UNITED STATES
SECURITIES AND EXCHANGE COMMISSION
Washington, D.C. 20549
FORM N-CSR
CERTIFIED SHAREHOLDER REPORT OF REGISTERED
MANAGEMENT INVESTMENT COMPANIES
Investment Company Act file number: 811-8194
FINANCIAL INVESTORS TRUST
(Exact name of registrant as specified in charter)
1290 Broadway, Suite 1100, Denver, Colorado 80203
(Address of principal executive offices) (Zip code)
David T. Buhler, Secretary
Financial Investors Trust
1290 Broadway, Suite 1100
Denver, Colorado 80203
(Name and address of agent for service)
Registrant’s telephone number, including area code: 303-623-2577
Date of fiscal year end: April 30
Date of reporting period: April 30, 2015
1
| Item 1. | Reports to Stockholders. |
TABLE OF CONTENTS

| | |
Aspen Managed Futures Strategy Fund | | Manager Commentary |
| | April 30, 2015 (Unaudited) |
May 7, 2015
Performance Results
For the one-year period ending April 30, 2015, the Class I shares of the Aspen Managed Futures Strategy Fund (the “Fund”) posted a gain of 14.51%. Per its mandate, the Fund maintained very tight correlation1 to the Aspen Managed Futures Beta Index (“Aspen MFBI” or the “Index”)2. The Index uses a combination of trend and counter-trend algorithms to determine exposures to 23 futures markets. In following the Index, the Fund can take long or short exposures to each of the eligible markets. A long position in a futures market should profit if the price of the futures contract rises, and a short position should profit if the price of the futures contract falls.
The Newedge CTA Index3, a managed futures benchmark, returned 20.44% in the same timeframe. Another benchmark, the BTOP50 Index4, returned 15.6%. It is important to note that there are substantive differences between the Fund and these indices in terms of construction. There were no significant changes to the Fund strategy during this period.
Explanation of Fund Performance
The Fund was flat in May (0.00%) and slightly down in June (-0.11%). These months perpetuated an extremely low volatility market backdrop that had been evident since early spring. Because the Index that is tracked by the Fund does not have a volatility target, Fund returns joined underlying asset returns in their low volatility state. In fact, the Fund’s daily returns represented a one-penny or zero-penny change in Fund NAV (approximately +/-0.1%) on about 55% of all days over this two-month period.
July (+0.44%), August (+1.43%), and September (+5.42%) represented the strongest quarter for the Fund since its launch, with September in particular being the best month in the Fund’s history. The primary driver of Fund returns was a strengthening US dollar which manifested itself as strongly positive returns for short trends in the currency and commodity asset classes. (The markets in both asset classes were almost exclusively short for most of the quarter, representing a rising dollar bet.) Interestingly, the Fund outperformed most managed futures benchmarks in July and September—down months for equities—and underperformed the benchmarks in August—an up month for equities. This reinforces a pattern, now noticeable for at least the past two years, of Fund returns being less beholden to equities than are the returns of many competing managed futures products.
The early days of October witnessed a continued downtrend in equity returns, leading the Fund to adopt a portfolio that was positioned as a strong hedge against further risk asset losses. However, equities rallied mid-month, and US equities in particular managed to rise back to near-record highs, after hitting a nearly 10% drawdown prior to the rally. This caused a whipsaw reversal in the Fund through much of the month. After attenuating negative-risk positions, the Fund benefitted the last two days of the month from the end of the Fed’s Quantitative5 Easing policies, which caused currencies and commodities to resume their strong decline against the US dollar. Gains on those days reduced Fund losses to -1.64% for the entire month.
With a return of +5.33%, November was the second-best month in Fund history, and January (+4.99%) was not far behind. While December’s return (+1.62%) was not as strong, it was still positive, leading the November-January period to be easily the strongest 3-month period in fund history (at +12.37%). The story in all three months was largely the same. Strong, broad downtrends in currencies and commodities and strong uptrends in fixed income drove returns throughout the three-month period; only equities provided mixed results.
In February, a strong trend resumption in equities offset losses due to trend reversals in the three other asset classes. The result was a small loss for the Fund overall (-0.66%). Due to the strength of the trends leading into the month, the reversals in February did not cause meaningful trend position attenuation, which proved fortunate, as March saw a resumption of strong downtrends in currency and commodity positions, leading to a +1.15% return for the fund that month.
While it may be early to proclaim the end of the downtrends in currencies and commodities that drove the majority of the +19.26% Fund return for the three quarters ending March, 2015, the whipsaw behavior in April (which resulted in a monthly return of -3.88% for the Fund) was finally strong enough to cause the Aspen MFBI model to reduce and, in a few cases, reverse trend positions in those asset classes. However, should April prove to be the turning point for the prevailing downtrends in those asset classes, the difference between the +19.26% and -3.88% returns demonstrates the ability of a trend-following model to generate sizable profits over the full lifecycle of a strong trend, despite the inevitable losses taken as the trend expires.
Outlook
Looking ahead to the second quarter and rest of 2015, we see three broad themes developing. First, it is likely that we will see a continuation of higher market volatility. It is not difficult to envision this scenario, considering the significant political and economic uncertainty being played out on the global stage. The effects of continuing quantitative easing in Europe and Japan may well exacerbate extreme market movements, owing to such a large scale of the effort.
We continue to think that the potential for a rate increase in the U.S. is overblown. It is hard to fathom why the Federal Reserve would threaten the seemingly fragile economic recovery by boosting rates even by a small amount. We expect the market to react to higher rates the same way that it reacted when crude prices dropped so dramatically, with equal parts confusion and fear. Once the dust settles, we believe it’s likely we’ll see money flow from debt to equity.
Speaking of crude oil, the last broad theme revolves around market perception. In the next few quarters, we believe that investors will finally adjust to lower energy costs. There has been considerable nervousness about the effect of oil prices on employment in the energy patch, but overall lower energy prices are a net positive to the economy. Most estimates peg the benefit at around 0.50% of additional GDP6 growth.
| | |
Annual Report | April 30, 2015 | | 1 |
| | |
Aspen Managed Futures Strategy Fund | | Manager Commentary |
| | April 30, 2015 (Unaudited) |
It is important that investors maintain adequate diversification during periods of uncertainty. The potential of managed futures to profit as volatility increases underscores its importance in a portfolio of equity and fixed income securities.
Sincerely,
Bryan R. Fisher (Managing Director)
William Ware Bush (Director)
Performance data quoted represents past performance. Past performance does not guarantee future results. Investment return and principal value of an investment will fluctuate so that an investor’s shares, when sold or redeemed, may be worth more or less than the original cost. Current performance data may be higher or lower than actual data quoted. For the most current month-end performance data please call 1-855-845-9444.
The views and information discussed in this commentary are as of the date of publication, are subject to change, and may not reflect the writers’ current views. The views expressed represent an assessment of market conditions at a specific point in time, are opinions only and should not be relied upon as investment advice regarding a particular investment or markets in general. Such information does not constitute a recommendation to buy or sell specific securities or investment vehicles. It should not be assumed that any investment will be profitable or will equal the performance of the portfolios or any securities or any sectors mentioned in this letter. The subject matter contained in this letter has been derived from several sources believed to be reliable and accurate at the time of compilation. Neither Aspen Partners Ltd. nor the Fund accepts any liability for losses either direct or consequential caused by the use of this information.
The Aspen Managed Futures Strategy Fund is distributed by ALPS Distributors, Inc.
Diversification does not eliminate the risk of experiencing investment losses.
| 1 | Correlation – a statistical measure of how two securities move in relation to each other. |
| 2 | Aspen Managed Futures Beta Index (Aspen MFBI) is constructed using a quantitative, rules-based model designed to replicate the trend-following and counter-trend exposure of futures markets by allocating assets to liquid futures contracts of certain financial and commodities futures markets. The Index therefore seeks to reflect the performance of strategies and exposures common to a broad universe of futures markets, i.e., managed futures beta. The Index is not actively managed and does not reflect any deduction for fees, expenses or taxes. An investor cannot invest directly in the Index. |
| 3 | The Newedge CTA Index provides the market with a reliable daily performance benchmark of major commodity trading advisors (CTAs). The Newedge CTA Index calculates the daily rate of return for a pool of CTAs selected from the larger managers that are open to new investment. Selection of the pool of qualified CTAs used in construction of the Index will be conducted annually, with re-balancing on January 1st of each year. A committee of industry professionals has been established to monitor the methodology of the index on a regular basis. The Index is not actively managed and does not reflect any deduction for fees, expenses or taxes. An investor cannot invest directly in the Index. |
| 4 | Barclay BTOP50 Index is an index of the largest investable CTA programs as measured by assets under management. The Index is not actively managed and does not reflect any deduction for fees, expenses or taxes. An investor cannot invest directly in the Index. |
| 5 | Quantitative Easing – An unconventional monetary policy in which a central bank purchases government securities or other securities from the market in order to lower interest rates and increase the money supply. |
| 6 | GDP – Gross Domestic Product is an aggregate measure of production equal to the sum of the gross values added of all resident, institutional units engaged in production (plus any taxes, and minus any subsidies, on products not included in the value of their outputs). |
| | |
2 | | www.aspenfuturesfund.com |
| | |
Aspen Managed Futures Strategy Fund | | Manager Commentary |
| | April 30, 2015 (Unaudited) |
Cumulative Total Return Performance as of April 30, 2015
| | | | | | | | | | | | | | |
Aspen Managed Futures Strategy
Fund | | Calendar
Year-to-Date | | 1 Year | | | 3 Year | | Since Inception* | | | | Portfolio Composition as of April 30, 2015 As a percentage of Net Assets 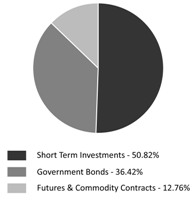
|
| | |
Aspen Managed Futures Strategy Fund - Class A (NAV)(1) | | 1.42% | | | 14.00 | % | | 5.04% | | 0.98% | | |
| | |
Aspen Managed Futures Strategy Fund - Class A (MOP)(2) | | -4.21% | | | 7.76 | % | | 3.08% | | -0.52% | | |
| | |
Aspen Managed Futures Strategy Fund - Class I | | 1.40% | | | 14.51 | % | | 5.43% | | 1.37% | | |
| | |
Newedge CTA Index(3) | | 2.37% | | | 20.44 | % | | 4.82% | | 2.68% | | |
| | |
Aspen Managed Futures Beta Index(4) | | 2.17% | | | 15.01 | % | | 5.84% | | 1.90% | | |
| | |
Performance data quoted represents past performance. Past performance does not guarantee future results. Investment return and principal value of an investment will fluctuate so that an investor’s shares, when sold or redeemed, may be worth more or less than the original cost. Current performance data may be higher or lower than actual data quoted. For the most current month-end performance data please call 1-855-845-9444. The table does not reflect the deduction of taxes that a shareholder would pay on Fund distributions or the redemption of Fund shares. * Fund Inception date of August 2, 2011. (1) Net Asset Value (NAV) is the share price without sales charges. (2) Maximum Offering Price (MOP) includes sales charges. Class A returns include effects of the Fund’s maximum sales charge of 5.50%. (3) The Newedge CTA Index provides the market with a reliable daily performance benchmark of major commodity trading advisors (CTAs). The Newedge CTA Index calculates the daily rate of return for a pool of CTAs selected from the larger managers that are open to new investment. Selection of the pool of qualified CTAs used in construction of the Index will be conducted annually, with re-balancing on January 1st of each year. A committee of industry professionals has been established to monitor the methodology of the index on a regular basis. The index is not actively managed and does not reflect any deductions for fees, expense or taxes. An investor may not invest directly in an index. (4) Aspen Managed Futures Beta Index – The Managed Futures Beta Index is constructed using a quantitative, rules-based model designed to replicate the trend-following and counter-trend exposure of futures markets by allocating assets to liquid futures contracts of certain financial and commodities futures markets. The Index therefore seeks to reflect the performance of strategies and exposures common to a broad universe of futures markets, i.e., managed futures beta. The index is not actively managed and does not reflect any deductions for fees, expense or taxes. An investor may not invest directly in an index. | | |
Performance of $10,000 Initial Investment (as of April 30, 2015)
Comparison of change in value of a $10,000 investment (includes applicable sales loads)
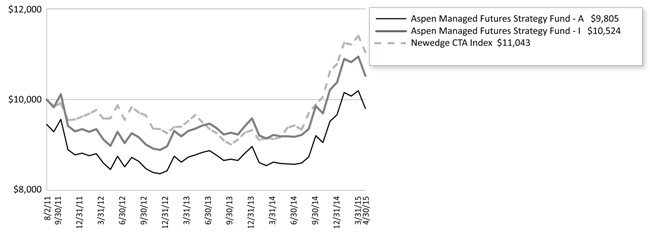
The chart represents historical performance of a hypothetical investment of $10,000 in the Fund since inception. Past performance does not guarantee future results. This chart does not reflect the deduction of taxes that a shareholder would pay on Fund distributions or the redemption of Fund shares.
| | |
Annual Report | April 30, 2015 | | 3 |
| | |
Aspen Managed Futures Strategy Fund | | Consolidated Disclosure of Fund Expenses |
| | April 30, 2015 (Unaudited) |
As a shareholder of a Fund, you incur two types of costs: (1) transaction costs, including applicable sales charges (loads), redemption fees, wire fees and low balance fees; and (2) ongoing costs, including management fees, distribution and service (12b-1) fees, shareholder services fees and other Fund expenses. This example is intended to help you understand your indirect costs, also referred to as “ongoing costs” (in dollars), of investing in the Fund and to compare these costs with the ongoing costs of investing in other mutual funds.
This example is based on an investment of $1,000 invested at the beginning of the period and held for the entire six-month period of November 1, 2014 through April 30, 2015.
Actual Expenses The first line of the table below provides information about actual account values and actual expenses. You may use the information in this line, together with the amount you invested at the beginning of the period, to estimate the expenses that you paid over the period. Simply divide your account value by $1,000 (for example, an $8,600 account value divided by $1,000 = 8.6), then multiply the result by the number in the first line under the heading “Expenses Paid During Period” to estimate the expenses you paid on your account during this period.
Hypothetical Example for Comparison Purposes The second line of the table provides information about hypothetical account values and hypothetical expenses based on the Fund’s actual expense ratio and an assumed rate of return of 5% per year before expenses, which is not the Fund’s actual return. The hypothetical account values and expenses may not be used to estimate the actual ending account balance or expenses you paid for the period. You may use this information to compare ongoing costs of investing in the Fund and other funds. To do so, compare this 5% hypothetical example with the 5% hypothetical examples that appear in the shareholder reports of other funds.
Please note that the expenses shown in the table are meant to highlight your ongoing costs only and do not reflect any transactional costs, such as applicable sales charges (loads), redemption fees, wire fees and low balance fees. Therefore, the second line of the table is useful in comparing ongoing costs only and will not help you determine the relative total costs of owning different funds. In addition, if these transaction costs were included, your costs would be higher.
| | | | | | | | |
| | | Beginning
Account Value
11/1/14 | | Ending
Account Value
4/30/15 | | Expense Ratio(a) | | Expenses Paid During period
11/1/14 - 4/30/15(b) |
Class A | | | | | | | | |
Actual | | $ 1,000.00 | | $ 1,082.10 | | 1.65% | | $ 8.52 |
Hypothetical (5% return before expenses) | | $ 1,000.00 | | $ 1,016.61 | | 1.65% | | $ 8.25 |
Class I | | | | | | | | |
Actual | | $ 1,000.00 | | $ 1,085.30 | | 1.23% | | $ 6.36 |
Hypothetical (5% return before expenses) | | $ 1,000.00 | | $ 1,018.70 | | 1.23% | | $ 6.16 |
| (a) | The Fund’s expense ratios have been based on the Fund’s most recent fiscal half-year expenses. |
| (b) | Expenses are equal to the Fund’s annualized expense ratio multiplied by the average account value over the period, multiplied by the number of days in the most recent fiscal half-year (181)/365 (to reflect the half-year period). |
| | |
4 | | www.aspenfuturesfund.com |
| | |
Aspen Managed Futures Strategy Fund | | Consolidated Schedule of Investments |
| | April 30, 2015 |
| | | | | | | | |
| | | Principal Amount/
Shares | | | Value (Note 2) | |
GOVERNMENT BONDS (36.42%) | | | | | | | | |
U.S. TREASURY NOTES (36.42%) | | | | | | | | |
0.250%, 10/31/2015 | | | $ 5,000,000 | | | | $ 5,004,295 | |
0.250%, 11/30/2015 | | | 12,086,000 | | | | 12,097,337 | |
0.250%, 12/31/2015 | | | 9,029,000 | | | | 9,033,235 | |
0.375%, 01/31/2016 | | | 6,006,000 | | | | 6,014,913 | |
0.375%, 01/31/2016 | | | 3,325,000 | | | | 3,329,934 | |
0.250%, 02/29/2016 | | | 16,019,000 | | | | 16,025,263 | |
0.375%, 03/31/2016 | | | 5,042,000 | | | | 5,048,696 | |
0.375%, 03/31/2016 | | | 3,300,000 | | | | 3,304,382 | |
0.250%, 04/15/2016 | | | 10,000,000 | | | | 10,002,340 | |
0.375%, 04/30/2016 | | | 10,034,000 | | | | 10,046,542 | |
0.375%, 05/31/2016 | | | 7,029,000 | | | | 7,036,690 | |
0.500%, 08/31/2016 | | | 5,042,000 | | | | 5,049,482 | |
0.375%, 10/31/2016 | | | 5,041,000 | | | | 5,035,485 | |
TOTAL GOVERNMENT BONDS | | | | | | | | |
| | | | | | | | |
(Cost $96,936,347) | | | | | | | 97,028,594 | |
| | | | | | | | |
| | |
SHORT TERM INVESTMENTS (50.82%) | | | | | | | | |
MONEY MARKET FUND (8.27%) | | | | | | | | |
Dreyfus Treasury & Agency Cash Management Fund - Institutional Shares, 7-day yield, 0.010% | | | 22,039,791 | | | | 22,039,791 | |
| | | | | | | | |
| | |
U.S. TREASURY BILLS (42.55%) | | | | | | | | |
0.066%, 05/28/2015(a) | | | $ 10,500,000 | | | | 10,499,476 | |
0.059%, 06/25/2015(a) | | | 10,500,000 | | | | 10,499,050 | |
0.066%, 07/23/2015(a) | | | 6,750,000 | | | | 6,749,959 | |
0.090%, 08/20/2015(a) | | | 5,750,000 | | | | 5,749,954 | |
0.063%, 09/17/2015(a) | | | 4,000,000 | | | | 3,999,808 | |
0.075%, 10/08/2015(a) | | | 3,350,000 | | | | 3,349,554 | |
0.088%, 10/15/2015(a) | | | 7,500,000 | | | | 7,498,867 | |
0.151%, 11/12/2015(a) | | | 5,000,000 | | | | 4,998,510 | |
0.156%, 12/10/2015(a) | | | 9,300,000 | | | | 9,295,676 | |
0.159%, 01/07/2016(a) | | | 10,000,000 | | | | 9,991,460 | |
0.179%, 02/04/2016(a) | | | 10,000,000 | | | | 9,989,150 | |
0.212%, 03/03/2016(a) | | | 10,500,000 | | | | 10,487,463 | |
0.190%, 03/31/2016(a) | | | 5,000,000 | | | | 4,990,925 | |
0.222%, 04/28/2016(a) | | | 15,300,000 | | | | 15,266,830 | |
| | | | | | | | |
| | | | | | | 113,366,682 | |
| | | | | | | | |
| | |
TOTAL SHORT TERM INVESTMENTS (Cost $135,380,422) | | | | | | | 135,406,473 | |
| | | | | | | | |
| | |
TOTAL INVESTMENTS (87.24%) (Cost $232,316,769) | | | | | | $ | 232,435,067 | |
| | | | | | | | |
| | |
Other Assets In Excess Of Liabilities (12.76%) | | | | | | | 33,989,832(b) | |
| | | | | | | | |
| | |
NET ASSETS (100.00%) | | | | | | $ | 266,424,899 | |
| | | | | | | | |
| (a) | Rate shown represents the bond equivalent yield to maturity at date of purchase. |
| (b) | Includes cash which is being held as collateral for futures contracts. |
| | |
See Notes to Consolidated Financial Statements. | | |
Annual Report | April 30, 2015 | | 5 |
| | |
Aspen Managed Futures Strategy Fund | | Consolidated Schedule of Investments |
| | April 30, 2015 |
FUTURES CONTRACTS
At April 30, 2015, the Fund had outstanding futures contracts:
| | | | | | | | | | | | | | |
| Description | | Position | | Contracts | | Expiration
Date | | Underlying Face
Amount at Value | | | Unrealized
Appreciation | |
Commodity Contracts | | | | | | | | | | | | | | |
Silver Future | | Short | | 77 | | 07/30/2015 | | $ | (6,218,905) | | | $ | 208,078 | |
Soybean Future | | Short | | 65 | | 07/15/2015 | | | (3,172,000) | | | | 3,259 | |
WTI Crude Future | | Long | | 57 | | 05/20/2015 | | | 3,398,910 | | | | 59,387 | |
Equity Contracts | | | | | | | | | | | | | | |
FTSE® 100 Index Future | | Long | | 203 | | 06/22/2015 | | | 21,591,137 | | | | 95,217 | |
Nikkei 225 Index Future | | Long | | 215 | | 06/12/2015 | | | 20,898,000 | | | | 335,295 | |
Foreign Currency Contracts | | | | | | | | | | | | | | |
New Zealand Dollar Currency Future | | Long | | 231 | | 06/16/2015 | | | 17,551,380 | | | | 64,184 | |
| | | | | | | | | | |
| | | | | | | | $ | 54,048,522 | | | $ | 765,420 | |
| | | | | | | | | | |
| | | | | |
| Description | | Position | | Contracts | | Expiration
Date | | Underlying Face
Amount at Value | | | Unrealized
Depreciation | |
Commodity Contracts | | | | | | | | | | | | | | |
Copper Future | | Short | | 45 | | 07/30/2015 | | $ | (3,247,313) | | | $ | (230,882) | |
Corn Future | | Short | | 353 | | 07/15/2015 | | | (6,464,313) | | | | (19,522) | |
Gold 100 Oz Future | | Long | | 28 | | 06/29/2015 | | | 3,310,720 | | | | (77,650) | |
New York Harbor ULSD Future | | Short | | 41 | | 06/01/2015 | | | (3,410,421) | | | | (171,979) | |
Sugar No. 11 (World) Future | | Short | | 434 | | 07/01/2015 | | | (6,406,534) | | | | (15,744) | |
Equity Contracts | | | | | | | | | | | | | | |
Euro STOXX 50® Index Future | | Long | | 535 | | 06/22/2015 | | | 21,433,857 | | | | (218,741) | |
S&P 500® E-Mini Future | | Long | | 203 | | 06/22/2015 | | | 21,100,835 | | | | (136,258) | |
Fixed Income Contracts | | | | | | | | | | | | | | |
Canadian 10 Year Bond Future | | Long | | 109 | | 06/22/2015 | | | 12,668,935 | | | | (242,440) | |
Euro-Bund Future | | Long | | 219 | | 06/09/2015 | | | 38,533,176 | | | | (422,470) | |
Long Gilt Future | | Long | | 138 | | 06/29/2015 | | | 25,021,390 | | | | (517,853) | |
U.S. 10 Year Treasury Note Future | | Long | | 97 | | 06/22/2015 | | | 12,452,375 | | | | (91,125) | |
Foreign Currency Contracts | | | | | | | | | | | | | | |
Australian Dollar Currency Future | | Long | | 49 | | 06/16/2015 | | | 3,869,040 | | | | (57,555) | |
Canadian Dollar Currency Future | | Short | | 170 | | 06/17/2015 | | | (14,055,600) | | | | (549,721) | |
Euro FX Currency Future | | Short | | 332 | | 06/16/2015 | | | (46,753,900) | | | | (2,176,165) | |
Japanese Yen Currency Future | | Long | | 134 | | 06/16/2015 | | | 14,033,150 | | | | (51,938) | |
Swiss Franc Currency Future | | Short | | 134 | | 06/16/2015 | | | (18,017,975) | | | | (637,225) | |
| | | | | | | | | | |
| | | | | | | | $ | 54,067,422 | | | $ | (5,617,268) | |
| | | | | | | | | | |
Common Abbreviations:
FTSE - Financial Times and the London Stock Exchange
FX - Foreign
No. - Number
Oz - Ounce
S&P - Standard and Poor’s
ULSD - Ultra Low Sulfur Diesel
Holdings are subject to change.
For Fund compliance purposes, the Fund’s industry classifications refer to any one or more of the industry sub-classifications used by one or more widely recognized market indexes or ratings group indexes, and/or as defined by Fund management. This definition may not apply for purposes of this report, which may combine industry sub-classifications for reporting ease. Industries are shown as a percentage of net assets.
| | |
See Notes to Consolidated Financial Statements. | | |
6 | | www.aspenfuturesfund.com |
| | |
| Aspen Managed Futures Strategy Fund Consolidated Statement of Assets & Liabilities |
| | April 30, 2015 |
| | | | |
ASSETS: | | | | |
Investments, at value | | $ | 232,435,067 | |
Cash | | | 11,565,750 | |
Deposit with broker for futures contracts, foreign currency (Cost $8,325,749) (Note 3) | | | 8,335,500 | |
Deposit with broker for futures contracts (Note 3) | | | 28,135,299 | |
Receivable for shares sold | | | 1,495,565 | |
Variation margin receivable | | | 765,420 | |
Interest receivable | | | 55,870 | |
Prepaid and other assets | | | 12,740 | |
| |
Total assets | | | 282,801,211 | |
| |
| |
LIABILITIES: | | | | |
Payable to advisor | | | 164,153 | |
Payable for investments purchased | | | 10,026,242 | |
Variation margin payable | | | 5,617,268 | |
Payable for shares redeemed | | | 413,022 | |
Payable for administration fees | | | 19,897 | |
Payable for distribution and service fees | | | | |
Class A | | | 13,373 | |
Payable for transfer agency fees | | | 12,631 | |
Payable for trustee fees and expenses | | | 1,902 | |
Payable for professional fees | | | 33,804 | |
Payable for chief compliance officer fees | | | 2,894 | |
Payable for principal financial officer fees | | | 417 | |
Payable for licensing fees | | | 54,718 | |
Accrued expenses and other liabilities | | | 15,991 | |
| |
Total liabilities | | | 16,376,312 | |
| |
NET ASSETS | | $ | 266,424,899 | |
| |
| |
NET ASSETS CONSIST OF: | | | | |
| |
Paid-in capital (Note 5) | | $ | 244,987,744 | |
Accumulated net investment income | | | 5,144,673 | |
Accumulated net realized gain on investments, futures contracts and foreign currency transactions | | | 21,016,281 | |
Net unrealized depreciation on investments, futures contracts and foreign currency translations | | | (4,723,799) | |
| |
NET ASSETS | | $ | 266,424,899 | |
| |
| |
INVESTMENTS, AT COST | | $ | 232,316,769 | |
| |
PRICING OF SHARES: | | | | |
Class A: | | | | |
Net Asset Value, offering and redemption price per share | | $ | 10.01 | |
Net Assets | | $ | 23,849,913 | |
Shares of beneficial interest outstanding | | | 2,381,761 | |
Maximum offering price per share (NAV/0.9450), based on maximum sales charge of 5.50% of the offering price | | $ | 10.59 | |
| |
Class I: | | | | |
Net Asset Value, offering and redemption price per share | | $ | 10.17 | |
Net Assets | | $ | 242,574,986 | |
Shares of beneficial interest outstanding | | | 23,844,450 | |
| | |
See Notes to Consolidated Financial Statements. | | |
Annual Report | April 30, 2015 | | 7 |
| | |
Aspen Managed Futures Strategy Fund | | Consolidated Statement of Operations |
| | For the Year Ended April 30, 2015 |
| | | | |
| |
INVESTMENT INCOME: | | | | |
Interest | | $ | 290,043 | |
Dividends | | | 1,349 | |
| |
Total Investment Income | | | 291,392 | |
| |
| |
EXPENSES: | | | | |
Investment advisory fees (Note 6) | | | 1,594,295 | |
Administrative fees | | | 232,640 | |
Distribution and service fees | | | | |
Class A | | | 53,339 | |
Transfer agency fees | | | 125,054 | |
Professional fees | | | 43,098 | |
Custodian fees | | | 11,506 | |
Trustee fees and expenses | | | 19,684 | |
Principal financial officer fees | | | 5,000 | |
Chief compliance officer fees | | | 33,217 | |
Licensing fees | | | 531,432 | |
Other | | | 64,298 | |
| |
Total Net Expenses | | | 2,713,563 | |
| |
NET INVESTMENT LOSS | | | (2,422,171) | |
| |
| |
Net realized gain on investments | | | 22,808 | |
Net realized gain on futures contracts | | | 36,480,798 | |
Net realized loss on foreign currency transactions | | | (182,329) | |
Net change in unrealized appreciation of investments | | | 39,024 | |
Net change in unrealized depreciation on futures contracts | | | (7,069,889) | |
Net change in unrealized appreciation on translation of assets and liabilities denominated in foreign currency transactions | | | 10,656 | |
| |
NET REALIZED AND UNREALIZED GAIN ON INVESTMENTS | | | 29,301,068 | |
| |
NET INCREASE IN NET ASSETS RESULTING FROM OPERATIONS | | $ | 26,878,897 | |
| |
| | |
See Notes to Consolidated Financial Statements. | | |
8 | | www.aspenfuturesfund.com |
| | |
Aspen Managed Futures Strategy Fund | | Consolidated Statements of Changes in Net Assets |
| | | | | | | | |
| | | For the | | | For the | |
| | | Year Ended | | | Year Ended | |
| | | April 30, 2015 | | | April 30, 2014 | |
OPERATIONS: | | | | | | | | |
Net investment loss | | $ | (2,422,171) | | | $ | (1,929,841) | |
Net realized gain/(loss) on investments, futures contracts and foreign currency transactions | | | 36,321,277 | | | | (2,925,094) | |
Net change in unrealized appreciation/(depreciation) on investments, futures contracts and foreign currency translations | | | (7,020,209) | | | | 1,557,404 | |
Net increase/(decrease) in net assets resulting from operations | | | 26,878,897 | | | | (3,297,531) | |
| | |
DISTRIBUTIONS TO SHAREHOLDERS (Note 4): | | | | | | | | |
From net realized gains on investments | | | | | | | | |
Class A | | | (309,900) | | | | (162,261) | |
Class I | | | (4,218,836) | | | | (2,158,924) | |
Net decrease in net assets from distributions | | | (4,528,736) | | | | (2,321,185) | |
| | |
SHARE TRANSACTIONS (Note 5): | | | | | | | | |
Class A | | | | | | | | |
Proceeds from sales of shares | | | 13,068,693 | | | | 13,615,924 | |
Distributions reinvested | | | 298,289 | | | | 160,468 | |
Cost of shares redeemed | | | (3,700,970) | | | | (3,784,081) | |
Redemption fees | | | 531 | | | | 7,725 | |
Class I | | | | | | | | |
Proceeds from sales of shares | | | 75,913,390 | | | | 67,455,247 | |
Distributions reinvested | | | 3,994,682 | | | | 2,022,776 | |
Cost of shares redeemed | | | (25,671,930) | | | | (17,814,123) | |
Redemption fees | | | 1,186 | | | | 5,843 | |
Net increase from share transactions | | | 63,903,871 | | | | 61,669,779 | |
| | |
Net increase in net assets | | | 86,254,032 | | | | 56,051,063 | |
| | |
NET ASSETS: | | | | | | | | |
Beginning of period | | | 180,170,867 | | | | 124,119,804 | |
End of period* | | $ | 266,424,899 | | | $ | 180,170,867 | |
| | |
*Includes accumulated net investment income/(loss) of: | | $ | 5,144,673 | | | $ | (710,695) | |
| | |
Other Information: | | | | | | | | |
SHARE TRANSACTIONS: | | | | | | | | |
Class A | | | | | | | | |
Sold | | | 1,300,095 | | | | 1,473,235 | |
Distributions reinvested | | | 30,594 | | | | 17,310 | |
Redeemed | | | (388,614) | | | | (411,560) | |
Net increase in shares outstanding | | | 942,075 | | | | 1,078,985 | |
| | |
| | |
Class I | | | | | | | | |
Sold | | | 7,614,314 | | | | 7,251,376 | |
Distributions reinvested | | | 403,911 | | | | 216,109 | |
Redeemed | | | (2,608,713) | | | | (1,932,582) | |
Net increase in shares outstanding | | | 5,409,512 | | | | 5,534,903 | |
| | |
| | |
See Notes to Consolidated Financial Statements. | | |
Annual Report | April 30, 2015 | | 9 |
| | |
Aspen Managed Futures Strategy Fund – Class A | | Consolidated Financial Highlights |
| | For a share outstanding throughout the periods presented. |
| | | | | | | | |
| | | | | | | | | For the Period |
| | | For the | | For the | | For the | | August 2, 2011 |
| | | Year Ended | | Year Ended | | Year Ended | | (Inception) to |
| | | April 30, 2015 (a) | | April 30, 2014 (a) | | April 30, 2013 (a) | | April 30, 2012 (a) |
NET ASSET VALUE, BEGINNING OF PERIOD | | $ 8.97 | | $ 9.29 | | $ 8.95 | | $ 10.00 |
INCOME/(LOSS) FROM OPERATIONS: | | | | | | | | |
Net investment loss(b) | | (0.14) | | (0.16) | | (0.16) | | (0.13) |
Net realized and unrealized gain/(loss) on investments | | 1.39 | | (0.05) | | 0.50 | | (0.92) |
Total from investment operations | | 1.25 | | (0.21) | | 0.34 | | (1.05) |
LESS DISTRIBUTIONS: | | | | | | | | |
Distributions from net realized gain on investments | | (0.21) | | (0.12) | | – | | – |
Total distributions | | (0.21) | | (0.12) | | – | | – |
REDEMPTION FEES ADDED TO PAID IN CAPITAL | | 0.00(c) | | 0.01 | | 0.00(c) | | – |
INCREASE/(DECREASE) IN NET ASSET VALUE | | 1.04 | | (0.32) | | 0.34 | | (1.05) |
NET ASSET VALUE, END OF PERIOD | | $ 10.01 | | $ 8.97 | | $ 9.29 | | $ 8.95 |
| |
| | | | |
TOTAL RETURN(d) | | 14.00% | | (2.15%) | | 3.80% | | (10.50%)(e) |
| | | | |
RATIOS AND SUPPLEMENTAL DATA: | | | | | | | | |
Net assets, end of period (000’s) | | $ 23,850 | | $ 12,914 | | $ 3,350 | | $ 1,254 |
| | | | |
RATIOS TO AVERAGE NET ASSETS: | | | | | | | | |
Operating expenses excluding fee waivers/reimbursements | | 1.64% | | 1.83% | | 1.80% | | 2.53%(f) |
Operating expenses including fee waivers/reimbursements | | 1.64% | | 1.83% | | 1.80% | | 1.80%(f) |
Net investment loss including fee waivers/reimbursements | | (1.50%) | | (1.72%) | | (1.75%) | | (1.79%)(f) |
| | | | |
PORTFOLIO TURNOVER RATE | | 38% | | 90% | | 0% | | 0%(e) |
| (a) | Per share amounts and ratios to average net assets include income and expenses of the Aspen Futures Fund Ltd. (subsidiary), exclusive of the subsidiary’s management fee. |
| (b) | Per share numbers have been calculated using the average shares method. |
| (c) | Less than $0.005 per share. |
| (d) | Total return does not reflect the effect of sales charges. |
| | |
See Notes to Consolidated Financial Statements. | | |
10 | | www.aspenfuturesfund.com |
| | |
Aspen Managed Futures Strategy Fund – Class I | | Consolidated Financial Highlights |
| | For a share outstanding throughout the periods presented. |
| | | | | | | | | | | | | | | | |
| | | For the
Year Ended
April 30, 2015 (a) | | | For the
Year Ended
April 30, 2014 (a) | | | For the
Year Ended
April 30, 2013 (a) | | | For the Period
August 2, 2011
(Inception) to
April 30, 2012 (a) | |
NET ASSET VALUE, BEGINNING OF PERIOD | | | $ 9.07 | | | | $ 9.36 | | | | $ 8.98 | | | | $ 10.00 | |
INCOME/(LOSS) FROM OPERATIONS: | | | | | | | | | | | | | | | | |
Net investment loss(b) | | | (0.11) | | | | (0.11) | | | | (0.11) | | | | (0.11) | |
Net realized and unrealized gain/(loss) on investments | | | 1.42 | | | | (0.06) | | | | 0.49 | | | | (0.91) | |
Total from investment operations | | | 1.31 | | | | (0.17) | | | | 0.38 | | | | (1.02) | |
LESS DISTRIBUTIONS: | | | | | | | | | | | | | | | | |
Distributions from net realized gain on investments | | | (0.21) | | | | (0.12) | | | | – | | | | – | |
Total distributions | | | (0.21) | | | | (0.12) | | | | – | | | | – | |
REDEMPTION FEES ADDED TO PAID IN CAPITAL | | | 0.00 | (c) | | | 0.00 | (c) | | | 0.00 | (c) | | | 0.00 | (c) |
INCREASE/(DECREASE) IN NET ASSET VALUE | | | 1.10 | | | | (0.29) | | | | 0.38 | | | | (1.02) | |
NET ASSET VALUE, END OF PERIOD | | | $ 10.17 | | | | $ 9.07 | | | | $ 9.36 | | | | $ 8.98 | |
| | |
| | | | |
TOTAL RETURN | | | 14.51% | | | | (1.81%) | | | | 4.23% | | | | (10.20%) | (d) |
| | | | |
RATIOS AND SUPPLEMENTAL DATA: | | | | | | | | | | | | | | | | |
Net assets, end of period (000’s) | | | $ 242,575 | | | | $ 167,258 | | | | $ 120,769 | | | | $ 90,450 | |
| | | | |
RATIOS TO AVERAGE NET ASSETS: | | | | | | | | | | | | | | | | |
Operating expenses excluding fee waivers/reimbursements | | | 1.25% | | | | 1.30% | | | | 1.25% | | | | 1.75% | (e) |
Operating expenses including fee waivers/reimbursements | | | 1.25% | | | | 1.30% | | | | 1.25% | | | | 1.55% | (e) |
Net investment loss including fee waivers/reimbursements | | | (1.11%) | | | | (1.20%) | | | | (1.20%) | | | | (1.54%) | (e) |
| | | | |
PORTFOLIO TURNOVER RATE | | | 38% | | | | 90% | | | | 0% | | | | 0% | (d) |
| (a) | Per share amounts and ratios to average net assets include income and expenses of the Aspen Futures Fund Ltd. (subsidiary), exclusive of the subsidiary’s management fee. |
| (b) | Per share numbers have been calculated using the average shares method. |
| (c) | Less than $0.005 per share. |
| | |
See Notes to Consolidated Financial Statements. | | |
Annual Report | April 30, 2015 | | 11 |
| | |
Aspen Managed Futures Strategy Fund | | Notes to Consolidated Financial Statements |
| | April 30, 2015 |
1. ORGANIZATION
Financial Investors Trust (the “Trust”), a Delaware statutory trust, is an open-end management investment company registered under the Investment Company Act of 1940, as amended (“1940 Act”). As of April 30, 2015, the Trust had 30 registered funds. This annual report describes the Aspen Managed Futures Strategy Fund (the “Fund”). The Fund seeks investment results that replicate as closely as possible, before fees and expenses, the price and yield performance of the Aspen Managed Futures Beta Index (the “MFBI” or “Index”). The Aspen Managed Futures Strategy Fund offers Class A and Class I shares.
Basis of Consolidation for the Aspen Futures Fund, Ltd.
Aspen Futures Fund, Ltd. (the “Subsidiary”), a Cayman Islands exempted company, is a wholly owned subsidiary of the Fund. The Subsidiary’s investment objective is designed to enhance the ability of the Fund to obtain exposure to equities, financial, currency and commodities markets consistent with the limits of the U.S. federal tax law requirements applicable to registered investment companies. The Subsidiary is subject to substantially the same investment policies and investment restrictions as the Fund. The Subsidiary acts as an investment vehicle for the Fund in order to effect certain commodity-related investments on behalf of the Fund. Investments in the Subsidiary are expected to provide the Fund with exposure to the commodity markets within the limitations of Subchapter M of the Internal Revenue Code of 1986, as amended (the “Code”), and recent IRS revenue rulings, as discussed below under “Federal Income Taxes”. The Fund is the sole shareholder of the Subsidiary pursuant to a subscription agreement dated as of August 2, 2011, and it is intended that the Fund will remain the sole shareholder and will continue to control the Subsidiary. Under the Articles of Association of the Subsidiary, shares issued by the Subsidiary confer upon a shareholder the right to wholly own and vote at general meetings of the Subsidiary and certain rights in connection with any winding-up or repayment of capital, as well as the right to participate in the profits or assets of the Subsidiary. The Fund may invest up to 25% of its total assets in shares of the Subsidiary. As a wholly owned subsidiary of the Fund, all assets and liabilities, income and expenses of the Subsidiary are consolidated in the financial statements and financial highlights of the Fund. All investments held by the Subsidiary are disclosed in the accounts of the Fund. As of April 30, 2015, net assets of the Fund were $266,424,899, of which $27,573,271 or 10.35%, represented the Fund’s ownership of all issued shares and voting rights of the Subsidiary.
2. SIGNIFICANT ACCOUNTING POLICIES
The accompanying financial statements were prepared in accordance with accounting principles generally accepted in the United States of America (“U.S. GAAP”). The preparation of financial statements in conformity with U.S. GAAP requires management to make certain estimates and assumptions that affect the reported amounts of assets and liabilities and disclosures of contingent assets and liabilities at the date of the financial statements and the reported amounts of revenue and expenses during the period. Actual results could differ from those estimates. The Fund is considered an investment company for financial reporting purposes under U.S. GAAP. The following is a summary of significant accounting policies consistently followed by the Fund and subsidiary in preparation of the financial statements.
Investment Valuation: The Fund generally values its securities based on market prices determined at the close of regular trading on the New York Stock Exchange (“NYSE”), normally 4:00 p.m. Eastern Time, on each day the NYSE is open for trading.
For equity securities and mutual funds that are traded on an exchange, the market price is usually the closing sale or official closing price on that exchange. In the case of equity securities not traded on an exchange, or if such closing prices are not otherwise available, the securities are valued at the mean of the most recent bid and ask prices on such day. Redeemable securities issued by open-end registered investment companies are valued at the investment company’s applicable net asset value, with the exception of exchange-traded open-end investment companies, which are priced as equity securities.
The market price for debt obligations is generally the price supplied by an independent third-party pricing service approved by the Board of Trustees (the “Board”), which may use a matrix, formula or other objective method that takes into consideration quotations from dealers, market transactions in comparable investments, market indices and yield curves. If vendors are unable to supply a price, or if the price supplied is deemed to be unreliable, the market price may be determined using quotations received from one or more brokers–dealers that make a market in the security. Short–term debt obligations that will mature in 60 days or less are valued at amortized cost, unless it is determined that using this method would not reflect an investment’s fair value.
Futures contracts that are listed or traded on a national securities exchange, commodities exchange, contract market or comparable over-the-counter market, and that are freely transferable, are valued at their closing settlement price on the exchange on which they are primarily traded or based upon the current settlement price for a like instrument acquired on the day on which the instrument is being valued. A settlement price may not be used if the market makes a limit move with respect to a particular commodity.
Forward currency exchange contracts have a market value determined by the prevailing foreign currency exchange daily rates and current foreign currency exchange forward rates. The foreign currency exchange forward rates are calculated using an automated system that estimates rates on the basis of the current day foreign currency exchange rates and forward foreign currency exchange rates supplied by a pricing service.
| | |
12 | | www.aspenfuturesfund.com |
| | |
Aspen Managed Futures Strategy Fund | | Notes to Consolidated Financial Statements |
| | April 30, 2015 |
Investment securities that are primarily traded on foreign securities exchanges are valued at the preceding closing values of such securities on their respective exchanges, except when an occurrence subsequent to the time a value was so established is likely to have changed such value. In such an event, the fair value of those securities are determined in good faith through consideration of other factors in accordance with procedures established by and under the general supervision of the Board.
When such prices or quotations are not available, or when the Fair Value Committee appointed by the Board believes that they are unreliable, securities may be priced using fair value procedures approved by the Board.
Fair Value Measurements: The Fund discloses the classification of its fair value measurements following a three-tier hierarchy based on the inputs used to measure fair value. Inputs refer broadly to the assumptions that market participants would use in pricing the asset or liability, including assumptions about risk. Inputs may be observable or unobservable. Observable inputs reflect the assumptions market participants would use in pricing the asset or liability that are developed based on market data obtained from sources independent of the reporting entity. Unobservable inputs reflect the reporting entity’s own assumptions about the assumptions market participants would use in pricing the asset or liability that are developed based on the best information available.
Various inputs are used in determining the value of the Fund’s investments as of the end of the reporting period. When inputs used fall into different levels of the fair value hierarchy, the level in the hierarchy within which the fair value measurement falls is determined based on the lowest level input that is significant to the fair value measurement in its entirety. The designated input levels are not necessarily an indication of the risk or liquidity associated with these investments. These inputs are categorized in the following hierarchy under applicable financial accounting standards:
| | | | |
Level 1 | | – | | Unadjusted quoted prices in active markets for identical investments, unrestricted assets or liabilities that the Fund has the ability to access at the measurement date; |
| | |
Level 2 | | – | | Quoted prices which are not active, quoted prices for similar assets or liabilities in active markets or inputs other than quoted prices that are observable (either directly or indirectly) for substantially the full term of the asset or liability; and |
| | |
Level 3 | | – | | Significant unobservable prices or inputs (including the Fund’s own assumptions in determining the fair value of investments) where there is little or no market activity for the asset or liability at the measurement date. The following is a summary of each input used to value the Fund as of April 30, 2015: |
| | | | | | | | | | | | | | | | |
| Investments in Securities at Value | | Level 1 -
Quoted Prices | | | Level 2 -
Other Significant
Observable Inputs | | | Level 3 -
Significant Unobservable
Inputs | | | Total | |
Government Bonds | | $ | – | | | $ | 97,028,594 | | | $ | – | | | $ | 97,028,594 | |
Short Term Investments | | | | | | | | | | | | | | | | |
Money Market Fund | | | 22,039,791 | | | | – | | | | – | | | | 22,039,791 | |
U.S. Treasury Bills | | | – | | | | 113,366,682 | | | | – | | | | 113,366,682 | |
TOTAL | | $ | 22,039,791 | | | $ | 210,395,276 | | | $ | – | | | $ | 232,435,067 | |
| | | | | | | | | | | | | | | | | |
Other Financial Instruments | | | | | | | | | | | | | | | | |
Assets: | | | | | | | | | | | | | | | | |
Futures Contracts | | | | | | | | | | | | | | | | |
Commodity Contracts | | $ | 270,724 | | | $ | – | | | $ | – | | | $ | 270,724 | |
Equity Contracts | | | 430,512 | | | | – | | | | – | | | | 430,512 | |
Foreign Currency Contracts | | | 64,184 | | | | – | | | | – | | | | 64,184 | |
Liabilities: | | | | | | | | | | | | | | | | |
Futures Contracts | | | | | | | | | | | | | | | | |
Commodity Contracts | | | (515,777) | | | | – | | | | – | | | | (515,777) | |
Equity Contracts | | | (354,999) | | | | – | | | | – | | | | (354,999) | |
Fixed Income Contracts | | | (1,273,888) | | | | – | | | | – | | | | (1,273,888) | |
Foreign Currency Contracts | | | (3,472,604) | | | | – | | | | – | | | | (3,472,604) | |
TOTAL | | $ | (4,851,848) | | | $ | – | | | $ | – | | | $ | (4,851,848) | |
| | | | | | | | | | | | | | | | | |
The Fund recognizes transfers between levels as of the end of the period. For the year ended April 30, 2015, the Fund did not have any transfers between Level 1 and Level 2 securities. For the year ended April 30, 2015, the Fund did not have any securities that used significant unobservable inputs (Level 3) in determining fair value.
| | |
Annual Report | April 30, 2015 | | 13 |
| | |
Aspen Managed Futures Strategy Fund | | Notes to Consolidated Financial Statements |
| | April 30, 2015 |
Investment Transactions and Investment Income: Investment transactions are accounted for on the date the investments are purchased or sold (trade date). Realized gains and losses from investment transactions are reported on an identified cost basis. Interest income, which includes accretion of discounts, is accrued and recorded as earned. Dividend income is recognized on the ex-dividend date or for certain foreign securities, as soon as information is available to the Fund. All of the realized and unrealized gains and losses and net investment income, are allocated daily to each class in proportion to its average daily net assets.
Foreign Securities: The Fund may directly purchase securities of foreign issuers. Investing in securities of foreign issuers involves special risks not typically associated with investing in securities of U.S. issuers. The risks include possible reevaluation of currencies, the inability to repatriate foreign currency, less complete financial information about companies and possible future adverse political and economic developments. Moreover, securities of many foreign issuers and their markets may be less liquid and their prices more volatile than those of securities of comparable U.S. issuers.
Foreign Currency Translation: The books and records of the Fund are maintained in U.S. dollars. Investment valuations and other assets and liabilities initially expressed in foreign currencies are converted each business day into U.S. dollars based upon current exchange rates. Prevailing foreign exchange rates may generally be obtained at the close of the NYSE (normally, 4:00 p.m. Eastern Time). The portion of realized and unrealized gains or losses on investments due to fluctuations in foreign currency exchange rates is not separately disclosed and is included in realized and unrealized gains or losses on investments, when applicable.
Foreign Currency Spot Contracts: The Fund may enter into foreign currency spot contracts to facilitate transactions in foreign securities or to convert foreign currency receipts into U.S. dollars. A foreign currency spot contract is an agreement between two parties to buy and sell currencies at the current market rate, for settlement generally within two business days. The U.S. dollar value of the contracts is determined using current currency exchange rates supplied by a pricing service. The contract is marked-to-market daily for settlements beyond one day and any change in market value is recorded as an unrealized gain or loss. When the contract is closed, the Fund records a realized gain or loss equal to the difference between the value on the open and close date. Losses may arise from changes in the value of the foreign currency, or if the counterparties do not perform under the contract’s terms. The maximum potential loss from such contracts is the aggregate face value in U.S. dollars at the time the contract was opened.
Trust Expenses: Some expenses of the Trust can be directly attributed to the Fund. Expenses which cannot be directly attributed to the Fund are apportioned among all funds in the Trust based on average net assets of each fund.
Fund and Class Expenses: Expenses that are specific to a class of shares of the Fund are charged directly to that share class. All expenses of the Fund, other than class specific expenses, are allocated daily to each class in proportion to its average daily net assets. Fees provided under the distribution (Rule 12b-1) and the shareholder service plan for a particular class of the Fund are charged to the operations of such class.
Federal Income Taxes: The Fund complies with the requirements under Subchapter M of the Internal Revenue Code of 1986, as amended, applicable to regulated investment companies and intends to distribute substantially all of their net taxable income and net capital gains, if any, each year so that it will not be subject to excise tax on distributed income and gains. The Fund is not subject to income taxes to the extent such distributions are made.
As of and during the year ended April 30, 2015, the Fund did not have a liability for any unrecognized tax benefits. The Fund files U.S. federal, state, and local tax returns as required. The Fund’s tax returns are subject to examination by the relevant tax authorities until expiration of the applicable statute of limitations, which is generally three years after the filing of the tax return for federal purposes and four years for most state returns. Tax returns for open years have incorporated no uncertain tax positions that require a provision for income taxes.
Distributions to Shareholders: The Fund normally pays dividends and distributes capital gains, if any, on an annual basis. Income dividend distributions are derived from interest and other income the Fund receives from its investments, including short term capital gains. Long term capital gains distributions are derived from gains realized when the Fund sells a security it has owned for more than a year. The Fund may make additional distributions and dividends at other times if the portfolio manager believes doing so may be necessary for the Fund to avoid or reduce taxes.
3. DERIVATIVE INSTRUMENTS
The Fund uses derivatives (including futures) to pursue its investment objective. The Fund’s use of derivative instruments involves risks different from, or possibly greater than, the risks associated with investing directly in securities and other traditional investments. These risks may include (i) the risk that the counterparty to a derivative transaction may not fulfill its contractual obligations, (ii) risk of mispricing or improper valuation, and (iii) the risk that changes in the value of the derivative may not correlate perfectly with the underlying asset, rate or index. These risks could cause
| | |
14 | | www.aspenfuturesfund.com |
| | |
Aspen Managed Futures Strategy Fund | | Notes to Consolidated Financial Statements |
| | April 30, 2015 |
the Fund to lose more than the principal amount invested. In addition, investments in derivatives involve leverage, which means a small percentage of assets invested in derivatives can have a disproportionately large impact on the Fund.
The Fund’s use of derivatives can result in losses due to unanticipated changes in the market risk factors and the overall market. In instances where the Fund is using derivatives to decrease, or hedge, exposures to market risk factors for securities held by the Fund, there are also risks that those derivatives may not perform as expected resulting in losses for the combined or hedged positions. Derivatives may have little or no initial cash investment relative to their market value exposure and therefore can produce significant gains or losses in excess of their cost. This use of embedded leverage allows the Fund to increase its market value exposure relative to its net assets and can substantially increase the volatility of the Fund’s performance.
In addition, use of derivatives may increase or decrease exposure to the following risk factors:
| | • | | Equity Risk: Equity risk relates to the change in value of equity securities as they relate to increases or decreases in the general market. |
| | • | | Fixed Income Risk: When the Fund invests in fixed-income securities or derivatives, the value of an investment in the Fund will fluctuate with changes in interest rates. Typically, a rise in interest rates causes a decline in the value of fixed-income securities or derivatives owned by the Fund. In general, the market price of debt securities with longer maturities will increase or decrease more in response to changes in interest rates than shorter-term securities. Other risk factors include credit risk (the debtor may default) and prepayment risk (the debtor may pay its obligation early, reducing the amount of interest payments). |
| | • | | Foreign Currency Risk: Currency trading involves significant risks, including market risk, interest rate risk, country risk, counterparty credit risk and short sale risk. Market risk results from the price movement of foreign currency values in response to shifting market supply and demand. Interest rate risk arises whenever a country changes its stated interest rate target associated with its currency. Country risk arises because virtually every country has interfered with international transactions in its currency. Counterparty credit risk arises when the counterparty will not fulfill its obligations to the Fund. Short sale risk arises from the sale of a security that is not owned, or any sale that is completed by the delivery of a security borrowed. |
| | • | | Commodity Risk: Exposure to the commodities markets may subject the Fund to greater volatility than investments in traditional securities. Commodity prices are influenced by unfavorable weather, animal and plant disease, geologic and environmental factors, as well as changes in government regulation such as tariffs, embargoes or burdensome production rules and restrictions. |
Futures: The Fund and the Subsidiary may enter into futures contracts. Futures contracts are agreements between two parties to buy and sell a particular commodity, instrument or index for a specified price on a specified future date. When the Fund or the Subsidiary enters into a futures contract, it is required to deposit with (or for the benefit of) its broker an amount of cash or short-term high-quality securities as “initial margin”. The margin requirements are set by the exchange on which the contract is traded and may be modified during the term of the contract. The initial margin is in the nature of a performance bond or good faith deposit on the futures contract that is returned to the Fund upon termination of the contract, assuming all contractual obligations have been satisfied. As the value of the contract changes, the value of the futures contract position increases or declines. Subsequent payments, known as “variation margin”, are made or received by the Fund or the Subsidiary, depending on the price fluctuations in the fair value of the contract and the value of cash or securities on deposit with the broker. The aggregate principal amounts of the contracts are not recorded in the financial statements. Fluctuations in the value of the contracts are recorded in the Consolidated Statements of Assets and Liabilities as an asset (liability) and in the Consolidated Statements of Operations as unrealized appreciation (depreciation) until the contracts are closed, when they are recorded as realized gains (losses). Realized gain or loss on a futures position is equal to the difference between the value of the contract at the time it was opened and the value at the time it was closed, minus brokerage commissions. When the Fund or the Subsidiary enters into a futures contract certain risks may arise, such as illiquidity in the futures market, which may limit the Fund’s or the Subsidiary’s ability to close out a futures contract prior to settlement date, and unanticipated movements in the value of securities, commodities or interest rates. Futures contracts are exchange-traded. Exchange-traded futures are standardized contracts and are settled through a clearing house with fulfillment supported by the credit of the exchange. Therefore, counterparty credit risk to the Fund and the Subsidiary is reduced. In addition, the Fund could be exposed to risk if the counterparties to the contracts are unable to meet the terms of their contracts. With exchange traded futures, there is minimal counterparty credit risk to the Funds since futures are exchange traded and the exchange’s clearinghouse, as a counterparty to all exchange traded futures, guarantees the futures against default.
| | |
Annual Report | April 30, 2015 | | 15 |
| | |
Aspen Managed Futures Strategy Fund | | Notes to Consolidated Financial Statements |
| | April 30, 2015 |
Consolidated Balance Sheet – Fair Value of Derivative Instruments as of April 30, 2015(a):
| | | | | | | | | | | | |
| Risk Exposure | | Asset Derivatives Balance Sheet Location | | Fair Value | | | Liabilities Derivatives Balance Sheet Location | | Fair Value | |
| |
Futures Contracts | | Variation margin receivable | | $ | 765,420 | | | Variation margin payable | | $ | 5,617,268 | |
| |
| | | | $ | 765,420 | | | | | $ | 5,617,268 | |
| |
| | | | |
| | Risk Exposure to Fund | | | | | | | | | | |
| | Commodity Contracts | | $ | 270,724 | | | | | $ | 515,777 | |
| | Equity Contracts | | | 430,512 | | | | | | 354,999 | |
| | Fixed Income Contracts | | | – | | | | | | 1,273,888 | |
| | Foreign Currency Contracts | | | 64,184 | | | | | | 3,472,604 | |
| | | | | | |
| | | | $ | 765,420 | | | | | $ | 5,617,268 | |
| | | | | | |
| (a) | The number of futures contracts held at April 30, 2015 is representative of activity during the year ended April 30, 2015. |
Consolidated Statement of Operations – The effect of Derivative Instruments for the year ended April 30, 2015:
| | | | | | | | | | |
| Derivatives Instruments | | Location of Gain/(Loss) on Derivatives Recognized in Income | | Realized Gain/(Loss) on Derivatives Recognized in Income | | | Change in Unrealized Gain/(Loss) on Derivatives Recognized in Income |
|
Futures Contracts | | Net realized gain on futures contracts/Net | | | | | | |
| | change in unrealized depreciation on | | | | | | |
| | futures contracts | | $ | 36,480,798 | | | $ (7,069,889) |
| | | | | |
| | | | $ | 36,480,798 | | | $ (7,069,889) |
| | | | | |
| | Risk Exposure to Fund | | | | | | |
| | Commodity Contracts | | $ | 6,597,595 | | | $ (875,750) |
| | Equity Contracts | | | (791,236) | | | (445,066) |
| | Fixed Income Contracts | | | 9,329,556 | | | (1,466,856) |
| | Foreign Currency Contracts | | | 21,344,883 | | | (4,282,217) |
| | | | | |
| | | | $ | 36,480,798 | | | $ (7,069,889) |
| | | | | |
4. TAX BASIS INFORMATION
Reclassifications: Reclassifications to paid-in capital relate primarily to differing book/tax treatment of net investment losses, foreign currency transactions, and income from a controlled foreign corporation. For the year ended April 30, 2015, the following reclassifications, which had no impact on results of operations or net assets, were recorded to reflect tax character:
| | | | | | | | | | | | |
| Fund | | Paid-in Capital | | | Accumulated Net Investment Gain | | | Accumulated Net Realized Loss | |
Aspen Managed Futures Strategy Fund | | $ | 875,750 | | | $ | 8,277,539 | | | $ | (9,153,289) | |
Tax Basis of Investments: As of April 30, 2015, the aggregate cost of investments, gross unrealized appreciation/(depreciation) and net unrealized depreciation for Federal tax purposes was as follows:
| | | | | | | | | | | | | | | | | | | | |
| | | Cost of
Investments | | | Gross Appreciation (excess of value
over tax cost) | | | Gross Depreciation (excess of tax cost
over value ) | | | Net Depreciation on Futures Contracts
and Foreign Currencies | | | Net Depreciation
on Investments | |
Aspen Managed Futures Strategy Fund | | $ | 232,316,769 | | | $ | 1,061,672 | | | $ | (943,374) | | | $ | (4,842,097) | | | $ | (4,723,799) | |
| | |
16 | | www.aspenfuturesfund.com |
| | |
Aspen Managed Futures Strategy Fund | | Notes to Consolidated Financial Statements |
| | April 30, 2015 |
Components of Distributable Earnings: At April 30, 2015, components of distributable earnings were on a tax basis as follows:
| | | | |
| | | Aspen Managed Futures Strategy Fund | |
Undistributed ordinary income | | $ | 13,114,296 | |
Accumulated net capital gains | | | 8,439,863 | |
Net unrealized depreciation on futures contracts | | | (4,723,799) | |
Other cumulative effect of timing differences | | | 4,606,795 | |
Total distributable earnings | | $ | 21,437,155 | |
| | |
Capital Losses: As of April 30, 2015, the Fund has no accumulated capital loss carryforwards.
During the year ended April 30, 2015, the Fund utilized capital loss carryforwards in the amount of $35,626.
Tax Basis of Distributions to Shareholders: Distributions are determined in accordance with federal income tax regulations, which differ from GAAP, and, therefore, may differ significantly in amount or character from net investment income and realized gains for financial reporting purposes. Financial reporting records are adjusted for permanent book/tax differences to reflect tax character but are not adjusted for temporary differences.
The tax character of distributions paid during the year ending April 30, 2015 were as follows:
| | | | | | | | |
| | | Ordinary Income | | | Long-Term Capital Gain | |
Aspen Managed Futures Strategy Fund | | $ | 399,962 | | | $ | 4,128,774 | |
|
The tax character of distributions paid during the year ending April 30, 2014 were as follows: | |
| | |
| | | Ordinary Income | | | Long-Term Capital Gain | |
Aspen Managed Futures Strategy Fund | | $ | – | | | $ | 2,321,185 | |
5. SHARES OF BENEFICIAL INTEREST
The capitalization of the Trust consists of an unlimited number of shares of beneficial interest with no par value per share. Holders of the shares of the Fund of the Trust have one vote for each share held and a proportionate fraction of a vote for each fractional share. All shares issued and outstanding are fully paid and are transferable and redeemable at the option of the shareholder. Purchasers of the shares do not have any obligation to make payments to the Trust or its creditors (other than the purchase price for the shares) or make contributions to the Trust or its creditors solely by reason of the purchasers’ ownership of the shares. Shares have no pre-emptive rights.
Fund shares redeemed within 30 days of purchase may incur a 2% short-term redemption fee deducted from the redemption amount. The amount of redemption fees received during the period are presented in the Consolidated Statement of Changes in Net Assets.
6. MANAGEMENT AND RELATED-PARTY TRANSACTIONS
Aspen Partners Ltd. (the “Adviser” or “Aspen”), subject to the authority of the Board, is responsible for the overall management and administration of the Fund’s business affairs. The Adviser manages the investments of the Fund in accordance with the Fund’s investment objective, policies and limitations and investment guidelines established jointly by the Adviser and the Board. Pursuant to the Investment Advisory Agreement, (the “Advisory Agreement”), the Fund will pay the Adviser an annual management fee of 0.75%, based on the Fund’s average daily net assets. The management fee is paid on a monthly basis.
The Subsidiary has entered into a separate advisory agreement (the “Subsidiary Advisory Agreement”) with Aspen, the Subsidiary’s investment adviser and the Fund’s investment adviser, for the management of the Subsidiary’s portfolio pursuant to which the Subsidiary is obligated to pay the Adviser a management fee at the same rate that the Fund pays the Adviser for investment advisory services provided to the Fund. The Adviser has agreed to waive the advisory fee it receives from the Fund in an amount equal to the management fee paid by the Subsidiary. This waiver may not be terminated or modified without the consent of the Board.
| | |
Annual Report | April 30, 2015 | | 17 |
| | |
Aspen Managed Futures Strategy Fund | | Notes to Consolidated Financial Statements |
| | April 30, 2015 |
The Adviser has contractually agreed to waive and/or reimburse fees or expenses in order to limit total annual fund operating expenses after fee waiver/expense reimbursements (excluding distribution and service (12b-1) fees, shareholder services fees, acquired fund fees and expenses, brokerage expenses, interest expenses, taxes and extraordinary expenses) to 1.55% of the Fund’s average daily net assets. This agreement is in effect through August 31, 2016. This agreement may not be terminated or modified prior to this date except with the approval of the Board.
Pursuant to this agreement, the Fund will reimburse the Adviser for any fee waivers and expense reimbursements made by the Adviser, provided that any such reimbursements made by the Fund to the Adviser will not cause the Fund’s expense limitation to exceed expense limitations in existence at the time the expense was incurred, or at the time of the reimbursement, whichever is lower, and the reimbursement is made within three years after the expenses were incurred.
Fund Accounting Fees and Expenses
ALPS Fund Services, Inc. (“ALPS”) serves as administrator to the Fund and the Fund has agreed to pay expenses incurred in connection with their administrative activities. Pursuant to an Administrative Agreement, ALPS provides operational services to the Fund including, but not limited to, fund accounting and fund administration and generally assists in the Fund’s operations. Officers of the Trust are employees of ALPS. The Fund’s administration fee is accrued on a daily basis and paid monthly. Administration fees paid by the Fund for the year ended April 30, 2015 are disclosed in the Consolidated Statement of Operations.
ALPS is reimbursed by the Fund for certain out-of-pocket expenses.
Transfer Agent
ALPS serves as transfer, dividend paying and shareholder servicing agent for the Fund. ALPS receives an annual minimum fee, a fee based upon the number of shareholder accounts, and is also reimbursed by the Fund for certain out-of-pocket expenses.
Compliance Services
ALPS provides services that assist the Trust’s chief compliance officer in monitoring and testing the policies and procedures of the Trust in conjunction with requirements under Rule 38a-1 under the 1940 Act and receives an annual base fee. ALPS is reimbursed for certain out-of-pocket expenses by the Fund.
Principal Financial Officer
ALPS receives an annual fee for providing principal financial officer services to the Fund.
Distributor
ALPS Distributors, Inc. (“ADI” or the “Distributor”) (an affiliate of ALPS) acts as the distributor of the Fund’s shares pursuant to a Distribution Agreement with the Trust. Shares are sold on a continuous basis by ADI as agent for the Fund, and ADI has agreed to use its best efforts to solicit orders for the sale of the Fund’s shares, although it is not obliged to sell any particular amount of shares. ADI is not entitled to any compensation for its services as Distributor. ADI is registered as a broker-dealer with the Securities and Exchange Commission.
The Fund has adopted a plan of distribution for Class A shares pursuant to Rule 12b-1 under the 1940 Act (the “Plan”). The Plan allows the Fund to use Class A assets to pay fees in connection with the distribution and marketing of Class A shares and/or the provision of shareholder services to Class A shareholders. The Plan permits payment for services in connection with the administration of plans or programs that use Class A shares as their funding medium and for related expenses. The Plan permits the Fund to use its Class A assets to make total payments at an annual rate of up to 0.25% of the Fund’s average daily net assets attributable to its Class A shares. The expenses of the plan are reflected as distribution and service fees in the Consolidated Statement of Operations.
The Fund has adopted a shareholder service plan (a “Shareholder Services Plan”) for Class A shares. Under the Shareholder Services Plan the Fund is authorized to pay banks and their affiliates and other institutions, including broker-dealers and Fund affiliates (“Participating Organizations”), an aggregate fee in an amount not to exceed on an annual basis 0.15% for Class A shares of the average daily net asset value of the Class A shares, respectively, attributable to or held in the name of a Participating Organization for its clients as compensation for providing shareholder service activities, which do not include distribution services, pursuant to an agreement with a Participating Organization. Any amount of such payment not paid during the Fund’s fiscal year for such service activities shall be reimbursed to the Fund. Shareholder Services Plan fees are included with distribution and service fees on the Consolidated Statement of Operations.
Index Licensing Services
The Fund has adopted an Index Licensing Agreement with Quantitative Equity Strategies, LLC (“QES”) and the Adviser, joint owners of the Index, pursuant to which the Fund pays QES a monthly annualized licensing fee of 0.25%, based on the Fund’s average daily net assets for the right to use the Index in connection with the Fund.
| | |
18 | | www.aspenfuturesfund.com |
| | |
Aspen Managed Futures Strategy Fund | | Notes to Consolidated Financial Statements |
| | April 30, 2015 |
7. SECURITIES TRANSACTIONS
The cost of purchases and proceeds from sales of U.S. Government securities (excluding short-term securities) during the year ended April 30, 2015 were as follows:
| | | | |
| Aspen Managed Futures Strategy Fund | | | |
Cost of Investments Purchased | | $ | 58,838,468 | |
Proceeds from Investments Sold | | $ | 23,760,410 | |
8. INDEMNIFICATIONS
Under the Trust’s organizational documents, its officers and Trustees are indemnified against certain liability arising out of the performance of their duties to the Trust. Additionally, in the normal course of business, the Trust enters into contracts with service providers that may contain general indemnification clauses, which may permit indemnification to the extent permissible under applicable law. The Trust’s maximum exposure under these arrangements is unknown, as this would involve future claims that may be made against the Trust that have not yet occurred.
| | |
Annual Report | April 30, 2015 | | 19 |
| | |
Aspen Managed Futures Strategy Fund | | Report of Independent Registered Public Accounting Firm |
| | |
To the Shareholders and Board of Trustees of Financial Investors Trust:
We have audited the accompanying consolidated statement of assets and liabilities, including the consolidated schedule of investments, of Aspen Managed Futures Strategy Fund and subsidiary (the “Fund”), one of the portfolios constituting Financial Investors Trust, as of April 30, 2015, the related consolidated statement of operations for the year then ended, the consolidated statements of changes in net assets for each of the two years in the period then ended, and the consolidated financial highlights for each of the three years in the period then ended and the period from August 2, 2011 (inception) to April 30, 2012. These financial statements and financial highlights are the responsibility of the Fund’s management. Our responsibility is to express an opinion on these financial statements and financial highlights based on our audits.
We conducted our audits in accordance with the standards of the Public Company Accounting Oversight Board (United States). Those standards require that we plan and perform the audit to obtain reasonable assurance about whether the financial statements and financial highlights are free of material misstatement. The Fund is not required to have, nor were we engaged to perform, an audit of its internal control over financial reporting. Our audits included consideration of internal control over financial reporting as a basis for designing audit procedures that are appropriate in the circumstances, but not for the purpose of expressing an opinion on the effectiveness of the Fund’s internal control over financial reporting. Accordingly, we express no such opinion. An audit also includes examining, on a test basis, evidence supporting the amounts and disclosures in the financial statements, assessing the accounting principles used and significant estimates made by management, as well as evaluating the overall financial statement presentation. Our procedures included confirmation of securities owned as of April 30, 2015, by correspondence with the custodian and broker. We believe that our audits provide a reasonable basis for our opinion.
In our opinion, the consolidated financial statements and financial highlights referred to above present fairly, in all material respects, the financial position of Aspen Managed Futures Strategy Fund and subsidiary of the Financial Investors Trust, as of April 30, 2015, the results of their operations for the year then ended, the changes in their net assets for each of the two years in the period then ended, and the financial highlights for each of the three years in the period then ended and the period from August 2, 2011 (inception) to April 30, 2012, in conformity with accounting principles generally accepted in the United States of America.
DELOITTE & TOUCHE LLP
Denver, Colorado
June 26, 2015
| | |
20 | | www.aspenfuturesfund.com |
| | |
Aspen Managed Futures Strategy Fund | | Disclosure Regarding Approval of Fund Advisory Agreement |
| | April 30, 2015 (Unaudited) |
On March 3, 2015, the Trustees met in person to discuss, among other things, the approval of the investment advisory agreement (the “Investment Advisory Agreement”) between the Trust and Aspen Partners, Ltd. (“Aspen”) with respect to the Aspen Managed Futures Strategy Fund (the “Aspen Fund”), in accordance with Section 15(c) of the 1940 Act. The Independent Trustees met with independent legal counsel during executive session and discussed the Investment Advisory Agreement and other related materials.
In renewing and approving the Investment Advisory Agreement, the Trustees, including the Independent Trustees, considered the following factors with respect to the Aspen Fund:
Investment Advisory Fee Rate and Total Expense Ratios: The Trustees reviewed and considered the contractual annual advisory fee to be paid by the Trust, on behalf of the Aspen Fund, to Aspen of 0.75% of the average daily net assets of the Aspen Fund, in light of the extent and quality of the advisory services provided by Aspen to the Aspen Fund.
The Trustees considered the information they received comparing the Aspen Fund’s contractual annual advisory fee and total expense ratios (net of waivers) with those of funds in the relevant peer expense group of provided by an independent provider of investment company data.
The Trustees also considered whether there were any fee structures applicable to Aspen’s comparable clients employing a strategy comparable to that of the Aspen Fund, noting that Aspen had indicated that it did not offer comparable strategies to other investment companies or other large institutional clients at this time, but was exploring those options for 2015.
The Trustees noted that the contractual annual advisory fee of 0.75% was the lowest in the Managed Futures peer group. The Trustees also noted that the total net expense ratios of 1.83% and 1.30% of the Class A and Class I Shares, respectively, of the Aspen Fund, were in the case of the Class A shares, slightly lower than both the expense group median and the expense group average, and in the case of the Class I shares, significantly lower than both the expense group median and the expense group average.
Nature, Extent and Quality of the Services under the Investment Advisory Agreement: The Trustees received and considered information regarding the nature, extent and quality of services provided to the Aspen Fund under the Investment Advisory Agreement. The Trustees reviewed certain background materials supplied by Aspen in its presentation, including its Form ADV and compliance materials.
The Trustees reviewed and considered Aspen’s investment advisory personnel, its history as an asset manager, its performance and the amount of assets currently under management by Aspen. The Trustees also reviewed the research and decision-making processes utilized by Aspen, including the methods adopted to seek to achieve compliance with the investment objectives, policies and restrictions of the Aspen Fund.
The Trustees considered the background and experience of Aspen’s management in connection with the Aspen Fund, including reviewing the qualifications, backgrounds and responsibilities of the management team primarily responsible for the day-to-day portfolio management of the Aspen Fund and the extent of the resources devoted to research and analysis of actual and potential investments.
The Trustees also reviewed the accompanying compliance-related materials and further noted that they have received reports on these services and compliance issues at each regular Board meeting throughout the year related to the services rendered by Aspen with respect to the Aspen Fund.
Performance: The Trustees reviewed performance information for each Aspen Fund for the 3-month, 1-year, and 3-year periods ended September 30, 2014, for each share class. That review included a comparison of each Aspen Fund’s performance to the performance of a universe of comparable funds selected by an independent provider of investment company data. The Trustees noted the Aspen Fund had achieved slightly below average performance its peer performance universe for the 3-month and 1-year periods, but had achieved the best 3-year performance its peer performance universe.
Adviser’s Profitability: The Trustees considered the profits, if any, realized by Aspen in connection with the operation of the Aspen Fund. The Board then reviewed Aspen’s financial statements in order to analyze the financial condition and stability and profitability of the adviser.
Economies of Scale: The Trustees considered whether economies of scale in the provision of services to the Aspen Fund will be passed along to the shareholders under the proposed agreements.
Other Benefits to the Adviser: The Trustees reviewed and considered any other incidental benefits derived or to be derived by Aspen from its relationship with the Aspen Fund, including whether soft dollar arrangements were used.
In selecting Aspen as the Aspen Fund’ investment adviser and approving the Investment Advisory Agreement and the fees charged under the Investment Advisory Agreement, the Trustees concluded that no single factor reviewed by the Trustees was identified by the Trustees to be
| | |
Annual Report | April 30, 2015 | | 21 |
| | |
Aspen Managed Futures Strategy Fund | | Disclosure Regarding Approval of Fund Advisory Agreement |
| | April 30, 2015 (Unaudited) |
determinative as the principal factor in whether to approve the Investment Advisory Agreement. Further, the Independent Trustees were advised by separate independent legal counsel throughout the process. The Trustees, including all of the Independent Trustees, determined that:
| | ● | | the investment advisory fees to be received by Aspen were the lowest in the peer group and that the total net expense ratios with respect to the Class A and Class I shares of the Aspen Fund were each lower than both the expense group median and the expense group average, and in the case of the Class I shares, significantly lower; |
| | ● | | there were no investment products offered by Aspen to other investment companies or other large institutional clients with comparable strategies at this time, but Aspen was exploring those options for the future; |
| | ● | | the nature, extent and quality of services to be rendered by Aspen under the Investment Advisory Agreement were adequate; the performance of the Aspen Fund was slightly below average in its peer performance universe for the 3-month and 1-year periods, but more importantly, the best 3-year performance its peer performance universe; |
| | ● | | the profit earned and anticipated to be realized by Aspen in connection with the operation of the Aspen Fund is not unreasonable to the Trust; and |
| | ● | | there were no material economies of scale or other benefits currently accruing to Aspen in connection with its relationship with the Aspen Fund. |
Based on the Trustees’ deliberations and their evaluation of the information described above, the Trustees, including all of the Independent Trustees, concluded that Aspen’s compensation for investment advisory services is consistent with the best interests of the Aspen Fund and their shareholders.
| | |
22 | | www.aspenfuturesfund.com |
| | |
Aspen Managed Futures Strategy Fund | | Additional Information |
| | April 30, 2015 (Unaudited) |
1. FUND HOLDINGS
The Fund files its complete schedule of portfolio holdings with the Securities and Exchange Commission (the “SEC”) for the first and third quarters of each fiscal year on Form N-Q within 60 days after the end of the period. Copies of the Fund’s Form N-Q are available without charge on the SEC website at http://www.sec.gov. You may also review and copy the Form N-Q at the SEC’s Public Reference Room in Washington, DC. For more information about the operation of the Public Reference Room, please call the SEC at 1-800-SEC-0330.
2. FUND PROXY VOTING POLICIES, PROCEDURES AND SUMMARIES
The Fund’s policies and procedures used in determining how to vote proxies and information regarding how the Fund voted proxies relating to portfolio securities during the most recent prior 12-month period ending June 30 are available without charge, (1) upon request, by calling (toll-free) 855-845-9444 and (2) on the SEC’s website at http://www.sec.gov.
3. TAX INFORMATION (UNAUDITED)
The Fund designates the following for federal income tax purposes for distributions made during the calendar year ended December 31, 2014:
| | | | |
| | | QDI | | DRD |
Aspen Managed Futures Strategy Fund | | 0.00 % | | 0.00 % |
In early 2015, if applicable, shareholders of record received this information for the distribution paid to them by the Fund during the calendar year 2014 via Form 1099. The Fund will notify shareholders in early 2016 of amounts paid to them by the Funds, if any, during the calendar year 2015.
Pursuant to Section 852(b)(3) of the Internal Revenue Code, Aspen Managed Futures Strategy Fund designated $4,128,774 as long-term capital gain distribution.
| | |
Annual Report | April 30, 2015 | | 23 |
| | |
Aspen Managed Futures Strategy Fund | | Trustees and Officers |
| | April 30, 2015 (Unaudited) |
Additional information regarding the Fund’s trustees is included in the Statement of Additional Information, which can be obtained without charge by calling 855-845-9444.
INDEPENDENT TRUSTEES
| | | | | | | | | | |
Name, Address* & Year of Birth | | Position(s) Held with Fund | | Term of Office and Length of Time Served** | | Principal Occupation(s) During Past 5 Years*** | | Number of Funds in Fund Complex
Overseen by Trustee**** | | Other Directorships
Held by Trustee
During Past 5 Years |
Mary K. Anstine, 1940 | | Trustee | | Ms. Anstine was elected at a special meeting of shareholders held on March 21, 1997 and re-elected at a special meeting of shareholders held on August 7, 2009. | | Ms. Anstine was formerly an Executive Vice President of First Interstate Bank of Denver until 1994, President/Chief Executive Officer of HealthONE Alliance, Denver, Colorado, from 1994 to 2004, and has been retired since 2004. Ms. Anstine is also Trustee/Director of AV Hunter Trust and Colorado Uplift Board. Ms. Anstine was formerly a Director of the Trust Bank of Colorado (later purchased and now known as Northern Trust Bank), HealthONE and Denver Area Council of the Boy Scouts of America, and a member of the American Bankers Association Trust Executive Committee. | | 30 | | Ms. Anstine is a Trustee of ALPS ETF Trust (18 funds); ALPS Variable Investment Trust (9 funds); Reaves Utility Income Fund (1 fund); and Westcore Trust (12 funds). |
John R. Moran, Jr., 1930 | | Trustee | | Mr. Moran was elected at a special meeting of shareholders held on March 21, 1997 and re-elected at a special meeting of shareholders held on August 7, 2009. | | Mr. Moran formerly served as President and CEO of The Colorado Trust, a private foundation serving the health and hospital community in the state of Colorado, from 1991 to 2007. During his career as an attorney from 1958 to 1991, Mr. Moran was formerly a partner with the firm of Kutak Rock & Campbell in Denver, Colorado and a member of the Colorado House of Representatives. Currently, Mr. Moran is a member of the Treasurer’s Investment Advisory Committee for the University of Colorado. | | 30 | | None. |
| * | All communications to Trustees and Officers may be directed to Financial Investors Trust c/o 1290 Broadway, Suite 1100, Denver, CO 80203. |
| ** | This is the period for which the Trustee or Officer began serving the Trust. Each Trustee and/or Officer serves an indefinite term, until his successor is elected. |
| *** | Except as otherwise indicated, each individual has held the office shown or other offices in the same company for the last five years. |
| **** | The Fund Complex includes all series of the Trust (currently 30) and any other investment companies for which any Trustee serves as Trustee for and which Aspen Partners, Ltd. provides investment advisory services (currently none). |
| | |
24 | | www.aspenfuturesfund.com |
| | |
Aspen Managed Futures Strategy Fund | | Trustees and Officers |
| | April 30, 2015 (Unaudited) |
INDEPENDENT TRUSTEES
| | | | | | | | | | |
Name, Address* & Year of Birth | | Position(s) Held with Fund | | Term of Office and Length of Time Served** | | Principal Occupation(s) During Past 5 Years*** | | Number of Funds in Fund Complex
Overseen by Trustee**** | | Other Directorships
Held by Trustee
During Past 5 Years |
Jeremy W. Deems, 1976 | | Trustee | | Mr. Deems was appointed as a Trustee at the March 11, 2008 meeting of the Board of Trustees and elected at a special meeting of shareholders held on August 7, 2009. | | Mr. Deems is the Co-Founder and Chief Financial Officer of Green Alpha Advisors, LLC, a registered investment advisor, and Co-Portfolio Manager of the Shelton Green Alpha Fund. Prior to joining Green Alpha Advisors, Mr. Deems was CFO and Treasurer of Forward Management, LLC, ReFlow Management Co., LLC, ReFlow Fund, LLC, a private investment fund, and Sutton Place Management, LLC, an administrative services company, from 1998 to June 2007. From 2004 to 2005, Mr Deems also served as Treasurer of the Forward Funds and the Sierra Club Funds. | | 30 | | Mr. Deems is a Trustee of ALPS ETF Trust (18 funds); ALPS Variable Investment Trust (9 funds) and Reaves Utility Income Fund (1 fund). |
Jerry G. Rutledge, 1944 | | Trustee | | Mr. Rutledge was elected at a special meeting of shareholders held on August 7, 2009. | | Mr. Rutledge is the President and owner of Rutledge’s Inc., a retail clothing business. Mr. Rutledge is currently serving as a Director of the University of Colorado Hospital. Mr. Rutledge was from 1994 to 2007 a Regent of the University of Colorado. | | 30 | | Mr. Rutledge is a Trustee of Principal Real Estate Income Fund (1 fund), Clough Global Allocation Fund (1 fund), Clough Global Equity Fund (1 fund) and Clough Global Opportunities Fund (1 fund). |
Michael “Ross” Shell, 1970 | | Trustee | | Mr. Shell was elected at a special meeting of shareholders held on August 7, 2009. | | Mr. Shell is Founder and CEO of Red Idea, LLC, a strategic consulting/early stage venture firm (since June 2008). From 1999 to 2009, he was a part- owner and Director of Tesser, Inc., a brand agency. From December 2005 to May 2008, he was Director, Marketing and Investor Relations, of Woodbourne, a REIT/real estate hedge fund and private equity firm. Prior to this, from May 2004 to November 2005, he worked as a business strategy consultant; from June 2003 to April 2004, he was on the Global Client Services team of IDEO, a product design/innovation firm; and from 1999 to 2003, he was President of Tesser, Inc. Mr. Shell graduated with honors from Stanford University with a degree in Political Science. | | 30 | | None. |
| | |
Annual Report | April 30, 2015 | | 25 |
| | |
Aspen Managed Futures Strategy Fund | | Trustees and Officers |
| | April 30, 2015 (Unaudited) |
INTERESTED TRUSTEE
| | | | | | | | | | |
Name, Address* & Age | | Position(s) Held with
Fund | | Term of Office and Length of Time Served** | | Principal Occupation(s) During Past 5 Years*** | | Number of
Funds in
Fund Complex
Overseen by Trustee**** | | Other Directorships
Held by Trustee |
Edmund J. Burke, 1961 | | Trustee,
Chairman
and
President | | Mr. Burke was elected as Chairman at the August 28, 2009 meeting of the Board of Trustees. Mr. Burke was elected as Trustee at a special meeting of shareholders held on August 7, 2009. Mr. Burke was elected President of the Trust at the December 17, 2002 meeting of the Board of Trustees. | | Mr. Burke is President and a Director of ALPS Holdings, Inc. (“AHI”) (since 2005) and Director of Boston Financial Data Services, Inc. (“BFDS”), ALPS Advisors, Inc. (“AAI”), ALPS Distributors, Inc. (“ADI”), ALPS Fund Services, Inc. (“AFS”) and ALPS Portfolio Solutions Distributor, Inc. (“APSD”) and from 2001-2008, was President of AAI, ADI, AFS and APSD. Because of his positions with AHI, BFDS, AAI, ADI, AFS and APSD, Mr. Burke is deemed an affiliate of the Trust as defined under the 1940 Act. Mr. Burke is Trustee and President of the Clough Global Allocation Fund (Trustee since 2006; President since 2004); Trustee and President of the Clough Global Equity Fund (Trustee since 2006; President since 2005); Trustee and President of the Clough Global Opportunities Fund (since 2006); Trustee of the Liberty All-Star Equity Fund; and Director of the Liberty All-Star Growth Fund, Inc. | | 35 | | Mr. Burke is a Trustee of Clough Global Allocation Fund (1 fund); Clough Global Equity Fund (1 fund); Clough Global Opportunities Fund (1 fund); Trustee of the Liberty All-Star Equity Fund (1 fund); and Director of the Liberty All-Star Growth Fund, Inc. (1 fund). |
| * | All communications to Trustees and Officers may be directed to Financial Investors Trust c/o 1290 Broadway, Suite 1100, Denver, CO 80203. |
| ** | This is the period for which the Trustee or Officer began serving the Trust. Each Trustee and/or Officer serves an indefinite term, until his successor is elected. |
| *** | Except as otherwise indicated, each individual has held the office shown or other offices in the same company for the last five years. |
| **** | The Fund Complex includes all series of the Trust (currently 30) and any other investment companies for which any Trustee serves as Trustee for and which Aspen Partners, Ltd. provides investment advisory services (currently none). |
| | |
26 | | www.aspenfuturesfund.com |
| | |
Aspen Managed Futures Strategy Fund | | Trustees and Officers |
| | April 30, 2015 (Unaudited) |
OFFICERS
| | | | | | |
Name, Address* & Year of Birth | | Position(s) Held
with Fund | | Term of Office and Length
of Time Served** | | Principal Occupation(s) During Past 5 Years*** |
| Kimberly R. Storms, 1972 | | Treasurer | | Ms. Storms was elected Treasurer of the Trust at the March 12, 2013 meeting of the Board of Trustees. | | Ms. Storms is Senior Vice President and Director of Fund Administration of ALPS. Because of her position with ALPS, Ms. Storms is deemed an affiliate of the Trust as defined under the 1940 Act. Ms. Storms is also Treasurer of Liberty All-Star Equity Fund and Liberty All-Star Growth Fund, Inc. and Chief Financial Officer of The Arbitrage Funds. |
David T. Buhler, 1971 | | Secretary | | Mr. Buhler was elected Secretary of the Trust at the September 11, 2012 meeting of the Board of Trustees. | | Mr. Buhler joined ALPS in June 2010. He is currently Vice President and Senior Associate Counsel of ALPS, AAI, ADI and APSD. Prior to joining ALPS, Mr. Buhler served as Associate General Counsel and Assistant Secretary of Founders Asset Management LLC from 2006 to 2009. Because of his position with ALPS, Mr. Buhler is deemed an affiliate of the Trust as defined under the 1940 Act. Mr. Buhler is also the Secretary ALPS Variable Investment Trust, ALPS ETF Trust and Westcore Trust. |
Ted Uhl, 1974 | | Chief Compliance Officer (“CCO”) | | Mr. Uhl was appointed CCO of the Trust at the June 8, 2010 meeting of the Board of Trustees. | | Mr. Uhl joined ALPS in October 2006, and is currently Deputy Compliance Officer of ALPS. Prior to his current role, Mr. Uhl served as Senior Risk Manager for ALPS from October 2006 until June 2010. Because of his position with ALPS, Mr. Uhl is deemed an affiliate of the Trust as defined under the 1940 Act. Mr. Uhl is also CCO of the Clough Global Funds, Reaves Utility Income Fund, Centre Funds and Transparent Value Trust. |
| | |
Annual Report | April 30, 2015 | | 27 |


This material must be accompanied or preceded by the prospectus.
WWW.ASPENFUTURESFUND.COM
| | | | |
Shareholder Letter | | | 1 | |
| |
Performance Update | | | 10 | |
| |
Disclosure of Fund Expenses | | | 12 | |
| |
Portfolio of Investments | | | 13 | |
| |
Statement of Assets and Liabilities | | | 22 | |
| |
Statement of Operations | | | 23 | |
| |
Statements of Changes in Net Assets | | | 24 | |
| |
Financial Highlights | | | 25 | |
| |
Notes to Financial Statements | | | 26 | |
| |
Report of Independent Registered Public Accounting Firm | | | 32 | |
| |
Additional Information | | | 33 | |
| |
Trustees and Officers | | | 34 | |
|
Disciplined Growth Investors’ goal is to communicate clearly and transparently with our clients and mutual fund shareholders. It is mutually beneficial when our shareholders understand how we invest, what we are currently thinking and forecasting, and the specific investment decisions we have made. Our views and opinions regarding the investment prospects of our portfolio holdings and Funds are “forward looking statements” which may or may not be accurate over the long term. While we believe we have a reasonable basis for these forecasts and have confidence in our investment team’s views, actual results may differ materially from those we anticipate. Information provided in this report should not be considered a recommendation to purchase or sell any particular security. | |
You can identify forward looking statements as those including words such as “believe”, “expect”, “anticipate”, “forecast”, and similar statement. We cannot assure future performance. These forward-looking statements are made only as-of the date of this report. Following the publication of this report, we will not update any of the forward-looking statements included here. | |
Past performance does not guarantee future results. Fund prices fluctuate as the underlying assets have exposure to market fluctuations and other risks, as described in the Fund’s prospectus. Please visit www.dgifund.com or call 855-344-3863 to obtain current performance information and for the current prospectus and statement of additional information. This material must be preceded or accompanied by a prospectus. Please read the prospectus carefully before investing. | |
| | |
| The Disciplined Growth Investors Fund | | Shareholder Letter |
| | April 30, 2015 (Unaudited) |
April 30, 2015
Dear Shareholders,
As of April 30, 2015, your mutual fund had total assets of $113.4 million. One year ago, the Fund had total assets of $86.8 million. The increase is a result of positive investment performance and stable investor inflows that were greater than outflows. We thank you for your patience and loyalty as shareholders.
Performance
Your mutual fund returned 12.87% after fees in the last year (through April 30, 2015). Our research shows the expected returns of the Fund’s equity holdings far exceeds that of the bonds in the portfolio. It is worth reminding our shareholders that when we allocate portfolio capital into any equity investment, we calculate an expected return for that stock. Our minimum hurdle rate1 for purchases is 12%. This suggests that the DGI Fund has the potential to achieve long-term returns well in excess of those available from bonds and money market funds.
Since inception in August of 2011, the Fund has returned 73.6% (16.00% compounded annually). The equity portion of the Fund has increased 107.5% (21.7% compounded annually) and the bond portion has increased 12.0% (3.1% compounded annually).
In last year’s letter we wrote that calendar year 2014 would likely be a more challenging year than 2013’s “magic carpet ride”. Returns in 2014 were indeed lower than and less consistent than 2013. Early in 2014, we began more aggressively looking for new stock ideas to put in the portfolio. The stock market has moved irregularly upward in 2015. A market environment like 2015 can open up significant individual investment opportunities. We are continuing the effort of finding new stock ideas begun early in 2014.
Portfolio Asset Mix
The portfolio currently holds 69.5% stocks and 30.5% bonds and cash. A list of holdings is included as part of this annual report.
Portfolio Transactions
In the last twelve months, we made initial purchases of the following seven stocks: QLIK Technologies (QLIK), Realpage Inc. (RP), Urban Outfitters (URBN), Core Laboratories (CLB), Aruba Networks (ARUN), and Synaptics (SYNA).
We also added to the positions in Ultra Petroleum (UPL), Garmin Ltd. (GRMN), and Myriad Genetics (MYGN) during the past year. We closed the position of two Fund holdings, tw telecom (following Level 3’s acquisition of tw telecom) and Paragon Offshore.
| 1 | “Hurdle rate” refers to the minimum expected return a potential investment candidate must clear before we will make an investment. In the case of The DGI Fund the hurdle rate for stocks is 12%. This is an annualized rate of expected return over the next seven years. Existing holdings may show an expected return figure above or below the hurdle rate over the course of our long-term ownership. |
| | |
| | |
| Annual Report | April 30, 2015 | | 1 |
| | |
The Disciplined Growth Investors Fund | | Shareholder Letter |
| | April 30, 2015 (Unaudited) |
The Right Stuff
One of the best books I have read was written by Tom Wolfe in 1979. “The Right Stuff” related the story of the original Mercury 7 astronauts and the famous test pilots who preceded them. Much of the book centered on Chuck Yeager, the first man to break the sound barrier. Yeager was arguably the finest pilot of his time.
In “The Right Stuff”, the genius of Chuck Yeager was his acceptance of his situation at any moment. One of the riveting stories in the book is how Yeager had control problems with his experimental aircraft and still managed to land safely. Clearly he accepted the reality of his plight and his simple acceptance helped him survive. Yeager’s story offers a valuable lesson for investors: a choice to see the world as it is, not how we might want it to be.
Today investors are faced with an environment that is not how we want it to be. The problem is interest rates; they are lower than we would like. The ten-year US Treasury Note offers a yield-to-maturity (YTM)2 of 1.9% per year. The thirty-year US Treasury bond offers a YTM of 2.5%. And these yields are before the effects of inflation.
Yield-to-maturity is vitally important as an estimate of the future return from a bond before inflation. So, if the ten-year Treasury note is priced to yield 1.9% to maturity, that yield is your best estimate of your return from this T-Note if held to maturity (10 years, in this example).
I wish interest rates were higher. High rates make our mission at DGI a lot easier. Our clients are net lenders, not borrowers. High rates improve the return on the fixed income portion of the Fund. High rates simplify the investment challenge for retirees. High rates reduce the unfunded liabilities of our pension fund clients.
Before we delve further into bonds, we need to re-acquaint you with a foundational investment concept known as “margin of safety”. Ben Graham highlighted “margin of safety” as the most important investment principle of all. “Margin of safety” is easy to understand in our day-to-day lives. If a man chooses to drink to excess and drive his car, he is giving away his and others’ “margin of safety.” This does not mean he is pre-ordained to crash; he just has a higher likelihood of an unfortunate outcome. For those investors who are not concerned about an adequate margin of safety, their investment is not necessarily doomed to failure. They just have higher odds of a poor or catastrophic outcome.
In the case of bonds, especially US Treasury bonds and notes, the principal and interest payments are safe and offer some margin of safety for the investor. Unfortunately interest rates are so low that from a value standpoint bonds and notes offer a disappointingly low margin of safety.
The news gets worse. We believe bonds are not very good long-term investments, because of “interest-on-interest.” Interest earned and reinvested earns future interest payments -- interest-on-interest. It may seem counterintuitive, but this tends to increase the dispersion of bond returns
| 2 | Yield-to-Maturity, or YTM, is the return expected on a Bond if held until maturity date. Depending on the type of bond, this can be comprised of appreciation, depreciation, interest payments, or a combination of those factors. |
Yield-to-Sale would be an alternate measure of expressing a bond return, as the total return on the bond between purchase and sale points.
| | |
| | |
| 2 | | 1-855-DGI-FUND (344-3863) | www.DGIfund.com |
| | |
The Disciplined Growth Investors Fund | | Shareholder Letter |
| | April 30, 2015 (Unaudited) |
over time. Stocks perform almost exactly in reverse. Stocks have high volatility of returns over the very short-term but the dispersion of returns tends to narrow over long periods of time. The following chart clearly illustrates these behaviors:
Exhibit 1: Returns Characteristics of Stocks and Bonds
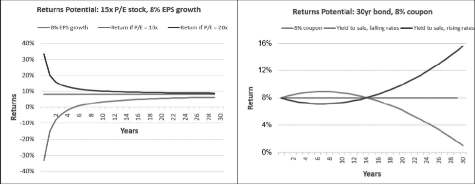
Source: Disciplined Growth Investors’ internal research. This is a hypothetical example for illustrative purposes only.
For those of you who want a more comprehensive explanation of the two charts above, our own Nick Hansen’s analysis is contained in the commentary following this investment letter.
Even though we believe bonds offer little margin of safety as a standalone investment and we do not currently view them as good long-term investments, bonds can serve important purposes in a balanced portfolio. They can be a source of stable income which is important for those who are taking regular distributions. Bonds can serve to moderate annual volatility. Typically stocks decline during periods of economic and financial fears; conversely investment-grade bonds do well because of their favored position in the capital structure of most companies. Bonds can also be a hedge against the now-famous Black Swan theory -- that a low-odds event can have major effects. We like to think of bonds as a source of income and a hedge against unforeseen market events.
The investment challenge today is that bonds are an expensive hedge solely because interest rates are so low. We need to adapt. The first step is to remember the lesson from Chuck Yeager and accept the reality of low rates. There are four steps we must take:
| | • | | We must budget for low returns from the fixed income side of the portfolio; for the next ten years 2-4% per year before inflation seems appropriate. |
| | • | | We have reduced the exposure to bonds to the minimum acceptable level for your Fund until interest rates increase to safer levels. |
| | • | | We need to communicate with our clients the implications of low interest rates. This letter is an attempt to improve our shareholders’ understanding of low interest rates. |
| | • | | We need to make sure your Fund is properly structured so as to balance the need for acceptable long-term returns with a tolerable level of annual volatility. |
| | |
| | |
| Annual Report | April 30, 2015 | | 3 |
| | |
The Disciplined Growth Investors Fund | | Shareholder Letter |
| | April 30, 2015 (Unaudited) |
In today’s low rate environment all investors are at risk of trying to stretch imprudently for yields. We are seeking to avoid at least two traps:
| | 1. | We will not chase yields; that is, we will not seek to invest in lower quality bond issues to temporarily enhance performance. We thoroughly understand that a borrower who pays a high rate of interest only does so because it cannot qualify for a lower rate. |
| | 2. | We also understand that transparency in the bond market has been severely compromised by the extensive use of derivatives. In far too many cases it is not possible to figure out the value of the underlying creditworthiness of a bond. |
How do we position the portfolio?
| | • | | We will maintain tight control over the maturity of your Fund’s bond portfolio. We believe it is inevitable that interest rates will rise, even if we cannot predict the timing. When interest rates rise the greatest damage is inflicted on holders of longer-term bonds. |
| | • | | We will maintain broad diversification in your Fund’s bond portfolio and equal weight the positions. This protects against an adverse credit experience with any one issuer. |
Bond3 investing is almost exactly opposite stock investing. Suppose we have two portfolios, one invested in three stocks and one in three bonds. If one of the stocks was Apple before it increased in value 100 fold, the portfolio would produce significant returns regardless of the success or failure of the other two stocks. Conversely in the three bond portfolio, if one bond defaults the other two bonds cannot increase their interest payments to make up for the loss. A single loss can lead to an adverse outcome.
There is good news. In contrast to bonds, our forecasts show that stocks today offer excellent returns. So we believe the appropriate investment policy is to maximize exposure to stocks and minimize exposure to bonds consistent with the Fund’s investment objectives.
Historical Context and Investment Outlook
It is now fifteen years since the Y2K demarcation. There are readily available lessons to be learned about investing in stocks and bonds if we break the fifteen years into the first ten years and the last five. For our purposes here we will examine the period from the beginning of 2000 (12/31/1999) until the beginning of 2010 (12/31/2009) and then the period from the beginning of 2010 (12/31/2009) until the beginning of 2015 (12/31/2014).
The first decade of the 21st century has been labeled the “lost decade”, especially for stocks. The S&P 500, the most widely used index of stock returns, actually lost money (-0.9% per year) for the decade, including reinvested dividends. Bonds provided clearly superior results during the same period, earning over 6% per year. Even money market funds performed spectacularly well, earning 4% per year. The “lost decade” began with a severe bear market in stocks and ended with a severe bear market in stocks.
The investment environment abruptly and violently reversed trend in the middle of 2009. Just prior to this reversal stocks had sold off to levels which we believed offered a once-in-a-generation buying opportunity.
| 3 | Purchasers of the shares do not have any obligation to make payments to the Trust or its creditors (other than the purchase price for the shares) or make contributions to the Trust or its creditors solely by reason of the purchasers’ ownership of the shares. |
| | |
| | |
| 4 | | 1-855-DGI-FUND (344-3863) | www.DGIfund.com |
| | |
The Disciplined Growth Investors Fund | | Shareholder Letter |
| | April 30, 2015 (Unaudited) |
The reversal which occurred in 2009 has continued through the end of 2014. From the beginning of 2010 through the end of 2014 the S&P 500 returned 15.5% while bonds returned 4.7%. Typical money market returns also dropped from 3% to near zero, even though inflation was about 1.5% per year. Our readers will note that equity performance is far better than the prior decade and bond performance is noticeably lower.
Let’s play this “movie” forward through the end of this decade. If bonds provide 2% per year for the next five years then their return for the decade would be 3.3% per year. If S&P 500 achieves a rate of return of 8% per year4 for the next five years then it would achieve an 11.7% annualized return for the decade. Assuming short-term interest rates increase slightly for the next five years, money market funds would provide less than 1% for the decade. Compare this to the annualized returns in the prior decade of -0.9% for the S&P 500, over 6% for bonds, and 4% for money market funds.
If we fast forward to the beginning of the third decade of this century, beginning 12/31/2019, the investment problem may well remain. If interest rates were to increase slightly between now and then to perhaps 3%, bonds would still not offer sufficient returns for most investors to lift the funded levels of many institutional pension funds or to satisfy the current and future retirement needs of many individuals.
The issue here may be one of perspective. The chart below shows the pattern of long-term interest rates since 1871. The chart is striking; it shows that for most of the last 150 years long-term interest rates fluctuated between 2% and 5%. It looks like the period from 1981-1995 was more of an anomaly than a sustainable condition. We believe it is probable that long-term interest rates have returned to a normal condition of 2-4% yields. All investors, including us, should take this into consideration.
Exhibit 2: Long-term Interest Rate History:
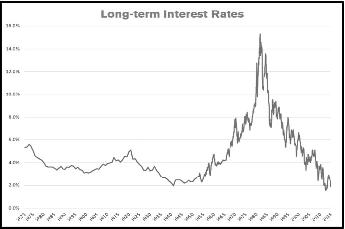
Source: Robert Shiller http://www.econ.yale.edu/~shiller/data.htm
| 4 | This is the Russell Mid Cap Index’s annual performance since Disciplined Growth Investors’ inception (2/28/1997). |
| | |
| | |
| Annual Report | April 30, 2015 | | 5 |
| | |
The Disciplined Growth Investors Fund | | Shareholder Letter |
| | April 30, 2015 (Unaudited) |
We can also learn much by looking at returns for stocks, bonds and short-term investments by decade since 1930. Below is the table showing this data.
Exhibit 3: Asset Cumulative Performance by Decade: Stocks (S&P 500 Index) vs. Bonds:
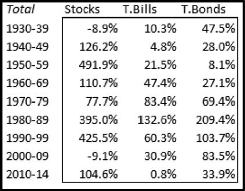
Sources: Aswath Damodaran and FactSet.
The table above offers many interesting insights. In our opinion here are three of the most valuable:
| | 1. | Stocks versus Treasury bonds -- Stocks beat bonds in every decade except those two decades when stocks lost money. After the decade from 1930-39, Treasury Bonds earned 1.9% per year for the next three decades, while stocks earned 11.1% per year. |
| | 2. | Treasury Bonds versus T-Bills5. T-bonds6 underperformed T-Bills for three straight decades from 1950-79. The golden age of T-Bonds began in the 1980 decade and lasted for three decades. T-Bonds earned a compound return of 8.5% per year over those thirty years; T-Bills earned 5.4% per year. |
| | 3. | In the two decades when stocks lost money, each decade began with a severe bear market and then experienced a second severe bear market late in the decade. |
Combining the historical insights contained in exhibits 2 and 3, we can make educated guesses about the capital markets over the next few decades. In our view, bonds are likely to provide normal returns, probably between 2 and 4% per year before inflation. Stocks are the favored asset under our projections. After the negative decade from 1930-40, stocks outperformed bonds for six straight decades.
| 5 | A Treasury Bill, or “T-Bill” is a short-term debt obligation issued by the U.S. Treasury and backed by the full faith and credit of the U.S. Government. T-Bills have maturities of one year or less. |
| 6 | A Treasury Bond, or “T-Bond”, is a long-term (over 10 years to maturity at issuance) debt obligation issued by the U.S. Treasury and backed by the full faith and credit of the U.S. Government. |
| | |
| | |
| 6 | | 1-855-DGI-FUND (344-3863) | www.DGIfund.com |
| | |
The Disciplined Growth Investors Fund | | Shareholder Letter |
| | April 30, 2015 (Unaudited) |
While it is reassuring that exhibit 3 suggests stocks are likely to be the preferred asset class for the next several decades, we would be remiss if we did not back up this historical data with intensive research on your portfolio of invested companies. As we have detailed numerous times over the last several years, corporate America and, more importantly, your invested companies have been on a roll with massive innovation across many industries. Valuations are reasonable. Business models are robust. Simply, our individual stock work backs up the forecast that stocks are likely to outperform bonds by a significant margin over the following decades.
In our opinion, a portfolio with a balance of stocks and bonds, given the outlook for stocks combined with normal returns from bonds, should provide the basis for sound risk-adjusted performance.
Sincerely,
Frederick K. Martin, CFA
Chief Investment Officer
Disciplined Growth Investors, Inc.
ALPS Distributors, Inc. is the distributor for The Disciplined Growth Investors Fund.
The views and information discussed in this commentary are as of the date of publication, are subject to change, and may not reflect the writer’s current views. The views expressed represent an assessment of market conditions at a specific point in time, are opinions only and should not be relied upon as investment advice regarding a particular investment or markets in general. Such information does not constitute a recommendation to buy or sell specific securities or investment vehicles. It should not be assumed that any investment will be profitable or will equal the performance of the Fund or any securities or any sectors mentioned herein. The subject matter contained in this letter has been derived from several sources believed to be reliable and accurate at the time of compilation. Disciplined Growth Investors, Inc. nor the Fund accepts any liability for losses either direct or consequential caused by the use of this information.
Fred Martin is a registered representative of ALPS Distributors, Inc.
| | |
| | |
| Annual Report | April 30, 2015 | | 7 |
| | |
The Disciplined Growth Investors Fund | | Shareholder Letter |
| | April 30, 2015 (Unaudited) |
Additional Commentary: Equity and Fixed Income Investment Returns in the Long-Term
When considering a long-term investment in a stock or a bond, a crucial difference is worth noting: bonds mature, while stocks do not.
What does this mean? An investment in a bond will eventually be returned to the investor, as stipulated in a contract, while an investment in a stock is perpetual. When an investment in a bond is returned to the investor before the investor has need of the money, it must be reinvested. Because this reinvestment can occur in a variety of rate environments, the long-term return from an investment in bonds becomes more uncertain the longer the investment period the investor faces and, consequently, the more reinvestment events the investor must risk.
Conversely, a stock investment generally experiences greater volatility in the near-term, since its value is based upon the uncertain future success of the underlying firm. Over time, as the success of the firm either manifests or does not, the uncertainty resolves and the return of the stock converges to the outcome achieved by the firm.
In the charts below, note that the sooner a bond returns capital to the bondholder, that is, the higher the coupon payment, the sooner that bondholder’s investment is subject to reinvestment risk. In the case of a stock, as time passes, the returns to the equity holder converge to the fundamental progress experienced by the underlying business.
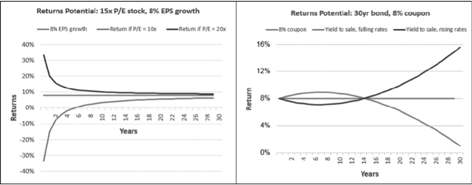
Source: Disciplined Growth Investors’ internal research. This is a hypothetical example for illustrative purposes only.
| | |
| | |
| 8 | | 1-855-DGI-FUND (344-3863) | www.DGIfund.com |
| | |
The Disciplined Growth Investors Fund | | Shareholder Letter |
| | April 30, 2015 (Unaudited) |
In the right-hand example5, note that that at an 8% coupon and a $100,000 initial investment, the bondholder must reinvest $8,000 per year initially, and must eventually reinvest the $100,000. The total return experienced becomes more and more dependent not on the yield of the initial investment, but on the yield of the reinvestments. Over time, the range of possible returns on the initial investment diverge.
In the case of the stock, imagine that the stock price varies between a P/E multiple of 10x and 20x earnings. If earnings grew by 8% per year, those valuation fluctuations come to impact the overall rate of return less and less as the fundamental growth of the company comes to dominate the returns.
| 5 | “EPS Growth” is Earnings-per-share growth. This is the annualized growth rate of net income per share of stock. In the example above, if a company earned $1 per share in year 1, an 8% EPS growth would imply $1.08 in earnings-per-share in year 2. |
| | P/E is the Price-to-Earnings Ratio (or multiple) for a given company. For example, a P/E of 15 would mean the company’s stock price is 15 times greater than its annual per-share earnings. In the example above, we are making an illustration for educational purposes, and not using historical data or specific forecast data. |
| | |
| | |
| Annual Report | April 30, 2015 | | 9 |
| | |
The Disciplined Growth Investors Fund | | Performance Update |
| | April 30, 2015 (Unaudited) |
Cumulative Total Return Performance (for the period ended April 30, 2015)
| | | | | | | | | | | | | | | | | | | | | | | | | | | | |
| | | 1 month | | | Quarter | | | 6 month | | | YTD | | | 1 Year | | | 3 Year | | | Since
Inception* | |
Disciplined Growth | | | | | | | | | | | | | | | | | | | | | | | | | | | | |
Investors Fund | | | -0.95 | % | | | 3.67 | % | | | 4.67 | % | | | 0.50 | % | | | 12.87 | % | | | 12.59 | % | | | 16.00 | % |
S&P 500® | | | | | | | | | | | | | | | | | | | | | | | | | | | | |
Total Return Index(1) | | | 0.96 | % | | | 5.07 | % | | | 4.40 | % | | | 1.92 | % | | | 12.98 | % | | | 16.73 | % | | | 19.10 | % |
| * | Fund Inception date of August 12, 2011 |
| (1) | The S&P 500® Total Return Index is an unmanaged index of 500 common stocks chosen for market size, liquidity and industry group representation. It is a market-value weighted index. The Index is not actively managed and does not reflect any deductions for fees, expenses or taxes. An investor may not invest directly in the Index. |
The returns shown above do not reflect the deductions of taxes a shareholder would pay on Fund distributions or redemptions of Fund shares.
Returns less than one year are cumulative.
Performance data quoted represents past performance. Past performance does not guarantee future results. Investment return and principal value of an investment will fluctuate so that an investor’s shares, when sold or redeemed, may be worth more or less than the original cost. Current performance data may be higher or lower than actual data quoted. For the most current month-end performance data please call 1.855.DGI.FUND.
| | |
| | |
| 10 | | 1-855-DGI-FUND (344-3863) | www.DGIfund.com |
| | |
The Disciplined Growth Investors Fund | | Performance Update |
| | April 30, 2015 (Unaudited) |
Growth of $10,000 Investment in the Fund (for the period ended April 30, 2015)
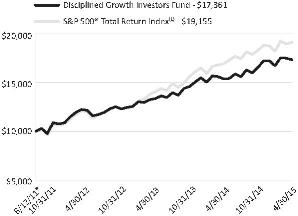
The chart represents historical performance of a hypothetical investment of $10,000 in the Fund since inception. Past performance does not guarantee future results. This chart does not reflect the deduction of taxes that a shareholder would pay on Fund distributions or the redemption of Fund shares.
Investing in the Fund is subject to investment risks, including possible loss of the principal amount invested.
| | | | | | | | | | | | |
Industry Sector Allocation | | | | | | | | Top Ten Holdings | | | | |
(as a % of Net Assets)* | | | | | | | | (as a % of Net Assets)* | | | | |
| | | | |
Technology | | | 26.48% | | | | | Intuit, Inc. | | | 3.39% | |
Consumer Discretionary | | | 18.61% | | | | | TJX Cos., Inc. | | | 3.38% | |
Producer Durables | | | 10.44% | | | | | Middleby Corp. | | | 2.97% | |
Health Care | | | 7.57% | | | | | L Brands, Inc. | | | 2.96% | |
Energy | | | 2.33% | | | | | Edwards Lifesciences Corp. | | | 2.95% | |
Financial Services | | | 4.11% | | | | | Seagate Technology PLC | | | 2.65% | |
Asset/Mortgage Backed Securities | | | 0.15% | | | | | Open Text Corp. | | | 2.45% | |
Corporate Bond | | | 22.75% | | | | | Akamai Technologies, Inc. | | | 2.31% | |
Foreign Government Bonds | | | 0.47% | | | | | Plexus Corp. | | | 2.31% | |
Government & Agency Obligations | | | 0.10% | | | | | Autodesk, Inc. | | | 2.05% | |
Other Assets in Excess of Liabilities | | | 6.99% | | | | | Top Ten Holdings | | | 27.42% | |
| * | Holdings are subject to change. |
| | |
| | |
| Annual Report | April 30, 2015 | | 11 |
| | |
The Disciplined Growth Investors Fund | | Disclosure of Fund Expenses |
| | April 30, 2015 (Unaudited) |
As a shareholder of a Fund, you incur two types of costs: direct costs, such as short-term redemption fees and wire fees, balance fees, and indirect costs, including management fees, and other fund operating expenses. This example is intended to help you understand your indirect costs, also referred to as “ongoing costs” (in dollars), of investing in the Fund and to compare these costs with the ongoing costs of investing in other mutual funds.
This example is based on an investment of $1,000 invested at the beginning of the period and held for the entire six-month period of November 1, 2014 through April 30, 2015.
Actual Expenses The first line of the table below provides information about actual account values and actual expenses. You may use the information in this line, together with the amount you invested at the beginning of the period, to estimate the expenses that you paid over the period. Simply divide your account value by $1,000 (for example, an $8,600 account value divided by $1,000 = 8.6), then multiply the result by the number in the first line under the heading “Expenses Paid During Period” to estimate the expenses you paid on your account during this period.
Hypothetical Example for Comparison Purposes The second line of the table provides information about hypothetical account values and hypothetical expenses based on the Fund’s actual expense ratio and an assumed rate of return of 5% per year before expenses, which is not the Fund’s actual return. The hypothetical account values and expenses may not be used to estimate the actual ending account balance or expenses you paid for the period. You may use this information to compare ongoing costs of investing in the Fund and other funds. To do so, compare this 5% hypothetical example with the 5% hypothetical examples that appear in the shareholder reports of other funds.
Please note that the expenses shown in the table are meant to highlight your ongoing costs only and do not reflect any direct costs, such as wire fees or low balance fees. Therefore, the second line of the table is useful in comparing ongoing costs only and will not help you determine the relative total costs of owning different funds. In addition, if these direct costs were included, your costs would be higher.
| | | | | | | | | | | | | | | | |
| | | Beginning Account
Value 11/1/2014 | | | Ending Account
Value 4/30/2015 | | | Expense
Ratio(a) | | | Expenses Paid
During period
11/1/2014 -
4/30/2015(b) | |
Actual | | $ | 1,000.00 | | | $ | 1,046.70 | | | | 0.78 | % | | $ | 3.96 | |
Hypothetical (5% return before expenses) | | $ | 1,000.00 | | | $ | 1,020.93 | | | | 0.78 | % | | $ | 3.91 | |
| (a) | The Fund’s expense ratios have been annualized based on the Fund’s most recent fiscal half-year expenses. |
| (b) | Expenses are equal to the Fund’s annualized expense ratio, multiplied by the average account value over the period, multiplied by the number of days in the most recent fiscal half-year (181)/365 (to reflect the half-year period). |
| | |
| | |
| 12 | | 1-855-DGI-FUND (344-3863) | www.DGIfund.com |
| | |
The Disciplined Growth Investors Fund | | Portfolio of Investments |
| | April 30, 2015 |
| | | | | | | | |
| | | Shares | | | Value (Note 2) |
COMMON STOCKS (69.54%) | | | | | | | | |
CONSUMER DISCRETIONARY (18.61%) | | | | | | | | |
Auto & Auto Parts (1.43%) | | | | | | | | |
Gentex Corp. | | | 93,600 | | | $ | 1,623,960 | |
| | | | | | | | |
| | |
Consumer Products (4.92%) | | | | | | | | |
Ethan Allen Interiors, Inc. | | | 45,569 | | | | 1,103,681 | |
Garmin Ltd. | | | 33,163 | | | | 1,498,636 | |
Ralph Lauren Corp. | | | 9,431 | | | | 1,258,190 | |
Select Comfort Corp.(a) | | | 55,436 | | | | 1,708,537 | |
| | | | | | | | |
| | | | | | | 5,569,044 | |
| | | | | | | | |
| | |
Leisure (2.29%) | | | | | | | | |
Cheesecake Factory, Inc. | | | 14,650 | | | | 734,405 | |
Royal Caribbean Cruises Ltd. | | | 27,400 | | | | 1,864,844 | |
| | | | | | | | |
| | | | | | | 2,599,249 | |
| | | | | | | | |
| | |
Media (0.64%) | | | | | | | | |
DreamWorks Animation SKG, Inc. - Class A(a) | | | 27,962 | | | | 728,690 | |
| | | | | | | | |
| | |
Retail (8.70%) | | | | | | | | |
Cabela’s, Inc.(a) | | | 35,200 | | | | 1,856,448 | |
L Brands, Inc. | | | 37,580 | | | | 3,358,149 | |
TJX Cos., Inc. | | | 59,275 | | | | 3,825,608 | |
Urban Outfitters, Inc.(a) | | | 20,500 | | | | 820,820 | |
| | | | | | | | |
| | | | | | | 9,861,025 | |
| | | | | | | | |
Textiles, Apparel & Luxury Goods (0.63%) | | | | | | | | |
Tumi Holdings, Inc.(a) | | | 30,325 | | | | 709,302 | |
| | | | | | | | |
| | |
TOTAL CONSUMER DISCRETIONARY | | | | | | | 21,091,270 | |
| | | | | | | | |
| | |
ENERGY (2.33%) | | | | | | | | |
Energy Equipment & Services (0.61%) | | | | | | | | |
Noble Corp. PLC | | | 40,232 | | | | 696,416 | |
| | | | | | | | |
| | |
Oil & Gas Services (0.92%) | | | | | | | | |
Core Laboratories NV | | | 7,900 | | | | 1,037,112 | |
| | | | | | | | |
| | |
| | |
| Annual Report | April 30, 2015 | | 13 |
| | |
The Disciplined Growth Investors Fund | | Portfolio of Investments |
| | April 30, 2015 |
| | | | | | | | |
| | | Shares | | | Value (Note 2) |
ENERGY (continued) | | | | | | | | |
Oil, Gas & Consumable Fuels (0.80%) | | | | | | | | |
Ultra Petroleum Corp.(a) | | | 53,075 | | | $ | 903,867 | |
| | | | | | | | |
| | |
TOTAL ENERGY | | | | | | | 2,637,395 | |
| | | | | | | | |
| | |
FINANCIAL SERVICES (4.11%) | | | | | | | | |
Banks (0.54%) | | | | | | | | |
TCF Financial Corp. | | | 38,725 | | | | 606,434 | |
| | | | | | | | |
| | |
Consumer Finance & Credit Services (2.03%) | | | | | | | | |
FactSet Research Systems, Inc. | | | 14,644 | | | | 2,304,819 | |
| | | | | | | | |
| | |
Investment Banking & Brokerage (1.54%) | | | | | | | | |
E*Trade Financial Corp.(a) | | | 30,196 | | | | 869,343 | |
Janus Capital Group, Inc. | | | 49,175 | | | | 880,232 | |
| | | | | | | | |
| | | | | | | 1,749,575 | |
| | | | | | | | |
| | |
TOTAL FINANCIAL SERVICES | | | | | | | 4,660,828 | |
| | | | | | | | |
| | |
HEALTH CARE (7.57%) | | | | | | | | |
Biotechnology (0.85%) | | | | | | | | |
Myriad Genetics, Inc.(a) | | | 29,425 | | | | 971,908 | |
| | | | | | | | |
| | |
Medical Equipment & Services (5.77%) | | | | | | | | |
Edwards Lifesciences Corp.(a) | | | 26,425 | | | | 3,346,726 | |
Intuitive Surgical, Inc.(a) | | | 3,612 | | | | 1,791,480 | |
Varian Medical Systems, Inc.(a) | | | 15,750 | | | | 1,399,387 | |
| | | | | | | | |
| | | | | | | 6,537,593 | |
| | | | | | | | |
| | |
Medical Specialties (0.95%) | | | | | | | | |
Align Technology, Inc.(a) | | | 18,300 | | | | 1,076,772 | |
| | | | | | | | |
| | |
TOTAL HEALTH CARE | | | | | | | 8,586,273 | |
| | | | | | | | |
| | |
PRODUCER DURABLES (10.44%) | | | | | | | | |
Computers (0.55%) | | | | | | | | |
IHS, Inc. - Class A(a) | | | 5,000 | | | | 627,350 | |
| | | | | | | | |
| | |
Machinery (2.97%) | | | | | | | | |
Middleby Corp.(a) | | | 33,204 | | | | 3,364,893 | |
| | | | | | | | |
| | |
| | |
| 14 | | 1-855-DGI-FUND (344-3863) | www.DGIfund.com |
| | |
The Disciplined Growth Investors Fund | | Portfolio of Investments |
| | April 30, 2015 |
| | | | | | | | |
| | | Shares | | | Value (Note 2) |
PRODUCER DURABLES (continued) | | | | | | | | |
Machinery-Diversified (0.61%) | | | | | | | | |
Graco, Inc. | | | 9,725 | | | $ | 696,504 | |
| | | | | | | | |
| | |
Manufacturing & Production (0.68%) | | | | | | | | |
Eaton Corp. PLC | | | 11,264 | | | | 774,175 | |
| | | | | | | | |
| | |
Professional Services (1.38%) | | | | | | | | |
Corporate Executive Board Co. | | | 18,625 | | | | 1,561,334 | |
| | | | | | | | |
| | |
Scientific Instruments & Services (1.03%) | | | | | | | | |
Brady Corp. - Class A | | | 13,100 | | | | 348,853 | |
Trimble Navigation Ltd.(a) | | | 32,150 | | | | 817,574 | |
| | | | | | | | |
| | | | | | | 1,166,427 | |
| | | | | | | | |
| | |
Software (0.57%) | | | | | | | | |
Paychex, Inc. | | | 13,225 | | | | 639,958 | |
| | | | | | | | |
| | |
Transportation & Freight (2.65%) | | | | | | | | |
JetBlue Airways Corp.(a) | | | 81,675 | | | | 1,676,788 | |
Landstar System, Inc. | | | 21,225 | | | | 1,322,530 | |
| | | | | | | | |
| | | | | | | 2,999,318 | |
| | | | | | | | |
| | |
TOTAL PRODUCER DURABLES | | | | | | | 11,829,959 | |
| | | | | | | | |
| | |
TECHNOLOGY (26.48%) | | | | | | | | |
Computers (1.56%) | | | | | | | | |
Synaptics, Inc.(a) | | | 12,900 | | | | 1,092,888 | |
Teradata Corp.(a) | | | 15,400 | | | | 677,446 | |
| | | | | | | | |
| | | | | | | 1,770,334 | |
| | | | | | | | |
| | |
Electronics (6.52%) | | | | | | | | |
ARM Holdings PLC - Sponsored ADR | | | 19,812 | | | | 1,010,214 | |
Microchip Technology, Inc. | | | 20,900 | | | | 995,989 | |
Open Text Corp. | | | 54,862 | | | | 2,774,920 | |
Plexus Corp.(a) | | | 60,700 | | | | 2,613,135 | |
| | | | | | | | |
| | | | | | | 7,394,258 | |
| | | | | | | | |
| | |
| | |
| Annual Report | April 30, 2015 | | 15 |
| | |
The Disciplined Growth Investors Fund | | Portfolio of Investments |
| | April 30, 2015 |
| | | | | | | | |
| | | Shares | | | Value (Note 2) |
TECHNOLOGY (continued) | | | | | | | | |
Information Technology (12.78%) | | | | | | | | |
Akamai Technologies, Inc.(a) | | | 35,475 | | | $ | 2,617,345 | |
Autodesk, Inc.(a) | | | 40,850 | | | | 2,321,505 | |
Dolby Laboratories, Inc. - Class A | | | 15,625 | | | | 629,063 | |
Intuit, Inc. | | | 38,275 | | | | 3,840,131 | |
Seagate Technology PLC | | | 51,187 | | | | 3,005,701 | |
Yahoo!, Inc.(a) | | | 48,700 | | | | 2,072,916 | |
| | | | | | | | |
| | | | | | | 14,486,661 | |
| | | | | | | | |
| | |
Semiconductors (0.69%) | | | | | | | | |
Power Integrations, Inc. | | | 15,800 | | | | 781,942 | |
| | | | | | | | |
| | |
Software (1.67%) | | | | | | | | |
Qlik Technologies, Inc.(a) | | | 32,000 | | | | 1,113,280 | |
RealPage, Inc.(a) | | | 39,000 | | | | 773,760 | |
| | | | | | | | |
| | | | | | | 1,887,040 | |
| | | | | | | | |
| | |
Telecommunications (3.26%) | | | | | | | | |
Aruba Networks, Inc.(a) | | | 34,200 | | | | 841,662 | |
Plantronics, Inc. | | | 28,700 | | | | 1,528,849 | |
Ubiquiti Networks, Inc. | | | 29,000 | | | | 828,530 | |
ViaSat, Inc.(a) | | | 8,244 | | | | 495,629 | |
| | | | | | | | |
| | | | | | | 3,694,670 | |
| | | | | | | | |
| | |
TOTAL TECHNOLOGY | | | | | | | 30,014,905 | |
| | | | | | | | |
| | |
| TOTAL COMMON STOCKS | | | | | | | | |
| (Cost $53,728,135) | | | | | | | 78,820,630 | |
| | | | | | | | |
| | |
| | | Principal
Amount | | | Value (Note 2) |
| ASSET/MORTGAGE BACKED SECURITIES (0.15%) | | | | | | | | |
Government National Mortgage Association, Series | | | | | | | | |
2005-93 | | | | | | | | |
5.500% 12/20/2034 | | $ | 159,649 | | | | 166,240 | |
| | | | | | | | |
| | |
| TOTAL ASSET/MORTGAGE BACKED SECURITIES | | | | | | | | |
| (Cost $171,574) | | | | | | | 166,240 | |
| | | | | | | | |
| | |
| CORPORATE BONDS (22.75%) | | | | | | | | |
21st Century Fox America, Inc. | | | | | | | | |
6.900% 03/01/2019 | | | 302,000 | | | | 357,024 | |
| | |
| | |
| 16 | | 1-855-DGI-FUND (344-3863) | www.DGIfund.com |
| | |
The Disciplined Growth Investors Fund | | Portfolio of Investments |
| | April 30, 2015 |
| | | | | | | | |
| | | Principal
Amount | | Value (Note 2) |
CORPORATE BONDS (continued) | | | | | | | | |
Advance Auto Parts, Inc. | | | | | | | | |
5.750% 05/01/2020 | | $ | 318,000 | | | $ | 358,066 | |
Ameren Illinois Co. | | | | | | | | |
9.750% 11/15/2018 | | | 339,000 | | | | 428,556 | |
American Express Co. | | | | | | | | |
7.000% 03/19/2018 | | | 379,000 | | | | 435,896 | |
American International Group, Inc. | | | | | | | | |
5.850% 01/16/2018 | | | 318,000 | | | | 354,263 | |
Anheuser-Busch InBev Worldwide, Inc. | | | | | | | | |
2.500% 07/15/2022 | | | 361,000 | | | | 357,104 | |
Arizona Public Service Co. | | | | | | | | |
8.750% 03/01/2019 | | | 282,000 | | | | 353,104 | |
AT&T, Inc. | | | | | | | | |
5.500% 02/01/2018 | | | 440,000 | | | | 485,071 | |
Bank of America Corp. | | | | | | | | |
5.650% 05/01/2018 | | | 323,000 | | | | 357,555 | |
CenterPoint Energy Resources Corp. | | | | | | | | |
6.000% 05/15/2018 | | | 292,000 | | | | 328,959 | |
CMS Energy Corp. | | | | | | | | |
5.050% 03/15/2022 | | | 309,000 | | | | 349,745 | |
Coca-Cola HBC Finance BV | | | | | | | | |
5.500% 09/17/2015 | | | 253,000 | | | | 257,252 | |
Comcast Cable Communications Holdings, Inc. | | | | | | | | |
9.455% 11/15/2022 | | | 251,000 | | | | 362,805 | |
Commonwealth Edison Co. | | | | | | | | |
5.800% 03/15/2018 | | | 323,000 | | | | 363,804 | |
Connecticut Light & Power Co., Series 09-A | | | | | | | | |
5.500% 02/01/2019 | | | 252,000 | | | | 285,744 | |
ConocoPhillips Holding Co. | | | | | | | | |
6.950% 04/15/2029 | | | 267,000 | | | | 359,967 | |
Corning, Inc. | | | | | | | | |
6.625% 05/15/2019 | | | 271,000 | | | | 319,430 | |
Corporacion Andina de Fomento | | | | | | | | |
5.750% 01/12/2017 | | | 1,000 | | | | 1,076 | |
8.125% 06/04/2019 | | | 235,000 | | | | 290,997 | |
CSX Corp. | | | | | | | | |
7.375% 02/01/2019 | | | 296,000 | | | | 353,489 | |
CVS Health Corp. | | | | | | | | |
4.125% 05/15/2021 | | | 331,000 | | | | 364,014 | |
DCP Midstream Operating LP | | | | | | | | |
3.875% 03/15/2023 | | | 371,000 | | | | 342,474 | |
Diageo Capital PLC | | | | | | | | |
5.750% 10/23/2017 | | | 439,000 | | | | 487,215 | |
| | |
| | |
| Annual Report | April 30, 2015 | | 17 |
| | |
The Disciplined Growth Investors Fund | | Portfolio of Investments |
| | April 30, 2015 |
| | | | | | | | |
| | | Principal
Amount | | Value (Note 2) |
CORPORATE BONDS (continued) | | | | | | | | |
Dominion Resources, Inc. | | | | | | | | |
2.250% 09/01/2015 | | $ | 500,000 | | | $ | 502,738 | |
Edison International | | | | | | | | |
3.750% 09/15/2017 | | | 312,000 | | | | 330,264 | |
El Paso Natural Gas Co. LLC | | | | | | | | |
5.950% 04/15/2017 | | | 331,000 | | | | 356,754 | |
Emerson Electric Co. | | | | | | | | |
5.000% 04/15/2019 | | | 320,000 | | | | 359,130 | |
Energy Transfer Partners LP | | | | | | | | |
9.700% 03/15/2019 | | | 286,000 | | | | 358,491 | |
Enterprise Products Operating LLC | | | | | | | | |
5.200% 09/01/2020 | | | 315,000 | | | | 357,781 | |
Fluor Corp. | | | | | | | | |
3.375% 09/15/2021 | | | 348,000 | | | | 365,044 | |
General Electric Capital Corp. | | | | | | | | |
5.875% 01/14/2038 | | | 294,000 | | | | 382,579 | |
Georgia Power Co. | | | | | | | | |
5.400% 06/01/2018 | | | 270,000 | | | | 301,726 | |
Health Care REIT, Inc. | | | | | | | | |
2.250% 03/15/2018 | | | 353,000 | | | | 358,020 | |
Interstate Power & Light Co. | | | | | | | | |
3.650% 09/01/2020 | | | 339,000 | | | | 360,988 | |
ITC Holdings Corp. | | | | | | | | |
4.050% 07/01/2023 | | | 289,000 | | | | 305,302 | |
Jersey Central Power & Light Co. | | | | | | | | |
7.350% 02/01/2019 | | | 435,000 | | | | 511,844 | |
Johnson & Johnson | | | | | | | | |
5.850% 07/15/2038 | | | 271,000 | | | | 363,584 | |
Joy Global, Inc. | | | | | | | | |
6.000% 11/15/2016 | | | 452,000 | | | | 483,543 | |
JPMorgan Chase & Co. | | | | | | | | |
1.800% 01/25/2018 | | | 359,000 | | | | 361,495 | |
Lockheed Martin Corp. | | | | | | | | |
4.250% 11/15/2019 | | | 328,000 | | | | 361,947 | |
Lubrizol Corp. | | | | | | | | |
8.875% 02/01/2019 | | | 258,000 | | | | 320,829 | |
McDonald’s Corp. | | | | | | | | |
6.300% 03/01/2038 | | | 278,000 | | | | 359,370 | |
MetLife, Inc. | | | | | | | | |
6.750% 06/01/2016 | | | 389,000 | | | | 413,456 | |
National Rural Utilities Cooperative Finance Corp. | | | | | | | | |
10.375% 11/01/2018 | | | 362,000 | | | | 467,968 | |
Nevada Power Co. | | | | | | | | |
7.125% 03/15/2019 | | | 285,000 | | | | 339,466 | |
| | |
| | |
| 18 | | 1-855-DGI-FUND (344-3863) | www.DGIfund.com |
| | |
The Disciplined Growth Investors Fund | | Portfolio of Investments |
| | April 30, 2015 |
| | | | | | | | |
| | | Principal
Amount | | Value (Note 2) |
CORPORATE BONDS (continued) | | | | | | | | |
Noble Energy, Inc. | | | | | | | | |
8.250% 03/01/2019 | | $ | 257,000 | | | $ | 308,340 | |
Nucor Corp. | | | | | | | | |
5.750% 12/01/2017 | | | 295,000 | | | | 327,730 | |
Oncor Electric Delivery Co. LLC | | | | | | | | |
7.000% 09/01/2022 | | | 268,000 | | | | 341,772 | |
ONEOK Partners LP | | | | | | | | |
3.200% 09/15/2018 | | | 401,000 | | | | 411,333 | |
PacifiCorp | | | | | | | | |
5.650% 07/15/2018 | | | 17,000 | | | | 19,193 | |
Pepsi Bottling Group, Inc., Series B | | | | | | | | |
7.000% 03/01/2029 | | | 262,000 | | | | 369,044 | |
Plains All American Pipeline LP / Plains All American | | | | | | | | |
Finance Corp. | | | | | | | | |
8.750% 05/01/2019 | | | 283,000 | | | | 351,688 | |
PPL Capital Funding, Inc. | | | | | | | | |
3.500% 12/01/2022 | | | 511,000 | | | | 530,912 | |
PSEG Power LLC | | | | | | | | |
2.450% 11/15/2018 | | | 353,000 | | | | 358,996 | |
5.320% 09/15/2016 | | | 440,000 | | | | 464,970 | |
Puget Energy, Inc. | | | | | | | | |
5.625% 07/15/2022 | | | 320,000 | | | | 371,965 | |
Republic Services, Inc. | | | | | | | | |
5.500% 09/15/2019 | | | 315,000 | | | | 357,557 | |
Royal Bank of Scotland Group PLC, Series 1 | | | | | | | | |
9.118% Perpetual Maturity(b) | | | 3,000 | | | | 3,019 | |
Sempra Energy | | | | | | | | |
6.500% 06/01/2016 | | | 449,000 | | | | 476,183 | |
TCI Communications, Inc. | | | | | | | | |
8.750% 08/01/2015 | | | 691,000 | | | | 704,367 | |
TECO Finance, Inc. | | | | | | | | |
6.572% 11/01/2017 | | | 301,000 | | | | 337,164 | |
Texas Gas Transmission LLC | | | | | | | | |
4.600% 06/01/2015 | | | 224,000 | | | | 224,559 | |
Total System Services, Inc. | | | | | | | | |
2.375% 06/01/2018 | | | 361,000 | | | | 363,582 | |
TransCanada PipeLines Ltd. | | | | | | | | |
7.250% 08/15/2038 | | | 235,000 | | | | 321,805 | |
Tyco Electronics Group SA | | | | | | | | |
3.500% 02/03/2022 | | | 347,000 | | | | 360,404 | |
Unilever Capital Corp. | | | | | | | | |
4.800% 02/15/2019 | | | 321,000 | | | | 357,740 | |
United Parcel Service, Inc. | | | | | | | | |
6.200% 01/15/2038 | | | 279,000 | | | | 372,088 | |
| | |
| | |
| Annual Report | April 30, 2015 | | 19 |
| | |
The Disciplined Growth Investors Fund | | Portfolio of Investments |
| | April 30, 2015 |
| | | | | | | | | | | | |
| | | | | | Principal
Amount | | | Value (Note 2) | |
CORPORATE BONDS (continued) | | | | | | | | | | | | |
Verizon Communications, Inc. | | | | | | | | | | | | |
4.500% 09/15/2020 | | | | | | $ | 329,000 | | | $ | 360,411 | |
Viacom, Inc. | | | | | | | | | | | | |
2.500% 09/01/2018 | | | | | | | 346,000 | | | | 352,447 | |
Wachovia Corp. | | | | | | | | | | | | |
5.750% 06/15/2017 | | | | | | | 500,000 | | | | 548,473 | |
Wal-Mart Stores, Inc. | | | | | | | | | | | | |
6.200% 04/15/2038 | | | | | | | 282,000 | | | | 376,225 | |
Xerox Business Services LLC | | | | | | | | | | | | |
5.200% 06/01/2015 | | | | | | | 138,000 | | | | 138,450 | |
| | | | | | | | | | | | |
| | | |
TOTAL CORPORATE BONDS | | | | | | | | | | | | |
(Cost $25,429,039) | | | | | | | | | | | 25,786,346 | |
| | | | | | | | | | | | |
| | | |
FOREIGN GOVERNMENT BONDS (0.47%) | | | | | | | | | | | | |
Israel Government AID Bonds | | | | | | | | | | | | |
5.500% 12/04/2023 | | | | | | | 209,000 | | | | 259,600 | |
Province of Quebec Canada, Series NN | | | | | | | | | | | | |
7.125% 02/09/2024 | | | | | | | 201,000 | | | | 268,358 | |
| | | | | | | | | | | | |
| | | |
TOTAL FOREIGN GOVERNMENT BONDS | | | | | | | | | | | | |
(Cost $514,456) | | | | | | | | | | | 527,958 | |
| | | | | | | | | | | | |
| | | |
GOVERNMENT & AGENCY OBLIGATIONS (0.10%) | | | | | | | | | | | | |
U.S. Treasury Bonds | | | | | | | | | | | | |
6.500% 11/15/2026 | | | | | | | 28,000 | | | | 40,465 | |
U.S. Treasury Notes | | | | | | | | | | | | |
4.500% 11/15/2015 | | | | | | | 16,000 | | | | 16,380 | |
4.500% 02/15/2016 | | | | | | | 38,000 | | | | 39,297 | |
5.125% 05/15/2016 | | | | | | | 20,000 | | | | 21,000 | |
| | | | | | | | | | | | |
| | | |
TOTAL GOVERNMENT & AGENCY OBLIGATIONS | | | | | | | | | | | | |
(Cost $116,076) | | | | | | | | | | | 117,142 | |
| | | | | | | | | | | | |
| | | |
| | | Yield | | | Shares | | | Value (Note 2) | |
SHORT TERM INVESTMENTS (6.69%) | | | | | | | | | | | | |
MONEY MARKET FUND (1.57%) | | | | | | | | | | | | |
Fidelity Institutional Money Market | | | | | | | | | | | | |
Government Portfolio - Class I | | | 0.01 | %(c) | | | 1,784,806 | | | | 1,784,806 | |
| | | | | | | | | | | | |
| | |
| | |
| 20 | | 1-855-DGI-FUND (344-3863) | www.DGIfund.com |
| | |
The Disciplined Growth Investors Fund | | Portfolio of Investments |
| | April 30, 2015 |
| | | | | | | | | | | | |
| | | Yield | | | Principal
Amount | | | Value (Note 2) | |
SHORT TERM INVESTMENTS (continued) | | | | | | | | | | | | |
U.S. TREASURY BILLS (5.12%) | | | | | | | | | | | | |
U.S. Treasury Bill, 12/10/2015 | | | 0.14 | %(d) | | $ | 5,800,000 | | | $ | 5,797,303 | |
| | | | | | | | | | | | |
| | | |
TOTAL SHORT TERM INVESTMENTS | | | | | | | | | | | | |
(Cost $7,579,826) | | | | | | | | | | | 7,582,109 | |
| | | | | | | | | | | | |
| | | |
TOTAL INVESTMENTS (99.70%) | | | | | | | | | | | | |
(Cost $87,539,106) | | | | | | | | | | $ | 113,000,425 | |
| | | |
Other Assets In Excess Of Liabilities (0.30%) | | | | | | | | | | | 341,896 | |
| | | | | | | | | | | | |
| | | |
NET ASSETS (100.00%) | | | | | | | | | | $ | 113,342,321 | |
| | | | | | | | | | | | |
| (a) | Non-Income Producing Security. |
| (b) | This security has no contractual maturity date, is not redeemable and contractually pays an indefinite stream of interest. |
| (c) | Represents the 7-day yield. |
| (d) | Rate shown represents the bond equivalent yield to maturity at date of purchase. |
Common Abbreviations:
ADR - American Depositary Receipt.
AID - Agency for International Development.
BV - Besloten Vennootschap is the Dutch term for private limited liability company.
LLC - Limited Liability Company.
LP - Limited Partnership.
Ltd. - Limited.
NV - Naamloze Vennootschap is the Dutch term for limited liability company.
PLC - Public Limited Company.
REIT - Real Estate Investment Trust.
SA - Generally designated corporations in various countries, mostly those employing civil law. This translates literally in all languages mentioed as anonymous company.
Holdings are subject to change.
For Fund compliance purposes, the Fund’s industry classifications refer to any one or more of the industry sub-classifications used by one or more widely recognized market indexes or ratings group indexes, and/or as defined by Fund management. This definition may not apply for purposes of this report, which may combine industry sub-classifications for reporting ease. Industries are shown as a percent of net assets.
See Notes to Financial Statements.
| | |
| | |
| Annual Report | April 30, 2015 | | 21 |
| | |
The Disciplined Growth Investors Fund | | Statement of Assets and Liabilities |
| | April 30, 2015 |
| | | | |
ASSETS | | | | |
Investments, at value | | $ | 113,000,425 | |
Dividends and interest receivable | | | 426,029 | |
| |
Total assets | | | 113,426,454 | |
| |
| |
LIABILITIES | | | | |
Payable for shares redeemed | | | 11,159 | |
Payable to adviser | | | 72,974 | |
| |
Total liabilities | | | 84,133 | |
| |
NET ASSETS | | $ | 113,342,321 | |
| |
| |
NET ASSETS CONSIST OF | | | | |
Paid-in capital (Note 5) | | $ | 85,360,272 | |
Accumulated net investment income | | | 63,074 | |
Accumulated net realized gain on investments | | | 2,457,656 | |
Net unrealized appreciation on investments | | | 25,461,319 | |
| |
NET ASSETS | | $ | 113,342,321 | |
| |
| |
INVESTMENTS, AT COST | | $ | 87,539,106 | |
| |
PRICING OF SHARES | | | | |
Net Asset Value, offering and redemption price per share | | $ | 16.75 | |
Shares of beneficial interest outstanding | | | 6,765,442 | |
See Notes to Financial Statements.
| | |
| | |
| 22 | | 1-855-DGI-FUND (344-3863) | www.DGIfund.com |
| | |
The Disciplined Growth Investors Fund | | Statement of Operations |
| | |
| | | | |
| | | For the Year Ended April 30, 2015 | |
INVESTMENT INCOME | | | | |
Dividends | | $ | 791,782 | |
Foreign taxes withheld | | | (6,929) | |
Interest | | | 588,860 | |
Total investment income | | | 1,373,713 | |
| |
EXPENSES | | | | |
Investment advisory fees (Note 6) | | | 772,421 | |
Total expenses | | | 772,421 | |
NET INVESTMENT INCOME | | | 601,292 | |
| |
REALIZED AND UNREALIZED GAIN ON INVESTMENTS | | | | |
Net realized gain on investments | | | 2,893,527 | |
Net change in unrealized appreciation on investments | | | 8,397,596 | |
NET REALIZED AND UNREALIZED GAIN ON INVESTMENTS | | | 11,291,123 | |
NET INCREASE IN NET ASSETS RESULTING FROM OPERATIONS | | $ | 11,892,415 | |
| | |
See Notes to Financial Statements.
| | |
| | |
| Annual Report | April 30, 2015 | | 23 |
| | |
The Disciplined Growth Investors Fund | | Statements of Changes in Net Assets |
| | |
| | | | | | | | |
| | | For the Year Ended April 30, 2015 | | | For the Year Ended April 30, 2014 | |
OPERATIONS | | | | | | | | |
Net investment income | | $ | 601,292 | | | $ | 364,119 | |
Net realized gain on investments | | | 2,893,527 | | | | 359,277 | |
Net change in unrealized appreciation on investments | | | 8,397,596 | | | | 9,603,782 | |
Net increase in net assets resulting from operations | | | 11,892,415 | | | | 10,327,178 | |
| | |
DISTRIBUTIONS (Note 3) | | | | | | | | |
From net investment income | | | (550,583) | | | | (381,779) | |
From net realized gains on investments | | | (709,544) | | | | (278,995) | |
Net decrease in net assets from distributions | | | (1,260,127) | | | | (660,774) | |
| | |
CAPITAL SHARE TRANSACTIONS (Note 5) | | | | | | | | |
Proceeds from sales of shares | | | 27,552,615 | | | | 13,673,561 | |
Issued to shareholders in reinvestment of distributions | | | 1,251,789 | | | | 656,043 | |
Cost of shares redeemed, net of redemption fees | | | (12,834,981) | | | | (4,222,784) | |
Net increase from capital share transactions | | | 15,969,423 | | | | 10,106,820 | |
| | |
Net increase in net assets | | | 26,601,711 | | | | 19,773,224 | |
| | |
NET ASSETS | | | | | | | | |
Beginning of period | | | 86,740,610 | | | | 66,967,386 | |
End of period* | | $ | 113,342,321 | | | $ | 86,740,610 | |
| | |
| | |
*Including accumulated net investment income of: | | $ | 63,074 | | | $ | 5,773 | |
| | |
OTHER INFORMATION | | | | | | | | |
Share Transactions | | | | | | | | |
Issued | | | 1,694,271 | | | | 938,053 | |
Issued to shareholders in reinvestment of distributions | | | 75,504 | | | | 45,106 | |
Redeemed | | | (779,232) | | | | (293,031) | |
Net increase in share transactions | | | 990,543 | | | | 690,128 | |
| | |
See Notes to Financial Statements.
| | |
| | |
| 24 | | 1-855-DGI-FUND (344-3863) | www.DGIfund.com |
| | |
The Disciplined Growth Investors Fund | | Financial Highlights |
| | For a share outstanding during the periods presented |
| | | | | | | | | | | | | | | | |
| | | For the Year
Ended April 30, 2015 | | | For the Year
Ended April 30, 2014 | | | For the Year Ended April 30, 2013 | | | For the Period August 12, 2011 (Inception) to
April 30, 2012 | |
NET ASSET VALUE, BEGINNING OF PERIOD | | $ | 15.02 | | | $ | 13.17 | | | $ | 12.13 | | | $ | 10.00 | |
| | | | |
INCOME FROM OPERATIONS | | | | | | | | | | | | | | | | |
Net investment income(a) | | | 0.10 | | | | 0.07 | | | | 0.11 | | | | 0.05 | |
Net realized and unrealized gain on investments | | | 1.83 | | | | 1.90 | | | | 1.09 | | | | 2.11 | |
Total from investment operations | | | 1.93 | | | | 1.97 | | | | 1.20 | | | | 2.16 | |
| | | | |
DISTRIBUTIONS | | | | | | | | | | | | | | | | |
From net investment income | | | (0.09) | | | | (0.07) | | | | (0.11) | | | | (0.03) | |
From net realized gain on investments | | | (0.11) | | | | (0.05) | | | | (0.05) | | | | – | |
Total distributions | | | (0.20) | | | | (0.12) | | | | (0.16) | | | | (0.03) | |
| | | | |
REDEMPTION FEES ADDED TO PAID-IN CAPITAL | | | – | | | | – | | | | – | | | | – | |
| | | | | |
INCREASE IN NET ASSET VALUE | | | 1.73 | | | | 1.85 | | | | 1.04 | | | | 2.13 | |
NET ASSET VALUE, END OF PERIOD | | $ | 16.75 | | | $ | 15.02 | | | $ | 13.17 | | | $ | 12.13 | |
| | |
| | | | |
TOTAL RETURN | | | 12.87% | | | | 15.02% | | | | 9.93% | | | | 21.65%(b) | |
| | | | |
RATIOS AND SUPPLEMENTAL DATA | | | | | | | | | | | | | | | | |
Net assets, end of period (000’s) | | $ | 113,342 | | | $ | 86,741 | | | $ | 66,967 | | | $ | 35,678 | |
| | | | |
RATIOS TO AVERAGE NET ASSETS | | | | | | | | | | | | | | | | |
Expenses | | | 0.78% | | | | 0.78% | | | | 0.78% | | | | 0.77%(c) | |
Net investment income | | | 0.61% | | | | 0.47% | | | | 0.90% | | | | 0.60%(c) | |
| | | | |
PORTFOLIO TURNOVER RATE | | | 14% | | | | 10% | | | | 10% | | | | 6%(b) | |
| (a) | Per share numbers have been calculated using the average shares method. |
See Notes to Financial Statements.
| | |
| | |
| Annual Report | April 30, 2015 | | 25 |
| | |
The Disciplined Growth Investors Fund | | Notes to Financial Statements |
| | April 30, 2015 |
1. ORGANIZATION
Financial Investors Trust (the “Trust”), a Delaware statutory trust, is an open-end management investment company registered under the Investment Company Act of 1940, as amended (“1940 Act”). As of April 30, 2015, the Trust had 30 registered funds. This annual report describes the Disciplined Growth Investors Fund (the “Fund”). The Fund seeks long-term capital growth and as a secondary objective, modest income with reasonable risk.
2. SIGNIFICANT ACCOUNTING POLICIES
The accompanying financial statements were prepared in accordance with accounting principles generally accepted in the United States of America (“U.S. GAAP”). The preparation of financial statements in conformity with U.S. GAAP requires management to make certain estimates and assumptions that affect the reported amounts of assets and liabilities and disclosures of contingent assets and liabilities at the date of the financial statements and the reported amounts of revenue and expenses during the period. Actual results could differ from those estimates. The Fund is considered an investment company for financial reporting purposes under U.S. GAAP. The following is a summary of significant accounting policies consistently followed by the Fund in preparation of their financial statements.
Investment Valuation: The Fund generally values its securities based on market prices determined at the close of regular trading on the New York Stock Exchange (“NYSE”), normally 4:00 p.m. Eastern Time, on each day the NYSE is open for trading.
For equity securities and mutual funds that are traded on an exchange, the market price is usually the closing sale or official closing price on that exchange. In the case of equity securities not traded on an exchange, or if such closing prices are not otherwise available, the securities are valued at the mean of the most recent bid and ask prices on such day. Redeemable securities issued by open-end registered investment companies are valued at the investment company’s applicable net asset value, with the exception of exchange-traded open-end investment companies, which are priced as equity securities.
The market price for debt obligations is generally the price supplied by an independent third-party pricing service approved by the Board of Trustees (the “Board”), which may use a matrix, formula or other objective method that takes into consideration quotations from dealers, market transactions in comparable investments, market indices and yield curves. If vendors are unable to supply a price, or if the price supplied is deemed to be unreliable, the market price may be determined using quotations received from one or more broker–dealers that make a market in the security. Short–term debt obligations that will mature in 60 days or less are valued at amortized cost, unless it is determined that using this method would not reflect an investment’s fair value.
When such prices or quotations are not available, or when the Fair Value Committee appointed by the Board believes that they are unreliable, securities may be priced using fair value procedures approved by the Board.
Fair Value Measurements: The Fund discloses the classification of its fair value measurements following a three-tier hierarchy based on the inputs used to measure fair value. Inputs refer
| | |
| | |
| 26 | | 1-855-DGI-FUND (344-3863) | www.DGIfund.com |
| | |
The Disciplined Growth Investors Fund | | Notes to Financial Statements |
| | April 30, 2015 |
broadly to the assumptions that market participants would use in pricing the asset or liability, including assumptions about risk. Inputs may be observable or unobservable. Observable inputs reflect the assumptions market participants would use in pricing the asset or liability that are developed based on market data obtained from sources independent of the reporting entity. Unobservable inputs reflect the reporting entity’s own assumptions about the assumptions market participants would use in pricing the asset or liability that are developed based on the best information available.
Various inputs are used in determining the value of the Fund’s investments as of the end of the reporting period. When inputs used fall into different levels of the fair value hierarchy, the level in the hierarchy within which the fair value measurement falls is determined based on the lowest level input that is significant to the fair value measurement in its entirety. The designated input levels are not necessarily an indication of the risk or liquidity associated with these investments. These inputs are categorized in the following hierarchy under applicable financial accounting standards:
| | |
Level 1 – | | Unadjusted quoted prices in active markets for identical investments, unrestricted assets or liabilities that the Fund has the ability to access at the measurement date; |
| |
Level 2 – | | Quoted prices which are not active, quoted prices for similar assets or liabilities in active markets or inputs other than quoted prices that are observable (either directly or indirectly) for substantially the full term of the asset or liability; and |
| |
Level 3 – | | Significant unobservable prices or inputs (including the Fund’s own assumptions in determining the fair value of investments) where there is little or no market activity for the asset or liability at the measurement date. |
The following is a summary of each input used to value the Fund as of April 30, 2015:
| | | | | | | | | | | | | | | | |
Investments in Securities at
Value | | Level 1 -
Unadjusted
Quoted Prices | | | Level 2 - Other
Significant
Observable
Inputs | | | Level 3 -
Significant
Unobservable
Inputs | | | Total | |
Common Stocks(a) | | $ | 78,820,630 | | | $ | – | | | $ | – | | | $ | 78,820,630 | |
Asset/Mortgage Backed
Securities | | | – | | | | 166,240 | | | | – | | | | 166,240 | |
Corporate Bonds | | | – | | | | 25,786,346 | | | | – | | | | 25,786,346 | |
Foreign Government Bonds | | | – | | | | 527,958 | | | | – | | | | 527,958 | |
Government & Agency
Obligations | | | – | | | | 117,142 | | | | – | | | | 117,142 | |
Short Term Investments | | | | | | | | | | | | | | | | |
Money Market Fund | | | 1,784,806 | | | | – | | | | – | | | | 1,784,806 | |
U.S. Treasury Bills | | | – | | | | 5,797,303 | | | | – | | | | 5,797,303 | |
TOTAL | | $ | 80,605,436 | | | $ | 32,394,989 | | | $ | – | | | $ | 113,000,425 | |
| |
| (a) | For detailed descriptions of the underlying industries, see the accompanying Portfolio of Investments. |
| | |
| | |
| Annual Report | April 30, 2015 | | 27 |
| | |
The Disciplined Growth Investors Fund | | Notes to Financial Statements |
| | April 30, 2015 |
The Fund recognizes transfers between levels as of the end of the period. For the year ended April 30, 2015, the Fund did not have any transfers between Level 1 and Level 2 securities. For the year ended April 30, 2015, the Fund did not have any securities that used unobservable inputs (Level 3) in determining fair value.
Investment Transactions and Investment Income: Investment transactions are accounted for on the date the investments are purchased or sold (trade date). Realized gains and losses from investment transactions are reported on an identified cost basis. Interest income, which includes accretion of discounts, is accrued and recorded as earned. Dividend income is recognized on the ex-dividend date or for certain foreign securities, as soon as information is available to the Fund.
Trust Expenses: Some expenses of the Trust can be directly attributed to the Fund. Expenses which cannot be directly attributed to the Fund are apportioned among all funds in the Trust based on average net assets of each fund.
Fund Expenses: Expenses that are specific to the Fund are charged directly to the Fund.
Federal Income Taxes: The Fund complies with the requirements under Subchapter M of the Internal Revenue Code of 1986, as amended, applicable to regulated investment companies and intends to distribute substantially all of their net taxable income and net capital gains, if any, each year so that it will not be subject to excise tax on undistributed income and gains. The Fund is not subject to income taxes to the extent such distributions are made.
As of and during the year ended April 30, 2015, the Fund did not have a liability for any unrecognized tax benefits. The Fund files U.S. federal, state, and local tax returns as required. The Fund’s tax returns are subject to examination by the relevant tax authorities until expiration of the applicable statute of limitations, which is generally three years after the filing of the tax return for federal purposes and four years for most state returns. Tax returns for open years have incorporated no uncertain tax positions that require a provision for income taxes.
Distributions to Shareholders: The Fund normally pays dividends, if any, quarterly and distributes capital gains, if any, on an annual basis. Income dividend distributions are derived from interest and other income the Fund receives from its investments, including short term capital gains. Long term capital gain distributions are derived from gains realized when the Fund sells a security it has owned for more than a year. The Fund may make additional distributions and dividends at other times if the portfolio manager believes doing so may be necessary for the Fund to avoid or reduce taxes.
3. TAX BASIS INFORMATION
Reclassifications: As of April 30, 2015, permanent differences in book and tax accounting were reclassified. These differences had no effect on net assets and were primarily attributed to minor differences between book and tax characterizations of paydown transactions.
| | |
| | |
| 28 | | 1-855-DGI-FUND (344-3863) | www.DGIfund.com �� |
| | |
The Disciplined Growth Investors Fund | | Notes to Financial Statements |
| | April 30, 2015 |
The reclassifications as of April 30, 2015 were as follows:
| | | | | | | | | | | | |
| Fund | | Paid-in Capital | | | Accumulated Net
Investment Income | | | Accumulated Net
Realized Loss on
Investments | |
Disciplined Growth Investors Fund | | $ | – | | | $ | 6,592 | | | $ | (6,592 | ) |
Tax Basis of Investments: As of April 30, 2015, the aggregate cost of investments, gross unrealized appreciation/(depreciation) and net unrealized appreciation for Federal tax purposes was as follows:
| | | | |
| | | Disciplined Growth
Investors Fund | |
Gross appreciation | | | | |
(excess of value over tax cost) | | $ | 26,926,613 | |
Gross depreciation | | | | |
(excess of tax cost over value) | | | (1,465,294) | |
| | |
Net unrealized appreciation | | $ | 25,461,319 | |
| |
Cost of investments for income tax purposes | | $ | 87,539,106 | |
| |
Components of Earnings: As of April 30, 2015, components of distributable earnings were as follows:
| | | | |
Undistributed ordinary income | | $ | 275,908 | |
Accumulated capital gains | | | 2,244,822 | |
Net unrealized appreciation on investments | | | 25,461,319 | |
| | |
Total | | $ | 27,982,049 | |
| |
Capital Losses: As of April 30, 2015, the Fund has no accumulated capital loss carryforwards.
Tax Basis of Distributions to Shareholders: The character of distributions made during the year from net investment income or net realized gains may differ from its ultimate characterization for federal income tax purposes. Also, due to the timing of dividend distributions, the fiscal year in which amounts are distributed may differ from the fiscal year in which the income or realized gain was recorded by the Fund.
The tax character of distributions paid during the year ended April 30, 2015, were as follows:
| | | | | | | | |
| | | Ordinary Income | | | Long-Term Capital
Gain | |
The Disciplined Growth Investors Fund | | $ | 576,515 | | | $ | 683,612 | |
The tax character of distributions paid during the year ended April 30, 2014, were as follows:
| | | | | | | | |
| | | Ordinary Income | | | Long-Term Capital
Gain | |
The Disciplined Growth Investors Fund | | $ | 381,779 | | | $ | 278,995 | |
| | |
| | |
| Annual Report | April 30, 2015 | | 29 |
| | |
The Disciplined Growth Investors Fund | | Notes to Financial Statements |
| | April 30, 2015 |
4. SECURITIES TRANSACTIONS
During the year ended April 30, 2015, equity holdings, asset/mortgage backed securities, fixed income securities and U.S. Treasury Notes were transferred in-kind. The intent of the transfers was to save on equity transaction costs both for the new shareholders at the institution they transferred from and for the Fund on the addition of assets. The assets of two separate accounts were transferred-in-kind into the Fund in the amount of $6,677,711.
The cost of purchases and proceeds from sales of securities (excluding short-term securities, transfers-in-kind, and U.S. Government Obligations) during the year ended April 30, 2015, were as follows:
| | | | | | | | |
| Fund | | Purchases of
Securities | | | Proceeds From Sales
of Securities | |
The Disciplined Growth Investors Fund | | $ | 18,123,626 | | | $ | 13,099,403 | |
Investment transactions in U.S. government and agency securities (excluding transfers-in-kind) for the year ended April 30, 2015 were as follows:
| | | | | | | | |
| Fund | | Purchases of
Securities | | | Proceeds From Sales
of Securities | |
The Disciplined Growth Investors Fund | | $ | – | | | $ | 75,000 | |
5. SHARES OF BENEFICIAL INTEREST
The capitalization of the Trust consists of an unlimited number of shares of beneficial interest with no par value per share. Holders of the shares of the Fund of the Trust have one vote for each share held and a proportionate fraction of a vote for each fractional share. All shares issued and outstanding are fully paid and are transferable and redeemable at the option of the shareholder. Purchasers of the shares do not have any obligation to make payments to the Trust or its creditors (other than the purchase price for the shares) or make contributions to the Trust or its creditors solely by reason of the purchasers’ ownership of the shares. Shares have no pre-emptive rights.
Shares redeemed within 90 days of purchase may incur a 2% short-term redemption fee deducted from the redemption amount. For the years ended April 30, 2015 and April 30, 2014, the Fund did not receive any redemption fees.
6. MANAGEMENT AND RELATED-PARTY TRANSACTIONS
Disciplined Growth Investors, Inc. (the “Adviser” or “DGI”), subject to the authority of the Board, is responsible for the overall management and administration of the Fund’s business affairs. DGI manages the investments of the Fund in accordance with the Fund’s investment objective, policies and limitations and investment guidelines established jointly by the Adviser and the Trustees. Pursuant to the Advisory Agreement, the Fund pays the Adviser a unitary management fee for the services and facilities it provides payable on a monthly basis at the annual rate of 0.78% of the Fund’s average daily net assets.
| | |
| | |
| 30 | | 1-855-DGI-FUND (344-3863) | www.DGIfund.com |
| | |
The Disciplined Growth Investors Fund | | Notes to Financial Statements |
| | April 30, 2015 |
Out of the unitary management fee, the Adviser pays substantially all expenses of the Fund, including the cost of transfer agency, custody, fund administration, bookkeeping and pricing services, legal, audit and other services, except for interest expenses, brokerage expenses, taxes and extraordinary expenses not incurred in the ordinary course of the Fund’s business. Also included are Trustee fees which were $2,847 for the year ended April 30, 2015.
Fund Administrator Fees and Expenses
ALPS Fund Services, Inc. (“ALPS”) serves as administrator to the Fund. Pursuant to an Administrative Agreement, ALPS provides operational services to the Fund including, but not limited to, fund accounting and fund administration and generally assists in the Fund’s operations. Officers of the Trust are employees of ALPS. The Fund’s administration fee is accrued on a daily basis and paid monthly. The Administrator is also reimbursed for certain out-of-pocket expenses. The administrative fee and out-of-pocket expenses are included in the unitary management fee paid to the Adviser.
Transfer Agent
ALPS serves as transfer, dividend paying and shareholder servicing agent for the Fund. ALPS receives an annual minimum fee, a fee based upon the number of shareholder accounts, and is also reimbursed for certain out-of-pocket expenses. The fee is included in the unitary management fee paid to the Adviser.
Compliance Services
ALPS provides services that assist the Trust’s chief compliance officer in monitoring and testing the policies and procedures of the Trust in conjunction with requirements under Rule 38a-1 under the 1940 Act and receives an annual base fee. ALPS is reimbursed for certain out-of-pocket expenses. The fee is included in the unitary management fee paid to the Adviser.
Principal Financial Officer
ALPS receives an annual fee for providing principal financial officer services to the Fund. The fee is included in the unitary management fee paid to the Adviser.
Distributor
ALPS Distributors, Inc. (“ADI” or the “Distributor”) (an affiliate of ALPS) acts as the distributor of the Fund’s shares pursuant to a Distribution Agreement with the Trust. Shares are sold on a continuous basis by ADI as agent for the Fund, and ADI has agreed to use its best efforts to solicit orders for the sale of the Fund’s shares, although it is not obliged to sell any particular amount of shares. ADI is not entitled to any compensation for its services as Distributor. ADI is registered as a broker-dealer with the Securities and Exchange Commission.
7. INDEMNIFICATIONS
Under the Trust’s organizational documents, its officers and Trustees are indemnified against certain liability arising out of the performance of their duties to the Trust. Additionally, in the normal course of business, the Trust enters into contracts with service providers that may contain general indemnification clauses, which may permit indemnification to the extent permissible under applicable law. The Trust’s maximum exposure under these arrangements is unknown, as this would involve future claims that may be made against the Trust that have not yet occurred.
| | |
| | |
| Annual Report | April 30, 2015 | | 31 |
| | |
| The Disciplined Growth Investors Fund | | Report of Independent Registered
Public Accounting Firm |
| | |
To the Shareholders and Board of Trustees of Financial Investors Trust:
We have audited the accompanying statement of assets and liabilities, including the portfolio of investments, of The Disciplined Growth Investors Fund (the “Fund”), one of the portfolios constituting Financial Investors Trust, as of April 30, 2015, the related statement of operations for the year then ended, the statements of changes in net assets for each of the two years in the period then ended, and the financial highlights for each of the three years in the period then ended and the period from August 12, 2011 (inception) to April 30, 2012. These financial statements and financial highlights are the responsibility of the Fund’s management. Our responsibility is to express an opinion on these financial statements and financial highlights based on our audits.
We conducted our audits in accordance with the standards of the Public Company Accounting Oversight Board (United States). Those standards require that we plan and perform the audit to obtain reasonable assurance about whether the financial statements and financial highlights are free of material misstatement. The Fund is not required to have, nor were we engaged to perform, an audit of its internal control over financial reporting. Our audits included consideration of internal control over financial reporting as a basis for designing audit procedures that are appropriate in the circumstances, but not for the purpose of expressing an opinion on the effectiveness of the Fund’s internal control over financial reporting. Accordingly, we express no such opinion. An audit also includes examining, on a test basis, evidence supporting the amounts and disclosures in the financial statements, assessing the accounting principles used and significant estimates made by management, as well as evaluating the overall financial statement presentation. Our procedures included confirmation of securities owned as of April 30, 2015, by correspondence with the custodian. We believe that our audits provide a reasonable basis for our opinion.
In our opinion, the financial statements and financial highlights referred to above present fairly, in all material respects, the financial position of The Disciplined Growth Investors Fund of Financial Investors Trust, as of April 30, 2015, the results of its operations for the year then ended, the changes in its net assets for each of the two years in the period then ended, and the financial highlights for each of the three years in the period then ended and the period from August 12, 2011 (inception) to April 30, 2012, in conformity with accounting principles generally accepted in the United States of America.
DELOITTE & TOUCHE LLP
Denver, Colorado
June 26, 2015
| | |
| | |
| 32 | | 1-855-DGI-FUND (344-3863) | www.DGIfund.com |
| | |
The Disciplined Growth Investors Fund | | Additional Information |
| | April 30, 2015 (Unaudited) |
1. FUND HOLDINGS
The Fund files its complete schedule of portfolio holdings with the Securities and Exchange Commission (the “SEC”) for the first and third quarters of each fiscal year on Form N-Q within 60 days after the end of the period. Copies of the Fund’s Form N-Q are available without charge on the SEC website at http://www.sec.gov. You may also review and copy the Form N-Q at the SEC’s Public Reference Room in Washington, DC. For more information about the operation of the Public Reference Room, please call the SEC at 1-800-SEC-0330.
2. FUND PROXY VOTING POLICIES, PROCEDURES AND SUMMARIES
The Fund’s policies and procedures used in determining how to vote proxies and information regarding how the Fund voted proxies relating to portfolio securities during the most recent prior 12-month period ending June 30 are available without charge, (1) upon request, by calling (toll-free) 855-DGI-Fund and (2) on the SEC’s website at http://www.sec.gov.
3. TAX DESIGNATIONS
The Fund designates the following for federal income tax purposes for distributions made during the calendar year ended December 31, 2014:
| | |
Dividend Received Deduction | | 78.17% |
Qualified Dividend Income | | 100.00% |
Pursuant to Section 852(b)(3) of the Internal Revenue Code, the Disciplined Growth Investors Fund designated $683,612 as long-term capital gain dividends.
In early 2015, if applicable, shareholders of record received this information for the distributions paid to them by the Fund during the calendar year 2014 via Form 1099. The Fund will notify shareholders in early 2016 of amounts paid to them by the Fund, if any, during the calendar year 2015.
| | |
| | |
| Annual Report | April 30, 2015 | | 33 |
| | |
The Disciplined Growth Investors Fund | | Trustees and Officers |
| | April 30, 2015 (Unaudited) |
Additional information regarding the Fund’s trustees is included in the Statement of Additional Information, which can be obtained without charge by calling 855-DGI-Fund.
INDEPENDENT TRUSTEES
| | | | | | | | | | |
Name, Address* & Year of Birth | | Position(s) Held with Fund | | Term of Office and Length of Time Served** | | Principal Occupation(s) During Past 5 Years*** | | Number of
Funds in
Fund
Complex
Overseen
by
Trustee**** | | Other
Directorships Held by Trustee
During Past 5 Years |
Mary K. Anstine, 1940 | | Trustee | | Ms. Anstine was elected at a special meeting of shareholders held on March 21, 1997 and re-elected at a special meeting of shareholders held on August 7, 2009. | | Ms. Anstine was formerly an Executive Vice President of First Interstate Bank of Denver until 1994, President/Chief Executive Officer of HealthONE Alliance, Denver, Colorado, from 1994 to 2004, and has been retired since 2004. Ms. Anstine is also Trustee/Director of AV Hunter Trust and Colorado Uplift Board. Ms. Anstine was formerly a Director of the Trust Bank of Colorado (later purchased and now known as Northern Trust Bank), HealthONE and Denver Area Council of the Boy Scouts of America, and a member of the American Bankers Association Trust Executive Committee. | | 30 | | Ms. Anstine is a Trustee of ALPS ETF Trust (18 funds); ALPS Variable Investment Trust (9 funds); Reaves Utility Income Fund (1 fund); and Westcore Trust (12 funds). |
John R. Moran, Jr., 1930 | | Trustee | | Mr. Moran was elected at a special meeting of shareholders held on March 21, 1997 and re-elected at a special meeting of shareholders held on August 7, 2009. | | Mr. Moran formerly served as President and CEO of The Colorado Trust, a private foundation serving the health and hospital community in the state of Colorado, from 1991 to 2007. During his career as an attorney from 1958 to 1991, Mr. Moran was formerly a partner with the firm of Kutak Rock & Campbell in Denver, Colorado and a member of the Colorado House of Representatives. Currently, Mr. Moran is a member of the Treasurer’s Investment Advisory Committee for the University of Colorado. | | 30 | | None. |
| * | All communications to Trustees and Officers may be directed to Financial Investors Trust c/o 1290 Broadway, Suite 1100, Denver, CO 80203. |
| ** | This is the period for which the Trustee or Officer began serving the Trust. Each Trustee and/or Officer serves an indefinite term, until his successor is elected. |
| *** | Except as otherwise indicated, each individual has held the office shown or other offices in the same company for the last five years. |
| **** | The Fund Complex includes all series of the Trust (currently 30) and any other investment companies for which any Trustee serves as Trustee for and which Disciplined Growth Investors, Inc. provides investment advisory services (currently none). |
| | |
| | |
| 34 | | 1-855-DGI-FUND (344-3863) | www.DGIfund.com |
| | |
The Disciplined Growth Investors Fund | | Trustees and Officers |
| | April 30, 2015 (Unaudited) |
INDEPENDENT TRUSTEES (continued)
| | | | | | | | | | |
Name, Address* & Year of Birth | | Position(s) Held with Fund | | Term of Office and Length of Time Served** | | Principal Occupation(s) During Past 5 Years*** | | Number of
Funds in
Fund
Complex
Overseen
by
Trustee**** | | Other
Directorships Held by Trustee
During Past 5 Years |
| Jeremy W. Deems, 1976 | | Trustee | | Mr. Deems was appointed as a Trustee at the March 11, 2008 meeting of the Board of Trustees and elected at a special meeting of shareholders held on August 7, 2009. | | Mr. Deems is the Co-Founder and Chief Financial Officer of Green Alpha Advisors, LLC, a registered investment advisor, and Co-Portfolio Manager of the Shelton Green Alpha Fund. Prior to joining Green Alpha Advisors, Mr. Deems was CFO and Treasurer of Forward Management, LLC, ReFlow Management Co., LLC, ReFlow Fund, LLC, a private investment fund, and Sutton Place Management, LLC, an administrative services company, from 1998 to June 2007. From 2004 to 2005, Mr Deems also served as Treasurer of the Forward Funds and the Sierra Club Funds. | | 30 | | Mr. Deems is a Trustee of ALPS ETF Trust (18 funds); ALPS Variable Investment Trust (9 funds) and Reaves Utility Income Fund (1 fund). |
| Jerry G. Rutledge 1944 | | Trustee | | Mr. Rutledge was elected at a special meeting of shareholders held on August 7, 2009 | | Mr. Rutledge is the President and owner of Rutledge’s Inc., a retail clothing business. Mr. Rutledge is currently serving as a Director of the University of Colorado Hospital. Mr. Rutledge was from 1994 to 2007 a Regent of the University of Colorado. | | 30 | | Mr. Rutledge is a Trustee of Principal Real Estate Income Fund (1 fund), Clough Global Allocation Fund (1 fund), Clough Global Equity Fund (1 fund) and Clough Global Opportunities Fund (1 fund). |
| | |
| | |
| Annual Report | April 30, 2015 | | 35 |
| | |
The Disciplined Growth Investors Fund | | Trustees and Officers |
| | April 30, 2015 (Unaudited) |
INDEPENDENT TRUSTEES (continued)
| | | | | | | | | | |
Name, Address* & Year of Birth | | Position(s) Held with Fund | | Term of Office and Length of Time Served** | | Principal Occupation(s) During Past 5 Years*** | | Number of
Funds in
Fund
Complex
Overseen
by
Trustee**** | | Other
Directorships Held by Trustee
During Past 5 Years |
Michael “Ross” Shell, 1970 | | Trustee | | Mr. Shell was elected at a special meeting of shareholders held on August 7, 2009 | | Mr. Shell is Founder and CEO of Red Idea, LLC, a strategic consulting/early stage venture firm (since June 2008). From 1999 to 2009, he was a part-owner and Director of Tesser, Inc., a brand agency. From December 2005 to May 2008, he was Director, Marketing and Investor Relations, of Woodbourne, a REIT/real estate hedge fund and private equity firm. Prior to this, from May 2004 to November 2005, he worked as a business strategy consultant; from June 2003 to April 2004, he was on the Global Client Services team of IDEO, a product design/innovation firm; and from 1999 to 2003, he was President of Tesser, Inc. Mr. Shell graduated with honors from Stanford University with a degree in Political Science. | | 30 | | None. |
| * | All communications to Trustees and Officers may be directed to Financial Investors Trust c/o 1290 Broadway, Suite 1100, Denver, CO 80203. |
| ** | This is the period for which the Trustee or Officer began serving the Trust. Each Trustee and/or Officer serves an indefinite term, until his successor is elected. |
| *** | Except as otherwise indicated, each individual has held the office shown or other offices in the same company for the last five years. |
| **** | The Fund Complex includes all series of the Trust (currently 30) and any other investment companies for which any Trustee serves as Trustee for and which Disciplined Growth Investors, Inc. provides investment advisory services (currently none). |
| | |
| | |
| 36 | | 1-855-DGI-FUND (344-3863) | www.DGIfund.com |
| | |
The Disciplined Growth Investors Fund | | Trustees and Officers |
| | April 30, 2015 (Unaudited) |
INTERESTED TRUSTEE
| | | | | | | | | | |
Name, Address* & Age | | Position(s) Held with Fund | | Term of Office and Length of Time Served** | | Principal Occupation(s) During Past 5 Years*** | | Number of Funds in Fund Complex Overseen by
Trustee**** | | Other Directorships Held by Trustee |
Edmund J. Burke, 1961 | | Trustee, Chairman and President | | Mr. Burke was elected as Chairman at the August 28, 2009 meeting of the Board of Trustees. Mr. Burke was elected as Trustee at a special meeting of shareholders held on August 7, 2009. Mr. Burke was elected President of the Trust at the December 17, 2002 meeting of the Board of Trustees. | | Mr. Burke is President and a Director of ALPS Holdings, Inc. (“AHI”) (since 2005) and Director of Boston Financial Data Services, Inc. (“BFDS”), ALPS Advisors, Inc. (“AAI”), ALPS Distributors, Inc. (“ADI”), ALPS Fund Services, Inc. (“AFS”) and ALPS Portfolio Solutions Distributor, Inc. (“APSD”) and from 2001-2008, was President of AAI, ADI, AFS and APSD. Because of his positions with AHI, BFDS, AAI, ADI, AFS and APSD, Mr. Burke is deemed an affiliate of the Trust as defined under the 1940 Act. Mr. Burke is Trustee and President of the Clough Global Allocation Fund (Trustee since 2006; President since 2004); Trustee and President of the Clough Global Equity Fund (Trustee since 2006; President since 2005); Trustee and President of the Clough Global Opportunities Fund (since 2006); Trustee of the Liberty All-Star Equity Fund; and Director of the Liberty All-Star Growth Fund, Inc. | | 35 | | Mr. Burke is a Trustee of Clough Global Allocation Fund (1 fund); Clough Global Equity Fund (1 fund); Clough Global Opportunities Fund (1 fund); Trustee of the Liberty All-Star Equity Fund (1 fund); and Director of the Liberty All-Star Growth Fund, Inc. (1 fund). |
| | |
| | |
| Annual Report | April 30, 2015 | | 37 |
| | |
The Disciplined Growth Investors Fund | | Trustees and Officers |
| | April 30, 2015 (Unaudited) |
OFFICERS
| | | | | | | | | | |
| | | Name,
Address*
& Year
of Birth | | Position(s)
Held with
Fund | | Term of Office
and Length of
Time Served** | | Principal Occupation(s) During Past 5 Years*** | | |
| | | Kimberly R. Storms, 1972 | | Treasurer | | Ms. Storms was elected Treasurer of the Trust at the March 12, 2013 meeting of the Board of Trustees. | | Ms. Storms is Senior Vice President and Director of Fund Administration of ALPS. Because of her position with ALPS, Ms. Storms is deemed an affiliate of the Trust as defined under the 1940 Act. Ms. Storms is also Treasurer of Liberty All-Star Equity Fund and Liberty All-Star Growth Fund, Inc. and Chief Financial Officer of The Arbitrage Funds. | | |
| | | David T. Buhler, 1971 | | Secretary | | Mr. Buhler was elected Secretary of the Trust at the September 11, 2012 meeting of the Board of Trustees. | | Mr. Buhler joined ALPS in June 2010. He is currently Vice President and Senior Associate Counsel of ALPS, AAI, ADI and APSD. Prior to joining ALPS, Mr. Buhler served as Associate General Counsel and Assistant Secretary of Founders Asset Management LLC from 2006 to 2009. Because of his position with ALPS, Mr. Buhler is deemed an affiliate of the Trust as defined under the 1940 Act. Mr. Buhler is also the Secretary ALPS Variable Investment Trust, ALPS ETF Trust and Westcore Trust. | | |
| | | Ted Uhl, 1974 | | Chief
Compliance
Officer
(“CCO”) | | Mr. Uhl was appointed CCO of the Trust at the June 8, 2010 meeting of the Board of Trustees. | | Mr. Uhl joined ALPS in October 2006, and is currently Deputy Compliance Officer of ALPS. Prior to his current role, Mr. Uhl served as Senior Risk Manager for ALPS from October 2006 until June 2010. Because of his position with ALPS, Mr. Uhl is deemed an affiliate of the Trust as defined under the 1940 Act. Mr. Uhl is also CCO of the Clough Global Funds, Reaves Utility Income Fund, Centre Funds and Transparent Value Trust. | | |
| * | All communications to Trustees and Officers may be directed to Financial Investors Trust c/o 1290 Broadway, Suite 1100, Denver, CO 80203. |
| ** | This is the period for which the Trustee or Officer began serving the Trust. Each Trustee and/or Officer serves an indefinite term, until his successor is elected. |
| *** | Except as otherwise indicated, each individual has held the office shown or other offices in the same company for the last five years. |
| | |
| | |
| 38 | | 1-855-DGI-FUND (344-3863) | www.DGIfund.com |
Intentionally Left Blank

TABLE OF CONTENTS
| | |
| Emerald Growth Fund | | Manager Commentary |
| | April 30, 2015 (Unaudited) |
April 30, 2015
Dear Shareholders:
Investment Results
The performance of the Emerald Growth Fund’s Class A shares (without sales load), for the twelve months ended April 30, 2015, reflected a gain of 18.38% outpacing the Russell 2000 Growth Index(1) which gained 14.65%.
Although total returns for small capitalization growth stocks as represented by the Russell 2000 Growth Index were attractive for the full period, the first six months of the fiscal year were generally more challenging than the most recent six months. For the full calendar year 2014, small capitalization stocks trailed large caps by the widest margin since 1998 as declining oil prices, the rising dollar, consternation over the timing and trajectory of rate increases, and growing concerns regarding global growth and slowing rates of inflation weighed collectively on investor’s appetites for risk assets. “Four Down But Not Out Small Caps”, Forbes magazine March 2, 2015. As summer turned to fall, small capitalization stock performance started to improve, with the Russell 2000 Growth index advancing 10.06% in the final quarter of 2014. The resurgence in small capitalization leadership that began in the fourth calendar quarter of 2014 carried into early 2015, with the Russell 2000 Growth index gaining 3.49% during the first four months of the year as a strong earnings season across the Russell 2000 universe driven by a combination of more domestic exposure, conversely less currency exposure, less energy exposure and more innovation collectively drove strong earnings growth, propelling the index higher.
Investment Analysis
The Emerald Growth Fund outperformed its benchmark for the trailing 12-month period ended April 30, 2015. At the sector level relative outperformance was driven by stock selection within the healthcare, financial services and technology sectors. Outperformance in the aforementioned was modestly offset by relative underperformance within the consumer discretionary, producer durables and consumer staples sectors.
The healthcare sector represented the largest source of relative outperformance for the portfolio. Stock selection within the biotechnology and healthcare facilities industries was the largest driver of the relative outperformance. The portfolio was able to participate in and benefit from the resurgence in drug development, specifically in the area of rare diseases. While the healthcare sector and the biotechnology industry specifically has been an area of strong relative performance for the market and the Emerald portfolio for the last three years, Emerald continues to be positive on the outlook for the industry as those companies demonstrating clinical successes continue to be rewarded.
The portfolio also experienced a positive contribution to return within the financial services and technology sectors driven by relative outperformance within the banking, insurance, software and electronics industries.
This outperformance was partially offset by relative underperformance within the consumer discretionary, producer durables and consumer staples sectors. Stock selection within consumer discretionary and producer durables weighed on relative performance as holdings within the apparel, leisure, and construction industries underperformed relative to expectations. Relative performance within the consumer staples sector was challenged predominantly as a result of the portfolio’s underweight position relative to the benchmark.
Exiting April 2015, the portfolio has the largest relative active exposures to the financial services and technology sectors. Within the financial services sector, the banking industry remains a key area of focus. The technology sector is also an area of emphasis within the portfolios driven by a broad set of opportunities including security and mobile gaming, as well as data center and network infrastructure spending. Non-residential construction remains a key theme within the portfolio, reflecting Emerald’s belief that the improvement in non-residential construction growth that began during 2014 will continue and potentially accelerate in 2015, as fundamentals outside of the energy patch look increasingly attractive. The portfolio’s exposure to non-residential construction spans sectors with exposures reflected in holdings within the producer durables and materials sectors, with investments in engineering and construction, building materials and glass industries. Emerald is similarly enthusiastic regarding the opportunity within the healthcare sector. While the portfolio’s level of active exposure has fluctuated over the last few years, Emerald has remained unwavering in its view regarding the breadth of opportunity within the healthcare sector. Innovation within healthcare remains particularly robust with innovative new therapies being developed to treat and potentially cure an increasing number of disease states, advancements in medical devices within orthopedics, cardiology and oxygen markets to name a few, as well diagnostics and services. While the healthcare sector in aggregate has been an outperformer over the last three years, we believe that successful execution will continue to be rewarded.
| | |
Annual Report | April 30, 2015 | | 1 |
| | |
| Emerald Growth Fund | | Manager Commentary |
| | April 30, 2015 (Unaudited) |
Market Outlook
What is it about the first quarter? For the second consecutive year, first quarter U.S. economic growth has tracked materially below trend. The Atlanta Federal Reserve GDPNow forecasting model estimates that as of April 2, 2015 first quarter Gross Domestic Product (“GDP”) is currently tracking at a very modest 0.1% seasonally adjusted rate of growth, representing a meaningful sequential deceleration from the fourth quarter. It appears that another tough winter, a strengthening dollar and delays at the West Coast ports collectively conspired to restrain first quarter economic growth. Earnings estimates, as a result, have been moving lower as a reflection of slowing domestic economic growth, the rising dollar and lower oil prices. Earnings estimates for the S&P 500(2) have been hit particularly hard. According to a recent report from Bank of America Merrill Lynch, given the aforementioned headwinds, the organization has revised its earnings expectation for the S&P 500 and now anticipates aggregate earnings for the index to decline approximately 1.7% this year, representing the first year of negative Earnings Per Share (“EPS”) growth for the S&P 500 since 2009. While not yet consensus, the revision is reflective of the headwinds facing large U.S. multinationals. The question the market will be trying the answer over the coming weeks is whether this “recession in earnings growth” is temporary or something more durable likely resulting in greater short-term market volatility.
Admittedly, at this stage it is difficult to ascertain whether the current U.S. economic slowdown is a result of the transient factors discussed above or if there is something larger at play. From Emerald’s perspective, the economy feels very reminiscent of the first quarter of 2014 where the slowdown, while more severe than anticipated, proved temporary, with economic growth subsequently accelerating throughout the year. We believe we could see a similar scenario play out this year given the potential for a reemergence of discretionary spend by the U.S. consumer, an improving outlook for Eurozone economic growth, stabilizing growth in China and a dollar which may have already peaked.
If we are correct and domestic economic growth reaccelerates, this should provide a tailwind to small capitalization revenue and earnings growth, both on a relative and absolute basis. Given that small capitalization stocks’ revenue mix is skewed toward domestic sources, these companies theoretically should be more insulated from currency pressures, and as a result earnings growth for the Russell 2000 should continue to substantially outpace the rate of earnings growth for the S&P 500. This was certainly the case in the first quarter, with revenue and earnings growth for small capitalization stocks pacing at 9.9% and 14.8% respectively, significantly ahead of the 1.7% revenue growth and 5.4% EPS growth posted by the larger capitalization peers, according to the February 24, 2015 report from Bank of America Merrill Lynch’s Small-Cap Strategist, Steven DeSanctis.
At this point, none of the concerns discussed above appear to be changing the Fed’s policy outlook which we believe continues to point to a rate increase sometime during 2015. Given the significant slowdown in first quarter economic growth, and inflation remaining subdued, Emerald continues to believe that the Federal Reserve is likely to remain patient, erring on the side of caution, and preferring to follow the trend (whether that be jobs or inflation) rather than anticipate it. That being said, if the Federal Reserve is able to maintain its current trajectory, the tightening will only be in response to strong domestic growth, which has historically been positively correlated(3) to small capitalization performance. We see no reason why that should not be the case today.
As always, Emerald remains focused on utilizing its fundamental bottom-up research process to identify some of the best growth opportunities within the small capitalization universe.
| | | | |
Top Contributors | | Top Detractors | | |
Bluebird Bio, Inc. | | Magnum Hunter Resources Corporation | | |
Proofpoint, Inc. | | Penn Virginia Corporation | | |
Alnylam Pharmaceuticals, Inc. | | Channeladvisor Corporation | | |
EPAM Systems, Inc. | | Sarepta Therapeutics, Inc. | | |
Acadia Healthcare Company, Inc. | | Tutor Perini Corporation | | |
| | |

| | 
| |  |
Kenneth G. Mertz II, CFA | | Stacey L. Sears | | Joseph W. Garner |
Chief Investment Officer | | Portfolio Manager | | Portfolio Manager |
Portfolio Manager | | | | |
| | |
Emerald Mutual Fund Advisers Trust | | | | |
| | |
2 | | www.emeraldmutualfunds.com |
| | |
| Emerald Growth Fund | | Manager Commentary |
| | April 30, 2015 (Unaudited) |
The views and information discussed in this commentary are as of the date of publication, are subject to change, and may not reflect the writer’s current views. The views expressed represent an assessment of market conditions at a specific point in time, are opinions only and should not be relied upon as investment advice regarding a particular investment or markets in general. Such information does not constitute a recommendation to buy or sell specific securities or investment vehicles. It should not be assumed that any investment will be profitable or will equal the performance of the Fund or any securities or any sectors mentioned in this letter. The subject matter contained in this letter has been derived from several sources believed to be reliable and accurate at the time of compilation. Neither Emerald Mutual Fund Advisors Trust nor the Fund accepts any liability for losses either direct or consequential caused by the use of this information.
The Emerald Growth Fund is distributed by ALPS Distributors, Inc.
| (1) | The Russell 2000® Growth Index measures the performance of the small-cap growth segment of the U.S. equity universe. It includes those Russell 2000® Index companies with higher price-to-value ratios and higher forecasted growth values. The Index is not actively managed and does not reflect any deductions for fees, expenses or taxes. An investor may not invest directly into the Index. |
| (2) | Standard & Poor’s 500® Index is an unmanaged index of 500 common stocks chosen for the market size, liquidity and industry group representation. It is a market-value weighted index. The Index is not actively managed and does not reflect any deduction for fees, expenses or taxes. An investor may not invest directly into the Index. |
| (3) | Correlation is a statistical measure of how an index moves in relation to another index or model portfolio. A correlation ranges from -1 to 1. A correlation of 1 means the two indexes have moved in lockstep with each other. A correlation of -1 means the two indexes have moved in exactly the opposite direction. |
| | |
Annual Report | April 30, 2015 | | 3 |
| | |
| Emerald Growth Fund | | Manager Commentary |
| | April 30, 2015 (Unaudited) |
| | | | | | |
TOP TEN HOLDINGS
(as a % of Net Assets)* | | | | | |
| | |
Spirit Airlines, Inc. | | | 2.31% | | | |
| | | |
Apogee Enterprises, Inc. | | | 2.11% | | | |
| | | |
EPAM Systems, Inc. | | | 2.03% | | | |
| | | |
Acadia Healthcare Co., Inc. | | | 1.94% | | | |
| | | |
Imperva, Inc. | | | 1.82% | | | |
| | | |
Bank of the Ozarks, Inc. | | | 1.73% | | | |
| | | |
Trex Co., Inc. | | | 1.56% | | | |
| | | |
Astronics Corp. | | | 1.44% | | | |
| | | |
IPG Photonics Corp. | | | 1.44% | | | |
| | | |
Proofpoint, Inc. | | | 1.43% | | | |
| | | |
Top Ten Holdings | | | 17.81% | | | |
| | | |
| |
INDUSTRY SECTOR ALLOCATION (as a % of Net Assets) | | | |
| | |
Technology | | | 23.49% | | | |
| | | |
Health Care | | | 22.04% | | | |
| | | |
Financial Services | | | 15.51% | | | |
| | | |
Consumer Discretionary | | | 15.08% | | | |
| | | |
Producer Durables | | | 11.68% | | | |
| | | |
Materials & Processing | | | 5.30% | | | |
| | | |
Energy | | | 2.17% | | | |
| | | |
Utilities | | | 1.23% | | | |
| | | |
Consumer Staples | | | 0.19% | | | |
| | | |
Cash, Cash Equivalents, & Other Net Assets | | | 3.31% | | | |
| | | |
| |
* Holdings are subject to change. | | | |
| | |
| | | | | | |
| | | |
| | | | | | |
| | | |
| | | | | | |
| | | |
| | | | | | |
| | | |
| | | | | | |
| | | |
| | | | | | |
| | | |
| | | | | | |
| | | |
| | | | | | |
| | | |
| | | | | | |
| | | |
| | | | | | |
| | | |
| | | | | | |
| | | |
| | |
| | | | | | |
| | | | | | |
| | | |
| | | | | | |
| | | |
| | | |
| | | |
GROWTH OF $10,000 INVESTMENT IN THE FUND (for the period ended April 30, 2015)
Comparison of change in value of a $10,000 investment (includes applicable sales loads)
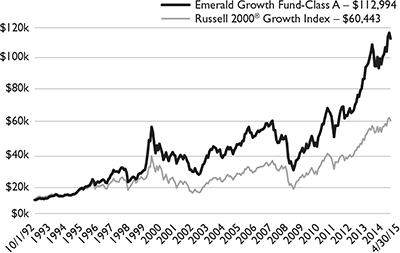
The chart represents historical performance of a hypothetical investment of $10,000 in the Fund since inception. Past performance does not guarantee future results. This chart does not reflect the deduction of taxes that a shareholder would pay on Fund distributions or the redemption of Fund shares.
| | | | | | | | | | | | | | | | | | | | | | | | | | | | |
AVERAGE ANNUAL TOTAL RETURN (for the period ended April 30, 2015) | |
| | | | | | |
| | | | | | | | | | | | | | | Since | | | Expense Ratio | |
| | | 1 Year | | | 3 Year | | | 5 Year | | | 10 Year | | | Inception1 | | | Gross2 | | | Net2 | |
Class A (NAV) | | | 18.38% | | | | 17.64% | | | | 17.47% | | | | 11.22% | | | | 11.58% | | | | 1.31% | | | | 1.29% | |
Class A (MOP) | | | 12.78% | | | | 15.74% | | | | 16.33% | | | | 10.67% | | | | 11.34% | | | | 1.31% | | | | 1.29% | |
Russell 2000®
Growth Index† | | | 14.65% | | | | 17.22% | | | | 14.94% | | | | 10.41% | | | | 8.29% | | | | | | | | | |
Class C (NAV) | | | 17.58% | | | | 16.87% | | | | 16.70% | | | | 10.55% | | | | 5.84% | | | | 1.96% | | | | 1.94% | |
Class C (CDSC) | | | 16.58% | | | | 16.87% | | | | 16.70% | | | | 10.55% | | | | 5.84% | | | | 1.96% | | | | 1.94% | |
Russell 2000®
Growth Index† | | | 14.65% | | | | 17.22% | | | | 14.94% | | | | 10.41% | | | | 4.55% | | | | | | | | | |
Investor Class | | | 18.37% | | | | 17.61% | | | | – | | | | – | | | | 13.73% | | | | 1.34% | | | | 1.34% | |
Russell 2000®
Growth Index† | | | 14.65% | | | | 17.22% | | | | 14.94% | | | | 10.41% | | | | 11.78% | | | | | | | | | |
Institutional Class | | | 18.77% | | | | 17.99% | | | | 17.82% | | | | – | | | | 18.32% | | | | 1.00% | | | | 0.99% | |
Russell 2000®
Growth Index† | | | 14.65% | | | | 17.22% | | | | 14.94% | | | | 10.41% | | | | 17.13% | | | | | | | | | |
The performance quoted represents past performance, does not guarantee future results and current performance may be lower or higher than the data quoted. The investment return and principal value of an investment will fluctuate so that shares, when redeemed, may be worth more or less than their original cost. Performance data current to the most recent month end may be obtained at www.emeraldmutualfunds.com.
Performance shown for periods prior to March 16, 2012, reflects the performance of the Forward Growth Fund, a series of Forward Funds (as a result of a reorganization of the Forward Growth Fund into the Emerald Growth Fund).
| | |
4 | | www.emeraldmutualfunds.com |
| | |
| Emerald Growth Fund | | Manager Commentary |
| | April 30, 2015 (Unaudited) |
Maximum Offering Price (MOP) for Class A shares includes the Fund’s maximum sales charge of 4.75%. Performance shown at NAV does not include these sales charges and would have been lower had it been taken into account.
A Contingent Deferred Sales Charge (CDSC) of 1.00% may apply to Class C shares redeemed within the first 12 months after a purchase.
| 1 | Inception Dates - Class A: 10/01/1992, Class C: 07/01/2000, Class Institutional: 10/21/2008, Class Investor: 05/01/2011 |
| 2 | Emerald Mutual Fund Advisers Trust (“Emerald” or the “Adviser”) has agreed contractually to waive a portion of its fees and reimburse other expenses until August 31, 2015 in amounts necessary to limit the Fund’s operating expenses (exclusive of Acquired Fund Fees and Expenses, brokerage expenses, interest expenses, taxes and extraordinary expense) for Class A, Class C, Institutional Class, and Investor Class shares to an annual rate (as percentage of the Fund’s average daily net assets) of 1.29%, 1.94%, 0.99% and 1.34% respectively. The Adviser will be permitted to recover, on a class-by-class basis, expenses it has borne through the agreement described above to the extent that the Fund’s expenses in later periods fall below the annual rates set forth in the relevant agreement. The Fund will not be obligated to pay any such deferred fees and expenses more than three years after the year(s) in which the fees and expense were incurred. The Adviser may not discontinue this waiver prior to August 31, 2015, without the approval by the Fund’s Board of Trustees. Ratios as of the Prospectus dated August 31, 2014 and may differ from the ratios presented in the Financial Highlights. |
| † | The Russell 2000® Growth Index measures the performance of the small-cap growth segment of the U.S. equity universe. It includes those Russell 2000® Index companies with higher price-to-value ratios and higher forecasted growth values. The Index is not actively managed and does not reflect any deduction for fees, expenses or taxes. An Investor may not invest directly into the Index. |
Important Risks
Investing in smaller companies generally will present greater investment risks, including: greater price volatility, greater sensitivity to changing economic conditions and less liquidity than the securities of larger, more mature companies.
| | |
Annual Report | April 30, 2015 | | 5 |
| | |
| Emerald Insights Fund | | Manager Commentary |
| | April 30, 2015 (Unaudited) |
April 30, 2015
Dear Shareholder:
Investment Results
The performance of the Emerald Insights Fund’s Class A shares (without sales load), for the nine months since the Fund’s inception reflected a gain of 9.80%, trailing the Russell Mid Cap Growth Index(1) benchmark by 3.69%. The temporarily unallocated cash from the Fund’s initial inflows had a negative impact on initial performance and was responsible for some of the Fund’s underperformance during our inaugural quarters.
After a tough inception in 2014, the Insights Fund rebounded strongly in the first quarter 2015 on the back of strong healthcare, energy, and technology stock performance. Mid-cap growth equities as an asset class posted robust returns vs. large caps and trailed only small cap growth equities as the best performing traditional equity asset class during the quarter. Russell Investments, “Small Cap Perspectives”, March 31, 2015. Russell Mid-Cap Growth Index performance was driven primarily by healthcare and technology sector performance, as these more traditional growth sectors outperformed on the investor expectations of continued accommodative global monetary policies, low inflation, dollar strength, and significant M&A (particularly biotech and pharma).
Investment Analysis
While the returns for the Insights Fund since inception are nicely positive, our first nine months could be described as participating in two distinctly different investment markets. The fund underperformed in the latter half of 2014 as the market favored lower growth, low interest rate dependent, higher capitalization companies within the benchmark – not the smaller, higher growth names targeted by the Insights Fund. The first four months of 2015, however, saw traditional growth-oriented names return to favor and the Fund’s continued conviction in high-growth, well-positioned names benefited performance. As a research-driven manager, stock selection always plays a vital role in the Fund’s performance – typically more-so than sector allocation. Since inception, stock selection within healthcare and technology were the largest contributors, while stock selection within the materials and energy sectors were the largest detractors.
Three healthcare names in particular, generated strong positive performance. Horizon Pharmaceuticals – a specialty biopharmaceutical company, Intrexon – a leader in the field of synthetic biology, and Alnylam Pharmaceuticals – a developer of therapeutics based on RNA interference, all contributing to our healthcare outperformance. Palo Alto Networks contributed to outperformance in the Technology sector, while a number of energy-related holdings, particularly U.S. Silica Holdings – a producer of commercial silica “frack sand”, detracted from sector performance.
Market Outlook
The Emerald Mid-Cap team has been steadfastly bullish about the US economy and growth stocks in general for the past five years. There are a currently a number of factors that cause us to maintain our bullish stance regarding mid-cap equities: while valuations have appreciated, they remain attractive vs. bonds (particularly for growth asset classes); global growth is likely to surprise to the upside; S&P 500(2) ex-energy earnings expectations remain reasonably solid; strong corporate stock buybacks; and debt indicators which suggest a continued upswing in business investment and business lending. We do, however, remain keenly focused on threats to stock market performance that could cause us to become more bearish on the direction of equities.
In 2014, we positioned portfolios for a global reflation(3) trade, a trade that never came to fruition, leading to our (and most active managers’) underperformance. This year, we have been more measured in our implementation of this trade related to portfolio positioning. We have reduced our energy weighting, and the remaining names are better capitalized. We have maintained our overweight in biotech and pharma, but selectively reduced names that have experienced hyperbolic price moves during the first several months of the year. Our largest overweight is technology, where we expect to see materially increased spending on security, data management, and online services. Technology has tended to do well around rate hikes and benefits from our expectations about increased capital spending. We remain overweight banks and airlines – banks, for the expected economic growth and rate increases contributing to loan growth and net interest margins; and airlines, given limited capacity additions and fuel cost benefits. Airlines have been weak recently after very strong second half of 2014, but we expect that weakness to reverse when energy prices stabilize, and when investors come to realize the true earnings power of selected growth airlines. We are modestly overweight consumer discretionary as we still see companies benefiting from declining energy prices and a larger consumer pocketbook. We remain underweight consumer staples, REITs, and utilities, given our expectations around the reflation trade and those sectors’ relatively high valuations given limited growth.
While it is certainly the case that market fluctuations are an ever present reality, one constant is Emerald’s commitment to deep fundamental research and our investment in our research team. We think our time-tested approach to identifying companies capable of performing in most market environments should continue to provide our clients with above-average market returns in the long-term.
| | |
6 | | www.emeraldmutualfunds.com |
| | |
| Emerald Insights Fund | | Manager Commentary |
| | April 30, 2015 (Unaudited) |
| | | | |
| Top Five Contributors to Return | | Top Five Detractors from Return | | |
| iShares Russell Mid-Cap Growth ETF | | U.S. Silica Holdings, Inc. | | |
| Horizon Pharma plc | | Penn Virginia Corporation | | |
| Intrexon Corporation | | Patterson-UTI Energy, Inc. | | |
| Alnylam Pharmaceuticals, Inc. | | Chicago Bridge & Iron. NV | | |
| Palo Alto Networks, Inc. | | Wynn Resorts, Limited | | |
| | |
 | |  | |  |
| David A. Volpe, CFA | | Joseph W. Garner | | Stephen L. Amsterdam |
| Deputy Chief Investment Officer | | Associate Portfolio Manager | | Associate Portfolio Manager |
| Portfolio Manager | | | | |
The views and information discussed in this commentary are as of the date of publication, are subject to change, and may not reflect the writer’s current views. The views expressed represent an assessment of market conditions at a specific point in time, are opinions only and should not be relied upon as investment advice regarding a particular investment or markets in general. Such information does not constitute a recommendation to buy or sell specific securities or investment vehicles. It should not be assumed that any investment will be profitable or will equal the performance of the Fund or any securities or any sectors mentioned in this letter. The subject matter contained in this letter has been derived from several sources believed to be reliable and accurate at the time of compilation. Neither Emerald Mutual Fund Advisors Trust nor the Fund accepts any liability for losses either direct or consequential caused by the use of this information.
The Emerald Insights Fund is distributed by ALPS Distributors, Inc.
| (1) | The Russell Midcap Growth Index measures the performance of the mid-cap growth segment of the U.S. equity universe. It includes those Russell Midcap Index companies with higher price-to-book ratios and higher forecasted growth values. As of June 30, 2014, the Russell Midcap Growth Index included securities issued by companies that ranged in size between $2.2 billion and $27.1 billion. The Index is not actively managed and does not reflect any deductions for fees, expenses or taxes. An investor may not invest directly into the Index. |
| (2) | Standard & Poor’s 500® Index is an unmanaged index of 500 common stocks chosen for the market size, liquidity and industry group representation. It is a market-value weighted index. The Index is not actively managed and does not reflect any deduction for fees, expenses or taxes. An investor may not invest directly into the Index. |
| (3) | Reflation is a fiscal or monetary policy, designed to expand a country’s output and curb the effects of deflation. |
| | |
Annual Report | April 30, 2015 | | 7 |
| | |
| Emerald Insights Fund | | Manager Commentary |
| | April 30, 2015 (Unaudited) |
| | | | | | |
| | | |
TOP TEN HOLDINGS (as a % of Net Assets)* | | | |
iShares® Russell Mid-Cap Growth ETF | | | 10.07% | | | |
| | | |
Affiliated Managers Group, Inc. | | | 2.10% | | | |
| | | |
Intrexon Corp. | | | 2.05% | | | |
| | | |
Fortinet, Inc. | | | 2.01% | | | |
| | | |
PacWest Bancorp | | | 2.01% | | | |
| | | |
Jarden Corp. | | | 1.83% | | | |
| | | |
Southwest Airlines Co. | | | 1.79% | | | |
| | | |
Wabtec Corp. | | | 1.76% | | | |
| | | |
Jack in the Box, Inc. | | | 1.64% | | | |
| | | |
Eagle Materials, Inc. | | | 1.63% | | | |
| | | |
Top Ten Holdings | | | 26.89% | | | |
| | | |
| |
INDUSTRY SECTOR ALLOCATION (as a % of Net Assets) | | | |
Consumer Discretionary | | | 23.71% | | | |
| | | |
Technology | | | 17.53% | | | |
| | | |
Health Care | | | 11.55% | | | |
| | | |
Financial Services | | | 10.18% | | | |
| | | |
MUTUAL FUNDS/ETF’S - Equity | | | 10.07% | | | |
| | | |
Producer Durables | | | 9.67% | | | |
| | | |
Energy | | | 6.03% | | | |
| | | |
Consumer Staples | | | 3.11% | | | |
| | | |
Materials & Processing | | | 2.95% | | | |
| | | |
Utilities | | | 0.36% | | | |
| | | |
Cash, Cash Equivalents,
& Other Net Assets | | | 4.84% | | | |
| | | |
* Holdings are subject to change. | | | |
| | | | | | |
| | | | | | |
| | | | | | |
| | | | | | |
| | | | | | |
| | | | | | |
| | | | | | |
| | | | | | |
| | | | | | |
| | | | | | |
| | | | | | |
| | | | | | |
| | | | | | |
| | | | | | |
| | | | | | |
| | | | | | |
| | | | | | |
| | | | | | |
| | | | | | |
| | | | | | |
| | | | | | |
| | | | | | |
| | | | | | |
| | | | | | |
| | | | | | |
| | | | | | |
| | | | | | |
| | | | | | |
| | | | | | |
| | | | | | |
GROWTH OF $10,000 INVESTMENT IN THE FUND (for the period ended April 30, 2015)
Comparison of change in value of a $10,000 investment (includes applicable sales loads)
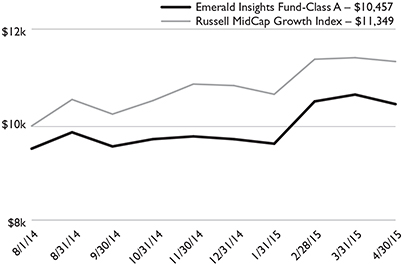
The chart represents historical performance of a hypothetical investment of $10,000 in the Fund since inception. Past performance does not guarantee future results. This chart does not reflect the deduction of taxes that a shareholder would pay on Fund distributions or the redemption of Fund shares.
| | | | | | | | | | |
AVERAGE ANNUAL TOTAL RETURN (for the period ended April 30, 2015) |
| | | | |
| | | | | | | | | Expense Ratio |
| | | 1 Month | | YTD | | Since Inception1 | | Gross2 | | Net2 |
Class A (NAV) | | -1.88% | | 7.54% | | 9.80% | | 1.89% | | 1.35% |
Class A (MOP) | | -6.55% | | 2.43% | | 4.57% | | 1.89% | | 1.35% |
Class C (NAV) | | -1.89% | | 7.37% | | 9.20% | | 2.54% | | 2.00% |
Class C (CDSC) | | -2.87% | | 6.37% | | 8.20% | | 2.54% | | 2.00% |
Investor Class | | -1.88% | | 7.56% | | 9.60% | | 1.94% | | 1.40% |
Institutional Class | | -1.79% | | 7.74% | | 10.00% | | 1.59% | | 1.05% |
Russell MidCap Growth Index† | | -0.70% | | 4.64% | | 13.49% | | | | |
The performance quoted represents past performance, does not guarantee future results and current performance may be lower or higher than the data quoted. The investment return and principal value of an investment will fluctuate so that shares, when redeemed, may be worth more or less than their original cost. Performance data current to the most recent month end may be obtained at www.emeraldmutualfunds.com.
Maximum Offering Price (MOP) for Class A shares includes the Fund’s maximum sales charge of 4.75%. Performance shown at NAV does not include these sales charges and would have been lower had it been taken into account.
A Contingent Deferred Sales Charge (CDSC) of 1.00% may apply to Class C shares redeemed within the first 12 months after a purchase.
| 1 | Inception Date – August 1, 2014. |
| 2 | Emerald Mutual Fund Advisers Trust (“Emerald” or the “Adviser”) has agreed contractually to waive a portion of its fees and reimburse other expenses until August 31, 2015 in amounts necessary to limit the Fund’s operating expenses (exclusive of Acquired Fund Fees and Expenses, brokerage expenses, interest expenses, taxes and extraordinary expense) for Class A, Class C, Institutional Class, and Investor Class shares to an annual rate (as percentage of the Fund’s average daily net assets) of 1.35%, 2.00%, 1.05% and 1.40% respectively. The Adviser will be permitted to recover, on a class-by-class basis, expenses it has borne through the agreement described above to the extent | |
| | |
8 | | www.emeraldmutualfunds.com |
| | |
| Emerald Insights Fund | | Manager Commentary |
| | April 30, 2015 (Unaudited) |
| | that the Fund’s expenses in later periods fall below the annual rates set forth in the relevant agreement. The Fund will not be obligated to pay any such deferred fees and expenses more than three years after the year(s) in which the fees and expense were incurred. The Adviser may not discontinue this waiver prior to August 31, 2015, without the approval by the Fund’s Board of Trustees. Ratios as of the Prospectus dated July 31, 2014 and may differ from the ratios presented in the Financial Highlights. |
| † | The Russell Midcap Growth Index measures the performance of the mid-cap growth segment of the U.S. equity universe. It includes those Russell Midcap Index companies with higher price-to-book ratios and higher forecasted growth values. As of June 30, 2014, the Russell Midcap Growth Index included securities issued by companies that ranged in size between $2.2 billion and $27.1 billion. The Index is not actively managed and does not reflect any deductions for fees, expenses or taxes. An investor may not invest directly into the Index. |
Important Risks
Investing in smaller companies generally will present greater investment risks, including: greater price volatility, greater sensitivity to changing economic conditions and less liquidity than the securities of larger, more mature companies.
| | |
Annual Report | April 30, 2015 | | 9 |
| | |
| Emerald Banking and Finance Fund | | Manager Commentary |
| | April 30, 2015 (Unaudited) |
April 30, 2015
Dear Shareholder:
Investment Results
The Emerald Bank & Finance Fund outperformed the Russell 2000 Index(1) for the 12 months ended April 30, 2015, returning +10.49% vs. 9.71% for the Index, though performing slightly less than the Russell 2000 Financial Services Index(2) which returned 10.93%. During the second half of the fiscal year, the SNL Small Cap U.S. Bank & Thrift Index(3) gained 1.16% versus a 4.40% gain delivered by the Standard & Poor’s 500 Index(4) and a gain of 4.65% for the Russell 2000 Index. The Emerald Banking and Finance Fund Class A (without sales load) however outperformed the Russell 2000 Index and the Standard & Poor’s 500 Index, having posted a 5.25% return.
The general consensus seems to be that the Federal Reserve (the “FED”) will slowly raise rates beginning in the second half of calendar 2015. In fact, we are aware of a number of banks that have increased their earnings guidance in anticipation of an increase in rates in the second half of 2015. Emerald believes this will expand the attractiveness of our bank and thrift holdings as the profitability of these banking models will be greatly increased. Loan growth has been exceptional in many of our holdings, and if we see greater spread income (the difference between the cost of deposits and the average lending rate for borrowers), the banks’ earnings estimates would have to be increased.
Investment Analysis
Loan growth trends for small community banks and thrifts have been strong in the first six months of 2015. In fact, the first quarter loan growth results for calendar 2015 were better than expected in what is usually a seasonally slow quarter and we believe that loan pipelines remain healthy. Earnings in the first quarter of 2015 also benefited from increased mortgage activity, driven by refinance volume, which we believe is likely to provide additional support as we enter the spring selling season.
Banks continued to deal with pressure on net interest margins in the first half of the year. We believe that net interest margin compression will continue in the second half of 2015 but at a slower pace. The big question remains however, when will interest rates begin to rise and if there is no move in rates/shape of the yield curve, can banks drive additional operating leverage?
As energy prices plummeted in the fiscal first half of the year, we have been monitoring energy loan portfolios closely. As anticipated, we have seen risk ratings being downgraded and energy related provisions increasing but we have seen very little energy charge offs and those we have witnessed have been related to the “servicers”. Management teams have informed us that energy borrowers have been working hard to navigate the reduced pricing environment through operational and balance sheet optimization. While we have not seen large amounts of charge offs related to energy loans, we have seen a substantial slow-down in the growth of bank energy loan portfolios as pay-downs have increased as borrowers attempt to remain in compliance with covenants.
We also would note an increase in branch optimization in the first half of the fiscal year as well as healthy merger and acquisition activity. According to (SNL Financial Data Dispatch, 4/28/2015), the U.S. saw 332 net bank and thrift branch closures in the first quarter of 2015 as banks continue to trim costs. For 2015, as of April 30, SNL counted 88 deal announcements in the banking sector with an aggregate disclosed deal value of $8.81 billion and a median price-to-tangible book ratio of 142.82%. During the same period in 2014, the sector saw 81 deal announcements with an aggregate disclosed deal value of $3.51 billion and a median price-to-tangible book ratio of 137.96%. (SNL Financial Data Dispatch, Bank M&A 2015 Deal Tracker, 5/6/2015)
Market Outlook
Recent comments by Federal Reserve Vice Chairman Fischer seem to have confirmed the outlook for an increase in the Fed Funds target range in 2015, while the FOMC removed “patient” from its guidance on the timing of its initial increase. General consensus is that the Fed will slowly raise rates beginning in the second half of 2015 and continue raising rates through 2016. We believe that the Fed will begin raising rates in the third quarter of 2015 by 25 basis points(5) and will continue to raise rates by 25 basis points per calendar quarter through year end 2016. Currently most banks that we meet with claim to be asset sensitive to some degree and thus well positioned for a rising rate environment. The “wild card” in our opinion will be deposits. The cost of deposits have been at historically low rates for a prolonged period of time and no one really knows what will happen as rates rise from such a low base. We believe that Banks should be taking some short term pain and paying a bit more to lock in longer term funding at these historically low rates. While a steepening yield curve can be a positive catalyst for bank stocks, particularly if it is a precursor to stronger economic activity, we believe an increase in short-term rates will be more beneficial to revenue and EPS growth. The one-month and three-month LIBOR rates, which are tied to banks’ variable rate commercial and industrial (C&I) loans, have remained essentially flat since the end of 2013 and are near absolute lows. We believe these short term rates are highly correlated(6) with the effective Fed Fund rate. With the consensus and our expectations for an initial increase in the Fed Fund rate in the fall of 2015, we believe one and three-month LIBOR rates will begin to rise in the second half of 2015. Thus leading to increased earnings growth for the bank sector.
| | |
10 | | www.emeraldmutualfunds.com |
| | |
| Emerald Banking and Finance Fund | | Manager Commentary |
| | April 30, 2015 (Unaudited) |
We believe that the market remains in the early stages of a long term recovery in bank stocks and remain confident in our expectations for improved fundamentals and continued consolidation amongst the small-to-mid capitalization bank and thrift stocks. With the first half of the fiscal year behind us, our focus remains on companies capable of producing above average organic growth, relatively stable net interest margins, and improving earnings power aided by lower efficiency ratios, with potential for accretive M&A activity. This type of “stock pickers market” falls directly into the strengths of Emerald’s Ten Step Research Process and this combined with any increase in short term interest rates which are more directly beneficial to revenue growth at community banks as many variable rate C&I loans are indexed off short term LIBOR will provide momentum for the Emerald Banking and Finance Fund in 2015.
| | | | |
Top Five Contributors to Return Included | | Top Five Detractors to Return Included | | |
Bank of the Ozarks, Inc. | | Independent Bank Group, Inc. | | |
AmTrust Financial Services Inc. | | Texas Capital Bancshares, Inc. | | |
PacWest Bancorp | | Flagstar Bancorp, Inc. | | |
Diamond Resorts International, Inc. | | On Deck Capital, Inc. | | |
SVB Financial Group | | Meta Financial Group, Inc. | | |
| | |

| | 
| | |
Kenneth G. Mertz II, CFA | | Steven E. Russell, Esq. | | |
Chief Investment Officer | | Portfolio Manager | | |
Portfolio Manager | | | | |
Emerald Mutual Fund Advisers Trust
The views and information discussed in this commentary are as of the date of publication, are subject to change, and may not reflect the writer’s current views. The views expressed represent an assessment of market conditions at a specific point in time, are opinions only and should not be relied upon as investment advice regarding a particular investment or markets in general. Such information does not constitute a recommendation to buy or sell specific securities or investment vehicles. It should not be assumed that any investment will be profitable or will equal the performance of the Fund or any securities or any sectors mentioned in this letter. The subject matter contained in this letter has been derived from several sources believed to be reliable and accurate at the time of compilation. Neither Emerald Mutual Fund Advisors Trust nor the Fund accepts any liability for losses either direct or consequential caused by the use of this information.
| The | Emerald Banking and Finance Fund is distributed by ALPS Distributors, Inc. |
| (1) | Russell 2000® Index measures the performance of the small-cap segment of the U.S. equity universe. The Russell 2000® Index is a subset of the Russell 3000® Index representing approximately 10% of the total market capitalization of that index. It includes approximately 2000 of the smallest securities based on a combination of their market cap and current index membership. The Index is not actively managed and does not reflect any deduction of fees, expenses or taxes. An investor may not invest directly into the Index. |
| (2) | Russell 2000® Financial Services Index – is comprised of the smallest financial services companies in the Russell 3000 Index. The Index is not actively managed and does not reflect any deductions for fees, expense, or taxes. An investor may not invest directly in the Index. |
| (3) | SNL Small Cap Bank & Thrift Index: Includes all publicly traded (NYSE, NYSE MKT, NASDAQ, OTC) Banks and Thrifts in SNL’s coverage universe with $250M to $1B Total Common Market Capitalization as of most recent pricing data. Source: SNL Financial, data as of May 19, 2015. |
| (4) | Standard & Poor’s 500® Index is an unmanaged index of 500 common stocks chosen for the market size, liquidity and industry group representation. It is a market-value weighted index. The Index is not actively managed and does not reflect any deduction for fees, expenses or taxes. An investor may not invest directly into the Index. |
| (5) | Basis Point is a common unit of measure for interest rates and other percentages in finance. One basis point is equal to 1/100th of 1%, or 0.01% (0.0001). |
| (6) | Correlation is a statistical measure of how an index moves in relation to another index or model portfolio. A correlation ranges from -1 to 1. A correlation of 1 means the two indexes have moved in lockstep with each other. A correlation of -1 means the two indexes have moved in exactly the opposite direction. |
| | |
Annual Report | April 30, 2015 | | 11 |
| | |
| Emerald Banking and Finance Fund | | Manager Commentary |
| | April 30, 2015 (Unaudited) |
| | | | | | |
TOP TEN HOLDINGS (as a % of Net Assets)* | | | |
| | |
Bank of the Ozarks, Inc. | | | 3.59% | | | |
| | | |
California Republic Bancorp | | | 3.38% | | | |
| | | |
PacWest Bancorp | | | 3.22% | | | |
| | | |
Signature Bank | | | 2.98% | | | |
| | | |
SVB Financial Group | | | 2.83% | | | |
| | | |
ConnectOne Bancorp, Inc. | | | 2.55% | | | |
| | | |
Customers Bancorp, Inc. | | | 2.45% | | | |
| | | |
FCB Financial Holdings, Inc., Class A | | | 2.21% | | | |
| | | |
BankUnited, Inc. | | | 2.18% | | | |
| | | |
Eagle Bancorp, Inc. | | | 2.15% | | | |
| | | |
Top Ten Holdings | | | 27.54% | | | |
| | | |
| | | | | | |
INDUSTRY SECTOR ALLOCATION (as a % of Net Assets) | | | |
| | |
Banks: Diversified | | | 74.28% | | | |
| | | |
Banks: Savings, Thrift & Mortgage Lending | | | 7.56% | | | |
| | | |
Commercial Banks | | | 5.30% | | | |
| | | |
Insurance: Property-Casualty | | | 3.15% | | | |
| | | |
Diversified Financial Services | | | 2.64% | | | |
| | | |
Consumer Lending | | | 1.81% | | | |
| | | |
Real Estate Investment Trusts (REITs) | | | 1.31% | | | |
| | | |
Insurance | | | 0.90% | | | |
| | | |
Financial Data & Services | | | 0.60% | | | |
| | | |
Asset Management & Custodian | | | 0.54% | | | |
| | | |
Real Estate Management & Development | | | 0.49% | | | |
| | | |
Commercial Finance & Mortgage Companies | | | 0.43% | | | |
| | | |
Securities Brokerage & Services | | | 0.17% | | | |
| | | |
Cash, Cash Equivalents, & Other Net Assets | | | 0.82% | | | |
| | | |
| | |
* Holdings are subject to change. | | | | | | |
| | | | | | |
| | | | | | |
| | | | | | |
| | | | | | |
| | | | | | |
| | | | | | |
| | | | | | |
| | | | | | |
| | | | | | |
| | | | | | |
| | | | | | |
| | | | | | |
| | | | | | |
| | | | | | |
| | | | | | |
| | | | | | |
| | | | | | |
| | | | | | |
| | | | | | |
| | | | | | |
| | | | | | |
| | | | | | |
| | | | | | |
| | | | | | |
GROWTH OF $10,000 INVESTMENT IN THE FUND (for the period ended April 30, 2015)
Comparison of change in value of a $10,000 investment (includes applicable sales loads)
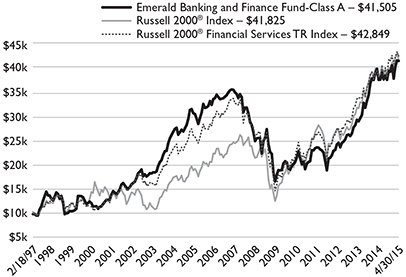
The chart represents historical performance of a hypothetical investment of $10,000 in the Fund since inception. Past performance does not guarantee future results. This chart does not reflect the deduction of taxes that a shareholder would pay on Fund distributions or the redemption of Fund shares.
AVERAGE ANNUAL TOTAL RETURN (for the period ended April 30, 2015)
| | | | | | | | | | | | | | | | | | | | | | | | | | | | |
| | | | | | | | | | | | | | | Since | | | Expense Ratio | |
| | | 1 Year | | | 3 Year | | | 5 Year | | | 10 Year | | | Inception1 | | | Gross2 | | | Net2 | |
Class A (NAV) | | | 10.49% | | | | 19.37% | | | | 12.90% | | | | 3.88% | | | | 8.43% | | | | 1.72% | | | | 1.72% | |
Class A (MOP) | | | 5.25% | | | | 17.44% | | | | 11.81% | | | | 3.38% | | | | 8.14% | | | | 1.72% | | | | 1.72% | |
Russell 2000® Index† | | | 9.71% | | | | 15.87% | | | | 12.73% | | | | 9.18% | | | | 8.18% | | | | | | | | | |
Russell 2000® Financial Services TR Index†† | | | 10.93% | | | | 15.74% | | | | 11.53% | | | | 5.68% | | | | 8.33% | | | | | | | | | |
Class C (NAV) | | | 9.77% | | | | 18.60% | | | | 12.20% | | | | 3.24% | | | | 8.59% | | | | 2.38% | | | | 2.38% | |
Class C (CDSC) | | | 8.77% | | | | 18.60% | | | | 12.20% | | | | 3.24% | | | | 8.59% | | | | 2.38% | | | | 2.38% | |
Russell 2000® Index† | | | 9.71% | | | | 15.87% | | | | 12.73% | | | | 9.18% | | | | 7.37% | | | | | | | | | |
Russell 2000® Financial Services TR Index†† | | | 10.93% | | | | 15.74% | | | | 11.53% | | | | 5.68% | | | | 9.39% | | | | | | | | | |
Investor Class | | | 10.52% | | | | 19.37% | | | | 11.92% | | | | – | | | | 12.89% | | | | 1.69% | | | | 1.69% | |
Russell 2000® Index† | | | 9.71% | | | | 15.87% | | | | 12.73% | | | | 9.18% | | | | 13.60% | | | | | | | | | |
Russell 2000® Financial Services TR Index†† | | | 10.93% | | | | 15.74% | | | | 11.53% | | | | 5.68% | | | | 12.59% | | | | | | | | | |
Institutional Class | | | 10.88% | | | | 19.79% | | | | – | | | | – | | | | 19.24% | | | | 1.37% | | | | 1.37% | |
Russell 2000® Index† | | | 9.71% | | | | 15.87% | | | | 12.73% | | | | 9.18% | | | | 14.37% | | | | | | | | | |
Russell 2000® Financial Services TR Index†† | | | 10.93% | | | | 15.74% | | | | 11.53% | | | | 5.68% | | | | 15.01% | | | | | | | | | |
| | |
12 | | www.emeraldmutualfunds.com |
| | |
| Emerald Banking and Finance Fund | | Manager Commentary |
| | April 30, 2015 (Unaudited) |
The performance quoted represents past performance, does not guarantee future results and current performance may be lower or higher than the data quoted. The investment return and principal value of an investment will fluctuate so that shares, when redeemed, may be worth more or less than their original cost. Performance data current to the most recent month end may be obtained at www.emeraldmutualfunds.com.
Performance shown for periods prior to March 16, 2012, reflects the performance of the Forward Banking & Finance Fund, a series of Forward Funds (as a result of a reorganization of the Forward Banking & Finance Fund into the Emerald Banking & Finance Fund).
Maximum Offering Price (MOP) for Class A shares includes the Fund’s maximum sales charge of 4.75%. Performance shown at NAV does not include these sales charges and would have been lower had it been taken into account.
A Contingent Deferred Sales Charge (CDSC) of 1.00% may apply to Class C shares redeemed within the first 12 months after a purchase.
| 1 | Inception Dates - Class A: 02/18/1997, Class C: 07/01/2000, Class Institutional: 03/19/2012, Class Investor: 03/16/2010 |
| 2 | Emerald Mutual Fund Advisers Trust (“Emerald” or the “Adviser”) has agreed contractually to waive a portion of its fees and reimburse other expenses until August 31, 2014 in amounts necessary to limit the Fund’s operating expenses (exclusive of Acquired Fund Fees and Expenses, brokerage expenses, interest expenses, taxes and extraordinary expense) for Class A, Class C, Institutional Class, and Investor Class shares to an annual rate (as percentage of the Fund’s average daily net assets) of 1.84%, 2.49%, 1.54% and 1.89% respectively. The Adviser will be permitted to recover, on a class-by-class basis, expenses it has borne through the agreement described above to the extent that the Fund’s expenses in later periods fall below the annual rates set forth in the relevant agreement. The Fund will not be obligated to pay any such deferred fees and expenses more than three years after the year(s) in which the fees and expense were incurred. The Adviser may not discontinue this waiver prior to August 31, 2014, without the approval by the Fund’s Board of Trustees. Ratios as of the Prospectus dated August 31, 2014 and may differ from the ratios presented in the Financial Highlights. |
| † | The Russell 2000® Index measures the performance of the small-cap segment of the U.S. equity universe. The Russell 2000® is a subset of the Russell 3000® Index representing approximately 10% of the total market capitalization of that index. It includes approximately 2000 of the smallest securities based on a combination of their market cap and current index membership. The index is not actively managed and does not reflect any deductions for fees, expenses or taxes. An investor may not invest directly into an index. |
| †† | The Russell 2000® Financial Services TR Index is comprised of the smallest financial services companies in the Russell 3000 Index. The Index is not actively managed and does not reflect any deductions for fees, expense, or taxes. An investor may not invest directly in the Index. |
Important Risks
A fund that concentrates in a particular industry will involve a greater degree of risk than a fund with a more diversified portfolio. Investing in smaller companies generally will present greater investment risks, including: greater price volatility, greater sensitivity to changing economic conditions and less liquidity than the securities of larger, more mature companies.
| | |
Annual Report | April 30, 2015 | | 13 |
| | |
| Emerald Funds | | Disclosure of Fund Expenses |
| | April 30, 2015 (Unaudited) |
As a shareholder of the Funds, you incur two types of costs: (1) transaction costs, including applicable sales charges (loads); and (2) ongoing costs, including management fees, distribution and service (12b-1) fees, shareholder services fees and other Fund expenses. This example is intended to help you understand your ongoing costs (in dollars) of investing in the Funds and to compare these costs with the ongoing costs of investing in other mutual funds. The example is based on an investment of $1,000 invested at the beginning of the (six-month) period and held for the entire period November 1, 2014 through April 30, 2015.
Actual Expenses
The first line for each share class of each Fund in the table provides information about actual account values and actual expenses. You may use this information, together with the amount you invested, to estimate the expenses that you paid over the period. Simply divide your account value by $1,000 (for example, an $8,600 account value divided by $1,000 = 8.6), then multiply the result by the number in the applicable line under the heading entitled “Expenses Paid During Period” to estimate the expenses you paid on your account during this period.
Hypothetical Example For Comparison Purposes
The second line for each share class of each Fund in the table below provides information about hypothetical account values and hypothetical expenses based on the Fund’s actual expense ratio and an assumed rate of return of 5% per year before expenses, which is not the Fund’s actual return. The hypothetical account values and expenses may not be used to estimate the actual ending account balance or expenses you paid for the period. You may use this information to compare the ongoing costs of investing in the Funds and other funds. To do so, compare this 5% hypothetical example with the 5% hypothetical examples that appear in the shareholder reports of other funds.
Please note that the expenses shown in the table below are meant to highlight your ongoing costs only and do not reflect any transactional costs, such as sales charges (loads), redemption fees or exchange fees. Therefore, the second line for each share class of each Fund within the table is useful in comparing ongoing costs only, and will not help you determine the relative total costs of owning different funds. If these transactional costs were included, your costs would have been higher.
| | | | | | | | |
| Emerald Growth Fund | | Beginning Account Value 11/01/14 | | Ending
Account Value
04/30/15 | | Expense
Ratio(a) | | Expense Paid
During Period
11/01/14 - 4/30/15(b) |
Class A | | | | | | | | |
Actual | | $ 1,000.00 | | $ 1,114.90 | | 1.29% | | $ 6.76 |
Hypothetical (5% return before expenses) | | $ 1,000.00 | | $ 1,018.40 | | 1.29% | | $ 6.46 |
| | | | | | | | | |
Class C | | | | | | | | |
Actual | | $ 1,000.00 | | $ 1,110.80 | | 1.94% | | $ 10.15 |
Hypothetical (5% return before expenses) | | $ 1,000.00 | | $ 1,015.17 | | 1.94% | | $ 9.69 |
| | | | | | | | | |
Institutional Class | | | | | | | | |
Actual | | $ 1,000.00 | | $ 1,116.40 | | 0.99% | | $ 5.20 |
Hypothetical (5% return before expenses) | | $ 1,000.00 | | $ 1,019.89 | | 0.99% | | $ 4.96 |
| | | | | | | | | |
Investor Class | | | | | | | | |
Actual | | $ 1,000.00 | | $ 1,115.20 | | 1.20% | | $ 6.29 |
Hypothetical (5% return before expenses) | | $ 1,000.00 | | $ 1,018.84 | | 1.20% | | $ 6.01 |
| | |
14 | | www.emeraldmutualfunds.com |
| | |
| Emerald Funds | | Disclosure of Fund Expenses |
| | April 30, 2015 (Unaudited) |
| | | | | | | | |
| Emerald Insights Fund | | Beginning
Account Value
11/01/14 | | Ending
Account Value
04/30/15 | | Expense
Ratio(a) | | Expense Paid During Period 11/01/14 - 4/30/15(b) |
Class A | | | | | | | | |
Actual | | $ 1,000.00 | | $ 1,075.40 | | 1.35% | | $ 6.95 |
Hypothetical (5% return before expenses) | | $ 1,000.00 | | $ 1,018.10 | | 1.35% | | $ 6.76 |
| | | | | | | | | |
Class C | | | | | | | | |
Actual | | $ 1,000.00 | | $ 1,072.70 | | 2.00% | | $ 10.28 |
Hypothetical (5% return before expenses) | | $ 1,000.00 | | $ 1,014.88 | | 2.00% | | $ 9.99 |
| | | | | | | | | |
Institutional Class | | | | | | | | |
Actual | | $ 1,000.00 | | $ 1,076.40 | | 1.05% | | $ 5.41 |
Hypothetical (5% return before expenses) | | $ 1,000.00 | | $ 1,019.59 | | 1.05% | | $ 5.26 |
| | | | | | | | | |
Investor Class | | | | | | | | |
Actual | | $ 1,000.00 | | $ 1,075.60 | | 1.40% | | $ 7.20 |
Hypothetical (5% return before expenses) | | $ 1,000.00 | | $ 1,017.85 | | 1.40% | | $ 7.00 |
| | | | | | | | |
| | | | |
| Emerald Banking and Finance Fund | | Beginning
Account Value
11/01/14 | | Ending
Account Value
04/30/15 | | Expense
Ratio(a) | | Expense Paid
During Period
11/01/14 - 4/30/15(b) |
Class A | | | | | | | | |
Actual | | $ 1,000.00 | | $ 1,052.90 | | 1.60% | | $ 8.14 |
Hypothetical (5% return before expenses) | | $ 1,000.00 | | $ 1,016.86 | | 1.60% | | $ 8.00 |
| | | | | | | | | |
Class C | | | | | | | | |
Actual | | $ 1,000.00 | | $ 1,049.70 | | 2.25% | | $ 11.43 |
Hypothetical (5% return before expenses) | | $ 1,000.00 | | $ 1,013.64 | | 2.25% | | $ 11.23 |
| | | | | | | | | |
Institutional Class | | | | | | | | |
Actual | | $ 1,000.00 | | $ 1,055.00 | | 1.25% | | $ 6.37 |
Hypothetical (5% return before expenses) | | $ 1,000.00 | | $ 1,018.60 | | 1.25% | | $ 6.26 |
| | | | | | | | | |
Investor Class | | | | | | | | |
Actual | | $ 1,000.00 | | $ 1,053.40 | | 1.52% | | $ 7.74 |
Hypothetical (5% return before expenses) | | $ 1,000.00 | | $ 1,017.26 | | 1.52% | | $ 7.60 |
| (a) | The Fund’s expense ratios have been based on the Fund’s most recent fiscal half-year expenses. |
| (b) | Expenses are equal to the Fund’s annualized expense ratio multiplied by the average account value over the period, multiplied by the number of days in the most recent fiscal half-year (181)/365 (to reflect the half-year period). |
| | |
Annual Report | April 30, 2015 | | 15 |
| | |
| Emerald Growth Fund | | Schedule of Investments |
| | April 30, 2015 |
| | | | | | | | |
| Shares | | | | | Value (Note 2) | |
| COMMON STOCKS: 96.69% | |
| Consumer Discretionary: 15.09% | |
| | 188,880 | | | American Eagle Outfitters, Inc. | | $ | 3,005,081 | |
| | 57,152 | | | Black Diamond, Inc.(a) | | | 514,940 | |
| | 86,890 | | | Brunswick Corp. | | | 4,347,976 | |
| | 38,040 | | | Burlington Stores, Inc.(a) | | | 1,961,723 | |
| | 281,770 | | | Chegg, Inc.(a) | | | 2,093,551 | |
| | 207,410 | | | Christopher & Banks Corp.(a) | | | 1,232,015 | |
| | 103,793 | | | Chuy’s Holdings, Inc.(a) | | | 2,347,798 | |
| | 89,087 | | | Dave & Buster’s Entertainment,
Inc.(a) | | | 2,808,022 | |
| | 215,488 | | | Diversified Restaurant Holdings, Inc.(a) | | | 786,531 | |
| | 52,180 | | | Ethan Allen Interiors, Inc. | | | 1,263,800 | |
| | 39,559 | | | Five Below, Inc.(a) | | | 1,333,929 | |
| | 111,380 | | | HomeAway, Inc.(a) | | | 3,113,071 | |
| | 54,271 | | | Jack in the Box, Inc. | | | 4,709,095 | |
| | 70,319 | | | Malibu Boats, Inc., Class A(a) | | | 1,488,653 | |
| | 40,564 | | | Marcus Corp. | | | 785,725 | |
| | 158,133 | | | MarineMax, Inc.(a) | | | 3,491,577 | |
| | 19,670 | | | Matthews International Corp., Class A | | | 954,585 | |
| | 39,485 | | | Pandora Media, Inc.(a) | | | 704,412 | |
| | 53,042 | | | Red Robin Gourmet Burgers, Inc.(a) | | | 3,982,924 | |
| | 74,038 | | | Rentrak Corp.(a) | | | 3,509,401 | |
| | 87,550 | | | Scientific Games Corp.,
Class A(a) | | | 1,109,258 | |
| | 256,415 | | | Sequential Brands Group,
Inc.(a) | | | 3,179,546 | |
| | 22,270 | | | Steven Madden Ltd.(a) | | | 868,975 | |
| | 94,465 | | | Tilly’s, Inc., Class A(a) | | | 1,260,163 | |
| | | | | | | 50,852,751 | |
| | | | | | | | | |
| Consumer Staples: 0.19% | |
| | 65,520 | | | Inventure Foods, Inc.(a) | | | 638,820 | |
| | | | | | | | | |
| Energy: 2.18% | |
| | 31,989 | | | Diamondback Energy, Inc.(a) | | | 2,641,332 | |
| | 128,540 | | | Enphase Energy, Inc.(a) | | | 1,615,748 | |
| | 19,890 | | | Gulfport Energy Corp.(a) | | | 973,417 | |
| | 82,980 | | | Sanchez Energy Corp.(a) | | | 1,218,976 | |
| | 73,880 | | | Synergy Resources Corp.(a) | | | 885,082 | |
| | | | | | | 7,334,555 | |
| | | | | | | | | |
| Financial Services: 15.50% | |
| | 42,921 | | | AmTrust Financial Services, Inc. | | | 2,552,512 | |
| | 56,223 | | | Atlas Financial Holdings, Inc.(a) | | | 1,037,314 | |
| | 150,424 | | | Bank of the Ozarks, Inc. | | | 5,830,434 | |
| | 25,380 | | | Bofl Holding, Inc.(a) | | | 2,330,138 | |
| | 87,000 | | | California Republic Bancorp(a) | | | 2,414,250 | |
| | 196,212 | | | CoBiz Financial, Inc. | | | 2,356,506 | |
| | 116,564 | | | ConnectOne Bancorp, Inc. | | | 2,240,360 | |
| | 77,033 | | | Customers Bancorp, Inc.(a) | | | 1,942,002 | |
| | 114,411 | | | FCB Financial Holdings, Inc., Class A(a) | | | 3,061,638 | |
| | 100,034 | | | First NBC Bank Holding Co.(a) | | | 3,519,196 | |
| | 118,203 | | | Howard Bancorp, Inc.(a) | | | 1,643,022 | |
| | 78,300 | | | Ladder Capital Corp., REIT,
Class A | | | 1,373,382 | |
| | 61,410 | | | LendingTree, Inc.(a) | | | 3,379,392 | |
| | | | | | | | |
| Shares | | | | | Value (Note 2) | |
| Financial Services (continued) | |
| | 49,261 | | | Marcus & Millichap, Inc.(a) | | $ | 1,742,854 | |
| | 28,125 | | | National Commerce Corp.(a) | | | 617,344 | |
| | 143,040 | | | Opus Bank | | | 4,477,152 | |
| | 78,444 | | | Pacific Premier Bancorp, Inc.(a) | | | 1,228,433 | |
| | 62,400 | | | PacWest Bancorp | | | 2,814,240 | |
| | 71,208 | | | Peoples Bancorp, Inc. | | | 1,651,314 | |
| | 14,740 | | | Pinnacle Financial Partners, Inc. | | | 702,361 | |
| | 18,257 | | | South State Corp. | | | 1,236,364 | |
| | 34,970 | | | Virtu Financial, Inc., Class A(a) | | | 748,008 | |
| | 172,860 | | | Walker & Dunlop, Inc.(a) | | | 3,308,541 | |
| | | | | | | 52,206,757 | |
| | | | | | | | | |
| Health Care: 22.02% | |
| | 24,230 | | | Abaxis, Inc. | | | 1,550,720 | |
| | 95,561 | | | Acadia Healthcare Co.,
Inc.(a) | | | 6,545,928 | |
| | 129,633 | | | Adamas Pharmaceuticals,
Inc.(a) | | | 2,238,762 | |
| | 90,000 | | | Akebia Therapeutics, Inc.(a) | | | 690,300 | |
| | 76,691 | | | Akorn, Inc.(a) | | | 3,193,413 | |
| | 186,179 | | | Amicus Therapeutics, Inc.(a) | | | 1,872,961 | |
| | 100,450 | | | AtriCure, Inc.(a) | | | 2,210,904 | |
| | 27,370 | | | Avalanche Biotechnologies, Inc.(a) | | | 872,008 | |
| | 44,760 | | | Bellicum Pharmaceuticals,
Inc.(a) | | | 1,073,345 | |
| | 18,040 | | | Bluebird Bio, Inc.(a) | | | 2,402,748 | |
| | 29,810 | | | Cantel Medical Corp. | | | 1,335,190 | |
| | 100,000 | | | Catalyst Pharmaceutical Partners, Inc.(a) | | | 316,000 | |
| | 57,101 | | | Cepheid(a) | | | 3,203,366 | |
| | 183,062 | | | Depomed, Inc.(a) | | | 4,258,022 | |
| | 24,319 | | | Dicerna Pharmaceuticals,
Inc.(a) | | | 488,082 | |
| | 85,684 | | | Horizon Pharma Plc(a) | | | 2,409,434 | |
| | 80,587 | | | Inogen, Inc.(a) | | | 2,960,766 | |
| | 115,190 | | | Insmed, Inc.(a) | | | 2,308,408 | |
| | 11,320 | | | Intercept Pharmaceuticals,
Inc.(a) | | | 2,861,809 | |
| | 106,479 | | | Intrexon Corp.(a) | | | 4,134,580 | |
| | 136,649 | | | K2M Group Holdings, Inc.(a) | | | 2,870,995 | |
| | 24,961 | | | LDR Holding Corp.(a) | | | 844,930 | |
| | 57,029 | | | LeMaitre Vascular, Inc. | | | 516,683 | |
| | 90,326 | | | MacroGenics, Inc.(a) | | | 2,584,227 | |
| | 39,110 | | | Marinus Pharmaceuticals,
Inc.(a) | | | 347,297 | |
| | 103,410 | | | Neurocrine Biosciences, Inc.(a) | | | 3,525,247 | |
| | 104,524 | | | Portola Pharmaceuticals,
Inc.(a) | | | 3,730,462 | |
| | 110,000 | | | Presbia Plc(a) | | | 880,000 | |
| | 5,883 | | | Puma Biotechnology, Inc.(a) | | | 1,062,352 | |
| | 18,412 | | | Ultragenyx Pharmaceutical, Inc.(a) | | | 1,038,989 | |
| | 57,960 | | | Veeva Systems, Inc.,
Class A(a) | | | 1,538,838 | |
| | 46,570 | | | WellCare Health Plans, Inc.(a) | | | 3,605,915 | |
| | 55,000 | | | Zafgen, Inc.(a) | | | 1,711,600 | |
| | 139,890 | | | ZIOPHARM Oncology, Inc.(a) | | | 1,232,431 | |
| | 46,640 | | | ZS Pharma, Inc.(a) | | | 1,775,585 | |
| | | | | | | 74,192,297 | |
| | |
16 | | www.emeraldmutualfunds.com |
| | |
| Emerald Growth Fund | | Schedule of Investments |
| | April 30, 2015 |
| |
| | |
| | | | | | |
| Shares | | | | Value (Note 2) | |
Materials & Processing: 5.30% | |
9,290 | | Acuity Brands, Inc. | | | $1,550,965 | |
135,256 | | Apogee Enterprises, Inc. | | | 7,117,171 | |
27,750 | | Installed Building Products, Inc.(a) | | | 577,478 | |
85,000 | | Mueller Water Products, Inc., Class A | | | 795,600 | |
65,808 | | PolyOne Corp. | | | 2,569,802 | |
112,184 | | Trex Co., Inc.(a) | | | 5,263,673 | |
| | | | | 17,874,689 | |
| | | | | | | |
Producer Durables: 11.70% | |
55,473 | | Adept Technology, Inc.(a) | | | 338,940 | |
72,174 | | Astronics Corp.(a) | | | 4,858,032 | |
13,760 | | Badger Meter, Inc. | | | 856,147 | |
95,258 | | FARO Technologies, Inc.(a) | | | 3,794,126 | |
62,491 | | H&E Equipment Services, Inc. | | | 1,544,778 | |
32,830 | | HEICO Corp. | | | 1,833,227 | |
181,493 | | Kforce, Inc. | | | 4,127,151 | |
110,002 | | Knoll, Inc. | | | 2,504,746 | |
40,790 | | Korn/Ferry International | | | 1,286,109 | |
75,000 | | Neff Corp., Class A(a) | | | 885,000 | |
114,662 | | Roadrunner Transportation Systems, Inc.(a) | | | 2,805,779 | |
113,673 | | Spirit Airlines, Inc.(a) | | | 7,783,190 | |
33,645 | | Tennant Co. | | | 2,163,037 | |
147,827 | | Tutor Perini Corp.(a) | | | 3,133,932 | |
52,040 | | Virgin America, Inc.(a) | | | 1,495,630 | |
| | | | | 39,409,824 | |
| | | | | | | |
Technology: 23.48% | |
245,536 | | ARC Document Solutions, Inc.(a) | | | 2,096,877 | |
55,566 | | Cavium, Inc.(a) | | | 3,600,121 | |
158,890 | | ChannelAdvisor Corp.(a) | | | 1,625,445 | |
72,040 | | Ciena Corp.(a) | | | 1,534,452 | |
105,441 | | EPAM Systems, Inc.(a) | | | 6,823,087 | |
87,529 | | Everyday Health, Inc.(a) | | | 1,073,106 | |
68,212 | | Gigamon, Inc.(a) | | | 2,007,479 | |
571,357 | | Glu Mobile, Inc.(a) | | | 3,862,373 | |
192,570 | | GTT Communications, Inc.(a) | | | 3,516,328 | |
47,930 | | Guidewire Software, Inc.(a) | | | 2,394,104 | |
134,350 | | Imperva, Inc.(a) | | | 6,129,047 | |
92,524 | | Inphi Corp.(a) | | | 1,984,640 | |
54,819 | | IPG Photonics Corp.(a) | | | 4,855,867 | |
31,210 | | Methode Electronics, Inc. | | | 1,325,177 | |
138,305 | | Microsemi Corp.(a) | | | 4,613,855 | |
25,475 | | MicroStrategy, Inc., Class A(a) | | | 4,639,507 | |
167,540 | | Model N, Inc.(a) | | | 1,968,595 | |
20,027 | | PDF Solutions, Inc.(a) | | | 361,888 | |
122,720 | | Pixelworks, Inc.(a) | | | 570,648 | |
88,950 | | Proofpoint, Inc.(a) | | | 4,801,521 | |
133,627 | | Qlik Technologies, Inc.(a) | | | 4,648,883 | |
150,754 | | Reis, Inc. | | | 3,426,638 | |
72,720 | | Super Micro Computer, Inc.(a) | | | 2,092,154 | |
7,930 | | Synaptics, Inc.(a) | | | 671,830 | |
| | | | | | |
| Shares | | | | Value (Note 2) | |
Technology (continued) | |
75,810 | | Synchronoss Technologies, Inc.(a) | | | $3,478,163 | |
105,856 | | Telenav, Inc.(a) | | | 884,956 | |
24,660 | | Ultimate Software Group,
Inc.(a) | | | 4,098,985 | |
| | | | | 79,085,726 | |
| | |
| | | | | | | |
Utilities: 1.23% | |
227,338 | | 8x8, Inc.(a) | | | 1,984,661 | |
464,030 | | Vonage Holdings Corp.(a) | | | 2,148,459 | |
| | | | | 4,133,120 | |
| | |
| | | | | | |
| | Total Common Stocks (Cost $257,988,812) | | | 325,728,539 | |
| | |
| | | | | | | |
WARRANTS: 0.00% | |
41,894 | | Magnum Hunter Resources Corp., Strike Price $8.50 (Expiring 04/15/16)(a) | | | 0 | |
| | |
| | | | | | |
| | Total Warrants (Cost $0) | | | 0 | |
| | |
| | | | | | | |
SHORT TERM INVESTMENTS: 2.70% | |
9,098,235 | | Dreyfus Government Cash Management Fund - Institutional Class
0.010% (7-Day Yield) | | | 9,098,235 | |
| | |
| | | | | | |
| | | Total Short Term Investments (Cost $9,098,235) | | | 9,098,235 | |
| | |
| | | | | | |
Total Investments: 99.39% (Cost $267,087,047) | | | 334,826,774 | |
| | |
| | | | | | |
Other Assets In Excess Of Liabilities: 0.61% | | | 2,052,684 | |
Net Assets: 100.00% | | | $336,879,458 | |
| | | | | | | |
| (a) | Non-income producing security. |
Investment Abbreviations:
Ltd. - Limited.
Plc - Public limited company.
REIT - Real Estate Investment Trust.
Holdings are subject to change.
| | |
Annual Report | April 30, 2015 | | 17 |
| | |
| Emerald Growth Fund | | Schedule of Investments |
| | April 30, 2015 |
For Fund compliance purposes, the Fund’s industry classifications refer to any one or more of the industry sub-classifications used by one or more widely recognized market indexes or ratings group indexes, and/or as defined by Fund management. This definition may not apply for purposes of this report, which may combine industry sub-classifications for reporting ease. Industries are shown as a percentage of net assets.
See Notes to Financial Statements.
| | |
18 | | www.emeraldmutualfunds.com |
| | |
| Emerald Insights Fund | | Schedule of Investments |
| | April 30, 2015 |
| | | | | | | | | | |
| Shares | | | | | Value (Note 2) | |
COMMON STOCKS: 84.15% | |
Consumer Discretionary: 23.70% | |
| | | 1,346 | | | Avis Budget Group, Inc.(a) | | $ | 72,872 | |
| | | 1,215 | | | BorgWarner, Inc. | | | 71,928 | |
| | | 2,072 | | | Brunswick Corp. | | | 103,683 | |
| | | 52 | | | Chipotle Mexican Grill, Inc.(a) | | | 32,310 | |
| | | 449 | | | Deckers Outdoor Corp.(a) | | | 33,226 | |
| | | 1,574 | | | Foot Locker, Inc. | | | 93,574 | |
| | | 333 | | | Harman International Industries, Inc. | | | 43,416 | |
| | | 2,351 | | | Hilton Worldwide Holdings, Inc.(a) | | | 68,085 | |
| | | 2,804 | | | HomeAway, Inc.(a) | | | 78,372 | |
| | | 1,013 | | | HSN, Inc. | | | 63,231 | |
| | | 2,888 | | | IMAX Corp.(a) | | | 107,896 | |
| | | 1,371 | | | Jack in the Box, Inc. | | | 118,962 | |
| | | 2,588 | | | Jarden Corp.(a) | | | 132,454 | |
| | | 3,618 | | | Lions Gate Entertainment Corp. | | | 112,194 | |
| | | 1,022 | | | McGraw Hill Financial, Inc. | | | 106,595 | |
| | | 4,418 | | | Pandora Media, Inc.(a) | | | 78,817 | |
| | | 630 | | | Polaris Industries, Inc. | | | 86,285 | |
| | | 509 | | | Ross Stores, Inc. | | | 50,330 | |
| | | 901 | | | Royal Caribbean Cruises Ltd. | | | 61,322 | |
| | | 570 | | | Signet Jewelers Ltd. | | | 76,454 | |
| | | 969 | | | Under Armour, Inc., Class A(a) | | | 75,146 | |
| | | 679 | | | Williams-Sonoma, Inc. | | | 49,927 | |
| | | | | | | | | 1,717,079 | |
| | | | | | | | | | | |
Consumer Staples: 3.11% | |
| | | 1,068 | | | Hain Celestial Group, Inc.(a) | | | 64,336 | |
| | | 367 | | | Keurig Green Mountain, Inc. | | | 42,708 | |
| | | 3,158 | | | Sprouts Farmers Market, Inc.(a) | | | 101,009 | |
| | | 397 | | | WhiteWave Foods Co.(a) | | | 17,456 | |
| | | | | | | | | 225,509 | |
| | | | | | | | | | | |
Energy: 6.03% | |
| | | 2,398 | | | Cabot Oil & Gas Corp. | | | 81,100 | |
| | | 903 | | | Diamondback Energy, Inc.(a) | | | 74,561 | |
| | | 2,277 | | | Gulfport Energy Corp.(a) | | | 111,436 | |
| | | 1,273 | | | SM Energy Co. | | | 73,796 | |
| | | 497 | | | Valero Energy Corp. | | | 28,279 | |
| | | 1,783 | | | Whiting Petroleum Corp.(a) | | | 67,594 | |
| | | | | | | | | 436,766 | |
| | | | | | | | | | | |
Financial Services: 9.23% | |
| | | 672 | | | Affiliated Managers Group, Inc.(a) | | | 151,959 | |
| | | 337 | | | Alliance Data Systems Corp.(a) | | | 100,194 | |
| | | 446 | | | Mid-America Apartment Communities, Inc., REIT | | | 33,276 | |
| | | 3,223 | | | PacWest Bancorp | | | 145,357 | |
| | | 1,540 | | | SEI Investments Co. | | | 70,317 | |
| | | 548 | | | Signature Bank(a) | | | 73,481 | |
| | | 711 | | | SVB Financial Group(a) | | | 94,392 | |
| | | | | | | | | 668,976 | |
| | | | | | | | | | |
| Shares | | | | | Value (Note 2) | |
Health Care: 11.55% | |
| | | 546 | | | Acadia Healthcare Co., Inc.(a) | | $ | 37,401 | |
| | | 2,343 | | | Akorn, Inc.(a) | | | 97,562 | |
| | | 1,148 | | | Alnylam Pharmaceuticals, Inc.(a) | | | 116,947 | |
| | | 272 | | | Bluebird Bio, Inc.(a) | | | 36,228 | |
| | | 1,119 | | | Cepheid(a) | | | 62,776 | |
| | | 2,576 | | | Horizon Pharma Plc(a) | | | 72,437 | |
| | | 259 | | | Intercept Pharmaceuticals, Inc.(a) | | | 65,478 | |
| | | 3,827 | | | Intrexon Corp.(a) | | | 148,602 | |
| | | 1,050 | | | Mylan NV(a) | | | 75,873 | |
| | | 424 | | | United Therapeutics Corp.(a) | | | 67,709 | |
| | | 1,320 | | | Veeva Systems, Inc., Class A(a) | | | 35,046 | |
| | | 172 | | | Vertex Pharmaceuticals, Inc.(a) | | | 21,204 | |
| | | | | | | | | 837,263 | |
| | | | | | | | | | | |
Materials & Processing: 2.95% | |
| | | 210 | | | Acuity Brands, Inc. | | | 35,059 | |
| | | 1,413 | | | Eagle Materials, Inc. | | | 117,830 | |
| | | 275 | | | PPG Industries, Inc. | | | 60,929 | |
| | | | | | | | | 213,818 | |
| | | | | | | | | | | |
Producer Durables: 9.68% | |
| | | 1,108 | | | B/E Aerospace, Inc. | | | 66,247 | |
| | | 634 | | | EnerSys | | | 43,049 | |
| | | 1,888 | | | Korn/Ferry International | | | 59,529 | |
| | | 987 | | | Middleby Corp.(a) | | | 100,023 | |
| | | 3,197 | | | Southwest Airlines Co. | | | 129,670 | |
| | | 1,715 | | | Spirit Airlines, Inc.(a) | | | 117,426 | |
| | | 599 | | | United Rentals, Inc.(a) | | | 57,851 | |
| | | 1,357 | | | Wabtec Corp. | | | 127,626 | |
| | | | | | | | | 701,421 | |
| | | | | | | | | | | |
Technology: 17.54% | |
| | | 997 | | | Altera Corp. | | | 41,555 | |
| | | 356 | | | Avago Technologies Ltd. | | | 41,609 | |
| | | 512 | | | Cavium, Inc.(a) | | | 33,173 | |
| | | 767 | | | Cornerstone OnDemand, Inc.(a) | | | 21,959 | |
| | | 1,206 | | | EPAM Systems, Inc.(a) | | | 78,040 | |
| | | 3,868 | | | Fortinet, Inc.(a) | | | 145,978 | |
| | | 496 | | | Intuit, Inc. | | | 49,764 | |
| | | 1,141 | | | IPG Photonics Corp.(a) | | | 101,070 | |
| | | 4,498 | | | King Digital Entertainment Plc | | | 71,338 | |
| | | 1,079 | | | Lam Research Corp. | | | 81,551 | |
| | | 340 | | | LinkedIn Corp., Class A(a) | | | 85,724 | |
| | | 4,351 | | | ON Semiconductor Corp.(a) | | | 50,124 | |
| | | 705 | | | Palo Alto Networks, Inc.(a) | | | 104,143 | |
| | | 2,138 | | | Proofpoint, Inc.(a) | | | 115,409 | |
| | | 621 | | | SBA Communications Corp., Class A(a) | | | 71,924 | |
| | | 1,070 | | | ServiceNow, Inc.(a) | | | 80,100 | |
| | | 751 | | | Skyworks Solutions, Inc. | | | 69,280 | |
| | | 710 | | | Yelp, Inc.(a) | | | 27,967 | |
| | | | | | | | | 1,270,708 | |
| | |
Annual Report | April 30, 2015 | | 19 |
| | |
| Emerald Insights Fund | | Schedule of Investments |
| | April 30, 2015 |
| | | | | | | | |
| Shares | | | | | Value (Note 2) | |
| Utilities: 0.36% | |
| | 769 | | | Exelon Corp. | | $ | 26,161 | |
| | |
| | | | Total Common Stocks (Cost $5,432,093) | | | 6,097,701 | |
|
| EXCHANGE TRADED FUNDS: 10.07% | |
| Equity: 10.07% | |
| | 7,503 | | | iShares® Russell Mid-Cap Growth ETF | | | 729,667 | |
| | |
| | | | Total Exchange Traded Funds (Cost $726,095) | | | 729,667 | |
|
| MASTER LIMITED PARTNERSHIPS: 0.95% | |
| Financial Services: 0.95% | |
| | 1,299 | | | Lazard Ltd., Class A | | | 68,886 | |
| | |
| | | | Total Master Limited Partnerships (Cost $68,615) | | | 68,886 | |
| | | |
| SHORT TERM INVESTMENTS: 4.57% | |
| | 331,003 | | | Dreyfus Government Cash Management Fund - Institutional Class
0.010% (7-Day Yield) | | | 331,003 | |
| | |
| | | | | Total Short Term Investments (Cost $331,003) | | | 331,003 | |
| |
| Total Investments: 99.74%
(Cost $6,557,806) | | | 7,227,257 | |
| |
| Other Assets In Excess Of Liabilities: 0.26% | | | 18,928 | |
| Net Assets: 100.00% | | $ | 7,246,185 | |
| | | | | | |
| (a) | Non-income producing security. |
Investment Abbreviations:
| ETF - | Exchange Traded Funds. |
| NV - | Naamloze Vennootschap is the Dutch term for a public limited liability corporation. |
| Plc - | Public limited company. |
| REIT | - Real Estate Investment Trust. |
| Holdings | are subject to change. |
For Fund compliance purposes, the Fund’s industry classifications refer to any one or more of the industry sub-classifications used by one or more widely recognized market indexes or ratings group indexes, and/or as defined by Fund management. This definition may not apply for purposes of this report, which may combine industry sub-classifications for reporting ease. Industries are shown as a percentage of net assets.
See Notes to Financial Statements.
| | |
20 | | www.emeraldmutualfunds.com |
| | |
| Emerald Banking and Finance Fund | | Schedule of Investments |
| | April 30, 2015 |
| | |
| | | | | | | | |
| Shares | | | | | Value (Note 2) | |
| COMMON STOCKS: 99.11% | |
| Financial Services: 99.11% | |
| Asset Management & Custodian: 0.53% | |
| | 45,204 | | | Silvercrest Asset Management Group, Inc., Class A | | | $704,730 | |
| | |
| | | | | | | | |
| Banks: Diversified: 74.25% | |
| | 111,600 | | | Alerus Financial Corp. | | | 2,220,840 | |
| | 30,639 | | | American Business Bank(a) | | | 888,531 | |
| | 94,090 | | | Ameris Bancorp | | | 2,351,309 | |
| | 30,000 | | | Atlas Financial Holdings, Inc.(a) | | | 553,500 | |
| | 54,028 | | | BancorpSouth, Inc. | | | 1,308,018 | |
| | 121,936 | | | Bank of the Ozarks, Inc. | | | 4,726,239 | |
| | 87,453 | | | BankUnited, Inc. | | | 2,873,706 | |
| | 95,070 | | | BNC Bancorp | | | 1,735,028 | |
| | 15,015 | | | Bofl Holding, Inc.(a) | | | 1,378,527 | |
| | 46,950 | | | Bridge Bancorp, Inc. | | | 1,186,426 | |
| | 18,290 | | | Bryn Mawr Bank Corp. | | | 550,346 | |
| | 77,200 | | | C1 Financial, Inc.(a) | | | 1,445,184 | |
| | 160,489 | | | California Republic Bancorp(a) | | | 4,453,570 | |
| | 145,582 | | | CoBiz Financial, Inc. | | | 1,748,440 | |
| | 13,800 | | | Community National Bank(a) | | | 276,690 | |
| | 40,520 | | | CommunityOne Bancorp(a) | | | 399,122 | |
| | 174,752 | | | ConnectOne Bancorp, Inc. | | | 3,358,733 | |
| | 922 | | | Consumers Bancorp, Inc. | | | 16,596 | |
| | 58,710 | | | CU Bancorp(a) | | | 1,216,471 | |
| | 127,682 | | | Customers Bancorp, Inc.(a) | | | 3,218,863 | |
| | 76,890 | | | Eagle Bancorp, Inc.(a) | | | 2,834,165 | |
| | 23,220 | | | East West Bancorp, Inc. | | | 942,500 | |
| | 51,345 | | | EverBank Financial Corp. | | | 953,477 | |
| | 86,853 | | | Farmers National Banc Corp. | | | 718,274 | |
| | 65,100 | | | First Bank(a) | | | 403,620 | |
| | 29,445 | | | First Business Financial Services, Inc. | | | 1,337,392 | |
| | 78,450 | | | First NBC Bank Holding Co.(a) | | | 2,759,871 | |
| | 39,225 | | | First of Long Island Corp. | | | 981,410 | |
| | 477 | | | First Virginia Community Bank(a) | | | 11,448 | |
| | 110,000 | | | Great Western Bancorp, Inc. | | | 2,405,700 | |
| | 22,506 | | | Guaranty Bancorp | | | 354,244 | |
| | 50,540 | | | Home BancShares, Inc. | | | 1,661,755 | |
| | 16,003 | | | HopFed Bancorp, Inc. | | | 207,879 | |
| | 59,296 | | | Howard Bancorp, Inc.(a) | | | 824,214 | |
| | 21,120 | | | IBERIABANK Corp. | | | 1,315,987 | |
| | 15,250 | | | Independent Bank Corp. | | | 636,230 | |
| | 50,000 | | | Independent Bank Corporation | | | 662,000 | |
| | 67,294 | | | Investors Bancorp, Inc. | | | 796,761 | |
| | 23,000 | | | John Marshall Bank(a) | | | 405,950 | |
| | 141,177 | | | MainStreet Bank(a) | | | 1,327,064 | |
| | 45,870 | | | Meridian Bancorp, Inc.(a) | | | 589,430 | |
| | 118,910 | | | National Commerce Corp.(a) | | | 2,610,075 | |
| | 224 | | | Oak Valley Bancorp | | | 2,146 | |
| | 73,738 | | | Old Line Bancshares, Inc. | | | 1,184,232 | |
| | 90,432 | | | Opus Bank | | | 2,830,522 | |
| | 120,532 | | | Pacific Premier Bancorp, Inc.(a) | | | 1,887,531 | |
| | | | | | | | |
| Shares | | | | | Value (Note 2) | |
| Banks: Diversified (continued) | |
| | 93,875 | | | PacWest Bancorp | | | $4,233,763 | |
| | 63,580 | | | Peoples Bancorp, Inc. | | | 1,474,420 | |
| | 33,413 | | | Peoples Financial Corp. | | | 313,748 | |
| | 56,542 | | | Pinnacle Financial Partners, Inc. | | | 2,694,226 | |
| | 57,110 | | | PrivateBancorp, Inc. | | | 2,117,068 | |
| | 12,860 | | | Renasant Corp. | | | 382,071 | |
| | 481,505 | | | Royal Bancshares of Pennsylvania, Inc., Class A(a) | | | 866,709 | |
| | 80,016 | | | ServisFirst Bancshares, Inc. | | | 2,789,358 | |
| | 29,220 | | | Signature Bank(a) | | | 3,918,110 | |
| | 31,940 | | | Simmons First National Corp., Class A | | | 1,397,375 | |
| | 20,936 | | | Southern First Bancshares, Inc.(a) | | | 376,848 | |
| | 17,164 | | | Southern Missouri Bancorp, Inc. | | | 323,885 | |
| | 20,598 | | | Southern National Bancorp of Virginia, Inc. | | | 243,056 | |
| | 66,313 | | | Square 1 Financial, Inc.,
Class A(a) | | | 1,714,854 | |
| | 21,955 | | | Sun Bancorp, Inc.(a) | | | 415,608 | |
| | 28,013 | | | SVB Financial Group(a) | | | 3,719,006 | |
| | 48,499 | | | Talmer Bancorp, Inc., Class A | | | 745,915 | |
| | 87,675 | | | WashingtonFirst Bankshares, Inc. | | | 1,412,444 | |
| | 36,738 | | | West Town Bank & Trust(a) | | | 563,928 | |
| | 47,284 | | | Western Alliance Bancorp(a) | | | 1,462,021 | |
| | | | | | | 97,714,429 | |
| | |
| | | | | | | | |
| Banks: Savings, Thrift & Mortgage Lending: 7.56% | |
| | 225,594 | | | Atlantic Coast Financial Corp.(a) | | | 945,239 | |
| | 50,000 | | | Avenue Financial Holdings, Inc.(a) | | | 592,500 | |
| | 11,750 | | | Bridge Capital Holdings(a) | | | 317,838 | |
| | 36,138 | | | Elmira Savings Bank | | | 721,315 | |
| | 12,500 | | | Flushing Financial Corp. | | | 239,500 | |
| | 103,401 | | | Heritage Financial Corp. | | | 1,747,477 | |
| | 70,910 | | | Heritage Financial Group, Inc. | | | 1,950,025 | |
| | 11,680 | | | Home Bancorp, Inc. | | | 252,872 | |
| | 18,520 | | | Home Federal Bancorp, Inc. | | | 365,770 | |
| | 36,429 | | | Mackinac Financial Corp. | | | 402,540 | |
| | 159,583 | | | Sterling Bancorp | | | 2,071,387 | |
| | 30,890 | | | Sussex Bancorp | | | 345,968 | |
| | | | | | | 9,952,431 | |
| | |
| | | | | | | | |
| Commercial Banks: 5.29% | |
| | 15,000 | | | County Bancorp, Inc. | | | 298,800 | |
| | 90,134 | | | First Capital Bancorp, Inc.(a) | | | 405,603 | |
| | 561,112 | | | First Security Group, Inc.(a) | | | 1,346,669 | |
| | 60,000 | | | Franklin Financial Network, Inc.(a) | | | 1,232,400 | |
| | 67,995 | | | Investar Holding Corp. | | | 1,047,123 | |
| | 44,200 | | | Seacoast Commerce Banc Holdings(a) | | | 523,770 | |
| | 55,007 | | | Stonegate Bank | | | 1,575,401 | |
| | 39,610 | | | Triumph Bancorp, Inc.(a) | | | 531,566 | |
| | | | | | | 6,961,332 | |
| | |
| | | | | | | | |
| Commercial Finance & Mortgage Companies: 0.42% | |
| | 32,000 | | | Ladder Capital Corp., REIT, Class A | | | 561,280 | |
| | |
Annual Report | April 30, 2015 | | 21 |
| | |
| Emerald Banking and Finance Fund | | Schedule of Investments |
| | April 30, 2015 |
| | | | | | |
| Shares | | | | Value (Note 2) | |
Consumer Lending: 1.81% | |
43,287 | | LendingTree, Inc.(a) | | | $2,382,084 | |
| | |
| | | | | | |
Diversified Financial Services: 2.64% | |
108,831 | | FCB Financial Holdings, Inc., Class A(a) | | | 2,912,318 | |
14,430 | | Greenhill & Co., Inc. | | | 570,706 | |
| | | | | 3,483,024 | |
| | |
| | | | | | |
Financial Data & Services: 0.60% | |
15,022 | | Cass Information Systems, Inc. | | | 785,200 | |
| | |
| | | | | | |
Insurance: 0.90% | |
50,000 | | James River Group Holdings Ltd. | | | 1,182,000 | |
| | |
| | | | | | |
Insurance: Property-Casualty: 3.14% | |
41,320 | | AmTrust Financial Services, Inc. | | | 2,457,300 | |
40,000 | | Federated National Holding Co. | | | 1,152,000 | |
31,441 | | United Insurance Holdings Corp. | | | 522,864 | |
| | | | | 4,132,164 | |
| | |
| | | | | | |
Real Estate Investment Trusts (REITs): 1.31% | |
53,830 | | Diamond Resorts International, Inc.(a) | | | 1,723,098 | |
| | |
| | | | | | |
Real Estate Management & Development: 0.49% | |
18,140 | | Marcus & Millichap, Inc.(a) | | | 641,793 | |
| | |
| | | | | | |
Securities Brokerage & Services: 0.17% | |
10,300 | | Virtu Financial, Inc., Class A(a) | | | 220,317 | |
| | |
| | Total Common Stocks (Cost $94,253,097) | | | 130,443,882 | |
| | |
| | | | | | | |
SHORT TERM INVESTMENTS: 0.65% | |
| | Dreyfus Government Cash Management Fund - Institutional Class | | | | |
853,301 | | 0.010% (7-Day Yield) | | | 853,301 | |
| | |
| | | Total Short Term Investments (Cost $853,301) | | | 853,301 | |
| | |
| | | | | | |
Total Investments: 99.76% (Cost $95,106,398) | | | 131,297,183 | |
| |
Other Assets In Excess Of Liabilities: 0.24% | | | 309,967 | |
| Net Assets: 100.00% | | $ | 131,607,150 | |
| | | | | | | |
(a) Non-income producing security.
Investment Abbreviations:
Ltd. - Limited.
REIT - Real Estate Investment Trust.
Holdings are subject to change.
For Fund compliance purposes, the Fund’s industry classifications refer to any one or more of the industry sub-classifications used by one or more widely recognized market indexes or ratings group indexes, and/or as defined by Fund management. This definition may not apply for purposes of this report, which may combine industry sub-classifications for reporting ease. Industries are shown as a percentage of net assets.
See Notes to Financial Statements.
| | |
22 | | www.emeraldmutualfunds.com |
| | |
| Emerald Funds | | Statements of Assets and Liabilities |
| | April 30, 2015 |
| | | | | | | | | | | | | | | |
| | | Emerald Growth
Fund | | Emerald Insights
Fund | | Emerald Banking
and Finance Fund |
ASSETS: | | | | | | | | | | | | | | | |
Investments, at value | | | $ | 334,826,774 | | | | $ | 7,227,257 | | | | $ | 131,297,183 | |
Cash | | | | 945,517 | | | | | – | | | | | – | |
Receivable for investments sold | | | | 3,751,026 | | | | | 161,984 | | | | | 1,444,888 | |
Receivable for shares sold | | | | 453,656 | | | | | 43,531 | | | | | 154,055 | |
Receivable due from advisor | | | | – | | | | | 562 | | | | | – | |
Interest and dividends receivable | | | | 25,851 | | | | | 1,663 | | | | | 33,670 | |
Other assets | | | | 31,403 | | | | | 2,261 | | | | | 22,834 | |
| | | | | | | | | | | | | | | |
Total Assets | | | | 340,034,227 | | | | | 7,437,258 | | | | | 132,952,630 | |
| | | | | | | | | | | | | | | |
LIABILITIES: | | | | | | | | | | | | | | | |
Payable for investments purchased | | | | 2,529,760 | | | | | 166,280 | | | | | 1,092,635 | |
Payable for shares redeemed | | | | 243,424 | | | | | – | | | | | 11,308 | |
Investment advisory fees payable | | | | 212,261 | | | | | – | | | | | 105,472 | |
Payable to fund accounting and administration | | | | 18,181 | | | | | 916 | | | | | 7,391 | |
Payable for distribution and service fees | | | | 83,271 | | | | | 2,186 | | | | | 85,891 | |
Payable for trustee fees and expenses | | | | 2,495 | | | | | 51 | | | | | 958 | |
Payable for transfer agency fees | | | | 15,225 | | | | | 2,499 | | | | | 10,467 | |
Payable for chief compliance officer fee | | | | 2,967 | | | | | 61 | | | | | 1,139 | |
Payable for principal financial officer fee | | | | 593 | | | | | 12 | | | | | 228 | |
Payable for professional fees | | | | 18,159 | | | | | 17,046 | | | | | 17,475 | |
Accrued expenses and other liabilities | | | | 28,433 | | | | | 2,022 | | | | | 12,516 | |
| | | | | | | | | | | | | | | |
Total Liabilities | | | | 3,154,769 | | | | | 191,073 | | | | | 1,345,480 | |
| | | | | | | | | | | | | | | |
NET ASSETS | | | $ | 336,879,458 | | | | $ | 7,246,185 | | | | $ | 131,607,150 | |
| | | | | | | | | | | | | | | |
NET ASSETS CONSIST OF: | | | | | | | | | | | | | | | |
Paid-in capital (Note 5) | | | $ | 248,127,445 | | | | $ | 6,730,481 | | | | $ | 98,989,345 | |
Accumulated net investment loss | | | | (847,422 | ) | | | | (12,292 | ) | | | | (269,341) | |
Accumulated net realized gain/(loss) on investments | | | | 21,859,708 | | | | | (141,455 | ) | | | | (3,303,639) | |
Net unrealized appreciation on investments | | | | 67,739,727 | | | | | 669,451 | | | | | 36,190,785 | |
| | | | | | | | | | | | | | | |
NET ASSETS | | | $ | 336,879,458 | | | | $ | 7,246,185 | | | | $ | 131,607,150 | |
| | | | | | | | | | | | | | | |
INVESTMENTS, AT COST | | | $ | 267,087,047 | | | | $ | 6,557,806 | | | | $ | 95,106,398 | |
PRICING OF SHARES | | | | | | | | | | | | | | | |
Class A: (a) | | | | | | | | | | | | | | | |
Net Asset Value, offering and redemption price per share | | | $ | 20.02 | | | | $ | 10.98 | | | | $ | 28.85 | |
Net Assets | | | $ | 123,828,014 | | | | $ | 6,492,870 | | | | $ | 48,575,025 | |
Shares of beneficial interest outstanding | | | | 6,185,663 | | | | | 591,378 | | | | | 1,683,581 | |
Maximum offering price per share (NAV/.9525, based on maximum sales charge of 4.75% of the offering price) | | | $ | 21.02 | | | | $ | 11.53 | | | | $ | 30.29 | |
Class C: (a) | | | | | | | | | | | | | | | |
Net Asset Value, offering and redemption price per share | | | $ | 17.48 | | | | $ | 10.92 | | | | $ | 26.19 | |
Net Assets | | | $ | 15,427,183 | | | | $ | 26,824 | | | | $ | 31,861,670 | |
Shares of beneficial interest outstanding | | | | 882,441 | | | | | 2,457 | | | | | 1,216,446 | |
Institutional Class: | | | | | | | | | | | | | | | |
Net Asset Value, offering and redemption price per share | | | $ | 20.54 | | | | $ | 10.99 | | | | $ | 29.15 | |
Net Assets | | | $ | 174,107,265 | | | | $ | 278,843 | | | | $ | 23,730,442 | |
Shares of beneficial interest outstanding | | | | 8,476,756 | | | | | 25,375 | | | | | 814,122 | |
Investor Class: | | | | | | | | | | | | | | | |
Net Asset Value, offering and redemption price per share | | | $ | 19.97 | | | | $ | 10.96 | | | | $ | 27.64 | |
Net Assets | | | $ | 23,516,996 | | | | $ | 447,648 | | | | $ | 27,440,013 | |
Shares of beneficial interest outstanding | | | | 1,177,724 | | | | | 40,827 | | | | | 992,638 | |
| (a) | Redemption price per share may be reduced for any applicable contingent deferred sales charge. For a description of a possible sales charge, please see the Funds’ Prospectus. |
See Notes to Financial Statements.
| | |
Annual Report | April 30, 2015 | | 23 |
| | |
| Emerald Funds | | Statements of Operations |
| | For the Year Ended April 30, 2015 |
| | | | | | | | | | | | | | | |
| | | Emerald Growth
Fund | | Emerald Insights
Fund(a) | | Emerald Banking
and Finance Fund |
INVESTMENT INCOME: | | | | | | | | | | | | | | | |
Dividends | | | $ | 1,003,207 | | | | $ | 25,297 | | | | $ | 1,245,957 | |
Foreign taxes withheld | | | | – | | | | | (133) | | | | | – | |
| | | | | | | | | | | | | | | |
Total Investment Income | | | | 1,003,207 | | | | | 25,164 | | | | | 1,245,957 | |
| | | | | | | | | | | | | | | |
| | | |
EXPENSES: | | | | | | | | | | | | | | | |
Investment advisory fee (Note 6) | | | | 2,049,993 | | | | | 27,168 | | | | | 1,201,613 | |
Recoupment of previously waived fees | | | | 27,022 | | | | | – | | | | | – | |
Administration fee | | | | 191,965 | | | | | 5,093 | | | | | 87,931 | |
Custodian fee | | | | 29,979 | | | | | 3,710 | | | | | 14,826 | |
Professional fees | | | | 27,432 | | | | | 18,163 | | | | | 22,332 | |
Transfer agent fee | | | | 115,952 | | | | | 20,564 | | | | | 91,886 | |
Trustee fees and expenses | | | | 8,409 | | | | | 139 | | | | | 3,671 | |
Registration/filing fees | | | | 71,241 | | | | | 2,575 | | | | | 47,652 | |
Reports to shareholder and printing fees | | | | 33,503 | | | | | 658 | | | | | 23,302 | |
Distribution and service fees | | | | | | | | | | | | | | | |
Class A | | | | 354,055 | | | | | 11,861 | | | | | 164,785 | |
Class C | | | | 116,453 | | | | | 175 | | | | | 295,329 | |
Institutional Class | | | | 62,735 | | | | | 48 | | | | | 5,930 | |
Investor Class | | | | 57,990 | | | | | 480 | | | | | 74,836 | |
Chief compliance officer fee | | | | 32,519 | | | | | 428 | | | | | 14,552 | |
Principal financial officer fee | | | | 6,836 | | | | | 86 | | | | | 3,079 | |
Other | | | | 21,142 | | | | | 5,280 | | | | | 14,457 | |
| | | | | | | | | | | | | | | |
Total expenses before waiver | | | | 3,207,226 | | | | | 96,428 | | | | | 2,066,181 | |
Less fees waived/reimbursed by investment adviser (Note 6) | | | | – | | | | | (47,639) | | | | | – | |
| | | | | | | | | | | | | | | |
| | | |
Total Net Expenses | | | | 3,207,226 | | | | | 48,789 | | | | | 2,066,181 | |
| | | | | | | | | | | | | | | |
| | | |
NET INVESTMENT LOSS: | | | | (2,204,019) | | | | | (23,625) | | | | | (820,224) | |
| | | | | | | | | | | | | | | |
| | | |
Net realized gain/(loss) on investments | | | | 26,045,665 | | | | | (143,101) | | | | | 2,239,110 | |
Net change in unrealized appreciation on investments | | | | 22,664,902 | | | | | 669,451 | | | | | 10,618,634 | |
| | | | | | | | | | | | | | | |
NET REALIZED AND UNREALIZED GAIN ON INVESTMENTS | | | | 48,710,567 | | | | | 526,350 | | | | | 12,857,744 | |
| | | | | | | | | | | | | | | |
NET INCREASE IN NET ASSETS RESULTING FROM OPERATIONS | | | $ | 46,506,548 | | | | $ | 502,725 | | | | $ | 12,037,520 | |
| | | | | | | | | | | | | | | |
| (a) | For the period August 1, 2014 (Inception) to April 30, 2015. |
See Notes to Financial Statements.
| | |
24 | | www.emeraldmutualfunds.com |
| | |
| Emerald Growth Fund | | Statements of Changes in Net Assets |
| | |
| | | | | | | | | | | | |
| | | Year Ended
April 30, 2015 | | | Year Ended
April 30, 2014 | |
OPERATIONS: | | | | | | | | | | | | |
Net investment loss | | | | $ | (2,204,019) | | | | | $ | (1,903,752) | |
Net realized gain on investments | | | | | 26,045,665 | | | | | | 28,529,898 | |
Net change in unrealized appreciation on investments | | | | | 22,664,902 | | | | | | 6,894,266 | |
| | | | | | | | | | | | |
Net increase in net assets resulting from operations | | | | | 46,506,548 | | | | | | 33,520,412 | |
| | | | | | | | | | | | |
| | | | |
DISTRIBUTIONS TO SHAREHOLDERS (NOTE 3): | | | | | | | | | | | | |
| | | | |
From net realized gains on investments | | | | | | | | | | | | |
Class A | | | | | (7,114,290) | | | | | | (5,103,134) | |
Class C | | | | | (872,458) | | | | | | (786,150) | |
Institutional Class | | | | | (10,131,634) | | | | | | (9,804,217) | |
Investor Class | | | | | (1,055,047) | | | | | | (833,989) | |
| | | | | | | | | | | | |
Net decrease in net assets from distributions | | | | | (19,173,429) | | | | | | (16,527,490) | |
| | | | | | | | | | | | |
SHARE TRANSACTIONS (NOTE 5): | | | | | | | | | | | | |
Class A | | | | | | | | | | | | |
Proceeds from sale of shares | | | | | 53,012,811 | | | | | | 32,230,458 | |
Issued to shareholders in reinvestment of distributions | | | | | 6,449,784 | | | | | | 4,588,579 | |
Cost of shares redeemed | | | | | (23,205,808) | | | | | | (10,981,411) | |
| | | | | | | | | | | | |
| | | | |
Net increase from share transactions | | | | | 36,256,787 | | | | | | 25,837,626 | |
| | | | | | | | | | | | |
| | | | |
Class C | | | | | | | | | | | | |
Proceeds from sale of shares | | | | | 5,349,541 | | | | | | 6,810,627 | |
Issued to shareholders in reinvestment of distributions | | | | | 745,415 | | | | | | 672,071 | |
Cost of shares redeemed | | | | | (3,205,852) | | | | | | (998,140) | |
| | | | | | | | | | | | |
| | | | |
Net increase from share transactions | | | | | 2,889,104 | | | | | | 6,484,558 | |
| | | | | | | | | | | | |
| | | | |
Institutional Class | | | | | | | | | | | | |
Proceeds from sale of shares | | | | | 44,366,418 | | | | | | 44,708,051 | |
Issued to shareholders in reinvestment of distributions | | | | | 9,651,464 | | | | | | 9,632,675 | |
Cost of shares redeemed | | | | | (29,629,924) | | | | | | (17,935,648) | |
| | | | | | | | | | | | |
| | | | |
Net increase from share transactions | | | | | 24,387,958 | | | | | | 36,405,078 | |
| | | | | | | | | | | | |
| | | | |
Investor Class | | | | | | | | | | | | |
Proceeds from sale of shares | | | | | 18,821,238 | | | | | | 16,794,225 | |
Issued to shareholders in reinvestment of distributions | | | | | 761,358 | | | | | | 824,690 | |
Cost of shares redeemed | | | | | (13,424,866) | | | | | | (3,115,720) | |
| | | | | | | | | | | | |
| | | | |
Net increase from share transactions | | | | | 6,157,730 | | | | | | 14,503,195 | |
| | | | | | | | | | | | |
| | | | |
Net increase in net assets | | | | $ | 97,024,698 | | | | | $ | 100,223,379 | |
| | | | | | | | | | | | |
| | | | |
NET ASSETS: | | | | | | | | | | | | |
Beginning of period | | | | | 239,854,760 | | | | | | 139,631,381 | |
| | | | | | | | | | | | |
End of period (including accumulated net investment loss of $(847,422) and $0) | | | | $ | 336,879,458 | | | | | $ | 239,854,760 | |
| | | | | | | | | | | | |
| | |
Annual Report | April 30, 2015 | | 25 |
| | |
| Emerald Growth Fund | | Statements of Changes in Net Assets |
| | |
| | | | | | | | | | | | | | | | |
| | | Year Ended
April 30, 2015 | | Year Ended
April 30, 2014 |
Other Information: | | | | | | | | | | | | | | | | |
SHARE TRANSACTIONS: | | | | | | | | | | | | | | | | |
Class A | | | | | | | | | | | | | | | | |
Sold | | | | | 2,761,491 | | | | | | | | 1,651,050 | | | |
Distributions reinvested | | | | | 341,078 | | | | | | | | 244,086 | | | |
Redeemed | | | | | (1,218,757) | | | | | | | | (580,859) | | | |
| | | | | | | | | | |
Net increase in shares outstanding | | | | | 1,883,812 | | | | | | | | 1,314,277 | | | |
| | | | | | | | | | |
| | | | | | |
Class C | | | | | | | | | | | | | | | | |
Sold | | | | | 306,048 | | | | | | | | 391,694 | | | |
Distributions reinvested | | | | | 45,040 | | | | | | | | 40,196 | | | |
Redeemed | | | | | (193,449) | | | | | | | | (58,625) | | | |
| | | | | | | | | | |
Net increase in shares outstanding | | | | | 157,639 | | | | | | | | 373,265 | | | |
| | | | | | | | | | |
| | | | | | |
Institutional Class | | | | | | | | | | | | | | | | |
Sold | | | | | 2,257,859 | | | | | | | | 2,251,862 | | | |
Distributions reinvested | | | | | 498,012 | | | | | | | | 502,225 | | | |
Redeemed | | | | | (1,548,603) | | | | | | | | (922,587) | | | |
| | | | | | | | | | |
Net increase in shares outstanding | | | | | 1,207,268 | | | | | | | | 1,831,500 | | | |
| | | | | | | | | | |
| | | | | | |
Investor Class | | | | | | | | | | | | | | | | |
Sold | | | | | 977,034 | | | | | | | | 878,538 | | | |
Distributions reinvested | | | | | 40,390 | | | | | | | | 43,960 | | | |
Redeemed | | | | | (718,235) | | | | | | | | (162,295) | | | |
| | | | | | | | | | |
Net increase in shares outstanding | | | | | 299,189 | | | | | | | | 760,203 | | | |
| | | | | | | | | | |
See Notes to Financial Statements.
| | |
26 | | www.emeraldmutualfunds.com |
| | |
| Emerald Insights Fund | | Statements of Changes in Net Assets |
| | |
| | | | | | |
| | | For the Period
August 1, 2014
(Inception) to
April 30, 2015 | |
OPERATIONS: | | | | | | |
Net investment loss | | | | $ | (23,625) | |
Net realized loss on investments | | | | | (143,101) | |
Net change in unrealized appreciation on investments | | | | | 669,451 | |
| | | | | | |
| | |
Net increase in net assets resulting from operations | | | | | 502,725 | |
| | | | | | |
| | |
SHARE TRANSACTIONS (NOTE 5): | | | | | | |
Class A | | | | | | |
Proceeds from sale of shares | | | | | 6,101,597 | |
Cost of shares redeemed | | | | | (82,206) | |
| | | | | | |
Net increase from share transactions | | | | | 6,019,391 | |
| | | | | | |
| | |
Class C | | | | | | |
Proceeds from sale of shares | | | | | 24,453 | |
| | | | | | |
Net increase from share transactions | | | | | 24,453 | |
| | | | | | |
| | |
Institutional Class | | | | | | |
Proceeds from sale of shares | | | | | 265,616 | |
| | | | | | |
Net increase from share transactions | | | | | 265,616 | |
| | | | | | |
| | |
Investor Class | | | | | | |
Proceeds from sale of shares | | | | | 434,000 | |
| | | | | | |
Net increase from share transactions | | | | | 434,000 | |
| | | | | | |
Net increase in net assets | | | | $ | 7,246,185 | |
| | | | | | |
| | |
NET ASSETS: | | | | | | |
Beginning of period | | | | | – | |
| | | | | | |
End of period (including accumulated net investment loss of $(12,292)) | | | | $ | 7,246,185 | |
| | | | | | |
| | |
Other Information: | | | | | | |
SHARE TRANSACTIONS: | | | | | | |
Class A | | | | | | |
Sold | | | | | 599,167 | |
Redeemed | | | | | (7,789) | |
| | | | | | |
Net increase in shares outstanding | | | | | 591,378 | |
| | | | | | |
Class C | | | | | | |
Sold | | | | | 2,457 | |
| | | | | | |
Net increase in shares outstanding | | | | | 2,457 | |
| | | | | | |
Institutional Class | | | | | | |
Sold | | | | | 25,375 | |
| | | | | | |
Net increase in shares outstanding | | | | | 25,375 | |
| | | | | | |
Investor Class | | | | | | |
Sold | | | | | 40,827 | |
| | | | | | |
Net increase in shares outstanding | | | | | 40,827 | |
| | | | | | |
See Notes to Financial Statements.
| | |
Annual Report | April 30, 2015 | | 27 |
| | |
| Emerald Banking and Finance Fund | | Statements of Changes in Net Assets |
| | |
| | | | | | | | | | | | |
| | | Year Ended
April 30, 2015 | | | Year Ended
April 30, 2014 | |
OPERATIONS: | | | | | | | | | | | | |
Net investment loss | | | | $ | (820,224) | | | | | $ | (556,712) | |
Net realized gain on investments | | | | | 2,239,110 | | | | | | 5,639,073 | |
Net change in unrealized appreciation on investments | | | | | 10,618,634 | | | | | | 12,763,257 | |
| | | | | | | | | | | | |
Net increase in net assets resulting from operations | | | | | 12,037,520 | | | | | | 17,845,618 | |
| | | | | | | | | | | | |
| | | | |
SHARE TRANSACTIONS (NOTE 5): | | | | | | | | | | | | |
Class A | | | | | | | | | | | | |
Proceeds from sale of shares | | | | | 8,943,302 | | | | | | 25,659,372 | |
Cost of shares redeemed | | | | | (13,656,116) | | | | | | (11,200,208) | |
| | | | | | | | | | | | |
Net increase/(decrease) from share transactions | | | | | (4,712,814) | | | | | | 14,459,164 | |
| | | | | | | | | | | | |
Class C | | | | | | | | | | | | |
Proceeds from sale of shares | | | | | 4,050,687 | | | | | | 7,599,293 | |
Cost of shares redeemed | | | | | (3,175,681) | | | | | | (2,355,553) | |
| | | | | | | | | | | | |
Net increase from share transactions | | | | | 875,006 | | | | | | 5,243,740 | |
| | | | | | | | | | | | |
Institutional Class | | | | | | | | | | | | |
Proceeds from sale of shares | | | | | 3,363,492 | | | | | | 16,536,237 | |
Cost of shares redeemed | | | | | (4,043,673) | | | | | | (608,192) | |
| | | | | | | | | | | | |
Net increase/(decrease) from share transactions | | | | | (680,181) | | | | | | 15,928,045 | |
| | | | | | | | | | | | |
Investor Class | | | | | | | | | | | | |
Proceeds from sale of shares | | | | | 12,918,507 | | | | | | 12,230,717 | |
Cost of shares redeemed | | | | | (6,971,664) | | | | | | (1,343,232) | |
| | | | | | | | | | | | |
Net increase from share transactions | | | | | 5,946,843 | | | | | | 10,887,485 | |
| | | | | | | | | | | | |
Net increase in net assets | | | | $ | 13,466,374 | | | | | $ | 64,364,052 | |
| | | | | | | | | | | | |
NET ASSETS: | | | | | | | | | | | | |
Beginning of period | | | | | 118,140,776 | | | | | | 53,776,724 | |
| | | | | | | | | | | | |
End of period (including accumulated net investment loss of $(269,341) and $(252,612)) | | | | $ | 131,607,150 | | | | | $ | 118,140,776 | |
| | | | | | | | | | | | |
| | | | |
Other Information: | | | | | | | | | | | | |
SHARE TRANSACTIONS: | | | | | | | | | | | | |
Class A | | | | | | | | | | | | |
Sold | | | | | 327,474 | | | | | | 1,038,680 | |
Redeemed | | | | | (506,169) | | | | | | (446,319) | |
| | | | | | | | | | | | |
Net increase/(decrease) in shares outstanding | | | | | (178,695) | | | | | | 592,361 | |
| | | | | | | | | | | | |
Class C | | | | | | | | | | | | |
Sold | | | | | 162,947 | | | | | | 329,912 | |
Redeemed | | | | | (129,546) | | | | | | (105,783) | |
| | | | | | | | | | | | |
Net increase in shares outstanding | | | | | 33,401 | | | | | | 224,129 | |
| | | | | | | | | | | | |
Institutional Class | | | | | | | | | | | | |
Sold | | | | | 122,773 | | | | | | 649,087 | |
Redeemed | | | | | (147,805) | | | | | | (24,418) | |
| | | | | | | | | | | | |
Net increase/(decrease) in shares outstanding | | | | | (25,032) | | | | | | 624,669 | |
| | | | | | | | | | | | |
Investor Class | | | | | | | | | | | | |
Sold | | | | | 496,076 | | | | | | 500,859 | |
Redeemed | | | | | (272,502) | | | | | | (57,090) | |
| | | | | | | | | | | | |
Net increase in shares outstanding | | | | | 223,574 | | | | | | 443,769 | |
| | | | | | | | | | | | |
See Notes to Financial Statements.
| | |
28 | | www.emeraldmutualfunds.com |
| | |
| Emerald Growth Fund | | Financial Highlights |
| | For a share outstanding throughout the periods presented |
| | | | | | | | | | | | | | | | | | | | | | | | |
| | | CLASS A | |
| | | Year Ended April 30,
2015 | | | Year Ended April 30,
2014 | | | Year Ended
April 30,
2013 | | | For the Period January 1,
2012 to April 30,
2012(a)(b) | | | Year Ended December 31,
2011 | | | Year Ended December 31,
2010 | |
NET ASSET VALUE, BEGINNING OF PERIOD | | $ | 18.11 | | | $ | 15.60 | | | $ | 16.20 | | | $ | 13.37 | | | $ | 13.57 | | | $ | 10.63 | |
INCOME/(LOSS) FROM OPERATIONS: | | | | | | | | | | | | | | | | | | | | | | | | |
Net investment loss | | | (0.18) (c) | | | | (0.21) (c) | | | | (0.15) (c) | | | | (0.05) (c) | | | | (0.14) (c) | | | | (0.12) | |
Net realized and unrealized gain/(loss) on investments | | | 3.43 | | | | 4.33 | | | | 1.40 | | | | 2.88 | | | | (0.06) | | | | 3.06 | |
| | | | | | | | | | | | | | | | | | | | | | | | |
Total from Investment Operations | | | 3.25 | | | | 4.12 | | | | 1.25 | | | | 2.83 | | | | (0.20) | | | | 2.94 | |
| | | | | | | | | | | | | | | | | | | | | | | | |
| | | | | | |
LESS DISTRIBUTIONS: | | | | | | | | | | | | | | | | | | | | | | | | |
From capital gains | | | (1.34) | | | | (1.61) | | | | (1.85) | | | | – | | | | – | | | | – | |
| | | | | | | | | | | | | | | | | | | | | | | | |
Total Distributions | | | (1.34) | | | | (1.61) | | | | (1.85) | | | | – | | | | – | | | | – | |
| | | | | | | | | | | | | | | | | | | | | | | | |
NET INCREASE/(DECREASE) IN NET ASSET VALUE | | | 1.91 | | | | 2.51 | | | | (0.60) | | | | 2.83 | | | | (0.20) | | | | 2.94 | |
| | | | | | | | | | | | | | | | | | | | | | | | |
NET ASSET VALUE, END OF PERIOD | | $ | 20.02 | | | $ | 18.11 | | | $ | 15.60 | | | $ | 16.20 | | | $ | 13.37 | | | $ | 13.57 | |
| | | | | | | | | | | | | | | | | | | | | | | | |
| | | | | | |
TOTAL RETURN(d) | | | 18.38 | % | | | 26.01 | % | | | 9.14 | % | | | 21.17% | (e) | | | (1.47) | % | | | 27.66 | % |
RATIOS/SUPPLEMENTAL DATA: | | | | | | | | | | | | | | | | | | | | | | | | |
Net Assets, End of Period (000s) | | $ | 123,828 | | | $ | 77,900 | | | $ | 46,605 | | | $ | 41,991 | | | $ | 37,008 | | | $ | 46,785 | |
RATIOS TO AVERAGE NET ASSETS: | | | | | | | | | | | | | | | | | | | | | | | | |
Net Investment loss | | | (0.93) | % | | | (1.12) | % | | | (1.01) | % | | | (1.02) | %(f) | | | (1.03) | % | | | (0.85) | % |
Operating expenses excluding reimbursement/waiver | | | 1.29 | % | | | 1.31 | % | | | 1.38 | % | | | 1.36 | %(f) | | | 1.36 | % | | | 1.41 | % |
Operating expenses including reimbursement/waiver | | | 1.29 | % | | | 1.29 | % | | | 1.29 | % | | | 1.29 | %(f) | | | 1.29 | % | | | 1.29 | % |
PORTFOLIO TURNOVER RATE | | | 68 | % | | | 70 | % | | | 78 | % | | | 28 | %(e) | | | 75 | % | | | 78 | % |
| (a) | Prior to its March 16, 2012 reorganization with and into the Emerald Growth Fund, the Fund was known as the Forward Growth Fund. |
| (b) | Effective March 13, 2012 the Board approved changing the fiscal year-end of the Fund from December 31 to April 30. |
| (c) | Per share amounts are based upon average shares outstanding. |
| (d) | Total return does not reflect the effect of sales charges. |
See Notes to Financial Statements.
| | |
Annual Report | April 30, 2015 | | 29 |
| | |
| Emerald Growth Fund | | Financial Highlights |
| | For a share outstanding throughout the periods presented |
| | | | | | | | | | | | | | | | | | | | | | | | |
| | | CLASS C | |
| | | Year Ended April 30,
2015 | | | Year Ended April 30,
2014 | | | Year Ended April 30,
2013 | | | For the Period January 1,
2012 to April 30,
2012(a)(b) | | | Year Ended December 31, 2011 | | | Year Ended December 31,
2010 | |
NET ASSET VALUE, BEGINNING OF PERIOD | | $ | 16.07 | | | $ | 14.07 | | | $ | 14.89 | | | $ | 12.31 | | | $ | 12.58 | | | $ | 9.92 | |
INCOME/(LOSS) FROM OPERATIONS: | | | | | | | | | | | | | | | | | | | | | | | | |
Net investment loss | | | (0.27) (c) | | | | (0.30) (c) | | | | (0.23) (c) | | | | (0.08) (c) | | | | (0.22) (c) | | | | (0.03) | |
Net realized and unrealized gain/(loss) on investments | | | 3.02 | | | | 3.91 | | | | 1.26 | | | | 2.66 | | | | (0.05) | | | | 2.69 | |
| | | | | | | | | | | | | | | | | | | | | | | | |
Total from Investment Operations | | | 2.75 | | | | 3.61 | | | | 1.03 | | | | 2.58 | | | | (0.27) | | | | 2.66 | |
| | | | | | | | | | | | | | | | | | | | | | | | |
| | | | | | |
LESS DISTRIBUTIONS: | | | | | | | | | | | | | | | | | | | | | | | | |
From capital gains | | | (1.34) | | | | (1.61) | | | | (1.85) | | | | – | | | | – | | | | – | |
| | | | | | | | | | | | | | | | | | | | | | | | |
Total Distributions | | | (1.34) | | | | (1.61) | | | | (1.85) | | | | – | | | | – | | | | – | |
| | | | | | | | | | | | | | | | | | | | | | | | |
NET INCREASE/(DECREASE) IN NET ASSET VALUE | | | 1.41 | | | | 2.00 | | | | (0.82) | | | | 2.58 | | | | (0.27) | | | | 2.66 | |
| | | | | | | | | | | | | | | | | | | | | | | | |
NET ASSET VALUE, END OF PERIOD | | $ | 17.48 | | | $ | 16.07 | | | $ | 14.07 | | | $ | 14.89 | | | $ | 12.31 | | | $ | 12.58 | |
| | | | | | | | | | | | | | | | | | | | | | | | |
| | | | | | |
TOTAL RETURN(d) | | | 17.58 | % | | | 25.19 | % | | | 8.43 | % | | | 20.96% | (e) | | | (2.15) | % | | | 26.81 | % |
RATIOS/SUPPLEMENTAL DATA: | | | | | | | | | | | | | | | | | | | | | | | | |
Net Assets, End of Period (000s) | | $ | 15,427 | | | $ | 11,645 | | | $ | 4,946 | | | $ | 3,026 | | | $ | 2,743 | | | $ | 2,812 | |
| RATIOS TO AVERAGE NET ASSETS: | | | | | | | | | | | | | | | | | | | | | | | | |
Net Investment loss | | | (1.58) | % | | | (1.77) | % | | | (1.65) | % | | | (1.67)% | (f) | | | (1.68) | % | | | (1.48) | % |
Operating expenses excluding reimbursement/waiver | | | 1.94 | % | | | 1.96 | % | | | 2.03 | % | | | 2.01% | (f) | | | 2.01 | % | | | 2.06 | % |
Operating expenses including reimbursement/waiver | | | 1.94 | % | | | 1.94 | % | | | 1.94 | % | | | 1.94% | (f) | | | 1.94 | % | | | 1.94 | % |
PORTFOLIO TURNOVER RATE | | | 68 | % | | | 70 | % | | | 78 | % | | | 28% | (e) | | | 75 | % | | | 78 | % |
| (a) | Prior to its March 16, 2012 reorganization with and into the Emerald Growth Fund, the Fund was known as the Forward Growth Fund. |
| (b) | Effective March 13, 2012 the Board approved changing the fiscal year-end of the Fund from December 31 to April 30. |
| (c) | Per share amounts are based upon average shares outstanding. |
| (d) | Total return does not reflect the effect of sales charges. |
See Notes to Financial Statements.
| | |
30 | | www.emeraldmutualfunds.com |
| | |
| Emerald Growth Fund | | Financial Highlights |
| | For a share outstanding throughout the periods presented |
| | | | | | | | | | | | | | | | | | | | | | | | |
| | | INSTITUTIONAL CLASS | |
| | | Year Ended April 30,
2015 | | | Year Ended April 30,
2014 | | | Year Ended April 30,
2013 | | | For the Period January 1,
2012 to April 30,
2012(a)(b) | | | Year Ended December 31,
2011 | | | Year Ended December 31,
2010 | |
NET ASSET VALUE, BEGINNING OF PERIOD | | $ | 18.49 | | | $ | 15.86 | | | $ | 16.39 | | | $ | 13.51 | | | $ | 13.67 | | | $ | 10.68 | |
INCOME/(LOSS) FROM OPERATIONS: | | | | | | | | | | | | | | | | | | | | | | | | |
Net investment loss | | | (0.12) (c) | | | | (0.16) (c) | | | | (0.11) (c) | | | | (0.04) (c) | | | | (0.10) (c) | | | | (0.06) | |
Net realized and unrealized gain/(loss) on investments | | | 3.51 | | | | 4.40 | | | | 1.43 | | | | 2.92 | | | | (0.06) | | | | 3.05 | |
| | | | | | | | | | | | | | | | | | | | | | | | |
Total from Investment Operations | | | 3.39 | | | | 4.24 | | | | 1.32 | | | | 2.88 | | | | (0.16) | | | | 2.99 | |
| | | | | | | | | | | | | | | | | | | | | | | | |
| | | | | | |
LESS DISTRIBUTIONS: | | | | | | | | | | | | | | | | | | | | | | | | |
From capital gains | | | (1.34) | | | | (1.61) | | | | (1.85) | | | | – | | | | – | | | | – | |
| | | | | | | | | | | | | | | | | | | | | | | | |
Total Distributions | | | (1.34) | | | | (1.61) | | | | (1.85) | | | | – | | | | – | | | | – | |
| | | | | | | | | | | | | | | | | | | | | | | | |
NET INCREASE/(DECREASE) IN NET ASSET VALUE | | | 2.05 | | | | 2.63 | | | | (0.53) | | | | 2.88 | | | | (0.16) | | | | 2.99 | |
| | | | | | | | | | | | | | | | | | | | | | | | |
NET ASSET VALUE, END OF PERIOD | | $ | 20.54 | | | $ | 18.49 | | | $ | 15.86 | | | $ | 16.39 | | | $ | 13.51 | | | $ | 13.67 | |
| | | | | | | | | | | | | | | | | | | | | | | | |
| | | | | | |
TOTAL RETURN | | | 18.77 | % | | | 26.35 | % | | | 9.47 | % | | | 21.32% | (d) | | | (1.17) | % | | | 28.00 | % |
RATIOS/SUPPLEMENTAL DATA: | | | | | | | | | | | | | | | | | | | | | | | | |
Net Assets, End of Period (000s) | | $ | 174,107 | | | $ | 134,440 | | | $ | 86,238 | | | $ | 83,149 | | | $ | 64,930 | | | $ | 64,880 | |
| RATIOS TO AVERAGE NET ASSETS: | | | | | | | | | | | | | | | | | | | | | | | | |
Net Investment loss | | | (0.63) | % | | | (0.82) | % | | | (0.71) | % | | | (0.72)% | (e) | | | (0.72) | % | | | (0.52) | % |
Operating expenses excluding reimbursement/waiver | | | 0.99 | % | | | 1.00 | % | | | 1.08 | % | | | 1.06% | (e) | | | 1.06 | % | | | 1.11 | % |
Operating expenses including reimbursement/waiver | | | 0.99 | % | | | 0.99 | % | | | 0.99 | % | | | 0.99% | (e) | | | 0.99 | % | | | 0.99 | % |
PORTFOLIO TURNOVER RATE | | | 68 | % | | | 70 | % | | | 78 | % | | | 28% | (d) | | | 75 | % | | | 78 | % |
| (a) | Prior to its March 16, 2012 reorganization with and into the Emerald Growth Fund, the Fund was known as the Forward Growth Fund. |
| (b) | Effective March 13, 2012 the Board approved changing the fiscal year-end of the Fund from December 31 to April 30. |
| (c) | Per share amounts are based upon average shares outstanding. |
See Notes to Financial Statements.
| | |
Annual Report | April 30, 2015 | | 31 |
| | |
| Emerald Growth Fund | | Financial Highlights |
| | For a share outstanding throughout the periods presented |
| | | | | | | | | | | | | | | | | | | | |
| | | INVESTOR CLASS | |
| | | Year Ended April 30,
2015 | | | Year Ended April 30,
2014 | | | Year Ended April 30,
2013 | | | For the Period January 1,
2012 to April 30,
2012(a)(b) | | | Period Ended December 31,
2011(c) | |
NET ASSET VALUE, BEGINNING OF PERIOD | | $ | 18.06 | | | $ | 15.57 | | | $ | 16.18 | | | $ | 13.35 | | | $ | 15.74 | |
INCOME/(LOSS) FROM OPERATIONS: | | | | | | | | | | | | | | | | | | | | |
Net investment loss(d) | | | (0.17) | | | | (0.23) | | | | (0.16) | | | | (0.05) | | | | (0.09) | |
Net realized and unrealized gain/(loss) on investments | | | 3.42 | | | | 4.33 | | | | 1.40 | | | | 2.88 | | | | (2.30) | |
| | | | | | | | | | | | | | | | | | | | |
Total from Investment Operations | | | 3.25 | | | | 4.10 | | | | 1.24 | | | | 2.83 | | | | (2.39) | |
| | | | | | | | | | | | | | | | | | | | |
| | | | | |
LESS DISTRIBUTIONS: | | | | | | | | | | | | | | | | | | | | |
From capital gains | | | (1.34) | | | | (1.61) | | | | (1.85) | | | | – | | | | – | |
| | | | | | | | | | | | | | | | | | | | |
Total Distributions | | | (1.34) | | | | (1.61) | | | | (1.85) | | | | – | | | | – | |
| | | | | | | | | | | | | | | | | | | | |
NET INCREASE/(DECREASE) IN NET ASSET VALUE | | | 1.91 | | | | 2.49 | | | | (0.61) | | | | 2.83 | | | | (2.39) | |
| | | | | | | | | | | | | | | | | | | | |
NET ASSET VALUE, END OF PERIOD | | $ | 19.97 | | | $ | 18.06 | | | $ | 15.57 | | | $ | 16.18 | | | $ | 13.35 | |
| | | | | | | | | | | | | | | | | | | | |
| | | | | |
TOTAL RETURN | | | 18.44 | % | | | 25.93 | % | | | 9.08 | % | | | 21.20% | (e) | | | (15.18)% | (e) |
RATIOS/SUPPLEMENTAL DATA: | | | | | | | | | | | | | | | | | | | | |
Net Assets, End of Period (000s) | | $ | 23,517 | | | $ | 15,870 | | | $ | 1,842 | | | $ | 1,085 | | | $ | 879 | |
RATIOS TO AVERAGE NET ASSETS: | | | | | | | | | | | | | | | | | | | | |
Net Investment loss | | | (0.91) | % | | | (1.18) | % | | | (1.05) | % | | | (1.07)% | (f) | | | (1.00)% | (f) |
Operating expenses excluding reimbursement/waiver | | | 1.27 | % | | | 1.34 | % | | | 1.43 | % | | | 1.41% | (f) | | | 1.43% | (f) |
Operating expenses including reimbursement/waiver | | | 1.27 | % | | | 1.34 | % | | | 1.34 | % | | | 1.34% | (f) | | | 1.34% | (f) |
PORTFOLIO TURNOVER RATE | | | 68 | % | | | 70 | % | | | 78 | % | | | 28% | (e) | | | 75% | (g) |
| (a) | Prior to its March 16, 2012 reorganization with and into the Emerald Growth Fund, the Fund was known as the Forward Growth Fund. |
| (b) | Effective March 13, 2012 the Board approved changing the fiscal year-end of the Fund from December 31 to April 30. |
| (c) | The Fund began offering Investor Class shares on May 2, 2011. |
| (d) | Per share amounts are based upon average shares outstanding. |
| (g) | Portfolio turnover is calculated at the Fund level and represents the year ended December 31, 2011. |
See Notes to Financial Statements.
| | |
32 | | www.emeraldmutualfunds.com |
| | |
| Emerald Insights Fund | | Financial Highlights |
| | For a share outstanding throughout the period presented |
| | | | |
| | | CLASS A | |
| | | For the Period | |
| | | August 1, 2014 (Inception) | |
| | | to April 30, 2015 | |
NET ASSET VALUE, BEGINNING OF PERIOD | | $ | 10.00 | |
INCOME FROM OPERATIONS: | | | | |
Net investment loss(a) | | | (0.05) | |
Net realized and unrealized gain on investments | | | 1.03 | |
| | | | |
Total from Investment Operations | | | 0.98 | |
| | | | |
| |
NET INCREASE IN NET ASSET VALUE | | | 0.98 | |
| | | | |
NET ASSET VALUE, END OF PERIOD | | $ | 10.98 | |
| | | | |
| |
TOTAL RETURN(b) | | | 9.80% (c) | |
RATIOS/SUPPLEMENTAL DATA: | | | | |
Net Assets, End of Period (000s) | | $ | 6,493 | |
RATIOS TO AVERAGE NET ASSETS: | | | | |
Net Investment loss | | | (0.66%) (d) | |
Operating expenses excluding reimbursement/waiver | | | 2.57% (d)(e) | |
Operating expenses including reimbursement/waiver | | | 1.35% (d)(e) | |
PORTFOLIO TURNOVER RATE | | | 88% (c) | |
| (a) | Per share amounts are based upon average shares outstanding. |
| (b) | Total return does not reflect the effect of sales charges. |
| (e) | Expense ratios before reductions for startup costs may not be representative of longer term operating periods. |
See Notes to Financial Statements.
| | |
Annual Report | April 30, 2015 | | 33 |
| | |
| Emerald Insights Fund | | Financial Highlights |
| | For a share outstanding throughout the period presented |
| | | | |
| | | CLASS C | |
| | | For the Period | |
| | | August 1, 2014 (Inception) | |
| | | to April 30, 2015 | |
NET ASSET VALUE, BEGINNING OF PERIOD | | $ | 10.00 | |
INCOME FROM OPERATIONS: | | | | |
Net investment loss(a) | | | (0.10) | |
Net realized and unrealized gain on investments | | | 1.02 | |
| | | | |
Total from Investment Operations | | | 0.92 | |
| | | | |
| |
NET INCREASE IN NET ASSET VALUE | | | 0.92 | |
| | | | |
NET ASSET VALUE, END OF PERIOD | | $ | 10.92 | |
| | | | |
| |
TOTAL RETURN(b) | | | 9.20% (c) | |
RATIOS/SUPPLEMENTAL DATA: | | | | |
Net Assets, End of Period (000s) | | $ | 27 | |
RATIOS TO AVERAGE NET ASSETS: | | | | |
Net Investment loss | | | (1.34%) (d) | |
Operating expenses excluding reimbursement/waiver | | | 7.25% (d)(e) | |
Operating expenses including reimbursement/waiver | | | 2.00% (d)(e) | |
PORTFOLIO TURNOVER RATE | | | 88% (c) | |
| (a) | Per share amounts are based upon average shares outstanding. |
| (b) | Total return does not reflect the effect of sales charges. |
| (e) | Expense ratios before reductions for startup costs may not be representative of longer term operating periods. |
See Notes to Financial Statements.
| | |
34 | | www.emeraldmutualfunds.com |
| | |
| Emerald Insights Fund | | Financial Highlights |
| | For a share outstanding throughout the period presented |
| | | | |
| | | INSTITUTIONAL CLASS | |
| | | For the Period | |
| | | August 1, 2014 (Inception) | |
| | | to April 30, 2015 | |
NET ASSET VALUE, BEGINNING OF PERIOD | | $ | 10.00 | |
INCOME FROM OPERATIONS: | | | | |
Net investment loss(a) | | | (0.03) | |
Net realized and unrealized gain on investments | | | 1.02 | |
| | | | |
Total from Investment Operations | | | 0.99 | |
| | | | |
| |
NET INCREASE IN NET ASSET VALUE | | | 0.99 | |
| | | | |
NET ASSET VALUE, END OF PERIOD | | $ | 10.99 | |
| | | | |
| |
TOTAL RETURN | | | 9.90% (b) | |
RATIOS/SUPPLEMENTAL DATA: | | | | |
Net Assets, End of Period (000s) | | $ | 279 | |
RATIOS TO AVERAGE NET ASSETS: | | | | |
Net Investment loss | | | (0.34%) (c) | |
Operating expenses excluding reimbursement/waiver | | | 4.66% (c)(d) | |
Operating expenses including reimbursement/waiver | | | 1.05% (c)(d) | |
PORTFOLIO TURNOVER RATE | | | 88% (b) | |
| (a) | Per share amounts are based upon average shares outstanding. |
| (d) | Expense ratios before reductions for startup costs may not be representative of longer term operating periods. |
See Notes to Financial Statements.
| | |
Annual Report | April 30, 2015 | | 35 |
| | |
| Emerald Insights Fund | | Financial Highlights |
| | For a share outstanding throughout the period presented |
| | | | |
| | | INVESTOR CLASS | |
| | | For the Period | |
| | | August 1, 2014 (Inception) | |
| | | to April 30, 2015 | |
NET ASSET VALUE, BEGINNING OF PERIOD | | $ | 10.00 | |
INCOME FROM OPERATIONS: | | | | |
Net investment loss(a) | | | (0.05) | |
Net realized and unrealized gain on investments | | | 1.01 | |
| | | | |
Total from Investment Operations | | | 0.96 | |
| | | | |
| |
NET INCREASE IN NET ASSET VALUE | | | 0.96 | |
| | | | |
NET ASSET VALUE, END OF PERIOD | | $ | 10.96 | |
| | | | |
| |
TOTAL RETURN | | | 9.60% (b) | |
RATIOS/SUPPLEMENTAL DATA: | | | | |
Net Assets, End of Period (000s) | | $ | 448 | |
RATIOS TO AVERAGE NET ASSETS: | | | | |
Net Investment loss | | | (0.67%) (c) | |
Operating expenses excluding reimbursement/waiver | | | 2.96% (c)(d) | |
Operating expenses including reimbursement/waiver | | | 1.40% (c)(d) | |
PORTFOLIO TURNOVER RATE | | | 88% (b) | |
| (a) | Per share amounts are based upon average shares outstanding. |
| (d) | Expense ratios before reductions for startup costs may not be representative of longer term operating periods. |
See Notes to Financial Statements.
| | |
36 | | www.emeraldmutualfunds.com |
| | |
Emerald Banking and Finance Fund | | Financial Highlights |
| | For a share outstanding throughout the periods presented |
| | | | | | | | | | | | | | | | | | | | | | | | |
| | | CLASS A | |
| | | Year Ended
April 30,
2015 | | | Year Ended
April 30,
2014 | | | Year Ended
April 30,
2013 | | | For the Period
January 1,
2012 to
April 30,
2012(a)(b) | | | Year Ended
December 31,
2011 | | | Year Ended
December 31,
2010 | |
NET ASSET VALUE, BEGINNING OF PERIOD | | $ | 26.11 | | | $ | 20.08 | | | $ | 16.96 | | | $ | 15.16 | | | $ | 15.89 | | | $ | 13.62 | |
INCOME/(LOSS) FROM OPERATIONS:(c) | | | | | | | | | | | | | | | | | | | | | | | | |
Net investment loss | | | (0.16) (d) | | | | (0.13) (d) | | | | (0.01) (d) | | | | (0.01) (d) | | | | (0.03) (d) | | | | (0.04) | |
Net realized and unrealized gain/(loss) on investments | | | 2.90 | | | | 6.16 | | | | 3.13 | | | | 1.81 | | | | (0.70) | | | | 2.31 | |
| | | | | | | | | | | | | | | | | | | | | | | | |
Total from Investment Operations | | | 2.74 | | | | 6.03 | | | | 3.12 | | | | 1.80 | | | | (0.73) | | | | 2.27 | |
| | | | | | | | | | | | | | | | | | | | | | | | |
| | | | | | |
NET INCREASE/(DECREASE) IN NET ASSET VALUE | | | 2.74 | | | | 6.03 | | | | 3.12 | | | | 1.80 | | | | (0.73) | | | | 2.27 | |
| | | | | | | | | | | | | | | | | | | | | | | | |
NET ASSET VALUE, END OF PERIOD | | $ | 28.85 | | | $ | 26.11 | | | $ | 20.08 | | | $ | 16.96 | | | $ | 15.16 | | | $ | 15.89 | |
| | | | | | | | | | | | | | | | | | | | | | | | |
| | | | | | |
TOTAL RETURN(e) | | | 10.49 | % | | | 30.03 | % | | | 18.40 | % | | | 11.87 | %(f) | | | (4.59 | )% | | | 16.67 | % |
RATIOS/SUPPLEMENTAL DATA: | | | | | | | | | | | | | | | | | | | | | | | | |
Net Assets, End of Period (000s) | | $ | 48,575 | | | $ | 48,622 | | | $ | 25,496 | | | $ | 21,363 | | | $ | 20,412 | | | $ | 26,756 | |
RATIOS TO AVERAGE NET ASSETS: | | | | | | | | | | | | | | | | | | | | | | | | |
Net Investment loss | | | (0.58 | )% | | | (0.53 | )% | | | (0.06 | )% | | | (0.24)% | (g) | | | (0.22 | )% | | | (0.22 | )% |
Operating expenses excluding reimbursement/waiver | | | 1.60 | % | | | 1.72 | % | | | 1.88 | % | | | 1.96% | (g) | | | 1.90 | % | | | 1.95 | % |
Operating expenses including reimbursement/waiver | | | 1.60 | % | | | 1.72 | % | | | 1.84 | % | | | 1.85% | (g) | | | n/a | | | | n/a | |
PORTFOLIO TURNOVER RATE | | | 33 | % | | | 34 | % | | | 53 | % | | | 9% | (f) | | | 27 | % | | | 48 | % |
| (a) | Prior to its March 16, 2012 reorganization with and into the Emerald Banking and Finance Fund, the Fund was known as the Forward Banking and Finance Fund. |
| (b) | Effective March 13, 2012 the Board approved changing the fiscal year-end of the Fund from December 31 to April 30. |
| (c) | The amount shown for a share outstanding throughout the period may not correlate with the Statement of Operations for the period due to the timing of sales and redemptions of Fund shares in relation to income earned and/or fluctuating market value of the investments of the Fund. |
| (d) | Per share amounts are based upon average shares outstanding. |
| (e) | Total return does not reflect the effect of sales charges. |
See Notes to Financial Statements.
| | |
Annual Report | April 30, 2015 | | 37 |
| | |
| Emerald Banking and Finance Fund | | Financial Highlights |
| | For a share outstanding throughout the periods presented |
| | | | | | | | | | | | | | | | | | | | | | | | |
| | | CLASS C | |
| | | Year Ended
April 30,
2015 | | | Year Ended
April 30,
2014 | | | Year Ended
April 30,
2013 | | | For the Period
January 1,
2012 to
April 30,
2012(a)(b) | | | Year Ended December 31,
2011 | | | Year Ended December 31,
2010 | |
NET ASSET VALUE, BEGINNING OF PERIOD | | $ | 23.86 | | | $ | 18.46 | | | $ | 15.70 | | | $ | 14.06 | | | $ | 14.82 | | | $ | 12.77 | |
INCOME/(LOSS) FROM OPERATIONS:(c) | | | | | | | | | | | | | | | | | | | | | | | | |
Net investment loss | | | (0.30) (d) | | | | (0.26) (d) | | | | (0.11) (d) | | | | (0.04) (d) | | | | (0.11) | (d) | | | (0.18) | |
Net realized and unrealized gain/(loss) on investments | | | 2.63 | | | | 5.66 | | | | 2.87 | | | | 1.68 | | | | (0.65) | | | | 2.23 | |
| | | | | | | | | | | | | | | | | | | | | | | | |
Total from Investment Operations | | | 2.33 | | | | 5.40 | | | | 2.76 | | | | 1.64 | | | | (0.76) | | | | 2.05 | |
| | | | | | | | | | | | | | | | | | | | | | | | |
| | | | | | |
NET INCREASE/(DECREASE) IN NET ASSET VALUE | | | 2.33 | | | | 5.40 | | | | 2.76 | | | | 1.64 | | | | (0.76) | | | | 2.05 | |
| | | | | | | | | | | | | | | | | | | | | | | | |
NET ASSET VALUE, END OF PERIOD | | $ | 26.19 | | | $ | 23.86 | | | $ | 18.46 | | | $ | 15.70 | | | $ | 14.06 | | | $ | 14.82 | |
| | | | | | | | | | | | | | | | | | | | | | | | |
| | | | | | |
TOTAL RETURN(e) | | | 9.77 | % | | | 29.25 | % | | | 17.58 | % | | | 11.66% | (f) | | | (5.13) | % | | | 16.05 | % |
RATIOS/SUPPLEMENTAL DATA: | | | | | | | | | | | | | | | | | | | | | | | | |
Net Assets, End of Period (000s) | | $ | 31,862 | | | $ | 28,222 | | | $ | 17,705 | | | $ | 14,690 | | | $ | 13,675 | | | $ | 17,872 | |
RATIOS TO AVERAGE NET ASSETS: | | | | | | | | | | | | | | | | | | | | | | | | |
Net Investment loss | | | (1.23) | % | | | (1.18) | % | | | (0.68) | % | | | (0.82)% | (g) | | | (0.77) | % | | | (0.77) | % |
Operating expenses excluding reimbursement/waiver | | | 2.25 | % | | | 2.38 | % | | | 2.54 | % | | | 2.55% | (g) | | | 2.45 | % | | | 2.50 | % |
Operating expenses including reimbursement/waiver | | | 2.25 | % | | | 2.38 | % | | | 2.49 | % | | | 2.44% | (g) | | | n/a | | | | n/a | |
PORTFOLIO TURNOVER RATE | | | 33 | % | | | 34 | % | | | 53 | % | | | 9% | (f) | | | 27 | % | | | 48 | % |
| (a) | Prior to its March 16, 2012 reorganization with and into the Emerald Banking and Finance Fund, the Fund was known as the Forward Banking and Finance Fund. |
| (b) | Effective March 13, 2012 the Board approved changing the fiscal year-end of the Fund from December 31 to April 30. |
| (c) | The amount shown for a share outstanding throughout the period may not correlate with the Statement of Operations for the period due to the timing of sales and redemptions of Fund shares in relation to income earned and/or fluctuating market value of the investments of the Fund. |
| (d) | Per share amounts are based upon average shares outstanding. |
| (e) | Total return does not reflect the effect of sales charges. |
See Notes to Financial Statements.
| | |
38 | | www.emeraldmutualfunds.com |
| | |
| Emerald Banking and Finance Fund | | Financial Highlights |
| | For a share outstanding throughout the periods presented |
| | | | | | | | | | | | | | | | |
| | | INSTITUTIONAL CLASS | |
| | | Year Ended
April 30, 2015 | | | Year Ended
April 30, 2014 | | | Year Ended
April 30, 2013 | | | For the Period
March 16, 2012 to
April 30, 2012(a) | |
NET ASSET VALUE, BEGINNING OF PERIOD | | $ | 26.29 | | | $ | 20.15 | | | $ | 16.96 | | | $ | 16.85 | |
INCOME/(LOSS) FROM OPERATIONS: | | | | | | | | | | | | | | | | |
Net investment income/(loss)(b) | | | (0.07) | | | | (0.06) | | | | 0.01 | | | | (0.01) | |
Net realized and unrealized gain on investments | | | 2.93 | | | | 6.20 | | | | 3.18 | | | | 0.12 | |
| | | | | | | | | | | | | | | | |
Total from Investment Operations | | | 2.86 | | | | 6.14 | | | | 3.19 | | | | 0.11 | |
| | | | | | | | | | | | | | | | |
| | | | |
NET INCREASE IN NET ASSET VALUE | | | 2.86 | | | | 6.14 | | | | 3.19 | | | | 0.11 | |
| | | | | | | | | | | | | | | | |
NET ASSET VALUE, END OF PERIOD | | $ | 29.15 | | | $ | 26.29 | | | $ | 20.15 | | | $ | 16.96 | |
| | | | | | | | | | | | | | | | |
| | | | |
TOTAL RETURN | | | 10.88 | % | | | 30.47 | % | | | 18.81 | % | | | 0.65% | (c) |
RATIOS/SUPPLEMENTAL DATA: | | | | | | | | | | | | | | | | |
Net Assets, End of Period (000s) | | $ | 23,730 | | | $ | 22,062 | | | $ | 4,321 | | | $ | 8 | |
RATIOS TO AVERAGE NET ASSETS: | | | | | | | | | | | | | | | | |
Net Investment income/(loss) | | | (0.25) | % | | | (0.23) | % | | | 0.06 | % | | | (0.27)% | (d) |
Operating expenses excluding reimbursement/waiver | | | 1.27 | % | | | 1.37 | % | | | 1.62 | % | | | 1.83% | (d) |
Operating expenses including reimbursement/waiver | | | 1.27 | % | | | 1.37 | % | | | 1.54 | % | | | 1.53% | (d) |
PORTFOLIO TURNOVER RATE | | | 33 | % | | | 34 | % | | | 53 | % | | | 9% | (c)(e) |
| (a) | The Fund began offering Institutional Class shares on March 16, 2012. |
| (b) | Per share amounts are based upon average shares outstanding. |
| (e) | Portfolio turnover rate is calculated at the Fund level and represents the period ended April 30, 2012. |
See Notes to Financial Statements.
| | |
Annual Report | April 30, 2015 | | 39 |
| | |
| Emerald Banking and Finance Fund | | Financial Highlights |
| | For a share outstanding throughout the periods presented |
| | | | | | | | | | | | | | | | | | | | | | | | |
| | | INVESTOR CLASS | |
| | | Year Ended
April 30,
2015 | | | Year Ended
April 30,
2014 | | | Year Ended
April 30,
2013 | | | For the Period
January 1,
2012 to
April 30,
2012(a)(b) | | | Year Ended December 31,
2011 | | | Period Ended
December 31,
2010(c) | |
NET ASSET VALUE, BEGINNING OF PERIOD | | $ | 25.01 | | | $ | 19.23 | | | $ | 16.25 | | | $ | 14.50 | | | $ | 15.14 | | | $ | 14.85 | |
INCOME/(LOSS) FROM OPERATIONS:(d) | | | | | | | | | | | | | | | | | | | | | | | | |
Net investment income/(loss)(e) | | | (0.15) | | | | (0.12) | | | | (0.01) | | | | (0.00) (f) | | | | 0.07 | | | | (0.02) | |
Net realized and unrealized gain/(loss) on investments | | | 2.78 | | | | 5.90 | | | | 2.99 | | | | 1.75 | | | | (0.71) | | | | 0.31 | |
| | | | | | | | | | | | | | | | | | | | | | | | |
Total from Investment Operations | | | 2.63 | | | | 5.78 | | | | 2.98 | | | | 1.75 | | | | (0.64) | | | | 0.29 | |
| | | | | | | | | | | | | | | | | | | | | | | | |
| | | | | | |
NET INCREASE/(DECREASE) IN NET ASSET VALUE | | | 2.63 | | | | 5.78 | | | | 2.98 | | | | 1.75 | | | | (0.64) | | | | 0.29 | |
| | | | | | | | | | | | | | | | | | | | | | | | |
NET ASSET VALUE, END OF PERIOD | | $ | 27.64 | | | $ | 25.01 | | | $ | 19.23 | | | $ | 16.25 | | | $ | 14.50 | | | $ | 15.14 | |
| | | | | | | | | | | | | | | | | | | | | | | | |
| | | | | | |
TOTAL RETURN | | | 10.52 | % | | | 30.06 | % | | | 18.34 | % | | | 12.07% | (g) | | | (4.23) | % | | | 1.95% | (g) |
RATIOS/SUPPLEMENTAL DATA: | | | | | | | | | | | | | | | | | | | | | | | | |
Net Assets, End of Period (000s) | | $ | 27,440 | | | $ | 19,235 | | | $ | 6,255 | | | $ | 693 | | | | $ 136 | | | $ | 4 | |
RATIOS TO AVERAGE NET ASSETS: | | | | | | | | | | | | | | | | | | | | | | | | |
Net Investment income/(loss) | | | (0.56) | % | | | (0.53) | % | | | (0.08) | % | | | (0.07)% | (h) | | | 0.47 | % | | | (0.20)% | (h) |
Operating expenses excluding reimbursement/waiver | | | 1.58 | % | | | 1.69 | % | | | 1.94 | % | | | 1.88% | (h) | | | 1.48 | % | | | 1.83% | (h) |
Operating expenses including reimbursement/waiver | | | 1.58 | % | | | 1.69 | % | | | 1.89 | % | | | 1.72% | (h) | | | n/a | | | | n/a | |
PORTFOLIO TURNOVER RATE | | | 33 | % | | | 34 | % | | | 53 | % | | | 9% | (g) | | | 27 | % | | | 48% | (i) |
| (a) | Prior to its March 16, 2012 reorganization with and into the Emerald Banking and Finance Fund, the Fund was known as the Forward Banking and Finance Fund. |
| (b) | Effective March 13, 2012 the Board approved changing the fiscal year-end of the Fund from December 31 to April 30. |
| (c) | The Fund began offering Investor Class shares on March 16, 2010. |
| (d) | The amount shown for a share outstanding throughout the period may not correlate with the Statement of Operations for the period due to the timing of sales and redemptions of Fund shares in relation to income earned and/or fluctuating market value of the investments of the Fund. |
| (e) | Per share amounts are based upon average shares outstanding. |
| (f) | Less than $0.005 per share. |
| (i) | Portfolio turnover rate is calculated at the Fund level and represents the year ended December 31, 2010. |
See Notes to Financial Statements.
| | |
40 | | www.emeraldmutualfunds.com |
| | |
| Emerald Funds | | Notes to Financial Statements |
| | April 30, 2015 |
1. ORGANIZATION
Financial Investors Trust (the “Trust”), a Delaware statutory trust, is an open-end management investment company registered under the Investment Company Act of 1940, as amended (the “1940 Act”). As of April 30, 2015, the Trust had 30 registered funds. This annual report describes the Emerald Growth Fund, Emerald Insights Fund and Emerald Banking and Finance Fund (each a “Fund” and collectively, the “Funds”). Prior to March 16, 2012, the Emerald Banking and Finance Fund was known as the Forward Banking and Finance Fund and the Emerald Growth Fund was known as the Forward Growth Fund. Effective March 13, 2012, the Board of Trustees (the “Board”) approved changing the fiscal year end of the Funds from December 31 to April 30.
The Emerald Growth Fund and the Emerald Insights Fund both seek to achieve long-term growth through capital appreciation.
The Emerald Banking and Finance Fund seeks to achieve long term growth through capital appreciation with income as a secondary objective.
2. SIGNIFICANT ACCOUNTING POLICIES
The accompanying financial statements were prepared in accordance with accounting principles generally accepted in the United States of America (“U.S. GAAP”). The preparation of financial statements in conformity with U.S. GAAP requires management to make certain estimates and assumptions that affect the reported amounts of assets and liabilities and disclosures of contingent assets and liabilities at the date of the financial statements and the reported amounts of revenue and expenses during the period. Actual results could differ from those estimates. The Funds are considered an investment company for financial reporting purposes under U.S. GAAP. The following is a summary of significant accounting policies consistently followed by the Funds in preparation of their financial statements.
Investment Valuation: The Funds generally value their securities based on market prices determined at the close of regular trading on the New York Stock Exchange (“NYSE”), normally, 4:00 p.m. Eastern time, on each business day the NYSE is open for trading.
For equity securities and mutual funds that are traded on an exchange, the market price is usually the closing sale or official closing price on that exchange. In the case of equity securities not traded on an exchange, or if such closing prices are not otherwise available, the securities are valued at the mean of the most recent bid and ask prices on such day. Redeemable securities issued by open-end registered investment companies are valued at the investment company’s applicable net asset value.
The market price for debt obligations is generally the price supplied by an independent third-party pricing service approved by the Board of Trustees (the “Board”), which may use a matrix, formula or other objective method that takes into consideration quotations from dealers, market transactions in comparable investments, market indices and yield curves. If vendors are unable to supply a price, or if the price supplied is deemed to be unreliable, the market price may be determined using quotations received from one or more brokers–dealers that make a market in the security. Short–term debt obligations that will mature in 60 days or less are valued at amortized cost, unless it is determined that using this method would not reflect an investment’s fair value. Investments in non-exchange traded funds are fair valued at their respective net asset values.
Equity securities that are primarily traded on foreign securities exchanges are valued at the preceding closing values of such securities on their respective exchanges, except when an occurrence subsequent to the time a value was so established is likely to have changed such value. In such an event, the fair values of those securities are determined in good faith through consideration of other factors in accordance with procedures established by and under the general supervision of the Board.
When such prices or quotations are not available, or when the Fair Value Committee appointed by the Board believes that they are unreliable, securities may be priced using fair value procedures approved by the Board.
Fair Value Measurements: A three-tier hierarchy has been established to classify fair value measurements for disclosure purposes. Inputs refer broadly to the assumptions that market participants would use in pricing the asset or liability, including assumptions about risk. Inputs may be observable or unobservable. Observable inputs are inputs that reflect the assumptions market participants would use in pricing the asset or liability that are developed based on market data obtained from sources independent of the reporting entity. Unobservable inputs are inputs that reflect the reporting entity’s own assumptions about the assumptions market participants would use in pricing the asset or liability that are developed based on the best information available. Various inputs are used in determining the value of each Fund’s investments as of the reporting period end. The designated input levels are not necessarily an indication of the risk or liquidity associated with these investments. These inputs are categorized in the following hierarchy under applicable financial accounting standards:
| | |
Level 1 – | | Unadjusted quoted prices in active markets for identical investments, unrestricted assets or liabilities that the Funds have the ability to access at the measurement date; |
Level 2 – | | Quoted prices which are not active, quoted prices for similar assets or liabilities in active markets or inputs other than quoted prices that are observable (either directly or indirectly) for substantially the full term of the asset or liability; and |
| | |
Annual Report | April 30, 2015 | | 41 |
| | |
| Emerald Funds | | Notes to Financial Statements |
| | April 30, 2015 |
| | |
Level 3 – | | Significant unobservable prices or inputs (including the Funds’ own assumptions in determining the fair value of investments) where there is little or no market activity for the asset or liability at the measurement date. |
The following is a summary of each input used to value the Funds as of April 30, 2015:
| | | | | | | | | | | | | | | | |
| Investments in Securities at Value | | Level 1 -
Quoted Prices | | | Level 2 -
Other Significant
Observable Inputs | | | Level 3 -
Significant
Unobservable
Inputs | | | Total | |
Emerald Growth Fund | | | | | | | | | | | | | | | | |
Common Stocks | | | | | | | | | | | | | | | | |
Financial Services | | $ | 49,792,507 | | | $ | 2,414,250 | | | $ | – | | | $ | 52,206,757 | |
Other(a) | | | 273,521,782 | | | | – | | | | – | | | | 273,521,782 | |
Warrants | | | – | | | | – | | | | – | | | | – | |
Short Term Investments | | | 9,098,235 | | | | – | | | | – | | | | 9,098,235 | |
TOTAL | | $ | 332,412,524 | | | $ | 2,414,250 | | | $ | – | | | $ | 334,826,774 | |
| | |
| | | | |
| Investments in Securities at Value | | Level 1 -
Quoted Prices | | | Level 2 -
Other Significant
Observable Inputs | | | Level 3 -
Significant
Unobservable
Inputs | | | Total | |
Emerald Insights Fund | | | | | | | | | | | | | | | | |
Common Stocks(a) | | $ | 6,097,701 | | | $ | – | | | $ | – | | | $ | 6,097,701 | |
Exchange Traded Funds(a) | | | 729,667 | | | | – | | | | – | | | | 729,667 | |
Master Limited Partnerships(a) | | | 68,886 | | | | – | | | | – | | | | 68,886 | |
Short Term Investments | | | 331,003 | | | | – | | | | – | | | | 331,003 | |
TOTAL | | $ | 7,227,257 | | | $ | – | | | $ | – | | | $ | 7,227,257 | |
| | |
| | | | |
| Investments in Securities at Value | | Level 1 -
Quoted Prices | | | Level 2 -
Other Significant
Observable Inputs | | | Level 3 -
Significant
Unobservable
Inputs | | | Total | |
Emerald Banking and Finance Fund | | | | | | | | | | | | | | | | |
Common Stocks | | | | | | | | | | | | | | | | |
Banks: Diversified | | $ | 91,028,668 | | | $ | 6,685,761 | | | $ | – | | | $ | 97,714,429 | |
Other(a) | | | 32,729,453 | | | | – | | | | – | | | | 32,729,453 | |
Short Term Investments | | | 853,301 | | | | – | | | | – | | | | 853,301 | |
TOTAL | | $ | 124,611,422 | | | $ | 6,685,761 | | | $ | – | | | $ | 131,297,183 | |
| | |
| (a) | For detailed descriptions of sector and industry, see the accompanying Schedule of Investments. |
The Funds recognize transfers between levels as of the end of the period. For the year ended April 30, 2015, the Funds had the following transfers between Level 1 and Level 2 securities.
| | | | | | | | | | | | | | | | |
| | | Level 1 | | | Level 2 | |
| Emerald Growth Fund | | Transfer In | | | Transfers (Out) | | | Transfer In | | | Transfers (Out) | |
| | | | | |
Common Stocks | | $ | – | | | $ | (2,414,250 | ) | | $ | 2,414,250 | | | $ | – | |
| | | | |
TOTAL | | $ | – | | | $ | (2,414,250 | ) | | $ | 2,414,250 | | | $ | – | |
| | |
| | |
42 | | www.emeraldmutualfunds.com |
| | |
| Emerald Funds | | Notes to Financial Statements |
| | April 30, 2015 |
| | | | | | | | | | | | | | | | |
| | | Level 1 | | | Level 2 | |
Emerald Banking and Finance Fund | | Transfer In | | | Transfers (Out) | | | Transfer In | | | Transfers (Out) | |
| | | | |
Common Stocks | | $ | – | | | $ | (5,342,101 | ) | | $ | 5,342,101 | | | $ | – | |
| | | | |
TOTAL | | $ | – | | | $ | (5,342,101 | ) | | $ | 5,342,101 | | | $ | – | |
| | |
The above transfers from Level 1 to Level 2 were due to the Funds’ lack of a closing market price. For the year ended April 30, 2015, the Emerald Insights Fund did not have any transfers between Level 1 and Level 2 securities.
For the year ended April 30, 2015, the Funds did not have any securities that used significant unobservable inputs (Level 3) in determining fair value.
Investment Transactions and Investment Income: Investment transactions are accounted for on the date the investments are purchased or sold (trade date). Realized gains and losses from investment transactions are reported on an identified cost basis, which is the same basis the Funds use for federal income tax purposes. Interest income, which includes accretion of discounts, is accrued and recorded as earned. Dividend income is recognized on the ex-dividend date or for certain foreign securities, as soon as information is available to the Funds. All of the realized and unrealized gains and losses and net investment income, are allocated daily to each class in proportion to its average daily net assets.
Real Estate Investment Trusts (“REITs”): The Funds may invest a portion of their assets in REITs and are subject to certain risks associated with direct investment in REITs. REITs may be affected by changes in the value of their underlying properties and by defaults by borrowers or tenants. REITs depend generally on their ability to generate cash flow to make distributions to shareowners, and certain REITs have self-liquidation provisions by which mortgages held may be paid in full and distributions of capital returns may be made at any time. In addition, the performance of a REIT may be affected by its failure to qualify for tax-free pass-through of income under the Internal Revenue Code of 1986, as amended (the “Code”), or its failure to maintain exemption from registration under the 1940 Act.
Trust Expenses: Some expenses of the Trust can be directly attributed to the Funds. Expenses which cannot be directly attributed to the Funds are apportioned among all funds in the Trust based on average net assets of each fund.
Fund and Class Expenses: Expenses that are specific to a Fund or class of shares of a Fund are charged directly to that Fund or share class. All expenses of the Fund, other than class specific expenses, are allocated daily to each class in proportion to its average daily net assets. Expenses that are common to the Funds generally are allocated among the Funds in proportion to their average daily net assets. Fees provided under the distribution (Rule 12b-1) and/or shareholder service plans for a particular class of the Funds are charged to the operations of such class.
Federal Income Taxes: Each Fund complies with the requirements under Subchapter M of the Internal Revenue Code of 1986, as amended, applicable to regulated investment companies and intends to distribute substantially all of its net taxable income and net capital gains, if any, each year so that the Funds will not be subject to excise tax on undistributed income and gains. The Funds are not subject to income taxes to the extent such distributions are made.
As of and during the year ended April 30, 2015, the Funds did not have a liability for any unrecognized tax benefits. The Funds file U.S. federal, state, and local tax returns as required. The Funds’ tax returns are subject to examination by the relevant tax authorities until expiration of the applicable statute of limitations, which is generally three years after the filing of the tax return for federal purposes and four years for most state returns. Tax returns for open years have incorporated no uncertain tax positions that require a provision for income taxes.
Distributions to Shareholders: Each Fund normally pays dividends and distributes capital gains, if any, on an annual basis. Income dividend distributions are derived from interest and other income each Fund receives from its investments, including short-term capital gains. Long term capital gain distributions are derived from gains realized when each Fund sells a security it has owned for more than a year. Each Fund may make additional distributions and dividends at other times if the portfolio manager believes doing so may be necessary for each Fund to avoid or reduce taxes.
| | |
Annual Report | April 30, 2015 | | 43 |
| | |
| Emerald Funds | | Notes to Financial Statements |
| | April 30, 2015 |
3. TAX BASIS INFORMATION
Reclassifications: As of April 30, 2015, permanent differences on book and tax accounting were reclassified. These differences had no effect on net assets and were primarily attributed to treatment of certain investments and net investment loss. These reclassifications were as follows:
| | | | | | | | | | | | |
| | | Undistributed Net
Investment Income | | | Accumulated Net
Realized Gain/(Loss)
on Investments | | | Paid-in Capital | |
Emerald Growth Fund | | $ | 1,356,597 | | | $ | – | | | $ | (1,356,597) | |
Emerald Insights Fund | | | 11,333 | | | | 1,646 | | | | (12,979) | |
Emerald Banking and Finance Fund | | | 803,495 | | | | (8,162) | | | | (795,333) | |
Included in those amounts reclassified was a net operating loss offset to Paid-in capital for the Emerald Growth Fund, the Emerald Insights Fund, and the Emerald Banking and Finance Fund in the amount of $1,356,597, $12,200, and $795,333 respectively.
Tax Basis of Investments: As of April 30, 2015, the aggregate cost of investments, gross unrealized appreciation/(depreciation) and net unrealized appreciation/(depreciation) for Federal tax purposes was as follows:
| | | | | | | | | | | | | | | | |
| | | Gross Appreciation (excess of value over tax cost) | | | Gross Depreciation (excess of tax cost over value) | | | Net Unrealized
Appreciation | | | Cost of Investments for Income Tax Purposes | |
Emerald Growth Fund | | $ | 81,575,127 | | | $ | (14,511,111) | | | $ | 67,064,016 | | | $ | 267,762,758 | |
Emerald Insights Fund | | | 803,232 | | | | (159,357) | | | | 643,875 | | | | 6,583,382 | |
Emerald Banking and Finance Fund | | | 36,856,177 | | | | (687,835) | | | | 36,168,342 | | | | 95,128,841 | |
Components of Distributable Earnings: As of April 30, 2015, components of distributable earnings were as follows:
| | | | | | | | | | | | |
| | | Emerald Growth Fund | | | Emerald Insights Fund | | | Emerald Banking and Finance Fund | |
Accumulated capital gains/(losses) | | $ | 22,535,419 | | | $ | (115,879) | | | $ | (3,281,196) | |
Net unrealized appreciation on investments | | | 67,064,016 | | | | 643,875 | | | | 36,168,342 | |
Other cumulative effect of timing differences | | | (847,422) | | | | (12,292) | | | | (269,341) | |
| |
Total | | $ | 88,752,013 | | | $ | 515,704 | | | $ | 32,617,805 | |
| |
Capital Losses: As of April 30, 2015, the Funds had capital loss carryforwards which may reduce the Funds’ taxable income arising from future net realized gains on investments, if any, to the extent permitted by the Code and thus may reduce the amount of the distributions to shareholders which would otherwise be necessary to relieve the Funds of any liability for federal tax. Pursuant to the Code, such capital loss carryforwards will expire as follows:
| | | | | | | | |
| | | Expiring in 2017 | | | Expiring in 2018 | |
Emerald Banking and Finance Fund | | $ | 1,673,837 | | | $ | 1,370,886 | |
During the year ended April 30, 2015, $2,294,350 of capital loss carryforwards were utilized by the Emerald Banking and Finance Fund.
The Emerald Insights Fund had non-expiring short-term capital losses in the amount of $51,209.
The Emerald Insights Fund and the Emerald Banking and Finance Fund elected to defer to the period ending April 30, 2016 capital losses recognized during the period November 1, 2014 to April 30, 2015 in the amount of $64,670 and $236,473 respectively.
As of April 30, 2015, Emerald Growth Fund, Emerald Insights Fund, and Emerald Banking and Finance Fund elected to defer to the period ending April 30, 2016, late year ordinary losses in the amount of $847,422, $12,292, and $269,341 respectively.
Tax Basis of Distributions to Shareholders: The character of distributions made during the year from net investment income or net realized gains may differ from its ultimate characterization for federal income tax purposes. Also, due to the timing of dividend distributions, the fiscal year in which amounts are distributed may differ from the fiscal year in which the income or realized gain were recorded by each Fund.
| | |
44 | | www.emeraldmutualfunds.com |
| | |
| Emerald Funds | | Notes to Financial Statements |
| | April 30, 2015 |
The tax character of distributions paid by the Funds for the fiscal year or period ended April 30, 2015, were as follows:
| | | | | | | | |
| | | Ordinary Income | | | Long-Term Capital Gain | |
Emerald Growth Fund | | $ | 7,294,238 | | | $ | 11,879,191 | |
Emerald Insights Fund | | | – | | | | – | |
Emerald Banking and Finance Fund | | | – | | | | – | |
The tax character of distributions paid by the Funds for the fiscal year ended April 30, 2014, were as follows:
| | | | | | | | |
| | | Ordinary Income | | | Long-Term Capital Gain | |
Emerald Growth Fund | | $ | 1,100,217 | | | $ | 15,427,273 | |
Emerald Insights Fund | | | – | | | | – | |
Emerald Banking and Finance Fund | | | – | | | | – | |
4. SECURITIES TRANSACTIONS
The cost of purchases and proceeds from sales of securities (excluding short-term securities) during the year or period ended April 30, 2015, was as follows:
| | | | | | | | |
| Funds | | Cost of Investments Purchased | | | Proceeds from Investments Sold | |
Emerald Growth Fund | | $ | 226,330,659 | | | $ | 187,155,262 | |
Emerald Insights Fund | | | 10,693,363 | | | | 4,323,424 | |
Emerald Banking and Finance Fund | | | 41,044,958 | | | | 39,903,375 | |
5. SHARES OF BENEFICIAL INTEREST
The capitalization of the Trust consists of an unlimited number of shares of beneficial interest with no par value per share. Holders of the shares of the Funds of the Trust have one vote for each share held and a proportionate fraction of a vote for each fractional share. All shares issued and outstanding are fully paid and are transferable and redeemable at the option of the shareholder. Purchasers of the shares do not have any obligation to make payments to the Trust or its creditors (other than the purchase price for the shares) or make contributions to the Trust or its creditors solely by reason of the purchasers’ ownership of the shares. Shares have no pre-emptive rights.
6. MANAGEMENT AND RELATED-PARTY TRANSACTIONS
Emerald Mutual Fund Advisers Trust, (“the Adviser”), subject to the authority of the Board, is responsible for the overall management and administration of the Funds’ business affairs. The Adviser manages the investments of the Funds in accordance with the Funds’ investment objective, policies and limitations and investment guidelines established jointly by the Adviser and the Trustees. Pursuant to the Advisory Agreement, the Funds pay the Adviser fees for the services and facilities it provides payable on a monthly basis at the annual rate set forth below of the Funds’ average daily net assets.
| | |
Emerald Growth Fund | | |
| |
Average Total Net Assets | | Contractual Fee |
| |
Up to and including $250M | | 0.75% |
| |
Over $250M and including $500M | | 0.65% |
| |
Over $500M and including $750M | | 0.55% |
| |
Over $750M | | 0.45% |
| |
Emerald Insights Fund | | |
| |
Average Total Net Assets | | Contractual Fee |
| |
Up to and including $250M | | 0.75% |
| |
Over $250M and including $500M | | 0.65% |
| |
Over $500M and including $750M | | 0.55% |
| |
Over $750M | | 0.45% |
| | |
Annual Report | April 30, 2015 | | 45 |
| | |
| Emerald Funds | | Notes to Financial Statements |
| | April 30, 2015 |
| | |
| |
Emerald Banking and Finance Fund | | |
| |
Average Total Net Assets | | Contractual Fee |
| |
Up to and including $100M | | 1.00% |
| |
Over $100M | | 0.90% |
The Adviser has contractually agreed to limit the total amount of “Management Fees” and “Other Expenses” that it is entitled to receive from each Fund through August 31, 2015, with respect to the Funds’ different classes, to the extent the Total Annual Fund Operating Expenses of a Fund (exclusive of acquired fund fees and expenses, brokerage expenses, interest expense, taxes and extraordinary expenses) exceed the annual rates (as a percentage of each Funds average daily net assets) set forth on the tables below. The Adviser will reduce the fee payable with respect to such Fund to the extent of such excess, and/or shall reimburse the Fund (or class) by the amount of such excess. The waiver or reimbursement shall be allocated to each class of the Fund in the same manner as the underlying expenses or fees were allocated. Pursuant to the expense limitation agreement between the Adviser and the Trust, each Fund will reimburse the Adviser for any contractual fee waivers and expense reimbursements made by the Adviser, provided that any such reimbursements made by each Fund to the Adviser will not cause the Funds’ expense limitation to exceed expense limitations in existence at the time the expense was incurred, or at the time of the reimbursement, whichever is lower, and the reimbursement is made within three years after the end of the fiscal year in which fees or expenses were incurred.
Emerald Growth Fund
| | | | | | |
| | | |
| Class A | | Class C | | Institutional Class | | Investor Class |
| 1.29% | | 1.94% | | 0.99% | | 1.34% |
Emerald Insights Fund
| | | | | | |
| | | |
| Class A | | Class C | | Institutional Class | | Investor Class |
| 1.35% | | 2.00% | | 1.05% | | 1.40% |
Emerald Banking and Finance Fund
| | | | | | |
| | | |
| Class A | | Class C | | Institutional Class | | Investor Class |
| 1.84% | | 2.49% | | 1.54% | | 1.89% |
For the period or year ended April 30, 2015, the fee waivers and/or reimbursements were as follows:
| | | | |
| Fund | | Fees Waived/Reimbursed By Adviser | | Recoupment of Past Waived Fees By
Adviser |
Emerald Growth Fund |
Class A | | $ – | | $ 5,720 |
Class C | | – | | 706 |
Institutional Class | | – | | 20,199 |
Investor Class | | – | | 397 |
Emerald Insights Fund | | | | |
Class A | | $ 41,382 | | $ – |
Class C | | 921 | | – |
Institutional Class | | 3,464 | | – |
Investor Class | | 1,872 | | – |
Emerald Banking and Finance Fund | | |
Class A | | $ – | | $ – |
Class C | | – | | – |
Institutional Class | | – | | – |
Investor Class | | – | | – |
| | |
46 | | www.emeraldmutualfunds.com |
| | |
| Emerald Funds | | Notes to Financial Statements |
| | April 30, 2015 |
As of 2015, the balances of recoupable expenses for each Fund were as follows:
| | | | | | | | | | | | | | | | |
| Fund | | Expires 2016 | | | Expires 2017 | | | Expires 2018 | | | Total | |
Emerald Growth Fund | | | | | | | | | | | | | | | | |
Class A | | $ | 37,509 | | | $ | 11,560 | | | $ | – | | | $ | 49,069 | |
Class C | | | 3,001 | | | | 1,471 | | | | – | | | | 4,472 | |
Institutional Class | | | 64,286 | | | | 16,688 | | | | – | | | | 80,974 | |
Investor Class | | | – | | | | – | | | | – | | | | – | |
Emerald Insights Fund | | | | | | | | | | | | | | | | |
Class A | | $ | – | | | $ | – | | | $ | 41,382 | | | $ | 41,382 | |
Class C | | | – | | | | – | | | | 921 | | | | 921 | |
Institutional Class | | | – | | | | – | | | | 3,464 | | | | 3,464 | |
Investor Class | | | – | | | | – | | | | 1,872 | | | | 1,872 | |
Emerald Banking and Finance Fund | | | | | | | | | | | | | | | | |
Class A | | $ | – | | | $ | – | | | $ | – | | | $ | – | |
Class C | | | – | | | | – | | | | – | | | | – | |
Institutional Class | | | – | | | | – | | | | – | | | | – | |
Investor Class | | | – | | | | – | | | | – | | | | – | |
The Funds will not be obligated to pay any such deferred fees and expenses more than three years after the year(s) in which the fees and expense were incurred.
Distributor: ALPS Distributors, Inc. (“ADI” or the “Distributor”) (an affiliate of ALPS Fund Services Inc. (“ALPS”)) acts as the distributor of the Funds’ shares pursuant to a Distribution Agreement with the Trust. Shares are sold on a continuous basis by ADI as agent for the Funds, and ADI has agreed to use its best efforts to solicit orders for the sale of Funds’ shares, although it is not obliged to sell any particular amount of shares. ADI is not entitled to any compensation for its services as Distributor. ADI is registered as a broker-dealer with the Securities and Exchange Commission.
Each Fund has adopted a separate Distribution and Services Plan (each a “Plan” and collectively, the “Plans”) pursuant to Rule 12b-1 of the 1940 Act. The Plans allow each Fund, as applicable, to use each Fund’s assets to pay fees in connection with the distribution and marketing of the Funds’ shares and/or the provision of shareholder services to the Funds’ shareholders. The Plan permits payment for services in connection with the administration of plans or programs that use shares of each Fund as their funding medium and for related expenses. The Plans permit each Fund to make total payments at an annual rate of up to 0.35%, 0.75% and 0.25% of the average daily net asset value of Class A, Class C and Investor Class, respectively. Because these fees are paid out of the Funds’ assets on an ongoing basis, over time they will increase the cost of an investment in the Funds, and Plan fees may cost an investor more than other types of sales charges.
Each Fund has adopted a Shareholder Services Plan (a “Shareholder Services Plan”) with respect to its shares. Under the Shareholder Services Plan, each Fund is authorized to pay banks and their affiliates and other institutions, including broker-dealers and Fund affiliates (“Participating Organizations”), an aggregate fee in an amount not to exceed on an annual basis 0.25%, 0.05% and 0.15% of the average daily net asset value of Class C, Institutional Class and Investor Class, respectively, of the Funds attributable to or held in the name of a Participating Organization for its clients as compensation for providing services pursuant to an agreement with a Participating Organization. Any amount of such payment not paid during the Funds’ fiscal year for such service activities shall be reimbursed to the Funds as soon as practicable after the end of the fiscal year. Shareholder Services Plan fees are included with distribution and service fees on the Statement of Operations.
Fund Administrator Fees and Expenses: ALPS Fund Services, Inc. (“ALPS”) serves as administrator to the Funds and the Funds have agreed to pay expenses incurred in connection with their administrative activities. Pursuant to an Administrative Agreement, ALPS provides operational services to the Funds including, but not limited to, fund accounting and fund administration and generally assists in the Funds’ operations. Officers of the Trust are employees of ALPS. The Funds’ administration fee is accrued on a daily basis and paid monthly. Administration fees paid by the Funds for the year ended April 30, 2015 are disclosed in the Statements of Operations.
ALPS is reimbursed by the Fund for certain out-of-pocket expenses.
Transfer Agent: ALPS serves as transfer, dividend paying and shareholder servicing agent for the Funds. ALPS receives an annual minimum fee, a fee based upon the number of shareholder accounts, and is also reimbursed by the Funds for certain out-of-pocket expenses.
| | |
Annual Report | April 30, 2015 | | 47 |
| | |
| Emerald Funds | | Notes to Financial Statements |
| | April 30, 2015 |
Compliance Services: ALPS provides services that assist the Trust’s chief compliance officer in monitoring and testing the policies and procedures of the Trust in conjunction with requirements under Rule 38a-1 under the 1940 Act and receives an annual base fee. ALPS is reimbursed for certain out-of-pocket expenses by the Funds.
Principal Financial Officer: ALPS receives an annual fee for providing principal financial officer services to the Funds.
7. INDEMNIFICATIONS
Under the Trust’s organizational documents, its officers and Trustees are indemnified against certain liability arising out of the performance of their duties to the Trust. Additionally, in the normal course of business, the Trust enters into contracts with service providers that may contain general indemnification clauses, which may permit indemnification to the extent permissible under applicable law. The Trust’s maximum exposure under these arrangements is unknown, as this would involve future claims that may be made against the Trust that have not yet occurred.
| | |
48 | | www.emeraldmutualfunds.com |
| | |
| | | Report of Independent Registered Public Accounting Firm |
| | |
To the Shareholders and Board of Trustees of Financial Investors Trust:
We have audited the accompanying statements of assets and liabilities, including the schedules of investments, of Emerald Growth Fund and Emerald Banking and Finance Fund, two of the portfolios of Financial Investors Trust as of April 30, 2015, the related statements of operations for the year then ended, the statements of changes in net assets for each of the two years in the period then ended, and the financial highlights for each of the three years in the period then ended and the period from January 1, 2012 to April 30, 2012. We have also audited the accompanying statement of assets of liabilities, including the schedule of investments, of Emerald Insights Fund (together with the Emerald Growth Fund and Emerald Banking and Finance Fund, the “Funds”), one of the portfolios of Financial Investors Trust as of April 30, 2015, the related statements of operations and changes in net assets, and the financial highlights for the period August 1, 2014 (Inception) to April 30, 2015. These financial statements and financial highlights are the responsibility of the Funds’ management. Our responsibility is to express an opinion on these financial statements and financial highlights based on our audits. The financial highlights for Emerald Growth Fund and Emerald Banking and Finance Fund for each of the two years in the period ended December 31, 2011 were audited by other auditors whose report, dated February 28, 2012, expressed an unqualified opinion on such financial highlights.
We conducted our audits in accordance with the standards of the Public Company Accounting Oversight Board (United States). Those standards require that we plan and perform the audit to obtain reasonable assurance about whether the financial statements and financial highlights are free of material misstatement. The Funds are not required to have, nor were we engaged to perform, an audit of their internal control over financial reporting. Our audits included consideration of internal control over financial reporting as a basis for designing audit procedures that are appropriate in the circumstances, but not for the purpose of expressing an opinion on the effectiveness of the Funds’ internal control over financial reporting. Accordingly, we express no such opinion. An audit also includes examining, on a test basis, evidence supporting the amounts and disclosures in the financial statements, assessing the accounting principles used and significant estimates made by management, as well as evaluating the overall financial statement presentation. Our procedures included confirmation of securities owned as of April 30, 2015, by correspondence with the custodian and brokers; where replies were not received from brokers, we performed other auditing procedures. We believe that our audits provide a reasonable basis for our opinion.
In our opinion, the financial statements and financial highlights referred to above present fairly, in all material respects, the financial position of Emerald Growth Fund, Emerald Banking and Finance Fund, and Emerald Insights Fund of Financial Investors Trust as of April 30, 2015, for the Emerald Growth Fund and Emerald Banking and Finance Fund the results of their operations for the year then ended, the changes in their net assets for each of the two years in the period then ended, and the financial highlights for each of the three years in the period then ended and the period from January 1, 2012 to April 30, 2012, and for the Emerald Insights Fund the results of its operations, changes in its net assets and the financial highlights for the period August 1, 2014 (Inception) to April 30, 2015, in conformity with accounting principles generally accepted in the United States of America.
DELOITTE & TOUCHE LLP
Denver, Colorado
June 26, 2015
| | |
Annual Report | April 30, 2015 | | 49 |
| | |
| | | Disclosure Regarding Approval of Fund Advisory Agreements |
| | April 30, 2015 (Unaudited) |
On December 9, 2014, the Trustees met in person to discuss, among other things, the approval of the investment advisory agreement between the Trust and Emerald Mutual Fund Advisers Trust (“Emerald”) (the “Investment Advisory Agreement”), in accordance with Section 15(c) of the 1940 Act. The Independent Trustees met with independent legal counsel during executive session and discussed the Investment Advisory Agreement and other related materials.
In renewing and approving the Investment Advisory Agreement with Emerald, the Trustees, including the Independent Trustees, considered the following factors with respect to the Emerald Growth Fund and Emerald Banking and Finance Fund (the “Emerald Funds”):
Investment Advisory Fee Rate: The Trustees reviewed and considered the contractual annual advisory fee to be paid by the Trust, on behalf of the Emerald Funds, to Emerald of 1.00% and 0.75% of the average daily net assets of the Emerald Banking and Finance Fund and the Emerald Growth Fund, respectively, in light of the extent and quality of the advisory services provided by Emerald to the Emerald Funds.
The Trustees considered the information they received comparing the Emerald Funds’ contractual annual advisory fee and total expenses (net of waivers) with those of funds in both the relevant peer expense group and universe of funds provided by an independent provider of investment company data.
The Trustees also considered the fee structures applicable to Emerald’s other clients employing a comparable strategy to that of the respective Emerald Funds.
Based on such information, the Trustees determined that the contractual annual advisory fee of 1.00% and the total net expense ratio of 1.72%, 1.69%, 2.39% and 1.37% of the Class A, Investor Class, Class C and Institutional Class Shares, respectively, of the Emerald Banking and Finance Fund, although generally greater than each respective peer group median, were generally reasonable in light of the long-term performance of the Fund compared with its peer group. The Trustees also determined that the contractual annual advisory fee of 0.75% and the total net expense ratio of 1.29%, 1.34%, 1.94% and 0.99% of the Class A, Investors Class, Class C and Institutional Class Shares, respectively, of the Emerald Growth Fund, were generally lower than their respective peer group medians.
Nature, Extent and Quality of the Services under the Investment Advisory Agreement: The Trustees received and considered information regarding the nature, extent and quality of services provided to the Emerald Funds under the Investment Advisory Agreement. The Trustees reviewed certain background materials supplied by Emerald in its presentation, including its Form ADV and Summary of Compliance Policies.
The Trustees reviewed and considered Emerald’s investment advisory personnel, its history as an asset manager, its performance and the amount of assets currently under management by Emerald. The Trustees also reviewed the research and decision-making processes utilized by Emerald, including the methods adopted to seek to achieve compliance with the investment objectives, policies and restrictions of the Emerald Funds.
The Trustees considered the background and experience of Emerald’s management in connection with the Emerald Funds, including reviewing the qualifications, backgrounds and responsibilities of the management team primarily responsible for the day-to-day portfolio management of the Emerald Funds and the extent of the resources devoted to research and analysis of actual and potential investments.
The Trustees also reviewed the accompanying Compliance-related materials and further noted that they have received reports on these services and Compliance issues at each regular Board meeting throughout the year related to the services rendered by Emerald with respect to the Emerald Funds.
Performance: The Trustees reviewed performance information for each Emerald Fund for the three-month, 1-year, 3-year, 5-year and 10-year periods, depending on share class inception date, ended September 30, 2014. That review included a comparison of each Emerald Fund’s performance to the performance of a universe of comparable funds selected by an independent provider of investment company data. The Trustees noted the Emerald Banking and Finance Fund Emerald generally underperformed its peer performance universe over the most recent three-month period, however, it had generally favorable comparable performance compared with its peer performance universe for the 1-year, 3-year, 5-year and 10-year periods. The Trustees noted the generally favorable performance of the Emerald Growth Fund compared with its peer performance universe for the three-month, 3-year, 5-year and 10-year periods.
Total Expense Ratios and the Adviser’s Profitability: The Trustees received and considered information provided by an independent provider of investment company data comparing the Emerald Funds’ total expense ratios against their respective expense groups, as well as a profitability analysis prepared by Emerald based on the fees payable under the Investment Advisory Agreement. The Trustees considered the profits, if any, realized by Emerald in connection with the operation of the Emerald Funds. The Board then reviewed Emerald’s financial statements in order to analyze the financial condition and stability and profitability of the adviser.
| | |
50 | | www.emeraldmutualfunds.com |
| | |
| | | Disclosure Regarding Approval of Fund Advisory Agreements |
| | April 30, 2015 (Unaudited) |
Economies of Scale: The Trustees considered whether economies of scale in the provision of services to the Emerald Funds will be passed along to the shareholders under the proposed agreements.
Other Benefits to the Adviser: The Trustees reviewed and considered any other incidental benefits derived or to be derived by Emerald from its relationship with the Emerald Funds, including whether soft dollar arrangements were used.
In selecting Emerald as the Emerald Funds’ investment adviser and approving the Investment Advisory Agreement and the fees charged under the Investment Advisory Agreement, the Trustees concluded that no single factor reviewed by the Trustees was identified by the Trustees to be determinative as the principal factor in whether to approve the Investment Advisory Agreement. Further, the Independent Trustees were advised by separate independent legal counsel throughout the process. The Trustees, including all of the Independent Trustees, concluded that:
| | — | | the investment advisory fees to be received by Emerald and total net expenses with respect to the Emerald Funds were, although in the case of the Emerald Banking and Finance Fund higher than the applicable peer group medians, within an acceptable range of the median, and in the case of the Emerald Growth Fund were actually lower than the applicable peer group median; |
| | — | | the nature, extent and quality of services to be rendered by Emerald under the Investment Advisory Agreement were adequate; |
| | — | | the performance of the Emerald Funds was, in the case of the Emerald Banking and Finance Fund, within an acceptable range of the performance of the funds in the applicable peer universe provided by an independent provider of investment company data, or, in the case of the Emerald Growth Fund, generally favorable over periods of three or more years and within an acceptable range over 1-year periods; |
| | — | | the profit, if any, anticipated to be realized by Emerald in connection with the operation of the Emerald Funds is not unreasonable to the Trust; and |
| | — | | to the extent there were any material economies of scale or other benefits accruing to Emerald in connection with its relationship with the Emerald Funds, their benefits had been substantially passed through to shareholders. |
Based on the Trustees’ deliberations and their evaluation of the information described above, the Trustees, including all of the Independent Trustees, concluded that Emerald’s compensation for investment advisory services is consistent with the best interests of the Emerald Funds and their shareholders.
| | |
Annual Report | April 30, 2015 | | 51 |
| | |
| Emerald Funds | | Additional Information |
| | April 30, 2015 (Unaudited) |
1. FUND HOLDINGS
The Funds file their complete schedule of portfolio holdings with the Securities and Exchange Commission (the “SEC”) for the first and third quarters of each fiscal year on Form N-Q within 60 days after the end of the period. Copies of the Funds’ Form N-Q are available without charge on the SEC website at http://www.sec.gov. You may also review and copy the Form N-Q at the SEC’s Public Reference Room in Washington, DC. For more information about the operation of the Public Reference Room, please call the SEC at 1-800-SEC-0330.
2. FUND PROXY VOTING POLICIES, PROCEDURES AND SUMMARIES
Each Fund’s policies and procedures used in determining how to vote proxies and information regarding how the Funds voted proxies relating to portfolio securities during the most recent prior 12-month period ending June 30 are available without charge, (1) upon request, by calling (toll-free) (855) 828-9909 and (2) on the SEC’s website at http://www.sec.gov.
3. TAX INFORMATION
The Funds designate the following for federal income tax purposes for distributions made during the calendar year ended December 31, 2014:
| | | | | | | | |
| | | QDI | | | DRD | |
Emerald Growth Fund | | | 10.81 | % | | | 10.81 | % |
Emerald Insights Fund | | | 0.00 | % | | | 0.00 | % |
Emerald Banking and Finance Fund | | | 0.00 | % | | | 0.00 | % |
In early 2015, if applicable, shareholders of record received this information for the distribution paid to them by the Funds during the calendar year 2014 via Form 1099. The Funds will notify shareholders in early 2016 of amounts paid to them by the Funds, if any, during the calendar year 2015.
Pursuant to Section 852(b)(3) of the Internal Revenue Code, Emerald Growth Fund designated $11,879,191 as long-term capital gain dividends.
| | |
52 | | www.emeraldmutualfunds.com |
| | |
| Emerald Funds | | Trustees & Officers |
| | April 30, 2015 (Unaudited) |
Additional information regarding the Fund’s trustees is included in the Statement of Additional Information, which can be obtained without charge by calling 855-828-9909.
INDEPENDENT TRUSTEES
| | | | | | | | | | |
Name,
Address*
& Year of Birth | | Position(s) Held with Fund | | Term of Office and Length of Time Served** | | Principal Occupation(s)
During Past 5 Years*** | | Number of Funds in Fund Complex
Overseen by Trustee**** | | Other Directorships Held by Trustee During Past 5 Years |
Mary K. Anstine, 1940 | | Trustee | | Ms. Anstine was elected at a special meeting of shareholders held on March 21, 1997 and re-elected at a special meeting of shareholders held on August 7, 2009. | | Ms. Anstine was formerly an Executive Vice President of First Interstate Bank of Denver until 1994, President/Chief Executive Officer of HealthONE Alliance, Denver, Colorado, from 1994 to 2004, and has been retired since 2004. Ms. Anstine is also Trustee/Director of AV Hunter Trust and Colorado Uplift Board. Ms. Anstine was formerly a Director of the Trust Bank of Colorado (later purchased and now known as Northern Trust Bank), HealthONE and Denver Area Council of the Boy Scouts of America, and a member of the American Bankers Association Trust Executive Committee. | | 30 | | Ms. Anstine is a Trustee of ALPS ETF Trust (18 funds); ALPS Variable Investment Trust (9 funds); Reaves Utility Income Fund (1 fund); and Westcore Trust (12 funds). |
John R. Moran, Jr., 1930 | | Trustee | | Mr. Moran was elected at a special meeting of shareholders held on March 21, 1997 and re-elected at a special meeting of shareholders held on August 7, 2009. | | Mr. Moran formerly served as President and CEO of The Colorado Trust, a private foundation serving the health and hospital community in the state of Colorado, from 1991 to 2007. During his career as an attorney from 1958 to 1991, Mr. Moran was formerly a partner with the firm of Kutak Rock & Campbell in Denver, Colorado and a member of the Colorado House of Representatives. Currently, Mr. Moran is a member of the Treasurer’s Investment Advisory Committee for the University of Colorado. | | 30 | | None. |
| * | All communications to Trustees and Officers may be directed to Financial Investors Trust c/o 1290 Broadway, Suite 1100, Denver, CO 80203. |
| ** | This is the period for which the Trustee or Officer began serving the Trust. Each Trustee and/or Officer serves an indefinite term, until his successor is elected. |
| *** | Except as otherwise indicated, each individual has held the office shown or other offices in the same company for the last five years. |
| **** | The Fund Complex includes all series of the Trust (currently 30) and any other investment companies for which any Trustee serves as Trustee for and which Emerald Mutual Fund Advisers Trust provides investment advisory services (currently none). |
| | |
Annual Report | April 30, 2015 | | 53 |
| | |
| Emerald Funds | | Trustees & Officers |
| | April 30, 2015 (Unaudited) |
INDEPENDENT TRUSTEES
| | | | | | | | | | |
Name,
Address*
& Year of Birth | | Position(s) Held with Fund | | Term of Office and Length of Time Served** | | Principal Occupation(s) During Past 5 Years*** | | Number of Funds in Fund Complex Overseen by Trustee**** | | Other Directorships Held by Trustee During Past 5 Years |
| | | | | |
Jeremy W. Deems, 1976 | | Trustee | | Mr. Deems was appointed as a Trustee at the March 11, 2008 meeting of the Board of Trustees and elected at a special meeting of shareholders held on August 7, 2009. | | Mr. Deems is the Co-Founder and Chief Financial Officer of Green Alpha Advisors, LLC, a registered investment advisor, and Co-Portfolio Manager of the Shelton Green Alpha Fund. Prior to joining Green Alpha Advisors, Mr. Deems was CFO and Treasurer of Forward Management, LLC, ReFlow Management Co., LLC, ReFlow Fund, LLC, a private investment fund, and Sutton Place Management, LLC, an administrative services company, from 1998 to June 2007. From 2004 to 2005, Mr Deems also served as Treasurer of the Forward Funds and the Sierra Club Funds. | | 30 | | Mr. Deems is a Trustee of ALPS ETF Trust (18 funds); ALPS Variable Investment Trust (9 funds) and Reaves Utility Income Fund (1 fund). |
| | | | | |
Jerry G. Rutledge, 1944 | | Trustee | | Mr. Rutledge was elected at a special meeting of shareholders held on August 7, 2009. | | Mr. Rutledge is the President and owner of Rutledge’s Inc., a retail clothing business. Mr. Rutledge is currently serving as a Director of the University of Colorado Hospital. Mr. Rutledge was from 1994 to 2007 a Regent of the University of Colorado. | | 30 | | Mr. Rutledge is a Trustee of Principal Real Estate Income Fund (1 fund), Clough Global Allocation Fund (1 fund), Clough Global Equity Fund (1 fund) and Clough Global Opportunities Fund (1 fund). |
| | | | | |
Michael “Ross” Shell, 1970 | | Trustee | | Mr. Shell was elected at a special meeting of shareholders held on August 7, 2009. | | Mr. Shell is Founder and CEO of Red Idea, LLC, a strategic consulting/early stage venture firm (since June 2008). From 1999 to 2009, he was a part- owner and Director of Tesser, Inc., a brand agency. From December 2005 to May 2008, he was Director, Marketing and Investor Relations, of Woodbourne, a REIT/real estate hedge fund and private equity firm. Prior to this, from May 2004 to November 2005, he worked as a business strategy consultant; from June 2003 to April 2004, he was on the Global Client Services team of IDEO, a product design/innovation firm; and from 1999 to 2003, he was President of Tesser, Inc. Mr. Shell graduated with honors from Stanford University with a degree in Political Science. | | 30 | | None. |
| * | All communications to Trustees and Officers may be directed to Financial Investors Trust c/o 1290 Broadway, Suite 1100, Denver, CO 80203. |
| ** | This is the period for which the Trustee or Officer began serving the Trust. Each Trustee and/or Officer serves an indefinite term, until his successor is elected. |
| *** | Except as otherwise indicated, each individual has held the office shown or other offices in the same company for the last five years. |
| **** | The Fund Complex includes all series of the Trust (currently 30) and any other investment companies for which any Trustee serves as Trustee for and which Emerald Mutual Fund Advisers Trust provides investment advisory services (currently none). |
| | |
54 | | www.emeraldmutualfunds.com |
| | |
| Emerald Funds | | Trustees & Officers |
| | April 30, 2015 (Unaudited) |
INTERESTED TRUSTEE
| | | | | | | | | | |
Name,
Address*
& Age | | Position(s) Held with Fund | | Term of Office and Length of Time Served** | | Principal Occupation(s) During Past 5 Years*** | | Number of Funds
in Fund Complex
Overseen by
Trustee**** | | Other Directorships Held by Trustee |
Edmund J. Burke, 1961 | | Trustee, Chairman and President | | Mr. Burke was elected as Chairman at the August 28, 2009 meeting of the Board of Trustees. Mr. Burke was elected as Trustee at a special meeting of shareholders held on August 7, 2009. Mr. Burke was elected President of the Trust at the December 17, 2002 meeting of the Board of Trustees. | | Mr. Burke is President and a Director of ALPS Holdings, Inc. (“AHI”) (since 2005) and Director of Boston Financial Data Services, Inc. (“BFDS”), ALPS Advisors, Inc. (“AAI”), ALPS Distributors, Inc. (“ADI”), ALPS Fund Services, Inc. (“AFS”) and ALPS Portfolio Solutions Distributor, Inc. (“APSD”) and from 2001-2008, was President of AAI, ADI, AFS and APSD. Because of his positions with AHI, BFDS, AAI, ADI, AFS and APSD, Mr. Burke is deemed an affiliate of the Trust as defined under the 1940 Act. Mr. Burke is Trustee and President of the Clough Global Allocation Fund (Trustee since 2006; President since 2004); Trustee and President of the Clough Global Equity Fund (Trustee since 2006; President since 2005); Trustee and President of the Clough Global Opportunities Fund (since 2006); Trustee of the Liberty All-Star Equity Fund; and Director of the Liberty All-Star Growth Fund, Inc. | | 35 | | Mr. Burke is a Trustee of Clough Global Allocation Fund (1 fund); Clough Global Equity Fund (1 fund); Clough Global Opportunities Fund (1 fund); Trustee of the Liberty All-Star Equity Fund (1 fund); and Director of the Liberty All-Star Growth Fund, Inc. (1 fund). |
| | |
Annual Report | April 30, 2015 | | 55 |
| | |
| Emerald Funds | | Trustees & Officers |
| | April 30, 2015 (Unaudited) |
OFFICERS
| | | | | | |
Name, Address*
& Year of Birth | | Position(s) Held with Fund | | Term of Office and Length of Time Served** | | Principal Occupation(s) During Past 5 Years*** |
Kimberly R. Storms, 1972 | | Treasurer | | Ms. Storms was elected Treasurer of the Trust at the March 12, 2013 meeting of the Board of Trustees. | | Ms. Storms is Senior Vice President and Director of Fund Administration of ALPS. Because of her position with ALPS, Ms. Storms is deemed an affiliate of the Trust as defined under the 1940 Act. Ms. Storms is also Treasurer of Liberty All-Star Equity Fund and Liberty All-Star Growth Fund, Inc. and Chief Financial Officer of The Arbitrage Funds. |
David T. Buhler, 1971 | | Secretary | | Mr. Buhler was elected Secretary of the Trust at the September 11, 2012 meeting of the Board of Trustees. | | Mr. Buhler joined ALPS in June 2010. He is currently Vice President and Senior Associate Counsel of ALPS, AAI, ADI and APSD. Prior to joining ALPS, Mr. Buhler served as Associate General Counsel and Assistant Secretary of Founders Asset Management LLC from 2006 to 2009. Because of his position with ALPS, Mr. Buhler is deemed an affiliate of the Trust as defined under the 1940 Act. Mr. Buhler is also the Secretary ALPS Variable Investment Trust, ALPS ETF Trust and Westcore Trust. |
Ted Uhl, 1974 | | Chief Compliance Officer (“CCO”) | | Mr. Uhl was appointed CCO of the Trust at the June 8, 2010 meeting of the Board of Trustees. | | Mr. Uhl joined ALPS in October 2006, and is currently Deputy Compliance Officer of ALPS. Prior to his current role, Mr. Uhl served as Senior Risk Manager for ALPS from October 2006 until June 2010. Because of his position with ALPS, Mr. Uhl is deemed an affiliate of the Trust as defined under the 1940 Act. Mr. Uhl is also CCO of the Clough Global Funds, Reaves Utility Income Fund, Centre Funds and Transparent Value Trust. |
| * | All communications to Trustees and Officers may be directed to Financial Investors Trust c/o 1290 Broadway, Suite 1100, Denver, CO 80203. |
| ** | This is the period for which the Trustee or Officer began serving the Trust. Each Trustee and/or Officer serves an indefinite term, until his successor is elected. |
| *** | Except as otherwise indicated, each individual has held the office shown or other offices in the same company for the last five years. |
| | |
56 | | www.emeraldmutualfunds.com |


TABLE OF CONTENTS
| | | | |
Shareholder Letter | | | 1 | |
|
| |
| |
Performance Update | | | 5 | |
|
| |
| |
Disclosure of Fund Expenses | | | 13 | |
|
| |
Portfolio of Investments | | | | |
| |
Grandeur Peak Emerging Markets Opportunities Fund | | | 14 | |
| |
Grandeur Peak Global Opportunities Fund | | | 19 | |
| |
Grandeur Peak Global Reach Fund | | | 24 | |
| |
Grandeur International Opportunities Fund | | | 31 | |
|
| |
| |
Statements of Assets and Liabilities | | | 36 | |
|
| |
| |
Statements of Operations | | | 37 | |
|
| |
Statement(s) of Changes in Net Assets | | | | |
| |
Grandeur Peak Emerging Markets Opportunities Fund | | | 38 | |
| |
Grandeur Peak Global Opportunities Fund | | | 40 | |
| |
Grandeur Peak Global Reach Fund | | | 41 | |
| |
Grandeur Peak International Opportunities Fund | | | 43 | |
|
| |
Financial Highlights | | | | |
| |
Grandeur Peak Emerging Markets Opportunities Fund | | | 44 | |
| |
Grandeur Peak Global Opportunities Fund | | | 46 | |
| |
Grandeur Peak Global Reach Fund | | | 48 | |
| |
Grandeur Peak International Opportunities Fund | | | 50 | |
|
| |
| |
Notes to Financial Statements | | | 52 | |
|
| |
| |
Report of Independent Registered Public Accounting Firm | | | 65 | |
|
| |
| |
Disclosure Regarding Approval of Fund Advisory Agreement | | | 66 | |
|
| |
| |
Additional Information | | | 68 | |
|
| |
| |
Trustees and Officers | | | 69 | |
|
| |
| | |
| Grandeur Peak Funds® | | Shareholder Letter |
April 30, 2015 (Unaudited)
| | | | |
 | | |
| | |
Robert Gardiner, CFA CEO & Portfolio Manager | | Blake Walker CIO & Portfolio Manager | | |
Dear Fellow Shareholders,
Most markets were up again this past year. We’ve been complaining for a while now that it has been getting harder and harder to find interesting companies at reasonable prices, and now after yet another year of pretty strong equity returns, our job is again that much more difficult. The real problem for us (and we suspect most bottom-up stock pickers) is that the returns from equities across the globe have been driven more by multiple expansion1 than earnings growth. Looking back over the past 15 quarters (12/31/11 – 3/31/15, since roughly the launch of our first funds), public companies have seen relatively modest revenue growth, no real change in margins, and therefore pretty tepid earnings growth (except in the case of European small cap companies and Japanese large caps), and yet stock prices are up significantly.2
So, it continues to get harder to find high quality companies with good fundamental momentum at attractive valuations. Markets of course cycle over time and frankly we look forward to a better investment environment at some point in the future. In the meantime, we’ll keep turning over new rocks, sticking to our discipline, and investing in what we believe to be high quality companies with strong long-term business models, albeit at slightly higher valuations.
Fund Commentary
“In math, we can sort of know that we’re wrong. We can even sometimes know that we’re right. But with most of science, you could never know that you’re right. . . . The main thing is where you set the bar between success and failure. Some people will say 99 percent correct is failure because you made a mistake.”
— Donald Knuth (WSJ Magazine, 3/27/15)3
Our belief is when it comes to investing, one can rarely know if a decision is right or wrong, and most decisions may be part both. Sometimes the analysis is good, but the timing of the buy or sell is off, or the sizing of the position is sub-optimal, or the overall composition of the portfolio (which in our case is determined almost entirely from our bottom-up stock analysis) is sub-optimal. Making mistakes is absolutely part of the process at Grandeur Peak Global Advisors. However, we believe that therein also lies the seeds of our future success.
Over the past year we’ve had some nice wins and we’ve also made mistakes. In the exciting, but tricky, world of small cap investing the key is of course to have your winners outpacing your losers. We are pleased that the net result for the past year was once again for each of our Funds to finish nicely ahead of its respective benchmark index (see performance for the period on pages 5, 7, 9 and 11).
Yet, there were times during the year when we were zigging while the market was zagging. We saw this happen some in the last calendar quarter. We were significantly overweight in Emerging Markets relative to the benchmark (while Emerging Markets lagged), and we were underweight in the strong Japan and Biotech markets. We know this will happen given our bottom-up company approach, and is not overly concerning to us as long-term investors. It doesn’t change our approach, it simply causes us to look harder at our portfolio to make sure we continue to believe that we have built a good portfolio for long-term success. There were a few company specific mistakes that of course we wish we hadn’t made, but we continue to like the composition of our portfolios.
Detailed analysis and commentary of the latest quarter’s results can be found each quarter at www.grandeurpeakglobal.com.
| | |
Annual Report | April 30, 2015 | | 1 |
| | |
| Grandeur Peak Funds® | | Shareholder Letter |
April 30, 2015 (Unaudited)
Notes from the Road
Over the past year we have talked with companies from 52 different countries. To give you a colorful sense of our global travels, here are Blake’s notes from a recent day in Oman:
My plane from Dubai arrives in Muscat, the capital city Sultanate of Oman, on a Thursday at 10pm. I collect my luggage and go the visa counter where a lady informs me I won’t need to buy one as I will only be in the country for a day. I clear customs and go to find a taxi to take me to the Best Western hotel. The metered taxis seem expensive so I go back to the terminal where many a friendly fellow had offered to provide transportation at a good price. I talk to a gentleman and get the price I want and we walk down a corridor leading to a terminal exit. I hear a commotion and see seven angry Omanis running towards us. They are extremely kind to me and explain I can’t go with this guy as what he is doing is illegal and I turn around and walk back towards the traditional taxi queue while the bunch angrily explain airport rules to this transportation provider (that’s my assumption anyway).
I get to the hotel at 11:30pm. I iron a shirt and I confirm for the third time with the analyst who arranged my meetings the next day where and when a car would be picking me up. He confirms that I should take a taxi to my first meeting after which a car would be waiting to gather me. There is no doubt this will be the case. I have confirmed it three times. I go to bed at 12:30am.
At 6:45am my alarm goes off. I woke up 3 times in the night not because of jet lag but because there was some sort of loud trucking business next door. This is literally the 5th night in row where I have only gotten 6 hours of sleep or less and I’m tired. I open the hotel room door and grab the newspaper where the front page headline is something to the effect of “don’t shoot your machine guns in the air in celebration anymore” as a dozen people had been killed the week before because of this and the government was telling imams to educate their flocks on the importance of refraining from this practice.
I hail a cab to take me to my 8am meeting with Mr. Abdul Qadir Shamsuddin who is the CEO of Al Anwar Ceramics, an Omani tile company Amy, Spencer and I first did a call with on April 29th, 2013. I see the Royal Opera House out the window on my way which I assume will be the extent of my sightseeing for the trip. I meet with Mr. Shamsuddin for 90 minutes and I am quite impressed with his vision and the way my questions are answered. I leave Al Anwar’s modest headquarters and go outside to catch the car that the aforementioned analyst has arranged for me to take to Al Anwar’s factory which is 111 miles away. There’s no car. I wait a few minutes and still no car arrives. I go back inside the building and ask if I can use a phone and I call the analyst who tells me he’s very sorry but he thought I was going to take a cab to the factory and that I didn’t need a car. I tell him I don’t think I can catch a cab 111 miles out to the middle of the desert. I talk to the CEO who says I’m in luck, somebody else is going out to the factory at that very moment and I can catch a ride.
I get in a car with two gentlemen one of whom is a full-time driver for the company and the other is the buyer for Al Anwar’s largest customer, an Egyptian gentleman who works for one of Saudi Arabia’s biggest tile distributors/retailers and Saudi Arabia happens to be a key growth area for Al Anwar. What a stroke of luck! We talk about creating our own luck and every single trip I take I connect some sort of dot I wasn’t intending to. I spend 90 minutes speaking to this buyer about the market in Saudi Arabia and about his suppliers and those that are high quality those that aren’t and he provides great insight.
We arrive at the factory where I sit down with the CFO of Al Anwar, Mr. A Suresh for another 90 minutes. We then tour two different manufacturing lines (one older and one newer) and he walks me through each step in quite a bit of detail. We talk everything from raw material sourcing to waste to manufacturing equipment. Mr. Suresh is quite impressive as well. We’ve only ever spoken to him on the phone and this is our first time meeting face to face. I go through almost each line item on the balance sheet and the income statement and cash flow statement to make sure I have a good handle for the financials. I ask super detailed questions including the questions our consumer analyst, Amy, has sent me and Mr. Suresh impressively answers them all.
I have to get back to the airport for a 5pm flight that I don’t want to miss because I can get back to Dubai in time for an 11pm flight back to Atlanta and then on to SLC. The same gentleman who drove me out to the factory drives me back to town. I see an ancient fort out of the car window. That’s the second piece of sightseeing I’ve done today. The drive is actually quite pleasant and it almost feels as if I am driving somewhere through Arizona. I haven’t eaten lunch which is typical and I’m getting hungry and the driver stops for gas and I get a package of nuts. While there is a bit of a language barrier with the driver, I speak to him for almost the entire trip not just about the company and its culture, which provides fascinating (and I believe truthful) insight into what is really happening at the company, but also about Oman in general and what the average person feels about what is happening in the country. The sample size is small but it’s relevant.
I get to the airport and go through customs and find out my flight is delayed which is so classic. I don’t land in Dubai until it’s too late to catch a flight to Atlanta. I get to an airport hotel at 11:15pm. I want to take a shower after a long day but it turns out there’s no water and the water won’t be back on for another 6 hours.
| | |
2 | | 1.855.377.7325 | www.GrandeurPeakGlobal.com |
| | |
| Grandeur Peak Funds® | | Shareholder Letter |
April 30, 2015 (Unaudited)
I do however finally get a great night’s sleep. It’s so typical to get a great night’s rest on the last night of a trip. I wake up refreshed in the morning and sit outside at a solitary table and I get quite a bit of work done including a 9-page write-up for the day I just spent with Al Anwar. Thankfully my 11pm flight to Atlanta departs on time. But there’s a massive headwind and it takes over 17 hours to travel from Dubai to Atlanta and I miss my connecting flight to SLC. And every other flight back to SLC is full. I’ve been gone for a week and I have 4 little kids and it would be nice to get home and see them and give my wife a break. I figure out a way to get on a plane to Detroit and then from Detroit back to SLC and I’m home a mere 29 hours late.
Hopefully that gives you a flavor for an average day of due diligence on a given company. Maybe it sounds a bit pedantic and I’ve given too much detail. But undoubtedly many of our trips involve little sleep and little time for lunch and little glamor other than a Best Western breakfast and none of them ever go perfectly as planned and the sightseeing tends to be limited at best and the due diligence tends to be fairly pragmatic in nature. But to me and all of us at Grandeur Peak it couldn’t be more invigorating and exciting.
Perhaps the most satisfying or fascinating thing about this trip was the opportunity I had to connect some global dots, which is a phenomenon that occurs on every single one of our trips. Such a statement is not hyperbole. That is the absolute truth. I had met with the CEO and CFO of a major competitor of Al Anwar earlier that week in Dubai. On one of the slides this competitor presented, they had a list of worldwide competitors. They said to me “you probably don’t recognize any of these companies but we highlight them because we think they’re the best and we benchmark ourselves against them and we want to become more like them.” The truth of the matter is I actually did recognize them. And I recognized them because I wasn’t simply an investor focused on the Middle East which is the type of investor this company was obviously used to dealing with. In fact, we currently own 3 of the companies they mentioned as being world class. I literally knew every single name they brought up. I have visited 3 of the names which are located in India, Egypt, and Indonesia. And with the exception of one Saudi company, I’ve spoken on the phone to the rest of the others, ALL of which our team has personally visited in Turkey, Sri Lanka, the UK, the US, India, Egypt, South Africa, Hong Kong/China, and Thailand. And now I have visited 2 more on this trip in the UAE and Oman.
The mosaic that is assembled from this dot-connecting is powerful and exciting and it’s really at the very core of what we’re all about.
Business Update
We don’t have much new to report on the business front as all our Funds remained closed. We have added a few employees to both the research and operations teams. We’re now up to 32 people, 21 of which are in research. We have 22 full-time employees and 10 part-time, and we’re feeling really good about the team. We are tweaking the structure of our research team a bit and are confident the change will strengthen the process. Essentially we have formalized the focus of each analyst beyond their primary sector responsibility. Each analyst will now be part of an industry team, a geography team and a fund team. While it might be a little difficult to balance wearing 3 hats, we think it will ensure our global analysis is never performed in a vacuum and that each Fund is receiving dedicated attention.
In 1983 the CFA Institute (AIMR back then) held a “Managing the Investment Professional” conference in Chicago. Charlie Ellis presented what he believed to be the characteristics of successful investment firms. He began his remarks with the following: “It should, in theory, really be quite easy to develop a first-rate professional firm. We all know the recipe. Get top people. Have a clear purpose. Have high professional standards. Take a long term view. Always remember that clients come ahead of the firm. Always remember that the firm comes ahead of the individual. And always remember, as an individual, that professional commitments come ahead of financial rewards. Maintain discipline at all times, and you shall succeed.” He finished up with: “It is my belief that the successful investment management organizations of the future will be those whose people want to invest their careers in relatively small enterprises that engage in important work on challenging problems for great clients.”4
This is exactly what we are trying to do. We continue to work hard on your behalf and thank you for your continued trust.
Sincerely,
| | |
Robert Gardiner, CFA | | Blake Walker |
Chief Executive Officer & Portfolio Manager | | Chief Investment Officer & Portfolio Manager |
| 1 | Multiple expansion is an increase in the price-earnings ratio, or “multiple”, of a stock or group of stocks. |
| 2 | Source: Bloomberg; Categories represented by the following indexes: US Large Cap = Russell 1000 Index, US Small Cap = Russell 2000 Index, Europe Large Cap = MSCI Europe Index, Europe Small Cap = MSCI Europe Small Cap Index, Japan Large Cap = MSCI Japan Index, Japan Small Cap = MSCI Japan Small Cap Index, EM Large Cap = MSCI EM Index, EM Small Cap = MSCI EM Small Cap Index |
| 3 | http://www.wsj.com/articles/vera-wang-brian-grazer-and-more-on-failure-1427468012?
vh=7609cab091ba04927bd85a55ba80fe17b07cf3ea&ts=1427469126 |
| 4 | Dr. Charles D Ellis, CFA, “The Characteristics of Successful Investment Firms,” ICFA Continuing Education Series, Volume 1984 Issue 1: http://www.cfapubs.org/doi/abs/10.2469/cp.v1984.n1.5 |
| | |
Annual Report | April 30, 2015 | | 3 |
| | |
| Grandeur Peak Funds® | | Shareholder Letter |
April 30, 2015 (Unaudited)
The objective of all Grandeur Peak Funds is long-term growth of capital.
RISKS: Mutual fund investing involves risks and loss of principal is possible. Investing in small and micro-cap funds will be more volatile and loss of principal could be greater than investing in large cap or more diversified funds. Investing in foreign securities entails special risks, such as currency fluctuations and political uncertainties, which are described in more detail in the prospectus. Investments in emerging markets are subject to the same risks as other foreign securities and may be subject to greater risks than investments in foreign countries with more established economies and securities markets.
An investor should consider investment objectives, risks, charges, and expenses carefully before investing. To obtain a Grandeur Peak Funds prospectus, containing this and other information, visit www.grandeurpeakglobal.com or call 1-855-377-PEAK (7325). Please read it carefully before investing.
The views and information discussed in this commentary are as of the date of publication, are subject to change, and may not reflect the writer’s current views. The views expressed represent an assessment of market conditions at a specific point in time, are opinions only and should not be relied upon as investment advice regarding a particular investment or markets in general. Such information does not constitute a recommendation to buy or sell specific securities or investment vehicles. It should not be assumed that any investment will be profitable or will equal the performance of the Funds or any securities or any sectors mentioned in this letter. The subject matter contained herein has been derived from several sources believed to be reliable and accurate at the time of compilation. Grandeur Peak Global Advisors, LLC nor the Funds accept any liability for losses either direct or consequential caused by the use of this information. Past performance does not guarantee future results.
CFA® is trademark owned by CFA Institute.
ALPS Distributors, Inc. is the Distributor for the Grandeur Peak Funds.
| | |
4 | | 1.855.377.7325 | www.GrandeurPeakGlobal.com |
| | |
| Grandeur Peak Emerging Markets Opportunities Fund | | Performance Update |
April 30, 2015 (Unaudited)
Cumulative Total Return Performance for the periods ended April 30, 2015
| | | | | | | | | | | | | | |
| | | | | | | Since
Inception(a) | | Expense Ratio | |
| | | 6 Months | | 1 Year | | | Gross | | | Net(b) | |
Grandeur Peak Emerging Markets Opportunities
Fund – Investor (GPEOX) | | 6.30% | | 12.06% | | 12.84% | | | 2.00% | | | | 1.95 | % |
Grandeur Peak Emerging Markets Opportunities
Fund – Institutional (GPEIX) | | 6.37% | | 12.22% | | 13.04% | | | 1.75% | | | | 1.70 | % |
Russell Emerging Markets Small Cap Index(c) | | 6.11% | | 7.50% | | 9.24% | | | | | | | | |
| (a) | Fund inception date of December 16, 2013. |
| (b) | Grandeur Peak Global Advisors, LLC (the “Adviser”), has agreed to waive and/or reimburse fees or expenses in order to limit Total Annual Fund Operating Expenses After Fee Waiver/Expense Reimbursement (excluding acquired fund fees and expenses, brokerage expenses, interest expenses, taxes and extraordinary expenses) to 1.95% of the Fund’s average daily net assets for the Investor Class and 1.70% of the Fund’s average daily net assets for the Institutional Class. This agreement is in effect through August 31, 2015. The Fund may have to repay some of these waivers and reimbursements to the Adviser in the following three years. This agreement may not be terminated or modified prior to this date except with the approval of the Fund’s Board of Trustees. |
| (c) | The Russell Emerging Markets Small Cap Index seeks to measure the performance of the small-cap equity universe of emerging countries. The Index is not actively managed and does not reflect any deductions for fees, expense, or taxes. An investor may not invest directly in the Index. |
Returns for periods greater than 1 year are annualized.
The returns shown above do not reflect the deduction of taxes a shareholder would pay on Fund distributions or redemption of Fund shares.
Performance data quoted represents past performance. Past performance does not guarantee future results. Investment return and principal value of an investment will fluctuate so that an investor’s shares, when sold or redeemed, may be worth more or less than the original cost. Current performance data may be higher or lower than actual data quoted. For the most current month-end performance data, please call 1-855-377-PEAK (7325).
Growth of $10,000 for the period ended April 30, 2015
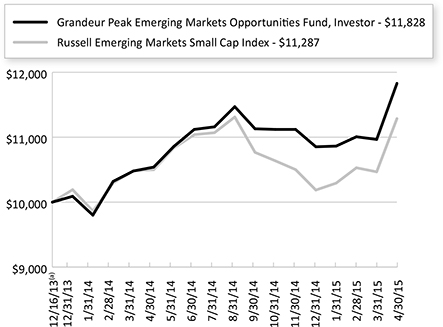
| | |
Annual Report | April 30, 2015 | | 5 |
| | |
| Grandeur Peak Emerging Markets Opportunities Fund | | Performance Update |
April 30, 2015 (Unaudited)
The graphs shown above represent a hypothetical investment of $10,000 in the Fund’s Investor Class shares for the period from inception to April 30, 2015. All returns reflect reinvested dividends, but do not reflect the deduction of taxes that an investor would pay on distributions or redemptions.
The Fund also offers Institutional Class shares, performance for which is not reflected in the graphs above. The performance of Institutional Class shares may be higher or lower than the performance of the Investor Class shares shown in the graphs above based upon differences in fees paid by shareholders investing in the Investor Class shares and Institutional Class shares.
| | | | |
| Regional Allocation (as a % of Net Assets)* | | | |
Asia ex Japan | | | 70.5 | % |
Africa/Middle East | | | 6.7 | % |
Latin America | | | 5.9 | % |
Europe | | | 3.8 | % |
North America | | | 3.6 | % |
Cash, Cash Equivalents, & Other Net Assets | | | 9.5 | % |
Total | | | 100.0 | % |
| |
| Industry Sector Allocation (as a % of Net Assets)* | | | |
Financials | | | 22.7 | % |
Consumer | | | 17.8 | % |
Industrials | | | 17.8 | % |
Technology | | | 17.2 | % |
Health Care | | | 9.1 | % |
Energy & Materials | | | 4.8 | % |
Exchange-Traded Funds | | | 1.1 | % |
Cash, Cash Equivalents, & Other Net Assets | | | 9.5 | % |
Total | | | 100.0 | % |
| |
| Top 10 Holdings (as a % of Net Assets)* | | | |
Man Wah Holdings, Ltd. | | | 2.8 | % |
Value Partners Group, Ltd. | | | 2.2 | % |
Hy-Lok Corp. | | | 1.2 | % |
Far East Horizon, Ltd. | | | 1.2 | % |
Market Vectors Vietnam ETF | | | 1.1 | % |
Sporton International, Inc. | | | 1.1 | % |
Security Bank Corp. | | | 1.1 | % |
Sinmag Equipment Corp. | | | 1.1 | % |
Blue Label Telecoms, Ltd. | | | 1.0 | % |
Silergy Corp. | | | 1.0 | % |
Total | | | 13.8 | % |
| * | Holdings are subject to change. |
| | |
6 | | 1.855.377.7325 | www.GrandeurPeakGlobal.com |
| | |
| Grandeur Peak Global Opportunities Fund | | Performance Update |
April 30, 2015 (Unaudited)
Cumulative Total Return Performance for the periods ended April 30, 2015
| | | | | | | | | | | | | | | | | | |
| | | | | | | | | | | | Expense Ratio | |
| | | 6 Months | | 1 Year | | 3 Years | | Since
Inception(a) | | | Gross | | | Net(b) | |
Grandeur Peak Global Opportunities Fund – Investor (GPGOX) | | 8.79% | | 11.09% | | 19.10% | | | 20.81% | | | | 1.70% | | | | 1.70% | |
Grandeur Peak Global Opportunities Fund – Institutional (GPGIX) | | 8.91% | | 11.20% | | 19.42% | | | 21.23% | | | | 1.46% | | | | 1.46% | |
Russell Global Small Cap Index(c) | | 6.33% | | 5.80% | | 11.99% | | | 13.67% | | | | | | | | | |
Russell Global Index(d) | | 5.40% | | 7.88% | | 13.09% | | | 14.63% | | | | | | | | | |
| (a) | Fund inception date of October 17, 2011. |
| (b) | Grandeur Peak Global Advisors, LLC (the “Adviser”), has agreed to waive and/or reimburse fees or expenses in order to limit Total Annual Fund Operating Expenses After Fee Waiver/Expense Reimbursement (excluding acquired fund fees and expenses, brokerage expenses, interest expenses, taxes and extraordinary expenses) to 1.75% of the Fund’s average daily net assets for the Investor Class and 1.50% of the Fund’s average daily net assets for the Institutional Class. This agreement is in effect through August 31, 2015. The Fund may have to repay some of these waivers and reimbursements to the Adviser in the following three years. This agreement may not be terminated or modified prior to this date except with the approval of the Fund’s Board of Trustees. |
| (c) | The Russell Global Small Cap Index seeks to measure the performance of the small-cap segment of the global equity universe. The Index is not actively managed and does not reflect any deductions for fees, expense, or taxes. An investor may not invest directly in the Index. |
| (d) | The Russell Global Index seeks to measure the performance of the global equity universe. The Index is not actively managed and does not reflect any deductions for fees, expense, or taxes. An investor may not invest directly in the Index. |
Returns for periods greater than 1 year are annualized.
The returns shown above do not reflect the deduction of taxes a shareholder would pay on Fund distributions or redemption of Fund shares.
Performance data quoted represents past performance. Past performance does not guarantee future results. Investment return and principal value of an investment will fluctuate so that an investor’s shares, when sold or redeemed, may be worth more or less than the original cost. Current performance data may be higher or lower than actual data quoted. For the most current month-end performance data, please call 1-855-377-PEAK (7325).
Growth of $10,000 for the period ended April 30, 2015
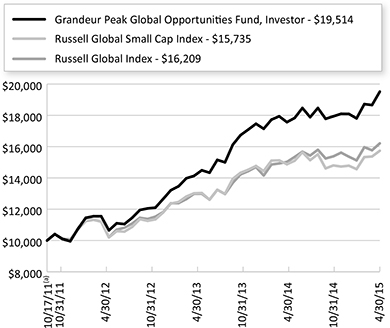
| | |
Annual Report | April 30, 2015 | | 7 |
| | |
| Grandeur Peak Global Opportunities Fund | | Performance Update |
April 30, 2015 (Unaudited)
The graphs shown above represent a hypothetical investment of $10,000 in the Fund’s Investor Class shares for the period from inception to April 30, 2015. All returns reflect reinvested dividends, but do not reflect the deduction of taxes that an investor would pay on distributions or redemptions.
The Fund also offers Institutional Class shares, performance for which is not reflected in the graphs above. The performance of Institutional Class shares may be higher or lower than the performance of the Investor Class shares shown in the graphs above based upon differences in fees paid by shareholders investing in the Investor Class shares and Institutional Class shares.
| | | | |
| Regional Allocation (as a % of Net Assets)* | | | |
Asia ex Japan | | | 33.2% | |
North America | | | 32.2% | |
Europe | | | 21.5% | |
Japan | | | 5.3% | |
Latin America | | | 3.2% | |
Africa/Middle East | | | 2.4% | |
Australia/New Zealand | | | 1.2% | |
Cash, Cash Equivalents, & Other Net Assets | | | 1.1% | |
Total | | | 100.0% | |
| |
| Industry Sector Allocation (as a % of Net Assets)* | | | |
Financials | | | 23.4% | |
Industrials | | | 22.8% | |
Technology | | | 19.4% | |
Consumer | | | 16.7% | |
Health Care | | | 12.2% | |
Energy & Materials | | | 4.4% | |
Cash, Cash Equivalents, & Other Net Assets | | | 1.1% | |
Total | | | 100.0% | |
| |
| Top 10 Holdings (as a % of Net Assets)* | | | |
First Republic Bank | | | 3.2% | |
Clinigen Group PLC | | | 2.1% | |
Man Wah Holdings, Ltd. | | | 2.1% | |
Roadrunner Transportation Systems, Inc. | | | 2.0% | |
Knight Transportation, Inc. | | | 1.4% | |
Melexis NV | | | 1.4% | |
Value Partners Group, Ltd. | | | 1.3% | |
Universal Truckload Services, Inc. | | | 1.1% | |
Palfinger AG | | | 1.1% | |
Home Capital Group, Inc. | | | 1.0% | |
Total | | | 16.7% | |
| * | Holdings are subject to change. |
| | |
8 | | 1.855.377.7325 | www.GrandeurPeakGlobal.com |
| | |
| Grandeur Peak Global Reach Fund | | Performance Update |
April 30, 2015 (Unaudited)
Cumulative Total Return Performance for the periods ended April 30, 2015
| | | | | | | | | | |
| | | | | | | | | Expense Ratio |
| | | 6 Months | | 1 Year | | Since
Inception(a) | | Gross | | Net(b) |
Grandeur Peak Global Reach Fund – Investor (GPROX) | | 8.47% | | 11.09% | | 19.43% | | 1.88% | | 1.64% |
Grandeur Peak Global Reach Fund – Institutional (GPRIX) | | 8.61% | | 11.41% | | 19.68% | | 1.72% | | 1.39% |
Russell Global Small Cap Index(c) | | 6.33% | | 5.80% | | 11.06% | | | | |
Russell Global Index(d) | | 5.40% | | 7.88% | | 12.90% | | | | |
| (a) | Fund inception date of June 19, 2013. |
| (b) | Grandeur Peak Global Advisors, LLC (the “Adviser”), has agreed to waive and/or reimburse fees or expenses in order to limit Total Annual Fund Operating Expenses After Fee Waiver/Expense Reimbursement (excluding acquired fund fees and expenses, brokerage expenses, interest expenses, taxes and extraordinary expenses) to 1.60% of the Fund’s average daily net assets for the Investor Class and 1.35% of the Fund’s average daily net assets for the Institutional Class. This agreement is in effect through August 31, 2015. The Fund may have to repay some of these waivers and reimbursements to the Adviser in the following three years. This agreement may not be terminated or modified prior to this date except with the approval of the Fund’s Board of Trustees. |
| (c) | The Russell Global Small Cap Index seeks to measure the performance of the small-cap segment of the global equity universe. The Index is not actively managed and does not reflect any deductions for fees, expense, or taxes. An investor may not invest directly in the Index. |
| (d) | The Russell Global Index seeks to measure the performance of the global equity universe. The Index is not actively managed and does not reflect any deductions for fees, expense, or taxes. An investor may not invest directly in the Index. |
Returns for periods greater than 1 year are annualized.
The returns shown above do not reflect the deduction of taxes a shareholder would pay on Fund distributions or redemption of Fund shares.
Performance data quoted represents past performance. Past performance does not guarantee future results. Investment return and principal value of an investment will fluctuate so that an investor’s shares, when sold or redeemed, may be worth more or less than the original cost. Current performance data may be higher or lower than actual data quoted. For the most current month-end performance data, please call 1-855-377-PEAK (7325).
Growth of $10,000 for the period ended April 30, 2015
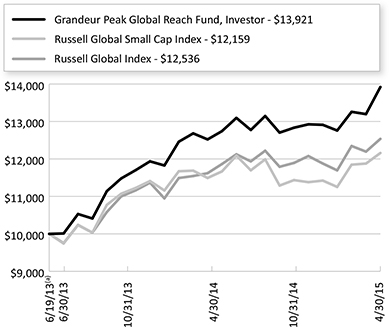
| | |
Annual Report | April 30, 2015 | | 9 |
| | |
| Grandeur Peak Global Reach Fund | | Performance Update |
April 30, 2015 (Unaudited)
The graphs shown above represent a hypothetical investment of $10,000 in the Fund’s Investor Class shares for the period from inception to April 30, 2015. All returns reflect reinvested dividends, but do not reflect the deduction of taxes that an investor would pay on distributions or redemptions.
The Fund also offers Institutional Class shares, performance for which is not reflected in the graphs above. The performance of Institutional Class shares may be higher or lower than the performance of the Investor Class shares shown in the graphs above based upon differences in fees paid by shareholders investing in the Investor Class shares and Institutional Class shares.
| | | | |
| Regional Allocation (as a % of Net Assets)* | | | |
Asia ex Japan | | | 36.2 | % |
North America | | | 26.2 | % |
Europe | | | 20.1 | % |
Africa/Middle East | | | 5.7 | % |
Japan | | | 5.1 | % |
Latin America | | | 2.5 | % |
Australia/New Zealand | | | 2.0 | % |
Cash, Cash Equivalents, & Other Net Assets | | | 2.2 | % |
Total | | | 100.0 | % |
| |
| Industry Sector Allocation (as a % of Net Assets)* | | | |
Consumer | | | 23.9 | % |
Financials | | | 21.8 | % |
Industrials | | | 19.4 | % |
Technology | | | 18.2 | % |
Health Care | | | 11.0 | % |
Energy & Materials | | | 3.5 | % |
Cash, Cash Equivalents, & Other Net Assets | | | 2.2 | % |
Total | | | 100.0 | % |
| |
| Top 10 Holdings (as a % of Net Assets)* | | | |
Man Wah Holdings, Ltd. | | | 2.1 | % |
First Republic Bank | | | 2.0 | % |
Clinigen Group PLC | | | 1.8 | % |
Roadrunner Transportation Systems, Inc. | | | 1.7 | % |
Value Partners Group, Ltd. | | | 1.0 | % |
Home Capital Group, Inc. | | | 0.9 | % |
VZ Holding AG | | | 0.8 | % |
Super Group, Ltd. | | | 0.8 | % |
Bank of Georgia Holdings PLC | | | 0.8 | % |
IG Group Holdings PLC | | | 0.8 | % |
Total | | | 12.7 | % |
| * | Holdings are subject to change. |
| | |
10 | | 1.855.377.7325 | www.GrandeurPeakGlobal.com |
| | |
| Grandeur Peak International Opportunities Fund | | Performance Update |
April 30, 2015 (Unaudited)
Cumulative Total Return Performance for the periods ended April 30, 2015
| | | | | | | | | | | | | | | | |
| | | | | | | | | | | Expense Ratio | |
| | | 6 Months | | 1 Year | | 3 Years | | Since
Inception(a) | | Gross | | | Net(b) | |
Grandeur Peak International Opportunities Fund –
Investor (GPIOX) | | 6.94% | | 7.25% | | 18.51% | | 20.00% | | | 1.68% | | | | 1.68% | |
Grandeur Peak International Opportunities Fund –
Institutional (GPIIX) | | 7.10% | | 7.41% | | 18.78% | | 20.23% | | | 1.44% | | | | 1.44% | |
Russell Global ex-U.S. Small Cap Index(c) | | 7.47% | | 3.24% | | 9.65% | | 10.55% | | | | | | | | |
| (a) | Fund inception date of October 17, 2011. |
| (b) | Grandeur Peak Global Advisors, LLC (the “Adviser”), has agreed to waive and/or reimburse fees or expenses in order to limit Total Annual Fund Operating Expenses After Fee Waiver/Expense Reimbursement (excluding acquired fund fees and expenses, brokerage expenses, interest expenses, taxes and extraordinary expenses) to 1.75% of the Fund’s average daily net assets for the Investor Class and 1.50% of the Fund’s average daily net assets for the Institutional Class. This agreement is in effect through August 31, 2015. The Fund may have to repay some of these waivers and reimbursements to the Adviser in the following three years. This agreement may not be terminated or modified prior to this date except with the approval of the Fund’s Board of Trustees. |
| (c) | The Russell Global ex-U.S. Small Cap Index seeks to measure the performance of the small-cap segment of the global equity universe, excluding companies assigned to the United States. The Index is not actively managed and does not reflect any deductions for fees, expense, or taxes. An investor may not invest directly in the Index. |
Returns for periods greater than 1 year are annualized.
The returns shown above do not reflect the deduction of taxes a shareholder would pay on Fund distributions or redemption of Fund shares.
Performance data quoted represents past performance. Past performance does not guarantee future results. Investment return and principal value of an investment will fluctuate so that an investor’s shares, when sold or redeemed, may be worth more or less than the original cost. Current performance data may be higher or lower than actual data quoted. For the most current month-end performance data, please call 1-855-377-PEAK (7325).
Growth of $10,000 for the period ended April 30, 2015
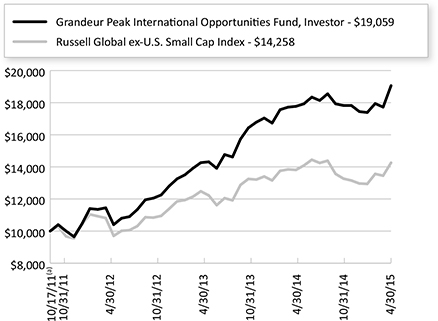
| | |
Annual Report | April 30, 2015 | | 11 |
| | |
| Grandeur Peak International Opportunities Fund | | Performance Update |
April 30, 2015 (Unaudited)
The graphs shown above represent a hypothetical investment of $10,000 in the Fund’s Investor Class shares for the period from inception to April 30, 2015. All returns reflect reinvested dividends, but do not reflect the deduction of taxes that an investor would pay on distributions or redemptions.
The Fund also offers Institutional Class shares, performance for which is not reflected in the graphs above. The performance of Institutional Class shares may be higher or lower than the performance of the Investor Class shares shown in the graphs above based upon differences in fees paid by shareholders investing in the Investor Class shares and Institutional Class shares.
| | | | |
| Regional Allocation (as a % of Net Assets)* | | | |
Asia ex Japan | | | 41.1% | |
Europe | | | 29.4% | |
Japan | | | 6.8% | |
North America | | | 5.1% | |
Latin America | | | 4.6% | |
Africa/Middle East | | | 3.8% | |
Australia/New Zealand | | | 1.3% | |
Cash, Cash Equivalents, & Other Net Assets | | | 7.9% | |
Total | | | 100.0% | |
| |
| Industry Sector Allocation (as a % of Net Assets)* | | | |
Financials | | | 21.7% | |
Industrials | | | 19.7% | |
Technology | | | 16.6% | |
Consumer | | | 16.1% | |
Health Care | | | 12.6% | |
Energy & Materials | | | 4.9% | |
Exchange-Traded Funds | | | 0.5% | |
Cash, Cash Equivalents, & Other Net Assets | | | 7.9% | |
Total | | | 100.0% | |
| |
| Top 10 Holdings (as a % of Net Assets)* | | | |
Clinigen Group PLC | | | 3.0% | |
Man Wah Holdings, Ltd. | | | 2.2% | |
Value Partners Group, Ltd. | | | 1.5% | |
Home Capital Group, Inc. | | | 1.4% | |
Trancom Co., Ltd. | | | 1.4% | |
Melexis NV | | | 1.3% | |
Hy-Lok Corp. | | | 1.2% | |
IG Group Holdings PLC | | | 1.1% | |
Sporton International, Inc. | | | 1.1% | |
VZ Holding AG | | | 1.1% | |
Total | | | 15.3% | |
| * | Holdings are subject to change. |
| | |
12 | | 1.855.377.7325 | www.GrandeurPeakGlobal.com |
| | |
| Grandeur Peak Funds® | | Disclosure of Fund Expenses |
April 30, 2015 (Unaudited)
As a shareholder of a Fund, you incur two types of costs: direct costs, such as short-term redemption fees and wire fees, and indirect costs, including management fees, and other fund operating expenses. This example is intended to help you understand your indirect costs, also referred to as “ongoing costs” (in dollars), of investing in the Fund and to compare these costs with the ongoing costs of investing in other mutual funds.
This example is based on an investment of $1,000 invested at the beginning of the period and held for the entire six-month period of November 1, 2014 through April 30, 2015.
Actual Expenses The first line of the table below provides information about actual account values and actual expenses. You may use the information in this line, together with the amount you invested at the beginning of the period, to estimate the expenses that you paid over the period. Simply divide your account value by $1,000 (for example, an $8,600 account value divided by $1,000 = 8.6), then multiply the result by the number in the first line under the heading “Expenses Paid During Period” to estimate the expenses you paid on your account during this period.
Hypothetical Example for Comparison Purposes The second line of the table provides information about hypothetical account values and hypothetical expenses based on the Fund’s actual expense ratio and an assumed rate of return of 5% per year before expenses, which is not the Fund’s actual return. The hypothetical account values and expenses may not be used to estimate the actual ending account balance or expenses you paid for the period. You may use this information to compare ongoing costs of investing in the Fund and other funds. To do so, compare this 5% hypothetical example with the 5% hypothetical examples that appear in the shareholder reports of other funds.
Please note that the expenses shown in the table are meant to highlight your ongoing costs only and do not reflect any direct costs, such as wire fees or low balance fees. Therefore, the second line of the table is useful in comparing ongoing costs only and will not help you determine the relative total costs of owning different funds. In addition, if these direct costs were included, your costs would be higher.
| | | | | | | | | | |
| | | Beginning Account
Value November 1, 2014 | | Ending Account
Value April 30, 2015 | | Expense Ratio(a) | | Expenses Paid
During period
November 1, 2014 -
April 30, 2015(b) | |
Grandeur Peak Emerging Markets Opportunities Fund | | | | | | | | | | |
Institutional Class | | | | | | | | | | |
Actual | | $ 1,000.00 | | $ 1,063.70 | | 1.59% | | | $ 8.14 | |
Hypothetical (5% return before expenses) | | $ 1,000.00 | | $ 1,016.91 | | 1.59% | | | $ 7.95 | |
Investor Class | | | | | | | | | | |
Actual | | $ 1,000.00 | | $ 1,063.00 | | 1.82% | | | $ 9.31 | |
Hypothetical (5% return before expenses) | | $ 1,000.00 | | $ 1,015.77 | | 1.82% | | | $ 9.10 | |
Grandeur Peak Global Opportunities Fund | | | | | | | | | | |
Institutional Class | | | | | | | | | | |
Actual | | $ 1,000.00 | | $ 1,089.10 | | 1.38% | | | $ 7.15 | |
Hypothetical (5% return before expenses) | | $ 1,000.00 | | $ 1,017.95 | | 1.38% | | | $ 6.90 | |
Investor Class | | | | | | | | | | |
Actual | | $ 1,000.00 | | $ 1,087.90 | | 1.61% | | | $ 8.33 | |
Hypothetical (5% return before expenses) | | $ 1,000.00 | | $ 1,016.81 | | 1.61% | | | $ 8.05 | |
Grandeur Peak Global Reach Fund | | | | | | | | | | |
Institutional Class | | | | | | | | | | |
Actual | | $ 1,000.00 | | $ 1,086.10 | | 1.35% | | | $ 6.98 | |
Hypothetical (5% return before expenses) | | $ 1,000.00 | | $ 1,018.10 | | 1.35% | | | $ 6.76 | |
Investor Class | | | | | | | | | | |
Actual | | $ 1,000.00 | | $ 1,084.70 | | 1.59% | | | $ 8.22 | |
Hypothetical (5% return before expenses) | | $ 1,000.00 | | $ 1,016.91 | | 1.59% | | | $ 7.95 | |
Grandeur Peak International Opportunities Fund | | | | | | | | | | |
Institutional Class | | | | | | | | | | |
Actual | | $ 1,000.00 | | $ 1,071.00 | | 1.38% | | | $ 7.09 | |
Hypothetical (5% return before expenses) | | $ 1,000.00 | | $ 1,017.95 | | 1.38% | | | $ 6.90 | |
Investor Class | | | | | | | | | | |
Actual | | $ 1,000.00 | | $ 1,069.40 | | 1.61% | | | $ 8.26 | |
Hypothetical (5% return before expenses) | | $ 1,000.00 | | $ 1,016.81 | | 1.61% | | | $ 8.05 | |
| (a) | The Fund’s expense ratios have been annualized based on the Fund’s most recent fiscal half-year expenses. |
| (b) | Expenses are equal to the Fund’s annualized expense ratio multiplied by the average account value over the period, multiplied by the number of days in the most recent fiscal half-year 181/365 (to reflect the half-year period). |
| | |
Annual Report | April 30, 2015 | | 13 |
| | |
| Grandeur Peak Emerging Markets Opportunities Fund | | Portfolio of Investments |
April 30, 2015
| | | | | | | | |
| | | Shares | | | Value
(Note 2) | |
COMMON STOCKS (88.89%) | |
Bangladesh (0.69%) | | | | | | | | |
Active Fine Chemicals, Ltd. | | | 1,146,000 | | | $ | 855,235 | |
Islami Bank Bangladesh, Ltd. | | | 4,667,565 | | | | 971,784 | |
Olympic Industries, Ltd. | | | 510,300 | | | | 1,383,142 | |
| | | | | | | | |
| | | | | | | 3,210,161 | |
| | | | | | | | |
| | |
Brazil (3.83%) | | | | | | | | |
Banco Daycoval SA | | | 662,137 | | | | 1,760,307 | |
CETIP SA - Mercados Organizados | | | 358,562 | | | | 4,084,319 | |
Even Construtora e Incorporadora SA | | | 640,700 | | | | 1,033,473 | |
Linx SA | | | 62,500 | | | | 913,971 | |
Localiza Rent a Car SA | | | 79,700 | | | | 934,301 | |
M Dias Branco SA | | | 54,400 | | | | 1,549,153 | |
Odontoprev SA | | | 694,000 | | | | 2,434,684 | |
Sonae Sierra Brasil SA | | | 211,500 | | | | 1,428,509 | |
Tegma Gestao Logistica | | | 121,500 | | | | 608,921 | |
Valid Solucoes SA | | | 204,100 | | | | 3,173,662 | |
| | | | | | | | |
| | | | | | | 17,921,300 | |
| | | | | | | | |
| | |
China (16.20%) | | | | | | | | |
51job, Inc., ADR(a) | | | 51,725 | | | | 1,862,100 | |
AAC Technologies Holdings, Inc. | | | 237,000 | | | | 1,251,053 | |
Airtac International Group | | | 250,000 | | | | 2,043,631 | |
BBI Life Sciences Corp.(a)(b) | | | 4,131,000 | | | | 1,810,880 | |
China Biologic Products, Inc.(a) | | | 22,825 | | | | 2,182,983 | |
China Construction Bank Corp., H Shares | | | 3,593,000 | | | | 3,487,850 | |
China Lesso Group Holdings, Ltd. | | | 5,294,000 | | | | 3,889,799 | |
China Medical System Holdings, Ltd. | | | 939,000 | | | | 1,657,103 | |
China Pioneer Pharma Holdings, Ltd. | | | 5,574,000 | | | | 4,331,008 | |
China Singyes Solar Technologies Holdings, Ltd. | | | 1,104,000 | | | | 1,807,938 | |
China South City Holdings, Ltd. | | | 6,885,000 | | | | 3,034,371 | |
Consun Pharmaceutical Group, Ltd. | | | 1,151,000 | | | | 919,972 | |
Dongpeng Holdings Co., Ltd. | | | 7,506,000 | | | | 4,125,586 | |
Far East Horizon, Ltd. | | | 5,112,500 | | | | 5,399,174 | |
Goldpac Group, Ltd. | | | 2,007,000 | | | | 1,675,459 | |
Le Saunda Holdings, Ltd. | | | 1,304,000 | | | | 557,902 | |
Man Wah Holdings, Ltd. | | | 10,047,600 | | | | 13,036,496 | |
| | | | | | | | |
| | | Shares | | | Value
(Note 2) | |
China (continued) | | | | | | | | |
Mindray Medical International, Ltd., ADR | | | 36,825 | | | $ | 1,137,156 | |
Minth Group, Ltd. | | | 1,060,000 | | | | 2,653,758 | |
Noah Holdings, Ltd., Sponsored
ADR(a) | | | 103,875 | | | | 3,520,324 | |
O2Micro International, Ltd., ADR(a) | | | 271,250 | | | | 623,875 | |
Phoenix New Media, Ltd., ADR(a) | | | 352,190 | | | | 2,539,290 | |
Sihuan Pharmaceutical Holdings Group, Ltd.(c) | | | 2,563,000 | | | | 1,603,828 | |
Technovator International, Ltd.(a) | | | 3,398,000 | | | | 3,314,621 | |
Tsui Wah Holdings, Ltd. | | | 2,512,000 | | | | 848,056 | |
Vitasoy International Holdings, Ltd. | | | 1,101,900 | | | | 2,015,978 | |
Wonderful Sky Financial Group Holdings, Ltd. | | | 805,000 | | | | 244,079 | |
WuXi PharmaTech Cayman, Inc., ADR(a) | | | 87,433 | | | | 3,774,483 | |
Xiabuxiabu Catering Management China Holdings Co., Ltd.(a)(b)(d) | | | 688,000 | | | | 447,894 | |
| | | | | | | | |
| | | | | | | 75,796,647 | |
| | | | | | | | |
| | |
Colombia (1.64%) | | | | | | | | |
Bolsa de Valores de Colombia | | | 115,263,748 | | | | 1,016,179 | |
Gran Tierra Energy, Inc.(a) | | | 743,650 | | | | 2,766,378 | |
Parex Resources, Inc.(a) | | | 485,731 | | | | 3,897,121 | |
| | | | | | | | |
| | | | | | | 7,679,678 | |
| | | | | | | | |
| | |
Georgia (0.98%) | | | | | | | | |
Bank of Georgia Holdings PLC | | | 167,297 | | | | 4,594,515 | |
| | | | | | | | |
| | |
Greece (0.50%) | | | | | | | | |
Sarantis SA(a) | | | 259,544 | | | | 2,360,574 | |
| | | | | | | | |
| | |
Hong Kong (3.30%) | | | | | | | | |
International Housewares Retail Co., Ltd. | | | 8,196,000 | | | | 2,315,867 | |
Samsonite International SA | | | 356,000 | | | | 1,298,392 | |
Sinosoft Technology Group, Ltd. | | | 1,752,000 | | | | 1,304,692 | |
Value Partners Group, Ltd. | | | 5,686,800 | | | | 10,514,153 | |
| | | | | | | | |
| | | | | | | 15,433,104 | |
| | | | | | | | |
| | |
India (13.04%) | | | | | | | | |
AIA Engineering, Ltd. | | | 43,750 | | | | 790,460 | |
Ajanta Pharma, Ltd. | | | 125,730 | | | | 2,500,149 | |
| | |
| See Notes to Financial Statements. | | |
| 14 | | 1.855.377.7325 | www.GrandeurPeakGlobal.com |
| | |
| Grandeur Peak Emerging Markets Opportunities Fund | | Portfolio of Investments |
April 30, 2015
| | | | | | | | |
| | | Shares | | | Value
(Note 2) | |
India (continued) | | | | | | | | |
Amara Raja Batteries, Ltd. | | | 37,800 | | | $ | 472,114 | |
Bajaj Finance, Ltd. | | | 23,100 | | | | 1,470,506 | |
Balkrishna Industries, Ltd. | | | 298,300 | | | | 3,644,741 | |
Credit Analysis & Research, Ltd. | | | 156,990 | | | | 3,848,560 | |
Dewan Housing Finance Corp., Ltd. | | | 552,500 | | | | 3,872,174 | |
eClerx Services, Ltd. | | | 58,979 | | | | 1,479,417 | |
Eros International Media, Ltd.(a) | | | 38,500 | | | | 249,603 | |
Glenmark Pharmaceuticals, Ltd. | | | 204,700 | | | | 2,863,339 | |
Hinduja Global Solutions, Ltd. | | | 194,500 | | | | 1,671,736 | |
IFGL Refractories, Ltd. | | | 359,956 | | | | 746,458 | |
Indiabulls Housing Finance, Ltd. | | | 249,000 | | | | 2,320,316 | |
Infinite Computer Solutions, Ltd. | | | 480,000 | | | | 1,706,785 | |
Infotech Enterprises, Ltd. | | | 488,595 | | | | 3,701,675 | |
Ipca Laboratories, Ltd. | | | 41,956 | | | | 423,616 | |
Jammu & Kashmir Bank, Ltd. | | | 1,574,699 | | | | 2,376,135 | |
Kolte-Patil Developers, Ltd. | | | 1,243,750 | | | | 4,191,203 | |
KPIT Technologies, Ltd. | | | 1,243,280 | | | | 2,054,778 | |
MBL Infrastructures, Ltd. | | | 165,000 | | | | 1,480,579 | |
MT Educare, Ltd. | | | 865,731 | | | | 1,405,715 | |
Nirvikara Paper Mills, Ltd.(a)(c) | | | 47,311 | | | | 50,682 | |
PC Jeweller, Ltd. | | | 168,000 | | | | 902,610 | |
Persistent Systems, Ltd. | | | 19,200 | | | | 213,342 | |
PI Industries, Ltd. | | | 94,675 | | | | 981,183 | |
Poly Medicure, Ltd. | | | 91,722 | | | | 772,046 | |
Repco Home Finance, Ltd. | | | 1,927 | | | | 17,600 | |
Somany Ceramics, Ltd. | | | 80,760 | | | | 531,484 | |
Suprajit Engineering, Ltd. | | | 139,782 | | | | 257,308 | |
Supreme Industries, Ltd. | | | 5,000 | | | | 53,755 | |
Time Technoplast, Ltd. | | | 4,012,600 | | | | 2,890,225 | |
Vaibhav Global, Ltd. | | | 289,337 | | | | 3,643,419 | |
Vakrangee Software, Ltd. | | | 573,100 | | | | 958,139 | |
Vardhman Textiles, Ltd. | | | 165,219 | | | | 1,687,567 | |
Vesuvius India, Ltd. | | | 171,200 | | | | 1,987,203 | |
WNS Holdings, Ltd., ADR(a) | | | 116,025 | | | | 2,799,683 | |
| | | | | | | | |
| | | | | | | 61,016,305 | |
| | | | | | | | |
Indonesia (4.70%) | | | | | | | | |
Arwana Citramulia Tbk PT | | | 21,820,200 | | | | 875,333 | |
Astra Graphia Tbk PT | | | 8,442,500 | | | | 1,445,890 | |
Bank Negara Indonesia Persero Tbk PT | | | 5,528,500 | | | | 2,728,408 | |
Bank Tabungan Pensiunan Nasional Tbk PT(a) | | | 4,985,000 | | | | 1,519,055 | |
| | | | | | | | |
| | | Shares | | | Value
(Note 2) | |
Indonesia (continued) | | | | | | | | |
Bekasi Fajar Industrial Estate Tbk PT | | | 56,350,600 | | | $ | 2,589,584 | |
Express Transindo Utama Tbk PT | | | 9,051,500 | | | | 768,112 | |
Lippo Cikarang Tbk PT(a) | | | 811,100 | | | | 746,969 | |
Panin Sekuritas Tbk PT | | | 3,694,500 | | | | 1,424,181 | |
Petra Foods, Ltd. | | | 841,400 | | | | 2,461,075 | |
Selamat Sempurna Tbk PT | | | 9,212,100 | | | | 3,342,180 | |
Tempo Scan Pacific Tbk PT | | | 16,446,500 | | | | 2,575,060 | |
Ultrajaya Milk Industry & Trading Co. Tbk PT | | | 5,042,900 | | | | 1,534,985 | |
| | | | | | | | |
| | | | | | | 22,010,832 | |
| | | | | | | | |
| | |
Kazakhstan (0.25%) | | | | | | | | |
Nostrum Oil & Gas, PLC(a) | | | 125,490 | | | | 1,181,114 | |
| | | | | | | | |
| | |
Luxembourg (0.32%) | | | | | | | | |
Globant SA(a) | | | 72,362 | | | | 1,520,326 | |
| | | | | | | | |
| | |
Malaysia (2.89%) | | | | | | | | |
AEON Credit Service M Bhd | | | 795,100 | | | | 3,313,195 | |
Berjaya Auto Bhd | | | 1,611,000 | | | | 1,825,713 | |
Berjaya Food Bhd | | | 231,584 | | | | 187,920 | |
CB Industrial Product Holding Bhd | | | 3,673,800 | | | | 2,090,519 | |
Freight Management Holdings Bhd | | | 66,400 | | | | 28,866 | |
Kossan Rubber Industries | | | 1,638,300 | | | | 2,760,017 | |
My EG Services Bhd | | | 1,301,800 | | | | 921,928 | |
Padini Holdings Bhd | | | 2,346,490 | | | | 920,505 | |
Uzma Bhd | | | 2,245,300 | | | | 1,458,465 | |
| | | | | | | | |
| | | | | | | 13,507,128 | |
| | | | | | | | |
| | |
Mexico (2.07%) | | | | | | | | |
Banregio Grupo Financiero SAB de CV(a) | | | 229,300 | | | | 1,315,239 | |
Credito Real SAB de CV | | | 1,853,451 | | | | 4,564,163 | |
Genomma Lab Internacional SAB de CV, Class B(a) | | | 1,403,500 | | | | 1,648,486 | |
Medica Sur SAB de CV, Series B | | | 585,646 | | | | 2,159,431 | |
| | | | | | | | |
| | | | | | | 9,687,319 | |
| | | | | | | | |
| | |
Oman (0.23%) | | | | | | | | |
Al Anwar Ceramic Tile Co. | | | 1,015,026 | | | | 1,078,416 | |
| | | | | | | | |
| | |
Philippines (4.29%) | | | | | | | | |
Concepcion Industrial Corp. | | | 2,879,660 | | | | 4,088,250 | |
Metropolitan Bank & Trust Co. | | | 957,990 | | | | 1,997,028 | |
| | |
| See Notes to Financial Statements. | | |
| Annual Report | April 30, 2015 | | 15 |
| | |
| Grandeur Peak Emerging Markets Opportunities Fund | | Portfolio of Investments |
April 30, 2015
| | | | | | | | |
| | | Shares | | | Value
(Note 2) | |
Philippines (continued) | | | | | | | | |
Pepsi-Cola Products Philippines, Inc.(a) | | | 42,513,000 | | | $ | 4,152,965 | |
Puregold Price Club, Inc. | | | 2,610,100 | | | | 2,323,136 | |
Robinsons Land Corp. | | | 3,372,600 | | | | 2,264,609 | |
Security Bank Corp. | | | 1,387,600 | | | | 5,228,564 | |
| | | | | | | | |
| | | | | | | 20,054,552 | |
| | | | | | | | |
| | |
Poland (2.01%) | | | | | | | | |
KRUK SA(a) | | | 106,846 | | | | 4,544,375 | |
Magellan SA(a) | | | 73,840 | | | | 1,333,278 | |
Wawel SA | | | 3,626 | | | | 1,339,661 | |
Work Service SA(a) | | | 400,807 | | | | 2,171,128 | |
| | | | | | | | |
| | | | | | | 9,388,442 | |
| | | | | | | | |
| | |
Russia (0.23%) | | | | | | | | |
MD Medical Group Investments PLC,
GDR(b) | | | 218,300 | | | | 1,091,500 | |
| | | | | | | | |
| | |
South Africa (6.42%) | | | | | | | | |
ARB Holdings, Ltd. | | | 1,134,108 | | | | 592,492 | |
Blue Label Telecoms, Ltd. | | | 7,170,223 | | | | 4,839,919 | |
Cartrack Holdings, Ltd.(a) | | | 2,627,200 | | | | 1,932,374 | |
Clicks Group, Ltd. | | | 382,300 | | | | 2,929,819 | |
Comair, Ltd. | | | 4,294,876 | | | | 1,945,939 | |
Ellies Holdings, Ltd.(a) | | | 4,832,608 | | | | 485,020 | |
EOH Holdings, Ltd. | | | 243,224 | | | | 3,300,316 | |
Interwaste Holdings, Ltd.(a) | | | 15,918,682 | | | | 1,846,614 | |
Invicta Holdings, Ltd. | | | 309,482 | | | | 1,897,280 | |
Italtile, Ltd. | | | 1,502,579 | | | | 1,477,791 | |
MiX Telematics, Ltd., Sponsored ADR(a) | | | 165,587 | | | | 1,159,109 | |
OneLogix Group, Ltd. | | | 2,142,622 | | | | 873,529 | |
Super Group, Ltd.(a) | | | 918,080 | | | | 2,782,535 | |
Transaction Capital, Ltd. | | | 5,181,040 | | | | 3,980,642 | |
| | | | | | | | |
| | | | | | | 30,043,379 | |
| | | | | | | | |
| | |
South Korea (7.32%) | | | | | | | | |
DGB Financial Group, Inc. | | | 202,500 | | | | 2,285,866 | |
Duk San Neolux Co., Ltd.(a) | | | 42,632 | | | | 878,887 | |
Duksan Hi-Metal Co., Ltd.(a) | | | 56,538 | | | | 551,767 | |
ENF Technology Co., Ltd. | | | 68,810 | | | | 896,749 | |
Hy-Lok Corp. | | | 171,557 | | | | 5,439,543 | |
Interpark Holdings Corp. | | | 257,000 | | | | 2,138,493 | |
ISC Co., Ltd. | | | 78,748 | | | | 3,153,277 | |
Koh Young Technology, Inc. | | | 25,244 | | | | 1,041,908 | |
KONA I Co., Ltd. | | | 122,306 | | | | 3,983,965 | |
LEENO Industrial, Inc. | | | 30,745 | | | | 1,316,051 | |
LF Corp. | | | 80,260 | | | | 2,639,038 | |
Samchuly Bicycle Co., Ltd. | | | 80,000 | | | | 1,877,358 | |
Solueta Co., Ltd.(a) | | | 131,000 | | | | 1,504,243 | |
TechWing, Inc. | | | 178,000 | | | | 1,803,703 | |
| | | | | | | | |
| | | Shares | | | Value
(Note 2) | |
South Korea (continued) | | | | | | | | |
Vieworks Co., Ltd. | | | 58,593 | | | $ | 1,612,162 | |
Vitzrocell Co., Ltd.(a) | | | 251,131 | | | | 1,759,449 | |
Wins Technet Co., Ltd. | | | 154,412 | | | | 1,387,280 | |
| | | | | | | | |
| | | | | | | 34,269,739 | |
| | | | | | | | |
| | |
Sri Lanka (1.92%) | | | | | | | | |
Asiri Hospital Holdings PLC | | | 4,000,000 | | | | 654,164 | |
Expolanka Holdings PLC(a) | | | 5,769,122 | | | | 367,874 | |
Hatton National Bank PLC | | | 893,400 | | | | 1,546,862 | |
Hemas Holdings PLC | | | 2,712,032 | | | | 1,554,383 | |
The Lanka Hospital Corp. PLC | | | 1,640,200 | | | | 509,409 | |
Royal Ceramics Lanka PLC | | | 3,593,775 | | | | 3,181,286 | |
Sampath Bank PLC | | | 590,486 | | | | 1,148,470 | |
| | | | | | | | |
| | | | | | | 8,962,448 | |
| | | | | | | | |
| | |
Taiwan (11.88%) | | | | | | | | |
ASPEED Technology, Inc. | | | 274,608 | | | | 2,515,752 | |
Chipbond Technology Corp. | | | 578,000 | | | | 1,249,054 | |
Cleanaway Co., Ltd. | | | 348,000 | | | | 2,156,294 | |
Cowealth Medical Holding Co., Ltd. | | | 731,000 | | | | 2,184,542 | |
Cub Elecparts, Inc. | | | 183,165 | | | | 2,323,776 | |
DYNACOLOR, Inc. | | | 944,000 | | | | 1,848,698 | |
Elan Microelectronics Corp. | | | 1,020,000 | | | | 1,670,003 | |
King’s Town Bank Co., Ltd. | | | 1,953,000 | | | | 2,001,686 | |
Novatek Microelectronics Corp. | | | 610,000 | | | | 3,188,247 | |
On-Bright Electronics, Inc. | | | 144,900 | | | | 786,167 | |
Polyronics Tech Corp. | | | 1,403,000 | | | | 3,237,730 | |
Richtek Technology Corp. | | | 346,000 | | | | 1,956,567 | |
Silergy Corp. | | | 471,422 | | | | 4,663,816 | |
Sinmag Equipment Corp. | | | 839,660 | | | | 5,037,404 | |
Solidwizard Technology Co., Ltd. | | | 541,000 | | | | 2,507,469 | |
Sporton International, Inc. | | | 927,000 | | | | 5,255,956 | |
Test Research, Inc. | | | 1,735,000 | | | | 3,527,987 | |
TSC Auto ID Technology Co., Ltd. | | | 184,000 | | | | 1,565,219 | |
UDE Corp. | | | 1,920,000 | | | | 4,211,028 | |
Voltronic Power Technology Corp. | | | 300,020 | | | | 3,722,175 | |
| | | | | | | | |
| | | | | | | 55,609,570 | |
| | | | | | | | |
| | |
Thailand (1.11%) | | | | | | | | |
Jubilee Enterprise PCL | | | 1,255,200 | | | | 1,227,975 | |
LPN Development PCL | | | 5,007,100 | | | | 2,603,836 | |
Premier Marketing PCL | | | 4,566,900 | | | | 1,383,943 | |
| | | | | | | | |
| | | | | | | 5,215,754 | |
| | | | | | | | |
| | |
| See Notes to Financial Statements. | | |
| 16 | | 1.855.377.7325 | www.GrandeurPeakGlobal.com |
| | |
| Grandeur Peak Emerging Markets Opportunities Fund | | Portfolio of Investments |
April 30, 2015
| | | | | | | | |
| | | Shares | | | Value
(Note 2) | |
Turkey (1.68%) | | | | | | | | |
Albaraka Turk Katilim Bankasi AS | | | 2,072,290 | | | $ | 1,339,762 | |
EGE Seramik Sanayi ve Ticaret AS | | | 1,312,061 | | | | 1,973,541 | |
Is Girisim Sermayesi Yatirim Ortakligi AS | | | 904,559 | | | | 646,452 | |
Pinar SUT Mamulleri Sanayii AS | | | 223,646 | | | | 2,150,603 | |
TAV Havalimanlari Holding AS(a) | | | 114,900 | | | | 1,010,187 | |
Uyum Gida Ihtiyac Maddeleri Sanayi ve Ticaret AS(a) | | | 685,472 | | | | 740,786 | |
| | | | | | | | |
| | | | | | | 7,861,331 | |
| | | | | | | | |
| | |
United Arab Emirates (0.09%) | | | | | | | | |
Aramex PJSC | | | 451,125 | | | | 426,713 | |
| | | | | | | | |
| | |
United States (0.36%) | | | | | | | | |
First Cash Financial Services, Inc.(a) | | | 34,475 | | | | 1,666,521 | |
| | | | | | | | |
| | |
Vietnam (0.94%) | | | | | | | | |
DHG Pharmaceutical JSC | | | 20,000 | | | | 77,814 | |
Japan Vietnam Medical Instrument JSC | | | 473,000 | | | | 464,456 | |
PetroVietnam Drilling and Well Services JSC | | | 950,000 | | | | 2,385,988 | |
Vietnam Dairy Products JSC | | | 284,816 | | | | 1,424,740 | |
Vietnam Sun Corp. | | | 12,420 | | | | 22,838 | |
| | | | | | | | |
| | | | | | | 4,375,836 | |
| | | | | | | | |
| | |
TOTAL COMMON STOCKS (Cost $376,008,769) | | | | | | | 415,963,204 | |
| | | | | | | | |
| | |
PREFERRED STOCKS (0.45%) | | | | | | | | |
Brazil (0.45%) | | | | | | | | |
Banco ABC Brasil SA | | | 473,652 | | | | 2,082,972 | |
| | | | | | | | |
| | |
TOTAL PREFERRED STOCKS (Cost $2,336,386) | | | | | | | 2,082,972 | |
| | | | | | | | |
|
EXCHANGE-TRADED FUNDS (1.13%) | |
United States (1.13%) | | | | | | | | |
Market Vectors Vietnam ETF | | | 293,950 | | | | 5,299,918 | |
| |
TOTAL EXCHANGE-TRADED FUNDS (Cost $5,344,259) | | | | 5,299,918 | |
| | | | | | | | |
| | | | | | | | |
| | | Shares | | | Value
(Note 2) | |
RIGHTS (0.00%)(e) | | | | | | | | |
Sri Lanka (0.00%)(e) | | | | | | | | |
Hemas Holdings PLC | | | 293,479 | | | $ | 10,788 | |
| | | | | | | | |
| | |
TOTAL RIGHTS (Cost $0) | | | | | | | 10,788 | |
| | | | | | | | |
| |
TOTAL INVESTMENTS (90.47%) (Cost $383,689,414) | | | $ | 423,356,882 | |
| |
Assets In Excess Of Other Liabilities (9.53%) | | | | 44,588,088 | |
| | | | | | | | |
| | |
NET ASSETS (100.00%) | | | | | | $ | 467,944,970 | |
| | | | | | | | |
| (a) | Non-Income Producing Security. |
| (b) | Security was purchased pursuant to Regulation S under the Securities Act of 1933, which exempts securities offered and sold outside of the United States from registration. Such security cannot be sold in the United States without either an effective registration statement filed pursuant to the Securities Act of 1933, or pursuant to an exemption from registration. The security has been deemed liquid under guidelines approved by the Fund’s Board of Trustees. As of April 30, 2015, the aggregate market value of those securities was $3,350,274, representing 0.72% of net assets. |
| (c) | Fair valued security under the procedures approved by the Fund’s Board of Trustees. |
| (d) | Security exempt from registration under Rule 144A of the Securities Act of 1933. These securities may be resold in the ordinary course of business in transactions exempt from registration, normally to qualified institutional buyers. As of April 30, 2015, these securities had a total aggregate market value of $447,894 representing 0.10% of net assets. |
Common Abbreviations:
ADR - American Depositary Receipt.
AS - Aktieselskab is the Danish term for a stock-based corporation.
Bhd - Berhad is the Malaysian term for public limited company.
ETF - Exchange Traded Fund.
GDR - Global Depositary Receipt.
JSC - Joint Stock Company.
Ltd. - Limited.
PCL - Public Company Limited.
PJSC - Public Joint Stock Company.
PLC - Public Limited Company.
SA - Generally designates corporations in various countries, mostly those employing the civil law.
SAB de CV - A variable capital company.
Tbk PT - Terbuka Perseroan Terbatas is an Indonesian term for a limited liability company.
Holdings are subject to change.
| | |
| See Notes to Financial Statements. | | |
| Annual Report | April 30, 2015 | | 17 |
| | |
| Grandeur Peak Emerging Markets Opportunities Fund | | Portfolio of Investments |
April 30, 2015
For Fund compliance purposes, the Fund’s geographical classifications refer to any one or more of the country sub-classifications used by one or more widely recognized market indexes or ratings group indexes, and/or as defined by Fund management. This definition may not apply for purposes of this report, which may combine sub-classifications for reporting ease. Geographical regions are shown as a percentage of net assets.
| | |
| See Notes to Financial Statements. | | |
| 18 | | 1.855.377.7325 | www.GrandeurPeakGlobal.com |
| | |
| Grandeur Peak Global Opportunities Fund | | Portfolio of Investments |
April 30, 2015
| | | | | | | | |
| | | Shares | | | Value
(Note 2) | |
COMMON STOCKS (98.60%) | |
Australia (1.22%) | | | | | | | | |
ALS, Ltd. | | | 214,337 | | | $ | 885,314 | |
Countplus, Ltd. | | | 315,836 | | | | 278,330 | |
CTI Logistics, Ltd. | | | 1,454,886 | | | | 1,556,707 | |
Magellan Financial Group, Ltd. | | | 318,864 | | | | 5,004,403 | |
The Reject Shop, Ltd. | | | 224,400 | | | | 1,151,771 | |
| | | | | | | | |
| | | | | | | 8,876,525 | |
| | | | | | | | |
| | |
Austria (1.08%) | | | | | | | | |
Palfinger AG | | | 261,274 | | | | 7,838,886 | |
| | | | | | | | |
| | |
Belgium (1.36%) | | | | | | | | |
Melexis NV | | | 160,770 | | | | 9,925,171 | |
| | | | | | | | |
| | |
Brazil (2.01%) | | | | | | | | |
Banco Daycoval SA | | | 1,078,400 | | | | 2,866,952 | |
CETIP SA - Mercados Organizados | | | 488,682 | | | | 5,566,493 | |
Fleury SA | | | 5,000 | | | | 27,697 | |
Grazziotin SA, Preference | | | 34,600 | | | | 173,405 | |
Odontoprev SA | | | 295,600 | | | | 1,037,021 | |
Tegma Gestao Logistica | | | 385,700 | | | | 1,933,013 | |
Valid Solucoes SA | | | 196,100 | | | | 3,049,266 | |
| | | | | | | | |
| | | | | | | 14,653,847 | |
| | | | | | | | |
| | |
Britain (7.59%) | | | | | | | | |
Abcam PLC | | | 339,553 | | | | 2,732,351 | |
Bovis Homes Group PLC | | | 180,686 | | | | 2,572,683 | |
Brammer PLC | | | 238,179 | | | | 1,388,386 | |
Cambian Group PLC | | | 571,706 | | | | 2,275,100 | |
Clinigen Group PLC | | | 1,685,944 | | | | 15,508,695 | |
Diploma PLC | | | 169,900 | | | | 2,073,335 | |
EMIS Group PLC | | | 378,117 | | | | 5,455,857 | |
Halma PLC | | | 80,100 | | | | 872,360 | |
Hunting PLC | | | 222,000 | | | | 1,995,211 | |
IG Group Holdings PLC | | | 563,048 | | | | 6,348,456 | |
Oxford Immunotec Global PLC(a) | | | 99,175 | | | | 1,316,052 | |
Premier Oil PLC(a) | | | 756,808 | | | | 2,024,628 | |
Robert Walters PLC | | | 140,483 | | | | 821,086 | |
RPS Group PLC | | | 2,071,939 | | | | 6,774,316 | |
Ultra Electronics Holdings PLC | | | 116,650 | | | | 3,102,080 | |
| | | | | | | | |
| | | | | | | 55,260,596 | |
| | | | | | | | |
| | |
Canada (2.02%) | | | | | | | | |
Halogen Software, Inc.(a) | | | 115,600 | | | | 1,006,050 | |
Home Capital Group, Inc. | | | 190,128 | | | | 7,504,265 | |
Richelieu Hardware, Ltd. | | | 73,555 | | | | 3,840,833 | |
| | | | | | | | |
| | | Shares | | | Value
(Note 2) | |
Canada (continued) | | | | | | | | |
Stantec, Inc. | | | 86,228 | | | $ | 2,329,192 | |
| | | | | | | | |
| | | | | | | 14,680,340 | |
| | | | | | | | |
| | |
China (7.79%) | | | | | | | | |
BBI Life Sciences Corp.(a)(b) | | | 7,357,000 | | | | 3,225,042 | |
China Lesso Group Holdings, Ltd. | | | 1,137,000 | | | | 835,418 | |
China Medical System Holdings, Ltd. | | | 2,799,000 | | | | 4,939,543 | |
Consun Pharmaceutical Group, Ltd. | | | 1,071,000 | | | | 856,030 | |
Dongpeng Holdings Co., Ltd. | | | 12,725,000 | | | | 6,994,149 | |
Far East Horizon, Ltd. | | | 4,639,000 | | | | 4,899,123 | |
Goldpac Group, Ltd. | | | 993,000 | | | | 828,964 | |
Le Saunda Holdings, Ltd. | | | 4,890,200 | | | | 2,092,217 | |
Man Wah Holdings, Ltd. | | | 11,845,800 | | | | 15,369,613 | |
Mindray Medical International, Ltd., ADR | | | 38,000 | | | | 1,173,440 | |
Noah Holdings, Ltd., Sponsored
ADR(a) | | | 54,900 | | | | 1,860,561 | |
O2Micro International, Ltd., ADR(a) | | | 566,315 | | | | 1,302,524 | |
Sihuan Pharmaceutical Holdings Group, Ltd.(c) | | | 4,043,000 | | | | 2,529,956 | |
Tao Heung Holdings, Ltd. | | | 1,861,300 | | | | 887,002 | |
Tsui Wah Holdings, Ltd. | | | 5,823,400 | | | | 1,965,990 | |
Vitasoy International Holdings, Ltd. | | | 1,135,483 | | | | 2,077,420 | |
Wonderful Sky Financial Group Holdings, Ltd. | | | 2,211,000 | | | | 670,385 | |
WuXi PharmaTech Cayman, Inc., ADR(a) | | | 72,775 | | | | 3,141,697 | |
Xiabuxiabu Catering Management China Holdings Co., Ltd.(a)(b)(d) | | | 1,590,000 | | | | 1,035,103 | |
| | | | | | | | |
| | | | | | | 56,684,177 | |
| | | | | | | | |
| | |
Colombia (0.93%) | | | | | | | | |
Gran Tierra Energy, Inc.(a) | | | 718,404 | | | | 2,672,463 | |
Parex Resources,
Inc.(a) | | | 507,300 | | | | 4,070,173 | |
| | | | | | | | |
| | | | | | | 6,742,636 | |
| | | | | | | | |
| | |
France (1.87%) | | | | | | | | |
Alten SA | | | 16,253 | | | | 793,353 | |
Argan SA, REIT | | | 38,700 | | | | 939,380 | |
Audika Groupe | | | 82,268 | | | | 1,634,107 | |
Esker SA | | | 36,547 | | | | 985,468 | |
Infotel SA | | | 34,520 | | | | 1,033,750 | |
Medicrea
International(a) | | | 167,370 | | | | 1,422,641 | |
MGI Digital Graphic Technology(a) | | | 44,650 | | | | 1,367,689 | |
| | |
| See Notes to Financial Statements. | | |
| Annual Report | April 30, 2015 | | 19 |
| | |
| Grandeur Peak Global Opportunities Fund | | Portfolio of Investments |
April 30, 2015
| | | | | | | | |
| | | Shares | | | Value
(Note 2) | |
France (continued) | | | | | | | | |
Neurones | | | 45,508 | | | $ | 770,904 | |
Prodware(a) | | | 199,300 | | | | 1,562,012 | |
SoluCom | | | 37,952 | | | | 1,836,511 | |
Thermador Groupe | | | 14,473 | | | | 1,273,946 | |
| | | | | | | | |
| | | | | | | 13,619,761 | |
| | | | | | | | |
| | |
Georgia (0.65%) | | | | | | | | |
Bank of Georgia Holdings PLC | | | 172,400 | | | | 4,734,659 | |
| | | | | | | | |
| | |
Germany (3.20%) | | | | | | | | |
Bertrandt AG | | | 37,719 | | | | 4,979,691 | |
ElringKlinger AG | | | 119,051 | | | | 3,277,405 | |
Nexus AG | | | 160,092 | | | | 3,163,763 | |
Norma Group SE | | | 43,068 | | | | 2,287,672 | |
Patrizia Immobilien AG(a) | | | 202,511 | | | | 3,989,125 | |
Softing AG | | | 75,599 | | | | 1,194,296 | |
Wirecard AG | | | 100,285 | | | | 4,404,431 | |
| | | | | | | | |
| | | | | | | 23,296,383 | |
| | | | | | | | |
| | |
Greece (0.12%) | | | | | | | | |
Sarantis SA(a) | | | 94,206 | | | | 856,811 | |
| | | | | | | | |
| | |
Hong Kong (2.16%) | | | | | | | | |
International Housewares Retail Co., Ltd. | | | 10,697,000 | | | | 3,022,551 | |
Samsonite International SA | | | 578,000 | | | | 2,108,063 | |
Sinosoft Technology Group, Ltd. | | | 1,243,000 | | | | 925,646 | |
Value Partners Group, Ltd. | | | 5,243,000 | | | | 9,693,625 | |
| | | | | | | | |
| | | | | | | 15,749,885 | |
| | | | | | | | |
| | |
India (7.44%) | | | | | | | | |
AIA Engineering, Ltd. | | | 38,400 | | | | 693,798 | |
Ajanta Pharma, Ltd. | | | 179,667 | | | | 3,572,690 | |
Bajaj Corp., Ltd. | | | 144,440 | | | | 996,856 | |
Bajaj Finance, Ltd. | | | 41,475 | | | | 2,640,227 | |
Balkrishna Industries, Ltd. | | | 154,500 | | | | 1,887,739 | |
City Union Bank, Ltd. | | | 895,267 | | | | 1,329,639 | |
Credit Analysis & Research, Ltd. | | | 138,700 | | | | 3,400,186 | |
Dewan Housing Finance Corp., Ltd. | | | 289,500 | | | | 2,028,949 | |
eClerx Services, Ltd. | | | 94,800 | | | | 2,377,944 | |
Eros International Media, Ltd.(a) | | | 62,500 | | | | 405,201 | |
Glenmark Pharmaceuticals, Ltd. | | | 375,000 | | | | 5,245,492 | |
Hinduja Global Solutions, Ltd. | | | 297,900 | | | | 2,560,464 | |
Indiabulls Housing Finance, Ltd. | | | 213,000 | | | | 1,984,849 | |
| | | | | | | | |
| | | Shares | | | Value
(Note 2) | |
India (continued) | | | | | | | | |
Infotech Enterprises, Ltd. | | | 359,116 | | | $ | 2,720,721 | |
Jammu & Kashmir Bank, Ltd. | | | 1,114,000 | | | | 1,680,965 | |
Kolte-Patil Developers, Ltd. | | | 652,097 | | | | 2,197,444 | |
KPIT Technologies, Ltd. | | | 781,850 | | | | 1,292,169 | |
Mahindra & Mahindra Financial Services, Ltd. | | | 73,700 | | | | 310,258 | |
MBL Infrastructures, Ltd. | | | 131,100 | | | | 1,176,388 | |
MT Educare, Ltd. | | | 587,689 | | | | 954,249 | |
Nirvikara Paper Mills, Ltd.(a)(c) | | | 7,555 | | | | 8,093 | |
PC Jeweller, Ltd. | | | 239,789 | | | | 1,288,309 | |
Persistent Systems, Ltd. | | | 118,200 | | | | 1,313,385 | |
Poly Medicure, Ltd. | | | 37,068 | | | | 312,010 | |
Supreme Industries, Ltd. | | | 177,644 | | | | 1,909,851 | |
Time Technoplast, Ltd. | | | 1,804,205 | | | | 1,299,546 | |
Vaibhav Global, Ltd. | | | 204,557 | | | | 2,575,843 | |
Vakrangee Software, Ltd. | | | 570,900 | | | | 954,461 | |
Vesuvius India, Ltd. | | | 53,365 | | | | 619,434 | |
WNS Holdings, Ltd., ADR(a) | | | 181,975 | | | | 4,391,057 | |
| | | | | | | | |
| | | | | | | 54,128,217 | |
| | | | | | | | |
| | |
Indonesia (3.17%) | | | | | | | | |
Arwana Citramulia Tbk PT | | | 48,263,300 | | | | 1,936,117 | |
Astra Graphia Tbk PT | | | 9,349,400 | | | | 1,601,209 | |
Bank Negara Indonesia Persero Tbk PT | | | 7,019,500 | | | | 3,464,242 | |
Bank Tabungan Pensiunan Nasional Tbk
PT(a) | | | 2,139,100 | | | | 651,838 | |
Lippo Cikarang Tbk PT(a) | | | 1,603,500 | | | | 1,476,717 | |
Panin Sekuritas Tbk PT | | | 4,471,300 | | | | 1,723,627 | |
Petra Foods, Ltd. | | | 1,461,300 | | | | 4,274,268 | |
Selamat Sempurna Tbk PT | | | 14,442,000 | | | | 5,239,605 | |
Tempo Scan Pacific Tbk PT | | | 10,915,000 | | | | 1,708,982 | |
Ultrajaya Milk Industry & Trading Co. Tbk PT | | | 3,254,500 | | | | 990,622 | |
| | | | | | | | |
| | | | | | | 23,067,227 | |
| | | | | | | | |
| | |
Ireland (0.66%) | | | | | | | | |
Beazley PLC | | | 611,300 | | | | 2,628,951 | |
Irish Residential Properties, REIT PLC | | | 1,797,346 | | | | 2,157,402 | |
| | | | | | | | |
| | | | | | | 4,786,353 | |
| | | | | | | | |
| | |
Israel (0.29%) | | | | | | | | |
Caesarstone Sdot Yam, Ltd. | | | 22,800 | | | | 1,350,672 | |
Hamlet Israel-Canada, Ltd. | | | 75,283 | | | | 737,897 | |
| | | | | | | | |
| | | | | | | 2,088,569 | |
| | | | | | | | |
| | |
Japan (5.27%) | | | | | | | | |
AIT Corp. | | | 329,200 | | | | 3,198,258 | |
AP Company Co., Ltd.(a) | | | 83,400 | | | | 1,209,505 | |
| | |
| See Notes to Financial Statements. | | |
| 20 | | 1.855.377.7325 | www.GrandeurPeakGlobal.com |
| | |
| Grandeur Peak Global Opportunities Fund | | Portfolio of Investments |
April 30, 2015
| | | | | | | | |
| | | Shares | | | Value
(Note 2) | |
Japan (continued) | | | | | | | | |
Arcland Service Co., Ltd. | | | 58,700 | | | $ | 2,499,667 | |
Benefit One, Inc. | | | 172,900 | | | | 2,513,924 | |
CMIC Co., Ltd. | | | 105,120 | | | | 1,561,348 | |
Daikokutenbussan Co., Ltd. | | | 18,100 | | | | 759,807 | |
Descente, Ltd. | | | 146,900 | | | | 1,885,925 | |
Future Architect, Inc. | | | 276,100 | | | | 1,667,621 | |
GCA Savvian Corp. | | | 283,700 | | | | 3,030,132 | |
Hard Off Corp. Co., Ltd. | | | 119,800 | | | | 1,188,720 | |
JCU Corp. | | | 53,200 | | | | 2,220,628 | |
MISUMI Group, Inc. | | | 44,500 | | | | 1,670,002 | |
Monogatari Corp. | | | 53,300 | | | | 1,783,709 | |
Prestige International, Inc. | | | 79,900 | | | | 618,905 | |
Shaklee Global Group,
Inc.(a) | | | 25,000 | | | | 434,714 | |
SK Kaken Co., Ltd. | | | 34,000 | | | | 2,981,407 | |
Syuppin Co., Ltd. | | | 155,400 | | | | 1,899,161 | |
Trancom Co., Ltd. | | | 153,370 | | | | 7,239,798 | |
| | | | | | | | |
| | | | | | | 38,363,231 | |
| | | | | | | | |
| | |
Luxembourg (0.75%) | | | | | | | | |
L’Occitane International SA | | | 1,843,753 | | | | 5,435,712 | |
| | | | | | | | |
| | |
Malaysia (1.60%) | | | | | | | | |
AEON Credit Service M Bhd | | | 778,480 | | | | 3,243,939 | |
Berjaya Auto Bhd | | | 2,461,000 | | | | 2,789,000 | |
Berjaya Food Bhd | | | 271,500 | | | | 220,310 | |
Kossan Rubber Industries | | | 1,040,000 | | | | 1,752,071 | |
My EG Services Bhd | | | 2,041,200 | | | | 1,445,568 | |
Padini Holdings Bhd | | | 5,568,350 | | | | 2,184,410 | |
| | | | | | | | |
| | | | | | | 11,635,298 | |
| | | | | | | | |
| | |
Mexico (0.43%) | | | | | | | | |
Banregio Grupo Financiero SAB de CV(a) | | | 206,120 | | | | 1,182,281 | |
Credito Real SAB de CV | | | 800,643 | | | | 1,971,601 | |
| | | | | | | | |
| | | | | | | 3,153,882 | |
| | | | | | | | |
| | |
Netherlands (0.51%) | | | | | | | | |
Aalberts Industries NV | | | 96,200 | | | | 2,982,460 | |
Arcadis NV | | | 22,500 | | | | 712,216 | |
| | | | | | | | |
| | | | | | | 3,694,676 | |
| | | | | | | | |
| | |
Norway (0.27%) | | | | | | | | |
Medistim ASA | | | 152,700 | | | | 838,918 | |
SpareBank 1 SMN | | | 50,195 | | | | 448,380 | |
Zalaris ASA(a) | | | 158,444 | | | | 672,058 | |
| | | | | | | | |
| | | | | | | 1,959,356 | |
| | | | | | | | |
| | |
Philippines (1.08%) | | | | | | | | |
Pepsi-Cola Products Philippines, Inc.(a) | | | 27,565,900 | | | | 2,692,829 | |
| | | | | | | | |
| | | Shares | | | Value
(Note 2) | |
Philippines (continued) | | | | | | | | |
Security Bank Corp. | | | 1,374,640 | | | $ | 5,179,729 | |
| | | | | | | | |
| | | | | | | 7,872,558 | |
| | | | | | | | |
| | |
Poland (0.12%) | | | | | | | | |
Wawel SA | | | 2,456 | | | | 907,393 | |
| | | | | | | | |
| | |
Singapore (0.78%) | | | | | | | | |
ARA Asset Management, Ltd. | | | 1,582,888 | | | | 2,067,346 | |
CSE Global, Ltd. | | | 4,531,250 | | | | 1,966,440 | |
Riverstone Holdings, Ltd. | | | 1,843,600 | | | | 1,615,502 | |
| | | | | | | | |
| | | | | | | 5,649,288 | |
| | | | | | | | |
| | |
South Africa (2.01%) | | | | | | | | |
Blue Label Telecoms, Ltd. | | | 1,012,400 | | | | 683,373 | |
Cartrack Holdings,
Ltd.(a) | | | 4,257,400 | | | | 3,131,428 | |
Cashbuild, Ltd. | | | 5,800 | | | | 136,167 | |
Clicks Group, Ltd. | | | 347,649 | | | | 2,664,265 | |
EOH Holdings, Ltd. | | | 153,300 | | | | 2,080,134 | |
Italtile, Ltd. | | | 1,177,166 | �� | | | 1,157,746 | |
MiX Telematics, Ltd., Sponsored ADR(a) | | | 117,000 | | | | 819,000 | |
Super Group, Ltd.(a) | | | 1,309,307 | | | | 3,968,274 | |
| | | | | | | | |
| | | | | | | 14,640,387 | |
| | | | | | | | |
| | |
South Korea (2.89%) | | | | | | | | |
Duk San Neolux Co., Ltd.(a) | | | 52,423 | | | | 1,080,736 | |
Hy-Lok Corp. | | | 234,907 | | | | 7,448,176 | |
ISC Co., Ltd. | | | 125,182 | | | | 5,012,616 | |
Koh Young Technology, Inc. | | | 55,781 | | | | 2,302,276 | |
KONA I Co., Ltd. | | | 85,980 | | | | 2,800,691 | |
LEENO Industrial, Inc. | | | 56,600 | | | | 2,422,784 | |
| | | | | | | | |
| | | | | | | 21,067,279 | |
| | | | | | | | |
| | |
Sweden (2.46%) | | | | | | | | |
AddTech AB, Class B | | | 212,427 | | | | 2,793,471 | |
Beijer Alma AB | | | 95,000 | | | | 2,131,796 | |
Bufab Holding AB(a) | | | 441,000 | | | | 2,831,214 | |
Indutrade AB | | | 70,900 | | | | 3,463,599 | |
Moberg Pharma AB(a) | | | 245,880 | | | | 1,480,086 | |
Nibe Industrier AB, Class B | | | 98,400 | | | | 2,620,944 | |
Opus Group AB | | | 2,372,531 | | | | 2,610,584 | |
| | | | | | | | |
| | | | | | | 17,931,694 | |
| | | | | | | | |
| | |
Switzerland (0.81%) | | | | | | | | |
VZ Holding AG | | | 27,475 | | | | 5,889,919 | |
| | | | | | | | |
| | |
Taiwan (5.09%) | | | | | | | | |
ASPEED Technology, Inc. | | | 217,698 | | | | 1,994,386 | |
Cub Elecparts, Inc. | | | 254,778 | | | | 3,232,315 | |
Novatek Microelectronics Corp. | | | 602,000 | | | | 3,146,434 | |
| | |
| See Notes to Financial Statements. | | |
| Annual Report | April 30, 2015 | | 21 |
| | |
| Grandeur Peak Global Opportunities Fund | | Portfolio of Investments |
April 30, 2015
| | | | | | | | |
| | | Shares | | | Value (Note 2) | |
Taiwan (continued) | | | | | | | | |
On-Bright Electronics, Inc. | | | 230,900 | | | $ | 1,252,767 | |
Polyronics Tech Corp. | | | 1,938,200 | | | | 4,472,821 | |
Silergy Corp. | | | 424,852 | | | | 4,203,095 | |
Sinmag Equipment Corp. | | | 197,120 | | | | 1,182,589 | |
Sporton International, Inc. | | | 1,191,347 | | | | 6,754,765 | |
Test Research, Inc. | | | 1,324,708 | | | | 2,693,691 | |
TSC Auto ID Technology Co., Ltd. | | | 132,000 | | | | 1,122,874 | |
UDE Corp. | | | 1,599,000 | | | | 3,506,997 | |
Voltronic Power Technology Corp. | | | 282,100 | | | | 3,499,852 | |
| | | | | | | | |
| | | | | | | 37,062,586 | |
| | | | | | | | |
| | |
Thailand (0.63%) | | | | | | | | |
LPN Development PCL | | | 4,370,000 | | | | 2,272,525 | |
Premier Marketing PCL | | | 7,758,000 | | | | 2,350,967 | |
| | | | | | | | |
| | | | | | | 4,623,492 | |
| | | | | | | | |
| | |
Turkey (0.44%) | | | | | | | | |
Albaraka Turk Katilim Bankasi AS | | | 2,701,883 | | | | 1,746,802 | |
EGE Seramik Sanayi ve Ticaret AS | | | 952,000 | | | | 1,431,954 | |
| | | | | | | | |
| | | | | | | 3,178,756 | |
| | | | | | | | |
| | |
United Arab Emirates (0.10%) | | | | | | | | |
Aramex PJSC | | | 755,100 | | | | 714,239 | |
| | | | | | | | |
| | |
United States (29.71%) | | | | | | | | |
Abaxis, Inc. | | | 29,080 | | | | 1,861,120 | |
Alamo Group, Inc. | | | 23,125 | | | | 1,428,662 | |
Amsurg Corp.(a) | | | 84,080 | | | | 5,273,498 | |
Aratana Therapeutics, Inc.(a) | | | 36,875 | | | | 476,056 | |
BioDelivery Sciences International,
Inc.(a) | | | 136,250 | | | | 1,098,175 | |
Cardica, Inc.(a) | | | 359,695 | | | | 146,756 | |
Cempra, Inc.(a) | | | 34,325 | | | | 1,080,894 | |
Chase Corp. | | | 9,627 | | | | 344,743 | |
CRA International, Inc.(a) | | | 62,347 | | | | 1,820,532 | |
Diamond Hill Investment Group, Inc. | | | 33,950 | | | | 6,185,690 | |
Dorman Products,
Inc.(a) | | | 31,300 | | | | 1,465,779 | |
DXP Enterprises, Inc.(a) | | | 40,700 | | | | 1,833,535 | |
Enphase Energy, Inc.(a) | | | 194,650 | | | | 2,446,750 | |
EPAM Systems, Inc.(a) | | | 94,700 | | | | 6,128,037 | |
Escalade, Inc. | | | 53,725 | | | | 966,513 | |
ExlService Holdings, Inc.(a) | | | 71,700 | | | | 2,468,631 | |
First Cash Financial Services, Inc.(a) | | | 68,700 | | | | 3,320,958 | |
First Republic Bank | | | 402,000 | | | | 23,432,580 | |
Fresh Market, Inc.(a) | | | 96,175 | | | | 3,379,590 | |
Genpact, Ltd.(a) | | | 106,300 | | | | 2,323,718 | |
| | | | | | | | |
| | | Shares | | | Value (Note 2) | |
United States (continued) | | | | | | | | |
Gentex Corp. | | | 143,575 | | | $ | 2,491,026 | |
Geospace Technologies Corp.(a) | | | 51,500 | | | | 1,112,400 | |
Grand Canyon Education, Inc.(a) | | | 60,475 | | | | 2,738,308 | |
Hennessy Advisors, Inc. | | | 33,925 | | | | 653,395 | |
Hibbett Sports, Inc.(a) | | | 36,950 | | | | 1,729,260 | |
Home BancShares, Inc. | | | 111,625 | | | | 3,670,230 | |
Inphi Corp.(a) | | | 211,625 | | | | 4,539,356 | |
IPC The Hospitalist Co., Inc.(a) | | | 85,575 | | | | 4,186,329 | |
Jones Energy, Inc., Class A(a) | | | 188,761 | | | | 1,936,688 | |
K2M Group Holdings, Inc.(a) | | | 154,425 | | | | 3,244,469 | |
Knight Transportation, Inc. | | | 352,745 | | | | 10,194,330 | |
LGI Homes, Inc.(a) | | | 321,175 | | | | 5,289,752 | |
Littelfuse, Inc. | | | 14,100 | | | | 1,381,659 | |
Malibu Boats, Inc.,
Class A(a) | | | 132,950 | | | | 2,814,551 | |
Manitex International, Inc.(a) | | | 221,355 | | | | 2,193,628 | |
MarketAxess Holdings, Inc. | | | 66,300 | | | | 5,691,855 | |
MaxLinear, Inc.,
Class A(a) | | | 255,275 | | | | 2,177,496 | |
Mesa Laboratories, Inc. | | | 14,447 | | | | 1,226,406 | |
Microchip Technology, Inc. | | | 51,545 | | | | 2,456,377 | |
Navigant Consulting,
Inc.(a) | | | 96,660 | | | | 1,397,704 | |
NorthStar Asset Management Group, Inc. | | | 107,550 | | | | 2,261,777 | |
NorthStar Realty Finance Corp., REIT | | | 185,700 | | | | 3,483,732 | |
Perficient, Inc.(a) | | | 205,650 | | | | 4,242,560 | |
Pericom Semiconductor Corp. | | | 135,831 | | | | 1,700,604 | |
Power Integrations, Inc. | | | 74,400 | | | | 3,682,056 | |
Redwood Trust, Inc., REIT | | | 133,800 | | | | 2,300,022 | |
Resources Connection, Inc. | | | 283,915 | | | | 4,474,500 | |
Roadrunner Transportation Systems, Inc.(a) | | | 604,900 | | | | 14,801,903 | |
SEI Investments Co. | | | 54,200 | | | | 2,474,772 | |
Signature Bank(a) | | | 23,350 | | | | 3,131,002 | |
Silicon Laboratories,
Inc.(a) | | | 97,640 | | | | 5,045,059 | |
STAAR Surgical Co.(a) | | | 512,925 | | | | 4,539,386 | |
SVB Financial Group(a) | | | 11,000 | | | | 1,460,360 | |
Synaptics, Inc.(a) | | | 24,675 | | | | 2,090,466 | |
Synergetics USA, Inc.(a) | | | 181,888 | | | | 889,432 | |
Syntel, Inc.(a) | | | 89,375 | | | | 4,023,663 | |
Transcat, Inc.(a) | | | 14,102 | | | | 143,699 | |
TriMas Corp.(a) | | | 119,700 | | | | 3,371,949 | |
TubeMogul, Inc.(a) | | | 114,869 | | | | 1,654,114 | |
Universal Truckload Services, Inc. | | | 383,907 | | | | 8,154,185 | |
Veracyte, Inc.(a) | | | 119,148 | | | | 1,090,204 | |
Virtusa Corp.(a) | | | 94,575 | | | | 3,764,085 | |
| | |
| See Notes to Financial Statements. | | |
| 22 | | 1.855.377.7325 | www.GrandeurPeakGlobal.com |
| | |
| Grandeur Peak Global Opportunities Fund | | Portfolio of Investments |
April 30, 2015
| | | | | | | | |
| | | Shares | | | Value
(Note 2) | |
United States (continued) | | | | | | | | |
Vitamin Shoppe, Inc.(a) | | | 59,650 | | | $ | 2,498,142 | |
Wesco Aircraft Holdings, Inc.(a) | | | 284,100 | | | | 4,454,688 | |
Whitestone, REIT | | | 130,965 | | | | 1,925,186 | |
| | | | | | | | |
| | | | | | | 216,264,982 | |
| | | | | | | | |
| | |
Vietnam (0.09%) | | | | | | | | |
DHG Pharmaceutical JSC | | | 27,440 | | | | 106,760 | |
Vietnam Dairy Products JSC | | | 110,000 | | | | 550,255 | |
| | | | | | | | |
| | | | | | | 657,015 | |
| | | | | | | | |
| | |
TOTAL COMMON STOCKS (Cost $584,552,081) | | | | | | | 717,691,786 | |
| | | | | | | | |
|
PREFERRED STOCKS (0.31%) | |
Brazil (0.31%) | | | | | | | | |
Banco ABC Brasil SA | | | 503,840 | | | | 2,215,729 | |
| | | | | | | | |
| |
TOTAL PREFERRED STOCKS (Cost $2,744,906) | | | | 2,215,729 | |
| | | | | | | | |
| |
TOTAL INVESTMENTS (98.91%) (Cost $587,296,987) | | | $ | 719,907,515 | |
| | |
Assets In Excess Of Other Liabilities (1.09%) | | | | | | | 7,949,091 | |
| | | | | | | | |
| | |
NET ASSETS (100.00%) | | | | | | $ | 727,856,606 | |
| | | | | | | | |
| (a) | Non-Income Producing Security. |
| (b) | Security was purchased pursuant to Regulation S under the Securities Act of 1933, which exempts securities offered and sold outside of the United States from registration. Such security cannot be sold in the United States without either an effective registration statement filed pursuant to the Securities Act of 1933, or pursuant to an exemption from registration. The security has been deemed liquid under guidelines approved by the Fund’s Board of Trustees. As of April 30, 2015, the aggregate market value of those securities was $4,260,145, representing 0.59% of net assets. |
| (c) | Fair valued security under the procedures approved by the Fund’s Board of Trustees. |
| (d) | Security exempt from registration under Rule 144A of the Securities Act of 1933. These securities may be resold in the ordinary course of business in transactions exempt from registration, normally to qualified institutional buyers. As of April 30, 2015, these securities had a total aggregate market value of $1,035,103 representing 0.14% of net assets. |
Common Abbreviations:
AB - Aktiebolag is the Swedish equivalent of the term corporation.
ADR - American Depositary Receipt.
AG - Aktiengesellschaft is a German term that refers to a corporation that is limited by shares, i.e., owned by shareholders.
AS - Aktieselskab is the Danish term for a stock-based corporation.
ASA - Allmennaksjeselskap is the Norwegian term for a public limited company.
Bhd - Berhad is the Malaysian term for public limited company.
JSC - Joint Stock Company.
Ltd. - Limited.
NV - Naamloze Vennootschap is the Dutch term for a public limited liability corporation.
PCL - Public Company Limited.
PJSC - Public Joint Stock Company.
PLC - Public Limited Company.
REIT - Real Estate Investment Trust.
SA - Generally designates corporations in various countries, mostly those employing the civil law.
SAB de CV - A variable capital company.
SE - A European Company which can operate on a Europe-wide basis and be governed by community law directly applicable in all member states.
Tbk PT - Terbuka Perseroan Terbatas is an Indonesian term for a limited liability company.
Holdings are subject to change.
For Fund compliance purposes, the Fund’s geographical classifications refer to any one or more of the country sub-classifications used by one or more widely recognized market indexes or ratings group indexes, and/or as defined by Fund management. This definition may not apply for purposes of this report, which may combine sub-classifications for reporting ease. Geographical regions are shown as a percentage of net assets.
| | |
| See Notes to Financial Statements. | | |
| Annual Report | April 30, 2015 | | 23 |
| | |
| Grandeur Peak Global Reach Fund | | Portfolio of Investments |
April 30, 2015
| | | | | | | | |
| | | Shares | | | Value
(Note 2) | |
COMMON STOCKS (97.65%) | |
Australia (2.00%) | | | | | | | | |
ALS, Ltd. | | | 31,823 | | | $ | 131,444 | |
Austbrokers Holdings, Ltd. | | | 132,251 | | | | 893,552 | |
Beacon Lighting Group, Ltd. | | | 749,900 | | | | 1,134,804 | |
Countplus, Ltd. | | | 822,288 | | | | 724,640 | |
CTI Logistics, Ltd. | | | 312,888 | | | | 334,786 | |
LifeHealthcare Group, Ltd. | | | 140,900 | | | | 362,664 | |
Lycopodium, Ltd. | | | 80,800 | | | | 92,444 | |
Magellan Financial Group, Ltd. | | | 164,264 | | | | 2,578,037 | |
The Reject Shop, Ltd. | | | 138,800 | | | | 712,415 | |
| | | | | | | | |
| | | | | | | 6,964,786 | |
| | | | | | | | |
| | |
Austria (0.38%) | | | | | | | | |
Palfinger AG | | | 44,094 | | | | 1,322,932 | |
| | | | | | | | |
| | |
Bangladesh (0.06%) | | | | | | | | |
Islami Bank Bangladesh, Ltd. | | | 985,000 | | | | 205,076 | |
| | | | | | | | |
| | |
Belgium (0.29%) | | | | | | | | |
Melexis NV | | | 16,185 | | | | 999,185 | |
| | | | | | | | |
| | |
Brazil (1.59%) | | | | | | | | |
Banco Daycoval SA | | | 267,200 | | | | 710,358 | |
CETIP SA - Mercados Organizados | | | 173,788 | | | | 1,979,589 | |
Even Construtora e Incorporadora SA | | | 150,700 | | | | 243,085 | |
Grazziotin SA, Preference | | | 27,800 | | | | 139,325 | |
M Dias Branco SA | | | 41,100 | | | | 1,170,408 | |
Odontoprev SA | | | 233,000 | | | | 817,408 | |
Valid Solucoes SA | | | 30,100 | | | | 468,041 | |
| | | | | | | | |
| | | | | | | 5,528,214 | |
| | | | | | | | |
| | |
Britain (6.94%) | | | | | | | | |
AB Dynamics PLC | | | 191,800 | | | | 591,216 | |
Abcam PLC | | | 207,389 | | | | 1,668,840 | |
Advanced Medical Solutions Group PLC | | | 163,095 | | | | 354,873 | |
Arrow Global Group PLC | | | 232,300 | | | | 925,328 | |
blinkx PLC(a) | | | 771,300 | | | | 414,392 | |
Bovis Homes Group PLC | | | 35,174 | | | | 500,822 | |
Brammer PLC | | | 58,301 | | | | 339,846 | |
Cambian Group PLC | | | 357,100 | | | | 1,421,077 | |
Clinigen Group PLC | | | 678,130 | | | | 6,237,995 | |
Diploma PLC | | | 39,400 | | | | 480,809 | |
dotdigital group PLC | | | 1,901,856 | | | | 875,806 | |
EMIS Group PLC | | | 45,396 | | | | 655,020 | |
Halma PLC | | | 14,736 | | | | 160,488 | |
HSS Hire Group
PLC(a)(b)(c) | | | 360,000 | | | | 1,090,005 | |
Hunting PLC | | | 28,800 | | | | 258,838 | |
| | | | | | | | |
| | | Shares | | | Value
(Note 2) | |
Britain (continued) | | | | | | | | |
IDOX PLC | | | 768,700 | | | $ | 470,448 | |
IG Group Holdings PLC | | | 234,443 | | | | 2,643,382 | |
ITE Group PLC | | | 74,900 | | | | 216,147 | |
Koovs PLC(a) | | | 336,300 | | | | 394,903 | |
Oxford Immunotec Global PLC(a) | | | 48,650 | | | | 645,585 | |
Premier Oil PLC(a) | | | 113,358 | | | | 303,258 | |
RPS Group PLC | | | 166,299 | | | | 543,724 | |
Telit Communications PLC(a) | | | 258,600 | | | | 923,905 | |
Topps Tiles PLC | | | 616,295 | | | | 1,090,281 | |
Tracsis PLC | | | 25,100 | | | | 169,366 | |
Ultra Electronics Holdings PLC | | | 10,750 | | | | 285,875 | |
WANdisco PLC(a) | | | 100,245 | | | | 450,612 | |
| | | | | | | | |
| | | | | | | 24,112,841 | |
| | | | | | | | |
| | |
Canada (1.82%) | | | | | | | | |
Bankers Petroleum, Ltd.(a) | | | 179,806 | | | | 535,022 | |
Cipher Pharmaceuticals, Inc.(a) | | | 37,500 | | | | 389,453 | |
Delphi Energy Corp.(a) | | | 411,600 | | | | 569,724 | |
Halogen Software, Inc.(a) | | | 11,995 | | | | 104,391 | |
Home Capital Group, Inc. | | | 76,859 | | | | 3,033,589 | |
Mapan Energy,
Ltd.(a)(d) | | | 422,300 | | | | 332,520 | |
Stantec, Inc. | | | 18,820 | | | | 508,366 | |
TransForce, Inc. | | | 37,296 | | | | 842,367 | |
| | | | | | | | |
| | | | | | | 6,315,432 | |
| | | | | | | | |
| | |
China (9.11%) | | | | | | | | |
51job, Inc., ADR(a) | | | 9,900 | | | | 356,400 | |
AAC Technologies Holdings, Inc. | | | 59,000 | | | | 311,444 | |
Airtac International Group | | | 43,000 | | | | 351,504 | |
BBI Life Sciences Corp.(a)(c) | | | 3,032,500 | | | | 1,329,338 | |
China Biologic Products, Inc.(a) | | | 3,525 | | | | 337,131 | |
China Construction Bank Corp., H Shares | | | 750,000 | | | | 728,051 | |
China Lesso Group Holdings, Ltd. | | | 2,878,000 | | | | 2,114,629 | |
China Medical System Holdings, Ltd. | | | 642,000 | | | | 1,132,971 | |
China Pioneer Pharma Holdings, Ltd. | | | 1,083,000 | | | | 841,493 | |
China Singyes Solar Technologies Holdings, Ltd. | | | 317,000 | | | | 519,127 | |
China South City Holdings, Ltd. | | | 2,135,000 | | | | 940,942 | |
Consun Pharmaceutical Group, Ltd. | | | 641,000 | | | | 512,339 | |
Dongpeng Holdings Co., Ltd. | | | 3,375,000 | | | | 1,855,030 | |
| | |
| See Notes to Financial Statements. | | |
| 24 | | 1.855.377.7325 | www.GrandeurPeakGlobal.com |
| | |
| Grandeur Peak Global Reach Fund | | Portfolio of Investments |
April 30, 2015
| | | | | | | | |
| | | Shares | | | Value (Note 2) | |
China (continued) | | | | | | | | |
Far East Horizon, Ltd. | | | 1,324,900 | | | $ | 1,399,191 | |
Goldpac Group, Ltd. | | | 382,000 | | | | 318,896 | |
Hilong Holding, Ltd. | | | 1,330,000 | | | | 501,023 | |
Le Saunda Holdings, Ltd. | | | 2,212,000 | | | | 946,379 | |
Man Wah Holdings, Ltd. | | | 5,574,600 | | | | 7,232,896 | |
Mindray Medical International, Ltd., ADR | | | 36,450 | | | | 1,125,576 | |
Noah Holdings, Ltd., Sponsored ADR(a) | | | 24,500 | | | | 830,305 | |
O2Micro International, Ltd., ADR(a) | | | 75,650 | | | | 173,995 | |
Phoenix New Media, Ltd., ADR(a) | | | 134,225 | | | | 967,762 | |
Sihuan Pharmaceutical Holdings Group, Ltd.(e) | | | 1,097,000 | | | | 686,461 | |
Tao Heung Holdings, Ltd. | | | 18,000 | | | | 8,578 | |
Technovator International,
Ltd.(a) | | | 965,000 | | | | 941,321 | |
Tsui Wah Holdings, Ltd. | | | 2,957,000 | | | | 998,289 | |
Vitasoy International Holdings, Ltd. | | | 922,000 | | | | 1,686,843 | |
Wonderful Sky Financial Group Holdings, Ltd. | | | 1,175,000 | | | | 356,265 | |
WuXi PharmaTech Cayman, Inc., ADR(a) | | | 38,935 | | | | 1,680,824 | |
Xiabuxiabu Catering Management China Holdings Co., Ltd.(a)(b)(c) | | | 756,000 | | | | 492,162 | |
| | | | | | | | |
| | | | | | | 31,677,165 | |
| | | | | | | | |
| | |
Colombia (0.67%) | | | | | | | | |
BBVA Colombia SA | | | 2,034,000 | | | | 267,272 | |
Gran Tierra Energy, Inc.(a) | | | 279,825 | | | | 1,040,949 | |
Parex Resources,
Inc.(a) | | | 127,261 | | | | 1,021,041 | |
| | | | | | | | |
| | | | | | | 2,329,262 | |
| | | | | | | | |
| | |
Denmark (0.08%) | | | | | | | | |
Ringkjoebing Landbobank AS | | | 1,258 | | | | 281,316 | |
| | | | | | | | |
| | |
Finland (0.02%) | | | | | | | | |
Aktia Bank OYJ | | | 6,544 | | | | 80,143 | |
| | | | | | | | |
| | |
France (2.35%) | | | | | | | | |
1000mercis | | | 4,350 | | | | 203,924 | |
Akka Technologies SA | | | 17,314 | | | | 542,016 | |
Alten SA | | | 15,200 | | | | 741,953 | |
Argan SA, REIT | | | 34,501 | | | | 837,456 | |
Audika Groupe | | | 15,035 | | | | 298,643 | |
Ausy(a) | | | 17,938 | | | | 670,718 | |
Esker SA | | | 33,309 | | | | 898,157 | |
| | | | | | | | |
| | | Shares | | | Value (Note 2) | |
France (continued) | | | | | | | | |
GameLoft SE(a) | | | 66,290 | | | $ | 350,529 | |
Infotel SA | | | 17,207 | | | | 515,288 | |
Medicrea International(a) | | | 86,569 | | | | 735,834 | |
MGI Digital Graphic Technology(a) | | | 24,519 | | | | 751,050 | |
Neurones | | | 19,682 | | | | 333,413 | |
Prodware(a) | | | 56,904 | | | | 445,985 | |
SoluCom | | | 10,233 | | | | 495,179 | |
Thermador Groupe | | | 1,460 | | | | 128,512 | |
Trigano SA | | | 5,737 | | | | 206,588 | |
| | | | | | | | |
| | | | | | | 8,155,245 | |
| | | | | | | | |
| | |
Georgia (0.77%) | | | | | | | | |
Bank of Georgia Holdings PLC | | | 97,200 | | | | 2,669,425 | |
| | | | | | | | |
| | |
Germany (2.48%) | | | | | | | | |
Bertrandt AG | | | 2,377 | | | | 313,813 | |
CANCOM SE | | | 11,900 | | | | 492,238 | |
Elmos Semiconductor AG | | | 43,453 | | | | 833,662 | |
ElringKlinger AG | | | 56,614 | | | | 1,558,551 | |
First Sensor AG(a) | | | 84,919 | | | | 982,118 | |
Nexus AG | | | 49,685 | | | | 981,883 | |
Norma Group SE | | | 6,360 | | | | 337,828 | |
Patrizia Immobilien AG(a) | | | 111,017 | | | | 2,186,848 | |
Softing AG | | | 4,917 | | | | 77,678 | |
Wirecard AG | | | 19,596 | | | | 860,639 | |
| | | | | | | | |
| | | | | | | 8,625,258 | |
| | | | | | | | |
| | |
Greece (0.64%) | | | | | | | | |
Sarantis SA(a) | | | 246,161 | | | | 2,238,855 | |
| | | | | | | | |
| | |
Hong Kong (2.58%) | | | | | | | | |
International Housewares Retail Co., Ltd. | | | 7,762,000 | | | | 2,193,235 | |
Samsonite International SA | | | 641,400 | | | | 2,339,294 | |
Sinosoft Technology Group, Ltd. | | | 1,113,000 | | | | 828,837 | |
Value Partners Group, Ltd. | | | 1,944,000 | | | | 3,594,203 | |
| | | | | | | | |
| | | | | | | 8,955,569 | |
| | | | | | | | |
| | |
India (7.77%) | | | | | | | | |
Ajanta Pharma, Ltd. | | | 23,418 | | | | 465,669 | |
Bajaj Corp., Ltd. | | | 8,000 | | | | 55,212 | |
Bajaj Finance, Ltd. | | | 15,400 | | | | 980,338 | |
Balkrishna Industries, Ltd. | | | 164,300 | | | | 2,007,479 | |
City Union Bank, Ltd. | | | 450,400 | | | | 668,928 | |
Container Corp. of India, Ltd. | | | 13,600 | | | | 350,744 | |
Credit Analysis & Research, Ltd. | | | 51,300 | | | | 1,257,603 | |
| | |
| See Notes to Financial Statements. | | |
| Annual Report | April 30, 2015 | | 25 |
| | |
| Grandeur Peak Global Reach Fund | | Portfolio of Investments |
April 30, 2015
| | | | | | | | |
| | | Shares | | | Value (Note 2) | |
India (continued) | | | | | | | | |
Dewan Housing Finance Corp., Ltd. | | | 133,400 | | | $ | 934,928 | |
eClerx Services, Ltd. | | | 12,900 | | | | 323,581 | |
Eros International Media, Ltd.(a) | | | 33,838 | | | | 219,379 | |
Glenmark Pharmaceuticals, Ltd. | | | 97,400 | | | | 1,362,429 | |
Hinduja Global Solutions, Ltd. | | | 111,289 | | | | 956,534 | |
IFGL Refractories, Ltd. | | | 108,100 | | | | 224,172 | |
Indiabulls Housing Finance, Ltd. | | | 55,278 | | | | 515,110 | |
Infotech Enterprises, Ltd. | | | 172,700 | | | | 1,308,403 | |
Inox Wind, Ltd.(a) | | | 154,698 | | | | 1,038,424 | |
Ipca Laboratories, Ltd. | | | 47,400 | | | | 478,582 | |
Jammu & Kashmir Bank, Ltd. | | | 420,000 | | | | 633,757 | |
Kolte-Patil Developers, Ltd. | | | 277,200 | | | | 934,112 | |
KPIT Technologies, Ltd. | | | 237,523 | | | | 392,556 | |
La Opala RG, Ltd. | | | 92,505 | | | | 571,491 | |
MBL Infrastructures, Ltd. | | | 127,200 | | | | 1,141,392 | |
MT Educare, Ltd. | | | 843,217 | | | | 1,369,158 | |
Nirvikara Paper Mills,
Ltd.(a)(e) | | | 18,255 | | | | 19,556 | |
PC Jeweller, Ltd. | | | 121,078 | | | | 650,513 | |
Persistent Systems, Ltd. | | | 57,632 | | | | 640,381 | |
PI Industries, Ltd. | | | 45,500 | | | | 471,548 | |
Poly Medicure, Ltd. | | | 81,374 | | | | 684,944 | |
Repco Home Finance, Ltd. | | | 1,131 | | | | 10,330 | |
Sintex Industries, Ltd. | | | 355,000 | | | | 618,163 | |
Somany Ceramics, Ltd. | | | 48,000 | | | | 315,890 | |
Supreme Industries, Ltd. | | | 45,000 | | | | 483,795 | |
Time Technoplast, Ltd. | | | 896,073 | | | | 645,430 | |
Vaibhav Global, Ltd. | | | 104,700 | | | | 1,318,414 | |
Vakrangee Software, Ltd. | | | 144,500 | | | | 241,583 | |
Vesuvius India, Ltd. | | | 24,830 | | | | 288,214 | |
V-Mart Retail, Ltd. | | | 18,567 | | | | 160,552 | |
WNS Holdings, Ltd.,
ADR(a) | | | 94,425 | | | | 2,278,475 | |
| | | | | | | | |
| | | | | | | 27,017,769 | |
| | | | | | | | |
| | |
Indonesia (3.14%) | | | | | | | | |
Arwana Citramulia Tbk PT | | | 2,495,000 | | | | 100,089 | |
Astra Graphia Tbk PT | | | 847,000 | | | | 145,060 | |
Bank Negara Indonesia Persero Tbk PT | | | 2,898,000 | | | | 1,430,212 | |
Bank Tabungan Pensiunan Nasional Tbk PT(a) | | | 1,961,900 | | | | 597,840 | |
Bekasi Fajar Industrial Estate Tbk PT | | | 18,948,000 | | | | 870,753 | |
Express Transindo Utama Tbk PT | | | 5,176,000 | | | | 439,236 | |
Lippo Cikarang Tbk PT(a) | | | 373,000 | | | | 343,508 | |
| | | | | | | | |
| | | Shares | | | Value (Note 2) | |
Indonesia (continued) | | | | | | | | |
Panin Sekuritas Tbk PT | | | 2,192,000 | | | $ | 844,987 | |
Petra Foods, Ltd. | | | 876,700 | | | | 2,564,327 | |
Selamat Sempurna Tbk PT | | | 7,197,200 | | | | 2,611,168 | |
Tempo Scan Pacific Tbk PT | | | 3,623,300 | | | | 567,307 | |
Ultrajaya Milk Industry & Trading Co. Tbk PT | | | 1,251,500 | | | | 380,938 | |
| | | | | | | | |
| | | | | | | 10,895,425 | |
| | | | | | | | |
| | |
Ireland (0.81%) | | | | | | | | |
Beazley PLC | | | 194,200 | | | | 835,174 | |
Irish Residential Properties, REIT PLC | | | 1,659,340 | | | | 1,991,750 | |
| | | | | | | | |
| | | | | | | 2,826,924 | |
| | | | | | | | |
| | |
Israel (1.29%) | | | | | | | | |
Caesarstone Sdot Yam, Ltd. | | | 5,715 | | | | 338,557 | |
Hamlet Israel-Canada, Ltd. | | | 124,669 | | | | 1,221,960 | |
Magic Software Enterprises, Ltd. | | | 43,950 | | | | 282,598 | |
Sarin Technologies, Ltd. | | | 311,000 | | | | 480,638 | |
Silicom, Ltd. | | | 23,449 | | | | 830,095 | |
Wix.com, Ltd.(a) | | | 67,700 | | | | 1,318,119 | |
| | | | | | | | |
| | | | | | | 4,471,967 | |
| | | | | | | | |
| | |
Japan (5.13%) | | | | | | | | |
AIT Corp. | | | 16,200 | | | | 157,387 | |
Anest Iwata Corp. | | | 131,700 | | | | 857,548 | |
AP Company Co., Ltd.(a) | | | 99,500 | | | | 1,442,994 | |
Arcland Service Co., Ltd. | | | 26,200 | | | | 1,115,695 | |
Benefit One, Inc. | | | 17,700 | | | | 257,354 | |
Central Automotive Products, Ltd. | | | 66,000 | | | | 462,668 | |
Century Tokyo Leasing Corp. | | | 10,700 | | | | 337,850 | |
CMIC Co., Ltd. | | | 36,900 | | | | 548,076 | |
Daikokutenbussan Co., Ltd. | | | 21,000 | | | | 881,544 | |
Descente, Ltd. | | | 69,900 | | | | 897,387 | |
Future Architect, Inc. | | | 124,500 | | | | 751,970 | |
GCA Savvian Corp. | | | 75,400 | | | | 805,329 | |
Hard Off Corp. Co., Ltd. | | | 159,600 | | | | 1,583,637 | |
Hiday Hidaka Corp. | | | 10,248 | | | | 249,126 | |
JCU Corp. | | | 15,800 | | | | 659,510 | |
Monogatari Corp. | | | 20,000 | | | | 669,309 | |
Shaklee Global Group,
Inc.(a) | | | 28,900 | | | | 502,529 | |
SK Kaken Co., Ltd. | | | 6,000 | | | | 526,131 | |
Sun Frontier Fudousan Co., Ltd. | | | 57,400 | | | | 546,927 | |
Syuppin Co., Ltd. | | | 148,500 | | | | 1,814,835 | |
TPR Co., Ltd. | | | 51,000 | | | | 1,337,867 | |
Trancom Co., Ltd. | | | 30,500 | | | | 1,439,746 | |
| | | | | | | | |
| | | | | | | 17,845,419 | |
| | | | | | | | |
| | |
| See Notes to Financial Statements. | | |
| 26 | | 1.855.377.7325 | www.GrandeurPeakGlobal.com |
| | |
| Grandeur Peak Global Reach Fund | | Portfolio of Investments |
April 30, 2015
| | | | | | | | |
| | | Shares | | | Value
(Note 2) | |
Kazakhstan (0.02%) | | | | | | | | |
Nostrum Oil & Gas, PLC(a) | | | 8,700 | | | $ | 81,885 | |
| | | | | | | | |
Luxembourg (0.84%) | | | | | | | | |
Globant SA(a) | | | 54,013 | | | | 1,134,813 | |
L’Occitane International SA | | | 602,000 | | | | 1,774,803 | |
| | | | | | | | |
| | | | | | | 2,909,616 | |
| | | | | | | | |
| | |
Malaysia (1.49%) | | | | | | | | |
AEON Credit Service M Bhd | | | 322,500 | | | | 1,343,863 | |
Berjaya Auto Bhd | | | 1,174,000 | | | | 1,330,470 | |
Berjaya Food Bhd | | | 1,400,300 | | | | 1,136,282 | |
CB Industrial Product Holding Bhd | | | 876,633 | | | | 498,834 | |
Freight Management Holdings Bhd | | | 118,900 | | | | 51,689 | |
Kossan Rubber Industries | | | 217,100 | | | | 365,745 | |
Padini Holdings Bhd | | | 265,500 | | | | 104,153 | |
Uzma Bhd | | | 556,000 | | | | 361,157 | |
| | | | | | | | |
| | | | | | | 5,192,193 | |
| | | | | | | | |
| | |
Mexico (0.70%) | | | | | | | | |
Banregio Grupo Financiero SAB de CV(a) | | | 96,262 | | | | 552,148 | |
Credito Real SAB de CV | | | 566,135 | | | | 1,394,120 | |
Medica Sur SAB de CV, Series B | | | 134,662 | | | | 496,534 | |
| | | | | | | | |
| | | | | | | 2,442,802 | |
| | | | | | | | |
| | |
Netherlands (0.60%) | | | | | | | | |
Aalberts Industries NV | | | 67,455 | | | | 2,091,287 | |
| | | | | | | | |
| | |
Norway (0.44%) | | | | | | | | |
Medistim ASA | | | 75,150 | | | | 412,866 | |
SpareBank 1 SMN | | | 44,300 | | | | 395,722 | |
Zalaris ASA(a) | | | 173,400 | | | | 735,496 | |
| | | | | | | | |
| | | | | | | 1,544,084 | |
| | | | | | | | |
| | |
Philippines (1.45%) | | | | | | | | |
Concepcion Industrial Corp. | | | 444,600 | | | | 631,198 | |
Pepsi-Cola Products Philippines, Inc.(a) | | | 12,913,100 | | | | 1,261,441 | |
Puregold Price Club, Inc. | | | 741,700 | | | | 660,155 | |
Robinsons Land Corp. | | | 1,074,300 | | | | 721,363 | |
Security Bank Corp. | | | 463,700 | | | | 1,747,251 | |
| | | | | | | | |
| | | | | | | 5,021,408 | |
| | | | | | | | |
| | |
Poland (0.91%) | | | | | | | | |
KRUK SA(a) | | | 27,400 | | | | 1,165,377 | |
Magellan SA(a) | | | 11,578 | | | | 209,056 | |
Wawel SA | | | 3,062 | | | | 1,131,286 | |
| | | | | | | | |
| | | Shares | | | Value
(Note 2) | |
Poland (continued) | | | | | | | | |
Work Service SA(a) | | | 122,000 | | | $ | 660,861 | |
| | | | | | | | |
| | | | | | | 3,166,580 | |
| | | | | | | | |
| | |
Russia (0.02%) | | | | | | | | |
MD Medical Group Investments PLC, GDR(c) | | | 11,855 | | | | 59,275 | |
| | | | | | | | |
| | |
Singapore (0.74%) | | | | | | | | |
ARA Asset Management, Ltd. | | | 567,000 | | | | 740,536 | |
CSE Global, Ltd. | | | 1,958,000 | | | | 849,719 | |
Riverstone Holdings, Ltd. | | | 191,400 | | | | 167,719 | |
Super Group, Ltd. | | | 734,000 | | | | 824,614 | |
| | | | | | | | |
| | | | | | | 2,582,588 | |
| | | | | | | | |
| | |
South Africa (4.13%) | | | | | | | | |
ARB Holdings, Ltd. | | | 2,096,566 | | | | 1,095,309 | |
Blue Label Telecoms, Ltd. | | | 1,783,400 | | | | 1,203,800 | |
Cartrack Holdings, Ltd.(a) | | | 1,975,900 | | | | 1,453,326 | |
Cashbuild, Ltd. | | | 22,586 | | | | 530,255 | |
Clicks Group, Ltd. | | | 173,700 | | | | 1,331,178 | |
Comair, Ltd. | | | 2,708,499 | | | | 1,227,177 | |
EOH Holdings, Ltd. | | | 46,900 | | | | 636,388 | |
Interwaste Holdings, Ltd.(a) | | | 10,642,707 | | | | 1,234,585 | |
Invicta Holdings, Ltd. | | | 143,688 | | | | 880,880 | |
Italtile, Ltd. | | | 921,472 | | | | 906,271 | |
MiX Telematics, Ltd., Sponsored ADR(a) | | | 95,929 | | | | 671,503 | |
OneLogix Group, Ltd. | | | 1,015,438 | | | | 413,986 | |
Super Group, Ltd.(a) | | | 687,900 | | | | 2,084,901 | |
Transaction Capital, Ltd. | | | 909,700 | | | | 698,931 | |
| | | | | | | | |
| | | | | | | 14,368,490 | |
| | | | | | | | |
| | |
South Korea (3.16%) | | | | | | | | |
DGB Financial Group, Inc. | | | 74,500 | | | | 840,973 | |
Duk San Neolux Co., Ltd.(a) | | | 16,642 | | | | 343,086 | |
ENF Technology Co., Ltd. | | | 10,000 | | | | 130,322 | |
Hy-Lok Corp. | | | 53,840 | | | | 1,707,100 | |
iMarketKorea, Inc. | | | 19,820 | | | | 504,788 | |
ISC Co., Ltd. | | | 54,879 | | | | 2,197,499 | |
i-SENS, Inc.(a) | | | 11,000 | | | | 506,049 | |
Koh Young Technology, Inc. | | | 13,143 | | | | 542,457 | |
KONA I Co., Ltd. | | | 26,386 | | | | 859,491 | |
LEENO Industrial, Inc. | | | 12,600 | | | | 539,348 | |
Solueta Co., Ltd.(a) | | | 57,000 | | | | 654,518 | |
TechWing, Inc. | | | 71,000 | | | | 719,455 | |
Vieworks Co., Ltd. | | | 14,454 | | | | 397,696 | |
Vitzrocell Co., Ltd.(a) | | | 127,500 | | | | 893,278 | |
Wins Technet Co., Ltd. | | | 17,000 | | | | 152,733 | |
| | | | | | | | |
| | | | | | | 10,988,793 | |
| | | | | | | | |
| | |
| See Notes to Financial Statements. | | |
| Annual Report | April 30, 2015 | | 27 |
| | |
| Grandeur Peak Global Reach Fund | | Portfolio of Investments |
April 30, 2015
| | | | | | | | |
| | | Shares | | | Value
(Note 2) | |
Spain (0.00%)(f) | | | | | | | | |
Let’s GOWEX SA(a)(e) | | | 10,700 | | | $ | 1 | |
| | | | | | | | |
| | |
Sri Lanka (0.73%) | | | | | | | | |
Expolanka Holdings PLC(a) | | | 4,122,200 | | | | 262,856 | |
Hemas Holdings PLC | | | 1,705,104 | | | | 977,269 | |
Royal Ceramics Lanka PLC | | | 1,460,600 | | | | 1,292,954 | |
| | | | | | | | |
| | | | | | | 2,533,079 | |
| | | | | | | | |
| | |
Sweden (1.70%) | | | | | | | | |
AddTech AB, Class B | | | 10,700 | | | | 140,708 | |
B&B Tools AB, Class B | | | 75,323 | | | | 1,216,462 | |
Bufab Holding AB(a) | | | 131,150 | | | | 841,981 | |
Bulten AB | | | 50,900 | | | | 579,594 | |
Moberg Pharma AB(a) | | | 111,100 | | | | 668,771 | |
Odd Molly International AB | | | 40,188 | | | | 216,533 | |
Opus Group AB | | | 853,107 | | | | 938,705 | |
Vitec Software Group AB, Class B | | | 15,300 | | | | 381,887 | |
Wihlborgs Fastigheter AB | | | 47,500 | | | | 919,337 | |
| | | | | | | | |
| | | | | | | 5,903,978 | |
| | | | | | | | |
| | |
Switzerland (0.85%) | | | | | | | | |
VZ Holding AG | | | 13,700 | | | | 2,936,921 | |
| | | | | | | | |
| | |
Taiwan (4.24%) | | | | | | | | |
ASPEED Technology, Inc. | | | 72,310 | | | | 662,450 | |
Chipbond Technology Corp. | | | 162,000 | | | | 350,081 | |
Cub Elecparts, Inc. | | | 116,419 | | | | 1,476,983 | |
DYNACOLOR, Inc. | | | 287,000 | | | | 562,051 | |
Godex International Co., Ltd. | | | 173,000 | | | | 534,178 | |
Novatek Microelectronics Corp. | | | 206,000 | | | | 1,076,687 | |
On-Bright Electronics, Inc. | | | 68,000 | | | | 368,940 | |
Polyronics Tech Corp. | | | 399,000 | | | | 920,780 | |
Richtek Technology Corp. | | | 60,000 | | | | 339,289 | |
Silergy Corp. | | | 121,925 | | | | 1,206,214 | |
Sinmag Equipment Corp. | | | 190,560 | | | | 1,143,234 | |
Sporton International, Inc. | | | 322,830 | | | | 1,830,399 | |
Test Research, Inc. | | | 488,440 | | | | 993,205 | |
TSC Auto ID Technology Co., Ltd. | | | 66,000 | | | | 561,437 | |
Tung Thih Electronic Co., Ltd. | | | 356,000 | | | | 1,617,663 | |
UDE Corp. | | | 493,000 | | | | 1,081,269 | |
| | | | | | | | |
| | | | | | | 14,724,860 | |
| | | | | | | | |
| | |
Thailand (0.37%) | | | | | | | | |
Jubilee Enterprise PCL | | | 227,600 | | | | 222,663 | |
Premier Marketing PCL | | | 3,478,100 | | | | 1,053,996 | |
| | | | | | | | |
| | | | | | | 1,276,659 | |
| | | | | | | | |
| | | | | | | | |
| | | Shares | | | Value
(Note 2) | |
Turkey (1.01%) | | | | | | | | |
Albaraka Turk Katilim Bankasi AS | | | 818,100 | | | $ | 528,912 | |
EGE Seramik Sanayi ve Ticaret AS | | | 662,900 | | | | 997,103 | |
Is Girisim Sermayesi Yatirim Ortakligi AS | | | 268,052 | | | | 191,566 | |
Pinar SUT Mamulleri Sanayii AS | | | 132,600 | | | | 1,275,095 | |
TAV Havalimanlari Holding AS(a) | | | 56,700 | | | | 498,500 | |
| | | | | | | | |
| | | | | | | 3,491,176 | |
| | | | | | | | |
| | |
United States (23.76%) | | | | | | | | |
2U, Inc.(a) | | | 22,375 | | | | 595,399 | |
Abaxis, Inc. | | | 5,575 | | | | 356,800 | |
Alamo Group, Inc. | | | 25,525 | | | | 1,576,934 | |
Alliance Fiber Optic Products, Inc. | | | 54,150 | | | | 994,194 | |
Amsurg Corp.(a) | | | 29,262 | | | | 1,835,313 | |
Aratana Therapeutics, Inc.(a) | | | 17,650 | | | | 227,861 | |
BioDelivery Sciences International, Inc.(a) | | | 147,325 | | | | 1,187,439 | |
Cempra, Inc.(a) | | | 8,000 | | | | 251,920 | |
ChannelAdvisor Corp.(a) | | | 38,750 | | | | 396,412 | |
Chase Corp. | | | 8,050 | | | | 288,270 | |
CRA International, Inc.(a) | | | 10,450 | | | | 305,140 | |
Diamond Hill Investment Group, Inc. | | | 6,375 | | | | 1,161,525 | |
Dorman Products, Inc.(a) | | | 13,850 | | | | 648,595 | |
DXP Enterprises, Inc.(a) | | | 26,500 | | | | 1,193,825 | |
Enphase Energy, Inc.(a) | | | 66,300 | | | | 833,391 | |
EPAM Systems, Inc.(a) | | | 9,300 | | | | 601,803 | |
ePlus, Inc.(a) | | | 14,000 | | | | 1,161,440 | |
Escalade, Inc. | | | 56,068 | | | | 1,008,663 | |
ExlService Holdings, Inc.(a) | | | 20,525 | | | | 706,676 | |
First Cash Financial Services, Inc.(a) | | | 19,975 | | | | 965,591 | |
First Republic Bank | | | 118,975 | | | | 6,935,053 | |
Fresh Market, Inc.(a) | | | 43,699 | | | | 1,535,583 | |
Genpact, Ltd.(a) | | | 23,575 | | | | 515,349 | |
Gentex Corp. | | | 57,425 | | | | 996,324 | |
Geospace Technologies Corp.(a) | | | 10,260 | | | | 221,616 | |
Grand Canyon Education, Inc.(a) | | | 37,700 | | | | 1,707,056 | |
Hennessy Advisors, Inc. | | | 25,050 | | | | 482,463 | |
Hibbett Sports, Inc.(a) | | | 16,025 | | | | 749,970 | |
Home BancShares, Inc. | | | 61,900 | | | | 2,035,272 | |
Inphi Corp.(a) | | | 98,600 | | | | 2,114,970 | |
InvenSense, Inc.(a) | | | 14,800 | | | | 220,816 | |
IPC The Hospitalist Co., Inc.(a) | | | 25,850 | | | | 1,264,582 | |
| | |
| See Notes to Financial Statements. | | |
| 28 | | 1.855.377.7325 | www.GrandeurPeakGlobal.com |
| | |
| Grandeur Peak Global Reach Fund | | Portfolio of Investments |
April 30, 2015
| | | | | | | | |
| | | Shares | | | Value
(Note 2) | |
United States (continued) | | | | | | | | |
Jones Energy, Inc., Class A(a) | | | 51,525 | | | $ | 528,646 | |
K2M Group Holdings, Inc.(a) | | | 50,475 | | | | 1,060,480 | |
Knight Transportation, Inc. | | | 19,250 | | | | 556,325 | |
LGI Homes, Inc.(a) | | | 106,325 | | | | 1,751,173 | |
Littelfuse, Inc. | | | 5,325 | | | | 521,797 | |
Malibu Boats, Inc., Class A(a) | | | 71,950 | | | | 1,523,181 | |
Manitex International, Inc.(a) | | | 68,125 | | | | 675,119 | |
Marin Software, Inc.(a) | | | 74,875 | | | | 452,245 | |
MarketAxess Holdings, Inc. | | | 11,380 | | | | 976,973 | |
Mastech Holdings, Inc.(a) | | | 69,747 | | | | 693,983 | |
MaxLinear, Inc., Class A(a) | | | 118,375 | | | | 1,009,739 | |
MEDNAX, Inc.(a) | | | 4,700 | | | | 332,666 | |
Mesa Laboratories, Inc. | | | 4,325 | | | | 367,149 | |
Microchip Technology, Inc. | | | 13,775 | | | | 656,448 | |
Misonix, Inc.(a) | | | 26,070 | | | | 339,692 | |
Navigant Consulting, Inc.(a) | | | 23,800 | | | | 344,148 | |
NorthStar Asset Management Group, Inc. | | | 35,400 | | | | 744,462 | |
NorthStar Realty Finance Corp., REIT | | | 108,950 | | | | 2,043,902 | |
NxStage Medical, Inc.(a) | | | 57,425 | | | | 1,052,600 | |
Patrick Industries, Inc.(a) | | | 16,950 | | | | 1,018,017 | |
Perficient, Inc.(a) | | | 46,250 | | | | 954,137 | |
Pericom Semiconductor Corp. | | | 32,025 | | | | 400,953 | |
Power Integrations, Inc. | | | 26,065 | | | | 1,289,957 | |
RealPage, Inc.(a) | | | 15,975 | | | | 316,944 | |
Redwood Trust, Inc., REIT | | | 44,400 | | | | 763,236 | |
Reis, Inc. | | | 17,200 | | | | 390,956 | |
Resources Connection, Inc. | | | 21,700 | | | | 341,992 | |
Roadrunner Transportation Systems, Inc.(a) | | | 248,100 | | | | 6,071,007 | |
Ruckus Wireless, Inc.(a) | | | 24,950 | | | | 291,416 | |
Signature Bank(a) | | | 14,450 | | | | 1,937,601 | |
Silicon Laboratories, Inc.(a) | | | 24,050 | | | | 1,242,664 | |
STAAR Surgical Co.(a) | | | 123,875 | | | | 1,096,294 | |
SVB Financial Group(a) | | | 9,025 | | | | 1,198,159 | |
Swift Transportation Co.(a) | | | 19,425 | | | | 470,085 | |
Synaptics, Inc.(a) | | | 20,075 | | | | 1,700,754 | |
Synergetics USA, Inc.(a) | | | 50,939 | | | | 249,092 | |
Syntel, Inc.(a) | | | 14,175 | | | | 638,159 | |
Textura Corp.(a) | | | 18,800 | | | | 491,996 | |
Transcat, Inc.(a) | | | 198,152 | | | | 2,019,169 | |
TriMas Corp.(a) | | | 77,000 | | | | 2,169,090 | |
TriNet Group, Inc.(a) | | | 1,400 | | | | 49,028 | |
TubeMogul, Inc.(a) | | | 63,645 | | | | 916,488 | |
Universal Truckload Services, Inc. | | | 87,800 | | | | 1,864,872 | |
Veracyte, Inc.(a) | | | 63,531 | | | | 581,309 | |
Virtusa Corp.(a) | | | 8,300 | | | | 330,340 | |
| | | | | | | | |
| | | Shares | | | Value
(Note 2) | |
United States (continued) | | | | | | | | |
Vitamin Shoppe, Inc.(a) | | | 30,875 | | | $ | 1,293,045 | |
Wesco Aircraft Holdings, Inc.(a) | | | 77,100 | | | | 1,208,928 | |
Whitestone, REIT | | | 40,044 | | | | 588,647 | |
| | | | | | | | |
| | | | | | | 82,591,308 | |
| | | | | | | | |
| | |
Vietnam (0.57%) | | | | | | | | |
Binh Minh Plastics JSC | | | 93,100 | | | | 338,506 | |
DHG Pharmaceutical JSC | | | 46,666 | | | | 181,563 | |
Japan Vietnam Medical Instrument JSC | | | 58,910 | | | | 57,846 | |
PetroVietnam Drilling and Well Services JSC | | | 234,200 | | | | 588,209 | |
Traphaco JSC | | | 89,000 | | | | 333,905 | |
Vietnam Dairy Products JSC | | | 97,636 | | | | 488,406 | |
| | | | | | | | |
| | | | | | | 1,988,435 | |
| | | | | | | | |
| | |
TOTAL COMMON STOCKS (Cost $311,040,710) | | | | | | | 339,413,626 | |
| | | | | | | | |
| | |
PREFERRED STOCKS (0.19%) | | | | | | | | |
Brazil (0.19%) | | | | | | | | |
Banco ABC Brasil SA | | | 154,141 | | | | 677,863 | |
| | | | | | | | |
| | |
TOTAL PREFERRED STOCKS (Cost $746,517) | | | | | | | 677,863 | |
| | | | | | | | |
| | |
RIGHTS (0.00%)(f) | | | | | | | | |
France (0.00%) | | | | | | | | |
Akka Technologies SA(a) | | | 17,314 | | | | 0 | |
| | | | | | | | |
| | |
Sri Lanka (0.00%)(f) | | | | | | | | |
Hemas Holdings PLC(a) | | | 182,661 | | | | 6,714 | |
| | | | | | | | |
| | |
TOTAL RIGHTS (Cost $0) | | | | | | | 6,714 | |
| | | | | | | | |
| |
TOTAL INVESTMENTS (97.84%) (Cost $311,787,227) | | | $ | 340,098,203 | |
| | |
Assets In Excess Of Other Liabilities (2.16%) | | | | | | | 7,495,083 | |
| | | | | | | | |
| | |
NET ASSETS (100.00%) | | | | | | $ | 347,593,286 | |
| | | | | | | | |
| | |
| See Notes to Financial Statements. | | |
| Annual Report | April 30, 2015 | | 29 |
| | |
| Grandeur Peak Global Reach Fund | | Portfolio of Investments |
April 30, 2015
| (a) | Non-Income Producing Security. |
| (b) | Security exempt from registration under Rule 144A of the Securities Act of 1933. These securities may be resold in the ordinary course of business in transactions exempt from registration, normally to qualified institutional buyers. As of April 30, 2015, these securities had a total aggregate market value of $1,582,167 representing 0.46% of net assets. |
| (c) | Security was purchased pursuant to Regulation S under the Securities Act of 1933, which exempts securities offered and sold outside of the United States from registration. Such security cannot be sold in the United States without either an effective registration statement filed pursuant to the Securities Act of 1933, or pursuant to an exemption from registration. The security has been deemed liquid under guidelines approved by the Fund’s Board of Trustees. As of April 30, 2015, the aggregate market value of those securities was $2,970,780, representing 0.85% of net assets. |
| (d) | Private Placement: these securities may only be resold in transactions exempt from registration under the Securities Act of 1933. As of April 30, 2015, these securities had a total value of $332,520 or 0.10% of Total Net Assets. |
| (e) | Fair valued security under the procedures approved by the Fund’s Board of Trustees. |
Common Abbreviations:
AB - Aktiebolag is the Swedish equivalent of the term corporation.
ADR - American Depositary Receipt.
AG - Aktiengesellschaft is a German term that refers to a corporation that is limited by shares, i.e., owned by shareholders.
AS - Aktieselskab is the Danish term for a stock-based corporation.
ASA - Allmennaksjeselskap is the Norwegian term for a public limited company.
Bhd - Berhad is the Malaysian term for public limited company.
GDR - Global Depositary Receipt.
JSC - Joint Stock Company.
Ltd. - Limited.
NV - Naamloze Vennootschap is the Dutch term for a public limited liability corporation.
OYJ - Osakeyhtio is the Finnish equivalent of a public limited company.
PCL - Public Company Limited.
PLC - Public Limited Company.
REIT - Real Estate Investment Trust.
SA - Generally designates corporations in various countries, mostly those employing the civil law.
SAB de CV - A variable capital company.
SE - A European Company which can operate on a Europe-wide basis and be governed by community law directly applicable in all member states.
Tbk PT - Terbuka Perseroan Terbatas is an Indonesian term for a limited liability company.
Holdings are subject to change.
For Fund compliance purposes, the Fund’s geographical classifications refer to any one or more of the country sub-classifications used by one or more widely recognized market indexes or ratings group indexes, and/or as defined by Fund management. This definition may not apply for purposes of this report, which may combine sub-classifications for reporting ease. Geographical regions are shown as a percentage of net assets.
| | |
| See Notes to Financial Statements. | | |
| 30 | | 1.855.377.7325 | www.GrandeurPeakGlobal.com |
| | |
| Grandeur Peak International Opportunities Fund | | Portfolio of Investments |
April 30, 2015
| | | | | | | | |
| | | Shares | | | Value
(Note 2) | |
COMMON STOCKS (91.26%) | | | | | | | | |
Australia (1.25%) | | | | | | | | |
ALS, Ltd. | | | 300,232 | | | $ | 1,240,101 | |
Countplus, Ltd. | | | 974,352 | | | | 858,646 | |
CTI Logistics, Ltd. | | | 1,484,490 | | | | 1,588,383 | |
Magellan Financial Group, Ltd. | | | 393,800 | | | | 6,180,484 | |
Medical Developments International, Ltd.(a) | | | 576,538 | | | | 862,300 | |
| | | | | | | | |
| | | | | | | 10,729,914 | |
| | | | | | | | |
| | |
Austria (1.05%) | | | | | | | | |
Palfinger AG | | | 300,913 | | | | 9,028,157 | |
| | | | | | | | |
| | |
Belgium (1.33%) | | | | | | | | |
Melexis NV | | | 184,284 | | | | 11,376,812 | |
| | | | | | | | |
| | |
Brazil (3.28%) | | | | | | | | |
Banco Daycoval SA | | | 1,481,400 | | | | 3,938,338 | |
CETIP SA - Mercados Organizados | | | 798,642 | | | | 9,097,195 | |
Even Construtora e Incorporadora SA | | | 1,113,700 | | | | 1,796,439 | |
Localiza Rent a Car SA | | | 109,500 | | | | 1,283,639 | |
M Dias Branco SA | | | 96,800 | | | | 2,756,581 | |
Odontoprev SA | | | 501,000 | | | | 1,757,603 | |
Tegma Gestao Logistica | | | 560,644 | | | | 2,809,779 | |
Valid Solucoes SA | | | 298,900 | | | | 4,647,759 | |
| | | | | | | | |
| | | | | | | 28,087,333 | |
| | | | | | | | |
| | |
Britain (11.20%) | | | | | | | | |
Abcam PLC | | | 543,066 | | | | 4,370,001 | |
Advanced Medical Solutions Group PLC | | | 1,190,569 | | | | 2,590,518 | |
Arrow Global Group PLC | | | 1,032,600 | | | | 4,113,186 | |
blinkx PLC(a) | | | 3,174,500 | | | | 1,705,546 | |
Bovis Homes Group PLC | | | 321,251 | | | | 4,574,106 | |
Brammer PLC | | | 274,417 | | | | 1,599,623 | |
Cambian Group PLC | | | 1,155,200 | | | | 4,597,110 | |
Clinigen Group PLC | | | 2,786,273 | | | | 25,630,423 | |
Diploma PLC | | | 290,300 | | | | 3,542,608 | |
EMIS Group PLC | | | 611,900 | | | | 8,829,116 | |
Halma PLC | | | 245,129 | | | | 2,669,673 | |
Hunting PLC | | | 403,100 | | | | 3,622,835 | |
IG Group Holdings PLC | | | 833,365 | | | | 9,396,324 | |
Oxford Immunotec Global PLC(a) | | | 167,430 | | | | 2,221,796 | |
Premier Oil PLC(a) | | | 894,941 | | | | 2,394,164 | |
RPS Group PLC | | | 2,413,011 | | | | 7,889,470 | |
Tracsis PLC | | | 253,100 | | | | 1,707,835 | |
| | | | | | | | |
| | | Shares | | | Value
(Note 2) | |
Britain (continued) | | | | | | | | |
Ultra Electronics Holdings PLC | | | 167,000 | | | $ | 4,441,041 | |
| | | | | | | | |
| | | | | | | 95,895,375 | |
| | | | | | | | |
| | |
Canada (3.23%) | | | | | | | | |
Delphi Energy Corp.(a) | | | 1,057,100 | | | | 1,463,205 | |
Halogen Software, Inc.(a) | | | 136,700 | | | | 1,189,681 | |
Home Capital Group, Inc. | | | 310,260 | | | | 12,245,819 | |
Mapan Energy, Ltd.(a)(b) | | | 1,449,000 | | | | 1,140,945 | |
Richelieu Hardware, Ltd. | | | 91,250 | | | | 4,764,816 | |
Stantec, Inc. | | | 158,352 | | | | 4,277,407 | |
TransForce, Inc. | | | 112,900 | | | | 2,549,959 | |
| | | | | | | | |
| | | | | | | 27,631,832 | |
| | | | | | | | |
| | |
China (9.47%) | | | | | | | | |
BBI Life Sciences
Corp.(a)(c) | | | 7,460,500 | | | | 3,270,413 | |
China Lesso Group Holdings, Ltd. | | | 5,138,000 | | | | 3,775,177 | |
China Medical System Holdings, Ltd. | | | 2,618,000 | | | | 4,620,123 | |
China Pioneer Pharma Holdings, Ltd. | | | 4,595,000 | | | | 3,570,324 | |
China Singyes Solar Technologies Holdings, Ltd. | | | 1,517,000 | | | | 2,484,277 | |
China South City Holdings, Ltd. | | | 5,820,000 | | | | 2,565,002 | |
Consun Pharmaceutical Group, Ltd. | | | 1,582,000 | | | | 1,264,462 | |
Dongpeng Holdings Co., Ltd. | | | 14,880,000 | | | | 8,178,620 | |
Far East Horizon, Ltd. | | | 6,513,000 | | | | 6,878,205 | |
Goldpac Group, Ltd. | | | 2,592,000 | | | | 2,163,821 | |
Le Saunda Holdings, Ltd. | | | 5,608,800 | | | | 2,399,661 | |
Man Wah Holdings, Ltd. | | | 14,199,200 | | | | 18,423,087 | |
Mindray Medical International, Ltd., ADR | | | 40,650 | | | | 1,255,272 | |
Minth Group, Ltd. | | | 1,351,000 | | | | 3,382,289 | |
Noah Holdings, Ltd., Sponsored ADR(a) | | | 65,400 | | | | 2,216,406 | |
O2Micro International, Ltd., ADR(a) | | | 611,689 | | | | 1,406,885 | |
Sihuan Pharmaceutical Holdings Group,
Ltd.(d) | | | 3,287,000 | | | | 2,056,880 | |
Tao Heung Holdings, Ltd. | | | 2,203,700 | | | | 1,050,173 | |
Vitasoy International Holdings, Ltd. | | | 2,163,338 | | | | 3,957,930 | |
WuXi PharmaTech Cayman, Inc., ADR(a) | | | 123,075 | | | | 5,313,148 | |
| | |
| See Notes to Financial Statements. | | |
| Annual Report | April 30, 2015 | | 31 |
| | |
| Grandeur Peak International Opportunities Fund | | Portfolio of Investments |
April 30, 2015
| | | | | | | | |
| | | Shares | | | Value
(Note 2) | |
China (continued) | | | | | | | | |
Xiabuxiabu Catering Management China Holdings Co.,
Ltd.(a)(c)(e) | | | 1,243,000 | | | $ | 809,203 | |
| | | | | | | | |
| | | | | | | 81,041,358 | |
| | | | | | | | |
| | |
Colombia (0.95%) | | | | | | | | |
Gran Tierra Energy, Inc.(a) | | | 1,043,525 | | | | 3,881,913 | |
Parex Resources, Inc.(a) | | | 528,345 | | | | 4,239,022 | |
| | | | | | | | |
| | | | | | | 8,120,935 | |
| | | | | | | | |
| | |
Denmark (0.11%) | | | | | | | | |
Ringkjoebing Landbobank AS | | | 4,357 | | | | 974,319 | |
| | | | | | | | |
| | |
Finland (0.03%) | | | | | | | | |
Aktia Bank OYJ | | | 22,466 | | | | 275,137 | |
| | | | | | | | |
| | |
France (2.73%) | | | | | | | | |
Alten SA | | | 69,000 | | | | 3,368,076 | |
Argan SA, REIT | | | 81,242 | | | | 1,972,018 | |
Audika Groupe | | | 128,397 | | | | 2,550,377 | |
Esker SA | | | 78,800 | | | | 2,124,795 | |
GameLoft SE(a) | | | 251,700 | | | | 1,330,943 | |
Infotel SA | | | 41,900 | | | | 1,254,754 | |
Medicrea International(a) | | | 193,596 | | | | 1,645,561 | |
MGI Digital Graphic Technology(a) | | | 71,550 | | | | 2,191,673 | |
Neurones | | | 79,220 | | | | 1,341,984 | |
Prodware(a) | | | 268,000 | | | | 2,100,448 | |
SoluCom | | | 43,328 | | | | 2,096,658 | |
Thermador Groupe | | | 16,307 | | | | 1,435,379 | |
| | | | | | | | |
| | | | | | | 23,412,666 | |
| | | | | | | | |
| | |
Georgia (0.74%) | | | | | | | | |
Bank of Georgia Holdings PLC | | | 229,611 | | | | 6,305,858 | |
| | | | | | | | |
| | |
Germany (4.26%) | | | | | | | | |
Bertrandt AG | | | 41,204 | | | | 5,439,783 | |
CANCOM SE | | | 36,300 | | | | 1,501,532 | |
ElringKlinger AG | | | 146,202 | | | | 4,024,857 | |
First Sensor AG(a) | | | 128,164 | | | | 1,482,262 | |
Nexus AG | | | 316,026 | | | | 6,245,356 | |
Norma Group SE | | | 59,103 | | | | 3,139,413 | |
Patrizia Immobilien AG(a) | | | 336,225 | | | | 6,623,065 | |
Softing AG | | | 96,691 | | | | 1,527,502 | |
Wirecard AG | | | 147,311 | | | | 6,469,773 | |
| | | | | | | | |
| | | | | | | 36,453,543 | |
| | | | | | | | |
| | |
Hong Kong (2.26%) | | | | | | | | |
International Housewares Retail Co., Ltd. | | | 10,854,000 | | | | 3,066,913 | |
| | | | | | | | |
| | | Shares | | | Value
(Note 2) | |
Hong Kong (continued) | | | | | | | | |
Samsonite International SA | | | 709,000 | | | $ | 2,585,842 | |
Sinosoft Technology Group, Ltd. | | | 1,471,000 | | | | 1,095,435 | |
Value Partners Group, Ltd. | | | 6,794,000 | | | | 12,561,222 | |
| | | | | | | | |
| | | | | | | 19,309,412 | |
| | | | | | | | |
| | |
India (7.65%) | | | | | | | | |
AIA Engineering, Ltd. | | | 103,424 | | | | 1,868,630 | |
Ajanta Pharma, Ltd. | | | 272,305 | | | | 5,414,803 | |
Bajaj Corp., Ltd. | | | 217,000 | | | | 1,497,630 | |
Bajaj Finance, Ltd. | | | 41,726 | | | | 2,656,205 | |
Balkrishna Industries, Ltd. | | | 117,500 | | | | 1,435,659 | |
City Union Bank, Ltd. | | | 1,027,565 | | | | 1,526,127 | |
Credit Analysis & Research, Ltd. | | | 161,600 | | | | 3,961,573 | |
Dewan Housing Finance Corp., Ltd. | | | 441,000 | | | | 3,090,730 | |
Glenmark Pharmaceuticals, Ltd. | | | 374,600 | | | | 5,239,896 | |
Hinduja Global Solutions, Ltd. | | | 340,600 | | | | 2,927,473 | |
Indiabulls Housing Finance, Ltd. | | | 225,000 | | | | 2,096,671 | |
Infotech Enterprises, Ltd. | | | 434,267 | | | | 3,290,078 | |
Ipca Laboratories, Ltd. | | | 134,500 | | | | 1,358,002 | |
Jammu & Kashmir Bank, Ltd. | | | 1,821,000 | | | | 2,747,790 | |
Kolte-Patil Developers, Ltd. | | | 742,300 | | | | 2,501,411 | |
KPIT Technologies, Ltd. | | | 1,699,321 | | | | 2,808,480 | |
MBL Infrastructures, Ltd. | | | 103,500 | | | | 928,727 | |
Nirvikara Paper Mills, Ltd.(a)(d) | | | 13,055 | | | | 13,985 | |
PC Jeweller, Ltd. | | | 303,500 | | | | 1,630,608 | |
Persistent Systems, Ltd. | | | 134,746 | | | | 1,497,237 | |
Poly Medicure, Ltd. | | | 23,242 | | | | 195,633 | |
Supreme Industries, Ltd. | | | 198,834 | | | | 2,137,665 | |
Time Technoplast, Ltd. | | | 4,384,100 | | | | 3,157,812 | |
Vaibhav Global, Ltd. | | | 260,500 | | | | 3,280,294 | |
Vakrangee Software, Ltd. | | | 1,583,459 | | | | 2,647,310 | |
Vesuvius India, Ltd. | | | 44,516 | | | | 516,719 | |
WNS Holdings, Ltd., ADR(a) | | | 209,750 | | | | 5,061,267 | |
| | | | | | | | |
| | | | | | | 65,488,415 | |
| | | | | | | | |
| | |
Indonesia (3.65%) | | | | | | | | |
Astra Graphia Tbk PT | | | 10,792,000 | | | | 1,848,273 | |
Bank Negara Indonesia Persero Tbk PT | | | 9,316,000 | | | | 4,597,603 | |
Bank Tabungan Pensiunan Nasional Tbk PT(a) | | | 2,566,200 | | | | 781,986 | |
Bekasi Fajar Industrial Estate Tbk PT | | | 65,215,500 | | | | 2,996,969 | |
| | |
| See Notes to Financial Statements. | | |
| 32 | | 1.855.377.7325 | www.GrandeurPeakGlobal.com |
| | |
| Grandeur Peak International Opportunities Fund | | Portfolio of Investments |
April 30, 2015
| | | | | | | | |
| | | Shares | | | Value
(Note 2) | |
Indonesia (continued) | | | | | | | | |
Express Transindo Utama Tbk PT | | | 22,620,500 | | | $ | 1,919,579 | |
Lippo Cikarang Tbk PT(a) | | | 1,334,000 | | | | 1,228,525 | |
Panin Sekuritas Tbk PT | | | 6,521,500 | | | | 2,513,953 | |
Petra Foods, Ltd. | | | 1,854,600 | | | | 5,424,661 | |
Selamat Sempurna Tbk PT | | | 16,646,800 | | | | 6,039,513 | |
Tempo Scan Pacific Tbk PT | | | 13,658,500 | | | | 2,138,538 | |
Ultrajaya Milk Industry & Trading Co. Tbk PT | | | 5,739,500 | | | | 1,747,020 | |
| | | | | | | | |
| | | | | | | 31,236,620 | |
| | | | | | | | |
| | |
Ireland (1.31%) | | | | | | | | |
Beazley PLC | | | 778,700 | | | | 3,348,870 | |
Irish Residential Properties, REIT PLC | | | 6,533,476 | | | | 7,842,304 | |
| | | | | | | | |
| | | | | | | 11,191,174 | |
| | | | | | | | |
| | |
Israel (0.36%) | | | | | | | | |
Caesarstone Sdot Yam, Ltd. | | | 27,100 | | | | 1,605,404 | |
Sarin Technologies, Ltd. | | | 976,000 | | | | 1,508,369 | |
| | | | | | | | |
| | | | | | | 3,113,773 | |
| | | | | | | | |
| | |
Japan (6.81%) | | | | | | | | |
AIT Corp. | | | 339,800 | | | | 3,301,240 | |
Anest Iwata Corp. | | | 298,800 | | | | 1,945,598 | |
AP Company Co., Ltd.(a) | | | 162,300 | | | | 2,353,748 | |
Arcland Service Co., Ltd. | | | 62,700 | | | | 2,670,002 | |
Benefit One, Inc. | | | 301,800 | | | | 4,388,099 | |
Century Tokyo Leasing Corp. | | | 74,500 | | | | 2,352,325 | |
CMIC Co., Ltd. | | | 184,555 | | | | 2,741,197 | |
Daikokutenbussan Co., Ltd. | | | 61,400 | | | | 2,577,466 | |
Descente, Ltd. | | | 168,100 | | | | 2,158,094 | |
Future Architect, Inc. | | | 464,700 | | | | 2,806,750 | |
GCA Savvian Corp. | | | 337,400 | | | | 3,603,689 | |
Hard Off Corp. Co., Ltd. | | | 160,100 | | | | 1,588,599 | |
Hiday Hidaka Corp. | | | 67,932 | | | | 1,651,409 | |
JCU Corp. | | | 39,000 | | | | 1,627,904 | |
Monogatari Corp. | | | 73,200 | | | | 2,449,672 | |
Prestige International, Inc. | | | 238,600 | | | | 1,848,193 | |
SK Kaken Co., Ltd. | | | 35,000 | | | | 3,069,095 | |
Sun Frontier Fudousan Co., Ltd. | | | 137,300 | | | | 1,308,241 | |
Syuppin Co., Ltd. | | | 168,400 | | | | 2,058,035 | |
Trancom Co., Ltd. | | | 250,090 | | | | 11,805,445 | |
| | | | | | | | |
| | | | | | | 58,304,801 | |
| | | | | | | | |
| | |
Luxembourg (0.96%) | | | | | | | | |
L’Occitane International SA | | | 2,802,712 | | | | 8,262,893 | |
| | | | | | | | |
| | |
Malaysia (2.27%) | | | | | | | | |
AEON Credit Service M Bhd | | | 1,033,940 | | | | 4,308,445 | |
| | | | | | | | |
| | | Shares | | | Value
(Note 2) | |
Malaysia (continued) | | | | | | | | |
Berjaya Auto Bhd | | | 2,911,000 | | | $ | 3,298,976 | |
Berjaya Food Bhd | | | 387,916 | | | | 314,777 | |
CB Industrial Product Holding Bhd | | | 3,120,600 | | | | 1,775,730 | |
Kossan Rubber Industries | | | 1,763,000 | | | | 2,970,097 | |
My EG Services Bhd | | | 2,352,800 | | | | 1,666,241 | |
Padini Holdings Bhd | | | 6,749,550 | | | | 2,647,783 | |
Uzma Bhd | | | 3,798,800 | | | | 2,467,561 | |
| | | | | | | | |
| | | | | | | 19,449,610 | |
| | | | | | | | |
| | |
Mexico (0.88%) | | | | | | | | |
Banregio Grupo Financiero SAB de CV(a) | | | 350,789 | | | | 2,012,087 | |
Credito Real SAB de CV | | | 1,350,324 | | | | 3,325,201 | |
Genomma Lab Internacional SAB de CV, Class B(a) | | | 1,888,400 | | | | 2,218,027 | |
| | | | | | | | |
| | | | | | | 7,555,315 | |
| | | | | | | | |
| | |
Netherlands (0.80%) | | | | | | | | |
Aalberts Industries NV | | | 219,807 | | | | 6,814,611 | |
| | | | | | | | |
| | |
Norway (0.48%) | | | | | | | | |
Medistim ASA | | | 417,000 | | | | 2,290,954 | |
SpareBank 1 SMN | | | 115,644 | | | | 1,033,020 | |
Zalaris ASA(a) | | | 188,200 | | | | 798,272 | |
| | | | | | | | |
| | | | | | | 4,122,246 | |
| | | | | | | | |
| | |
Oman (0.26%) | | | | | | | | |
Al Anwar Ceramic Tile Co. | | | 2,135,760 | | | | 2,269,142 | |
| | | | | | | | |
| | |
Philippines (1.56%) | | | | | | | | |
Pepsi-Cola Products Philippines, Inc.(a) | | | 45,267,500 | | | | 4,422,044 | |
Puregold Price Club, Inc. | | | 2,183,000 | | | | 1,942,993 | |
Security Bank Corp. | | | 1,856,760 | | | | 6,996,388 | |
| | | | | | | | |
| | | | | | | 13,361,425 | |
| | | | | | | | |
| | |
Russia (0.09%) | | | | | | | | |
MD Medical Group Investments PLC, GDR(c) | | | 157,000 | | | | 785,000 | |
| | | | | | | | |
| | |
Singapore (0.99%) | | | | | | | | |
ARA Asset Management, Ltd. | | | 2,580,212 | | | | 3,369,910 | |
CSE Global, Ltd. | | | 5,921,055 | | | | 2,569,578 | |
Riverstone Holdings, Ltd. | | | 2,940,000 | | | | 2,576,251 | |
| | | | | | | | |
| | | | | | | 8,515,739 | |
| | | | | | | | |
| | |
South Africa (2.97%) | | | | | | | | |
Blue Label Telecoms, Ltd. | | | 4,195,600 | | | | 2,832,041 | |
| | |
| See Notes to Financial Statements. | | |
| Annual Report | April 30, 2015 | | 33 |
| | |
| Grandeur Peak International Opportunities Fund | | Portfolio of Investments |
April 30, 2015
| | | | | | | | |
| | | Shares | | | Value
(Note 2) | |
South Africa (continued) | | | | | | | | |
Cartrack Holdings, Ltd.(a) | | | 4,849,500 | | | $ | 3,566,933 | |
Cashbuild, Ltd. | | | 13,118 | | | | 307,973 | |
Clicks Group, Ltd. | | | 273,485 | | | | 2,095,897 | |
Ellies Holdings, Ltd.(a) | | | 3,854,240 | | | | 386,827 | |
EOH Holdings, Ltd. | | | 254,556 | | | | 3,454,080 | |
Italtile, Ltd. | | | 3,988,625 | | | | 3,922,825 | |
MiX Telematics, Ltd., Sponsored ADR(a) | | | 164,500 | | | | 1,151,500 | |
OneLogix Group, Ltd. | | | 2,450,980 | | | | 999,244 | |
Super Group, Ltd.(a) | | | 1,966,797 | | | | 5,961,008 | |
Transaction Capital, Ltd. | | | 503,772 | | | | 387,053 | |
Value Group, Ltd. | | | 1,017,368 | | | | 328,914 | |
| | | | | | | | |
| | | | | | | 25,394,295 | |
| | | | | | | | |
| | |
South Korea (4.62%) | | | | | | | | |
DGB Financial Group, Inc. | | | 224,000 | | | | 2,528,563 | |
Duk San Neolux Co., Ltd.(a) | | | 73,134 | | | | 1,507,707 | |
ENF Technology Co., Ltd. | | | 93,100 | | | | 1,213,302 | |
Hy-Lok Corp. | | | 332,832 | | | | 10,553,075 | |
Interpark Holdings Corp. | | | 323,500 | | | | 2,691,839 | |
ISC Co., Ltd. | | | 162,187 | | | | 6,494,394 | |
Koh Young Technology, Inc. | | | 80,383 | | | | 3,317,686 | |
KONA I Co., Ltd. | | | 172,762 | | | | 5,627,506 | |
LEENO Industrial, Inc. | | | 56,457 | | | | 2,416,663 | |
LF Corp. | | | 70,470 | | | | 2,317,132 | |
Wins Technet Co., Ltd. | | | 94,800 | | | | 851,709 | |
| | | | | | | | |
| | | | | | | 39,519,576 | |
| | | | | | | | |
| | |
Sweden (3.35%) | | | | | | | | |
AddTech AB, Class B | | | 358,013 | | | | 4,707,966 | |
Beijer Alma AB | | | 110,100 | | | | 2,470,639 | |
Bufab Holding AB(a) | | | 836,000 | | | | 5,367,109 | |
Indutrade AB | | | 81,850 | | | | 3,998,528 | |
Moberg Pharma AB(a) | | | 371,800 | | | | 2,238,067 | |
Nibe Industrier AB, Class B | | | 192,581 | | | | 5,129,511 | |
Odd Molly International AB | | | 72,938 | | | | 392,989 | |
Opus Group AB | | | 3,980,568 | | | | 4,379,967 | |
| | | | | | | | |
| | | | | | | 28,684,776 | |
| | | | | | | | |
| | |
Switzerland (1.09%) | | | | | | | | |
VZ Holding AG | | | 43,380 | | | | 9,299,534 | |
| | | | | | | | |
| | |
Taiwan (7.56%) | | | | | | | | |
ASPEED Technology, Inc. | | | 240,799 | | | | 2,206,020 | |
Cleanaway Co., Ltd. | | | 476,000 | | | | 2,949,414 | |
Cowealth Medical Holding Co., Ltd. | | | 784,000 | | | | 2,342,929 | |
Cub Elecparts, Inc. | | | 335,431 | | | | 4,255,542 | |
King’s Town Bank Co., Ltd. | | | 4,113,000 | | | | 4,215,532 | |
Novatek Microelectronics Corp. | | | 791,000 | | | | 4,134,268 | |
On-Bright Electronics, Inc. | | | 383,000 | | | | 2,077,998 | |
| | | | | | | | |
| | | Shares | | | Value
(Note 2) | |
Taiwan (continued) | | | | | | | | |
Polyronics Tech Corp. | | | 2,786,300 | | | $ | 6,429,998 | |
Richtek Technology Corp. | | | 678,000 | | | | 3,833,967 | |
Silergy Corp. | | | 619,199 | | | | 6,125,785 | |
Sinmag Equipment Corp. | | | 544,500 | | | | 3,266,639 | |
Sporton International, Inc. | | | 1,649,340 | | | | 9,351,519 | |
Test Research, Inc. | | | 1,907,252 | | | | 3,878,248 | |
TSC Auto ID Technology Co., Ltd. | | | 451,000 | | | | 3,836,488 | |
UDE Corp. | | | 1,601,000 | | | | 3,511,384 | |
Voltronic Power Technology Corp. | | | 183,650 | | | | 2,278,440 | |
| | | | | | | | |
| | | | | | | 64,694,171 | |
| | | | | | | | |
| | |
Thailand (0.68%) | | | | | | | | |
LPN Development PCL | | | 5,003,100 | | | | 2,601,755 | |
Premier Marketing PCL | | | 10,552,000 | | | | 3,197,655 | |
| | | | | | | | |
| | | | | | | 5,799,410 | |
| | | | | | | | |
| | |
Turkey (0.32%) | | | | | | | | |
Albaraka Turk Katilim Bankasi AS | | | 4,272,500 | | | | 2,762,226 | |
| | | | | | | | |
| |
United Arab Emirates (0.17%) | | | | | |
Aramex PJSC | | | 1,561,000 | | | | 1,476,530 | |
| | | | | | | | |
| | |
United States (0.53%) | | | | | | | | |
First Cash Financial Services, Inc.(a) | | | 94,050 | | | | 4,546,377 | |
| | | | | | | | |
| | |
Vietnam (0.01%) | | | | | | | | |
DHG Pharmaceutical JSC | | | 25,000 | | | | 97,267 | |
| | | | | | | | |
| |
TOTAL COMMON STOCKS (Cost $657,927,083) | | | | 781,387,577 | |
| | | | | | | | |
|
PREFERRED STOCKS (0.35%) | |
Brazil (0.35%) | | | | | | | | |
Banco ABC Brasil SA | | | 685,311 | | | | 3,013,781 | |
| | | | | | | | |
| |
TOTAL PREFERRED STOCKS (Cost $3,650,781) | | | | 3,013,781 | |
| | | | | | | | |
|
EXCHANGE-TRADED FUNDS (0.49%) | |
United States (0.49%) | | | | | | | | |
Market Vectors Vietnam ETF | | | 231,525 | | | | 4,174,396 | |
| |
TOTAL EXCHANGE-TRADED FUNDS (Cost $4,247,806) | | | | 4,174,396 | |
| | | | | | | | |
| | |
| See Notes to Financial Statements. | | |
| 34 | | 1.855.377.7325 | www.GrandeurPeakGlobal.com |
| | |
| Grandeur Peak International Opportunities Fund | | Portfolio of Investments |
April 30, 2015
| | | | |
TOTAL INVESTMENTS (92.10%) | | | | |
(Cost $665,825,670) | | $ | 788,575,754 | |
| |
Assets In Excess Of Other Liabilities (7.90%) | | | 67,630,078 | |
| | | | |
| |
NET ASSETS (100.00%) | | $ | 856,205,832 | |
| | | | |
| (a) | Non-Income Producing Security. |
| (b) | Private Placement: these securities may only be resold in transactions exempt from registration under the Securities Act of 1933. As of April 30, 2015, these securities had a total value of $1,140,945 or 0.13% of Total Net Assets. |
| (c) | Security was purchased pursuant to Regulation S under the Securities Act of 1933, which exempts securities offered and sold outside of the United States from registration. Such security cannot be sold in the United States without either an effective registration statement filed pursuant to the Securities Act of 1933, or pursuant to an exemption from registration. The security has been deemed liquid under guidelines approved by the Fund’s Board of Trustees. As of April 30, 2015, the aggregate market value of those securities was $4,864,616, representing 0.57% of net assets. |
| (d) | Fair valued security under the procedures approved by the Fund’s Board of Trustees. |
| (e) | Security exempt from registration under Rule 144A of the Securities Act of 1933. These securities may be resold in the ordinary course of business in transactions exempt from registration, normally to qualified institutional buyers. As of April 30, 2015, these securities had a total aggregate market value of $809,203 representing 0.09% of net assets. |
Common Abbreviations:
AB - Aktiebolag is the Swedish equivalent of the term corporation.
ADR - American Depositary Receipt.
AG - Aktiengesellschaft is a German term that refers to a corporation that is limited by shares, i.e., owned by shareholders.
AS - Aktieselskab is the Danish term for a stock-based corporation.
ASA - Allmennaksjeselskap is the Norwegian term for a public limited company.
Bhd - Berhad is the Malaysian term for public limited company.
ETF - Exchange Traded Fund.
GDR - Global Depositary Receipt.
JSC - Joint Stock Company.
Ltd. - Limited.
NV - Naamloze Vennootschap is the Dutch term for a public limited liability corporation.
OYJ - Osakeyhtio is the Finnish equivalent of a public limited company.
PCL - Public Company Limited.
PJSC - Public Joint Stock Company.
PLC - Public Limited Company.
REIT - Real Estate Investment Trust.
SA - Generally designates corporations in various countries, mostly those employing the civil law.
SAB de CV - A variable capital company.
SE - A European Company which can operate on a Europe-wide basis and be governed by community law directly applicable in all member states.
Tbk PT - Terbuka Perseroan Terbatas is an Indonesian term for a limited liability company.
Holdings are subject to change.
For Fund compliance purposes, the Fund’s geographical classifications refer to any one or more of the country sub-classifications used by one or more widely recognized market indexes or ratings group indexes, and/or as defined by Fund management. This definition may not apply for purposes of this report, which may combine sub-classifications for reporting ease. Geographical regions are shown as a percentage of net assets.
| | |
| See Notes to Financial Statements. | | |
| Annual Report | April 30, 2015 | | 35 |
| | |
| Grandeur Peak Funds® | | Statements of Assets and Liabilities |
April 30, 2015
| | | | | | | | | | | | | | | | |
| | | Grandeur Peak
Emerging Markets
Opportunities Fund | | | Grandeur Peak
Global Opportunities
Fund | | | Grandeur Peak
Global Reach Fund | | | Grandeur Peak International Opportunities Fund | |
ASSETS | | | | | | | | | | | | | | | | |
Investments, at value (Cost - see below) | | $ | 423,356,882 | | | $ | 719,907,515 | | | $ | 340,098,203 | | | $ | 788,575,754 | |
Cash | | | 34,353,113 | | | | 5,452,572 | | | | 4,140,223 | | | | 49,092,409 | |
Foreign cash, at value
(Cost $7,903,098, $4,025,441, $3,018,926 and $10,234,877, respectively) | | | 7,906,155 | | | | 4,026,479 | | | | 3,018,901 | | | | 10,230,181 | |
Dividends and interest receivable | | | 299,195 | | | | 1,429,100 | | | | 462,365 | | | | 2,054,007 | |
Receivable for investments sold | | | 5,493,166 | | | | 1,345,081 | | | | 5,508,720 | | | | 13,950,188 | |
Receivable for fund shares subscribed | | | 150 | | | | 349,319 | | | | 75,434 | | | | 54,822 | |
Prepaid and other assets | | | 17,399 | | | | 15,272 | | | | 25,580 | | | | 15,581 | |
Total assets | | | 471,426,060 | | | | 732,525,338 | | | | 353,329,426 | | | | 863,972,942 | |
| | | | |
LIABILITIES | | | | | | | | | | | | | | | | |
Payable for investments purchased | | | 2,165,073 | | | | 1,990,421 | | | | 4,732,556 | | | | 5,903,570 | |
Foreign capital gains tax | | | 598,797 | | | | 725,970 | | | | 411,508 | | | | 730,034 | |
Payable for fund shares redeemed | | | – | | | | 1,000,072 | | | | 102,320 | | | | 39,423 | |
Advisory fees payable | | | 508,841 | | | | 742,880 | | | | 328,860 | | | | 858,235 | |
Administration fees payable | | | 15,335 | | | | 22,901 | | | | 14,078 | | | | 26,139 | |
Custodian fees payable | | | 112,182 | | | | 82,001 | | | | 63,647 | | | | 109,279 | |
Payable for trustee fees and expenses | | | 3,279 | | | | 5,318 | | | | 2,505 | | | | 5,997 | |
Payable for chief compliance officer fee | | | 657 | | | | 1,066 | | | | 502 | | | | 1,202 | |
Payable for principal financial officer fees | | | 160 | | | | 259 | | | | 122 | | | | 292 | |
Distribution and service fees payable | | | 8,099 | | | | 41,392 | | | | 17,693 | | | | 34,906 | |
Payable for transfer agency fees | | | 3,880 | | | | 10,791 | | | | 7,678 | | | | 7,762 | |
Accrued expenses and other liabilities | | | 64,787 | | | | 45,661 | | | | 54,671 | | | | 50,271 | |
Total liabilities | | | 3,481,090 | | | | 4,668,732 | | | | 5,736,140 | | | | 7,767,110 | |
NET ASSETS | | $ | 467,944,970 | | | $ | 727,856,606 | | | $ | 347,593,286 | | | $ | 856,205,832 | |
| | | | |
NET ASSETS CONSISTS OF | | | | | | | | | | | | | | | | |
Paid-in capital (Note 5) | | $ | 424,435,614 | | | $ | 564,418,735 | | | $ | 311,914,618 | | | $ | 703,414,662 | |
Accumulated net investment loss | | | (1,379,046) | | | | (687,723) | | | | (188,078) | | | | (181,274) | |
Accumulated net realized gain on investments and foreign currency transactions | | | 5,806,798 | | | | 32,248,170 | | | | 7,953,088 | | | | 30,837,521 | |
Net unrealized appreciation on investments and translation of assets and liabilities in foreign currencies | | | 39,081,604 | | | | 131,877,424 | | | | 27,913,658 | | | | 122,134,923 | |
NET ASSETS | | $ | 467,944,970 | | | $ | 727,856,606 | | | $ | 347,593,286 | | | $ | 856,205,832 | |
| | | | |
INVESTMENTS, AT COST | | $ | 383,689,414 | | | $ | 587,296,987 | | | $ | 311,787,227 | | | $ | 665,825,670 | |
| | | | |
PRICING OF SHARES | | | | | | | | | | | | | | | | |
Investor Class | | | | | | | | | | | | | | | | |
Net Assets | | $ | 39,896,497 | | | $ | 201,462,248 | | | $ | 87,353,900 | | | $ | 173,841,870 | |
Net Asset Value, offering and redemption price per share | | $ | 11.51 | | | $ | 3.43 | | | $ | 13.65 | | | $ | 3.42 | |
Shares of beneficial interest outstanding | | | 3,466,844 | | | | 58,675,794 | | | | 6,397,647 | | | | 50,836,643 | |
Institutional Class | | | | | | | | | | | | | | | | |
Net Assets | | $ | 428,048,473 | | | $ | 526,394,358 | | | $ | 260,239,386 | | | $ | 682,363,962 | |
Net Asset Value, offering and redemption price per share | | $ | 11.52 | | | $ | 3.46 | | | $ | 13.66 | | | $ | 3.43 | |
Shares of beneficial interest outstanding | | | 37,146,307 | | | | 152,152,949 | | | | 19,051,011 | | | | 198,811,745 | |
| | |
| See Notes to Financial Statements. | | |
| 36 | | 1.855.377.7325 | www.GrandeurPeakGlobal.com |
| | |
| Grandeur Peak Funds® | | Statements of Operations |
For the Year Ended April 30, 2015
| | | | | | | | | | | | | | | | |
| | | Grandeur Peak
Emerging Markets
Opportunities Fund | | | Grandeur Peak
Global Opportunities
Fund | | | Grandeur Peak
Global Reach Fund | | | Grandeur Peak
International
Opportunities Fund | |
INVESTMENT INCOME | | | | | | | | | | | | | | | | |
Dividends | | $ | 8,739,097 | | | $ | 13,011,157 | | | $ | 4,471,564 | | | $ | 17,372,060 | |
Interest | | | 1,032 | | | | 5,501 | | | | 845 | | | | 15,570 | |
Foreign taxes withheld | | | (618,061) | | | | (799,251) | | | | (278,317) | | | | (1,266,133) | |
Total investment income | | | 8,122,068 | | | | 12,217,407 | | | | 4,194,092 | | | | 16,121,497 | |
| | | | |
EXPENSES | | | | | | | | | | | | | | | | |
| | | | |
Investment advisor fees (Note 6) | | | 5,440,881 | | | | 8,835,079 | | | | 2,899,508 | | | | 10,147,648 | |
Recoupment of previously waived fees (Note 6) | | | 39,198 | | | | – | | | | 21,111 | | | | – | |
Administrative fees | | | 152,481 | | | | 254,992 | | | | 119,695 | | | | 292,196 | |
Distribution and service fees - Investor Class | | | 92,597 | | | | 488,148 | | | | 176,743 | | | | 376,438 | |
Transfer agent fees | | | 37,868 | | | | 88,133 | | | | 58,862 | | | | 67,032 | |
Professional fees | | | 82,432 | | | | 54,128 | | | | 39,833 | | | | 63,797 | |
Printing fees | | | 17,941 | | | | 52,021 | | | | 20,855 | | | | 37,283 | |
Registration fees | | | 51,985 | | | | 36,703 | | | | 60,335 | | | | 40,582 | |
Custodian fees | | | 494,154 | | | | 349,895 | | | | 304,278 | | | | 468,176 | |
Trustee fees and expenses | | | 13,151 | | | | 20,374 | | | | 9,232 | | | | 23,546 | |
Chief compliance officer fees | | | 7,434 | | | | 12,952 | | | | 4,824 | | | | 14,884 | |
Principal financial officer fees | | | 1,854 | | | | 3,231 | | | | 1,203 | | | | 3,713 | |
Offering costs | | | 23,346 | | | | – | | | | 8,040 | | | | – | |
Other expenses | | | 12,929 | | | | 23,530 | | | | 10,712 | | | | 26,453 | |
Total expenses | | | 6,468,251 | | | | 10,219,186 | | | | 3,735,231 | | | | 11,561,748 | |
NET INVESTMENT INCOME | | | 1,653,817 | | | | 1,998,221 | | | | 458,861 | | | | 4,559,749 | |
| | | |
REALIZED AND UNREALIZED GAIN/(LOSS) ON INVESTMENTS | | | | | | | | | | | | | |
Net realized gain on investments | | | 12,762,607 | | | | 64,187,726 | | | | 10,330,113 | | | | 62,613,295 | |
Net realized gain/(loss) on foreign currency transactions | | �� | (209,176) | | | | 717 | | | | (123,732) | | | | (51,284) | |
Net change in unrealized appreciation/(depreciation) on investments (net of foreign capital gains tax of $598,797, $725,970, $411,508 and $730,034, respectively) | | | 29,480,347 | | | | 8,976,940 | | | | 20,783,069 | | | | (6,889,526) | |
Net change in unrealized appreciation/(depreciation) on translation of assets and liabilities in foreign currencies | | | (10,335) | | | | (252,449) | | | | 21,095 | | | | (265,062) | |
NET REALIZED AND UNREALIZED GAIN ON INVESTMENTS AND FOREIGN CURRENCY TRANSACTIONS | | | 42,023,443 | | | | 72,912,934 | | | | 31,010,545 | | | | 55,407,423 | |
NET INCREASE IN NET ASSETS RESULTING FROM OPERATIONS | | $ | 43,677,260 | | | $ | 74,911,155 | | | $ | 31,469,406 | | | $ | 59,967,172 | |
| | |
| See Notes to Financial Statements. | | |
Annual Report | April 30, 2015 | | 37 |
| | |
| Grandeur Peak Emerging Markets Opportunities Fund | | Statements of Changes in Net Assets |
| | | | | | | | |
| | | For the
Year Ended
April 30, 2015 | | | For the Period
December 16, 2013
(Inception) to
April 30, 2014 | |
OPERATIONS | | | | | | | | |
Net investment income/(loss) | | $ | 1,653,817 | | | $ | (257,649) | |
Net realized gain on investments and foreign currency transactions | | | 12,553,431 | | | | 1,401,415 | |
Net change in unrealized appreciation on investments and foreign currency translations | | | 29,470,012 | | | | 9,611,592 | |
Net increase in net assets resulting from operations | | | 43,677,260 | | | | 10,755,358 | |
| | |
DISTRIBUTIONS TO SHAREHOLDERS (NOTE 3) | | | | | | | | |
Net investment income | | | | | | | | |
Investor Class | | | (54,833) | | | | – | |
Institutional Class | | | (1,137,527) | | | | – | |
Net realized gains on investments | | | | | | | | |
Investor Class | | | (924,569) | | | | – | |
Institutional Class | | | (8,862,626) | | | | – | |
Net decrease in net assets from distributions | | | (10,979,555) | | | | – | |
| | |
CAPITAL SHARE TRANSACTIONS (NOTE 5) | | | | | | | | |
Investor Class | | | | | | | | |
Proceeds from sales of shares | | | 18,678,785 | | | | 28,115,421 | |
Distributions reinvested | | | 967,793 | | | | – | |
Cost of shares redeemed | | | (10,477,031) | | | | (1,134,670) | |
Redemption fees | | | 723 | | | | 2,526 | |
Net increase from capital shares transactions | | | 9,170,270 | | | | 26,983,277 | |
| | |
Institutional Class | | | | | | | | |
Proceeds from sales of shares | | | 142,994,927 | | | | 246,808,127 | |
Distributions reinvested | | | 9,195,374 | | | | – | |
Cost of shares redeemed | | | (9,885,549) | | | | (776,919) | |
Redemption fees | | | 1,347 | | | | 1,053 | |
Net increase from capital shares transactions | | | 142,306,099 | | | | 246,032,261 | |
| | |
Net increase in net assets | | | 184,174,074 | | | | 283,770,896 | |
| | |
NET ASSETS | | | | | | | | |
Beginning of year | | | 283,770,896 | | | | – | |
End of year* | | $ | 467,944,970 | | | $ | 283,770,896 | |
| | |
*Including accumulated net investment loss of: | | $ | (1,379,046) | | | $ | (271,674) | |
| | |
| See Notes to Financial Statements. | | |
| 38 | | 1.855.377.7325 | www.GrandeurPeakGlobal.com |
| | |
| Grandeur Peak Emerging Markets Opportunities Fund | | Statements of Changes in Net Assets |
| | | | | | | | |
| | | For the Year Ended
April 30, 2015 | | | For the Period
December 16, 2013
(Inception) to
April 30, 2014 | |
OTHER INFORMATION | | | | | | | | |
Shares Transactions | | | | | | | | |
Investor Class | | | | | | | | |
Issued | | | 1,678,743 | | | | 2,766,379 | |
Issued to shareholders in reinvestment of distributions | | | 92,083 | | | | – | |
Redeemed | | | (959,085) | | | | (111,276) | |
Net increase in share transactions | | | 811,741 | | | | 2,655,103 | |
| | |
Institutional Class | | | | | | | | |
Issued | | | 12,912,043 | | | | 24,349,676 | |
Issued to shareholders in reinvestment of distributions | | | 874,085 | | | | – | |
Redeemed | | | (914,887) | | | | (74,610) | |
Net increase in share transactions | | | 12,871,241 | | | | 24,275,066 | |
| | |
| See Notes to Financial Statements. | | |
Annual Report | April 30, 2015 | | 39 |
| | |
| Grandeur Peak Global Opportunities Fund | | Statements of Changes in Net Assets |
| | | | | | | | |
| | | For the
Year Ended
April 30, 2015 | | | For the
Year Ended
April 30, 2014 | |
OPERATIONS | | | | | | | | |
Net investment income/(loss) | | $ | 1,998,221 | | | $ | (1,238) | |
Net realized gain on investments and foreign currency transactions | | | 64,188,443 | | | | 35,369,394 | |
Net change in unrealized appreciation on investments and foreign currency translations | | | 8,724,491 | | | | 71,580,303 | |
Net increase in net assets resulting from operations | | | 74,911,155 | | | | 106,948,459 | |
| | |
DISTRIBUTIONS TO SHAREHOLDERS (NOTE 3) | | | | | | | | |
Net investment income | | | | | | | | |
Investor Class | | | (418,468) | | | | – | |
Institutional Class | | | (1,900,259) | | | | (550,548) | |
Net realized gains on investments | | | | | | | | |
Investor Class | | | (12,966,230) | | | | (7,710,181) | |
Institutional Class | | | (32,097,504) | | | | (16,434,044) | |
Net decrease in net assets from distributions | | | (47,382,461) | | | | (24,694,773) | |
| | |
CAPITAL SHARE TRANSACTIONS (NOTE 5) | | | | | | | | |
Investor Class | | | | | | | | |
Proceeds from sales of shares | | | 12,505,211 | | | | 77,017,540 | |
Distributions reinvested | | | 12,613,027 | | | | 7,430,355 | |
Cost of shares redeemed | | | (47,705,840) | | | | (29,512,700) | |
Redemption fees | | | 1,678 | | | | 3,666 | |
Net increase/(decrease) from capital shares transactions | | | (22,585,924) | | | | 54,938,861 | |
| | |
Institutional Class | | | | | | | | |
Proceeds from sales of shares | | | 35,606,279 | | | | 236,191,571 | |
Distributions reinvested | | | 32,205,349 | | | | 16,039,187 | |
Cost of shares redeemed | | | (54,015,246) | | | | (30,650,202) | |
Redemption fees | | | 1,133 | | | | 5,551 | |
Net increase from capital shares transactions | | | 13,797,515 | | | | 221,586,107 | |
| | |
Net increase in net assets | | | 18,740,285 | | | | 358,778,654 | |
| | |
NET ASSETS | | | | | | | | |
Beginning of year | | | 709,116,321 | | | | 350,337,667 | |
End of year* | | $ | 727,856,606 | | | $ | 709,116,321 | |
| | |
*Including accumulated net investment loss of: | | $ | (687,723) | | | $ | (705,800) | |
| | |
OTHER INFORMATION | | | | | | | | |
Shares Transactions | | | | | | | | |
Investor Class | | | | | | | | |
Issued | | | 3,751,583 | | | | 24,473,188 | |
Issued to shareholders in reinvestment of distributions | | | 3,966,361 | | | | 2,286,263 | |
Redeemed | | | (14,276,987) | | | | (9,301,622) | |
Net increase/(decrease) in share transactions | | | (6,559,043) | | | | 17,457,829 | |
| | |
Institutional Class | | | | | | | | |
Issued | | | 10,612,822 | | | | 74,111,902 | |
Issued to shareholders in reinvestment of distributions | | | 10,064,172 | | | | 4,904,950 | |
Redeemed | | | (16,204,159) | | | | (9,571,700) | |
Net increase in share transactions | | | 4,472,835 | | | | 69,445,152 | |
| | |
| See Notes to Financial Statements. | | |
| 40 | | 1.855.377.7325 | www.GrandeurPeakGlobal.com |
| | |
| Grandeur Peak Global Reach Fund | | Statements of Changes in Net Assets |
| | | | | | | | |
| | | For the Year Ended April 30, 2015 | | | For the Period
June 19, 2013 (Inception) to April 30, 2014 | |
OPERATIONS | | | | | | | | |
Net investment income | | $ | 458,861 | | | $ | 32,885 | |
Net realized gain on investments and foreign currency transactions | | | 10,206,381 | | | | 1,579,849 | |
Net change in unrealized appreciation on investments and foreign currency translations | | | 20,804,164 | | | | 7,109,494 | |
Net increase in net assets resulting from operations | | | 31,469,406 | | | | 8,722,228 | |
| | |
DISTRIBUTIONS TO SHAREHOLDERS (NOTE 3) | | | | | | | | |
Net investment income | | | | | | | | |
Investor Class | | | (39,255) | | | | (44,891) | |
Institutional Class | | | (429,550) | | | | (108,748) | |
Net realized gains on investments | | | | | | | | |
Investor Class | | | (920,561) | | | | (171,869) | |
Institutional Class | | | (2,653,424) | | | | (195,310) | |
Net decrease in net assets from distributions | | | (4,042,790) | | | | (520,818) | |
| | |
CAPITAL SHARE TRANSACTIONS (NOTE 5) | | | | | | | | |
Investor Class | | | | | | | | |
Proceeds from sales of shares | | | 50,078,072 | | | | 56,808,405 | |
Distributions reinvested | | | 913,417 | | | | 209,868 | |
Cost of shares redeemed | | | (16,658,848) | | | | (13,615,726) | |
Redemption fees | | | 11,400 | | | | 7,176 | |
Net increase from capital shares transactions | | | 34,344,041 | | | | 43,409,723 | |
| | |
Institutional Class | | | | | | | | |
Proceeds from sales of shares | | | 163,642,642 | | | | 86,258,768 | |
Distributions reinvested | | | 2,839,814 | | | | 295,528 | |
Cost of shares redeemed | | | (15,137,030) | | | | (3,696,595) | |
Redemption fees | | | 3,537 | | | | 4,832 | |
Net increase from capital shares transactions | | | 151,348,963 | | | | 82,862,533 | |
| | |
Net increase in net assets | | | 213,119,620 | | | | 134,473,666 | |
| | |
NET ASSETS | | | | | | | | |
Beginning of year | | | 134,473,666 | | | | – | |
End of year* | | $ | 347,593,286 | | | $ | 134,473,666 | |
| | |
*Including accumulated net investment loss of: | | $ | (188,078) | | | $ | (32,886) | |
| | |
| See Notes to Financial Statements. | | |
| Annual Report | April 30, 2015 | | 41 |
| | |
| Grandeur Peak Global Reach Fund | | Statements of Changes in Net Assets |
| | | | | | | | |
| | | For the Year Ended April 30, 2015 | | | For the Period
June 19, 2013 (Inception) to April 30, 2014 | |
| | |
OTHER INFORMATION | | | | | | | | |
Shares Transactions | | | | | | | | |
Investor Class | | | | | | | | |
Issued | | | 3,913,617 | | | | 4,831,859 | |
Issued to shareholders in reinvestment of distributions | | | 72,379 | | | | 17,984 | |
Redeemed | | | (1,303,058) | | | | (1,135,134) | |
Net increase in share transactions | | | 2,682,938 | | | | 3,714,709 | |
| | |
Institutional Class | | | | | | | | |
Issued | | | 12,894,402 | | | | 7,398,753 | |
Issued to shareholders in reinvestment of distributions | | | 225,203 | | | | 25,367 | |
Redeemed | | | (1,179,712) | | | | (313,002) | |
Net increase in share transactions | | | 11,939,893 | | | | 7,111,118 | |
| | |
| See Notes to Financial Statements. | | |
| 42 | | 1.855.377.7325 | www.GrandeurPeakGlobal.com |
| | |
| Grandeur Peak International Opportunities Fund | | Statements of
Changes in Net Assets |
| | | | | | | | |
| | | For the
Year Ended
April 30, 2015 | | | For the
Year Ended
April 30, 2014 | |
OPERATIONS | | | | | | | | |
Net investment income | | $ | 4,559,749 | | | $ | 2,180,239 | |
Net realized gain on investments and foreign currency transactions | | | 62,562,011 | | | | 32,761,153 | |
Net change in unrealized appreciation/(depreciation) on investments and foreign currency translations | | | (7,154,588) | | | | 90,655,973 | |
Net increase in net assets resulting from operations | | | 59,967,172 | | | | 125,597,365 | |
| | |
DISTRIBUTIONS TO SHAREHOLDERS (NOTE 3) | | | | | | | | |
Net investment income | | | | | | | | |
Investor Class | | | (519,202) | | | | (850,286) | |
Institutional Class | | | (3,324,759) | | | | (4,248,374) | |
Net realized gains on investments | | | | | | | | |
Investor Class | | | (9,145,192) | | | | (3,131,062) | |
Institutional Class | | | (39,074,979) | | | | (12,702,647) | |
Net decrease in net assets from distributions | | | (52,064,132) | | | | (20,932,369) | |
| | |
CAPITAL SHARE TRANSACTIONS (NOTE 5) | | | | | | | | |
Investor Class | | | | | | | | |
Proceeds from sales of shares | | | 27,042,166 | | | | 55,833,951 | |
Distributions reinvested | | | 9,427,674 | | | | 3,836,965 | |
Cost of shares redeemed | | | (18,351,671) | | | | (23,996,762) | |
Redemption fees | | | 293 | | | | 9,771 | |
Net increase from capital shares transactions | | | 18,118,462 | | | | 35,683,925 | |
| | |
Institutional Class | | | | | | | | |
Proceeds from sales of shares | | | 25,311,158 | | | | 332,595,278 | |
Distributions reinvested | | | 36,728,280 | | | | 15,198,982 | |
Cost of shares redeemed | | | (43,279,215) | | | | (24,245,014) | |
Redemption fees | | | 1,597 | | | | 12,327 | |
Net increase from capital shares transactions | | | 18,761,820 | | | | 323,561,573 | |
| | |
Net increase in net assets | | | 44,783,322 | | | | 463,910,494 | |
| | |
NET ASSETS | | | | | | | | |
Beginning of year | | | 811,422,510 | | | | 347,512,016 | |
End of year* | | $ | 856,205,832 | | | $ | 811,422,510 | |
| | |
*Including accumulated net investment loss of: | | $ | (181,274) | | | $ | (597,470) | |
| | |
OTHER INFORMATION | | | | | | | | |
Shares Transactions | | | | | | | | |
Investor Class | | | | | | | | |
Issued | | | 8,289,054 | | | | 17,554,569 | |
Issued to shareholders in reinvestment of distributions | | | 3,021,690 | | | | 1,195,316 | |
Redeemed | | | (5,468,291) | | | | (7,842,523) | |
Net increase in share transactions | | | 5,842,453 | | | | 10,907,362 | |
| | |
Institutional Class | | | | | | | | |
Issued | | | 7,532,407 | | | | 107,001,298 | |
Issued to shareholders in reinvestment of distributions | | | 11,734,275 | | | | 4,720,181 | |
Redeemed | | | (13,091,622) | | | | (7,558,233) | |
Net increase in share transactions | | | 6,175,060 | | | | 104,163,246 | |
| | |
| See Notes to Financial Statements. | | |
| Annual Report | April 30, 2015 | | 43 |
| | |
| Grandeur Peak Emerging Markets Opportunities Fund | | Financial Highlights |
For a Share Outstanding Throughout the Periods Presented
| | | | | | | | |
| Investor Class | | Year Ended
April 30, 2015 | | | For the Period
December 16,
2013
(Inception) to
April 30, 2014 | |
NET ASSET VALUE, BEGINNING OF PERIOD | | $ | 10.53 | | | $ | 10.00 | |
| | |
INCOME FROM INVESTMENT OPERATIONS | | | | | | | | |
Net investment income/(loss)(a) | | | 0.02 | | | | (0.05) | |
Net realized and unrealized gain on investments | | | 1.22 | | | | 0.58 | |
Total income from investment operations | | | 1.24 | | | | 0.53 | |
| | |
DISTRIBUTIONS | | | | | | | | |
From net investment income | | | (0.01) | | | | – | |
From net realized gain on investments | | | (0.25) | | | | – | |
Total distributions | | | (0.26) | | | | – | |
| | |
REDEMPTION FEES ADDED TO PAID-IN CAPITAL | | | 0.00 | (b) | | | 0.00 | (b) |
| | |
INCREASE IN NET ASSET VALUE | | | 0.98 | | | | 0.53 | |
NET ASSET VALUE, END OF PERIOD | | $ | 11.51 | | | $ | 10.53 | |
| | |
TOTAL RETURN | | | 12.06 | % | | | 5.30 | %(c) |
| | |
RATIOS AND SUPPLEMENTAL DATA | | | | | | | | |
Net assets, end of period (in 000s) | | $ | 39,896 | | | $ | 27,952 | |
| | |
RATIOS TO AVERAGE NET ASSETS | | | | | | | | |
Expenses (excluding fees waived/reimbursed by investment advisor) | | | 1.82 | % | | | 2.01 | %(d)(e) |
Expenses (including fees waived/reimbursed by investment advisor) | | | 1.82 | % | | | 1.95 | %(d)(e) |
Net investment income/(loss) | | | 0.22 | % | | | (0.55 | )%(d) |
| | |
PORTFOLIO TURNOVER RATE | | | 53 | % | | | 26 | %(c) |
| (a) | Per share numbers have been calculated using the average shares method. |
| (b) | Less than $0.005 or ($0.005) per share. |
| (e) | Expense ratios during startup periods may not be representative of longer term operating periods. |
| | |
| See Notes to Financial Statements. | | |
| 44 | | 1.855.377.7325 | www.GrandeurPeakGlobal.com |
| | |
| Grandeur Peak Emerging Markets Opportunities Fund | | Financial Highlights |
For a Share Outstanding Throughout the Periods Presented
| | | | | | | | |
| Institutional Class | | Year Ended
April 30, 2015 | | | For the Period
December 16,
2013
(Inception) to
April 30, 2014 | |
NET ASSET VALUE, BEGINNING OF PERIOD | | $ | 10.54 | | | $ | 10.00 | |
| | |
INCOME FROM INVESTMENT OPERATIONS | | | | | | | | |
Net investment income/(loss)(a) | | | 0.05 | | | | (0.03 | ) |
Net realized and unrealized gain on investments | | | 1.21 | | | | 0.57 | |
Total income from investment operations | | | 1.26 | | | | 0.54 | |
| | |
DISTRIBUTIONS | | | | | | | | |
From net investment income | | | (0.03 | ) | | | – | |
From net realized gain on investments | | | (0.25 | ) | | | – | |
Total distributions | | | (0.28 | ) | | | – | |
| | |
REDEMPTION FEES ADDED TO PAID-IN CAPITAL | | | 0.00 | (b) | | | 0.00 | (b) |
| | |
INCREASE IN NET ASSET VALUE | | | 0.98 | | | | 0.54 | |
NET ASSET VALUE, END OF PERIOD | | $ | 11.52 | | | $ | 10.54 | |
| | | | | | | |
| | |
TOTAL RETURN | | | 12.22 | % | | | 5.40 | %(c) |
| | |
RATIOS AND SUPPLEMENTAL DATA | | | | | | | | |
Net assets, end of period (in 000s) | | $ | 428,048 | | | $ | 255,819 | |
| | |
RATIOS TO AVERAGE NET ASSETS | | | | | | | | |
Expenses (excluding fees waived/reimbursed by investment advisor) | | | 1.58 | % | | | 1.76 | %(d)(e) |
Expenses (including fees waived/reimbursed by investment advisor) | | | 1.58 | % | | | 1.70 | %(d)(e) |
Net investment income/(loss) | | | 0.43 | % | | | (0.37 | )%(d) |
| | |
PORTFOLIO TURNOVER RATE | | | 53 | % | | | 26 | %(c) |
| (a) | Per share numbers have been calculated using the average shares method. |
| (b) | Less than $0.005 or ($0.005) per share. |
| (e) | Expense ratios during startup periods may not be representative of longer term operating periods. |
| | |
| See Notes to Financial Statements. | | |
| Annual Report | April 30, 2015 | | 45 |
| | |
| Grandeur Peak Global Opportunities Fund | | Financial Highlights |
For a Share Outstanding Throughout the Periods Presented
| | | | | | | | | | | | | | | | |
| Investor Class | | Year Ended
April 30, 2015 | | | Year Ended
April 30, 2014 | | | Year Ended
April 30, 2013 | | | For the Period
October 17, 2011
(Inception) to
April 30, 2012 | |
NET ASSET VALUE, BEGINNING OF PERIOD | | $ | 3.31 | | | $ | 2.77 | | | $ | 2.31 | | | $ | 2.00 | |
| | | | |
INCOME FROM INVESTMENT OPERATIONS | | | | | | | | | | | | | | | | |
Net investment income/(loss)(a) | | | 0.00 | (b) | | | (0.00 | )(b) | | | 0.00 | (b) | | | (0.00 | )(b) |
Net realized and unrealized gain on investments | | | 0.35 | | | | 0.67 | | | | 0.51 | | | | 0.31 | |
Total income from investment operations | | | 0.35 | | | | 0.67 | | | | 0.51 | | | | 0.31 | |
| | | | |
DISTRIBUTIONS | | | | | | | | | | | | | | | | |
From net investment income | | | (0.01 | ) | | | – | | | | (0.01 | ) | | | – | |
From net realized gain on investments | | | (0.22 | ) | | | (0.13 | ) | | | (0.04 | ) | | | – | |
Total distributions | | | (0.23 | ) | | | (0.13 | ) | | | (0.05 | ) | | | – | |
| | | | |
REDEMPTION FEES ADDED TO PAID-IN CAPITAL | | | 0.00 | (b) | | | 0.00 | (b) | | | 0.00 | (b) | | | 0.00 | (b) |
| | | | |
INCREASE IN NET ASSET VALUE | | | 0.12 | | | | 0.54 | | | | 0.46 | | | | 0.31 | |
NET ASSET VALUE, END OF PERIOD | | $ | 3.43 | | | $ | 3.31 | | | $ | 2.77 | | | $ | 2.31 | |
| | | | | | | | | | | | | |
| | | | |
TOTAL RETURN | | | 11.09 | % | | | 24.31 | % | | | 22.34 | % | | | 15.50 | %(c) |
| | | | |
RATIOS AND SUPPLEMENTAL DATA | | | | | | | | | | | | | | | | |
Net assets, end of period (in 000s) | | $ | 201,462 | | | $ | 216,247 | | | $ | 132,384 | | | $ | 73,154 | |
| | | | |
RATIOS TO AVERAGE NET ASSETS | | | | | | | | | | | | | | | | |
Expenses (excluding fees waived/reimbursed by investment advisor) | | | 1.62 | % | | | 1.68 | % | | | 1.76 | % | | | 2.30 | %(d) |
Expenses (including fees waived/reimbursed by investment advisor) | | | 1.62 | % | | | 1.68 | % | | | 1.75 | % | | | 1.75 | %(d) |
Net investment income/(loss) | | | 0.12 | % | | | (0.15 | )% | | | 0.19 | % | | | (0.04 | )%(d) |
| | | | |
PORTFOLIO TURNOVER RATE | | | 37 | % | | | 38 | % | | | 35 | % | | | 42 | %(c) |
| (a) | Per share numbers have been calculated using the average shares method. |
| (b) | Less than $0.005 or ($0.005) per share. |
| | |
| See Notes to Financial Statements. | | |
| 46 | | 1.855.377.7325 | www.GrandeurPeakGlobal.com |
| | |
| Grandeur Peak Global Opportunities Fund | | Financial Highlights |
For a Share Outstanding Throughout the Periods Presented
| | | | | | | | | | | | | | | | |
| Institutional Class | | Year Ended
April 30, 2015 | | | Year Ended
April 30, 2014 | | | Year Ended
April 30, 2013 | | | For the Period
October 17, 2011
(Inception) to
April 30, 2012 | |
NET ASSET VALUE, BEGINNING OF PERIOD | | $ | 3.34 | | | $ | 2.79 | | | $ | 2.32 | | | $ | 2.00 | |
| | | | |
INCOME FROM INVESTMENT OPERATIONS | | | | | | | | | | | | | | | | |
Net investment income(a) | | | 0.01 | | | | 0.00 | (b) | | | 0.01 | | | | 0.00 | (b) |
Net realized and unrealized gain on investments | | | 0.34 | | | | 0.68 | | | | 0.52 | | | | 0.32 | |
Total income from investment operations | | | 0.35 | | | | 0.68 | | | | 0.53 | | | | 0.32 | |
| | | | |
DISTRIBUTIONS | | | | | | | | | | | | | | | | |
From net investment income | | | (0.01 | ) | | | (0.00 | )(b) | | | (0.02 | ) | | | – | |
From net realized gain on investments | | | (0.22 | ) | | | (0.13 | ) | | | (0.04 | ) | | | – | |
Total distributions | | | (0.23 | ) | | | (0.13 | ) | | | (0.06 | ) | | | – | |
| | | | |
REDEMPTION FEES ADDED TO PAID-IN CAPITAL | | | 0.00 | (b) | | | 0.00 | (b) | | | 0.00 | (b) | | | 0.00 | (b) |
| | | | |
INCREASE IN NET ASSET VALUE | | | 0.12 | | | | 0.55 | | | | 0.47 | | | | 0.32 | |
NET ASSET VALUE, END OF PERIOD | | $ | 3.46 | | | $ | 3.34 | | | $ | 2.79 | | | $ | 2.32 | |
| | | | | | | | | | | | | |
| | | | |
TOTAL RETURN | | | 11.20 | % | | | 24.67 | % | | | 22.86 | % | | | 16.00 | %(c) |
| | | | |
RATIOS AND SUPPLEMENTAL DATA | | | | | | | | | | | | | | | | |
Net assets, end of period (in 000s) | | $ | 526,394 | | | $ | 492,869 | | | $ | 217,953 | | | $ | 77,737 | |
| | | | |
RATIOS TO AVERAGE NET ASSETS | | | | | | | | | | | | | | | | |
Expenses (excluding fees waived/reimbursed by investment advisor) | | | 1.38 | % | | | 1.44 | % | | | 1.51 | % | | | 2.03 | %(d) |
Expenses (including fees waived/reimbursed by investment advisor) | | | 1.38 | % | | | 1.44 | % | | | 1.50 | % | | | 1.50 | %(d) |
Net investment income | | | 0.35 | % | | | 0.08 | % | | | 0.37 | % | | | 0.40 | %(d) |
| | | | |
PORTFOLIO TURNOVER RATE | | | 37 | % | | | 38 | % | | | 35 | % | | | 42 | %(c) |
| (a) | Per share numbers have been calculated using the average shares method. |
| (b) | Less than $0.005 or ($0.005) per share. |
| | |
| See Notes to Financial Statements. | | |
| Annual Report | April 30, 2015 | | 47 |
| | |
| Grandeur Peak Global Reach Fund | | Financial Highlights |
For a Share Outstanding Throughout the Periods Presented
| | | | | | | | |
| Investor Class | | Year Ended
April 30, 2015 | | | For the Period
June 19, 2013
(Inception) to
April 30, 2014 | |
NET ASSET VALUE, BEGINNING OF PERIOD | | $ | 12.43 | | | $ | 10.00 | |
| | |
INCOME FROM INVESTMENT OPERATIONS | | | | | | | | |
Net investment income/(loss)(a) | | | 0.00 | (b) | | | (0.02 | ) |
Net realized and unrealized gain on investments | | | 1.37 | | | | 2.54 | |
Total income from investment operations | | | 1.37 | | | | 2.52 | |
| | |
DISTRIBUTIONS | | | | | | | | |
From net investment income | | | (0.01 | ) | | | (0.02 | ) |
From net realized gain on investments | | | (0.14 | ) | | | (0.08 | ) |
Total distributions | | | (0.15 | ) | | | (0.10 | ) |
| | |
REDEMPTION FEES ADDED TO PAID-IN CAPITAL | | | 0.00 | (b) | | | 0.01 | |
| | |
INCREASE IN NET ASSET VALUE | | | 1.22 | | | | 2.43 | |
NET ASSET VALUE, END OF PERIOD | | $ | 13.65 | | | $ | 12.43 | |
| | | | | | | |
| | |
TOTAL RETURN | | | 11.09 | % | | | 25.31 | %(c) |
| | |
RATIOS AND SUPPLEMENTAL DATA | | | | | | | | |
Net assets, end of period (in 000s) | | $ | 87,354 | | | $ | 46,163 | |
| | |
RATIOS TO AVERAGE NET ASSETS | | | | | | | | |
Expenses (excluding fees waived/reimbursed by investment advisor) | | | 1.60 | % | | | 1.91 | %(d)(e) |
Expenses (including fees waived/reimbursed by investment advisor) | | | 1.60 | % | | | 1.60 | %(d)(e) |
Net investment income/(loss) | | | 0.03 | % | | | (0.17 | )%(d) |
| | |
PORTFOLIO TURNOVER RATE | | | 46 | % | | | 39 | %(c) |
| (a) | Per share numbers have been calculated using the average shares method. |
| (b) | Less than $0.005 or ($0.005) per share. |
| (e) | Expense ratios during startup periods may not be representative of longer term operating periods. |
| | |
| See Notes to Financial Statements. | | |
| 48 | | 1.855.377.7325 | www.GrandeurPeakGlobal.com |
| | |
| Grandeur Peak Global Reach Fund | | Financial Highlights |
For a Share Outstanding Throughout the Periods Presented
| | | | | | | | |
| Institutional Class | | Year Ended
April 30, 2015 | | | For the Period
June 19, 2013
(Inception) to
April 30, 2014 | |
NET ASSET VALUE, BEGINNING OF PERIOD | | $ | 12.42 | | | $ | 10.00 | |
| | |
INCOME FROM INVESTMENT OPERATIONS | | | | | | | | |
Net investment income(a) | | | 0.03 | | | | 0.02 | |
Net realized and unrealized gain on investments | | | 1.37 | | | | 2.52 | |
Total income from investment operations | | | 1.40 | | | | 2.54 | |
| | |
DISTRIBUTIONS | | | | | | | | |
From net investment income | | | (0.02 | ) | | | (0.04 | ) |
From net realized gain on investments | | | (0.14 | ) | | | (0.08 | ) |
Total distributions | | | (0.16 | ) | | | (0.12 | ) |
| | |
REDEMPTION FEES ADDED TO PAID-IN CAPITAL | | | 0.00 | (b) | | | 0.00 | (b) |
| | |
INCREASE IN NET ASSET VALUE | | | 1.24 | | | | 2.42 | |
NET ASSET VALUE, END OF PERIOD | | $ | 13.66 | | | $ | 12.42 | |
| | | | | | | |
| | |
TOTAL RETURN | | | 11.41 | % | | | 25.45 | %(c) |
| | |
RATIOS AND SUPPLEMENTAL DATA | | | | | | | | |
Net assets, end of period (in 000s) | | $ | 260,239 | | | $ | 88,311 | |
| | |
RATIOS TO AVERAGE NET ASSETS | | | | | | | | |
Expenses (excluding fees waived/reimbursed by investment advisor) | | | 1.35 | % | | | 1.75 | %(d)(e) |
Expenses (including fees waived/reimbursed by investment advisor) | | | 1.35 | % | | | 1.35 | %(d)(e) |
Net investment income | | | 0.23 | % | | | 0.21 | %(d) |
| | |
PORTFOLIO TURNOVER RATE | | | 46 | % | | | 39 | %(c) |
| (a) | Per share numbers have been calculated using the average shares method. |
| (b) | Less than $0.005 or ($0.005) per share. |
| (e) | Expense ratios during startup periods may not be representative of longer term operating periods. |
| | |
| See Notes to Financial Statements. | | |
| Annual Report | April 30, 2015 | | 49 |
| | |
| Grandeur Peak International Opportunities Fund | | Financial Highlights |
For a Share Outstanding Throughout the Periods Presented
| | | | | | | | | | | | | | | | |
| Investor Class | | Year Ended
April 30, 2015 | | | Year Ended
April 30, 2014 | | | Year Ended
April 30, 2013 | | | For the Period
October 17, 2011
(Inception) to
April 30, 2012 | |
NET ASSET VALUE, BEGINNING OF PERIOD | | $ | 3.41 | | | $ | 2.83 | | | $ | 2.29 | | | $ | 2.00 | |
| | | | |
INCOME FROM INVESTMENT OPERATIONS | | | | | | | | | | | | | | | | |
Net investment income(a) | | | 0.01 | | | | 0.01 | | | | 0.01 | | | | 0.00 | (b) |
Net realized and unrealized gain on investments | | | 0.21 | | | | 0.68 | | | | 0.55 | | | | 0.29 | |
Total income from investment operations | | | 0.22 | | | | 0.69 | | | | 0.56 | | | | 0.29 | |
| | | | |
DISTRIBUTIONS | | | | | | | | | | | | | | | | |
From net investment income | | | (0.01 | ) | | | (0.02 | ) | | | (0.01 | ) | | | – | |
From net realized gain on investments | | | (0.20 | ) | | | (0.09 | ) | | | (0.01 | ) | | | – | |
Total distributions | | | (0.21 | ) | | | (0.11 | ) | | | (0.02 | ) | | | – | |
| | | | |
REDEMPTION FEES ADDED TO PAID-IN CAPITAL | | | 0.00 | (b) | | | 0.00 | (b) | | | 0.00 | (b) | | | 0.00 | (b) |
| | | | |
INCREASE IN NET ASSET VALUE | | | 0.01 | | | | 0.58 | | | | 0.54 | | | | 0.29 | |
NET ASSET VALUE, END OF PERIOD | | $ | 3.42 | | | $ | 3.41 | | | $ | 2.83 | | | $ | 2.29 | |
| | | | | | | | | | | | | |
| | | | |
TOTAL RETURN | | | 7.25 | % | | | 24.59 | % | | | 24.57 | % | | | 14.50 | %(c) |
| | | | |
RATIOS AND SUPPLEMENTAL DATA | | | | | | | | | | | | | | | | |
Net assets, end of period (in 000s) | | $ | 173,842 | | | $ | 153,296 | | | $ | 96,550 | | | $ | 9,274 | |
| | | | |
RATIOS TO AVERAGE NET ASSETS | | | | | | | | | | | | | | | | |
Expenses (excluding fees waived/reimbursed by investment advisor) | | | 1.62 | % | | | 1.73 | % | | | 1.88 | % | | | 2.94 | %(d) |
Expenses (including fees waived/reimbursed by investment advisor) | | | 1.62 | % | | | 1.73 | % | | | 1.75 | % | | | 1.75 | %(d) |
Net investment income | | | 0.37 | % | | | 0.20 | % | | | 0.26 | % | | | 0.33 | %(d) |
| | | | |
PORTFOLIO TURNOVER RATE | | | 36 | % | | | 37 | % | | | 52 | % | | | 24 | %(c) |
| (a) | Per share numbers have been calculated using the average shares method. |
| (b) | Less than $0.005 or ($0.005) per share. |
| | |
| See Notes to Financial Statements. | | |
| 50 | | 1.855.377.7325 | www.GrandeurPeakGlobal.com |
| | |
| Grandeur Peak International Opportunities Fund | | Financial Highlights |
For a Share Outstanding Throughout the Periods Presented
| | | | | | | | | | | | | | | | |
| Institutional Class | | Year Ended
April 30, 2015 | | | Year Ended
April 30, 2014 | | | Year Ended
April 30, 2013 | | | For the Period
October 17, 2011
(Inception) to
April 30, 2012 | |
NET ASSET VALUE, BEGINNING OF PERIOD | | $ | 3.42 | | | $ | 2.84 | | | $ | 2.29 | | | $ | 2.00 | |
| | | | |
INCOME FROM INVESTMENT OPERATIONS | | | | | | | | | | | | | | | | |
Net investment income(a) | | | 0.02 | | | | 0.01 | | | | 0.01 | | | | 0.01 | |
Net realized and unrealized gain on investments | | | 0.21 | | | | 0.69 | | | | 0.57 | | | | 0.28 | |
Total income from investment operations | | | 0.23 | | | | 0.70 | | | | 0.58 | | | | 0.29 | |
| | | | |
DISTRIBUTIONS | | | | | | | | | | | | | | | | |
From net investment income | | | (0.02 | ) | | | (0.03 | ) | | | (0.02 | ) | | | – | |
From net realized gain on investments | | | (0.20 | ) | | | (0.09 | ) | | | (0.01 | ) | | | – | |
Total distributions | | | (0.22 | ) | | | (0.12 | ) | | | (0.03 | ) | | | – | |
| | | | |
REDEMPTION FEES ADDED TO PAID-IN CAPITAL | | | 0.00 | (b) | | | 0.00 | (b) | | | 0.00 | (b) | | | 0.00 | (b) |
| | | | |
INCREASE IN NET ASSET VALUE | | | 0.01 | | | | 0.58 | | | | 0.55 | | | | 0.29 | |
NET ASSET VALUE, END OF PERIOD | | $ | 3.43 | | | $ | 3.42 | | | $ | 2.84 | | | $ | 2.29 | |
| | | | | | | | | | | | | |
| | | | |
TOTAL RETURN | | | 7.41 | % | | | 24.70 | % | | | 25.11 | % | | | 14.50 | %(c) |
| | | | |
RATIOS AND SUPPLEMENTAL DATA | | | | | | | | | | | | | | | | |
Net assets, end of period (in 000s) | | $ | 682,364 | | | $ | 658,127 | | | $ | 250,962 | | | $ | 55,458 | |
| | | | |
RATIOS TO AVERAGE NET ASSETS | | | | | | | | | | | | | | | | |
Expenses (excluding fees waived/reimbursed by investment advisor) | | | 1.38 | % | | | 1.46 | % | | | 1.59 | % | | | 2.50 | %(d) |
Expenses (including fees waived/reimbursed by investment advisor) | | | 1.38 | % | | | 1.46 | % | | | 1.50 | % | | | 1.50 | %(d) |
Net investment income | | | 0.61 | % | | | 0.42 | % | | | 0.51 | % | | | 0.56 | %(d) |
| | | | |
PORTFOLIO TURNOVER RATE | | | 36 | % | | | 37 | % | | | 52 | % | | | 24 | %(c) |
| (a) | Per share numbers have been calculated using the average shares method. |
| (b) | Less than $0.005 or ($0.005) per share. |
| | |
| See Notes to Financial Statements. | | |
| Annual Report | April 30, 2015 | | 51 |
| | |
| Grandeur Peak Funds® | | Notes to Financial Statements |
April 30, 2015
1. ORGANIZATION
Financial Investors Trust (the “Trust”), a Delaware statutory trust, is an open-end management investment company registered under the Investment Company Act of 1940, as amended (“1940 Act”). As of April 30, 2015, the Trust had 30 registered funds. This annual report describes the Grandeur Peak Emerging Markets Opportunities Fund, Grandeur Peak Global Opportunities Fund, Grandeur Peak Global Reach Fund, and Grandeur Peak International Opportunities Fund (individually a “Fund” and collectively, the “Funds”). The Funds seek long-term growth of capital. The Funds offer Investor Class and Institutional Class shares. The Grandeur Peak Global Opportunities Fund and Grandeur Peak International Opportunities Fund were each previously a non-diversified investment company for the diversification purposes of the Investment Company Act of 1940. As a result of operating in a diversified manner for the past three years, the Funds are now deemed to be diversified under the Investment Company Act of 1940. Neither Fund may resume operating in a non-diversified manner without first obtaining shareholder approval.
2. SIGNIFICANT ACCOUNTING POLICIES
The accompanying financial statements were prepared in accordance with accounting principles generally accepted in the United States of America (“U.S. GAAP”). The preparation of financial statements in conformity with U.S. GAAP requires management to make certain estimates and assumptions that affect the reported amounts of assets and liabilities and disclosures of contingent assets and liabilities at the date of the financial statements and the reported amounts of revenue and expenses during the period. Actual results could differ from those estimates. The Funds are considered an investment company for financial reporting purposes under U.S. GAAP. The following is a summary of significant accounting policies consistently followed by the Funds in preparation of their financial statements.
Investment Valuation: The Funds generally value their securities based on market prices determined at the close of regular trading on the New York Stock Exchange (“NYSE”), normally 4:00 p.m. Eastern Time, on each day the NYSE is open for trading.
For equity securities and mutual funds that are traded on an exchange, the market price is usually the closing sale or official closing price on that exchange. In the case of equity securities not traded on an exchange, or if such closing prices are not otherwise available, the securities are valued at the mean of the most recent bid and ask prices on such day. Redeemable securities issued by open-end registered investment companies are valued at the investment company’s applicable net asset value.
Equity securities that are primarily traded on foreign securities exchanges are valued at the closing values of such securities on their respective foreign exchanges, except when an event occurs subsequent to the close of the foreign exchange and the close of the NYSE that was likely to have changed such value. In such an event, the fair value of those securities are determined in good faith through consideration of other factors in accordance with procedures established by and under the general supervision of the Board of Trustees (the “Board”). The Funds will use a fair valuation model provided by an independent pricing service, which is intended to reflect fair value when a security’s value or a meaningful portion of each Fund’s portfolio is believed to have been materially affected by a valuation event that has occurred between the close of the exchange or market on which the security is traded and the close of the regular trading day on the NYSE. The Funds’ valuation procedures set forth certain triggers which instruct when to use the fair valuation model.
Forward currency exchange contracts have a market value determined by the prevailing foreign currency exchange daily rates and current foreign currency exchange forward rates. The foreign currency exchange forward rates are calculated using an automated system that estimates rates on the basis of the current day foreign currency exchange rates and forward foreign currency exchange rates supplied by a pricing service.
When such prices or quotations are not available, or when the Fair Value Committee appointed by the Board believes that they are unreliable, securities may be priced using fair value procedures approved by the Board.
Fair Value Measurements: The Funds disclose the classification of their fair value measurements following a three-tier hierarchy based on the inputs used to measure fair value. Inputs refer broadly to the assumptions that market participants would use in pricing the asset or liability, including assumptions about risk. Inputs may be observable or unobservable. Observable inputs reflect the assumptions market participants would use in pricing the asset or liability that are developed based on market data obtained from sources independent of the reporting entity. Unobservable inputs reflect the reporting entity’s own assumptions about the assumptions market participants would use in pricing the asset or liability that are developed based on the best information available.
Various inputs are used in determining the value of the Funds’ investments as of the end of the reporting period. When inputs used fall into different levels of the fair value hierarchy, the level in the hierarchy within which the fair value measurement falls is determined based on the lowest level input that is significant to the fair value measurement in its entirety. The designated input levels are not necessarily an indication of the risk or liquidity associated with these investments. These inputs are categorized in the following hierarchy under applicable financial accounting standards:
| | |
52 | | 1.855.377.7325 | www.GrandeurPeakGlobal.com |
| | |
| Grandeur Peak Funds® | | Notes to Financial Statements |
April 30, 2015
Level 1 – Unadjusted quoted prices in active markets for identical investments, unrestricted assets or liabilities that the Funds have the ability to access at the measurement date;
Level 2 – Quoted prices which are not active, quoted prices for similar assets or liabilities in active markets or inputs other than quoted prices that are observable (either directly or indirectly) for substantially the full term of the asset or liability; and
Level 3 – Significant unobservable prices or inputs (including the Funds’ own assumptions in determining the fair value of investments) where there is little or no market activity for the asset or liability at the measurement date.
The following is a summary of each Fund’s investments in the fair value hierarchy as of April 30, 2015:
| | | | | | | | | | | | | | | | |
| Investments in Securities at Value | | Level 1 - Quoted
and Unadjusted
Prices | | | Level 2 - Other
Significant
Observable Inputs | | | Level 3 - Significant
Unobservable
Inputs | | | Total | |
Grandeur Peak Emerging Markets Opportunities Fund | |
Common Stocks | | | | | | | | | | | | | | | | |
Bangladesh | | $ | 2,354,926 | | | $ | 855,235 | | | $ | – | | | $ | 3,210,161 | |
Brazil | | | 17,921,300 | | | | – | | | | – | | | | 17,921,300 | |
China | | | 22,025,854 | | | | 52,166,965 | | | | 1,603,828 | | | | 75,796,647 | |
Colombia | | | 7,679,678 | | | | – | | | | – | | | | 7,679,678 | |
Georgia | | | – | | | | 4,594,515 | | | | – | | | | 4,594,515 | |
Greece | | | 2,360,574 | | | | – | | | | – | | | | 2,360,574 | |
Hong Kong | | | 2,315,867 | | | | 13,117,237 | | | | – | | | | 15,433,104 | |
India | | | 25,061,277 | | | | 35,904,346 | | | | 50,682 | | | | 61,016,305 | |
Indonesia | | | 4,608,390 | | | | 17,402,442 | | | | – | | | | 22,010,832 | |
Kazakhstan | | | – | | | | 1,181,114 | | | | – | | | | 1,181,114 | |
Luxembourg | | | 1,520,326 | | | | – | | | | – | | | | 1,520,326 | |
Malaysia | | | 2,947,937 | | | | 10,559,191 | | | | – | | | | 13,507,128 | |
Mexico | | | 9,687,319 | | | | – | | | | – | | | | 9,687,319 | |
Oman | | | – | | | | 1,078,416 | | | | – | | | | 1,078,416 | |
Philippines | | | 4,152,965 | | | | 15,901,587 | | | | – | | | | 20,054,552 | |
Poland | | | 4,844,067 | | | | 4,544,375 | | | | – | | | | 9,388,442 | |
Russia | | | 1,091,500 | | | | – | | | | – | | | | 1,091,500 | |
South Africa | | | 19,953,197 | | | | 10,090,182 | | | | – | | | | 30,043,379 | |
South Korea | | | 878,887 | | | | 33,390,852 | | | | – | | | | 34,269,739 | |
Sri Lanka | | | 7,813,978 | | | | 1,148,470 | | | | – | | | | 8,962,448 | |
Taiwan | | | – | | | | 55,609,570 | | | | – | | | | 55,609,570 | |
Thailand | | | 1,227,975 | | | | 3,987,779 | | | | – | | | | 5,215,754 | |
Turkey | | | 4,770,596 | | | | 3,090,735 | | | | – | | | | 7,861,331 | |
United Arab Emirates | | | – | | | | 426,713 | | | | – | | | | 426,713 | |
United States | | | 1,666,521 | | | | – | | | | – | | | | 1,666,521 | |
Vietnam | | | 1,989,848 | | | | 2,385,988 | | | | – | | | | 4,375,836 | |
Preferred Stocks | | | | | | | | | | | | | | | | |
Brazil | | | 2,082,972 | | | | – | | | | – | | | | 2,082,972 | |
Exchange-Traded Funds | | | | | | | | | | | | | | | | |
United States | | | 5,299,918 | | | | – | | | | – | | | | 5,299,918 | |
Rights | | | | | | | | | | | | | | | | |
Sri Lanka | | | 10,788 | | | | – | | | | – | | | | 10,788 | |
Total | | $ | 154,266,660 | | | $ | 267,435,712 | | | $ | 1,654,510 | | | $ | 423,356,882 | |
| | | | | | | | | | | | | | | | | |
| | |
Annual Report | April 30, 2015 | | 53 |
| | |
| Grandeur Peak Funds® | | Notes to Financial Statements |
April 30, 2015
| | | | | | | | | | | | | | | | |
| Investments in Securities at Value | | Level 1 - Quoted
and Unadjusted
Prices | | | Level 2 - Other
Significant
Observable Inputs | | | Level 3 - Significant
Unobservable
Inputs | | | Total | |
Grandeur Peak Global Opportunities Fund | |
Common Stocks | | | | | | | | | | | | | | | | |
Australia | | $ | – | | | $ | 8,876,525 | | | $ | – | | | $ | 8,876,525 | |
Austria | | | 7,838,886 | | | | – | | | | – | | | | 7,838,886 | |
Belgium | | | – | | | | 9,925,171 | | | | – | | | | 9,925,171 | |
Brazil | | | 14,653,847 | | | | – | | | | – | | | | 14,653,847 | |
Britain | | | 21,278,257 | | | | 33,982,339 | | | | – | | | | 55,260,596 | |
Canada | | | 14,680,340 | | | | – | | | | – | | | | 14,680,340 | |
China | | | 17,220,176 | | | | 36,934,045 | | | | 2,529,956 | | | | 56,684,177 | |
Colombia | | | 6,742,636 | | | | – | | | | – | | | | 6,742,636 | |
France | | | 7,020,199 | | | | 6,599,562 | | | | – | | | | 13,619,761 | |
Georgia | | | – | | | | 4,734,659 | | | | – | | | | 4,734,659 | |
Germany | | | 3,163,763 | | | | 20,132,620 | | | | – | | | | 23,296,383 | |
Greece | | | 856,811 | | | | – | | | | – | | | | 856,811 | |
Hong Kong | | | 3,022,551 | | | | 12,727,334 | | | | – | | | | 15,749,885 | |
India | | | 23,387,762 | | | | 30,732,362 | | | | 8,093 | | | | 54,128,217 | |
Indonesia | | | 4,189,164 | | | | 18,878,063 | | | | – | | | | 23,067,227 | |
Ireland | | | 2,157,402 | | | | 2,628,951 | | | | – | | | | 4,786,353 | |
Israel | | | 2,088,569 | | | | – | | | | – | | | | 2,088,569 | |
Japan | | | 6,179,665 | | | | 32,183,566 | | | | – | | | | 38,363,231 | |
Luxembourg | | | 5,435,712 | | | | – | | | | – | | | | 5,435,712 | |
Malaysia | | | 1,972,381 | | | | 9,662,917 | | | | – | | | | 11,635,298 | |
Mexico | | | 3,153,882 | | | | – | | | | – | | | | 3,153,882 | |
Netherlands | | | – | | | | 3,694,676 | | | | – | | | | 3,694,676 | |
Norway | | | – | | | | 1,959,356 | | | | – | | | | 1,959,356 | |
Philippines | | | 2,692,829 | | | | 5,179,729 | | | | – | | | | 7,872,558 | |
Poland | | | 907,393 | | | | – | | | | – | | | | 907,393 | |
Singapore | | | – | | | | 5,649,288 | | | | – | | | | 5,649,288 | |
South Africa | | | 5,927,714 | | | | 8,712,673 | | | | – | | | | 14,640,387 | |
South Korea | | | 1,080,736 | | | | 19,986,543 | | | | – | | | | 21,067,279 | |
Sweden | | | 4,963,010 | | | | 12,968,684 | | | | – | | | | 17,931,694 | |
Switzerland | | | 5,889,919 | | | | – | | | | – | | | | 5,889,919 | |
Taiwan | | | – | | | | 37,062,586 | | | | – | | | | 37,062,586 | |
Thailand | | | – | | | | 4,623,492 | | | | – | | | | 4,623,492 | |
Turkey | | | 1,431,954 | | | | 1,746,802 | | | | – | | | | 3,178,756 | |
United Arab Emirates | | | – | | | | 714,239 | | | | – | | | | 714,239 | |
United States | | | 216,264,982 | | | | – | | | | – | | | | 216,264,982 | |
Vietnam | | | 657,015 | | | | – | | | | – | | | | 657,015 | |
Preferred Stocks | | | | | | | | | | | | | | | | |
Brazil | | | 2,215,729 | | | | – | | | | – | | | | 2,215,729 | |
Total | | $ | 387,073,284 | | | $ | 330,296,182 | | | $ | 2,538,049 | | | $ | 719,907,515 | |
| | | | | | | | | | | | | | | | | |
| | |
54 | | 1.855.377.7325 | www.GrandeurPeakGlobal.com |
| | |
| Grandeur Peak Funds® | | Notes to Financial Statements |
April 30, 2015
| | | | | | | | | | | | | | | | |
| Investments in Securities at Value | | Level 1 - Quoted
and Unadjusted
Prices | | | Level 2 - Other
Significant
Observable Inputs | | | Level 3 - Significant
Unobservable
Inputs | | | Total | |
Grandeur Peak Global Reach Fund | | | | | | | | | | | | | | | | |
Common Stocks | | | | | | | | | | | | | | | | |
Australia | | $ | – | | | $ | 6,964,786 | | | $ | – | | | $ | 6,964,786 | |
Austria | | | 1,322,932 | | | | – | | | | – | | | | 1,322,932 | |
Bangladesh | | | 205,076 | | | | – | | | | – | | | | 205,076 | |
Belgium | | | – | | | | 999,185 | | | | – | | | | 999,185 | |
Brazil | | | 5,528,214 | | | | – | | | | – | | | | 5,528,214 | |
Britain | | | 10,291,692 | | | | 13,821,149 | | | | – | | | | 24,112,841 | |
Canada | | | 6,315,432 | | | | – | | | | – | | | | 6,315,432 | |
China | | | 9,370,131 | | | | 21,620,573 | | | | 686,461 | | | | 31,677,165 | |
Colombia | | | 2,061,990 | | | | 267,272 | | | | – | | | | 2,329,262 | |
Denmark | | | – | | | | 281,316 | | | | – | | | | 281,316 | |
Finland | | | – | | | | 80,143 | | | | – | | | | 80,143 | |
France | | | 4,370,046 | | | | 3,785,199 | | | | – | | | | 8,155,245 | |
Georgia | | | – | | | | 2,669,425 | | | | – | | | | 2,669,425 | |
Germany | | | 1,964,001 | | | | 6,661,257 | | | | – | | | | 8,625,258 | |
Greece | | | 2,238,855 | | | | – | | | | – | | | | 2,238,855 | |
Hong Kong | | | 2,193,235 | | | | 6,762,334 | | | | – | | | | 8,955,569 | |
India | | | 11,613,617 | | | | 15,384,596 | | | | 19,556 | | | | 27,017,769 | |
Indonesia | | | 1,282,225 | | | | 9,613,200 | | | | – | | | | 10,895,425 | |
Ireland | | | 1,991,750 | | | | 835,174 | | | | – | | | | 2,826,924 | |
Israel | | | 3,991,329 | | | | 480,638 | | | | – | | | | 4,471,967 | |
Japan | | | 683,518 | | | | 17,161,901 | | | | – | | | | 17,845,419 | |
Kazakhstan | | | – | | | | 81,885 | | | | – | | | | 81,885 | |
Luxembourg | | | 2,909,616 | | | | – | | | | – | | | | 2,909,616 | |
Malaysia | | | 1,502,027 | | | | 3,690,166 | | | | – | | | | 5,192,193 | |
Mexico | | | 2,442,802 | | | | – | | | | – | | | | 2,442,802 | |
Netherlands | | | – | | | | 2,091,287 | | | | – | | | | 2,091,287 | |
Norway | | | – | | | | 1,544,084 | | | | – | | | | 1,544,084 | |
Philippines | | | 1,261,441 | | | | 3,759,967 | | | | – | | | | 5,021,408 | |
Poland | | | 2,001,203 | | | | 1,165,377 | | | | – | | | | 3,166,580 | |
Russia | | | 59,275 | | | | – | | | | – | | | | 59,275 | |
Singapore | | | – | | | | 2,582,588 | | | | – | | | | 2,582,588 | |
South Africa | | | 9,220,714 | | | | 5,147,776 | | | | – | | | | 14,368,490 | |
South Korea | | | 343,086 | | | | 10,645,707 | | | | – | | | | 10,988,793 | |
Spain(a) | | | – | | | | – | | | | 1 | | | | 1 | |
Sri Lanka | | | 2,533,079 | | | | – | | | | – | | | | 2,533,079 | |
Sweden | | | 1,440,401 | | | | 4,463,577 | | | | – | | | | 5,903,978 | |
Switzerland | | | 2,936,921 | | | | – | | | | – | | | | 2,936,921 | |
Taiwan | | | – | | | | 14,724,860 | | | | – | | | | 14,724,860 | |
Thailand | | | 222,663 | | | | 1,053,996 | | | | – | | | | 1,276,659 | |
Turkey | | | 2,463,764 | | | | 1,027,412 | | | | – | | | | 3,491,176 | |
United States | | | 82,591,308 | | | | – | | | | – | | | | 82,591,308 | |
Vietnam | | | 1,400,226 | | | | 588,209 | | | | – | | | | 1,988,435 | |
Preferred Stocks | | | | | | | | | | | | | | | | |
Brazil | | | 677,863 | | | | – | | | | – | | | | 677,863 | |
Rights | | | | | | | | | | | | | | | | |
France | | | – | | | | – | | | | – | | | | – | |
Sri Lanka | | | 6,714 | | | | – | | | | – | | | | 6,714 | |
Total | | $ | 179,437,146 | | | $ | 159,955,039 | | | $ | 706,018 | | | $ | 340,098,203 | |
| | | | | | | | | | | | | | | | | |
| (a) | Akka Technologies SA rights are considered Level 3. The market value of the rights were $0 as of 04/30/15. |
| | |
Annual Report | April 30, 2015 | | 55 |
| | |
| Grandeur Peak Funds® | | Notes to Financial Statements |
April 30, 2015
| | | | | | | | | | | | | | | | |
| Investments in Securities at Value | | Level 1 - Quoted
and Unadjusted
Prices | | | Level 2 - Other
Significant
Observable Inputs | | | Level 3 - Significant
Unobservable
Inputs | | | Total | |
Grandeur Peak International Opportunities Fund | |
Common Stocks | | | | | | | | | | | | | | | | |
Australia | | $ | 862,300 | | | $ | 9,867,614 | | | $ | – | | | $ | 10,729,914 | |
Austria | | | 9,028,157 | | | | – | | | | – | | | | 9,028,157 | |
Belgium | | | – | | | | 11,376,812 | | | | – | | | | 11,376,812 | |
Brazil | | | 28,087,333 | | | | – | | | | – | | | | 28,087,333 | |
Britain | | | 39,006,262 | | | | 56,889,113 | | | | – | | | | 95,895,375 | |
Canada | | | 27,631,832 | | | | – | | | | – | | | | 27,631,832 | |
China | | | 22,328,261 | | | | 56,656,217 | | | | 2,056,880 | | | | 81,041,358 | |
Colombia | | | 8,120,935 | | | | – | | | | – | | | | 8,120,935 | |
Denmark | | | – | | | | 974,319 | | | | – | | | | 974,319 | |
Finland | | | – | | | | 275,137 | | | | – | | | | 275,137 | |
France | | | 9,742,813 | | | | 13,669,853 | | | | – | | | | 23,412,666 | |
Georgia | | | – | | | | 6,305,858 | | | | – | | | | 6,305,858 | |
Germany | | | 7,727,618 | | | | 28,725,925 | | | | – | | | | 36,453,543 | |
Hong Kong | | | 3,066,913 | | | | 16,242,499 | | | | – | | | | 19,309,412 | |
India | | | 28,092,925 | | | | 37,381,505 | | | | 13,985 | | | | 65,488,415 | |
Indonesia | | | 4,549,838 | | | | 26,686,782 | | | | – | | | | 31,236,620 | |
Ireland | | | 7,842,304 | | | | 3,348,870 | | | | – | | | | 11,191,174 | |
Israel | | | 1,605,404 | | | | 1,508,369 | | | | – | | | | 3,113,773 | |
Japan | | | 6,370,335 | | | | 51,934,466 | | | | – | | | | 58,304,801 | |
Luxembourg | | | 8,262,893 | | | | – | | | | – | | | | 8,262,893 | |
Malaysia | | | 3,284,874 | | | | 16,164,736 | | | | – | | | | 19,449,610 | |
Mexico | | | 7,555,315 | | | | – | | | | – | | | | 7,555,315 | |
Netherlands | | | – | | | | 6,814,611 | | | | – | | | | 6,814,611 | |
Norway | | | – | | | | 4,122,246 | | | | – | | | | 4,122,246 | |
Oman | | | – | | | | 2,269,142 | | | | – | | | | 2,269,142 | |
Philippines | | | 4,422,044 | | | | 8,939,381 | | | | – | | | | 13,361,425 | |
Russia | | | 785,000 | | | | – | | | | – | | | | 785,000 | |
Singapore | | | – | | | | 8,515,739 | | | | – | | | | 8,515,739 | |
South Africa | | | 13,167,569 | | | | 12,226,726 | | | | – | | | | 25,394,295 | |
South Korea | | | 1,507,707 | | | | 38,011,869 | | | | – | | | | 39,519,576 | |
Sweden | | | 8,230,737 | | | | 20,454,039 | | | | – | | | | 28,684,776 | |
Switzerland | | | 9,299,534 | | | | – | | | | – | | | | 9,299,534 | |
Taiwan | | | – | | | | 64,694,171 | | | | – | | | | 64,694,171 | |
Thailand | | | – | | | | 5,799,410 | | | | – | | | | 5,799,410 | |
Turkey | | | – | | | | 2,762,226 | | | | – | | | | 2,762,226 | |
United Arab Emirates | | | – | | | | 1,476,530 | | | | – | | | | 1,476,530 | |
United States | | | 4,546,377 | | | | – | | | | – | | | | 4,546,377 | |
Vietnam | | | 97,267 | | | | – | | | | – | | | | 97,267 | |
Preferred Stocks | | | | | | | | | | | | | | | | |
Brazil | | | 3,013,781 | | | | – | | | | – | | | | 3,013,781 | |
Exchange-Traded Funds | | | | | | | | | | | | | | | | |
United States | | | 4,174,396 | | | | – | | | | – | | | | 4,174,396 | |
| | | | | | | | | | | | | | | | | |
Total | | $ | 272,410,724 | | | $ | 514,094,165 | | | $ | 2,070,865 | | | $ | 788,575,754 | |
| | | | | | | | | | | | | | | | | |
| | |
56 | | 1.855.377.7325 | www.GrandeurPeakGlobal.com |
| | |
| Grandeur Peak Funds® | | Notes to Financial Statements |
April 30, 2015
The Funds recognize transfers between levels as of the end of the period. For the fiscal year ended April 30, 2015, the Funds had the following transfers between Level 1 and Level 2 securities. The most frequent, although not exclusive, cause of common stocks to be transferred between level 1 and 2 is due to whether the foreign securities in the Funds are fair value priced on the last day of the period (i.e. when the S&P 500 moves +/- 1% on the day, the foreign securities are re-priced as of 4:00pm EST based on a historic pricing algorithm performed by a third-party service).
The Grandeur Peak Emerging Markets Opportunities Fund had the following transfers out of Levels 1 and 2 at January 31, 2015:
| | | | | | | | | | | | | | | | |
| | | Level 1 - Quoted and Unadjusted Prices | | | Level 2 - Quoted and Unadjusted Prices | |
| | | Transfers In | | | Transfers (Out) | | | Transfers In | | | Transfers (Out) | |
Common Stocks | | $ | – | | | $ | (199,923,935 | ) | | $ | 199,923,935 | | | $ | – | |
Total | | $ | – | | | $ | (199,923,935 | ) | | $ | 199,923,935 | | | $ | – | |
| | | | | | | | | | | | | | | | | |
The Grandeur Peak Global Opportunities Fund had the following transfers out of Levels 1 and 2 at April 30, 2015:
| | | | | | | | | | | | | | | | |
| | | Level 1 - Quoted and Unadjusted Prices | | | Level 2 - Quoted and Unadjusted Prices | |
| | | Transfers In | | | Transfers (Out) | | | Transfers In | | | Transfers (Out) | |
Common Stocks | | $ | – | | | $ | (258,963,312 | ) | | $ | 258,963,312 | | | $ | – | |
Total | | $ | – | | | $ | (258,963,312 | ) | | $ | 258,963,312 | | | $ | – | |
| | | | | | | | | | | | | | | | | |
The Grandeur Peak Global Reach Fund had the following transfers out of Levels 1 and 2 at April 30, 2015:
| | | | | | | | | | | | | | | | |
| | | Level 1 - Quoted and Unadjusted Prices | | | Level 2 - Quoted and Unadjusted Prices | |
| | | Transfers In | | | Transfers (Out) | | | Transfers In | | | Transfers (Out) | |
Common Stocks | | $ | – | | | $ | (104,050,564 | ) | | $ | 104,050,564 | | | $ | – | |
Total | | $ | – | | | $ | (104,050,564 | ) | | $ | 104,050,564 | | | $ | – | |
| | | | | | | | | | | | | | | | | |
The Grandeur Peak International Opportunities Fund had the following transfers out of Levels 1 and 2 at April 30, 2015:
| | | | | | | | | | | | | | | | |
| | | Level 1 - Quoted and Unadjusted Prices | | | Level 2 - Quoted and Unadjusted Prices | |
| | | Transfers In | | | Transfers (Out) | | | Transfers In | | | Transfers (Out) | |
Common Stocks | | $ | – | | | $ | (400,904,010 | ) | | $ | 400,904,010 | | | $ | – | |
Total | | $ | – | | | $ | (400,904,010 | ) | | $ | 400,904,010 | | | $ | – | |
| | | | | | | | | | | | | | | | | |
The following is a reconciliation of the investments in which significant unobservable inputs (Level 3) were used in determining fair value:
| | | | | | | | |
| Grandeur Peak Emerging Markets Opportunities Fund | | Common Stock | | | Total | |
| | | | |
Balance as of April 30, 2014 | | $ | 2,701,643 | | | $ | 2,701,643 | |
Accrued discount/ premium | | | – | | | | – | |
Return of Capital | | | – | | | | – | |
Realized Gain/(Loss) | | | (3,600,143) | | | | (3,600,143) | |
Change in Unrealized Appreciation/(Depreciation) | | | 1,999,089 | | | | 1,999,089 | |
Purchases | | | 67,350 | | | | 67,350 | |
Sales Proceeds | | | (1,117,257) | | | | (1,117,257) | |
Transfer into Level 3 | | | 1,603,828 | | | | 1,603,828 | |
Transfer out of Level 3 | | | – | | | | – | |
| | | | |
Balance as of April 30, 2015 | | $ | 1,654,510 | | | $ | 1,654,510 | |
| | | | |
Net change in unrealized appreciation/(depreciation) included in the Statements of Operations attributable to Level 3 investments held at April 30, 2015 | | $ | 140,396 | | | $ | 140,396 | |
| | |
Annual Report | April 30, 2015 | | 57 |
| | |
| Grandeur Peak Funds® | | Notes to Financial Statements |
April 30, 2015
| | | | | | | | |
| Grandeur Peak Global Opportunities Fund | | Common Stock | | | Total | |
| | | | |
Balance as of April 30, 2014 | | $ | 4,062,331 | | | $ | 4,062,331 | |
Accrued discount/premium | | | – | | | | – | |
Return of Capital | | | – | | | | – | |
Realized Gain/(Loss) | | | (4,554,082) | | | | (4,554,082) | |
Change in Unrealized Appreciation/(Depreciation) | | | 2,439,772 | | | | 2,439,772 | |
Purchases | | | 151,292 | | | | 151,292 | |
Sales Proceeds | | | (2,091,220) | | | | (2,091,220) | |
Transfer into Level 3 | | | 2,529,956 | | | | 2,529,956 | |
Transfer out of Level 3 | | | – | | | | – | |
| | | | |
Balance as of April 30, 2015 | | $ | 2,538,049 | | | $ | 2,538,049 | |
| | | | |
Net change in unrealized appreciation/(depreciation) included in the Statements of Operations attributable to Level 3 investments held at April 30, 2015 | | $ | 27,697 | | | $ | 27,697 | |
| | |
| Grandeur Peak Global Reach Fund | | Common Stock | | | Total | |
| | | | |
Balance as of April 30, 2014 | | $ | 941,990 | | | $ | 941,990 | |
Accrued discount/ premium | | | – | | | | – | |
Return of Capital | | | – | | | | – | |
Realized Gain/(Loss) | | | (981,178) | | | | (981,178) | |
Change in Unrealized Appreciation/(Depreciation) | | | 441,078 | | | | 441,078 | |
Purchases | | | 25,856 | | | | 25,856 | |
Sales Proceeds | | | (408,190) | | | | (408,190) | |
Transfer into Level 3 | | | 686,462 | | | | 686,462 | |
Transfer out of Level 3 | | | – | | | | – | |
| | | | |
Balance as of April 30, 2015 | | $ | 706,018 | | | $ | 706,018 | |
| | | | |
Net change in unrealized appreciation/(depreciation) included in the Statements of Operations attributable to Level 3 investments held at April 30, 2015 | | $ | (261,615) | | | $ | (261,615) | |
| | |
| Grandeur Peak International Opportunities Fund | | Common Stock | | | Total | |
| | | | |
Balance as of April 30, 2014 | | $ | 4,769,152 | | | $ | 4,769,152 | |
Accrued discount/premium | | | – | | | | – | |
Return of Capital | | | – | | | | – | |
Realized Gain/(Loss) | | | (5,797,627) | | | | (5,797,627) | |
Change in Unrealized Appreciation/(Depreciation) | | | 3,053,656 | | | | 3,053,656 | |
Purchases | | | 17,792 | | | | 17,792 | |
Sales Proceeds | | | (2,028,988) | | | | (2,028,988) | |
Transfer into Level 3 | | | 2,056,880 | | | | 2,056,880 | |
Transfer out of Level 3 | | | – | | | | – | |
| | | | |
Balance as of April 30, 2015 | | $ | 2,070,865 | | | $ | 2,070,865 | |
| | | | |
Net change in unrealized appreciation/(depreciation) included in the Statements of Operations attributable to Level 3 investments held at April 30, 2015 | | $ | (23,304) | | | $ | (23,304) | |
Net change in unrealized appreciation/depreciation on Level 3 securities is included on the Statements of Assets and Liabilities under Net unrealized appreciation on investments and translation of assets and liabilities in foreign currencies. Due to the lack of a market to trade a newly acquired security, a price was unobtainable and was transferred to a level 3 security for all Funds.
| | |
58 | | 1.855.377.7325 | www.GrandeurPeakGlobal.com |
| | |
| Grandeur Peak Funds® | | Notes to Financial Statements |
April 30, 2015
The table below provided additional information about the Level 3 Fair Value Measurements as of April 30, 2015:
Quantitative Information about Level 3 Fair Value Measurements
Grandeur Peak Emerging Markets Opportunities Fund
| | | | | | | | | | | | | | |
| Asset Class | | Fair Value (USD)
at 4/30/15 | | | Valuation Technique | | | Unobservable Inputs(a) | | Value | |
Foreign Common Stock | | $ | 1,654,510 | | | | Premium on last quoted exchange price | | | Premium | | | 10 | % |
Grandeur Peak Global Opportunities Fund
| | | | | | | | | | | | | | |
| Asset Class | | Fair Value (USD)
at 4/30/15 | | | Valuation Technique | | | Unobservable Inputs(a) | | Value | |
Foreign Common Stock | | $ | 2,538,049 | | | | Premium on last quoted exchange price | | | Premium | | | 10 | % |
Grandeur Peak Global Reach Fund
| | | | | | | | | | | | | | |
| Asset Class | | Fair Value (USD)
at 4/30/15 | | | Valuation Technique | | | Unobservable Inputs(a) | | Value | |
Foreign Common Stock | | $ | 706,018 | | | | Premium on last quoted exchange price | | | Premium | | | 10 | % |
Grandeur Peak International Opportunities Funds
| | | | | | | | | | | | | | |
Asset Class | | Fair Value (USD)
at 4/30/15 | | | Valuation Technique | | | Unobservable Inputs(a) | | Value | |
Foreign Common Stock | | $ | 2,070,865 | | | | Premium on last quoted exchange price | | | Premium | | | 10 | % |
| (a) | A change to the unobservable input may result in a significant change to the value of the investment as follows: |
| | | | |
| Unobservable Input | | Impact to Value if Input Increases | | Impact to Value if Input Decreases |
Premium | | Increase | | Decrease |
Investment Transactions and Investment Income: Investment transactions are accounted for on the date the investments are purchased or sold (trade date). Realized gains and losses from investment transactions are reported on an identified cost basis. Interest income, which includes accretion of discounts and amortization of premiums, is accrued and recorded as earned. Dividend income is recognized on the ex-dividend date or for certain foreign securities, as soon as information is available to the Funds. All of the realized and unrealized gains and losses and net investment income, are allocated daily to each class in proportion to its average daily net assets.
Cash Management Transactions: The Funds subscribe to the Brown Brothers Harriman & Co. (“BBH”) Cash Management Service (“CMS”), whereby cash balances are automatically swept into overnight offshore demand deposits with either the BBH Grand Cayman branch or a branch of a pre-approved commercial bank. This fully automated program allows the Funds to earn interest on cash balances. Excess cash with deposit institutions domiciled outside of the U.S. are subject to sovereign actions in the jurisdiction of the deposit institution including, but not limited to, freeze, seizure or diminution. Cash balances in the BBH CMS are included on the Statements of Assets and Liabilities under Cash and Foreign Cash, at Value. As of April 30, 2015, the Funds had the following cash balances participating in the BBH CMS:
| | | | |
| Fund | | | |
Grandeur Peak Emerging Markets Opportunities Fund | | $ | 34,352,042 | |
Grandeur Peak Global Opportunities Fund | | | 5,452,333 | |
Grandeur Peak Global Reach Fund | | | 4,140,132 | |
Grandeur Peak International Opportunities Fund | | | 49,090,714 | |
| | |
Annual Report | April 30, 2015 | | 59 |
| | |
| Grandeur Peak Funds® | | Notes to Financial Statements |
April 30, 2015
As of April 30, 2015, the Funds had the following foreign cash balances participating in the BBH CMS (cost and value of foreign cash balances are equal):
| | | | |
| Fund | | | |
Grandeur Peak Emerging Markets Opportunities Fund | | $ | 30 | |
Grandeur Peak Global Opportunities Fund | | | 10,015 | |
Grandeur Peak Global Reach Fund | | | 283,631 | |
Grandeur Peak International Opportunities Fund | | | 905,282 | |
Foreign Securities: The Funds may directly purchase securities of foreign issuers. Investing in securities of foreign issuers involves special risks not typically associated with investing in securities of U.S. issuers. The risks include possible reevaluation of currencies, the inability to repatriate foreign currency, less complete financial information about companies and possible future adverse political and economic developments. Moreover, securities of many foreign issuers and their markets may be less liquid and their prices more volatile than those of securities of comparable U.S. issuers.
Foreign Currency Translation: The books and records of the Funds are maintained in U.S. dollars. Investment valuations and other assets and liabilities initially expressed in foreign currencies are converted each business day into U.S. dollars based upon current exchange rates. Prevailing foreign exchange rates may generally be obtained at the close of the NYSE (normally, 4:00 p.m. Eastern Time). The portion of realized and unrealized gains or losses on investments due to fluctuations in foreign currency exchange rates is not separately disclosed and is included in realized and unrealized gains or losses on investments, when applicable.
Foreign Currency Spot Contracts: The Funds may enter into foreign currency spot contracts to facilitate transactions in foreign securities or to convert foreign currency receipts into U.S. dollars. A foreign currency spot contract is an agreement between two parties to buy and sell currencies at the current market rate, for settlement generally within two business days. The U.S. dollar value of the contracts is determined using current currency exchange rates supplied by a pricing service.
The contract is marked-to-market daily for settlements beyond one day and any change in market value is recorded as an unrealized gain or loss. When the contract is closed, a realized gain or loss is recorded equal to the difference between the value on the open and close date. Losses may arise from changes in the value of the foreign currency, or if the counterparties do not perform under the contract’s terms. The maximum potential loss from such contracts is the aggregate face value in U.S. dollars at the time the contract was opened.
Trust Expenses: Some expenses of the Trust can be directly attributed to the Funds. Expenses which cannot be directly attributed to the Funds are apportioned among all funds in the Trust based on average net assets of each fund.
Fund and Class Expenses: Expenses that are specific to a Fund or class of shares of a Fund are charged directly to that Fund or share class. Expenses that are common to all Funds generally are allocated among the Funds in proportion to their average daily net assets. Fees provided under the distribution (Rule 12b-1) and/or shareholder service plans for a particular class of the Funds are charged to the operations of such class.
Offering Costs: Offering costs, including costs of printing initial prospectuses, legal and registration fees, are amortized over twelve months from the inception date of the Funds. As of April 30, 2015, the Funds fully amortized all offering costs.
Federal Income Taxes: The Funds comply with the requirements under Subchapter M of the Internal Revenue Code of 1986, as amended, applicable to regulated investment companies and intend to distribute substantially all of their net taxable income and net capital gains, if any, each year so that it will not be subject to excise tax on undistributed income and gains. The Funds are not subject to income taxes to the extent such distributions are made.
As of and during the year ended April 30, 2015, the Grandeur Peak Emerging Markets Opportunities Fund, the Grandeur Peak Global Opportunities Fund, the Grandeur Peak Global Reach Fund, and the Grandeur Peak International Opportunities Fund had a liability for unrecognized capital gains tax in the amount of $598,797, $725,970, $411,508, and $730,034 respectively. The Funds file U.S. federal, state, and local tax returns as required. The Funds’ tax returns are subject to examination by the relevant tax authorities until expiration of the applicable statute of limitations, which is generally three years after the filing of the tax return for federal purposes and four years for most state returns. Tax returns for open years have incorporated no uncertain tax positions that require a provision for income taxes.
Distributions to Shareholders: Each Fund normally pays dividends and distributes capital gains, if any, on an annual basis. Income dividend distributions are derived from interest and other income each Fund receives from their investments, including short term capital gains. Long term capital gain distributions are derived from gains realized when each Fund sells a security it has owned for more than a year. Each Fund may make
| | |
60 | | 1.855.377.7325 | www.GrandeurPeakGlobal.com |
| | |
| Grandeur Peak Funds® | | Notes to Financial Statements |
April 30, 2015
additional distributions and dividends at other times if the portfolio manager believes doing so may be necessary for each Fund to avoid or reduce taxes. The Funds intend to pass through foreign tax credits to shareholders.
3. TAX BASIS INFORMATION
Reclassifications: As of April 30, 2015, permanent differences in book and tax accounting were reclassified. These differences had no effect on net assets and are primarily attributed to the differing book/tax treatment of foreign currency transactions, non-deductible expenses, PFIC investments, book/tax distribution differences and certain other investments. The reclassifications were as follows:
| | | | | | | | | | | | |
| Fund | | Paid-in Capital | | | Accumulated Net
Investment
Income/(Loss) | | | Accumulated Net
Realized Gain/(Loss) on
Investments | |
Grandeur Peak Emerging Markets Opportunities Fund | | $ | (23,597) | | | $ | (1,568,829) | | | $ | 1,592,426 | |
Grandeur Peak Global Opportunities Fund | | | – | | | | 338,583 | | | | (338,583) | |
Grandeur Peak Global Reach Fund | | | (6,791) | | | | (145,248) | | | | 152,039 | |
Grandeur Peak International Opportunities Fund | | | 1 | | | | (299,592) | | | | 299,591 | |
Tax Basis of Investments: As of April 30, 2015, the aggregate cost of investments, gross unrealized appreciation/(depreciation) and net unrealized appreciation for Federal tax purposes was as follows:
| | | | | | | | | | | | | | | | | | | | |
| | | Gross Appreciation
(excess of value over
tax cost) | | | Gross Depreciation
(excess of tax cost
over value) | | | Net Depreciation of
Foreign Currency | | | Net
Unrealized
Appreciation | | | Cost of Investments
for Income Tax
Purposes | |
Grandeur Peak Emerging Markets Opportunities Fund | | $ | 71,803,217 | | | $ | (33,034,879) | | | $ | (585,864) | | | $ | 38,182,474 | | | $ | 384,588,544 | |
Grandeur Peak Global Opportunities Fund | | | 177,951,835 | | | | (46,153,502 | ) | | | (733,104 | ) | | | 131,065,229 | | | | 588,109,182 | |
Grandeur Peak Global Reach Fund | | | 49,153,043 | | | | (21,273,245 | ) | | | (397,318 | ) | | | 27,482,480 | | | | 312,218,405 | |
Grandeur Peak International Opportunities Fund | | | 182,714,047 | | | | (61,000,659 | ) | | | (615,161 | ) | | | 121,098,227 | | | | 666,862,366 | |
Components of Earnings: As of April 30, 2015, components of distributable earnings on a tax basis were as follows:
| | | | | | | | | | | | | | | | | | | | |
| | | Undistributed
Ordinary Income | | | Accumulated Capital
Gains | | | Other Accumulated
Loss | | | Net Unrealized
Appreciation on
Investments and
Foreign Currency | | | Total Distributable
Earnings | |
Grandeur Peak Emerging Markets Opportunities Fund | | $ | – | | | $ | 13,091,570 | | | $ | (7,764,688) | | | $ | 38,182,474 | | | $ | 43,509,356 | |
Grandeur Peak Global Opportunities Fund | | | 3,094,344 | | | | 29,278,298 | | | | – | | | | 131,065,229 | | | | 163,437,871 | |
Grandeur Peak Global Reach Fund | | | 3,531,390 | | | | 4,664,903 | | | | (105 | ) | | | 27,482,480 | | | | 35,678,668 | |
Grandeur Peak International Opportunities Fund | | | 2,896,078 | | | | 28,796,865 | | | | – | | | | 121,098,227 | | | | 152,791,170 | |
Capital Losses: As of April 30, 2015, the Funds have no accumulated capital loss carryforwards.
Tax Basis of Distributions to Shareholders: The character of distributions made during the year from net investment income or net realized gains may differ from its ultimate characterization for federal income tax purposes. Also, due to the timing of dividend distributions, the fiscal year in which amounts are distributed may differ from the fiscal year in which the income or realized gain were recorded by the Funds.
The tax character of distributions paid by the Funds for the fiscal year and or period ended April 30, 2015 were as follows:
| | | | | | | | |
| | | Ordinary Income | | | Long-Term Capital
Gain | |
Grandeur Peak Emerging Markets Opportunities Fund | | $ | 10,934,864 | | | $ | 44,691 | |
Grandeur Peak Global Opportunities Fund | | | 9,456,832 | | | | 37,925,629 | |
Grandeur Peak Global Reach Fund | | | 3,157,372 | | | | 885,418 | |
Grandeur Peak International Opportunities Fund | | | 19,542,293 | | | | 32,521,839 | |
| | |
Annual Report | April 30, 2015 | | 61 |
| | |
| Grandeur Peak Funds® | | Notes to Financial Statements |
April 30, 2015
The tax character of distributions paid by the Funds for the fiscal year and or period ended April 30, 2014 were as follows:
| | | | | | | | |
| | | Ordinary Income | | | Long-Term Capital
Gain | |
Grandeur Peak Emerging Markets Opportunities Fund | | $ | – | | | $ | – | |
Grandeur Peak Global Opportunities Fund | | | 12,405,055 | | | | 12,289,718 | |
Grandeur Peak Global Reach Fund | | | 520,818 | | | | – | |
Grandeur Peak International Opportunities Fund | | | 16,309,161 | | | | 4,623,208 | |
The Fund elects to defer to the period ending April 30, 2016, capital losses recognized during the period November 1, 2014 to April 30, 2015 in the amount of:
| | | | |
| Fund | | Capital Losses Recognized | |
Grandeur Peak Emerging Markets Opportunities | | $ | 6,385,642 | |
The Fund elects to defer to the period ending April 30, 2016, late year ordinary losses in the amount of:
| | | | |
| Fund | | Ordinary Losses Recognized | |
Grandeur Peak Emerging Markets Opportunities | | $ | 1,379,046 | |
4. SECURITIES TRANSACTIONS
The cost of purchases and proceeds from sales of securities (excluding short term securities) during the year ended April 30, 2015 were as follows:
| | | | | | | | |
| Fund | | Purchases of Securities | | | Proceeds From Sales of
Securities | |
Grandeur Peak Emerging Markets Opportunities Fund | | $ | 297,849,644 | | | $ | 193,582,148 | |
Grandeur Peak Global Opportunities Fund | | | 256,013,945 | | | | 289,906,826 | |
Grandeur Peak Global Reach Fund | | | 302,470,528 | | | | 112,274,875 | |
Grandeur Peak International Opportunities Fund | | | 276,611,506 | | | | 267,117,199 | |
5. SHARES OF BENEFICIAL INTEREST
The capitalization of the Trust consists of an unlimited number of shares of beneficial interest with no par value per share. Holders of the shares of the Funds of the Trust have one vote for each share held and a proportionate fraction of a vote for each fractional share. All shares issued and outstanding are fully paid and are transferable and redeemable at the option of the shareholder. Purchasers of the shares do not have any obligation to make payments to the Trust or its creditors (other than the purchase price for the shares) or make contributions to the Trust or its creditors solely by reason of the purchasers’ ownership of the shares. Shares have no pre-emptive rights.
Shares redeemed within 60 days of purchase may incur a 2% short-term redemption fee deducted from the redemption amount. For the year ended April 30, 2015 and the year ended April 30, 2014, the redemption fees charged by the Funds are presented in the Statements of Changes in Net Assets.
6. MANAGEMENT AND RELATED-PARTY TRANSACTIONS
Grandeur Peak Global Advisors, LLC (the “Adviser” or “Grandeur Peak Global Advisors”), subject to the authority of the Board, is responsible for the overall management and administration of the Funds’ business affairs. The Adviser manages the investments of the Funds in accordance with the Funds’ investment objective, policies and limitations and investment guidelines established jointly by the Adviser and the Trustees. Pursuant to the Advisory Agreement, (the “Advisory Agreement”), each Fund pays the Adviser an annual management fee based on each Fund’s average daily net assets. The management fee is paid on a monthly basis. The following table reflects the Funds’ advisory fee rates.
| | |
| Fund | | Advisory Fee |
Grandeur Peak Emerging Markets Opportunities Fund | | 1.35% |
Grandeur Peak Global Opportunities Fund | | 1.25% |
Grandeur Peak Global Reach Fund | | 1.10% |
Grandeur Peak International Opportunities Fund | | 1.25% |
| | |
62 | | 1.855.377.7325 | www.GrandeurPeakGlobal.com |
| | |
| Grandeur Peak Funds® | | Notes to Financial Statements |
April 30, 2015
With respect to the Grandeur Peak Global Opportunities Fund and the Grandeur Peak International Opportunities Fund, the Adviser has contractually agreed to limit certain of each Fund’s expenses to 1.75% of the Fund’s average daily net assets in the Investor Class shares and 1.50% of the Fund’s average daily net assets in the Institutional Class shares until August 31, 2015. With respect to the Grandeur Peak Emerging Markets Opportunities Fund, the Adviser has contractually agreed to limit certain of the Fund’s expenses to 1.95% of the Fund’s average daily net assets in the Investor Class shares and 1.70% of the Fund’s average daily net assets in the Institutional Class shares until August 31, 2015. With respect to the Grandeur Peak Global Reach Fund, the Adviser has contractually agreed to limit certain of the Fund’s expenses to 1.60% of the Fund’s average daily net assets in the Investor Class shares and 1.35% of the Fund’s average daily net assets in the Institutional Class shares until August 31, 2015. Pursuant to these agreements, each Fund will reimburse the Adviser for any fee waivers and expense reimbursements made by the Adviser, provided that any such reimbursements made by the Funds to the Adviser will not cause the Funds’ expense limitation to exceed expense limitations in existence at the time the expense was incurred, or at the time of the reimbursement, whichever is lower, and the reimbursement is made within three years after the expenses were incurred.
For the year ended April 30, 2015, the fee waivers and/or reimbursements were as follows:
| | | | | | | | | | | | |
| Fund | | Fees Waived/Reimbursed
By Adviser | | | Recoupment of Previously,
Waived Fees
By Adviser | | | Total | |
Grandeur Peak Emerging Markets Opportunities Fund | | | | | | | | | | | | |
Investor Class | | $ | – | | | $ | 3,666 | | | $ | 3,666 | |
Institutional Class | | | – | | | | 35,532 | | | | 35,532 | |
Grandeur Peak Global Opportunities Fund | | | | | | | | | | | | |
Investor Class | | $ | – | | | $ | – | | | $ | – | |
Institutional Class | | | – | | | | – | | | | – | |
Grandeur Peak Global Reach Fund | | | | | | | | | | | | |
Investor Class | | $ | – | | | $ | 4,963 | | | $ | 4,963 | |
Institutional Class | | | – | | | | 16,148 | | | | 16,148 | |
Grandeur Peak International Opportunities Fund | | | | | | | | | | | | |
Investor Class | | $ | – | | | $ | – | | | $ | – | |
Institutional Class | | | – | | | | – | | | | – | |
As of April 30, 2015, the balances of recoupable expenses for each Fund were as follows:
| | | | | | | | |
| Fund | | Expires 2017 | | | Total | |
Grandeur Peak Emerging Markets Opportunities Fund | | | | | | | | |
Investor Class | | $ | – | | | $ | – | |
Institutional Class | | | – | | | | – | |
Grandeur Peak Global Opportunities Fund | | | | | | | | |
Investor Class | | $ | – | | | $ | – | |
Institutional Class | | | – | | | | – | |
Grandeur Peak Global Reach Fund | | | | | | | | |
Investor Class | | $ | 45,810 | | | $ | 45,810 | |
Institutional Class | | | 98,313 | | | | 98,313 | |
Grandeur Peak International Opportunities Fund | | | | | | | | |
Investor Class | | $ | – | | | $ | – | |
Institutional Class | | | – | | | | – | |
Administrator Fees and Expenses
ALPS Fund Services, Inc. (“ALPS”) serves as administrator to the Funds and the Funds have agreed to pay expenses incurred in connection with their administrative activities. Pursuant to an Administrative Agreement, ALPS provides operational services to the Funds including, but not limited to, fund accounting and fund administration and generally assists in the Funds’ operations. Officers of the Trust are employees of ALPS. The Funds’ administration fee is accrued on a daily basis and paid monthly. Administration fees paid by the Funds for the year ended April 30, 2015 are disclosed in the Statements of Operations.
ALPS is reimbursed by the Fund for certain out-of-pocket expenses.
| | |
Annual Report | April 30, 2015 | | 63 |
| | |
| Grandeur Peak Funds® | | Notes to Financial Statements |
April 30, 2015
Transfer Agent
ALPS serves as transfer, dividend paying and shareholder servicing agent for the Funds. ALPS receives an annual minimum fee, a fee based upon the number of shareholder accounts, and is also reimbursed by the Funds for certain out-of-pocket expenses.
Compliance Services
ALPS provides services that assist the Trust’s chief compliance officer in monitoring and testing the policies and procedures of the Trust in conjunction with requirements under Rule 38a-1 under the 1940 Act and receives an annual base fee. ALPS is reimbursed for certain out-of-pocket expenses by the Funds.
Principal Financial Officer
ALPS receives an annual fee for providing principal financial officer services to the Funds.
Distributor: ALPS Distributors, Inc. (“ADI” or the “Distributor”) (an affiliate of ALPS) acts as the distributor of the Funds’ shares pursuant to a Distribution Agreement with the Trust. Shares are sold on a continuous basis by ADI as agent for the Funds, and ADI has agreed to use its best efforts to solicit orders for the sale of each Fund’s shares, although it is not obliged to sell any particular amount of shares. ADI is not entitled to any compensation for its services as Distributor. ADI is registered as a broker-dealer with the Securities and Exchange Commission.
Each Fund has adopted a Distribution and Services (12b-1) Plan pursuant to Rule 12b-1 of the 1940 Act (the “Plan”) for its Investor Class shares. The Plan allows the Funds to use Investor Class assets to pay fees in connection with the distribution and marketing of Investor Class shares and/or the provision of shareholder services to Investor Class shareholders. The Plan permits payment for services in connection with the administration of plans or programs that use Investor Class shares of each Fund as their funding medium and for related expenses. The Plan permits the Funds to make total payments at an annual rate of up to 0.25% of each Fund’s average daily net assets attributable to its Investor Class shares. The expenses of the Plan are reflected as distribution and service fees in the Statement of Operations.
7. INDEMNIFICATIONS
Under the Trust’s organizational documents, its officers and Trustees are indemnified against certain liability arising out of the performance of their duties to the Trust. Additionally, in the normal course of business, the Trust enters into contracts with service providers that may contain general indemnification clauses, which may permit indemnification to the extent permissible under applicable law. The Trust’s maximum exposure under these arrangements is unknown, as this would involve future claims that may be made against the Trust that have not yet occurred.
| | |
64 | | 1.855.377.7325 | www.GrandeurPeakGlobal.com |
| | |
| Grandeur Peak Funds® | | Report of Independent Registered
Public Accounting Firm |
To the Shareholders and Board of Trustees of Financial Investors Trust:
We have audited the accompanying statements of assets and liabilities, including the portfolios of investments, of Grandeur Peak Emerging Markets Opportunities Fund, Grandeur Peak Global Opportunities Fund, Grandeur Peak Global Reach Fund, and Grandeur Peak International Opportunities Fund (the “Funds”), four of the portfolios constituting Financial Investors Trust, as of April 30, 2015, the related statements of operations for the year then ended, the statements of changes in net assets for each of the two years in the period then ended, and the financial highlights for each of the periods presented (as to the Grandeur Peak Emerging Markets Opportunities Fund, the related statements of changes in net assets for the year then ended and for the period from December 16, 2013 (inception) to April 30, 2014) (as to the Grandeur Peak Global Reach Fund, the related statements of changes in net assets for the year then ended and for the period from June 19, 2013 (inception) to April 30, 2014). These financial statements and financial highlights are the responsibility of the Funds’ management. Our responsibility is to express an opinion on these financial statements and financial highlights based on our audits.
We conducted our audits in accordance with the standards of the Public Company Accounting Oversight Board (United States). Those standards require that we plan and perform the audit to obtain reasonable assurance about whether the financial statements and financial highlights are free of material misstatement. The Funds are not required to have, nor were we engaged to perform, an audit of their internal control over financial reporting. Our audits included consideration of internal control over financial reporting as a basis for designing audit procedures that are appropriate in the circumstances, but not for the purpose of expressing an opinion on the effectiveness of the Funds’ internal control over financial reporting. Accordingly, we express no such opinion. An audit also includes examining, on a test basis, evidence supporting the amounts and disclosures in the financial statements, assessing the accounting principles used and significant estimates made by management, as well as evaluating the overall financial statement presentation. Our procedures included confirmation of securities owned as of April 30, 2015, by correspondence with the custodian and brokers; where replies were not received from brokers, we performed other auditing procedures. We believe that our audits provide a reasonable basis for our opinion.
In our opinion, the financial statements and financial highlights referred to above present fairly, in all material respects, the financial position of Grandeur Peak Emerging Markets Opportunities Fund, Grandeur Peak Global Opportunities Fund, Grandeur Peak Global Reach Fund, and Grandeur Peak International Opportunities Fund of Financial Investors Trust as of April 30, 2015, and the results of their operations, the changes in their net assets, and the financial highlights for the periods presented in conformity with accounting principles generally accepted in the United States of America.
DELOITTE & TOUCHE LLP
Denver, Colorado
June 26, 2015
| | |
Annual Report | April 30, 2015 | | 65 |
| | |
Grandeur Peak Funds® | | Disclosure Regarding Approval of Fund Advisory Agreement |
April 30, 2015 (Unaudited)
GRANDEUR PEAK EMERGING MARKETS OPPORTUNITIES FUND
On March 12, 2013, the Trustees met in person to discuss, among other things, the approval of the Investment Advisory Agreement between the Trust and Grandeur Peak Global Advisors, LLC (“Grandeur Peak”) (the “Investment Advisory Agreement”) in accordance with Section 15(c) of the 1940 Act. The Independent Trustees met with independent legal counsel during executive session and discussed the Investment Advisory Agreement and other related materials.
In approving the Investment Advisory Agreement with Grandeur Peak, the Trustees, including the Independent Trustees, considered the following factors with respect to the Grandeur Peak Emerging Markets Opportunities Fund (the “Grandeur Peak Fund” or the “Fund”):
Investment Advisory Fee Rate: The Trustees reviewed and considered the contractual annual advisory fee to be paid by the Trust, on behalf of the Grandeur Peak Fund, to Grandeur Peak of 1.35% of the Grandeur Peak Fund’s daily average net assets, in light of the extent and quality of the advisory services to be provided by Grandeur Peak to the Fund.
The Trustees considered the information they received comparing the Grandeur Peak Fund’s contractual annual advisory fee and overall expenses with those of funds in both the relevant expense group and universe of funds provided by an independent provider of investment company data.
Based on such information, the Trustees determined that the contractual annual advisory fee of 1.35% and the total expense ratio of 1.70% and 1.95% for the Institutional Class and Investor Class Shares, respectively, of the Grandeur Peak Fund, taking into account the contractual fee waiver in place, are comparable to others within the Fund’s anticipated peer universe.
Nature, Extent and Quality of the Services under the Investment Advisory Agreement: The Trustees received and considered information regarding the nature, extent and quality of services to be provided to the Grandeur Peak Fund under the Investment Advisory Agreement. The Trustees reviewed certain background materials supplied by Grandeur Peak in its presentation, including its Form ADV.
The Trustees reviewed and considered Grandeur Peak’s investment advisory personnel, its history as an asset manager and its performance and the amount of assets currently under management. The Trustees also reviewed the research and decision-making processes utilized by Grandeur Peak, including the methods adopted to seek to achieve compliance with the investment objectives, policies and restrictions of the Grandeur Peak Fund.
The Trustees considered the background and experience of Grandeur Peak’s management in connection with the Grandeur Peak Fund, including reviewing the qualifications, backgrounds and responsibilities of the management team primarily responsible for the day-to-day portfolio management of the Grandeur Peak Fund and the extent of the resources devoted to research and analysis of actual and potential investments.
The Trustees also reviewed, among other things, Grandeur Peak’s insider trading policies and procedures and its Code of Ethics.
Performance: The Trustees noted that since the Grandeur Peak Fund has not yet begun operations, there is no fund performance to be reviewed or analyzed at this time. The Trustees also considered the limitations on the comparability of performance information for certain related funds and accounts. The Trustees considered Grandeur Peak’s reputation generally and its investment techniques, risk management controls and decision-making processes.
The Adviser’s Profitability: The Trustees received and considered a projected profitability analysis prepared by Grandeur Peak based on the fees payable under the Investment Advisory Agreement. The Trustees considered the profits, if any, anticipated to be realized by Grandeur Peak in connection with the operation of the Grandeur Peak Fund. The Board then reviewed and discussed Grandeur Peak’s financial statements in order to analyze the financial condition and stability and profitability of the adviser.
Economies of Scale: The Trustees considered whether economies of scale in the provision of services to the Grandeur Peak Fund will be passed along to the shareholders under the proposed agreement.
Other Benefits to the Adviser: The Trustees reviewed and considered any other incidental benefits derived or to be derived by Grandeur Peak from its relationship with the Grandeur Peak Fund, including soft dollar arrangements.
| | |
66 | | 1.855.377.7325 | www.GrandeurPeakGlobal.com |
| | |
Grandeur Peak Funds® | | Disclosure Regarding Approval of Fund Advisory Agreement |
April 30, 2015 (Unaudited)
The Board summarized its deliberations with respect to the Investment Advisory Agreement with Grandeur Peak. In selecting Grandeur Peak and the fees charged under the Investment Advisory Agreement, the Trustees concluded that no single factor reviewed by the Trustees was identified by the Trustees to be determinative as the principal factor in whether to approve the Investment Advisory Agreement. Further, the Independent Trustees were advised by separate independent legal counsel throughout the process. The Trustees, including all of the Independent Trustees, concluded that:
| | · | | the investment advisory fees to be received by Grandeur Peak with respect to the Grandeur Peak Fund were comparable to others within the Fund’s peer universe; |
| | · | | the nature, extent and quality of services to be rendered by Grandeur Peak under the Investment Advisory Agreement were adequate; |
| | · | | there was no performance history for the Grandeur Peak Fund for the Board to consider; |
| | · | | the terms of the proposed fee waiver and expense limitation agreement between the Trust, on behalf of the Grandeur Peak Fund, and Grandeur Peak, were not unreasonable; |
| | · | | the profit, if any, anticipated to be realized by Grandeur Peak in connection with the operation of the Grandeur Peak Fund is not unreasonable to the Fund; and |
| | · | | there were no material economies of scale or other incidental benefits accruing to Grandeur Peak in connection with its relationship to the Grandeur Peak Fund. |
Based on the Trustees’ deliberations and their evaluation of the information described above, the Trustees, including all of the Independent Trustees, concluded that Grandeur Peak’s compensation for investment advisory services is consistent with the best interests of the Grandeur Peak Fund and its shareholders.
| | |
Annual Report | April 30, 2015 | | 67 |
| | |
| Grandeur Peak Funds® | | Additional Information |
April 30, 2015 (Unaudited)
1. FUND HOLDINGS
The Funds file their complete schedule of portfolio holdings with the Securities and Exchange Commission (the “SEC”) for the first and third quarters of each fiscal year on Form N-Q within 60 days after the end of the period. Copies of the Funds’ Form N-Q are available without charge on the SEC website at http://www.sec.gov. You may also review and copy the Form N-Q at the SEC’s Public Reference Room in Washington, DC. For more information about the operation of the Public Reference Room, please call the SEC at 1-800-SEC-0330.
2. FUND PROXY VOTING POLICIES, PROCEDURES AND SUMMARIES
The Funds’ policies and procedures used in determining how to vote proxies and information regarding how the Funds voted proxies relating to portfolio securities during the most recent prior 12-month period ending June 30 are available without charge, (1) upon request, by calling (toll-free) 855-377-PEAK(7325) and (2) on the SEC’s website at http://www.sec.gov.
3. TAX DESIGNATIONS
The Funds designate the following for federal income tax purposes for distributions made during the fiscal year ended April 30, 2015:
| | | | | | | | | | | | | | | | |
| | | Global
Opportunities Fund | | | International
Opportunities Fund | | | Global Reach Fund | | | Emerging Markets
Opportunities Fund | |
Foreign Taxes Paid | | $ | 575,310 | | | $ | 1,291,979 | | | $ | 541,661 | | | $ | 2,057,767 | |
Foreign Source Income | | $ | 9,248,141 | | | $ | 13,809,339 | | | $ | 3,245,614 | | | $ | 8,161,036 | |
Of the distributions paid by the Funds from ordinary income for the calendar year ended December 31, 2014, the following percentages met the requirements to be treated as qualifying for the corporate dividends received deduction and qualified dividend income:
| | | | | | | | |
| | | Global
Opportunities Fund | | International
Opportunities Fund | | Global Reach Fund | | Emerging Markets
Opportunities Fund |
Dividend Received Deduction | | 12.31% | | 0.14% | | 5.76% | | — |
Qualified Dividend Income | | 70.25% | | 40.22% | | 50.85% | | 22.81% |
In early 2015, if applicable, shareholders of record received this information for the distributions paid to them by the Funds during the calendar year 2014 via Form 1099. The Funds will notify shareholders in early 2016 of amounts paid to them by the Funds, if any, during the calendar year 2015.
Pursuant to Section 852(b)(3) of the Internal Revenue Code, Grandeur Peak Global Opportunities Fund, Grandeur Peak International Opportunities Fund, Grandeur Peak Global Reach Fund, and Grandeur Peak Emerging Markets Opportunity Fund designated $37,925,629, $32,521,839, $885,418, and $44,691 respectively, as long-term capital gain dividends.
| | |
68 | | 1.855.377.7325 | www.GrandeurPeakGlobal.com |
| | |
| Grandeur Peak Funds® | | Trustees and Officers |
April 30, 2015 (Unaudited)
Additional information regarding the Fund’s trustees is included in the Statement of Additional Information, which can be obtained without charge by calling 855-377-PEAK.
INDEPENDENT TRUSTEES
| | | | | | | | | | |
Name, Address* & Year of Birth | | Position(s) Held with Fund | | Term of Office and Length of Time Served** | | Principal Occupation(s) During Past 5 Years*** | | Number of Funds in Fund Complex Overseen by Trustee**** | | Other Directorships
Held by Trustee
During Past 5 Years |
Mary K. Anstine, 1940 | | Trustee | | Ms. Anstine was elected at a special meeting of shareholders held on March 21, 1997 and re-elected at a special meeting of shareholders held on August 7, 2009. | | Ms. Anstine was formerly an Executive Vice President of First Interstate Bank of Denver until 1994, President/Chief Executive Officer of HealthONE Alliance, Denver, Colorado, from 1994 to 2004, and has been retired since 2004. Ms. Anstine is also Trustee/Director of AV Hunter Trust and Colorado Uplift Board. Ms. Anstine was formerly a Director of the Trust Bank of Colorado (later purchased and now known as Northern Trust Bank), HealthONE and Denver Area Council of the Boy Scouts of America, and a member of the American Bankers Association Trust Executive Committee. | | 30 | | Ms. Anstine is a Trustee of ALPS ETF Trust (18 funds); ALPS Variable Investment Trust (9 funds); Reaves Utility Income Fund (1 fund); and Westcore Trust (12 funds). |
John R. Moran, Jr., 1930 | | Trustee | | Mr. Moran was elected at a special meeting of shareholders held on March 21, 1997 and re-elected at a special meeting of shareholders held on August 7, 2009. | | Mr. Moran formerly served as President and CEO of The Colorado Trust, a private foundation serving the health and hospital community in the state of Colorado, from 1991 to 2007. During his career as an attorney from 1958 to 1991, Mr. Moran was formerly a partner with the firm of Kutak Rock & Campbell in Denver, Colorado and a member of the Colorado House of Representatives. Currently, Mr. Moran is a member of the Treasurer’s Investment Advisory Committee for the University of Colorado. | | 30 | | None. |
| * | All communications to Trustees and Officers may be directed to Financial Investors Trust c/o 1290 Broadway, Suite 1100, Denver, CO 80203. |
| ** | This is the period for which the Trustee or Officer began serving the Trust. Each Trustee and/or Officer serves an indefinite term, until his successor is elected. Officers are elected on an annual basis. |
| *** | Except as otherwise indicated, each individual has held the office shown or other offices in the same company for the last five years. |
| **** | The Fund Complex includes all series of the Trust (currently 30) and any other investment companies for which Grandeur Peak Global Advisors LLC provides investment advisory services (currently none). |
| | |
Annual Report | April 30, 2015 | | 69 |
| | |
| Grandeur Peak Funds® | | Trustees and Officers |
April 30, 2015 (Unaudited)
INDEPENDENT TRUSTEES
| | | | | | | | | | |
Name,
Address* &
Age | | Position(s)
Held with
Fund | | Term of Office
and Length of
Time Served** | | Principal Occupation(s)
During Past 5 Years*** | | Number of
Funds in
Fund
Complex
Overseen
by Trustee**** | | Other Directorships Held
by Trustee |
| | | | | |
Jeremy W. Deems, 1976 | | Trustee | | Mr. Deems was appointed as a Trustee at the March 11, 2008 meeting of the Board of Trustees and elected at a special meeting of shareholders held on August 7, 2009. | | Mr. Deems is the Co-Founder and Chief Financial Officer of Green Alpha Advisors, LLC, a registered investment advisor, and Co-Portfolio Manager of the Shelton Green Alpha Fund. Prior to joining Green Alpha Advisors, Mr. Deems was CFO and Treasurer of Forward Management, LLC, ReFlow Management Co., LLC, ReFlow Fund, LLC, a private investment fund, and Sutton Place Management, LLC, an administrative services company, from 1998 to June 2007. From 2004 to 2005, Mr Deems also served as Treasurer of the Forward Funds and the Sierra Club Funds. | | 30 | | Mr. Deems is a Trustee of ALPS ETF Trust (18 funds); ALPS Variable Investment Trust (9 funds) and Reaves Utility Income Fund (1 fund). |
| | | | | |
Jerry G. Rutledge, 1944 | | Trustee | | Mr. Rutledge was elected at a special meeting of shareholders held on August 7, 2009. | | Mr. Rutledge is the President and owner of Rutledge’s Inc., a retail clothing business. Mr. Rutledge is currently serving as a Director of the University of Colorado Hospital. Mr. Rutledge was from 1994 to 2007 a Regent of the University of Colorado. | | 30 | | Mr. Rutledge is a Trustee of Principal Real Estate Income Fund (1 fund), Clough Global Allocation Fund (1 fund), Clough Global Equity Fund (1 fund) and Clough Global Opportunities Fund (1 fund). |
| | | | | |
Michael “Ross” Shell, 1970 | | Trustee | | Mr. Shell was elected at a special meeting of shareholders held on August 7, 2009. | | Mr. Shell is Founder and CEO of Red Idea, LLC, a strategic consulting/early stage venture firm (since June 2008). From 1999 to 2009, he was a part-owner and Director of Tesser, Inc., a brand agency. From December 2005 to May 2008, he was Director, Marketing and Investor Relations, of Woodbourne, a REIT/real estate hedge fund and private equity firm. Prior to this, from May 2004 to November 2005, he worked as a business strategy consultant; from June 2003 to April 2004, he was on the Global Client Services team of IDEO, a product design/innovation firm; and from 1999 to 2003, he was President of Tesser, Inc. Mr. Shell graduated with honors from Stanford University with a degree in Political Science. | | 30 | | None. |
| * | All communications to Trustees and Officers may be directed to Financial Investors Trust c/o 1290 Broadway, Suite 1100, Denver, CO 80203. |
| ** | This is the period for which the Trustee or Officer began serving the Trust. Each Trustee and/or Officer serves an indefinite term, until his successor is elected. Officers are elected on an annual basis. |
| *** | Except as otherwise indicated, each individual has held the office shown or other offices in the same company for the last five years. |
| **** | The Fund Complex includes all series of the Trust (currently 30) and any other investment companies for which Grandeur Peak Global Advisors LLC provides investment advisory services (currently none). |
| | |
70 | | 1.855.377.7325 | www.GrandeurPeakGlobal.com |
| | |
| Grandeur Peak Funds® | | Trustees and Officers |
April 30, 2015 (Unaudited)
INTERESTED TRUSTEE
| | | | | | | | | | |
Name,
Address*
& Age | | Position(s)
Held with Fund | | Term of Office
and Length of
Time Served** | | Principal Occupation(s)
During Past 5 Years*** | | Number of Funds
in Fund Complex
Overseen by
Trustee**** | | Other Directorships Held
by Trustee |
| | | | | |
Edmund J. Burke, 1961 | | Trustee, Chairman and President | | Mr. Burke was elected as Chairman at the August 28, 2009 meeting of the Board of Trustees. Mr. Burke was elected as Trustee at a special meeting of shareholders held on August 7, 2009. Mr. Burke was elected President of the Trust at the December 17, 2002 meeting of the Board of Trustees. | | Mr. Burke is President and a Director of ALPS Holdings, Inc. (“AHI”) (since 2005) and Director of Boston Financial Data Services, Inc. (“BFDS”), ALPS Advisors, Inc. (“AAI”), ALPS Distributors, Inc. (“ADI”), ALPS Fund Services, Inc. (“AFS”) and ALPS Portfolio Solutions Distributor, Inc. (“APSD”) and from 2001-2008, was President of AAI, ADI, AFS and APSD. Because of his positions with AHI, BFDS, AAI, ADI, AFS and APSD, Mr. Burke is deemed an affiliate of the Trust as defined under the 1940 Act. Mr. Burke is Trustee and President of the Clough Global Allocation Fund (Trustee since 2006; President since 2004); Trustee and President of the Clough Global Equity Fund (Trustee since 2006; President since 2005); Trustee and President of the Clough Global Opportunities Fund (since 2006); Trustee of the Liberty All-Star Equity Fund; and Director of the Liberty All-Star Growth Fund, Inc. | | 35 | | Mr. Burke is a Trustee of Clough Global Allocation Fund (1 fund); Clough Global Equity Fund (1 fund); Clough Global Opportunities Fund (1 fund); Trustee of the Liberty All-Star Equity Fund (1 fund); and Director of the Liberty All-Star Growth Fund, Inc. (1 fund). |
| | |
Annual Report | April 30, 2015 | | 71 |
| | |
| Grandeur Peak Funds® | | Trustees and Officers |
April 30, 2015 (Unaudited)
OFFICERS
| | | | | | |
Name, Address* & Year of Birth | | Position(s) Held with Fund | | Term of Office and Length
of Time Served** | | Principal Occupation(s)
During Past 5 Years*** |
| | | |
Kimberly RStorms, 1972 | | Treasurer | | Ms. Storms was elected Treasurer of the Trust at the March 12, 2013 meeting of the Board of Trustees. | | Ms. Storms is Senior Vice President and Director of Fund Administration of ALPS. Because of her position with ALPS, Ms. Storms is deemed an affiliate of the Trust as defined under the 1940 Act. Ms. Storms is also Treasurer of Liberty All-Star Equity Fund and Liberty All-Star Growth Fund, Inc. and Chief Financial Officer of The Arbitrage Funds. |
| | | |
David T. Buhler, 1971 | | Secretary | | Mr. Buhler was elected Secretary of the Trust at the September 11, 2012 meeting of the Board of Trustees. | | Mr. Buhler joined ALPS in June 2010. He is currently Vice President and Senior Associate Counsel of ALPS, AAI, ADI and APSD. Prior to joining ALPS, Mr. Buhler served as Associate General Counsel and Assistant Secretary of Founders Asset Management LLC from 2006 to 2009. Because of his position with ALPS, Mr. Buhler is deemed an affiliate of the Trust as defined under the 1940 Act. Mr. Buhler is also the Secretary ALPS Variable Investment Trust, ALPS ETF Trust and Westcore Trust. |
| | | |
Ted Uhl, 1974 | | Chief Compliance
Officer (“CCO”) | | Mr. Uhl was appointed CCO of the Trust at the June 8, 2010 meeting of the Board of Trustees. | | Mr. Uhl joined ALPS in October 2006, and is currently Deputy Compliance Officer of ALPS. Prior to his current role, Mr. Uhl served as Senior Risk Manager for ALPS from October 2006 until June 2010. Because of his position with ALPS, Mr. Uhl is deemed an affiliate of the Trust as defined under the 1940 Act. Mr. Uhl is also CCO of the Clough Global Funds, Reaves Utility Income Fund, Centre Funds and Transparent Value Trust. |
| * | All communications to Trustees and Officers may be directed to Financial Investors Trust c/o 1290 Broadway, Suite 1100, Denver, CO 80203. |
| ** | This is the period for which the Trustee or Officer began serving the Trust. Each Trustee and/or Officer serves an indefinite term, until his successor is elected. Officers are elected on an annual basis. |
| *** | Except as otherwise indicated, each individual has held the office shown or other offices in the same company for the last five years. |
| | |
72 | | 1.855.377.7325 | www.GrandeurPeakGlobal.com |

TABLE OF CONTENTS
| | |
Pathway Advisors Funds | | Shareholder Letter |
| | April 30, 2015 (Unaudited) |
May 15, 2015
Dear Shareholder:
Below is a table of our year-to-date and one year performance as of 4/30/15. We’ve also included the annualized since inception return through the same period
| | | | | | |
| | | Year-To-Date | | 1 Year | | Since Inception |
Pathway Advisors Conservative | | 1.23% | | 3.28% | | 4.50% |
Pathway Advisors Aggressive Growth | | 2.88% | | 5.41% | | 11.82% |
The performance data quoted represents past performance. Past performance does not guarantee future results. The investment return and principal value of an investment will fluctuate so that an Investor’s shares, when redeemed, may not be worth more or less than their original cost and current performance may be lower or higher than the performance quoted. To obtain the most recent month-end performance data, please call 1-888-288-1121 or visit www.pathwayadvisorsfunds.com.
Hanson McClain, Inc. (the “Adviser”) has agreed contractually to limit the amount of the Fund’s total annual expenses, exclusive of Acquired Fund Fees and Expenses, brokerage expenses, interest expenses, taxes and extraordinary expenses, to 1.88% of the Fund’s average daily net assets. This agreement is in effect through August 31, 2015. The Adviser will be permitted to recover expenses it has borne through the agreement described above to the extent that the Fund’s expenses in later periods fall below the annual rates set forth in the relevant agreement. The Fund will not be obligated to pay any such deferred fees and expenses more than three years after the end of the fiscal year in which the fees and expense were deferred. The Adviser may not discontinue this waiver without the approval by the Fund’s Board of Trustees.
With the Federal Reserve’s complete removal of quantitative easing (QE) and with the European Central Bank (ECB) and the Bank of Japan (BOJ) doing aggressive QE, the world has diverged in terms of any coordinated monetary policy that existed post the financial crisis of 2008. Not only the removal of QE, but the expectation of tightening by the Fed, along with the asset purchases by the ECB and BOJ, have helped the US Dollar to surge relative to almost every other currency. This has also pushed bond yields in many parts of the developed world to near zero or negative, even for longer maturities. This is helped in part by negative deposit rates in Europe. The goal of such measures is to encourage spending and investment and discourage savings, the theory being that this will help bring back economic growth in areas that have struggled with deflation or are concerned about the potential for deflation.
With the US dollar appreciating and plenty of energy supply having come online due to innovations in fracking and horizontal drilling, a glut of worldwide oil supply relative to demand and historical production levels had downward pressure on oil prices. From June of last year to March of this year, we experienced more than a 50% drop in crude oil prices. Due to more high yield bond issuance coming from the energy sector, it’s not surprising that we also witnessed high yield to treasury spreads widen by more than 200 basis points, coinciding with the drop in oil prices. Since newer and smaller exploration and production companies require a higher dollar value per barrel to maintain profitability, a sharp drop in prices puts pressure on the financial health of these companies and shuts off potential new financing for companies that may need additional capital. Oil prices have since come back up near $60/barrel and spreads have tightened by more than 100
| | |
| Annual Report | April 30, 2015 | | 1 |
| | |
Pathway Advisors Funds | | Shareholder Letter |
| | April 30, 2015 (Unaudited) |
basis points while the US Dollar, as measured by the US Dollar Index, has dropped from over 100 to 94.14. This index was at just 80 last June.
With anticipation of the Federal Reserve raising rates, which we believe they will do, and with volatility remaining low, as measured by the Volatility Index (VIX) at 12.70, we believe that volatility will increase and we continue to stress the importance of diversification and to not have too much concentration in assets that are very expensive as these will likely fall harder and faster with the next correction or bear market that comes along. The current bull market has plowed forward with very few bouts of subdued volatility for more than 6 years and rates have been held at a zero bound for even longer. A rising tide has truly lifted nearly all boats for several years. At this stage in the cycle, we believe it prudent to re-emphasize quality investments over high-fliers and diversification over putting all of one’s eggs in one basket. We are grateful for the confidence and trust that you have placed in us and we will continue to do our best to navigate the challenging currents ahead on your behalf.
Sincerely,
David Schauer
Chief Investment Officer
The views and information discussed in this commentary are as of the date of publication, are subject to change, and may not reflect the writer’s current views. The views expressed represent an assessment of market conditions at a specific point in time, are opinions only and should not be relied upon as investment advice regarding a particular investment or markets in general. Such information does not constitute a recommendation to buy or sell specific securities or investment vehicles. It should not be assumed that any investment will be profitable or will equal the performance of the portfolios or any securities or any sectors mentioned in this letter. The subject matter contained in this letter has been derived from several sources believed to be reliable and accurate at the time of compilation. Neither Hanson McClain, Inc. nor the Funds accept any liability for losses either direct or consequential caused by the use of this information.
The Pathway Aggressive Growth Fund invests in underlying funds that use investment techniques and financial instruments that may be considered aggressive, including the use of futures contracts, options on futures contracts, securities and indices, forward contracts, swap agreements and similar instruments, exposes an underlying fund to potentially dramatic changes (losses) in the value of certain of its portfolio holdings.
The Pathway Conservative Fund invests in underlying funds that invest long or short in fixed-income securities subjects the Fund to additional risks that include credit risk, interest risk, maturity risk, investment-grade securities risk, municipal securities risk and prepayment risk. These risks could affect the value of a particular investment by the Fund, possibly causing the Fund’s share price and total return to be reduced and fluctuate more than other types of investments.
The Pathway Advisors Funds are distributed by ALPS Distributors, Inc.
Diversification does not assure a profit or protect against a loss.
| | |
| 2 | | www.pathwayadvisorsfunds.com |
| | |
Pathway Advisors Funds | | Shareholder Letter |
| | April 30, 2015 (Unaudited) |
The Volatility Index® is an index which measures expectations of volatility, or fluctuations in price, of the S&P 500® Total Return Index. Higher values for the volatility index indicate that investors expect the value of the S&P 500® Total Return Index to fluctuate wildly – up, down, or both – in the next 30 days. The Index is not actively managed and does not reflect any deduction for fees, expenses or taxes. An investor cannot invest directly in the Index.
The US Dollar Index (USDX, DXY) is an index (or measure) of the value of the United States dollar relative to a basket of foreign currencies, often referred to as a basket of US trade partners’ currencies. It is a weighted geometric mean of the dollar’s value relative to other select currencies. The Index is not actively managed and does not reflect any deduction for fees, expenses or taxes. An investor cannot invest directly in the Index.
Quantitative Easing – An unconventional monetary policy in which a central bank purchases government securities or other securities from the market in order to lower interest rates and increase the money supply.
Basis Point – A unit of measure used in finance to describe the percentage change in the value or rate of a financial instrument. One basis point is equivalent to 0.01% (1/100th of a percent) or 0.0001 in decimal form.
| | |
| Annual Report | April 30, 2015 | | 3 |
| | |
Pathway Advisors Conservative Fund | | Performance Update |
| | April 30, 2015 (Unaudited) |
Cumulative Total Return for the period ended April 30, 2015
| | | | | | |
| | | Calendar YTD | | One Year | | Since Inception* |
Pathway Advisors Conservative Fund | | 1.23% | | 3.28% | | 4.50% |
S&P 500® Total Return Index1 | | 1.92% | | 12.98% | | 18.53% |
Barclays Capital U.S. Aggregate Bond Index2 | | 2.21% | | 10.76% | | 14.96% |
Russell 2000® Index3 | | 1.65% | | 9.71% | | 18.63% |
| * | Fund inception date of July 30, 2012. |
The returns shown above do not reflect the deduction of taxes a shareholder would pay on Fund distributions or redemption of Fund shares.
Performance data quoted represents past performance. Past performance does not guarantee future results. Investment return and principal value of an investment will fluctuate so that an investor’s shares, when sold or redeemed, may be worth more or less than the original cost. Current performance data may be higher or lower than actual data quoted. For the most current month-end performance data, please call 1-888-288-1121 or visit www.pathwayadvisorsfunds.com.
| 1 | The S&P 500® Total Return Index is an unmanaged index of 500 common stocks chosen for the market size, liquidity and industry group representation. It is a market-value weighted index. The Index is not actively managed and does not reflect any deduction for fees, expenses or taxes. An investor may not invest directly into the Index. |
| 2 | The Barclays Capital U.S. Aggregate Bond Index is a market capitalization-weighted index, meaning the securities in the index are weighted according to the market size of each bond type. Most U.S. traded investment grade bonds are represented. Municipal bonds, and Treasury Inflation-Protected Securities are excluded, due to tax treatment issues. The Index includes Treasury securities, Government agency bonds, Mortgage-backed bonds, Corporate bonds, and a small amount of foreign bonds traded in U.S. The Index is not actively managed and does not reflect any deduction for fees, expenses or taxes. An investor may not invest directly into the Index. |
| 3 | The Russell 2000® Index measures the performance of the small-cap segment of the U.S. equity universe. The Russell 2000® Index is a subset of the Russell 3000® Index representing approximately 10% of the total market capitalization of that index. It includes approximately 2000 of the smallest securities based on a combination of their market cap and current index membership. The Index is not actively managed and does not reflect any deduction for fees, expenses or taxes. An investor may not invest directly into the Index. |
| | |
| 4 | | www.pathwayadvisorsfunds.com |
| | |
Pathway Advisors Conservative Fund | | Performance Update |
| | April 30, 2015 (Unaudited) |
Growth of $10,000 for the period ended April 30, 2015
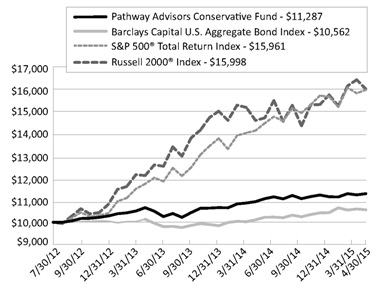
The graphs shown above represent a hypothetical investment of $10,000 in the Fund’s Investor Class shares for the period from inception to 4/30/15. All returns reflect reinvested dividends, but do not reflect the deduction of taxes that an investor would pay on distributions or redemptions.
| | |
| Annual Report | April 30, 2015 | | 5 |
| | |
Pathway Advisors Conservative Fund | | Performance Update |
| | April 30, 2015 (Unaudited) |
| | |
| Top Ten Long Holdings | | (as a % of Net Assets)* |
DoubleLine Total Return Bond Fund - Class I | | 13.79% |
iShares® Core U.S. Aggregate Bond ETF | | 13.69% |
Vanguard® Total Stock Market ETF | | 11.32% |
Metropolitan West Total Return Bond Fund - Class I | | 7.95% |
Goldman Sachs Strategic Income Fund - Institutional Class | | 6.15% |
Templeton Global Bond Fund - Advisor Class | | 5.91% |
Vanguard® Wellington Fund - Class Admiral | | 5.74% |
Vanguard® S&P 500® ETF | | 4.90% |
Loomis Sayles Bond Fund - Institutional Class | | 4.03% |
Hartford World Bond Fund - Class Y | | 3.96% |
Top Ten Holdings | | 77.44% |
Portfolio Allocation (as a % of Net Assets)*
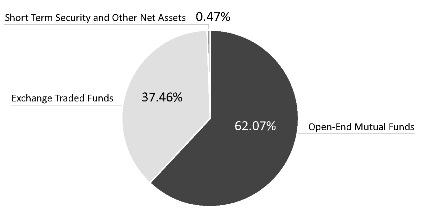
| * | Holdings are subject to change. |
| | |
| 6 | | www.pathwayadvisorsfunds.com |
| | |
Pathway Advisors Aggressive Growth Fund | | Performance Update |
| | April 30, 2015 (Unaudited) |
Cumulative Total Return for the period ended April 30, 2015
| | | | | | |
| | | Calendar YTD | | One Year | | Since Inception* |
Pathway Advisors Aggressive Growth Fund | | 2.88% | | 5.41% | | 11.82% |
MSCI EAFE® Index1 | | 9.16% | | 1.66% | | 14.08% |
S&P 500 Total Return Index2 | | 1.92% | | 12.98% | | 18.53% |
Russell 2000® Index3 | | 1.65% | | 9.71% | | 18.63% |
| * | Fund inception date of July 30, 2012. |
The returns shown above do not reflect the deduction of taxes a shareholder would pay on Fund distributions or redemption of Fund shares.
Performance data quoted represents past performance. Past performance does not guarantee future results. Investment return and principal value of an investment will fluctuate so that an investor’s shares, when sold or redeemed, may be worth more or less than the original cost. Current performance data may be higher or lower than actual data quoted. For the most current month-end performance data, please call 1-888-288-1121 or visit www.pathwayadvisorsfunds.com.
| 1 | MSCI EAFE® Index (Europe, Australasia, Far East) is a free float-adjusted market capitalization weighted index designed to measure developed market equity performance. The MSCI EAFE® Index is composed of companies representative of the market structure of Developed Market countries. The index includes reinvestment of dividends, net of foreign withholding taxes. The Index is not actively managed and does not reflect any deduction for fees, expenses or taxes. An investor may not invest directly into the Index. |
| 2 | The S&P 500® Total Return Index is an unmanaged index of 500 common stocks chosen for the market size, liquidity and industry group representation. It is a market-value weighted index. The Index is not actively managed and does not reflect any deduction for fees, expenses or taxes. An investor may not invest directly into the Index. |
| 3 | The Russell 2000® Index measures the performance of the small-cap segment of the U.S. equity universe. The Russell 2000® Index is a subset of the Russell 3000® Index representing approximately 10% of the total market capitalization of that index. It includes approximately 2000 of the smallest securities based on a combination of their market cap and current index membership. The Index is not actively managed and does not reflect any deduction for fees, expenses or taxes. An investor may not invest directly into the Index. |
Source: MSCI. MSCI makes no express or implied warranties or representations and shall have no liability whatsoever with respect to any MSCI data contained herein. The MSCI data may not be further redistributed or used to create indices or financial products. This report is not approved or produced by MSCI.
| | |
| Annual Report | April 30, 2015 | | 7 |
| | |
Pathway Advisors Aggressive Growth Fund | | Performance Update |
| | April 30, 2015 (Unaudited) |
Growth of $10,000 for the period ended April 30, 2015
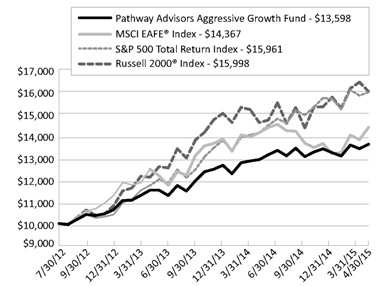
The graphs shown above represent a hypothetical investment of $10,000 in the Fund’s Investor Class shares for the period from inception 4/30/15. All returns reflect reinvested dividends, but do not reflect the deduction of taxes that an investor would pay on distributions or redemptions.
| | |
| 8 | | www.pathwayadvisorsfunds.com |
| | |
Pathway Advisors Aggressive Growth Fund | | Performance Update |
| | April 30, 2015 (Unaudited) |
| | |
| Top Ten Long Holdings | | (as a % of Net Assets)* |
Vanguard® Total Stock Market ETF | | 22.99% |
Vanguard® Total International Stock ETF | | 12.43% |
DoubleLine Total Return Bond Fund - Class I | | 9.75% |
Vanguard® S&P 500® ETF | | 9.53% |
Deutsche Global Infrastructure Fund - Institutional Class | | 6.17% |
Putnam Capital Spectrum Fund - Class Y | | 5.91% |
iShares® Dow Jones International Select Dividend Index Fund | | 5.05% |
Vanguard® FTSE Emerging Markets ETF | | 4.27% |
Akre Focus Fund - Institutional Class | | 4.06% |
iShares® Dow Jones Select Dividend Index Fund | | 3.86% |
Top Ten Holdings | | 84.02% |
Portfolio Allocation (as a % of Net Assets)*
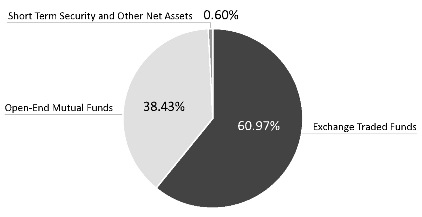
| * | Holdings are subject to change. |
| | |
| Annual Report | April 30, 2015 | | 9 |
| | |
Pathway Advisors Funds | | Disclosure of Fund Expenses |
| | April 30, 2015 (Unaudited) |
As a shareholder of a Fund, you incur two types of costs: direct costs, such as short-term redemption fees and wire fees, and indirect costs, including management fees, and other fund operating expenses. This example is intended to help you understand your indirect costs, also referred to as “ongoing costs” (in dollars), of investing in the Fund and to compare these costs with the ongoing costs of investing in other mutual funds.
This example is based on an investment of $1,000 invested at the beginning of the period and held for the entire six-month period of November 1, 2014 through April 30, 2015.
Actual Expenses The first line of the table below provides information about actual account values and actual expenses. You may use the information in this line, together with the amount you invested at the beginning of the period, to estimate the expenses that you paid over the period. Simply divide your account value by $1,000 (for example, an $8,600 account value divided by $1,000 = 8.6), then multiply the result by the number in the first line under the heading “Expenses Paid During Period” to estimate the expenses you paid on your account during this period.
Hypothetical Example for Comparison Purposes The second line of the table provides information about hypothetical account values and hypothetical expenses based on the Fund’s actual expense ratio and an assumed rate of return of 5% per year before expenses, which is not the Fund’s actual return. The hypothetical account values and expenses may not be used to estimate the actual ending account balance or expenses you paid for the period. You may use this information to compare ongoing costs of investing in the Fund and other funds. To do so, compare this 5% hypothetical example with the 5% hypothetical examples that appear in the shareholder reports of other funds.
Please note that the expenses shown in the table are meant to highlight your ongoing costs only and do not reflect any direct costs, such as wire fees or low balance fees. Therefore, the second line of the table is useful in comparing ongoing costs only and will not help you determine the relative total costs of owning different funds. In addition, if these direct costs were included, your costs would be higher.
| | | | | | | | |
| | | Beginning
Account Value
11/01/14 | | Ending
Account Value
04/30/15 | | Expense
Ratio(a) | | Expenses Paid
During Period
11/01/14-
04/30/15(b) |
Pathway Advisors Conservative Fund |
Actual | | $ 1,000.00 | | $ 1,011.80 | | 1.88% | | $ 9.38 |
Hypothetical | | | | | | | | |
(5% return before expenses) | | $ 1,000.00 | | $ 1,015.47 | | 1.88% | | $ 9.39 |
Pathway Advisors Aggressive Growth Fund |
Actual | | $ 1,000.00 | | $ 1,026.50 | | 1.88% | | $ 9.45 |
Hypothetical | | | | | | | | |
(5% return before expenses) | | $ 1,000.00 | | $ 1,015.47 | | 1.88% | | $ 9.39 |
| (a) | Annualized, based on the Funds’ most recent fiscal half year expenses. |
| (b) | Expenses are equal to the Fund’s annualized expense ratio multiplied by the average account value over the period, multiplied by the number of days in the most recent fiscal half-year (181)/365 (to reflect the half-year period). |
| | |
| 10 | | www.pathwayadvisorsfunds.com |
| | |
Pathway Advisors Conservative Fund | | Portfolio of Investments |
| | April 30, 2015 |
| | | | | | | | | | | | |
| Description | | | | | Shares | | | Value (Note 2) | |
EXCHANGE TRADED FUNDS (37.46%) | | | | | | | | | | | | |
iShares® Core U.S. Aggregate Bond ETF | | | | | | | 39,945 | | | $ | 4,428,302 | |
Schwab U.S. TIPs ETF™ | | | | | | | 18,000 | | | | 995,220 | |
Vanguard® FTSE Emerging Markets ETF | | | | | | | 16,655 | | | | 730,655 | |
Vanguard® S&P 500® ETF | | | | | | | 8,286 | | | | 1,583,455 | |
Vanguard® Total International Stock ETF | | | | | | | 13,593 | | | | 717,303 | |
Vanguard® Total Stock Market ETF | | | | | | | 33,934 | | | | 3,661,818 | |
| | | | | | | | | | | | |
TOTAL EXCHANGE TRADED FUNDS (Cost $11,905,861) | | | | | | | | | | | 12,116,753 | |
OPEN-END MUTUAL FUNDS (62.08%) | | | | | | | | | | | | |
Catalyst Hedged Futures Strategy Fund - Class I | | | | | | | 69,053 | | | | 741,630 | |
Deutsche Global Infrastructure Fund - Institutional Class | | | | | | | 46,445 | | | | 692,953 | |
DoubleLine Total Return Bond Fund - Class I | | | | | | | 405,647 | | | | 4,462,113 | |
Goldman Sachs Strategic Income Fund - Institutional Class | | | | | | | 197,940 | | | | 1,989,301 | |
Hartford World Bond Fund - Class Y | | | | | | | 121,983 | | | | 1,280,823 | |
Loomis Sayles Bond Fund - Institutional Class | | | | | | | 88,374 | | | | 1,304,393 | |
Metropolitan West Total Return Bond Fund - Class I | | | | | | | 234,344 | | | | 2,570,750 | |
Osterweis Strategic Income Fund - Class I | | | | | | | 109,069 | | | | 1,263,019 | |
PIMCO All Asset All Authority Fund - Institutional Class | | | | | | | 80,627 | | | | 755,473 | |
Putnam Capital Spectrum Fund - Class Y | | | | | | | 32,770 | | | | 1,254,429 | |
Templeton Global Bond Fund - Advisor Class | | | | | | | 153,685 | | | | 1,910,306 | |
Vanguard® Wellington Fund - Class Admiral | | | | | | | 27,067 | | | | 1,855,154 | |
| | | | | | | | | | | | |
TOTAL OPEN-END MUTUAL FUNDS (Cost $20,082,833) | | | | | | | | | | | 20,080,344 | |
| | | 7-Day
Yield | | | Shares | | | Value
(Note 2) | |
SHORT TERM INVESTMENTS (0.13%) | | | | | | | | | | | | |
Dreyfus Cash Management, Institutional Shares | | | 0.040 | % | | | 42,360 | | | | 42,360 | |
| | | | | | | | | | | | |
TOTAL SHORT TERM INVESTMENTS (Cost $42,360) | | | | | | | | | | | 42,360 | |
TOTAL INVESTMENTS (99.67%) (Cost $32,031,054) | | | | | | | | | | $ | 32,239,457 | |
Other Assets In Excess Of Liabilities (0.33%) | | | | | | | | | | | 108,286 | |
NET ASSETS (100.00%) | | | | | | | | | | $ | 32,347,743 | |
| | |
Common Abbreviations:
ETF - Exchange Traded Fund.
FTSE - Financial Times and Stock Exchange.
PIMCO - Pacific Investment Management Company, LLC.
S&P - Standard & Poor’s.
TIPS - Treasury Inflation Protected Securities.
Holdings are subject to change.
See Notes to Financial Statements.
| | |
| Annual Report | April 30, 2015 | | 11 |
| | |
Pathway Advisors Aggressive Growth Fund | | Portfolio of Investments |
| | April 30, 2015 |
| | | | | | | | | | | | |
| Description | | | | | Shares | | | Value
(Note 2) | |
EXCHANGE TRADED FUNDS (60.97%) | | | | | | | | | | | | |
iShares® International Select Dividend Index ETF | | | | | | | 56,720 | | | | $ 1,986,902 | |
iShares® Select Dividend Index ETF | | | | | | | 19,387 | | | | 1,518,584 | |
Vanguard® FTSE Emerging Markets ETF | | | | | | | 38,336 | | | | 1,681,800 | |
Vanguard® S&P 500® ETF | | | | | | | 19,640 | | | | 3,753,204 | |
Vanguard® Total International Stock ETF | | | | | | | 92,724 | | | | 4,893,045 | |
Vanguard® Total Stock Market ETF | | | | | | | 83,887 | | | | 9,052,247 | |
WisdomTree® Emerging Markets SmallCap Dividend Fund | | | | | | | 23,947 | | | | 1,119,283 | |
TOTAL EXCHANGE TRADED FUNDS (Cost $23,247,763) | | | | | | | | | | | 24,005,065 | |
OPEN-END MUTUAL FUNDS (38.43%) | | | | | | | | | | | | |
Akre Focus Fund - Institutional Class | | | | | | | 68,289 | | | | 1,596,604 | |
Catalyst Hedged Futures Strategy Fund - Class I | | | | | | | 126,879 | | | | 1,362,677 | |
Deutsche Global Infrastructure Fund - Institutional Class | | | | | | | 162,687 | | | | 2,427,296 | |
DoubleLine Total Return Bond Fund - Class I | | | | | | | 349,084 | | | | 3,839,924 | |
Osterweis Strategic Income Fund - Class I | | | | | | | 65,898 | | | | 763,099 | |
PIMCO All Asset All Authority Fund - Institutional Class | | | | | | | 139,163 | | | | 1,303,956 | |
Principal MidCap Fund - Institutional Class | | | | | | | 65,207 | | | | 1,508,891 | |
Putnam Capital Spectrum Fund - Class Y | | | | | | | 60,761 | | | | 2,325,940 | |
TOTAL OPEN-END MUTUAL FUNDS (Cost $14,988,498) | | | | | | | | | | | 15,128,387 | |
| | | 7-Day
Yield | | | Shares | | | Value
(Note 2) | |
SHORT TERM INVESTMENTS (0.78%) | | | | | | | | | | | | |
Dreyfus Cash Management, Institutional Shares | | | 0.040 | % | | | 307,944 | | | | 307,944 | |
TOTAL SHORT TERM INVESTMENTS (Cost $307,944) | | | | | | | | | | | 307,944 | |
TOTAL INVESTMENTS (100.18%) (Cost $38,544,205) | | | | | | | | | | $ | 39,441,396 | |
Liabilities in Excess of Other Assets (-0.18%) | | | | | | | | | | | (70,896) | |
NET ASSETS (100.00%) | | | | | | | | | | $ | 39,370,500 | |
| | | | | | | | | | | | | |
Common Abbreviations:
ETF - Exchange Traded Fund.
FTSE - Financial Times and Stock Exchange.
PIMCO - Pacific Investment Management Company, LLC.
S&P - Standard & Poor’s.
Holdings are subject to change.
See Notes to Financial Statements.
| | |
| 12 | | www.pathwayadvisorsfunds.com |
| | |
Pathway Advisors Funds | | Statements of Assets and Liabilities |
| | April 30, 2015 |
| | | | | | | | |
| | | Pathway Advisors
Conservative Fund | | | Pathway Advisors
Aggressive Growth
Fund | |
ASSETS | | | | | | | | |
Investments, at value | | $ | 32,239,457 | | | $ | 39,441,396 | |
Receivable for investments sold | | | 150,000 | | | | – | |
Dividends receivable | | | 22,770 | | | | 13,008 | |
Other assets | | | 3,728 | | | | 3,447 | |
Total assets | | | 32,415,955 | | | | 39,457,851 | |
LIABILITIES | | | | | | | | |
Investment advisory fees payable | | | 19,126 | | | | 26,390 | |
Distributions and service fees payable | | | 17,236 | | | | 26,811 | |
Payable for trustee fees and expenses | | | 93 | | | | 150 | |
Payable for chief compliance officer fees | | | 1,610 | | | | 1,939 | |
Payable for principal financial officer fees | | | 382 | | | | 465 | |
Payable for administration fees | | | 7,567 | | | | 9,059 | |
Payable for transfer agency fees | | | 4,058 | | | | 4,599 | |
Payable for professional fees | | | 12,568 | | | | 12,595 | |
Payable for custody fees | | | 833 | | | | 833 | |
Payable for reports to shareholders | | | 461 | | | | 711 | |
Accrued expenses and other liabilities | | | 4,278 | | | | 3,799 | |
Total liabilities | | | 68,212 | | | | 87,351 | |
NET ASSETS | | $ | 32,347,743 | | | $ | 39,370,500 | |
| | |
| | |
NET ASSETS CONSIST OF | | | | | | | | |
Paid-in capital (Note 5) | | $ | 32,026,530 | | | $ | 38,342,600 | |
Accumulated net investment income/(loss) | | | 13,927 | | | | (36,521) | |
Accumulated net realized gain on investments | | | 98,883 | | | | 167,230 | |
Net unrealized appreciation on investments | | | 208,403 | | | | 897,191 | |
NET ASSETS | | $ | 32,347,743 | | | $ | 39,370,500 | |
| | |
INVESTMENTS, AT COST | | $ | 32,031,054 | | | $ | 38,544,205 | |
PRICING OF SHARES | | | | | | | | |
Net Asset Value, offering and redemption price per share | | $ | 10.66 | | | $ | 12.16 | |
Net Assets | | $ | 32,347,743 | | | $ | 39,370,500 | |
Shares of beneficial interest outstanding (unlimited number of shares, no par value common stock authorized) | | | 3,033,100 | | | | 3,236,511 | |
See Notes to Financial Statements.
| | |
| Annual Report | April 30, 2015 | | 13 |
| | |
Pathway Advisors Funds | | Statements of Operations |
| | For the Year Ended April 30, 2015 |
| | | | | | | | |
| | | Pathway Advisors Conservative Fund | | | Pathway Advisors Aggressive Growth Fund | |
INVESTMENT INCOME | | | | | | | | |
Dividends from other investment companies | | $ | 285,487 | | | $ | 438,519 | |
Total investment income | | | 285,487 | | | | 438,519 | |
| | |
EXPENSES | | | | | | | | |
Investment advisory fees (Note 6) | | | 95,949 | | | | 178,286 | |
Administration fees | | | 36,146 | | | | 68,389 | |
Transfer agency fees | | | 32,445 | | | | 36,774 | |
Distribution and service fees | | | 35,983 | | | | 62,647 | |
Professional fees | | | 13,971 | | | | 14,813 | |
Custody fees | | | 5,157 | | | | 5,161 | |
Reports to shareholders | | | 909 | | | | 1,758 | |
Trustee fees and expenses | | | 264 | | | | 489 | |
Registration fees | | | 21,600 | | | | 21,772 | |
Chief compliance officer fees | | | 5,814 | | | | 10,912 | |
Principal financial officer fees | | | 1,397 | | | | 2,625 | |
Other | | | 4,320 | | | | 3,824 | |
Total expenses before waivers | | | 253,955 | | | | 407,450 | |
Less fees waived/reimbursed by investment advisor (Note 6) | | | (73,567) | | | | (72,255) | |
Total net expenses | | | 180,388 | | | | 335,195 | |
NET INVESTMENT INCOME | | | 105,099 | | | | 103,324 | |
Net realized gain on investments | | | 177,216 | | | | 1,154,117 | |
Net realized capital gain distributions from other investment companies | | | 33,763 | | | | 74,206 | |
Net change in unrealized appreciation/(depreciation) on investments | | | 70,829 | | | | (115,782) | |
NET REALIZED AND UNREALIZED GAIN ON INVESTMENTS | | | 281,808 | | | | 1,112,541 | |
NET INCREASE IN NET ASSETS RESULTING FROM OPERATIONS | | $ | 386,907 | | | $ | 1,215,865 | |
| | |
See Notes to Financial Statements.
| | |
| 14 | | www.pathwayadvisorsfunds.com |
| | |
Pathway Advisors Conservative Fund | | Statements of Changes in Net Assets |
| | |
| | | | | | | | |
| | | For the Year Ended
April 30, 2015 | | | For the Year Ended
April 30, 2014 | |
OPERATIONS | | | | | | | | |
Net investment income | | $ | 105,099 | | | $ | 52,229 | |
Net realized gain/(loss) on investments | | | 177,216 | | | | (9,884) | |
Net realized capital gain distributions from other investment companies | | | 33,763 | | | | 26,283 | |
Net change in unrealized appreciation on investments | | | 70,829 | | | | 113,990 | |
Net increase in net assets resulting from operations | | | 386,907 | | | | 182,618 | |
DISTRIBUTIONS (NOTE 3) | | | | | | | | |
Net investment income | | | (107,965) | | | | (43,119) | |
Net realized gains on investments | | | (122,319) | | | | (9,256) | |
Net decrease in net assets from distributions | | | (230,284) | | | | (52,375) | |
BENEFICIAL INTEREST TRANSACTIONS (NOTE 5) | | | | | | | | |
Shares sold | | | 29,628,281 | | | | 4,685,131 | |
Dividends reinvested | | | 230,284 | | | | 52,374 | |
Shares redeemed | | | (3,090,468) | | | | (808,445) | |
Net increase in net assets derived from beneficial interest transactions | | | 26,768,097 | | | | 3,929,060 | |
Net increase in net assets | | | 26,924,720 | | | | 4,059,303 | |
NET ASSETS: | | | | | | | | |
Beginning of period | | | 5,423,023 | | | | 1,363,720 | |
End of period* | | $ | 32,347,743 | | | $ | 5,423,023 | |
| | | | | | | | | |
* Includes accumulated net investment income of: | | $ | 13,927 | | | $ | 16,518 | |
See Notes to Financial Statements.
| | |
| Annual Report | April 30, 2015 | | 15 |
| | |
Pathway Advisors Aggressive Growth Fund | | Statements of Changes in Net Assets |
| | |
| | | | | | | | |
| | | For the Year Ended
April 30, 2015 | | | For the Year Ended
April 30, 2014 | |
OPERATIONS | | | | | | | | |
Net investment income | | $ | 103,324 | | | $ | 80,975 | |
Net realized gain on investments | | | 1,154,117 | | | | 40,254 | |
Net realized capital gain distributions from other investment companies | | | 74,206 | | | | 73,997 | |
Net change in unrealized appreciation/(depreciation) on investments | | | (115,782) | | | | 944,050 | |
| |
Net increase in net assets resulting from operations | | | 1,215,865 | | | | 1,139,276 | |
| |
DISTRIBUTIONS (NOTE 3) | | | | | | | | |
Net investment income | | | (150,330) | | | | (92,205) | |
Net realized gains on investments | | | (1,134,772) | | | | (35,419) | |
| |
Net decrease in net assets from distributions | | | (1,285,102) | | | | (127,624) | |
| |
BENEFICIAL INTEREST TRANSACTIONS (NOTE 5) | | | | | | | | |
Shares sold | | | 31,104,559 | | | | 15,021,195 | |
Dividends reinvested | | | 1,285,089 | | | | 127,625 | |
Shares redeemed | | | (9,573,718) | | | | (1,115,620) | |
| |
Net increase in net assets derived from beneficial interest transactions | | | 22,815,930 | | | | 14,033,200 | |
| |
Net increase in net assets | | | 22,746,693 | | | | 15,044,852 | |
NET ASSETS: | | | | | | | | |
Beginning of period | | | 16,623,807 | | | | 1,578,955 | |
| |
End of period* | | $ | 39,370,500 | | | $ | 16,623,807 | |
| |
| |
* Includes accumulated net investment loss of: | | $ | (36,521) | | | | - | |
See Notes to Financial Statements.
| | |
16 | | www.pathwayadvisorsfunds.com |
| | |
Pathway Advisors Conservative Fund | | Financial Highlights |
| | For a share outstanding throughout the periods presented. |
| | | | | | | | | | | | | | | | | | | |
| | | For the Year
Ended
April 30, 2015 | | | | For the Year
Ended
April 30, 2014 | | | | For the Period
Ended
April 30, 2013(a) |
| | | | | |
NET ASSET VALUE, BEGINNING OF PERIOD | | | $ | 10.61 | | | | | | $ | 10.51 | | | | | | $ | 10.00 | |
INCOME FROM OPERATIONS | | | | | | | | | | | | | | | | | | | |
Net investment income(b) | | | | 0.12 | | | | | | | 0.16 | | | | | | | 0.14 | |
Net realized and unrealized gain on investments | | | | 0.23 | | | | | | | 0.10 | | | | | | | 0.52 | |
| | | | | | | | | | | | | | | | | | | |
Total from Investment Operations | | | | 0.35 | | | | | | | 0.26 | | | | | | | 0.66 | |
| | | | | | | | | | | | | | | | | | | |
| | | | | |
LESS DISTRIBUTIONS | | | | | | | | | | | | | | | | | | | |
Net investment income | | | | (0.14) | | | | | | | (0.13) | | | | | | | (0.13) | |
Net realized gain on investments | | | | (0.16) | | | | | | | (0.03) | | | | | | | (0.02) | |
| | | | | | | | | | | | | | | | | | | |
Total Distributions | | | | (0.30) | | | | | | | (0.16) | | | | | | | (0.15) | |
| | | | | | | | | | | | | | | | | | | |
NET INCREASE IN NET ASSET VALUE | | | | 0.05 | | | | | | | 0.10 | | | | | | | 0.51 | |
| | | | | | | | | | | | | | | | | | | |
NET ASSET VALUE, END OF PERIOD | | | $ | 10.66 | | | | | | $ | 10.61 | | | | | | $ | 10.51 | |
| | | | | | | | | | | | | | | | | | | |
TOTAL RETURN(c) | | | | 3.28% | | | | | | | 2.53% | | | | | | | 6.59% | |
| | | | | |
RATIOS/SUPPLEMENTAL DATA | | | | | | | | | | | | | | | | | | | |
Net assets, End of Period (000s) | | | $ | 32,348 | | | | | | $ | 5,423 | | | | | | $ | 1,364 | |
RATIOS TO AVERAGE NET ASSETS: | | | | | | | | | | | | | | | | | | | |
Operating Expenses: | | | | | | | | | | | | | | | | | | | |
Excluding reimbursement/waiver(d) | | | | 2.65% | | | | | | | 4.84% | | | | | | | 49.62% | (e)(f) |
Including reimbursement/waiver(d) | | | | 1.88% | | | | | | | 1.91% | (g) | | | | | | 1.98% | (e)(f) |
Net investment income including reimbursement/waiver(d) | | | | 1.10% | | | | | | | 1.57% | | | | | | | 1.83% | (e) |
PORTFOLIO TURNOVER RATE | | | | 50% | | | | | | | 38% | | | | | | | 18% | (h) |
| (a) | The Fund commenced operations on July 31, 2012. |
| (b) | Calculated using the average shares method. |
| (c) | Total investment return is calculated assuming a purchase of a common share at the opening of the first day and a sale at closing on the last day of each period reported. Dividends and distributions, if any, are assumed for purposes of this calculation to be reinvested at prices obtained under the Fund’s dividend reinvestment plan. Total returns would have been lower had certain expenses not been waived during the period. Total investment returns do not reflect brokerage commissions, if any, and are not annualized. |
| (d) | The ratios exclude the impact of expenses of the underlying funds in which the Fund invests as represented in the Portfolio of Investments. |
| (f) | Expense ratios before reductions for startup periods may not be representative of longer term operating periods. |
| (g) | Contractual expense limitation changed from 1.98% to 1.88% effective October 1, 2013. |
See Notes to Financial Statements.
| | |
Annual Report | April 30, 2015 | | 17 |
| | |
Pathway Advisors Aggressive Growth Fund | | Financial Highlights |
| | For a share outstanding throughout the periods presented. |
| | | | | | | | | | | | |
| | | For the Year Ended
April 30, 2015 | | | For the Year Ended April 30, 2014 | | | For the Period Ended April 30, 2013(a) | |
| | | |
NET ASSET VALUE, BEGINNING OF PERIOD | | $ | 12.65 | | | $ | 11.40 | | | $ | 10.00 | |
INCOME FROM OPERATIONS | | | | | | | | | | | | |
Net investment income(b) | | | 0.07 | | | | 0.10 | | | | 0.03 | |
Net realized and unrealized gain on investments | | | 0.58 | | | | 1.27 | | | | 1.47 | |
| | | | | | | | | | | | |
Total from Investment Operations | | | 0.65 | | | | 1.37 | | | | 1.50 | |
| | | | | | | | | | | | |
| | | |
LESS DISTRIBUTIONS | | | | | | | | | | | | |
Net investment income | | | (0.13) | | | | (0.09) | | | | (0.08) | |
Net realized gain on investments | | | (1.01) | | | | (0.03) | | | | (0.02) | |
| | | | | | | | | | | | |
Total Distributions | | | (1.14) | | | | (0.12) | | | | (0.10) | |
| | | | | | | | | | | | |
NET INCREASE/(DECREASE) IN NET ASSET VALUE | | | (0.49) | | | | 1.25 | | | | 1.40 | |
| | | | | | | | | | | | |
NET ASSET VALUE, END OF PERIOD | | $ | 12.16 | | | $ | 12.65 | | | $ | 11.40 | |
| | | | | | | | | | | | |
TOTAL RETURN(c) | | | 5.41% | | | | 12.05% | | | | 15.14% | |
| | | |
RATIOS/SUPPLEMENTAL DATA | | | | | | | | | | | | |
Net assets, End of Period (000s) | | $ | 39,371 | | | $ | 16,624 | | | $ | 1,579 | |
RATIOS TO AVERAGE NET ASSETS: | | | | | | | | | | | | |
Operating Expenses: | | | | | | | | | | | | |
Excluding reimbursement/waiver(d) | | | 2.29% | | | | 3.16% | | | | 44.74% | (e)(f) |
Including reimbursement/waiver(d) | | | 1.88% | | | | 1.90% | (g) | | | 1.98% | (e)(f) |
Net investment income including reimbursement/waiver(d) | | | 0.58% | | | | 0.85% | | | | 0.39% | (e) |
PORTFOLIO TURNOVER RATE | | | 65% | | | | 18% | | | | 31% | (h) |
| (a) | The Fund commenced operations on July 31, 2012. |
| (b) | Calculated using the average shares method. |
| (c) | Total investment return is calculated assuming a purchase of a common share at the opening of the first day and a sale at closing on the last day of each period reported. Dividends and distributions, if any, are assumed for purposes of this calculation to be reinvested at prices obtained under the Fund’s dividend reinvestment plan. Total returns would have been lower had certain expenses not been waived during the period. Total investment returns do not reflect brokerage commissions, if any, and are not annualized. |
| (d) | The ratios exclude the impact of expenses of the underlying funds in which the Fund invests as represented in the Portfolio of Investments. |
| (f) | Expense ratios before reductions for startup periods may not be representative of longer term operating periods. |
| (g) | Contractual expense limitation changed from 1.98% to 1.88% effective October 1, 2013. |
See Notes to Financial Statements.
| | |
| 18 | | www.pathwayadvisorsfunds.com |
| | |
Pathway Advisors Funds | | Notes to Financial Statements |
| | April 30, 2015 |
1. ORGANIZATION
Financial Investors Trust (the “Trust”), a Delaware statutory trust, is an open-end management investment company registered under the Investment Company Act of 1940, as amended (“1940 Act”). As of April 30, 2015, the Trust has 30 registered funds. This annual report describes Pathway Advisors Conservative Fund and Pathway Advisors Aggressive Growth Fund (individually a “Fund” and collectively, the “Funds”). The Pathway Advisors Conservative Fund seeks total return through a primary emphasis on income with a secondary emphasis on growth of capital. The Pathway Advisors Aggressive Growth Fund seeks total return through a primary emphasis on growth with a secondary emphasis on income.
2. SIGNIFICANT ACCOUNTING POLICIES
The accompanying financial statements were prepared in accordance with accounting principles generally accepted in the United States of America (“U.S. GAAP”). The preparation of financial statements in conformity with U.S. GAAP requires management to make certain estimates and assumptions that affect the reported amounts of assets and liabilities and disclosures of contingent assets and liabilities at the date of the financial statements and the reported amounts of revenue and expenses during the period. Actual results could differ from those estimates. The Funds are considered an investment company for financial reporting purposes under U.S. GAAP. The following is a summary of significant accounting policies consistently followed by the Funds in preparation of their financial statements.
Investment Valuation: The Funds generally value their securities based on market prices determined at the close of regular trading on the New York Stock Exchange (“NYSE”), normally 4:00 p.m. Eastern Time, on each day the NYSE is open for trading.
For equity securities and mutual funds that are traded on an exchange, the market price is usually the closing sale or official closing price on that exchange. In the case of equity securities not traded on an exchange, or if such closing prices are not otherwise available, the securities are valued at the mean of the most recent bid and ask prices on such day. Redeemable securities issued by open-end registered investment companies are valued at the investment company’s applicable net asset value, with the exception of exchange-traded open-end investment companies, which are priced as equity securities.
The market price for debt obligations is generally the price supplied by an independent third-party pricing service approved by the Board of Trustees (the “Board”), which may use a matrix, formula or other objective method that takes into consideration quotations from dealers, market transactions in comparable investments, market indices and yield curves. If vendors are unable to supply a price, or if the price supplied is deemed to be unreliable, the market price may be determined using quotations received from one or more broker-dealers that make a market in the security. Short–term debt obligations that will mature in 60 days or less are valued at amortized cost, unless it is determined that using this method would not reflect an investment’s fair value.
When such prices or quotations are not available, or when the Fair Value Committee appointed by the Board believes that they are unreliable, securities may be priced using fair value procedures approved by the Board.
| | |
| Annual Report | April 30, 2015 | | 19 |
| | |
Pathway Advisors Funds | | Notes to Financial Statements |
| | April 30, 2015 |
Fair Value Measurements: The Funds disclose the classification of their fair value measurements following a three-tier hierarchy based on the inputs used to measure fair value. Inputs refer broadly to the assumptions that market participants would use in pricing the asset or liability, including assumptions about risk. Inputs may be observable or unobservable. Observable inputs reflect the assumptions market participants would use in pricing the asset or liability that are developed based on market data obtained from sources independent of the reporting entity. Unobservable inputs reflect the reporting entity’s own assumptions about the assumptions market participants would use in pricing the asset or liability that are developed based on the best information available.
Various inputs are used in determining the value of the Funds’ investments as of the end of the reporting period. When inputs used fall into different levels of the fair value hierarchy, the level in the hierarchy within which the fair value measurement falls is determined based on the lowest level input that is significant to the fair value measurement in its entirety. The designated input levels are not necessarily an indication of the risk or liquidity associated with these investments. These inputs are categorized in the following hierarchy under applicable financial accounting standards:
| | | | |
Level 1 | | – | | Unadjusted quoted prices in active markets for identical investments, unrestricted assets or liabilities that the Funds have the ability to access at the measurement date; |
| | |
Level 2 | | – | | Quoted prices which are not active, quoted prices for similar assets or liabilities in active markets or inputs other than quoted prices that are observable (either directly or indirectly) for substantially the full term of the asset or liability; and |
| | |
Level 3 | | – | | Significant unobservable prices or inputs (including the Funds’ own assumptions in determining the fair value of investments) where there is little or no market activity for the asset or liability at the measurement date. |
The following is a summary of the inputs used to value the Funds’ investments as of April 30, 2015:
Pathway Advisors Conservative Fund
| | | | | | | | | | | | | | | | |
| Investments in Securities at Value | | Level 1 -
Quoted Prices | | | Level 2 -
Other
Significant
Observable
Inputs | | | Level 3 -
Significant
Unobservable
Inputs | | | Total | |
| |
Exchange Traded Funds | | $ | 12,116,753 | | | $ | – | | | $ | – | | | $ | 12,116,753 | |
Open-End Mutual Funds | | | 20,080,344 | | | | – | | | | – | | | | 20,080,344 | |
Short Term Investments | | | 42,360 | | | | – | | | | – | | | | 42,360 | |
| |
Total | | $ | 32,239,457 | | | $ | – | | | $ | – | | | $ | 32,239,457 | |
| | |
| | |
| 20 | | www.pathwayadvisorsfunds.com |
| | |
Pathway Advisors Funds | | Notes to Financial Statements |
| | April 30, 2015 |
Pathway Advisors Aggressive Growth Fund
| | | | | | | | | | | | | | | | |
| Investments in Securities at Value | | Level 1 -
Quoted Prices | | | Level 2 -
Other
Significant
Observable
Inputs | | | Level 3 -
Significant
Unobservable
Inputs | | | Total | |
| |
Exchange Traded Funds | | $ | 24,005,065 | | | $ | – | | | $ | – | | | $ | 24,005,065 | |
Open-End Mutual Funds | | | 15,128,387 | | | | – | | | | – | | | | 15,128,387 | |
Short Term Investments | | | 307,944 | | | | – | | | | – | | | | 307,944 | |
| |
Total | | $ | 39,441,396 | | | $ | – | | | $ | – | | | $ | 39,441,396 | |
| | |
The Funds recognize transfers between levels as of the end of the period. For the year ended April 30, 2015, the Funds did not have any transfers between Level 1 and Level 2 securities. For the year ended April 30, 2015, the Funds did not have any securities that used significant unobservable inputs (Level 3) in determining fair value.
Investment Transactions and Investment Income: Investment transactions are accounted for on the date the investments are purchased or sold (trade date basis). Net realized gains and losses from investment transactions are reported on an identified cost basis. Interest income, which includes accretion of discounts and amortization of premiums, is accrued and recorded as earned. Dividend income is recognized on the ex-dividend date or for certain foreign securities, as soon as information is available to the Funds.
Trust Expenses: Some expenses of the Trust can be directly attributed to the Funds. Expenses which cannot be directly attributed to the Funds are apportioned among all funds in the Trust based on average net assets of each fund.
Fund Expenses: Expenses that are specific to a Fund are charged directly to that Fund.
Federal Income Taxes: The Funds comply with the requirements under Subchapter M of the Internal Revenue Code of 1986, as amended, applicable to regulated investment companies and intend to distribute substantially all of their net taxable income and net capital gains, if any, each year, so that it will not be subject to excise tax on undistributed income and gains. The Funds are not subject to income taxes to the extent such distributions are made.
As of and during the year ended April 30, 2015, the Funds did not have a liability for any unrecognized tax benefits. The Funds file U.S. federal, state, and local tax returns as required. The Funds’ tax returns are subject to examination by the relevant tax authorities until expiration of the applicable statute of limitations, which is generally three years after the filing of the tax return for federal purposes and four years for most state returns. Tax returns for open years have incorporated no uncertain tax positions that require a provision for income taxes.
Distributions to Shareholders: Each Fund normally pays dividends and distributes capital gains, if any, on an annual basis. Income dividend distributions are derived from interest and other income each Fund receives from its investments, including short-term capital gains. Long term capital gain distributions are derived from gains realized when each Fund sells a security it has
| | |
| Annual Report | April 30, 2015 | | 21 |
| | |
Pathway Advisors Funds | | Notes to Financial Statements |
| | April 30, 2015 |
owned for more than a year. Each Fund may make additional distributions and dividends at other times if the portfolio manager believes doing so may be necessary for each Fund to avoid or reduce taxes.
3. TAX BASIS INFORMATION
Reclassifications: As of April 30, 2015, permanent differences in book and tax accounting were reclassified. These differences had no effect on net assets and were primarily attributed to non-deductible expenses and book-tax distribution differences. The reclassifications were as follows:
| | | | | | | | | | | | |
| Fund | | Paid-in Capital | | | Accumulated Net
Investment Income | | | Accumulated Net
Realized Loss on
Investments | |
Pathway Advisors Conservative Fund | | $ | (275) | | | $ | 275 | | | $ | – | |
Pathway Advisors Aggressive Growth Fund | | | – | | | | 10,485 | | | | (10,485) | |
Tax Basis of Investments: As of April 30, 2015, the costs of investments for federal income tax purposes and accumulated net unrealized appreciation/(depreciation) on investments were as follows:
| | | | | | | | | | | | | | | | |
| | | Gross
Appreciation
(excess of value
over tax cost) | | | Gross
Depreciation
(excess of tax
cost over value) | | | Net Unrealized
Appreciation | | | Cost of
Investments for
Income Tax
Purposes | |
Pathway Advisors Conservative Fund | | $ | 317,315 | | | $ | (144,667) | | | $ | 172,648 | | | $ | 32,066,809 | |
Pathway Advisors Aggressive Growth Fund | | | 1,085,463 | | | | (215,222) | | | | 870,241 | | | | 38,571,155 | |
Components of Distributable Earnings: As of April 30, 2015, components of distributable earnings were as follows:
| | | | | | | | |
| | | Pathway Advisors
Conservative Fund | | | Pathway Advisors
Aggressive Growth
Fund | |
Undistributed ordinary income | | $ | 23,769 | | | $ | – | |
Accumulated capital gain | | | 124,796 | | | | 194,180 | |
Net unrealized appreciation on investments | | | 172,648 | | | | 870,241 | |
Other cumulative effect of timing differences | | | – | | | | (36,521) | |
Total distributable earnings | | $ | 321,213 | | | $ | 1,027,900 | |
| | | | | | | | | |
Capital Losses: As of April 30, 2015, the Funds have no accumulated capital loss carryforwards.
The Pathway Advisors Aggressive Growth Fund elects to defer to the period ending April 30, 2016, late year ordinary losses in the amount of $36,521.
| | |
| 22 | | www.pathwayadvisorsfunds.com |
| | |
Pathway Advisors Funds | | Notes to Financial Statements |
| | April 30, 2015 |
Tax Basis of Distributions to Shareholders: The character of distributions made during the period from net investment income or net realized gains may differ from its ultimate characterization for federal income tax purposes. Also, due to the timing of dividend distributions, the fiscal year in which amounts are distributed may differ from the fiscal year in which the income or realized gain were recorded by the Funds.
The tax character of distributions paid by the Funds for the year ended April 30, 2015, were as follows:
| | | | | | | | |
| | | Ordinary Income | | | Long-Term Capital
Gain | |
Pathway Advisors Conservative Fund | | $ | 156,882 | | | $ | 73,402 | |
Pathway Advisors Aggressive Growth Fund | | | 576,858 | | | | 708,244 | |
The tax character of distributions paid by the Funds for the period ended April 30, 2014, were as follows:
| | | | | | | | |
| | | Ordinary Income | | | Long-Term Capital
Gain | |
Pathway Advisors Conservative Fund | | $ | 44,742 | | | $ | 7,633 | |
Pathway Advisors Aggressive Growth Fund | | | 125,902 | | | | 1,722 | |
4. SECURITIES TRANSACTIONS
Purchases and sales of securities (excluding short-term securities) during the year ended April 30, 2015, were as follows:
| | | | | | | | |
| Fund | | Purchases of
Securities | | | Proceeds From Sales
of Securities | |
Pathway Advisors Conservative Fund | | $ | 32,087,804 | | | $ | 5,434,710 | |
Pathway Advisors Aggressive Growth Fund | | | 33,901,579 | | | | 12,283,799 | |
5. BENEFICIAL SHARE TRANSACTIONS
The capitalization of the Trust consists of an unlimited number of shares of beneficial interest with no par value per share. Holders of the shares of the Funds of the Trust have one vote for each share held and a proportionate fraction of a vote for each fractional share. All shares issued and outstanding are fully paid and are transferable and redeemable at the option of the shareholder. Purchasers of the shares do not have any obligation to make payments to the Trust or its creditors (other than the purchase price for the shares) or make contributions to the Trust or its creditors solely by reason of the purchasers’ ownership of the shares. Shares have no pre-emptive rights.
| | |
| Annual Report | April 30, 2015 | | 23 |
| | |
Pathway Advisors Funds | | Notes to Financial Statements |
| | April 30, 2015 |
Transactions in shares of capital stock:
Pathway Advisors Conservative Fund
| | | | | | | | |
| | | For the Year Ended
April 30, 2015 | | | For the Year Ended
April 30, 2014 | |
Common Shares Outstanding - Beginning of Period | | | 510,894 | | | | 129,714 | |
Common Shares Sold | | | 2,789,052 | | | | 453,941 | |
Common Shares Issued as Reinvestment of Dividends | | | 21,828 | | | | 5,060 | |
Common Shares Redeemed | | | (288,674) | | | | (77,821) | |
Common Shares Outstanding - End of Period | | | 3,033,100 | | | | 510,894 | |
| | | | | | | | | |
| | | | |
Pathway Advisors Aggressive Growth Fund | | | | |
| | | | | | | | |
| | | For the Year Ended
April 30, 2015 | | | For the Year Ended
April 30, 2014 | |
Common Shares Outstanding - Beginning of Period | | | 1,314,394 | | | | 138,460 | |
Common Shares Sold | | | 2,567,170 | | | | 1,256,587 | |
Common Shares Issued as Reinvestment of Dividends | | | 108,082 | | | | 10,317 | |
Common Shares Redeemed | | | (753,135) | | | | (90,970) | |
Common Shares Outstanding - End of Period | | | 3,236,511 | | | | 1,314,394 | |
| | | | | | | | | |
6. MANAGEMENT AND RELATED PARTY TRANSACTIONS
Investment Advisory
Hanson McClain, Inc. (the “Adviser”), subject to the authority of the Board, is responsible for the overall management and administration of the Funds’ business affairs. The Adviser manages the investments of the Funds in accordance with the Funds’ investment objective, policies and limitations and investment guidelines established jointly by the Adviser and the Board. Pursuant to the Investment Advisory Agreement (“Advisory Agreement”), the Adviser is entitled to an investment advisory fee, computed daily and payable monthly of 1.00% of the average daily net assets for each Fund.
The Adviser has agreed contractually to limit the amount of each Fund’s total annual expenses, exclusive of acquired fund fees and expenses, brokerage expenses, interest expenses, taxes and extraordinary expenses, to 1.88% of each Fund’s average daily net assets. This agreement is in effect through August 31, 2015. The Adviser will be permitted to recover expenses it has borne through the agreement described above to the extent that the Funds’ expenses in later periods fall below the annual rates set forth in the relevant agreement. The Funds will not be obligated to pay any such deferred fees and expenses more than three years after the end of the fiscal year in which the fees and expense were deferred. The Adviser may not discontinue this waiver without the approval by the Funds’ Board.
| | |
| 24 | | www.pathwayadvisorsfunds.com |
| | |
Pathway Advisors Funds | | Notes to Financial Statements |
| | April 30, 2015 |
For the year ended April 30, 2015, the fee waivers and/or reimbursements were as follows:
| | | | | | | | | | | | |
| | | Fees Waived/ Reimbursed By Adviser | | | Recoupment of Past Waived Fees By Adviser | | | Total | |
Pathway Advisors Conservative Fund | | $ | 73,567 | | | $ | – | | | $ | 73,567 | |
Pathway Advisors Aggressive Growth Fund | | | 72,255 | | | | – | | | | 72,255 | |
As of April 30, 2015, the balances of recoupable expenses for each Fund were as follows:
| | | | | | | | | | | | | | | | |
| Fund | | Expires 2016 | | | Expires 2017 | | | Expires 2018 | | | Total | |
Pathway Advisors Conservative Fund | | $ | 153,925 | | | $ | 97,471 | | | $ | 73,567 | | | $ | 324,963 | |
Pathway Advisors Aggressive Growth Fund | | | 167,248 | | | | 120,826 | | | | 72,255 | | | | 360,329 | |
Fund Administrator Fees and Expenses
ALPS Fund Services, Inc. (“ALPS”) serves as administrator to the Funds and the Funds have agreed to pay expenses incurred in connection with their administrative activities. Pursuant to an Administrative Agreement, ALPS provides operational services to the Funds including, but not limited to, fund accounting and fund administration and generally assists in the Funds’ operations. Officers of the Trust are employees of ALPS. The Funds’ administration fee is accrued on a daily basis and paid monthly. Administration fees paid by the Funds for the year ended April 30, 2015 are disclosed in the Statements of Operations.
ALPS is reimbursed by the Fund for certain out-of-pocket expenses.
Transfer Agent
ALPS serves as transfer, dividend paying and shareholder servicing agent for the Funds. ALPS receives an annual minimum fee, a fee based upon the number of shareholder accounts, and is also reimbursed by each Fund for certain out-of-pocket expenses.
Compliance Services
ALPS provides services that assist the Trust’s chief compliance officer in monitoring and testing the policies and procedures of the Trust in conjunction with requirements under Rule 38a-1 under the 1940 Act and receives an annual base fee. ALPS is reimbursed for certain out-of-pocket expenses by the Fund.
Principal Financial Officer
ALPS receives an annual fee for providing principal financial officer services to the Funds.
Distributor
ALPS Distributors, Inc. (“ADI” or the “Distributor”) (an affiliate of ALPS) acts as the distributor of the Funds’ shares pursuant to a Distribution Agreement with the Trust. Shares are sold on a continuous basis by ADI as agent for the Funds, and ADI has agreed to use its best efforts to solicit orders for the sale of Funds’ shares, although it is not obliged to sell any particular amount of shares. ADI is not entitled to any compensation for its services as Distributor. ADI is registered as a broker-dealer with the Securities and Exchange Commission.
| | |
| Annual Report | April 30, 2015 | | 25 |
| | |
Pathway Advisors Funds | | Notes to Financial Statements |
| | April 30, 2015 |
Each Fund has adopted a separate Distribution and Services Plan (each a “Plan” and collectively, the “Plans”) pursuant to Rule 12b-1 of the 1940 Act. The Plans allow each Fund, as applicable, to use each Fund’s assets to pay fees in connection with the distribution and marketing of the Funds’ shares and/or the provision of shareholder services to the Funds’ shareholders. The Plan permits payment for services in connection with the administration of plans or programs that use shares of each Fund as their funding medium and for related expenses. The Plans permit each Fund to make total payments at an annual rate of up to 0.25% of each Funds’ average daily net assets. Because these fees are paid out of the Funds’ assets on an ongoing basis, over time they will increase the cost of an investment in the Funds, and Plan fees may cost an investor more than other types of sales charges.
Each Fund has adopted a Shareholder Services Plan (a “Shareholder Services Plan”) with respect to its shares. Under the Shareholder Services Plan, each Fund is authorized to pay banks and their affiliates and other institutions, including broker-dealers and Fund affiliates (“Participating Organizations”), an aggregate fee in an amount not to exceed on an annual basis 0.15% of the average daily net asset value of shares of the Funds attributable to or held in the name of a Participating Organization for its clients as compensation for providing services pursuant to an agreement with a Participating Organization. Any amount of such payment not paid during the Funds’ fiscal year for such service activities shall be reimbursed to the Funds as soon as practicable after the end of the fiscal year. Shareholder Services Plan fees are included within “Distribution and service fees” on the Statement of Operations.
7. INDEMNIFICATIONS
Under the Trust’s organizational documents, its officers and Trustees are indemnified against certain liability arising out of the performance of their duties to the Trust. Additionally, in the normal course of business, the Trust enters into contracts with service providers that may contain general indemnification clauses, which may permit indemnification to the extent permissible under applicable laws. The Trust’s maximum exposure under these arrangements is unknown, as this would involve future claims that may be made against the Trust that have not yet occurred.
| | |
| 26 | | www.pathwayadvisorsfunds.com |
| | |
Pathway Advisors Funds | | Report of Independent Registered Public Accounting Firm |
To the Shareholders and Board of Trustees of Financial Investors Trust:
We have audited the accompanying statements of assets and liabilities, including the portfolios of investments, of Pathway Advisors Conservative Fund and Pathway Advisors Aggressive Growth Fund, two of the portfolios constituting Financial Investors Trust (the “Funds”), as of April 30, 2015, and the related statements of operations for the year then ended, the statements of changes in net assets for each of the two years in the period then ended, and the financial highlights for each of the two years in the period then ended and the period from July 31, 2012 (commencement of operations) to April 30, 2013. These financial statements and financial highlights are the responsibility of the Funds’ management. Our responsibility is to express an opinion on these financial statements and financial highlights based on our audits.
We conducted our audits in accordance with the standards of the Public Company Accounting Oversight Board (United States). Those standards require that we plan and perform the audit to obtain reasonable assurance about whether the financial statements and financial highlights are free of material misstatement. The Funds are not required to have, nor were we engaged to perform, an audit of their internal control over financial reporting. Our audits included consideration of internal control over financial reporting as a basis for designing audit procedures that are appropriate in the circumstances, but not for the purpose of expressing an opinion on the effectiveness of the Funds’ internal control over financial reporting. Accordingly, we express no such opinion. An audit also includes examining, on a test basis, evidence supporting the amounts and disclosures in the financial statements, assessing the accounting principles used and significant estimates made by management, as well as evaluating the overall financial statement presentation. Our procedures included confirmation of securities owned as of April 30, 2015, by correspondence with the custodian. We believe that our audits provide a reasonable basis for our opinion.
In our opinion, the financial statements and financial highlights referred to above present fairly, in all material respects, the financial position of Pathway Advisors Conservative Fund and Pathway Advisors Aggressive Growth Fund as of April 30, 2015, the results of their operations for the year then ended, the changes in their net assets for each of the two years in the period then ended, and the financial highlights for each of the two years in the period then ended and the period from July 31, 2012 (commencement of operations) to April 30, 2013, in conformity with accounting principles generally accepted in the United States of America.
DELOITTE & TOUCHE LLP
Denver, Colorado
June 26, 2015
| | |
| Annual Report | April 30, 2015 | | 27 |
| | |
Pathway Advisors Funds | | Additional Information |
| | April 30, 2015 (Unaudited) |
1. FUND HOLDINGS
The Funds file their complete schedule of portfolio holdings with the Securities and Exchange Commission (the “SEC”) for the first and third quarters of each fiscal year on Form N-Q within 60 days after the end of the period. Copies of the Funds’ Form N-Q are available without charge on the SEC website at http://www.sec.gov. You may also review and copy the Form N-Q at the SEC’s Public Reference Room in Washington, DC. For more information about the operation of the Public Reference Room, please call the SEC at 1-800-SEC-0330.
2. FUND PROXY VOTING POLICIES, PROCEDURES AND SUMMARIES
The Funds’ policies and procedures used in determining how to vote proxies and information regarding how the Fund voted proxies relating to portfolio securities during the most recent prior 12-month period ending June 30 are available without charge, (1) upon request, by calling (toll-free) 888-288-1121 and (2) on the SEC’s website at http://www.sec.gov.
3. TAX DESIGNATIONS
The Funds designate the following as a percentage of taxable ordinary income distributions, or up to the maximum amount allowable, for the calendar year ended December 31, 2014:
| | | | |
| | | Dividends Received
Deduction | | Qualified Dividend
Income |
Pathway Advisors Conservative Fund | | – | | 21.02% |
Pathway Advisors Aggressive Growth Fund | | 7.79% | | 39.66% |
In early 2015, if applicable, shareholders of record received this information for the distributions paid to them by the Funds during the calendar year 2014 via Form 1099. The Funds will notify shareholders in early 2016 of amounts paid to them by the Funds, if any, during the calendar year 2015.
Pursuant to Section 852(b)(3) of the Internal Revenue Code, Pathway Advisors Conservative Fund and Pathway Advisors Aggressive Fund designated $73,402, and $708,244 respectively as long-term capital gain dividends.
Please consult a tax advisor if you have questions about federal or state income tax laws, or how to prepare your tax returns.
| | |
| 28 | | www.pathwayadvisorsfunds.com |
| | |
Pathway Advisors Funds | | Trustees & Officers |
| | April 30, 2015 (Unaudited) |
Additional information regarding the Fund’s trustees is included in the Statement of Additional Information, which can be obtained without charge by calling 888-288-1121.
INDEPENDENT TRUSTEES
| | | | | | | | | | |
Name, Address* & Year of Birth | | Position(s)
Held with
Fund | | Term of Office and Length of Time Served** | | Principal Occupation(s) During Past 5 Years*** | | Number of
Funds in
Fund
Complex
Overseen
by
Trustee**** | | Other Directorships Held by Trustee During Past 5 Years |
Mary K. Anstine, 1940 | | Trustee | | Ms. Anstine was elected at a special meeting of shareholders held on March 21, 1997 and re-elected at a special meeting of shareholders held on August 7, 2009. | | Ms. Anstine was formerly an Executive Vice President of First Interstate Bank of Denver until 1994, President/Chief Executive Officer of HealthONE Alliance, Denver, Colorado, from 1994 to 2004, and has been retired since 2004. Ms. Anstine is also Trustee/Director of AV Hunter Trust and Colorado Uplift Board. Ms. Anstine was formerly a Director of the Trust Bank of Colorado (later purchased and now known as Northern Trust Bank), HealthONE and Denver Area Council of the Boy Scouts of America, and a member of the American Bankers Association Trust Executive Committee. | | 30 | | Ms. Anstine is a Trustee of ALPS ETF Trust (18 funds); ALPS Variable Investment Trust (9 funds); Reaves Utility Income Fund (1 fund); and Westcore Trust (12 funds). |
John R. Moran, Jr., 1930 | | Trustee | | Mr. Moran was elected at a special meeting of shareholders held on March 21, 1997 and re-elected at a special meeting of shareholders held on August 7, 2009. | | Mr. Moran formerly served as President and CEO of The Colorado Trust, a private foundation serving the health and hospital community in the state of Colorado, from 1991 to 2007. During his career as an attorney from 1958 to 1991, Mr. Moran was formerly a partner with the firm of Kutak Rock & Campbell in Denver, Colorado and a member of the Colorado House of Representatives. Currently, Mr. Moran is a member of the Treasurer’s Investment Advisory Committee for the University of Colorado. | | 30 | | None. |
| * | All communications to Trustees and Officers may be directed to Financial Investors Trust c/o 1290 Broadway, Suite 1100, Denver, CO 80203. |
| ** | This is the period for which the Trustee or Officer began serving the Trust. Each Trustee and/or Officer serves an indefinite term, until his successor is elected. |
| *** | Except as otherwise indicated, each individual has held the office shown or other offices in the same company for the last five years. |
| **** | The Fund Complex includes all series of the Trust (currently 30) and any other investment companies for which any Trustee serves as Trustee for and which Hanson McClain, Inc. provides investment advisory services (currently none). |
| | |
| Annual Report | April 30, 2015 | | 29 |
| | |
Pathway Advisors Funds | | Trustees & Officers |
| | April 30, 2015 (Unaudited) |
INDEPENDENT TRUSTEES (continued)
| | | | | | | | | | |
Name, Address* & Year of Birth | | Position(s)
Held with
Fund | | Term of Office and Length of Time Served** | | Principal Occupation(s) During Past 5 Years*** | | Number of Funds in Fund Complex Overseen by Trustee**** | | Other Directorships
Held by Trustee
During Past
5 Years |
Jeremy W. Deems, 1976 | | Trustee | | Mr. Deems was appointed as a Trustee at the March 11, 2008 meeting of the Board of Trustees and elected at a special meeting of shareholders held on August 7, 2009. | | Mr. Deems is the Co-Founder and Chief Financial Officer of Green Alpha Advisors, LLC, a registered investment advisor, and Co-Portfolio Manager of the Shelton Green Alpha Fund. Prior to joining Green Alpha Advisors, Mr. Deems was CFO and Treasurer of Forward Management, LLC, ReFlow Management Co., LLC, ReFlow Fund, LLC, a private investment fund, and Sutton Place Management, LLC, an administrative services company, from 1998 to June 2007. From 2004 to 2005, Mr Deems also served as Treasurer of the Forward Funds and the Sierra Club Funds. | | 30 | | Mr. Deems is a Trustee of ALPS ETF Trust (18 funds); ALPS Variable Investment Trust (9 funds) and Reaves Utility Income Fund (1 fund). |
| Jerry G. Rutledge 1944 | | Trustee | | Mr. Rutledge was elected at a special meeting of shareholders held on August 7, 2009 | | Mr. Rutledge is the President and owner of Rutledge’s Inc., a retail clothing business. Mr. Rutledge is currently serving as a Director of the University of Colorado Hospital. Mr. Rutledge was from 1994 to 2007 a Regent of the University of Colorado. | | 30 | | Mr. Rutledge is a Trustee of Principal Real Estate Income Fund (1 fund), Clough Global Allocation Fund (1 fund), Clough Global Equity Fund (1 fund) and Clough Global Opportunities Fund (1 fund). |
| * | All communications to Trustees and Officers may be directed to Financial Investors Trust c/o 1290 Broadway, Suite 1100, Denver, CO 80203. |
| ** | This is the period for which the Trustee or Officer began serving the Trust. Each Trustee and/or Officer serves an indefinite term, until his successor is elected. |
| *** | Except as otherwise indicated, each individual has held the office shown or other offices in the same company for the last five years. |
| **** | The Fund Complex includes all series of the Trust (currently 30) and any other investment companies for which any Trustee serves as Trustee for and which Hanson McClain, Inc. provides investment advisory services (currently none). |
| | |
| 30 | | www.pathwayadvisorsfunds.com |
| | |
Pathway Advisors Funds | | Trustees & Officers |
| | April 30, 2015 (Unaudited) |
INDEPENDENT TRUSTEES (continued)
| | | | | | | | | | |
Name, Address* & Year of Birth | | Position(s)
Held with Fund | | Term of Office and Length of Time Served** | | Principal Occupation(s) During Past 5 Years*** | | Number of Funds in Fund Complex Overseen by Trustee**** | | Other Directorships Held by Trustee During Past 5 Years |
Michael “Ross” Shell, 1970 | | Trustee | | Mr. Shell was elected at a special meeting of shareholders held on August 7, 2009 | | Mr. Shell is Founder and CEO of Red Idea, LLC, a strategic consulting/early stage venture firm (since June 2008). From 1999 to 2009, he was a part-owner and Director of Tesser, Inc., a brand agency. From December 2005 to May 2008, he was Director, Marketing and Investor Relations, of Woodbourne, a REIT/real estate hedge fund and private equity firm. Prior to this, from May 2004 to November 2005, he worked as a business strategy consultant; from June 2003 to April 2004, he was on the Global Client Services team of IDEO, a product design/innovation firm; and from 1999 to 2003, he was President of Tesser, Inc. Mr. Shell graduated with honors from Stanford University with a degree in Political Science. | | 30 | | None. |
| | |
| Annual Report | April 30, 2015 | | 31 |
| | |
Pathway Advisors Funds | | Trustees & Officers |
| | April 30, 2015 (Unaudited) |
| | | | | | | | | | |
| INTERESTED TRUSTEE | | | | | | |
Name, Address* & Age | | Position(s) Held with Fund | | Term of Office and Length of Time Served** | | Principal Occupation(s) During Past 5 Years*** | | Number of Funds in Fund Complex Overseen by Trustee**** | | Other Directorships Held by Trustee |
| Edmund J. Burke, 1961 | | Trustee, Chairman and President | | Mr. Burke was elected as Chairman at the August 28, 2009 meeting of the Board of Trustees. Mr. Burke was elected as Trustee at a special meeting of shareholders held on August 7, 2009. Mr. Burke was elected President of the Trust at the December 17, 2002 meeting of the Board of Trustees. | | Mr. Burke is President and a Director of ALPS Holdings, Inc. (“AHI”) (since 2005) and Director of Boston Financial Data Services, Inc. (“BFDS”), ALPS Advisors, Inc. (“AAI”), ALPS Distributors, Inc. (“ADI”), ALPS Fund Services, Inc. (“AFS”) and ALPS Portfolio Solutions Distributor, Inc. (“APSD”) and from 2001-2008, was President of AAI, ADI, AFS and APSD. Because of his positions with AHI, BFDS, AAI, ADI, AFS and APSD, Mr. Burke is deemed an affiliate of the Trust as defined under the 1940 Act. Mr. Burke is Trustee and President of the Clough Global Allocation Fund (Trustee since 2006; President since 2004); Trustee and President of the Clough Global Equity Fund (Trustee since 2006; President since 2005); Trustee and President of the Clough Global Opportunities Fund (since 2006); Trustee of the Liberty All-Star Equity Fund; and Director of the Liberty All-Star Growth Fund, Inc. | | 35 | | Mr. Burke is a Trustee of Clough Global Allocation Fund (1 fund); Clough Global Equity Fund (1 fund); Clough Global Opportunities Fund (1 fund); Trustee of the Liberty All-Star Equity Fund (1 fund); and Director of the Liberty All-Star Growth Fund, Inc. (1 fund). |
| * | All communications to Trustees and Officers may be directed to Financial Investors Trust c/o 1290 Broadway, Suite 1100, Denver, CO 80203. |
| ** | This is the period for which the Trustee or Officer began serving the Trust. Each Trustee and/or Officer serves an indefinite term, until his successor is elected. |
| *** | Except as otherwise indicated, each individual has held the office shown or other offices in the same company for the last five years. |
| **** | The Fund Complex includes all series of the Trust (currently 30) and any other investment companies for which any Trustee serves as Trustee for and which Hanson McClain, Inc. provides investment advisory services (currently none). |
| | |
| 32 | | www.pathwayadvisorsfunds.com |
| | |
Pathway Advisors Funds | | Trustees & Officers |
| | April 30, 2015 (Unaudited) |
OFFICERS
| | | | | | |
Name, Address* & Year of Birth | | Position(s) Held with Fund | | Term of Office and Length of Time Served** | | Principal Occupation(s) During Past 5 Years*** |
Kimberly R. Storms, 1972 | | Treasurer | | Ms. Storms was elected Treasurer of the Trust at the March 12, 2013 meeting of the Board of Trustees. | | Ms. Storms is Senior Vice President and Director of Fund Administration of ALPS. Because of her position with ALPS, Ms. Storms is deemed an affiliate of the Trust as defined under the 1940 Act. Ms. Storms is also Treasurer of Liberty All-Star Equity Fund and Liberty All-Star Growth Fund, Inc. and Chief Financial Officer of The Arbitrage Funds. |
David T. Buhler, 1971 | | Secretary | | Mr. Buhler was elected Secretary of the Trust at the September 11, 2012 meeting of the Board of Trustees. | | Mr. Buhler joined ALPS in June 2010. He is currently Vice President and Senior Associate Counsel of ALPS, AAI, ADI and APSD. Prior to joining ALPS, Mr. Buhler served as Associate General Counsel and Assistant Secretary of Founders Asset Management LLC from 2006 to 2009. Because of his position with ALPS, Mr. Buhler is deemed an affiliate of the Trust as defined under the 1940 Act. Mr. Buhler is also the Secretary ALPS Variable Investment Trust, ALPS ETF Trust and Westcore Trust. |
Ted Uhl, 1974 | | Chief
Compliance
Officer(“CCO”) | | Mr. Uhl was appointed CCO of the Trust at the June 8, 2010 meeting of the Board of Trustees. | | Mr. Uhl joined ALPS in October 2006, and is currently Deputy Compliance Officer of ALPS. Prior to his current role, Mr. Uhl served as Senior Risk Manager for ALPS from October 2006 until June 2010. Because of his position with ALPS, Mr. Uhl is deemed an affiliate of the Trust as defined under the 1940 Act. Mr. Uhl is also CCO of the Clough Global Funds, Reaves Utility Income Fund, Centre Funds and Transparent Value Trust. |
| | |
| Annual Report | April 30, 2015 | | 33 |
Table of Contents
| | |
| Redmont Funds | | Shareholder Letter |
| | April 30, 2015 (Unaudited) |
Performance Discussion:
REDMONT RESOLUTE FUND I
Table 1 notes the performance for Fund I as of quarter end under standard reporting (since inception) as well as of April 30th.
Table 1 i. ii. iii. iv. v.
Performance (amounts greater than one year are annualized)
| | | | | | | | | | | | | | | | | | | | | | | | | | | | | | |
| Redmont Resolute Fund I | | Standardized Performance Data as of March 31, 2015 | | Non-Standardized Performance Data as of April 30, 2015 |
| | | Year-to-Date | | 1-Year | | Since Inception
(12/30/11) | | Year-to-Date | | 1-Year | | Since Inception
(12/30/11) |
Resolute Fund I - I Class | | | | 1.69% | | | | | 3.16% | | | | | 3.53% | | | | | 1.50% | | | | | 3.16% | | | | | 3.38% | |
Resolute Fund I - A Class | | | | 3.99% | | | | | 5.14% | | | | | 3.85% | | | | | 3.71% | | | | | 5.05% | | | | | 3.67% | |
Load Adjusted | | | | -1.71% | | | | | -0.65% | | | | | 2.07% | | | | | -1.98% | | | | | -0.75% | | | | | 1.93% | |
HFRX Global Hedge Fund Index | | | | 2.06% | | | | | 0.36% | | | | | 3.57% | | | | | 2.28% | | | | | 1.31% | | | | | 3.55% | |
S&P 500® Total Return Index | | | | 0.95% | | | | | 12.73% | | | | | 19.04% | | | | | 1.92% | | | | | 12.98% | | | | | 18.87% | |
Morningstar Multi-Alternative Universe | | | | 0.05% | | | | | 3.22% | | | | | 3.05% | | | | | 0.08% | | | | | 3.49% | | | | | 3.21% | |
| | | Gross Expense
Ratio | | Less Expense
Waivers | | Net Expense
Ratio | | Net Ratio ex Dividend & Short Expense |
Resolute Fund I - I Class | | | | 5.62% | | | | | -3.22% | | | | | 2.40% | | | | | | | | | | 2.32% | | | | | | |
Resolute Fund I - A Class | | | | 6.15% | | | | | -3.35% | | | | | 2.80% | | | | | | | | | | 2.72% | | | | | | |
This performance analysis section shows the fund’s historical performance. Past performance is not indicative of future results. Investment return and value of shares will fluctuate. Upon redemption, shares may be worth more or less than their original cost. The current performance may be higher or lower than the quoted performance. Call 1-855-268-2242 or visit www.redmontfunds.com for the most recent month end performance results. The Fund has a redemption fee of 2.00% for shares redeemed within the first 90 days of purchase. Maximum Offering Price (MOP) for Class A includes the Fund’s maximum sales charge of 5.50%. Performance shown at NAV does not include these sales charges and would have been lower had it been taken into account.
Note: “Non-Standardized” performance includes month-end periods other than quarter-end. Examples include April, May, July, August, etc.
Fund I outperformed the HFRX Global Hedge Fund Index by approximately 185 basis pointsvi. (depending on the share class) over the twelve months ending April 30, 2015. This was due primarily to strong performance later in the fiscal year. Since inception, the Fund has outperformed the HFRX Global Hedge Fund Index during strong equity markets and underperformed the Index during market declines. The main factor driving that performance profile is the Fund’s higher level of net equity exposure relative to the HFRX Global Hedge Fund Index. As we have discussed in previous letters, the Fund seeks to perform in line with the equity markets over time with less volatility. In order to accomplish this objective, the Fund must maintain a minimum level of net equity exposure or it will not be able to keep up enough in strong markets. Though hedge fund exposure can vary greatly over time, we anticipate outperforming the Index in up markets and underperforming in down markets and to outperform the Index over a full market cycle.
Relative to the S&P 500 Index, the Fund has performed as we expected - participating but trailing in strong up markets while generally protecting capital (not experiencing as negative a return as the index) and outperforming in negative markets.
When compared to the peer group (Morningstar MultiAlternative Universe), the Fund lagged the Universe by approximately -30 basis points during the past twelve months but outperformed over 10 basis points annualized since inception. As with the HFRX Global Index, the Universe is very diverse and contains a number of market-neutral and other low net equity strategies that cause the average net equity exposure for the Universe to be considerably less than our Fund. So we anticipate outperforming the Universe in up markets and underperforming in down markets - recent performance has been consistent with our expectations.
| | |
| Annual Report | April 30, 2015 | | 1 |
| | |
| Redmont Funds | | Shareholder Letter |
| | April 30, 2015 (Unaudited) |
REDMONT RESOLUTE FUND II
Table 2 notes the performance for Fund II as of quarter end under standard reporting (since inception) as well as of April 30th.
Table 2 i. ii. iii. iv. v.
Performance (amounts greater than one year are annualized)
| | | | | | | | | | | | | | | | | | | | | | | | | | | | | | |
| Redmont Resolute Fund II | | Standardized Performance Data as of March 31, 2015 | | Non-Standardized Performance Data as of April 30, 2015 |
| | | Year-to-Date | | 1-Year | | Since Inception
(12/30/11) | | Year-to-Date | | 1-Year | | Since Inception
(12/30/11) |
Resolute Fund II - I Class | | | | 1.62% | | | | | 4.16% | | | | | 5.56% | | | | | 1.62% | | | | | 4.16% | | | | | 5.42% | |
HFRX Global Hedge Fund Index | | | | 2.06% | | | | | 0.36% | | | | | 3.57% | | | | | 2.28% | | | | | 1.31% | | | | | 3.55% | |
S&P 500® Total Return Index | | | | 0.95% | | | | | 12.73% | | | | | 19.04% | | | | | 1.92% | | | | | 12.98% | | | | | 18.87% | |
Morningstar Multi-Alternative Universe | | | | 0.05% | | | | | 3.22% | | | | | 3.05% | | | | | 0.08% | | | | | 3.49% | | | | | 3.21% | |
| | | Gross Expense
Ratio | | Less Expense
Waivers | | Net Expense
Ratio | | Net Ratio ex Dividend & Short Expense |
Resolute Fund II - I Class | | | | 2.64% | | | | | -1.35% | | | | | 1.29% | | | | | | | | | | 1.21% | | | | | | |
This performance analysis section shows the fund’s historical performance. Past performance is not indicative of future results. Investment return and value of shares will fluctuate. Upon redemption, shares may be worth more or less than their original cost. The current performance may be higher or lower than the quoted performance. Call 1-855-268-2242 or visit www.redmontfunds.com for the most recent month end performance results. The Fund has a redemption fee of 2.00% for shares redeemed within the first 90 days of purchase. Performance shown at NAV does not include these sales charges and would have been lower had it been taken into account.
Note: “Non-Standardized” performance includes month-end periods other than quarter-end. Examples include April, May, July, August, etc.
Fund II outperformed the HFRX Global Hedge Fund Index by 285 basis points over the twelve months ending April 30, 2015. Since inception, the Fund has outperformed the HFRX Global Hedge Fund Index by over 180 basis points annualized by performing well during strong equity markets underperforming the Index during market declines. The main factor driving that performance profile is the Fund’s higher level of net equity exposure relative to the HFRX Global Hedge Fund Index. As we have discussed in previous letters, the Fund seeks to perform in line with the equity markets over time with less volatility. In order to accomplish this objective, the Fund must maintain a minimum level of net equity exposure or it will not be able to keep up enough in strong markets. Though hedge fund exposure can vary greatly over time, we anticipate outperforming the Index in up markets and underperforming in down markets and to outperform the Index over a full market cycle.
Relative to the S&P 500 Index, the Fund has performed as we expected - participating but trailing in strong up markets while protecting capital and outperforming in negative markets.
When compared to the peer group (Morningstar MultiAlternative Universe), the Fund has outperformed the Universe over all time periods – by over 60 basis points during the past twelve months and 200 basis points annualized since inception. As with the HFRX Global Index, the Universe is very diverse and contains a number of market-neutral and other low net equity strategies that cause the average net equity exposure for the Universe to be considerably less than our Fund. So we anticipate outperforming the Universe in up markets and underperforming in down markets - recent performance has been consistent with our expectations.
Underlying Allocation Weights & Performance:
Each Fund consists of three main asset classes:
| | ● | | Tactical Asset Allocation viii. - with three underlying portfolios (two mutual funds and a separate account); |
| | ● | | Long/Short Equity ix. - with four underlying portfolios (one mutual fund and three separate accounts); and |
| | ● | | Opportunistic/Other x. - with three underlying portfolios (two mutual funds and one separate account). |
| | |
| Redmont Funds | | Shareholder Letter |
| | April 30, 2015 (Unaudited) |
The current allocation remained roughly unchanged during the fiscal year ending April 30, 2015. Figure 1 lists the long-term target asset allocation for the Funds as well as the allocation for Fund I and Fund II as of April 30th.
Figure 1
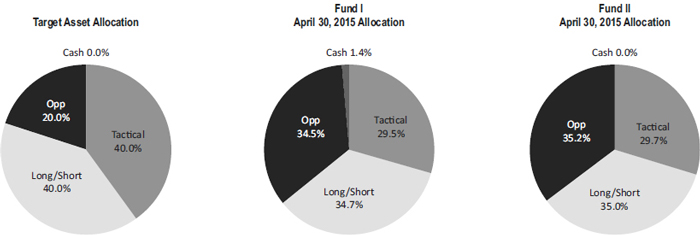
Holdings and allocations subject to change.
All three allocations performed well over the trailing twelve months ending April 30, 2015. The underlying funds’ performance varied as expected with the funds with a higher net exposure outperforming the funds with a lower net exposure. Long/Short and Tactical were the leading contributors while Opportunistic did not perform quite as strongly (which is to be expected given their more defensive nature).
Several manager changes we made during the fiscal year:
| | ● | | Tactical – one manager was redeemed in the fourth quarter of 2014. The manager was replaced in order to fund two new managers with more flexible investment styles to improve alternative-like exposure for this asset class. The new fund and separate account were added the same quarter. |
| | ● | | Long/Short – one manager was removed in the fourth quarter of 2014 due to concerns over the risk/return profile of the fund and ability to maintain performance with substantial growth in fund assets. The manager was replaced with a separate account manager in the same quarter. |
| | ● | | Opportunistic – one manager was removed due to the permanent closure of the fund. The proceeds were reinvested in the two funds and separate account that comprise the asset class holdings. |
Closing:
We appreciate your investment in the Redmont Resolute Fund. Please feel free to contact us with any questions.
|
Sincerely, |
 |
R. Scott Graham, CFA & Michael T. Lytle, CFA |
Portfolio Managers |
| | |
| Annual Report | April 30, 2015 | | 3 |
| | |
| Redmont Funds | | Shareholder Letter |
| | April 30, 2015 (Unaudited) |
IMPORTANT NOTES AND DISCLOSURES
The Fund’s investment objectives, risks, charges and expenses must be considered before investing. The prospectus contains this and other important information about the investment company, and may be obtained by calling 1-855-268-2242 or by visiting www.redmontfunds.com. Read it carefully before investing.
The views and information discussed in this commentary are as of the date of publication, are subject to change, and may not reflect the writer’s current views. The views expressed represent an assessment of market conditions at a specific point in time, are opinions only and should not be relied upon as investment advice regarding a particular investment or markets in general. Such information does not constitute a recommendation to buy or sell specific securities or investment vehicles. It should not be assumed that any investment will be profitable or will equal the performance of the portfolios or any securities or any sectors mentioned in this letter. The subject matter contained in this letter has been derived from several sources believed to be reliable and accurate at the time of compilation. Neither Highland Associates, Inc. nor the Funds accept any liability for losses either direct or consequential caused by the use of this information.
RISKS:
The Funds are structured with an Underlying Investment Strategy. This strategy adopts the risks of investments in Other Investment Companies. These risks include, but are not limited to higher expenses, allocation risk, underlying fund risk, transparency risk, and underlying fund managed portfolio risk. Investments which focus on alternative strategies are subject to increased risk and loss of principal and are not suitable for all investors. Swap Risk involves swap agreements and are subject to counterparty default risk and may not perform as intended. Derivatives Risk involves the exercise of skill and judgment. Derivatives may expire worthless or not perform as expected. Equity risk may cause the value of the securities held by the Funds to fall due to general market and economic conditions, perceptions regarding the industries in which the issuers of securities held by the Fund participate, or factors relating to specific companies in which the Fund invest.
The Funds’ investments in non-U.S. issuers may be even more volatile and may present more risks than investments in U.S. issuers.
Commodity Risk may subject the Funds to greater volatility than traditional investments because of global supply and demand, changes in interest rates, commodity index volatility, and factors affecting a particular industry or commodity. Commodity-linked investments may not move in the same direction and to the same extent as the underlying commodities.
| ii. | The HFRX Global Index is designed to be representative of the overall composition of the hedge fund universe, and includes convertible arbitrage, distressed securities, equity hedge, equity market neutral, event driven, macro, merger arbitrage, and relative value strategies. Investors cannot invest directly in an index. |
| iii. | The S&P 500 Index is an unmanaged index of 500 common stocks chosen for market size, liquidity, and industry group representation. It is a market-value weighted index. The Index is not actively managed and does not reflect any deduction for fees, expenses, or taxes. Investors cannot invest directly in this index. |
| iv. | The Morningstar Multi-Alternative Universe is designed to represent the exposure to alternative investment tactics. Funds in this category have the majority of their assets exposed to alternative strategies. An investor’s exposure to different tactics may change slightly over time in response to market movements. Funds in this category include both funds with static allocations to alternative strategies and funds tactically allocating among alternative strategies and asset classes. The gross short exposure is greater than 20%. |
| v. | Highland Associates, Inc. (the “Adviser”) has agreed, with respect to each share class of the Redmont Resolute Fund I, contractually to waive a portion of its Management Fee and/or reimburse Fund expenses in two ways. First, the Adviser will waive the portion of its 1.50% Management Fee and/or reimburse the Fund (or share class, as applicable) by an amount equal to any amount over the total of (i) 0.50% plus (ii) any sub-advisory fees paid by the Adviser (“Sub-Advisory Fees”). Second, and after the fee waiver and/or expense reimbursement described above has been applied, to the extent the Fund’s total annual expenses (exclusive of Distribution and Service (12b-1) Fees, Swap Fees and Expenses, Shareholder Services Fees, Acquired Fund Fees and Expenses, Sub-Advisory Fees, brokerage expenses, interest expense, taxes and extraordinary expenses) exceed 1.40% of the Fund’s average daily net assets, the Adviser has contractually agreed to also either reduce the fee payable by the amount of such excess, and/or to reimburse the Fund (or share class, as applicable) by the amount of such excess. This agreement is in effect through August 31, 2017. The Adviser will be permitted to recover expenses it has borne through the agreement to limit total annual expenses for each share class to 1.40% of the Fund’s average daily net assets, on a class-by-class basis, to the extent that the Fund’s expenses in later periods fall below the annual rates set forth in the relevant agreement. The Fund will not be obligated to pay any such deferred fees and expenses more than three years after the end of the fiscal year in which the fees and expense were deferred. The Adviser may not discontinue this agreement to waive fees and/or reimburse expenses without the approval by the Fund’s Board of Trustees. |
| vi. | Basis Point = 0.01%, 100 basis points would equal 1.0% |
| vii. | Highland Associates, Inc. has agreed to waive the portion of its 1.50% Management Fee in excess of any sub-advisory fees paid by the Adviser to sub-advisors in connection with the Redmont Resolute Fund II. This agreement is in effect through August 31, 2017. The Adviser may not discontinue this agreement to waive fees without the approval by the Fund’s Board of Trustees. |
| | |
| Redmont Funds | | Shareholder Letter |
| | April 30, 2015 (Unaudited) |
| viii. | The tactical asset allocation strategy is designed to provide investors with fluid exposure to global markets including primarily cash, fixed income, and equities. |
| ix. | The long/short equity strategy is designed to provide investors with hedged equity exposure using both fundamental and quantitative analysis. |
| x. | The other strategies allocation is designed to provide investors with exposure that has a lower correlation with the other segments of the Fund. The classification consists of but is not limited to trading strategies, managed futures, arbitrage, distressed securities, etc. |
ALPS Distributors, Inc. is the distributor for the Redmont Funds. R. Scott Graham and Michael T. Lytle are registered representatives of ALPS Distributors, Inc. CFA Institute Marks are trademarks owned by the CFA Institute.
| | |
| Annual Report | April 30, 2015 | | 5 |
| | |
| Redmont Resolute Fund I | | Performance Update |
| | April 30, 2015 (Unaudited) |
| | | | | | | | | | | | | | | | |
| Performance (for the period ended April 30, 2015) | |
Redmont Resolute Fund I | |
Cumulative Total Return | |
(for the period ended
April 30, 2015) | | Year-to-Date | | 1 Year | | | 3 Year | | | Since
Inception* | |
Class A (NAV)(a) | | 3.71% | | | 5.05% | | | | 3.50% | | | | 3.67% | |
Class I (NAV) | | 1.50% | | | 3.16% | | | | 3.15% | | | | 3.38% | |
HFRX Global Hedge Fund Index(b) | | 2.28% | | | 1.31% | | | | 2.85% | | | | 3.55% | |
S&P 500® Total Return Index(c) | | 1.92% | | | 12.98% | | | | 16.73% | | | | 18.87% | |
Dow Jones U.S. Select Dividend Index(d) | | -0.43% | | | 8.42% | | | | 15.56% | | | | 16.06% | |
| | | | | | | | | | | | |
* | | Fund inception date of 12/30/11. | | |
(a) | | Net Asset Value (NAV) is the share price without sales charges. | | |
(b) | | The HFRX Global Hedge Fund Index is designed to be representative of the overall composition of the hedge fund universe, and includes convertible arbitrage, distressed securities, equity hedge, equity market neutral, event driven, macro, merger arbitrage, and relative value strategies. The index is not actively managed and does not reflect any deduction of fees, expenses or taxes. An investor may not invest directly in an index. | | |
(c) | | The S&P 500® Total Return Index is the Standard & Poor’s composite index of 500 stocks, a widely recognized, unmanaged index of common stock prices. The index is not actively managed and does not reflect any deduction of fees, expenses or taxes. An investor may not invest directly in an index. | | |
| | |
| | |
(d) | | The Dow Jones U.S. Select Dividend Index represents the country’s top stocks by dividend yield, selected annually and subject to screening and buffering criteria. The index is not actively managed and does not reflect any deductions of fees, expenses or taxes. An investor may not invest directly in an index. | | |
Performance data quoted represents past performance. Past performance does not guarantee future results. Investment return and principal value of an investment will fluctuate so that an investor’s shares, when sold or redeemed, may be worth more or less than the original cost. Current performance data may be higher or lower than actual data quoted. For the most current month-end performance data please call 1-855-268-2242. | | |
The table does not reflect the deduction of taxes that a shareholder would pay on Fund distributions or the redemption of Fund shares. | | |
| | | | | | |
| | | Top Ten Holdings* | |
| (for the period ended April 30, 2015) | |
| | |
| As a percentage of Net Assets | |
| PIMCO Short-Term Fund, Institutional Class | | | 18.93% | |
| FPA Crescent Fund | | | 9.88% | |
| Morgan Stanley Institutional Fund, Inc. - Multi-Asset Portfolio, Class I | | | 9.30% | |
| AQR Risk Parity Fund, Class I | | | 6.70% | |
| AQR Multi Strategy Alternative Fund, Class I | | | 6.59% | |
| Diamond Hill Long-Short Fund, Class Y | | | 4.43% | |
| SPDR® S&P 500® ETF Trust | | | 1.73% | |
| iShares® MSCI EMU ETF | | | 1.71% | |
| iShares® MSCI Japan ETF | | | 1.48% | |
| PowerShares® Senior Loan Portfolio | | | 1.02% | |
| Top Ten Holdings | | | 61.77% | |
| * Holdings are subject to change. | | | | |
| Table presents indicative values only. | | | | |
| | | | | |
| | | | | |
| | | | | |
| | | | | |
| | | | | |
| | | | | |
| | | | | | | |
| | | | | | | |
| | | | | | | |
| | | | | | | |
| | | | | | | |
| | | | | | | |
| | | | | | | |
| | | | | | | |
| | | | | | | |
| | | | | | | |
| | | | | | | |
| | | | | | | |
| | | | | | | |
| | | | | | | |
| | | | | | | |
| | | | | | | |
| | | | | | | |
| | | | | | | |
| | | | | | | |
| | | | | | | |
| | | | | | | |
| | | | | | | |
| | | | | | | |
| | | | | | | |
| | | | | | | |
Performance of $10,000 Initial Investment (for the period ended April 30, 2015)
Comparison of change in value of a $10,000 investment (includes applicable sales loads)
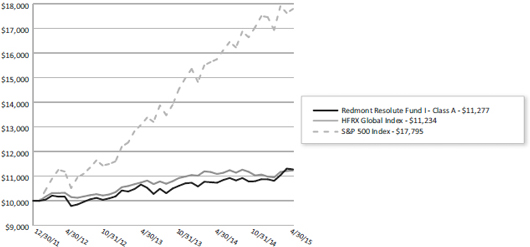
The chart represents historical performance of a hypothetical investment of $10,000 in the Fund since inception. Past performance does not guarantee future results. This chart does not reflect the deduction of taxes that a shareholder would pay on Fund distributions or the redemption of Fund shares.
| | |
| Redmont Resolute Fund II | | Performance Update |
| | April 30, 2015 (Unaudited) |
Performance (for the period ended April 30, 2015)
Redmont Resolute Fund II
| | | | | | | | | | | | | | |
Cumulative Total Return (for the period ended
April 30, 2015) | | Year-to-Date | | 1 Year | | | 3 Year | | | Since Inception* | |
| |
Class I (NAV) | | 1.62% | | | 4.16% | | | | 4.87% | | | | 5.42% | |
| |
HFRX Global Hedge Fund Index(a) | | 2.28% | | | 1.31% | | | | 2.85% | | | | 3.55% | |
| |
S&P 500® Total Return Index(b) | | 1.92% | | | 12.98% | | | | 16.73% | | | | 18.87% | |
| |
Dow Jones U.S. Select Dividend Index(c) | | -0.43% | | | 8.42% | | | | 15.56% | | | | 16.06% | |
| |
| | |
* | | Fund inception date of 12/30/11. |
(a) | | The HFRX Global Hedge Fund Index is designed to be representative of the overall composition of the hedge fund universe and includes convertible arbitrage, distressed securities, equity hedge, equity market neutral, event driven, macro, merger arbitrage and relative value strategies. The index is not actively managed and does not reflect any deduction of fees, expenses or taxes. An investor may not invest directly in an index. |
(b) | | The S&P 500® Total Return Index is the Standard & Poor’s composite index of 500 stocks, a widely recognized, unmanaged index of common stock prices. The index is not actively managed and does not reflect any deduction of fees, expenses or taxes. An investor may not invest directly in an index. |
(c) | | The Dow Jones U.S. Select Dividend Index represents the country’s top stocks by dividend yield, selected annually and subject to screening and buffering criteria. The index is not actively managed and does not reflect any deductions of fees, expenses or taxes. An investor may not invest directly in an index. |
Performance data quoted represents past performance. Past performance does not guarantee future results. Investment return and principal value of an investment will fluctuate so that an investor’s shares, when sold or redeemed, may be worth more or less than the original cost. Current performance data may be higher or lower than actual data quoted. For the most current month-end performance data please call 1-855-268-2242.
The table does not reflect the deduction of taxes that a shareholder would pay on Fund distributions or the redemption of Fund shares.
| | | | |
| | | Top Ten Holdings* (for the period ended April 30, 2015) |
| As a percentage of Net Assets | | |
| PIMCO Short-Term Fund, Institutional Class | | 14.56% |
| FPA Crescent Fund | | 9.82% |
| AQR Risk Parity Fund, Class I | | 9.52% |
| Morgan Stanley Institutional Fund, Inc. - Multi-Asset Portfolio, Class I | | 9.33% |
| AQR Multi Strategy Alternative Fund, Class I | | 9.01% |
| Diamond Hill Long-Short Fund, Class Y | | 8.72% |
| Nuveen Symphony Floating Rate Income Fund, Class I | | 1.03% |
| Apple, Inc. | | 0.19% |
| Nissan Auto Receivables Owner Trust 2015-A A1 | | 0.13% |
| Diamondback Energy, Inc. | | 0.10% |
| Top Ten Holdings | | 62.41% |
| * Holdings are subject to change. Table presents indicative values only. |
| |
| | | |
| | | |
| | | |
| | | |
| | | |
| | | |
| | | |
| | | |
| | | |
| | | |
| | | |
| | | |
| | | |
| | | |
| | | |
| | | |
| | | |
| | | |
| | | |
| | | |
| | | |
Performance of $10,000 Initial Investment (for the period ended April 30, 2015)
Comparison of change in value of a $10,000 investment
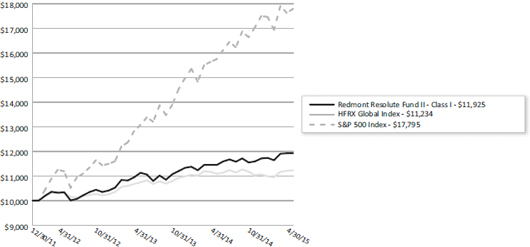
The chart represents historical performance of a hypothetical investment of $10,000 in the Fund since inception. Past performance does not guarantee future results. This chart does not reflect the deduction of taxes that a shareholder would pay on Fund distributions or the redemption of Fund shares.
| | |
| Annual Report | April 30, 2015 | | 7 |
| | |
| Redmont Funds | | Disclosure of Fund Expenses |
| | April 30, 2015 (Unaudited) |
As a shareholder of the Funds, you incur two types of costs: (1) transaction costs, including applicable sales charges (loads), redemption fees, wire fees and low balance fees; and (2) ongoing costs, including management fees, distribution and service (12b-1) fees, shareholder services fees and other Fund expenses. This example is intended to help you understand your indirect costs, also referred to as “ongoing costs” (in dollars), of investing in the Fund and to compare these costs with the ongoing costs of investing in other mutual funds.
This example is based on an investment of $1,000 invested at the beginning of the period and held for the six-month period of November 1, 2014 through April 30, 2015.
Actual Expenses The first line of the table below provides information about actual account values and actual expenses. You may use the information in this line, together with the amount you invested at the beginning of the period, to estimate the expenses that you paid over the period. Simply divide your account value by $1,000 (for example, an $8,600 account value divided by $1,000 = 8.6), then multiply the result by the number in the first line under the heading “Expenses Paid During Period” to estimate the expenses you paid on your account during this period.
Hypothetical Example for Comparison Purposes The second line of the table provides information about hypothetical account values and hypothetical expenses based on the Fund’s actual expense ratio and an assumed rate of return of 5% per year before expenses, which is not the Fund’s actual return. The hypothetical account values and expenses may not be used to estimate the actual ending account balance or expenses you paid for the period. You may use this information to compare ongoing costs of investing in the Fund and other funds. To do so, compare this 5% hypothetical example with the 5% hypothetical examples that appear in the shareholder reports of other funds.
Please note that the expenses shown in the table are meant to highlight your ongoing costs only and do not reflect any transactional costs, such as applicable sales charges (loads), redemption fees, wire fees and low balance fees. Therefore, the second line of the table is useful in comparing ongoing costs only and will not help you determine the relative total costs of owning different funds. In addition, if these transaction costs were included, your costs would be higher.
| | | | | | | | | | | | | | | | | | | | |
| | | BEGINNING
ACCOUNT VALUE 11/01/14 | | ENDING
ACCOUNT VALUE 04/30/15 | | EXPENSE
RATIO(a) | | EXPENSES PAID
DURING PERIOD
11/01/14-04/30/15(b) |
| Redmont Resolute Fund I | | | | | | | | |
Class A | | | | | | | | | | | | | | | | | | | | |
Actual | | | $ | 1,000.00 | | | | $ | 1,044.60 | | | | | 2.09 | % | | | $ | 10.60 | |
Hypothetical (5% return before expenses) | | | $ | 1,000.00 | | | | $ | 1,014.43 | | | | | 2.09 | % | | | $ | 10.44 | |
| | | | |
| | | | | | | | | |
Class I | | | | | | | | | | | | | | | | | | | | |
Actual | | | $ | 1,000.00 | | | | $ | 1,023.00 | | | | | 1.70 | % | | | $ | 8.53 | |
Hypothetical (5% return before expenses) | | | $ | 1,000.00 | | | | $ | 1,016.36 | | | | | 1.70 | % | | | $ | 8.50 | |
| | | | | | | | | |
| | | | |
| Redmont Resolute Fund II | | | | | | | | |
Class I | | | | | | | | | | | | | | | | | | | | |
Actual | | | $ | 1,000.00 | | | | $ | 1,028.70 | | | | | 0.35 | % | | | $ | 1.76 | |
Hypothetical (5% return before expenses) | | | $ | 1,000.00 | | | | $ | 1,023.06 | | | | | 0.35 | % | | | $ | 1.76 | |
| (a) | Annualized, based on the Fund’s most recent fiscal half year expenses. |
| (b) | Expenses are equal to the Fund’s annualized expense ratio multiplied by the average account value over the period, multiplied by the number of days in the most recent fiscal half-year (181)/365 (to reflect the half-year period). |
| | |
| Redmont Resolute Fund I | | Schedule of Investments |
| | April 30, 2015 |
| | | | | | | | |
| Description | | Shares | | | Value (Note 2) | |
| |
COMMON STOCKS (11.22%) | | | | | | | | |
ADVERTISING (0.09%) | | | | | | | | |
Alliance Data Systems Corp.(a) | | | 3 | | | $ | 892 | |
Omnicom Group, Inc.(b) | | | 27 | | | | 2,045 | |
| | | | | | | | |
| | | | | | | 2,937 | |
| | | | | | | | |
| | |
AEROSPACE & DEFENSE (0.43%) | | | | | | | | |
Cubic Corp. | | | 20 | | | | 992 | |
Exelis, Inc. | | | 22 | | | | 539 | |
General Dynamics Corp. | | | 15 | | | | 2,060 | |
Lockheed Martin Corp.(b) | | | 16 | | | | 2,986 | |
Northrop Grumman Corp.(b) | | | 15 | | | | 2,311 | |
Raytheon Co.(b) | | | 14 | | | | 1,456 | |
The Boeing Co. | | | 7 | | | | 1,003 | |
Triumph Group, Inc.(b) | | | 17 | | | | 1,007 | |
United Technologies Corp.(b) | | | 11 | | | | 1,251 | |
| | | | | | | | |
| | | | | | | 13,605 | |
| | | | | | | | |
| | |
AGRICULTURE (0.08%) | | | | | | | | |
Bunge, Ltd. | | | 17 | | | | 1,468 | |
Lorillard, Inc.(b) | | | 14 | | | | 978 | |
| | | | | | | | |
| | | | | | | 2,446 | |
| | | | | | | | |
| | |
AIRLINES (0.05%) | | | | | | | | |
Delta Air Lines, Inc. | | | 37 | | | | 1,652 | |
| | | | | | | | |
| | |
AUTO PARTS & EQUIPMENT (0.18%) | | | | | | | | |
Allison Transmission Holdings, Inc. | | | 23 | | | | 706 | |
Lear Corp. | | | 20 | | | | 2,220 | |
Tenneco, Inc.(a) | | | 46 | | | | 2,689 | |
| | | | | | | | |
| | | | | | | 5,615 | |
| | | | | | | | |
| | |
BANKS (1.09%) | | | | | | | | |
Bank of America Corp.(b) | | | 85 | | | | 1,354 | |
BB&T Corp.(b) | | | 82 | | | | 3,140 | |
Capital One Financial Corp.(b) | | | 49 | | | | 3,962 | |
Citigroup, Inc.(b) | | | 74 | | | | 3,946 | |
Fifth Third Bancorp(b) | | | 179 | | | | 3,580 | |
Huntington Bancshares, Inc.(b) | | | 122 | | | | 1,325 | |
JPMorgan Chase & Co.(b) | | | 64 | | | | 4,049 | |
Regions Financial Corp.(b) | | | 131 | | | | 1,288 | |
State Street Corp.(b) | | | 25 | | | | 1,928 | |
SunTrust Banks, Inc.(b) | | | 29 | | | | 1,203 | |
The Goldman Sachs Group, Inc.(b) | | | 15 | | | | 2,946 | |
The PNC Financial Services Group, Inc.(b) | | | 21 | | | | 1,926 | |
Wells Fargo & Co.(b) | | | 72 | | | | 3,967 | |
| | | | | | | | |
| | | | | | | 34,614 | |
| | | | | | | | |
| | |
BEVERAGES (0.04%) | | | | | | | | |
Constellation Brands, Inc., Class A(a) | | | 12 | | | | 1,391 | |
| | | | | | | | |
| | |
| See Notes to Financial Statements. | | |
Annual Report | April 30, 2015 | | 9 |
| | |
| Redmont Resolute Fund I | | Schedule of Investments |
| | April 30, 2015 |
| | | | | | | | |
| Description | | Shares | | | Value (Note 2) | |
| |
BIOTECHNOLOGY (0.18%) | | | | | | | | |
Amgen, Inc. | | | 16 | | | $ | 2,527 | |
Celgene Corp.(a) | | | 7 | | | | 756 | |
Gilead Sciences, Inc.(a) | | | 24 | | | | 2,412 | |
| | | | | | | | |
| | | | | | | 5,695 | |
| | | | | | | | |
| | |
BUILDING MATERIALS (0.09%) | | | | | | | | |
Masco Corp. | | | 105 | | | | 2,781 | |
| | | | | | | | |
| | |
CHEMICALS (0.20%) | | | | | | | | |
Huntsman Corp.(b) | | | 88 | | | | 2,028 | |
The Mosaic Co. | | | 46 | | | | 2,024 | |
The Valspar Corp. | | | 28 | | | | 2,271 | |
| | | | | | | | |
| | | | | | | 6,323 | |
| | | | | | | | |
| | |
COAL (0.01%) | | | | | | | | |
Cloud Peak Energy, Inc.(a) | | | 41 | | | | 266 | |
| | | | | | | | |
| | |
COMMERCIAL SERVICES (0.62%) | | | | | | | | |
Apollo Education Group, Inc.(a) | | | 45 | | | | 755 | |
Civeo Corp. | | | 130 | | | | 607 | |
Equifax, Inc. | | | 25 | | | | 2,423 | |
EVERTEC, Inc. | | | 85 | | | | 1,762 | |
Global Payments, Inc. | | | 14 | | | | 1,404 | |
H&R Block, Inc. | | | 67 | | | | 2,026 | |
ManpowerGroup, Inc.(b) | | | 29 | | | | 2,475 | |
Moody’s Corp.(b) | | | 19 | | | | 2,043 | |
Robert Half International, Inc.(b) | | | 35 | | | | 1,941 | |
Total System Services, Inc. | | | 43 | | | | 1,701 | |
Towers Watson & Co., Class A(b) | | | 20 | | | | 2,538 | |
| | | | | | | | |
| | | | | | | 19,675 | |
| | | | | | | | |
| | |
COMPUTERS (0.63%) | | | | | | | | |
Amdocs, Ltd.(b) | | | 36 | | | | 1,983 | |
Apple, Inc.(b) | | | 26 | | | | 3,254 | |
Brocade Communications Systems, Inc. | | | 270 | | | | 3,051 | |
EMC Corp.(b) | | | 95 | | | | 2,556 | |
Hewlett-Packard Co. | | | 68 | | | | 2,242 | |
NetApp, Inc.(b) | | | 47 | | | | 1,704 | |
Seagate Technology PLC(b) | | | 37 | | | | 2,173 | |
Western Digital Corp.(b) | | | 29 | | | | 2,834 | |
| | | | | | | | |
| | | | | | | 19,797 | |
| | | | | | | | |
| | |
DISTRIBUTION & WHOLESALE (0.11%) | | | | | | | | |
Arrow Electronics, Inc.(a)(b) | | | 41 | | | | 2,448 | |
WESCO International, Inc.(a) | | | 16 | | | | 1,154 | |
| | | | | | | | |
| | | | | | | 3,602 | |
| | | | | | | | |
| | |
DIVERSIFIED FINANCIAL SERVICES (0.45%) | | | | | | | | |
Ally Financial, Inc.(a) | | | 73 | | | | 1,598 | |
Discover Financial Services(b) | | | 58 | | | | 3,362 | |
| | |
| See Notes to Financial Statements. | | |
10 | | www.redmontfunds.com |
| | |
| Redmont Resolute Fund I | | Schedule of Investments |
| | April 30, 2015 |
| | | | | | | | |
| Description | | Shares | | | Value (Note 2) | |
| |
DIVERSIFIED FINANCIAL SERVICES (0.45%) (continued) | | | | | | | | |
Navient Corp. | | | 113 | | | $ | 2,208 | |
Outerwall, Inc. | | | 22 | | | | 1,462 | |
Raymond James Financial, Inc.(b) | | | 23 | | | | 1,300 | |
SLM Corp.(a) | | | 152 | | | | 1,549 | |
TD Ameritrade Holding Corp.(b) | | | 37 | | | | 1,341 | |
The Charles Schwab Corp.(b) | | | 41 | | | | 1,251 | |
| | | | | | | | |
| | | | | | | 14,071 | |
| | | | | | | | |
| | |
ELECTRIC (0.04%) | | | | | | | | |
AES Corp. | | | 105 | | | | 1,391 | |
| | | | | | | | |
| | |
ELECTRICAL COMPONENTS & EQUIPMENT (0.05%) | | | | | | | | |
Emerson Electric Co. | | | 25 | | | | 1,471 | |
| | | | | | | | |
| | |
ELECTRONICS (0.33%) | | | | | | | | |
Avnet, Inc.(b) | | | 47 | | | | 2,004 | |
Flextronics International, Ltd.(a)(b) | | | 264 | | | | 3,042 | |
Honeywell International, Inc.(b) | | | 13 | | | | 1,312 | |
Jabil Circuit, Inc. | | | 109 | | | | 2,455 | |
TE Connectivity, Ltd. | | | 25 | | | | 1,664 | |
| | | | | | | | |
| | | | | | | 10,477 | |
| | | | | | | | |
| | |
ENTERTAINMENT (0.03%) | | | | | | | | |
Six Flags Entertainment Corp. | | | 18 | | | | 846 | |
| | | | | | | | |
| | |
FOOD (0.08%) | | | | | | | | |
Tyson Foods, Inc., Class A | | | 65 | | | | 2,568 | |
| | | | | | | | |
| | |
FOREST PRODUCTS & PAPER (0.08%) | | | | | | | | |
MeadWestvaco Corp. | | | 52 | | | | 2,538 | |
| | | | | | | | |
| | |
HEALTHCARE - PRODUCTS (0.14%) | | | | | | | | |
Medtronic PLC | | | 35 | | | | 2,606 | |
Zimmer Holdings, Inc. | | | 17 | | | | 1,867 | |
| | | | | | | | |
| | | | | | | 4,473 | |
| | | | | | | | |
| | |
HEALTHCARE - SERVICES (0.36%) | | | | | | | | |
Anthem, Inc. | | | 20 | | | | 3,019 | |
Cigna Corp. | | | 21 | | | | 2,618 | |
ICON PLC(a) | | | 24 | | | | 1,544 | |
Laboratory Corp. of America Holdings(a) | | | 15 | | | | 1,793 | |
Universal Health Services, Inc., Class B(b) | | | 21 | | | | 2,456 | |
| | | | | | | | |
| | | | | | | 11,430 | |
| | | | | | | | |
| | |
HOUSEWARES (0.16%) | | | | | | | | |
Avery Dennison Corp.(b) | | | 48 | | | | 2,669 | |
| | |
| See Notes to Financial Statements. | | |
Annual Report | April 30, 2015 | | 11 |
| | |
| Redmont Resolute Fund I | | Schedule of Investments |
| | April 30, 2015 |
| | | | | | | | |
| Description | | Shares | | | Value (Note 2) | |
| |
HOUSEWARES (0.16%) (continued) | | | | | | | | |
Newell Rubbermaid, Inc.(b) | | | 64 | | | $ | 2,440 | |
| | | | | | | | |
| | | | | | | 5,109 | |
| | | | | | | | |
| | |
INSURANCE (0.96%) | | | | | | | | |
ACE, Ltd.(b) | | | 24 | | | | 2,568 | |
Alleghany Corp.(a) | | | 5 | | | | 2,368 | |
American International Group, Inc. | | | 40 | | | | 2,252 | |
Aon PLC | | | 29 | | | | 2,791 | |
Berkshire Hathaway, Inc., Class B(a)(b) | | | 19 | | | | 2,683 | |
MetLife, Inc.(b) | | | 22 | | | | 1,128 | |
Prudential Financial, Inc. | | | 16 | | | | 1,306 | |
Reinsurance Group of America, Inc.(b) | | | 13 | | | | 1,191 | |
The Allstate Corp.(b) | | | 43 | | | | 2,995 | |
The Travelers Companies, Inc.(b) | | | 18 | | | | 1,820 | |
Torchmark Corp.(b) | | | 23 | | | | 1,290 | |
Validus Holdings, Ltd.(b) | | | 60 | | | | 2,510 | |
WR Berkley Corp. | | | 50 | | | | 2,449 | |
XL Group PLC | | | 82 | | | | 3,040 | |
| | | | | | | | |
| | | | | | | 30,391 | |
| | | | | | | | |
| | |
INTERNET (0.24%) | | | | | | | | |
Baidu, Inc., Sponsored ADR(a) | | | 4 | | | | 801 | |
CDW Corp. | | | 51 | | | | 1,954 | |
Expedia, Inc. | | | 11 | | | | 1,037 | |
Google, Inc., Class A(a) | | | 3 | | | | 1,646 | |
Google, Inc., Class C(a) | | | 1 | | | | 539 | |
Phoenix New Media, Ltd., ADR(a) | | | 81 | | | | 584 | |
Yahoo!, Inc.(a) | | | 24 | | | | 1,022 | |
| | | | | | | | |
| | | | | | | 7,583 | |
| | | | | | | | |
| | |
MACHINERY - DIVERSIFIED (0.01%) | | | | | | | | |
Zebra Technologies Corp., Class A(a) | | | 4 | | | | 368 | |
| | | | | | | | |
| | |
MEDIA (0.53%) | | | | | | | | |
CBS Corp., Class B(b) | | | 22 | | | | 1,367 | |
Comcast Corp., Class A(b) | | | 49 | | | | 2,830 | |
Liberty Broadband Corp., Class C(a)(b) | | | 10 | | | | 543 | |
Liberty Global PLC, Class C(a) | | | 79 | | | | 3,985 | |
Liberty Media Corp., Class A(a)(b) | | | 16 | | | | 614 | |
Liberty Media Corp., Class C(a)(b) | | | 25 | | | | 949 | |
Starz, Class A(a) | | | 15 | | | | 590 | |
Time Warner Cable, Inc. | | | 3 | | | | 467 | |
Time, Inc.(b) | | | 21 | | | | 479 | |
Tribune Media Co., Class A | | | 26 | | | | 1,458 | |
Twenty-First Century Fox, Inc., Class A | | | 43 | | | | 1,465 | |
Viacom, Inc., Class B(b) | | | 27 | | | | 1,875 | |
| | | | | | | | |
| | | | | | | 16,622 | |
| | | | | | | | |
| | |
| See Notes to Financial Statements. | | |
12 | | www.redmontfunds.com |
| | |
| Redmont Resolute Fund I | | Schedule of Investments |
| | April 30, 2015 |
| | | | | | | | |
| Description | | Shares | | | Value (Note 2) | |
| |
METAL FABRICATE & HARDWARE (0.03%) | | | | | | | | |
The Timken Co. | | | 25 | | | $ | 982 | |
| | | | | | | | |
| | |
MINING (0.04%) | | | | | | | | |
Barrick Gold Corp. | | | 90 | | | | 1,172 | |
| | | | | | | | |
| | |
MISCELLANEOUS MANUFACTURING (0.35%) | | | | | | | | |
Carlisle Companies, Inc.(b) | | | 9 | | | | 869 | |
Crane Co.(b) | | | 19 | | | | 1,161 | |
Danaher Corp.(b) | | | 33 | | | | 2,702 | |
Ingersoll-Rand PLC | | | 50 | | | | 3,292 | |
Parker-Hannifin Corp. | | | 9 | | | | 1,074 | |
Textron, Inc. | | | 44 | | | | 1,935 | |
| | | | | | | | |
| | | | | | | 11,033 | |
| | | | | | | | |
| | |
OIL & GAS (1.10%) | | | | | | | | |
Anadarko Petroleum Corp. | | | 16 | | | | 1,506 | |
Canadian Natural Resources, Ltd.(b) | | | 67 | | | | 2,228 | |
Diamondback Energy, Inc.(a)(b) | | | 52 | | | | 4,294 | |
Energen Corp. | | | 36 | | | | 2,562 | |
EOG Resources, Inc.(b) | | | 23 | | | | 2,276 | |
EQT Corp. | | | 15 | | | | 1,349 | |
Exxon Mobil Corp.(b) | | | 34 | | | | 2,970 | |
Kosmos Energy, Ltd.(a) | | | 95 | | | | 929 | |
Marathon Petroleum Corp. | | | 23 | | | | 2,267 | |
Occidental Petroleum Corp. | | | 34 | | | | 2,723 | |
Parsley Energy, Inc., Class A(a)(b) | | | 229 | | | | 3,971 | |
Phillips 66(b) | | | 41 | | | | 3,252 | |
Precision Drilling Corp. | | | 94 | | | | 683 | |
QEP Resources, Inc. | | | 91 | | | | 2,047 | |
Rice Energy, Inc.(a)(b) | | | 74 | | | | 1,823 | |
| | | | | | | | |
| | | | | | | 34,880 | |
| | | | | | | | |
| | |
PACKAGING & CONTAINERS (0.28%) | | | | | | | | |
Berry Plastics Group, Inc.(a) | | | 52 | | | | 1,780 | |
Crown Holdings, Inc.(a)(b) | | | 40 | | | | 2,170 | |
Graphic Packaging Holding Co.(b) | | | 273 | | | | 3,849 | |
Packaging Corp. of America | | | 17 | | | | 1,176 | |
| | | | | | | | |
| | | | | | | 8,975 | |
| | | | | | | | |
| | |
PHARMACEUTICALS (0.77%) | | | | | | | | |
AbbVie, Inc. | | | 38 | | | | 2,457 | |
Cardinal Health, Inc.(b) | | | 29 | | | | 2,446 | |
Express Scripts Holding Co.(a)(b) | | | 37 | | | | 3,197 | |
Johnson & Johnson | | | 15 | | | | 1,488 | |
McKesson Corp.(b) | | | 11 | | | | 2,457 | |
Merck & Co., Inc. | | | 36 | | | | 2,144 | |
Novartis AG, Sponsored ADR | | | 10 | | | | 1,018 | |
Omnicare, Inc.(b) | | | 31 | | | | 2,727 | |
Pfizer, Inc. | | | 60 | | | | 2,036 | |
Shire PLC, ADR | | | 5 | | | | 1,218 | |
| | |
| See Notes to Financial Statements. | | |
Annual Report | April 30, 2015 | | 13 |
| | |
| Redmont Resolute Fund I | | Schedule of Investments |
| | April 30, 2015 |
| | | | | | | | |
| Description | | Shares | | | Value (Note 2) | |
| |
PHARMACEUTICALS (0.77%) (continued) | | | | | | | | |
Teva Pharmaceutical Industries, Ltd., Sponsored ADR | | | 50 | | | $ | 3,021 | |
| | | | | | | | |
| | | | | | | 24,209 | |
| | | | | | | | |
| | |
REAL ESTATE INVESTMENT TRUSTS (0.10%) | | | | | | | | |
American Capital Agency Corp. | | | 53 | | | | 1,094 | |
American Homes 4 Rent, Class A | | | 41 | | | | 692 | |
American Residential Properties, Inc.(a) | | | 33 | | | | 619 | |
Boston Properties, Inc. | | | 5 | | | | 662 | |
| | | | | | | | |
| | | | | | | 3,067 | |
| | | | | | | | |
| | |
RETAIL (0.31%) | | | | | | | | |
CVS Health Corp.(b) | | | 28 | | | | 2,780 | |
Macy’s, Inc.(b) | | | 37 | | | | 2,391 | |
The Gap, Inc. | | | 51 | | | | 2,022 | |
The Home Depot, Inc.(b) | | | 23 | | | | 2,461 | |
| | | | | | | | |
| | | | | | | 9,654 | |
| | | | | | | | |
| | |
SAVINGS & LOANS (0.05%) | | | | | | | | |
Investors Bancorp, Inc. | | | 130 | | | | 1,539 | |
| | | | | | | | |
| | |
SEMICONDUCTORS (0.28%) | | | | | | | | |
Avago Technologies, Ltd. | | | 13 | | | | 1,519 | |
NXP Semiconductors NV(a) | | | 31 | | | | 2,980 | |
ON Semiconductor Corp.(a)(b) | | | 204 | | | | 2,350 | |
Texas Instruments, Inc.(b) | | | 39 | | | | 2,114 | |
| | | | | | | | |
| | | | | | | 8,963 | |
| | | | | | | | |
| | |
SHIPBUILDING (0.07%) | | | | | | | | |
Huntington Ingalls Industries, Inc.(b) | | | 18 | | | | 2,369 | |
| | | | | | | | |
| | |
SOFTWARE (0.33%) | | | | | | | | |
Activision Blizzard, Inc. | | | 56 | | | | 1,278 | |
Fidelity National Information Services, Inc. | | | 29 | | | | 1,812 | |
Microsoft Corp.(b) | | | 63 | | | | 3,064 | |
NetEase, Inc., ADR | | | 11 | | | | 1,410 | |
Oracle Corp.(b) | | | 64 | | | | 2,792 | |
| | | | | | | | |
| | | | | | | 10,356 | |
| | | | | | | | |
| | |
TELECOMMUNICATIONS (0.25%) | | | | | | | | |
Cisco Systems, Inc.(b) | | | 61 | | | | 1,759 | |
Harris Corp. | | | 19 | | | | 1,525 | |
Motorola Solutions, Inc.(b) | | | 23 | | | | 1,374 | |
Qorvo, Inc.(a) | | | 28 | | | | 1,845 | |
Verizon Communications, Inc. | | | 27 | | | | 1,362 | |
| | | | | | | | |
| | | | | | | 7,865 | |
| | | | | | | | |
| | |
TOTAL COMMON STOCKS (Cost $293,102) | | | | | | | 354,801 | |
| |
| | |
| See Notes to Financial Statements. | | |
14 | | www.redmontfunds.com |
| | |
| Redmont Resolute Fund I | | Schedule of Investments |
| | April 30, 2015 |
| | | | | | | | |
| Description | | Shares | | | Value (Note 2) | |
| |
EXCHANGE TRADED FUNDS (9.69%) | | | | | | | | |
iShares® Emerging Markets Corporate Bond ETF | | | 413 | | | $ | 20,960 | |
iShares® Europe ETF | | | 532 | | | | 24,515 | |
iShares® iBoxx $ Investment Grade Corporate Bond ETF | | | 191 | | | | 22,908 | |
iShares® MSCI EMU ETF | | | 1,369 | | | | 53,993 | |
iShares® MSCI India ETF | | | 399 | | | | 11,725 | |
iShares® MSCI Japan ETF | | | 3,634 | | | | 46,733 | |
iShares® MSCI Mexico Capped ETF | | | 80 | | | | 4,689 | |
iShares® Russell 2000 ETF | | | 154 | | | | 18,659 | |
PowerShares® Senior Loan Portfolio | | | 1,336 | | | | 32,304 | |
SPDR® S&P 500® ETF Trust | | | 262 | | | | 54,632 | |
Vanguard Total International Bond ETF | | | 283 | | | | 15,135 | |
| | | | | | | | |
| | | | | | | 306,253 | |
| | | | | | | | |
| | |
TOTAL EXCHANGE TRADED FUNDS (Cost $288,377) | | | | | | | 306,253 | |
| |
| | |
LIMITED PARTNERSHIPS (0.02%) | | | | | | | | |
OIL & GAS (0.02%) | | | | | | | | |
Viper Energy Partners LP | | | 39 | | | | 804 | |
| | | | | | | | |
| | |
TOTAL LIMITED PARTNERSHIPS (Cost $844) | | | | | | | 804 | |
| |
| | |
OPEN-END MUTUAL FUNDS (55.82%) | | | | | | | | |
AQR Multi Strategy Alternative Fund, Class I | | | 21,230 | | | | 208,477 | |
AQR Risk Parity Fund, Class I | | | 19,695 | | | | 211,722 | |
Diamond Hill Long-Short Fund, Class Y(a) | | | 5,696 | | | | 139,958 | |
FPA Crescent Fund | | | 9,133 | | | | 312,343 | |
Morgan Stanley Institutional Fund, Inc. - Multi-Asset Portfolio, Class I | | | 26,075 | | | | 293,866 | |
PIMCO Short-Term Fund, Institutional Class | | | 61,047 | | | | 598,265 | |
| | | | | | | | |
| | | | | | | 1,764,631 | |
| | | | | | | | |
| | |
TOTAL OPEN-END MUTUAL FUNDS (Cost $1,685,855) | | | | | | | 1,764,631 | |
| |
| | |
| | | Principal Amount/
Shares | | | Value (Note 2) | |
| |
SHORT TERM INVESTMENTS (12.94%) | | | | | | | | |
MONEY MARKET FUNDS (12.78%) | | | | | | | | |
Dreyfus Treasury Cash Management Fund, Institutional Class, 7-day yield, 0.010% | | | 403,944 | | | | 403,944 | |
| | | | | | | | |
| | |
U.S. TREASURY BILLS (0.16%) | | | | | | | | |
0.208%, 03/31/2016(b)(c) | | $ | 5,000 | | | | 4,990 | |
| | | | | | | | |
| | |
TOTAL SHORT TERM INVESTMENTS (Cost $408,934) | | | | | | | 408,934 | |
| |
| | |
| See Notes to Financial Statements. | | |
Annual Report | April 30, 2015 | | 15 |
| | |
| Redmont Resolute Fund I | | Schedule of Investments |
| | April 30, 2015 |
| | | | | | | | |
| | | | | | Value (Note 2) | |
| |
TOTAL INVESTMENTS (89.69%) (Cost $2,677,112) | | | | | | $ | 2,835,423 | |
| | |
SEGREGATED CASH WITH BROKERS (16.36%)(d) | | | | | | | 517,259 | |
| | |
SECURITIES SOLD SHORT (-5.00%) (Proceeds $148,268) | | | | | | $ | (158,177) | |
| | |
LIABILITIES IN EXCESS OF OTHER ASSETS (-1.05%) | | | | | | | (33,298) | |
| |
NET ASSETS (100.00%) | | | | | | $ | 3,161,207 | |
| |
| | |
| SCHEDULE OF SECURITIES SOLD SHORT | | | | | | | | |
| | | Shares | | | Value (Note 2) | |
| |
COMMON STOCKS (-5.00%) | | | | | | | | |
APPAREL (-0.05%) | | | | | | | | |
Under Armour, Inc., Class A | | | (21) | | | $ | (1,629) | |
| | | | | | | | |
| | |
AUTO MANUFACTURERS (-0.02%) | | | | | | | | |
Tesla Motors, Inc. | | | (3) | | | | (678) | |
| | | | | | | | |
| | |
AUTO PARTS & EQUIPMENT (-0.06%) | | | | | | | | |
Autoliv, Inc. | | | (11) | | | | (1,306) | |
Dorman Products, Inc. | | | (15) | | | | (702) | |
| | | | | | | | |
| | | | | | | (2,008) | |
| | | | | | | | |
BANKS (-0.39%) | | | | | | | | |
BancorpSouth, Inc. | | | (39) | | | | (944) | |
Bank of Hawaii Corp. | | | (12) | | | | (725) | |
Community Bank System, Inc. | | | (27) | | | | (944) | |
CVB Financial Corp. | | | (57) | | | | (892) | |
First Financial Bankshares, Inc. | | | (25) | | | | (724) | |
Glacier Bancorp, Inc. | | | (30) | | | | (790) | |
HDFC Bank, Ltd., ADR | | | (11) | | | | (625) | |
Home BancShares, Inc. | | | (27) | | | | (888) | |
PacWest Bancorp | | | (17) | | | | (767) | |
Trustmark Corp. | | | (41) | | | | (976) | |
UMB Financial Corp. | | | (14) | | | | (697) | |
United Bankshares, Inc. | | | (39) | | | | (1,465) | |
Valley National Bancorp | | | (73) | | | | (688) | |
Westamerica Bancorporation | | | (27) | | | | (1,176) | |
| | | | | | | | |
| | | | | | | (12,301) | |
| | | | | | | | |
BEVERAGES (-0.03%) | | | | | | | | |
Keurig Green Mountain, Inc. | | | (7) | | | | (815) | |
| | | | | | | | |
| | |
BIOTECHNOLOGY (-0.01%) | | | | | | | | |
Puma Biotechnology, Inc. | | | (2) | | | | (361) | |
| | | | | | | | |
| | |
BUILDING MATERIALS (-0.07%) | | | | | | | | |
Trex Co., Inc. | | | (17) | | | | (798) | |
USG Corp. | | | (36) | | | | (955) | |
| | |
| See Notes to Financial Statements. | | |
16 | | www.redmontfunds.com |
| | |
| Redmont Resolute Fund I | | Schedule of Investments |
| | April 30, 2015 |
| | | | | | | | |
| | | Shares | | | Value (Note 2) | |
| |
BUILDING MATERIALS (-0.07%) (continued) | | | | | | | | |
Vulcan Materials Co. | | | (7) | | | $ | (599) | |
| | | | | | | | |
| | | | | | | (2,352) | |
| | | | | | | | |
CHEMICALS (-0.14%) | | | | | | | | |
Air Products & Chemicals, Inc. | | | (6) | | | | (860) | |
EI du Pont de Nemours & Co. | | | (21) | | | | (1,537) | |
FMC Corp. | | | (18) | | | | (1,068) | |
Intrepid Potash, Inc. | | | (73) | | | | (915) | |
| | | | | | | | |
| | | | | | | (4,380) | |
| | | | | | | | |
COMMERCIAL SERVICES (-0.20%) | | | | | | | | |
Aramark | | | (29) | | | | (891) | |
Avis Budget Group, Inc. | | | (21) | | | | (1,137) | |
Monro Muffler Brake, Inc. | | | (33) | | | | (1,976) | |
Ritchie Bros. Auctioneers, Inc. | | | (48) | | | | (1,214) | |
Rollins, Inc. | | | (43) | | | | (1,067) | |
| | | | | | | | |
| | | | | | | (6,285) | |
| | | | | | | | |
COMPUTERS (-0.17%) | | | | | | | | |
3D Systems Corp. | | | (26) | | | | (652) | |
Infosys, Ltd., Sponsored ADR | | | (50) | | | | (1,549) | |
VeriFone Systems, Inc. | | | (55) | | | | (1,967) | |
Wipro, Ltd., ADR | | | (116) | | | | (1,331) | |
| | | | | | | | |
| | | | | | | (5,499) | |
| | | | | | | | |
COSMETICS & PERSONAL CARE (-0.04%) | | | | | | | | |
Colgate-Palmolive Co. | | | (18) | | | | (1,211) | |
| | | | | | | | |
| | |
DISTRIBUTION & WHOLESALE (-0.10%) | | | | | | | | |
Fastenal Co. | | | (37) | | | | (1,577) | |
WW Grainger, Inc. | | | (7) | | | | (1,739) | |
| | | | | | | | |
| | | | | | | (3,316) | |
| | | | | | | | |
DIVERSIFIED FINANCIAL SERVICES (-0.11%) | | | | | | | | |
Eaton Vance Corp. | | | (30) | | | | (1,232) | |
Financial Engines, Inc. | | | (25) | | | | (1,054) | |
LPL Financial Holdings, Inc. | | | (29) | | | | (1,174) | |
| | | | | | | | |
| | | | | | | (3,460) | |
| | | | | | | | |
ELECTRIC (-0.02%) | | | | | | | | |
Ormat Technologies, Inc. | | | (17) | | | | (622) | |
| | | | | | | | |
| | |
ELECTRONICS (-0.19%) | | | | | | | | |
Agilent Technologies, Inc. | | | (19) | | | | (786) | |
Itron, Inc. | | | (38) | | | | (1,363) | |
LG Display Co., Ltd., ADR | | | (99) | | | | (1,368) | |
National Instruments Corp. | | | (52) | | | | (1,487) | |
Trimble Navigation, Ltd. | | | (45) | | | | (1,144) | |
| | | | | | | | |
| | | | | | | (6,148) | |
| | | | | | | | |
| | |
ENTERTAINMENT (-0.04%) | | | | | | | | |
DreamWorks Animation SKG, Inc., Class A | | | (48) | | | | (1,251) | |
| | | | | | | | |
| | |
FOOD (-0.37%) | | | | | | | | |
Campbell Soup Co. | | | (25) | | | | (1,118) | |
Flowers Foods, Inc. | | | (53) | | | | (1,184) | |
McCormick & Co., Inc. | | | (15) | | | | (1,130) | |
Mondelez International, Inc., Class A | | | (33) | | | | (1,266) | |
Snyder’s-Lance, Inc. | | | (17) | | | | (502) | |
| | |
| See Notes to Financial Statements. | | |
Annual Report | April 30, 2015 | | 17 |
| | |
| Redmont Resolute Fund I | | Schedule of Investments |
| | April 30, 2015 |
| | | | | | | | |
| | | Shares | | | Value (Note 2) | |
| |
FOOD (-0.37%) (continued) | | | | | | | | |
Sprouts Farmers Market, Inc. | | | (44) | | | $ | (1,407) | |
The Fresh Market, Inc. | | | (34) | | | | (1,195) | |
The Hain Celestial Group, Inc. | | | (19) | | | | (1,145) | |
The JM Smucker Co. | | | (10) | | | | (1,159) | |
United Natural Foods, Inc. | | | (22) | | | | (1,484) | |
| | | | | | | | |
| | | | | | | (11,590) | |
| | | | | | | | |
| | |
FOREST PRODUCTS & PAPER (-0.02%) | | | | | | | | |
Wausau Paper Corp. | | | (62) | | | | (578) | |
| | | | | | | | |
| | |
HEALTHCARE - PRODUCTS (-0.12%) | | | | | | | | |
Henry Schein, Inc. | | | (6) | | | | (823) | |
ResMed, Inc. | | | (11) | | | | (703) | |
Sirona Dental Systems, Inc. | | | (9) | | | | (835) | |
West Pharmaceutical Services, Inc. | | | (30) | | | | (1,598) | |
| | | | | | | | |
| | | | | | | (3,959) | |
| | | | | | | | |
| | |
HEALTHCARE - SERVICES (-0.03%) | | | | | | | | |
Health Net, Inc. | | | (17) | | | | (895) | |
| | | | | | | | |
| | |
HOME BUILDERS (-0.02%) | | | | | | | | |
Lennar Corp., Class A | | | (13) | | | | (595) | |
| | | | | | | | |
| | |
HOME FURNISHINGS (-0.02%) | | | | | | | | |
Leggett & Platt, Inc. | | | (17) | | | | (722) | |
| | | | | | | | |
| | |
HOUSEWARES (-0.12%) | | | | | | | | |
The Clorox Co. | | | (12) | | | | (1,273) | |
The Scotts Miracle-Gro Co., Class A | | | (12) | | | | (774) | |
Tumi Holdings, Inc. | | | (69) | | | | (1,614) | |
| | | | | | | | |
| | | | | | | (3,661) | |
| | | | | | | | |
| | |
INTERNET (-0.26%) | | | | | | | | |
Cogent Communications Holdings, Inc. | | | (17) | | | | (595) | |
Equinix, Inc. | | | (7) | | | | (1,792) | |
Internap Corp. | | | (65) | | | | (611) | |
Netflix, Inc. | | | (2) | | | | (1,113) | |
Pandora Media, Inc. | | | (69) | | | | (1,231) | |
Shutterstock, Inc. | | | (7) | | | | (473) | |
Twitter, Inc. | | | (22) | | | | (857) | |
Yelp, Inc. | | | (16) | | | | (630) | |
Zillow, Inc., Class A | | | (10) | | | | (976) | |
| | | | | | | | |
| | | | | | | (8,278) | |
| | | | | | | | |
| | |
LEISURE TIME (-0.03%) | | | | | | | | |
Qunar Cayman Islands, Ltd., ADR | | | (22) | | | | (1,030) | |
| | | | | | | | |
| | |
METAL FABRICATE & HARDWARE (-0.02%) | | | | | | | | |
Sun Hydraulics Corp. | | | (15) | | | | (584) | |
| | | | | | | | |
| | | | | | | | |
| | |
MINING (-0.02%) | | | | | | | | |
Teck Resources, Ltd., Class B | | | (40) | | | | (607) | |
| | | | | | | | |
| | |
MISCELLANEOUS MANUFACTURING (-0.09%) | | | | | | | | |
AptarGroup, Inc. | | | (14) | | | | (869) | |
Proto Labs, Inc. | | | (24) | | | | (1,680) | |
| | |
| See Notes to Financial Statements. | | |
18 | | www.redmontfunds.com |
| | |
| Redmont Resolute Fund I | | Schedule of Investments |
| | April 30, 2015 |
| | | | | | | | |
| | | Shares | | | Value (Note 2) | |
| |
MISCELLANEOUS MANUFACTURING (-0.09%) (continued) | | | | | | | | |
Raven Industries, Inc. | | | (19) | | | $ | (379) | |
| | | | | | | | |
| | | | | | | (2,928) | |
| | | | | | | | |
OIL & GAS (-0.33%) | | | | | | | | |
Atwood Oceanics, Inc. | | | (29) | | | | (968) | |
Cabot Oil & Gas Corp. | | | (40) | | | | (1,353) | |
Chesapeake Energy Corp. | | | (5) | | | | (79) | |
Concho Resources, Inc. | | | (11) | | | | (1,393) | |
Continental Resources, Inc. | | | (20) | | | | (1,053) | |
CVR Energy, Inc. | | | (16) | | | | (641) | |
Denbury Resources, Inc. | | | (50) | | | | (440) | |
Diamond Offshore Drilling, Inc. | | | (15) | | | | (502) | |
Matador Resources Co. | | | (33) | | | | (915) | |
Oasis Petroleum, Inc. | | | (60) | | | | (1,076) | |
Seadrill, Ltd. | | | (78) | | | | (1,021) | |
Ultra Petroleum Corp. | | | (52) | | | | (886) | |
| | | | | | | | |
| | | | | | | (10,327) | |
| | | | | | | | |
OIL & GAS SERVICES (-0.07%) | | | | | | | | |
Bristow Group, Inc. | | | (22) | | | | (1,367) | |
NOW, Inc. | | | (39) | | | | (932) | |
| | | | | | | | |
| | | | | | | (2,299) | |
| | | | | | | | |
PACKAGING & CONTAINERS (-0.02%) | | | | | | | | |
Bemis Co., Inc. | | | (17) | | | | (765) | |
| | | | | | | | |
| | |
PIPELINES (-0.04%) | | | | | | | | |
Spectra Energy Corp. | | | (30) | | | | (1,118) | |
| | | | | | | | |
| | |
REAL ESTATE INVESTMENT TRUSTS (-0.17%) | | | | | | | | |
HCP, Inc. | | | (22) | | | | (887) | |
Health Care REIT, Inc. | | | (11) | | | | (792) | |
Omega Healthcare Investors, Inc. | | | (21) | | | | (758) | |
Plum Creek Timber Co., Inc. | | | (18) | | | | (760) | |
Realty Income Corp. | | | (22) | | | | (1,033) | |
Rouse Properties, Inc. | | | (58) | | | | (1,013) | |
| | | | | | | | |
| | | | | | | (5,243) | |
| | | | | | | | |
RETAIL (-0.52%) | | | | | | | | |
Bob Evans Farms, Inc. | | | (30) | | | | (1,290) | |
Buffalo Wild Wings, Inc. | | | (8) | | | | (1,274) | |
Cabela’s, Inc. | | | (25) | | | | (1,318) | |
CarMax, Inc. | | | (24) | | | | (1,635) | |
Chipotle Mexican Grill, Inc. | | | (2) | | | | (1,243) | |
Krispy Kreme Doughnuts, Inc. | | | (87) | | | | (1,548) | |
L Brands, Inc. | | | (10) | | | | (894) | |
Mattress Firm Holding Corp. | | | (17) | | | | (1,004) | |
Restoration Hardware Holdings, Inc. | | | (16) | | | | (1,379) | |
Texas Roadhouse, Inc. | | | (46) | | | | (1,546) | |
The Cheesecake Factory, Inc. | | | (30) | | | | (1,504) | |
The Wendy’s Co. | | | (165) | | | | (1,670) | |
| | | | | | | | |
| | | | | | | (16,305) | |
| | | | | | | | |
SAVINGS & LOANS (-0.07%) | | | | | | | | |
Astoria Financial Corp. | | | (64) | | | | (843) | |
New York Community Bancorp, Inc. | | | (76) | | | | (1,306) | |
| | | | | | | | |
| | | | | | | (2,149) | |
| | | | | | | | |
| | |
| See Notes to Financial Statements. | | |
Annual Report | April 30, 2015 | | 19 |
| | |
| Redmont Resolute Fund I | | Schedule of Investments |
| | April 30, 2015 |
| | | | | | | | |
| | | Shares | | | Value (Note 2) | |
| |
SEMICONDUCTORS (-0.02%) | | | | | | | | |
Cirrus Logic, Inc. | | | (17) | | | $ | (574) | |
| | | | | | | | |
| | |
SOFTWARE (-0.55%) | | | | | | | | |
Acxiom Corp. | | | (39) | | | | (681) | |
Aspen Technology, Inc. | | | (21) | | | | (932) | |
athenahealth, Inc. | | | (12) | | | | (1,472) | |
Blackbaud, Inc. | | | (50) | | | | (2,527) | |
Cerner Corp. | | | (18) | | | | (1,293) | |
NetSuite, Inc. | | | (13) | | | | (1,242) | |
Rackspace Hosting, Inc. | | | (33) | | | | (1,779) | |
Red Hat, Inc. | | | (17) | | | | (1,279) | |
Salesforce.com, Inc. | | | (29) | | | | (2,112) | |
Synchronoss Technologies, Inc. | | | (30) | | | | (1,376) | |
The Ultimate Software Group, Inc. | | | (7) | | | | (1,164) | |
Tyler Technologies, Inc. | | | (11) | | | | (1,341) | |
VMware, Inc., Class A | | | (3) | | | | (264) | |
| | | | | | | | |
| | | | | | | (17,462) | |
| | | | | | | | |
STORAGE & WAREHOUSING (-0.03%) | | | | | | | | |
Mobile Mini, Inc. | | | (23) | | | | (886) | |
| | | | | | | | |
| | |
TELECOMMUNICATIONS (-0.23%) | | | | | | | | |
Arista Networks, Inc. | | | (13) | | | | (832) | |
CenturyLink, Inc. | | | (27) | | | | (971) | |
Finisar Corp. | | | (53) | | | | (1,078) | |
Frontier Communications Corp. | | | (156) | | | | (1,070) | |
Sprint Corp. | | | (245) | | | | (1,257) | |
Telefonica SA, Sponsored ADR | | | (77) | | | | (1,167) | |
ViaSat, Inc. | | | (17) | | | | (1,022) | |
| | | | | | | | |
| | | | | | | (7,397) | |
| | | | | | | | |
TOYS, GAMES & HOBBIES (-0.03%) | | | | | | | | |
Mattel, Inc. | | | (30) | | | | (845) | |
| | | | | | | | |
| | |
TRANSPORTATION (-0.16%) | | | | | | | | |
Canadian Pacific Railway, Ltd. | | | (4) | | | | (762) | |
Heartland Express, Inc. | | | (31) | | | | (648) | |
JB Hunt Transport Services, Inc. | | | (15) | | | | (1,308) | |
Kansas City Southern | | | (6) | | | | (615) | |
Knight Transportation, Inc. | | | (22) | | | | (636) | |
Old Dominion Freight Line, Inc. | | | (6) | | | | (427) | |
Ryder System, Inc. | | | (7) | | | | (668) | |
| | | | | | | | |
| | | | | | | (5,064) | |
| | | | | | | | |
| | |
TOTAL COMMON STOCKS (Proceeds $148,268) | | | | | | | (158,177) | |
| |
| | |
TOTAL SECURITIES SOLD SHORT (Proceeds $148,268) | | | | | | $ | (158,177) | |
| |
| | |
| See Notes to Financial Statements. | | |
20 | | www.redmontfunds.com |
| | |
| Redmont Resolute Fund I | | Schedule of Investments |
| | April 30, 2015 |
| (a) | Non-income producing security. |
| (b) | Security position either entirely or partially held in a segregated account as collateral for securities sold short, futures contracts, and total return swap contracts. Aggregate total market value of $130,814. |
| (c) | Rate shown represents the bond equivalent yield to maturity at date of purchase. |
| (d) | Includes cash which is being held as collateral for securities sold short, and total return swap contracts. |
| | | | | | | | | | | | | | | | |
| Description | | Position | | Contracts | | Expiration
Date | | | Underlying Face
Amount at Value | | | Unrealized
Depreciation | |
| |
Foreign Currency Contracts | | | | | | | | | | | | | | | | |
Euro FX Currency Future | | Short | | 1 | | | 06/16/2015 | | | $ | (140,825) | | | $ | (9,010) | |
| | | | | | | | | | | | |
| | | | | | | | | | $ | (140,825) | | | $ | (9,010) | |
| | | | | | | | | | | | |
TOTAL RETURN SWAP CONTRACTS*
| | | | | | | | | | | | | | | | |
| Counterparty | | Reference Obligation | | Notional Amount | | | Rate Paid by the Fund | | | Termination Date | | Unrealized
Depreciation | |
| |
Morgan Stanley | | Impala Segregated Portfolio(a) | | $ | 273,341 | | | | 1-Month LIBOR BBA | | | 03/20/2019 | | $ | (5,036) | |
Morgan Stanley | | Melchior Segregated Portfolio(b) | | | 326,112 | | | | 1-Month LIBOR BBA | | | 03/20/2019 | | | (1,254) | |
Morgan Stanley | | Trilogy Segregated Portfolio(c) | | | 684,213 | | | | 1-Month LIBOR BBA | | | 09/02/2015 | | | (2,389) | |
| | | | | | | | | | | | | | | | |
| | | | $ | 1,283,666 | | | | | | | | | $ | (8,679) | |
| | | | | | | | | | | | | | | | |
| * | The Fund receives payments based on any positive return of the Reference Obligation less the rate paid by the Fund. The Fund makes payments on any negative return of such Reference Obligation plus the rate paid by the Fund. |
| (a) | European equity long/short strategy that employs a flexible, low-net strategy (0% to 50%), and long exposure will vary between 60% and 100%. The portfolio is primarily comprised of large and mid-cap stocks listed on European exchanges. |
| (b) | Global equity long/short strategy that uses a long-biased strategy that is focused on cyclical sectors. The strategy has a net exposure that ranges between 50% and 80%, and long exposure varies between 80% and 100%. The strategy is comprised of large cap stocks listed on exchanges of developed and emerging market countries. |
| (c) | Absolute return, long volatility options strategy. The strategy employs three underlying strategies with most of the exposure to a collared equity strategy. The strategy purchases a basket of large cap stocks, sell out-of-the-money call options, and buy out-of-the-money put options. The strategy also employs an options income strategy that involves selling short duration, near-the-money call spreads and put spreads. |
Common Abbreviations:
ADR - American Depositary Receipt.
AG - Aktiengesellschaft is a German term that refers to a corporation that is limited by shares, i.e., owned by shareholders.
AQR - AQR Capital Management LLC.
BBA - British Bankers Association.
EMU - European Economic and Monetary Union.
ETF - Exchange Traded Fund.
FPA - First Pacific Advisors LLC.
LIBOR - London Interbank Offered Rate.
LLC - Limited Liability Company.
LP - Limited Partnership.
Ltd. - Limited.
MSCI - Morgan Stanley Capital International.
NV - Naamloze Vennootschap is the Dutch term for a public limited liability corporation.
PIMCO - Pacific Investment Management Company.
PLC - Public Limited Company.
REIT - Real Estate Investment Trust.
S&P - Standard & Poor’s.
SA - Generally designates corporations in various countries, mostly those employing the civil law.
SPDR - Standard & Poor’s Depositary Receipt.
| | |
| See Notes to Financial Statements. | | |
Annual Report | April 30, 2015 | | 21 |
| | |
| Redmont Resolute Fund II | | Schedule of Investments |
| | April 30, 2015 |
| | | | | | | | |
| Description | | Shares | | | Value (Note 2) | |
| |
COMMON STOCKS (14.10%) | | | | | | | | |
ADVERTISING (0.07%) | | | | | | | | |
Alliance Data Systems Corp.(a) | | | 508 | | | $ | 151,034 | |
Omnicom Group, Inc.(b) | | | 4,457 | | | | 337,662 | |
The Interpublic Group of Companies, Inc. | | | 1,306 | | | | 27,217 | |
| | | | | | | | |
| | | | | | | 515,913 | |
| | | | | | | | |
| | |
AEROSPACE & DEFENSE (0.40%) | | | | | | | | |
Cubic Corp. | | | 3,220 | | | | 159,648 | |
Exelis, Inc. | | | 3,616 | | | | 88,664 | |
General Dynamics Corp. | | | 3,227 | | | | 443,132 | |
Lockheed Martin Corp.(b) | | | 3,147 | | | | 587,230 | |
Northrop Grumman Corp.(b) | | | 3,005 | | | | 462,890 | |
Raytheon Co.(b) | | | 2,643 | | | | 274,872 | |
Safran SA | | | 1,272 | | | | 93,194 | |
The Boeing Co.(b) | | | 1,738 | | | | 249,125 | |
Triumph Group, Inc.(b) | | | 2,793 | | | | 165,457 | |
United Technologies Corp.(b) | | | 1,793 | | | | 203,954 | |
| | | | | | | | |
| | | | | | | 2,728,166 | |
| | | | | | | | |
| | |
AGRICULTURE (0.20%) | | | | | | | | |
Altria Group, Inc. | | | 3,209 | | | | 160,611 | |
Archer-Daniels-Midland Co. | | | 1,359 | | | | 66,428 | |
British American Tobacco PLC | | | 3,159 | | | | 174,203 | |
Bunge, Ltd. | | | 2,811 | | | | 242,786 | |
Imperial Tobacco Group PLC | | | 3,971 | | | | 194,568 | |
Japan Tobacco, Inc. | | | 800 | | | | 28,214 | |
Lorillard, Inc. | | | 3,834 | | | | 267,843 | |
Philip Morris International, Inc. | | | 1,343 | | | | 112,100 | |
Swedish Match AB | | | 3,748 | | | | 115,498 | |
| | | | | | | | |
| | | | | | | 1,362,251 | |
| | | | | | | | |
| | |
AIRLINES (0.06%) | | | | | | | | |
ANA Holdings, Inc. | | | 24,000 | | | | 66,694 | |
Delta Air Lines, Inc. | | | 6,866 | | | | 306,498 | |
Japan Airlines Co., Ltd. | | | 1,600 | | | | 53,601 | |
Southwest Airlines Co. | | | 473 | | | | 19,185 | |
| | | | | | | | |
| | | | | | | 445,978 | |
| | | | | | | | |
| | |
APPAREL (0.05%) | | | | | | | | |
adidas AG | | | 1,872 | | | | 154,327 | |
Burberry Group PLC | | | 5,035 | | | | 134,789 | |
Michael Kors Holdings, Ltd.(a) | | | 206 | | | | 12,743 | |
NIKE, Inc., Class B | | | 799 | | | | 78,973 | |
| | | | | | | | |
| | | | | | | 380,832 | |
| | | | | | | | |
| | |
AUTO MANUFACTURERS (0.25%) | | | | | | | | |
Bayerische Motoren Werke AG | | | 1,471 | | | | 175,247 | |
Daihatsu Motors Co. | | | 7,800 | | | | 113,407 | |
Daimler AG | | | 1,482 | | | | 143,659 | |
Fiat Chrysler Auto NV(a) | | | 3,983 | | | | 59,705 | |
Fuji Heavy Industries, Ltd. | | | 4,900 | | | | 165,159 | |
Honda Motor Co., Ltd. | | | 8,000 | | | | 270,787 | |
| | |
| See Notes to Financial Statements. | | |
22 | | www.redmontfunds.com |
| | |
| Redmont Resolute Fund II | | Schedule of Investments |
| | April 30, 2015 |
| | | | | | | | |
| Description | | Shares | | | Value (Note 2) | |
| |
AUTO MANUFACTURERS (0.25%) (continued) | | | | | | | | |
Isuzu Motors, Ltd. | | | 9,400 | | | $ | 125,451 | |
Mitsubishi Motors Corp. | | | 500 | | | | 4,636 | |
Suzuki Motor Corp. | | | 2,500 | | | | 81,292 | |
Toyota Motor Corp. | | | 8,800 | | | | 616,000 | |
| | | | | | | | |
| | | | | | | 1,755,343 | |
| | | | | | | | |
| | |
AUTO PARTS & EQUIPMENT (0.23%) | | | | | | | | |
Aisin Seiki Co., Ltd. | | | 3,600 | | | | 165,528 | |
Allison Transmission Holdings, Inc. | | | 3,705 | | | | 113,670 | |
Continental AG | | | 451 | | | | 106,674 | |
Delphi Automotive PLC | | | 1,152 | | | | 95,616 | |
Denso Corp. | | | 2,600 | | | | 129,869 | |
Lear Corp. | | | 3,313 | | | | 367,842 | |
NHK Spring Co., Ltd. | | | 10,900 | | | | 125,615 | |
NOK Corp. | | | 400 | | | | 12,714 | |
Tenneco, Inc.(a) | | | 7,552 | | | | 441,414 | |
| | | | | | | | |
| | | | | | | 1,558,942 | |
| | | | | | | | |
| | |
BANKS (1.31%) | | | | | | | | |
Banca Monte dei Paschi di Siena SpA(a) | | | 39,033 | | | | 24,237 | |
Banco Santander SA | | | 30,874 | | | | 234,209 | |
Bank of America Corp.(b) | | | 24,266 | | | | 386,557 | |
BB&T Corp.(b) | | | 13,407 | | | | 513,354 | |
Capital One Financial Corp.(b) | | | 7,934 | | | | 641,464 | |
Citigroup, Inc.(b) | | | 12,093 | | | | 644,799 | |
Comerica, Inc. | | | 1,683 | | | | 79,791 | |
Credit Agricole SA | | | 9,698 | | | | 151,417 | |
Danske Bank A/S | | | 5,426 | | | | 154,228 | |
Fifth Third Bancorp(b) | | | 33,977 | | | | 679,540 | |
Hokuhoku Financial Group, Inc. | | | 53,000 | | | | 127,395 | |
HSBC Holdings PLC | | | 41,936 | | | | 417,194 | |
Huntington Bancshares, Inc.(b) | | | 19,827 | | | | 215,321 | |
JPMorgan Chase & Co.(b) | | | 11,114 | | | | 703,072 | |
KBC Groep NV(a) | | | 2,335 | | | | 154,375 | |
KeyCorp | | | 4,355 | | | | 62,930 | |
Mitsubishi UFJ Financial Group, Inc. | | | 31,100 | | | | 222,935 | |
Mizuho Financial Group, Inc. | | | 28,200 | | | | 54,015 | |
Natixis SA | | | 17,370 | | | | 144,056 | |
Regions Financial Corp.(b) | | | 37,086 | | | | 364,555 | |
Royal Bank of Scotland Group PLC(a) | | | 25,508 | | | | 132,539 | |
Shinsei Bank, Ltd. | | | 58,000 | | | | 119,497 | |
State Street Corp.(b) | | | 4,071 | | | | 313,956 | |
Sumitomo Mitsui Financial Group, Inc. | | | 5,500 | | | | 241,466 | |
Sumitomo Mitsui Trust Holdings, Inc. | | | 39,000 | | | | 173,214 | |
SunTrust Banks, Inc.(b) | | | 4,743 | | | | 196,835 | |
The Bank of Yokohama, Ltd. | | | 23,000 | | | | 147,092 | |
The Chiba Bank, Ltd. | | | 7,000 | | | | 57,923 | |
The Chugoku Bank, Ltd. | | | 1,100 | | | | 17,762 | |
The Goldman Sachs Group, Inc.(b) | | | 2,422 | | | | 475,729 | |
The PNC Financial Services Group, Inc.(b) | | | 3,374 | | | | 309,497 | |
| | |
| See Notes to Financial Statements. | | |
Annual Report | April 30, 2015 | | 23 |
| | |
| Redmont Resolute Fund II | | Schedule of Investments |
| | April 30, 2015 |
| | | | | | | | |
| Description | | Shares | | | Value (Note 2) | |
| |
BANKS (1.31%) (continued) | | | | | | | | |
Wells Fargo & Co.(b) | | | 16,104 | | | $ | 887,330 | |
| | | | | | | | |
| | | | | | | 9,048,284 | |
| | | | | | | | |
| | |
BEVERAGES (0.16%) | | | | | | | | |
Anheuser-Busch InBev NV | | | 162 | | | | 19,809 | |
Asahi Group Holdings, Ltd. | | | 3,100 | | | | 100,101 | |
Carlsberg A/S, Class B | | | 1,577 | | | | 143,960 | |
Coca-Cola Enterprises, Inc. | | | 596 | | | | 26,468 | |
Constellation Brands, Inc., Class A(a)(b) | | | 1,898 | | | | 220,054 | |
Heineken Holding NV | | | 1,912 | | | | 133,623 | |
Heineken NV | | | 1,876 | | | | 148,211 | |
Kirin Holdings Co., Ltd. | | | 8,800 | | | | 116,891 | |
Monster Beverage Corp.(a) | | | 194 | | | | 26,599 | |
PepsiCo, Inc. | | | 2,080 | | | | 197,850 | |
| | | | | | | | |
| | | | | | | 1,133,566 | |
| | | | | | | | |
| | |
BIOTECHNOLOGY (0.20%) | | | | | | | | |
Amgen, Inc. | | | 3,499 | | | | 552,527 | |
Biogen, Inc.(a) | | | 173 | | | | 64,690 | |
Celgene Corp.(a) | | | 1,494 | | | | 161,442 | |
Gilead Sciences, Inc.(a) | | | 5,686 | | | | 571,500 | |
| | | | | | | | |
| | | | | | | 1,350,159 | |
| | | | | | | | |
| | |
BUILDING MATERIALS (0.12%) | | | | | | | | |
Daikin Industries, Ltd. | | | 2,500 | | | | 169,682 | |
Holcim, Ltd. | | | 1,954 | | | | 158,339 | |
Masco Corp. | | | 17,096 | | | | 452,873 | |
Sika AG(a) | | | 23 | | | | 79,530 | |
| | | | | | | | |
| | | | | | | 860,424 | |
| | | | | | | | |
| | |
CHEMICALS (0.32%) | | | | | | | | |
Air Water, Inc. | | | 2,000 | | | | 35,662 | |
Akzo Nobel NV | | | 921 | | | | 70,756 | |
Asahi Kasei Corp. | | | 15,000 | | | | 142,211 | |
BASF SE | | | 105 | | | | 10,550 | |
CF Industries Holdings, Inc. | | | 33 | | | | 9,486 | |
Daicel Corp. | | | 4,300 | | | | 52,183 | |
EI du Pont de Nemours & Co. | | | 348 | | | | 25,474 | |
Huntsman Corp.(b) | | | 14,273 | | | | 328,993 | |
Kansai Paint Co., Ltd. | | | 7,000 | | | | 125,637 | |
Kuraray Co., Ltd. | | | 4,100 | | | | 55,834 | |
Linde AG | | | 872 | | | | 171,151 | |
Lonza Group AG | | | 1,042 | | | | 148,658 | |
LyondellBasell Industries NV, Class A | | | 1,152 | | | | 119,255 | |
PPG Industries, Inc. | | | 354 | | | | 78,432 | |
Praxair, Inc. | | | 543 | | | | 66,208 | |
The Dow Chemical Co. | | | 1,591 | | | | 81,141 | |
The Mosaic Co. | | | 7,431 | | | | 326,964 | |
The Valspar Corp. | | | 4,532 | | | | 367,545 | |
| | | | | | | | |
| | | | | | | 2,216,140 | |
| | | | | | | | |
| | |
| See Notes to Financial Statements. | | |
24 | | www.redmontfunds.com |
| | |
| Redmont Resolute Fund II | | Schedule of Investments |
| | April 30, 2015 |
| | | | | | | | |
| Description | | Shares | | | Value (Note 2) | |
| |
COAL (0.01%) | | | | | | | | |
Cloud Peak Energy, Inc.(a) | | | 6,670 | | | $ | 43,288 | |
| | | | | | | | |
| | |
COMMERCIAL SERVICES (0.57%) | | | | | | | | |
Adecco SA | | | 1,737 | | | | 142,803 | |
Apollo Education Group, Inc.(a) | | | 7,312 | | | | 122,732 | |
Benesse Holdings, Inc. | | | 2,200 | | | | 69,095 | |
Bunzl PLC | | | 4,772 | | | | 134,707 | |
Cintas Corp. | | | 345 | | | | 27,583 | |
Civeo Corp. | | | 21,089 | | | | 98,486 | |
Dai Nippon Printing Co., Ltd. | | | 13,000 | | | | 135,281 | |
Equifax, Inc.(b) | | | 4,082 | | | | 395,668 | |
EVERTEC, Inc. | | | 13,846 | | | | 287,028 | |
Global Payments, Inc. | | | 2,249 | | | | 225,530 | |
H&R Block, Inc. | | | 11,595 | | | | 350,633 | |
ManpowerGroup, Inc.(b) | | | 4,692 | | | | 400,368 | |
MasterCard, Inc., Class A | | | 1,326 | | | | 119,618 | |
Moody’s Corp.(b) | | | 3,345 | | | | 359,654 | |
Robert Half International, Inc.(b) | | | 5,755 | | | | 319,115 | |
Total System Services, Inc. | | | 7,396 | | | | 292,586 | |
Towers Watson & Co., Class A(b) | | | 3,306 | | | | 419,548 | |
United Rentals, Inc.(a) | | | 192 | | | | 18,543 | |
| | | | | | | | |
| | | | | | | 3,918,978 | |
| | | | | | | | |
| | |
COMPUTERS (0.65%) | | | | | | | | |
Accenture PLC, Class A | | | 870 | | | | 80,605 | |
Amdocs, Ltd.(b) | | | 5,810 | | | | 319,957 | |
Apple, Inc. | | | 10,051 | | | | 1,257,883 | |
Brocade Communications Systems, Inc.(b) | | | 43,909 | | | | 496,172 | |
Cognizant Technology Solutions Corp., Class A(a) | | | 351 | | | | 20,547 | |
Computer Sciences Corp. | | | 630 | | | | 40,603 | |
EMC Corp.(b) | | | 17,227 | | | | 463,579 | |
Fujitsu, Ltd. | | | 23,000 | | | | 152,794 | |
Hewlett-Packard Co. | | | 14,660 | | | | 483,340 | |
International Business Machines Corp. | | | 240 | | | | 41,110 | |
Itochu Techno-Solutions Corp. | | | 900 | | | | 20,616 | |
NetApp, Inc.(b) | | | 7,603 | | | | 275,609 | |
Seagate Technology PLC | | | 6,009 | | | | 352,848 | |
Western Digital Corp.(b) | | | 4,694 | | | | 458,791 | |
| | | | | | | | |
| | | | | | | 4,464,454 | |
| | | | | | | | |
| | |
COSMETICS & PERSONAL CARE (0.02%) | | | | | | | | |
Kao Corp. | | | 1,000 | | | | 48,149 | |
The Procter & Gamble Co. | | | 1,281 | | | | 101,852 | |
Unicharm Corp. | | | 200 | | | | 5,052 | |
| | | | | | | | |
| | | | | | | 155,053 | |
| | | | | | | | |
| | |
DISTRIBUTION & WHOLESALE (0.12%) | | | | | | | | |
Arrow Electronics, Inc.(a)(b) | | | 6,617 | | | | 395,101 | |
ITOCHU Corp. | | | 15,600 | | | | 193,367 | |
Marubeni Corp. | | | 5,300 | | | | 33,016 | |
Sumitomo Corp. | | | 4,700 | | | | 55,837 | |
| | |
| See Notes to Financial Statements. | | |
Annual Report | April 30, 2015 | | 25 |
| | |
| Redmont Resolute Fund II | | Schedule of Investments |
| | April 30, 2015 |
| | | | | | | | |
| Description | | Shares | | | Value (Note 2) | |
| |
DISTRIBUTION & WHOLESALE (0.12%) (continued) | | | | | | | | |
WESCO International, Inc.(a) | | | 2,580 | | | $ | 186,121 | |
| | | | | | | | |
| | | | | | | 863,442 | |
| | | | | | | | |
| | |
DIVERSIFIED FINANCIAL SERVICES (0.54%) | | | | | | | | |
Aberdeen Asset Management PLC | | | 18,561 | | | | 135,362 | |
Affiliated Managers Group, Inc.(a) | | | 241 | | | | 54,497 | |
Ally Financial, Inc.(a) | | | 11,910 | | | | 260,710 | |
Ameriprise Financial, Inc. | | | 1,276 | | | | 159,857 | |
BlackRock, Inc. | | | 143 | | | | 52,043 | |
CME Group, Inc. | | | 1,099 | | | | 99,910 | |
Daiwa Securities Group, Inc. | | | 20,000 | | | | 167,504 | |
Discover Financial Services(b) | | | 9,962 | | | | 577,497 | |
Franklin Resources, Inc. | | | 1,730 | | | | 89,199 | |
Intercontinental Exchange, Inc. | | | 104 | | | | 23,351 | |
Japan Exchange Group, Inc. | | | 300 | | | | 8,769 | |
Legg Mason, Inc. | | | 601 | | | | 31,643 | |
Mitsubishi UFJ Lease & Finance Co., Ltd. | | | 800 | | | | 4,328 | |
Navient Corp. | | | 18,308 | | | | 357,738 | |
Nomura Holdings, Inc. | | | 5,700 | | | | 36,921 | |
ORIX Corp. | | | 12,600 | | | | 195,701 | |
Outerwall, Inc. | | | 3,647 | | | | 242,270 | |
Partners Group Holding AG | | | 444 | | | | 140,155 | |
Raymond James Financial, Inc.(b) | | | 3,743 | | | | 211,592 | |
SLM Corp.(a) | | | 24,752 | | | | 252,223 | |
TD Ameritrade Holding Corp.(b) | | | 5,945 | | | | 215,506 | |
The Charles Schwab Corp.(b) | | | 6,707 | | | | 204,564 | |
The NASDAQ OMX Group, Inc. | | | 315 | | | | 15,319 | |
Visa, Inc., Class A | | | 2,912 | | | | 192,338 | |
| | | | | | | | |
| | | | | | | 3,728,997 | |
| | | | | | | | |
| | |
ELECTRIC (0.21%) | | | | | | | | |
AES Corp. | | | 25,714 | | | | 340,711 | |
Chubu Electric Power Co. Inc | | | 6,200 | | | | 82,381 | |
Consolidated Edison, Inc. | | | 343 | | | | 21,112 | |
DTE Energy Co. | | | 359 | | | | 28,587 | |
Duke Energy Corp. | | | 210 | | | | 16,290 | |
E.ON SE | | | 9,429 | | | | 147,800 | |
EDP - Energias de Portugal SA | | | 12,419 | | | | 49,810 | |
Electricite de France SA | | | 374 | | | | 9,545 | |
Enel SpA | | | 35,040 | | | | 166,664 | |
Entergy Corp. | | | 252 | | | | 19,449 | |
Exelon Corp. | | | 3,099 | | | | 105,428 | |
GDF Suez | | | 3,878 | | | | 79,272 | |
Hokuriku Electric Power Co. | | | 4,100 | | | | 60,916 | |
Iberdrola SA | | | 25,106 | | | | 168,493 | |
PG&E Corp. | | | 553 | | | | 29,265 | |
Public Service Enterprise Group, Inc. | | | 120 | | | | 4,985 | |
The Chugoku Electric Power Co., Inc | | | 8,100 | | | | 118,854 | |
| | | | | | | | |
| | | | | | | 1,449,562 | |
| | | | | | | | |
| | |
ELECTRICAL COMPONENTS & EQUIPMENT (0.05%) | | | | | | | | |
Emerson Electric Co. | | | 5,505 | | | | 323,859 | |
| | |
| See Notes to Financial Statements. | | |
26 | | www.redmontfunds.com |
| | |
| Redmont Resolute Fund II | | Schedule of Investments |
| | April 30, 2015 |
| | | | | | | | |
| Description | | Shares | | | Value (Note 2) | |
| |
ELECTRICAL COMPONENTS & EQUIPMENT (0.05%) (continued) | | | | | | | | |
Hitachi, Ltd. | | | 3,000 | | | $ | 20,586 | |
| | | | | | | | |
| | | | | | | 344,445 | |
| | | | | | | | |
| | |
ELECTRONICS (0.34%) | | | | | | | | |
Avnet, Inc.(b) | | | 7,688 | | | | 327,740 | |
Corning, Inc. | | | 1,457 | | | | 30,495 | |
Flextronics International, Ltd.(a)(b) | | | 42,945 | | | | 494,941 | |
Hirose Elect Co., Ltd. | | | 900 | | | | 127,236 | |
Honeywell International, Inc.(b) | | | 2,076 | | | | 209,510 | |
Ibiden Co., Ltd. | | | 4,300 | | | | 75,628 | |
Jabil Circuit, Inc.(b) | | | 17,678 | | | | 398,109 | |
Kyocera Corp. | | | 300 | | | | 15,756 | |
Minebea Co., Ltd. | | | 7,000 | | | | 108,400 | |
Murata Manufacturing Co., Ltd. | | | 1,500 | | | | 213,191 | |
Nippon Electric Glass Co., Ltd. | | | 17,000 | | | | 97,814 | |
TE Connectivity, Ltd. | | | 4,073 | | | | 271,058 | |
| | | | | | | | |
| | | | | | | 2,369,878 | |
| | | | | | | | |
| | |
ENGINEERING & CONSTRUCTION (0.08%) | | | | | | | | |
ACS Actividades de Construccion y Servicios SA | | | 3,606 | | | | 127,645 | |
Aeroports de Paris | | | 1,073 | | | | 132,349 | |
Bouygues SA | | | 3,331 | | | | 138,126 | |
JGC Corp. | | | 5,000 | | | | 104,502 | |
Kajima Corp. | | | 9,000 | | | | 43,191 | |
| | | | | | | | |
| | | | | | | 545,813 | |
| | | | | | | | |
| | |
ENTERTAINMENT (0.04%) | | | | | | | | |
Six Flags Entertainment Corp. | | | 2,875 | | | | 135,183 | |
William Hill PLC | | | 23,668 | | | | 131,225 | |
| | | | | | | | |
| | | | | | | 266,408 | |
| | | | | | | | |
| | |
ENVIRONMENTAL CONTROL (0.01%) | | | | | | | | |
Republic Services, Inc. | | | 955 | | | | 38,802 | |
| | | | | | | | |
| | |
FOOD (0.23%) | | | | | | | | |
Associated British Foods PLC | | | 3,371 | | | | 147,835 | |
CALBEE, Inc. | | | 2,700 | | | | 110,352 | |
Carrefour SA | | | 966 | | | | 33,397 | |
Chocoladefabriken Lindt & Sprungli AG | | | 24 | | | | 132,226 | |
General Mills, Inc. | | | 515 | | | | 28,500 | |
Kellogg Co. | | | 821 | | | | 51,994 | |
Koninklijke Ahold NV | | | 7,531 | | | | 146,292 | |
Mondelez International, Inc., Class A | | | 1,325 | | | | 50,840 | |
Nestle SA | | | 3,077 | | | | 240,434 | |
Nissin Foods Holdings Co., Ltd. | | | 2,200 | | | | 105,762 | |
Seven & I Holdings Co., Ltd. | | | 300 | | | | 13,003 | |
Sysco Corp. | | | 620 | | | | 22,959 | |
The Kroger Co. | | | 817 | | | | 56,299 | |
Tyson Foods, Inc., Class A(b) | | | 10,531 | | | | 415,975 | |
| | | | | | | | |
| | | | | | | 1,555,868 | |
| | | | | | | | |
| | |
| See Notes to Financial Statements. | | |
Annual Report | April 30, 2015 | | 27 |
| | |
| Redmont Resolute Fund II | | Schedule of Investments |
| | April 30, 2015 |
| | | | | | | | |
| Description | | Shares | | | Value (Note 2) | |
| |
FOOD SERVICE (0.02%) | | | | | | | | |
Compass Group PLC | | | 9,403 | | | $ | 166,997 | |
| | | | | | | | |
| | |
FOREST PRODUCTS & PAPER (0.09%) | | | | | | | | |
International Paper Co. | | | 765 | | | | 41,096 | |
MeadWestvaco Corp. | | | 8,466 | | | | 413,141 | |
Oji Holdings Corp. | | | 8,000 | | | | 35,779 | |
UPM-Kymmene OYJ | | | 7,032 | | | | 127,992 | |
| | | | | | | | |
| | | | | | | 618,008 | |
| | | | | | | | |
| | |
GAS (0.02%) | | | | | | | | |
AGL Resources, Inc. | | | 894 | | | | 44,941 | |
Gas Natural SDG SA | | | 4,968 | | | | 122,472 | |
| | | | | | | | |
| | | | | | | 167,413 | |
| | | | | | | | |
| | |
HAND & MACHINE TOOLS (0.03%) | | | | | | | | |
Fuji Electric Holdings Co., Ltd. | | | 17,000 | | | | 80,586 | |
Makita Corp. | | | 1,900 | | | | 95,955 | |
Schindler Holding AG | | | 80 | | | | 13,651 | |
Stanley Black & Decker, Inc. | | | 87 | | | | 8,587 | |
| | | | | | | | |
| | | | | | | 198,779 | |
| | | | | | | | |
| | |
HEALTHCARE - PRODUCTS (0.18%) | | | | | | | | |
CR Bard, Inc. | | | 633 | | | | 105,445 | |
DENTSPLY International, Inc. | | | 2,702 | | | | 137,802 | |
Edwards Lifesciences Corp.(a) | | | 631 | | | | 79,916 | |
Medtronic PLC | | | 5,737 | | | | 427,120 | |
QIAGEN NV(a) | | | 3,549 | | | | 86,136 | |
Sonova Holding AG | | | 859 | | | | 119,511 | |
St Jude Medical, Inc. | | | 263 | | | | 18,423 | |
Zimmer Holdings, Inc.(b) | | | 2,774 | | | | 304,696 | |
| | | | | | | | |
| | | | | | | 1,279,049 | |
| | | | | | | | |
| | |
HEALTHCARE - SERVICES (0.31%) | | | | | | | | |
Aetna, Inc. | | | 315 | | | | 33,664 | |
Anthem, Inc. | | | 3,794 | | | | 572,628 | |
Cigna Corp. | | | 3,941 | | | | 491,206 | |
HCA Holdings, Inc.(a) | | | 343 | | | | 25,385 | |
ICON PLC(a) | | | 3,905 | | | | 251,248 | |
Laboratory Corp. of America Holdings(a) | | | 2,442 | | | | 291,966 | |
Miraca Holdings, Inc. | | | 400 | | | | 20,134 | |
UnitedHealth Group, Inc. | | | 668 | | | | 74,415 | |
Universal Health Services, Inc., Class B(b) | | | 3,431 | | | | 401,256 | |
| | | | | | | | |
| | | | | | | 2,161,902 | |
| | | | | | | | |
| | |
HOME BUILDERS (0.03%) | | | | | | | | |
Daiwa House Industry Co., Ltd. | | | 5,900 | | | | 132,330 | |
Sekisui Chemical Co., Ltd. | | | 5,000 | | | | 67,211 | |
| | | | | | | | |
| | | | | | | 199,541 | |
| | | | | | | | |
| | |
HOME FURNISHINGS (0.04%) | | | | | | | | |
Panasonic Corp. | | | 16,700 | | | | 241,129 | |
| | |
| See Notes to Financial Statements. | | |
28 | | www.redmontfunds.com |
| | |
| Redmont Resolute Fund II | | Schedule of Investments |
| | April 30, 2015 |
| | | | | | | | |
| Description | | Shares | | | Value (Note 2) | |
| |
HOME FURNISHINGS (0.04%) (continued) | | | | | | | | |
Sony Corp.(a) | | | 700 | | | $ | 21,366 | |
| | | | | | | | |
| | | | | | | 262,495 | |
| | | | | | | | |
| | |
HOUSEHOLD PRODUCTS & WARES (0.02%) | | | | | | | | |
Henkel AG & Co. KGaA | | | 1,295 | | | | 151,516 | |
| | | | | | | | |
| | |
HOUSEWARES (0.15%) | | | | | | | | |
Avery Dennison Corp.(b) | | | 8,793 | | | | 488,803 | |
Kimberly-Clark Corp. | | | 1,354 | | | | 148,520 | |
Newell Rubbermaid, Inc.(b) | | | 10,453 | | | | 398,573 | |
| | | | | | | | |
| | | | | | | 1,035,896 | |
| | | | | | | | |
| | |
INSURANCE (1.00%) | | | | | | | | |
ACE, Ltd.(b) | | | 4,488 | | | | 480,171 | |
Admiral Group PLC | | | 386 | | | | 9,231 | |
Aflac, Inc. | | | 1,334 | | | | 84,095 | |
Alleghany Corp.(a) | | | 836 | | | | 395,863 | |
Allianz SE | | | 1,360 | | | | 233,032 | |
American International Group, Inc. | | | 6,556 | | | | 369,037 | |
Aon PLC | | | 4,640 | | | | 446,507 | |
Aviva PLC | | | 18,606 | | | | 150,513 | |
AXA SA | | | 4,921 | | | | 124,960 | |
Baloise Holding AG | | | 971 | | | | 127,288 | |
Berkshire Hathaway, Inc., Class B(a)(b) | | | 4,180 | | | | 590,258 | |
Direct Line Insurance Group PLC | | | 6,931 | | | | 33,949 | |
Legal & General Group PLC | | | 38,485 | | | | 153,594 | |
MetLife, Inc.(b) | | | 4,747 | | | | 243,474 | |
Principal Financial Group, Inc. | | | 156 | | | | 7,975 | |
Prudential Financial, Inc. | | | 3,992 | | | | 325,747 | |
Reinsurance Group of America, Inc.(b) | | | 2,098 | | | | 192,219 | |
Swiss Re AG | | | 1,771 | | | | 157,747 | |
The Allstate Corp.(b) | | | 8,481 | | | | 590,786 | |
The Progressive Corp. | | | 3,107 | | | | 82,833 | |
The Travelers Companies, Inc.(b) | | | 3,442 | | | | 348,021 | |
Tokio Marine Holdings, Inc. | | | 5,400 | | | | 221,653 | |
Torchmark Corp.(b) | | | 3,663 | | | | 205,531 | |
Validus Holdings, Ltd.(b) | | | 9,717 | | | | 406,462 | |
WR Berkley Corp. | | | 8,186 | | | | 401,032 | |
XL Group PLC | | | 13,409 | | | | 497,206 | |
| | | | | | | | |
| | | | | | | 6,879,184 | |
| | | | | | | | |
| | |
INTERNET (0.28%) | | | | | | | | |
Amazon.com, Inc.(a) | | | 160 | | | | 67,485 | |
Baidu, Inc., Sponsored ADR(a) | | | 636 | | | | 127,378 | |
CDW Corp. | | | 8,249 | | | | 316,102 | |
eBay, Inc.(a) | | | 597 | | | | 34,781 | |
Expedia, Inc.(b) | | | 1,926 | | | | 181,487 | |
F5 Networks, Inc.(a) | | | 120 | | | | 14,642 | |
Facebook, Inc., Class A(a) | | | 1,409 | | | | 110,987 | |
Google, Inc., Class A(a) | | | 657 | | | | 360,542 | |
Google, Inc., Class C(a) | | | 340 | | | | 182,696 | |
| | |
| See Notes to Financial Statements. | | |
Annual Report | April 30, 2015 | | 29 |
| | |
| Redmont Resolute Fund II | | Schedule of Investments |
| | April 30, 2015 |
| | | | | | | | |
| Description | | Shares | | | Value (Note 2) | |
| |
INTERNET (0.28%) (continued) | | | | | | | | |
Nexon Co., Ltd. | | | 4,300 | | | $ | 54,848 | |
Phoenix New Media, Ltd., ADR(a) | | | 13,207 | | | | 95,223 | |
Symantec Corp. | | | 1,234 | | | | 30,757 | |
The Priceline Group, Inc.(a) | | | 80 | | | | 99,025 | |
TripAdvisor, Inc.(a) | | | 119 | | | | 9,578 | |
VeriSign, Inc.(a) | | | 758 | | | | 48,141 | |
Yahoo!, Inc.(a) | | | 3,898 | | | | 165,918 | |
| | | | | | | | |
| | | | | | | 1,899,590 | |
| | | | | | | | |
| | |
INVESTMENT COMPANIES (0.02%) | | | | | | | | |
EXOR SpA | | | 2,867 | | | | 132,986 | |
| | | | | | | | |
| | |
IRON & STEEL (0.03%) | | | | | | | | |
Kobe Steel, Ltd. | | | 44,000 | | | | 80,335 | |
Nippon Steel & Sumitomo Metal Corp. | | | 57,000 | | | | 149,422 | |
| | | | | | | | |
| | | | | | | 229,757 | |
| | | | | | | | |
| | |
LEISURE TIME (0.00%)(c) | | | | | | | | |
Royal Caribbean Cruises, Ltd. | | | 96 | | | | 6,534 | |
| | | | | | | | |
| | |
LODGING (0.00%)(c) | | | | | | | | |
Wyndham Worldwide Corp. | | | 201 | | | | 17,165 | |
| | | | | | | | |
| | |
MACHINERY - CONSTRUCTION & MINING (0.09%) | | | | | | | | |
ABB, Ltd. | | | 9,058 | | | | 199,811 | |
Atlas Copco AB, Class B | | | 1,232 | | | | 34,358 | |
Caterpillar, Inc. | | | 898 | | | | 78,018 | |
Hitachi Construction Machinery Co., Ltd. | | | 4,800 | | | | 85,749 | |
Mitsubishi Electric Corp. | | | 16,000 | | | | 209,581 | |
| | | | | | | | |
| | | | | | | 607,517 | |
| | | | | | | | |
| | |
MACHINERY - DIVERSIFIED (0.06%) | | | | | | | | |
Alstom SA(a) | | | 1,751 | | | | 55,120 | |
FANUC Corp. | | | 200 | | | | 44,431 | |
Kawasaki Heavy Industries, Ltd. | | | 5,000 | | | | 25,879 | |
Mitsubishi Heavy Industries, Ltd. | | | 32,000 | | | | 178,948 | |
Rockwell Automation, Inc. | | | 322 | | | | 38,189 | |
Roper Technologies, Inc. | | | 51 | | | | 8,577 | |
Zebra Technologies Corp., Class A(a) | | | 626 | | | | 57,642 | |
| | | | | | | | |
| | | | | | | 408,786 | |
| | | | | | | | |
| | |
MEDIA (0.49%) | | | | | | | | |
Cablevision Systems Corp., Class A | | | 697 | | | | 13,926 | |
CBS Corp., Class B(b) | | | 3,543 | | | | 220,127 | |
Comcast Corp., Class A(b) | | | 12,422 | | | | 717,495 | |
DIRECTV(a) | | | 648 | | | | 58,777 | |
Discovery Communications, Inc., Class C(a) | | | 892 | | | | 26,965 | |
Liberty Broadband Corp., Class C(a)(b) | | | 1,580 | | | | 85,731 | |
Liberty Global PLC, Class C(a) | | | 12,776 | | | | 644,549 | |
| | |
| See Notes to Financial Statements. | | |
30 | | www.redmontfunds.com |
| | |
| Redmont Resolute Fund II | | Schedule of Investments |
| | April 30, 2015 |
| | | | | | | | |
| Description | | Shares | | | Value (Note 2) | |
| |
MEDIA (0.49%) (continued) | | | | | | | | |
Liberty Media Corp., Class A(a)(b) | | | 2,613 | | | $ | 100,287 | |
Liberty Media Corp., Class C(a)(b) | | | 3,986 | | | | 151,269 | |
ProSiebenSat.1 Media AG | | | 74 | | | | 3,813 | |
Starz, Class A(a) | | | 2,391 | | | | 94,038 | |
The Walt Disney Co. | | | 1,367 | | | | 148,620 | |
Time Warner Cable, Inc. | | | 1,013 | | | | 157,542 | |
Time Warner, Inc. | | | 439 | | | | 37,056 | |
Time, Inc.(b) | | | 3,463 | | | | 79,060 | |
Tribune Media Co., Class A | | | 4,265 | | | | 239,138 | |
Twenty-First Century Fox, Inc., Class A | | | 7,586 | | | | 258,531 | |
Viacom, Inc., Class B(b) | | | 4,313 | | | | 299,538 | |
Vivendi SA | | | 1,746 | | | | 43,944 | |
| | | | | | | | |
| | | | | | | 3,380,406 | |
| | | | | | | | |
| | |
METAL FABRICATE & HARDWARE (0.02%) | | | | | | | | |
The Timken Co. | | | 4,022 | | | | 158,024 | |
| | | | | | | | |
| | |
MINING (0.09%) | | | | | | | | |
Anglo American PLC | | | 8,905 | | | | 151,045 | |
Antofagasta PLC | | | 11,287 | | | | 135,399 | |
Barrick Gold Corp. | | | 14,554 | | | | 189,493 | |
Rio Tinto PLC | | | 3,092 | | | | 136,929 | |
| | | | | | | | |
| | | | | | | 612,866 | |
| | | | | | | | |
| | |
MISCELLANEOUS MANUFACTURING (0.36%) | | | | | | | | |
3M Co. | | | 826 | | | | 129,178 | |
Carlisle Companies, Inc.(b) | | | 1,434 | | | | 138,381 | |
Crane Co. | | | 3,240 | | | | 197,996 | |
Danaher Corp.(b) | | | 5,414 | | | | 443,298 | |
Dover Corp. | | | 944 | | | | 71,480 | |
FUJIFILM Holdings Corp. | | | 4,700 | | | | 178,513 | |
General Electric Co. | | | 2,805 | | | | 75,959 | |
Illinois Tool Works, Inc. | | | 912 | | | | 85,345 | |
Ingersoll-Rand PLC | | | 8,190 | | | | 539,230 | |
Nikon Corp. | | | 2,700 | | | | 38,488 | |
Parker-Hannifin Corp.(b) | | | 2,061 | | | | 246,001 | |
Pentair PLC | | | 646 | | | | 40,149 | |
Textron, Inc.(b) | | | 7,122 | | | | 313,226 | |
| | | | | | | | |
| | | | | | | 2,497,244 | |
| | | | | | | | |
| | |
OFFICE & BUSINESS EQUIPMENT (0.04%) | | | | | | | | |
Canon, Inc. | | | 7,200 | | | | 258,271 | |
Pitney Bowes, Inc. | | | 497 | | | | 11,118 | |
| | | | | | | | |
| | | | | | | 269,389 | |
| | | | | | | | |
| | |
OIL & GAS (1.08%) | | | | | | | | |
Anadarko Petroleum Corp. | | | 2,941 | | | | 276,748 | |
Apache Corp. | | | 282 | | | | 19,289 | |
BP PLC | | | 44,932 | | | | 324,231 | |
Canadian Natural Resources, Ltd.(b) | | | 10,943 | | | | 363,855 | |
Chesapeake Energy Corp. | | | 1,595 | | | | 25,153 | |
| | |
| See Notes to Financial Statements. | | |
Annual Report | April 30, 2015 | | 31 |
| | |
| Redmont Resolute Fund II | | Schedule of Investments |
| | April 30, 2015 |
| | | | | | | | |
| Description | | Shares | | | Value (Note 2) | |
| |
OIL & GAS (1.08%) (continued) | | | | | | | | |
Chevron Corp. | | | 567 | | | $ | 62,971 | |
Devon Energy Corp. | | | 59 | | | | 4,024 | |
Diamondback Energy, Inc.(a) | | | 8,467 | | | | 699,120 | |
Energen Corp.(b) | | | 5,803 | | | | 413,000 | |
EOG Resources, Inc. | | | 4,243 | | | | 419,845 | |
EQT Corp. | | | 2,385 | | | | 214,507 | |
Exxon Mobil Corp. | | | 8,737 | | | | 763,352 | |
Helmerich & Payne, Inc. | | | 124 | | | | 9,668 | |
Hess Corp. | | | 1,408 | | | | 108,275 | |
Idemitsu Kosan Co., Ltd. | | | 3,300 | | | | 64,231 | |
Inpex Corp. | | | 10,300 | | | | 130,260 | |
Kosmos Energy, Ltd.(a) | | | 15,410 | | | | 150,710 | |
Marathon Oil Corp. | | | 3,097 | | | | 96,317 | |
Marathon Petroleum Corp. | | | 4,595 | | | | 452,929 | |
Neste Oil OYJ | | | 4,919 | | | | 133,995 | |
Newfield Exploration Co.(a) | | | 668 | | | | 26,212 | |
Occidental Petroleum Corp. | | | 5,598 | | | | 448,400 | |
Parsley Energy, Inc., Class A(a) | | | 37,260 | | | | 646,088 | |
Phillips 66 | | | 6,947 | | | | 550,967 | |
Precision Drilling Corp. | | | 15,286 | | | | 111,129 | |
QEP Resources, Inc. | | | 14,746 | | | | 331,785 | |
Rice Energy, Inc.(a)(b) | | | 12,069 | | | | 297,259 | |
Royal Dutch Shell PLC, Class A | | | 2,112 | | | | 66,767 | |
Statoil ASA | | | 3,715 | | | | 78,447 | |
Tesoro Corp. | | | 230 | | | | 19,741 | |
TOTAL SA | | | 674 | | | | 36,694 | |
Transocean, Ltd. | | | 1,063 | | | | 20,006 | |
Valero Energy Corp. | | | 1,020 | | | | 58,038 | |
| | | | | | | | |
| | | | | | | 7,424,013 | |
| | | | | | | | |
| | |
OIL & GAS SERVICES (0.05%) | | | | | | | | |
Baker Hughes, Inc. | | | 1,482 | | | | 101,458 | |
FMC Technologies, Inc.(a) | | | 784 | | | | 34,574 | |
Petrofac, Ltd. | | | 3,677 | | | | 49,330 | |
Schlumberger, Ltd. | | | 1,477 | | | | 139,739 | |
| | | | | | | | |
| | | | | | | 325,101 | |
| | | | | | | | |
| | |
PACKAGING & CONTAINERS (0.22%) | | | | | | | | |
Ball Corp. | | | 1,000 | | | | 73,410 | |
Berry Plastics Group, Inc.(a) | | | 8,374 | | | | 286,558 | |
Crown Holdings, Inc.(a)(b) | | | 6,481 | | | | 351,659 | |
Graphic Packaging Holding Co.(b) | | | 44,320 | | | | 624,912 | |
Packaging Corp. of America | | | 2,821 | | | | 195,185 | |
| | | | | | | | |
| | | | | | | 1,531,724 | |
| | | | | | | | |
| | |
PHARMACEUTICALS (1.02%) | | | | | | | | |
AbbVie, Inc. | | | 8,338 | | | | 539,135 | |
Actavis PLC(a) | | | 114 | | | | 32,246 | |
Alfresa Holdings Corp. | | | 8,300 | | | | 124,917 | |
AmerisourceBergen Corp. | | | 687 | | | | 78,524 | |
Astellas Pharma, Inc. | | | 1,400 | | | | 21,920 | |
AstraZeneca PLC | | | 629 | | | | 43,414 | |
| | |
| See Notes to Financial Statements. | | |
32 | | www.redmontfunds.com |
| | |
| Redmont Resolute Fund II | | Schedule of Investments |
| | April 30, 2015 |
| | | | | | | | |
| Description | | Shares | | | Value (Note 2) | |
| |
PHARMACEUTICALS (1.02%) (continued) | | | | | | | | |
Bayer AG | | | 2,035 | | | $ | 296,822 | |
Cardinal Health, Inc.(b) | | | 4,662 | | | | 393,193 | |
Daiichi Sankyo Co., Ltd. | | | 3,100 | | | | 54,146 | |
Eisai Co., Ltd. | | | 1,600 | | | | 107,632 | |
Express Scripts Holding Co.(a)(b) | | | 7,551 | | | | 652,406 | |
GlaxoSmithKline PLC | | | 1,730 | | | | 40,218 | |
Johnson & Johnson | | | 6,238 | | | | 618,810 | |
McKesson Corp.(b) | | | 2,089 | | | | 466,683 | |
Medipal Holdings Corp. | | | 600 | | | | 8,246 | |
Merck & Co., Inc. | | | 6,160 | | | | 366,890 | |
Novartis AG | | | 2,061 | | | | 213,512 | |
Novartis AG, Sponsored ADR | | | 1,600 | | | | 162,880 | |
Novo Nordisk A/S, Class B | | | 5,176 | | | | 294,788 | |
Omnicare, Inc.(b) | | | 5,018 | | | | 441,484 | |
Pfizer, Inc. | | | 19,181 | | | | 650,811 | |
Roche Holding AG | | | 568 | | | | 164,017 | |
Sanofi | | | 512 | | | | 52,431 | |
Santen Pharmaceutical Co., Ltd. | | | 6,500 | | | | 86,068 | |
Shionogi & Co. | | | 1,900 | | | | 62,776 | |
Shire PLC | | | 2,423 | | | | 198,425 | |
Shire PLC, ADR | | | 837 | | | | 203,818 | |
Sumitomo Dainippon Pharma Co., Ltd. | | | 10,000 | | | | 112,982 | |
Takeda Pharmaceutical Co., Ltd. | | | 800 | | | | 41,253 | |
Teva Pharmaceutical Industries, Ltd., Sponsored ADR | | | 8,070 | | | | 487,589 | |
| | | | | | | | |
| | | | | | | 7,018,036 | |
| | | | | | | | |
| | |
PIPELINES (0.01%) | | | | | | | | |
ONEOK, Inc. | | | 997 | | | | 47,956 | |
| | | | | | | | |
| | |
REAL ESTATE (0.07%) | | | | | | | | |
CBRE Group, Inc., Class A(a) | | | 921 | | | | 35,311 | |
Daito Trust Construction Co., Ltd. | | | 1,200 | | | | 140,452 | |
IMMOFINANZ AG(a) | | | 11,242 | | | | 33,805 | |
Mitsubishi Estate Co., Ltd. | | | 9,000 | | | | 212,789 | |
Nomura Real Estate Holdings, Inc. | | | 1,700 | | | | 34,769 | |
| | | | | | | | |
| | | | | | | 457,126 | |
| | | | | | | | |
| | |
REAL ESTATE INVESTMENT TRUSTS (0.11%) | | | | | | | | |
American Capital Agency Corp. | | | 8,576 | | | | 176,966 | |
American Homes 4 Rent, Class A | | | 6,633 | | | | 112,031 | |
American Residential Properties, Inc.(a) | | | 5,397 | | | | 101,248 | |
Boston Properties, Inc.(b) | | | 794 | | | | 105,054 | |
General Growth Properties, Inc. | | | 89 | | | | 2,439 | |
Host Hotels & Resorts, Inc. | | | 7,615 | | | | 153,366 | |
Iron Mountain, Inc. | | | 460 | | | | 15,865 | |
Public Storage | | | 335 | | | | 62,950 | |
| | | | | | | | |
| | | | | | | 729,919 | |
| | | | | | | | |
| | |
RETAIL (0.49%) | | | | | | | | |
Aeon Co., Ltd. | | | 12,000 | | | | 149,849 | |
Best Buy Co., Inc. | | | 532 | | | | 18,434 | |
| | |
| See Notes to Financial Statements. | | |
Annual Report | April 30, 2015 | | 33 |
| | |
| Redmont Resolute Fund II | | Schedule of Investments |
| | April 30, 2015 |
| | | | | | | | |
| Description | | Shares | | | Value (Note 2) | |
| |
RETAIL (0.49%) (continued) | | | | | | | | |
Chipotle Mexican Grill, Inc.(a) | | | 60 | | | $ | 37,280 | |
CVS Health Corp.(b) | | | 6,109 | | | | 606,563 | |
Darden Restaurants, Inc. | | | 374 | | | | 23,850 | |
Dollar General Corp. | | | 337 | | | | 24,503 | |
Dollar Tree, Inc.(a) | | | 759 | | | | 57,995 | |
FamilyMart Co., Ltd. | | | 2,400 | | | | 103,719 | |
Fast Retailing Co., Ltd. | | | 400 | | | | 158,442 | |
J Front Retailing Co., Ltd. | | | 4,000 | | | | 66,801 | |
Kohl’s Corp. | | | 703 | | | | 50,370 | |
Lowe’s Companies, Inc. | | | 1,475 | | | | 101,568 | |
Macy’s, Inc.(b) | | | 6,676 | | | | 431,470 | |
O’Reilly Automotive, Inc.(a) | | | 504 | | | | 109,786 | |
Pandora A/S | | | 1,521 | | | | 157,719 | |
Shimamura Co., Ltd. | | | 300 | | | | 30,050 | |
Staples, Inc. | | | 910 | | | | 14,851 | |
Starbucks Corp. | | | 3,015 | | | | 149,484 | |
The Gap, Inc. | | | 9,640 | | | | 382,130 | |
The Home Depot, Inc.(b) | | | 4,715 | | | | 504,411 | |
The TJX Companies, Inc. | | | 557 | | | | 35,949 | |
Wal-Mart Stores, Inc. | | | 2,288 | | | | 178,578 | |
| | | | | | | | |
| | | | | | | 3,393,802 | |
| | | | | | | | |
| | |
SAVINGS & LOANS (0.04%) | | | | | | | | |
Investors Bancorp, Inc. | | | 21,189 | | | | 250,878 | |
| | | | | | | | |
| | |
SEMICONDUCTORS (0.29%) | | | | | | | | |
ASML Holding NV | | | 461 | | | | 50,060 | |
Avago Technologies, Ltd. | | | 2,062 | | | | 241,007 | |
Intel Corp. | | | 4,368 | | | | 142,178 | |
Lam Research Corp. | | | 49 | | | | 3,703 | |
Micron Technology, Inc.(a) | | | 589 | | | | 16,569 | |
NXP Semiconductors NV(a) | | | 5,101 | | | | 490,308 | |
ON Semiconductor Corp.(a)(b) | | | 33,234 | | | | 382,856 | |
QUALCOMM, Inc. | | | 1,663 | | | | 113,084 | |
Texas Instruments, Inc.(b) | | | 9,802 | | | | 531,367 | |
| | | | | | | | |
| | | | | | | 1,971,132 | |
| | | | | | | | |
| | |
SHIPBUILDING (0.06%) | | | | | | | | |
Huntington Ingalls Industries, Inc.(b) | | | 2,920 | | | | 384,243 | |
| | | | | | | | |
| | |
SOFTWARE (0.36%) | | | | | | | | |
Activision Blizzard, Inc. | | | 9,098 | | | | 207,571 | |
Amadeus IT Holding SA, Class A | | | 3,165 | | | | 145,102 | |
Autodesk, Inc.(a) | | | 443 | | | | 25,176 | |
Citrix Systems, Inc.(a) | | | 319 | | | | 21,424 | |
Electronic Arts, Inc.(a) | | | 447 | | | | 25,966 | |
Fidelity National Information Services, Inc. | | | 4,777 | | | | 298,515 | |
Intuit, Inc. | | | 1,589 | �� | | | 159,424 | |
Microsoft Corp.(b) | | | 18,139 | | | | 882,281 | |
NetEase, Inc., ADR(b) | | | 1,840 | | | | 235,870 | |
| | |
| See Notes to Financial Statements. | | |
34 | | www.redmontfunds.com |
| | |
| Redmont Resolute Fund II | | Schedule of Investments |
| | April 30, 2015 |
| | | | | | | | |
| Description | | Shares | | | Value (Note 2) | |
| |
SOFTWARE (0.36%) (continued) | | | | | | | | |
Oracle Corp.(b) | | | 10,700 | | | $ | 466,734 | |
The Dun & Bradstreet Corp. | | | 246 | | | | 31,407 | |
| | | | | | | | |
| | | | | | | 2,499,470 | |
| | | | | | | | |
| | |
TELECOMMUNICATIONS (0.51%) | | | | | | | | |
AT&T, Inc. | | | 3,411 | | | | 118,157 | |
Belgacom SA | | | 794 | | | | 29,693 | |
CenturyLink, Inc. | | | 222 | | | | 7,983 | |
Cisco Systems, Inc.(b) | | | 14,438 | | | | 416,247 | |
Deutsche Telekom AG | | | 11,252 | | | | 208,150 | |
Eutelsat Communications SA | | | 3,939 | | | | 137,464 | |
Harris Corp.(b) | | | 3,514 | | | | 281,963 | |
Hikari Tsushin, Inc. | | | 900 | | | | 60,301 | |
KDDI Corp. | | | 2,000 | | | | 47,571 | |
Motorola Solutions, Inc. | | | 3,684 | | | | 220,119 | |
Nippon Telegraph & Telephone Corp. | | | 3,000 | | | | 203,116 | |
NTT DOCOMO, Inc. | | | 12,000 | | | | 213,568 | |
Orange SA | | | 3,984 | | | | 65,938 | |
Qorvo, Inc.(a) | | | 4,559 | | | | 300,484 | |
SoftBank Corp. | | | 1,700 | | | | 106,855 | |
Swisscom AG | | | 246 | | | | 146,870 | |
Telecom Italia SpA(a) | | | 120,449 | | | | 143,226 | |
Verizon Communications, Inc. | | | 10,474 | | | | 528,309 | |
Vodafone Group PLC | | | 74,943 | | | | 265,219 | |
| | | | | | | | |
| | | | | | | 3,501,233 | |
| | | | | | | | |
| | |
TOYS, GAMES & HOBBIES (0.01%) | | | | | | | | |
Mattel, Inc. | | | 1,410 | | | | 39,706 | |
| | | | | | | | |
| | |
TRANSPORTATION (0.17%) | | | | | | | | |
AP Moeller-Maersk A/S, Class A | | | 62 | | | | 119,723 | |
AP Moeller-Maersk A/S, Class B | | | 49 | | | | 97,346 | |
Central Japan Railway Co. | | | 1,100 | | | | 197,659 | |
CH Robinson Worldwide, Inc. | | | 283 | | | | 18,222 | |
Deutsche Post AG | | | 1,621 | | | | 53,794 | |
East Japan Railway Co. | | | 2,500 | | | | 221,838 | |
FedEx Corp. | | | 391 | | | | 66,302 | |
Hankyu Hanshin Holdings | | | 21,000 | | | | 127,337 | |
Nippon Yusen Kabushiki Kaisha | | | 13,000 | | | | 41,156 | |
Union Pacific Corp. | | | 1,094 | | | | 116,216 | |
United Parcel Service, Inc., Class B | | | 882 | | | | 88,668 | |
| | | | | | | | |
| | | | | | | 1,148,261 | |
| | | | | | | | |
| | |
TOTAL COMMON STOCKS (Cost $84,008,914) | | | | | | | 97,164,630 | |
| |
| | |
EXCHANGE TRADED FUNDS (0.04%) | | | | | | | | |
iShares® Europe ETF | | | 2,658 | | | | 122,480 | |
iShares® MSCI Japan ETF | | | 4,129 | | | | 53,099 | |
| | |
| See Notes to Financial Statements. | | |
Annual Report | April 30, 2015 | | 35 |
| | |
| Redmont Resolute Fund II | | Schedule of Investments |
| | April 30, 2015 |
| | | | | | | | |
| Description | | Shares | | | Value (Note 2) | |
| |
EXCHANGE TRADED FUNDS (0.04%) (continued) | | | | | | | | |
SPDR® S&P 500® ETF Trust | | | 363 | | | $ | 75,693 | |
| | | | | | | | |
| | | | | | | 251,272 | |
| | | | | | | | |
| | |
TOTAL EXCHANGE TRADED FUNDS (Cost $233,887) | | | | | | | 251,272 | |
| |
| | |
LIMITED PARTNERSHIPS (0.02%) | | | | | | | | |
OIL & GAS (0.02%) | | | | | | | | |
Viper Energy Partners LP | | | 6,401 | | | | 131,925 | |
| | | | | | | | |
| | |
TOTAL LIMITED PARTNERSHIPS (Cost $138,096) | | | | | | | 131,925 | |
| |
| | |
OPEN-END MUTUAL FUNDS (62.00%) | | | | | | | | |
AQR Multi Strategy Alternative Fund, Class I | | | 6,325,013 | | | | 62,111,632 | |
AQR Risk Parity Fund, Class I | | | 6,105,398 | | | | 65,633,031 | |
Diamond Hill Long-Short Fund, Class Y(a) | | | 2,446,597 | | | | 60,112,889 | |
FPA Crescent Fund | | | 1,978,548 | | | | 67,666,327 | |
Morgan Stanley Institutional Fund, Inc. - Multi-Asset Portfolio, Class I | | | 5,706,197 | | | | 64,308,836 | |
Nuveen Symphony Floating Rate Income Fund, Class I | | | 345,218 | | | | 7,121,849 | |
PIMCO Short-Term Fund, Institutional Class | | | 10,242,522 | | | | 100,376,720 | |
| | | | | | | | |
| | | | | | | 427,331,284 | |
| | | | | | | | |
| | |
TOTAL OPEN-END MUTUAL FUNDS (Cost $409,525,931) | | | | | | | 427,331,284 | |
| |
| | |
PREFERRED STOCKS (0.02%) | | | | | | | | |
AUTO MANUFACTURERS (0.02%) | | | | | | | | |
Bayerische Motoren Werke AG | | | 1,361 | | | | 125,114 | |
| | | | | | | | |
| | |
TOTAL PREFERRED STOCKS (Cost $107,812) | | | | | | | 125,114 | |
| |
| | |
| Description | | Principal Amount | | | Value (Note 2) | |
| |
ASSET-BACKED SECURITIES (0.32%) | | | | | | | | |
Ford Credit Auto Owner Trust 2015-A A1 | | | | | | | | |
0.32%, 04/15/2016 | | $ | 537,536 | | | | 537,547 | |
Hyundai Auto Lease Securitization Trust 2015-A A1 | | | | | | | | |
0.28%, 03/15/2016(d) | | | 534,642 | | | | 534,658 | |
Nissan Auto Receivables Owner Trust 2015-A A1 | | | | | | | | |
0.35%, 04/15/2016 | | | 871,000 | | | | 871,031 | |
Toyota Auto Receivables Owner Trust 2015-A A2 | | | | | | | | |
0.71%, 07/17/2017 | | | 272,000 | | | | 272,164 | |
| | | | | | | | |
| | | | | | | 2,215,400 | |
| | | | | | | | |
| | |
TOTAL ASSET-BACKED SECURITIES (Cost $2,215,175) | | | | | | | 2,215,400 | |
| |
| | |
| See Notes to Financial Statements. | | |
36 | | www.redmontfunds.com |
| | |
| Redmont Resolute Fund II | | Schedule of Investments |
| | April 30, 2015 |
| | | | | | | | |
| | | Principal Amount | | | Value (Note 2) | |
| |
CORPORATE BONDS (2.07%) | | | | | | | | |
Abbey National Treasury Services PLC | | | | | | | | |
1.38%, 03/13/2017 | | $ | 46,000 | | | $ | 46,180 | |
Actavis Funding SCS | | | | | | | | |
3.00%, 03/12/2020 | | | 38,000 | | | | 38,754 | |
3.80%, 03/15/2025 | | | 10,000 | | | | 10,132 | |
4.55%, 03/15/2035 | | | 35,000 | | | | 35,232 | |
4.75%, 03/15/2045 | | | 6,000 | | | | 6,073 | |
Allegheny Technologies, Inc. | | | | | | | | |
5.95%, 01/15/2021 | | | 23,000 | | | | 24,092 | |
American Campus Communities Operating Partnership LP | | | | | | | | |
4.13%, 07/01/2024 | | | 40,000 | | | | 41,571 | |
American Express Credit Corp. | | | | | | | | |
1.55%, 09/22/2017 | | | 54,000 | | | | 54,320 | |
American Honda Finance Corp. | | | | | | | | |
1.20%, 07/14/2017 | | | 153,000 | | | | 153,308 | |
American International Group, Inc. | | | | | | | | |
3.88%, 01/15/2035 | | | 86,000 | | | | 83,991 | |
Amgen, Inc. | | | | | | | | |
3.13%, 05/01/2025 | | | 63,000 | | | | 62,410 | |
4.40%, 05/01/2045 | | | 68,000 | | | | 67,240 | |
Anadarko Finance Co., Series B | | | | | | | | |
7.50%, 05/01/2031 | | | 20,000 | | | | 26,091 | |
Anadarko Petroleum Corp. | | | | | | | | |
6.45%, 09/15/2036 | | | 114,000 | | | | 141,271 | |
Anheuser-Busch InBev Worldwide, Inc. | | | | | | | | |
1.38%, 07/15/2017 | | | 78,000 | | | | 78,647 | |
Apple, Inc. | | | | | | | | |
3.45%, 02/09/2045 | | | 25,000 | | | | 22,406 | |
Arizona Public Service Co. | | | | | | | | |
2.20%, 01/15/2020 | | | 20,000 | | | | 20,157 | |
Assurant, Inc. | | | | | | | | |
6.75%, 02/15/2034 | | | 98,000 | | | | 123,111 | |
Astoria Financial Corp. | | | | | | | | |
5.00%, 06/19/2017 | | | 97,000 | | | | 102,528 | |
AT&T, Inc. | | | | | | | | |
3.00%, 06/30/2022 | | | 74,000 | | | | 73,670 | |
3.40%, 05/15/2025 | | | 21,000 | | | | 20,849 | |
4.35%, 06/15/2045 | | | 39,000 | | | | 36,084 | |
4.50%, 05/15/2035 | | | 51,000 | | | | 50,088 | |
4.75%, 05/15/2046 | | | 48,000 | | | | 47,098 | |
BAE Systems Holdings, Inc. | | | | | | | | |
3.80%, 10/07/2024(d) | | | 28,000 | | | | 29,321 | |
4.75%, 10/07/2044(d) | | | 35,000 | | | | 37,262 | |
Banco Internacional del Peru SAA | | | | | | | | |
5.75%, 10/07/2020(e) | | | 100,000 | | | | 110,750 | |
Bancolombia SA | | | | | | | | |
5.95%, 06/03/2021 | | | 100,000 | | | | 111,170 | |
Bangkok Bank PCL Hong Kong | | | | | | | | |
3.88%, 09/27/2022(e) | | | 200,000 | | | | 209,549 | |
Bank of America Corp. | | | | | | | | |
4.25%, 10/22/2026 | | | 104,000 | | | | 104,510 | |
7.25%, 10/15/2025 | | | 7,000 | | | | 8,760 | |
| | |
| See Notes to Financial Statements. | | |
Annual Report | April 30, 2015 | | 37 |
| | |
| Redmont Resolute Fund II | | Schedule of Investments |
| | April 30, 2015 |
| | | | | | | | |
| | | Principal Amount | | | Value (Note 2) | |
| |
CORPORATE BONDS (2.07%) (continued) | | | | | | | | |
Bank of America Corp., Series L | | | | | | | | |
2.60%, 01/15/2019 | | $ | 119,000 | | | $ | 120,971 | |
3.95%, 04/21/2025 | | | 35,000 | | | | 34,586 | |
BBVA Bancomer SA | | | | | | | | |
6.75%, 09/30/2022(e) | | | 150,000 | | | | 170,812 | |
Becton Dickinson and Co. | | | | | | | | |
4.69%, 12/15/2044 | | | 10,000 | | | | 10,519 | |
Bharti Airtel International Netherlands BV | | | | | | | | |
5.13%, 03/11/2023(e) | | | 200,000 | | | | 217,700 | |
Blue Cross & Blue Shield of Minnesota | | | | | | | | |
3.79%, 05/01/2025(d) | | | 17,000 | | | | 17,128 | |
BP Capital Markets PLC | | | | | | | | |
3.54%, 11/04/2024 | | | 22,000 | | | | 22,508 | |
4.74%, 03/11/2021 | | | 30,000 | | | | 33,741 | |
Cemex Finance LLC | | | | | | | | |
6.00%, 04/01/2024(e) | | | 200,000 | | | | 205,620 | |
Chevron Corp. | | | | | | | | |
1.37%, 03/02/2018 | | | 40,000 | | | | 40,207 | |
1.96%, 03/03/2020 | | | 22,000 | | | | 22,119 | |
China Cinda Finance 2015 I, Ltd. | | | | | | | | |
4.25%, 04/23/2025(d) | | | 200,000 | | | | 196,723 | |
China Overseas Finance Cayman V, Ltd. | | | | | | | | |
3.95%, 11/15/2022 | | | 200,000 | | | | 200,677 | |
CISCO Systems, Inc. | | | | | | | | |
2.13%, 03/01/2019 | | | 66,000 | | | | 67,227 | |
Citigroup, Inc. | | | | | | | | |
3.88%, 03/26/2025 | | | 19,000 | | | | 18,829 | |
5.88%, 02/22/2033 | | | 179,000 | | | | 204,091 | |
Colbun SA | | | | | | | | |
4.50%, 07/10/2024(e) | | | 200,000 | | | | 208,823 | |
Costco Wholesale Corp. | | | | | | | | |
2.25%, 02/15/2022 | | | 42,000 | | | | 41,664 | |
Credit Suisse New York | | | | | | | | |
1.70%, 04/27/2018 | | | 38,000 | | | | 37,969 | |
5.40%, 01/14/2020 | | | 177,000 | | | | 198,991 | |
Crown Castle Towers | | | | | | | | |
3.66%, 05/15/2025 | | | 26,000 | | | | 26,000 | |
CVS Pass-Through Trust | | | | | | | | |
5.93%, 01/10/2034(d) | | | 34,984 | | | | 41,487 | |
Deutsche Bank AG London | | | | | | | | |
1.88%, 02/13/2018 | | | 125,000 | | | | 125,562 | |
Development Bank of Kazakhstan JSC | | | | | | | | |
4.13%, 12/10/2022(e) | | | 200,000 | | | | 185,580 | |
Diageo Capital PLC | | | | | | | | |
5.75%, 10/23/2017 | | | 69,000 | | | | 76,578 | |
Discover Financial Services | | | | | | | | |
3.75%, 03/04/2025 | | | 38,000 | | | | 38,090 | |
Dollar General Corp. | | | | | | | | |
4.13%, 07/15/2017 | | | 59,000 | | | | 62,007 | |
Dominion Gas Holdings LLC | | | | | | | | |
4.80%, 11/01/2043 | | | 34,000 | | | | 37,085 | |
| | |
| See Notes to Financial Statements. | | |
38 | | www.redmontfunds.com |
| | |
| Redmont Resolute Fund II | | Schedule of Investments |
| | April 30, 2015 |
| | | | | | | | |
| | | Principal Amount | | | Value (Note 2) | |
| |
CORPORATE BONDS (2.07%) (continued) | | | | | | | | |
Dominion Resources, Inc. | | | | | | | | |
5.75%, 10/01/2054(f) | | $ | 31,000 | | | $ | 33,096 | |
Domtar Corp. | | | | | | | | |
6.75%, 02/15/2044 | | | 46,000 | | | | 51,596 | |
DP World, Ltd. | | | | | | | | |
6.85%, 07/02/2037(e) | | | 100,000 | | | | 112,976 | |
Ecolab, Inc. | | | | | | | | |
2.25%, 01/12/2020 | | | 19,000 | | | | 19,083 | |
Ecopetrol SA | | | | | | | | |
5.88%, 09/18/2023 | | | 100,000 | | | | 108,875 | |
El Paso Pipeline Partners Operating Co., LLC | | | | | | | | |
6.50%, 04/01/2020 | | | 92,000 | | | | 106,488 | |
Energy Transfer Partners LP | | | | | | | | |
4.90%, 03/15/2035 | | | 38,000 | | | | 37,204 | |
5.15%, 03/15/2045 | | | 31,000 | | | | 30,314 | |
EnLink Midstream Partners LP | | | | | | | | |
5.05%, 04/01/2045 | | | 19,000 | | | | 19,064 | |
Entergy Arkansas, Inc. | | | | | | | | |
4.95%, 12/15/2044 | | | 25,000 | | | | 25,833 | |
Entergy Louisiana LLC | | | | | | | | |
4.95%, 01/15/2045 | | | 23,000 | | | | 23,517 | |
Exelon Generation Co., LLC | | | | | | | | |
2.95%, 01/15/2020 | | | 26,000 | | | | 26,448 | |
Exxon Mobil Corp. | | | | | | | | |
1.31%, 03/06/2018 | | | 41,000 | | | | 41,271 | |
Farmers Exchange Capital III | | | | | | | | |
5.45%, 10/15/2054(d)(f) | | | 15,000 | | | | 15,844 | |
Fifth Third Bancorp, Series J | | | | | | | | |
4.90%, Perpetual Maturity(g) | | | 80,000 | | | | 78,036 | |
First Niagara Financial Group, Inc. | | | | | | | | |
6.75%, 03/19/2020 | | | 166,000 | | | | 183,266 | |
7.25%, 12/15/2021 | | | 37,000 | | | | 41,407 | |
FirstEnergy Corp., Series C | | | | | | | | |
7.38%, 11/15/2031 | | | 74,000 | | | | 94,505 | |
Forest Laboratories, Inc. | | | | | | | | |
4.88%, 02/15/2021(d) | | | 65,000 | | | | 71,162 | |
Freeport-McMoran Oil & Gas LLC / FCX Oil & Gas, Inc. | | | | | | | | |
6.63%, 05/01/2021 | | | 35,000 | | | | 37,100 | |
6.75%, 02/01/2022 | | | 60,000 | | | | 64,290 | |
Freeport-McMoRan, Inc. | | | | | | | | |
2.30%, 11/14/2017 | | | 39,000 | | | | 39,213 | |
General Electric Capital Corp. | | | | | | | | |
1.50%, 07/12/2016 | | | 89,000 | | | | 89,959 | |
5.88%, 01/14/2038 | | | 56,000 | | | | 72,872 | |
General Electric Co. | | | | | | | | |
2.70%, 10/09/2022 | | | 52,000 | | | | 52,610 | |
Georgia Power Co. | | | | | | | | |
3.00%, 04/15/2016 | | | 22,000 | | | | 22,502 | |
Georgia-Pacific LLC | | | | | | | | |
3.60%, 03/01/2025(d) | | | 109,000 | | | | 110,362 | |
3.73%, 07/15/2023(d) | | | 87,000 | | | | 90,542 | |
5.40%, 11/01/2020(d) | | | 75,000 | | | | 85,303 | |
| | |
| See Notes to Financial Statements. | | |
Annual Report | April 30, 2015 | | 39 |
| | |
| Redmont Resolute Fund II | | Schedule of Investments |
| | April 30, 2015 |
| | | | | | | | |
| | | Principal Amount | | | Value (Note 2) | |
| |
CORPORATE BONDS (2.07%) (continued) | | | | | | | | |
Goldcorp, Inc. | | | | | | | | |
5.45%, 06/09/2044 | | $ | 46,000 | | | $ | 46,614 | |
Harris Corp. | | | | | | | | |
3.83%, 04/28/2025 | | | 18,000 | | | | 18,127 | |
4.85%, 04/27/2035 | | | 34,000 | | | | 34,239 | |
5.05%, 04/27/2045 | | | 32,000 | | | | 32,176 | |
Hess Corp. | | | | | | | | |
5.60%, 02/15/2041 | | | 67,000 | | | | 74,682 | |
7.88%, 10/01/2029 | | | 32,000 | | | | 41,967 | |
Hewlett-Packard Co. | | | | | | | | |
6.00%, 09/15/2041 | | | 69,000 | | | | 76,253 | |
Hydro-Quebec | | | | | | | | |
1.38%, 06/19/2017 | | | 95,000 | | | | 95,996 | |
Ingersoll-Rand Global Holding Co., Ltd. | | | | | | | | |
5.75%, 06/15/2043 | | | 84,000 | | | | 98,881 | |
Ingersoll-Rand Luxembourg Finance SA | | | | | | | | |
4.65%, 11/01/2044 | | | 14,000 | | | | 14,320 | |
InRetail Consumer | | | | | | | | |
5.25%, 10/10/2021(e) | | | 50,000 | | | | 51,625 | |
Intel Corp. | | | | | | | | |
1.35%, 12/15/2017 | | | 71,000 | | | | 71,425 | |
Itau Unibanco Holding SA | | | | | | | | |
5.65%, 03/19/2022(e) | | | 200,000 | | | | 209,000 | |
John Deere Capital Corp. | | | | | | | | |
0.36%, 02/25/2016(f) | | | 120,000 | | | | 120,097 | |
1.13%, 06/12/2017 | | | 81,000 | | | | 81,401 | |
1.55%, 12/15/2017 | | | 85,000 | | | | 85,956 | |
JPMorgan Chase & Co. | | | | | | | | |
2.20%, 10/22/2019 | | | 17,000 | | | | 17,014 | |
3.25%, 09/23/2022 | | | 178,000 | | | | 180,858 | |
JPMorgan Chase & Co., Series 1 | | | | | | | | |
7.90%, Perpetual Maturity(g) | | | 75,000 | | | | 80,062 | |
JPMorgan Chase & Co., Series V | | | | | | | | |
5.00%, Perpetual Maturity(g) | | | 36,000 | | | | 35,460 | |
JPMorgan Chase & Co., Series Z | | | | | | | | |
5.30%, Perpetual Maturity(g) | | | 19,000 | | | | 19,071 | |
Kimberly-Clark Corp. | | | | | | | | |
1.85%, 03/01/2020 | | | 12,000 | | | | 11,988 | |
Kimco Realty Corp. | | | | | | | | |
4.25%, 04/01/2045 | | | 17,000 | | | | 16,083 | |
Kinder Morgan, Inc. | | | | | | | | |
5.00%, 02/15/2021(d) | | | 57,000 | | | | 61,589 | |
5.55%, 06/01/2045 | | | 30,000 | | | | 30,051 | |
Kinross Gold Corp. | | | | | | | | |
5.95%, 03/15/2024 | | | 25,000 | | | | 23,340 | |
KOC Holding AS | | | | | | | | |
3.50%, 04/24/2020(e) | | | 200,000 | | | | 196,500 | |
Laboratory Corp. of America Holdings | | | | | | | | |
3.20%, 02/01/2022 | | | 10,000 | | | | 10,093 | |
3.60%, 02/01/2025 | | | 33,000 | | | | 32,957 | |
4.70%, 02/01/2045 | | | 17,000 | | | | 16,977 | |
| | |
| See Notes to Financial Statements. | | |
40 | | www.redmontfunds.com |
| | |
| Redmont Resolute Fund II | | Schedule of Investments |
| | April 30, 2015 |
| | | | | | | | |
| | | Principal Amount | | | Value (Note 2) | |
| |
CORPORATE BONDS (2.07%) (continued) | | | | | | | | |
LS Finance 2022, Ltd. | | | | | | | | |
4.25%, 10/16/2022 | | $ | 200,000 | | | $ | 206,136 | |
Lubrizol Corp. | | | | | | | | |
6.50%, 10/01/2034 | | | 24,000 | | | | 31,741 | |
MAF Global Securities, Ltd. | | | | | | | | |
4.75%, 05/07/2024(e) | | | 200,000 | | | | 211,820 | |
Marathon Oil Corp. | | | | | | | | |
6.60%, 10/01/2037 | | | 28,000 | | | | 34,133 | |
Massachusetts Mutual Life Insurance Co. | | | | | | | | |
4.50%, 04/15/2065(d) | | | 24,000 | | | | 23,043 | |
Medtronic, Inc. | | | | | | | | |
3.50%, 03/15/2025(d) | | | 21,000 | | | | 21,753 | |
4.38%, 03/15/2035(d) | | | 81,000 | | | | 85,727 | |
Metropolitan Life Global Funding I | | | | | | | | |
1.30%, 04/10/2017(d) | | | 300,000 | | | | 301,793 | |
Morgan Stanley | | | | | | | | |
1.88%, 01/05/2018 | | | 54,000 | | | | 54,240 | |
4.10%, 05/22/2023 | | | 174,000 | | | | 178,858 | |
4.75%, 03/22/2017 | | | 63,000 | | | | 66,919 | |
5.00%, 11/24/2025 | | | 33,000 | | | | 35,831 | |
MUFG Americas Holdings Corp. | | | | | | | | |
1.63%, 02/09/2018 | | | 18,000 | | | | 18,022 | |
Mylan, Inc. | | | | | | | | |
7.88%, 07/15/2020(d) | | | 149,000 | | | | 156,028 | |
National Rural Utilities Cooperative Finance Corp. | | | | | | | | |
0.95%, 04/24/2017 | | | 19,000 | | | | 18,997 | |
1.10%, 01/27/2017 | | | 59,000 | | | | 59,327 | |
1.90%, 11/01/2015 | | | 150,000 | | | | 151,144 | |
2.00%, 01/27/2020 | | | 38,000 | | | | 38,015 | |
4.75%, 04/30/2043(f) | | | 64,000 | | | | 64,352 | |
New York Life Global Funding | | | | | | | | |
1.65%, 05/15/2017(d) | | | 104,000 | | | | 105,518 | |
Noble Energy, Inc. | | | | | | | | |
3.90%, 11/15/2024 | | | 20,000 | | | | 20,525 | |
5.05%, 11/15/2044 | | | 69,000 | | | | 72,178 | |
Noble Group, Ltd. | | | | | | | | |
6.75%, 01/29/2020(e) | | | 100,000 | | | | 105,000 | |
Odebrecht Finance, Ltd. | | | | | | | | |
4.38%, 04/25/2025(e) | | | 200,000 | | | | 172,500 | |
Omega Healthcare Investors, Inc. | | | | | | | | |
4.50%, 04/01/2027(d) | | | 43,000 | | | | 42,327 | |
4.95%, 04/01/2024 | | | 49,000 | | | | 51,677 | |
Oracle Corp. | | | | | | | | |
3.90%, 05/15/2035 | | | 51,000 | | | | 50,454 | |
4.13%, 05/15/2045 | | | 51,000 | | | | 50,454 | |
Oversea-Chinese Banking Corp., Ltd. | | | | | | | | |
4.00%, 10/15/2024(e)(f) | | | 200,000 | | | | 207,953 | |
Paccar Financial Corp. | | | | | | | | |
2.20%, 09/15/2019 | | | 93,000 | | | | 94,411 | |
Pacific LifeCorp. | | | | | | | | |
6.00%, 02/10/2020(d) | | | 51,000 | | | | 58,183 | |
| | |
| See Notes to Financial Statements. | | |
Annual Report | April 30, 2015 | | 41 |
| | |
| Redmont Resolute Fund II | | Schedule of Investments |
| | April 30, 2015 |
| | | | | | | | |
| | | Principal Amount | | | Value (Note 2) | |
| |
CORPORATE BONDS (2.07%) (continued) | | | | | | | | |
Pelabuhan Indonesia II PT | | | | | | | | |
4.25%, 05/05/2025(d) | | $ | 200,000 | | | $ | 195,125 | |
Penske Truck Leasing Co., LP / PTL Finance Corp. | | | | | | | | |
3.05%, 01/09/2020(d) | | | 28,000 | | | | 28,534 | |
Petroleos Mexicanos | | | | | | | | |
5.50%, 06/27/2044 | | | 12,000 | | | | 11,898 | |
Pitney Bowes, Inc. | | | | | | | | |
4.63%, 03/15/2024 | | | 80,000 | | | | 82,930 | |
President and Fellows of Harvard College | | | | | | | | |
3.62%, 10/01/2037 | | | 34,000 | | | | 33,953 | |
Prudential Financial, Inc. | | | | | | | | |
5.63%, 06/15/2043(f) | | | 81,000 | | | | 86,872 | |
Regions Financial Corp. | | | | | | | | |
7.38%, 12/10/2037 | | | 111,000 | | | | 144,408 | |
Roche Holdings, Inc. | | | | | | | | |
1.35%, 09/29/2017(d) | | | 300,000 | | | | 302,650 | |
Sberbank of Russia Via SB Capital SA | | | | | | | | |
6.13%, 02/07/2022(e) | | | 200,000 | | | | 194,900 | |
Southwestern Energy Co. | | | | | | | | |
3.30%, 01/23/2018 | | | 10,000 | | | | 10,269 | |
4.05%, 01/23/2020 | | | 19,000 | | | | 19,718 | |
4.95%, 01/23/2025 | | | 37,000 | | | | 38,516 | |
Stanley Black & Decker, Inc. | | | | | | | | |
5.75%, 12/15/2053(f) | | | 83,000 | | | | 90,470 | |
Synchrony Financial | | | | | | | | |
4.25%, 08/15/2024 | | | 54,000 | | | | 56,070 | |
Talisman Energy, Inc. | | | | | | | | |
5.50%, 05/15/2042 | | | 63,000 | | | | 61,800 | |
TD Ameritrade Holding Corp. | | | | | | | | |
2.95%, 04/01/2022 | | | 25,000 | | | | 25,308 | |
The Bank of New York Mellon Corp., Series E | | | | | | | | |
4.95%, Perpetual Maturity(g) | | | 36,000 | | | | 36,033 | |
The Boeing Co. | | | | | | | | |
0.95%, 05/15/2018 | | | 86,000 | | | | 85,349 | |
The Goldman Sachs Group, Inc. | | | | | | | | |
2.55%, 10/23/2019 | | | 24,000 | | | | 24,303 | |
5.25%, 07/27/2021 | | | 53,000 | | | | 60,077 | |
6.13%, 02/15/2033 | | | 53,000 | | | | 66,312 | |
6.75%, 10/01/2037 | | | 123,000 | | | | 155,342 | |
The Goldman Sachs Group, Inc., Series M | | | | | | | | |
5.38%, Perpetual Maturity(g) | | | 20,000 | | | | 20,005 | |
The Interpublic Group of Companies, Inc. | | | | | | | | |
4.20%, 04/15/2024 | | | 36,000 | | | | 37,933 | |
The Southern Co. | | | | | | | | |
1.30%, 08/15/2017 | | | 119,000 | | | | 119,275 | |
Time Warner Cable, Inc. | | | | | | | | |
6.55%, 05/01/2037 | | | 10,000 | | | | 10,395 | |
Time Warner Entertainment Co., LP | | | | | | | | |
8.38%, 07/15/2033 | | | 53,000 | | | | 64,357 | |
Trans-Allegheny Interstate Line Co. | | | | | | | | |
3.85%, 06/01/2025(d) | | | 20,000 | | | | 20,720 | |
| | |
| See Notes to Financial Statements. | | |
42 | | www.redmontfunds.com |
| | |
| Redmont Resolute Fund II | | Schedule of Investments |
| | April 30, 2015 |
| | | | | | | | | | | | |
| | | | | | Principal Amount | | | Value (Note 2) | |
| |
CORPORATE BONDS (2.07%) (continued) | | | | | | | | | | | | |
Transnet SOC, Ltd. | | | | | | | | | | | | |
4.00%, 07/26/2022(e) | | | | | | $ | 200,000 | | | $ | 193,816 | |
Transocean, Inc. | | | | | | | | | | | | |
3.80%, 10/15/2022 | | | | | | | 14,000 | | | | 10,793 | |
Trinity Industries, Inc. | | | | | | | | | | | | |
4.55%, 10/01/2024 | | | | | | | 27,000 | | | | 26,703 | |
Union Pacific Corp. | | | | | | | | | | | | |
3.88%, 02/01/2055 | | | | | | | 23,000 | | | | 21,867 | |
UnitedHealth Group, Inc. | | | | | | | | | | | | |
1.40%, 12/15/2017 | | | | | | | 28,000 | | | | 28,246 | |
Valmont Industries, Inc. | | | | | | | | | | | | |
5.25%, 10/01/2054 | | | | | | | 60,000 | | | | 57,056 | |
Verizon Communications, Inc. | | | | | | | | | | | | |
4.40%, 11/01/2034 | | | | | | | 8,000 | | | | 7,879 | |
4.52%, 09/15/2048(e) | | | | | | | 80,000 | | | | 76,468 | |
4.67%, 03/15/2055(d) | | | | | | | 49,000 | | | | 45,610 | |
4.86%, 08/21/2046 | | | | | | | 88,000 | | | | 88,760 | |
6.40%, 09/15/2033 | | | | | | | 5,000 | | | | 6,081 | |
Viacom, Inc. | | | | | | | | | | | | |
4.85%, 12/15/2034 | | | | | | | 17,000 | | | | 16,855 | |
5.25%, 04/01/2044 | | | | | | | 17,000 | | | | 17,104 | |
Wells Fargo & Co. | | | | | | | | | | | | |
1.40%, 09/08/2017 | | | | | | | 160,000 | | | | 160,785 | |
3.90%, 05/01/2045 | | | | | | | 17,000 | | | | 16,508 | |
Wells Fargo & Co., Series U | | | | | | | | | | | | |
5.88%, Perpetual Maturity(g) | | | | | | | 33,000 | | | | 35,104 | |
Wells Fargo Capital X | | | | | | | | | | | | |
5.95%, 12/15/2036 | | | | | | | 28,000 | | | | 29,015 | |
Woori Bank | | | | | | | | | | | | |
4.75%, 04/30/2024(e) | | | | | | | 200,000 | | | | 212,962 | |
XLIT, Ltd. | | | | | | | | | | | | |
4.45%, 03/31/2025 | | | | | | | 19,000 | | | | 19,173 | |
5.50%, 03/31/2045 | | | | | | | 43,000 | | | | 41,963 | |
| | | | | | | | | | | | |
| | | | | | | | | | | 14,294,788 | |
| | | | | | | | | | | | |
| | | |
TOTAL CORPORATE BONDS (Cost $14,219,680) | | | Currency | | | | | | | | 14,294,788 | |
| |
| | | |
FOREIGN GOVERNMENT BONDS (0.04%) | | | | | | | | | | | | |
Canada Government International Bond | | | | | | | | | | | | |
0.88%, 02/14/2017 | | | USD | | | | 90,000 | | | | 90,443 | |
Mexico Government International Bond | | | | | | | | | | | | |
4.75%, 03/08/2044 | | | USD | | | | 71,000 | | | | 73,254 | |
Province of British Columbia | | | | | | | | | | | | |
2.85%, 06/15/2015 | | | USD | | | | 97,000 | | | | 97,290 | |
| | | | | | | | | | | | |
| | | | | | | | | | | 260,987 | |
| | | | | | | | | | | | |
| | | |
TOTAL FOREIGN GOVERNMENT BONDS (Cost $261,471) | | | | | | | | | | | 260,987 | |
| |
| | |
| See Notes to Financial Statements. | | |
Annual Report | April 30, 2015 | | 43 |
| | |
| Redmont Resolute Fund II | | Schedule of Investments |
| | April 30, 2015 |
| | | | | | | | | | | | |
| | | Principal Amount | | | | | | Value (Note 2) | |
| |
GOVERNMENT BONDS (0.18%) | | | | | | | | | | | | |
Tennessee Valley Authority | | | | | | | | | | | | |
1.75%, 10/15/2018 | | $ | 43,000 | | | | | | | $ | 43,769 | |
| | | | | | | | | | | | |
| | | |
U.S. Treasury Bonds | | | | | | | | | | | | |
3.00%, 11/15/2044 | | | 143,000 | | | | | | | | 150,429 | |
3.13%, 08/15/2044 | | | 96,000 | | | | | | | | 103,358 | |
3.50%, 02/15/2039 | | | 81,000 | | | | | | | | 92,637 | |
4.50%, 02/15/2036 | | | 50,000 | | | | | | | | 66,184 | |
5.25%, 11/15/2028 | | | 69,000 | | | | | | | | 92,783 | |
| | | | | | | | | | | | |
| | | | | | | | | | | 505,391 | |
| | | | | | | | | | | | |
| | | |
U.S. Treasury Inflation Indexed Notes | | | | | | | | | | | | |
0.13%, 04/15/2018 | | | 152,289 | | | | | | | | 156,001 | |
| | | | | | | | | | | | |
| | | |
U.S. Treasury Notes | | | | | | | | | | | | |
1.38%, 03/31/2020 | | | 76,000 | | | | | | | | 75,786 | |
1.38%, 04/30/2020 | | | 64,000 | | | | | | | | 63,820 | |
1.75%, 03/31/2022 | | | 19,000 | | | | | | | | 18,948 | |
2.00%, 02/15/2025 | | | 224,000 | | | | | | | | 223,213 | |
2.25%, 11/15/2024 | | | 132,000 | | | | | | | | 134,506 | |
| | | | | | | | | | | | |
| | | | | | | | | | | 516,273 | |
| | | | | | | | | | | | |
| | | |
TOTAL GOVERNMENT BONDS (Cost $1,205,097) | | | | | | | | | | | 1,221,434 | |
| |
| | | Principal Amount/ Shares | | | | | | Value (Note 2) | |
| |
SHORT TERM INVESTMENTS (10.24%) | | | | | | | | | | | | |
MONEY MARKET FUNDS (9.68%) | | | | | | | | | | | | |
Dreyfus Treasury Cash Management Fund, Institutional Class, 7-day yield, 0.010% | | | 66,732,479 | | | | | | | | 66,732,479 | |
| | | | | | | | | | | | |
| | | |
U.S. TREASURY BILLS (0.56%) | | | | | | | | | | | | |
0.020%, 07/02/2015(b)(h) | | $ | 610,000 | | | | | | | | 610,005 | |
0.063%, 09/17/2015(h) | | | 763,000 | | | | | | | | 762,963 | |
0.180%, 02/04/2016(h) | | | 763,000 | | | | | | | | 762,172 | |
0.208%, 03/31/2016(b)(h) | | | 1,760,000 | | | | | | | | 1,756,806 | |
| | | | | | | | | | | | |
| | | | | | | | | | | 3,891,946 | |
| | | | | | | | | | | | |
TOTAL SHORT TERM INVESTMENTS (Cost $ 70,623,818) | | | | | | | | | | | 70,624,425 | |
| |
| | | |
TOTAL INVESTMENTS (89.03%) (Cost $ 582,539,881) | | | | | | $ | | | | | 613,621,259 | |
| | | |
SEGREGATED CASH WITH BROKERS (15.58%)(i) | | | | | | | | | | | 107,374,766 | |
| | |
| See Notes to Financial Statements. | | |
44 | | www.redmontfunds.com |
| | |
| Redmont Resolute Fund II | | Schedule of Investments |
| | April 30, 2015 |
| | | | | | | | |
| | | | | | Value (Note 2) | |
| |
SECURITIES SOLD SHORT (-3.73%) (Proceeds $24,136,549) | | | | | | $ | (25,702,964) | |
| | |
LIABILITIES IN EXCESS OF OTHER ASSETS (-0.88%) | | | | | | | (6,027,538) | |
| |
NET ASSETS (100.00%) | | | | | | $ | 689,265,523 | |
| |
| | |
SCHEDULE OF SECURITIES SOLD SHORT | | | | | | | | |
| | | Shares | | | Value (Note 2) | |
| |
COMMON STOCKS (-3.73%) | | | | | | | | |
APPAREL (-0.04%) | | | | | | | | |
Under Armour, Inc., Class A | | | (3,381) | | | $ | (262,197) | |
| | | | | | | | |
| | |
AUTO MANUFACTURERS (-0.01%) | | | | | | | | |
Tesla Motors, Inc. | | | (422) | | | | (95,393) | |
| | | | | | | | |
| | |
AUTO PARTS & EQUIPMENT (-0.05%) | | | | | | | | |
Autoliv, Inc. | | | (1,863) | | | | (221,175) | |
Dorman Products, Inc. | | | (2,429) | | | | (113,750) | |
| | | | | | | | |
| | | | | | | (334,925) | |
| | | | | | | | |
BANKS (-0.29%) | | | | | | | | |
BancorpSouth, Inc. | | | (6,376) | | | | (154,363) | |
Bank of Hawaii Corp. | | | (1,908) | | | | (115,224) | |
Community Bank System, Inc. | | | (4,347) | | | | (151,928) | |
CVB Financial Corp. | | | (9,224) | | | | (144,355) | |
First Financial Bankshares, Inc. | | | (4,028) | | | | (116,651) | |
Glacier Bancorp, Inc. | | | (4,811) | | | | (126,722) | |
HDFC Bank, Ltd., ADR | | | (1,823) | | | | (103,619) | |
Home BancShares, Inc. | | | (4,398) | | | | (144,606) | |
PacWest Bancorp | | | (2,706) | | | | (122,041) | |
Trustmark Corp. | | | (6,686) | | | | (159,127) | |
UMB Financial Corp. | | | (2,202) | | | | (109,637) | |
United Bankshares, Inc. | | | (6,370) | | | | (239,385) | |
Valley National Bancorp | | | (11,849) | | | | (111,736) | |
Westamerica Bancorporation | | | (4,346) | | | | (189,268) | |
| | | | | | | | |
| | | | | | | (1,988,662) | |
| | | | | | | | |
BEVERAGES (-0.02%) | | | | | | | | |
Keurig Green Mountain, Inc. | | | (1,216) | | | | (141,506) | |
| | | | | | | | |
| | |
BIOTECHNOLOGY (-0.01%) | | | | | | | | |
Puma Biotechnology, Inc. | | | (390) | | | | (70,426) | |
| | | | | | | | |
| | |
BUILDING MATERIALS (-0.06%) | | | | | | | | |
Trex Co., Inc. | | | (2,803) | | | | (131,517) | |
USG Corp. | | | (5,864) | | | | (155,630) | |
Vulcan Materials Co. | | | (1,057) | | | | (90,395) | |
| | | | | | | | |
| | | | | | | (377,542) | |
| | | | | | | | |
CHEMICALS (-0.10%) | | | | | | | | |
Air Products & Chemicals, Inc. | | | (978) | | | | (140,274) | |
EI du Pont de Nemours & Co. | | | (3,448) | | | | (252,394) | |
FMC Corp. | | | (3,000) | | | | (177,930) | |
| | |
| See Notes to Financial Statements. | | |
Annual Report | April 30, 2015 | | 45 |
| | |
| Redmont Resolute Fund II | | Schedule of Investments |
| | April 30, 2015 |
| | | | | | | | |
| | | Shares | | | Value (Note 2) | |
| |
CHEMICALS (-0.10%) (continued) | | | | | | | | |
Intrepid Potash, Inc. | | | (11,803) | | | $ | (147,892) | |
| | | | | | | | |
| | | | | | | (718,490) | |
| | | | | | | | |
COMMERCIAL SERVICES (-0.15%) | | | | | | | | |
Aramark | | | (4,749) | | | | (145,937) | |
Avis Budget Group, Inc. | | | (3,456) | | | | (187,108) | |
Monro Muffler Brake, Inc. | | | (5,428) | | | | (325,083) | |
Ritchie Bros. Auctioneers, Inc. | | | (7,837) | | | | (198,197) | |
Rollins, Inc. | | | (6,939) | | | | (172,087) | |
| | | | | | | | |
| | | | | | | (1,028,412) | |
| | | | | | | | |
COMPUTERS (-0.13%) | | | | | | | | |
3D Systems Corp. | | | (4,204) | | | | (105,478) | |
Infosys, Ltd., Sponsored ADR | | | (8,064) | | | | (249,823) | |
VeriFone Systems, Inc. | | | (8,915) | | | | (318,889) | |
Wipro, Ltd., ADR | | | (18,889) | | | | (216,657) | |
| | | | | | | | |
| | | | | | | (890,847) | |
| | | | | | | | |
COSMETICS & PERSONAL CARE (-0.03%) | | | | | | | | |
Colgate-Palmolive Co. | | | (2,943) | | | | (198,005) | |
| | | | | | | | |
| | |
DISTRIBUTION & WHOLESALE (-0.08%) | | | | | | | | |
Fastenal Co. | | | (5,975) | | | | (254,654) | |
WW Grainger, Inc. | | | (1,137) | | | | (282,465) | |
| | | | | | | | |
| | | | | | | (537,119) | |
| | | | | | | | |
DIVERSIFIED FINANCIAL SERVICES (-0.08%) | | | | | | | | |
Eaton Vance Corp. | | | (4,901) | | | | (201,333) | |
Financial Engines, Inc. | | | (4,120) | | | | (173,741) | |
LPL Financial Holdings, Inc. | | | (4,771) | | | | (193,082) | |
| | | | | | | | |
| | | | | | | (568,156) | |
| | | | | | | | |
ELECTRIC (-0.02%) | | | | | | | | |
Ormat Technologies, Inc. | | | (2,813) | | | | (102,928) | |
| | | | | | | | |
| | |
ELECTRONICS (-0.15%) | | | | | | | | |
Agilent Technologies, Inc. | | | (3,144) | | | | (130,067) | |
Itron, Inc. | | | (6,104) | | | | (218,889) | |
LG Display Co., Ltd., ADR | | | (16,039) | | | | (221,659) | |
National Instruments Corp. | | | (8,492) | | | | (242,871) | |
Trimble Navigation, Ltd. | | | (7,292) | | | | (185,436) | |
| | | | | | | | |
| | | | | | | (998,922) | |
| | | | | | | | |
ENTERTAINMENT (-0.03%) | | | | | | | | |
DreamWorks Animation SKG, Inc., Class A | | | (7,877) | | | | (205,275) | |
| | | | | | | | |
| | |
FOOD (-0.28%) | | | | | | | | |
Campbell Soup Co. | | | (4,030) | | | | (180,181) | |
Flowers Foods, Inc. | | | (8,666) | | | | (193,598) | |
McCormick & Co., Inc. | | | (2,498) | | | | (188,099) | |
Mondelez International, Inc., Class A | | | (5,292) | | | | (203,054) | |
Snyder’s-Lance, Inc. | | | (2,765) | | | | (81,651) | |
Sprouts Farmers Market, Inc. | | | (7,120) | | | | (227,733) | |
The Fresh Market, Inc. | | | (5,523) | | | | (194,078) | |
The Hain Celestial Group, Inc. | | | (3,104) | | | | (186,985) | |
The JM Smucker Co. | | | (1,656) | | | | (191,964) | |
United Natural Foods, Inc. | | | (3,638) | | | | (245,420) | |
| | | | | | | | |
| | | | | | | (1,892,763) | |
| | | | | | | | |
| | |
| See Notes to Financial Statements. | | |
46 | | www.redmontfunds.com |
| | |
| Redmont Resolute Fund II | | Schedule of Investments |
| | April 30, 2015 |
| | | | | | | | |
| | | Shares | | | Value (Note 2) | |
| |
FOREST PRODUCTS & PAPER (-0.01%) | | | | | | | | |
Wausau Paper Corp. | | | (10,047) | | | $ | (93,638) | |
| | | | | | | | |
| | |
HEALTHCARE - PRODUCTS (-0.09%) | | | | | | | | |
Henry Schein, Inc. | | | (980) | | | | (134,358) | |
ResMed, Inc. | | | (1,835) | | | | (117,330) | |
Sirona Dental Systems, Inc. | | | (1,487) | | | | (137,919) | |
West Pharmaceutical Services, Inc. | | | (4,815) | | | | (256,543) | |
| | | | | | | | |
| | | | | | | (646,150) | |
| | | | | | | | |
HEALTHCARE - SERVICES (-0.02%) | | | | | | | | |
Health Net, Inc. | | | (2,687) | | | | (141,471) | |
| | | | | | | | |
| | |
HOME BUILDERS (-0.01%) | | | | | | | | |
Lennar Corp., Class A | | | (2,163) | | | | (99,065) | |
| | | | | | | | |
| | |
HOME FURNISHINGS (-0.02%) | | | | | | | | |
Leggett & Platt, Inc. | | | (2,819) | | | | (119,723) | |
| | | | | | | | |
| | |
HOUSEWARES (-0.09%) | | | | | | | | |
The Clorox Co. | | | (1,964) | | | | (208,380) | |
The Scotts Miracle-Gro Co., Class A | | | (1,893) | | | | (122,117) | |
Tumi Holdings, Inc. | | | (11,155) | | | | (260,916) | |
| | | | | | | | |
| | | | | | | (591,413) | |
| | | | | | | | |
INTERNET (-0.19%) | | | | | | | | |
Cogent Communications Holdings, Inc. | | | (2,778) | | | | (97,202) | |
Equinix, Inc. | | | (1,101) | | | | (281,779) | |
Internap Corp. | | | (10,588) | | | | (99,527) | |
Netflix, Inc. | | | (313) | | | | (174,185) | |
Pandora Media, Inc. | | | (11,194) | | | | (199,701) | |
Shutterstock, Inc. | | | (1,082) | | | | (73,024) | |
Twitter, Inc. | | | (3,602) | | | | (140,334) | |
Yelp, Inc. | | | (2,520) | | | | (99,263) | |
Zillow, Inc., Class A | | | (1,675) | | | | (163,547) | |
| | | | | | | | |
| | | | | | | (1,328,562) | |
| | | | | | | | |
LEISURE TIME (-0.02%) | | | | | | | | |
Qunar Cayman Islands, Ltd., ADR | | | (3,550) | | | | (166,247) | |
| | | | | | | | |
| | |
METAL FABRICATE & HARDWARE (-0.01%) | | | | | | | | |
Sun Hydraulics Corp. | | | (2,382) | | | | (92,684) | |
| | | | | | | | |
| | |
MINING (-0.01%) | | | | | | | | |
Teck Resources, Ltd., Class B | | | (6,550) | | | | (99,429) | |
| | | | | | | | |
| | |
MISCELLANEOUS MANUFACTURING (-0.07%) | | | | | | | | |
AptarGroup, Inc. | | | (2,346) | | | | (145,616) | |
Proto Labs, Inc. | | | (3,896) | | | | (272,720) | |
Raven Industries, Inc. | | | (3,137) | | | | (62,552) | |
| | | | | | | | |
| | | | | | | (480,888) | |
| | | | | | | | |
OIL & GAS (-0.24%) | | | | | | | | |
Atwood Oceanics, Inc. | | | (4,619) | | | | (154,182) | |
Cabot Oil & Gas Corp. | | | (6,553) | | | | (221,622) | |
Chesapeake Energy Corp. | | | (810) | | | | (12,774) | |
Concho Resources, Inc. | | | (1,730) | | | | (219,122) | |
| | |
| See Notes to Financial Statements. | | |
Annual Report | April 30, 2015 | | 47 |
| | |
| Redmont Resolute Fund II | | Schedule of Investments |
| | April 30, 2015 |
| | | | | | | | |
| | | Shares | | | Value (Note 2) | |
| |
OIL & GAS (-0.24%) (continued) | | | | | | | | |
Continental Resources, Inc. | | | (3,231) | | | $ | (170,048) | |
CVR Energy, Inc. | | | (2,632) | | | | (105,385) | |
Denbury Resources, Inc. | | | (8,169) | | | | (71,969) | |
Diamond Offshore Drilling, Inc. | | | (2,409) | | | | (80,629) | |
Matador Resources Co. | | | (5,431) | | | | (150,547) | |
Oasis Petroleum, Inc. | | | (9,789) | | | | (175,615) | |
Seadrill, Ltd. | | | (12,678) | | | | (165,955) | |
Ultra Petroleum Corp. | | | (8,522) | | | | (145,130) | |
| | | | | | | | |
| | | | | | | (1,672,978) | |
| | | | | | | | |
OIL & GAS SERVICES (-0.06%) | | | | | | | | |
Bristow Group, Inc. | | | (3,617) | | | | (224,724) | |
NOW, Inc. | | | (6,300) | | | | (150,570) | |
| | | | | | | | |
| | | | | | | (375,294) | |
| | | | | | | | |
PACKAGING & CONTAINERS (-0.02%) | | | | | | | | |
Bemis Co., Inc. | | | (2,745) | | | | (123,525) | |
| | | | | | | | |
| | |
PIPELINES (-0.03%) | | | | | | | | |
Spectra Energy Corp. | | | (4,945) | | | | (184,201) | |
| | | | | | | | |
| | |
REAL ESTATE INVESTMENT TRUSTS (-0.12%) | | | | | | | | |
HCP, Inc. | | | (3,629) | | | | (146,212) | |
Health Care REIT, Inc. | | | (1,731) | | | | (124,667) | |
Omega Healthcare Investors, Inc. | | | (3,427) | | | | (123,681) | |
Plum Creek Timber Co., Inc. | | | (2,878) | | | | (121,452) | |
Realty Income Corp. | | | (3,554) | | | | (166,931) | |
Rouse Properties, Inc. | | | (9,475) | | | | (165,528) | |
| | | | | | | | |
| | | | | | | (848,471) | |
| | | | | | | | |
| | |
RETAIL (-0.38%) | | | | | | | | |
Bob Evans Farms, Inc. | | | (4,955) | | | | (213,164) | |
Buffalo Wild Wings, Inc. | | | (1,264) | | | | (201,355) | |
Cabela’s, Inc. | | | (4,087) | | | | (215,548) | |
CarMax, Inc. | | | (3,833) | | | | (261,066) | |
Chipotle Mexican Grill, Inc. | | | (299) | | | | (185,781) | |
Krispy Kreme Doughnuts, Inc. | | | (14,223) | | | | (253,169) | |
L Brands, Inc. | | | (1,687) | | | | (150,750) | |
Mattress Firm Holding Corp. | | | (2,776) | | | | (164,006) | |
Restoration Hardware Holdings, Inc. | | | (2,563) | | | | (220,854) | |
Texas Roadhouse, Inc. | | | (7,401) | | | | (248,674) | |
The Cheesecake Factory, Inc. | | | (4,906) | | | | (245,938) | |
The Wendy’s Co. | | | (26,815) | | | | (271,368) | |
| | | | | | | | |
| | | | | | | (2,631,673) | |
| | | | | | | | |
SAVINGS & LOANS (-0.05%) | | | | | | | | |
Astoria Financial Corp. | | | (10,422) | | | | (137,258) | |
New York Community Bancorp, Inc. | | | (12,355) | | | | (212,382) | |
| | | | | | | | |
| | | | | | | (349,640) | |
| | | | | | | | |
SEMICONDUCTORS (-0.01%) | | | | | | | | |
Cirrus Logic, Inc. | | | (2,826) | | | | (95,462) | |
| | | | | | | | |
| | |
SOFTWARE (-0.41%) | | | | | | | | |
Acxiom Corp. | | | (6,299) | | | | (109,981) | |
Aspen Technology, Inc. | | | (3,475) | | | | (154,255) | |
athenahealth, Inc. | | | (1,909) | | | | (234,158) | |
| | |
| See Notes to Financial Statements. | | |
48 | | www.redmontfunds.com |
| | |
| Redmont Resolute Fund II | | Schedule of Investments |
| | April 30, 2015 |
| | | | | | | | |
| | | Shares | | | Value (Note 2) | |
| |
SOFTWARE (-0.41%) (continued) | | | | | | | | |
Blackbaud, Inc. | | | (8,107) | | | $ | (409,647) | |
Cerner Corp. | | | (2,950) | | | | (211,839) | |
NetSuite, Inc. | | | (2,162) | | | | (206,622) | |
Rackspace Hosting, Inc. | | | (5,420) | | | | (292,138) | |
Red Hat, Inc. | | | (2,774) | | | | (208,771) | |
Salesforce.com, Inc. | | | (4,661) | | | | (339,414) | |
Synchronoss Technologies, Inc. | | | (4,956) | | | | (227,381) | |
The Ultimate Software Group, Inc. | | | (1,162) | | | | (193,148) | |
Tyler Technologies, Inc. | | | (1,855) | | | | (226,217) | |
VMware, Inc., Class A | | | (437) | | | | (38,500) | |
| | | | | | | | |
| | | | | | | (2,852,071) | |
| | | | | | | | |
STORAGE & WAREHOUSING (-0.02%) | | | | | | | | |
Mobile Mini, Inc. | | | (3,714) | | | | (143,138) | |
| | | | | | | | |
| | |
TELECOMMUNICATIONS (-0.18%) | | | | | | | | |
Arista Networks, Inc. | | | (2,129) | | | | (136,277) | |
CenturyLink, Inc. | | | (4,369) | | | | (157,109) | |
Finisar Corp. | | | (8,628) | | | | (175,407) | |
Frontier Communications Corp. | | | (25,430) | | | | (174,450) | |
Sprint Corp. | | | (39,846) | | | | (204,410) | |
Telefonica SA, Sponsored ADR | | | (12,589) | | | | (190,849) | |
ViaSat, Inc. | | | (2,779) | | | | (167,074) | |
| | | | | | | | |
| | | | | | | (1,205,576) | |
| | | | | | | | |
TOYS, GAMES & HOBBIES (-0.02%) | | | | | | | | |
Mattel, Inc. | | | (4,885) | | | | (137,562) | |
| | | | | | | | |
| | |
TRANSPORTATION (-0.12%) | | | | | | | | |
Canadian Pacific Railway, Ltd. | | | (592) | | | | (112,823) | |
Heartland Express, Inc. | | | (4,985) | | | | (104,286) | |
JB Hunt Transport Services, Inc. | | | (2,431) | | | | (211,983) | |
Kansas City Southern | | | (919) | | | | (94,188) | |
Knight Transportation, Inc. | | | (3,595) | | | | (103,896) | |
Old Dominion Freight Line, Inc. | | | (973) | | | | (69,210) | |
Ryder System, Inc. | | | (1,218) | | | | (116,149) | |
| | | | | | | | |
| | | | | | | (812,535) | |
| | | | | | | | |
| | |
TOTAL COMMON STOCKS (Proceeds $ 24,136,549) | | | | | | | (25,702,964) | |
| |
| | |
TOTAL SECURITIES SOLD SHORT (Proceeds $ 24,136,549) | | | | | | $ | (25,702,964) | |
| |
SCHEDULE OF WRITTEN OPTIONS
| | | | | | | | | | | | | | |
| | | Number of Contracts | | Exercise Price | | | Maturity Date | | | Value (Note 2) | |
| |
WRITTEN OPTIONS | | | | | | | | | | | | | | |
Call Options | | | | | | | | | | | | | | |
Anadarko Petroleum Corp. | | (25) | | $ | 97.50 | | | | 08/21/2015 | | | $ | (11,125) | |
Diamondback Energy, Inc. | | (7) | | | 85.00 | | | | 06/19/2015 | | | | (2,345) | |
Diamondback Energy, Inc. | | (38) | | | 70.00 | | | | 06/19/2015 | | | | (45,980) | |
EOG Resources, Inc. | | (7) | | | 92.50 | | | | 07/17/2015 | | | | (6,300) | |
| | |
| See Notes to Financial Statements. | | |
Annual Report | April 30, 2015 | | 49 |
| | |
| Redmont Resolute Fund II | | Schedule of Investments |
| | April 30, 2015 |
| | | | | | | | | | | | | | |
| | | Number of Contracts | | Exercise Price | | | Maturity Date | | | Value (Note 2) | |
| |
WRITTEN OPTIONS (continued) | | | | | | | | | | | | | | |
Call Options (continued) | | | | | | | | | | | | | | |
Exxon Mobil Corp. | | (54) | | $ | 87.50 | | | | 07/17/2015 | | | $ | (12,258) | |
Occidental Petroleum Corp. | | (50) | | | 80.00 | | | | 05/15/2015 | | | | (9,500) | |
| | | | | | | | | | | | | | |
| | | | |
TOTAL WRITTEN OPTIONS (Proceeds $72,275) | | | | | | | | | | | | $ | (87,508) | |
| | | | | | | | | | | | | | |
| (a) | Non-income producing security. |
| (b) | Security position either entirely or partially held in a segregated account as collateral for securities sold short, written options, futures contracts, and total return swap contracts. Aggregate total market value of $22,674,464. |
| (d) | Security exempt from registration under rule 144A of the securities act of 1933. This security may be resold in transactions exempt from registration, normally to qualified institutional buyers. At period end, the market value of those securities was $2,678,392, representing 0.39% of the Fund’s net assets. |
| (e) | Securities were purchased pursuant to Regulation S under the Securities Act of 1933, which exempts securities offered and sold outside the United States from registration. Such securities cannot be sold in the United States without either an effective registration statement filed pursuant to Securities Act of 1933, or pursuant to an exemption from registration. These securities have been deemed liquid under guidelines approved by the Fund’s Board of Trustees. At period end, the aggregate market value of those securities was $3,254,354, representing 0.47% of net assets. |
| (f) | The rate shown on floating or adjustable rate securities represents the coupon rate at period end. |
| (g) | This security has no contractual maturity date, is not redeemable and contractually pays an indefinite stream of interest. |
| (h) | Rate shown represents the bond equivalent yield to maturity at date of purchase. |
| (i) | Includes cash which is being held as collateral for securities sold short, written options, and total return swap contracts. |
FUTURES CONTRACTS
At April 30, 2015, the Fund had outstanding futures contracts:
| | | | | | | | | | | | | | | | | | |
| Description | | Position | | | | Contracts | | Expiration Date | | | Underlying Face Amount at Value | | | Unrealized Appreciation | |
| |
Equity Contracts | | | | | | | | | | | | | | | | | | |
Mexican Bolsa Index Future | | Long | | | | 35 | | | 06/22/2015 | | | $ | 1,014,411 | | | $ | 16,462 | |
Fixed Income Contracts | | | | | | | | | | | | | | | | | | |
Euro-BOBL Future | | Short | | | | 9 | | | 06/09/2015 | | | | (1,301,608) | | | | 3,421 | |
Euro-OAT Future | | Long | | | | 8 | | | 06/09/2015 | | | | 1,385,417 | | | | 4,478 | |
U.S. Long Bond Future | | Short | | | | 4 | | | 06/22/2015 | | | | (638,375) | | | | 9,585 | |
Foreign Currency Contracts | | | | | | | | | | | | | | | | | | |
New Zealand Dollar Currency Future | | Long | | | | 35 | | | 06/16/2015 | | | | 2,659,300 | | | | 162,986 | |
| | | | | | | | | | | | | | |
| | | | | | | | | | | | $ | 3,119,145 | | | $ | 196,932 | |
| | | | | | | | | | | | | | |
| | |
| See Notes to Financial Statements. | | |
50 | | www.redmontfunds.com |
| | |
| Redmont Resolute Fund II | | Schedule of Investments |
| | April 30, 2015 |
| | | | | | | | | | | | | | | | | | |
| Description | | Position | | | | Contracts | | Expiration Date | | | Underlying Face Amount at Value | | | Unrealized Appreciation | |
| |
Equity Contracts | | | | | | | | | | | | | | | | | | |
E-Mini S&P 500® Future | | Short | | | | 33 | | | 06/22/2015 | | | $ | (3,430,185) | | | $ | (20,870) | |
Euro STOXX 50® Index Future | | Long | | | | 154 | | | 06/22/2015 | | | | 6,169,746 | | | | (40,390) | |
FTSE® 100 Index Future | | Short | | | | 17 | | | 06/22/2015 | | | | (1,808,125) | | | | (42,157) | |
Russell 2000® E-Mini Future | | Long | | | | 32 | | | 06/22/2015 | | | | 3,892,480 | | | | (66,330) | |
SGX CNX Nifty Index Future | | Long | | | | 155 | | | 05/29/2015 | | | | 2,559,515 | | | | (23,142) | |
Tokyo Price Index Future | | Short | | | | 8 | | | 06/12/2015 | | | | (1,064,322) | | | | (54,323) | |
Fixed Income Contracts | | | | | | | | | | | | | | | | | | |
Australian 10 Year Bond Future | | Long | | | | 2 | | | 06/16/2015 | | | | 154,076 | | | | (232) | |
Australian 3 Year Bond Future | | Long | | | | 2 | | | 06/16/2015 | | | | 155,215 | | | | (197) | |
Canadian 10 Year Bond Future | | Long | | | | 4 | | | 06/22/2015 | | | | 464,915 | | | | (6,906) | |
Canadian 5 Year Bond Future | | Long | | | | 2 | | | 06/22/2015 | | | | 203,581 | | | | (1,861) | |
Euro-BTP Future | | Long | | | | 17 | | | 06/09/2015 | | | | 2,641,459 | | | | (6,709) | |
Long Gilt Future | | Long | | | | 2 | | | 06/29/2015 | | | | 362,629 | | | | (1,416) | |
Short Gilt Future | | Long | | | | 2 | | | 06/29/2015 | | | | 319,035 | | | | (65) | |
U.S. 10 Year Note Future | | Short | | | | 46 | | | 06/22/2015 | | | | (5,905,250) | | | | (14,840) | |
U.S. 5 Year Note Future | | Short | | | | 23 | | | 07/01/2015 | | | | (2,763,054) | | | | (14,786) | |
Foreign Currency Contracts | | | | | | | | | | | | | | | | | | |
Australian Dollar Currency Future | | Short | | | | 32 | | | 06/16/2015 | | | | (2,526,720) | | | | (116,105) | |
British Pound Currency Future | | Short | | | | 37 | | | 06/16/2015 | | | | (3,550,613) | | | | (95,408) | |
Euro FX Currency Future | | Short | | | | 43 | | | 06/16/2015 | | | | (6,055,475) | | | | (387,409) | |
Japanese Yen Currency Future | | Short | | | | 135 | | | 06/16/2015 | | | | (14,137,875) | | | | (211,756) | |
Swiss Franc Currency Future | | Short | | | | 18 | | | 06/16/2015 | | | | (2,420,325) | | | | (186,021) | |
| | | | | | | | | | | | | | |
| | | | | | | | | | | | $ | (26,739,293) | | | $ | (1,290,923) | |
| | | | | | | | | | | | | | |
TOTAL RETURN SWAP CONTRACTS*
| | | | | | | | | | | | | | | | |
| Counterparty | | Reference Obligation | | Notional Amount | | | Rate Paid by the Fund | | | Termination Date | | Unrealized Depreciation | |
| |
Morgan Stanley | | Impala Segregated Portfolio(a) | | $ | 61,888,446 | | | | 1-Month LIBOR BBA | | | 03/20/2019 | | $ | (1,140,245) | |
Morgan Stanley | | Melchior Segregated Portfolio(b) | | | 56,886,548 | | | | 1-Month LIBOR BBA | | | 03/20/2019 | | | (218,762) | |
Morgan Stanley | | Trilogy Segregated Portfolio(c) | | | 113,351,365 | | | | 1-Month LIBOR BBA | | | 09/02/2015 | | | (395,784) | |
| | | | | | | | | | | | | | | | |
| | | | $ | 232,126,359 | | | | | | | | | $ | (1,754,791) | |
| | | | | | | | | | | | | | | | |
| * | The Fund receives payments based on any positive return of the Reference Obligation less the rate paid by the Fund. The Fund makes payments on any negative return of such Reference Obligation plus the rate paid by the Fund. |
| (a) | European equity long/short strategy that employs a flexible, low-net strategy (0% to 50%), and long exposure will vary between 60% and 100%. The portfolio is primarily comprised of large and mid-cap stocks listed on European exchanges. |
| (b) | Global equity long/short strategy that uses a long-biased strategy that is focused on cyclical sectors. The strategy has a net exposure that ranges between 50% and 80%, and long exposure varies between 80% and 100%. The strategy is comprised of large cap stocks listed on exchanges of developed and emerging market countries. |
| (c) | Absolute return, long volatility options strategy. The strategy employs three underlying strategies with most of the exposure to a collared equity strategy. The strategy purchases a basket of large cap stocks, sell out-of-the-money call options, and buy out-of-the-money put options. The strategy also employs an options income strategy that involves selling short duration, near-the-money call spreads and put spreads. |
Common Abbreviations:
AB - Aktiebolag is the Swedish equivalent of the term corporation.
ADR - American Depositary Receipt.
AG - Aktiengesellschaft is a German term that refers to a corporation that is limited by shares, i.e., owned by shareholders.
AQR - AQR Capital Management LLC.
A/S - Aktieselskab is the Danish term for Joint Stock Company.
AS - Anonim Sirketi is the Turkish term for Joint Stock Company.
ASA - Allmennaksjeselskap is the Norwegian term for public limited company.
BBA - British Bankers Association.
| | |
| See Notes to Financial Statements. | | |
Annual Report | April 30, 2015 | | 51 |
| | |
| Redmont Resolute Fund II | | Schedule of Investments |
| | April 30, 2015 |
BOBL - Bundesobligationen is the German word for a German government security issued with a 5 year maturity.
BTP - Bonds offered by the government of Italy.
BV - Besloten Vennootschap is the Dutch term for private limited liability company.
CNX Nifty - The National Stock Exchange of India’s benchmark stock market index for Indian equity market.
ETF - Exchange Traded Fund.
FPA - First Pacific Advisors LLC.
FTSE - Financial Times and the London Stock Exchange.
JSC - Joint Stock Company.
KGaA - Kommanditgesellschaft Auf Aktien is the German term for a partnership limited by shares.
LIBOR - London Interbank Offered Rate.
LLC - Limited Liability Company.
LP - Limited Partnership.
Ltd. - Limited.
MSCI - Morgan Stanley Capital International.
NV - Naamloze Vennootschap is the Dutch term for a public limited liability corporation.
OAT - Obligations Assimilables du Tresor is the French term for Long-term French government bonds.
OYJ - Osakeyhtio is the Finnish equivalent of a public limited company.
PCL - A rearrangement of the letters for Public Limited Company, used in Thailand.
PIMCO - Pacific Investment Management Company.
PLC - Public Limited Company.
PT - Perseroan Terbata is the Indonesian term for limited liability company.
REIT - Real Estate Investment Trust.
S&P - Standard & Poor’s.
SA - Generally designates corporations in various countries, mostly those employing the civil law.
SAA - Sociedad Anonima Abierta is the Peruvian term used for companies with 20 or more shareholders.
SCS - Societe en Commandite Simple is the French term for limited partnership.
SE - SE Regulation. A European company which can operate on a Europe-wide basis and be governed by Community law directly applicable in all Member States.
SGX - Singapore Exchange.
SOC - State owned company.
SpA - Societa per Azione.
SPDR - Standard & Poor’s Depositary Receipt.
STOXX 50 - A stock index representing 50 of the largest companies in Europe based on market capitalization.
| | |
| See Notes to Financial Statements. | | |
52 | | www.redmontfunds.com |
| | |
| Redmont Funds | | Statements of Assets and Liabilities |
| | April 30, 2015 |
| | | | | | | | |
| | | Redmont Resolute Fund I | | | Redmont Resolute Fund II | |
| |
ASSETS | | | | | | | | |
Investments, at value | | $ | 2,835,423 | | | $ | 613,621,259 | |
Deposits with brokers for securities sold short and written options | | | 159,259 | | | | 26,514,766 | |
Deposits with brokers for total return swap contracts | | | 358,000 | | | | 80,860,000 | |
Foreign currency, at value (Cost $– and $18,307, respectively) | | | – | | | | 18,378 | |
Receivable for investments sold | | | 16,307 | | | | 2,905,377 | |
Receivable due from adviser | | | 10,378 | | | | – | |
Receivable for dividends | | | 614 | | | | 394,512 | |
Other assets | | | 13,008 | | | | 4,465 | |
| |
Total assets | | | 3,392,989 | | | | 724,318,757 | |
| |
LIABILITIES | | | | | | | | |
Securities sold short (Proceeds $148,268 and $24,136,549, respectively) | | | 158,177 | | | | 25,702,964 | |
Written options, at value (Premiums received $– and $72,275, respectively) | | | – | | | | 87,508 | |
Unrealized depreciation on total return swap contracts | | | 8,679 | | | | 1,754,791 | |
Investment advisory fees payable | | | – | | | | 365,638 | |
Distributions and service fees payable | | | 140 | | | | N/A | |
Payable for dividend expense on securities sold short | | | 76 | | | | 12,433 | |
Payable for interest expense on total return swap contracts | | | 2,282 | | | | 606,846 | |
Payable for investments purchased | | | 32,999 | | | | 6,352,567 | |
Variation margin payable | | | 1,850 | | | | 53,176 | |
Trustee fees and expenses payable | | | 29 | | | | 5,183 | |
Chief compliance officer fee payable | | | 22 | | | | 4,029 | |
Principal financial officer fees payable | | | 5 | | | | 829 | |
Administration fees payable | | | 2,061 | | | | 38,356 | |
Transfer agent fees payable | | | 5,952 | | | | 4,856 | |
Professional fees payable | | | 12,539 | | | | 26,237 | |
Custody fees payable | | | 4,583 | | | | 20,032 | |
Accrued expenses and other liabilities | | | 2,388 | | | | 17,789 | |
| |
Total liabilities | | | 231,782 | | | | 35,053,234 | |
| |
NET ASSETS | | $ | 3,161,207 | | | $ | 689,265,523 | |
| |
NET ASSETS CONSIST OF | | | | | | | | |
Paid-in capital (Note 6) | | $ | 2,932,701 | | | $ | 650,175,543 | |
Accumulated net income | | | 6,987 | | | | 4,809,515 | |
Accumulated net realized gain on investments, securities sold short, written options, futures contracts, total return swap contracts, and foreign currency transactions | | | 90,806 | | | | 7,628,211 | |
Net unrealized appreciation on investments, securities sold short, written options, futures contracts, total return swap contracts, and translation of assets and liabilities in foreign currency transactions | | | 130,713 | | | | 26,652,254 | |
| |
NET ASSETS | | $ | 3,161,207 | | | $ | 689,265,523 | |
| |
INVESTMENTS, AT COST | | $ | 2,677,112 | | | $ | 582,539,881 | |
| |
| | |
| See Notes to Financial Statements. | | |
Annual Report | April 30, 2015 | | 53 |
| | |
| Redmont Funds | | Statements of Assets and Liabilities |
| | April 30, 2015 |
| | | | | | | | |
| | | Redmont Resolute Fund I | | | Redmont Resolute Fund II | |
| |
PRICING OF SHARES | | | | | | | | |
Class A: | | | | | | | | |
Net Asset Value, offering and redemption price per share(a) | | $ | 10.91 | | | | N/A | |
Net Assets | | $ | 401,311 | | | | N/A | |
Shares of beneficial interest outstanding (unlimited number of shares, no par value common stock authorized) | | | 36,772 | | | | N/A | |
Maximum offering price per share ((NAV/0.9450), based on maximum sales charge of 5.50% of the offering price) | | $ | 11.54 | | | | N/A | |
Class I: | | | | | | | | |
Net Asset Value, offering and redemption price per share | | $ | 10.80 | | | $ | 11.32 | |
Net Assets | | $ | 2,759,896 | | | $ | 689,265,523 | |
Shares of beneficial interest outstanding (unlimited number of shares, no par value common stock authorized) | | | 255,492 | | | | 60,903,896 | |
| (a) | Redemption price per share may be reduced for any applicable contingent deferred sales charge. For a description of a possible sales charge, please see the Fund’s Prospectus. |
| | |
| See Notes to Financial Statements. | | |
54 | | www.redmontfunds.com |
| | |
| Redmont Funds | | Statements of Operations |
| | For the Year Ended April 30, 2015 |
| | | | | | | | |
| | | Redmont Resolute
Fund I | | | Redmont Resolute Fund II | |
| |
INVESTMENT INCOME | | | | | | | | |
Dividends | | $ | 48,903 | | | $ | 13,759,521 | |
Interest | | | 26 | | | | 230,497 | |
Foreign taxes withheld | | | (61) | | | | (48,107) | |
| |
Total investment income | | | 48,868 | | | | 13,941,911 | |
| |
| | |
EXPENSES | | | | | | | | |
Investment advisory fees (Note 7) | | | 53,173 | | | | 9,882,247 | |
Broker fees and charges on securities sold short | | | 1,050 | | | | 167,198 | |
Administration fees | | | 13,964 | | | | 311,677 | |
Transfer agency fees | | | 45,770 | | | | 38,572 | |
Distribution and service fees | | | | | | | | |
Class A | | | 1,292 | | | | N/A | |
Professional fees | | | 13,664 | | | | 40,863 | |
Custody fees | | | 22,582 | | | | 82,192 | |
Reports to shareholders and printing fees | | | 1,421 | | | | 13,375 | |
Trustee fees and expenses | | | 108 | | | | 19,736 | |
Registration/filing fees | | | 28,503 | | | | 3,109 | |
Chief compliance officer fees | | | 249 | | | | 47,150 | |
Principal financial officer fees | | | 67 | | | | 9,953 | |
Dividend expense on securities sold short | | | 2,852 | | | | 463,601 | |
Other | | | 7,484 | | | | 20,071 | |
| |
Total expenses before waivers | | | 192,179 | | | | 11,099,744 | |
Less fees waived/reimbursed by investment adviser (Note 7) | | | | | | | | |
Class A | | | (12,062) | | | | N/A | |
Class I | | | (119,860) | | | | (8,950,885) | |
| |
Total net expenses | | | 60,257 | | | | 2,148,859 | |
| |
NET INVESTMENT INCOME/(LOSS) | | | (11,389) | | | | 11,793,052 | |
| |
Net realized gain on investments | | | 146,810 | | | | 8,702,792 | |
Net realized loss on securities sold short | | | (8,702) | | | | (1,389,237) | |
Net realized gain on written options | | | – | | | | 56,752 | |
Net realized gain on futures contracts | | | 25,101 | | | | 4,041,829 | |
Net realized gain on total return swap contracts | | | 43,942 | | | | 8,036,873 | |
Net realized loss on foreign currency transactions | | | – | | | | (43,275) | |
Net realized capital gain distributions from other investment companies | | | 13,702 | | | | 3,191,369 | |
Net change in unrealized depreciation on investments | | | (66,949) | | | | (4,220,586) | |
Net change in unrealized depreciation on securities sold short | | | (2,149) | | | | (359,419) | |
Net change in unrealized appreciation on written options | | | – | | | | 30,520 | |
Net change in unrealized depreciation on futures contracts | | | (9,010) | | | | (1,093,991) | |
Net change in unrealized depreciation on total return swap contracts | | | (9,914) | | | | (1,963,997) | |
Net change in unrealized appreciation on translation of assets and liabilities in foreign currency transactions | | | – | | | | 1,306 | |
| |
NET REALIZED AND UNREALIZED GAIN ON INVESTMENTS | | | 132,831 | | | | 14,990,936 | |
| |
NET INCREASE IN NET ASSETS RESULTING FROM OPERATIONS | | $ | 121,442 | | | $ | 26,783,988 | |
| |
| | |
| See Notes to Financial Statements. | | |
Annual Report | April 30, 2015 | | 55 |
| | |
| Redmont Funds | | Statements of Changes in Net Assets |
| | |
| | | | | | | | | | | | |
| | | Redmont Resolute Fund I | |
| | | |
| | | | | For the Year Ended April 30, 2015 | | | | | For the Year Ended
April 30, 2014 | |
| | | | | | | | | | | | |
OPERATIONS | | | | | | | | | | | | |
Net investment loss | | | | $ | (11,389) | | | | | $ | (13,472) | |
Net realized gain on investments, securities sold short, futures contracts, and total return swap contracts | | | | | 207,151 | | | | | | 1,493 | |
Net realized gain distributions from other investment companies | | | | | 13,702 | | | | | | 31,794 | |
Net change in unrealized appreciation/(depreciation) on investments, securities sold short, futures contracts, and total return swap contracts | | | | | (88,022) | | | | | | 44,042 | |
| |
Net increase in net assets resulting from operations | | | | | 121,442 | | | | | | 63,857 | |
| |
DISTRIBUTIONS (NOTE 4) | | | | | | | | | | | | |
Net investment income | | | | | | | | | | | | |
Class I | | | | | (2,014) | | | | | | – | |
Net realized gains on investments | | | | | | | | | | | | |
Class A | | | | | (19,271) | | | | | | (291) | |
Class I | | | | | (62,548) | | | | | | (35,858) | |
| |
Net decrease in net assets from distributions | | | | | (83,833) | | | | | | (36,149) | |
| |
BENEFICIAL INTEREST TRANSACTIONS (NOTE 6) | | | | | | | | | | | | |
Shares sold | | | | | | | | | | | | |
Class A | | | | | 828,298 | | | | | | 81,978 | |
Class I | | | | | 187,065 | | | | | | 1,070,517 | |
Dividends reinvested | | | | | | | | | | | | |
Class A | | | | | 19,271 | | | | | | 291 | |
Class I | | | | | 64,562 | | | | | | 35,858 | |
Shares redeemed, net of redemption fees | | | | | | | | | | | | |
Class A | | | | | (541,265) | | | | | | – | |
Class I | | | | | (1,687,672) | | | | | | (179,407) | |
| |
Net increase/(decrease) in net assets derived from beneficial interest transactions | | | | | (1,129,741) | | | | | | 1,009,237 | |
| |
Net increase/(decrease) in Net Assets | | | | | (1,092,132) | | | | | | 1,036,945 | |
NET ASSETS: | | | | | | | | | | | | |
Beginning of period | | | | | 4,253,339 | | | | | | 3,216,394 | |
| |
End of period* | | | | $ | 3,161,207 | | | | | $ | 4,253,339 | |
| |
* Includes accumulated net investment income/(loss) of: | | | | $ | 6,987 | | | | | $ | (24,033) | |
| | |
| See Notes to Financial Statements. | | |
56 | | www.redmontfunds.com |
| | |
| Redmont Funds | | Statements of Changes in Net Assets |
| | |
| | | | | | | | | | | | |
| | | Redmont Resolute Fund II | |
| | | |
| | | | | For the Year Ended April 30, 2015 | | | | | For the Year Ended
April 30, 2014 | |
| | | | | | | | | | | | |
OPERATIONS | | | | | | | | | | | | |
Net investment income | | | | $ | 11,793,052 | | | | | $ | 7,169,861 | |
Net realized gain/(loss) on investments, securities sold short, written options, futures contracts, total return swap contracts, and foreign currency transactions | | | | | 19,405,734 | | | | | | (5,891,610) | |
Net realized gain distributions from other investment companies | | | | | 3,191,369 | | | | | | 5,662,182 | |
Net change in unrealized appreciation/(depreciation) on investments, securities sold short, written options, futures contracts, total return swap contracts, and translation of assets and liabilities in foreign currency transactions | | | | | (7,606,167) | | | | | | 10,861,443 | |
| |
Net increase in net assets resulting from operations | | | | | 26,783,988 | | | | | | 17,801,876 | |
| |
DISTRIBUTIONS (NOTE 4) | | | | | | | | | | | | |
Net investment income | | | | | | | | | | | | |
Class I | | | | | (14,088,339) | | | | | | (6,549,225) | |
Net realized gains on investments | | | | | | | | | | | | |
Class I | | | | | (4,443,526) | | | | | | (4,724,816) | |
| |
Net decrease in net assets from distributions | | | | | (18,531,865) | | | | | | (11,274,041) | |
| |
BENEFICIAL INTEREST TRANSACTIONS (NOTE 6) | | | | | | | | | | | | |
Shares sold | | | | | | | | | | | | |
Class I | | | | | 97,459,393 | | | | | | 278,165,907 | |
Dividends reinvested | | | | | | | | | | | | |
Class I | | | | | 18,500,507 | | | | | | 11,258,768 | |
Shares redeemed, net of redemption fees | | | | | | | | | | | | |
Class I | | | | | (39,895,825) | | | | | | (137,322,440) | |
| |
Net increase in net assets derived from beneficial interest transactions | | | | | 76,064,075 | | | | | | 152,102,235 | |
| |
Net increase in Net Assets | | | | | 84,316,198 | | | | | | 158,630,070 | |
NET ASSETS: | | | | | | | | | | | | |
Beginning of period | | | | | 604,949,325 | | | | | | 446,319,255 | |
| |
End of period* | | | | $ | 689,265,523 | | | | | $ | 604,949,325 | |
| |
* Includes accumulated net investment income/(loss) of: | | | | $ | 4,809,515 | | | | | $ | (965,202) | |
| | |
| See Notes to Financial Statements. | | |
Annual Report | April 30, 2015 | | 57 |
| | |
| Redmont Resolute Fund I | | Financial Highlights |
| | For a share outstanding throughout the periods presented |
| | | | | | | | | | | | | | | | |
| | | Class A | |
| | | | |
| | | For the
Year Ended
April 30, 2015 | | | For the
Year Ended April 30, 2014 | | | For the
Year Ended
April 30, 2013 | | | For the
Period Ended
April 30, 2012(a) | |
| |
| | | | |
NET ASSET VALUE, BEGINNING OF PERIOD | | $ | 10.61 | | | $ | 10.63 | | | $ | 10.17 | | | $ | 10.00 | |
INCOME/(LOSS) FROM OPERATIONS | | | | | | | | | | | | | | | | |
Net investment loss(b) | | | (0.18) | | | | (0.10) | | | | (0.04) | | | | (0.07) | |
Net realized and unrealized gain on investments | | | 0.39 | | | | 0.17 | | | | 0.52 | | | | 0.24 | |
| | | | | | | | | | | | | | | | |
Total from Investment Operations | | | 0.21 | | | | 0.07 | | | | 0.48 | | | | 0.17 | |
| | | | | | | | | | | | | | | | |
| | | | |
LESS DISTRIBUTIONS | | | | | | | | | | | | | | | | |
Net investment income | | | – | | | | – | | | | (0.03) | | | | – | |
Net realized gain on investments | | | (0.23) | | | | (0.09) | | | | (0.00)(c) | | | | – | |
| | | | | | | | | | | | | | | | |
Total Distributions | | | (0.23) | | | | (0.09) | | | | (0.03) | | | | – | |
| | | | | | | | | | | | | | | | |
REDEMPTION FEES ADDED TO PAID IN CAPITAL | | | 0.32 | | | | – | | | | 0.01 | | | | – | |
| | | | | | | | | | | | | | | | |
NET INCREASE/(DECREASE) IN NET ASSET VALUE | | | 0.30 | | | | (0.02) | | | | 0.46 | | | | 0.17 | |
| | | | | | | | | | | | | | | | |
NET ASSET VALUE, END OF PERIOD | | $ | 10.91 | | | $ | 10.61 | | | $ | 10.63 | | | $ | 10.17 | |
| | | | | | | | | | | | | | | | |
TOTAL RETURN(d) | | | 5.05 | % | | | 0.70 | % | | | 4.81 | % | | | 1.70 | % |
| | | | |
RATIOS/SUPPLEMENTAL DATA | | | | | | | | | | | | | | | | |
Net assets, End of Period (000s) | | $ | 401 | | | $ | 104 | | | $ | 21 | | | $ | 1 | |
RATIOS TO AVERAGE NET ASSETS: | | | | | | | | | | | | | | | | |
Operating expenses excluding reimbursement/waiver(e) | | | 5.81% | (f) | | | 5.38% | (f) | | | 6.47 | % | | | 689.76% | (g) |
Operating expenses including reimbursement/waiver(e) | | | 2.08% | (f) | | | 2.08% | (f) | | | 2.30 | % | | | 2.30% | (g) |
Net investment loss including reimbursement/waiver(e) | | | (1.66) | % | | | (0.99) | % | | | (0.38) | % | | | (2.21)% | (g) |
PORTFOLIO TURNOVER RATE | | | 83 | % | | | 91 | % | | | 25 | % | | | 13% | (h) |
| (a) | The Fund’s inception was December 30, 2011. |
| (b) | Calculated using the average shares method. |
| (c) | Less than $0.005 per share. |
| (d) | Total investment return is calculated assuming a purchase of a common share at the opening of the first day and a sale at closing on the last day of each period reported. Dividends and distributions, if any, are assumed for purposes of this calculation to be reinvested at prices obtained under the Fund’s dividend reinvestment plan. Total returns would have been lower had certain expenses not been waived during the period. Total investment returns do not reflect brokerage commissions, if any, and are not annualized. |
| (e) | The ratios exclude the impact of expenses of the underlying funds in which the Fund invests as represented in the Schedule of Investments. |
| (f) | Dividend and interest expense on securities sold short totaled 0.11% and 0.08% of average net assets for the years ended April 30, 2015 and 2014, respectively. |
| | |
| See Notes to Financial Statements. | | |
58 | | www.redmontfunds.com |
| | |
| Redmont Resolute Fund I | | Financial Highlights |
| | For a share outstanding throughout the periods presented |
| | | | | | | | | | | | | | | | |
| | | Class I | |
| | | | |
| | | For the
Year Ended
April 30, 2015 | | | For the
Year Ended
April 30, 2014 | | | For the
Year Ended
April 30, 2013 | | | For the
Period Ended
April 30, 2012(a) | |
| |
| | | | |
NET ASSET VALUE, BEGINNING OF PERIOD | | $ | 10.70 | | | $ | 10.65 | | | $ | 10.18 | | | $ | 10.00 | |
INCOME/(LOSS) FROM OPERATIONS | | | | | | | | | | | | | | | | |
Net investment loss(b) | | | (0.02) | | | | (0.04) | | | | (0.02) | | | | (0.06) | |
Net realized and unrealized gain on investments | | | 0.36 | | | | 0.18 | | | | 0.52 | | | | 0.24 | |
| | | | | | | | | | | | | | | | |
Total from Investment Operations | | | 0.34 | | | | 0.14 | | | | 0.50 | | | | 0.18 | |
| | | | | | | | | | | | | | | | |
| | | | |
LESS DISTRIBUTIONS | | | | | | | | | | | | | | | | |
Net investment income | | | (0.01) | | | | – | | | | (0.03) | | | | – | |
Net realized gain on investments | | | (0.23) | | | | (0.09) | | | | (0.00)(c) | | | | – | |
| | | | | | | | | | | | | | | | |
Total Distributions | | | (0.24) | | | | (0.09) | | | | (0.03) | | | | – | |
| | | | | | | | | | | | | | | | |
REDEMPTION FEES ADDED TO PAID IN CAPITAL | | | 0.00(c) | | | | – | | | | – | | | | – | |
| | | | | | | | | | | | | | | | |
NET INCREASE IN NET ASSET VALUE | | | 0.10 | | | | 0.05 | | | | 0.47 | | | | 0.18 | |
| | | | | | | | | | | | | | | | |
NET ASSET VALUE, END OF PERIOD | | $ | 10.80 | | | $ | 10.70 | | | $ | 10.65 | | | $ | 10.18 | |
| | | | | | | | | | | | | | | | |
TOTAL RETURN(d) | | | 3.16 | % | | | 1.36 | % | | | 4.96 | % | | | 1.80 | % |
| | | | |
RATIOS/SUPPLEMENTAL DATA | | | | | | | | | | | | | | | | |
Net assets, End of Period (000s) | | $ | 2,760 | | | $ | 4,149 | | | $ | 3,195 | | | $ | 951 | |
RATIOS TO AVERAGE NET ASSETS: | | | | | | | | | | | | | | | | |
Operating expenses excluding reimbursement/waiver(e) | | | 5.38% | (f) | | | 4.85% | (f) | | | 5.87 | % | | | 19.86% | (g) |
Operating expenses including reimbursement/waiver(e) | | | 1.66% | (f) | | | 1.73% | (f) | | | 1.90 | % | | | 1.90% | (g) |
Net investment loss including reimbursement/waiver(e) | | | (0.19) | % | | | (0.35) | % | | | (0.23) | % | | | (1.78)% | (g) |
PORTFOLIO TURNOVER RATE | | | 83 | % | | | 91 | % | | | 25 | % | | | 13% | (h) |
| (a) | The Fund’s inception was December 30, 2011. |
| (b) | Calculated using the average shares method. |
| (c) | Less than $0.005 per share. |
| (d) | Total investment return is calculated assuming a purchase of a common share at the opening of the first day and a sale at closing on the last day of each period reported. Dividends and distributions, if any, are assumed for purposes of this calculation to be reinvested at prices obtained under the Fund’s dividend reinvestment plan. Total returns would have been lower had certain expenses not been waived during the period. Total investment returns do not reflect brokerage commissions, if any, and are not annualized. |
| (e) | The ratios exclude the impact of expenses of the underlying funds in which the Fund invests as represented in the Schedule of Investments. |
| (f) | Dividend and interest expense on securities sold short totaled 0.11% and 0.08% of average net assets for the years ended April 30, 2015 and 2014, respectively. |
| | |
| See Notes to Financial Statements. | | |
Annual Report | April 30, 2015 | | 59 |
| | |
| Redmont Resolute Fund II | | Financial Highlights |
| | For a share outstanding throughout the periods presented |
| | | | | | | | | | | | | | | | |
| | | Class I | |
| | | | |
| | | For the
Year Ended
April 30, 2015 | | | For the
Year Ended
April 30, 2014 | | | For the
Year Ended
April 30, 2013 | | | For the
Period Ended
April 30, 2012(a) | |
| |
| | | | |
NET ASSET VALUE, BEGINNING OF PERIOD | | $ | 11.18 | | | $ | 11.05 | | | $ | 10.34 | | | $ | 10.00 | |
INCOME/(LOSS) FROM OPERATIONS | | | | | | | | | | | | | | | | |
Net investment income/(loss)(b) | | | 0.20 | | | | 0.13 | | | | 0.11 | | | | (0.03) | |
Net realized and unrealized gain on investments | | | 0.26 | | | | 0.19 | | | | 0.68 | | | | 0.37 | |
| | | | | | | | | | | | | | | | |
Total from Investment Operations | | | 0.46 | | | | 0.32 | | | | 0.79 | | | | 0.34 | |
| | | | | | | | | | | | | | | | |
| | | | |
LESS DISTRIBUTIONS | | | | | | | | | | | | | | | | |
Net investment income | | | (0.24) | | | | (0.11) | | | | (0.08) | | | | – | |
Net realized gain on investments | | | (0.08) | | | | (0.08) | | | | – | | | | – | |
| | | | | | | | | | | | | | | | |
Total Distributions | | | (0.32) | | | | (0.19) | | | | (0.08) | | | | – | |
| | | | | | | | | | | | | | | | |
NET INCREASE IN NET ASSET VALUE | | | 0.14 | | | | 0.13 | | | | 0.71 | | | | 0.34 | |
| | | | | | | | | | | | | | | | |
NET ASSET VALUE, END OF PERIOD | | $ | 11.32 | | | $ | 11.18 | | | $ | 11.05 | | | $ | 10.34 | |
| | | | | | | | | | | | | | | | |
TOTAL RETURN(c) | | | 4.16 | % | | | 2.85 | % | | | 7.65 | % | | | 3.40 | % |
| | | | |
RATIOS/SUPPLEMENTAL DATA | | | | | | | | | | | | | | | | |
Net assets, End of Period (000s) | | $ | 689,266 | | | $ | 604,949 | | | $ | 446,319 | | | $ | 78,498 | |
RATIOS TO AVERAGE NET ASSETS: | | | | | | | | | | | | | | | | |
Operating expenses excluding reimbursement/waiver(d) | | | 1.68% | (e) | | | 1.69% | (e) | | | 1.32 | % | | | 1.63% | (f) |
Operating expenses including reimbursement/waiver(d) | | | 0.33% | (e) | | | 0.29% | (e) | | | 0.22 | % | | | 1.13% | (f) |
Net investment income/(loss) including reimbursement/waiver(d) | | | 1.79 | % | | | 1.19 | % | | | 1.08 | % | | | (0.97)% | (f) |
PORTFOLIO TURNOVER RATE | | | 54 | % | | | 114 | % | | | 51 | % | | | 18% | (g) |
| (a) | The Fund’s inception was December 30, 2011. |
| (b) | Calculated using the average shares method. |
| (c) | Total investment return is calculated assuming a purchase of a common share at the opening of the first day and a sale at closing on the last day of each period reported. Dividends and distributions, if any, are assumed for purposes of this calculation to be reinvested at prices obtained under the Fund’s dividend reinvestment plan. Total returns would have been lower had certain expenses not been waived during the period. Total investment returns do not reflect brokerage commissions, if any, and are not annualized. |
| (d) | The ratios exclude the impact of expenses of the underlying funds in which the Fund invests as represented in the Schedule of Investments. |
| (e) | Dividend and interest expense on securities sold short totaled 0.10% and 0.08% of average net assets for the years ended April 30, 2015 and 2014, respectively. |
| | |
| See Notes to Financial Statements. | | |
60 | | www.redmontfunds.com |
| | |
| Redmont Funds | | Notes to Financial Statements |
| | April 30, 2015 |
1. ORGANIZATION
Financial Investors Trust (the “Trust”), a Delaware statutory trust, is an open-end management investment company registered under the Investment Company Act of 1940, as amended (“1940 Act”). As of April 30, 2015, the Trust has 30 registered funds. This annual report describes the Redmont Resolute Fund I and Redmont Resolute Fund II (each a “Fund” and collectively, the “Funds”). The Funds seek to provide long-term total return with reduced volatility and reduced correlation to the conventional stock and bond markets. The Redmont Resolute Fund I offers Class A and Class I shares and the Redmont Resolute Fund II offers Class I shares.
2. SIGNIFICANT ACCOUNTING POLICIES
The accompanying financial statements were prepared in accordance with accounting principles generally accepted in the United States of America (“U.S. GAAP”). The preparation of financial statements in conformity with U.S. GAAP requires management to make certain estimates and assumptions that affect the reported amounts of assets and liabilities and disclosures of contingent assets and liabilities at the date of the financial statements and the reported amounts of revenue and expenses during the period. Actual results could differ from those estimates. The Funds are considered an investment company for financial reporting purposes under U.S. GAAP. The following is a summary of significant accounting policies consistently followed by the Funds in preparation of their financial statements.
Investment Valuation: The Funds generally value their securities based on market prices determined at the close of regular trading on the New York Stock Exchange (“NYSE”), normally 4:00 p.m. Eastern Time, on each day the NYSE is open for trading.
For equity securities and mutual funds that are traded on an exchange, the market price is usually the closing sale or official closing price on that exchange. In the case of equity securities not traded on an exchange, or if such closing prices are not otherwise available, the securities are valued at the mean of the most recent bid and ask prices on such day. Redeemable securities issued by open-end registered investment companies are valued at the investment company’s applicable net asset value, with the exception of exchange-traded open-end investment companies, which are priced as equity securities.
The market price for debt obligations is generally the price supplied by an independent third-party pricing service approved by the Board of Trustees (the “Board”), which may use a matrix, formula or other objective method that takes into consideration quotations from dealers, market transactions in comparable investments, market indices and yield curves. If vendors are unable to supply a price, or if the price supplied is deemed to be unreliable, the market price may be determined using quotations received from one or more brokers–dealers that make a market in the security. Short–term debt obligations that will mature in 60 days or less are valued at amortized cost, unless it is determined that using this method would not reflect an investment’s fair value.
Futures contracts that are listed or traded on a national securities exchange, commodities exchange, contract market or comparable over the counter market, and that are freely transferable, are valued at their closing settlement price on the exchange on which they are primarily traded or based upon the current settlement price for a like instrument acquired on the day on which the instrument is being valued. A settlement price may not be used if the market makes a limit move with respect to a particular commodity. Over-the-counter swap contracts for which market quotations are readily available are valued based on quotes received from independent pricing services or one or more dealers that make markets in such securities. Options contracts listed for trading on a securities exchange or board of trade are valued at the last quoted sales price or, in the absence of a sale at the mean of the last bid and asked prices.
When such prices or quotations are not available, or when the Fair Value Committee appointed by the Board believes that they are unreliable, securities may be priced using fair value procedures approved by the Board.
Fair Value Measurements: The Funds disclose the classification of their fair value measurements following a three-tier hierarchy based on the inputs used to measure fair value. Inputs refer broadly to the assumptions that market participants would use in pricing the asset or liability, including assumptions about risk. Inputs may be observable or unobservable. Observable inputs reflect the assumptions market participants would use in pricing the asset or liability that are developed based on market data obtained from sources independent of the reporting entity. Unobservable inputs reflect the reporting entity’s own assumptions about the assumptions market participants would use in pricing the asset or liability that are developed based on the best information available.
| | |
| Annual Report | April 30, 2015 | | 61 |
| | |
| Redmont Funds | | Notes to Financial Statements |
| | April 30, 2015 |
Various inputs are used in determining the value of the Funds’ investments as of the end of the reporting period. When inputs used fall into different levels of the fair value hierarchy, the level in the hierarchy within which the fair value measurement falls is determined based on the lowest level input that is significant to the fair value measurement in its entirety. The designated input levels are not necessarily an indication of the risk or liquidity associated with these investments. These inputs are categorized in the following hierarchy under applicable financial accounting standards:
| | | | |
Level 1 | | – | | Unadjusted quoted prices in active markets for identical investments, unrestricted assets or liabilities that the Funds have the ability to access at the measurement date; |
| | |
Level 2 | | – | | Quoted prices which are not active, quoted prices for similar assets or liabilities in active markets or inputs other than quoted prices that are observable (either directly or indirectly) for substantially the full term of the asset or liability; and |
| | |
Level 3 | | – | | Significant unobservable prices or inputs (including the Funds’ own assumptions in determining the fair value of investments) where there is little or no market activity for the asset or liability at the measurement date. |
The following is a summary of the inputs used to value the Funds’ investments as of April 30, 2015:
Redmont Resolute Fund I
| | | | | | | | | | | | | | | | |
| Investments in Securities at Value | | Level 1 -
Quoted Prices | | | Level 2 - Other Significant
Observable Inputs | | | Level 3 - Significant
Unobservable Inputs | | | Total | |
| |
Common Stocks* | | $ | 354,801 | | | $ | – | | | $ | – | | | $ | 354,801 | |
Exchange Traded Funds | | | 306,253 | | | | – | | | | – | | | | 306,253 | |
Limited Partnerships* | | | 804 | | | | – | | | | – | | | | 804 | |
Open-End Mutual Funds | | | 1,764,631 | | | | – | | | | – | | | | 1,764,631 | |
Short Term Investments | | | | | | | | | | | | | | | | |
Money Market Funds | | | 68,493 | | | | – | | | | – | | | | 68,493 | |
U.S. Treasury Bills | | | – | | | | 4,990 | | | | – | | | | 4,990 | |
| |
Total | | $ | 2,494,982 | | | $ | 4,990 | | | $ | – | | | $ | 2,499,972 | |
| |
| | | | |
| Other Financial Instruments | | | | | | | | | | | | |
| |
Liabilities: | | | | | | | | | | | | | | | | |
Common Stocks Sold Short* | | | (158,177) | | | | – | | | | – | | | | (158,177) | |
Futures Contracts | | | (9,010) | | | | – | | | | – | | | | (9,010) | |
Total Return Swap Contracts | | | – | | | | (8,679) | | | | – | | | | (8,679) | |
| |
Total | | $ | (167,187) | | | $ | (8,679) | | | $ | – | | | $ | (175,866) | |
| |
| | | | |
| Redmont Resolute Fund II | | | | | | | | | | | | | | | | |
| | | | |
| Investments in Securities at Value | | Level 1 - Quoted Prices | | | Level 2 -
Other Significant
Observable Inputs | | | Level 3 - Significant
Unobservable Inputs | | | Total | |
| |
Common Stocks* | | $ | 97,164,630 | | | $ | – | | | $ | – | | | $ | 97,164,630 | |
Exchange Traded Funds | | | 251,272 | | | | – | | | | – | | | | 251,272 | |
Limited Partnerships* | | | 131,925 | | | | – | | | | – | | | | 131,925 | |
Open-End Mutual Funds | | | 427,331,284 | | | | – | | | | – | | | | 427,331,284 | |
Preferred Stocks* | | | 125,114 | | | | – | | | | – | | | | 125,114 | |
Asset-Backed Securities | | | – | | | | 2,215,400 | | | | – | | | | 2,215,400 | |
Corporate Bonds | | | – | | | | 14,294,788 | | | | – | | | | 14,294,788 | |
Foreign Government Bonds | | | – | | | | 260,987 | | | | – | | | | 260,987 | |
Government Bonds | | | – | | | | 1,221,434 | | | | – | | | | 1,221,434 | |
Short Term Investments | | | | | | | | | | | | | | | | |
Money Market Funds | | | 14,293,146 | | | | – | | | | – | | | | 14,293,146 | |
U.S. Treasury Bills | | | – | | | | 3,891,946 | | | | – | | | | 3,891,946 | |
| |
Total | | $ | 539,297,371 | | | $ | 21,884,555 | | | $ | – | | | $ | 561,181,926 | |
| |
| | |
| Redmont Funds | | Notes to Financial Statements |
| | April 30, 2015 |
| | | | | | | | | | | | | | | | |
| Other Financial Instruments | | | | | | | | | | | | |
| |
Assets: | | | | | | | | | | | | | | | | |
Futures Contracts | | $ | 196,932 | | | $ | – | | | $ | – | | | $ | 196,932 | |
Liabilities: | | | | | | | | | | | | | | | | |
Common Stocks Sold Short* | | | (25,702,964) | | | | – | | | | – | | | | (25,702,964) | |
Written Options | | | (87,508) | | | | – | | | | – | | | | (87,508) | |
Futures Contracts | | | (1,290,923) | | | | – | | | | – | | | | (1,290,923) | |
Total Return Swap Contracts | | | – | | | | (1,754,791) | | | | – | | | | (1,754,791) | |
| |
Total | | $ | �� (26,884,463) | | | $ | (1,754,791) | | | $ | – | | | $ | (28,639,254) | |
| |
| * | For detailed Industry descriptions, see the accompanying Schedule of Investments. |
The Funds recognize transfers between levels as of the end of the period. For the year ended April 30, 2015, the Funds did not have any transfers between Level 1 and Level 2 securities. There were no Level 3 securities held during the period.
Foreign Securities: The Funds may directly purchase securities of foreign issuers. Investing in securities of foreign issuers involves special risks not typically associated with investing in securities of U.S. issuers. The risks include possible reevaluation of currencies, the inability to repatriate foreign currency, less complete financial information about companies and possible future adverse political and economic developments. Moreover, securities of many foreign issuers and their markets may be less liquid and their prices more volatile than those of securities of comparable U.S. issuers.
Foreign Currency Translation: The books and records of the Funds are maintained in U.S. dollars. Investment valuations and other assets and liabilities initially expressed in foreign currencies are converted each business day into U.S. dollars based upon current exchange rates. Prevailing foreign exchange rates may generally be obtained at the close of the NYSE (normally, 4:00 p.m. Eastern Time). The portion of realized and unrealized gains or losses on investments due to fluctuations in foreign currency exchange rates is not separately disclosed and is included in realized and unrealized gains or losses on investments, when applicable.
Foreign Currency Spot Contracts: The Funds may enter into foreign currency spot contracts to facilitate transactions in foreign securities or to convert foreign currency receipts into U.S. dollars. A foreign currency spot contract is an agreement between two parties to buy and sell currencies at the current market rate, for settlement generally within two business days. The U.S. dollar value of the contracts is determined using current currency exchange rates supplied by a pricing service.
Trust Expenses: Some expenses of the Trust can be directly attributed to the Funds. Expenses which cannot be directly attributed to the Funds are apportioned among all funds in the Trust based on average net assets of each fund.
Fund and Class Expenses: Expenses that are specific to a Fund or class of shares of a Fund are charged directly to that Fund or share class. Expenses that are common to all Funds generally are allocated among the Funds in proportion to their average daily net assets. Fees provided under the distribution (Rule 12b-1) and/or shareholder service plans for a particular class of the Fund are charged to the operations of such class.
Federal Income Taxes: The Funds comply with the requirements under Subchapter M of the Internal Revenue Code of 1986, as amended, applicable to regulated investment companies and intend to distribute substantially all of their net taxable income and net capital gains, if any, each year so that the Funds will not be subject to excise tax on undistributed income and gains. The Funds are not subject to income taxes to the extent such distributions are made.
As of and during the year ended April 30, 2015, the Funds did not have a liability for any unrecognized tax benefits. The Funds file U.S. federal, state, and local tax returns as required. The Funds’ tax returns are subject to examination by the relevant tax authorities until expiration of the applicable statute of limitations, which is generally three years after the filing of the tax return for federal purposes and four years for most state returns. Tax returns for open years have incorporated no uncertain tax positions that require a provision for income taxes.
Investment Transactions and Investment Income: Investment transactions are accounted for on the date the investments are purchased or sold (trade date basis). Net realized gains and losses from investment transactions are reported on an identified cost basis. Interest income, which includes accretion of discounts and amortization of premiums, is accrued and recorded as earned. Dividend income is recognized on the ex-dividend date or for certain foreign securities, as soon as information is available to the Funds. All of the realized and unrealized gains and losses and net investment income, are allocated daily to each class in proportion its average daily net assets.
| | |
| Annual Report | April 30, 2015 | | 63 |
| | |
| Redmont Funds | | Notes to Financial Statements |
| | April 30, 2015 |
Short Sales: Each Fund may make short sales of securities consistent with its strategies. A short sale is a transaction in which a Fund sells a security it does not own in anticipation that the market price of that security will decline.
When a Fund makes a short sale, it must borrow the security sold short and deliver it to the broker dealer through which it made the short sale as collateral for its obligation to deliver the security upon conclusion of the sale. The Fund may have to pay a fee to borrow particular securities and is often obligated to pay over any accrued interest and dividends on such borrowed securities.
If the price of the security sold short increases between the time of the short sale and the time that a Fund replaces the borrowed security, the Fund will incur a loss; conversely, if the price declines, the Fund will realize a capital gain. Any gain will be decreased, and any loss increased, by the transaction costs described above. The successful use of short selling may be adversely affected by imperfect correlation between movements in the price of the security sold short and the securities being hedged.
To the extent that a Fund engages in short sales, it will provide collateral to the broker-dealer and (except in the case of short sales “against the box”) will maintain additional asset coverage in the form of segregated or “earmarked” assets determined to be liquid in accordance with procedures established by the Board and that is equal to the current market value of the securities sold short, or will ensure that such positions are covered by “offsetting” positions, until the Fund replaces the borrowed security. A short sale is “against the box” to the extent that the Fund contemporaneously owns, or has the right to obtain at no added cost, securities identical to those sold short. Each Fund may engage in short selling to the extent permitted by the federal securities laws and rules and interpretations thereunder. To the extent a Fund engages in short selling in foreign (non-U.S.) jurisdictions, the Fund will do so to the extent permitted by the laws and regulations of such jurisdiction.
Distributions to Shareholders: Each Fund normally pays dividends and distributes capital gains, if any, on an annual basis. Income dividend distributions are derived from interest and other income each Fund receives from their investments, including distributions of short term capital gains. Capital gain distributions are derived from gains realized when each Fund sells a security it has owned for more than a year. Each Fund may make additional distributions and dividends at other times if its portfolio manager or managers believe doing so may be necessary for each Fund to avoid or reduce taxes.
Each Fund may pay or receive cash as collateral on these contracts which may be recorded as an asset and/or liability. The Fund must set aside liquid assets, or engage in other appropriate measures, to cover its obligations under these contracts. Swaps are marked to market daily using either pricing vendor quotations, counterparty prices or model prices and the change in value, if any, is recorded as an unrealized gain or loss. Upfront payments made and/or received by the Fund are recorded as an asset and/or liability and realized gains or losses are recognized ratably over the contract’s term/event, with the exception of forward starting interest rate swaps, whose realized gains or losses are recognized ratably from the effective start date. Periodic payments received or made on swap contracts are recorded as realized gains or losses. Gains or losses are realized upon termination of a swap contract and are recorded on the Statements of Operations.
3. DERIVATIVE INSTRUMENTS
Swap Contracts: Each Fund may enter into swap transactions for hedging purposes or to seek to increase total return. At the present time, the Funds primarily enter into swap transactions for the purpose of increasing total return. Risks may arise as a result of the failure of the counterparty to the swap contract to comply with the terms of the swap contract. The loss incurred by the failure of a counterparty is generally limited to the net payment to be received by the Funds and/or the termination value at the end of the contract.
Therefore, the Funds consider the creditworthiness of each counterparty to a contract in evaluating potential credit risk. Additionally, risks may arise from unanticipated movements in interest rates or in the value of the underlying reference asset or index. Entering into these agreements involves, to varying degrees, market risk, liquidity risk and elements of credit, legal and documentation risk that are not directly reflected in the amounts recognized in the Statements of Assets and Liabilities.
Each Fund invests in total return swaps to obtain exposure to a security or market without owning such security or investing directly in that market or to transfer the risk/return of one market (e.g., fixed income) to another market (e.g., equity) (equity risk and/or interest rate risk). Total return swaps are agreements in which there is an exchange of cash flows whereby one party commits to make payments based on the total return (coupons plus capital gains/losses) of an underlying instrument in exchange for fixed or floating rate interest payments. To the extent the total return of the instrument or index underlying the transaction exceeds or falls short of the offsetting interest rate obligation, the Fund will receive a payment from or make a payment to the counterparty. Swap agreements held at April 30, 2015 are disclosed in the Schedule of Investments.
Each Fund may pay or receive cash as collateral on these contracts which may be recorded as an asset and/or liability. The Fund must set aside liquid assets, or engage in other appropriate measures, to cover its obligations under these contracts. Swaps are marked to market daily using either pricing vendor quotations, counterparty prices or model prices and the change in value, if any, is recorded as an unrealized gain or loss.
| | |
| Redmont Funds | | Notes to Financial Statements |
| | April 30, 2015 |
Upfront payments made and/or received by the Fund are recorded as an asset and/or liability and realized gains or losses are recognized ratably over the contract’s term/event, with the exception of forward starting interest rate swaps, whose realized gains or losses are recognized ratably from the effective start date. Periodic payments received or made on swap contracts are recorded as realized gains or losses. Gains or losses are realized upon termination of a swap contract and are recorded on the Statements of Operations.
International Swaps and Derivatives Association, Inc. Master Agreements (“ISDA Master Agreements”) govern OTC financial derivative transactions entered into by the Funds and those counterparties. The ISDA Master Agreements maintain provisions for general obligations, representations, agreements, collateral and events of default or termination. Events of termination include conditions that may entitle counterparties to elect to terminate early and cause settlement of all outstanding transactions under the applicable ISDA Master Agreement. Any election to early terminate could be material to the financial statements.
Option Contracts: Each Fund may enter into options transactions for hedging purposes and for non-hedging purposes such as seeking to enhance return. Each Fund may write covered put and call options on any stocks or stock indices, currencies traded on domestic and foreign securities exchanges, or futures contracts on stock indices, interest rates and currencies traded on domestic and, to the extent permitted by the CFTC, foreign exchanges. A call option on an asset written by a Fund obligates the Fund to sell the specified asset to the holder (purchaser) at a stated price (the exercise price) if the option is exercised before a specified date (the expiration date). A put option on an asset written by a Fund obligates the Fund to buy the specified asset from the purchaser at the exercise price if the option is exercised before the expiration date. Premiums received when writing options are recorded as liabilities and are subsequently adjusted to the current value of the options written. Premiums received from writing options that expire are treated as realized gains. Premiums received from writing options, which are either exercised or closed, are offset against the proceeds received or amount paid on the transaction to determine realized gains or losses which are recorded on the Statement of Operations.
Written option activity for the year ended April 30, 2015 was as follows:
Redmont Resolute Fund II
| | | | | | | | | | |
| | | |
| | | Written Call Options | |
| |
| | | | | Contracts | | | | Premiums | |
| |
Outstanding, April 30, 2014 | | | | (121) | | | | $ | 55,327 | |
Written | | | | (539) | | | | | 262,824 | |
Covered | | | | 146 | | | | | (70,990) | |
Exercised | | | | 230 | | | | | (122,290) | |
Expired | | | | 103 | | | | | (52,596) | |
| |
Outstanding, April 30, 2015 | | | | (181) | | | | $ | 72,275 | |
| |
Futures: Each Fund may enter into futures contracts for hedging purposes. A futures contract represents a commitment for the future purchase or sale of an asset at a specified price on a specified date. Upon entering into a futures contract, the Fund is required to deposit an initial margin with the broker in an amount equal to a certain percentage of the contract amount. The Fund receives from or pays to the broker, on a daily basis, an amount of cash equal to the daily fluctuation in value of the contract. Such receipts or payments are known as “variation margin,” and are recorded by the Fund as unrealized gains or losses. When the futures contract is closed, the Fund records a gain or loss equal to the difference between the value of the contract at the time it was opened and the value at the time it was closed.
A Fund’s potential losses from the use of futures extend beyond its initial investment in such contracts. The use of futures contracts involves, to varying degrees, elements of market risk in excess of the amount recognized in the Statements of Assets and Liabilities. The predominant risk is that the movement of a futures contract’s price may result in a loss, which could render a Fund’s hedging strategy unsuccessful. There is minimal counterparty credit risk since futures contracts are exchange traded and the exchange’s clearinghouse, as counterparty to all exchange traded futures, guarantees the futures against default.
| | |
| Annual Report | April 30, 2015 | | 65 |
| | |
| Redmont Funds | | Notes to Financial Statements |
| | April 30, 2015 |
Risk Exposure: The following tables disclose the amounts related to each Fund’s use of derivative instruments.
The effect of derivatives instruments on the Statements of Assets and Liabilities as of April 30, 2015:
| | | | | | | | | | | | |
| Risk Exposure | | Asset Derivatives Statements
of Assets and Liabilities
Location | | Fair Value | | | Liability Derivatives Statements
of Assets and Liabilities Location | | Fair Value | |
| |
Redmont Resolute Fund I | | | | | | | | | | | | |
Equity Contracts (Total Return Swap Contracts) | | Unrealized appreciation on total return swap contracts | | $ | – | | | Unrealized depreciation on total return swap contracts | | $ | 8,679 | |
Futures Contracts * | | Unrealized appreciation on futures contracts | | | – | | | Unrealized depreciation on futures contracts | | | 9,010(a) | |
| |
Total | | | | $ | – | | | | | $ | 17,689 | |
| |
| | | | |
| | * Risk Exposure to Fund | | | | | | | | | | |
| | Foreign Currency Contracts | | $ | – | | | | | $ | 9,010 | |
| | | | |
| Risk Exposure | | Asset Derivatives Statements
of Assets and Liabilities
Location | | Fair Value | | | Liability Derivatives Statements
of Assets and Liabilities Location | | Fair Value | |
| |
Redmont Resolute Fund II | | | | | | | | | | | | |
Equity Contracts (Total Return Swap Contracts) | | Unrealized appreciation on total return swap contracts | | $ | – | | | Unrealized depreciation on total return swap contracts | | $ | 1,754,791 | |
Equity Contracts (Written Options) | | N/A | | | N/A | | | Written options, at value | | | 87,508 | |
Futures Contracts * | | Unrealized appreciation on futures contracts | | | 196,932 | (a) | | Unrealized depreciation on futures contracts | | | 1,290,923(a) | |
| |
Total | | | | $ | 196,932 | | | | | $ | 3,133,222 | |
| |
| | | | |
| | * Risk Exposure to Fund | | | | | | | | | | |
| | Equity Contracts | | $ | 16,462 | | | | | $ | 247,212 | |
| | Fixed Income Contracts | | | 17,484 | | | | | | 47,012 | |
| | Foreign Currency Contracts | | | 162,986 | | | | | | 996,699 | |
| | | | | | |
| | | | $ | 196,932 | | | | | $ | 1,290,923 | |
| | | | | | |
| (a) | Reflects cumulative unrealized appreciation (depreciation) of futures contracts as reported in the Schedule of Investments. The value reflected on the accompanying Statement of Assets and Liabilities is only the unsettled variation margin receivable (payable) as of April 30, 2015. |
| | |
| Redmont Funds | | Notes to Financial Statements |
| | April 30, 2015 |
The effect of derivatives instruments on the Statements of Operations for the year ended April 30, 2015:
| | | | | | | | | | |
| Risk Exposure | | Statement of Operations Location | | Realized Gain/(Loss)
on Derivatives
Recognized
in Income | | | Change in Unrealized
Appreciation/(Depreciation)
on Derivatives Recognized in Income | |
| |
Redmont Resolute Fund I | | | | | | | | | | |
Equity Contracts (Total Return Swap Contracts) | | Net realized gain on total return swap contracts/Net change in unrealized depreciation on total return swap contracts | | $ | 43,942 | | | $ | (9,914) | |
Futures Contracts* | | Net realized gain on futures contracts/Net change in unrealized depreciation on futures contracts | | | 25,101 | | | | (9,010) | |
| |
Total | | | | $ | 69,043 | | | $ | (18,924) | |
| | | | | | |
| | | |
| | *Risk Exposure to Fund | | | | | | | | |
| | Domestic Currency Contracts | | $ | 4,308 | | | $ | – | |
| | Foreign Currency Contracts | | | 20,793 | | | | (9,010) | |
| | | | | | |
| | | | $ | 25,101 | | | $ | (9,010) | |
| | | | | | |
| | | |
Redmont Resolute Fund II | | | | | | | | | | |
Equity Contracts (Total Return Swap Contracts) | | Net realized gain on total return swap contracts/Net change in unrealized depreciation on total return swap contracts | | $ | 8,036,873 | | | $ | (1,963,997) | |
Equity Contracts (Written Options) | | Net realized gain on written options/Net change in unrealized appreciation on written options | | | 56,752 | | | | 30,520 | |
Futures Contracts* | | Net realized gain on futures contracts/Net change in unrealized depreciation on futures contracts | | | 4,041,829 | | | | (1,093,991) | |
| |
Total | | | | $ | 12,135,454 | | | $ | (3,027,468) | |
| |
| | | |
| | *Risk Exposure to Fund | | | | | | | | |
| | Equity Contracts | | $ | 876,693 | | | $ | (230,750) | |
| | Fixed Income Contracts | | | 275,614 | | | | (29,528) | |
| | Foreign Currency Contracts | | | 2,889,522 | | | | (833,713) | |
| | | | | | |
| | | | $ | 4,041,829 | | | $ | (1,093,991) | |
| | | | | | |
| | |
| Annual Report | April 30, 2015 | | 67 |
| | |
| Redmont Funds | | Notes to Financial Statements |
| | April 30, 2015 |
Volume of Derivative Instruments for the Funds during the year ended April 30, 2015 was as follows:
| | | | | | | | | | |
| Derivative Type | | Unit of Measurement | | | | Monthly Average | | | |
|
Redmont I | | | | | | | | | | |
Equity Swap Contracts | | Notional Quantity | | | | | 1,279,351 | | | |
| | | | |
| Derivative Type | | Unit of Measurement | | | | Monthly Average | | | |
|
Redmont II | | | | | | | | | | |
Equity Swap Contracts | | Notional Quantity | | | | | 222,888,168 | | | |
Written Option Contracts | | Contracts | | | | | (124) | | | |
Certain derivative contracts and repurchase agreements are executed under either standardized netting agreements or, for exchange-traded derivatives, the relevant contracts for a particular exchange which contain enforceable netting provisions. A derivative netting arrangement creates an enforceable right of set-off that becomes effective, and affects the realization of settlement on individual assets, liabilities and collateral amounts, only following a specified event of default or early termination. Default events may include the failure to make payments or deliver securities timely, material adverse changes in financial condition or insolvency, the breach of minimum regulatory capital requirements, or loss of license, charter or other legal authorization necessary to perform under the contract.
The following table presents financial instruments that are subject to enforceable netting arrangements or other similar agreements as of April 30, 2015:
| | | | | | | | | | | | | | | | | | | | | | |
Redmont Resolute Fund I | |
Offsetting of Derivatives Liabilities | |
| |
| | | | |
| | | | | | | | | | | Gross Amounts
Not Offset in the
Statement of
Financial Position | |
| Description | | Gross Amounts of
Recognized
Liabilities | | | Gross Amounts
Offset in the
Statement of
Financial Position | | Net Amounts
Presented in the
Statement of
Financial Position | | | Financial
Instruments
Available for
Offset (a) | | | Cash Collateral
Pledged(a) | | | Net Payable
Amount | |
| |
Total Return Swap Contracts | | $ | 8,679 | | | | | $ | 8,679 | | | $ | – | | | $ | (8,679) | | | $ | – | |
| |
Total | | $ | 8,679 | | | | | $ | 8,679 | | | $ | – | | | $ | (8,679) | | | $ | – | |
| |
Redmont Resolute Fund II | |
Offsetting of Derivatives Liabilities | |
| |
| | | | |
| | | | | | | | | | | Gross Amounts
Not Offset in the
Statement of
Financial Position | |
| Description | | Gross Amounts of
Recognized
Liabilities | | | Gross Amounts
Offset in the
Statement of
Financial Position | | Net Amounts
Presented in the
Statement of
Financial Position | | | Financial
Instruments
Available for
Offset (a) | | | Cash Collateral
Pledged(a) | | | Net Payable
Amount | |
| |
Total Return Swap Contracts | | $ | 1,754,791 | | | | | $ | 1,754,791 | | | $ | – | | | $ | (1,754,791) | | | $ | – | |
| |
Total | | $ | 1,754,791 | | | | | $ | 1,754,791 | | | $ | – | | | $ | (1,754,791) | | | $ | – | |
| |
| (a) | These amounts are limited to the derivative asset/liability balance and, accordingly, do not include excess collateral received/pledged. |
| | |
| Redmont Funds | | Notes to Financial Statements |
| | April 30, 2015 |
4. TAX BASIS INFORMATION
Reclassifications: As of April 30, 2015, permanent differences in book and tax accounting were reclassified. These differences had no effect on net assets and were primarily attributed to differing book and tax treatment of certain investments. The reclassifications were as follows:
| | | | | | | | | | | | | | |
| | | Undistributed Net
Investment Income | | | Accumulated Net
Realized Loss on
Investments | | | Paid-in Capital | | | |
|
Redmont Resolute Fund I | | $ | 44,423 | | | $ | (44,423) | | | $ | – | | | |
Redmont Resolute Fund II | | | 8,070,004 | | | | (8,137,611) | | | | 67,607 | | | |
Tax Basis of Investments: As of April 30, 2015, the aggregate cost of investments, gross unrealized appreciation/(depreciation) and net unrealized appreciation for Federal tax purposes were as follows:
| | | | | | | | | | | | | | | | | | | | | | |
| | | Gross Appreciation
(excess of value over
tax cost) | | | Gross Depreciation
(excess of tax cost
over value) | | | Net Depreciation of
Derivatives and
Foreign Currency | | | Net Unrealized
Appreciation | | | Cost of Investments
for Income Tax
Purposes | | | |
|
Redmont Resolute Fund I | | $ | 177,245 | | | $ | (24,108) | | | $ | (27,598) | | | $ | 125,539 | | | $ | 2,682,286 | | | |
Redmont Resolute Fund II | | | 37,341,594 | | | | (7,806,446) | | | | (4,429,124) | | | | 25,106,024 | | | | 584,086,111 | | | |
Components of Earnings: As of April 30, 2015, components of distributable earnings were as follows:
| | | | | | | | | | | | | | | | | | | | | | | | |
| | | Accumulated Capital
Gains | | | | | Undistributed Ordinary
Income | | | | | Net Unrealized
Appreciation | | | | | Other Cumulative
Effect of Timing
Differences | | | |
|
Redmont Resolute Fund I | | $ | 74,911 | | | | | $ | 17,527 | | | | | $ | 125,539 | | | | | $ | 10,529 | | | |
Redmont Resolute Fund II | | | 8,100,125 | | | | | | 4,557,865 | | | | | | 25,106,024 | | | | | | 1,325,966 | | | |
Capital Losses: As of April 30, 2015, the Funds have no accumulated capital loss carryforwards.
Tax Basis of Distributions to Shareholders: The character of distributions made during the year from net investment income or net realized gains may differ from its ultimate characterization for federal income tax purposes. Also, due to the timing of dividend distributions, the fiscal year in which amounts are distributed may differ from the fiscal year in which the income or realized gain were recorded by the Funds.
The tax character of distributions paid by the Funds for the fiscal year ended April 30, 2015, were as follows:
| | | | | | | | | | |
| | | Ordinary Income | | | | | Long-Term Capital Gains | |
| |
Redmont Resolute Fund I | | $ | 20,460 | | | | | $ | 63,373 | |
Redmont Resolute Fund II | | | 14,088,339 | | | | | | 4,443,526 | |
|
The tax character of distributions paid by the Funds for the fiscal year ended April 30, 2014, were as follows: | |
| | | |
| | | Ordinary Income | | | | | Long-Term Capital Gains | |
| |
Redmont Resolute Fund I | | $ | 24,591 | | | | | $ | 11,558 | |
Redmont Resolute Fund II | | | 8,831,574 | | | | | | 2,442,467 | |
| | |
| Annual Report | April 30, 2015 | | 69 |
| | |
| Redmont Funds | | Notes to Financial Statements |
| | April 30, 2015 |
5. SECURITIES TRANSACTIONS
Purchases and sales of securities, excluding short-term securities and U.S. Government Obligations during the year ended April 30, 2015 were as follows:
| | | | | | | | |
| Fund | | Purchases of Securities | | | Proceeds From Sales of Securities | |
| |
Redmont Resolute Fund I | | $ | 2,279,076 | | | $ | 3,312,525 | |
Redmont Resolute Fund II | | | 338,073,732 | | | | 277,682,045 | |
|
Purchases and sales of U.S. Government Obligations during the year ended April 30, 2015 were as follows: | |
| | |
| Fund | | Purchases of Securities | | | Proceeds From Sales of Securities | |
| |
Redmont Resolute Fund I | | $ | – | | | $ | – | |
Redmont Resolute Fund II | | | 3,067,387 | | | | 1,618,139 | |
6. BENEFICIAL SHARE TRANSACTIONS
The capitalization of the Trust consists of an unlimited number of shares of beneficial interest with no par value per share. Holders of the shares of the Funds of the Trust have one vote for each share held and a proportionate fraction of a vote for each fractional share. All shares issued and outstanding are fully paid and are transferable and redeemable at the option of the shareholder. Purchasers of the shares do not have any obligation to make payments to the Trust or its creditors (other than the purchase price for the shares) or make contributions to the Trust or its creditors solely by reason of the purchasers’ ownership of the shares. Shares have no pre-emptive rights.
Transactions in common shares were as follows:
Redmont Resolute Fund I
| | | | | | | | |
| Class A: | | For the Year Ended April 30, 2015 | | | | | For the Year Ended
April 30, 2014 |
|
Common Shares Outstanding - Beginning of Period | | | 9,794 | | | | | 2,016 |
Common Shares Sold | | | 76,910 | | | | | 7,751 |
Common Shares Issued as Reinvestment of Dividends | | | 1,832 | | | | | 27 |
Common Shares Redeemed | | | (51,764) | | | | | – |
|
Common Shares Outstanding - End of Period | | | 36,772 | | | | | 9,794 |
|
| | | |
| Class I: | | For the Year Ended April 30, 2015 | | | | | For the Year Ended
April 30, 2014 |
|
Common Shares Outstanding - Beginning of Period | | | 387,727 | | | | | 299,893 |
Common Shares Sold | | | 17,365 | | | | | 101,486 |
Common Shares Issued as Reinvestment of Dividends | | | 6,068 | | | | | 3,354 |
Common Shares Redeemed | | | (155,668) | | | | | (17,006) |
|
Common Shares Outstanding - End of Period | | | 255,492 | | | | | 387,727 |
|
| | | |
Redmont Resolute Fund II | | | | | | | | |
| Class I: | | For the Year Ended April 30, 2015 | | | | | For the Year Ended
April 30, 2014 |
|
Common Shares Outstanding - Beginning of Period | | | 54,134,098 | | | | | 40,383,121 |
Common Shares Sold | | | 8,615,477 | | | | | 25,080,731 |
Common Shares Issued as Reinvestment of Dividends | | | 1,660,728 | | | | | 1,013,390 |
Common Shares Redeemed | | | (3,506,407) | | | | | (12,343,144) |
|
Common Shares Outstanding - End of Period | | | 60,903,896 | | | | | 54,134,098 |
|
| | |
| Redmont Funds | | Notes to Financial Statements |
| | April 30, 2015 |
Shares redeemed within 30 days of purchase may incur a 2% short-term redemption fee deducted from the redemption amount. Redemption fees are reflected in the “Shares redeemed, net of redemption fees” in the Statements of Changes in Net Assets. For the year ended April 30, 2014 and the year ended April 30, 2015, the Funds retained fees as follows:
| | | | | | | | | | |
| Fund | | For the Year Ended
April 30, 2015 | | | For the Year Ended
April 30, 2014 | | | |
|
Redmont Resolute Fund I | | $ | 10,019 | | | $ | – | | | |
Redmont Resolute Fund II | | | – | | | | – | | | |
7. MANAGEMENT AND RELATED PARTY TRANSACTIONS
Investment Advisory
Highland Associates, Inc. (“Highland” or the Adviser”), subject to the authority of the Board, is responsible for the overall management and administration of the Funds’ business affairs. Pursuant to the Investment Advisory Agreement (the “Advisory Agreement”), the Adviser is entitled to an investment advisory fee, computed daily and payable monthly of 1.50% of the average daily net assets for each Fund.
The Adviser entered into an Investment Sub-Advisory Agreement with Robeco Investment Management, Inc. (“Robeco”) and with Pinebridge Investments LLC (“Pinebridge). The Investment Sub-Advisory Agreements are in accordance with the Funds’ investment objective, policies and limitations and investment guidelines established jointly by the Adviser and the Board. The Adviser determines the allocation of each Fund’s assets among Robeco, Pinebridge and other open-end investment companies. The Funds are not required to invest with any minimum number of sub-advisers or open-end investment companies, and do not have minimum or maximum limitations with respect to allocations of assets to Robeco and Prinebridge (collectively the “Sub-Advisors”), investment strategy or market sector. Highland may change the allocation of each of the Fund’s assets among the available investment options, and may add or remove sub-advisers, at any time. The Sub-Advisors are responsible for the day-to-day management of its allocated portion of Fund assets. Highland has ultimate responsibility, subject to the oversight of the Board of the Funds, to oversee the Sub-Advisors, and to recommend their hiring, termination and replacement.
Pursuant to the each Investment Sub-Advisory Agreement, the Adviser pays the Sub-Advisors an annual sub-advisory management fee which is based on each Fund’s average quarterly market value of the assets managed by the Sub-Advisors. The Adviser is required to pay all fees due to Sub-Advisors out of the management fee the Adviser receives from each Fund. The following table reflects the Funds’ contractual sub-advisory fee rates.
| | | | | | |
| Sub-Advisers | | Average Daily
Market Value of the Fund | | Contractual
Sub-Advisory Fee | | |
|
| | First $50 Million | | 0.55% | | |
Pinebridge Investments LLC | | Over $50 Million | | 0.50% | | |
| | First $50 Million | | 1.25% | | |
Robeco Investment Management, Inc. | | Over $50 Million | | 1.00% | | |
The Adviser has agreed, with respect to Redmont Resolute Fund I’s Class A and Class I shares, to contractually to waive the portion of its 1.50% Management Fee in excess of the sum of 0.50% plus any sub-advisory fees paid by the Adviser to the Sub-Advisors, and/or reimburse the Fund (or class, as applicable) by the amount of such excess. In addition, after giving effect to the foregoing fee waiver and/or expense reimbursement, the Adviser has contractually agreed to limit the amount of the Fund’s total annual expenses (exclusive of Distribution and Service (12b-1) Fees, shareholder services fees, swap fees and expenses, acquired fund fees and expenses, sub-advisory fees, brokerage expenses, interest expense, taxes and extraordinary expenses) to 1.40% of the average daily net assets. The agreement is in effect through August 31, 2017. Pursuant to this agreement, the Fund will reimburse the Adviser for any fee waivers and expense reimbursements made by the Adviser, provided that any such reimbursements made by the Fund to the Adviser will not cause the Fund’s expense limitation to exceed expense limitations in existence at the time the expense was incurred, or at the time of the reimbursement, whichever is lower, and the reimbursement is made within three years after the expenses were incurred.
The Adviser has agreed, with respect to the Redmont Resolute Fund II Class I shares, to waive the portion of its 1.50% Management Fee in excess of any sub-advisory fees paid by the Adviser to Sub-Advisors. This agreement is in effect through August 31, 2017.
| | |
| Annual Report | April 30, 2015 | | 71 |
| | |
| Redmont Funds | | Notes to Financial Statements |
| | April 30, 2015 |
For the year ended April 30, 2015, the fee waivers and/or reimbursements were as follows:
| | | | | | | | | | |
| | | Fees Waived/Reimbursed By
Adviser | | | | Recoupment of Previously
Waived Fees By Adviser | | | |
|
Redmont Resolute Fund I - Class A | | $ (12,062) | | | | $ | – | | | |
Redmont Resolute Fund I - Class I | | (119,860) | | | | | – | | | |
Redmont Resolute Fund II - Class I | | (8,950,885) | | | | | – | | | |
As of April 30, 2015, the balances of recoupable expenses for each Fund were as follows:
| | | | | | | | | | | | | | | | | | |
| | | Expires 2016 | | | Expires 2017 | | | Expires 2018 | | | Total | | | |
|
Redmont Resolute Fund I - Class A | | $ | 2,377 | | | $ | 801 | | | $ | 9,323 | | | $ | 12,501 | | | |
Redmont Resolute Fund I - Class I | | | 61,265 | | | | 83,109 | | | | 92,586 | | | | 236,960 | | | |
Administrator Fees and Expenses
ALPS Fund Services, Inc. (“ALPS”) serves as administrator to the Funds and the Funds have agreed to pay expenses incurred in connection with their administrative activities. Pursuant to an Administrative Agreement, ALPS provides operational services to the Funds including, but not limited to, fund accounting and fund administration and generally assists in the Funds’ operations. Officers of the Trust are employees of ALPS. The Funds’ administration fee is accrued on a daily basis and paid monthly. Administration fees paid by the Funds for the year ended April 30, 2015 are disclosed in the Statements of Operations.
ALPS is reimbursed by the Fund for certain out-of-pocket expenses.
Transfer Agent
ALPS serves as transfer, dividend paying and shareholder servicing agent for the Funds. ALPS receives an annual minimum fee, a fee based upon the number of shareholder accounts, and is also reimbursed by the Funds for certain out-of-pocket expenses.
Compliance Services
ALPS provides services that assist the Trust’s chief compliance officer in monitoring and testing the policies and procedures of the Trust in conjunction with requirements under Rule 38a-1 under the 1940 Act and receives an annual base fee. ALPS is reimbursed for certain out-of-pocket expenses by the Funds.
Principal Financial Officer
ALPS receives an annual fee for providing principal financial officer services to the Funds.
Distributor
ALPS Distributors, Inc. (“ADI” or the “Distributor”) (an affiliate of ALPS) acts as the distributor of the Funds’ shares pursuant to a Distribution Agreement with the Trust. Shares are sold on a continuous basis by ADI as agent for the Funds, and ADI has agreed to use its best efforts to solicit orders for the sale of Funds’ shares, although it is not obliged to sell any particular amount of shares. ADI is not entitled to any compensation for its services as Distributor. ADI is registered as a broker-dealer with the Securities and Exchange Commission.
The Redmont Resolute Fund I has adopted a Distribution and Services Plan (the “Plan”) pursuant to Rule 12b-1 of the 1940 Act for Class A shares. The Plan allows the Fund to use Class A assets to pay fees in connection with the distribution and marketing of Class A shares and/or the provision of shareholder services to Class A shareholders. The Plan permits payment for services in connection with the administration of plans or programs that use Class A shares of the Fund, if any, as their funding medium and for related expenses. The Plan permits the Fund to make total payments at an annual rate of up to 0.25% of the Fund’s average daily net assets attributable to its Class A shares. Because these fees are paid out of the Fund’s Class A assets, if any, on an ongoing basis, over time they will increase the cost of an investment in Class A shares, if any, and Plan fees may cost an investor more than other types of sales charges.
The Redmont Resolute Fund I has adopted a shareholder services plan (“Shareholder Services Plan”) for Class A shares. Under the Shareholder Services Plan the Fund is authorized to pay banks and their affiliates and other institutions, including broker-dealers and Fund affiliates (“Participating Organizations”), an aggregate fee in an amount not to exceed on an annual basis 0.15% for Class A shares of the average daily net asset value of the Class A shares, respectively, attributable to or held in the name of a Participating Organization for its clients as compensation for providing shareholder service activities, which do not include distribution services, pursuant to an agreement with a Participating Organization. Shareholder Services plan fees are included with distribution and service fees on the Statement of Operations.
| | |
| Redmont Funds | | Notes to Financial Statements |
| | April 30, 2015 |
8. INDEMNIFICATIONS
Under the Trust’s organizational documents, its officers and Trustees are indemnified against certain liability arising out of the performance of their duties to the Trust. Additionally, in the normal course of business, the Trust enters into contracts with service providers that may contain general indemnification clauses which may permit indemnification to the extent permissible under applicable law. The Trust’s maximum exposure under these arrangements is unknown, as this would involve future claims that may be made against the Trust that have not yet occurred.
| | |
| Annual Report | April 30, 2015 | | 73 |
| | |
| Redmont Funds | | Report of Independent Registered Accounting Firm |
| | April 30, 2015 |
To the Shareholders and Board of Trustees of Financial Investors Trust:
We have audited the accompanying statements of assets and liabilities, including the schedules of investments, of Redmont Resolute Fund I and Redmont Resolute Fund II (the “Funds”), two of the portfolios constituting Financial Investors Trust, as of April 30, 2015, and the related statements of operations for the year then ended, the statements of changes in net assets for each of the two years in the period then ended, and the financial highlights for each of the three years in the period then ended and for the period from December 30, 2011 (inception) to April 30, 2012. These financial statements and financial highlights are the responsibility of the Funds’ management. Our responsibility is to express an opinion on these financial statements and financial highlights based on our audits.
We conducted our audits in accordance with the standards of the Public Company Accounting Oversight Board (United States). Those standards require that we plan and perform the audit to obtain reasonable assurance about whether the financial statements and financial highlights are free of material misstatement. The Funds are not required to have, nor were we engaged to perform, an audit of their internal control over financial reporting. Our audits included consideration of internal control over financial reporting as a basis for designing audit procedures that are appropriate in the circumstances, but not for the purpose of expressing an opinion on the effectiveness of the Funds’ internal control over financial reporting. Accordingly, we express no such opinion. An audit also includes examining, on a test basis, evidence supporting the amounts and disclosures in the financial statements, assessing the accounting principles used and significant estimates made by management, as well as evaluating the overall financial statement presentation. Our procedures included confirmation of securities owned as of April 30, 2015, by correspondence with the custodian and brokers; where replies were not received from brokers, we performed other auditing procedures. We believe that our audits provide a reasonable basis for our opinion. We believe that our audits provide a reasonable basis for our opinion.
In our opinion, the financial statements and financial highlights referred to above present fairly, in all material respects, the financial position of Redmont Resolute Fund I and Redmont Resolute Fund II of Financial Investors Trust as of April 30, 2015, the results of their operations for the year then ended, and the changes in their net assets for each of the two years in the period then ended, and the financial highlights for each of the three years in the period then ended and the period from December 30, 2011 (inception) to April 30, 2012, in conformity with accounting principles generally accepted in the United States of America.
DELOITTE & TOUCHE LLP
Denver, Colorado
June 26, 2015
| | |
| Redmont Funds | | Disclosure Regarding Approval of Fund Advisory Agreements |
| | April 30, 2015 (Unaudited) |
On December 9, 2014, the Trustees met in person to discuss, among other things, the approval of the investment advisory agreement between the Trust and Highland Associates, Inc. (“Highland”) (the “Investment Advisory Agreement”), and the investment sub-advisory agreement among the Trust, Highland and Robeco Investment Management, Inc. (“Robeco”), in accordance with Section 15(c) of the 1940 Act. The Independent Trustees met with independent legal counsel during executive session and discussed the Investment Advisory Agreement and Sub-Advisory Agreement, and other related materials.
In renewing and approving the Investment Advisory Agreement with Highland, and the Sub-Advisory Agreement with Robeco, the Trustees, including the Independent Trustees, considered the following factors with respect to the Redmont Resolute Funds (the “Redmont Funds”):
Investment Advisory Fee Rate: The Trustees reviewed and considered the contractual annual advisory fee to be paid by the Trust, on behalf of the Redmont Funds, to Highland of 1.50% of each of the Redmont Funds’ daily average net assets, in light of the extent and quality of the advisory services to be provided by Highland to the Redmont Funds. The Trustees also reviewed and considered the contractual annual sub-advisory fee to be paid by Highland to Robeco of 1.25% of each of the Redmont Fund’s daily average net assets allocated to Robeco up to $50 million, and 1.00% of each of the Redmont Fund’s daily average net assets allocated to Robeco above $50 million, in light of the extent and quality of the advisory services to be provided by it to the Redmont Funds.
The Trustees also considered the fee structures applicable to Highland’s other clients employing a comparable strategy to that of the Redmont Funds.
The Trustees considered the information they received comparing the Redmont Funds contractual annual advisory fee and overall net expenses with those of funds in both the relevant expense peer group provided by an independent provider of investment company data.
Based on such information, the Trustees determined that the contractual annual advisory fee of 1.50% of the daily average net assets of each of the Redmont Funds and the total net expense ratio of 1.55% for Class I Shares of Redmont Fund I and 1.95% for Class A Shares of Redmont Fund I, although generally higher than each respective peer group median, were reasonable in light of the services provided by Highland. The Trustees also determined that the annual advisory fee of 1.50%, which was currently waived by Highland in its entirety, and total net expense ratio of 0.26%, for Redmont Fund II, was significantly lower than the Fund’s peer group median. Based on such information, the Trustees further determined that the fees payable to Robeco by Highland were within an acceptable range.
Nature, Extent and Quality of the Services under the Investment Advisory and Sub-Advisory Agreements: The Trustees received and considered information regarding the nature, extent and quality of services provided by Highland and Robeco to the Redmont Funds under the Investment Advisory and Sub-Advisory Agreements. The Trustees reviewed certain background materials supplied by Highland and Robeco in their presentations, including their Form ADVs, financial statements and Compliance Policies and Procedures. The Trustees reviewed and considered Highland’s and Robeco’s investment advisory personnel, their histories as asset managers, their performance and the amount of assets currently under management by Highland and Robeco. The Trustees also reviewed the research and decision-making processes utilized by Highland and Robeco, including the methods adopted to seek to achieve compliance with the investment objectives, policies and restrictions of the Redmont Funds.
The Trustees considered the background and experience of Highland’s and Robeco’s management in connection with the Redmont Funds, including reviewing the qualifications, backgrounds and responsibilities of the management team primarily responsible for the day-to-day portfolio management of the Redmont Funds and the extent of the resources devoted to research and analysis of actual and potential investments.
The Trustees also reviewed the accompanying Compliance-related materials and further noted that they have received reports on these services and Compliance issues at each regular Board meeting throughout the year related to the services rendered by Highland and Robeco with respect to the Redmont Funds.
Performance: The Trustees reviewed performance information for each Redmont Fund for the three-month and 1-year periods ended September 30, 2014. That review included a comparison of each Redmont Fund’s performance to the performance of a universe of comparable funds selected by an independent provider of investment company data. The Trustees noted that although each Redmont Fund generally underperformed against funds identified by an independent provider of investment company data, each Redmont Fund’s performance was within an acceptable range of the performance of the funds in the applicable peer universe provided by an independent provider of investment company data.
Total Expense Ratios and the Adviser’s Profitability: The Trustees received and considered information provided by an independent provider of investment company data comparing the Redmont Funds’ total expense ratios against their respective expense groups, as well as a profitability analysis prepared by Highland and Robeco based on the fees payable under the Investment Advisory and Sub-Advisory Agreements. The Trustees considered the profits, if any, realized by Highland and Robeco in connection with the operation of the Redmont Funds. The Trustees noted that although the Redmont Funds are not currently profitable to Highland, Highland had affirmed its ongoing commitment to the Redmont Funds. The
| | |
| Annual Report | April 30, 2015 | | 75 |
| | |
| Redmont Funds | | Disclosure Regarding Approval of Fund Advisory Agreements |
| | April 30, 2015 (Unaudited) |
Board then reviewed Highland’s and Robeco’s financial statements in order to analyze the financial condition and stability and profitability of Highland and Robeco.
Economies of Scale: The Trustees considered whether economies of scale in the provision of services to the Redmont Funds will be passed along to the shareholders under the proposed agreements, and noted that economies primarily resulted from the fact that each Redmont Fund was managed with the same investment strategies and policies.
Other Benefits to the Adviser and Sub-Adviser: The Trustees reviewed and considered any other incidental benefits derived or to be derived by Highland and Robeco from their relationship with the Redmont Funds, including soft dollar arrangements.
The Board summarized its deliberations with respect to the Investment Advisory Agreement with Highland and the Sub-Advisory Agreement with Robeco. In selecting Highland and Robeco, and approving the Investment Advisory and Sub-advisory Agreements and fees applicable under each agreement, the Trustees concluded that no single factor reviewed by the Trustees was identified by the Trustees to be determinative as the principal factor in whether to approve the Investment Advisory and Sub-Advisory Agreements. Further, the Independent Trustees were advised by separate independent legal counsel throughout the process. The Trustees, including all of the Independent Trustees, concluded that:
| | ● | | the investment advisory fees to be received by Highland with respect to the Redmont Funds were, although higher than applicable peer group medians, within an acceptable range of the median when considered in light of Highland’s agreement to waive fees and/or reimburse total fund expenses with respect to Redmont Fund I, and Highland’s agreement to waive its advisory fee altogether in connection with Redmont Fund II, and in light of each Redmont Fund’s performance relative to its peer group; |
| | ● | | Robeco’s fees under the Sub-Advisory Agreement would be paid directly by Highland; |
| | ● | | the nature, extent and quality of services to be rendered by the nature, extent and quality of services rendered by Highland under the Investment Advisory Agreement and Robeco under the Sub-Advisory Agreement were adequate; |
| | ● | | the performance of the Redmont Funds slightly underperformed, but was within an acceptable range of the performance of the funds in the applicable peer universe provided by an independent provider of investment company data; |
| | ● | | the profit, if any, anticipated to be realized by Highland and Robeco in connection with the operation of the Redmont Funds is not unreasonable to the Trust, and Highland’s commitment to the Redmont Funds despite any losses; and |
| | ● | | to the extent there were any material economies of scale or other benefits accruing to Highland in connection with its relationship with the Redmont Funds, their benefits had been substantially passed through to shareholders, and there were no material economies of scale or other incidental benefits accruing to Robeco in connection with its relationship with the Redmont Funds. |
Based on the Trustees’ deliberations and their evaluation of the information described above, the Trustees, including all of the Independent Trustees, concluded that the compensation to Highland and Robeco for investment advisory and sub-advisory services, respectively, is consistent with the best interests of each of the Redmont Funds and their shareholders.
| | |
| Redmont Funds | | Additional Information |
| | April 30, 2015 (Unaudited) |
1. FUND HOLDINGS
The Funds file their complete schedule of portfolio holdings with the Securities and Exchange Commission (the “SEC”) for the first and third quarters of each fiscal year on Form N-Q within 60 days after the end of the period. Copies of the Funds’ Form N-Q are available without charge on the SEC website at http:// www.sec.gov. You may also review and copy the Form N-Q at the SEC’s Public Reference Room in Washington, D.C. For more information about the operation of the Public Reference Room, please call the SEC at 1-800-SEC-0330.
2. FUND PROXY VOTING POLICIES, PROCEDURES AND SUMMARIES
Fund policies and procedures used in determining how to vote proxies and information regarding how each of the Funds voted proxies relating to portfolio securities during the most recent prior 12-month period ending June 30 are available without charge, (1) upon request, by calling (toll-free) (866) 759-5679 and (2) on the SEC’s website at http://www.sec.gov.
3. TAX DESIGNATIONS
The Fund designates the following for federal income tax purposes for distributions made during the calendar year ended December 31, 2014:
| | | | | | | | |
| | | QDI | | | DRD | |
| |
Redmont Resolute Fund I | | | 66.09% | | | | 34.65% | |
Redmont Resolute Fund II | | | 20.65% | | | | 8.94% | |
In early 2015, if applicable, shareholders of record received this information for the distribution paid to them by the Fund during the calendar year 2014 via Form 1099. The Fund will notify shareholders in early 2016 of amounts paid to them by the Funds, if any, during the calendar year 2015.
Pursuant to Section 852(b)(3) of the Internal Revenue Code, Redmont Resolute I designates $63,373 and Redmont Resolute II designates $4,443,526 as long-term capital gain distributions.
| | |
| Annual Report | April 30, 2015 | | 77 |
| | |
| Redmont Funds | | Trustees & Officers |
| | April 30, 2015 (Unaudited) |
Additional information regarding the Fund’s trustees is included in the Statement of Additional Information, which can be obtained without charge by calling 866-759-5679.
INDEPENDENT TRUSTEES
| | | | | | | | | | |
Name, Address* & Year of Birth | | Position(s) Held with Fund | | Term of Office and Length of Time Served** | | Principal Occupation(s)
During Past 5 Years*** | | Number of Funds in Fund Complex Overseen
by Trustee**** | | Other Directorships
Held by Trustee
During Past 5 Years |
|
Mary K. Anstine, 1940 | | Trustee | | Ms. Anstine was elected at a special meeting of shareholders held on March 21, 1997 and re-elected at a special meeting of shareholders held on August 7, 2009. | | Ms. Anstine was formerly an Executive Vice President of First Interstate Bank of Denver until 1994, President/Chief Executive Officer of HealthONE Alliance, Denver, Colorado, from 1994 to 2004, and has been retired since 2004. Ms. Anstine is also Trustee/Director of AV Hunter Trust and Colorado Uplift Board. Ms. Anstine was formerly a Director of the Trust Bank of Colorado (later purchased and now known as Northern Trust Bank), HealthONE and Denver Area Council of the Boy Scouts of America, and a member of the American Bankers Association Trust Executive Committee. | | 30 | | Ms. Anstine is a Trustee of ALPS ETF Trust (18 funds); ALPS Variable Investment Trust (9 funds); Reaves Utility Income Fund (1 fund); and Westcore Trust (12 funds). |
|
John R. Moran, Jr., 1930 | | Trustee | | Mr. Moran was elected at a special meeting of shareholders held on March 21, 1997 and re-elected at a special meeting of shareholders held on August 7, 2009. | | Mr. Moran formerly served as President and CEO of The Colorado Trust, a private foundation serving the health and hospital community in the state of Colorado, from 1991 to 2007. During his career as an attorney from 1958 to 1991, Mr. Moran was formerly a partner with the firm of Kutak Rock & Campbell in Denver, Colorado and a member of the Colorado House of Representatives. Currently, Mr. Moran is a member of the Treasurer’s Investment Advisory Committee for the University of Colorado. | | 30 | | None. |
|
| * | All communications to Trustees and Officers may be directed to Financial Investors Trust c/o 1290 Broadway, Suite 1100, Denver, CO 80203. |
| ** | This is the period for which the Trustee or Officer began serving the Trust. Each Trustee and/or Officer serves an indefinite term, until his successor is elected. |
| *** | Except as otherwise indicated, each individual has held the office shown or other offices in the same company for the last five years. |
| **** | The Fund Complex includes all series of the Trust (currently 3) and any other investment companies for which Highland Associates, Inc., Robeco Investment Management, Inc. and/or PineBridge Investment LLC provides investment advisory services (currently none). |
| | |
| Redmont Funds | | Trustees & Officers |
| | April 30, 2015 (Unaudited) |
INDEPENDENT TRUSTEES
| | | | | | | | | | |
Name, Address* & Year of Birth | | Position(s) Held with Fund | | Term of Office and Length of Time Served** | | Principal Occupation(s)
During Past 5 Years*** | | Number of Funds in Fund Complex Overseen
by Trustee**** | | Other Directorships
Held by Trustee
During Past 5 Years |
|
Jeremy W. Deems, 1976 | | Trustee | | Mr. Deems was appointed as a Trustee at the March 11, 2008 meeting of the Board of Trustees and elected at a special meeting of shareholders held on August 7, 2009. | | Mr. Deems is the Co-Founder and Chief Financial Officer of Green Alpha Advisors, LLC, a registered investment advisor, and Co-Portfolio Manager of the Shelton Green Alpha Fund. Prior to joining Green Alpha Advisors, Mr. Deems was CFO and Treasurer of Forward Management, LLC, ReFlow Management Co., LLC, ReFlow Fund, LLC, a private investment fund, and Sutton Place Management, LLC, an administrative services company, from 1998 to June 2007. From 2004 to 2005, Mr Deems also served as Treasurer of the Forward Funds and the Sierra Club Funds. | | 30 | | Mr. Deems is a Trustee of ALPS ETF Trust (18 funds); ALPS Variable Investment Trust (9 funds) and Reaves Utility Income Fund (1 fund). |
|
Jerry G. Rutledge, 1944 | | Trustee | | Mr. Rutledge was elected at a special meeting of shareholders held on August 7, 2009. | | Mr. Rutledge is the President and owner of Rutledge’s Inc., a retail clothing business. Mr. Rutledge is currently serving as a Director of the University of Colorado Hospital. Mr. Rutledge was from 1994 to 2007 a Regent of the University of Colorado. | | 30 | | Mr. Rutledge is a Trustee of Principal Real Estate Income Fund (1 fund), Clough Global Allocation Fund (1 fund), Clough Global Equity Fund (1 fund) and Clough Global Opportunities Fund (1 fund). |
|
Michael “Ross” Shell, 1970 | | Trustee | | Mr. Shell was elected at a special meeting of shareholders held on August 7, 2009. | | Mr. Shell is Founder and CEO of Red Idea, LLC, a strategic consulting/early stage venture firm (since June 2008). From 1999 to 2009, he was a part-owner and Director of Tesser, Inc., a brand agency. From December 2005 to May 2008, he was Director, Marketing and Investor Relations, of Woodbourne, a REIT/real estate hedge fund and private equity firm. Prior to this, from May 2004 to November 2005, he worked as a business strategy consultant; from June 2003 to April 2004, he was on the Global Client Services team of IDEO, a product design/innovation firm; and from 1999 to 2003, he was President of Tesser, Inc. Mr. Shell graduated with honors from Stanford University with a degree in Political Science. | | 30 | | None. |
|
| | |
| Annual Report | April 30, 2015 | | 79 |
| | |
| Redmont Funds | | Trustees & Officers |
| | April 30, 2015 (Unaudited) |
INTERESTED TRUSTEE
| | | | | | | | | | |
Name, Address* & Age | | Position(s) Held with Fund | | Term of Office and Length of Time Served** | | Principal Occupation(s)
During Past 5 Years*** | | Number of Funds in Fund Complex Overseen by
Trustee**** | | Other Directorships Held by Trustee |
|
Edmund J. Burke, 1961 | | Trustee, Chairman and President | | Mr. Burke was elected as Chairman at the August 28, 2009 meeting of the Board of Trustees. Mr. Burke was elected as Trustee at a special meeting of shareholders held on August 7, 2009. Mr. Burke was elected President of the Trust at the December 17, 2002 meeting of the Board of Trustees. | | Mr. Burke is President and a Director of ALPS Holdings, Inc. (“AHI”) (since 2005) and Director of Boston Financial Data Services, Inc. (“BFDS”), ALPS Advisors, Inc. (“AAI”), ALPS Distributors, Inc. (“ADI”), ALPS Fund Services, Inc. (“AFS”) and ALPS Portfolio Solutions Distributor, Inc. (“APSD”) and from 2001-2008, was President of AAI, ADI, AFS and APSD. Because of his positions with AHI, BFDS, AAI, ADI, AFS and APSD, Mr. Burke is deemed an affiliate of the Trust as defined under the 1940 Act. Mr. Burke is Trustee and President of the Clough Global Allocation Fund (Trustee since 2006; President since 2004); Trustee and President of the Clough Global Equity Fund (Trustee since 2006; President since 2005); Trustee and President of the Clough Global Opportunities Fund (since 2006); Trustee of the Liberty All-Star Equity Fund; and Director of the Liberty All-Star Growth Fund, Inc. | | 35 | | Mr. Burke is a Trustee of Clough Global Allocation Fund (1 fund); Clough Global Equity Fund (1 fund); Clough Global Opportunities Fund (1 fund); Trustee of the Liberty All-Star Equity Fund (1 fund); and Director of the Liberty All-Star Growth Fund, Inc. (1 fund). |
|
| * | All communications to Trustees and Officers may be directed to Financial Investors Trust c/o 1290 Broadway, Suite 1100, Denver, CO 80203. |
| ** | This is the period for which the Trustee or Officer began serving the Trust. Each Trustee and/or Officer serves an indefinite term, until his successor is elected. |
| *** | Except as otherwise indicated, each individual has held the office shown or other offices in the same company for the last five years. |
| **** | The Fund Complex includes all series of the Trust (currently 3) and any other investment companies for which Highland Associates, Inc., Robeco Investment Management, Inc. and/or PineBridge Investment LLC provides investment advisory services (currently none). |
| | |
| Redmont Funds | | Trustees & Officers |
| | April 30, 2015 (Unaudited) |
OFFICERS
| | | | | | |
Name, Address* & Year of Birth | | Position(s) Held
with Fund | | Term of Office and Length of Time Served** | | Principal Occupation(s) During Past 5 Years*** |
|
Kimberly R. Storms, 1972 | | Treasurer | | Ms. Storms was elected Treasurer of the Trust at the March 12, 2013 meeting of the Board of Trustees. | | Ms. Storms is Senior Vice President and Director of Fund Administration of ALPS. Because of her position with ALPS, Ms. Storms is deemed an affiliate of the Trust as defined under the 1940 Act. Ms. Storms is also Treasurer of Liberty All-Star Equity Fund and Liberty All-Star Growth Fund, Inc. and Chief Financial Officer of The Arbitrage Funds. |
|
David T. Buhler, 1971 | | Secretary | | Mr. Buhler was elected Secretary of the Trust at the September 11, 2012 meeting of the Board of Trustees. | | Mr. Buhler joined ALPS in June 2010. He is currently Vice President and Senior Associate Counsel of ALPS, AAI, ADI and APSD. Prior to joining ALPS, Mr. Buhler served as Associate General Counsel and Assistant Secretary of Founders Asset Management LLC from 2006 to 2009. Because of his position with ALPS, Mr. Buhler is deemed an affiliate of the Trust as defined under the 1940 Act. Mr. Buhler is also the Secretary ALPS Variable Investment Trust, ALPS ETF Trust and Westcore Trust. |
|
Ted Uhl, 1974 | | Chief Compliance Officer (“CCO”) | | Mr. Uhl was appointed CCO of the Trust at the June 8, 2010 meeting of the Board of Trustees. | | Mr. Uhl joined ALPS in October 2006, and is currently Deputy Compliance Officer of ALPS. Prior to his current role, Mr. Uhl served as Senior Risk Manager for ALPS from October 2006 until June 2010. Because of his position with ALPS, Mr. Uhl is deemed an affiliate of the Trust as defined under the 1940 Act. Mr. Uhl is also CCO of the Clough Global Funds, Reaves Utility Income Fund, Centre Funds and Transparent Value Trust. |
|
| | |
| Annual Report | April 30, 2015 | | 81 |


| | | | |
| | Seafarer Overseas Growth | | |
| | and Income Fund | | |
| | | | |
| Investor Class | | SFGIX | | |
| Institutional Class | | SIGIX | | |
| | | | |
| | ANNUAL REPORT | | |
| | April 30, 2015 | | |

TABLE OF CONTENTS
| | |
| Seafarer Overseas Growth and Income Fund | | Letter to Shareholders |
April 30, 2015
LETTER TO SHAREHOLDERS
May 10, 2015
Dear Fellow Shareholders,
I am pleased to address you again on behalf of the Seafarer Overseas Growth and Income Fund. This report addresses the Fund’s 2014-15 fiscal year (May 1, 2014 to April 30, 2015).
During the fiscal year period, the Fund returned 12.76%, while the Fund’s benchmark, the MSCI Emerging Markets Total Return Index, rose 8.17%.1 By way of broader comparison, the S&P 500 Index increased 12.98%.
The Fund began the fiscal year with a net asset value of $11.59 per share. During the ensuing twelve months, the Fund paid two distributions: $0.075 per share in June 2014 and $0.282 per share in December 2014. Those payments brought the cumulative distribution per share, as measured from the Fund’s inception2 to the end of the fiscal year, to $1.031. The Fund finished the fiscal year with a value of $12.66 per share.3
Performance Review
The Fund’s performance during the fiscal year could be summarized as a tale of two halves. During the first half of the year, the Fund and its benchmark index surged higher, only to surrender the bulk of their gains by mid-year. The second half followed a different pattern: the Fund and the index rose again, but this time the gains were sustained, and the Fund outpaced its benchmark.
Early in the fiscal year, the emerging markets raced higher, driven by the twin prospects of political change in Brazil and economic stimulus in China. By early September 2014, the Fund and the index had gained 7.48% and 11.91%, respectively. However, that gain proved to be the short-term peak in markets, as September heralded the end to the markets’ run.4
During September, a series of economic reports indicated that the U.S. economy was growing faster than was broadly anticipated. That economic strength prompted investors to re-evaluate their expectations regarding the pace and magnitude of future interest rate increases, even as the Governors of the Federal Reserve cautioned that “conditions may . . . warrant keeping the target federal funds rate below levels [viewed] as normal” for some time to come.5 The resulting change in expectations for interest rates brought about a sharp decline in global stock and foreign currency markets.
Around the same time, a number of unwelcome events struck the emerging markets simultaneously. Economic reports revealed that the Chinese economy was unexpectedly weak, despite the government’s ongoing attempts to introduce economic stimulus. Meanwhile, Brazil’s presidential election sent stocks and the local currency swooning, as the incumbent – President Dilma Rousseff – won re-election by a narrow margin. President Rousseff was deemed by many observers to be less “market-friendly” than her opponent, and her victory spurred the Brazilian market’s decline. At the same time, Russia’s involvement in Ukraine re-escalated, triggering additional concern. At that time, reports suggested that Russia’s government might close its capital account to foreign exchange, and this caused the ruble and other emerging market currencies to tumble. Together these events caused the Fund and the index to slump, such that at the fiscal mid-year (October 31, 2014) the Fund had retreated to a 2.38% gain, and the index to a 3.96% gain.
From the end of October until December, equities in the emerging markets continued to decline, pushing both the Fund and its benchmark lower still. However, during the first three months of 2015, the trend was reversed. The Fund saw a number of its holdings in China, Korea, Japan and especially India contribute positively to performance. Then, in April, a sudden surge in Chinese equities pushed both the index and the Fund higher.
The impetus for the sudden rise in China-related shares is not known with certainty at this time. The prevailing speculation is that a new market trading mechanism known as the “Shanghai - Hong Kong Stock Connect” (“SHKC”) has unleashed a wave of new capital that has exited mainland China and bid
| | |
| Annual Report | April 30, 2015 | | 1 |
| | |
| Seafarer Overseas Growth and Income Fund | | Letter to Shareholders |
April 30, 2015
up China-related stocks listed in Hong Kong.6 It seems as though a recent regulatory change allowed China-based mutual funds to remove capital from the mainland via the SHKC and shift it to Hong Kong. Prior to this change, the SHKC facility had seen little traffic on the “southbound route” (i.e., Chinese investors seeking to move capital from Shanghai to Hong Kong, as opposed to the “northbound route,” which describes global investors seeking to move capital from Hong Kong to Shanghai).
The common view is that this wave of Chinese capital has washed over Hong Kong shares, pushing them higher without much basis, except to align prices with the elevated valuations that exist within China’s A-share market.6 This explanation may hold some merit, but it is not fully satisfying, as it explains only a portion of what has transpired. The amount of capital that has turned over within Hong Kong in the past month is too large to be explained by the “southbound route” alone. Accordingly, the facts suggest that global investors have also played a role in the recent China frenzy, and other mechanisms – or machinations – are at work. As China liberalizes its economy, it is bound to induce large and unpredictable dislocations in markets around the world – the SHKC program is but one such example. We intend to monitor events around China carefully.
It is worth remembering that in only one year, the Chinese stock market has moved from pariah status to center focus within the emerging markets. China’s current economic and political transition is a complex one, and it is impossible to come to an informed, simple conclusion about whether the changes underway are “good” or “bad.” However, China’s development is vital to the world’s future, and it deserves your attention as an investor, regardless of your views on the country. For greater context, please refer to the discussion titled “Peering Over China’s Great Wall of Worry,” which was included in the Letter to Shareholders in the Fund’s Annual Report for the period ended April 30, 2014.7
If you wish to review a more detailed discussion of the Fund’s performance and holdings, Seafarer publishes four portfolio reviews per year. Each corresponds to a standard calendar quarter. Please visit www.seafarerfunds.com/archives for further information.
A Milestone for the Fund
As of February 15, 2015, the Fund achieved an important milestone: it recorded its third anniversary. Accordingly the Fund produced a three-year historical performance record for the first time.
At Seafarer, we believe that investors should only utilize the Fund for long-term investment purposes. Seafarer would advocate a three-year investment horizon at an absolute minimum, and preferably horizons of five years or longer. However, as the Fund has now achieved a three-year record, it seems an appropriate time to reflect on whether the Fund has made progress with respect to its stated investment objectives. By Prospectus, the Fund has two objectives: the primary objective is to “[seek] to provide long-term capital appreciation along with some current income;” the secondary objective is to “[seek] to mitigate adverse volatility in returns.”
With respect to long-term capital appreciation: as of April 30, 2015 (the end of the fiscal year), the Fund’s annualized three-year performance was 10.86%, versus the benchmark index, which rose 3.60% on an annualized basis. The Fund ranked within the top 2% of the Morningstar “Diversified Emerging Markets” fund category (based on a universe of 557 funds and related share classes).8
With respect to the production of current income: from its inception to April 30, 2015, the Fund produced $0.534 in net ordinary income per share (out of $1.031 in total distributions per share).
With respect to the mitigation of adverse volatility: the Fund had an “up market capture” of 95.6% for the three year period ended April 30, 2015. (Up market capture, or “UMC,” is a measure of the average extent to which a given fund rises with its benchmark index, conditional upon the index rising. A measurement of 100% indicates the fund rises in prefect tandem with the index). The Fund’s UMC ranks at the 29th percentile of funds within the Morningstar “Diversified Emerging Markets” category (1st percentile is the “best,” and 100th percentile is the “worst”).8
Over the same three year period ended April 30, 2015, when markets declined, the Fund had a “down market capture” (or “DMC”) of 60.5%. This means that conditional on months in which the index fell,
| | |
| 2 | | (855) 732-9220 | seafarerfunds.com |
| | |
| Seafarer Overseas Growth and Income Fund | | Letter to Shareholders |
April 30, 2015
the Fund’s decline was on average only 60.5% that of the benchmark index. The Fund’s DMC ranks at the 94th percentile of funds within the same Morningstar category (in this case, 1st percentile is the “worst,” and 100th percentile is the “best”).8
The asymmetrical performance record of the Fund (capturing, on average, 95.6% of the upside versus 60.5% of the downside) indicates that, historically, the Fund mitigated a degree of adverse volatility.
Everyone at Seafarer is proud of the Fund’s performance since its inception, particularly in that the Fund appears to have made reasonable progress toward its primary and secondary objectives. However, we are acutely aware that the Fund’s historical out-performance is unlikely to persist.
As discussed at greater length in preceding commentaries, I believe that the developing world has recently undergone a period of anemic and disappointing growth. Corporate profits did not expand much, and consequently emerging market equities offered little in the way of positive gains over the past three years. Ironically, those same conditions have proven ideal for the Fund’s strategy. The Fund does not necessarily pursue high rates of growth, but rather seeks companies that can grow in a steady manner. Seafarer’s research suggests that, since the Fund’s inception, it has been successful in its efforts to invest in sustainable growth, as the underlying holdings produced profit growth that was considerably more reliable than that of the index portfolio. (For more on this topic, view Seafarer’s Quarterly Briefing video for the first quarter of 2015.9) I believe the holdings’ sustained growth, during a time of otherwise anemic conditions, accounts for much of the Fund’s outperformance.
However, the next three years may be markedly different. I believe that profit growth will re-accelerate. If it does, the Fund might struggle to keep pace with equity markets. If history is any guide, investors tend to aggressively pursue reinvigorated growth; at the same time, they shed many of their concerns regarding valuation. When such conditions prevail, the Fund’s relatively conservative approach often acts as an impediment to its relative performance – especially if markets jump higher, quickly. In any case, I wish to caution shareholders that the Fund’s strategy is designed to produce only moderate outperformance over long periods of time. Given that the Fund has instead generated considerable outperformance over a short period of time, I suggest that the Fund’s recent history might not serve as a reliable guide to its future performance.
New Modes of Communication
I am pleased to report that Seafarer Capital Partners, the investment adviser for your Fund, continues to grow and evolve. One example of the firm’s evolution will soon be evident in the manner in which we communicate with shareholders.
Historically, the firm has utilized several modes of communication, including written commentaries and conference calls. However, as our company has grown, we have noted that shareholders and clients might prefer alternate modes of communication – particularly communication that is timely, interactive, accessible, readily searchable, and in a digital format. With these preferences in mind, Seafarer has recently begun an internal campaign to create more written content, and especially more video content. With respect to the latter, a new “Video Library” is available at www.seafarerfunds.com/video. The library features videos discussing the Fund, its strategy, and the emerging markets more broadly. Our aim is to create a library of materials that will grow over time, and which will address key topics of concern to the Fund’s shareholders. We encourage you to explore this new resource at your convenience.
At the same time, we have decided to discontinue the “Shareholder Conference Call” that Seafarer held semi-annually since the Fund’s inception. The conference call was a useful way to communicate with existing and prospective clients, but over time it became apparent to us that the format (a live call, followed by an audio replay available on the Seafarer website) was not sufficiently timely, accessible, or searchable. In our view, we can disseminate content of similar (or better) quality via our forthcoming videos and written commentaries, and these new content formats will prove more focused, timely, accessible and interactive than our past conference calls. We are excited to move in this new direction.
| | |
| Annual Report | April 30, 2015 | | 3 |
| | |
| Seafarer Overseas Growth and Income Fund | | Letter to Shareholders |
April 30, 2015
Thank you for entrusting us with your capital. We are, as always, honored to serve as your investment adviser in the emerging markets.
Sincerely,
Andrew Foster
Chief Investment Officer
Seafarer Capital Partners, LLC
The MSCI Emerging Markets Total Return Index, Standard (Large+Mid Cap) Core, Gross (dividends reinvested), USD is a free float-adjusted market capitalization index designed to measure equity market performance of emerging markets. Index code: GDUEEGF. The index is not actively managed and does not reflect any deductions for fees, expenses or taxes. It is not possible to invest directly in this or any index.
The S&P 500 Total Return Index is a stock market index based on the market capitalizations of 500 large companies with common stock listed on the NYSE or NASDAQ. The index is not actively managed and does not reflect any deductions for fees, expenses or taxes. It is not possible to invest directly in this or any index.
The views and information discussed in this commentary are as of the date of publication, are subject to change, and may not reflect the writer’s current views. The views expressed represent an assessment of market conditions at a specific point in time, are opinions only and should not be relied upon as investment advice regarding a particular investment or markets in general. Such information does not constitute a recommendation to buy or sell specific securities or investment vehicles. It should not be assumed that any investment will be profitable or will equal the performance of the portfolios or any securities or any sectors mentioned herein. The subject matter contained in this letter has been derived from several sources believed to be reliable and accurate at the time of compilation. Seafarer Capital Partners, LLC nor the Fund accepts any liability for losses either direct or consequential caused by the use of this information.
| 1 | References to the “Fund” pertain to the Fund’s Institutional share class (ticker: SIGIX). The Investor share class (ticker: SFGIX) returned 12.55% during the fiscal year period. |
| 2 | The Fund’s inception date is February 15, 2012. |
| 3 | The Fund’s Investor share class began the fiscal year with a net asset value of $11.58 per share. The Fund paid two distributions: $0.072 per share in June 2014 and $0.272 per share in December 2014. Those two payments brought the cumulative distribution per share, as measured from the Fund’s inception to the end of the fiscal year, to $0.995. The Fund finished the fiscal year with a value of $12.64 per share. |
| 4 | The short-term “peak” of the Fund and the index in the first half of the fiscal year was September 5, 2014. |
| 5 | Federal Reserve Board of Governors, Federal Open Market Committee, Press Release, September 17, 2014 (www.federalreserve.gov/newsevents/press/monetary/20140917a.htm). |
| 6 | The Chinese A-Share is a class of securitized common stock in Chinese companies, traded exclusively on Chinese stock exchanges (i.e., Shanghai and Shenzen), and denominated in renminbi, China’s currency. Historically, the renminbi has been subject to strict controls, such that foreign (i.e., non-Chinese) investors were not able to obtain or use the currency for financial purposes (i.e. savings or investment). Because of this constraint on the currency, A-shares have historically been inaccessible to foreign investors, de facto: foreigners could not legally obtain renminbi for investment purposes, and therefore they could not fund any purchase of A-shares. Over the past decade, China has liberalized the use of the renminbi for investment purposes, allowing selected, large foreign institutions to apply for “Qualified Foreign Institutional Investor” (QFII) status. Foreign institutions granted QFII status can legally purchase renminbi under a quota scheme, and that renminbi can be used to fund the purchase of A-shares and other financial assets within China. More recently, China has launched a program known as the “Shanghai-Hong Kong Stock Connect,” (“SHKC”) or colloquially, the “through train;” this program allows foreign investors to purchase selected A-shares regardless of their QFII status. A-shares are not to be confused with H-shares (Chinese companies incorporated in China, but listed in Hong Kong) and ordinary Hong Kong-listed companies of Chinese origin (Hong Kong incorporated, and Hong Kong-listed, but with substantial economic ties to mainland China). H-shares and Hong Kong-listed companies are available for investment by foreign (non-mainland China) investors; ironically, H-shares are not necessarily available to domestic Chinese parties, who can only invest in Hong Kong via a regulated scheme called “Qualified Domestic Institutional Investor” (QDII). |
| 7 | The Letter to Shareholders for the period ended April 30, 2014 is available at www.seafarerfunds.com/fund/ shareholder-letter/2014/04/annual. Information on the Seafarer website is provided for textual reference only, and is not incorporated by reference into this letter or report. |
| 8 | Source: eVestment as of April 30, 2015. |
| 9 | The Quarterly Briefing video for the first quarter of 2015 is available at www.seafarerfunds.com/video/2015/03/quarterly-briefing |
| | |
| 4 | | (855) 732-9220 | seafarerfunds.com |
| | |
| Seafarer Overseas Growth and Income Fund | | Portfolio Review |
April 30, 2015
Seafarer Overseas Growth and Income Fund Performance
| | | | | | | | | | | | | | |
Total Return (As of April 30, 2015) | | 1 Year | | | 3 Years | | | Since
Inception* -
Annualized | | | Net
Expense
Ratio** |
Investor Class (SFGIX) | | | 12.55% | | | | 10.70% | | | | 10.59% | | | 1.25% |
Institutional Class (SIGIX) | | | 12.76% | | | | 10.86% | | | | 10.75% | | | 1.05% |
MSCI Emerging Markets Total Return Index^ | | | 8.17% | | | | 3.60% | | | | 2.54% | | | |
Gross expense ratio: 1.66% for Investor Class; 1.51% for Institutional Class. Ratios as of the Prospectus dated August 31, 2014**
All performance is in U.S. dollars with gross (pre-tax) dividends and/or distributions reinvested. The performance data quoted represents past performance and does not guarantee future results. Future returns may be lower or higher. The investment return and principal value will fluctuate so that an investor’s shares, when redeemed, may be worth more or less than the original cost. Shares of the Fund redeemed or exchanged within 90 days of purchase are subject to a 2% redemption fee. Performance does not reflect this fee, which if deducted would reduce an individual’s return. To obtain the Fund’s most recent month-end performance, visit seafarerfunds.com or call (855) 732-9220.
| * | Inception Date: February 15, 2012. |
| ** | Seafarer Capital Partners, LLC has agreed contractually to waive and/or reimburse fees or expenses in order to limit Total Annual Fund Operating Expenses After Fee Waiver/Expense Reimbursements (excluding brokerage expenses, interest expenses, taxes and extraordinary expenses) to 1.25% and 1.05% of the Fund’s average daily net assets for the Investor and Institutional share classes, respectively. This agreement is in effect through August 31, 2015. |
| ^ | The MSCI Emerging Markets Total Return Index, Standard (Large+Mid Cap) Core, Gross (dividends reinvested), USD is a free float-adjusted market capitalization index designed to measure equity market performance of emerging markets. Index code: GDUEEGF. The index is not actively managed and does not reflect any deductions for fees, expense or taxes. An investor may not invest directly in an index. |
| | |
| Annual Report | April 30, 2015 | | 5 |
| | |
| Seafarer Overseas Growth and Income Fund | | Portfolio Review |
April 30, 2015
Performance of a $10,000 Investment Since Inception
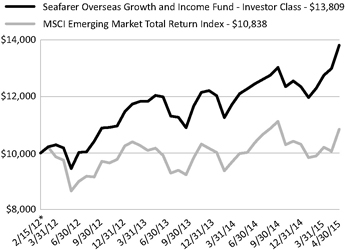
* Inception Date: February 15, 2012.
The chart shown above represents historical performance of a hypothetical investment of $10,000 in the Fund’s Investor Class shares for the period from inception to April 30, 2015. All returns reflect reinvested dividends and/or distributions, but do not reflect the deduction of taxes that an investor would pay on distributions or redemptions.
The Fund also offers Institutional Class shares, performance for which is not reflected in the chart above. The performance of Institutional Class shares may be higher or lower than the performance of the Investor Class shares shown above based upon differences in fees paid by shareholders investing in the Investor Class shares and Institutional Class shares.
Investment Objective
The Fund seeks to provide long-term capital appreciation along with some current income. The Fund seeks to mitigate adverse volatility in returns as a secondary objective.
Strategy
The Fund invests primarily in the securities of companies located in developing countries. The Fund invests in several asset classes including dividend-paying common stocks, preferred stocks, convertible bonds, and fixed-income securities.
The Fund seeks to offer investors a relatively stable means of participating in a portion of developing countries’ growth prospects, while providing some downside protection compared to a portfolio that invests only in the common stocks of those countries.
| | |
| 6 | | (855) 732-9220 | seafarerfunds.com |
| | |
| Seafarer Overseas Growth and Income Fund | | Portfolio Review |
April 30, 2015
Fund Characteristics
| | | | |
Inception Date | | | February 15, 2012 | |
Net Assets | | | $183.3M | |
Portfolio Turnover1 | | | 28% | |
| | | | | | | | |
| | | Investor Class | | | Institutional Class | |
Ticker | | | SFGIX | | | | SIGIX | |
NAV | | | $12.64 | | | | $12.66 | |
30-Day SEC Yield (unsubsidized) | | | 1.61% | | | | 1.74% | |
Fund Distribution Yield | | | 1.52% | | | | 1.62% | |
Net Expense Ratio | | | 1.25% | | | | 1.05% | |
Redemption Fee (within 90 calendar days) | | | 2.00% | | | | 2.00% | |
Minimum Initial Investment | | | $2,500 | | | | $100,000 | |
Minimum Initial Investment - Automatic Investment Plan | | | $1,500 | | | | $100,000 | |
Minimum Initial Investment - Retirement Account | | | $1,000 | | | | $100,000 | |
Underlying Portfolio Holdings
| | | | |
Number of Holdings | | | 42 | |
% of Net Assets in Top 10 Holdings | | | 36% | |
Weighted Average Market Cap | | | $21.0B | |
Market Cap of Portfolio Median Dollar | | | $3.5B | |
Gross Portfolio Yield2 | | | 2.8% | |
Price / Book Value2 | | | 1.8 | |
Price / Earnings2,3 | | | 13.4 | |
Earnings Per Share Growth2,3 | | | 16% | |
|
1 For the year ended April 30, 2015. 2 Calculated as a harmonic average of the underlying portfolio holdings. 3 Based on consensus earnings estimates for next year. Excludes securities for which consensus earnings estimates are not available. |
30-Day SEC Yield: a standard yield calculation developed by the Securities and Exchange Commission (SEC). It represents net investment income earned by the Fund over a 30-day period, expressed as an annual percentage rate based on the Fund’s share price at the end of the 30-day period. The 30-Day Yield should be regarded as an estimate of the Fund’s rate of investment income, and it may not equal the Fund’s actual income distribution rate. Fund Distribution Yield: a measure of the sum of the Fund’s income distributions during the trailing 380 days divided by the previous month’s NAV (adjusted upward for any capital gains distributed over the same time period). Gross Portfolio Yield: gross yield for the underlying portfolio, estimated based on the dividend yield for common and preferred stocks and yield to maturity for bonds. This measure of yield does not account for offsetting Fund expenses and other costs, and consequently it should not be construed as the yield that an investor in the Fund would receive. Price / Book Value: the value of a company’s common shares, divided by the company’s book value. Price / Earnings: the market price of a company’s common shares divided by the earnings per common share as forecast for next year. Earnings Per Share (EPS) Growth: forecast growth rate of earnings per common share next year, expressed as a percentage. Past performance does not guarantee future results. Sources: ALPS Fund Services, Inc., Bloomberg, Seafarer. |
| | |
| Annual Report | April 30, 2015 | | 7 |
| | |
| Seafarer Overseas Growth and Income Fund | | Portfolio Review |
April 30, 2015
Top 10 Holdings
| | | | | | | | | | | | | | | | | | |
| Holding | | Sector | | Country | | % Net
Assets | | | Issuer Mkt
Cap ($B) | | Yield1 | | Price /
Book | | Price /
Earnings2 | | EPS
Growth2 |
Hang Lung Properties, Ltd. | | Financials | | China / Hong Kong | | | 4.1% | | | $15.2 | | 2.9% | | 0.9 | | 19 | | -4% |
Samsung Electronics Co. Ltd., Pfd. | | Information Technology | | South Korea | | | 4.0% | | | $192.6 | | 1.8% | | 0.9 | | 7 | | 15% |
Infosys, Ltd. ADR | | Information Technology | | India | | | 4.0% | | | $35.6 | | 1.9% | | 4.3 | | 16 | | 9% |
Xinhua Winshare Publishing and Media Co., Ltd. | | Consumer Discretionary | | China / Hong Kong | | | 3.9% | | | $1.4 | | 3.5% | | 1.5 | | 11 | | 14% |
Singapore Telecommunications Ltd. | | Telecom. Services | | Singapore | | | 3.6% | | | $53.3 | | 3.8% | | 3.0 | | 18 | | 5% |
Dongsuh Co. Inc3 | | Consumer Staples | | South Korea | | | 3.5% | | | $3.1 | | 1.8% | | 3.1 | | – | | – |
Pico Far East Holdings Ltd. | | Consumer Discretionary | | China / Hong Kong | | | 3.4% | | | $0.4 | | 4.7% | | 1.7 | | 9 | | 9% |
Valid Solucoes | | Industrials | | Brazil | | | 3.4% | | | $0.9 | | 2.2% | | 4.4 | | 16 | | 12% |
Astra International Tbk PT | | Consumer Discretionary | | Indonesia | | | 2.9% | | | $21.4 | | 3.2% | | 2.8 | | 12 | | 11% |
Sindoh Co. Ltd.3 | | Information Technology | | South Korea | | | 2.9% | | | $0.7 | | 2.2% | | 0.8 | | – | | – |
Cumulative Weight of Top 10 Holdings: | | | | | 36% | | | | | | | | | | | |
Total Number of Holdings: | | | | | | | 42 | | | | | | | | | | | |
| 1 | Yield = dividend yield for common and preferred stocks and yield to maturity for bonds. |
| 2 | Based on consensus earnings estimates for next year. |
| 3 | Consensus estimates for earnings and EPS growth are not available for this security. |
Portfolio holdings are subject to change.
Sources: ALPS Fund Services, Inc., Bloomberg, Seafarer.
| | |
| 8 | | (855) 732-9220 | seafarerfunds.com |
| | |
| Seafarer Overseas Growth and Income Fund | | Portfolio Review |
April 30, 2015
Portfolio Composition
| | | | |
| Region/Country | | % Net Assets | |
East & South Asia | | | 61 | |
China / Hong Kong | | | 20 | |
India | | | 8 | |
Indonesia | | | 4 | |
Japan | | | 3 | |
Malaysia | | | 2 | |
Singapore | | | 8 | |
South Korea | | | 10 | |
Taiwan | | | 3 | |
Vietnam | | | 3 | |
Eastern Europe | | | 12 | |
Poland | | | 7 | |
Turkey | | | 5 | |
Latin America | | | 21 | |
Brazil | | | 13 | |
Mexico | | | 7 | |
Middle East & Africa | | | 3 | |
South Africa | | | 3 | |
Cash and Other Assets, Less Liabilities | | | 3 | |
Total | | | 100 | |
| |
| Asset Class | | % Net Assets | |
Common Stock | | | 78 | |
Preferred Stock | | | 9 | |
ADR | | | 5 | |
Foreign Currency Government Bond | | | 3 | |
Foreign Currency Convertible Bond | | | 2 | |
USD Convertible Bond | | | 1 | |
Cash and Other Assets, Less Liabilities | | | 3 | |
Total | | | 100 | |
| |
| Market Capitalization of Issuer | | % Net Assets | |
Large Cap (over $10 billion) | | | 35 | |
Mid Cap ($1 - $10 billion) | | | 44 | |
Small Cap (under $1 billion) | | | 16 | |
Not Applicable | | | 3 | |
Cash and Other Assets, Less Liabilities | | | 3 | |
Total | | | 100 | |
Percentage values may not sum to 100% due to rounding.
| | | | |
| Sector | | % Net Assets | |
Consumer Discretionary | | | 14 | |
Consumer Staples | | | 7 | |
Financials* | | | 19 | |
Government | | | 3 | |
Health Care | | | 11 | |
Industrials | | | 11 | |
Information Technology | | | 22 | |
Materials | | | 5 | |
Telecommunication Services | | | 4 | |
Utilities | | | 2 | |
Cash and Other Assets, Less Liabilities | | | 3 | |
Total | | | 100 | |
| * | The Fund’s holdings in the Financials sector include property-related stocks, which are classified within the “Financials sector” according to the Global Industry Classification Standard (GICS) methodology utilized herein. Property-related holdings comprised 5% of the Fund’s net assets as of April 30, 2015. | |
| | |
| Annual Report | April 30, 2015 | | 9 |
| | |
| Seafarer Overseas Growth and Income Fund | | Portfolio Review |
April 30, 2015
Top 5 Performance Contributors and Detractors
For the year ended April 30, 2015
| | | | |
| Contributors | | % Net Assets1 | |
Sun Pharma Advanced Research Co., Ltd. | | | 2.3 | |
Dongsuh Co. Inc | | | 3.5 | |
Xinhua Winshare Publishing and Media Co., Ltd. | | | 3.9 | |
Digital China Holdings, Ltd. | | | 2.5 | |
EOH Holdings Ltd. | | | 1.7 | |
| |
| Detractors | | % Net Assets1 | |
Cia Vale do Rio Doce, Pfd. | | | 2.3 | |
Keppel Corp. Ltd.2 | | | – | |
SinoMedia Holding, Ltd.2 | | | – | |
Astra International Tbk PT | | | 2.9 | |
Bank Pekao SA | | | 2.8 | |
| 2 | As of April 30, 2015, the Fund had no economic interest in this security. |
Source: Bloomberg.
| | |
| 10 | | (855) 732-9220 | seafarerfunds.com |
| | |
| Seafarer Overseas Growth and Income Fund | | Disclosure of Fund Expenses |
| | April 30, 2015 (Unaudited) |
As a shareholder of the Fund you will incur two types of costs: (1) transaction costs, including applicable redemption fees; and (2) ongoing costs, including management fees and other Fund expenses. The following examples are intended to help you understand your ongoing costs (in dollars) of investing in the Fund and to compare these costs with the ongoing costs of investing in other mutual funds. The examples are based on an investment of $1,000 invested on November 1, 2014 and held until April 30, 2015.
Actual Expenses. The first line of each table below provides information about actual account values and actual expenses. You may use the information in this line, together with the amount you invested, to estimate the expenses that you paid over the period. Simply divide your account value by $1,000 (for example, an $8,600 account value divided by $1,000 = 8.6), then multiply the result by the number in the first line under the heading “Expenses Paid During Period” to estimate the expenses you paid on your account during this period.
Hypothetical Example for Comparison Purposes. The second line of the table below provides information about hypothetical account values and hypothetical expenses based on the Fund’s actual expense ratio and an assumed rate of return of 5% per year before expenses, which is not the Fund’s actual return. The hypothetical account values and expenses may not be used to estimate the actual ending account balance or expenses you paid for the period. You may use this information to compare the ongoing costs of investing in the Fund and other mutual funds. To do so, compare this 5% hypothetical example with the 5% hypothetical examples that appear in the shareholder reports of the other funds. The expenses shown in the table are meant to highlight ongoing Fund costs only and do not reflect transaction fees, such as redemption fees or exchange fees. Therefore, the second line of each table below is useful in comparing ongoing costs only, and may not help you determine the relative total costs of owning different funds. In addition, if these transactional costs were included, your costs would have been higher.
| | | | | | | | |
| | | Beginning Account Value 11/01/14 | | Ending Account Value 04/30/15 | | Expense
Ratio(a) | | Expenses Paid During Period 11/01/14 - 04/30/15(b) |
Investor Class | | | | | | | | |
Actual | | $ 1,000.00 | | $ 1,100.50 | | 1.25% | | $ 6.51 |
Hypothetical (5% return before expenses) | | $ 1,000.00 | | $ 1,018.60 | | 1.25% | | $ 6.26 |
Institutional Class | | | | | | | | |
Actual | | $ 1,000.00 | | $ 1,101.40 | | 1.05% | | $ 5.47 |
| Hypothetical (5% return before expenses) | | $ 1,000.00 | | $ 1,019.59 | | 1.05% | | $ 5.26 |
| (a) | Annualized, based on the Fund’s most recent fiscal half year expenses. |
| (b) | Expenses are equal to the Fund’s annualized expense ratio multiplied by the average account value over the period, multiplied by the number of days in the most recent fiscal half-year (181)/365 (to reflect the half-year period). |
| | |
| Annual Report | April 30, 2015 | | 11 |
| | |
| Seafarer Overseas Growth and Income Fund | | Portfolio of Investments |
April 30, 2015
| | | | | | | | | | |
| | | Currency | | Shares | | | Value | |
| |
COMMON STOCKS (82.6%) | | | | | | | | | | |
Brazil (7.4%) | | | | | | | | | | |
Valid Solucoes e Servicos de Seguranca em Meios de Pagamento e Identificacao SA | | BRL | | | 400,000 | | | $ | 6,219,818 | |
Odontoprev SA | | BRL | | | 1,225,000 | | | | 4,297,532 | |
Iochpe-Maxion SA | | BRL | | | 850,000 | | | | 3,123,019 | |
| | | | | | | | | | |
| | | |
Total Brazil | | | | | | | | | 13,640,369 | |
| | | | | | | | | | |
| | | |
China / Hong Kong (18.5%) | | | | | | | | | | |
Hang Lung Properties, Ltd. | | HKD | | | 2,200,000 | | | | 7,437,244 | |
Xinhua Winshare Publishing and Media Co., Ltd., Class H | | HKD | | | 5,749,500 | | | | 7,195,018 | |
Pico Far East Holdings, Ltd. | | HKD | | | 21,450,000 | | | | 6,226,978 | |
Greatview Aseptic Packaging Co., Ltd. | | HKD | | | 7,600,000 | | | | 4,579,514 | |
Digital China Holdings, Ltd. | | HKD | | | 2,925,000 | | | | 4,520,258 | |
Shandong Weigao Group Medical Polymer Co., Ltd., Class H | | HKD | | | 4,169,000 | | | | 3,852,840 | |
| | | | | | | | | | |
| | | |
Total China / Hong Kong | | | | | | | | | 33,811,852 | |
| | | | | | | | | | |
| | | |
India (7.9%) | | | | | | | | | | |
Infosys, Ltd., ADR | | USD | | | 235,000 | | | | 7,280,300 | |
Sun Pharma Advanced Research Co., Ltd.(a) | | INR | | | 675,000 | | | | 4,224,169 | |
Balkrishna Industries, Ltd. | | INR | | | 241,315 | | | | 2,948,477 | |
| | | | | | | | | | |
| | | |
Total India | | | | | | | | | 14,452,946 | |
| | | | | | | | | | |
| | | |
Indonesia (2.9%) | | | | | | | | | | |
Astra International Tbk PT | | IDR | | | 10,000,000 | | | | 5,262,321 | |
| | | | | | | | | | |
| | | |
Total Indonesia | | | | | | | | | 5,262,321 | |
| | | | | | | | | | |
| | | |
Japan (2.7%) | | | | | | | | | | |
Hisamitsu Pharmaceutical Co., Inc. | | JPY | | | 115,000 | | | | 4,955,804 | |
| | | | | | | | | | |
| | | |
Total Japan | | | | | | | | | 4,955,804 | |
| | | | | | | | | | |
| | | |
Malaysia (2.0%) | | | | | | | | | | |
Hartalega Holdings Bhd | | MYR | | | 1,600,000 | | | | 3,660,319 | |
| | | | | | | | | | |
| | | |
Total Malaysia | | | | | | | | | 3,660,319 | |
| | | | | | | | | | |
| | |
| 12 | | (855) 732-9220 | seafarerfunds.com |
| | |
| Seafarer Overseas Growth and Income Fund | | Portfolio of Investments |
April 30, 2015
| | | | | | | | | | |
| | | Currency | | Shares | | | Value | |
| |
Mexico (7.4%) | | | | | | | | | | |
Bolsa Mexicana de Valores SAB de CV | | MXN | | | 2,667,105 | | | $ | 5,133,595 | |
Grupo Financiero Banorte SAB de CV | | MXN | | | 750,000 | | | | 4,254,497 | |
Grupo Herdez SAB de CV(a) | | MXN | | | 1,550,000 | | | | 4,213,955 | |
| | | | | | | | | | |
| | | |
Total Mexico | | | | | | | | | 13,602,047 | |
| | | | | | | | | | |
| | | |
Poland (7.1%) | | | | | | | | | | |
Bank Pekao SA | | PLN | | | 100,000 | | | | 5,197,876 | |
PGE SA | | PLN | | | 700,000 | | | | 4,027,904 | |
Asseco Poland SA | | PLN | | | 227,500 | | | | 3,832,618 | |
| | | | | | | | | | |
| | | |
Total Poland | | | | | | | | | 13,058,398 | |
| | | | | | | | | | |
| | | |
Singapore (6.4%) | | | | | | | | | | |
Singapore Telecommunications, Ltd. | | SGD | | | 1,950,000 | | | | 6,516,115 | |
SIA Engineering Co., Ltd. | | SGD | | | 1,650,000 | | | | 5,217,058 | |
| | | | | | | | | | |
| | | |
Total Singapore | | | | | | | | | 11,733,173 | |
| | | | | | | | | | |
| | | |
South Africa (3.5%) | | | | | | | | | | |
EOH Holdings, Ltd. | | ZAR | | | 235,000 | | | | 3,188,724 | |
Sanlam, Ltd. | | ZAR | | | 485,000 | | | | 3,136,794 | |
| | | | | | | | | | |
| | | |
Total South Africa | | | | | | | | | 6,325,518 | |
| | | | | | | | | | |
| | | |
South Korea (6.4%) | | | | | | | | | | |
Dongsuh Co., Inc. | | KRW | | | 208,457 | | | | 6,463,614 | |
Sindoh Co., Ltd. | | KRW | | | 81,000 | | | | 5,258,955 | |
| | | | | | | | | | |
| | | |
Total South Korea | | | | | | | | | 11,722,569 | |
| | | | | | | | | | |
| | | |
Taiwan (2.5%) | | | | | | | | | | |
Taiwan Semiconductor Manufacturing Co., Ltd. | | TWD | | | 600,000 | | | | 2,888,564 | |
Taiwan Semiconductor Manufacturing Co., Ltd., ADR | | USD | | | 70,000 | | | | 1,710,800 | |
| | | | | | | | | | |
| | | |
Total Taiwan | | | | | | | | | 4,599,364 | |
| | | | | | | | | | |
| | | |
Turkey (4.7%) | | | | | | | | | | |
Aselsan Elektronik Sanayi Ve Ticaret AS | | TRY | | | 950,000 | | | | 4,953,790 | |
| | |
| Annual Report | April 30, 2015 | | 13 |
| | |
| Seafarer Overseas Growth and Income Fund | | Portfolio of Investments |
April 30, 2015
| | | | | | | | | | |
| | | Currency | | Shares | | | Value | |
| |
Turkey (continued) | | | | | | | | | | |
Arcelik AS | | TRY | | | 685,000 | | | $ | 3,689,796 | |
| | | | | | | | | | |
| | | |
Total Turkey | | | | | | | | | 8,643,586 | |
| | | | | | | | | | |
| | | |
Vietnam (3.2%) | | | | | | | | | | |
Nam Long Investment Corp. | | VND | | | 2,750,000 | | | | 2,509,263 | |
Bao Viet Holdings | | VND | | | 1,475,000 | | | | 2,418,481 | |
Vietnam National Reinsurance Corp. | | VND | | | 815,790 | | | | 869,068 | |
| | | | | | | | | | |
| | | |
Total Vietnam | | | | | | | | | 5,796,812 | |
| | | | | | | | | | |
| | | |
TOTAL COMMON STOCKS (Cost $135,530,327) | | | | | | | | | 151,265,078 | |
| |
| | | |
PREFERRED STOCKS (8.7%) | | | | | | | | | | |
Brazil (4.7%) | | | | | | | | | | |
Banco Bradesco SA, ADR | | USD | | | 418,000 | | | | 4,468,420 | |
Vale SA | | BRL | | | 710,000 | | | | 4,236,977 | |
| | | | | | | | | | |
| | | |
Total Brazil | | | | | | | | | 8,705,397 | |
| | | | | | | | | | |
| | | |
South Korea (4.0%) | | | | | | | | | | |
Samsung Electronics Co., Ltd. | | KRW | | | 7,200 | | | | 7,305,782 | |
| | | | | | | | | | |
| | | |
Total South Korea | | | | | | | | | 7,305,782 | |
| | | | | | | | | | |
| | | |
TOTAL PREFERRED STOCKS (Cost $16,886,273) | | | | | | | | | 16,011,179 | |
| |
| | | | | | | | | | | | | | | | | | |
| | | Currency | | Rate | | | Maturity
Date | | | Principal Amount | | | Value | |
| |
FOREIGN CURRENCY CONVERTIBLE BONDS (1.9%) | | | | | | | | | | | | | | | | | | |
China / Hong Kong (1.9%) | | | | | | | | | | | | | | | | | | |
ASM Pacific Technology, Ltd. | | HKD | | | 2.00% | | | | 03/28/19 | | | | 24,000,000 | | | | 3,522,330 | |
| | | | | | | | | | | | | | | | | | |
| | | | | |
Total China / Hong Kong | | | | | | | | | | | | | | | | | 3,522,330 | |
| | | | | | | | | | | | | | | | | | |
| | | | | |
TOTAL FOREIGN CURRENCY CONVERTIBLE BONDS (Cost $3,315,043) | | | | | | | | | | | | | | | | | 3,522,330 | |
| |
| | |
| 14 | | (855) 732-9220 | seafarerfunds.com |
| | |
| Seafarer Overseas Growth and Income Fund | | Portfolio of Investments |
April 30, 2015
| | | | | | | | | | | | | | | | | | |
| | | Currency | | Rate | | | Maturity
Date | | | Principal Amount | | | Value | |
| |
FOREIGN CURRENCY GOVERNMENT BONDS (2.5%) | | | | | | | | | | | | | | | | |
Brazil (1.1%) | | | | | | | | | | | | | | | | | | |
Brazilian Government International Bond | | BRL | | | 10.25 | % | | | 01/10/28 | | | | 5,500,000 | | | $ | 2,044,508 | |
| | | | | | | | | | | | | | | | | | |
| | | | | |
Total Brazil | | | | | | | | | | | | | | | | | 2,044,508 | |
| | | | | | | | | | | | | | | | | | |
| | | | | |
Indonesia (0.9%) | | | | | | | | | | | | | | | | | | |
Indonesia Treasury Bond, Series FR70 | | IDR | | | 8.38 | % | | | 03/15/24 | | | | 20,000,000,000 | | | | 1,614,272 | |
| | | | | | | | | | | | | | | | | | |
| | | | | |
Total Indonesia | | | | | | | | | | | | | | | | | 1,614,272 | |
| | | | | | | | | | | | | | | | | | |
| | | | | |
Turkey (0.5%) | | | | | | | | | | | | | | | | | | |
Turkey Government Bond | | TRY | | | 8.80 | % | | | 09/27/23 | | | | 2,500,000 | | | | 915,307 | |
| | | | | | | | | | | | | | | | | | |
| | | | | |
Total Turkey | | | | | | | | | | | | | | | | | 915,307 | |
| | | | | | | | | | | | | | | | | | |
| | | |
TOTAL FOREIGN CURRENCY GOVERNMENT BONDS (Cost $4,973,379) | | | | | | | | | | | | 4,574,087 | |
| |
| | | | | |
USD CONVERTIBLE BONDS (1.4%) | | | | | | | | | | | | | | | | | | |
Singapore (1.4%) | | | | | | | | | | | | | | | | | | |
Olam International, Ltd. | | USD | | | 6.00 | % | | | 10/15/16 | | | $ | 2,500,000 | | | | 2,659,375 | |
| | | | | | | | | | | | | | | | | | |
| | | | | |
Total Singapore | | | | | | | | | | | | | | | | | 2,659,375 | |
| | | | | | | | | | | | | | | | | | |
| | | | | |
TOTAL USD CONVERTIBLE BONDS
(Cost $2,597,075) | | | | | | | | | | | | | | | | | 2,659,375 | |
| |
| | | | | |
TOTAL INVESTMENTS (Cost $163,302,097) (97.1%) | | | | | | | | | | | | | | | | $ | 178,032,049 | |
| | | | | |
Cash and Other Assets, Less Liabilities (2.9%) | | | | | | | | | | | | | | | | | 5,224,788 | |
| |
NET ASSETS (100.0%) | | | | | | | | | | | | | | | | $ | 183,256,837 | |
| |
| (a) | Non-income producing security. |
Certain securities were fair valued in accordance with procedures established by the Fund’s Board of Trustees (Note 2).
| | |
| Annual Report | April 30, 2015 | | 15 |
| | |
| Seafarer Overseas Growth and Income Fund | | Portfolio of Investments |
April 30, 2015
Currency Abbreviations
| | | | |
| BRL | | - | | Brazil Real |
| HKD | | - | | Hong Kong Dollar |
| IDR | | - | | Indonesia Rupiah |
| INR | | - | | India Rupee |
| JPY | | - | | Japan Yen |
| KRW | | - | | South Korea Won |
| MXN | | - | | Mexico Peso |
| MYR | | - | | Malaysia Ringgit |
| PLN | | - | | Poland Zloty |
| SGD | | - | | Singapore Dollar |
| TRY | | - | | Turkey Lira |
| TWD | | - | | Taiwan New Dollar |
| USD | | - | | United States Dollar |
| VND | | - | | Vietnam Dong |
| ZAR | | - | | South Africa Rand |
Common Abbreviations:
| | | | |
| ADR | | - | | American Depositary Receipt. |
| AS | | - | | Andonim Sirketi, Joint Stock Company in Turkey. |
| Bhd | | - | | Berhad, Public Limited Company in Malaysia. |
| Ltd. | | - | | Limited. |
| SA | | - | | Generally designates corporations in various countries, mostly those employing the civil law. This translates literally in all languages mentioned as anonymous company. |
| SAB de CV | | - | | A variable capital company. |
| Tbk PT | | - | | Terbuka is the Indonesian term for limited liability company. |
Holdings are subject to change.
For Fund compliance purposes, the Fund’s geographical classifications refer to any one or more of the sub-classifications used by one or more widely recognized market indexes or ratings group indexes, and/or as defined by Fund management. This definition may not apply for purposes of this report, which may combine sub-classifications for reporting ease. Geographical regions are shown as a percentage of net assets.
See Accompanying Notes to Financial Statements.
| | |
| 16 | | (855) 732-9220 | seafarerfunds.com |
| | |
| Seafarer Overseas Growth and Income Fund | | Statement of Assets and Liabilities |
| | April 30, 2015 |
| | | | |
ASSETS: | | | | |
| |
Investments, at value | | $ | 178,032,049 | |
Cash | | | 6,481,248 | |
Foreign currency, at value (Cost $2,447,644) | | | 2,433,462 | |
Receivable for shares sold | | | 2,595,453 | |
Interest and dividends receivable | | | 314,069 | |
Prepaid expenses and other assets | | | 20,066 | |
| |
Total Assets | | | 189,876,347 | |
| |
LIABILITIES: | | | | |
Payable for investments purchased | | | 5,977,389 | |
Foreign capital gains tax | | | 233,737 | |
Administrative fees payable | | | 14,441 | |
Shareholder service plan fees payable | | | 29,719 | |
Payable for shares redeemed | | | 210,561 | |
Investment advisory fees payable | | | 95,147 | |
Trustee fees and expenses payable | | | 1,056 | |
Audit and tax fees payable | | | 16,569 | |
Accrued expenses and other liabilities | | | 40,891 | |
| |
Total Liabilities | | | 6,619,510 | |
| |
NET ASSETS | | $ | 183,256,837 | |
| |
NET ASSETS CONSIST OF: | | | | |
Paid-in capital (Note 5) | | $ | 167,837,779 | |
Accumulated net investment loss | | | (444,614) | |
Accumulated net realized gain on investments and foreign currency transactions | | | 1,372,405 | |
Net unrealized appreciation on investments and translation of assets and liabilities in foreign currencies | | | 14,491,267 | |
| |
NET ASSETS | | $ | 183,256,837 | |
| |
INVESTMENTS, AT COST | | $ | 163,302,097 | |
PRICING OF SHARES | | | | |
Investor Class: | | | | |
Net Asset Value, offering and redemption price per share | | $ | 12.64 | |
Net Assets | | $ | 53,543,052 | |
Shares of beneficial interest outstanding | | | 4,236,391 | |
Institutional Class: | | | | |
Net Asset Value, offering and redemption price per share | | $ | 12.66 | |
Net Assets | | $ | 129,713,785 | |
Shares of beneficial interest outstanding | | | 10,249,032 | |
See Accompanying Notes to Financial Statements.
| | |
| Annual Report | April 30, 2015 | | 17 |
| | |
| Seafarer Overseas Growth and Income Fund | | Statement of Operations |
For the Year Ended April 30, 2015
| | | | |
INVESTMENT INCOME: | | | | |
Dividends | | $ | 2,669,164 | |
Foreign taxes withheld on dividends | | | (204,519) | |
Interest and other income | | | 367,075 | |
Foreign taxes withheld on interest | | | (10,600) | |
| |
Total investment income | | | 2,821,120 | |
| |
| |
EXPENSES: | | | | |
Investment advisory fees (Note 6) | | | 901,863 | |
Administrative and transfer agency fees | | | 212,034 | |
Trustee fees and expenses | | | 3,665 | |
Registration/filing fees | | | 39,593 | |
Shareholder service plan fees | | | | |
Investor Class | | | 44,387 | |
Institutional Class | | | 39,359 | |
Recoupment of previously waived fees | | | | |
Investor Class | | | 6,166 | |
Legal fees | | | 12,190 | |
Audit fees | | | 18,919 | |
Reports to shareholders and printing fees | | | 14,230 | |
Custody fees | | | 109,813 | |
Miscellaneous | | | 8,011 | |
| |
Total expenses | | | 1,410,230 | |
Less fees waived/reimbursed by investment advisor (Note 6) | | | | |
Institutional Class | | | (67,938) | |
| |
Total net expenses | | | 1,342,292 | |
| |
NET INVESTMENT INCOME: | | | 1,478,828 | |
| |
Net realized gain on investments | | | 3,383,459 | |
Net realized loss on foreign currency transactions | | | (310,890) | |
Net change in unrealized appreciation on investments (net of foreign capital gains tax of $160,623) | | | 11,226,795 | |
Net change in unrealized depreciation on translation of assets and liabilities in foreign currency transactions | | | (7,731) | |
| |
NET REALIZED AND UNREALIZED GAIN ON INVESTMENTS AND FOREIGN CURRENCY TRANSLATIONS | | | 14,291,633 | |
| |
NET INCREASE IN NET ASSETS RESULTING FROM OPERATIONS | | $ | 15,770,461 | |
| |
See Accompanying Notes to Financial Statements.
| | |
| 18 | | (855) 732-9220 | seafarerfunds.com |
| | |
| Seafarer Overseas Growth and Income Fund | | Statements of Changes in Net Assets |
| | | | | | | | |
| | | Year Ended
April 30, 2015 | | | Year Ended
April 30, 2014 | |
| | | | |
OPERATIONS: | | | | | | | | |
Net investment income | | $ | 1,478,828 | | | $ | 790,512 | |
Net realized gain on investments and foreign currency transactions | | | 3,072,569 | | | | 472,767 | |
Net change in unrealized appreciation on investments and foreign currency translations | | | 11,219,064 | | | | 474,336 | |
| |
Net increase in net assets resulting from operations | | | 15,770,461 | | | | 1,737,615 | |
| |
DISTRIBUTIONS TO SHAREHOLDERS (NOTE 3): | | | | | | | | |
From net investment income | | | | | | | | |
Investor Class | | $ | (553,066) | | | $ | (585,611) | |
Institutional Class | | | (1,354,908) | | | | (308,771) | |
From net realized gains on investments | | | | | | | | |
Investor Class | | | (462,598) | | | | (654,807) | |
Institutional Class | | | (1,176,662) | | | | (316,013) | |
| |
Net decrease in net assets from distributions | | | (3,547,234) | | | | (1,865,202) | |
| |
BENEFICIAL INTEREST TRANSACTIONS (NOTE 5): | | | | | | | | |
Shares sold | | | | | | | | |
Investor Class | | $ | 35,017,066 | | | $ | 18,789,915 | |
Institutional Class | | | 82,647,370 | | | | 41,977,026 | |
Dividends reinvested | | | | | | | | |
Investor Class | | | 1,000,415 | | | | 1,190,349 | |
Institutional Class | | | 2,292,073 | | | | 611,803 | |
Shares Redeemed, net of redemption fees | | | | | | | | |
Investor Class | | | (12,562,924) | | | | (18,143,918) | |
Institutional Class | | | (11,165,061) | | | | (8,326,537) | |
| |
Net increase in net assets derived from beneficial interest transactions | | | 97,228,939 | | | | 36,098,638 | |
| |
| | |
Net increase in net assets | | $ | 109,452,166 | | | $ | 35,971,051 | |
| | |
NET ASSETS: | | | | | | | | |
Beginning of period | | $ | 73,804,671 | | | $ | 37,833,620 | |
| |
End of period (including accumulated net investment loss of ($444,614) and ($233,636), respectively) | | $ | 183,256,837 | | | $ | 73,804,671 | |
| |
| | |
| Annual Report | April 30, 2015 | | 19 |
| | |
| Seafarer Overseas Growth and Income Fund | | Statements of Changes in Net Assets |
| | | | | | | | |
| | | Year Ended
April 30, 2015 | | | Year Ended
April 30, 2014 | |
| | | | |
Other Information: | | | | | | | | |
SHARE TRANSACTIONS: | | | | | | | | |
Investor Class | | | | | | | | |
Sold | | | 2,904,763 | | | | 1,651,517 | |
Distributions reinvested | | | 90,196 | | | | 105,435 | |
Redeemed | | | (1,105,772) | | | | (1,622,659) | |
| |
Net increase in shares outstanding | | | 1,889,187 | | | | 134,293 | |
| |
Institutional Class | | | | | | | | |
Sold | | | 6,996,213 | | | | 3,748,511 | |
Distributions reinvested | | | 206,966 | | | | 54,211 | |
Redeemed | | | (977,140) | | | | (743,914) | |
| |
Net increase in shares outstanding | | | 6,226,039 | | | | 3,058,808 | |
| |
See Accompanying Notes to Financial Statements.
| | |
| 20 | | (855) 732-9220 | seafarerfunds.com |
| | |
| Seafarer Overseas Growth and Income Fund | | Financial Highlights |
| | For a share outstanding through the periods presented |
| | | | | | | | | | | | | | | | |
| Investor Class | | Year Ended
April 30, 2015 | | | Year Ended
April 30, 2014 | | | Year Ended
April 30, 2013 | | | For the Period
February 15,
2012
(Inception) to
April 30, 2012 | |
| |
NET ASSET VALUE, BEGINNING OF PERIOD | | $ | 11.58 | | | $ | 11.91 | | | $ | 10.18 | | | $ | 10.00 | |
INCOME FROM OPERATIONS: | | | | | | | | | | | | | | | | |
Net investment income(a) | | | 0.14 | | | | 0.19 | | | | 0.10 | | | | 0.05 | |
Net realized and unrealized gain on investments | | | 1.26 | | | | 0.02 | | | | 1.74 | | | | 0.13 | |
| |
Total from investment operations | | | 1.40 | | | | 0.21 | | | | 1.84 | | | | 0.18 | |
| |
| | | | |
LESS DISTRIBUTIONS: | | | | | | | | | | | | | | | | |
From net investment income | | | (0.19) | | | | (0.26) | | | | (0.11) | | | | – | |
From net realized gains on investments | | | (0.15) | | | | (0.28) | | | | (0.00) (b) | | | | – | |
| |
Total distributions | | | (0.34) | | | | (0.54) | | | | (0.11) | | | | – | |
| |
REDEMPTION FEES ADDED TO PAID IN CAPITAL | | | 0.00 (c) | | | | 0.00 (c) | | | | 0.00 (c) | | | | – | |
| |
NET INCREASE/(DECREASE) IN NET ASSET VALUE | | | 1.06 | | | | (0.33) | | | | 1.73 | | | | 0.18 | |
| |
NET ASSET VALUE, END OF PERIOD | | $ | 12.64 | | | $ | 11.58 | | | $ | 11.91 | | | $ | 10.18 | |
| |
| | | | |
TOTAL RETURN(d) | | | 12.55% | | | | 1.93% | | | | 18.24% | | | | 1.80% | |
SUPPLEMENTAL DATA: | | | | | | | | | | | | | | | | |
Net assets, end of period (in 000s) | | $ | 53,543 | | | $ | 27,181 | | | $ | 26,348 | | | $ | 1,443 | |
RATIOS TO AVERAGE NET ASSETS: | | | | | | | | | | | | | | | | |
Operating expenses excluding reimbursement/waiver | | | 1.30% | | | | 1.78% | | | | 2.82% | | | | 18.96% (e) | |
Operating expenses including reimbursement/waiver | | | 1.30% (f) | | | | 1.40% | | | | 1.49% | | | | 1.60% (e) | |
Net investment income including reimbursement/waiver | | | 1.19% | | | | 1.66% | | | | 0.90% | | | | 2.61% (e) | |
PORTFOLIO TURNOVER RATE(g) | | | 28% | | | | 51% | | | | 39% | | | | 5% | |
| (a) | Calculated using the average shares method. |
| (b) | Less than $(0.005) per share. |
| (c) | Less than $0.005 per share. |
| (d) | Total returns are for the period indicated and have not been annualized. Total returns would have been lower had certain expenses not been waived during the period. Returns shown do not reflect the deduction of taxes that a shareholder would pay on Fund distributions or the redemption of Fund shares. |
| (f) | Effective September 1, 2014 the Advisor agreed to limit expenses to 1.25%. Prior to September 1, 2014, the Advisor agreed to limit expenses to 1.40% |
| (g) | Portfolio turnover rate for periods less than one full year have not been annualized. |
See Accompanying Notes to Financial Statements.
| | |
| Annual Report | April 30, 2015 | | 21 |
| | |
| Seafarer Overseas Growth and Income Fund | | Financial Highlights |
For a share outstanding through the periods presented
| | | | | | | | | | | | | | | | |
| Institutional Class | | Year Ended
April 30, 2015 | | | Year Ended
April 30, 2014 | | | Year Ended
April 30, 2013 | | | For the Period
February 15,
2012
(Inception) to
April 30, 2012 | |
| |
NET ASSET VALUE, BEGINNING OF PERIOD | | $ | 11.59 | | | $ | 11.91 | | | $ | 10.18 | | | $ | 10.00 | |
INCOME FROM OPERATIONS: | | | | | | | | | | | | | | | | |
Net investment income(a) | | | 0.15 | | | | 0.21 | | | | 0.14 | | | | 0.04 | |
Net realized and unrealized gain on investments | | | 1.28 | | | | 0.02 | | | | 1.71 | | | | 0.14 | |
| |
Total from investment operations | | | 1.43 | | | | 0.23 | | | | 1.85 | | | | 0.18 | |
| |
| | | | |
LESS DISTRIBUTIONS: | | | | | | | | | | | | | | | | |
From net investment income | | | (0.21) | | | | (0.27) | | | | (0.12) | | | | – | |
From net realized gains on investments | | | (0.15) | | | | (0.28) | | | | (0.00) (b) | | | | – | |
| |
Total distributions | | | (0.36) | | | | (0.55) | | | | (0.12) | | | | – | |
| |
REDEMPTION FEES ADDED TO PAID IN CAPITAL | | | 0.00 (c) | | | | 0.00 (c) | | | | 0.00 (c) | | | | – | |
| |
NET INCREASE/(DECREASE) IN NET ASSET VALUE | | | 1.07 | | | | (0.32) | | | | 1.73 | | | | 0.18 | |
| |
NET ASSET VALUE, END OF PERIOD | | $ | 12.66 | | | $ | 11.59 | | | $ | 11.91 | | | $ | 10.18 | |
| |
| | | | |
TOTAL RETURN(d) | | | 12.76% | | | | 2.12% | | | | 18.33% | | | | 1.80% | |
SUPPLEMENTAL DATA: | | | | | | | | | | | | | | | | |
Net assets, end of period (in 000s) | | $ | 129,714 | | | $ | 46,624 | | | $ | 11,486 | | | $ | 1,346 | |
RATIOS TO AVERAGE NET ASSETS: | | | | | | | | | | | | | | | | |
Operating expenses excluding reimbursement/waiver | | | 1.18% | | | | 1.61% | | | | 2.88% | | | | 21.65% (e) | |
Operating expenses including reimbursement/waiver | | | 1.10% (f) | | | | 1.25% | | | | 1.35% | | | | 1.45% (e) | |
Net investment income including reimbursement/waiver | | | 1.30% | | | | 1.89% | | | | 1.28% | | | | 2.00% (e) | |
PORTFOLIO TURNOVER RATE(g) | | | 28% | | | | 51% | | | | 39% | | | | 5% | |
| (a) | Calculated using the average shares method. |
| (b) | Less than $(0.005) per share. |
| (c) | Less than $0.005 per share. |
| (d) | Total returns are for the period indicated and have not been annualized. Total returns would have been lower had certain expenses not been waived during the period. Returns shown do not reflect the deduction of taxes that a shareholder would pay on Fund distributions or the redemption of Fund shares. |
| (f) | Effective September 1, 2014 the Advisor agreed to limit expenses to 1.05%. Prior to September 1, 2014, the Advisor agreed to limit expenses to 1.25% |
| (g) | Portfolio turnover rate for periods less than one full year have not been annualized. |
See Accompanying Notes to Financial Statements.
| | |
| 22 | | (855) 732-9220 | seafarerfunds.com |
| | |
| Seafarer Overseas Growth and Income Fund | | Notes to Financial Statements |
April 30, 2015
1. ORGANIZATION
Financial Investors Trust (the “Trust”), a Delaware statutory trust, is an open-end management investment company registered under the Investment Company Act of 1940, as amended (“1940 Act”). As of April 30, 2015, the Trust had 30 registered funds. This annual report describes the Seafarer Overseas Growth and Income Fund (the “Fund”). The Fund seeks to provide long-term capital appreciation along with some current income; it also seeks to mitigate adverse volatility in returns as a secondary objective. The Fund offers Investor Class and Institutional Class shares.
2. SIGNIFICANT ACCOUNTING POLICIES
The accompanying financial statements were prepared in accordance with accounting principles generally accepted in the United States of America (“U.S. GAAP”). The preparation of financial statements in conformity with U.S. GAAP requires management to make certain estimates and assumptions that affect the reported amounts of assets and liabilities and disclosures of contingent assets and liabilities at the date of the financial statements and the reported amounts of revenue and expenses during the period. Actual results could differ from those estimates. The Fund is considered an investment company for financial reporting purposes under U.S. GAAP. The following is a summary of significant accounting policies consistently followed by the Fund in preparation of its financial statements.
Investment Valuation: The Fund generally values its securities based on market prices determined at the close of regular trading on the New York Stock Exchange (“NYSE”), normally 4:00 p.m. Eastern Time, on each day the NYSE is open for trading.
For equity securities and mutual funds that are traded on an exchange, the market price is usually the closing sale or official closing price on that exchange. In the case of equity securities not traded on an exchange, or if such closing prices are not otherwise available, the securities are valued at the mean of the most recent bid and ask prices on such day. Redeemable securities issued by open-end registered investment companies are valued at the investment company’s applicable net asset value, with the exception of exchange-traded open-end investment companies, which are priced as equity securities.
Equity securities that are primarily traded on foreign securities exchanges are valued at the closing values of such securities on their respective foreign exchanges, except when an event occurs subsequent to the close of the foreign exchange but before the close of the NYSE, such that the securities’ value would likely change. In such an event, the fair values of those securities are determined in good faith through consideration of other factors in accordance with procedures established by and under the general supervision of the Board of Trustees (the “Board”). The Fund will use a fair valuation model provided by an independent pricing service, which is intended to reflect fair value when a security’s value or a meaningful portion of the Fund’s portfolio is believed to have been materially affected by a valuation event that has occurred between the close of the exchange or market on which the security is traded and the close of the regular trading day on the NYSE. The Fund’s valuation procedures set forth certain triggers that inform the Fund when to use the fair valuation model.
The market price for debt obligations is generally the price supplied by an independent third-party pricing service approved by the Board which may use a matrix, formula or other objective method that takes into consideration quotations from dealers, market transactions in comparable investments, market indices and yield curves. If vendors are unable to supply a price, or if the price supplied is deemed to be unreliable, the market price may be determined using quotations received from one or more broker–dealers that make a market in the security. Short–term debt obligations that will mature in 60 days
| | |
| Annual Report | April 30, 2015 | | 23 |
| | |
| Seafarer Overseas Growth and Income Fund | | Notes to Financial Statements |
April 30, 2015
or less are valued at amortized cost, unless it is determined that using this method would not reflect an investment’s fair value.
Forward currency exchange contracts have a market value determined by the prevailing foreign currency exchange daily rates and current foreign currency exchange forward rates. The foreign currency exchange forward rates are calculated using an automated system that estimates rates on the basis of the current day foreign currency exchange rates and forward foreign currency exchange rates supplied by a pricing service.
When such prices or quotations are not available, or when the Fair Value Committee appointed by the Board believes that they are unreliable, securities may be priced using fair value procedures approved by the Board.
Certain foreign countries impose a tax on capital gains which is accrued by the Fund based on unrealized appreciation, if any, on affected securities. The tax is paid when the gain is realized.
Fair Value Measurements: The Fund discloses the classification of its fair value measurements following a three-tier hierarchy based on the inputs used to measure fair value. Inputs refer broadly to the assumptions that market participants would use in pricing the asset or liability, including assumptions about risk. Inputs may be observable or unobservable. Observable inputs reflect the assumptions market participants would use in pricing the asset or liability. Such inputs are developed based on market data obtained from sources independent of the reporting entity. Unobservable inputs reflect the reporting entity’s own assumptions about the assumptions market participants would use in pricing the asset or liability, which are developed based on the information available and the reporting entity’s best efforts to interpret such information.
Various inputs are used in determining the value of the Fund’s investments as of the end of the reporting period. When inputs used fall into different levels of the fair value hierarchy, the level in the hierarchy within which the fair value measurement falls is determined based on the lowest level input that is significant to the fair value measurement in its entirety. The designated input levels are not necessarily an indication of the risk or liquidity associated with these investments. These inputs are categorized in the following hierarchy under applicable financial accounting standards:
| | |
Level 1 – | | Unadjusted quoted prices in active markets for identical investments, unrestricted assets or liabilities that a Fund has the ability to access at the measurement date; |
| |
Level 2 – | | Quoted prices which are not active, quoted prices for similar assets or liabilities in active markets or inputs other than quoted prices that are observable (either directly or indirectly) for substantially the full term of the asset or liability; and |
| |
Level 3 – | | Significant unobservable prices or inputs (including the Fund’s own assumptions in determining the fair value of investments) where there is little or no market activity for the asset or liability at the measurement date. |
| | |
| 24 | | (855) 732-9220 | seafarerfunds.com |
| | |
| Seafarer Overseas Growth and Income Fund | | Notes to Financial Statements |
April 30, 2015
The following is a summary of each input used to value the Fund as of April 30, 2015:
| | | | | | | | | | | | | | | | |
| | | | | | | | | Level 3 - | | | | |
Investments in Securities at Value(a) | | Level 1 -
Quoted Prices | | | Level 2 - Other Significant
Observable Inputs | | | Significant
Unobservable
Inputs | | | Total | |
| |
Common Stocks | | | | | | | | | | | | | | | | |
Brazil | | $ | 13,640,369 | | | $ | – | | | $ | – | | | $ | 13,640,369 | |
China / Hong Kong | | | 6,226,978 | | | | 27,584,874 | | | | – | | | | 33,811,852 | |
India | | | 10,228,777 | | | | 4,224,169 | | | | – | | | | 14,452,946 | |
Indonesia | | | – | | | | 5,262,321 | | | | – | | | | 5,262,321 | |
Japan | | | – | | | | 4,955,804 | | | | – | | | | 4,955,804 | |
Malaysia | | | – | | | | 3,660,319 | | | | – | | | | 3,660,319 | |
Mexico | | | 13,602,047 | | | | – | | | | – | | | | 13,602,047 | |
Poland | | | – | | | | 13,058,398 | | | | – | | | | 13,058,398 | |
Singapore | | | – | | | | 11,733,173 | | | | – | | | | 11,733,173 | |
South Africa | | | – | | | | 6,325,518 | | | | – | | | | 6,325,518 | |
South Korea | | | 5,258,955 | | | | 6,463,614 | | | | – | | | | 11,722,569 | |
Taiwan | | | 1,710,800 | | | | 2,888,564 | | | | – | | | | 4,599,364 | |
Turkey | | | – | | | | 8,643,586 | | | | – | | | | 8,643,586 | |
Vietnam | | | 5,796,812 | | | | – | | | | – | | | | 5,796,812 | |
Preferred Stocks | | | | | | | | | | | | | | | | |
Brazil | | | 8,705,397 | | | | – | | | | – | | | | 8,705,397 | |
South Korea | | | – | | | | 7,305,782 | | | | – | | | | 7,305,782 | |
Foreign Currency | | | | | | | | | | | | | | | | |
Convertible Bonds | | | – | | | | 3,522,330 | | | | – | | | | 3,522,330 | |
Foreign Currency | | | | | | | | | | | | | | | | |
Government Bonds | | | – | | | | 4,574,087 | | | | – | | | | 4,574,087 | |
USD Convertible Bonds | | | – | | | | 2,659,375 | | | | – | | | | 2,659,375 | |
| |
Total | | $ | 65,170,135 | | | $ | 112,861,914 | | | $ | – | | | $ | 178,032,049 | |
| |
| (a) | For detailed descriptions of countries, see the accompanying Portfolio of Investments. |
The Fund recognizes transfers between levels as of the end of the period. For the year ended April 30, 2015, the Fund did not have any securities that used significant unobservable inputs (Level 3) in determining fair value.
Security amounts the Fund transferred between Levels 1 and 2 at April 30, 2015 were as follows:
| | | | | | | | | | |
| Seafarer Overseas | | | | | | | | | | |
| Growth and | | Level 1 | | | | Level 2 |
| Income Fund | | Transfers In | | Transfers (Out) | | | | Transfers In | | Transfers (Out) |
|
Common Stocks | | $ 5,258,955 | | $ (6,849,043) | | | | $ 6,849,043 | | $ (5,258,955) |
|
Total | | $ 5,258,955 | | $ (6,849,043) | | | | $ 6,849,043 | | $ (5,258,955) |
|
| | |
| Annual Report | April 30, 2015 | | 25 |
| | |
| Seafarer Overseas Growth and Income Fund | | Notes to Financial Statements |
April 30, 2015
The transfers were due to the Fund utilizing a fair value evaluation service with respect to international securities with an earlier market closing than the Fund’s net asset value computation cutoff. When events trigger the use of the fair value evaluation service on a reporting date, it results in certain securities transferring from a Level 1 to a Level 2.
Investment Transactions and Investment Income: Investment transactions are accounted for on the date the investments are purchased or sold (trade date). Realized gains and losses from investment transactions are reported on an identified cost basis. Interest income, which includes accretion of discounts and amortization of premiums, is accrued and recorded as earned. Dividend income is recognized on the ex-dividend date or for certain foreign securities, as soon as information is available to the Fund. All of the realized and unrealized gains and losses and net investment income are allocated daily to each class in proportion to its average daily net assets.
Foreign Securities: The Fund may directly purchase securities of foreign issuers. Investing in securities of foreign issuers involves special risks not typically associated with investing in securities of U.S. issuers. The risks include possible reevaluation of currencies, the inability to repatriate foreign currency, less complete financial information about companies and possible future adverse political and economic developments. Moreover, securities of many foreign issuers and their markets may be less liquid and their prices more volatile than those of securities of comparable U.S. issuers.
Foreign Currency Translation: The books and records of the Fund are maintained in U.S. dollars. Investment valuations and other assets and liabilities initially expressed in foreign currencies are converted each business day into U.S. dollars based upon current exchange rates. Prevailing foreign exchange rates may generally be obtained at the close of the NYSE (normally, 4:00 p.m. Eastern time). The portion of realized and unrealized gains or losses on investments due to fluctuations in foreign currency exchange rates is not separately disclosed and is included in realized and unrealized gains or losses on investments, when applicable.
Foreign Currency Spot Contracts: The Fund may enter into foreign currency spot contracts to facilitate transactions in foreign securities or to convert foreign currency receipts into U.S. dollars. A foreign currency spot contract is an agreement between two parties to buy and sell currencies at the current market rate, for settlement generally within two business days. The U.S. dollar value of the contracts is determined using current currency exchange rates supplied by a pricing service. The contract is marked-to-market daily for settlements beyond one day and any change in market value is recorded as an unrealized gain or loss. When the contract is closed, the Fund records a realized gain or loss equal to the difference between the value on the open and close date. Losses may arise from changes in the value of the foreign currency, or if the counterparties do not perform under the contract’s terms. The maximum potential loss from such contracts is the aggregate face value in U.S. dollars at the time the contract was opened.
Trust Expenses: Some expenses of the Trust can be directly attributed to the Fund. Expenses which cannot be directly attributed to the Fund are apportioned among all funds in the Trust based on average net assets of each fund.
Fund and Class Expenses: Expenses that are specific to the Fund or class of shares of the Fund are charged directly to the Fund or share class. All expenses of the Fund, other than class specific expenses, are allocated daily to each class in proportion to its average daily net assets. Fees provided under the shareholder service plans for a particular class of the Fund are charged to the operations of such class.
| | |
| 26 | | (855) 732-9220 | seafarerfunds.com |
| | |
| Seafarer Overseas Growth and Income Fund | | Notes to Financial Statements |
April 30, 2015
Federal Income Taxes: The Fund complies with the requirements under Subchapter M of the Internal Revenue Code of 1986, as amended, applicable to regulated investment companies and intends to distribute substantially all of its net taxable income and net capital gains, if any, each year so that it will not be subject to excise tax on undistributed income and gains. The Fund is not subject to income taxes to the extent such distributions are made.
As of and during the year ended April 30, 2015, the Fund had a liability for any unrecognized capital gains tax of $233,737. The Fund files U.S. federal, state, and local tax returns as required. The Fund’s tax returns are subject to examination by the relevant tax authorities until expiration of the applicable statute of limitations, which is generally three years after the filing of the tax return for federal purposes and four years for most state returns. Tax returns for open years have incorporated no uncertain tax positions that require a provision for income taxes.
Distributions to Shareholders: The Fund normally pays dividends from net investment income, if any, on a semi-annual basis. The Fund normally distributes capital gains, if any, on an annual basis. Income dividend distributions are derived from interest and other income the Fund receives from its investments, including short term capital gains. Long term capital gain distributions are derived from gains realized when the Fund sells a security it has owned for more than one year. The Fund may make additional distributions and dividends at other times if the adviser believes doing so may be necessary for the Fund to avoid or reduce taxes.
3. TAX BASIS INFORMATION
Reclassifications: As of April 30, 2015, permanent differences in book and tax accounting were reclassified. These differences had no effect on net assets and were primarily attributed to differences in the tax character of distributions, PFICs and foreign currency. The reclassifications were as follows:
| | | | | | | | | | | | |
| | | | | | | | | Accumulated Net | |
| | | | | | Accumulated Net | | | Realized Loss on | |
| | | Paid-in Capital | | | Investment Income | | | Investments | |
| |
Seafarer Overseas Growth and Income Fund | | $ | 42,755 | | | $ | 218,168 | | | $ | (260,923) | |
Tax Basis of Investments: As of April 30, 2015, the aggregate cost of investments, gross unrealized appreciation/ (depreciation) and net unrealized appreciation for Federal tax purposes were as follows:
| | | | | | | | | | | | | | | | | | | | |
| | | Cost of
Investments | | | Gross
Unrealized
Appreciation | | | Gross
Unrealized
Depreciation | | | Net
Depreciation
on Foreign
Currencies | | | Net Unrealized Appreciation | |
| |
Seafarer Overseas Growth and Income Fund | | $ | 163,855,182 | | | $ | 21,379,596 | | | $ | (7,202,729 | ) | | $ | (238,685) | | | $ | 13,938,182 | |
| | |
| Annual Report | April 30, 2015 | | 27 |
| | |
| Seafarer Overseas Growth and Income Fund | | Notes to Financial Statements |
April 30, 2015
Components of Distributable Earnings: As of April 30, 2015, components of distributable earnings were as follows:
| | | | |
Undistributed ordinary income | | $ | – | |
Accumulated capital gains | | | 1,748,524 | |
Net unrealized appreciation on investments | | | 13,938,182 | |
Other cumulative effect of timing differences | | | (267,648) | |
| |
Total distributable earnings | | $ | 15,419,058 | |
| |
Capital Losses: As of April 30, 2015, the Fund had no capital loss carryforwards.
The fund elects to defer to the period ending April 30, 2016, capital losses recognized during the period November 1, 2014 to April 30, 2015 in the amount of $267,648.
Tax Basis of Distributions to Shareholders: The character of distributions made during the year from net investment income or net realized gains may differ from its ultimate characterization for federal income tax purposes. Also, due to the timing of dividend distributions, the fiscal year in which amounts are distributed may differ from the fiscal year in which the income or realized gain is recorded by the Fund.
The tax character of distributions paid by the Fund for the fiscal year ended April 30, 2015, were as follows:
| | | | | | | | |
| | | | | | Long-Term Capital | |
| | | Ordinary Income | | | Gain | |
| |
Seafarer Overseas Growth and Income Fund | | $ | 1,973,654 | | | $ | 1,573,580 | |
The tax character of distributions paid by the Fund for the fiscal year ended April 30, 2014, were as follows:
| | | | | | | | |
| | | | | | Long-Term Capital | |
| | | Ordinary Income | | | Gain | |
| |
Seafarer Overseas Growth and Income Fund | | $ | 1,543,197 | | | $ | 322,005 | |
4. SECURITIES TRANSACTIONS
The cost of purchases and proceeds from sales of securities excluding short term securities during the year ended April 30, 2015, were as follows:
| | | | | | | | |
| | | Purchases of | | | Proceeds From Sales | |
| | | Securities | | | of Securities | |
| |
Seafarer Overseas Growth and Income Fund | | $ | 123,415,840 | | | | $ 32,174,342 | |
| | |
| 28 | | (855) 732-9220 | seafarerfunds.com |
| | |
| Seafarer Overseas Growth and Income Fund | | Notes to Financial Statements |
April 30, 2015
5. SHARES OF BENEFICIAL INTEREST
The capitalization of the Trust consists of an unlimited number of shares of beneficial interest with no par value per share. Holders of the shares of the Fund of the Trust have one vote for each share held and a proportionate fraction of a vote for each fractional share. All shares issued and outstanding are fully paid and are transferable and redeemable at the option of the shareholder. Purchasers of the shares do not have any obligation to make payments to the Trust or its creditors (other than the purchase price for the shares) or make contributions to the Trust or its creditors solely by reason of the purchasers’ ownership of the shares. Shares have no pre-emptive rights.
Shares redeemed within 90 days of purchase may incur a 2% short-term redemption fee deducted from the redemption amount. The redemption fee is reflected in the “Shares redeemed, net of redemption fees” in the Statements of Changes in Net Assets. During the years ended April 30, 2015, and April 30, 2014, the Fund retained the following redemption fees:
| | | | |
| | | For the Year ended | | For the Year ended |
| Fund | | April 30, 2015 | | April 30, 2014 |
|
Seafarer Overseas Growth and Income Fund | | | | |
|
Investor Class | | $ 10,091 | | $ 9,035 |
|
Institutional Class | | $ 6,959 | | $ 3,790 |
|
6. MANAGEMENT AND RELATED-PARTY TRANSACTIONS
Seafarer Capital Partners, LLC (the “Adviser”), subject to the authority of the Board, is responsible for the overall management and administration of the Fund’s business affairs. The Adviser manages the investments of the Fund in accordance with the Fund’s investment objective, policies, limitations and investment guidelines established jointly by the Adviser and the Trustees. Pursuant to the Advisory Agreement (the “Advisory Agreement”), the Fund pays the Adviser an annual management fee based on the Fund’s average daily net assets. The management fee is paid on a monthly basis. From the inception of the Fund through August 31, 2014, the Fund paid the Adviser an annual management fee of 0.85%. Effective September 1, 2014, the Adviser contractually agreed to reduce its annual management fee to 0.75%.
From the inception of the Fund through August 31, 2013, the Adviser contractually agreed to limit certain Fund expenses (exclusive of acquired fund fees and expenses, brokerage expenses, interest expenses, taxes and extraordinary expenses) to 1.60% and 1.45% of the Fund’s average daily net assets in the Investor and Institutional share classes, respectively. Effective September 1, 2013, the Adviser contractually agreed to limit certain Fund expenses (exclusive of brokerage expenses, interest expenses, taxes and extraordinary expenses) to 1.40% and 1.25% of the Fund’s average daily net assets in the Investor and Institutional share classes, respectively, through August 31, 2014. Effective September 1, 2014, the Adviser contractually agreed to limit such Fund expenses to 1.25% and 1.05% of the Fund’s average daily net assets in the Investor and Institutional share classes, respectively, through August 31, 2015, at which point this agreement may be extended further. The Fund may have to repay some of these waivers and reimbursements to the Adviser in the following three years. Pursuant to the expense limitation agreement between the Adviser and the Trust, the Fund will reimburse the Adviser for any contractual fee waivers made by the Adviser, provided that any such reimbursements made by the Fund to the Adviser will not cause the Fund’s expense limitation to exceed expense limitations in existence at the time the expense was incurred, or at the time of the
| | |
| Annual Report | April 30, 2015 | | 29 |
| | |
| Seafarer Overseas Growth and Income Fund | | Notes to Financial Statements |
April 30, 2015
reimbursement, whichever is lower, and the reimbursement is made within three years after the end of the fiscal year in which fees or expenses were incurred.
For the year ended April 30, 2015, the fee waivers and/or reimbursements were as follows:
| | | | |
| | | Fees Waived/ | |
| | | Reimbursed By | |
| Fund | | Adviser | |
| |
Seafarer Overseas Growth and Income Fund | | | | |
| |
Institutional Class | | $ | 67,938 | |
| |
As of April 30, 2015, the balances of recoupable expenses for each class were as follows:
| | | | | | | | | | | | | | | | |
| | | Expires | | | Expires | | | Expires | | | | |
| Fund | | 2016 | | | 2017 | | | 2018 | | | Total | |
| |
Seafarer Overseas Growth and Income Fund | | | | | | | | | | | | | | | | |
| |
Investor Class | | $ | 111,471 | | | $ | 89,143 | | | $ | – | | | $ | 200,614 | |
| |
Institutional Class | | | 42,281 | | | | 66,379 | | | | 67,938 | | | | 176,598 | |
| |
Fund Administrator Fees and Expenses
ALPS Fund Services, Inc. (“ALPS” and the “Administrator”) (an affiliate of ALPS Distributors, Inc.) provides administrative, fund accounting and other services to the Fund under the Administration, Bookkeeping and Pricing Services Agreement with the Trust. Under this Agreement, ALPS is paid fees by the Fund, accrued on a daily basis and paid on a monthly basis following the end of the month, based on the greater of (a) an annual total fee of $151,120 (subject to an annual cost of living increase), or (b) the following fee schedule:
| | | | |
| Average Total Net Assets | | Contractual Fee | | |
|
Between $0-$500M | | 0.05% | | |
$500M-$1B | | 0.03% | | |
Above $1B | | 0.02% | | |
The Administrator is also reimbursed by the Fund for certain out-of-pocket expenses.
Transfer Agent
ALPS serves as transfer, dividend paying and shareholder servicing agent for the Fund (“Transfer Agent”). ALPS is compensated based upon a $26,420 annual base fee for the Fund, and annually $9 per direct open account and $7 per open account through NSCC. The Transfer Agent is also reimbursed by the Fund for certain out-of-pocket expenses.
Compliance Services
ALPS provides services that assist the Trust’s chief compliance officer in monitoring and testing the policies and procedures of the Trust in conjunction with requirements under Rule 38a-1 under the 1940 Act under the Chief Compliance Officer Services Agreement with the Trust. Under this Agreement, the Adviser pays ALPS an annual base fee of $31,704 and reimburses ALPS for certain out-of-pocket expenses.
| | |
| 30 | | (855) 732-9220 | seafarerfunds.com |
| | |
| Seafarer Overseas Growth and Income Fund | | Notes to Financial Statements |
April 30, 2015
Principal Financial Officer
ALPS provides principal financial officer services to the Fund under the Principal Financial Officer Services Agreement with the Trust. Under this Agreement, the Adviser pays ALPS an annual base fee of $10,000 and reimburses ALPS for certain out-of-pocket expenses.
Distributor
ALPS Distributors, Inc. (“ADI” or the “Distributor”) (an affiliate of ALPS) acts as the distributor of the Fund’s shares pursuant to the Distribution Agreement with the Trust. Under a side letter agreement, the Adviser pays ADI an annual base fee of $12,000 for the distribution services. The Adviser also reimburses ADI for certain out-of-pocket expenses. Shares are sold on a continuous basis by ADI as agent for the Fund, and ADI has agreed to use its best efforts to solicit orders for the sale of the Fund’s shares, although it is not obliged to sell any particular amount of shares. ADI is registered as a broker-dealer with the Securities and Exchange Commission.
Shareholder Service Plan for Investor Class and Institutional Class Shares
The Fund has adopted a shareholder service plan (a “Service Plan”) for each of its share classes. Under the Service Plan, the Fund is authorized to enter into shareholder service agreements with investment advisors, financial institutions and other service providers (“Participating Organizations”) to maintain and provide certain administrative and servicing functions in relation to the accounts of shareholders. The Service Plan will cause the Fund to pay an aggregate fee, not to exceed on an annual basis 0.15% and 0.05% of the average daily net asset value of the Investor and Institutional share classes, respectively. Such payment will be made on assets attributable to or held in the name of a Participating Organization, on behalf of its clients as compensation for providing service activities pursuant to an agreement with a Participating Organization. Any amount of such payment not paid during the Fund’s fiscal year for such service activities shall be reimbursed to the Fund as soon as practicable after the end of the fiscal year.
7. INDEMNIFICATIONS
Under the Trust’s organizational documents, its officers and Trustees are indemnified against certain liability arising out of the performance of their duties to the Trust. Additionally, in the normal course of business, the Trust enters into contracts with service providers that may contain general indemnification clauses, which may permit indemnification to the extent permissible under the applicable law. The Trust’s maximum exposure under these arrangements is unknown, as this would involve future claims that may be made against the Trust that have not yet occurred.
| | |
| Annual Report | April 30, 2015 | | 31 |
| | |
| | | Report of Independent Registered |
| Seafarer Overseas Growth and Income Fund | | Public Accounting Firm |
April 30, 2015
To the Shareholders and Board of Trustees of Financial Investors Trust:
We have audited the accompanying statement of assets and liabilities, including the portfolio of investments, of Seafarer Overseas Growth and Income Fund (the “Fund”), one of the portfolios constituting Financial Investors Trust, as of April 30, 2015, the related statement of operations for the year then ended, the statements of changes in net assets for each of the two years in the period then ended, and the financial highlights for each of the three years in the period then ended and for the period from February 15, 2012 (inception) to April 30, 2012. These financial statements and financial highlights are the responsibility of the Fund’s management. Our responsibility is to express an opinion on these financial statements and financial highlights based on our audits.
We conducted our audits in accordance with the standards of the Public Company Accounting Oversight Board (United States). Those standards require that we plan and perform the audit to obtain reasonable assurance about whether the financial statements and financial highlights are free of material misstatement. The Fund is not required to have, nor were we engaged to perform, an audit of its internal control over financial reporting. Our audits included consideration of internal control over financial reporting as a basis for designing audit procedures that are appropriate in the circumstances, but not for the purpose of expressing an opinion on the effectiveness of the Fund’s internal control over financial reporting. Accordingly, we express no such opinion. An audit also includes examining, on a test basis, evidence supporting the amounts and disclosures in the financial statements, assessing the accounting principles used and significant estimates made by management, as well as evaluating the overall financial statement presentation. Our procedures included confirmation of securities owned as of April 30, 2015, by correspondence with the custodian and brokers; where replies were not received from brokers, we performed other auditing procedures. We believe that our audits provide a reasonable basis for our opinion.
In our opinion, the financial statements and financial highlights referred to above present fairly, in all material respects, the financial position of Seafarer Overseas Growth and Income Fund of Financial Investors Trust as of April 30, 2015, the results of its operations for the year then ended, and the changes in its net assets for each of the two years in the period then ended, and the financial highlights for each of the three years in the period then ended and for the period from February 15, 2012 (inception) to April 30, 2012, in conformity with accounting principles generally accepted in the United States of America.
DELOITTE & TOUCHE LLP
Denver, Colorado
June 26, 2015
| | |
| 32 | | (855) 732-9220 | seafarerfunds.com |
| | |
| | Disclosure Regarding Approval |
Seafarer Overseas Growth and Income Fund | | of Fund Advisory Agreement |
April 30, 2015 (Unaudited)
On December 9, 2014, the Trustees met in person to discuss, among other things, the approval of the investment advisory agreement between the Trust and Seafarer Capital Partners, LLC (“Seafarer”) (the “Investment Advisory Agreement”), in accordance with Section 15(c) of the 1940 Act. The Independent Trustees met with independent legal counsel during executive session and discussed the Investment Advisory Agreement and other related materials.
In renewing and approving the Investment Advisory Agreement with Seafarer, the Trustees, including the Independent Trustees, considered the following factors with respect to the Seafarer Overseas Growth and Income Fund (the “Seafarer Fund”):
Investment Advisory Fee Rate: The Trustees reviewed and considered the contractual annual advisory fee to be paid by the Trust, on behalf of the Seafarer Fund, to Seafarer of 0.75% of the Seafarer Fund’s daily average net assets, in light of the extent and quality of the advisory services provided by Seafarer to the Seafarer Fund.
The Trustees considered the information they received comparing the Seafarer Fund’s contractual annual advisory fee and total net expenses with those of funds in both the relevant expense group and expense universe of funds provided by an independent provider of investment company data, noting that the Adviser had reduced its management fee for the Fund from 0.85% to 0.75% effective September 1, 2014.
Based on such information, the Trustees further determined that the contractual annual advisory fee of 0.75% of assets was below the median of the Seafarer Fund’s peer group and universe. The Trustees noted that the total net expense ratio for the Seafarer Fund was below the median for its expense group, as provided by an independent provider of investment company data.
The Trustees also considered the fee structures applicable to Seafarer’s other client employing a comparable strategy to that of the Seafarer Fund.
Nature, Extent and Quality of the Services under the Investment Advisory Agreement: The Trustees received and considered information regarding the nature, extent and quality of services to be provided to the Seafarer Fund under the Investment Advisory Agreement. The Trustees reviewed certain background materials supplied by Seafarer in its presentation, including its Form ADV.
The Trustees reviewed and considered Seafarer’s investment advisory personnel, its history as an asset manager and its performance and the amount of assets currently under management by Seafarer. The Trustees also reviewed the research and decision-making processes utilized by Seafarer, including the methods adopted to seek to achieve compliance with the investment objectives, policies and restrictions of the Seafarer Fund.
The Trustees considered the background and experience of Seafarer’s management in connection with the Seafarer Fund, including reviewing the qualifications, backgrounds and responsibilities of the management team primarily responsible for the day-to-day portfolio management of the Seafarer Fund, and the extent of the resources devoted to research and analysis of actual and potential investments.
The Trustees also reviewed, among other things, Seafarer’s trading policies and procedures and its Code of Ethics.
Performance: The Trustees reviewed performance information for the Seafarer Fund for the 1-year and since inception periods ended October 31, 2014. That review included a comparison of the Seafarer Fund’s performance to the performance of a universe of comparable funds selected by an independent provider of investment company data. The Trustees noted the performance of the Seafarer Fund exceeded the average and median performance of its peer universe for those periods. The Trustees also considered Seafarer’s discussion of the Seafarer Fund’s top contributors and top detractors, as well as Seafarer’s performance and reputation generally and its investment techniques, risk management controls and decision-making processes.
| | |
| Annual Report | April 30, 2015 | | 33 |
| | |
| Seafarer Overseas Growth and Income Fund | | Disclosure Regarding Approval of Fund Advisory Agreement |
April 30, 2015 (Unaudited)
Total Expense Ratios and the Adviser’s Profitability: The Trustees received and considered information provided by an independent provider of investment company data comparing the Seafarer Fund’s total expense ratio against its expense group, as well as a profitability analysis prepared by Seafarer based on the fees payable under the Investment Advisory Agreement. The Trustees considered the profits, if any, realized by Seafarer in connection with the operation of the Seafarer Fund. The Board then reviewed Seafarer’s financial statements in order to analyze the financial condition and stability and profitability of the adviser.
Economies of Scale: The Trustees considered whether economies of scale in the provision of services to the Seafarer Fund will be passed along to the shareholders under the proposed agreement.
Other Benefits to the Adviser: The Trustees reviewed and considered any other incidental benefits derived or to be derived by Seafarer from its relationship with the Seafarer Fund, including whether soft dollar arrangements were used.
In selecting Seafarer as the Seafarer Fund’s investment adviser and approving the Investment Advisory Agreement and the fees charged under the Investment Advisory Agreement, the Trustees concluded that no single factor reviewed by the Trustees was identified by the Trustees to be determinative as the principal factor in whether to approve the Investment Advisory Agreement. Further, the Independent Trustees were advised by separate independent legal counsel throughout the process. The Trustees, including all of the Independent Trustees, concluded that:
| | • | | the investment advisory fee to be received by Seafarer with respect to the Seafarer Fund was below the average and median of the Seafarer Fund’s expense group and the median of its expense universe, and that the total net expense ratio for the Seafarer Fund was below the average and median of its expense group; |
| | • | | the nature, extent and quality of services to be rendered by Seafarer under the Investment Advisory Agreement were adequate; |
| | • | | the performance of the Seafarer Fund was short in that it did not have a 3-year track record and for the 1-year period was generally comparable to the performance of the funds in its peer group, as provided by an independent provider of investment company data; |
| | • | | bearing in mind the limitations of comparing different types of managed accounts and the different levels of service typically associated with such accounts, the fee structures applicable to Seafarer’s other clients employing a comparable strategy to that of the Seafarer Fund were not indicative of any unreasonableness with respect to the advisory fees proposed to be payable by the Seafarer Fund; |
| | • | | the total expense ratio of the Seafarer Fund was generally lower than its expense group median; |
| | • | | the profit, if any, anticipated to be realized by Seafarer in connection with the operation of the Seafarer Fund is not unreasonable to the Seafarer Fund; and |
| | • | | there were no material economies of scale or other incidental benefits accruing to Seafarer in connection with its relationship with the Seafarer Fund. |
Based on the Trustees’ deliberations and their evaluation of the information described above, the Trustees, including all of the Independent Trustees, concluded that Seafarer’s compensation for investment advisory services is consistent with the best interests of the Seafarer Fund and its shareholders.
| | |
| 34 | | (855) 732-9220 | seafarerfunds.com |
| | |
| Seafarer Overseas Growth and Income Fund | | Additional Information |
| | April 30, 2015 (Unaudited) |
1. FUND HOLDINGS
The Fund files its complete schedule of portfolio holdings with the Securities and Exchange Commission (the “SEC”) for the first and third quarters of each fiscal year on Form N-Q within 60 days after the end of the period. Copies of the Fund’s Form N-Q are available without charge on the SEC website at http://www.sec.gov. You may also review and copy the Form N-Q at the SEC’s Public Reference Room in Washington, D.C. For more information about the operation of the Public Reference Room, please call the SEC at 1-800-SEC-0330.
2. FUND PROXY VOTING POLICIES, PROCEDURES AND SUMMARIES
The Fund’s policies and procedures used in determining how to vote proxies and information regarding how the Fund voted proxies relating to portfolio securities during the most recent prior 12-month period ending June 30 are available without charge, (1) upon request, by calling toll-free (855) 732-9220 and (2) on the SEC’s website at http://www.sec.gov.
3. TAX DESIGNATIONS (UNAUDITED)
The Fund designates the following as a percentage of taxable ordinary income distributions, or up to the maximum amount allowable, for the calendar year ended December 31, 2014:
| | |
| Dividends Received Deduction | | Qualified Dividend Income |
0.00% | | 29.70% |
In early 2015, if applicable, shareholders of record received this information for the distributions paid to them by the Fund during the calendar year 2014 via Form 1099. The Fund will notify shareholders in early 2016 of amounts paid to them by the Fund, if any, during the calendar year 2015.
The Fund designates foreign taxes paid in the amount of $295,407 and foreign source income in the amount of $2,749,035 for federal income tax purposes for the year ended April 30, 2015.
Pursuant to section 852(b)(3), the Fund designates $1,616,335 as a long-term capital gain distribution. This amount includes $42,755 of earnings and profits distributed to shareholders on redemptions.
Please consult a tax advisor if you have questions about federal or state income tax laws, or how to prepare your tax returns.
| | |
| Annual Report | April 30, 2015 | | 35 |
| | |
| Seafarer Overseas Growth and Income Fund | | Trustees and Officers |
| | April 30, 2015 (Unaudited) |
Additional information regarding the Fund’s trustees is included in the Statement of Additional Information, which can be obtained without charge by calling 855-732-9220.
INDEPENDENT TRUSTEES
| | | | | | | | | | |
Name, Address* & Year of Birth | | Position(s) Held with Fund | | Term of Office and Length of Time Served** | | Principal Occupation(s) During Past 5 Years*** | | Number of Funds in Fund Complex Overseen by Trustee**** | | Other Directorships Held by Trustee During Past 5 Years |
|
Mary K. Anstine, 1940 | | Trustee | | Ms. Anstine was elected at a special meeting of shareholders held on March 21, 1997 and re-elected at a special meeting of shareholders held on August 7, 2009. | | Ms. Anstine was formerly an Executive Vice President of First Interstate Bank of Denver until 1994, President/Chief Executive Officer of HealthONE Alliance, Denver, Colorado, from 1994 to 2004, and has been retired since 2004. Ms. Anstine is also Trustee/Director of AV Hunter Trust and Colorado Uplift Board. Ms. Anstine was formerly a Director of the Trust Bank of Colorado (later purchased and now known as Northern Trust Bank), HealthONE and Denver Area Council of the Boy Scouts of America, and a member of the American Bankers Association Trust Executive Committee. | | 30 | | Ms. Anstine is a Trustee of ALPS ETF Trust (18 funds); ALPS Variable Investment Trust (9 funds); Reaves Utility Income Fund (1 fund); and Westcore Trust (12 funds). |
|
John R. Moran, Jr., 1930 | | Trustee | | Mr. Moran was elected at a special meeting of shareholders held on March 21, 1997 and re-elected at a special meeting of shareholders held on August 7, 2009. | | Mr. Moran formerly served as President and CEO of The Colorado Trust, a private foundation serving the health and hospital community in the state of Colorado, from 1991 to 2007. During his career as an attorney from 1958 to 1991, Mr. Moran was formerly a partner with the firm of Kutak Rock & Campbell in Denver, Colorado and a member of the Colorado House of Representatives. Currently, Mr. Moran is a member of the Treasurer’s Investment Advisory Committee for the University of Colorado. | | 30 | | None. |
|
| * | All communications to Trustees and Officers may be directed to Financial Investors Trust c/o 1290 Broadway, Suite 1100, Denver, CO 80203. |
| ** | This is the period for which the Trustee or Officer began serving the Trust. Each Trustee and/or Officer serves an indefinite term, until his successor is elected. |
| *** | Except as otherwise indicated, each individual has held the office shown or other offices in the same company for the last five years. |
| **** | The Fund Complex includes all series of the Trust (currently 30) and any other investment companies for which any Trustee serves as Trustee for and which Seafarer Capital Partners, LLC provides investment advisory services (currently none). |
| | |
| 36 | | (855) 732-9220 | seafarerfunds.com |
| | |
| Seafarer Overseas Growth and Income Fund | | Trustees and Officers |
April 30, 2015 (Unaudited)
INDEPENDENT TRUSTEES
| | | | | | | | | | |
Name, Address* & Year of Birth | | Position(s) Held with Fund | | Term of Office and Length of Time Served** | | Principal Occupation(s) During Past 5 Years*** | | Number of Funds in Fund Complex Overseen by Trustee**** | | Other Directorships Held by Trustee During Past 5 Years |
|
Jeremy W. Deems, 1976 | | Trustee | | Mr. Deems was appointed as a Trustee at the March 11, 2008 meeting of the Board of Trustees and elected at a special meeting of shareholders held on August 7, 2009. | | Mr. Deems is the Co-Founder and Chief Financial Officer of Green Alpha Advisors, LLC, a registered investment advisor, and Co-Portfolio Manager of the Shelton Green Alpha Fund. Prior to joining Green Alpha Advisors, Mr. Deems was CFO and Treasurer of Forward Management, LLC, ReFlow Management Co., LLC, ReFlow Fund, LLC, a private investment fund, and Sutton Place Management, LLC, an administrative services company, from 1998 to June 2007. From 2004 to 2005, Mr Deems also served as Treasurer of the Forward Funds and the Sierra Club Funds. | | 30 | | Mr. Deems is a Trustee of ALPS ETF Trust (18 funds); ALPS Variable Investment Trust (9 funds) and Reaves Utility Income Fund (1 fund). |
|
Jerry G. Rutledge 1944 | | Trustee | | Mr. Rutledge was elected at a special meeting of shareholders held on August 7, 2009 | | Mr. Rutledge is the President and owner of Rutledge’s Inc., a retail clothing business. Mr. Rutledge is currently serving as a Director of the University of Colorado Hospital. Mr. Rutledge was from 1994 to 2007 a Regent of the University of Colorado. | | 30 | | Mr. Rutledge is a Trustee of Principal Real Estate Income Fund (1 fund), Clough Global Allocation Fund (1 fund), Clough Global Equity Fund (1 fund) and Clough Global Opportunities Fund (1 fund). |
|
| | |
| Annual Report | April 30, 2015 | | 37 |
| | |
| Seafarer Overseas Growth and Income Fund | | Trustees and Officers |
April 30, 2015 (Unaudited)
INDEPENDENT TRUSTEES
| | | | | | | | | | |
Name, Address* & Year of Birth | | Position(s) Held with Fund | | Term of Office and Length of Time Served** | | Principal Occupation(s) During Past 5 Years*** | | Number of Funds in Fund Complex
Overseen by
Trustee**** | | Other Directorships Held by Trustee During Past 5 Years |
|
Michael “Ross” Shell, 1970 | | Trustee | | Mr. Shell was elected at a special meeting of shareholders held on August 7, 2009 | | Mr. Shell is Founder and CEO of Red Idea, LLC, a strategic consulting/early stage venture firm (since June 2008). From 1999 to 2009, he was a part-owner and Director of Tesser, Inc., a brand agency. From December 2005 to May 2008, he was Director, Marketing and Investor Relations, of Woodbourne, a REIT/real estate hedge fund and private equity firm. Prior to this, from May 2004 to November 2005, he worked as a business strategy consultant; from June 2003 to April 2004, he was on the Global Client Services team of IDEO, a product design/innovation firm; and from 1999 to 2003, he was President of Tesser, Inc. Mr. Shell graduated with honors from Stanford University with a degree in Political Science. | | 30 | | None. |
|
| * | All communications to Trustees and Officers may be directed to Financial Investors Trust c/o 1290 Broadway, Suite 1100, Denver, CO 80203. |
| ** | This is the period for which the Trustee or Officer began serving the Trust. Each Trustee and/or Officer serves an indefinite term, until his successor is elected. |
| *** | Except as otherwise indicated, each individual has held the office shown or other offices in the same company for the last five years. |
| **** | The Fund Complex includes all series of the Trust (currently 30) and any other investment companies for which any Trustee serves as Trustee for and which Seafarer Capital Partners, LLC provides investment advisory services (currently none). |
| | |
| 38 | | (855) 732-9220 | seafarerfunds.com |
| | |
| Seafarer Overseas Growth and Income Fund | | Trustees and Officers |
April 30, 2015 (Unaudited)
INTERESTED TRUSTEE
| | | | | | | | | | |
Name, Address* & Year of Birth | | Position(s) Held with Fund | | Term of Office and Length of Time Served** | | Principal Occupation(s) During Past 5 Years*** | | Number of Funds in Fund Complex Overseen by Trustee**** | | Other Directorships Held by Trustee During Past 5 Years |
|
Edmund J. Burke, 1961 | | Trustee, Chairman and President | | Mr. Burke was elected as Chairman at the August 28, 2009 meeting of the Board of Trustees. Mr. Burke was elected as Trustee at a special meeting of shareholders held on August 7, 2009. Mr. Burke was elected President of the Trust at the December 17, 2002 meeting of the Board of Trustees. | | Mr. Burke is President and a Director of ALPS Holdings, Inc. (“AHI”) (since 2005) and Director of Boston Financial Data Services, Inc. (“BFDS”), ALPS Advisors, Inc. (“AAI”), ALPS Distributors, Inc. (“ADI”), ALPS Fund Services, Inc. (“AFS”) and ALPS Portfolio Solutions Distributor, Inc. (“APSD”) and from 2001-2008, was President of AAI, ADI, AFS and APSD. Because of his positions with AHI, BFDS, AAI, ADI, AFS and APSD, Mr. Burke is deemed an affiliate of the Trust as defined under the 1940 Act. Mr. Burke is Trustee and President of the Clough Global Allocation Fund (Trustee since 2006; President since 2004); Trustee and President of the Clough Global Equity Fund (Trustee since 2006; President since 2005); Trustee and President of the Clough Global Opportunities Fund (since 2006); Trustee of the Liberty All-Star Equity Fund; and Director of the Liberty All-Star Growth Fund, Inc. | | 35 | | Mr. Burke is a Trustee of Clough Global Allocation Fund (1 fund); Clough Global Equity Fund (1 fund); Clough Global Opportunities Fund (1 fund); Trustee of the Liberty All-Star Equity Fund (1 fund); and Director of the Liberty All-Star Growth Fund, Inc. (1 fund). |
|
| | |
| Annual Report | April 30, 2015 | | 39 |
| | |
| Seafarer Overseas Growth and Income Fund | | Trustees and Officers |
April 30, 2015 (Unaudited)
OFFICERS
| | | | | | |
Name, Address* & Year of Birth | | Position(s) Held with Fund | | Term of Office and Length of Time Served** | | Principal Occupation(s) During Past 5 Years*** |
|
Kimberly R. Storms, 1972 | | Treasurer | | Ms. Storms was elected Treasurer of the Trust at the March 12, 2013 meeting of the Board of Trustees. | | Ms. Storms is Senior Vice President and Director of Fund Administration of ALPS. Because of her position with ALPS, Ms. Storms is deemed an affiliate of the Trust as defined under the 1940 Act. Ms. Storms is also Treasurer of Liberty All-Star Equity Fund and Liberty All-Star Growth Fund, Inc. and Chief Financial Officer of The Arbitrage Funds. |
|
David T. Buhler, 1971 | | Secretary | | Mr. Buhler was elected Secretary of the Trust at the September 11, 2012 meeting of the Board of Trustees. | | Mr. Buhler joined ALPS in June 2010. He is currently Vice President and Senior Associate Counsel of ALPS, AAI, ADI and APSD. Prior to joining ALPS, Mr. Buhler served as Associate General Counsel and Assistant Secretary of Founders Asset Management LLC from 2006 to 2009. Because of his position with ALPS, Mr. Buhler is deemed an affiliate of the Trust as defined under the 1940 Act. Mr. Buhler is also the Secretary ALPS Variable Investment Trust, ALPS ETF Trust and Westcore Trust. |
|
Ted Uhl, 1974 | | Chief Compliance Officer (“CCO”) | | Mr. Uhl was appointed CCO of the Trust at the June 8, 2010 meeting of the Board of Trustees. | | Mr. Uhl joined ALPS in October 2006, and is currently Deputy Compliance Officer of ALPS. Prior to his current role, Mr. Uhl served as Senior Risk Manager for ALPS from October 2006 until June 2010. Because of his position with ALPS, Mr. Uhl is deemed an affiliate of the Trust as defined under the 1940 Act. Mr. Uhl is also CCO of the Clough Global Funds, Reaves Utility Income Fund, Centre Funds and Transparent Value Trust. |
|
| * | All communications to Trustees and Officers may be directed to Financial Investors Trust c/o 1290 Broadway, Suite 1100, Denver, CO 80203. |
| ** | This is the period for which the Trustee or Officer began serving the Trust. Each Trustee and/or Officer serves an indefinite term, until his successor is elected. |
| *** | Except as otherwise indicated, each individual has held the office shown or other offices in the same company for the last five years. |
| | |
| 40 | | (855) 732-9220 | seafarerfunds.com |

Seafarer Funds distributed by ALPS Distributors, Inc.
Must be accompanied or preceded by a prospectus.
Table of Contents
April 30, 2015
| | |
| Stonebridge Small-Cap Growth Fund | | Letter to Shareholders |
April 30, 2015 (Unaudited)
April 30, 2015
OVERVIEW
An unusually cold and snowy winter caused major disruptions to economic activity in the first quarter of 2015. Sound familiar? It’s a similar opening sentence we used for our shareholder letter last May. And, it appears there will be an analogous result; real economic contraction of Gross Domestic Product (GDP) in the first quarter. However, the overall U.S. economy is in much better shape than a year ago. The aggregate level of employment is higher, the labor participation rate is higher, real wages are higher and oil prices are lower. As such, we are constructive about the potential for economic growth in the U.S. for the remainder of the year. For small cap growth companies, the domestic economic outlook is key.
So far, 2015 has thematically been about two things: the strong performance of non-U.S. equity markets and volatile oil prices. Addressing the latter, the price of crude oil West Texas Intermediate (WTI) has rallied from the mid-$40s to over $60 a barrel as a result of accelerating worldwide demand for crude oil (global demand is estimated to have risen over 3% in the first quarter versus a year ago) and the declining growth of U.S. supplies. The Fund has prospered from this recent rally in crude oil prices as several of its investments have seen strong price appreciation. Regarding the global equity markets, vast quantitative easing and improved economic performance in select countries and regions have driven various local equity markets to multi-year highs. We are not surprised by either phenomenon.
Regarding updates in policy and trends, in late January, the European Central Bank (ECB) unveiled its bazooka and announced a 1 trillion euro bond-buying program whereby it would purchase 60 billion euros worth of bonds a month. Since the ECB’s quantitative easing announcement, European equity indices have been reaching successive new highs. On the other hand, the U.S. Federal Reserve is considering the opposite tact by possibly raising the Federal Funds Rate. However, as mentioned earlier, U.S. economic data remains mixed; presumably due to the harsh winter. Last, during the first quarter of 2015, the Broad Trade Weighted U.S. Dollar Index(1) reached a 10 year high, likely impeding the future growth potential of U.S. based multi-nationals. As such, while there has been a deviation in performance among domestic and foreign equity indices there has also been divergence within domestic equity indices; the Russell 2000 Growth Index(2) has performed best since smaller companies predominantly sell products to the domestic market as opposed to foreign markets.
The current global bond market is at an interesting juncture and is worthy of a few comments as it can affect a company’s access to capital. During the first quarter of 2015, particularly following the ECB quantitative easing announcement, European sovereign yield curves across Europe continued to shift lower as bond prices amongst all maturities rallied higher. For example, by the end of March, the nominal yield of a 10 year German bond was 18 basis points (0.18%). At the time, the spread between a 10 year German bond and 10 year U.S. Treasury Bond was in excess of 175 basis points. Despite the recent decline in the 10 year German Bond (recently quoted at over 70 basis points) the spread between U.S bonds and German bonds remains over 150 basis points. So, even if the Federal Reserve is compelled to raise the Federal Funds Rate in 2015 due to improved U.S. economic activity, a probable outcome is a flattening of the U.S. bond yield curve as higher, longer-dated U.S. bond yields feasibly attract foreign buyers. The yield curve both nominally and in slope can affect the equity markets including small cap growth companies.
| | |
| Annual Report | April 30, 2015 | | 1 |
| | |
| Stonebridge Small-Cap Growth Fund | | Letter to Shareholders |
April 30, 2015 (Unaudited)
While the Fund’s investments have recently performed well, the fiscal year 2015 was challenging. Our initial exposure to energy companies benefited the Fund as WTI crude oil prices eclipsed $100/barrel. However, we did not reduce exposure as oil prices dropped to the $50 level. Instead, we added appreciably to our positions believing that the drop would be temporary. As mentioned earlier, that conviction plus the increased weighting helped the Fund’s performance as oil prices rallied from the lows. Unfortunately, there was other derivative exposure to energy within our industrial names. Some of those positions also fared poorly through the fall in oil prices. However, the Fund has seen some redemption as one of our industrial holdings exposed to the energy business was taken private at a 60% premium.
STONEBRIDGE SMALL-CAP GROWTH FUND
For the fiscal year ending April 30, 2015, the Stonebridge Small-Cap Growth Fund fell by 3.83%. During this twelve month period, the Fund kept its sector allocations somewhat constant with the exception of the technology sector (increased exposure) and energy sector (increased exposure mid-year). Currently, the technology and health care sectors in combination are greater than 50% of the Fund’s exposure and as such remain key areas of focus for the Fund’s investment strategy, as the investment team continues to identify businesses that have strong growth profiles due to industry-leading innovation. The Fund continues to favor industrial companies with advanced technology in niche markets that benefit from long-term secular growth drivers. And while the Fund’s strategy remains cautious on the overall state of consumer spending, it does have investment positions in consumer companies with strong growth opportunities and market-leading positions.
Stonebridge Small-Cap Growth Fund (SBSGX) Sector Allocation
as a Percent of Net Assets as of April 30, 2015
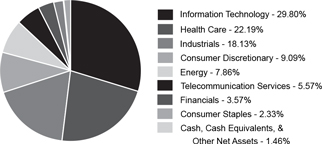
* These allocations may not reflect the current or future position of the portfolio.
| | |
| 2 | | Stonebridge Small-Cap Growth Fund |
| | |
| Stonebridge Small-Cap Growth Fund | | Letter to Shareholders |
April 30, 2015 (Unaudited)
Change in value of a $10,000 investment in Stonebridge Small-Cap
Growth Fund (SBSGX) vs. the Russell 2000® Growth Index and
the S&P 500 Total Return Index from April 30, 2005 to April 30, 2015
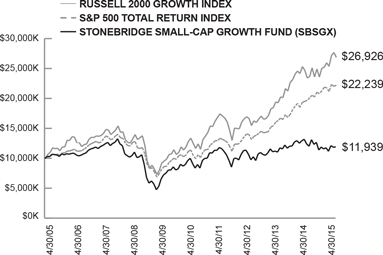
Average Annual Total Returns for the Years Ended April 30, 2015
| | | | | | | | | | | | |
| | | 1 Year | | | 5 Years | | | 10 Years | |
Stonebridge Small-Cap Growth Fund (SBSGX) | | | -3.83% | | | | 3.55% | | | | 1.79% | |
Russell 2000® Growth Index(2) | | | 14.65% | | | | 14.94% | | | | 10.41% | |
S&P 500® Total Return Index(3) | | | 12.98% | | | | 14.33% | | | | 8.32% | |
Average annual total returns reflect reinvestment of all dividends and capital gains distributions, any fee waivers in effect and any expense reimbursements. Without the fee waivers and expense reimbursements, the total return figures would be lower. Past performance is not indicative of future results and current performance may be lower or higher than the performance quoted. Investment return and principal value will fluctuate and shares, when redeemed, may be worth more or less than their original cost. The total returns shown do not reflect the deduction of taxes that a shareholder would pay on fund distributions or the redemption of fund shares. To obtain the most recent month-end performance, please call the Fund’s toll-free number at 1-800-639-3935.
Effective as of the close of business February 15, 2013, Stonebridge Small-Cap Growth Fund (SBAGX) (the “Acquired Fund”) and Stonebridge Institutional Small-Cap Growth Fund (SBSCX) (the “Acquiring Fund”), each a series of Stonebridge Funds Trust were reorganized into a newly created fund, which is named the Stonebridge Small-Cap Growth Fund (SBSGX) (the “Fund”), under the Financial Investors Trust. The Fund’s performance for periods prior to the close of business February 15, 2013 is that of the Acquiring Fund.
As of the Prospectus dated August 31, 2014, the gross annual expense ratio for the Stonebridge Small-Cap Growth Fund was 2.25%. At April 30, 2015, the Fund’s gross annual expense ratio was 2.12%.
| | |
| Annual Report | April 30, 2015 | | 3 |
| | |
| Stonebridge Small-Cap Growth Fund | | Letter to Shareholders |
April 30, 2015 (Unaudited)
CONCLUSION
In managing the Fund in accordance with its strategy, we seek to identify strong businesses that we believe exhibit competitive advantages, growing market share, and healthy balance sheets, and that are poised to rapidly grow earnings in excess of market expectations. We are positioning the Fund toward those businesses and economic sectors that we believe contain the best opportunities for future growth and investment returns. Although we are most excited about the outlook for technology, health care and energy companies, we believe that we will continue to find opportunities for the Fund across sectors that can deliver solid performance results for shareholders.
Sincerely,
Richard C. Barrett, CFA
Matthew W. Markatos, CFA
Portfolio Managers
Performance quoted above represents past performance. Past Performance does not guarantee future results.
The views and information discussed in this commentary are as of the date of publication, are subject to change, and may not reflect the writer’s current views. The views expressed represent an assessment of market conditions at a specific point in time, are opinions only and should not be relied upon as investment advice regarding a particular investment or markets in general. Such information does not constitute a recommendation to buy or sell specific securities or investment vehicles. It should not be assumed that any investment will be profitable or will equal the performance of the portfolios or any securities or any sectors mentioned in this letter. The subject matter contained in this letter has been derived from several sources believed to be reliable and accurate at the time of compilation. Neither Stonebridge Capital Management, Inc. nor the Fund accepts any liability for losses either direct or consequential caused by the use of this information.
The Stonebridge Small-Cap Growth Fund is distributed by ALPS Distributors, Inc.
| | |
| 4 | | Stonebridge Small-Cap Growth Fund |
| | |
| Stonebridge Small-Cap Growth Fund | | Letter to Shareholders |
April 30, 2015 (Unaudited)
DEFINITIONS:
| (1) | The Broad Trade-Weighted US Dollar Index, also known as the Broad Index, is a measure of the value of the United States dollar relative to other world currencies. It is similar to the U.S. Dollar Index in that its numerical value is determined as a weighted average of the price of various currencies relative to the dollar, but different currencies are used and relative values are weighted differently. The Index is not actively managed and does not reflect any deductions for fees, expenses or taxes. An investor may not invest directly in the Index. |
| (2) | The Russell 2000® Growth Index is an unmanaged index that measures the performance of those Russell 2000® Index companies with higher price-to-book ratios and higher forecasted growth values. The Russell 2000® Index measures the performance of the 2,000 smallest companies in the Russell 3000® Index, which measures the performance of the 3,000 largest U.S. companies in terms of market capitalization. The Russell 2000® Growth Index is constructed to provide a comprehensive and unbiased barometer of the small-cap growth market. This is a total return index which reflects the reinvestment of income dividends and capital gain distributions, if any, but does not reflect fees, brokerage commissions, or other expenses of investing. The Index is not actively managed and does not reflect any deductions for fees, expenses or taxes. An investor may not invest directly in the Index. |
| (3) | The S&P 500® Total Return Index is an unmanaged index of 500 common stocks chosen for the market size, liquidity and industry group representation. It is a market-value weighted index. The Index is not actively managed and does not reflect any deduction for fees, expenses or taxes. An investor may not invest directly into the Index. |
Quantitative Easing - An unconventional monetary policy in which a central bank purchases government securities or other securities from the market in order to lower interest rates and increase the money supply.
Nominal Yields - The coupon rate on a bond. The nominal yield is the interest rate (to par value) that the bond issuer promises to pay bond purchasers. This rate is fixed and applies to the life of the bond. Nominal yield is sometimes referred to as nominal rate, coupon yield or coupon rate.
Sovereign Yield Curve - A line that plots the interest rates, at a set point in time, of bonds having equal credit quality, but differing maturity dates.
| | |
| Annual Report | April 30, 2015 | | 5 |
| | |
| Stonebridge Small-Cap Growth Fund | | Disclosure of Fund Expenses |
April 30, 2015 (Unaudited)
As a shareholder of a Fund, you incur two types of costs: (1) transaction costs (such as the 2% fee on redemption of Fund shares made within 30 days of purchase); and (2) ongoing costs, including management fees and other Fund expenses. The following examples are intended to help you understand your ongoing costs (in dollars) of investing in a Fund and to compare these costs with the ongoing costs of investing in other mutual funds. The examples are based on an investment of $1,000 invested on November 1, 2014 and held until April 30, 2015.
Actual Return — The first line of the following tables provides information about actual account values and actual expenses. You may use the information in this line, together with the amount you invested, to estimate the expenses that you paid over the period. Simply divide your account value by $1,000 (for example, an $8,600 account value divided by $1,000 = 8.6), then multiply the result by the number in the first line under the heading “Expense Paid During Period” to estimate the expenses you paid on your account during this period.
Hypothetical 5% Return — The second line of the following tables provides information about hypothetical account values and hypothetical expenses based on each Fund’s actual expense ratio and an assumed rate of return of 5% per year before expenses, which is not the Fund’s actual return. The hypothetical account values and expenses may not be used to estimate the actual ending account balance or expenses you paid for the period. You may use this information to compare the ongoing costs of investing in a Fund and other mutual funds. To do so, compare this 5% hypothetical example with the 5% hypothetical examples that appear in the shareholder reports of the other funds.
The expenses shown in the table are meant to highlight ongoing Fund costs only and do not reflect transaction fees, such as redemption fees. Therefore, the second line of the table is useful in comparing ongoing costs only, and may not help you determine the relative total costs of owning different funds. If the transaction fees were included, your costs would be higher.
Stonebridge Small-Cap Growth Fund
| | | | | | | | | | | | | | | | | | | | |
| | | Beginning Account
Value at 11/01/14 | | Ending Account
Value at 4/30/15 | | Expense Ratio(1) | | Expense Paid
During Period
11/01/14 to
4/30/15(2) |
Actual Fund Return | | | $ | 1,000.00 | | | | $ | 1,003.20 | | | | | 2.17 | % | | | $ | 10.78 | |
Hypothetical Fund Return | | | | | | | | | | | | | | | | | | | | |
(5% return before expenses) | | | $ | 1,000.00 | | | | $ | 1,014.03 | | | | | 2.17 | % | | | $ | 10.84 | |
| (1) | The Fund’s expense ratios have been annualized based on the Fund’s most recent fiscal half-year expenses. |
| (2) | Expenses are equal to the Fund’s annualized expense ratio multiplied by the average account value over the period, multiplied by the number of days in the most recent fiscal half-year (181)/365 (to reflect the half-year period). |
| | |
| 6 | | Stonebridge Small-Cap Growth Fund |
| | |
| Stonebridge Small-Cap Growth Fund | | Statement of Investments |
April 30, 2015
| | | | | | | | |
| | | Shares | | | Market Value | |
COMMON STOCKS (98.54%) | | | | | | | | |
CONSUMER DISCRETIONARY - (9.09%) | | | | | | | | |
Diversified Consumer Services (0.97%) | | | | | | | | |
Steiner Leisure, Ltd.** | | | 3,300 | | | $ | 159,192 | |
| | | | | | | | |
| | |
Hotels, Restaurants & Leisure (4.16%) | | | | | | | | |
Belmond Ltd. - Class A** | | | 19,000 | | | | 234,080 | |
Interval Leisure Group, Inc. | | | 18,000 | | | | 446,220 | |
| | | | | | | | |
| | | | | | | 680,300 | |
| | | | | | | | |
Household Durables (0.85%) | | | | | | | | |
Meritage Homes Corp.** | | | 3,250 | | | | 139,003 | |
| | | | | | | | |
| | |
Media (2.17%) | | | | | | | | |
MDC Partners, Inc. - Class A | | | 17,000 | | | | 355,980 | |
| | | | | | | | |
| | |
Specialty Retail (0.94%) | | | | | | | | |
Select Comfort Corp.** | | | 5,000 | | | | 154,100 | |
| | | | | | | | |
| | |
TOTAL CONSUMER DISCRETIONARY | | | | | | | 1,488,575 | |
| | | | | | | | |
| | |
CONSUMER STAPLES - (2.33%) | | | | | | | | |
Food & Staples Retailing (2.33%) | | | | | | | | |
Chefs’ Warehouse, Inc.** | | | 21,000 | | | | 382,410 | |
| | | | | | | | |
| | |
TOTAL CONSUMER STAPLES | | | | | | | 382,410 | |
| | | | | | | | |
| | |
ENERGY - (7.86%) | | | | | | | | |
Energy Equipment & Services (4.43%) | | | | | | | | |
Rowan Cos. PLC - Class A | | | 15,000 | | | | 317,850 | |
Superior Energy Services, Inc. | | | 6,500 | | | | 165,750 | |
US Silica Holdings, Inc. | | | 6,500 | | | | 242,775 | |
| | | | | | | | |
| | | | | | | 726,375 | |
| | | | | | | | |
Oil, Gas & Consumable Fuels (3.43%) | | | | | | | | |
Denbury Resources, Inc. | | | 37,000 | | | | 325,970 | |
Sanchez Energy Corp.** | | | 16,000 | | | | 235,040 | |
| | | | | | | | |
| | | | | | | 561,010 | |
| | | | | | | | |
TOTAL ENERGY | | | | | | | 1,287,385 | |
| | | | | | | | |
See Notes to Financial Statements.
| | |
| Annual Report | April 30, 2015 | | 7 |
| | |
| Stonebridge Small-Cap Growth Fund | | Statement of Investments |
April 30, 2015
| | | | | | | | |
| | | Shares | | | Market Value | |
FINANCIALS - (3.57%) | | | | | | | | |
Capital Markets (3.57%) | | | | | | | | |
Fifth Street Asset Management, Inc. | | | 53,000 | | | $ | 584,590 | |
| | | | | | | | |
| | |
TOTAL FINANCIALS | | | | | | | 584,590 | |
| | | | | | | | |
| | |
HEALTH CARE - (22.19%) | | | | | | | | |
Biotechnology (6.78%) | | | | | | | | |
ACADIA Pharmaceuticals, Inc.** | | | 5,000 | | | | 170,850 | |
Exact Sciences Corp.** | | | 11,500 | | | | 240,350 | |
Genomic Health, Inc.** | | | 20,000 | | | | 541,400 | |
Sarepta Therapeutics, Inc.** | | | 13,000 | | | | 158,600 | |
| | | | | | | | |
| | | | | | | 1,111,200 | |
| | | | | | | | |
Health Care Equipment & Supplies (2.66%) | | | | | | | | |
Masimo Corp.** | | | 6,000 | | | | 202,560 | |
Merit Medical Systems, Inc.** | | | 12,000 | | | | 232,920 | |
| | | | | | | | |
| | | | | | | 435,480 | |
| | | | | | | | |
Health Care Technology (5.85%) | | | | | | | | |
HMS Holdings Corp.** | | | 26,500 | | | | 450,765 | |
Quality Systems, Inc. | | | 32,500 | | | | 506,837 | |
| | | | | | | | |
| | | | | | | 957,602 | |
| | | | | | | | |
Life Sciences Tools & Services (3.98%) | | | | | | | | |
Luminex Corp.** | | | 42,000 | | | | 651,840 | |
| | | | | | | | |
| | |
Medical & Dental Instruments & Supplies (2.92%) | | | | | | | | |
Trinity Biotech PLC - Sponsored ADR | | | 28,500 | | | | 477,945 | |
| | | | | | | | |
| | |
TOTAL HEALTH CARE | | | | | | | 3,634,067 | |
| | | | | | | | |
| | |
INDUSTRIALS - (18.13%) | | | | | | | | |
Commercial Services & Supplies (2.27%) | | | | | | | | |
Performant Financial Corp.** | | | 125,000 | | | | 371,250 | |
| | | | | | | | |
| | |
Construction & Engineering (5.80%) | | | | | | | | |
Aegion Corp.** | | | 17,000 | | | | 313,140 | |
Great Lakes Dredge & Dock Corp.** | | | 64,708 | | | | 375,306 | |
KBR, Inc. | | | 15,000 | | | | 262,050 | |
| | | | | | | | |
| | | | | | | 950,496 | |
| | | | | | | | |
Machinery (6.26%) | | | | | | | | |
Adept Technology, Inc.** | | | 23,000 | | | | 140,530 | |
Chart Industries, Inc.** | | | 6,250 | | | | 253,437 | |
Energy Recovery, Inc.** | | | 50,000 | | | | 148,500 | |
Woodward, Inc. | | | 10,250 | | | | 482,263 | |
| | | | | | | | |
| | | | | | | 1,024,730 | |
| | | | | | | | |
See Notes to Financial Statements.
| | |
| 8 | | Stonebridge Small-Cap Growth Fund |
| | |
| Stonebridge Small-Cap Growth Fund | | Statement of Investments |
April 30, 2015
| | | | | | | | |
| | | Shares | | | Market Value | |
INDUSTRIALS (continued) | | | | | | | | |
Professional Services (2.14%) | | | | | | | | |
Mistras Group, Inc.** | | | 19,500 | | | $ | 350,220 | |
| | | | | | | | |
| | |
Road & Rail (1.66%) | | | | | | | | |
Quality Distribution, Inc.** | | | 27,500 | | | | 272,800 | |
| | | | | | | | |
| | |
TOTAL INDUSTRIALS | | | | | | | 2,969,496 | |
| | | | | | | | |
| | |
INFORMATION TECHNOLOGY - (29.80%) | | | | | | | | |
Electronic Equipment, Instruments & Components (1.10%) | | | | | | | | |
DTS, Inc.** | | | 5,000 | | | | 179,250 | |
| | | | | | | | |
| | |
Internet Software & Services (10.15%) | | | | | | | | |
Cornerstone OnDemand, Inc.** | | | 16,500 | | | | 472,395 | |
Dealertrack Technologies, Inc.** | | | 13,000 | | | | 511,030 | |
Marin Software, Inc.** | | | 80,000 | | | | 483,200 | |
SPS Commerce, Inc.** | | | 3,000 | | | | 195,780 | |
| | | | | | | | |
| | | | | | | 1,662,405 | |
| | | | | | | | |
IT Services (0.87%) | | | | | | | | |
ServiceSource International, Inc.** | | | 40,000 | | | | 142,800 | |
| | | | | | | | |
| | |
Semiconductors & Semiconductor Equipment (7.17%) | | | | | | | | |
Applied Micro Circuits Corp.** | | | 110,000 | | | | 590,700 | |
EZchip Semiconductor, Ltd.** | | | 30,000 | | | | 583,800 | |
| | | | | | | | |
| | | | | | | 1,174,500 | |
| | | | | | | | |
Software (10.51%) | | | | | | | | |
Callidus Software, Inc.** | | | 45,500 | | | | 561,925 | |
Jive Software, Inc.** | | | 95,000 | | | | 511,100 | |
PTC, Inc.** | | | 4,750 | | | | 182,115 | |
Tangoe, Inc.** | | | 34,057 | | | | 465,900 | |
| | | | | | | | |
| | | | | | | 1,721,040 | |
| | | | | | | | |
TOTAL INFORMATION TECHNOLOGY | | | | | | | 4,879,995 | |
| | | | | | | | |
| | |
TELECOMMUNICATION SERVICES - (5.57%) | | | | | | | | |
Diversified Telecommunication Services (5.57%) | | | | | | | | |
8x8, Inc.** | | | 65,500 | | | | 571,815 | |
Cogent Communications Holdings, Inc. | | | 9,750 | | | | 341,153 | |
| | | | | | | | |
| | |
TOTAL TELECOMMUNICATION SERVICES | | | | | | | 912,968 | |
| | | | | | | | |
| | |
TOTAL COMMON STOCKS | | | | | | | | |
(Cost $15,812,378) | | | | | | | 16,139,486 | |
| | | | | | | | |
See Notes to Financial Statements.
| | |
| Annual Report | April 30, 2015 | | 9 |
| | |
| Stonebridge Small-Cap Growth Fund | | Statement of Investments |
April 30, 2015
| | | | | | | | |
| | | Shares | | | Market Value | |
| | |
MONEY MARKET MUTUAL FUNDS (0.08%) | | | | | | | | |
Fidelity® Institutional Money Market | | | | | | | | |
Government Portfolio - Class I | | | | | | | | |
(0.01% 7 Day Yield) | | | 12,558 | | | $ | 12,558 | |
| | | | | | | | |
| | |
TOTAL MONEY MARKET MUTUAL FUNDS | | | | | | | | |
(Cost $12,558) | | | | | | | 12,558 | |
| | | | | | | | |
| | |
TOTAL INVESTMENTS (98.62%) | | | | | | | | |
(Cost $15,824,936) | | | | | | $ | 16,152,044 | |
OTHER ASSETS IN EXCESS OF LIABILITIES (1.38%) | | | | | | | 225,753 | |
| | | | | | | | |
NET ASSETS (100.00%) | | | | | | $ | 16,377,797 | |
| | | | | | | | |
| ** | Non-Income Producing Security. |
Common Abbreviations:
ADR - American Depositary Receipt.
Ltd. - Limited.
PLC - Public Limited Company.
Holdings are subject to change.
For Fund compliance purposes, the Fund’s industry classifications refer to any one or more of the industry sub-classifications used by one or more widely recognized market indexes or ratings group indexes, and/or as defined by Fund management. This definition may not apply for purposes of this report, which may combine industry sub-classifications for reporting ease. Industries are shown as a percentage of net assets.
See Notes to Financial Statements.
| | |
| 10 | | Stonebridge Small-Cap Growth Fund |
| | |
| Stonebridge Small-Cap Growth Fund | | Statement of Assets and Liabilities |
April 30, 2015 |
| | | | |
ASSETS: | | | | |
Investments, at value | | $ | 16,152,044 | |
Receivable for investments sold | | | 790,574 | |
Dividends receivable | | | 1,084 | |
Prepaid and other assets | | | 7,497 | |
| | | | |
Total assets | | | 16,951,199 | |
| | | | |
| |
LIABILITIES: | | | | |
Payable for investments purchased | | | 514,647 | |
Payable for fund shares redeemed | | | 2,170 | |
Advisory fees payable | | | 10,332 | |
Administration and fund accounting fees payable | | | 7,157 | |
Payable for transfer agent fees | | | 12,669 | |
Payable for professional fees | | | 15,573 | |
Payable for trustee fees and expenses | | | 155 | |
Payable for chief compliance officer fees | | | 1,761 | |
Accrued expenses and other liabilities | | | 8,938 | |
| | | | |
Total liabilities | | | 573,402 | |
| | | | |
Net Assets | | $ | 16,377,797 | |
| | | | |
| |
COMPOSITION OF NET ASSETS: | | | | |
Paid-in capital (Note 5) | | $ | 16,751,718 | |
Accumulated net investment loss | | | (88,332) | |
Accumulated net realized loss on investments | | | (612,697) | |
Net unrealized appreciation in value of investments | | | 327,108 | |
| | | | |
Net Assets | | $ | 16,377,797 | |
| | | | |
| |
NET ASSET VALUE PER SHARE: | | | | |
Net Assets | | $ | 16,377,797 | |
Shares outstanding | | | 1,957,899 | |
Net asset value and redemption price per share* | | $ | 8.36 | |
| | | | |
| |
Investments, at cost | | $ | 15,824,936 | |
| | | | |
| * | A charge of 2% is imposed on the redemption proceeds of shares held 30 days or less (Note 5). |
See Notes to Financial Statements.
| | |
| Annual Report | April 30, 2015 | | 11 |
| | |
| Stonebridge Small-Cap Growth Fund | | Statement of Operations |
For the Year Ended April 30, 2015 |
| | | | |
INCOME: | | | | |
Dividends | | $ | 68,481 | |
Foreign taxes withheld on dividends | | | (1,059) | |
| | | | |
Total Income | | | 67,422 | |
| | | | |
| |
EXPENSES: | | | | |
Investment advisory fees (Note 6) | | | 129,484 | |
Administration fees | | | 77,277 | |
Transfer agent fees | | | 72,519 | |
Fund accounting fees and expenses | | | 3,653 | |
Custodian fees | | | 5,000 | |
Professional fees | | | 21,001 | |
Printing fees | | | 9,394 | |
Registration fees | | | 10,150 | |
Trustee fees and expenses | | | 528 | |
Chief compliance officer fees | | | 20,608 | |
Insurance | | | 291 | |
Other | | | 15,996 | |
| | | | |
Total Expenses | | | 365,901 | |
| | | | |
Net Investment Loss | | | (298,479) | |
| | | | |
| |
REALIZED AND UNREALIZED GAIN/(LOSS) ON INVESTMENTS: | | | | |
Net realized loss on investments | | | (505,161) | |
Change in net unrealized appreciation of investments | | | 110,963 | |
| | | | |
Net Realized and Unrealized Loss on Investments | | | (394,198) | |
| | | | |
Net Decrease in Net Assets Resulting From Operations | | $ | (692,677) | |
| | | | |
See Notes to Financial Statements.
| | |
| 12 | | Stonebridge Small-Cap Growth Fund |
| | |
| Stonebridge Small-Cap Growth Fund | | Statements of Changes in Net Assets |
|
| | | | | | | | |
| | | For the Year Ended
April 30, 2015 | | | For the Year Ended
April 30, 2014 | |
OPERATIONS: | | | | | | | | |
Net investment loss | | $ | (298,479) | | | $ | (399,846) | |
Net realized gain/(loss) on investments | | | (505,161) | | | | 2,637,902 | |
Change in net unrealized appreciation/(depreciation) of investments | | | 110,963 | | | | (82,960) | |
| | | | |
Increase/(Decrease) in Net Assets Resulting from Operations | | | (692,677) | | | | 2,155,096 | |
| | | | |
| | |
DISTRIBUTIONS (Note 3): | | | | | | | | |
From net realized gains | | | (1,202,412) | | | | (746,920) | |
| | | | |
Total distributions | | | (1,202,412) | | | | (746,920) | |
| | | | |
| | |
CAPITAL SHARE TRANSACTIONS (NOTE 5): | | | | | | | | |
Net decrease in shareholder activity derived from beneficial interest transactions, net of redemption fees | | | (431,599) | | | | (545,370) | |
| | | | |
| | |
NET INCREASE/(DECREASE) IN NET ASSETS | | | (2,326,688) | | | | 862,806 | |
| | |
NET ASSETS: | | | | | | | | |
Beginning of period | | | 18,704,485 | | | | 17,841,679 | |
| | | | |
End of period* | | $ | 16,377,797 | | | $ | 18,704,485 | |
| | | | |
| | |
* Includes accumulated net investment loss of: | | $ | (88,332) | | | $ | – | |
See Notes to Financial Statements.
| | |
| Annual Report | April 30, 2015 | | 13 |
| | |
| Stonebridge Small-Cap Growth Fund | | |
For a share outstanding through the periods presented |
|
|
|
PER SHARE DATA |
Net asset value, beginning of period |
|
INCOME/(LOSS) FROM INVESTMENT OPERATIONS: |
Net investment loss |
Net realized and unrealized gain/(loss) on investments |
Total Income/(Loss) from Investment Operations |
|
DISTRIBUTIONS TO SHAREHOLDERS: |
From net realized gain on investments |
Total Distributions to Shareholders |
Net Increase/(Decrease) in Net Asset Value |
Net asset value, end of period |
Total Return |
|
Ratios & Supplemental Data: |
Net assets, end of period (in 000s) |
Ratios to average net assets: |
Expenses (excluding fee waivers) |
Expenses (including fee waivers) |
Net investment loss (including fee waivers) |
Portfolio Turnover Rate(5) |
| (1) | The Fund’s fiscal year end changed from October 31st to April 30th. See Note 1. |
| (2) | Calculated using the average shares method. |
| (3) | Total return not annualized for periods less than one full year. |
| (5) | Portfolio turnover rate for periods less than one full year have not been annualized. |
See Notes to Financial Statements.
| | |
| 14 | | Stonebridge Small-Cap Growth Fund |
Financial Highlights
| | | | | | | | | | | | | | | | | | | | | | |
Year Ended
April 30, 2015 | | | Year Ended
April 30, 2014 | | | Six Months
Ended April 30,
2013(1) | | | Year Ended
October 31,
2012 | | | Year Ended
October 31,
2011 | | | Year Ended
October 31,
2010 | |
| | |
| | | | | | | | | | | | | | | | | | | | | | | |
| | $9.42 | | | | $8.74 | | | | $8.42 | | | | $7.90 | | | | $7.91 | | | | $6.38 | |
| | |
| | | | | |
| | | | | | | | | | | | | | | | | | | | | | | |
| | (0.15)(2) | | | | (0.20)(2) | | | | (0.15)(2) | | | | (0.30) | | | | (0.26) | | | | (0.24) | |
| | (0.27) | | | | 1.26 | | | | 0.47 | | | | 0.82 | | | | 0.25 | | | | 1.77 | |
| | |
| | (0.42) | | | | 1.06 | | | | 0.32 | | | | 0.52 | | | | (0.01) | | | | 1.53 | |
| | |
| | | | | |
| | | | | | | | | | | | | | | | | | | | | | | |
| | (0.64) | | | | (0.38) | | | | – | | | | – | | | | – | | | | – | |
| | |
| | (0.64) | | | | (0.38) | | | | – | | | | – | | | | – | | | | – | |
| | |
| | (1.06) | | | | 0.68 | | | | 0.32 | | | | 0.52 | | | | (0.01) | | | | 1.53 | |
| | |
| | $8.36 | | | | $9.42 | | | | $8.74 | | | | $8.42 | | | | $7.90 | | | | $7.91 | |
| | |
| | (3.83)% | | | | 12.20% | | | | 3.80%(3) | | | | 6.58% | | | | (0.13)% | | | | 23.98% | |
| | |
| | | | | |
| | | | | | | | | | | | | | | | | | | | | | | |
| | $16,378 | | | | $18,704 | | | | $17,842 | | | | $12,673 | | | | $12,457 | | | | $13,492 | |
| | |
| | | | | | | | | | | | | | | | | | | | | | | |
| | N/A | | | | N/A | | | | N/A | | | | N/A | | | | N/A | | | | 3.48% | |
| | |
| | 2.12% | | | | 2.25% | | | | 3.86%(4) | | | | 3.89% | | | | 3.36% | | | | 3.40% | |
| | |
| | (1.73)% | | | | (2.09)% | | | | (3.52)%(4) | | | | (3.58)% | | | | (2.96)% | | | | (3.19)% | |
| | |
| | 138% | | | | 152% | | | | 89% | | | | 222% | | | | 195% | | | | 115% | |
| | |
| | |
| Annual Report | April 30, 2015 | | 15 |
| | |
| Stonebridge Small-Cap Growth Fund | | Notes to Financial Statements |
April 30, 2015 |
1. ORGANIZATION
Financial Investors Trust (the “Trust”), a Delaware statutory trust, is an open-end management investment company registered under the Investment Company Act of 1940, as amended (“1940 Act”). As of April 30, 2015, the Trust had 30 registered funds. This annual report describes the Stonebridge Small-Cap Growth Fund (prior to the close of business on February 15, 2013 known as the Stonebridge Institutional Small-Cap Growth Fund) (the “Fund”). The Fund seeks long-term growth of capital.
The Fund is a successor to a previously operational fund which was a series of the Stonebridge Funds Trust, a Delaware statutory trust, and was organized into a series of the Trust effective as of the close of business on February 15, 2013. As a result, the Fund’s fiscal year end changed from October 31 to April 30.
2. SIGNIFICANT ACCOUNTING POLICIES
The accompanying financial statements were prepared in accordance with accounting principles generally accepted in the United States of America (“U.S. GAAP”). The preparation of financial statements in conformity with U.S. GAAP requires management to make certain estimates and assumptions that affect the reported amounts of assets and liabilities and disclosures of contingent assets and liabilities at the date of the financial statements and the reported amounts of revenue and expenses during the period. Actual results could differ from those estimates. The Fund is considered an investment company for financial reporting purposes under U.S. GAAP. The following is a summary of significant accounting policies consistently followed by the Fund in preparation of its financial statements.
Investment Valuation: The Fund generally values its securities based on market prices determined at the close of regular trading on the New York Stock Exchange (“NYSE”), normally 4:00 p.m. Eastern Time, on each day the NYSE is open for trading.
For equity securities and mutual funds that are traded on an exchange, the market price is usually the closing sale or official closing price on that exchange. In the case of equity securities not traded on an exchange, or if such closing prices are not otherwise available, the securities are valued at the mean of the most recent bid and ask prices on such day. Redeemable securities issued by open-end registered investment companies are valued at the investment company’s applicable net asset value, with the exception of exchange-traded open-end investment companies, which are priced as equity securities.
Short–term debt obligations that will mature in 60 days or less are valued at amortized cost, unless it is determined that using this method would not reflect an investment’s fair value. Investments in non-exchange traded funds are fair valued at their respective net asset values.
When such prices or quotations are not available, or when the Fair Value Committee appointed by the Board of Trustees (the “Board”) believes that they are unreliable, securities may be priced using fair value procedures approved by the Board.
Fair Value Measurements: The Fund discloses the classification of its fair value measurements following a three-tier hierarchy based on the inputs used to measure fair value. Inputs refer broadly to the assumptions that market participants would use in pricing the asset or liability, including assumptions about risk. Inputs may be observable or unobservable. Observable inputs
| | |
| 16 | | Stonebridge Small-Cap Growth Fund |
| | |
| Stonebridge Small-Cap Growth Fund | | Notes to Financial Statements |
April 30, 2015
reflect the assumptions market participants would use in pricing the asset or liability that are developed based on market data obtained from sources independent of the reporting entity.
Unobservable inputs reflect the reporting entity’s own assumptions about the assumptions market participants would use in pricing the asset or liability that are developed based on the best information available.
Various inputs are used in determining the value of the Fund’s investments as of the end of the reporting period. When inputs used fall into different levels of the fair value hierarchy, the level in the hierarchy within which the fair value measurement falls is determined based on the lowest level input that is significant to the fair value measurement in its entirety. The designated input levels are not necessarily an indication of the risk or liquidity associated with these investments. These inputs are categorized in the following hierarchy under applicable financial accounting standards:
| | |
Level 1 – | | Unadjusted quoted prices in active markets for identical investments, unrestricted assets or liabilities that the Fund has the ability to access at the measurement date; |
| |
Level 2 – | | Quoted prices which are not active, quoted prices for similar assets or liabilities in active markets or inputs other than quoted prices that are observable (either directly or indirectly) for substantially the full term of the asset or liability; and |
| |
Level 3 – | | Significant unobservable prices or inputs (including the Fund’s own assumptions in determining the fair value of investments) where there is little or no market activity for the asset or liability at the measurement date. |
The following is a summary of each input used to value the Fund as of April 30, 2015:
| | | | | | | | | | | | | | | | |
| | | Valuation Inputs | | | | |
| | | | | | | | |
| Investments in Securities at Value | | Level 1 | | | Level 2 | | | Level 3 | | | Total | |
| |
Common Stocks* | | $ | 16,139,486 | | | $ | – | | | $ | – | | | $ | 16,139,486 | |
Money Market Mutual Funds | | | 12,558 | | | | – | | | | – | | | | 12,558 | |
| |
Total | | $ | 16,152,044 | | | $ | – | | | $ | – | | | $ | 16,152,044 | |
| |
| * | For detailed descriptions, see the accompanying Statement of Investments. |
The Fund recognizes transfers between levels as of the end of the period. For the year ended April 30, 2015, the Fund did not have any transfers between Level 1 and Level 2 securities. For the year ended April 30, 2015, the Fund did not have any securities that used significant unobservable inputs (Level 3) in determining fair value.
Investment Transactions and Investment Income: Investment transactions are accounted for on the date the investments are purchased or sold (trade date). Realized gains and losses from investment transactions are reported on an identified cost basis. Interest income, which includes accretion of discounts, is accrued and recorded as earned. Dividend income is recognized on the ex-dividend date or for certain foreign securities, as soon as information is available to the Fund.
Trust Expenses: Some expenses of the Trust can be directly attributed to the Fund. Expenses which cannot be directly attributed to the Fund are apportioned among all funds in the Trust based on average net assets of each fund.
| | |
| Annual Report | April 30, 2015 | | 17 |
| | |
| Stonebridge Small-Cap Growth Fund | | Notes to Financial Statements |
April 30, 2015
Fund Expenses: Expenses that are specific to the Fund are charged directly to the Fund.
Federal Income Taxes: The Fund complies with the requirements under Subchapter M of the Internal Revenue Code of 1986, as amended (the “Code”), applicable to regulated investment companies and intends to distribute substantially all of their net taxable income and net capital gains, if any, each year so that it will not be subject to excise tax on undistributed income and gains. The Fund is not subject to income taxes to the extent such distributions are made.
As of and during the year ended April 30, 2015, the Fund did not have a liability for any unrecognized tax benefits. The Fund files U.S. federal, state, and local tax returns as required. The Fund’s tax returns are subject to examination by the relevant tax authorities until expiration of the applicable statute of limitations, which is generally three years after the filing of the tax return for federal purposes and four years for most state returns. Tax returns for open years have incorporated no uncertain tax positions that require a provision for income taxes.
Distributions to Shareholders: The Fund normally pays dividends and distributes capital gains, if any, on an annual basis. Income dividend distributions are derived from interest and other income the Fund receives from its investments, including short term capital gains. Long term capital gain distributions are derived from gains realized when the Fund sells a security it has owned for more than a year. The Fund may make additional distributions and dividends at other times if the portfolio manager believes doing so may be necessary for the Fund to avoid or reduce taxes.
3. TAX BASIS INFORMATION
Reclassifications: As of April 30, 2015, permanent differences on book and tax accounting were reclassified. These differences had no effect on net assets and were primarily attributed to the differing treatment of a net investment loss. These reclassifications were as follows:
| | | | |
Undistributed Net Investment Income | | $ | 210,147 | |
Accumulated Net Gain on Investments | | | 17 | |
Paid-in Capital | | | (210,164) | |
Included in those amounts reclassified was a net operating loss offset to Paid-in capital in the amount of $210,147.
Tax Basis of Investments: As of April 30, 2015, the aggregate cost of investments, gross unrealized appreciation/(depreciation) and net unrealized appreciation for Federal tax purposes was as follows:
| | | | |
Gross appreciation (excess of value over tax cost) | | $ | 1,513,356 | |
Gross depreciation (excess of tax cost over value) | | | (1,203,834) | |
| |
Net unrealized appreciation | | $ | 309,522 | |
| |
Cost of investments for income tax purposes | | $ | 15,842,522 | |
| |
| | |
| 18 | | Stonebridge Small-Cap Growth Fund |
| | |
| Stonebridge Small-Cap Growth Fund | | Notes to Financial Statements |
April 30, 2015
Components of Earnings: As of April 30, 2015, components of distributable earnings were as follows:
| | | | |
Accumulated capital losses | | $ | (595,111) | |
Net unrealized appreciation on investments | | | 309,522 | |
Other cumulative effect of timing differences | | | (88,332) | |
| |
Total | | $ | (373,921) | |
| |
As of April 30, 2015, the Fund elects to defer to the period ending April 30, 2016, late year ordinary losses in the amount of $88,332.
Capital Losses: As of April 30, 2015, the Fund has no accumulated capital loss carryforwards.
The Fund has elected to defer Short Term capital losses in the amount of $595,111 to the next tax year.
Tax Basis of Distributions to Shareholders: The character of distributions made during the year from net investment income or net realized gains may differ from its ultimate characterization for federal income tax purposes. Also, due to the timing of dividend distributions, the fiscal year in which amounts are distributed may differ from the fiscal year in which the income or realized gain was recorded by the Fund.
The tax character of distributions paid during the year ended April 30, 2015, were as follows:
| | | | | | | | |
| | | Ordinary Income | | | Long-Term Capital
Gain | |
| |
The Stonebridge Small-Cap Growth Fund | | $ | 962,886 | | | $ | 239,526 | |
The tax character of distributions paid during the year ended April 30, 2014, were as follows:
| | | | | | | | |
| | | Ordinary Income | | | Long-Term Capital
Gain | |
| |
The Stonebridge Small-Cap Growth Fund | | $ | 218,314 | | | $ | 528,606 | |
4. SECURITIES TRANSACTIONS
The cost of purchases and proceeds from sales of securities (excluding short-term securities) during the year ended April 30, 2015, was as follows:
| | | | | | | | |
| | | Purchases | | | Sales | |
| |
Stonebridge Small-Cap Growth Fund | | $ | 23,587,724 | | | $ | 25,661,886 | |
| | |
| Annual Report | April 30, 2015 | | 19 |
| | |
| Stonebridge Small-Cap Growth Fund | | Notes to Financial Statements |
April 30, 2015
5. SHARES OF BENEFICIAL INTEREST
The capitalization of the Trust consists of an unlimited number of shares of beneficial interest with no par value per share. Holders of the shares of the Fund of the Trust have one vote for each share held and a proportionate fraction of a vote for each fractional share. All shares issued and outstanding are fully paid and are transferable and redeemable at the option of the shareholder. Purchasers of the shares do not have any obligation to make payments to the Trust or its creditors (other than the purchase price for the shares) or make contributions to the Trust or its creditors solely by reason of the purchasers’ ownership of the shares. Shares have no pre-emptive rights.
| | | | | | | | | | | | | | | | |
| | | Year Ended April 30, 2015
Shares | | | Year Ended April 30, 2015 Amount | | | Year Ended April 30, 2014
Shares | | | Year Ended April 30, 2014 Amount | |
| |
Shares sold | | | 22,272 | | | $ | 193,865 | | | | 11,430 | | | $ | 108,589 | |
Shares issued in reinvestment of dividends | | | 154,444 | | | | 1,179,954 | | | | 78,468 | | | | 734,465 | |
| |
Total | | | 176,716 | | | | 1,373,819 | | | | 89,898 | | | | 843,054 | |
| |
Less shares redeemed, net of redemption fees | | | (204,934) | | | | (1,805,418) | | | | (144,715) | | | | (1,388,424) | |
| |
Net Decrease | | | (28,218) | | | $ | (431,599) | | | | (54,817) | | | $ | (545,370) | |
| |
Shares redeemed within 30 days of purchase will incur a 2% short-term redemption fee deducted from the redemption amount. Redemption fees are reflected in the “Net increase/(decrease) in shareholder activity derived from beneficial interest transactions, net of redemption fees” in the Statements of Changes in Net Assets.
For the years ended April 30, 2015 and April 30, 2014, the Fund did not receive any redemption fees.
6. MANAGEMENT AND RELATED-PARTY TRANSACTIONS
The Trust has entered into an advisory agreement with Stonebridge Capital Management, Inc. (the “Adviser”) with respect to the Fund. The advisory agreement has been approved by the Board and shareholders. Pursuant to the advisory agreement with the Trust, the Adviser is entitled to investment advisory fees, computed daily and payable monthly at an annual rate of 0.75% of the average daily net assets of the Fund.
Fund Accounting Fees and Expenses
ALPS Fund Services, Inc. (“ALPS”) serves as administrator to the Fund and the Fund has agreed to pay expenses incurred in connection with their administrative activities. Pursuant to an Administrative Agreement, ALPS provides operational services to the Fund including, but not limited to, fund accounting and fund administration and generally assists in the Fund’s operations. Officers of the Trust are employees of ALPS. The Fund’s administration fee is accrued on a daily basis and paid monthly. Administration fees paid by the Fund for the year ended April 30, 2015 are disclosed in the Statement of Operations.
| | |
| 20 | | Stonebridge Small-Cap Growth Fund |
| | |
| Stonebridge Small-Cap Growth Fund | | Notes to Financial Statements |
April 30, 2015
ALPS is reimbursed by the Fund for certain out-of-pocket expenses.
Transfer Agent
ALPS serves as transfer, dividend paying and shareholder servicing agent for the Fund. ALPS receives an annual minimum fee, a fee based upon the number of shareholder accounts, and is also reimbursed by the Fund for certain out-of-pocket expenses.
Compliance Services
ALPS provides services that assist the Trust’s chief compliance officer in monitoring and testing the policies and procedures of the Trust in conjunction with requirements under Rule 38a-1 under the 1940 Act and receives an annual base fee. ALPS is reimbursed for certain out-of-pocket expenses by the Fund.
Principal Financial Officer
ALPS receives an annual fee for providing principal financial officer services to the Fund.
Distributor
ALPS Distributors, Inc. (“ADI” or the “Distributor”) (an affiliate of ALPS) acts as the distributor of the Fund’s shares pursuant to a Distribution Agreement with the Trust. Shares are sold on a continuous basis by ADI as agent for the Fund, and ADI has agreed to use its best efforts to solicit orders for the sale of the Fund’s shares, although it is not obliged to sell any particular amount of shares. ADI is not entitled to any compensation for its services as Distributor. ADI is registered as a broker-dealer with the Securities and Exchange Commission.
7. INDEMNIFICATIONS
Under the Trust’s organizational documents, its officers and Trustees are indemnified against certain liability arising out of the performance of their duties to the Trust. Additionally, in the normal course of business, the Trust enters into contracts with service providers that may contain general indemnification clauses, which may permit indemnification to the extent permissible under applicable law. The Trust’s maximum exposure under these arrangements is unknown, as this would involve future claims that may be made against the Trust that have not yet occurred.
| | |
| Annual Report | April 30, 2015 | | 21 |
Report of Independent Registered Public Accounting Firm
To the Shareholders and Board of Trustees of Financial Investors Trust:
We have audited the accompanying statement of assets and liabilities, including the statement of investments, of Stonebridge Small-Cap Growth Fund (the “Fund”), one of the portfolios constituting Financial Investors Trust, as of April 30, 2015, the related statement of operations for the year then ended, the statements of changes in net assets for each of the two years in the period then ended, and the financial highlights for each of the two years in the period then ended and the period from November 1, 2012 to April 30, 2013. These financial statements and financial highlights are the responsibility of the Fund’s management. Our responsibility is to express an opinion on these financial statements and financial highlights based on our audits. The financial highlights for each of the three years in the period ended October 31, 2012 were audited by other auditors whose report, dated December 11, 2012, expressed an unqualified opinion on such financial highlights.
We conducted our audits in accordance with the standards of the Public Company Accounting Oversight Board (United States). Those standards require that we plan and perform the audit to obtain reasonable assurance about whether the financial statements and financial highlights are free of material misstatement. The Fund is not required to have, nor were we engaged to perform, an audit of its internal control over financial reporting. Our audits included consideration of internal control over financial reporting as a basis for designing audit procedures that are appropriate in the circumstances, but not for the purpose of expressing an opinion on the effectiveness of the Fund’s internal control over financial reporting. Accordingly, we express no such opinion. An audit also includes examining, on a test basis, evidence supporting the amounts and disclosures in the financial statements, assessing the accounting principles used and significant estimates made by management, as well as evaluating the overall financial statement presentation. Our procedures included confirmation of securities owned as of April 30, 2015, by correspondence with the custodian and brokers; where replies were not received from brokers, we performed other auditing procedures. We believe that our audits provide a reasonable basis for our opinion.
In our opinion, the financial statements and financial highlights referred to above present fairly, in all material respects, the financial position of Stonebridge Small-Cap Growth Fund of Financial Investors Trust as of April 30, 2015, the results of its operations for the year then ended, the changes in its net assets for each of the two years in the period then ended, and the financial highlights for each of the two years in the period then ended and the period from November 1, 2012 to April 30, 2013, in conformity with accounting principles generally accepted in the United States of America.
DELOITTE & TOUCHE LLP
Denver, Colorado
June 26, 2015
| | |
| 22 | | Stonebridge Small-Cap Growth Fund |
| | |
| Stonebridge Small-Cap Growth Fund | | Additional Information |
April 30, 2015 (Unaudited)
1. FUND HOLDINGS
The Fund files its complete schedule of portfolio holdings with the Securities and Exchange Commission (the “SEC”) for the first and third quarters of each fiscal year on Form N-Q within 60 days after the end of the period. Copies of the Fund’s Form N-Q are available without charge on the SEC website at http://www.sec.gov. You may also review and copy the Form N-Q at the SEC’s Public Reference Room in Washington, DC. For more information about the operation of the Public Reference Room, please call the SEC at 1-800-SEC-0330.
2. FUND PROXY VOTING POLICIES, PROCEDURES AND SUMMARIES
The Fund’s policies and procedures used in determining how to vote proxies and information regarding how the Fund voted proxies relating to portfolio securities during the most recent prior 12-month period ending June 30 are available without charge, (1) upon request, by calling (toll-free) 800-639-3935 and (2) on the SEC’s website at http://www.sec.gov.
3. TAX DESIGNATIONS
The Fund designates the following for federal income tax purposes for the calendar year ended December 31, 2014:
| | | | |
| | | Qualified Dividend
Income | | Dividend Received
Deduction |
|
Stonebridge Small-Cap Growth Fund | | 0.00% | | 0.00% |
|
Pursuant to Section 852(b)(3) of the Internal Revenue Code, the Stonebridge Small-Cap Growth Fund designated $239,526 as long-term capital gain dividends.
| | |
| Annual Report | April 30, 2015 | | 23 |
| | |
| Stonebridge Small-Cap Growth Fund | | Trustees & Officers |
April 30, 2015 (Unaudited)
Additional information regarding the Fund’s trustees is included in the Statement of Additional Information, which can be obtained without charge by calling 800-639-3935.
INDEPENDENT TRUSTEES
| | | | | | | | | | |
Name, Address* & Year of Birth | | Position(s) Held with Fund | | Term of Office and Length of Time Served** | | Principal Occupation(s) During Past 5 Years*** | | Number of Funds in Fund Complex Overseen by
Trustee**** | | Other Directorships Held by Trustee During Past 5 Years |
|
Mary K. Anstine, 1940 | | Trustee | | Ms. Anstine was elected at a special meeting of shareholders held on March 21, 1997 and re-elected at a special meeting of shareholders held on August 7, 2009. | | Ms. Anstine was formerly an Executive Vice President of First Interstate Bank of Denver until 1994, President/Chief Executive Officer of HealthONE Alliance, Denver, Colorado, from 1994 to 2004, and has been retired since 2004. Ms. Anstine is also Trustee/Director of AV Hunter Trust and Colorado Uplift Board. Ms. Anstine was formerly a Director of the Trust Bank of Colorado (later purchased and now known as Northern Trust Bank), HealthONE and Denver Area Council of the Boy Scouts of America, and a member of the American Bankers Association Trust Executive Committee. | | 30 | | Ms. Anstine is a Trustee of ALPS ETF Trust (18 funds); ALPS Variable Investment Trust (9 funds); Reaves Utility Income Fund (1 fund); and Westcore Trust (12 funds). |
|
John R. Moran, Jr., 1930 | | Trustee | | Mr. Moran was elected at a special meeting of shareholders held on March 21, 1997 and re-elected at a special meeting of shareholders held on August 7, 2009. | | Mr. Moran formerly served as President and CEO of The Colorado Trust, a private foundation serving the health and hospital community in the state of Colorado, from 1991 to 2007. During his career as an attorney from 1958 to 1991, Mr. Moran was formerly a partner with the firm of Kutak Rock & Campbell in Denver, Colorado and a member of the Colorado House of Representatives. Currently, Mr. Moran is a member of the Treasurer’s Investment Advisory Committee for the University of Colorado. | | 30 | | None. |
|
| * | All communications to Trustees and Officers may be directed to Financial Investors Trust c/o 1290 Broadway, Suite 1100, Denver, CO 80203. |
| ** | This is the period for which the Trustee or Officer began serving the Trust. Each Trustee and/or Officer serves an indefinite term, until his successor is elected. |
| *** | Except as otherwise indicated, each individual has held the office shown or other offices in the same company for the last five years. |
| **** | The Fund Complex includes all series of the Trust (currently 30) and any other investment companies for which any Trustee serves as Trustee for and which Stonebridge Capital Management, Inc. provides investment advisory services (currently none). |
| | |
| 24 | | Stonebridge Small-Cap Growth Fund |
| | |
| Stonebridge Small-Cap Growth Fund | | Trustees & Officers |
April 30, 2015 (Unaudited)
INDEPENDENT TRUSTEES (continued)
| | | | | | | | | | |
Name, Address* & Year of Birth | | Position(s) Held with Fund | | Term of Office and Length of Time Served** | | Principal Occupation(s) During Past 5 Years*** | | Number of Funds in Fund Complex Overseen by Trustee**** | | Other Directorships Held by Trustee During Past 5 Years |
|
Jeremy W. Deems, 1976 | | Trustee | | Mr. Deems was appointed as a Trustee at the March 11, 2008 meeting of the Board of Trustees and elected at a special meeting of shareholders held on August 7, 2009. | | Mr. Deems is the Co-Founder and Chief Financial Officer of Green Alpha Advisors, LLC, a registered investment advisor, and Co-Portfolio Manager of the Shelton Green Alpha Fund. Prior to joining Green Alpha Advisors, Mr. Deems was CFO and Treasurer of Forward Management, LLC, ReFlow Management Co., LLC, ReFlow Fund, LLC, a private investment fund, and Sutton Place Management, LLC, an administrative services company, from 1998 to June 2007. From 2004 to 2005, Mr Deems also served as Treasurer of the Forward Funds and the Sierra Club Funds. | | 30 | | Mr. Deems is a Trustee of ALPS ETF Trust (18 funds); ALPS Variable Investment Trust (9 funds) and Reaves Utility Income Fund (1 fund). |
|
Jerry G. Rutledge 1944 | | Trustee | | Mr. Rutledge was elected at a special meeting of shareholders held on August 7, 2009 | | Mr. Rutledge is the President and owner of Rutledge’s Inc., a retail clothing business. Mr. Rutledge is currently serving as a Director of the University of Colorado Hospital. Mr. Rutledge was from 1994 to 2007 a Regent of the University of Colorado. | | 30 | | Mr. Rutledge is a Trustee of Principal Real Estate Income Fund (1 fund), Clough Global Allocation Fund (1 fund), Clough Global Equity Fund (1 fund) and Clough Global Opportunities Fund (1 fund). |
|
| | |
| Annual Report | April 30, 2015 | | 25 |
| | |
| Stonebridge Small-Cap Growth Fund | | Trustees & Officers |
April 30, 2015 (Unaudited)
INDEPENDENT TRUSTEES (continued)
| | | | | | | | | | |
Name, Address* & Year of Birth | | Position(s) Held with Fund | | Term of Office and Length of Time Served** | | Principal Occupation(s) During Past 5 Years*** | | Number of Funds in Fund Complex Overseen by Trustee**** | | Other Directorships Held by Trustee During Past 5 Years |
|
Michael “Ross” Shell, 1970 | | Trustee | | Mr. Shell was elected at a special meeting of shareholders held on August 7, 2009 | | Mr. Shell is Founder and CEO of Red Idea, LLC, a strategic consulting/early stage venture firm (since June 2008). From 1999 to 2009, he was a part-owner and Director of Tesser, Inc., a brand agency. From December 2005 to May 2008, he was Director, Marketing and Investor Relations, of Woodbourne, a REIT/real estate hedge fund and private equity firm. Prior to this, from May 2004 to November 2005, he worked as a business strategy consultant; from June 2003 to April 2004, he was on the Global Client Services team of IDEO, a product design/innovation firm; and from 1999 to 2003, he was President of Tesser, Inc. Mr. Shell graduated with honors from Stanford University with a degree in Political Science. | | 30 | | None. |
|
| * | All communications to Trustees and Officers may be directed to Financial Investors Trust c/o 1290 Broadway, Suite 1100, Denver, CO 80203. |
| ** | This is the period for which the Trustee or Officer began serving the Trust. Each Trustee and/or Officer serves an indefinite term, until his successor is elected. |
| *** | Except as otherwise indicated, each individual has held the office shown or other offices in the same company for the last five years. |
| **** | The Fund Complex includes all series of the Trust (currently 30) and any other investment companies for which any Trustee serves as Trustee for and which Stonebridge Capital Management, Inc. provides investment advisory services (currently none). |
| | |
| 26 | | Stonebridge Small-Cap Growth Fund |
| | |
| Stonebridge Small-Cap Growth Fund | | Trustees & Officers |
April 30, 2015 (Unaudited)
INTERESTED TRUSTEE
| | | | | | | | | | |
Name, Address* & Age | | Position(s) Held with Fund | | Term of Office and Length of Time Served** | | Principal Occupation(s) During Past 5 Years*** | | Number of Funds in Fund Complex Overseen by Trustee**** | | Other Directorships Held by Trustee |
|
Edmund J. Burke, 1961 | | Trustee, Chairman and President | | Mr. Burke was elected as Chairman at the August 28, 2009 meeting of the Board of Trustees. Mr. Burke was elected as Trustee at a special meeting of shareholders held on August 7, 2009. Mr. Burke was elected President of the Trust at the December 17, 2002 meeting of the Board of Trustees. | | Mr. Burke is President and a Director of ALPS Holdings, Inc. (“AHI”) (since 2005) and Director of Boston Financial Data Services, Inc. (“BFDS”), ALPS Advisors, Inc. (“AAI”), ALPS Distributors, Inc. (“ADI”), ALPS Fund Services, Inc. (“AFS”) and ALPS Portfolio Solutions Distributor, Inc. (“APSD”) and from 2001-2008, was President of AAI, ADI, AFS and APSD. Because of his positions with AHI, BFDS, AAI, ADI, AFS and APSD, Mr. Burke is deemed an affiliate of the Trust as defined under the 1940 Act. Mr. Burke is Trustee and President of the Clough Global Allocation Fund (Trustee since 2006; President since 2004); Trustee and President of the Clough Global Equity Fund (Trustee since 2006; President since 2005); Trustee and President of the Clough Global Opportunities Fund (since 2006); Trustee of the Liberty All-Star Equity Fund; and Director of the Liberty All-Star Growth Fund, Inc. | | 35 | | Mr. Burke is a Trustee of Clough Global Allocation Fund (1 fund); Clough Global Equity Fund (1 fund); Clough Global Opportunities Fund (1 fund); Trustee of the Liberty All-Star Equity Fund (1 fund); and Director of the Liberty All-Star Growth Fund, Inc. (1 fund). |
|
| | |
| Annual Report | April 30, 2015 | | 27 |
| | |
| Stonebridge Small-Cap Growth Fund | | Trustees & Officers |
April 30, 2015 (Unaudited)
OFFICERS
| | | | | | |
Name, Address* & Year of Birth | | Position(s) Held with Fund | | Term of Office and Length of Time Served** | | Principal Occupation(s) During Past 5 Years*** |
|
Kimberly R. Storms, 1972 | | Treasurer | | Ms. Storms was elected Treasurer of the Trust at the March 12, 2013 meeting of the Board of Trustees. | | Ms. Storms is Senior Vice President and Director of Fund Administration of ALPS. Because of her position with ALPS, Ms. Storms is deemed an affiliate of the Trust as defined under the 1940 Act. Ms. Storms is also Treasurer of Liberty All-Star Equity Fund and Liberty All-Star Growth Fund, Inc. and Chief Financial Officer of The Arbitrage Funds. |
|
David T. Buhler, 1971 | | Secretary | | Mr. Buhler was elected Secretary of the Trust at the September 11, 2012 meeting of the Board of Trustees. | | Mr. Buhler joined ALPS in June 2010. He is currently Vice President and Senior Associate Counsel of ALPS, AAI, ADI and APSD. Prior to joining ALPS, Mr. Buhler served as Associate General Counsel and Assistant Secretary of Founders Asset Management LLC from 2006 to 2009. Because of his position with ALPS, Mr. Buhler is deemed an affiliate of the Trust as defined under the 1940 Act. Mr. Buhler is also the Secretary ALPS Variable Investment Trust, ALPS ETF Trust and Westcore Trust. |
|
Ted Uhl, 1974 | | Chief Compliance Officer (“CCO”) | | Mr. Uhl was appointed CCO of the Trust at the June 8, 2010 meeting of the Board of Trustees. | | Mr. Uhl joined ALPS in October 2006, and is currently Deputy Compliance Officer of ALPS. Prior to his current role, Mr. Uhl served as Senior Risk Manager for ALPS from October 2006 until June 2010. Because of his position with ALPS, Mr. Uhl is deemed an affiliate of the Trust as defined under the 1940 Act. Mr. Uhl is also CCO of the Clough Global Funds, Reaves Utility Income Fund, Centre Funds and Transparent Value Trust. |
|
| * | All communications to Trustees and Officers may be directed to Financial Investors Trust c/o 1290 Broadway, Suite 1100, Denver, CO 80203. |
| ** | This is the period for which the Trustee or Officer began serving the Trust. Each Trustee and/or Officer serves an indefinite term, until his successor is elected. |
| *** | Except as otherwise indicated, each individual has held the office shown or other offices in the same company for the last five years. |
| | |
| 28 | | Stonebridge Small-Cap Growth Fund |

This report and its financial statements are submitted for the general information of the shareholders of the Fund. The report is not authorized for distribution to prospective investors in the Fund unless preceded or accompanied by a prospectus.


Table of Contents
www.vulcanvaluepartners.com
Shareholder Letter
April 30, 2015 (Unaudited)
PORTFOLIO REVIEW
Annual Report 4.30.15
Vulcan Value Partners Fund and Vulcan Value Partners Small Cap Fund outperformed their primary benchmarks during the period ended April 30, 2015. Much more importantly, the Vulcan Value Partners Fund and Vulcan Value Partners Small Cap Fund have produced exceptional long-term returns as both funds have outperformed their respective benchmarks inception to date. Vulcan Value Partners Fund and Vulcan Value Partners Small Cap Fund received a 5-Star Overall Morningstar Ranking. (As of April 30, 2015 out of 1,577 Large Growth, and 637 Small Blend Funds, respectively, derived from a weighted average of the Funds’ three-, five- and ten-year (if applicable) Morningstar metrics, which are based on risk-adjusted return performance.)*
As we have often said, we place no weight on short-term results, good or bad, and neither should you. In fact, we have made and will continue to make decisions that negatively impact short-term performance when we think we can improve our long-term returns and lower risk. We encourage you to place more weight on our longer term historical results and a great deal of weight on our long-term prospects.
We have made two important decisions that we think will enhance our long-term prospects:
First, we are closing Vulcan Value Partners Fund to new investors. Existing investors can continue to add to or reduce their committed capital. However, if anyone leaves they cannot come back. We closed the Small Cap Fund in late 2013. We did so because we wanted to remain nimble enough to continue to execute our investment philosophy. We are very fortunate to have partnered with outstanding clients who share our long-term time horizon and provide stable capital. As fiduciaries, we first and foremost want to preserve our clients’ capital and our own. Continued growth has several downsides. Increased size makes it more difficult to execute on the trading desk. We have additional capacity in that area, but we want it to accrue to our existing clients instead of being absorbed by new clients. Growth also adds to complexity. Complexity makes it more difficult to focus on our core competencies. We have always been a research driven shop and want to remain so. Limiting the number of client relationships we have will allow us to serve our existing clients better and will allow our research team to focus on research.
Second, Adam McClain has been appointed President. Adam is a founding partner of Vulcan Value Partners, LLC and will continue to lead the firm’s client service team. Adam is the right person and it is the right time to make this change. Adam knows our company, our clients, and our investment philosophy extremely well, having been intimately involved in the development of each since we started the firm. He is well respected both inside and outside of Vulcan Value Partners. Adam’s ability and willingness to take on these additional responsibilities will allow me to spend even more time on research, which is my highest and best use.
Turning to our portfolios, our primary concern is always to mitigate risk. Returns will take care of themselves. The strong dollar has reduced values across the board for U.S. companies with operations abroad. Our overseas domiciled companies have benefitted from the strong dollar but not enough to offset the strong dollar’s impact on our U.S. companies. As prices have continued to rise and values are under pressure, valuation levels are rising and risk is increasing. As valuation levels continue to rise, fear has given way to complacency, and complacency historically gives way
| | |
| Annual Report | April 30, 2015 | | 1 |
Shareholder Letter
April 30, 2015 (Unaudited)
to greed. Greed historically leads to a bubble and then to the next bear market. We look forward to it. We are at our best when others are panicking. The current environment is the most challenging for us. It might seem counter-intuitive, but the complacency in the markets we are now experiencing increases risk. The energy markets, especially oil, seemed to be pretty complacent a year ago. Then, look at what happened with oil declining from over $100 per barrel to under $50 per barrel. We cannot predict the timing nor the magnitude, but the same dynamic will likely play out in the stock market. Our goal is to be ready for it. How? We own, in our opinion, superior businesses with stable, steadily growing estimated values. We own them at an estimated discount that provides a margin of safety. Admittedly, those estimated discounts are not as large as they have been nor as we would wish them to be. So, we are more diversified than at any time since we started the company. Our 1% and 2% positions provide liquidity that can quickly be redeployed into larger positions in more deeply discounted companies when they become available to us.
As you know, we are not big fans of energy. Not having any energy exposure helped us last year. It was not a macro or sector call. We simply could not find any energy companies that qualified for investment in terms of quality or valuation. After oil dropped below $50 per barrel, we found a couple of energy related companies that did qualify. Keep on reading…
In the discussion that follows, we generally define material contributors and detractors as companies having a greater than 1% impact on the portfolio.
Vulcan Value Partners Large Cap Fund Review
We bought twenty one new positions and sold 11 positions during the period.
There were three material contributors and no material detractors to performance in the period.
New positions included Partner RE, Axis Capital Holdings, Precision Castparts, Qualcomm, Emerson Electric, Schlumberger and National Oilwell Varco.
We sold eBay to redeploy capital into more discounted companies with larger estimated margins of safety. Shortly after we bought eBay last year (we have owned it before) activists became involved in the stock and drove its price higher. Subsequently, the company announced it would separate its Marketplaces division from Paypal. The stock market reacted favorably to this news. Price rose faster than our estimated value, and eBay’s margin of safety eroded.
We purchased Partner RE and Axis Capital in combination. The two companies announced a merger and at certain times it made more sense to buy one company instead of the other, but our intention was to have a position in the merged company. Subsequent to the end of the first quarter, the Agnelli family announced that they were making an unsolicited bid for Partner RE. Partner RE’s stock price has risen as a result. We are monitoring the situation and will follow our investment discipline.
Precision Castparts makes products that are integral to Airbus and Boeing’s aircraft programs. They also make products used in the energy sector. Flagging demand for energy related products has masked strong demand for aircraft products. In our opinion, Precision Castparts is dominant in
| | |
| 2 | | www.vulcanvaluepartners.com |
Shareholder Letter
April 30, 2015 (Unaudited)
its industry, has a large backlog of products going into newer aircraft programs, produces high levels of free cash flow, and has attractive returns on capital.
We have owned Qualcomm in the past. We sold it because of increased risk associated with its Chinese licensing agreements. Recently, Qualcomm reached agreements with Chinese authorities that were more favorable than many, including us, had expected. After an initial rally, Qualcomm’s stock declined due to concerns about its chip making business. We believe the company’s licensing business is much more valuable than its chip making business. With risk to the licensing business mitigated and GAAP earnings weakness caused by the smaller chip making business, we were able to re-acquire Qualcomm at attractive estimated valuation levels that provided an adequate margin of safety.
In our opinion, Emerson Electric is a well-managed, diversified, global manufacturer that produces consistently high levels of free cash flow, has attractive returns on capital, and a steadily growing value. Emerson Electric’s results have been negatively impacted by the strong dollar and sluggish global economic growth. We are pleased to be able to add it to our holdings.
We purchased Schlumberger and National Oilwell Varco after oil dropped to below $50 per barrel. Neither company actually produces energy, but both supply value-added services to the industry that are required to produce and find new supplies of oil. Consequently, both companies, in our opinion, have superior economics compared to their customers yet sell at larger discounts to them. We expect lower earnings but high levels of free cash flow and stable values for both companies this year and next. Over the longer term, we expect both companies to grow their estimated values at a low double-digit rate.
Vulcan Value Partners Small Cap Fund Review
We bought seventeen new positions and sold twenty positions during the period.
There was four material contributors to performance during the period and one material detractor.
We sold Insperity, Universal Technical Institute, Avery Dennison, Montpelier RE, Genpact, and Iconix Brands. In all cases except Universal Technical Institute, we sold our stakes because our estimated margin of safety had eroded as price rose faster than our estimated value. In the case of Universal Technical Institute, we sold it because government regulations impacting the for-profit education business became even more onerous and uncertain than we expected. Our investment in Universal Technical Institute was predicated on the assumption that increased government regulation would drive out companies that did not offer value for their students/customers, and that those that did add value, such as Universal Technical Institute, would ultimately thrive. Unfortunately, proposed additional regulations did not differentiate between productive and non-productive institutions. In our opinion, the range of possibilities became too extreme, and our estimated margin of safety eroded so we sold our position.
New purchases included MSC Industrial, Fossil Group, and Aspen Insurance Holdings. MSC Industrial has a large distribution network stocking hundreds of thousands of SKU’s that are needed to keep the nation’s factories running. Their ability to supply relatively small cost but mission critical items within 24 hours allows them to charge a premium for their products. The strong dollar is pressuring their customer base, and low inflation is muting their pricing power. We
| | |
| Annual Report | April 30, 2015 | | 3 |
Shareholder Letter
April 30, 2015 (Unaudited)
believe the company is a clear leader in its market segment, continues to gain market share, produces strong free cash flow, and has attractive returns on capital. As conditions for their customer base improve, so we believe MSC Industrial’s results will as well. In the meantime, they are producing returns that most businesses would envy.
In our opinion, Fossil Group has a unique business franchise in that it produces timepieces, has a global distribution network, and owns and licenses watch brands. As a result, they are an attractive partner for watch brand owners. The strong dollar has obscured their underlying growth. In addition, concerns about the impact that the Apple Watch may have on their business has weighed on the stock price. Fossil has partnered with Google to produce several versions of Android smart watches. We think a market will exist for both traditional and smart watches. We think Fossil is uniquely positioned to prosper with both traditional watches and smart watches, regardless how the market evolves.
Aspen Insurance Holdings is a Bermuda based insurance company with consistent levels of underwriting profitability and, in our opinion, an excellent capital allocation track record. They are similar to Montpelier RE but were much more discounted in our estimate. Montpelier RE was bid up on a hostile takeover bid, which subsequently failed. We sold our stake in Montpelier RE after the bid was announced and re-deployed capital into Aspen Insurance Holdings.
Closing
We are only concerned about our long-term results, and everything we do is with that goal in mind. With valuation levels rising and complacency replacing fear, our short-term results are likely to be challenged. Having said that, we have taken a number of important steps operationally and strategically that position us very well to continue to produce attractive long-term results. Operationally, our portfolios are highly liquid and more diversified than they ever have been. When deeper discounts become available, we will be able to deploy our liquidity opportunistically. In the meantime, we own, in our opinion, outstanding businesses that are steadily compounding their values at discounts to our estimate of intrinsic worth, while companies we do not own trade at a premium to our estimate of fair value. Strategically, closing to new investors protects the high quality of our client base and reserves additional investment capacity for you, our client partners. Adam McClain’s ability to take on more responsibility for day to day operations strengthens our research efforts. So, we feel better about our long-term prospects than ever while cautioning you that in the short-term, systemic market-level risks are rising with valuation levels.
Thank you for the confidence you have placed in us.
C.T. Fitzpatrick
Chief Executive Officer
| | |
| 4 | | www.vulcanvaluepartners.com |
Shareholder Letter
April 30, 2015 (Unaudited)
| 1 | For each fund with at least a three-year history, Morningstar calculates a Morningstar Rating™ based on a Morningstar Risk-Adjusted Return measure that accounts for variation in a fund’s monthly performance (including the effects of sales charges, loads, and redemption fees), placing more emphasis on downward variations and rewarding consistent performance. The top 10% of funds in each category receive 5 stars, the next 22.5% receive 4 stars, the next 35% receive 3 stars, the next 22.5% receive 2 stars and the bottom 10% receive 1 star. (Each share class is counted as a fraction of one fund within this scale and rated separately, which may cause slight variations in the distribution percentages.) The Overall Morningstar Rating for a fund is derived from a weighted average of the performance figures associated with its three-, five- and ten-year (if applicable) Morningstar Rating metrics, as of April 30, 2015. Morningstar Rating is for the retail share class only; other classes may have different performance characteristics. © 2015 Morningstar, Inc. All Rights Reserved. The information contained herein: (1) is proprietary to Morningstar and/or its content providers; (2) may not be copied or distributed; and (3) is not warranted to be accurate, complete or timely. Neither Morningstar nor its content providers are responsible for any damages or losses arising from any use of this information. Vulcan Value Partners Fund (VVPLX) was rated 5 Stars out of 1,577 for the 3-year period and 5 Stars out of 1,357 for the 5 year period against Large Growth Funds. Vulcan Value Partners Small Cap Fund (VVPSX) was rated 5 Stars out of 637 for the 3-year period and 5 Stars out of 573 for the 5-year period against Small Blend Funds. All information in this report is as of the date shown in the upper right hand corner unless otherwise indicated. |
| 2 | Please see page 6 and 9 for 1 year and inception to date returns for the Vulcan Value Partners Fund and Vulcan Value Partners Small Cap Fund, respectively. |
Margin of Safety is a favorable difference between the price of a company’s shares and the estimated intrinsic value of those shares.
Free Cash Flow is a measure of how much a business generates after accounting for capital expenditures. It is calculated as operating cash flow less capital expenditures.
Return of Capital is a return from an investment that is not considered income. The return of capital is when some or all of the money an investor has in an investment is paid back, thus decreasing the value of the investment.
Price to Book Ratio is a ratio used to compare a stock’s market value to its book value. It is calculated by dividing the current closing price of the stock by the latest quarter’s book value per share.
The views and information discussed in this commentary are as of the date of publication, are subject to change, and may not reflect the writer’s current views. The views expressed represent an assessment of market conditions at a specific point in time, are opinions only and should not be relied upon as investment advice regarding a particular investment or markets in general. Such information does not constitute a recommendation to buy or sell specific securities or investment vehicles. It should not be assumed that any investment will be profitable or will equal the performance of the Funds or any securities or any sectors mentioned in this letter. The subject matter contained in this letter has been derived from several sources believed to be reliable and accurate at the time of compilation. Neither Vulcan Value Partners, LLC nor the Funds accept any liability for losses either direct or consequential caused by the use of this information.
Diversification does not assure a profit or protect against loss.
The primary and secondary benchmark indexes are not actively managed and do not reflect any deductions for fees, expenses or taxes. An investor may not invest directly in an index.
The Funds are distributed by ALPS Distributors, Inc.
| | |
| Annual Report | April 30, 2015 | | 5 |
Fund Overview
April 30, 2015 (Unaudited)
VULCAN VALUE PARTNERS FUND
Average Annual Total Returns (as of 4/30/15)
| | | | | | | | | | | | | | | | | | | | | | |
| | | | | | | | | | | Since | | | Expense Ratios | |
| | | 1 Year | | 3 Year | | | 5 Year | | | Inception* | | | Total | | | Net** | |
Vulcan Value Partners Fund | | 16.61% | | | 19.57% | | | | 16.38% | | | | 16.50% | | | | 1.09% | | | | 1.09% | |
S&P 500® Total Return Index*** | | 12.98% | | | 16.73% | | | | 14.33% | | | | 14.62% | | | | | | | | | |
Russell 1000® Value Index*** | | 9.31% | | | 17.20% | | | | 13.39% | | | | 14.24% | | | | | | | | | |
Performance data quoted represents past performance. Past performance does not guarantee future results. Investment return and principal value of an investment will fluctuate so that an investor’s shares, when sold or redeemed, may be worth more or less than the original cost. The Fund imposes a 2.00% redemption fee on shares held for less that 90 days. Current performance data may be higher or lower than actual data quoted. For the most current month-end performance data, please call 1-877-421-5078.
The table does not reflect the deduction of taxes that a shareholder would pay on Fund distributions or the redemption of Fund shares.
Subject to investment risks, including possible loss of the principal amount invested.
| * | Fund inception date of 12/30/09. |
| ** | Vulcan Value Partners, LLC (“Vulcan” or the “Adviser”) has given a contractual agreement to the Fund that to the extent the Total Annual Fund Operating Expenses (as defined in Item 3 of Form N- 1A) with respect to the Fund (exclusive of Acquired Fund Fees and Expenses (if any), brokerage expenses, interest expense, taxes and extraordinary expenses) (“Designated Annual Fund Operating Expenses”) exceed 1.25% of the Fund’s average daily net assets for a particular fiscal year of the Fund, the Adviser will reduce the Management Fee and/or Other Expenses otherwise payable to the Adviser with respect to the Fund for the fiscal year by an amount equal to such excess, and/or the Adviser shall reimburse the Fund by the amount of such excess. This agreement is in effect through August 31, 2015. Without this agreement, expenses could be higher. If the Adviser foregoes any fees and/or reimburses the Fund pursuant to this letter agreement with respect to a particular fiscal year, then the Adviser shall be entitled to recover from the Fund the amount foregone or reimbursed to the extent Designated Annual Fund Operating Expenses are less than 1.25% of the Fund’s average daily net assets if within three years after the expenses were incurred. Ratios as of the Prospectus dated August 31, and may differ from the ratio disclosed in the Financial Highlights. |
| *** | Indices are not actively managed and do not reflect any deduction for fees, expenses or taxes. An investor may not invest directly in an index. |
| | |
| 6 | | www.vulcanvaluepartners.com |
Fund Overview
April 30, 2015 (Unaudited)
Performance of $10,000 Initial Investment (for the period ended April 30, 2015)
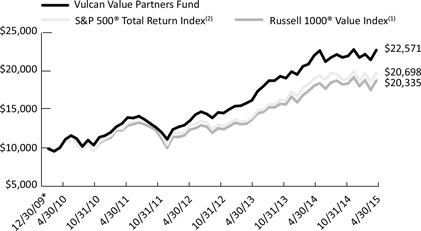
The chart above represents historical performance of a hypothetical investment of $10,000 in the Fund since inception. Past performance does not guarantee future results. This chart does not reflect the deduction of taxes that a shareholder would pay on Fund distributions or the redemption of Fund shares.
| * | Fund inception date of 12/30/09. |
| (1) | The Russell 1000® Value Index measures the performance of the large-cap value segment of the U.S. equity universe. It includes those Russell 1000® companies with lower price-to-book ratios and lower expected growth values. The index is not actively managed and does not reflect any deductions for fees, expense or taxes. An investor may not invest directly in an index. |
| (2) | The S&P 500® Total Return Index is an unmanaged index of 500 common stocks chosen for market size, liquidity and industry group representation. It is a market-value weighted index. The index is not actively managed and does not reflect any deductions for fees, expense or taxes. An investor may not invest directly in an index. |
Investing in the Fund is subject to investment risks, including possible loss of the principal amount invested.
Industry Allocation (as a % of Net Assets)
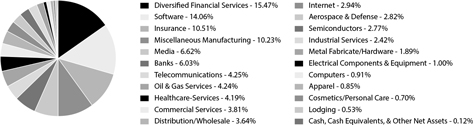
| | |
| Annual Report | April 30, 2015 | | 7 |
Disclosure of Fund Expenses
April 30, 2015 (Unaudited)
As a shareholder of the Vulcan Value Partners Fund (the “Fund”), you will incur two types of costs: (1) transaction costs, including applicable redemption fees; and (2) ongoing costs, including management fees and other Fund expenses. The following examples are intended to help you understand your ongoing costs (in dollars) of investing in the Fund and to compare these costs with the ongoing costs of investing in other mutual funds. The examples are based on an investment of $1,000 invested on November 1, 2014 and held until April 30, 2015.
Actual Expenses. The first line of each table below provides information about actual account values and actual expenses. You may use the information in this line, together with the amount you invested, to estimate the expenses that you paid over the period. Simply divide your account value by $1,000 (for example, an $8,600 account value divided by $1,000 = 8.6), then multiply the result by the number in the first line under the heading “Expenses Paid During Period” to estimate the expenses you paid on your account during this period.
Hypothetical Example for Comparison Purposes. The second line of the table below provides information about hypothetical account values and hypothetical expenses based on the Fund’s actual expense ratio and an assumed rate of return of 5% per year before expenses, which is not the Fund’s actual return. The hypothetical account values and expenses may not be used to estimate the actual ending account balance or expenses you paid for the period. You may use this information to compare the ongoing costs of investing in the Fund and other mutual funds. To do so, compare this 5% hypothetical example with the 5% hypothetical examples that appear in the shareholder reports of the other funds. The expenses shown in the table are meant to highlight ongoing Fund costs only and do not reflect transaction fees, such as redemption fees or exchange fees. Therefore, the second line of each table below is useful in comparing ongoing costs only, and may not help you determine the relative total costs of owning different funds. In addition, if these transactional costs were included, your costs would have been higher.
Vulcan Value Partners Fund
| | | | | | | | | | |
| | | Beginning Account
Value 11/1/14 | | Ending Account
Value 4/30/15 | | Expense
Ratio(a) | | Expenses Paid
During period
11/1/14 - 4/30/15(b) | |
| | | | |
Actual | | $ 1,000.00 | | $ 1,067.10 | | 1.08% | | | $ 5.54 | |
Hypothetical | | | | | | | | | | |
(5% return before expenses) | | $ 1,000.00 | | $ 1,019.44 | | 1.08% | | | $ 5.41 | |
| (a) | The Fund’s expense ratios have been annualized based on the Fund’s most recent fiscal half-year expenses. |
| (b) | Expenses are equal to the Fund’s annualized expense ratio multiplied by the average account value over the period, multiplied by the number of days in the most recent fiscal half-year (181)/365 (to reflect the half-year period). |
| | |
| 8 | | www.vulcanvaluepartners.com |
Fund Overview
April 30, 2015 (Unaudited)
VULCAN VALUE PARTNERS SMALL CAP FUND
Average Annual Total Returns (as of 4/30/15)
| | | | | | | | | | | | |
| | | | | | | | | Since Inception* | | Expense Ratios |
| | | 1 Year | | 3 Year | | 5 Year | | | Total | | Net** |
Vulcan Value Partners Small Cap Fund | | 10.74% | | 18.70% | | 15.76% | | 17.95% | | 1.31% | | 1.26% |
Russell 2000® Value Index*** | | 4.89% | | 14.52% | | 10.55% | | 12.97% | | | | |
Russell 2000® Index*** | | 9.71% | | 15.87% | | 12.73% | | 14.59% | | | | |
Performance data quoted represents past performance. Past performance does not guarantee future results. Investment return and principal value of an investment will fluctuate so that an investor’s shares, when sold or redeemed, may be worth more or less than the original cost. The Fund imposes a 2.00% redemption fee on shares held for less than 90 days. Current performance data may be higher or lower than actual data quoted. For the most current month-end performance data, please call 1-877-421-5078.
The table does not reflect the deduction of taxes that a shareholder would pay on Fund distributions or the redemption of Fund shares.
Subject to investment risks, including possible loss of the principal amount invested.
| * | Fund inception date of 12/30/09. |
| ** | Vulcan Value Partners, LLC (“Vulcan” or the “Adviser”) has given a contractual agreement to the Fund that to the extent the Total Annual Fund Operating Expenses (as defined in Item 3 of Form N- 1A) with respect to the Fund (exclusive of Acquired Fund Fees and Expenses (if any), brokerage expenses, interest expense, taxes and extraordinary expenses) (“Designated Annual Fund Operating Expenses”) exceed 1.25% of such Fund’s average daily net assets for a particular fiscal year of the Fund, the Adviser will reduce the Management Fee and/or Other Expenses otherwise payable to the Adviser with respect to the Fund for such fiscal year by an amount equal to such excess, and/or the Adviser shall reimburse the Fund by the amount of such excess. This agreement is in effect through August 31, 2015. Without this agreement, expenses could be higher. If the Adviser foregoes any fees and/or reimburses the Fund pursuant to this letter agreement with respect to a particular fiscal year, then the Adviser shall be entitled to recover from the Fund the amount foregone or reimbursed to the extent Designated Annual Fund Operating Expenses are less than 1.25% of the Fund’s average daily net assets if within three years after the expenses were incurred. Ratios as of the Prospectus dated August 31, and may differ from the ratio disclosed in the Financial Highlights. |
| *** | Indices are not actively managed and do not reflect any deduction for fees, expenses or taxes. An investor may not invest directly in an index. |
| | |
| Annual Report | April 30, 2015 | | 9 |
Fund Overview
April 30, 2015 (Unaudited)
Performance of $10,000 Initial Investment (for the period ended April 30, 2015)
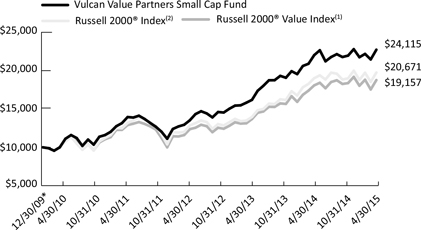
The chart above represents historical performance of a hypothetical investment of $10,000 in the Fund since inception. Past performance does not guarantee future results. This chart does not reflect the deduction of taxes that a shareholder would pay on Fund distributions or the redemption of Fund shares.
| * | Fund inception date of 12/30/09. |
| (1) | The Russell 2000® Value Index measures the performance of small-cap value segment of the U.S. equity universe. It includes those Russell 2000® companies with lower price-to-book ratios and lower forecasted growth values. The index is not actively managed and does not reflect any deductions for fees, expense or taxes. An investor may not invest directly in an index. |
| (2) | The Russell 2000® Index measures the performance of the small-cap segment of the U.S. equity universe. The Russell 2000® Index is a subset of the Russell 3000® Index representing approximately 8% of the total market capitalization of that index. It includes approximately 2,000 of the smallest securities based on a combination of their market cap and current index membership. The index is not actively managed and does not reflect any deductions for fees, expense or taxes. An investor may not invest directly in an index. |
Investing in the Fund is subject to investment risks, including possible loss of the principal amount invested.
Industry Allocation (as a % of Net Assets)
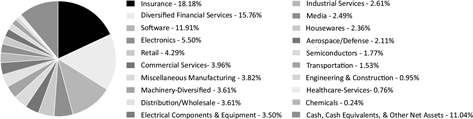
| | |
| 10 | | www.vulcanvaluepartners.com |
Disclosure of Fund Expenses
April 30, 2015 (Unaudited)
As a shareholder of the Vulcan Value Partners Small Cap Fund (the “Fund”), you will incur two types of costs: (1) transaction costs, including applicable redemption fees; and (2) ongoing costs, including management fees and other Fund expenses. The following examples are intended to help you understand your ongoing costs (in dollars) of investing in the Fund and to compare these costs with the ongoing costs of investing in other mutual funds. The examples are based on an investment of $1,000 invested on November 1, 2014 and held until April 30, 2015.
Actual Expenses. The first line of each table below provides information about actual account values and actual expenses. You may use the information in this line, together with the amount you invested, to estimate the expenses that you paid over the period. Simply divide your account value by $1,000 (for example, an $8,600 account value divided by $1,000 = 8.6), then multiply the result by the number in the first line under the heading “Expenses Paid During Period” to estimate the expenses you paid on your account during this period.
Hypothetical Example for Comparison Purposes. The second line of the table below provides information about hypothetical account values and hypothetical expenses based on the Fund’s actual expense ratio and an assumed rate of return of 5% per year before expenses, which is not the Fund’s actual return. The hypothetical account values and expenses may not be used to estimate the actual ending account balance or expenses you paid for the period. You may use this information to compare the ongoing costs of investing in the Fund and other mutual funds. To do so, compare this 5% hypothetical example with the 5% hypothetical examples that appear in the shareholder reports of the other funds. The expenses shown in the table are meant to highlight ongoing Fund costs only and do not reflect transaction fees, such as redemption fees or exchange fees. Therefore, the second line of each table below is useful in comparing ongoing costs only, and may not help you determine the relative total costs of owning different funds. In addition, if these transactional costs were included, your costs would have been higher.
Vulcan Value Partners Small Cap Fund
| | | | | | | | | | |
| | | Beginning Account
Value 11/1/14 | | Ending Account
Value 4/30/15 | | Expense
Ratio(a) | | Expenses Paid
During period
11/1/14 - 4/30/15(b) | |
| |
| | | | |
Actual | | $ 1,000.00 | | $ 1,060.90 | | 1.25% | | | $ 6.39 | |
Hypothetical | | | | | | | | | | |
(5% return before expenses) | | $ 1,000.00 | | $ 1,018.60 | | 1.25% | | | $ 6.26 | |
| (a) | The Fund’s expense ratios have been annualized based on the Fund’s most recent fiscal half-year expenses. |
| (b) | Expenses are equal to the Fund’s annualized expense ratio multiplied by the average account value over the period, multiplied by the number of days in the most recent fiscal half-year (181)/365 (to reflect the half-year period). |
| | |
| Annual Report | April 30, 2015 | | 11 |
| | |
| Statement of Investments | | Vulcan Value Partners Fund |
|
| April 30, 2015 | | |
| | | | | | | | | | | | | | |
| | | | | Shares | | | | | | Value (Note 2) | |
| |
COMMON STOCKS (99.88%) | | | | | | | | | | | | | | |
Communications (13.81%) | | | | | | | | | | | | | | |
Internet (2.94%) | | | | | | | | | | | | | | |
F5 Networks, Inc.(a) | | | | | 426,719 | | | | | | | $ | 52,068,252 | |
| | | | | | | | | | |
| | | | |
Media (6.62%) | | | | | | | | | | | | | | |
Discovery Communications, Inc., Class C(a) | | | | | 1,472,174 | | | | | | | | 44,503,820 | |
Scripps Networks Interactive, Inc., Class A | | | | | 207,959 | | | | | | | | 14,528,016 | |
Time Warner, Inc. | | | | | 168,825 | | | | | | | | 14,250,518 | |
Walt Disney Co. | | | | | 404,631 | | | | | | | | 43,991,482 | |
| | | | | | | | | | |
| | | | | | | | | | | | | 117,273,836 | |
| | | | | | | | | | |
| | | | |
Telecommunications (4.25%) | | | | | | | | | | | | | | |
Cisco Systems, Inc. | | | | | 800,621 | | | | | | | | 23,081,904 | |
Verizon Communications, Inc. | | | | | 1,032,503 | | | | | | | | 52,079,451 | |
| | | | | | | | | | |
| | | | | | | | | | | | | 75,161,355 | |
| | | | | | | | | | |
| | | | |
TOTAL COMMUNICATIONS | | | | | | | | | | | | | 244,503,443 | |
| | | | | | | | | | | | | | |
| | | | |
Consumer, Cyclical (5.02%) | | | | | | | | | | | | | | |
Apparel (0.85%) | | | | | | | | | | | | | | |
LVMH Moet Hennessy Louis Vuitton, SE | | | | | 86,032 | | | | | | | | 15,128,727 | |
| | | | | | | | | | |
| | | | |
Distribution/Wholesale (3.64%) | | | | | | | | | | | | | | |
Fossil Group, Inc.(a) | | | | | 766,835 | | | | | | | | 64,398,803 | |
| | | | | | | | | | |
| | | | |
Lodging (0.53%) | | | | | | | | | | | | | | |
Intercontinental Hotels Group PLC, ADR | | | | | 220,847 | | | | | | | | 9,410,291 | |
| | | | | | | | | | |
| | | | |
TOTAL CONSUMER, CYCLICAL | | | | | | | | | | | | | 88,937,821 | |
| | | | | | | | | | | | | | |
| | | | |
Consumer, Non-cyclical (8.70%) | | | | | | | | | | | | | | |
Commercial Services (3.81%) | | | | | | | | | | | | | | |
Mastercard, Inc., Class A | | | | | 541,893 | | | | | | | | 48,884,168 | |
Sabre Corp. | | | | | 742,046 | | | | | | | | 18,469,525 | |
| | | | | | | | | | |
| | | | | | | | | | | | | 67,353,693 | |
| | | | | | | | | | |
| | | | |
Cosmetics/Personal Care (0.70%) | | | | | | | | | | | | | | |
Colgate-Palmolive Co. | | | | | 185,215 | | | | | | | | 12,461,265 | |
| | | | | | | | | | |
| | | | |
Healthcare-Services (4.19%) | | | | | | | | | | | | | | |
Aetna, Inc. | | | | | 484,727 | | | | | | | | 51,802,774 | |
| | |
| 12 | | www.vulcanvaluepartners.com |
| | |
| Vulcan Value Partners Fund | | Statement of Investments |
|
| | April 30, 2015 |
| | | | | | | | | | | | | | |
| | | | | Shares | | | | | | Value (Note 2) | |
| |
Consumer, Non-cyclical (continued) | | | | | | | | | | | | | | |
Healthcare-Services (continued) | | | | | | | | | | | | | | |
Anthem, Inc. | | | | | 147,777 | | | | | | | $ | 22,303,983 | |
| | | | | | | | | | |
| | | | | | | | | | | | | 74,106,757 | |
| | | | | | | | | | |
| | | | |
TOTAL CONSUMER, NON-CYCLICAL | | | | | | | | | | | | | 153,921,715 | |
| | | | | | | | | | | | | | |
| | | | |
Energy (4.24%) | | | | | | | | | | | | | | |
Oil & Gas Services (4.24%) | | | | | | | | | | | | | | |
National Oilwell Varco, Inc. | | | | | 1,380,312 | | | | | | | | 75,102,776 | |
| | | | | | | | | | |
| | | | |
TOTAL ENERGY | | | | | | | | | | | | | 75,102,776 | |
| | | | | | | | | | | | | | |
| | | | |
Financial (32.01%) | | | | | | | | | | | | | | |
Banks (6.03%) | | | | | | | | | | | | | | |
Bank of New York Mellon Corp. | | | | | 1,090,318 | | | | | | | | 46,164,064 | |
State Street Corp. | | | | | 784,811 | | | | | | | | 60,524,625 | |
| | | | | | | | | | |
| | | | | | | | | | | | | 106,688,689 | |
| | | | | | | | | | |
| | | | |
Diversified Financial Services (15.47%) | | | | | | | | | | | | | | |
Aberdeen Asset Management PLC | | | | | 9,554,807 | | | | | | | | 70,323,379 | |
Franklin Resources, Inc. | | | | | 1,372,119 | | | | | | | | 70,746,456 | |
NASDAQ OMX Group, Inc. | | | | | 766,821 | | | | | | | | 37,290,505 | |
T Rowe Price Group, Inc. | | | | | 540,235 | | | | | | | | 43,856,277 | |
Visa, Inc., Class A | | | | | 782,352 | | | | | | | | 51,674,350 | |
| | | | | | | | | | |
| | | | | | | | | | | | | 273,890,967 | |
| | | | | | | | | | |
| | | | |
Insurance (10.51%) | | | | | | | | | | | | | | |
Axis Capital Holdings, Ltd. | | | | | 1,044,600 | | | | | | | | 54,381,876 | |
Chubb Corp. | | | | | 518,835 | | | | | | | | 51,027,422 | |
Everest Re Group, Ltd. | | | | | 265,959 | | | | | | | | 47,582,725 | |
PartnerRe, Ltd. | | | | | 258,242 | | | | | | | | 33,054,976 | |
| | | | | | | | | | |
| | | | | | | | | | | | | 186,046,999 | |
| | | | | | | | | | |
| | | | |
TOTAL FINANCIAL | | | | | | | | | | | | | 566,626,655 | |
| | | | | | | | | | | | | | |
| | | | |
Industrial (18.36%) | | | | | | | | | | | | | | |
Aerospace & Defense (2.82%) | | | | | | | | | | | | | | |
Boeing Co. | | | | | 347,828 | | | | | | | | 49,857,666 | |
| | | | | | | | | | |
| | | | |
Electrical Components & Equipment (1.00%) | | | | | | | | | | | | | | |
Emerson Electric Co. | | | | | 300,004 | | | | | | | | 17,649,235 | |
| | | | | | | | | | |
| | |
| Annual Report | April 30, 2015 | | 13 |
| | |
| Statement of Investments | | Vulcan Value Partners Fund |
|
| April 30, 2015 | | |
| | | | | | | | | | | | | | |
| | | | | Shares | | | | | | Value (Note 2) | |
| |
Industrial (continued) | | | | | | | | | | | | | | |
Industrial Services (2.42%) | | | | | | | | | | | | | | |
MSC Industrial Direct Co., Inc., Class A | | | | | 603,596 | | | | | | | $ | 42,891,532 | |
| | | | | | | | | | |
| | | | |
Metal Fabricate/Hardware (1.89%) | | | | | | | | | | | | | | |
Precision Castparts Corp. | | | | | 161,781 | | | | | | | | 33,438,515 | |
| | | | | | | | | | |
| | | | |
Miscellaneous Manufacturing (10.23%) | | | | | | | | | | | | | | |
Dover Corp. | | | | | 702,670 | | | | | | | | 53,206,172 | |
Parker-Hannifin Corp. | | | | | 1,071,216 | | | | | | | | 127,860,342 | |
| | | | | | | | | | |
| | | | | | | | | | | | | 181,066,514 | |
| | | | | | | | | | |
| | | | |
TOTAL INDUSTRIAL | | | | | | | | | | | | | 324,903,462 | |
| | | | | | | | | | | | | | |
| | | | |
Technology (17.74%) | | | | | | | | | | | | | | |
Computers (0.91%) | | | | | | | | | | | | | | |
Apple, Inc. | | | | | 128,629 | | | | | | | | 16,097,919 | |
| | | | | | | | | | |
| | | | |
Semiconductors (2.77%) | | | | | | | | | | | | | | |
QUALCOMM, Inc. | | | | | 722,789 | | | | | | | | 49,149,652 | |
| | | | | | | | | | |
| | | | |
Software (14.06%) | | | | | | | | | | | | | | |
Check Point Software Technologies, Ltd.(a) | | | | | 365,926 | | | | | | | | 30,547,503 | |
Microsoft Corp. | | | | | 1,016,428 | | | | | | | | 49,439,058 | |
MSCI, Inc. | | | | | 431,331 | | | | | | | | 26,393,144 | |
Oracle Corp. | | | | | 3,265,865 | | | | | | | | 142,457,031 | |
| | | | | | | | | | |
| | | | | | | | | | | | | 248,836,736 | |
| | | | | | | | | | |
| | | | |
TOTAL TECHNOLOGY | | | | | | | | | | | | | 314,084,307 | |
| | | | | | | | | | | | | | |
| | | | |
TOTAL COMMON STOCKS | | | | | | | | | | | | | | |
(Cost $1,535,931,407) | | | | | | | | | | | | | 1,768,080,179 | |
| |
| | |
| 14 | | www.vulcanvaluepartners.com |
| | |
| Vulcan Value Partners Fund | | Statement of Investments |
|
| | April 30, 2015 |
| | | | | | | | | | | | |
| | | 7-Day | | | | | | Value | |
| | | Yield | | | Shares | | | (Note 2) | |
| |
SHORT TERM INVESTMENTS (2.08%) | | | | | | | | | | | | |
Money Market Fund (2.08%) | | | | | | | | | | | | |
Dreyfus Treasury Prime Cash Management Fund, Institutional Shares | | | 0.010 | % | | | 36,748,914 | | | $ | 36,748,914 | |
| | | | | | | | | | | | |
| | | |
TOTAL SHORT TERM INVESTMENTS | | | | | | | | | | | | |
(Cost $36,748,914) | | | | | | | | | | | 36,748,914 | |
| |
| | | |
TOTAL INVESTMENTS (101.96%) | | | | | | | | | | | | |
(Cost $1,572,680,321) | | | | | | | | | | $ | 1,804,829,093 | |
| | | |
Liabilities In Excess Of Other Assets (-1.96%) | | | | | | | | | | | (34,724,726) | |
| |
| | | |
NET ASSETS (100.00%) | | | | | | | | | | $ | 1,770,104,367 | |
| |
| (a) | Non-Income Producing Security. |
Common Abbreviations:
ADR - American Depositary Receipt.
Ltd. - Limited.
PLC - Public Limited Company.
SE - A European Company which can operate on a Europe-wide basis and be governed by Community law directly applicable in all Member States.
Holdings are subject to change.
For Fund compliance purposes, the Fund’s industry classifications refer to any one or more of the industry sub-classifications used by one or more widely recognized market indexes or ratings group indexes, and/or as defined by Fund management. This definition may not apply for purposes of this report, which may combine industry sub-classifications for reporting ease. Industries are shown as a percentage of net assets.
See Accompanying Notes to Financial Statements.
| | |
| Annual Report | April 30, 2015 | | 15 |
| | |
| Statement of Investments | | Vulcan Value Partners Small Cap Fund |
|
| April 30, 2015 | | |
| | | | | | | | | | | | | | |
| | | | | | | | | | | Value | |
| | | | | Shares | | | | | | (Note 2) | |
| |
COMMON STOCKS (88.96%) | | | | | | | | | | | | | | |
Basic Materials (0.24%) | | | | | | | | | | | | | | |
Chemicals (0.24%) | | | | | | | | | | | | | | |
KMG Chemicals, Inc. | | | | | 93,876 | | | | | | | $ | 2,748,689 | |
| | | | | | | | | | |
| | | | |
TOTAL BASIC MATERIALS | | | | | | | | | | | | | 2,748,689 | |
| | | | | | | | | | | | | | |
| | | | |
Communications (2.49%) | | | | | | | | | | | | | | |
Media (2.49%) | | | | | | | | | | | | | | |
SAI Global, Ltd. | | | | | 9,002,349 | | | | | | | | 28,139,840 | |
| | | | | | | | | | |
| | | | |
TOTAL COMMUNICATIONS | | | | | | | | | | | | | 28,139,840 | |
| | | | | | | | | | | | | | |
| | | | |
Consumer, Cyclical (10.26%) | | | | | | | | | | | | | | |
Distribution/Wholesale (3.61%) | | | | | | | | | | | | | | |
Fossil Group, Inc.(a) | | | | | 486,798 | | | | | | | | 40,881,296 | |
| | | | | | | | | | |
| | | | |
Housewares (2.36%) | | | | | | | | | | | | | | |
Tupperware Brands Corp. | | | | | 399,993 | | | | | | | | 26,743,532 | |
| | | | | | | | | | |
| | | | |
Retail (4.29%) | | | | | | | | | | | | | | |
Nu Skin Enterprises, Inc., Class A | | | | | 860,480 | | | | | | | | 48,660,144 | |
| | | | | | | | | | |
| | | | |
TOTAL CONSUMER, CYCLICAL | | | | | | | | | | | | | 116,284,972 | |
| | | | | | | | | | | | | | |
| | | | |
Consumer, Non-cyclical (4.72%) | | | | | | | | | | | | | | |
Commercial Services (3.96%) | | | | | | | | | | | | | | |
Navigant Consulting, Inc.(a) | | | | | 2,279,035 | | | | | | | | 32,954,846 | |
Sabre Corp. | | | | | 480,737 | | | | | | | | 11,965,544 | |
| | | | | | | | | | |
| | | | | | | | | | | | | 44,920,390 | |
| | | | | | | | | | |
| | | | |
Healthcare-Services (0.76%) | | | | | | | | | | | | | | |
Chemed Corp. | | | | | 74,234 | | | | | | | | 8,555,468 | |
| | | | | | | | | | |
| | | | |
TOTAL CONSUMER, NON-CYCLICAL | | | | | | | | | | | | | 53,475,858 | |
| | | | | | | | | | | | | | |
| | | | |
Financial (33.94%) | | | | | | | | | | | | | | |
Diversified Financial Services (15.76%) | | | | | | | | | | | | | | |
Ashmore Group PLC | | | | | 11,317,107 | | | | | | | | 53,713,547 | |
Eaton Vance Corp. | | | | | 1,268,487 | | | | | | | | 52,109,446 | |
NASDAQ OMX Group, Inc. | | | | | 514,887 | | | | | | | | 25,038,955 | |
Virtus Investment Partners, Inc. | | | | | 357,269 | | | | | | | | 47,738,284 | |
| | | | | | | | | | |
| | | | | | | | | | | | | 178,600,232 | |
| | | | | | | | | | |
| | |
| 16 | | www.vulcanvaluepartners.com |
| | |
| Vulcan Value Partners Small Cap Fund | | Statement of Investments |
|
| | April 30, 2015 |
| | | | | | | | | | | | | | |
| | | | | | | | | | | Value | |
| | | | | Shares | | | | | | (Note 2) | |
| |
Financial (continued) | | | | | | | | | | | | | | |
Insurance (18.18%) | | | | | | | | | | | | | | |
Aspen Insurance Holdings, Ltd. | | | | | 944,263 | | | | | | | $ | 44,125,410 | |
Axis Capital Holdings, Ltd. | | | | | 969,350 | | | | | | | | 50,464,361 | |
Everest Re Group, Ltd. | | | | | 196,239 | | | | | | | | 35,109,120 | |
Navigators Group, Inc.(a) | | | | | 617,434 | | | | | | | | 48,190,724 | |
ProAssurance Corp. | | | | | 226,611 | | | | | | | | 10,186,164 | |
Safety Insurance Group, Inc. | | | | | 307,666 | | | | | | | | 17,890,778 | |
| | | | | | | | | | |
| | | | | | | | | | | | | 205,966,557 | |
| | | | | | | | | | |
| | | | |
TOTAL FINANCIAL | | | | | | | | | | | | | 384,566,789 | |
| | | | | | | | | | | | | | |
| | | | |
Industrial (23.63%) | | | | | | | | | | | | | | |
Aerospace & Defense (2.11%) | | | | | | | | | | | | | | |
Curtiss-Wright Corp. | | | | | 326,761 | | | | | | | | 23,873,159 | |
| | | | | | | | | | |
| | | | |
Electrical Components & Equipment (3.50%) | | | | | | | | | | | | | | |
EnerSys | | | | | 583,851 | | | | | | | | 39,643,483 | |
| | | | | | | | | | |
| | | | |
Electronics (5.50%) | | | | | | | | | | | | | | |
Ituran Location and Control, Ltd. | | | | | 1,360,860 | | | | | | | | 31,068,434 | |
Woodward, Inc. | | | | | 665,351 | | | | | | | | 31,304,764 | |
| | | | | | | | | | |
| | | | | | | | | | | | | 62,373,198 | |
| | | | | | | | | | |
| | | | |
Engineering & Construction (0.95%) | | | | | | | | | | | | | | |
Exponent, Inc. | | | | | 121,623 | | | | | | | | 10,777,014 | |
| | | | | | | | | | |
| | | | |
Industrial Services (2.61%) | | | | | | | | | | | | | | |
MSC Industrial Direct Co., Inc., Class A | | | | | 415,546 | | | | | | | | 29,528,699 | |
| | | | | | | | | | |
| | | | |
Machinery-Diversified (3.61%) | | | | | | | | | | | | | | |
Graco, Inc. | | | | | 144,866 | | | | | | | | 10,375,303 | |
Lindsay Corp. | | | | | 292,737 | | | | | | | | 23,181,843 | |
Nordson Corp. | | | | | 92,190 | | | | | | | | 7,342,933 | |
| | | | | | | | | | |
| | | | | | | | | | | | | 40,900,079 | |
| | | | | | | | | | |
| | | | |
Miscellaneous Manufacturing (3.82%) | | | | | | | | | | | | | | |
Actuant Corp., Class A | | | | | 1,068,669 | | | | | | | | 25,455,696 | |
Donaldson Co., Inc. | | | | | 477,522 | | | | | | | | 17,844,997 | |
| | | | | | | | | | |
| | | | | | | | | | | | | 43,300,693 | |
| | | | | | | | | | |
| | |
| Annual Report | April 30, 2015 | | 17 |
| | |
| Statement of Investments | | Vulcan Value Partners Small Cap Fund |
|
| April 30, 2015 | | |
| | | | | | | | | | | | | | | | |
| | | | | | | | | | | | | Value | |
| | | | | | | Shares | | | | | | (Note 2) | |
| |
Industrial (continued) | | | | | | | | | | | | | | | | |
Transportation (1.53%) | | | | | | | | | | | | | | | | |
Forward Air Corp. | | | | | | | 345,289 | | | | | | | $ | 17,392,207 | |
| | | | | | | | | | | | |
| | | | | |
TOTAL INDUSTRIAL | | | | | | | | | | | | | | | 267,788,532 | |
| | | | | | | | | | | | | | | | |
| | | | | |
Technology (13.68%) | | | | | | | | | | | | | | | | |
Semiconductors (1.77%) | | | | | | | | | | | | | | | | |
Rovi Corp.(a) | | | | | | | 1,085,984 | | | | | | | | 20,101,564 | |
| | | | | | | | | | | | |
| | | | | |
Software (11.91%) | | | | | | | | | | | | | | | | |
ACI Worldwide, Inc.(a) | | | | | | | 3,592,022 | | | | | | | | 82,724,267 | |
MSCI, Inc. | | | | | | | 600,346 | | | | | | | | 36,735,172 | |
Omnicell, Inc.(a) | | | | | | | 435,720 | | | | | | | | 15,481,131 | |
| | | | | | | | | | | | |
| | | | | | | | | | | | | | | 134,940,570 | |
| | | | | | | | | | | | |
| | | | | |
TOTAL TECHNOLOGY | | | | | | | | | | | | | | | 155,042,134 | |
| | | | | | | | | | | | | | | | |
| | | | | |
TOTAL COMMON STOCKS | | | | | | | | | | | | | | | | |
(Cost $914,762,655) | | | | | | | | | | | | | | | 1,008,046,814 | |
| |
| | | | | |
| | | | | 7-Day | | | | | | | | Value | |
| | | | | Yield | | Shares | | | | | | (Note 2) | |
| |
SHORT TERM INVESTMENTS (9.44%) | | | | | | | | | | | | | | | | |
Money Market Fund (9.44%) | | | | | | | | | | | | | | | | |
Dreyfus Treasury Prime Cash Management Fund, Institutional Shares | | | | 0.010% | | | 106,983,029 | | | | | | | | 106,983,029 | |
| | | | | | | | | | | | | | | | |
| | | | | |
TOTAL SHORT TERM INVESTMENTS | | | | | | | | | | | | | | | | |
(Cost $106,983,029) | | | | | | | | | | | | | | | 106,983,029 | |
| |
| | | | | |
TOTAL INVESTMENTS (98.40%) | | | | | | | | | | | | | | | | |
(Cost $1,021,745,684) | | | | | | | | | | | | | | $ | 1,115,029,843 | |
| | | | |
Other Assets In Excess Of Liabilities (1.60%) | | | | | | | | | | | | | 18,092,517 | |
| |
| | | | | |
NET ASSETS (100.00%) | | | | | | | | | | | | | | $ | 1,133,122,360 | |
| |
| | |
| 18 | | www.vulcanvaluepartners.com |
| | |
| Vulcan Value Partners Small Cap Fund | | Statement of Investments |
|
| | April 30, 2015 |
| (a) | Non-Income Producing Security. |
Common Abbreviations:
Ltd. - Limited.
PLC - Public Limited Company.
Holdings are subject to change.
For Fund compliance purposes, the Fund’s industry classifications refer to any one or more of the industry sub-classifications used by one or more widely recognized market indexes or ratings group indexes, and/or as defined by Fund management. This definition may not apply for purposes of this report, which may combine industry sub-classifications for reporting ease. Industries are shown as a percentage of net assets.
See Accompanying Notes to Financial Statements.
| | |
| Annual Report | April 30, 2015 | | 19 |
Statements of Assets and Liabilities
April 30, 2015
| | | | | | | | |
| | | Vulcan Value Partners | | | Vulcan Value Partners | |
| | | Fund | | | Small Cap Fund | |
| |
ASSETS: | | | | | | | | |
Investments, at value | | $ | 1,804,829,093 | | | $ | 1,115,029,843 | |
Receivable for investments sold | | | 12,486,921 | | | | 18,264,772 | |
Receivable for shares sold | | | 2,041,004 | | | | 924,047 | |
Dividends receivable | | | 1,055,371 | | | | 484,109 | |
Other assets | | | 38,482 | | | | 19,698 | |
| |
Total assets | | | 1,820,450,871 | | | | 1,134,722,469 | |
| |
| | |
LIABILITIES: | | | | | | | | |
Payable for investments purchased | | | 47,666,780 | | | | – | |
Payable for shares redeemed | | | 1,030,706 | | | | 401,044 | |
Payable to adviser | | | 1,430,193 | | | | 1,068,530 | |
Payable for administration fees | | | 38,828 | | | | 25,120 | |
Payable for transfer agency fees | | | 25,049 | | | | 39,462 | |
Payable for professional fees | | | 18,634 | | | | 18,738 | |
Payable for trustee fees and expenses | | | 12,626 | | | | 8,216 | |
Accrued expenses and other liabilities | | | 123,688 | | | | 38,999 | |
| |
Total liabilities | | | 50,346,504 | | | | 1,600,109 | |
| |
NET ASSETS | | $ | 1,770,104,367 | | | $ | 1,133,122,360 | |
| |
| | |
NET ASSETS CONSIST OF: | | | | | | | | |
| | |
Paid-in capital (Note 5) | | $ | 1,475,012,366 | | | $ | 1,023,366,438 | |
Accumulated net investment income | | | 3,221,845 | | | | – | |
Accumulated net realized gain on investments | | | 59,721,384 | | | | 16,471,763 | |
Net unrealized appreciation in value of investments | | | 232,148,772 | | | | 93,284,159 | |
| |
NET ASSETS | | $ | 1,770,104,367 | | | $ | 1,133,122,360 | |
| |
| | |
INVESTMENTS, AT COST | | $ | 1,572,680,321 | | | $ | 1,021,745,684 | |
| | |
PRICING OF SHARES: | | | | | | | | |
Net Asset Value, offering and redemption price per share | | $ | 19.97 | | | $ | 18.61 | |
Shares of beneficial interest outstanding (unlimited number of shares, no par value common stock authorized) | | | 88,637,682 | | | | 60,879,664 | |
See Accompanying Notes to Financial Statements.
| | |
| 20 | | www.vulcanvaluepartners.com |
Statements of Operations
For the Year Ended April 30, 2015
| | | | | | | | |
| | | Vulcan Value Partners
Fund | | | Vulcan Value Partners
Small Cap Fund | |
| |
INVESTMENT INCOME: | | | | | | | | |
Dividends | | $ | 29,457,731 | | | $ | 19,579,042 | |
Foreign taxes withheld | | | (760,509) | | | | (684,782) | |
| |
Total investment income | | | 28,697,222 | | | | 18,894,260 | |
| |
| | |
EXPENSES: | | | | | | | | |
Investment advisory fees (Note 6) | | | 13,036,173 | | | | 12,017,370 | |
Administrative fees | | | 372,672 | | | | 301,250 | |
Transfer agency fees | | | 214,649 | | | | 505,558 | |
Professional fees | | | 42,877 | | | | 40,232 | |
Custodian fees | | | 151,687 | | | | 144,043 | |
Trustee fees and expenses | | | 41,486 | | | | 30,082 | |
Other | | | 182,064 | | | | 103,813 | |
| |
Total expenses before waiver | | | 14,041,608 | | | | 13,142,348 | |
Less fees waived/reimbursed by investment adviser (Note 6) | | | – | | | | (79,989) | |
| |
Total net expenses | | | 14,041,608 | | | | 13,062,359 | |
| |
NET INVESTMENT INCOME | | | 14,655,614 | | | | 5,831,901 | |
| |
| | |
Net realized gain on investments | | | 98,001,413 | | | | 75,800,547 | |
Net change in unrealized appreciation of investments | | | 79,272,468 | | | | 22,946,461 | |
| |
NET REALIZED AND UNREALIZED GAIN ON INVESTMENTS | | | 177,273,881 | | | | 98,747,008 | |
| |
NET INCREASE IN NET ASSETS RESULTING FROM OPERATIONS | | $ | 191,929,495 | | | $ | 104,578,909 | |
| |
See Accompanying Notes to Financial Statements.
| | |
| Annual Report | April 30, 2015 | | 21 |
| | |
| Statements of Changes in Net Assets | | Vulcan Value Partners Fund |
| | | | | | | | |
| | | For the Year Ended
April 30, 2015 | | | For the Year Ended
April 30, 2014 | |
| |
OPERATIONS: | | | | | | | | |
Net investment income | | $ | 14,655,614 | | | $ | 5,507,738 | |
Net realized gain on investments and foreign currency transactions | | | 98,001,413 | | | | 45,057,654 | |
Net change in unrealized appreciation on investments | | | 79,272,468 | | | | 84,723,466 | |
| |
Net increase in net assets resulting from operations | | | 191,929,495 | | | | 135,288,858 | |
| |
| | |
DISTRIBUTIONS TO SHAREHOLDERS (Note 3): | | | | | | | | |
From net investment income | | | (12,786,089) | | | | (4,575,383) | |
From net realized gains on investments | | | (68,848,994) | | | | (18,524,637) | |
| |
Net decrease in net assets from distributions | | | (81,635,083) | | | | (23,100,020) | |
| |
| | |
SHARE TRANSACTIONS (Note 5): | | | | | | | | |
Proceeds from sales of shares | | | 787,552,477 | | | | 410,644,045 | |
Issued to shareholders in reinvestment of distributions | | | 66,389,769 | | | | 19,326,050 | |
Cost of shares redeemed, net of redemption fees | | | (123,961,345) | | | | (59,627,069) | |
| |
Net increase from share transactions | | | 729,980,901 | | | | 370,343,026 | |
| |
| | |
Net increase in net assets | | | 840,275,313 | | | | 482,531,864 | |
| |
| | |
NET ASSETS: | | | | | | | | |
Beginning of year | | | 929,829,054 | | | | 447,297,190 | |
| |
End of year* | | $ | 1,770,104,367 | | | $ | 929,829,054 | |
| |
| | |
*Includes accumulated net investment income of: | | $ | 3,221,845 | | | $ | 1,352,320 | |
See Accompanying Notes to Financial Statements.
| | |
| 22 | | www.vulcanvaluepartners.com |
| | |
| Vulcan Value Partners Small Cap Fund | | Statements of Changes in Net Assets |
| | | | | | | | |
| | | For the Year Ended
April 30, 2015 | | | For the Year Ended
April 30, 2014 | |
| |
OPERATIONS: | | | | | | | | |
Net investment income/(loss) | | $ | 5,831,901 | | | $ | (371,534) | |
Net realized gain on investments | | | 75,800,547 | | | | 59,583,583 | |
Net change in unrealized appreciation on investments | | | 22,946,461 | | | | 29,817,231 | |
| |
Net increase in net assets resulting from operations | | | 104,578,909 | | | | 89,029,280 | |
| |
| | |
DISTRIBUTIONS TO SHAREHOLDERS (Note 3): | | | | | | | | |
From net investment income | | | (5,724,213) | | | | – | |
From net realized gains on investments | | | (94,956,634) | | | | (37,145,114) | |
| |
Net decrease in net assets from distributions | | | (100,680,847) | | | | (37,145,114) | |
| |
| | |
SHARE TRANSACTIONS (Note 5): | | | | | | | | |
Proceeds from sales of shares | | | 286,238,909 | | | | 753,029,272 | |
Issued to shareholders in reinvestment of distributions | | | 84,059,577 | | | | 28,982,662 | �� |
Cost of shares redeemed, net of redemption fees | | | (307,320,451) | | | | (192,802,041) | |
| |
Net increase from share transactions | | | 62,978,035 | | | | 589,209,893 | |
| |
| | |
Net increase in net assets | | | 66,876,097 | | | | 641,094,059 | |
| |
| | |
NET ASSETS: | | | | | | | | |
Beginning of year | | | 1,066,246,263 | | | | 425,152,204 | |
| |
End of year* | | $ | 1,133,122,360 | | | $ | 1,066,246,263 | |
| |
| | |
*Includes accumulated net investment income/(loss) of: | | $ | – | | | $ | – | |
See Accompanying Notes to Financial Statements.
| | |
| Annual Report | April 30, 2015 | | 23 |
Financial Highlights
For a share outstanding throughout the years presented.
|
|
|
NET ASSET VALUE, BEGINNING OF PERIOD |
|
INCOME/(LOSS) FROM OPERATIONS: |
|
Net investment income(a) |
Net realized and unrealized gain on investments |
|
Total from investment operations |
|
|
LESS DISTRIBUTIONS TO SHAREHOLDERS: |
From net investment income |
From net realized gains on investments |
|
Total distributions |
|
|
Redemption fees added to paid-in capital |
|
Increase in net asset value |
|
NET ASSET VALUE, END OF YEAR |
|
|
Total return |
|
RATIOS AND SUPPLEMENTAL DATA: |
Net assets, end of year (000’s) |
|
Ratio of expenses to average net assets without fee waivers/reimbursements |
Ratio of expenses to average net assets including fee waivers/reimbursements |
Net investment income to average net assets including fee waivers/reimbursements |
|
Portfolio turnover rate |
| | (a) | Per share numbers have been calculated using the average shares method. |
| | (b) | Less than $0.005 per share. |
See Accompanying Notes to Financial Statements.
| | |
| 24 | | www.vulcanvaluepartners.com |
Vulcan Value Partners Fund
| | | | | | | | | | | | | | | | | | |
For the Year
Ended April 30,
2015 | | | For the Year
Ended April 30,
2014 | | | For the Year
Ended April 30,
2013 | | | For the Year
Ended April 30,
2012 | | | For the Year
Ended April 30,
2011 | |
| | |
| | $ 18.20 | | | | $ 15.28 | | | | $ 13.03 | | | | $ 11.66 | | | | $ 10.57 | |
| | |
| | | | | | | | | | | | | | | | | | | |
| | | | |
| | 0.22 | | | | 0.14 | | | | 0.15 | | | | 0.02 | | | | 0.01 | |
| | 2.77 | | | | 3.33 | | | | 2.35 | | | | 1.45 | | | | 1.13 | |
| | |
| | 2.99 | | | | 3.47 | | | | 2.50 | | | | 1.47 | | | | 1.14 | |
| | |
| | | | |
| | | | | | | | | | | | | | | | | | | |
| | (0.17) | | | | (0.11) | | | | (0.12) | | | | (0.01) | | | | (0.01) | |
| | (1.05) | | | | (0.44) | | | | (0.13) | | | | (0.09) | | | | (0.04) | |
| | |
| | (1.22) | | | | (0.55) | | | | (0.25) | | | | (0.10) | | | | (0.05) | |
| | |
| | | | |
| | 0.00 (b) | | | | 0.00 (b) | | | | 0.00 (b) | | | | 0.00 (b) | | | | 0.00 (b) | |
| | |
| | 1.77 | | | | 2.92 | | | | 2.25 | | | | 1.37 | | | | 1.09 | |
| | |
| | $ 19.97 | | | | $ 18.20 | | | | $ 15.28 | | | | $ 13.03 | | | | $ 11.66 | |
| | |
| | | | |
| | 16.61% | | | | 22.84% | | | | 19.33% | | | | 12.73% | | | | 10.82% | |
| | | | |
| | | | | | | | | | | | | | | | | | | |
| | $ 1,770,104 | | | | $ 929,829 | | | | $ 447,297 | | | | $ 125,087 | | | | $ 48,757 | |
| | | | |
| | 1.08% | | | | 1.09% | | | | 1.18% | | | | 1.51% | | | | 2.01% | |
| | 1.08% | | | | 1.09% | | | | 1.18% | | | | 1.50% | | | | 1.50% | |
| | 1.12% | | | | 0.80% | | | | 1.06% | | | | 0.16% | | | | 0.07% | |
| | | | |
| | 64% | | | | 56% | | | | 24% | | | | 49% | | | | 44% | |
| | |
| Annual Report | April 30, 2015 | | 25 |
Financial Highlights
For a share outstanding throughout the years presented.
|
|
|
NET ASSET VALUE, BEGINNING OF PERIOD |
|
INCOME/(LOSS) FROM OPERATIONS: |
|
Net investment income/(loss)(a) |
Net realized and unrealized gain on investments |
|
Total from investment operations |
|
|
LESS DISTRIBUTIONS TO SHAREHOLDERS: |
From net investment income |
From net realized gains on investments |
|
Total distributions |
|
|
Redemption fees added to paid-in capital |
|
Increase/(decrease) in net asset value |
|
NET ASSET VALUE, END OF YEAR |
|
|
Total return |
|
RATIOS AND SUPPLEMENTAL DATA: |
Net assets, end of year (000’s) |
|
Ratio of expenses to average net assets without fee waivers/reimbursements |
Ratio of expenses to average net assets including fee waivers/reimbursements |
|
Net investment income/(loss) to average net assets including fee waivers/reimbursements |
|
Portfolio turnover rate |
| (a) | Per share numbers have been calculated using the average shares method. |
| (b) | Less than $0.005 per share. |
See Accompanying Notes to Financial Statements.
| | |
| 26 | | www.vulcanvaluepartners.com |
Vulcan Value Partners Small Cap Fund
| | | | | | | | | | | | | | | | | | |
For the Year
Ended April 30,
2015 | | | For the Year
Ended April 30,
2014 | | | For the Year
Ended April 30,
2013 | | | For the Year
Ended April 30,
2012 | | | For the Year
Ended April 30,
2011 | |
| | |
| | $ 18.74 | | | | $ 16.97 | | | | $ 13.18 | | | | $ 13.72 | | | | $ 11.60 | |
| | |
| | | | | | | | | | | | | | | | | | | |
| | | | |
| | 0.10 | | | | (0.01) | | | | 0.03 | | | | 0.02 | | | | (0.09) | |
| | 1.77 | | | | 2.76 | | | | 3.91 | | | | 0.17 | | | | 2.55 | |
| | |
| | 1.87 | | | | 2.75 | | | | 3.94 | | | | 0.19 | | | | 2.46 | |
| | |
| | | | |
| | | | | | | | | | | | | | | | | | | |
| | (0.11) | | | | – | | | | (0.06) | | | | – | | | | – | |
| | (1.89) | | | | (0.98) | | | | (0.09) | | | | (0.73) | | | | (0.34) | |
| | |
| | (2.00) | | | | (0.98) | | | | (0.15) | | | | (0.73) | | | | (0.34) | |
| | |
| | | | |
| | 0.00 (b) | | | | 0.00 (b) | | | | 0.00 (b) | | | | 0.00 (b) | | | | 0.00 (b) | |
| | |
| | (0.13) | | | | 1.77 | | | | 3.79 | | | | (0.54) | | | | 2.12 | |
| | |
| | $ 18.61 | | | | $ 18.74 | | | | $ 16.97 | | | | $ 13.18 | | | | $ 13.72 | |
| | |
| | |
| | | | |
| | 10.74% | | | | 16.11% | | | | 30.07% | | | | 2.10% | | | | 21.75% | |
| | | | |
| | | | | | | | | | | | | | | | | | | |
| | $ 1,133,122 | | | | $ 1,066,246 | | | | $ 425,152 | | | | $ 40,103 | | | | $ 36,363 | |
| | | | |
| | 1.26% | | | | 1.30% | | | | 1.38% | | | | 1.86% | | | | 2.50% | |
| | 1.25% | | | | 1.25% | | | | 1.28% | | | | 1.50% | | | | 1.50% | |
| | | | |
| | 0.56% | | | | (0.05%) | | | | 0.21% | | | | 0.15% | | | | (0.71%) | |
| | | | |
| | 73% | | | | 70% | | | | 57% | | | | 57% | | | | 60% | |
| | |
| Annual Report | April 30, 2015 | | 27 |
Notes to Financial Statements
April 30, 2015
1. ORGANIZATION
Financial Investors Trust (the “Trust”) is organized as a Delaware statutory trust and is registered as an open-end management investment company under the Investment Company Act of 1940, as amended (“1940 Act”). As of April 30, 2015, the Trust had 30 registered funds. This annual report describes the Vulcan Value Partners Fund and Vulcan Value Partners Small Cap Fund (each a “Fund” and collectively, the “Funds”). The Funds seek to achieve long-term capital appreciation.
The Vulcan Value Partners Fund and Vulcan Value Partners Small Cap Fund are both classified as a non-diversified investment company for purpose of the 1940 Act. As a result of ongoing operations, it is possible the Vulcan Value Partners Small Cap Fund may become a diversified investment company, which would occur at the earliest on or about November, 2015. In such case, the Fund may not resume operating in a non-diversified manner without first obtaining shareholder approval.
2. SIGNIFICANT ACCOUNTING POLICIES
The accompanying financial statements were prepared in accordance with accounting principles generally accepted in the United States of America (“U.S. GAAP”). The preparation of financial statements in conformity with U.S. GAAP requires management to make certain estimates and assumptions that affect the reported amounts of assets and liabilities and disclosures of contingent assets and liabilities at the date of the financial statements and the reported amounts of revenue and expenses during the period. Actual results could differ from those estimates. The Funds are considered an investment company for financial reporting purposes under U.S. GAAP. The following is a summary of significant accounting policies consistently followed by the Funds in preparation of their financial statements.
Investment Valuation: The Funds generally value their securities based on market prices determined at the close of regular trading on the New York Stock Exchange (“NYSE”), normally 4:00 p.m. Eastern Time, on each day the NYSE is open for trading.
For equity securities and mutual funds that are traded on an exchange, the market price is usually the closing sale or official closing price on that exchange. In the case of equity securities not traded on an exchange, or if such closing prices are not otherwise available, the securities are valued at the mean of the most recent bid and ask prices on such day. Redeemable securities issued by open-end registered investment companies are valued at the investment company’s applicable net asset value.
The market price for debt obligations is generally the price supplied by an independent third-party pricing service approved by the Board of Trustees (the “Board”), which may use a matrix, formula or other objective method that takes into consideration quotations from dealers, market transactions in comparable investments, market indices and yield curves. If vendors are unable to supply a price, or if the price supplied is deemed to be unreliable, the market price may be determined using quotations received from one or more broker–dealers that make a market in the security. Short-term debt obligations that will mature in 60 days or less are valued at amortized cost, unless it is determined that using this method would not reflect an investment’s fair value.
| | |
| 28 | | www.vulcanvaluepartners.com |
Notes to Financial Statements
April 30, 2015
When such prices or quotations are not available, or when the Fair Value Committee appointed by the Board believes that they are unreliable, securities may be priced using fair value procedures approved by the Board.
Fair Value Measurements: A three-tier hierarchy has been established to classify fair value measurements for disclosure purposes. Inputs refer broadly to the assumptions that market participants would use in pricing the asset or liability, including assumptions about risk. Inputs may be observable or unobservable. Observable inputs are inputs that reflect the assumptions market participants would use in pricing the asset or liability that are developed based on market data obtained from sources independent of the reporting entity. Unobservable inputs are inputs that reflect the reporting entity’s own assumptions about the assumptions market participants would use in pricing the asset or liability that are developed based on the best information available. Various inputs are used in determining the value of each Fund’s investments as of the reporting period end. The designated input levels are not necessarily an indication of the risk or liquidity associated with these investments. These inputs are categorized in the following hierarchy under applicable financial accounting standards:
| | | | |
Level 1 | | – | | Unadjusted quoted prices in active markets for identical investments, unrestricted assets or liabilities that the Funds have the ability to access at the measurement date; |
Level 2 | | – | | Quoted prices which are not active, quoted prices for similar assets or liabilities in active markets or inputs other than quoted prices that are observable (either directly or indirectly) for substantially the full term of the asset or liability; and |
Level 3 | | – | | Significant unobservable prices or inputs (including the Funds’ own assumptions in determining the fair value of investments) where there is little or no market activity for the asset or liability at the measurement date. |
The following is a summary of each input used to value each Fund’s investments as of April 30, 2015.
| | | | | | | | | | | | | | | | |
| Vulcan Value Partners Fund: | | | | | | | | | | | | |
| Investments in Securities at Value | | Level 1 -
Unadjusted
Quoted Prices | | | Level 2 - Other Significant
Observable
Inputs | | | Level 3 -
Significant
Unobservable
Inputs | | | Total | |
| |
Common Stocks(a) | | $ | 1,768,080,179 | | | $ | – | | | $ | – | | | $ | 1,768,080,179 | |
Short Term Investments | | | 36,748,914 | | | | – | | | | – | | | | 36,748,914 | |
| |
TOTAL | | $ | 1,804,829,093 | | | $ | – | | | $ | – | | | $ | 1,804,829,093 | |
| |
| | |
| Annual Report | April 30, 2015 | | 29 |
Notes to Financial Statements
April 30, 2015
| | | | | | | | | | | | | | | | |
| Vulcan Value Partners Small Cap Fund: | | | | | | | | | | | | |
| | | | | | Level 2 - Other | | | Level 3 - | | | | |
| | | Level 1 - | | | Significant | | | Significant | | | | |
| Investments in Securities at Value | | Unadjusted
Quoted Prices | | | Observable
Inputs | | | Unobservable
Inputs | | | Total | |
| |
Common Stocks | | | | | | | | | | | | | | | | |
Basic Materials | | $ | 2,748,689 | | | $ | – | | | $ | – | | | $ | 2,748,689 | |
Communications | | | – | | | | 28,139,840 | | | | – | | | | 28,139,840 | |
Consumer, Cyclical | | | 116,284,972 | | | | – | | | | – | | | | 116,284,972 | |
Consumer, Non-cyclical | | | 53,475,858 | | | | – | | | | – | | | | 53,475,858 | |
Financial | | | 330,853,242 | | | | 53,713,547 | | | | – | | | | 384,566,789 | |
Industrial | | | 267,788,532 | | | | – | | | | – | | | | 267,788,532 | |
Technology | | | 155,042,134 | | | | – | | | | – | | | | 155,042,134 | |
Short Term Investments | | | 106,983,029 | | | | – | | | | – | | | | 106,983,029 | |
| |
TOTAL | | $ | 1,033,176,456 | | | $ | 81,853,387 | | | $ | – | | | $ | 1,115,029,843 | |
| |
| (a) | For detailed descriptions, see the accompanying Statements of Investments. |
The Funds recognize transfers between levels as of the end of period. For the year ended April 30, 2015, the Funds did not have any transfer between Level 1 and Level 2. For the year ended April 30, 2015, the Funds did not have any securities that used significant unobservable inputs (Level 3) in determining fair value.
Investment Transactions and Investment Income: Investment transactions are accounted for on the date the investments are purchased or sold (trade date). Realized gains and losses from investment transactions are reported on an identified cost basis, which is the same basis the Funds use for federal income tax purposes. Interest income, which includes accretion of discounts and amortization of premiums, is accrued and recorded as earned. Dividend income is recognized on the ex-dividend date or for certain foreign securities, as soon as information is available to the Funds. All of the realized and unrealized gains and losses and net investment income, are allocated daily to each class in proportion to its average daily net assets.
Foreign Securities: The Funds may directly purchase securities of foreign issuers. Investing in securities of foreign issuers involves special risks not typically associated with investing in securities of U.S. issuers. The risks include possible reevaluation of currencies, the inability to repatriate foreign currency, less complete financial information about companies and possible future adverse political and economic developments. Moreover, securities of many foreign issuers and their markets may be less liquid and their prices more volatile than those of securities of comparable U.S. issuers.
Trust Expenses: Some expenses of the Trust can be directly attributed to the Funds. Expenses which cannot be directly attributed are apportioned among all funds in the Trust based on average net assets of each fund.
Fund Expenses: Expenses that are specific to a Fund are charged directly to that Fund.
| | |
| 30 | | www.vulcanvaluepartners.com |
Notes to Financial Statements
April 30, 2015
Federal Income Taxes: Each Fund complies with the requirements under Subchapter M of the Internal Revenue Code of 1986, as amended, applicable to regulated investment companies and intends to distribute substantially all of its net taxable income and net capital gains, if any, each year so that it will not be subject to excise tax on undistributed income and gains. The Funds are not subject to income taxes to the extent such distributions are made.
As of and during the year ended April 30, 2015, the Funds did not have a liability for any unrecognized tax benefits. The Funds file U.S. federal, state, and local tax returns as required. The Fund’s tax returns are subject to examination by the relevant tax authorities until expiration of the applicable statute of limitations, which is generally three years after the filing of the tax return for federal purposes and four years for most state returns. Tax returns for open years have incorporated no uncertain tax positions that require a provision for income taxes.
Distributions to Shareholders: Each Fund normally pays dividends and distributes capital gains, if any, on an annual basis. Income dividend distributions are derived from interest and other income each Fund receives from its investments, including short-term capital gains. Long term capital gain distributions are derived from gains realized when each Fund sells a security it has owned for more than a year. Each Fund may make additional distributions and dividends at other times if the portfolio manager believes doing so may be necessary for each Fund to avoid or reduce taxes.
3. TAX BASIS INFORMATION:
Reclassifications: As of April 30, 2015, permanent differences in book and tax accounting were reclassified. These differences had no effect on net assets and were primarily attributed to book/tax distribution differences. The reclassifications were as follows:
| | | | | | | | | | | | |
| | | | | | | | | Accumulated Net | |
| | | | | | Accumulated Net | | | Realized Gain on | |
| Fund | | Paid-in Capital | | | Investment Loss | | | Investments | |
| |
Vulcan Value Partners Fund | | $ | – | | | $ | – | | | $ | – | |
Vulcan Value Partners Small Cap Fund | | | – | | | | (107,688) | | | | 107,688 | |
Tax Basis of Investments: As of April 30, 2015, the aggregate cost of investments, gross unrealized appreciation/ (depreciation) and net unrealized appreciation for federal tax purposes was as follows:
| | | | | | | | |
| | | Vulcan Value Partners | | | Vulcan Value Partners | |
| | | Fund | | | Small Cap Fund | |
| |
Gross appreciation | | | | | | | | |
(excess of value over tax cost) | | $ | 250,941,841 | | | $ | 131,896,265 | |
Gross depreciation | | | | | | | | |
(excess of tax cost over value) | | | (22,358,760) | | | | (42,720,040) | |
| |
Net unrealized appreciation | | $ | 228,583,081 | | | $ | 89,176,225 | |
| |
Cost of investments for income tax purposes | | $ | 1,576,246,012 | | | $ | 1,025,853,618 | |
| |
| | |
| Annual Report | April 30, 2015 | | 31 |
Notes to Financial Statements
April 30, 2015
Components of Earnings: As of April 30, 2015, components of distributable earnings were as follows:
| | | | | | | | |
| | | | | | Vulcan Value | |
| | | Vulcan Value | | | Partners Small Cap | |
| | | Partners Fund | | | Fund | |
| |
Undistributed ordinary income | | $ | 22,360,091 | | | $ | – | |
Accumulated capital gains | | | 44,148,829 | | | | 20,579,697 | |
Net unrealized appreciation on investments | | | 228,583,081 | | | | 89,176,225 | |
| |
Total | | $ | 295,092,001 | | | $ | 109,755,922 | |
| |
As of April 30, 2015, the Vulcan Value Small Cap Fund elects to defer to the period ending April 30, 2016, capital losses recognized during the period November 1, 2014 to April 30, 2015 in the amount of $7,034,053.
Capital Losses: As of April 30, 2015, the Funds have no accumulated capital loss carryforwards.
Tax Basis of Distributions to Shareholders: The character of distributions made during the year from net investment income or net realized gains may differ from its ultimate characterization for federal income tax purposes. Also, due to the timing of dividend distributions, the fiscal year in which amounts are distributed may differ from the fiscal year in which the income or realized gain were recorded by each Fund.
The tax character of distributions paid by the Funds for the fiscal years ended April 30, 2015 and April 30, 2014 were as follows:
| | | | | | | | |
| | | | | | Long-Term Capital | |
| | | Ordinary Income | | | Gain | |
| |
2015 | | | | | | | | |
Vulcan Value Partners Fund | | $ | 48,380,968 | | | $ | 33,254,115 | |
Vulcan Value Partners Small Cap Fund | | | 64,217,648 | | | | 36,463,199 | |
| | |
| | | | | | Long-Term Capital | |
| | | Ordinary Income | | | Gain | |
| |
2014 | | | | | | | | |
Vulcan Value Partners Fund | | $ | 17,739,758 | | | $ | 5,360,262 | |
Vulcan Value Partners Small Cap Fund | | | 26,859,770 | | | | 10,285,344 | |
| | |
| 32 | | www.vulcanvaluepartners.com |
Notes to Financial Statements
April 30, 2015
4. SECURITIES TRANSACTIONS
The cost of purchases and proceeds from sales of securities (excluding short-term securities) during the year ended April 30, 2015 were as follows:
| | | | | | | | |
| | | | | | Proceeds From Sales of | |
| Fund | | Purchase of Securities | | | Securities | |
| |
Vulcan Value Partners Fund | | | $ 1,567,884,897 | | | | $ 797,423,316 | |
Vulcan Value Partners Small Cap Fund | | | 726,470,152 | | | | 808,717,849 | |
5. CAPITAL SHARE TRANSACTIONS
The capitalization of the Trust consists of an unlimited number of shares of beneficial interest with no par value per share. Holders of the shares of the Funds of the Trust have one vote for each share held and a proportionate fraction of a vote for each fractional share. All shares issued and outstanding are fully paid and are transferable and redeemable at the option of the shareholder. Purchasers of the shares do not have any obligation to make payments to the Trust or its creditors (other than the purchase price for the shares) or make contributions to the Trust or its creditors solely by reason of the purchasers’ ownership of the shares. Shares have no pre-emptive rights.
Shares redeemed within 90 days of purchase may incur a 2% short-term redemption fee deducted from the redemption amount. The Vulcan Value Partners Fund and the Vulcan Value Partners Small Cap Fund retained $22,469 and $17,712, respectively, for the year ended April 30, 2015, and $78,880 and $76,658, respectively, for the year ended April 30, 2014, which is reflected in the “Cost of shares redeemed, net of redemption fees” in the Statements of Changes in Net Assets.
Transactions in shares of capital stock for the dates listed below were as follows:
| | | | | | | | |
| Vulcan Value Partners Fund | |
| | | For the Year Ended | | | For the Year Ended | |
| | | April 30, 2015 | | | April 30, 2014 | |
| |
Shares Sold | | | 40,549,413 | | | | 24,274,979 | |
Shares Issued in Reinvestment of Dividends | | | 3,392,456 | | | | 1,094,860 | |
Less Shares Redeemed | | | (6,399,329) | | | | (3,545,292) | |
| |
Net Increase | | | 37,542,540 | | | | 21,824,547 | |
| |
|
| Vulcan Value Partners Small Cap Fund | |
| | | For the Year Ended | | | For the Year Ended | |
| | | April 30, 2015 | | | April 30, 2014 | |
| |
Shares Sold | | | 15,540,687 | | | | 40,732,583 | |
Shares Issued in Reinvestment of Dividends | | | 4,815,937 | | | | 1,529,428 | |
Less Shares Redeemed | | | (16,362,540) | | | | (10,434,040) | |
| |
Net Increase | | | 3,994,084 | | | | 31,827,971 | |
| |
| | |
| Annual Report | April 30, 2015 | | 33 |
Notes to Financial Statements
April 30, 2015
6. MANAGEMENT AND RELATED-PARTY TRANSACTIONS
Vulcan Value Partners, LLC (“Vulcan” or the “Adviser”), subject to the authority of the Board, is responsible for the overall management and administration of the Funds’ business affairs. Vulcan manages the investments of the Funds in accordance with each Fund’s investment objective, policies and limitations and investment guidelines established jointly by the Adviser and the Board. Pursuant to the Investment Advisory Agreement (the “Advisory Agreement”), the Funds pay Vulcan an annual management fee of 1.00% and 1.15% for Vulcan Value Partners Fund and Vulcan Value Partners Small Cap Fund, respectively, based on each Fund’s average daily net assets.
Vulcan has contractually agreed with the Funds to limit the amount of each Fund’s total annual expenses (exclusive of brokerage expenses, interest expense, taxes and extraordinary expenses) to 1.25% of each Fund’s average daily net assets. This agreement is in effect through August 31, 2015 and is reevaluated on an annual basis. Without this agreement, expenses could be higher. The Adviser is permitted to recover expenses it has borne through the agreement described above to the extent that each Fund’s expenses in later periods fall below the annual rates set forth in the relevant agreement. If the Adviser foregoes any fees and/or reimburses the Funds pursuant to this agreement with respect to a particular fiscal year, then the Adviser shall be entitled to recover from the Funds the amount forgone or reimbursed to the extent annual fund operating expenses are less than 1.25% of the Funds’ average daily net assets during any fiscal year following such fiscal year.
Pursuant to the expense limitation agreement between the Adviser and the Trust, each Fund will reimburse the Adviser for any contractual fee waivers and expense reimbursements made by the Adviser, provided that any such reimbursements made by each Fund to the Adviser will not cause the Funds’ expense limitation to exceed expense limitations in existence at the time the expense was incurred, or at the time of the reimbursement, whichever is lower, and the reimbursement is made within three years after the end of the fiscal year in which fees or expenses were incurred.
For the year ended April 30, 2015, the fee waivers and/or reimbursements were as follows:
| | | | | | | | |
| | | Fees Waived/Reimbursed | | | Recoupment of Previously | |
| Fund | | By Adviser | | | Waived Fees by Adviser | |
| |
Vulcan Value Partners Fund | | $ | – | | | $ | – | |
Vulcan Value Partners Small Cap Fund | | | 79,989 | | | | – | |
As of April 30, 2015, the balances of recoupable expenses for each Fund were as follows:
| | | | | | | | | | | | | | | | |
| Fund | | Expires 2016 | | | Expires 2017 | | | Expires 2018 | | | Total | |
| |
Vulcan Value Partners Fund | | $ | – | | | $ | – | | | $ | – | | | $ | – | |
Vulcan Value Partners Small Cap Fund | | | 161,158 | | | | 400,224 | | | | 79,989 | | | | 641,371 | |
Fund Administrator Fees and Expenses: ALPS Fund Services, Inc. (“ALPS”) serves as administrator to the Funds and the Funds have agreed to pay expenses incurred in connection with their administrative activities. Pursuant to an Administrative Agreement, ALPS provides operational services to the Funds including, but not limited to, fund accounting and fund administration and generally assists in the Funds’ operations. Officers of the Trust are employees
| | |
| 34 | | www.vulcanvaluepartners.com |
Notes to Financial Statements
April 30, 2015
of ALPS. The Funds’ administration fee is accrued on a daily basis and paid monthly. Administration fees paid by the Funds for the year ended April 30, 2015 are disclosed in the Statements of Operations.
ALPS is reimbursed by the Fund for certain out-of-pocket expenses.
Transfer Agent: ALPS serves as transfer, dividend paying and shareholder servicing agent for the Funds. ALPS receives an annual minimum fee, a fee based upon the number of shareholder accounts, and is also reimbursed by the Funds for certain out-of-pocket expenses.
Compliance Services: ALPS provides services that assist the Trust’s chief compliance officer in monitoring and testing the policies and procedures of the Trust in conjunction with requirements under Rule 38a-1 under the 1940 Act and receives an annual base fee. ALPS is reimbursed for certain out-of-pocket expenses by the Funds. Vulcan pays this fee on behalf of the Funds.
Principal Financial Officer: ALPS Fund Services, Inc. (“ALPS” and the “Administrator”) (an affiliate of ADI) receives an annual fee for providing principal financial officer services to the Funds. Vulcan pays this fee on behalf of the Funds.
Distributor: ALPS Distributors, Inc. (“ADI” or the “Distributor”) (an affiliate of ALPS Fund Services, Inc.) acts as the distributor of each Fund’s shares pursuant to a Distribution Agreement with the Trust. Shares are sold on a continuous basis by ADI as agent for the Funds, and ADI has agreed to use its best efforts to solicit orders for the sale of each Fund’s shares, although it is not obliged to sell any particular amount of shares. ADI is not entitled to any compensation for its services as Distributor. ADI is registered as a broker-dealer with the Securities and Exchange Commission.
7. INDEMNIFICATIONS
Under the Trust’s organizational documents, its Officers and Trustees are indemnified against certain liability arising out of the performance of their duties to the Trust. Additionally, in the normal course of business, the Trust enters into contracts with service providers that may contain general indemnification clauses which may permit indemnification to the extent permissible under applicable law. The Trust’s maximum exposure under these arrangements is unknown, as this would involve future claims that may be made against the Trust that have not yet occurred.
8. SUBSEQUENT EVENT
Effective as of the close of business on June 1, 2015, the Vulcan Value Partners Fund closed to new investors. This change will affect new investors seeking to purchase shares of the Fund either directly or through third party intermediaries. Existing shareholders of the Fund may continue to purchase additional shares of the Fund.
| | |
| Annual Report | April 30, 2015 | | 35 |
Report of Independent Registered Public Accounting Firm
To the Shareholders and Board of Trustees of Financial Investors Trust:
We have audited the accompanying statements of assets and liabilities, including the statements of investments, of Vulcan Value Partners Fund and Vulcan Value Partners Small Cap Fund (the “Funds”), two of the portfolios constituting Financial Investors Trust, as of April 30, 2015, and the related statements of operations for the year then ended, the statements of changes in net assets for each of the two years in the period then ended, and the financial highlights for each of the five years in the period then ended. These financial statements and financial highlights are the responsibility of the Funds’ management. Our responsibility is to express an opinion on these financial statements and financial highlights based on our audits.
We conducted our audits in accordance with the standards of the Public Company Accounting Oversight Board (United States). Those standards require that we plan and perform the audit to obtain reasonable assurance about whether the financial statements and financial highlights are free of material misstatement. The Funds are not required to have, nor were we engaged to perform, an audit of their internal control over financial reporting. Our audits included consideration of internal control over financial reporting as a basis for designing audit procedures that are appropriate in the circumstances, but not for the purpose of expressing an opinion on the effectiveness of the Funds’ internal control over financial reporting. Accordingly, we express no such opinion. An audit also includes examining, on a test basis, evidence supporting the amounts and disclosures in the financial statements, assessing the accounting principles used and significant estimates made by management, as well as evaluating the overall financial statement presentation. Our procedures included confirmation of securities owned as of April 30, 2015, by correspondence with the custodian and brokers; where replies were not received from brokers, we performed other auditing procedures. We believe that our audits provide a reasonable basis for our opinion.
In our opinion, the financial statements and financial highlights referred to above present fairly, in all material respects, the financial position of Vulcan Value Partners Fund and Vulcan Value Partners Small Cap Fund of Financial Investors Trust as of April 30, 2015, the results of their operations for the year then ended, the changes in their net assets for each of the two years in the period then ended, and the financial highlights for each of the five years in the period then ended, in conformity with accounting principles generally accepted in the United States of America.
|
DELOITTE & TOUCHE LLP |
|
Denver, Colorado |
June 26, 2015 |
| | |
| 36 | | www.vulcanvaluepartners.com |
Disclosure Regarding Approval of Fund Advisory Agreements
April 30, 2015 (Unaudited)
On December 9, 2014, the Trustees met in person to discuss, among other things, the approval of the investment advisory agreement between the Trust and Vulcan Value Partners, LLC (“Vulcan”) (the “Investment Advisory Agreement”), in accordance with Section 15(c) of the 1940 Act. The Independent Trustees met with independent legal counsel during executive session and discussed the Investment Advisory Agreement and other related materials.
In renewing and approving the Investment Advisory Agreement with Vulcan, the Trustees, including the Independent Trustees, considered the following factors with respect to the Vulcan Value Partners Small Cap Fund and Vulcan Value Partners Fund (the “Vulcan Funds”):
Investment Advisory Fee Rate: The Trustees reviewed and considered the contractual annual advisory fee to be paid by the Trust, on behalf of the Vulcan Funds, to Vulcan of 1.00% of the Vulcan Value Partners Fund’s daily average net assets and 1.15% of the Vulcan Value Partners Small Cap Fund’s daily average net assets, in light of the extent and quality of the advisory services provided by Vulcan to the Vulcan Funds.
The Trustees considered the information they received comparing the Vulcan Funds’ contractual annual advisory fee and total expenses (net of waivers) with those of funds in both the relevant peer expense group and universe of funds provided in the report furnished by an independent provider of investment company data.
Based on such information, the Trustees further determined that the contractual annual advisory fee of 1.00% of the Vulcan Value Partners Fund’s daily average net assets and 1.15% of the Vulcan Value Partners Small Cap Fund’s daily average net assets, and the total expense ratios (net of waivers) for each of the Vulcan Funds, were high but within an acceptable range within each of the Vulcan Funds’ respective peer group and universe.
The Trustees also considered the fee structures applicable to Vulcan Funds’ other clients employing a comparable strategy to that of the Vulcan Funds, as applicable.
Nature, Extent and Quality of the Services under the Investment Advisory Agreement: The Trustees received and considered information regarding the nature, extent and quality of services to be provided to the Vulcan Funds under the Investment Advisory Agreement. The Trustees reviewed certain background materials supplied by Vulcan in its presentation, including its Form ADV.
The Trustees reviewed and considered Vulcan’s investment advisory personnel, its history as an asset manager and its performance and the amount of assets currently under management by Vulcan. The Trustees also reviewed the research and decision-making processes utilized by Vulcan, including the methods adopted to seek to achieve compliance with the investment objectives, policies and restrictions of the Vulcan Funds.
The Trustees considered the background and experience of Vulcan’s management in connection with the Vulcan Funds, including reviewing the qualifications, backgrounds and responsibilities of the management team primarily responsible for the day-to-day portfolio management of the Vulcan Funds and the extent of the resources devoted to research and analysis of actual and potential investments.
| | |
| Annual Report | April 30, 2015 | | 37 |
Disclosure Regarding Approval of Fund Advisory Agreements
April 30, 2015 (Unaudited)
The Trustees also reviewed, among other things, Vulcan’s insider trading policies and procedures and its Code of Ethics.
Performance: The Trustees reviewed performance information for each of the Vulcan Funds for the three-month and 1-year periods ended September 30, 2014. That review included a comparison of each Vulcan Fund’s performance to the performance of a universe of comparable funds selected by an independent provider of investment company data. The Trustees noted the performance of Vulcan Value Partners Fund was generally above its respective peer universe median for the most recent 1-year period, while the performance of Vulcan Value Partners Small Cap Fund was generally below its respective peer universe median for the most recent 1-year period and better than the respective peer universe median for the 3-year period. The Trustees also considered Vulcan’s discussion of each Vulcan Fund’s top contributors and top detractors, as well as Vulcan’s performance and reputation generally and its investment techniques, risk management controls and decision-making processes.
Total Expense Ratios and the Adviser’s Profitability: The Trustees received and considered information provided by an independent provider of investment company data comparing the Vulcan Funds’ total expense ratios against their respective expense groups, as well as a profitability analysis prepared by Vulcan based on the fees payable under the Investment Advisory Agreement. The Trustees considered the profits, if any, realized by Vulcan in connection with the operation of the Vulcan Funds. The Board then reviewed Vulcan’s financial statements in order to analyze the financial condition and stability and profitability of the adviser.
Economies of Scale: The Trustees considered whether economies of scale in the provision of services to the Vulcan Funds will be passed along to the shareholders under the proposed agreement.
Other Benefits to the Adviser: The Trustees reviewed and considered any other incidental benefits derived or to be derived by Vulcan from its relationship with the Vulcan Funds, including whether soft dollar arrangements were used.
In selecting Vulcan as the Vulcan Funds’ investment adviser and approving the Investment Advisory Agreement and the fees charged under the Investment Advisory Agreement, the Trustees concluded that no single factor reviewed by the Trustees was identified by the Trustees to be determinative as the principal factor in whether to approve the Investment Advisory Agreement. Further, the Independent Trustees were advised by separate independent legal counsel throughout the process. The Trustees, including all of the Independent Trustees, concluded that:
| | ● | | the investment advisory fees to be received by Vulcan with respect to the Vulcan Funds were high but within an acceptable range within each of the Vulcan Fund’s peer group and universe; |
| | ● | | the nature, extent and quality of services to be rendered by Vulcan under the Investment Advisory Agreement were adequate; |
| | |
| 38 | | www.vulcanvaluepartners.com |
Disclosure Regarding Approval of Fund Advisory Agreements
April 30, 2015 (Unaudited)
| | ● | | the performance history of Vulcan Value Partners Fund, which generally outperformed the funds in its peer universe, as provided by an independent provider of investment company data, for the most recent 1- and 3-year periods, and the performance history of Vulcan Value Partners Small Cap Fund, which generally underperformed and outperformed for the most recent 1- and 3-year periods, respectively, the funds in its peer universe; |
| | ● | | bearing in mind the limitations of comparing different types of managed accounts and the different levels of service typically associated with such accounts, the fee structures applicable to Vulcan’s other clients employing a comparable strategy to one or more of the Vulcan Funds were not indicative of any unreasonableness with respect to the advisory fees proposed to be payable by the Vulcan Funds; |
| | ● | | the Vulcan Value Partners Fund and the Vulcan Value Partners Small Cap Fund’s total expense ratios were slightly higher than, but within an acceptable range of, their respective expense group medians; |
| | ● | | the profit, if any, anticipated to be realized by Vulcan in connection with the operation of the Vulcan Funds is not unreasonable to the Vulcan Funds; and |
| | ● | | there were no material economies of scale or other incidental benefits currently accruing to Vulcan in connection with its relationship with the Vulcan Funds. |
Based on the Trustees’ deliberations and their evaluation of the information described above, the Trustees, including all of the Independent Trustees, concluded that Vulcan’s compensation for investment advisory services is consistent with the best interests of the Vulcan and their shareholders.
| | |
| Annual Report | April 30, 2015 | | 39 |
Additional Information
April 30, 2015 (Unaudited)
1. FUND HOLDINGS
The Fund files its complete schedule of portfolio holdings with the Securities and Exchange Commission (the “SEC”) for the first and third quarters of each fiscal year on Form N-Q within 60 days after the end of the period. Copies of the Fund’s Form N-Q are available without charge on the SEC website at http://www.sec.gov. You may also review and copy the Form N-Q at the SEC’s Public Reference Room in Washington, DC. For more information about the operation of the Public Reference Room, please call the SEC at 1-800-SEC-0330.
2. FUND PROXY VOTING POLICIES, PROCEDURES AND SUMMARIES
The Fund’s policies and procedures used in determining how to vote proxies and information regarding how the Fund voted proxies relating to portfolio securities during the most recent prior 12-month period ending June 30 are available without charge, (1) upon request, by calling (toll-free) (866)-759-5679 and (2) on the SEC’s website at http://www.sec.gov.
3. TAX DESIGNATIONS
The Funds designate the following for federal income tax purposes for the calendar year ended December 31, 2014:
| | | | |
| | | Qualified Dividend
Income | | Dividend Received
Deduction |
|
Vulcan Value Partners Fund | | 45.65% | | 30.73% |
|
Vulcan Value Partners Small Cap Fund | | 24.36% | | 18.39% |
|
Pursuant to Section 852(b)(3) of the Internal Revenue Code, the Vulcan Value Partners Fund designated $33,254,115, and the Vulcan Value Small Cap Fund designated $36,463,199 as long-term capital gain dividends.
| | |
| 40 | | www.vulcanvaluepartners.com |
Trustees and Officers
April 30, 2015 (Unaudited)
Additional information regarding the Fund’s trustees is included in the Statement of Additional Information, which can be obtained without charge by calling 866-759-5679.
INDEPENDENT TRUSTEES
| | | | | | | | | | |
Name, Address* & Year of Birth | | Position(s) Held with Fund | | Term of
Office and
Length of
Time
Served** | | Principal Occupation(s) During Past 5 Years*** | | Number of
Funds in
Fund
Complex
Overseen
by
Trustee**** | | Other
Directorships
Held by Trustee
During Past
5 Years |
|
Mary K. Anstine, 1940 | | Trustee | | Ms. Anstine was elected at a special meeting of shareholders held on March 21, 1997 and re-elected at a special meeting of shareholders held on August 7, 2009. | | Ms. Anstine was formerly an Executive Vice President of First Interstate Bank of Denver until 1994, President/Chief Executive Officer of HealthONE Alliance, Denver, Colorado, from 1994 to 2004, and has been retired since 2004. Ms. Anstine is also Trustee/Director of AV Hunter Trust and Colorado Uplift Board. Ms. Anstine was formerly a Director of the Trust Bank of Colorado (later purchased and now known as Northern Trust Bank), HealthONE and Denver Area Council of the Boy Scouts of America, and a member of the American Bankers Association Trust Executive Committee. | | 30 | | Ms. Anstine is a Trustee of ALPS ETF Trust (18 funds); ALPS Variable Investment Trust (9 funds); Reaves Utility Income Fund (1 fund); and Westcore Trust (12 funds). |
|
John R. Moran, Jr., 1930 | | Trustee | | Mr. Moran was elected at a special meeting of shareholders held on March 21, 1997 and re-elected at a special meeting of shareholders held on August 7, 2009. | | Mr. Moran formerly served as President and CEO of The Colorado Trust, a private foundation serving the health and hospital community in the state of Colorado, from 1991 to 2007. During his career as an attorney from 1958 to 1991, Mr. Moran was formerly a partner with the firm of Kutak Rock & Campbell in Denver, Colorado and a member of the Colorado House of Representatives. Currently, Mr. Moran is a member of the Treasurer’s Investment Advisory Committee for the University of Colorado. | | 30 | | None. |
|
| * | All communications to Trustees and Officers may be directed to Financial Investors Trust c/o 1290 Broadway, Suite 1100, Denver, CO 80203. |
| ** | This is the period for which the Trustee or Officer began serving the Trust. Each Trustee and/or Officer serves an indefinite term, until his successor is elected. |
| *** | Except as otherwise indicated, each individual has held the office shown or other offices in the same company for the last five years. |
| **** | The Fund Complex includes all series of the Trust (currently 30) and any other investment companies for which any Trustee serves as Trustee for and which Vulcan Value Partners, LLC, Inc. provides investment advisory services (currently none). |
| | |
| Annual Report | April 30, 2015 | | 41 |
Trustees and Officers
April 30, 2015 (Unaudited)
INDEPENDENT TRUSTEES (continued)
| | | | | | | | | | |
Name,
Address*
& Year
of Birth | | Position(s)
Held with
Fund | | Term of
Office and
Length of
Time
Served** | | Principal Occupation(s) During Past 5 Years*** | | Number of
Funds in
Fund
Complex
Overseen
by
Trustee**** | | Other Directorships Held by Trustee During Past 5 Years |
|
Jeremy W. Deems, 1976 | | Trustee | | Mr. Deems was appointed as a Trustee at the March 11, 2008 meeting of the Board of Trustees and elected at a special meeting of shareholders held on August 7, 2009. | | Mr. Deems is the Co-Founder and Chief Financial Officer of Green Alpha Advisors, LLC, a registered investment advisor, and Co-Portfolio Manager of the Shelton Green Alpha Fund. Prior to joining Green Alpha Advisors, Mr. Deems was CFO and Treasurer of Forward Management, LLC, ReFlow Management Co., LLC, ReFlow Fund, LLC, a private investment fund, and Sutton Place Management, LLC, an administrative services company, from 1998 to June 2007. From 2004 to 2005, Mr Deems also served as Treasurer of the Forward Funds and the Sierra Club Funds. | | 30 | | Mr. Deems is a Trustee of ALPS ETF Trust (18 funds); ALPS Variable Investment Trust (9 funds) and Reaves Utility Income Fund (1 fund). |
|
Jerry G. Rutledge 1944 | | Trustee | | Mr. Rutledge was elected at a special meeting of shareholders held on August 7, 2009 | | Mr. Rutledge is the President and owner of Rutledge’s Inc., a retail clothing business. Mr. Rutledge is currently serving as a Director of the University of Colorado Hospital. Mr. Rutledge was from 1994 to 2007 a Regent of the University of Colorado. | | 30 | | Mr. Rutledge is a Trustee of Principal Real Estate Income Fund (1 fund), Clough Global Allocation Fund (1 fund), Clough Global Equity Fund (1 fund) and Clough Global Opportunities Fund (1 fund). |
|
| * | All communications to Trustees and Officers may be directed to Financial Investors Trust c/o 1290 Broadway, Suite 1100, Denver, CO 80203. |
| ** | This is the period for which the Trustee or Officer began serving the Trust. Each Trustee and/or Officer serves an indefinite term, until his successor is elected. |
| *** | Except as otherwise indicated, each individual has held the office shown or other offices in the same company for the last five years. |
| **** | The Fund Complex includes all series of the Trust (currently 30) and any other investment companies for which any Trustee serves as Trustee for and which Vulcan Value Partners, LLC, Inc. provides investment advisory services (currently none). |
| | |
| 42 | | www.vulcanvaluepartners.com |
Trustees and Officers
April 30, 2015 (Unaudited)
INDEPENDENT TRUSTEES (continued)
| | | | | | | | | | |
Name,
Address*
& Year
of Birth | | Position(s) Held with Fund | | Term of Office and
Length of Time Served** | | Principal Occupation(s) During Past 5 Years*** | | Number of
Funds in
Fund
Complex
Overseen
by
Trustee**** | | Other
Directorships
Held by Trustee
During Past 5 Years |
|
Michael “Ross” Shell, 1970 | | Trustee | | Mr. Shell was elected at a special meeting of shareholders held on August 7, 2009 | | Mr. Shell is Founder and CEO of Red Idea, LLC, a strategic consulting/early stage venture firm (since June 2008). From 1999 to 2009, he was a part-owner and Director of Tesser, Inc., a brand agency. From December 2005 to May 2008, he was Director, Marketing and Investor Relations, of Woodbourne, a REIT/real estate hedge fund and private equity firm. Prior to this, from May 2004 to November 2005, he worked as a business strategy consultant; from June 2003 to April 2004, he was on the Global Client Services team of IDEO, a product design/innovation firm; and from 1999 to 2003, he was President of Tesser, Inc. Mr. Shell graduated with honors from Stanford University with a degree in Political Science. | | 30 | | None. |
|
| | |
| Annual Report | April 30, 2015 | | 43 |
Trustees and Officers
April 30, 2015 (Unaudited)
INTERESTED TRUSTEE
| | | | | | | | | | |
Name,
Address*
& Age | | Position(s)
Held with
Fund | | Term of
Office and
Length of
Time
Served** | | Principal Occupation(s) During Past 5 Years*** | | Number of
Funds in
Fund
Complex
Overseen
by
Trustee**** | | Other
Directorships
Held by Trustee |
|
Edmund J. Burke, 1961 | | Trustee, Chairman and President | | Mr. Burke was elected as Chairman at the August 28, 2009 meeting of the Board of Trustees. Mr. Burke was elected as Trustee at a special meeting of shareholders held on August 7, 2009. Mr. Burke was elected President of the Trust at the December 17, 2002 meeting of the Board of Trustees. | | Mr. Burke is President and a Director of ALPS Holdings, Inc. (“AHI”) (since 2005) and Director of Boston Financial Data Services, Inc. (“BFDS”), ALPS Advisors, Inc. (“AAI”), ALPS Distributors, Inc. (“ADI”), ALPS Fund Services, Inc. (“AFS”) and ALPS Portfolio Solutions Distributor, Inc. (“APSD”) and from 2001-2008, was President of AAI, ADI, AFS and APSD. Because of his positions with AHI, BFDS, AAI, ADI, AFS and APSD, Mr. Burke is deemed an affiliate of the Trust as defined under the 1940 Act. Mr. Burke is Trustee and President of the Clough Global Allocation Fund (Trustee since 2006; President since 2004); Trustee and President of the Clough Global Equity Fund (Trustee since 2006; President since 2005); Trustee and President of the Clough Global Opportunities Fund (since 2006); Trustee of the Liberty All-Star Equity Fund; and Director of the Liberty All-Star Growth Fund, Inc. | | 35 | | Mr. Burke is a Trustee of Clough Global Allocation Fund (1 fund); Clough Global Equity Fund (1 fund); Clough Global Opportunities Fund (1 fund); Trustee of the Liberty All-Star Equity Fund (1 fund); and Director of the Liberty All-Star Growth Fund, Inc. (1 fund). |
|
| * | All communications to Trustees and Officers may be directed to Financial Investors Trust c/o 1290 Broadway, Suite 1100, Denver, CO 80203. |
| ** | This is the period for which the Trustee or Officer began serving the Trust. Each Trustee and/or Officer serves an indefinite term, until his successor is elected. |
| *** | Except as otherwise indicated, each individual has held the office shown or other offices in the same company for the last five years. |
| **** | The Fund Complex includes all series of the Trust (currently 30) and any other investment companies for which any Trustee serves as Trustee for and which Vulcan Value Partners, LLC, Inc. provides investment advisory services (currently none). |
| | |
| 44 | | www.vulcanvaluepartners.com |
Trustees and Officers
April 30, 2015 (Unaudited)
OFFICERS
| | | | | | |
Name,
Address*
& Year
of Birth | | Position(s)
Held with
Fund | | Term of Office and Length of Time Served** | | Principal Occupation(s) During Past 5 Years*** |
|
Kimberly R. Storms, 1972 | | Treasurer | | Ms. Storms was elected Treasurer of the Trust at the March 12, 2013 meeting of the Board of Trustees. | | Ms. Storms is Senior Vice President and Director of Fund Administration of ALPS. Because of her position with ALPS, Ms. Storms is deemed an affiliate of the Trust as defined under the 1940 Act. Ms. Storms is also Treasurer of Liberty All-Star Equity Fund and Liberty All-Star Growth Fund, Inc. and Chief Financial Officer of The Arbitrage Funds. |
|
David T. Buhler, 1971 | | Secretary | | Mr. Buhler was elected Secretary of the Trust at the September 11, 2012 meeting of the Board of Trustees. | | Mr. Buhler joined ALPS in June 2010. He is currently Vice President and Senior Associate Counsel of ALPS, AAI, ADI and APSD. Prior to joining ALPS, Mr. Buhler served as Associate General Counsel and Assistant Secretary of Founders Asset Management LLC from 2006 to 2009. Because of his position with ALPS, Mr. Buhler is deemed an affiliate of the Trust as defined under the 1940 Act. Mr. Buhler is also the Secretary ALPS Variable Investment Trust, ALPS ETF Trust and Westcore Trust. |
|
Ted Uhl, 1974 | | Chief Compliance Officer (“CCO”) | | Mr. Uhl was appointed CCO of the Trust at the June 8, 2010 meeting of the Board of Trustees. | | Mr. Uhl joined ALPS in October 2006, and is currently Deputy Compliance Officer of ALPS. Prior to his current role, Mr. Uhl served as Senior Risk Manager for ALPS from October 2006 until June 2010. Because of his position with ALPS, Mr. Uhl is deemed an affiliate of the Trust as defined under the 1940 Act. Mr. Uhl is also CCO of the Clough Global Funds, Reaves Utility Income Fund, Centre Funds and Transparent Value Trust. |
|
| | |
| Annual Report | April 30, 2015 | | 45 |

| | (a) | The Registrant, as of the end of the period covered by this report, has adopted a code of ethics that applies to the Registrant’s principal executive officer, principal financial officer, principal accounting officer or controller or any persons performing similar functions on behalf of the Registrant. |
| | (c) | During the period covered by this report, no amendments to the provisions of the code of ethics described in Item 2(a) above were made. |
| | (d) | During the period covered by this report, no implicit or explicit waivers to the provisions of the code of ethics described in Item 2(a) above were granted. |
| | (f) | The Registrant’s Code of Ethics is attached as an Exhibit to this report. |
| Item 3. | Audit Committee Financial Expert. |
The Board of Trustees of the Registrant has determined that the Registrant has at least one Audit Committee Financial Expert serving on its audit committee. The Board of Trustees of the Registrant has designated Jeremy W. Deems as the Registrant’s “Audit Committee Financial Expert.” Mr. Deems is “independent” as defined in paragraph (a)(2) of Item 3 to Form N-CSR.
| Item 4. | Principal Accountant Fees and Services. |
| | (a) | Audit Fees: For the Registrant’s fiscal years ended April 30, 2015 and April 30, 2014, the aggregate fees billed for professional services rendered by the principal accountant for the audit of the Registrant’s annual financial statements were $259,000 and $447,000, respectively. |
| | (b) | Audit-Related Fees: For the Registrant’s fiscal years ended April 30, 2015 and April 30, 2014, the aggregate fees billed for assurance and related services by the principal accountant that were reasonably related to the performance of the audit of the Registrant’s financial statements and are not reported under paragraph (a) of this Item were $0 and $0, respectively. |
2
| | (c) | Tax Fees: For the Registrant’s fiscal years ended April 30, 2015 and April 30, 2014, the aggregate fees billed for professional services rendered by the principal accountant for tax compliance, tax advice and tax planning were $45,185 and $112,280, respectively. The fiscal year 2014 and 2013 tax fees were for services for dividend calculation, excise tax preparation and tax return preparation. |
| | (d) | All Other Fees: For the Registrant’s fiscal years ended April 30, 2015 and April 30, 2014, no fees were billed to Registrant by the principal accountant for services other than the services reported in paragraphs (a) through (c) of this Item. |
| | (e)(1) | Audit Committee Pre-Approval Policies and Procedures: All services to be performed by the Registrant’s principal accountant must be pre-approved by the Registrant’s audit committee. The Chairman of the Audit Committee may pre-approve non-audit services to be performed by the Registrant’s principal accountant on an interim basis, subject to ratification by the Audit Committee at its next regularly scheduled meeting. |
| | (e)(2) | No services described in paragraphs (b) through (d) of this Item were approved by the Registrant’s audit committee pursuant to paragraph (c)(7)(i)(C) of Rule 2-01 of Regulation S-X. |
| | (g) | The aggregate non-audit fees billed by the Registrant’s accountant to the Registrant, and rendered to the Registrant’s investment adviser (not including any sub-adviser whose role is primarily portfolio management and is subcontracted with or overseen by another investment adviser), and any entity controlling, controlled by, or under common control with the adviser that provides ongoing services to the Registrant, were $68,301 in fiscal year ended April 30, 2015 and $153,978 in fiscal year ended April 30, 2014. These fees consisted of tax fees billed to (i) the Registrant of $45,185 in fiscal year ended April 30, 2015 and $112,280 in fiscal year ended April 30, 2014 as described in response to paragraph (c) above and (ii) to ALPS Fund Services, Inc. (“AFS”), an entity under common control with ALPS Advisors, Inc., the Registrant’s investment adviser, of $23,116 in fiscal year ended April 30, 2015 and $41,698 in fiscal year ended April 30, 2014. The non-audit fees billed to AFS related to SSAE 16 services and other compliance-related matters. |
| | (h) | The Registrant’s audit committee has considered whether the provision of non-audit services that were rendered to the Registrant’s investment adviser (not including any sub-adviser whose role is primarily portfolio management and is subcontracted with or overseen by another investment adviser), and any entity controlling, controlled by, or under common control with the investment adviser that provides ongoing services to the Registrant that were not pre-approved pursuant to paragraph (c)(7)(ii) of Rule 2-01 of Regulation S-X, is compatible |
3
| | with maintaining the principal accountant’s independence. The Registrant’s audit committee determined that the provision of such non-audit services is compatible with maintaining the principal accountant’s independence. |
| Item 5. | Audit Committee of Listed Registrants. |
Not applicable.
| | (a) | Schedule of Investments is included as part of the Reports to Stockholders filed under Item 1 of this Form N-CSR. |
| Item 7. | Disclosure of Proxy Voting Policies and Procedures for Closed-End Management Investment Companies. |
Not applicable to Registrant.
| Item 8. | Portfolio Managers of Closed-End Management Investment Companies. |
Not applicable to Registrant.
| Item 9. | Purchases of Equity Securities by Closed-End Management Investment Company and Affiliated Purchasers. |
Not applicable to Registrant.
| Item 10. | Submission of Matters to a Vote of Security Holders. |
There have been no material changes to the procedures by which shareholders may recommend nominees to the Registrant’s Board of Trustees, where those changes were implemented after the Registrant last provided disclosure in response to the requirements of Item 407(c)(2)(iv) of Regulation S-K, or this Item.
| Item 11. | Controls and Procedures. |
| | (a) | The Registrant’s principal executive officer and principal financial officer have concluded that the Registrant’s disclosure controls and procedures (as defined in Rule 30a-3(c) under the Investment Company Act of 1940, as amended) are effective based on their evaluation of these controls and procedures as of a date within 90 days of the filing date of this report. |
| | (b) | There was no change in the Registrant’s internal control over financial reporting (as defined in Rule 30a-3(d) under the Investment Company Act of 1940, as |
4
| | amended) during the second fiscal quarter of the period covered by this report that has materially affected, or is reasonably likely to materially affect, the Registrant’s internal control over financial reporting. |
| | (a)(1) | Registrant’s Code of Ethics for Principal Executive and Senior Financial Officers, which is the subject of the disclosure required by Item 2 of Form N-CSR, is incorporated by reference to Exhibit 12(a)(1) to the Registrant’s Certified Shareholder Report on Form N-CSR, File No. 811-8194, filed on July 7, 2008. |
| | (a)(2) | The certifications required by Rule 30a-2(a) of the Investment Company Act of 1940, as amended, and Section 302 of the Sarbanes-Oxley Act of 2002 are attached hereto as Exhibit 99.Cert. |
| | (b) | The certifications by the Registrant’s principal executive officer and principal financial officer, as required by Rule 30a-2(b) of the Investment Company Act of 1940, as amended, and Section 906 of the Sarbanes-Oxley Act of 2002 are attached hereto as Exhibit 99.906Cert. |
5
SIGNATURES
Pursuant to the requirements of the Securities Exchange Act of 1934 and the Investment Company Act of 1940, the Registrant has duly caused this report to be signed on its behalf by the undersigned, thereunto duly authorized.
FINANCIAL INVESTORS TRUST
| | |
| By: | | /s/ Edmund J. Burke |
| | Edmund J. Burke (Principal Executive Officer) |
| | President |
| |
| Date: | | July 8, 2015 |
Pursuant to the requirements of the Securities Exchange Act of 1934 and the Investment Company Act of 1940, this report has been signed below by the following persons on behalf of the Registrant and in the capacities and on the dates indicated.
FINANCIAL INVESTORS TRUST
| | |
| By: | | /s/ Edmund J. Burke |
| | Edmund J. Burke (Principal Executive Officer) |
| | President |
| |
| Date: | | July 8, 2015 |
| |
| By: | | /s/ Kimberly R. Storms |
| | Kimberly R. Storms (Principal Financial Officer) |
| | Treasurer |
| |
| Date: | | July 8, 2015 |
6