UNITED STATES
SECURITIES AND EXCHANGE COMMISSION
Washington, D.C. 20549
FORM N-CSR
CERTIFIED SHAREHOLDER REPORT OF REGISTERED
MANAGEMENT INVESTMENT COMPANIES
Investment Company Act file number: 811-08194
FINANCIAL INVESTORS TRUST
(Exact name of registrant as specified in charter)
1290 Broadway, Suite 1100, Denver, Colorado 80203
(Address of principal executive offices) (Zip code)
JoEllen L. Legg, Esq., Secretary
Financial Investors Trust
1290 Broadway, Suite 1100
Denver, Colorado 80203
(Name and address of agent for service)
Registrant’s telephone number, including area code: 303-623-2577
Date of fiscal year end: April 30
Date of reporting period: May 1, 2015 – April 30, 2016
| Item 1. | Reports to Stockholders. |
2
TABLE OF CONTENTS
| | |
| Aspen Managed Futures Strategy Fund | | Manager Commentary |
| | April 30, 2016 (Unaudited) |
May 7, 2016
Performance Results
For the one-year period ending April 30, 2016, the Class I shares of the Aspen Managed Futures Strategy Fund (the “Fund”) posted a return of -4.97%. Per its mandate, the Fund maintained a tight correlation1 to the Aspen Managed Futures Beta Index (“Aspen MFBI” or the “Index”)2. The Index uses a combination of trend and counter-trend algorithms to determine exposures to 23 futures markets. In following the Index, the Fund can take long or short positions in each of the eligible markets. A long position in a futures market will profit if the price of the futures contract rises, whereas a short position will profit if the price of the futures contract falls.
The SG CTA Index (formerly, the Newedge CTA Index)3, a managed futures benchmark, returned -0.7% over same time period. Another benchmark, the BTOP50 Index4, returned -2.7%. It is important to note that there are substantive differences between the Fund and these two indices in terms of construction. There were no significant changes to the Fund strategy during this period.
Explanation of Fund Performance
The Fund gained 0.49% in May 2015. U.S. equities rose during the month, while overseas bourses were mostly negative. Macroeconomic events continued to dominate headlines, as contrasting central bank commentary resulted in an uptick in market volatility.
The fixed income sector fell in the first two weeks of the month, as investors continued the selling spree that began in April. Buyers returned to the markets at mid-month after the release of weaker than expected economic data. The change in sentiment created a number of crosscurrents in the interest rate markets, and most trend-based managers experienced losses in May.
The Fund lost 1.66% in June 2015. The month was dominated by the Greek crises, which caused an increase in market volatility and numerous trend reversals. As a result, the SG CTA Index and the BTOP50 Index, two of the most often-cited managed futures benchmarks, lost 4% or more during the month.
Equities closely tracked the ongoing drama in Europe. Greece’s decision to postpone debt repayments until the end of June caused stocks to lose ground until about mid-month. The markets recovered when discussions between the EU and Greece turned friendlier, however, in the last week of June selling pressure intensified. The S&P 500 Index5 dropped nearly 2% in June. Trading in equity futures resulted in slight losses for the Fund.
The Fund gained 1.99% in July 2015. Against a volatile economic backdrop, a number of macro trends re-emerged leading to significant gains. The most important theme (and the most profitable for the Fund) was the decline in commodity prices. Crude oil lost more than 20%, its worst monthly showing in nearly seven years. Precious metals dropped precipitously due to a stronger dollar. Copper and other industrial metals likewise faltered due to reduced demand from China.
The Fund lost 4.00% in August 2015. The month was punctuated by a dramatic sell-off in the Chinese equity market. The pullback in China began on August 10th, when the country announced it was devaluing the yuan in response to disappointing Chinese retail sales. The market interpreted this move to be a lack of conviction in the strength of the economy, resulting in a sizable market decline. The Shanghai Stock Exchange Composite Index6, which appreciated 154% between July 2014 and June 2015, ended August 39% under its June peak. This unexpected move caused a reversal in a number of established market trends.
The Fund gained 1.02% in September 2015. Market conditions were turbulent, with global and domestic equity indices posting significant losses. The previous three months’ market pullback resulted in the worst calendar quarter since 2011 for stocks, as the S&P 500 Index fell 6.5% and the Shanghai Composite dropped nearly 25%. Equity markets provided the biggest boost for the Fund. Trading in FTSE7, Euro Stoxx8, Nikkei9 and S&P Futures all resulted in gains. Profits were capped due to numerous one-session rallies, most notably the 2% rally on the last day of the September.
The Fund lost 2.72% in October 2015. The month saw stocks rocket higher, with all ten sectors in the S&P 500 showing gains. It was the best month for equities in four years, and marked a dramatic turnaround for the market after the 3rd quarter’s turbulent conditions.
The Fund gained 2.38% in November 2015. Gains were broad-based, with profits generated in both the trend and counter-trend modules. Stocks continued higher in the U.S., but fell slightly elsewhere, while fixed income suffered losses. The currency markets were the biggest contributor to the Fund. Buoyed by strong employment data and the promise of higher rates by the Federal Reserve (the “Fed”), the U.S. dollar continued its ascent, creating trading opportunities in the Euro, Japanese yen, and Swiss franc. The stronger greenback contributed to declines in the energy market, while disappointing news regarding China’s economic recovery weighed heavily on raw materials prices.
The Fund recorded a loss of 1.07% in December 2015. Stocks lost ground in the U.S., but continued to outpace foreign bourses. Fixed income markets were mostly lower, especially in the high yield bond sectors, which experienced significant outflows.
The Fund lost 0.77% in January 2016, a month of extreme volatility in the equities markets. European stocks, technology issues, and small caps experienced significant pullbacks during the month, while fixed income posted modest gains as investors sought the relative safety of bonds.
The Fund gained 1.88% in February 2016. Capital flows favored safe haven assets due to increasing volatility. Equities markets fell early in the month and at one point were down double digits for 2016. A rally in the last two weeks of February limited losses in stock indices. The Fund was short foreign and domestic equities throughout February and, even with the rally, that sector proved to be the most profitable.
| | |
| Annual Report | April 30, 2016 | | 1 |
| | |
| Aspen Managed Futures Strategy Fund | | Manager Commentary |
| | April 30, 2016 (Unaudited) |
The Fund lost 2.17% in March 2016. The month proved to be a difficult period for managed futures as a number of well-established trends reversed. A broad-based reduction in market volatility added to the challenges, as new trends failed to materialize.
Outlook
In the U.S., a return to normalcy from quantitative easing took a detour when other central banks embraced a negative interest rate policy (NIRP). The concept of depositors paying banks for the privilege of holding their money is so new no one really knows what the unintended consequences might be. Take the Bank of Japan’s (BoJ) move to cut its benchmark interest rate below zero on January 29th. Since that day, the yen has appreciated 12%, even though the policy was originally intended to depress the value of the currency.
We have long been a proponent of a rising rate policy in the U.S., which would signal an end to the Fed’s backstop of the stock market. It would diminish many unintended consequences of Quantitative Easing10, including the increased possibility of asset bubbles and distortion of capital markets brought about by investment decisions that in normal conditions would never be made. Considering the strategy of other central banks, this policy will likely be delayed.
In the world of negative rates, alternative investments certainly deserve a seat at the table. In spite of the fact that the past year was particularly difficult for the managed futures sector and our Fund, there are two reasons why managed futures exposure is especially relevant. First, the ability to generate profits during periods of market volatility – which also coincides with the perpetuation of price trends – gives the asset class a unique benefit of negative correlation to stocks during down periods and flat to slightly positive correlation to stocks during favorable equity market periods. Second, managed futures has also been shown to be effective in capturing price trends in raw materials, such as crude oil and precious metals, a source of return that is completely unrelated to either the stock or bond markets.
Sincerely,
Bryan R. Fisher
William Ware Bush
Performance data quoted represents past performance. Past performance does not guarantee future results. Investment return and principal value of an investment will fluctuate so that an investor’s shares, when sold or redeemed, may be worth more or less than the original cost. Current performance data may be higher or lower than actual data quoted. For the most current month-end performance data please call 1-855-845-9444.
The views of Aspen Partners, Ltd. and information discussed in this commentary are as of the date of publication, are subject to change, and may not reflect the writers’ current views. The views expressed are those of the Fund’s adviser only, and represent an assessment of market conditions at a specific point in time, are opinions only and should not be relied upon as investment advice regarding a particular investment or markets in general. Such information does not constitute a recommendation to buy or sell specific securities or investment vehicles. It should not be assumed that any investment will be profitable or will equal the performance of the portfolios or any securities or any sectors mentioned in this letter. The subject matter contained in this letter has been derived from several sources believed to be reliable and accurate at the time of compilation. Neither Aspen Partners Ltd. nor the Fund accepts any liability for losses either direct or consequential caused by the use of this information.
The Aspen Managed Futures Strategy Fund is distributed by ALPS Distributors, Inc.
The Fund is subject to investment risks, including possible loss of the principal amount invested and therefore is not suitable for all investors. The Fund may not achieve its objectives.
| Diversification | does not eliminate the risk of experiencing investment losses |
| 1 | Correlation - a statistical measure of how two securities move in relation to each other. |
| 2 | Aspen Managed Futures Beta Index (Aspen MFBI) is constructed using a quantitative, rules-based model designed to replicate the trend-following and counter-trend exposure of futures markets by allocating assets to liquid futures contracts of certain financial and commodities futures markets. The Index therefore seeks to reflect the performance of strategies and exposures common to a broad universe of futures markets, i.e., managed futures beta. The Index is not actively managed and does not reflect any deduction for fees, expenses or taxes. An investor cannot invest directly in the Index. |
| 3 | The SG CTA Index (formerly, the Newedge CTA Index) provides the market with a reliable daily performance benchmark of major commodity trading advisors (CTAs). The SG CTA Index calculates the daily rate of return for a pool of CTAs selected from the larger managers that are open to new investment. Selection of the pool of qualified CTAs used in construction of the Index will be conducted annually, with re-balancing on January 1st of each year. A committee of industry professionals has been established to monitor the methodology of the index on a regular basis. The Index is not actively managed and does not reflect any deduction for fees, expenses or taxes. An investor cannot invest directly in the Index. |
| 4 | Barclay BTOP50 Index is an index of the largest investable CTA programs as measured by assets under management. The index is not actively managed and does not reflect any deduction for fees, expenses or taxes. The Index is not actively managed and does not reflect any deduction for fees, expenses or taxes. An investor cannot invest directly in the Index. |
| 5 | The S&P 500® Total Return Index is an unmanaged index of 500 common stocks chosen for the market size, liquidity and industry group representation. It is a market-value weighted index. The Index is not actively managed and does not reflect any deduction for fees, expenses or taxes. An investor may not invest directly into the Index. |
| | |
| 2 | | www.aspenfuturesfund.com |
| | |
| Aspen Managed Futures Strategy Fund | | Manager Commentary |
| | April 30, 2016 (Unaudited) |
| 6 | The Shanghai Stock Exchange Composite Index is a capitalization-weighted index. The index tracks the daily price performance of all A-shares and B-shares listed on the Shanghai Stock Exchange. The index was developed on December 19, 1990 with a base value of 100. Index trade volume on Q is scaled down by a factor of 1000. The Index is not actively managed and does not reflect any deduction for fees, expenses or taxes. An investor may not invest directly into the Index. |
| 7 | The Financial Times Stock Exchange 100 Index, also called the FTSE 100 Index, FTSE 100, FTSE, or, informally, the “Footsie” /‘f℧tsi:/, is a share index of the 100 companies listed on the London Stock Exchange with the highest market capitalization. |
| 8 | The EURO STOXX 50 is a stock index of Eurozone stocks designed by STOXX, an index provider owned by Deutsche Börse Group and SIX Group. |
| 9 | Nikkei is short for Japan’s Nikkei 225 Stock Average. It is a price-weighted index comprised of Japan’s top 225 blue-chip companies traded on the Tokyo Stock Exchange. The Nikkei is equivalent to the Dow Jones Industrial Average Index in the United States. |
| 10 | Quantitative Easing – A monetary policy in which a central bank purchases government securities or other securities from the market in order to lower interest rates and increase the money supply. |
| | |
| Annual Report | April 30, 2016 | | 3 |
| | |
| Aspen Managed Futures Strategy Fund | | Manager Commentary |
| | April 30, 2016 (Unaudited) |
Cumulative Total Return Performance as of April 30, 2016
| | | | | | | | | | | | |
| Aspen Managed Futures Strategy Fund | | Calendar
Year-to-Date | | | 1 Year | | | | 3 Year | | | Since Inception* |
Aspen Managed Futures Strategy Fund - Class A (NAV)(1) | | -1.23% | | | -5.20% | | | | 1.88% | | | -0.37% |
Aspen Managed Futures Strategy Fund - Class A (MOP)(2) | | -6.66% | | | -10.39% | | | | -0.02% | | | -1.55% |
Aspen Managed Futures Strategy Fund - Class I | | -1.32% | | | - 4.97% | | | | 2.23% | | | 0.00% |
SG CTA Index(3) | | 1.73% | | | - 0.65% | | | | 4.35% | | | 1.98% |
Aspen Managed Futures Beta Index(4) | | -0.61% | | | - 3.26% | | | | 4.13% | | | 2.01% |
Performance data quoted represents past performance. Past performance does not guarantee future results. Investment return and principal value of an investment will fluctuate so that an investor’s shares, when sold or redeemed, may be worth more or less than the original cost. Current performance data may be higher or lower than actual data quoted. For the most current month-end performance data please call 1-855-845-9444. The table does not reflect the deduction of taxes that a shareholder would pay on Fund distributions or the redemption of Fund shares. |
* Fund Inception date of August 2, 2011. (1) Net Asset Value (NAV) is the share price without sales charges. (2) Maximum Offering Price (MOP) includes sales charges. Class A returns include effects of the Fund’s maximum sales charge of 5.50%. (3) The SG CTA Index (formerly, the Newedge CTA Index) provides the market with a reliable daily performance benchmark of major commodity trading advisors (CTAs). The SG CTA Index calculates the daily rate of return for a pool of CTAs selected from the larger managers that are open to new investment. Selection of the pool of qualified CTAs used in construction of the Index will be conducted annually, with re-balancing on January 1st of each year. A committee of industry professionals has been established to monitor the methodology of the index on a regular basis. The Index is not actively managed and does not reflect any deduction for fees, expenses or taxes. An investor cannot invest directly in the Index. (4) Aspen Managed Futures Beta Index – The Managed Futures Beta Index is constructed using a quantitative, rules-based model designed to replicate the trend-following and counter-trend exposure of futures markets by allocating assets to liquid futures contracts of certain financial and commodities futures markets. The Index therefore seeks to reflect the performance of strategies and exposures common to a broad universe of futures markets, i.e., managed futures beta. The index is not actively managed and does not reflect any deductions for fees, expense or taxes. An investor may not invest directly in an index. |
| | |
| | | Portfolio Composition as of April 30, 2016 As a percentage of Net Assets^ 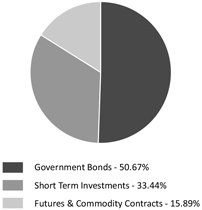 ^ Holdings subject to change, and may not reflect the current or future position of the portfolio. |
Performance of $10,000 Initial Investment (as of April 30, 2016)
Comparison of change in value of a $10,000 investment (includes applicable sales loads)
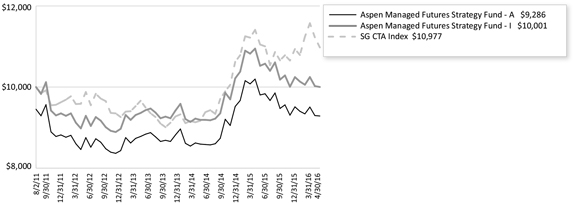
The chart represents historical performance of a hypothetical investment of $10,000 in the Fund since inception. Past performance does not guarantee future results. This chart does not reflect the deduction of taxes that a shareholder would pay on Fund distributions or the redemption of Fund shares.
| | |
| 4 | | www.aspenfuturesfund.com |
| | |
| Aspen Managed Futures Strategy Fund | | Consolidated Disclosure of Fund Expenses |
| | April 30, 2016 (Unaudited) |
As a shareholder of the Fund, you incur two types of costs: transaction costs, including sales charges (loads) on purchase payments, reinvested dividends, or other distributions; redemption fees; and exchange fees; and (2) ongoing costs, including management fees; distribution and/or service (12b-1) fees; shareholder servicing fees; and other fund operating expenses. This example is intended to help you understand your ongoing costs (in dollars), of investing in the Fund and to compare these costs with the ongoing costs of investing in other mutual funds.
This example is based on an investment of $1,000 invested at the beginning of the period and held for the entire six-month period of November 1, 2015 through April 30, 2016.
Actual Expenses The first line of the table below provides information about actual account values and actual expenses. You may use the information in this line, together with the amount you invested, to estimate the expenses that you paid over the period. Simply divide your account value by $1,000 (for example, an $8,600 account value divided by $1,000 = 8.6), then multiply the result by the number in the first line under the heading “Expenses Paid During Period” to estimate the expenses you paid on your account during this period.
Hypothetical Example for Comparison Purposes The second line of the table below provides information about hypothetical account values and hypothetical expenses based on the Fund’s actual expense ratio and an assumed rate of return of 5% per year before expenses, which is not the Fund’s actual return. The hypothetical account values and expenses may not be used to estimate the actual ending account balance or expenses you paid for the period. You may use this information to compare the ongoing costs of investing in the Fund and other funds. To do so, compare this 5% hypothetical example with the 5% hypothetical examples that appear in the shareholder reports of other mutual funds.
Please note that the expenses shown in the table are meant to highlight your ongoing costs only and do not reflect any transactional costs, such as applicable sales charges (loads), redemption fees, or exchange fees. Therefore, the second line of the table is useful in comparing ongoing costs only and will not help you determine the relative total costs of owning different funds. In addition, if these transactional costs were included, your costs would have been higher.
| | | | | | | | | | | | | | | | | | | | |
| | | Beginning
Account Value
11/1/15 | | Ending
Account Value
4/30/16 | | Expense Ratio(a) | | Expenses Paid
During period
11/1/15 - 4/30/16(b) |
| | | | |
Class A | | | | | | | | | | | | | | | | | | | | |
Actual | | | $ | 1,000.00 | | | | $ | 997.90 | | | | | 1.60% | | | | $ | 7.95 | |
Hypothetical (5% return before expenses) | | | $ | 1,000.00 | | | | $ | 1,016.91 | | | | | 1.60% | | | | $ | 8.02 | |
Class I | | | | | | | | | | | | | | | | | | | | |
Actual | | | $ | 1,000.00 | | | | $ | 999.40 | | | | | 1.24% | | | | $ | 6.16 | |
Hypothetical (5% return before expenses) | | | $ | 1,000.00 | | | | $ | 1,018.70 | | | | | 1.24% | | | | $ | 6.22 | |
| (a) | The Fund’s expense ratios have been based on the Fund’s most recent fiscal half-year expenses. |
| (b) | Expenses are equal to the Fund’s annualized expense ratio multiplied by the average account value over the period, multiplied by the number of days in the most recent fiscal half-year (182)/366 (to reflect the half-year period). |
| | |
| Annual Report | April 30, 2016 | | 5 |
| | |
| Aspen Managed Futures Strategy Fund | | Consolidated Schedule of Investments |
| | April 30, 2016 |
| | | | | | | | |
| | | Principal Amount/
Shares | | | Value (Note 2) | |
| |
GOVERNMENT BONDS (50.67%) | | | | | | | | |
U.S. TREASURY NOTES (50.67%) | | | | | | | | |
0.250%, 05/15/2016 | | $ | 5,000,000 | | | $ | 5,000,160 | |
0.375%, 05/31/2016 | | | 7,029,000 | | | | 7,030,005 | |
0.500%, 06/30/2016 | | | 5,000,000 | | | | 5,001,970 | |
0.500%, 07/31/2016 | | | 5,000,000 | | | | 5,002,250 | |
0.500%, 08/31/2016 | | | 15,042,000 | | | | 15,049,130 | |
0.500%, 09/30/2016 | | | 7,500,000 | | | | 7,503,383 | |
0.500%, 09/30/2016 | | | 3,350,000 | | | | 3,351,511 | |
0.375%, 10/31/2016 | | | 8,071,000 | | | | 8,069,741 | |
0.500%, 11/30/2016 | | | 19,050,000 | | | | 19,054,458 | |
0.500%, 01/31/2017 | | | 13,000,000 | | | | 12,998,726 | |
0.500%, 03/31/2017 | | | 15,014,000 | | | | 15,007,844 | |
0.625%, 05/31/2017 | | | 10,065,000 | | | | 10,065,201 | |
0.625%, 07/31/2017 | | | 19,823,000 | | | | 19,818,738 | |
0.625%, 08/31/2017 | | | 5,045,000 | | | | 5,042,341 | |
0.625%, 09/30/2017 | | | 6,050,000 | | | | 6,045,626 | |
| | |
TOTAL GOVERNMENT BONDS | | | | | | | | |
| | | | | | | | |
(Cost $143,993,513) | | | | | | | 144,041,084 | |
| | | | | | | | |
| | |
SHORT TERM INVESTMENTS (33.44%) | | | | | | | | |
MONEY MARKET FUND (4.16%) | | | | | | | | |
Dreyfus Treasury & Agency Cash Management Fund - Institutional Shares, 7-day yield, 0.162% | | | 11,829,203 | | | | 11,829,203 | |
| | | | | | | | |
| | |
U.S. TREASURY BILLS (29.28%) | | | | | | | | |
0.243%, 05/26/2016(a) | | | 10,600,000 | | | | 10,598,210 | |
0.285%, 06/23/2016(a) | | | 10,500,000 | | | | 10,495,600 | |
0.333%, 07/21/2016(a) | | | 10,000,000 | | | | 9,995,800 | |
0.418%, 08/18/2016(a) | | | 4,000,000 | | | | 3,997,048 | |
0.413%, 09/15/2016(a) | | | 5,000,000 | | | | 4,995,245 | |
0.575%, 10/13/2016(a) | | | 9,400,000 | | | | 9,385,336 | |
0.496%, 11/10/2016(a) | | | 10,000,000 | | | | 9,981,620 | |
0.563%, 12/08/2016(a) | | | 13,350,000 | | | | 13,322,085 | |
0.565%, 01/05/2017(a) | | | 10,500,000 | | | | 10,471,388 | |
| | | | | | | | |
| | | | | | | 83,242,332 | |
| | | | | | | | |
| | |
TOTAL SHORT TERM INVESTMENTS (Cost $95,024,319) | | | | | | | 95,071,535 | |
| | | | | | | | |
| | |
TOTAL INVESTMENTS (84.11%) (Cost $239,017,832) | | | | | | $ | 239,112,619 | |
| | | | | | | | |
| | |
Other Assets In Excess Of Liabilities (15.89%) | | | | | | | 45,167,783(b) | |
| | | | | | | | |
| | |
NET ASSETS (100.00%) | | | | | | $ | 284,280,402 | |
| | | | | | | | |
| (a) | Rate shown represents the bond equivalent yield to maturity at date of purchase. |
| (b) | Includes cash which is being held as collateral for futures contracts. |
| | |
| See Notes to Consolidated Financial Statements. | | |
6 | | www.aspenfuturesfund.com |
| | |
| Aspen Managed Futures Strategy Fund | | Consolidated Schedule of Investments |
| | April 30, 2016 |
FUTURES CONTRACTS
At April 30, 2016, the Fund had outstanding futures contracts:
| | | | | | | | | | | | | | | | | | |
| Description | | Position | | | | Contracts | | Expiration
Date | | Underlying Face
Amount at Value | | | Unrealized
Appreciation | | | |
|
Commodity Contracts | | | | | | | | | | | | | | | | | | |
Copper Future(a) | | Long | | | | 64 | | 07/28/2016 | | $ | 3,653,600 | | | $ | 94,195 | | | |
Corn Future(a) | | Long | | | | 551 | | 07/15/2016 | | | 10,792,713 | | | | 190,806 | | | |
Gold 100 Oz Future(a) | | Long | | | | 85 | | 06/29/2016 | | | 10,969,250 | | | | 456,217 | | | |
New York Harbor ULSD Future(a) | | Long | | | | 64 | | 06/01/2016 | | | 3,725,568 | | | | 6,784 | | | |
Silver Future(a) | | Long | | | | 123 | | 07/28/2016 | | | 10,958,685 | | | | 304,885 | | | |
Soybean Future(a) | | Long | | | | 208 | | 07/15/2016 | | | 10,709,400 | | | | 12,228 | | | |
Sugar No. 11 (World) Future(a) | | Long | | | | 398 | | 07/01/2016 | | | 7,274,803 | | | | 212,468 | | | |
WTI Crude Future(a) | | Long | | | | 81 | | 05/23/2016 | | | 3,719,520 | | | | 234,280 | | | |
Foreign Currency Contracts | | | | | | | | | | | | | | | | | | |
Australian Dollar Currency Future | | Long | | | | 1,251 | | 06/14/2016 | | | 94,913,370 | | | | 581,297 | | | |
Canadian Dollar Currency Future | | Long | | | | 415 | | 06/15/2016 | | | 33,092,100 | | | | 1,656,186 | | | |
Japanese Yen Currency Future | | Long | | | | 441 | | 06/14/2016 | | | 51,696,225 | | | | 2,586,168 | | | |
New Zealand Dollar Currency Future | | Long | | | | 924 | | 06/14/2016 | | | 64,347,360 | | | | 2,189,395 | | | |
Interest Rate Contracts | | | | | | | | | | | | | | | | | | |
Canadian 10 Year Bond Future | | Short | | | | 314 | | 06/22/2016 | | | (34,826,046) | | | | 21,112 | | | |
| | | | | | | | | | | |
| | | | | | | | | | $ | 271,026,548 | | | $ | 8,546,021 | | | |
| | | | | | | | | | | |
| | | | | | | |
| Description | | Position | | | | Contracts | | Expiration
Date | | Underlying Face
Amount at Value | | | Unrealized
Depreciation | | | |
|
Equity Contracts | | | | | | | | | | | | | | | | | | |
Euro STOXX 50® Index Future | | Long | | | | 195 | | 06/20/2016 | | $ | 6,647,189 | | | $ | (194,722) | | | |
FTSE® 100 Index Future | | Long | | | | 148 | | 06/20/2016 | | | 13,433,471 | | | | (194,952) | | | |
Nikkei 225 Index Future | | Short | | | | 76 | | 06/10/2016 | | | (6,051,500) | | | | (50,176) | | | |
S&P 500® E-Mini Future | | Long | | | | 127 | | 06/20/2016 | | | 13,075,285 | | | | (173,937) | | | |
Foreign Currency Contracts | | | | | | | | | | | | | | | | | | |
Euro FX Currency Future | | Short | | | | 97 | | 06/14/2016 | | | (13,901,313) | | | | (179,170) | | | |
Swiss Franc Currency Future | | Short | | | | 496 | | 06/14/2016 | | | (64,752,800) | | | | (2,054,904) | | | |
Interest Rate Contracts | | | | | | | | | | | | | | | | | | |
Euro-Bund Future | | Long | | | | 93 | | 06/09/2016 | | | 17,238,551 | | | | (215,268) | | | |
Long Gilt Future | | Long | | | | 102 | | 06/29/2016 | | | 17,824,872 | | | | (284,169) | | | |
U.S. 10 Year Treasury Note Future | | Long | | | | 136 | | 06/22/2016 | | | 17,688,500 | | | | (78,806) | | | |
| | | | | | | | | | | |
| | | | | | | | | | $ | 1,202,255 | | | $ | (3,426,104) | | | |
| | | | | | | | | | | |
Common Abbreviations:
FTSE - Financial Times and the London Stock Exchange
S&P - Standard and Poor’s
ULSD - Ultra Low Sulfur Diesel
| (a) | Owned by an entity that is owned by the Fund and is consolidated as described in Note 1 of the Notes to the Consolidated Financial Statements. |
For Fund compliance purposes, the Fund’s industry classifications refer to any one or more of the industry sub-classifications used by one or more widely recognized market indexes or ratings group indexes, and/or as defined by Fund management. This definition may not apply for purposes of this report, which may combine industry sub-classifications for reporting ease. Industries are shown as a percentage of net assets.
| | |
| See Notes to Consolidated Financial Statements. | | |
Annual Report | April 30, 2016 | | 7 |
| | |
| Aspen Managed Futures Strategy Fund | | Consolidated Statement of Assets & Liabilities |
| | April 30, 2016 |
| | | | |
ASSETS: | | | | |
Investments, at value | | $ | 239,112,619 | |
Cash | | | 13,897,984 | |
Deposit with broker for futures contracts (Note 3) | | | 34,293,921 | |
Receivable for shares sold | | | 284,803 | |
Variation margin receivable | | | 671,792 | |
Interest receivable | | | 181,663 | |
Prepaid and other assets | | | 19,566 | |
| |
Total assets | | | 288,462,348 | |
| |
| |
LIABILITIES: | | | | |
Foreign cash due to broker for futures contracts (Note 3)(Cost $2,597,264) | | | 2,637,965 | |
Payable to advisor | | | 175,956 | |
Variation margin payable | | | 660,725 | |
Payable for shares redeemed | | | 521,262 | |
Payable for administration fees | | | 19,266 | |
Payable for distribution and service fees | | | | |
Class A | | | 22,175 | |
Payable for transfer agency fees | | | 9,336 | |
Delegated transfer agent equivalent services fees | | | | |
Class A | | | 1,058 | |
Class I | | | 25,559 | |
Payable for trustee fees and expenses | | | 1,680 | |
Payable for professional fees | | | 32,454 | |
Payable for chief compliance officer fees | | | 2,894 | |
Payable for principal financial officer fees | | | 417 | |
Payable for licensing fees | | | 58,652 | |
Accrued expenses and other liabilities | | | 12,547 | |
| |
Total liabilities | | | 4,181,946 | |
| |
NET ASSETS | | $ | 284,280,402 | |
| |
| |
NET ASSETS CONSIST OF: | | | | |
| |
Paid-in capital (Note 5) | | $ | 297,577,676 | |
Accumulated net investment income | | | 2,217,954 | |
Accumulated net realized loss | | | (20,689,231) | |
Net unrealized appreciation | | | 5,174,003 | |
| |
NET ASSETS | | $ | 284,280,402 | |
| |
| |
INVESTMENTS, AT COST | | $ | 239,017,832 | |
| |
PRICING OF SHARES: | | | | |
Class A: | | | | |
Net Asset Value, offering and redemption price per share | | $ | 8.83 | |
Net Assets | | $ | 19,682,046 | |
Shares of beneficial interest outstanding | | | 2,229,960 | |
Maximum offering price per share (NAV/0.9450), based on maximum sales charge of 5.50% of the offering price | | $ | 9.34 | |
| |
Class I: | | | | |
Net Asset Value, offering and redemption price per share | | $ | 8.98 | |
Net Assets | | $ | 264,598,356 | |
Shares of beneficial interest outstanding | | | 29,451,202 | |
| | |
| See Notes to Consolidated Financial Statements. | | |
8 | | www.aspenfuturesfund.com |
| | |
| Aspen Managed Futures Strategy Fund | | Consolidated Statement of Operations |
| | For the Year Ended April 30, 2016 |
| | | | |
| |
INVESTMENT INCOME: | | | | |
Interest | | $ | 811,329 | |
Dividends | | | 8,982 | |
| |
Total investment income | | | 820,311 | |
| |
| |
EXPENSES: | | | | |
Investment advisory fees (Note 6) | | | 2,176,587 | |
Investment advisory fees - subsidiary (Note 6) | | | 230,237 | |
Administrative fees | | | 222,375 | |
Distribution and service fees | | | | |
Class A | | | 79,491 | |
Transfer agency fees | | | 70,973 | |
Delegated transfer agent equivalent services fees | | | | |
Class A | | | 6,627 | |
Class I | | | 130,458 | |
Professional fees | | | 49,931 | |
Custodian fees | | | 11,859 | |
Trustee fees and expenses | | | 20,663 | |
Principal financial officer fees | | | 5,000 | |
Chief compliance officer fees | | | 34,729 | |
Licensing fees | | | 725,529 | |
Other | | | 72,713 | |
| |
Total expenses before waiver/reimbursement | | | 3,837,172 | |
Waiver of investment advisory fees - subsidiary (Note 6) | | | (230,237) | |
| |
Total net expenses | | | 3,606,935 | |
| |
NET INVESTMENT LOSS | | | (2,786,624) | |
| |
| |
Net realized gain on investments | | | 14,041 | |
Net realized loss on futures contracts | | | (21,958,420) | |
Net realized loss on foreign currency transactions | | | (103,475) | |
| |
Total net realized loss | | | (22,047,854) | |
| |
Net change in unrealized depreciation of investments | | | (23,511) | |
Net change in unrealized appreciation on futures contracts | | | 9,971,765 | |
Net change in unrealized depreciation on translation of assets and liabilities denominated in foreign currency transactions | | | (50,452) | |
| |
Net change in unrealized appreciation | | | 9,897,802 | |
| |
NET REALIZED AND UNREALIZED LOSS ON INVESTMENTS | | | (12,150,052) | |
| |
NET DECREASE IN NET ASSETS RESULTING FROM OPERATIONS | | $ | (14,936,676) | |
| |
| | |
| See Notes to Consolidated Financial Statements. | | |
Annual Report | April 30, 2016 | | 9 |
| | |
| Aspen Managed Futures Strategy Fund | | Consolidated Statements of Changes in Net Assets |
| | | | | | | | |
| | | For the
Year Ended
April 30, 2016 | | | For the Year Ended April 30, 2015 | |
| |
OPERATIONS: | | | | | | | | |
Net investment loss | | $ | (2,786,624) | | | $ | (2,422,171) | |
Net realized gain/(loss) | | | (22,047,854) | | | | 36,321,277 | |
Net change in unrealized appreciation/(depreciation) | | | 9,897,802 | | | | (7,020,209) | |
| |
Net increase/(decrease) in net assets resulting from operations | | | (14,936,676) | | | | 26,878,897 | |
| |
| | |
DISTRIBUTIONS TO SHAREHOLDERS (Note 4): | | | | | | | | |
From net investment income | | | | | | | | |
Class A | | | (290,384) | | | | – | |
Class I | | | (4,854,577) | | | | – | |
From net realized gains on investments | | | | | | | | |
Class A | | | (1,080,184) | | | | (309,900) | |
Class I | | | (15,329,525) | | | | (4,218,836) | |
| |
Net decrease in net assets from distributions | | | (21,554,670) | | | | (4,528,736) | |
| |
| | |
SHARE TRANSACTIONS (Note 5): | | | | | | | | |
Class A | | | | | | | | |
Proceeds from sales of shares | | | 17,757,620 | | | | 13,068,693 | |
Distributions reinvested | | | 1,314,015 | | | | 298,289 | |
Cost of shares redeemed | | | (20,727,211) | | | | (3,700,970) | |
Redemption fees | | | 5,100 | | | | 531 | |
Class I | | | | | | | | |
Proceeds from sales of shares | | | 83,806,547 | | | | 75,913,390 | |
Distributions reinvested | | | 16,756,950 | | | | 3,994,682 | |
Cost of shares redeemed | | | (44,568,213) | | | | (25,671,930) | |
Redemption fees | | | 2,041 | | | | 1,186 | |
| |
Net increase from share transactions | | | 54,346,849 | | | | 63,903,871 | |
| |
| | |
Net increase in net assets | | | 17,855,503 | | | | 86,254,032 | |
| |
| | |
NET ASSETS: | | | | | | | | |
Beginning of period | | | 266,424,899 | | | | 180,170,867 | |
| |
End of period* | | $ | 284,280,402 | | | $ | 266,424,899 | |
| |
*Includes accumulated net investment income of: | | $ | 2,217,954 | | | $ | 5,144,673 | |
| | |
Other Information: | | | | | | | | |
SHARE TRANSACTIONS: | | | | | | | | |
Class A | | | | | | | | |
Sold | | | 1,836,531 | | | | 1,300,095 | |
Distributions reinvested | | | 146,490 | | | | 30,594 | |
Redeemed | | | (2,134,823) | | | | (388,614) | |
| |
Net increase/(decrease) in shares outstanding | | | (151,802) | | | | 942,075 | |
| |
| | |
Class I | | | | | | | | |
Sold | | | 8,468,843 | | | | 7,614,314 | |
Distributions reinvested | | | 1,837,385 | | | | 403,911 | |
Redeemed | | | (4,699,475) | | | | (2,608,713) | |
| |
Net increase in shares outstanding | | | 5,606,753 | | | | 5,409,512 | |
| |
| | |
| See Notes to Consolidated Financial Statements. | | |
10 | | www.aspenfuturesfund.com |
| | |
| Aspen Managed Futures Strategy Fund – Class A | | Consolidated Financial Highlights |
| | For a share outstanding throughout the periods presented. |
| | | | | | | | | | | | | | | | | | | | |
| | | For the
Year Ended
April 30, 2016 (a) | | | For the
Year Ended
April 30, 2015 (a) | | | For the
Year Ended
April 30, 2014 (a) | | | For the
Year Ended
April 30, 2013 (a) | | | For the Period
August 2, 2011
(Inception) to
April 30, 2012 (a) | |
| |
NET ASSET VALUE, BEGINNING OF PERIOD | | $ | 10.01 | | | $ | 8.97 | | | $ | 9.29 | | | $ | 8.95 | | | $ | 10.00 | |
INCOME/(LOSS) FROM OPERATIONS: | | | | | | | | | | | | | | | | | | | | |
Net investment loss(b) | | | (0.12) | | | | (0.14) | | | | (0.16) | | | | (0.16) | | | | (0.13) | |
Net realized and unrealized gain/(loss) on investments | | | (0.39) | | | | 1.39 | | | | (0.05) | | | | 0.50 | | | | (0.92) | |
| |
Total from investment operations | | | (0.51) | | | | 1.25 | | | | (0.21) | | | | 0.34 | | | | (1.05) | |
| |
LESS DISTRIBUTIONS: | | | | | | | | | | | | | | | | | | | | |
From net investment income | | | (0.14) | | | | – | | | | – | | | | – | | | | – | |
Distributions from net realized gain on investments | | | (0.53) | | | | (0.21) | | | | (0.12) | | | | – | | | | – | |
| |
Total distributions | | | (0.67) | | | | (0.21) | | | | (0.12) | | | | – | | | | – | |
| |
REDEMPTION FEES ADDED TO PAID IN CAPITAL | | | 0.00(c) | �� | | | 0.00(c) | | | | 0.01 | | | | 0.00(c) | | | | – | |
| |
INCREASE/(DECREASE) IN NET ASSET VALUE | | | (1.18) | | | | 1.04 | | | | (0.32) | | | | 0.34 | | | | (1.05) | |
| |
NET ASSET VALUE, END OF PERIOD | | $ | 8.83 | | | $ | 10.01 | | | $ | 8.97 | | | $ | 9.29 | | | $ | 8.95 | |
| |
| | | | | |
TOTAL RETURN(d) | | | (5.20%) | | | | 14.00% | | | | (2.15%) | | | | 3.80% | | | | (10.50%)(e) | |
| | | | | |
RATIOS AND SUPPLEMENTAL DATA: | | | | | | | | | | | | | | | | | | | | |
Net assets, end of period (000’s) | | $ | 19,682 | | | $ | 23,850 | | | $ | 12,914 | | | $ | 3,350 | | | $ | 1,254 | |
| | | | | |
RATIOS TO AVERAGE NET ASSETS: | | | | | | | | | | | | | | | | | | | | |
Operating expenses excluding fee waivers/reimbursements | | | 1.56%(g) | | | | 1.64% | | | | 1.83% | | | | 1.80% | | | | 2.53%(f) | |
Operating expenses including fee waivers/reimbursements | | | 1.56% | | | | 1.64% | | | | 1.83% | | | | 1.80% | | | | 1.80%(f) | |
Net investment loss including fee waivers/reimbursements | | | (1.24%) | | | | (1.50%) | | | | (1.72%) | | | | (1.75%) | | | | (1.79%)(f) | |
| | | | | |
PORTFOLIO TURNOVER RATE | | | 58% | | | | 38% | | | | 90% | | | | 0% | | | | 0%(e) | |
| (a) | Per share amounts and ratios to average net assets include income and expenses of the Aspen Futures Fund Ltd. (subsidiary), exclusive of the subsidiary’s management fee. |
| (b) | Per share numbers have been calculated using the average shares method. |
| (c) | Less than $0.005 per share. |
| (d) | Total return does not reflect the effect of sales charges. |
| (g) | The ratio of operating expenses excluding fee waivers/reimbursements to average net assets is calculated excluding the waived Subsidiary management fee (see Note 6 for additional detail). The ratio inclusive of that fee would be 1.64%. |
| | |
| See Notes to Consolidated Financial Statements. | | |
Annual Report | April 30, 2016 | | 11 |
| | |
| Aspen Managed Futures Strategy Fund – Class I | | Consolidated Financial Highlights |
| | For a share outstanding throughout the periods presented. |
| | | | | | | | | | | | | | | | | | | | |
| | | For the
Year Ended
April 30, 2016 (a) | | | For the
Year Ended
April 30, 2015 (a) | | | For the
Year Ended
April 30, 2014 (a) | | | For the
Year Ended
April 30, 2013 (a) | | | For the Period
August 2, 2011
(Inception) to
April 30, 2012 (a) | |
| |
NET ASSET VALUE, BEGINNING OF PERIOD | | $ | 10.17 | | | $ | 9.07 | | | $ | 9.36 | | | $ | 8.98 | | | $ | 10.00 | |
INCOME/(LOSS) FROM OPERATIONS: | | | | | | | | | | | | | | | | | | | | |
Net investment loss(b) | | | (0.09) | | | | (0.11) | | | | (0.11) | | | | (0.11) | | | | (0.11) | |
Net realized and unrealized gain/(loss) on investments | | | (0.40) | | | | 1.42 | | | | (0.06) | | | | 0.49 | | | | (0.91) | |
| |
Total from investment operations | | | (0.49) | | | | 1.31 | | | | (0.17) | | | | 0.38 | | | | (1.02) | |
| |
LESS DISTRIBUTIONS: | | | | | | | | | | | | | | | | | | | | |
From net investment income | | | (0.17) | | | | – | | | | – | | | | – | | | | – | |
Distributions from net realized gain on investments | | | (0.53) | | | | (0.21) | | | | (0.12) | | | | – | | | | – | |
| |
Total distributions | | | (0.70) | | | | (0.21) | | | | (0.12) | | | | – | | | | – | |
| |
REDEMPTION FEES ADDED TO PAID IN CAPITAL | | | 0.00(c) | | | | 0.00(c) | | | | 0.00(c) | | | | 0.00(c) | | | | 0.00(c) | |
| |
INCREASE/(DECREASE) IN NET ASSET VALUE | | | (1.19) | | | | 1.10 | | | | (0.29) | | | | 0.38 | | | | (1.02) | |
| |
NET ASSET VALUE, END OF PERIOD | | $ | 8.98 | | | $ | 10.17 | | | $ | 9.07 | | | $ | 9.36 | | | $ | 8.98 | |
| |
| | | | | |
TOTAL RETURN | | | (4.97%) | | | | 14.51% | | | | (1.81%) | | | | 4.23% | | | | (10.20%)(d) | |
| | | | | |
RATIOS AND SUPPLEMENTAL DATA: | | | | | | | | | | | | | | | | | | | | |
Net assets, end of period (000’s) | | $ | 264,598 | | | $ | 242,575 | | | $ | 167,258 | | | $ | 120,769 | | | $ | 90,450 | |
| | | | | |
RATIOS TO AVERAGE NET ASSETS: | | | | | | | | | | | | | | | | | | | | |
Operating expenses excluding fee waivers/reimbursements | | | 1.22%(f) | | | | 1.25% | | | | 1.30% | | | | 1.25% | | | | 1.75%(e) | |
Operating expenses including fee waivers/reimbursements | | | 1.22% | | | | 1.25% | | | | 1.30% | | | | 1.25% | | | | 1.55%(e) | |
Net investment loss including fee waivers/reimbursements | | | (0.94%) | | | | (1.11%) | | | | (1.20%) | | | | (1.20%) | | | | (1.54%)(e) | |
| | | | | |
PORTFOLIO TURNOVER RATE | | | 58% | | | | 38% | | | | 90% | | | | 0% | | | | 0%(d) | |
| (a) | Per share amounts and ratios to average net assets include income and expenses of the Aspen Futures Fund Ltd. (subsidiary), exclusive of the subsidiary’s management fee. |
| (b) | Per share numbers have been calculated using the average shares method. |
| (c) | Less than $0.005 per share. |
| (f) | The ratio of operating expenses excluding fee waivers/reimbursements to average net assets is calculated excluding the waived Subsidiary management fee (see Note 6 for additional detail). The ratio inclusive of that fee would be 1.30%. |
| | |
| See Notes to Consolidated Financial Statements. | | |
12 | | www.aspenfuturesfund.com |
| | |
| Aspen Managed Futures Strategy Fund | | Notes to Consolidated Financial Statements |
| | April 30, 2016 |
1. ORGANIZATION
Financial Investors Trust (the “Trust”), a Delaware statutory trust, is an open-end management investment company registered under the Investment Company Act of 1940, as amended (“1940 Act”). As of April 30, 2016, the Trust had 34 registered funds. This annual report describes the Aspen Managed Futures Strategy Fund (the “Fund”). The Fund seeks investment results that replicate as closely as possible, before fees and expenses, the price and yield performance of the Aspen Managed Futures Beta Index (the “MFBI” or “Index”). The Aspen Managed Futures Strategy Fund offers Class A and Class I shares.
Basis of Consolidation for the Aspen Futures Fund, Ltd.
Aspen Futures Fund, Ltd. (the “Subsidiary”), a Cayman Islands exempted company, is a wholly owned subsidiary of the Fund. The Subsidiary’s investment objective is designed to enhance the ability of the Fund to obtain exposure to equities, financial, currency and commodities markets consistent with the limits of the U.S. federal tax law requirements applicable to registered investment companies. The Subsidiary is subject to substantially the same investment policies and investment restrictions as the Fund. The Subsidiary acts as an investment vehicle for the Fund in order to effect certain commodity-related investments on behalf of the Fund. Investments in the Subsidiary are expected to provide the Fund with exposure to the commodity markets within the limitations of Subchapter M of the Internal Revenue Code of 1986, as amended (the “Code”), and recent IRS revenue rulings, as discussed below under “Federal Income Taxes”. The Fund is the sole shareholder of the Subsidiary pursuant to a subscription agreement dated as of August 2, 2011, and it is intended that the Fund will remain the sole shareholder and will continue to control the Subsidiary. Under the Articles of Association of the Subsidiary, shares issued by the Subsidiary confer upon a shareholder the right to wholly own and vote at general meetings of the Subsidiary and certain rights in connection with any winding-up or repayment of capital, as well as the right to participate in the profits or assets of the Subsidiary. The Fund may invest up to 25% of its total assets in shares of the Subsidiary. As a wholly owned subsidiary of the Fund, all assets and liabilities, income and expenses of the Subsidiary are consolidated in the financial statements and financial highlights of the Fund. All investments held by the Subsidiary are disclosed in the accounts of the Fund. As of April 30, 2016, net assets of the Fund were $284,280,402, of which $23,654,939 or 8.32%, represented the Fund’s ownership of all issued shares and voting rights of the Subsidiary.
2. SIGNIFICANT ACCOUNTING POLICIES
The accompanying financial statements were prepared in accordance with accounting principles generally accepted in the United States of America (“U.S. GAAP”). The preparation of financial statements in conformity with U.S. GAAP requires management to make certain estimates and assumptions that affect the reported amounts of assets and liabilities and disclosures of contingent assets and liabilities at the date of the financial statements and the reported amounts of revenue and expenses during the period. Actual results could differ from those estimates. The Fund is considered an investment company for financial reporting purposes under U.S. GAAP. The following is a summary of significant accounting policies consistently followed by the Fund and subsidiary in preparation of the financial statements.
Investment Valuation: The Fund generally values its securities based on market prices determined at the close of regular trading on the New York Stock Exchange (“NYSE”), normally 4:00 p.m. Eastern Time, on each day the NYSE is open for trading.
For equity securities and mutual funds that are traded on an exchange, the market price is usually the closing sale or official closing price on that exchange. In the case of equity securities not traded on an exchange, or if such closing prices are not otherwise available, the securities are valued at the mean of the most recent bid and ask prices on such day. Redeemable securities issued by open-end registered investment companies are valued at the investment company’s applicable net asset value, with the exception of exchange-traded open-end investment companies, which are priced as equity securities.
The market price for debt obligations is generally the price supplied by an independent third-party pricing service approved by the Board of Trustees (the “Board”), which may use a matrix, formula or other objective method that takes into consideration quotations from dealers, market transactions in comparable investments, market indices and yield curves. If vendors are unable to supply a price, or if the price supplied is deemed to be unreliable, the market price may be determined using quotations received from one or more brokers–dealers that make a market in the security.
Futures contracts that are listed or traded on a national securities exchange, commodities exchange, contract market or comparable over-the-counter market, and that are freely transferable, are valued at their closing settlement price on the exchange on which they are primarily traded or based upon the current settlement price for a like instrument acquired on the day on which the instrument is being valued. A settlement price may not be used if the market makes a limit move with respect to a particular commodity.
Forward currency exchange contracts have a fair value determined by the prevailing foreign currency exchange daily rates and current foreign currency exchange forward rates. The foreign currency exchange forward rates are calculated using an automated system that estimates rates on the basis of the current day foreign currency exchange rates and forward foreign currency exchange rates supplied by a pricing service.
| | |
| Annual Report | April 30, 2016 | | 13 |
| | |
| Aspen Managed Futures Strategy Fund | | Notes to Consolidated Financial Statements |
| | April 30, 2016 |
Investment securities that are primarily traded on foreign securities exchanges are valued at the preceding closing values of such securities on their respective exchanges, except when an occurrence subsequent to the time a value was so established is likely to have changed such value. In such an event, the fair value of those securities are determined in good faith through consideration of other factors in accordance with procedures established by and under the general supervision of the Board.
When such prices or quotations are not available, or when Aspen Partners, Ltd. (the “Adviser”) believes that they are unreliable, securities may be priced using fair value procedures approved by the Board.
Fair Value Measurements: The Fund discloses the classification of its fair value measurements following a three-tier hierarchy based on the inputs used to measure fair value. Inputs refer broadly to the assumptions that market participants would use in pricing the asset or liability, including assumptions about risk. Inputs may be observable or unobservable. Observable inputs reflect the assumptions market participants would use in pricing the asset or liability that are developed based on market data obtained from sources independent of the reporting entity. Unobservable inputs reflect the reporting entity’s own assumptions about the assumptions market participants would use in pricing the asset or liability that are developed based on the best information available.
Various inputs are used in determining the value of the Fund’s investments as of the end of the reporting period. When inputs used fall into different levels of the fair value hierarchy, the level in the hierarchy within which the fair value measurement falls is determined based on the lowest level input that is significant to the fair value measurement in its entirety. The designated input levels are not necessarily an indication of the risk or liquidity associated with these investments. These inputs are categorized in the following hierarchy under applicable financial accounting standards:
| | | | |
Level 1 | | – | | Unadjusted quoted prices in active markets for identical investments, unrestricted assets or liabilities that the Fund has the ability to access at the measurement date; |
| | |
Level 2 | | – | | Quoted prices which are not active, quoted prices for similar assets or liabilities in active markets or inputs other than quoted prices that are observable (either directly or indirectly) for substantially the full term of the asset or liability; and |
| | |
Level 3 | | – | | Significant unobservable prices or inputs (including the Fund’s own assumptions in determining the fair value of investments) where there is little or no market activity for the asset or liability at the measurement date. |
The following is a summary of each input used to value the Fund as of April 30, 2016:
| | | | | | | | | | | | | | | | |
| Investments in Securities at Value | | Level 1 -
Quoted Prices | | | Level 2 - Other Significant
Observable Inputs | | | Level 3 - Significant Unobservable
Inputs | | | Total | |
| |
Government Bonds | | $ | – | | | $ | 144,041,084 | | | $ | – | | | $ | 144,041,084 | |
Short Term Investments | | | | | | | | | | | | | | | | |
Money Market Fund | | | 11,829,203 | | | | – | | | | – | | | | 11,829,203 | |
U.S. Treasury Bills | | | – | | | | 83,242,332 | | | | – | | | | 83,242,332 | |
| |
TOTAL | | $ | 11,829,203 | | | $ | 227,283,416 | | | $ | – | | | $ | 239,112,619 | |
| |
Other Financial Instruments | | | | | | | | | | | | | | | | |
Assets: | | | | | | | | | | | | | | | | |
Futures Contracts | | | | | | | | | | | | | | | | |
Commodity Contracts | | $ | 1,511,863 | | | $ | – | | | $ | – | | | $ | 1,511,863 | |
Foreign Currency Contracts | | | 7,013,046 | | | | – | | | | – | | | | 7,013,046 | |
Interest Rate Contracts | | | 21,112 | | | | – | | | | – | | | | 21,112 | |
Liabilities: | | | | | | | | | | | | | | | | |
Futures Contracts | | | | | | | | | | | | | | | | |
Equity Contracts | | | (613,787) | | | | – | | | | – | | | | (613,787) | |
Foreign Currency Contracts | | | (2,234,074) | | | | – | | | | – | | | | (2,234,074) | |
Interest Rate Contracts | | | (578,243) | | | | – | | | | – | | | | (578,243) | |
| |
TOTAL | | $ | 5,119,917 | | | $ | – | | | $ | – | | | $ | 5,119,917 | |
| |
The Fund recognizes transfers between levels as of the end of the period. For the year ended April 30, 2016, the Fund did not have any transfers between Level 1 and Level 2 securities. For the year ended April 30, 2016, the Fund did not have any securities that used significant unobservable inputs (Level 3) in determining fair value.
| | |
| 14 | | www.aspenfuturesfund.com |
| | |
| Aspen Managed Futures Strategy Fund | | Notes to Consolidated Financial Statements |
| | April 30, 2016 |
Investment Transactions and Investment Income: Investment transactions are accounted for on the date the investments are purchased or sold (trade date). Realized gains and losses from investment transactions are reported on an identified cost basis. Interest income, which includes accretion of discounts, is accrued and recorded as earned. Dividend income is recognized on the ex-dividend date or for certain foreign securities, as soon as information is available to the Fund. All of the realized and unrealized gains and losses and net investment income, are allocated daily to each class in proportion to its average daily net assets.
Foreign Securities: The Fund may directly purchase securities of foreign issuers. Investing in securities of foreign issuers involves special risks not typically associated with investing in securities of U.S. issuers. The risks include possible reevaluation of currencies, the inability to repatriate foreign currency, less complete financial information about companies and possible future adverse political and economic developments. Moreover, securities of many foreign issuers and their markets may be less liquid and their prices more volatile than those of securities of comparable U.S. issuers.
Foreign Currency Translation: The books and records of the Fund are maintained in U.S. dollars. Investment valuations and other assets and liabilities initially expressed in foreign currencies are converted each business day into U.S. dollars based upon current exchange rates. Prevailing foreign exchange rates may generally be obtained at the close of the NYSE (normally, 4:00 p.m. Eastern Time). The portion of realized and unrealized gains or losses on investments due to fluctuations in foreign currency exchange rates is not separately disclosed and is included in realized and unrealized gains or losses on investments, when applicable.
Foreign Currency Spot Contracts: The Fund may enter into foreign currency spot contracts to facilitate transactions in foreign securities or to convert foreign currency receipts into U.S. dollars. A foreign currency spot contract is an agreement between two parties to buy and sell currencies at the current market rate, for settlement generally within two business days. The U.S. dollar value of the contracts is determined using current currency exchange rates supplied by a pricing service. The contract is marked-to-market daily for settlements beyond one day and any change in market value is recorded as an unrealized gain or loss. When the contract is closed, the Fund records a realized gain or loss equal to the difference between the value on the open and close date. Losses may arise from changes in the value of the foreign currency, or if the counterparties do not perform under the contract’s terms. The maximum potential loss from such contracts is the aggregate face value in U.S. dollars at the time the contract was opened.
Trust Expenses: Some expenses of the Trust can be directly attributed to the Fund. Expenses which cannot be directly attributed to the Fund are apportioned among all funds in the Trust based on average net assets of each fund.
Fund and Class Expenses: Expenses that are specific to a class of shares of the Fund, including distribution fees (Rule 12b-1 fees) and shareholder servicing fees, are charged directly to that share class. All expenses of the Fund, other than class specific expenses, are allocated daily to each class in proportion to its average daily net assets.
Federal Income Taxes: The Fund complies with the requirements under Subchapter M of the Internal Revenue Code of 1986, as amended, applicable to regulated investment companies and intends to distribute substantially all of their net taxable income and net capital gains, if any, each year so that it will not be subject to excise tax on distributed income and gains. The Fund is not subject to income taxes to the extent such distributions are made.
As of and during the year ended April 30, 2016, the Fund did not have a liability for any unrecognized tax benefits. The Fund files U.S. federal, state, and local tax returns as required. The Fund’s tax returns are subject to examination by the relevant tax authorities until expiration of the applicable statute of limitations, which is generally three years after the filing of the tax return for federal purposes and four years for most state returns. Tax returns for open years have incorporated no uncertain tax positions that require a provision for income taxes.
Distributions to Shareholders: The Fund normally pays dividends and distributes capital gains, if any, on an annual basis. Income dividend distributions are derived from interest and other income the Fund receives from its investments, including short term capital gains. Long term capital gains distributions are derived from gains realized when the Fund sells a security it has owned for more than a year. The Fund may make additional distributions and dividends at other times if the portfolio manager believes doing so may be necessary for the Fund to avoid or reduce taxes.
3. DERIVATIVE INSTRUMENTS
The Fund uses derivatives (including futures) to pursue its investment objective. The Fund’s use of derivative instruments involves risks different from, or possibly greater than, the risks associated with investing directly in securities and other traditional investments. These risks may include (i) the risk that the counterparty to a derivative transaction may not fulfill its contractual obligations, (ii) risk of mispricing or improper valuation, and (iii) the risk that changes in the value of the derivative may not correlate perfectly with the underlying asset, rate or index. These risks could cause
| | |
| Annual Report | April 30, 2016 | | 15 |
| | |
| Aspen Managed Futures Strategy Fund | | Notes to Consolidated Financial Statements |
| | April 30, 2016 |
the Fund to lose more than the principal amount invested. In addition, investments in derivatives involve leverage, which means a small percentage of assets invested in derivatives can have a disproportionately large impact on the Fund.
The Fund’s use of derivatives can result in losses due to unanticipated changes in the market risk factors and the overall market. In instances where the Fund is using derivatives to decrease, or hedge, exposures to market risk factors for securities held by the Fund, there are also risks that those derivatives may not perform as expected resulting in losses for the combined or hedged positions. Derivatives may have little or no initial cash investment relative to their market value exposure and therefore can produce significant gains or losses in excess of their cost. This use of embedded leverage allows the Fund to increase its market value exposure relative to its net assets and can substantially increase the volatility of the Fund’s performance.
In addition, use of derivatives may increase or decrease exposure to the following risk factors:
| | ● | | Equity Risk: Equity risk relates to the change in value of equity securities as they relate to increases or decreases in the general market. |
| | ● | | Interest Rate Risk: When the Fund invests in fixed-income securities or derivatives, the value of an investment in the Fund will fluctuate with changes in interest rates. Typically, a rise in interest rates causes a decline in the value of fixed-income securities or derivatives owned by the Fund. In general, the market price of debt securities with longer maturities will increase or decrease more in response to changes in interest rates than shorter-term securities. Other risk factors include credit risk (the debtor may default) and prepayment risk (the debtor may pay its obligation early, reducing the amount of interest payments). |
| | ● | | Foreign Currency Risk: Currency trading involves significant risks, including market risk, interest rate risk, country risk, counterparty credit risk and short sale risk. Market risk results from the price movement of foreign currency values in response to shifting market supply and demand. Interest rate risk arises whenever a country changes its stated interest rate target associated with its currency. Country risk arises because virtually every country may interfer with international transactions in its currency. Counterparty credit risk arises when the counterparty will not fulfill its obligations to the Fund. Short sale risk arises from the sale of a security that is not owned, or any sale that is completed by the delivery of a security borrowed. |
| | ● | | Commodity Risk: Exposure to the commodities markets may subject the Fund to greater volatility than investments in traditional securities. Commodity prices are influenced by unfavorable weather, animal and plant disease, geologic and environmental factors, as well as changes in government regulation such as tariffs, embargoes or burdensome production rules and restrictions. |
Futures: The Fund and the Subsidiary may enter into futures contracts. Futures contracts are agreements between two parties to buy and sell a particular commodity, instrument or index for a specified price on a specified future date. When the Fund or the Subsidiary enters into a futures contract, it is required to deposit with (or for the benefit of) its broker an amount of cash or short-term high-quality securities as “initial margin”. The margin requirements are set by the exchange on which the contract is traded and may be modified during the term of the contract. The initial margin is in the nature of a performance bond or good faith deposit on the futures contract that is returned to the Fund upon termination of the contract, assuming all contractual obligations have been satisfied. As the value of the contract changes, the value of the futures contract position increases or declines. Subsequent payments, known as “variation margin”, are made or received by the Fund or the Subsidiary each day, depending on the price fluctuations in the fair value of the contract and the value of cash or securities on deposit with the broker. Such payments or receipts are recorded for financial statement purposes as unrealized gains or losses by the Fund. Variation margin does not represent a borrowing or loan by the Fund but is instead a settlement between the Fund and the broker of the amount one would owe the other if the futures contract expired. When the contract is closed, the Fund record a realized gain or loss equal to the difference between the value of the contract at the time it was opened and the value at the time it was closed. When the Fund or the Subsidiary enters into a futures contract certain risks may arise, such as illiquidity in the futures market, which may limit the Fund’s or the Subsidiary’s ability to close out a futures contract prior to settlement date, and unanticipated movements in the value of securities, commodities or interest rates. Futures contracts are exchange-traded. Exchange-traded futures are standardized contracts and are settled through a clearing house with fulfillment supported by the credit of the exchange. Therefore, counterparty credit risk to the Fund and the Subsidiary is reduced. With exchange traded futures, there is minimal counterparty credit risk to the Funds since futures are exchange traded and the exchange’s clearinghouse, as a counterparty to all exchange traded futures, guarantees the futures against default.
| | |
| 16 | | www.aspenfuturesfund.com |
| | |
| Aspen Managed Futures Strategy Fund | | Notes to Consolidated Financial Statements |
| | April 30, 2016 |
Consolidated Balance Sheet – Fair Value of Derivative Instruments as of April 30, 2016:
| | | | | | | | | | | | |
| Risk Exposure | | Asset Derivatives Balance Sheet Location | | Fair Value | | | Liabilities Derivatives Balance Sheet Location | | Fair Value | |
| |
Futures Contracts | | Unrealized appreciation on futures contracts(a) | | $ | 8,546,021 | | | Unrealized depreciation on futures contracts (a) | | $ | (3,426,104) | |
| |
| | | | $ | 8,546,021 | | | | | $ | (3,426,104) | |
| |
| | | | |
| | Risk Exposure to Fund | | | | | | | | | | |
| | Commodity Contracts | | $ | 1,511,863 | | | | | $ | – | |
| | Equity Contracts | | | – | | | | | | 613,787 | |
| | Foreign Currency Contracts | | | 7,013,046 | | | | | | 2,234,074 | |
| | Interest Rate Contracts | | | 21,112 | | | | | | 578,243 | |
| | | | | | |
| | | | $ | 8,546,021 | | | | | $ | 3,426,104 | |
| | | | | | |
| (a) | Represents cumulative appreciation/(depreciation) of futures contracts as reported in the Consolidated Statement of Investments. Only the current day’s net variation margin is reported within the Consolidated Statement of Assets and Liabilities. |
Consolidated Statement of Operations – The effect of Derivative Instruments for the year ended April 30, 2016:
| | | | | | | | | | |
| Derivatives Instruments | | Location of Gain/(Loss) on Derivatives Recognized in Income | | Realized Gain/(Loss) on Derivatives Recognized in Income | | | Change in Unrealized
Appreciation/(Depreciation) on
Derivatives Recognized in Income | |
| |
Futures Contracts | | Net realized loss on futures contracts/Net change in unrealized appreciation on futures contracts | | $ | (21,958,420) | | | $ | 9,971,765 | |
| | | | | | |
| | | | $ | (21,958,420) | | | $ | 9,971,765 | |
| | | | | | |
| | | |
| | Risk Exposure to Fund | | | | | | | | |
| | Commodity Contracts | | $ | 3,352,059 | | | $ | 1,756,916 | |
| | Equity Contracts | | | (6,746,395) | | | | (689,300) | |
| | Foreign Currency Contracts | | | (12,030,276) | | | | 8,187,392 | |
| | Interest Rate Contracts | | | (6,533,808) | | | | 716,757 | |
| | | | | | |
| | | | $ | (21,958,420) | | | $ | 9,971,765 | |
| | | | | | |
The average number of net futures contracts held by the fund during the period was 924.
4. TAX BASIS INFORMATION
Reclassifications: Reclassifications to paid-in capital relate primarily to differing book/tax treatment of foreign currency transactions and income from a controlled foreign corporation. For the year ended April 30, 2016, the following reclassifications, which had no impact on results of operations or net assets, were recorded to reflect tax character:
| | | | | | | | | | | | |
| Fund | | Paid-in Capital | | | Accumulated Net
Investment Income | | | Accumulated Net
Realized Loss | |
| |
Aspen Managed Futures Strategy Fund | | $ | (1,756,917) | | | $ | 5,004,866 | | | $ | (3,247,949) | |
Tax Basis of Investments: As of April 30, 2016, the aggregate cost of investments, gross unrealized appreciation/(depreciation) and net unrealized depreciation for Federal tax purposes was as follows:
| | | | | | | | | | | | | | | | | | | | |
| | | Cost of Investments | | | Gross Appreciation
(excess of value over
tax cost) | | | Gross Depreciation
(excess of tax cost
over value) | | | Net Appreciation on
Futures Contracts
and Foreign
Currencies | | | Net Appreciation on
Investments | |
| |
Aspen Managed Futures Strategy Fund | | $ | 239,017,832 | | | $ | 347,476 | | | $ | (252,689) | | | $ | 5,079,216 | | | $ | 5,174,003 | |
| | |
| Annual Report | April 30, 2016 | | 17 |
| | |
| Aspen Managed Futures Strategy Fund | | Notes to Consolidated Financial Statements |
| | April 30, 2016 |
Components of Distributable Earnings: At April 30, 2016, components of distributable earnings were on a tax basis as follows:
| | | | |
| | | Aspen Managed Futures Strategy Fund | |
Undistributed ordinary income | | $ | 2,217,954 | |
Accumulated net capital losses | | | (17,081,177) | |
Net unrealized appreciation on futures contracts | | | 5,174,003 | |
Other cumulative effect of timing differences | | | (3,608,054) | |
| |
Total distributable earnings | | $ | (13,297,274) | |
| |
Capital Losses: As of April 30, 2016, the Fund has available for Federal income tax purposes unused capital losses that may be used to offset future realized capital gains. The Fund has $5,251,829 in short-term losses and $7,866,509 in long-term losses that will be carried forward indefinitely to offset future realized gains.
The Fund elects to defer $3,962,839 to the period ending April 30, 2017, capital losses recognized during the period November 1, 2015 to April 30, 2016.
Tax Basis of Distributions to Shareholders: Distributions are determined in accordance with federal income tax regulations, which differ from GAAP, and, therefore, may differ significantly in amount or character from net investment income and realized gains for financial reporting purposes. Financial reporting records are adjusted for permanent book/tax differences to reflect tax character but are not adjusted for temporary differences.
The tax character of distributions paid during the year ending April 30, 2016 were as follows:
| | | | | | | | |
| | | Ordinary Income | | | Long-Term Capital Gain | |
| |
Aspen Managed Futures Strategy Fund | | $ | 13,114,807 | | | $ | 8,439,863 | |
The tax character of distributions paid during the year ending April 30, 2015 were as follows:
| | | | | | | | |
| | | Ordinary Income | | | Long-Term Capital Gain | |
| |
Aspen Managed Futures Strategy Fund | | $ | 399,962 | | | $ | 4,128,774 | |
5. SHARES OF BENEFICIAL INTEREST
The capitalization of the Trust consists of an unlimited number of shares of beneficial interest with no par value per share. Holders of the shares of the Fund of the Trust have one vote for each share held and a proportionate fraction of a vote for each fractional share. All shares issued and outstanding are fully paid and are transferable and redeemable at the option of the shareholder. Purchasers of the shares do not have any obligation to make payments to the Trust or its creditors solely by reason of the purchasers’ ownership of the shares. Shares have no pre-emptive rights.
Fund shares redeemed within 30 days of purchase may incur a 2% short-term redemption fee deducted from the redemption amount. The amount of redemption fees received during the period are presented in the Consolidated Statement of Changes in Net Assets.
6. MANAGEMENT AND RELATED-PARTY TRANSACTIONS
The Adviser, subject to the authority of the Board, is responsible for the overall management and administration of the Fund’s business affairs. The Adviser manages the investments of the Fund in accordance with the Fund’s investment objective, policies and limitations and investment guidelines established jointly by the Adviser and the Board. Pursuant to the Investment Advisory Agreement, (the “Advisory Agreement”), the Fund will pay the Adviser an annual management fee of 0.75%, based on the Fund’s average daily net assets. The management fee is paid on a monthly basis.
The Subsidiary has entered into a separate advisory agreement (the “Subsidiary Advisory Agreement”) with the Adviser for the management of the Subsidiary’s portfolio pursuant to which the Subsidiary is obligated to pay the Adviser a management fee at the same rate that the Fund pays the Adviser for investment advisory services provided to the Fund. The Adviser has agreed to waive the advisory fee it receives from the Fund in an amount equal to the management fee paid by the Subsidiary. This waiver may not be terminated or modified without the consent of the Board.
| | |
| 18 | | www.aspenfuturesfund.com |
| | |
| Aspen Managed Futures Strategy Fund | | Notes to Consolidated Financial Statements |
| | April 30, 2016 |
This agreement may not be terminated or modified prior to this date except with the approval of the Board. For the period ended April 30, 2016, this amount equaled $230,237 and is disclosed in the Consolidated Statement of Operations. These waivers are not subject to reimbursement/recoupment.
The Adviser has agreed to waive and/or reimburse fees or expenses in order to limit total annual Fund operating expenses after fee waiver/expense reimbursements (excluding distribution and service (12b-1) fees, shareholder services fees, acquired fund fees and expenses, brokerage expenses, interest expenses, taxes and extraordinary expenses) to 1.55% of the Fund’s average daily net asset for each of Class A and Class I shares. This agreement is in effect from April 1, 2013 through August 31, 2016. The management fee is paid on a monthly basis.
The Adviser will be permitted to recover on a class-by-class basis, expenses it has borne through the agreement to the extent that the Fund’s expenses in later periods fall below the expense cap in effect at the time of waiver or reimbursement. Notwithstanding the foregoing, the Fund will not be obligated to pay any such deferred fees and expenses more than three years after the end of the fiscal year in which the fees and expenses were deferred. The Expense Agreement may not be terminated or modified prior to August 31, 2016 except with the approval of the Board.
Fund Administrator Fees and Expenses
ALPS Fund Services, Inc. (“ALPS”) serves as administrator to the Fund and the Fund has agreed to pay expenses incurred in connection with its administrative activities. Pursuant to an Administration Agreement, ALPS provides operational services to the Fund including, but not limited to, fund accounting and fund administration and generally assist in the Fund’s operations. Officers of the Trust are employees of ALPS. The Fund’s administration fee is accrued on a daily basis and paid monthly. Administration fees paid by the Fund for the year ended April 30, 2016 are disclosed in the Consolidated Statement of Operations.
ALPS is reimbursed by the Fund for certain out-of-pocket expenses.
Transfer Agent
ALPS serves as transfer, dividend paying and shareholder servicing agent for the Fund. ALPS receives an annual minimum fee, a fee based upon the number of shareholder accounts, and is also reimbursed by the Fund for certain out-of-pocket expenses. Transfer agent fees paid by the Fund for the year ended April 30, 2016 are disclosed in the Statement of Operations.
Compliance Services
ALPS provides services that assist the Trust’s chief compliance officer in monitoring and testing the policies and procedures of the Trust in conjunction with requirements under Rule 38a-1 under the 1940 Act and receives an annual base fee. ALPS is reimbursed for certain out-of-pocket expenses by the Fund. Compliance service fees paid by the Fund for the year ended April 30, 2016 are disclosed in the Statement of Operations.
Principal Financial Officer
ALPS receives an annual fee for providing principal financial officer services to the Fund. Principal financial officer fees paid by the Fund for the year ended April 30, 2016 are disclosed in the Statement of Operations.
Distributor
ALPS Distributors, Inc. (“ADI” or the “Distributor”) (an affiliate of ALPS) acts as the distributor of the Fund’s shares pursuant to a Distribution Agreement with the Trust. Shares are sold on a continuous basis by ADI as agent for the Fund, and ADI has agreed to use its best efforts to solicit orders for the sale of the Fund’s shares, although it is not obliged to sell any particular amount of shares. ADI is not entitled to any compensation for its services as Distributor. ADI is registered as a broker-dealer with the U.S. Securities and Exchange Commission.
The Fund has adopted a plan of distribution for Class A shares pursuant to Rule 12b-1 under the 1940 Act (the “Plan”). The Plan allows the Fund to use Class A assets to pay fees in connection with the distribution and marketing of Class A shares and/or the provision of shareholder services to Class A shareholders. The Plan permits payment for services in connection with the administration of plans or programs that use Class A shares as their funding medium and for related expenses. The recipients of such payments may include the Distributor, other affiliates of the Adviser, broker-dealers, financial institutions, plan sponsors and administrators and other financial intermediaries through which investors may purchase shares of the Fund. The Plan permits the Fund to use its Class A assets to make total payments at an annual rate of up to 0.25% of the Fund’s average daily net assets attributable to its Class A shares. The expenses of the plan are reflected as distribution and service fees in the Consolidated Statement of Operations.
The Fund has adopted a shareholder service plan (a “Shareholder Services Plan”) for Class A shares. Under the Shareholder Services Plan the Fund is authorized to compensate certain financial intermediaries, including broker-dealers and Fund affiliates, which may include the Distributor, Adviser and/or the transfer agent (“Participating Organizations”), an aggregate fee in an amount not to exceed on an annual basis 0.15% for Class A shares of the average daily net asset value of the Class A shares attributable to or held in the name of a Participating Organizations for its clients as compensation for providing shareholder service activities, which do not include distribution services, pursuant to an agreement with a Participating
| | |
| Annual Report | April 30, 2016 | | 19 |
| | |
| Aspen Managed Futures Strategy Fund | | Notes to Consolidated Financial Statements |
| | April 30, 2016 |
Organizations. Any amount of such payment not paid to the Participating Organizations during the Fund’s fiscal year for such service activities shall be reimbursed to the Fund. Shareholder Services Plan fees are included with distribution and service fees on the Consolidated Statement of Operations.
Certain intermediaries may charge networking, omnibus account or other administrative fees with respect to transactions in shares of the Fund. Transactions may be processed through the National Securities Clearing Corporation (“NSCC”) or similar systems or processed on a manual basis. These fees are paid by the Fund to the Distributor, which uses such fees to reimburse intermediaries. In the event an intermediary receiving payments from the Distributor on behalf of the Fund converts from a networking structure to an omnibus account structure or otherwise experiences increased costs, fees borne by the Fund may increase. Fees paid by the Fund for the year ended April 30, 2016 are disclosed in the Consolidated Statement of Operations as Delegated Transfer Agent Equivalent Services.
Index Licensing Services
The Fund has adopted an Index Licensing Agreement with Quantitative Equity Strategies, LLC (“QES”) and the Adviser, joint owners of the Index, pursuant to which the Fund pays QES a monthly annualized licensing fee of 0.25%, based on the Fund’s average daily net assets for the right to use the Index in connection with the Fund.
7. SECURITIES TRANSACTIONS
The cost of purchases and proceeds from sales of U.S. Government securities (excluding short-term securities) during the year ended April 30, 2016 were as follows:
| | | | |
Aspen Managed Futures Strategy Fund | |
Cost of Investments Purchased | | $ | 163,485,913 | |
Proceeds from Investments Sold | | $ | 79,848,575 | |
8. INDEMNIFICATIONS
Under the Trust’s organizational documents, its officers and Trustees are indemnified against certain liability arising out of the performance of their duties to the Trust. Additionally, in the normal course of business, the Trust enters into contracts with service providers that may contain general indemnification clauses, which may permit indemnification to the extent permissible under applicable law. The Trust’s maximum exposure under these arrangements is unknown, as this would involve future claims that may be made against the Trust that have not yet occurred.
| | |
| 20 | | www.aspenfuturesfund.com |
| | |
| Aspen Managed Futures Strategy Fund | | Report of Independent Registered Public Accounting Firm |
| | |
To the Shareholders and Board of Trustees of Financial Investors Trust:
We have audited the accompanying consolidated statement of assets and liabilities, including the consolidated schedule of investments, of Aspen Managed Futures Strategy Fund and subsidiary (the “Fund”), one of the portfolios constituting Financial Investors Trust, as of April 30, 2016, and the related consolidated statement of operations for the year then ended, the consolidated statements of changes in net assets for each of the two years in the period then ended, and the consolidated financial highlights for each of the four years in the period then ended and for the period from August 2, 2011 (inception) to April 30, 2012. These financial statements and financial highlights are the responsibility of the Fund’s management. Our responsibility is to express an opinion on these financial statements and financial highlights based on our audits.
We conducted our audits in accordance with the standards of the Public Company Accounting Oversight Board (United States). Those standards require that we plan and perform the audit to obtain reasonable assurance about whether the financial statements and financial highlights are free of material misstatement. The Fund is not required to have, nor were we engaged to perform, an audit of its internal control over financial reporting. Our audits included consideration of internal control over financial reporting as a basis for designing audit procedures that are appropriate in the circumstances, but not for the purpose of expressing an opinion on the effectiveness of the Fund’s internal control over financial reporting. Accordingly, we express no such opinion. An audit also includes examining, on a test basis, evidence supporting the amounts and disclosures in the financial statements, assessing the accounting principles used and significant estimates made by management, as well as evaluating the overall financial statement presentation. Our procedures included confirmation of securities owned as of April 30, 2016, by correspondence with the custodian and broker. We believe that our audits provide a reasonable basis for our opinion.
In our opinion, the consolidated financial statements and financial highlights referred to above present fairly, in all material respects, the financial position of Aspen Managed Futures Strategy Fund and subsidiary of the Financial Investors Trust as of April 30, 2016, the results of their operations for the year then ended, the changes in their net assets for each of the two years in the period then ended, and the financial highlights for each of the four years in the period then ended and the period from August 2, 2011 (inception) to April 30, 2012, in conformity with accounting principles generally accepted in the United States of America.
DELOITTE & TOUCHE LLP
Denver, Colorado
June 28, 2016
| | |
| Annual Report | April 30, 2016 | | 21 |
| | |
| Aspen Managed Futures Strategy Fund | | Disclosure Regarding Approval of Fund Advisory Agreement |
| | April 30, 2016 (Unaudited) |
On March 11, 2016, the Trustees met in person to discuss, among other things, the approval of the investment advisory agreement between the Trust and Aspen Partners, Ltd. (the “Adviser”) with respect to the Aspen Managed Futures Strategy Fund (the “Aspen Fund”) (the “Investment Advisory Agreement”), in accordance with Section 15(c) of the Investment Company Act of 1940, as amended. The Independent Trustees met with independent legal counsel during executive session and discussed the Investment Advisory Agreement and other related materials.
In renewing and approving the Investment Advisory Agreement, the Trustees, including the Independent Trustees, considered the following factors with respect to the Aspen Fund:
Investment Advisory Fee Rate: The Trustees reviewed and considered the contractual annual advisory fee paid by the Trust, on behalf of the Aspen Fund, to the Adviser of 0.75% of the Aspen Fund’s daily average net assets, in light of the extent and quality of the advisory services provided by the Adviser to the Aspen Fund.
The Board received and considered information including a comparison of the Aspen Fund’s contractual and actual advisory fees and overall expenses with those of funds in the peer group and universes of funds provided by an independent provider of investment company data (the “Independent Data Provider”). The Trustees noted that the contractual advisory fee rate for the Aspen Fund was below the Independent Data Provider peer group average and median contractual advisory fee rates.
Total Expense Ratios: Based on such information, the Trustees further reviewed and considered the total net expenses (after waivers) of 1.64% and 1.25% of the Class A and Class I shares, respectively, of the Aspen Fund. The Trustees noted that the Aspen Fund’s total net expenses (after waivers) were below the Independent Data Provider peer group average and median total net expenses (after waivers).
Nature, Extent and Quality of the Services under the Investment Advisory Agreement: The Trustees received and considered information regarding the nature, extent and quality of services to be provided to the Aspen Fund under the Investment Advisory Agreement. The Trustees reviewed certain background materials supplied by the Adviser in its presentation, including its Form ADV.
The Trustees reviewed and considered the Adviser’s investment advisory personnel, its history as an asset manager and its performance and the amount of assets currently under management by the Adviser and its affiliated entities. The Trustees also reviewed the research and decision-making processes utilized by the Adviser, including the methods adopted to seek to achieve compliance with the investment objectives, policies and restrictions of the Aspen Fund.
The Trustees considered the background and experience of the Adviser’s management in connection with the Aspen Fund, including reviewing the qualifications, backgrounds and responsibilities of the management team primarily responsible for the day-to-day portfolio management of the Aspen Fund and the extent of the resources devoted to research and analysis of actual and potential investments.
The Trustees also reviewed, among other things, the Adviser’s insider trading policies and procedures and its Code of Ethics.
Performance: The Trustees reviewed performance information for the Aspen Fund for the 3-month, 1-year and 3-year periods ended December 31, 2015. That review included a comparison of the Aspen Fund’s performance to the performance of a group of comparable funds selected by the Independent Data Provider. The Trustees noted the performance of the Aspen Fund’s Class A and Class I shares were above their respective Independent Data Provider peer group average and median performance for the 3-year period ended December 31, 2015 and below their respective Independent Data Provider peer group average and median for the 3-month and 1-year periods ended December 31, 2015. The Trustees also considered the Adviser’s discussion of the Aspen Fund’s underlying portfolio diversification categories, its top contributors and top detractors, as well as the Adviser’s performance and reputation generally and its investment techniques, risk management controls and decision-making processes.
Comparable Accounts: The Trustees noted certain information provided by the Adviser regarding fees charged to other Adviser clients and considered the Adviser’s statements indicating that there were no clients with investment mandates directly comparable to that of the Aspen Fund.
Profitability: The Trustees received and considered a retrospective and projected profitability analysis prepared by the Adviser based on the fees payable under the Investment Advisory Agreement with respect to the Aspen Fund. The Trustees considered the profits anticipated to be realized by the Adviser in connection with the operation of the Aspen Fund. The Board then reviewed the Adviser’s audited consolidated financial statements and supplemental schedule for the fiscal years 2013 and 2014 in order to analyze the financial condition and stability and profitability of the Adviser.
Economies of Scale: The Trustees considered whether economies of scale in the provision of services to the Aspen Fund will be passed along to the shareholders under the proposed agreements.
| | |
| 22 | | www.aspenfuturesfund.com |
| | |
| Aspen Managed Futures Strategy Fund | | Disclosure Regarding Approval of Fund Advisory Agreement |
| | April 30, 2016 (Unaudited) |
Other Benefits to the Adviser: The Trustees reviewed and considered any other incidental benefits derived or to be derived by the Adviser from its relationship with the Aspen Fund, including whether soft dollar arrangements were used.
In renewing the Adviser as the Aspen Fund’s investment adviser and renewing the Investment Advisory Agreement and the fees charged under the Investment Advisory Agreement, the Trustees concluded that no single factor reviewed by the Trustees was identified by the Trustees to be determinative as the principal factor in whether to renew the Investment Advisory Agreement. Further, the Independent Trustees were advised by separate independent legal counsel throughout the process. The Trustees, including all of the Independent Trustees, concluded that:
| | ● | | the Aspen Fund’s contractual advisory fee rate was the below its Independent Data Provider peer group average and median contractual advisory fee rates; |
| | ● | | the total net expenses (after waivers) for the Aspen Fund’s Class A and Class I shares were below their respective Independent Data Provider peer group average and median total net expenses (after waivers); |
| | ● | | the nature, extent and quality of services rendered by the Adviser under the Investment Advisory Agreement with respect to the Aspen Fund was adequate; |
| | ● | | the performance of the Aspen Fund’s Class A and Class I shares were above their respective Independent Data Provider peer group average and median performance for the 3-year period ended December 31, 2015 and below their respective Independent Data Provider peer group average and median performance for the 3-month and 1-year periods ended December 31, 2015; |
| | ● | | bearing in mind the limitations of comparing different types of managed accounts and the different levels of service typically associated with such accounts, the fee structures applicable to the Adviser’s other clients were not indicative of any unreasonableness with respect to the advisory fees proposed to be payable by the Aspen Fund; |
| | ● | | the profit realized by the Adviser in connection with the operation of the Aspen Fund is not unreasonable to the Aspen Fund; and |
| | ● | | there were no material economies of scale or other incidental benefits accruing to the Adviser in connection with its relationship with the Aspen Fund. |
During the review process, the Trustees noted certain instances where clarification or follow-up was appropriate and others where the Trustees determined that further clarification or follow-up was not necessary. In those instances where clarification or follow-up was requested, the Board determined that in each case either information responsive to its requests had been provided, or where any request was outstanding in whole or in part, given the totality of the information provided with respect to the Investment Advisory Agreement, the Board had received sufficient information to renew and approve the Investment Advisory Agreement.
Based on the Trustees’ deliberations and their evaluation of the information described above, the Trustees, including all of the Independent Trustees, concluded that the Adviser’s compensation for investment advisory services is consistent with the best interests of the Aspen Fund and its shareholders.
| | |
| Annual Report | April 30, 2016 | | 23 |
| | |
| Aspen Managed Futures Strategy Fund | | Additional Information |
| | April 30, 2016 (Unaudited) |
1. FUND HOLDINGS
The Fund files its complete schedule of portfolio holdings with the Securities and Exchange Commission (the “SEC”) for the first and third quarters of each fiscal year on Form N-Q within 60 days after the end of the period. Copies of the Fund’s Form N-Q are available without charge on the SEC website at http://www.sec.gov. You may also review and copy the Form N-Q at the SEC’s Public Reference Room in Washington, DC. For more information about the operation of the Public Reference Room, please call the SEC at 1-800-SEC-0330.
2. FUND PROXY VOTING POLICIES, PROCEDURES AND SUMMARIES
The Fund’s policies and procedures used in determining how to vote proxies and information regarding how the Fund voted proxies relating to portfolio securities during the most recent prior 12-month period ending June 30 are available without charge, (1) upon request, by calling (toll-free) 855-845-9444 and (2) on the SEC’s website at http://www.sec.gov.
3. TAX INFORMATION (UNAUDITED)
The Fund designates the following for federal income tax purposes for distributions made during the calendar year ended December 31, 2015:
| | | | |
| | | QDI | | DRD |
Aspen Managed Futures Strategy Fund | | 0.00 % | | 0.00 % |
In early 2016, if applicable, shareholders of record received this information for the distribution paid to them by the Fund during the calendar year 2015 via Form 1099. The Fund will notify shareholders in early 2017 of amounts paid to them by the Funds, if any, during the calendar year 2016.
Pursuant to Section 852(b)(3) of the Internal Revenue Code, Aspen Managed Futures Strategy Fund designated $8,439,863 as long-term capital gain distribution.
| | |
| 24 | | www.aspenfuturesfund.com |
| | |
| Aspen Managed Futures Strategy Fund | | Trustees and Officers |
| | April 30, 2016 (Unaudited) |
Additional information regarding the Fund’s trustees is included in the Statement of Additional Information, which can be obtained without charge by calling 855-845-9444.
INDEPENDENT TRUSTEES
| | | | | | | | | | |
Name, Address* & Year of Birth | | Position(s) Held with Fund | | Term of Office
and Length of Time Served | | Principal Occupation(s)
During Past 5 Years** | | Number of
Funds in
Fund
Complex
Overseen
by Trustee*** | | Other Directorships Held
by Trustee During Past 5 Years** |
Mary K. Anstine, 1940 | | Trustee | | Ms. Anstine was elected at a special meeting of shareholders held on March 21, 1997 and re-elected at a special meeting of shareholders held on August 7, 2009. | | Ms. Anstine was formerly an Executive Vice President of First Interstate Bank of Denver until 1994, President/Chief Executive Officer of HealthONE Alliance, Denver, Colorado, from 1994 to 2004, and has been retired since 2004. Ms. Anstine is also Trustee/Director of AV Hunter Trust and Colorado Uplift Board. Ms. Anstine was formerly a Director of the Trust Bank of Colorado (later purchased and now known as Northern Trust Bank), HealthONE and Denver Area Council of the Boy Scouts of America, and a member of the American Bankers Association Trust Executive Committee. | | 34 | | Ms. Anstine is a Trustee of ALPS ETF Trust (20 funds); ALPS Variable Investment Trust (9 funds); Reaves Utility Income Fund (1 fund); and Westcore Trust (12 funds). |
John R. Moran, Jr., 1930 | | Trustee | | Mr. Moran was elected at a special meeting of shareholders held on March 21, 1997 and re-elected at a special meeting of shareholders held on August 7, 2009. | | Mr. Moran formerly served as President and CEO of The Colorado Trust, a private foundation serving the health and hospital community in the state of Colorado, from 1991 to 2007. During his career as an attorney from 1958 to 1991, Mr. Moran was formerly a partner with the firm of Kutak Rock & Campbell in Denver, Colorado and a member of the Colorado House of Representatives. Currently, Mr. Moran is a member of the Treasurer’s Investment Advisory Committee for the University of Colorado. | | 34 | | None. |
| | |
| Annual Report | April 30, 2016 | | 25 |
| | |
| Aspen Managed Futures Strategy Fund | | Trustees and Officers |
| | April 30, 2016 (Unaudited) |
INDEPENDENT TRUSTEES
| | | | | | | | | | |
Name, Address* & Year of Birth | | Position(s) Held with Fund | | Term of Office
and Length of Time Served | | Principal Occupation(s)
During Past 5 Years** | | Number of
Funds in
Fund
Complex
Overseen
by Trustee*** | | Other Directorships Held
by Trustee During Past 5 Years** |
Jeremy W. Deems, 1976 | | Trustee | | Mr. Deems was appointed as a Trustee at the March 11, 2008 meeting of the Board of Trustees and elected at a special meeting of shareholders held on August 7, 2009. | | Mr. Deems is the Co-Founder, Chief Operations Officer and Chief Financial Officer of Green Alpha Advisors, LLC, a registered investment advisor, and Co-Portfolio Manager of the Shelton Green Alpha Fund. Prior to joining Green Alpha Advisors, Mr. Deems was CFO and Treasurer of Forward Management, LLC, ReFlow Management Co., LLC, ReFlow Fund, LLC, a private investment fund, and Sutton Place Management, LLC, an administrative services company, from 1998 to June 2007. From 2004 to 2005, Mr. Deems also served as Treasurer of the Forward Funds and the Sierra Club Funds. | | 34 | | Mr. Deems is a Trustee of ALPS ETF Trust (20 funds); ALPS Variable Investment Trust (9 funds), Reaves Utility Income Fund (1 fund) and Clough Funds Trust (1 fund). |
Jerry G. Rutledge, 1944 | | Trustee | | Mr. Rutledge was elected at a special meeting of shareholders held on August 7, 2009. | | Mr. Rutledge is the President and owner of Rutledge’s Inc., a retail clothing business. Mr. Rutledge is currently Director of the American National Bank. He was from 1994 to 2007 a Regent of the University of Colorado. | | 34 | | Mr. Rutledge is a Trustee of Principal Real Estate Fund (1 fund), Clough Global Allocation Fund (1 fund), Clough Global Equity Fund (1 fund) and Clough Global Opportunities Fund (1 fund). |
Michael “Ross” Shell, 1970 | | Trustee | | Mr. Shell was elected at a special meeting of shareholders held on August 7, 2009. | | Mr. Shell is Founder and CEO of Red Idea, LLC, a strategic consulting/early stage venture firm (since June 2008). From 1999 to 2009, he was a part-owner and Director of Tesser, Inc., a brand agency. From December 2005 to May 2008, he was Director, Marketing and Investor Relations, of Woodbourne, a REIT/real estate hedge fund and private equity firm. Prior to this, from May 2004 to November 2005, he worked as a business strategy consultant; from June 2003 to April 2004, he was on the Global Client Services team of IDEO, a product design/innovation firm; and from 1999 to 2003, he was President of Tesser, Inc. Mr. Shell graduated with honors from Stanford University with a degree in Political Science. | | 34 | | None. |
| | |
| 26 | | www.aspenfuturesfund.com |
| | |
| Aspen Managed Futures Strategy Fund | | Trustees and Officers |
| | April 30, 2016 (Unaudited) |
INTERESTED TRUSTEE
| | | | | | | | | | |
Name, Address* & Age | | Position(s) Held with Fund | | Term of Office
and Length of Time Served | | Principal Occupation(s)
During Past 5 Years** | | Number of
Funds in
Fund
Complex
Overseen by
Trustee*** | | Other Directorships
Held by Trustee |
Edmund J. Burke, 1961 | | Trustee, Chairman and President | | Mr. Burke was elected as Chairman at the August 28, 2009 meeting of the Board of Trustees. Mr. Burke was elected as Trustee at a special meeting of shareholders held on August 7, 2009. Mr. Burke was elected President of the Trust at the December 17, 2002 meeting of the Board of Trustees. | | Mr. Burke is President and a Director of ALPS Holdings, Inc. (“AHI”) (since 2005) and Director of Boston Financial Data Services, Inc. (“BFDS”), ALPS Advisors, Inc. (“AAI”), ALPS Distributors, Inc. (“ADI”), ALPS Fund Services, Inc. (“AFS”) and ALPS Portfolio Solutions Distributor, Inc. (“APSD”) and from 2001-2008, was President of AAI, ADI, AFS and APSD. Because of his positions with AHI, BFDS, AAI, ADI, AFS and APSD, Mr. Burke is deemed an affiliate of the Trust as defined under the 1940 Act. Mr. Burke is Trustee and President of the Clough Global Allocation Fund (Trustee since 2006; President since 2004); Trustee and President of the Clough Global Equity Fund (Trustee since 2006; President since 2005); Trustee and President of the Clough Global Opportunities Fund (since 2006); Trustee of the Liberty All-Star Equity Fund; and Director of the Liberty All-Star Growth Fund, Inc. | | 34 | | Mr. Burke is a Trustee of Clough Global Allocation Fund (1 fund); Clough Global Equity Fund (1 fund); Clough Global Opportunities Fund (1 fund); Liberty All-Star Equity Fund (1 fund) and Clough Funds Trust (1 fund); and Director of the Liberty All-Star Growth Fund, Inc. (1 fund). |
| | |
| Annual Report | April 30, 2016 | | 27 |
| | |
| Aspen Managed Futures Strategy Fund | | Trustees and Officers |
| | April 30, 2016 (Unaudited) |
OFFICERS
| | | | | | |
Name, Address* & Year of Birth | | Position(s) Held with Fund | | Term of Office and
Length of Time Served | | Principal Occupation(s) During Past 5 Years** |
Kimberly R. Storms, 1972 | | Treasurer | | Ms. Storms was elected Treasurer of the Trust at the March 12, 2013 meeting of the Board of Trustees. | | Ms. Storms is Senior Vice President - Director of Fund Administration of ALPS. Because of her position with ALPS, Ms. Storms is deemed an affiliate of the Trust as defined under the 1940 Act. Ms. Storms is also Treasurer of Liberty All-Star Equity Fund, Liberty All-Star Growth Fund, Inc. and ALPS Series Trust. Ms. Storms also serves as a Board member and Treasurer of The Center for Trauma & Resilience, a nonprofit agency. |
JoEllen L. Legg, 1961 | | Secretary | | Ms. Legg was elected Secretary of the Trust at the September 15, 2015 meeting of the Board of Trustees. | | Ms. Legg joined ALPS in October 2007 and is currently Vice President, Assistant General Counsel of ALPS. Prior to joining ALPS, Ms. Legg served as Senior Counsel - Law (Corporate & Securities) for Adelphia Communications Corporation (February 2005 - March 2007). Prior to this, Ms. Legg held associate positions at Fried Frank Harris Shriver & Jacobson LLP (1998 - 2004) and at Patton Boggs LLP (2004 - 2005). Because of her position with ALPS, Ms. Legg is deemed an affiliate of the Trust as defined under the 1940 Act. Ms. Legg is also the Secretary of ALPS Series Trust and Reaves Utility Income Fund. |
Ted Uhl, 1974 | | Chief Compliance Officer (“CCO”) | | Mr. Uhl was appointed CCO of the Trust at the June 8, 2010 meeting of the Board of Trustees. | | Mr. Uhl joined ALPS in October 2006, and is currently Deputy Compliance Officer of ALPS. Prior to his current role, Mr. Uhl served as Senior Risk Manager for ALPS from October 2006 until June 2010. Because of his position with ALPS, Mr. Uhl is deemed an affiliate of the Trust as defined under the 1940 Act. Mr. Uhl is also CCO of the Reaves Utility Income Fund, Centre Funds and Transparent Value Trust. |
Jennell Panella, 1974 | | Assistant Treasurer | | Ms. Panella was elected Assistant Treasurer of the Trust at the September 15, 2015 meeting of the Board of Trustees. | | Ms. Panella joined ALPS in June 2012 and is currently Fund Controller of ALPS Fund Services, Inc. Prior to joining ALPS, Ms. Panella served as Financial Reporting Manager for Parker Global Strategies, LLC (2009-2012). Because of her position with ALPS, Ms. Panella is deemed an affiliate of the Trust as defined under the 1940 Act. Ms. Panella also serves as Assistant Treasurer of James Advantage Funds. |
Nate Mandeville, 1977 | | Assistant Treasurer | | Mr. Mandeville was elected Assistant Treasurer of the Trust at the September 15, 2015 meeting of the Board of Trustees. | | Mr. Mandeville joined ALPS in December 2013 and is Fund Controller for ALPS. Prior to joining ALPS, Mr. Mandeville worked for Great-West Financial (2011-2013), Virtuoso Sourcing Group (2008-2011) and Janus Capital Group (2000-2008). Because of his position with ALPS, Mr. Mandeville is deemed an affiliate of the Trust as defined under the 1940 Act. Mr. Mandeville also serves as Assistant Treasurer of ALPS Series Trust. |
| | |
| 28 | | www.aspenfuturesfund.com |
| | |
| Aspen Managed Futures Strategy Fund | | Trustees and Officers |
| | April 30, 2016 (Unaudited) |
OFFICERS
| | | | | | |
Name, Address* & Year of Birth | | Position(s) Held with Fund | | Term of Office and
Length of Time Served | | Principal Occupation(s) During Past 5 Years** |
Sharon Akselrod, 1974 | | Assistant Secretary | | Ms. Akselrod was elected Assistant Secretary of the Trust at the September 15, 2015 meeting of the Board of Trustees. | | Ms. Akselrod joined ALPS in August 2014 and is currently Senior Investment Company Act Paralegal of ALPS. Prior to joining ALPS, Ms. Akselrod served as Corporate Governance and Regulatory Associate for Nordstrom fsb (2013-2014) and Senior Legal Assistant – Legal Manager for AXA Equitable Life Insurance Company (2008-2013). Because of her position with ALPS, Ms. Akselrod is deemed an affiliate of the Trust as defined under the 1940 Act. |
Sareena Khwaja-Dixon 1980 | | Assistant Secretary | | Ms. Khwaja-Dixon was elected Assistant Secretary of the Trust at the December 15, 2015 meeting of the Board of Trustees. | | Ms. Khwaja-Dixon joined ALPS in August 2015 and is currently Senior Counsel and Vice President of ALPS. Prior to joining ALPS, Ms. Khwaja-Dixon served as a Senior Paralegal/Paralegal for Russell Investments (2011- 2015). Because of her position with ALPS, Ms. Khwaja-Dixon is deemed an affiliate of the Trust as defined under the 1940 Act. |
| * | All communications to Trustees and Officers may be directed to Financial Investors Trust c/o 1290 Broadway, Suite 1100, Denver, CO 80203. |
| ** | This is the period for which the Trustee or Officer began serving the Trust. Each Trustee serves an indefinite term, until his successor is elected. Officers are elected on an annual basis. |
| *** | The Fund Complex includes all series of the Trust (currently 34) and any other investment companies for which any Trustee serves as trustee for and which Aspen Partners, Ltd. provides investment advisory services (currently none). |
| | |
| Annual Report | April 30, 2016 | | 29 |

This material must be accompanied or preceded by the prospectus.
WWW.ASPENFUTURESFUND.COM

THE
DISCIPLINE
GROWTH
INVESTORS
FUND
4.30.2016 DGIFX ANNUAL REPORT
WWW.DGIFUND.COM
PHONE: 855.344.3863 FAX: 866.205.1499 PO BOX 275 DENVER, CO 80201
| | | | |
Shareholder Letter | | | 3 | |
| |
Performance Update | | | 5 | |
| |
Disclosure of Fund Expenses | | | 7 | |
| |
Portfolio of Investments | | | 17 | |
| |
Statement of Assets and Liabilities | | | 19 | |
| |
Statement of Operations | | | 20 | |
| |
Statements of Changes in Net Assets | | | 21 | |
| |
Financial Highlights | | | 23 | |
| |
Notes to Financial Statements | | | 29 | |
| |
Report of Independent Registered Public Accounting Firm | | | 31 | |
| |
Additional Information | | | 32 | |
| |
Trustees and Officers | | | 33 | |
|
Disciplined Growth Investors’ goal is to communicate clearly and transparently with our clients and mutual fund shareholders. It is mutually beneficial when our shareholders understand how we invest, what we are currently thinking and forecasting, and the specific investment decisions we have made. Our views and opinions regarding the investment prospects of our portfolio holdings and Funds are “forward looking statements” which may or may not be accurate over the long term. While we believe we have a reasonable basis for these forecasts and have confidence in our investment team’s views, actual results may differ materially from those we anticipate. Information provided in this report should not be considered a recommendation to purchase or sell any particular security. | |
|
You can identify forward looking statements as those including words such as “believe”, “expect”, “anticipate”, “forecast”, and similar statement. We cannot assure future performance. These forward-looking statements are made only as-of the date of this report. Following the publication of this report, we will not update any of the forward-looking statements included here. | |
|
Past performance does not guarantee future results. Fund prices fluctuate as the underlying assets have exposure to market fluctuations and other risks, as described in the Fund’s prospectus. Please visit www.dgifund.com or call 855-344-3863 to obtain current performance information and for the current prospectus and statement of additional information. This material must be preceded or accompanied by a prospectus. Please read the prospectus carefully before investing. | |
| | |
| The Disciplined Growth Investors Fund | | Shareholder Letter |
| | April 30, 2016 (Unaudited) |
April 30, 2016
Dear Shareholders,
As of April 30, 2016, The Disciplined Growth Investors Fund had total assets of $119.9 million. For the last twelve months, The DGI Fund has returned -2.05%. Equities have returned -2.9% in this period while fixed income securities have returned 2.2%. The Fund’s year-to-date performance for 2016 is 3.21%. Since inception, The DGI Fund has returned 11.91% on an annualized basis (4 years, 8 months).
Portfolio Asset Mix
The portfolio currently holds 69.9% stocks and 30.1% bonds and cash. A list of holdings is included as part of this annual report and is available on the Fund’s website at www.dgifund.com.
Portfolio Turnover & Transactions
The DGI Fund’s turnover for the last twelve months was 12.8%. This includes Fund inflows and outflows from investors and is consistent with the Fund’s since-inception annualized turnover of 11.6%.
In the last twelve months, we made initial purchases of the following six stocks: Cognex Corp. (CGNX), Southwestern Energy (SWN), Super Micro Computer Inc. (SMCI), and TripAdvisor Inc. (TRIP). We also added to the existing positions in Plantronics Inc. (PLT), Power Integrations Inc. (POWI), Tumi Holdings Inc. (TUMI), and Ultra Petroleum (UPLMQ).
We sold the remaining positions in Brady Corp, Dreamworks Animation SKG, Eaton Corp, Janus Capital Group Inc., Noble Corp, Teradata Corp, and Trimble Navigation Ltd. In addition, Aruba Networks was acquired by another company.
Market & Portfolio Commentary
The last twelve months was characterized by numerous macroeconomic events, including a slowdown in China, a decline in oil prices continued instability in the Mideast. These events overshadowed the underlying strong progress of the companies held in the mutual fund.
The macroeconomic uncertainties in part caused the U.S. stock market to decline sharply early in calendar 2016. We held a conference call open to all shareholders in February to address market volatility and provide our portfolio outlook. A recording of that call is available upon request.
The fiscal year of the mutual fund runs from April 2015 through April 2016. During the fiscal year, 25 stocks in your mutual fund had positive returns and 34 had negative returns1. The top five performers combined for a return of 4.3%. The bottom five performers combined to detract 6.0%. Your Fund’s 10 largest equity holdings returned 3.4%, with six of the top 10 holdings having positive results.
The numerous headlines tempts all investors to take their eyes off the most important investment factors- the long term expected returns from each asset class. As of today, the stocks in your mutual fund have an expected return under reasonable assumptions in excess of our required 12% hurdle rate2. Bonds are yielding 2-3% and money funds offer nearly zero returns3. Given the wide disparity in expected returns between stocks and other assets, we are maintaining our exposure to
| | |
| Annual Report | April 30, 2016 | | 1 |
| | |
| The Disciplined Growth Investors Fund | | Shareholder Letter |
| | April 30, 2016 (Unaudited) |
stocks at 70%, slightly higher than our long-term target. Even though we think bonds and money funds offer sub-par returns we are prudently honoring the fund’s balanced objectives and maintaining 30% of the fund in these two asset categories. We are maintaining tight maturity controls on the bonds.
For further portfolio commentary, market outlook articles, and the occasional macroeconomic note, please visit www.dgifund.com.
Sincerely,
Frederick K. Martin, CFA
Chief Investment Officer
Disciplined Growth Investors, Inc.
| 1 | This reflects some holdings that were sold prior to 4/30/2016 and holdings added over the course of the last twelve months. As of 4/30/2016, your mutual fund held 51 stocks in the equity portion of the portfolio. |
| 2 | Hurdle rate refers to the minimum expected return a potential investment candidate must clear before we will make an investment. In the case of The DGI Fund the hurdle rate for stocks is 12%. This is an annualized rate of expected return over the next seven years. Existing holdings may show an expected return figure above or below the hurdle rate over the course of our long term ownership. |
| 3 | As of 4/30/2016, the US 10 Year Treasury Bond Yield was 1.83% and the Barclay’s US Aggregate Bond Index Yield was 2.15%. The S&P/BGCantor US Treasury Bill Money Market Index had a yield of 0.26%. |
| | |
| 2 | | 1-855-DGI-FUND (344-3863) | www.DGIfund.com |
| | |
| The Disciplined Growth Investors Fund | | Performance Update |
| | April 30, 2016 (Unaudited) |
Cumulative Total Return Performance (for the period ended April 30, 2016)
| | | | | | | | | | | | | | | | | | | | | | | | | | | | |
| | | 1 month | | | Quarter | | | 6 month | | | YTD | | | 1 Year | | | 3 Year | | | Since Inception* | |
Disciplined Growth | | | | | | | | | | | | | | | | | | | | | | | | | | | | |
Investors Fund | | | 0.76% | | | | 7.51% | | | | 1.40% | | | | 3.21% | | | | -2.05% | | | | 8.34% | | | | 11.91% | |
S&P 500® | | | | | | | | | | | | | | | | | | | | | | | | | | | | |
Total Return Index(1) | | | 0.39% | | | | 7.05% | | | | 0.43% | | | | 1.74% | | | | 1.21% | | | | 11.26% | | | | 15.06% | |
| * | Fund Inception date of August 12, 2011. |
| (1) | The S&P 500® Total Return Index is an unmanaged index of 500 common stocks chosen for market size, liquidity and industry group representation. It is a market-value weighted index. The Index is not actively managed and does not reflect any deductions for fees, expenses or taxes. An investor may not invest directly in the Index. |
The returns shown above do not reflect the deductions of taxes a shareholder would pay on Fund distributions or redemptions of Fund shares.
Returns less than one year are cumulative.
Performance data quoted represents past performance. Past performance does not guarantee future results. Investment return and principal value of an investment will fluctuate so that an investor’s shares, when sold or redeemed, may be worth more or less than the original cost. Current performance data may be higher or lower than actual data quoted. For the most current month-end performance data please call 1.855.DGI.FUND.
| | |
| Annual Report | April 30, 2016 | | 5 |
| | |
| The Disciplined Growth Investors Fund | | Performance Update |
| | April 30, 2016 (Unaudited) |
Growth of $10,000 Investment in the Fund (for the period ended April 30, 2016)
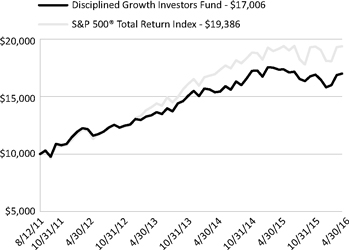
The chart represents historical performance of a hypothetical investment of $10,000 in the Fund since inception. Past performance does not guarantee future results. This chart does not reflect the deduction of taxes that a shareholder would pay on Fund distributions or the redemption of Fund shares.
Investing in the Fund is subject to investment risks, including possible loss of the principal amount invested.
| | | | |
| Industry Sector Allocation | | | |
| (as a % of Net Assets)* | | | |
| |
Technology | | | 25.97 | % |
Consumer Discretionary | | | 19.36 | % |
Health Care | | | 10.27 | % |
Producer Durables | | | 8.90 | % |
Energy | | | 2.27 | % |
Financial Services | | | 3.12 | % |
Asset/Mortgage Backed Securities | | | 0.08 | % |
Corporate Bond | | | 22.96 | % |
Foreign Government Bonds | | | 0.33 | % |
Government & Agency Obligations | | | 0.05 | % |
Other Assets in Excess of Liabilities | | | 6.69 | % |
| | | | |
| Top Ten Holdings | | | |
| (as a % of Net Assets)* | | | |
| |
U.S. Treasury Bill, 10/13/2016 | | | 5.00 | % |
Edwards Lifesciences Corp. | | | 4.88 | % |
TJX Cos., Inc. | | | 3.90 | % |
Intuit, Inc. | | | 3.37 | % |
Middleby Corp. | | | 3.26 | % |
Open Text Corp. | | | 2.82 | % |
L Brands, Inc. | | | 2.56 | % |
Plexus Corp. | | | 2.28 | % |
Autodesk, Inc. | | | 2.13 | % |
Intuitive Surgical, Inc. | | | 1.99 | % |
Top Ten Holdings | | | 32.19 | % |
| * | Holdings are subject to change, and may not reflect the current or future position of the portfolio. |
| | |
| 4 | | 1-855-DGI-FUND (344-3863) | www.DGIfund.com |
| | |
| The Disciplined Growth Investors Fund | | Disclosure of Fund Expenses |
| | April 30, 2016 (Unaudited) |
As a shareholder of the Fund, you incur two types of costs: (1) transaction costs, including sales charges (loads) on purchase payments, reinvested dividends, or other distributions; redemption fees; and exchange fees; and (2) ongoing costs, including management fees; distribution and/or service (12b-1) fees; and other fund operating expenses. This example is intended to help you understand your ongoing costs (in dollars), of investing in the Fund and to compare these costs with the ongoing costs of investing in other mutual funds.
This example is based on an investment of $1,000 invested at the beginning of the period and held for the entire six-month period of November 1, 2015 through April 30, 2016.
Actual Expenses The first line of the table below provides information about actual account values and actual expenses. You may use the information in this line, together with the amount you invested, to estimate the expenses that you paid over the period. Simply divide your account value by $1,000 (for example, an $8,600 account value divided by $1,000 = 8.6), then multiply the result by the number in the first line under the heading “Expenses Paid During Period” to estimate the expenses you paid on your account during this period.
Hypothetical Example for Comparison Purposes The second line of the table below provides information about hypothetical account values and hypothetical expenses based on the Fund’s actual expense ratio and an assumed rate of return of 5% per year before expenses, which is not the Fund’s actual return. The hypothetical account values and expenses may not be used to estimate the actual ending account balance or expenses you paid for the period. You may use this information to compare the ongoing costs of investing in the Fund and other mutual funds. To do so, compare this 5% hypothetical example with the 5% hypothetical examples that appear in the shareholder reports of the other funds.
Please note that the expenses shown in the table are meant to highlight your ongoing costs only and do not reflect transactional costs, such as sales charges (loads), redemption fees or exchange fees. Therefore, the second line of the table is useful in comparing ongoing costs only and will not help you determine the relative total costs of owning different funds. In addition, if these transactional costs were included, your costs would have been higher.
| | | | | | | | | | | | | | | | | | | | |
| | | Beginning Account
Value 11/1/2015 | | Ending Account
Value 4/30/2016 | | Expense
Ratio(a) | | Expenses Paid
During period
11/1/2015 -
4/30/2016(b) |
| | | | |
Actual | | | $ | 1,000.00 | | | | $ | 1,014.00 | | | | | 0.78 | % | | | $ | 3.91 | |
Hypothetical (5% return before expenses) | | | $ | 1,000.00 | | | | $ | 1,020.98 | | | | | 0.78 | % | | | $ | 3.92 | |
| (a) | The Fund’s expense ratios have been annualized based on the Fund’s most recent fiscal half-year expenses. |
| (b) | Expenses are equal to the Fund’s annualized expense ratio, multiplied by the average account value over the period, multiplied by the number of days in the most recent fiscal half-year (182)/366 (to reflect the half-year period). |
| | |
| Annual Report | April 30, 2016 | | 5 |
| | |
| The Disciplined Growth Investors Fund | | Portfolio of Investments |
| | April 30, 2016 |
| | | | | | | | |
| | | Shares | | | Value (Note 2) | |
| |
COMMON STOCKS (69.89%) | | | | | | | | |
CONSUMER DISCRETIONARY (19.36%) | | | | | | | | |
Auto & Auto Parts (1.45%) | | | | | | | | |
Gentex Corp. | | | 108,475 | | | $ | 1,739,939 | |
| | | | | | | | |
| | |
Consumer Products (4.82%) | | | | | | | | |
Ethan Allen Interiors, Inc. | | | 50,744 | | | | 1,727,326 | |
Garmin Ltd. | | | 37,225 | | | | 1,586,902 | |
Ralph Lauren Corp. | | | 9,956 | | | | 927,999 | |
Select Comfort Corp.(a) | | | 62,024 | | | | 1,530,752 | |
| | | | | | | | |
| | | | | | | 5,772,979 | |
| | | | | | | | |
| | |
Leisure (3.20%) | | | | | | | | |
Cheesecake Factory, Inc. | | | 15,987 | | | | 815,497 | |
Royal Caribbean Cruises Ltd. | | | 28,613 | | | | 2,214,646 | |
TripAdvisor, Inc.(a) | | | 12,400 | | | | 800,916 | |
| | | | | | | | |
| | | | | | | 3,831,059 | |
| | | | | | | | |
| | |
Retail (8.64%) | | | | | | | | |
Cabela’s, Inc.(a) | | | 36,975 | | | | 1,928,246 | |
L Brands, Inc. | | | 39,202 | | | | 3,069,125 | |
TJX Cos., Inc. | | | 61,675 | | | | 4,676,198 | |
Urban Outfitters, Inc.(a) | | | 22,725 | | | | 689,022 | |
| | | | | | | | |
| | | | | | | 10,362,591 | |
| | | | | | | | |
| | |
Textiles, Apparel & Luxury Goods (1.25%) | | | | | | | | |
Tumi Holdings, Inc.(a) | | | 56,250 | | | | 1,500,750 | |
| | | | | | | | |
| | |
TOTAL CONSUMER DISCRETIONARY | | | | | | | 23,207,318 | |
| | | | | | | | |
| | |
ENERGY (2.27%) | | | | | | | | |
Crude Producers (1.28%) | | | | | | | | |
Southwestern Energy Co.(a) | | | 114,050 | | | | 1,531,692 | |
| | | | | | | | |
| | |
Oil & Gas Services (0.92%) | | | | | | | | |
Core Laboratories NV | | | 8,300 | | | | 1,109,378 | |
| | | | | | | | |
| | |
Oil, Gas & Consumable Fuels (0.07%) | | | | | | | | |
Ultra Petroleum Corp.(a) | | | 257,313 | | | | 80,333 | |
| | | | | | | | |
| | |
TOTAL ENERGY | | | | | | | 2,721,403 | |
| | | | | | | | |
| | |
| 6 | | 1-855-DGI-FUND (344-3863) | www.DGIfund.com |
| | |
| The Disciplined Growth Investors Fund | | Portfolio of Investments |
| | April 30, 2016 |
| | | | | | | | |
| | | Shares | | | Value (Note 2) | |
| |
FINANCIAL SERVICES (3.12%) | | | | | | | | |
Banks (0.52%) | | | | | | | | |
TCF Financial Corp. | | | 45,375 | | | $ | 618,915 | |
| | | | | | | | |
| | |
Consumer Finance & Credit Services (1.93%) | | | | | | | | |
FactSet Research Systems, Inc. | | | 15,381 | | | | 2,318,686 | |
| | | | | | | | |
| | |
Investment Banking & Brokerage (0.67%) | | | | | | | | |
E*Trade Financial Corp.(a) | | | 31,908 | | | | 803,443 | |
| | | | | | | | |
| | |
TOTAL FINANCIAL SERVICES | | | | | | | 3,741,044 | |
| | | | | | | | |
| | |
HEALTH CARE (10.27%) | | | | | | | | |
Biotechnology (0.93%) | | | | | | | | |
Myriad Genetics, Inc.(a) | | | 30,900 | | | | 1,112,400 | |
| | | | | | | | |
| | |
Medical Equipment & Services (8.17%) | | | | | | | | |
Edwards Lifesciences Corp.(a) | | | 55,100 | | | | 5,852,171 | |
Intuitive Surgical, Inc.(a) | | | 3,799 | | | | 2,379,542 | |
Varian Medical Systems, Inc.(a) | | | 19,263 | | | | 1,563,770 | |
| | | | | | | | |
| | | | | | | 9,795,483 | |
| | | | | | | | |
| | |
Medical Specialties (1.17%) | | | | | | | | |
Align Technology, Inc.(a) | | | 19,425 | | | | 1,402,291 | |
| | | | | | | | |
| | |
TOTAL HEALTH CARE | | | | | | | 12,310,174 | |
| | | | | | | | |
| | |
PRODUCER DURABLES (8.90%) | | | | | | | | |
Computers (0.55%) | | | | | | | | |
IHS, Inc. - Class A(a) | | | 5,312 | | | | 654,332 | |
| | | | | | | | |
| | |
Machinery (3.26%) | | | | | | | | |
Middleby Corp.(a) | | | 35,666 | | | | 3,910,420 | |
| | | | | | | | |
| | |
Machinery-Diversified (0.68%) | | | | | | | | |
Graco, Inc. | | | 10,400 | | | | 815,256 | |
| | | | | | | | |
| | |
Professional Services (1.06%) | | | | | | | | |
CEB, Inc. | | | 20,500 | | | | 1,264,645 | |
| | | | | | | | |
| | |
Software (0.61%) | | | | | | | | |
Paychex, Inc. | | | 14,000 | | | | 729,680 | |
| | | | | | | | |
| | |
| Annual Report | April 30, 2016 | | 7 |
| | |
The Disciplined Growth Investors Fund | | Portfolio of Investments |
| | April 30, 2016 |
| | | | | | | | |
| | | Shares | | | Value (Note 2) | |
| |
PRODUCER DURABLES (continued) | | | | | | | | |
Transportation & Freight (2.74%) | | | | | | | | |
JetBlue Airways Corp.(a) | | | 86,525 | | | $ | 1,712,330 | |
Landstar System, Inc. | | | 24,012 | | | | 1,573,987 | |
| | | | | | | | |
| | | | | | | 3,286,317 | |
| | | | | | | | |
| | |
TOTAL PRODUCER DURABLES | | | | | | | 10,660,650 | |
| | | | | | | | |
| | |
TECHNOLOGY (25.97%) | | | | | | | | |
Computer Technology (1.03%) | | | | | | | | |
Super Micro Computer, Inc.(a) | | | 45,825 | | | | 1,233,151 | |
| | | | | | | | |
| | |
Electronics (6.71%) | | | | | | | | |
ARM Holdings PLC - Sponsored ADR | | | 20,849 | | | | 858,770 | |
Microchip Technology, Inc. | | | 22,000 | | | | 1,068,980 | |
Open Text Corp. | | | 60,537 | | | | 3,385,229 | |
Plexus Corp.(a) | | | 65,388 | | | | 2,730,603 | |
| | | | | | | | |
| | | | | | | 8,043,582 | |
| | | | | | | | |
| | |
Information Technology (10.59%) | | | | | | | | |
Akamai Technologies, Inc.(a) | | | 40,700 | | | | 2,075,293 | |
Autodesk, Inc.(a) | | | 42,725 | | | | 2,555,809 | |
Dolby Laboratories, Inc. - Class A | | | 18,325 | | | | 872,453 | |
Intuit, Inc. | | | 40,050 | | | | 4,040,645 | |
Seagate Technology PLC | | | 55,810 | | | | 1,214,984 | |
Yahoo!, Inc.(a) | | | 52,775 | | | | 1,931,565 | |
| | | | | | | | |
| | | | | | | 12,690,749 | |
| | | | | | | | |
| | |
Semiconductors (1.92%) | | | | | | | | |
Power Integrations, Inc. | | | 27,675 | | | | 1,335,319 | |
Synaptics, Inc.(a) | | | 13,575 | | | | 971,291 | |
| | | | | | | | |
| | | | | | | 2,306,610 | |
| | | | | | | | |
| | |
Software (2.42%) | | | | | | | | |
Cognex Corp. | | | 24,225 | | | | 860,714 | |
Medidata Solutions, Inc.(a) | | | 1,850 | | | | 80,715 | |
Qlik Technologies, Inc.(a) | | | 34,450 | | | | 1,060,716 | |
RealPage, Inc.(a) | | | 40,700 | | | | 894,993 | |
| | | | | | | | |
| | | | | | | 2,897,138 | |
| | | | | | | | |
| | |
| 8 | | 1-855-DGI-FUND (344-3863) | www.DGIfund.com |
| | |
The Disciplined Growth Investors Fund | | Portfolio of Investments |
| | April 30, 2016 |
| | | | | | | | |
| | | Shares | | | Value (Note 2) | |
| |
TECHNOLOGY (continued) | | | | | | | | |
Telecommunications (3.30%) | | | | | | | | |
Plantronics, Inc. | | | 54,188 | | | $ | 2,083,529 | |
Ubiquiti Networks, Inc.(a) | | | 30,375 | | | | 1,081,957 | |
ViaSat, Inc.(a) | | | 10,283 | | | | 788,706 | |
| | | | | | | | |
| | | | | | | 3,954,192 | |
| | | | | | | | |
| | |
TOTAL TECHNOLOGY | | | | | | | 31,125,422 | |
| | | | | | | | |
| | |
TOTAL COMMON STOCKS (Cost $60,653,009) | | | | | | | 83,766,011 | |
| | | | | | | | |
| | |
| | | Principal
Amount | | | Value (Note 2) | |
| |
ASSET/MORTGAGE BACKED SECURITIES (0.08%) | | | | | | | | |
Government National Mortgage Association, Series 2005-93 | | | | | | | | |
5.500% 12/20/2034 | | $ | 88,493 | | | | 90,490 | |
| | | | | | | | |
| | |
TOTAL ASSET/MORTGAGE BACKED SECURITIES (Cost $94,481) | | | | | | | 90,490 | |
| | | | | | | | |
| | |
CORPORATE BONDS (22.96%) | | | | | | | | |
BASIC MATERIALS (0.62%) | | | | | | | | |
Chemicals (0.28%) | | | | | | | | |
Lubrizol Corp. | | | | | | | | |
8.875% 02/01/2019 | | | 287,000 | | | | 341,787 | |
| | | | | | | | |
| | |
Iron/Steel (0.34%) | | | | | | | | |
Nucor Corp. | | | | | | | | |
5.750% 12/01/2017 | | | 380,000 | | | | 403,412 | |
| | | | | | | | |
| | |
TOTAL BASIC MATERIALS | | | | | | | 745,199 | |
| | | | | | | | |
| | |
COMMUNICATIONS (2.48%) | | | | | | | | |
Media (1.70%) | | | | | | | | |
21st Century Fox America, Inc. | | | | | | | | |
6.900% 03/01/2019 | | | 355,000 | | | | 405,614 | |
Comcast Cable Communications Holdings, Inc. | | | | | | | | |
9.455% 11/15/2022 | | | 288,000 | | | | 408,332 | |
Comcast Corp. | | | | | | | | |
5.150% 03/01/2020 | | | 715,000 | | | | 811,457 | |
| | |
| Annual Report | April 30, 2016 | | 9 |
| | |
The Disciplined Growth Investors Fund | | Portfolio of Investments |
| | April 30, 2016 |
��
| | | | | | | | |
| | | Principal
Amount | | | Value (Note 2) | |
| |
Media (continued) | | | | | | | | |
Viacom, Inc. | | | | | | | | |
5.625% 09/15/2019 | | $ | 370,000 | | | $ | 407,675 | |
| | | | | | | | |
| | | | | | | 2,033,078 | |
| | | | | | | | |
| | |
Telecommunications (0.78%) | | | | | | | | |
AT&T, Inc. | | | | | | | | |
3.000% 06/30/2022 | | | 510,000 | | | | 520,843 | |
AT&T, Inc. | | | | | | | | |
5.500% 02/01/2018 | | | 7,000 | | | | 7,500 | |
Verizon Communications, Inc. | | | | | | | | |
4.500% 09/15/2020 | | | 374,000 | | | | 413,896 | |
| | | | | | | | |
| | | | | | | 942,239 | |
| | | | | | | | |
| | |
TOTAL COMMUNICATIONS | | | | | | | 2,975,317 | |
| | | | | | | | |
| | |
CONSUMER, CYCLICAL (1.31%) | | | | | | | | |
Retail (1.31%) | | | | | | | | |
Advance Auto Parts, Inc. | | | | | | | | |
5.750% 05/01/2020 | | | 368,000 | | | | 402,526 | |
CVS Health Corp. | | | | | | | | |
4.125% 05/15/2021 | | | 352,000 | | | | 386,358 | |
McDonald’s Corp. | | | | | | | | |
6.300% 03/01/2038 | | | 286,000 | | | | 368,960 | |
Wal-Mart Stores, Inc. | | | | | | | | |
6.200% 04/15/2038 | | | 300,000 | | | | 410,313 | |
| | | | | | | | |
| | |
TOTAL CONSUMER, CYCLICAL | | | | | | | 1,568,157 | |
| | | | | | | | |
| | |
CONSUMER, NON-CYCLICAL (2.12%) | | | | | | | | |
Beverages (1.10%) | | | | | | | | |
Anheuser-Busch InBev Worldwide, Inc. | | | | | | | | |
2.500% 07/15/2022 | | | 416,000 | | | | 419,388 | |
Diageo Capital PLC | | | | | | | | |
5.750% 10/23/2017 | | | 455,000 | | | | 485,251 | |
Pepsi Bottling Group, Inc., Series B | | | | | | | | |
7.000% 03/01/2029 | | | 296,000 | | | | 413,093 | |
| | | | | | | | |
| | | | | | | 1,317,732 | |
| | | | | | | | |
| | |
Commercial Services (0.34%) | | | | | | | | |
Total System Services, Inc. | | | | | | | | |
2.375% 06/01/2018 | | | 406,000 | | | | 406,422 | |
| | | | | | | | |
| | |
| 10 | | 1-855-DGI-FUND (344-3863) | www.DGIfund.com |
| | |
| The Disciplined Growth Investors Fund | | Portfolio of Investments |
| | April 30, 2016 |
| | | | | | | | |
| | | Principal
Amount | | | Value (Note 2) | |
| |
Healthcare-Services (0.33%) | | | | | | | | |
UnitedHealth Group, Inc. | | | | | | | | |
3.350% 07/15/2022 | | $ | 380,000 | | | $ | 403,373 | |
| | | | | | | | |
| | |
Pharmaceuticals (0.35%) | | | | | | | | |
Johnson & Johnson | | | | | | | | |
5.850% 07/15/2038 | | | 308,000 | | | | 419,243 | |
| | | | | | | | |
| | |
TOTAL CONSUMER, NON-CYCLICAL | | | | | | | 2,546,770 | |
| | | | | | | | |
| | |
ENERGY (2.77%) | | | | | | | | |
Oil & Gas (0.55%) | | | | | | | | |
Conoco Funding Co. | | | | | | | | |
7.250% 10/15/2031 | | | 293,000 | | | | 347,202 | |
Noble Energy, Inc. | | | | | | | | |
8.250% 03/01/2019 | | | 275,000 | | | | 307,858 | |
| | | | | | | | |
| | | | | | | 655,060 | |
| | | | | | | | |
Pipelines (2.22%) | | | | | | | | |
Energy Transfer Partners LP | | | | | | | | |
9.700% 03/15/2019 | | | 357,000 | | | | 402,108 | |
Enterprise Products Operating LLC | | | | | | | | |
5.200% 09/01/2020 | | | 388,000 | | | | 427,214 | |
Kinder Morgan Energy Partners LP | | | | | | | | |
9.000% 02/01/2019 | | | 302,000 | | | | 343,492 | |
MarkWest Energy Partners LP / MarkWest Energy | | | | | | | | |
Finance Corp. | | | | | | | | |
4.500% 07/15/2023 | | | 425,000 | | | | 413,052 | |
ONEOK Partners LP | | | | | | | | |
3.200% 09/15/2018 | | | 422,000 | | | | 420,200 | |
Plains All American Pipeline LP / PAA Finance Corp. | | | | | | | | |
8.750% 05/01/2019 | | | 300,000 | | | | 338,100 | |
TransCanada PipeLines Ltd. | | | | | | | | |
7.250% 08/15/2038 | | | 253,000 | | | | 315,318 | |
| | | | | | | | |
| | | | | | | 2,659,484 | |
| | | | | | | | |
| | |
TOTAL ENERGY | | | | | | | 3,314,544 | |
| | | | | | | | |
| | |
FINANCIAL (3.51%) | | | | | | | | |
Banks (1.44%) | | | | | | | | |
Bank of America Corp. | | | | | | | | |
5.625% 07/01/2020 | | | 355,000 | | | | 399,263 | |
| | |
| Annual Report | April 30, 2016 | | 11 |
| | |
| The Disciplined Growth Investors Fund | | Portfolio of Investments |
| | April 30, 2016 |
| | | | | | | | |
| | | Principal
Amount | | | Value (Note 2) | |
| |
Banks (continued) | | | | | | | | |
JPMorgan Chase & Co. | | | | | | | | |
4.400% 07/22/2020 | | $ | 373,000 | | | $ | 405,141 | |
Royal Bank of Scotland Group PLC, Series 1 | | | | | | | | |
9.118% Perpetual Maturity (b) | | | 3,000 | | | | 3,038 | |
US Bancorp | | | | | | | | |
2.950% 07/15/2022 | | | 385,000 | | | | 396,982 | |
Wachovia Corp. | | | | | | | | |
5.750% 06/15/2017 | | | 500,000 | | | | 525,209 | |
| | | | | | | | |
| | | | | | | 1,729,633 | |
| | | | | | | | |
Diversified Financial Services (1.09%) | | | | | | | | |
American Express Co. | | | | | | | | |
7.000% 03/19/2018 | | | 398,000 | | | | 437,115 | |
General Electric Capital Corp. | | | | | | | | |
5.875% 01/14/2038 | | | 314,000 | | | | 414,627 | |
National Rural Utilities Cooperative Finance Corp. | | | | | | | | |
10.375% 11/01/2018 | | | 375,000 | | | | 456,332 | |
| | | | | | | | |
| | | | | | | 1,308,074 | |
| | | | | | | | |
Insurance (0.67%) | | | | | | | | |
American International Group, Inc. | | | | | | | | |
6.400% 12/15/2020 | | | 342,000 | | | | 398,864 | |
MetLife, Inc., Series A | | | | | | | | |
6.817% 08/15/2018 | | | 358,000 | | | | 401,550 | |
| | | | | | | | |
| | | | | | | 800,414 | |
| | | | | | | | |
Real Estate Investment Trusts (0.31%) | | | | | | | | |
Welltower, Inc. | | | | | | | | |
2.250% 03/15/2018 | | | 369,000 | | | | 372,485 | |
| | | | | | | | |
| | |
TOTAL FINANCIAL | | | | | | | 4,210,606 | |
| | | | | | | | |
| | |
GOVERNMENT (0.33%) | | | | | | | | |
Multi-National (0.33%) | | | | | | | | |
Corporacion Andina de Fomento | | | | | | | | |
8.125% 06/04/2019 | | | 333,000 | | | | 395,271 | |
Corporacion Andina de Fomento | | | | | | | | |
5.750% 01/12/2017 | | | 1,000 | | | | 1,031 | |
| | | | | | | | |
| | | | | | | 396,302 | |
| | | | | | | | |
| | |
TOTAL GOVERNMENT | | | | | | | 396,302 | |
| | | | | | | | |
| | |
| 12 | | 1-855-DGI-FUND (344-3863) | www.DGIfund.com |
| | |
| The Disciplined Growth Investors Fund | | Portfolio of Investments |
| | April 30, 2016 |
| | | | | | | | |
| | | Principal
Amount | | | Value (Note 2) | |
| |
INDUSTRIAL (2.99%) | | | | | | | | |
Aerospace/Defense (0.66%) | | | | | | | | |
Lockheed Martin Corp. | | | | | | | | |
4.250% 11/15/2019 | | $ | 348,000 | | | $ | 382,726 | |
Rockwell Collins, Inc. | | | | | | | | |
3.700% 12/15/2023 | | | 383,000 | | | | 411,305 | |
| | | | | | | | |
| | | | | | | 794,031 | |
| | | | | | | | |
Electrical Components & Equipment (0.31%) | | | | | | | | |
Emerson Electric Co. | | | | | | | | |
5.000% 04/15/2019 | | | 338,000 | | | | 369,114 | |
| | | | | | | | |
| | |
Electronics (0.33%) | | | | | | | | |
Corning, Inc. | | | | | | | | |
6.625% 05/15/2019 | | | 354,000 | | | | 399,284 | |
| | | | | | | | |
| | |
Engineering & Construction (0.35%) | | | | | | | | |
Fluor Corp. | | | | | | | | |
3.375% 09/15/2021 | | | 391,000 | | | | 411,974 | |
| | | | | | | | |
| | |
Environmental Control (0.33%) | | | | | | | | |
Republic Services, Inc. | | | | | | | | |
5.500% 09/15/2019 | | | 360,000 | | | | 398,561 | |
| | | | | | | | |
| | |
Miscellaneous Manufacturing (0.34%) | | | | | | | | |
Tyco Electronics Group SA | | | | | | | | |
3.500% 02/03/2022 | | | 390,000 | | | | 404,635 | |
| | | | | | | | |
| | |
Transportation (0.67%) | | | | | | | | |
CSX Corp. | | | | | | | | |
7.375% 02/01/2019 | | | 347,000 | | | | 398,733 | |
United Parcel Service, Inc. | | | | | | | | |
6.200% 01/15/2038 | | | 295,000 | | | | 406,794 | |
| | | | | | | | |
| | | | | | | 805,527 | |
| | | | | | | | |
| | |
TOTAL INDUSTRIAL | | | | | | | 3,583,126 | |
| | | | | | | | |
| | |
UTILITIES (6.83%) | | | | | | | | |
Electric (6.09%) | | | | | | | | |
Ameren Illinois Co. | | | | | | | | |
9.750% 11/15/2018 | | | 353,000 | | | | 421,582 | |
Arizona Public Service Co. | | | | | | | | |
8.750% 03/01/2019 | | | 352,000 | | | | 419,486 | |
| | |
| Annual Report | April 30, 2016 | | 13 |
| | |
| The Disciplined Growth Investors Fund | | Portfolio of Investments |
| | April 30, 2016 |
| | | | | | | | |
| | | Principal
Amount | | | Value (Note 2) | |
| |
Electric (continued) | | | | | | | | |
CMS Energy Corp. | | | | | | | | |
5.050% 03/15/2022 | | $ | 347,000 | | | $ | 391,925 | |
Commonwealth Edison Co. | | | | | | | | |
4.000% 08/01/2020 | | | 333,000 | | | | 362,100 | |
Consolidated Edison Co. of New York, Inc. | | | | | | | | |
7.125% 12/01/2018 | | | 313,000 | | | | 357,072 | |
Edison International | | | | | | | | |
3.750% 09/15/2017 | | | 389,000 | | | | 401,104 | |
Georgia Power Co. | | | | | | | | |
5.400% 06/01/2018 | | | 329,000 | | | | 356,413 | |
Interstate Power & Light Co. | | | | | | | | |
3.650% 09/01/2020 | | | 350,000 | | | | 366,471 | |
ITC Holdings Corp. | | | | | | | | |
4.050% 07/01/2023 | | | 391,000 | | | | 404,308 | |
Jersey Central Power & Light Co. | | | | | | | | |
7.350% 02/01/2019 | | | 453,000 | | | | 507,201 | |
Nevada Power Co. | | | | | | | | |
7.125% 03/15/2019 | | | 303,000 | | | | 349,519 | |
Oncor Electric Delivery Co. LLC | | | | | | | | |
7.000% 09/01/2022 | | | 332,000 | | | | 415,981 | |
PacifiCorp | | | | | | | | |
5.650% 07/15/2018 | | | 17,000 | | | | 18,644 | |
PPL Capital Funding, Inc. | | | | | | | | |
3.500% 12/01/2022 | | | 532,000 | | | | 558,326 | |
PSEG Power LLC | | | | | | | | |
5.125% 04/15/2020 | | | 367,000 | | | | 397,813 | |
PSEG Power LLC | | | | | | | | |
5.320% 09/15/2016 | | | 440,000 | | | | 446,712 | |
Puget Energy, Inc. | | | | | | | | |
5.625% 07/15/2022 | | | 340,000 | | | | 381,598 | |
TECO Finance, Inc. | | | | | | | | |
6.572% 11/01/2017 | | | 320,000 | | | | 341,459 | |
Wisconsin Electric Power Co. | | | | | | | | |
2.950% 09/15/2021 | | | 387,000 | | | | 406,504 | |
| | | | | | | | |
| | | | | | | 7,304,218 | |
| | | | | | | | |
Gas (0.74%) | | | | | | | | |
CenterPoint Energy Resources Corp. | | | | | | | | |
6.000% 05/15/2018 | | | 393,000 | | | | 421,320 | |
| | |
| 14 | | 1-855-DGI-FUND (344-3863) | www.DGIfund.com |
| | |
| The Disciplined Growth Investors Fund | | Portfolio of Investments |
| | April 30, 2016 |
| | | | | | | | | | | | |
| | | | | | Principal
Amount | | | Value
(Note 2) | |
| |
Gas (continued) | | | | | | | | | | | | |
Sempra Energy | | | | | | | | | | | | |
6.500% 06/01/2016 | | | | | | $ | 458,000 | | | $ | 459,900 | |
| | | | | | | | | | | | |
| | | | | | | | | | | 881,220 | |
| | | | | | | | | | | | |
| | | |
TOTAL UTILITIES | | | | | | | | | | | 8,185,438 | |
| | | | | | | | | | | | |
| | | |
TOTAL CORPORATE BONDS | | | | | | | | | | | | |
(Cost $27,128,772) | | | | | | | | | | | 27,525,459 | |
| | | | | | | | | | | | |
| | | |
FOREIGN GOVERNMENT BONDS (0.33%) | | | | | | | | | | | | |
Province of Quebec Canada, Series NN | | | | | | | | | | | | |
7.125% 02/09/2024 | | | | | | | 302,000 | | | | 395,483 | |
| | | | | | | | | | | | |
| | | |
TOTAL FOREIGN GOVERNMENT BONDS | | | | | | | | | | | | |
(Cost $387,676) | | | | | | | | | | | 395,483 | |
| | | | | | | | | | | | |
| | | |
GOVERNMENT & AGENCY OBLIGATIONS (0.05%) | | | | | | | | | | | | |
U.S. Treasury Bonds | | | | | | | | | | | | |
6.500% 11/15/2026 | | | | | | | 28,000 | | | | 40,489 | |
| | | | | | | | | | | | |
| | | |
U.S. Treasury Notes | | | | | | | | | | | | |
5.125% 05/15/2016 | | | | | | | 20,000 | | | | 20,035 | |
| | | | | | | | | | | | |
| | | |
TOTAL GOVERNMENT & AGENCY OBLIGATIONS | | | | | | | | | | | | |
(Cost $58,853) | | | | | | | | | | | 60,524 | |
| | | | | | | | | | | | |
| | | |
| | | Yield | | | Shares | | | Value
(Note 2) | |
| |
SHORT TERM INVESTMENTS (6.41%) | | | | | | | | | | | | |
MONEY MARKET FUND (1.41%) | | | | | | | | | | | | |
Fidelity Institutional Money Market | | | | | | | | | | | | |
Government Portfolio - Class I | | | 0.23% | (c) | | | 1,697,349 | | | | 1,697,349 | |
| | | | | | | | | | | | |
| | | |
U.S. TREASURY BILLS (5.00%) | | | | | | | | | | | | |
U.S. Treasury Bill, 10/13/2016 | | | 0.56% | (d) | | | 6,000,000 | | | | 5,990,640 | |
| | | | | | | | | | | | |
| | | |
TOTAL SHORT TERM INVESTMENTS | | | | | | | | | | | | |
(Cost $7,681,949) | | | | | | | | | | | 7,687,989 | |
| | | | | | | | | | | | |
| | |
| Annual Report | April 30, 2016 | | 15 |
| | |
| The Disciplined Growth Investors Fund | | Portfolio of Investments |
| | April 30, 2016 |
| | | | |
TOTAL INVESTMENTS (99.72%) | | | | |
(Cost $96,004,740) | | $ | 119,525,956 | |
| |
Other Assets In Excess Of Liabilities (0.28%) | | | 330,927 | |
| | | | |
| |
NET ASSETS (100.00%) | | $ | 119,856,883 | |
| | | | |
| (a) | Non-Income Producing Security. |
| (b) | This security has no contractual maturity date, is not redeemable and contractually pays an indefinite stream of interest. |
| (c) | Represents the 7-day yield. |
| (d) | Rate shown represents the bond equivalent yield to maturity at date of purchase. |
For Fund compliance purposes, the Fund’s industry classifications refer to any one or more of the industry sub-classifications used by one or more widely recognized market indexes or ratings group indexes, and/or as defined by Fund management. This definition may not apply for purposes of this report, which may combine industry sub-classifications for reporting ease. Industries are shown as a percent of net assets.
See Notes to Financial Statements.
| | |
| 16 | | 1-855-DGI-FUND (344-3863) | www.DGIfund.com |
| | |
| The Disciplined Growth Investors Fund | | Statement of Assets and Liabilities |
| | April 30, 2016 |
| | | | |
| |
ASSETS | | | | |
Investments, at value | | $ | 119,525,956 | |
Receivable for shares sold | | | 20,561 | |
Dividends and interest receivable | | | 389,959 | |
| |
Total assets | | | 119,936,476 | |
| |
| |
LIABILITIES | | | | |
Payable for shares redeemed | | | 3,250 | |
Payable to adviser | | | 76,343 | |
| |
Total liabilities | | | 79,593 | |
| |
NET ASSETS | | $ | 119,856,883 | |
| |
| |
NET ASSETS CONSIST OF | | | | |
Paid-in capital (Note 5) | | $ | 97,355,607 | |
Accumulated net investment income | | | 31,619 | |
Accumulated net realized loss | | | (1,051,559) | |
Net unrealized appreciation | | | 23,521,216 | |
| |
NET ASSETS | | $ | 119,856,883 | |
| |
| |
INVESTMENTS, AT COST | | $ | 96,004,740 | |
| |
PRICING OF SHARES | | | | |
Net Asset Value, offering and redemption price per share | | $ | 15.96 | |
Shares of beneficial interest outstanding | | | 7,510,229 | |
See Notes to Financial Statements.
| | |
| Annual Report | April 30, 2016 | | 17 |
| | |
| The Disciplined Growth Investors Fund | | Statement of Operations |
| | |
| | | | |
| | | For the Year Ended
April 30, 2016 | |
| |
INVESTMENT INCOME | | | | |
Dividends | | $ | 832,496 | |
Foreign taxes withheld | | | (7,246) | |
Interest | | | 738,453 | |
| |
Total investment income | | | 1,563,703 | |
| |
| |
EXPENSES | | | | |
Investment advisory fees (Note 6) | | | 892,641 | |
| |
Total expenses | | | 892,641 | |
| |
NET INVESTMENT INCOME | | | 671,062 | |
| |
| |
REALIZED AND UNREALIZED LOSS ON INVESTMENTS | | | | |
Net realized loss on investments | | | (1,044,969) | |
Net change in unrealized depreciation on investments | | | (1,940,103) | |
| |
NET REALIZED AND UNREALIZED LOSS ON INVESTMENTS | | | (2,985,072) | |
| |
NET DECREASE IN NET ASSETS RESULTING FROM OPERATIONS | | $ | (2,314,010) | |
| |
See Notes to Financial Statements.
| | |
| 18 | | 1-855-DGI-FUND (344-3863) | www.DGIfund.com |
| | |
| The Disciplined Growth Investors Fund | | Statements of Changes in Net Assets |
| | |
| | | | | | | | |
| | | For the Year Ended April 30, 2016 | | | For the Year Ended April 30, 2015 | |
| |
OPERATIONS | | | | | | | | |
Net investment income | | | $ 671,062 | | | | $ 601,292 | |
Net realized gain/(loss) | | | (1,044,969) | | | | 2,893,527 | |
Net change in unrealized appreciation/(depreciation) | | | (1,940,103) | | | | 8,397,596 | |
| |
Net increase/(decrease) in net assets resulting from operations | | | (2,314,010) | | | | 11,892,415 | |
| |
| | |
DISTRIBUTIONS (Note 3) | | | | | | | | |
From net investment income | | | (709,053) | | | | (550,583) | |
From net realized gains on investments | | | (2,457,710) | | | | (709,544) | |
| |
Net decrease in net assets from distributions | | | (3,166,763) | | | | (1,260,127) | |
| |
| | |
CAPITAL SHARE TRANSACTIONS (Note 5) | | | | | | | | |
Proceeds from sales of shares | | | 22,263,652 | | | | 27,552,615 | |
Issued to shareholders in reinvestment of distributions | | | 3,149,642 | | | | 1,251,789 | |
Cost of shares redeemed, net of redemption fees | | | (13,417,959) | | | | (12,834,981) | |
| |
Net increase from capital share transactions | | | 11,995,335 | | | | 15,969,423 | |
| |
| | |
Net increase in net assets | | | 6,514,562 | | | | 26,601,711 | |
| |
| | |
NET ASSETS | | | | | | | | |
Beginning of period | | | 113,342,321 | | | | 86,740,610 | |
| |
End of period* | | | $ 119,856,883 | | | | $ 113,342,321 | |
| |
| | |
*Including accumulated net investment income of: | | | $ 31,619 | | | | $ 63,074 | |
| | |
OTHER INFORMATION | | | | | | | | |
Share Transactions | | | | | | | | |
Issued | | | 1,367,464 | | | | 1,694,271 | |
Issued to shareholders in reinvestment of distributions | | | 202,387 | | | | 75,504 | |
Redeemed | | | (825,064) | | | | (779,232) | |
| |
Net increase in share transactions | | | 744,787 | | | | 990,543 | |
| |
See Notes to Financial Statements.
| | |
| Annual Report | April 30, 2016 | | 19 |
| | |
| The Disciplined Growth Investors Fund | | |
| | |
|
|
|
NET ASSET VALUE, BEGINNING OF PERIOD |
|
INCOME FROM OPERATIONS |
Net investment income(a) |
Net realized and unrealized gain/(loss) on investments |
|
Total from investment operations |
|
|
DISTRIBUTIONS |
From net investment income |
From net realized gain on investments |
|
Total distributions |
|
|
REDEMPTION FEES ADDED TO PAID-IN CAPITAL |
|
INCREASE/(DECREASE) IN NET ASSET VALUE |
|
NET ASSET VALUE, END OF PERIOD |
|
|
TOTAL RETURN |
|
RATIOS AND SUPPLEMENTAL DATA |
Net assets, end of period (000’s) |
|
RATIOS TO AVERAGE NET ASSETS |
Expenses |
Net investment income |
|
PORTFOLIO TURNOVER RATE |
| (a) | Per share numbers have been calculated using the average shares method. |
See Notes to Financial Statements.
| | |
| 20 | | 1-855-DGI-FUND (344-3863) | www.DGIfund.com |
| | |
| | | Financial Highlights |
| | For a share outstanding during the periods presented |
| | | | | | | | |
For the Year Ended April 30, 2016 | | For the Year
Ended April 30, 2015 | | For the Year
Ended April 30, 2014 | | For the Year
Ended April 30, 2013 | | For the Period
August 12, 2011
(Inception) to
April 30, 2012 |
|
| $ 16.75 | | $ 15.02 | | $ 13.17 | | $ 12.13 | | $ 10.00 |
| | | | | | | | |
| | | | |
| 0.09 | | 0.10 | | 0.07 | | 0.11 | | 0.05 |
| (0.44) | | 1.83 | | 1.90 | | 1.09 | | 2.11 |
|
| (0.35) | | 1.93 | | 1.97 | | 1.20 | | 2.16 |
|
| | | | | | | | |
| | | | |
| (0.10) | | (0.09) | | (0.07) | | (0.11) | | (0.03) |
| (0.34) | | (0.11) | | (0.05) | | (0.05) | | – |
|
| (0.44) | | (0.20) | | (0.12) | | (0.16) | | (0.03) |
|
| | | | |
| – | | – | | – | | – | | – |
|
| (0.79) | | 1.73 | | 1.85 | | 1.04 | | 2.13 |
|
| $ 15.96 | | $ 16.75 | | $ 15.02 | | $ 13.17 | | $ 12.13 |
|
| | | | |
| (2.05%) | | 12.87% | | 15.02% | | 9.93% | | 21.65% (b) |
| | | | | | | | |
| | | | |
| $ 119,857 | | $ 113,342 | | $ 86,741 | | $ 66,967 | | $ 35,678 |
| | | | | | | | |
| | | | |
| 0.78% | | 0.78% | | 0.78% | | 0.78% | | 0.77% (c) |
| 0.59% | | 0.61% | | 0.47% | | 0.90% | | 0.60% (c) |
| | | | |
| 13% | | 14% | | 10% | | 10% | | 6% (b) |
| | |
| Annual Report | April 30, 2016 | | 21 |
| | |
| The Disciplined Growth Investors Fund | | Notes to Financial Statements |
| | April 30, 2016 |
1. ORGANIZATION
Financial Investors Trust (the “Trust”), a Delaware statutory trust, is an open-end management investment company registered under the Investment Company Act of 1940, as amended (“1940 Act”). As of April 30, 2016, the Trust had 34 registered funds. This annual report describes The Disciplined Growth Investors Fund (the “Fund”). The Fund seeks long-term capital growth and as a secondary objective, modest income with reasonable risk.
2. SIGNIFICANT ACCOUNTING POLICIES
The accompanying financial statements were prepared in accordance with accounting principles generally accepted in the United States of America (“U.S. GAAP”). The preparation of financial statements in conformity with U.S. GAAP requires management to make certain estimates and assumptions that affect the reported amounts of assets and liabilities and disclosures of contingent assets and liabilities at the date of the financial statements and the reported amounts of revenue and expenses during the period. Actual results could differ from those estimates. The Fund is considered an investment company for financial reporting purposes under U.S. GAAP. The following is a summary of significant accounting policies consistently followed by the Fund in preparation of their financial statements.
Investment Valuation: The Fund generally values its securities based on market prices determined at the close of regular trading on the New York Stock Exchange (“NYSE”), normally 4:00 p.m. Eastern Time, on each day the NYSE is open for trading.
For equity securities and mutual funds that are traded on an exchange, the market price is usually the closing sale or official closing price on that exchange. In the case of equity securities not traded on an exchange, or if such closing prices are not otherwise available, the securities are valued at the mean of the most recent bid and ask prices on such day. Redeemable securities issued by open-end registered investment companies are valued at the investment company’s applicable net asset value, with the exception of exchange-traded open-end investment companies, which are priced as equity securities.
The market price for debt obligations is generally the price supplied by an independent third-party pricing service approved by the Board of Trustees (the “Board”), which may use a matrix, formula or other objective method that takes into consideration quotations from dealers, market transactions in comparable investments, market indices and yield curves. If vendors are unable to supply a price, or if the price supplied is deemed to be unreliable, the market price may be determined using quotations received from one or more broker–dealers that make a market in the security. Fixed-income obligations, excluding municipal securities, having a remaining maturity of greater than 60 days, are typically valued at the mean between the evaluated bid and ask prices formulated by an independent pricing service. Corporate Bonds, U.S. Government & Agency, and U.S. Treasury Bonds & Notes are valued using market models that consider trade data, quotations from dealers and active market makers, relevant yield curve and spread data, creditworthiness, trade data or market information on comparable securities, and other relevant security specific information. Mortgage-related and asset-backed securities are valued based on models that consider trade data, prepayment and default projections, benchmark yield and spread data and estimated cash flows of each tranche of the issuer. Publicly traded foreign government debt
| | |
| 22 | | 1-855-DGI-FUND (344-3863) | www.DGIfund.com |
| | |
| The Disciplined Growth Investors Fund | | Notes to Financial Statements |
| | April 30, 2016 |
securities are typically traded internationally in the over-the-counter market and are valued at the mean between the bid and asked prices as of the close of business of that market.
When such prices or quotations are not available, or when Disciplined Growth Investors, Inc. (the “Adviser”) believes that they are unreliable, securities may be priced using fair value procedures approved by the Board of Trustees (the “Board”).
Fair Value Measurements: The Fund discloses the classification of its fair value measurements following a three-tier hierarchy based on the inputs used to measure fair value. Inputs refer broadly to the assumptions that market participants would use in pricing the asset or liability, including assumptions about risk. Inputs may be observable or unobservable. Observable inputs reflect the assumptions market participants would use in pricing the asset or liability that are developed based on market data obtained from sources independent of the reporting entity. Unobservable inputs reflect the reporting entity’s own assumptions about the assumptions market participants would use in pricing the asset or liability that are developed based on the best information available.
Various inputs are used in determining the value of the Fund’s investments as of the end of the reporting period. When inputs used fall into different levels of the fair value hierarchy, the level in the hierarchy within which the fair value measurement falls is determined based on the lowest level input that is significant to the fair value measurement in its entirety. The designated input levels are not necessarily an indication of the risk or liquidity associated with these investments. These inputs are categorized in the following hierarchy under applicable financial accounting standards:
| | |
Level 1 – | | Unadjusted quoted prices in active markets for identical investments, unrestricted assets or liabilities that the Fund has the ability to access at the measurement date; |
| |
Level 2 – | | Quoted prices which are not active, quoted prices for similar assets or liabilities in active markets or inputs other than quoted prices that are observable (either directly or indirectly) for substantially the full term of the asset or liability; and |
| |
Level 3 – | | Significant unobservable prices or inputs (including the Fund’s own assumptions in determining the fair value of investments) where there is little or no market activity for the asset or liability at the measurement date. |
| | |
| Annual Report | April 30, 2016 | | 23 |
| | |
| The Disciplined Growth Investors Fund | | Notes to Financial Statements |
| | April 30, 2016 |
The following is a summary of each input used to value the Fund as of April 30, 2016:
| | | | | | | | | | | | | | | | |
| Investments in Securities at Value | | Level 1 -
Unadjusted
Quoted Prices | | | Level 2 - Other
Significant
Observable
Inputs | | | Level 3 -
Significant
Unobservable
Inputs | | | Total | |
| |
Common Stocks(a) | | $ | 83,766,011 | | | $ | – | | | $ | – | | | $ | 83,766,011 | |
Asset/Mortgage Backed Securities | | | – | | | | 90,490 | | | | – | | | | 90,490 | |
Corporate Bonds | | | – | | | | 27,525,459 | | | | – | | | | 27,525,459 | |
Foreign Government Bonds | | | – | | | | 395,483 | | | | – | | | | 395,483 | |
Government & Agency Obligations | | | – | | | | 60,524 | | | | – | | | | 60,524 | |
Short Term Investments | | | | | | | | | | | | | | | | |
Money Market Fund | | | 1,697,349 | | | | – | | | | – | | | | 1,697,349 | |
U.S. Treasury Bills | | | – | | | | 5,990,640 | | | | – | | | | 5,990,640 | |
| |
TOTAL | | $ | 85,463,360 | | | $ | 34,062,596 | | | $ | – | | | $ | 119,525,956 | |
| |
| (a) | For detailed descriptions of the underlying industries, see the accompanying Portfolio of Investments. |
The Fund recognizes transfers between levels as of the end of the period. For the year ended April 30, 2016, the Fund did not have any transfers between Level 1 and Level 2 securities. For the year ended April 30, 2016, the Fund did not have any securities that used unobservable inputs (Level 3) in determining fair value.
Investment Transactions and Investment Income: Investment transactions are accounted for on the date the investments are purchased or sold (trade date). Realized gains and losses from investment transactions are reported on an identified cost basis. Interest income, which includes accretion of discounts, is accrued and recorded as earned. Dividend income is recognized on the ex-dividend date or for certain foreign securities, as soon as information is available to the Fund.
Trust Expenses: Some expenses of the Trust can be directly attributed to the Fund. Expenses which cannot be directly attributed to the Fund are apportioned among all funds in the Trust based on average net assets of each fund.
Fund Expenses: Expenses that are specific to the Fund are charged directly to the Fund.
Federal Income Taxes: The Fund complies with the requirements under Subchapter M of the Internal Revenue Code of 1986, as amended, applicable to regulated investment companies and intends to distribute substantially all of their net taxable income and net capital gains, if any, each year so that it will not be subject to excise tax on undistributed income and gains. The Fund is not subject to income taxes to the extent such distributions are made.
As of and during the year ended April 30, 2016, the Fund did not have a liability for any unrecognized tax benefits. The Fund files U.S. federal, state, and local tax returns as required. The Fund’s tax returns are subject to examination by the relevant tax authorities until expiration of the
| | |
| 24 | | 1-855-DGI-FUND (344-3863) | www.DGIfund.com |
| | |
| The Disciplined Growth Investors Fund | | Notes to Financial Statements |
| | April 30, 2016 |
applicable statute of limitations, which is generally three years after the filing of the tax return for federal purposes and four years for most state returns. Tax returns for open years have incorporated no uncertain tax positions that require a provision for income taxes.
Distributions to Shareholders: The Fund normally pays dividends, if any, quarterly and distributes capital gains, if any, on an annual basis. Income dividend distributions are derived from dividends and other income the Fund receives from its investments, including short term capital gains. Long term capital gain distributions are derived from gains realized when the Fund sells a security it has owned for more than a year. The Fund may make additional distributions and dividends at other times if the portfolio manager believes doing so may be necessary for the Fund to avoid or reduce taxes.
3. TAX BASIS INFORMATION
Reclassifications: As of April 30, 2016, permanent differences in book and tax accounting were reclassified. These differences had no effect on net assets and were primarily attributed to minor differences between book and tax characterizations of paydown transactions.
The reclassifications as of April 30, 2016 were as follows:
| | | | | | | | | | | | |
| Fund | | Paid-in Capital | | | Accumulated Net
Investment Income | | | Accumulated Net
Realized Loss on
Investments | |
| |
Disciplined Growth Investors Fund | | $ | – | | | $ | 6,536 | | | $ | (6,536) | |
Tax Basis of Investments: As of April 30, 2016, the aggregate cost of investments, gross unrealized appreciation/ (depreciation) and net unrealized appreciation for Federal tax purposes was as follows:
| | | | |
| | | Disciplined Growth
Investors Fund | |
| |
Gross appreciation | | | | |
(excess of value over tax cost) | | $ | 27,741,879 | |
Gross depreciation | | | | |
(excess of tax cost over value) | | | (4,220,717) | |
| |
Net unrealized appreciation | | $ | 23,521,162 | |
| |
Cost of investments for income tax purposes | | $ | 96,004,794 | |
| |
Components of Earnings: As of April 30, 2016, components of distributable earnings were as follows:
| | | | |
Undistributed ordinary income | | $ | 31,619 | |
Accumulated capital losses | | | (1,051,505) | |
Net unrealized appreciation on investments | | | 23,521,162 | |
| |
Total | | $ | 22,501,276 | |
| |
| | |
| Annual Report | April 30, 2016 | | 25 |
| | |
| The Disciplined Growth Investors Fund | | Notes to Financial Statements |
| | April 30, 2016 |
Capital Losses: As of April 30, 2016, the Fund has available for Federal income tax purposes unused capital losses that may be used to offset future realized capital gains. The Fund has $145,258 in long-term losses that will be carried forward indefinitely to offset future realized gains.
The Fund elects to defer $906,247 to the period ending April 30, 2017, capital losses recognized during the period November 1, 2015 to April 30, 2016.
Tax Basis of Distributions to Shareholders: The character of distributions made during the year from net investment income or net realized gains may differ from its ultimate characterization for federal income tax purposes. Also, due to the timing of dividend distributions, the fiscal year in which amounts are distributed may differ from the fiscal year in which the income or realized gain was recorded by the Fund.
The tax character of distributions paid during the year ended April 30, 2016, were as follows:
| | | | | | | | |
| | | Ordinary Income | | | Long-Term Capital
Gain | |
| |
The Disciplined Growth Investors Fund | | $ | 921,941 | | | $ | 2,244,822 | |
|
The tax character of distributions paid during the year ended April 30, 2015, were as follows: | |
| | |
| | | Ordinary Income | | | Long-Term Capital
Gain | |
| |
The Disciplined Growth Investors Fund | | $ | 576,515 | | | $ | 683,612 | |
4. SECURITIES TRANSACTIONS
During the year ended April 30, 2016, equity holdings, asset/mortgage backed securities, fixed income securities and U.S. Treasury Notes were transferred in-kind. The intent of the transfers was to save on equity transaction costs both for the new shareholders at the institution they transferred from and for the Fund on the addition of assets. The assets of two separate accounts were transferred-in-kind into the Fund in the amount of $4,893,997.
The cost of purchases and proceeds from sales of securities (excluding short-term securities, transfers-in-kind, and U.S. Government Obligations) during the year ended April 30, 2016, were as follows:
| | | | | | | | |
| Fund | | Purchases of
Securities | | | Proceeds From Sales of
Securities | |
| |
The Disciplined Growth Investors Fund | | $ | 18,924,654 | | | $ | 13,692,645 | |
| | |
| 26 | | 1-855-DGI-FUND (344-3863) | www.DGIfund.com |
| | |
| The Disciplined Growth Investors Fund | | Notes to Financial Statements |
| | April 30, 2016 |
Investment transactions in U.S. government and agency securities (excluding transfers-in-kind) for the year ended April 30, 2016 were as follows:
| | | | | | | | |
| Fund | | Purchases of
Securities | | | Proceeds From Sales of
Securities | |
The Disciplined Growth Investors Fund | | $ | 5,971,627 | | | $ | 54,000 | |
5. SHARES OF BENEFICIAL INTEREST
The capitalization of the Trust consists of an unlimited number of shares of beneficial interest with no par value per share. Holders of the shares of the Fund of the Trust have one vote for each share held and a proportionate fraction of a vote for each fractional share. All shares issued and outstanding are fully paid and are transferable and redeemable at the option of the shareholder. Purchasers of the shares do not have any obligation to make payments to the Trust or its creditors (other than the purchase price for the shares or make contributions to the Trust or its creditors solely by reason of the purchasers’ ownership of the shares. Shares have no pre-emptive rights.
Prior to September 1, 2015, shares redeemed within 90 days of purchase may have incurred a 2% short-term redemption fee deducted from the redemption amount. Effective September 1, 2015, the Fund no longer imposes redemption fees. For the years ended April 30, 2016 and April 30, 2015, the Fund did not receive any redemption fees.
6. MANAGEMENT AND RELATED-PARTY TRANSACTIONS
The Adviser, subject to the authority of the Board, is responsible for the overall management and administration of the Fund’s business affairs. The Adviser manages the investments of the Fund in accordance with the Fund’s investment objective, policies and limitations and investment guidelines established jointly by the Adviser and the Trustees. Pursuant to the Advisory Agreement, the Fund pays the Adviser a unitary management fee for the services and facilities it provides payable on a monthly basis at the annual rate of 0.78% of the Fund’s average daily net assets. The management fee is paid on a monthly basis.
Out of the unitary management fee, the Adviser pays substantially all expenses of the Fund, including the cost of transfer agency, custody, fund administration, bookkeeping and pricing services, legal, audit and other services, except for interest expenses, brokerage expenses, taxes and extraordinary expenses not incurred in the ordinary course of the Fund’s business. Also included are Trustee fees which were $3,124 for the year ended April 30, 2016.
Fund Administrator Fees and Expenses
ALPS Fund Services, Inc. (“ALPS”) serves as administrator to the Fund. Pursuant to an Administration Agreement, ALPS provides operational services to the Fund including, but not limited to, fund accounting and fund administration and generally assists in the Fund’s operations. Officers of the Trust are employees of ALPS. The Fund’s administration fee is accrued on a daily basis and paid monthly. The Administrator is also reimbursed for certain out-of-pocket expenses. The administrative fee and out-of-pocket expenses are included in the unitary management fee paid to the Adviser.
| | |
| Annual Report | April 30, 2016 | | 27 |
| | |
| The Disciplined Growth Investors Fund | | Notes to Financial Statements |
| | April 30, 2016 |
Transfer Agent
ALPS serves as transfer, dividend paying and shareholder servicing agent for the Fund. ALPS receives an annual minimum fee, a fee based upon the number of shareholder accounts, and is also reimbursed for certain out-of-pocket expenses. The fee and out-of-pocket expenses are included in the unitary management fee paid to the Adviser.
Compliance Services
ALPS provides services that assist the Trust’s chief compliance officer in monitoring and testing the policies and procedures of the Trust in conjunction with requirements under Rule 38a-1 under the 1940 Act and receives an annual base fee. ALPS is reimbursed for certain out-of-pocket expenses. The fee and out-of-pocket expenses are included in the unitary management fee paid to the Adviser.
Principal Financial Officer
ALPS receives an annual fee for providing principal financial officer services to the Fund. The fee is included in the unitary management fee paid to the Adviser.
Distributor
ALPS Distributors, Inc. (“ADI” or the “Distributor”) (an affiliate of ALPS) acts as the distributor of the Fund’s shares pursuant to a Distribution Agreement with the Trust. Shares are sold on a continuous basis by ADI as agent for the Fund, and ADI has agreed to use its best efforts to solicit orders for the sale of the Fund’s shares, although it is not obliged to sell any particular amount of shares. ADI is not entitled to any compensation for its services as Distributor. ADI is registered as a broker-dealer with the Securities and Exchange Commission.
7. INDEMNIFICATIONS
Under the Trust’s organizational documents, its officers and Trustees are indemnified against certain liability arising out of the performance of their duties to the Trust. Additionally, in the normal course of business, the Trust enters into contracts with service providers that may contain general indemnification clauses, which may permit indemnification to the extent permissible under applicable law. The Trust’s maximum exposure under these arrangements is unknown, as this would involve future claims that may be made against the Trust that have not yet occurred.
| | |
| 28 | | 1-855-DGI-FUND (344-3863) | www.DGIfund.com |
| | |
| The Disciplined Growth Investors Fund | | Report of Independent Registered Public Accounting Firm |
| | |
To the Shareholders and Board of Trustees of Financial Investors Trust:
We have audited the accompanying statement of assets and liabilities, including the portfolio of investments, of The Disciplined Growth Investors Fund (the “Fund”), one of the portfolios constituting Financial Investors Trust, as of April 30, 2016, and the related statement of operations for the year then ended, the statements of changes in net assets for each of the two years in the period then ended, and the financial highlights for each of the four years in the period then ended and for the period from August 12, 2011 (inception) to April 30, 2012. These financial statements and financial highlights are the responsibility of the Fund’s management. Our responsibility is to express an opinion on these financial statements and financial highlights based on our audits.
We conducted our audits in accordance with the standards of the Public Company Accounting Oversight Board (United States). Those standards require that we plan and perform the audit to obtain reasonable assurance about whether the financial statements and financial highlights are free of material misstatement. The Fund is not required to have, nor were we engaged to perform, an audit of its internal control over financial reporting. Our audits included consideration of internal control over financial reporting as a basis for designing audit procedures that are appropriate in the circumstances, but not for the purpose of expressing an opinion on the effectiveness of the Fund’s internal control over financial reporting. Accordingly, we express no such opinion. An audit also includes examining, on a test basis, evidence supporting the amounts and disclosures in the financial statements, assessing the accounting principles used and significant estimates made by management, as well as evaluating the overall financial statement presentation. Our procedures included confirmation of securities owned as of April 30, 2016, by correspondence with the custodian. We believe that our audits provide a reasonable basis for our opinion.
In our opinion, the financial statements and financial highlights referred to above present fairly, in all material respects, the financial position of The Disciplined Growth Investors Fund of Financial Investors Trust as of April 30, 2016, the results of its operations for the year then ended, the changes in its net assets for each of the two years in the period then ended, and the financial highlights for each of the four years in the period then ended and for the period from August 12, 2011 (inception) to April 30, 2012, in conformity with accounting principles generally accepted in the United States of America.
|
DELOITTE & TOUCHE LLP |
|
Denver, Colorado |
June 28, 2016 |
| | |
| Annual Report | April 30, 2016 | | 29 |
| | |
| The Disciplined Growth Investors Fund | | Additional Information |
| | April 30, 2016 (Unaudited) |
1. FUND HOLDINGS
The Fund files its complete schedule of portfolio holdings with the Securities and Exchange Commission (the “SEC”) for the first and third quarters of each fiscal year on Form N-Q within 60 days after the end of the period. Copies of the Fund’s Form N-Q are available without charge on the SEC website at http://www.sec.gov. You may also review and copy the Form N-Q at the SEC’s Public Reference Room in Washington, DC. For more information about the operation of the Public Reference Room, please call the SEC at 1-800-SEC-0330.
2. FUND PROXY VOTING POLICIES, PROCEDURES AND SUMMARIES
The Fund’s policies and procedures used in determining how to vote proxies and information regarding how the Fund voted proxies relating to portfolio securities during the most recent prior 12-month period ending June 30 are available without charge, (1) upon request, by calling (toll-free) 855-DGI-Fund and (2) on the SEC’s website at http://www.sec.gov.
3. TAX DESIGNATIONS
The Fund designates the following for federal income tax purposes for distributions made during the calendar year ended December 31, 2015:
| | | | |
Dividend Received Deduction | | | 62.06 | % |
Qualified Dividend Income | | | 100.00 | % |
Pursuant to Section 852(b)(3) of the Internal Revenue Code, the Disciplined Growth Investors Fund designated $2,244,822 as long-term capital gain dividends.
In early 2016, if applicable, shareholders of record received this information for the distributions paid to them by the Fund during the calendar year 2015 via Form 1099. The Fund will notify shareholders in early 2017 of amounts paid to them by the Fund, if any, during the calendar year 2016.
| | |
| 30 | | 1-855-DGI-FUND (344-3863) | www.DGIfund.com |
| | |
| The Disciplined Growth Investors Fund | | Trustees and Officers |
| | April 30, 2016 (Unaudited) |
Additional information regarding the Fund’s trustees is included in the Statement of Additional Information, which can be obtained without charge by calling 888-288-1121.
INDEPENDENT TRUSTEES
| | | | | | | | | | |
Name, Address* & Year of Birth | | Position(s) Held with
Fund | | Term of Office and Length of Time Served | | Principal Occupation(s) During Past 5 Years** | | Number of
Funds in
Fund
Complex Overseen
by
Trustee*** | | Other Directorships Held by Trustee During Past 5 Years** |
| Mary K. Anstine, 1940 | | Trustee | | Ms. Anstine was elected at a special meeting of shareholders held on March 21, 1997 and re-elected at a special meeting of shareholders held on August 7, 2009. | | Ms. Anstine was formerly an Executive Vice President of First Interstate Bank of Denver until 1994, President/Chief Executive Officer of HealthONE Alliance, Denver, Colorado, from 1994 to 2004, and has been retired since 2004. Ms. Anstine is also Trustee/Director of AV Hunter Trust and Colorado Uplift Board. Ms. Anstine was formerly a Director of the Trust Bank of Colorado (later purchased and now known as Northern Trust Bank), HealthONE and Denver Area Council of the Boy Scouts of America, and a member of the American Bankers Association Trust Executive Committee. | | 34 | | Ms. Anstine is a Trustee of ALPS ETF Trust (20 funds); ALPS Variable Investment Trust (9 funds); Reaves Utility Income Fund (1 fund); and Westcore Trust (12 funds). |
John R. Moran, Jr.,
1930 | | Trustee | | Mr. Moran was elected at a special meeting of shareholders held on March 21, 1997 and re-elected at a special meeting of shareholders held on August 7, 2009. | | Mr. Moran formerly served as President and CEO of The Colorado Trust, a private foundation serving the health and hospital community in the state of Colorado, from 1991 to 2007. During his career as an attorney from 1958 to 1991, Mr. Moran was formerly a partner with the firm of Kutak Rock & Campbell in Denver, Colorado and a member of the Colorado House of Representatives. Currently, Mr. Moran is a member of the Treasurer’s Investment Advisory Committee for the University of Colorado. | | 34 | | None. |
| | |
| Annual Report | April 30, 2016 | | 31 |
| | |
| The Disciplined Growth Investors Fund | | Trustees and Officers |
| | April 30, 2016 (Unaudited) |
INDEPENDENT TRUSTEES (continued)
| | | | | | | | | | |
Name, Address* & Year of Birth | | Position(s)
Held with
Fund | | Term of
Office and
Length of
Time Served | | Principal Occupation(s) During Past 5 Years** | | Number of
Funds in
Fund
Complex
Overseen
by
Trustee*** | | Other
Directorships
Held by Trustee
During Past 5
Years** |
| Jeremy W. Deems, 1976 | | Trustee | | Mr. Deems was appointed as a Trustee at the March 11, 2008 meeting of the Board of Trustees and elected at a special meeting of shareholders held on August 7, 2009. | | Mr. Deems is the Co-Founder, Chief Operations Officer and Chief Financial Officer of Green Alpha Advisors, LLC, a registered investment advisor, and Co-Portfolio Manager of the Shelton Green Alpha Fund. Prior to joining Green Alpha Advisors, Mr. Deems was CFO and Treasurer of Forward Management, LLC, ReFlow Management Co., LLC, ReFlow Fund, LLC, a private investment fund, and Sutton Place Management, LLC, an administrative services company, from 1998 to June 2007. From 2004 to 2005, Mr. Deems also served as Treasurer of the Forward Funds and the Sierra Club Funds. | | 34 | | Mr. Deems is a Trustee of ALPS ETF Trust (20 funds); ALPS Variable Investment Trust (9 funds), Reaves Utility Income Fund (1 fund) and Clough Funds Trust (1 fund). |
| Jerry G. Rutledge 1944 | | Trustee | | Mr. Rutledge was elected at a special meeting of shareholders held on August 7, 2009. | | Mr. Rutledge is the President and owner of Rutledge’s Inc., a retail clothing business. Mr. Rutledge is currently Director of the American National Bank. He was from 1994 to 2007 a Regent of the University of Colorado. | | 34 | | Mr. Rutledge is a Trustee of Principal Real Estate Fund (1 fund), Clough Global Allocation Fund (1 fund), Clough Global Equity Fund (1 fund) and Clough Global Opportunities Fund (1 fund). |
| | |
| 32 | | 1-855-DGI-FUND (344-3863) | www.DGIfund.com |
| | |
| The Disciplined Growth Investors Fund | | Trustees and Officers |
| | April 30, 2016 (Unaudited) |
INDEPENDENT TRUSTEES (continued)
| | | | | | | | | | |
Name,
Address*
& Year of Birth | | Position(s)
Held with
Fund | | Term of
Office and
Length of
Time Served | | Principal Occupation(s) During Past 5 Years** | | Number of
Funds in
Fund
Complex
Overseen
by
Trustee*** | | Other
Directorships
Held by Trustee
During Past 5
Years** |
| Michael “Ross” Shell, 1970 | | Trustee | | Mr. Shell was elected at a special meeting of shareholders held on August 7, 2009. | | Mr. Shell is Founder and CEO of Red Idea, LLC, a strategic consulting/early stage venture firm (since June 2008). From 1999 to 2009, he was a part-owner and Director of Tesser, Inc., a brand agency. From December 2005 to May 2008, he was Director, Marketing and Investor Relations, of Woodbourne, a REIT/real estate hedge fund and private equity firm. Prior to this, from May 2004 to November 2005, he worked as a business strategy consultant; from June 2003 to April 2004, he was on the Global Client Services team of IDEO, a product design/innovation firm; and from 1999 to 2003, he was President of Tesser, Inc. Mr. Shell graduated with honors from Stanford University with a degree in Political Science. | | 34 | | None. |
| | |
| Annual Report | April 30, 2016 | | 33 |
| | |
| The Disciplined Growth Investors Fund | | Trustees and Officers |
| | April 30, 2016 (Unaudited) |
INTERESTED TRUSTEE
| | | | | | | | | | |
Name,
Address*
& Age | | Position(s)
Held with
Fund | | Term of
Office and
Length of
Time Served | | Principal Occupation(s) During Past 5 Years** | | Number of
Funds in
Fund
Complex Overseen
by
Trustee*** | | Other
Directorships
Held by
Trustee |
| Edmund J. Burke, 1961 | | Trustee, Chairman and President | | Mr. Burke was elected as Chairman at the August 28, 2009 meeting of the Board of Trustees. Mr. Burke was elected as Trustee at a special meeting of shareholders held on August 7, 2009. Mr. Burke was elected President of the Trust at the December 17, 2002 meeting of the Board of Trustees. | | Mr. Burke is President and a Director of ALPS Holdings, Inc. (“AHI”) (since 2005) and Director of Boston Financial Data Services, Inc. (“BFDS”), ALPS Advisors, Inc. (“AAI”), ALPS Distributors, Inc. (“ADI”), ALPS Fund Services, Inc. (“AFS”) and ALPS Portfolio Solutions Distributor, Inc. (“APSD”) and from 2001-2008, was President of AAI, ADI, AFS and APSD. Because of his positions with AHI, BFDS, AAI, ADI, AFS and APSD, Mr. Burke is deemed an affiliate of the Trust as defined under the 1940 Act. Mr. Burke is Trustee and President of the Clough Global Allocation Fund (Trustee since 2006; President since 2004); Trustee and President of the Clough Global Equity Fund (Trustee since 2006; President since 2005); Trustee and President of the Clough Global Opportunities Fund (since 2006); Trustee of the Liberty All-Star Equity Fund; and Director of the Liberty All-Star Growth Fund, Inc. | | 34 | | Mr. Burke is a Trustee of Clough Global Allocation Fund (1 fund); Clough Global Equity Fund (1 fund); Clough Global Opportunities Fund (1 fund); Liberty All-Star Equity Fund (1 fund) and Clough Funds Trust (1 fund); and Director of the Liberty All-Star Growth Fund, Inc. (1 fund). |
| | |
| 34 | | 1-855-DGI-FUND (344-3863) | www.DGIfund.com |
| | |
| The Disciplined Growth Investors Fund | | Trustees and Officers |
| | April 30, 2016 (Unaudited) |
OFFICERS
| | | | | | |
Name, Address* & Year of Birth | | Position(s) Held with Fund | | Term of Office and Length of Time Served | | Principal Occupation(s) During Past 5 Years** |
|
Kimberly R. Storms, 1972 | | Treasurer | | Ms. Storms was elected Treasurer of the Trust at the March 12, 2013 meeting of the Board of Trustees. | | Ms. Storms is Senior Vice President - Director of Fund Administration of ALPS. Because of her position with ALPS, Ms. Storms is deemed an affiliate of the Trust as defined under the 1940 Act. Ms. Storms is also Treasurer of Liberty All-Star Equity Fund, Liberty All-Star Growth Fund, Inc. and ALPS Series Trust. Ms. Storms also serves as a Board member and Treasurer of The Center for Trauma & Resilience, a nonprofit agency. |
|
JoEllen L. Legg, 1961 | | Secretary | | Ms. Legg was elected Secretary of the Trust at the September 15, 2015 meeting of the Board of Trustees. | | Ms. Legg joined ALPS in October 2007 and is currently Vice President, Assistant General Counsel of ALPS. Prior to joining ALPS, Ms. Legg served as Senior Counsel - Law (Corporate & Securities) for Adelphia Communications Corporation (February 2005 - March 2007). Prior to this, Ms. Legg held associate positions at Fried Frank Harris Shriver & Jacobson LLP (1998 - 2004) and at Patton Boggs LLP (2004 - 2005). Because of her position with ALPS, Ms. Legg is deemed an affiliate of the Trust as defined under the 1940 Act. Ms. Legg is also the Secretary of ALPS Series Trust and Reaves Utility Income Fund. |
|
| Ted Uhl, 1974 | | Chief Compliance Officer (“CCO”) | | Mr. Uhl was appointed CCO of the Trust at the June 8, 2010 meeting of the Board of Trustees. | | Mr. Uhl joined ALPS in October 2006, and is currently Deputy Compliance Officer of ALPS. Prior to his current role, Mr. Uhl served as Senior Risk Manager for ALPS from October 2006 until June 2010. Because of his position with ALPS, Mr. Uhl is deemed an affiliate of the Trust as defined under the 1940 Act. Mr. Uhl is also CCO of the Reaves Utility Income Fund, Centre Funds and Transparent Value Trust. |
|
| Jennell Panella, 1974 | | Assistant Treasurer | | Ms. Panella was elected Assistant Treasurer of the Trust at the September 15, 2015 meeting of the Board of Trustees. | | Ms. Panella joined ALPS in June 2012 and is currently Fund Controller of ALPS Fund Services, Inc. Prior to joining ALPS, Ms. Panella served as Financial Reporting Manager for Parker Global Strategies, LLC (2009-2012). Because of her position with ALPS, Ms. Panella is deemed an affiliate of the Trust as defined under the 1940 Act. Ms. Panella also serves as Assistant Treasurer of James Advantage Funds. |
|
| Nate Mandeville, 1977 | | Assistant Treasurer | | Mr. Mandeville was elected Assistant Treasurer of the Trust at the September 15, 2015 meeting of the Board of Trustees. | | Mr. Mandeville joined ALPS in December 2013 and is Fund Controller for ALPS. Prior to joining ALPS, Mr. Mandeville worked for Great-West Financial (2011-2013), Virtuoso Sourcing Group (2008-2011) and Janus Capital Group (2000-2008). Because of his position with ALPS, Mr. Mandeville is deemed an affiliate of the Trust as defined under the 1940 Act. Mr. Mandeville also serves as Assistant Treasurer of ALPS Series Trust. |
|
| Sharon Akselrod, 1974 | | Assistant Secretary | | Ms. Akselrod was elected Assistant Secretary of the Trust at the September 15, 2015 meeting of the Board of Trustees. | | Ms. Akselrod joined ALPS in August 2014 and is currently Senior Investment Company Act Paralegal of ALPS. Prior to joining ALPS, Ms. Akselrod served as Corporate Governance and Regulatory Associate for Nordstrom fsb (2013-2014) and Senior Legal Assistant – Legal Manager for AXA Equitable Life Insurance Company (2008-2013). Because of her position with ALPS, Ms. Akselrod is deemed an affiliate of the Trust as defined under the 1940 Act. |
|
| | |
| Annual Report | April 30, 2016 | | 35 |
| | |
| The Disciplined Growth Investors Fund | | Trustees and Officers |
| | April 30, 2016 (Unaudited) |
OFFICERS (continued)
| | | | | | |
Name, Address* & Year of Birth | | Position(s) Held with Fund | | Term of Office and Length of Time Served | | Principal Occupation(s) During Past 5 Years** |
|
| Sareena Khwaja-Dixon 1980 | | Assistant Secretary | | Ms. Khwaja-Dixon was elected Assistant Secretary of the Trust at the December 15, 2015 meeting of the Board of Trustees. | | Ms. Khwaja-Dixon joined ALPS in August 2015 and is currently Senior Counsel and Vice President of ALPS. Prior to joining ALPS, Ms. Khwaja-Dixon served as a Senior Paralegal/Paralegal for Russell Investments (2011-2015). Because of her position with ALPS, Ms. Khwaja-Dixon is deemed an affiliate of the Trust as defined under the 1940 Act. |
|
| * | All communications to Trustees and Officers may be directed to Financial Investors Trust c/o 1290 Broadway, Suite 1100, Denver, CO 80203. |
| ** | This is the period for which the Trustee or Officer began serving the Trust. Each Trustee serves an indefinite term, until his successor is elected. Officers are elected on an annual basis. |
| *** | The Fund Complex includes all series of the Trust (currently 34) and any other investment companies for which any Trustee serves as trustee for and which Disciplined Growth Investors, Inc. provides investment advisory services (currently none). |
| | |
| 36 | | 1-855-DGI-FUND (344-3863) | www.DGIfund.com |
| | |
This material must be preceded or accompanied by a prospectus. The Disciplined Growth Investors Fund is distributed by ALPS Distributors, Inc. | |  |
TABLE OF CONTENTS
| | |
| Emerald Growth Fund | | Manager Commentary |
| | April 30, 2016 (Unaudited) |
April 30, 2016
Dear Shareholders:
Investment Results
The performance of the Emerald Growth Fund’s Class A shares (without sales load), for the twelve months ended April 30, 2016, declined by -10.28% trailing the Russell 2000 Growth Index(1) which declined by -8.27%.
Decelerating global growth, the Chinese devaluation of the Yuan, declining oil prices, and consternation over timing and appropriateness of the U.S. Federal Reserve raising rates and widening high yield spreads all conspired to pressure market returns throughout the better part of the last twelve months. Market pessimism peaked in early February of 2016 with the CBOE (Chicago Board Options Exchange) volatility index peaking near 28 and the S&P 500® Index(2) bottoming at a 10.3% year-to-date decline. Recession fears receded as February and March progressed in response to declining high yield spreads, rising oil prices, the stabilization of economic data flowing from China as well as stabilization in domestic manufacturing, as measured by the Institute of Supply Management and ongoing strength in employment gains. As economic data showed improvement, so too did performance across the major market indices. The Federal Reserve’s dovish tone at the March meeting only further stoked the gains as the Federal Reserve acknowledged in its commentary that global developments present downside risks to the domestic economic outlook. As a result, the Federal Reserve acknowledged that the pace of rate increases would likely be slower than previously expected and recalibrated the trajectory of the median increase fed funds rate to 50 Basis Point (“bps”)(3) from 100 bps by the end of 2016.
The combination of uncertain global growth and the resulting heightened risk aversion presented a challenging backdrop for small capitalization stocks and more specifically small capitalization growth stocks. For the trailing twelve months ended April 29, 2016 small capitalization stocks, as represented by the Russell 2000® Index(4), returned a negative 5.94% underperforming large capitalization stocks, as represented by the Russell 1000® Index(5), which returned a positive 0.34%. Within the Russell 2000, for the trailing twelve month period ended April 29, 2016, the Russell 2000 Value index(6) declined 3.71%, whereas the Russell 2000 Growth index declined by 8.27% over the same period.
Investment Analysis
On a relative basis, the Fund trailed the benchmark for the trailing period as the positive contribution to return achieved in the healthcare, energy and consumer discretionary sectors was unable to offset relative underperformance within the producer durables, technology, and financial services sectors.
The producer durables sector was the largest source of relative underperformance for the trailing period driven by challenging stock selection within the aerospace, air transport, construction and scientific instrument industries. Performance within the technology and financial services sectors also weighed on relative performance as a result of the relative underperformance of holdings within the electronic entertainment, semiconductor, bank and thrift industries.
Challenging relative performance in the aforementioned sectors was partially offset by relative outperformance within the healthcare, energy and consumer discretionary sectors. Performance within the healthcare sector benefitted both as a result of the portfolio’s relative underweight position to the biotechnology industry and stock selection in the pharmaceutical and healthcare management industries. Beyond healthcare, the modest outperformance within the energy and consumer discretionary sectors was driven by the portfolio’s relative underweight position and stock selection within the specialty retail and diversified retail industries.
Entering the second quarter of 2016, the portfolio held the largest active exposures to the financial services and technology sectors. Thoughts on those sectors and other areas of notable opportunity/ portfolio exposure are highlighted below:
The financial services sector continued to represent the portfolio’s largest relative overweight position, however the composition of those holdings has shifted somewhat. Exposure to the banking industry, although still overweight, has declined and assets have been redeployed to a diversified set of holdings within the real estate investment trust (REIT) industry. Although Emerald continues to believe that loan growth at small-cap banks will outpace loan growth at their larger brethren, we also recognize the headwind that the flattening yield curve presents to the banking industry and as a result have opted to adjust the portfolio’s positioning.
Emerald has also maintained the portfolio’s relative overweight position to the technology sector. Although concerns over global economic growth are likely to create ongoing volatility within the sector we continue to be optimistic regarding the outlook for the holdings in the portfolio. Within the enterprise, the emphasis remains on those companies with products serving the security and business intelligence/analytics opportunities inside of software. We also believe there is an emerging opportunity to participate in the pharmaceutical industry’s adoption of cloud technology. In addition, Emerald believes that ever increasing demand for network bandwidth and speed will drive meaningful spending within the optical segment of the network infrastructure in 2016.
| | |
| Annual Report | April 30, 2016 | | 1 |
| | |
| Emerald Growth Fund | | Manager Commentary |
| | April 30, 2016 (Unaudited) |
The healthcare sector has been under significant pressure from a performance perspective since the start of the year in response to political rhetoric surrounding the industry’s pricing tactics as well as heightened risk aversion in the marketplace which weighed on the biotechnology and pharmaceutical industries. While valuations in the industry are beginning to look more attractive, the presidential election cycle is ongoing and we expect headline risk associated with the “hot button” nature of healthcare pricing will likely remain elevated through year-end. That being said, Emerald continues to take advantage of opportunities as they present themselves and in so doing remain focused on those companies that are developing innovative therapeutics that can command premium pricing and can demonstrate that they are cost neutral or even save the system money. The portfolio held an underweight position in the healthcare sector exiting the first quarter.
Market Outlook
As we look to the balance of 2016, Emerald remains cautiously optimistic regarding the market outlook for the balance of year. Although the market may have temporarily rebounded from the depths of the market trough in February thanks to stabilizing economic data and easing fears of a global recession, the macroeconomic environment and related investor sentiment remains fragile. The Federal Reserve at its March meeting struck a more dovish tone than expected, recalibrating its expectations for the median 2016 increase in the Federal Funds rate from 100 basis points to 50 basis points, with risk to weaker global growth cited as the primary rationale for the re-rating. This sentiment was echoed in early April by International Monetary Fund head Christine Lagarde when she stated that the global recovery remains too slow, too fragile and the risks to its durability are increasing. In this regard China and its ability to coast to a soft landing remain a focal point. As does Japan, which is already in negative growth and negative interest rate territory, and the Eurozone which cannot seemingly accelerate beyond 1.5% Gross Domestic Product growth. Oil prices and the supply-demand tug of war continue to garner a large amount of attention as the daily direction of the commodity price remains highly correlated to the direction of the S&P 500® Index. Corporate profits which have been under pressure domestically and abroad also continue to weigh on the markets. Earnings estimates for the S&P 500® Index have been reduced by 9% since the start of 2016, according to a recent report from Bank of America Merrill Lynch, which represents the most extreme three-month negative revision since the first quarter of 2009. Add to these factors the upcoming U.S. presidential election and the U.S. Treasury’s recent moves to tighten regulations aimed at slowing cross-border merger and acquisition activity, and it is our expectation that the market will likely continue to be subject to periods of heightened volatility as the market sorts out and responds to the direction of the economic statistics.
Domestically, first quarter economic growth again proved to be much weaker than anticipated, as has been the case for the last three years. That being said, in each of the last two calendar years, the rate of first quarter growth has not proven to be a directional indicator of growth for the balance of the calendar year. In both calendar 2014 and 2015, economic growth started out weaker than expected and then strengthened during the second and third quarters. There seems to be some sign that this pattern may play out again in 2016. Recent data points from the Institute of Supply Management appear to be pointing to improving trends in both the services and manufacturing components of the measurement. Employment continued to grow and thanks to the dovish positioning of the Federal Reserve, and after a 40% rise in the trade-weighted dollar since early 2011, the strength in the U.S. dollar has begun to recede and should as a result start easing the headwind to revenue and earnings growth. After what is shaping up to be the third consecutive quarter of negative earnings growth for the S&P, a return to growth would certainly be a welcomed change. In aggregate, Emerald believes that 2016 has the potential to look a lot like 2015 from a growth perspective. We believe services will continue to expand, manufacturing will stabilize and consumption will continue to plod ahead and with the potential to serve as a source of upside. That being said, the post-recession U.S. consumer has been much more focused on increasing savings, using less credit and seeking value and convenience. Although the long-awaited acceleration in consumer spending has yet to be witnessed, all of the ingredients to support an acceleration in spending are in place. Consumer Confidence remains encouraging, unemployment remains low, the savings rate has risen, wages are moving in a positive direction, and home prices should continue to rise (increasing equity).
Given our expectation that U.S. economic growth is likely to remain moderate and overall growth scarce, Emerald continues to believe growth as a style could be positioned to return to outperformance. Small capitalization stocks could be able to offer greater levels of earnings growth than that of large capitalization stocks if the domestic economy remains stronger than the rest of the world.
As always, Emerald remains focused on utilizing its fundamental bottom-up research process to identify the best growth opportunities within the small capitalization universe.
| | |
| 2 | | www.emeraldmutualfunds.com |
| | |
| Emerald Growth Fund | | Manager Commentary |
| | April 30, 2016 (Unaudited) |
| | | | |
| Top Contributors | | Top Detractors | | |
| ZS Pharma, Inc. | | Cepheid | | |
| Virgin America, Inc. | | Glu Mobile Inc. | | |
| LendingTree, Inc. | | Chimerix Inc. | | |
| Depomed, Inc. | | Chegg, Inc. | | |
| WellCare Health Plans, Inc. | | Bluebird bio, Inc. | | |
| | |
| Sincerely, | | | | |
| | |
| Kenneth G. Mertz II, CFA | | Stacey L. Sears | | Joseph W. Garner |
| Chief Investment Officer | | Portfolio Manager | | Portfolio Manager |
| Portfolio Manager | | | | |
| | |
| Emerald Mutual Fund Advisers Trust | | | | |
The views of Emerald Mutual Fund Advisors Trust and information discussed in this commentary are as of the date of publication, are subject to change, and may not reflect the writer’s current views. The views expressed are those of the author only, and represent an assessment of market conditions at a specific point in time, are opinions only and should not be relied upon as investment advice regarding a particular investment or markets in general. Such information does not constitute a recommendation to buy or sell specific securities or investment vehicles. It should not be assumed that any investment will be profitable or will equal the performance of the Fund or any securities or any sectors mentioned in this letter. The subject matter contained in this letter has been derived from several sources believed to be reliable and accurate at the time of compilation. Neither Emerald Mutual Fund Advisors Trust nor the Fund accepts any liability for losses either direct or consequential caused by the use of this information.
The Emerald Growth Fund is distributed by ALPS Distributors, Inc.
Diversification does not assure a profit or protect against a loss.
The Fund is subject to investment risks, including possible loss of the principal amount invested and therefore is not suitable for all investors. The Fund may not achieve its objectives.
| (1) | The Russell 2000® Growth Index measures the performance of the small-cap growth segment of the U.S. equity universe. It includes those Russell 2000® Index companies with higher price-to-value ratios and higher forecasted growth values. The Index is not actively managed and does not reflect any deductions for fees, expenses or taxes. An investor may not invest directly into the Index. |
| (2) | Standard & Poor’s 500® Index is an unmanaged index of 500 common stocks chosen for the market size, liquidity and industry group representation. It is a market-value weighted index. The Index is not actively managed and does not reflect any deduction for fees, expenses or taxes. An investor may not invest directly into the Index. |
| (3) | Basis Point is a common unit of measure for interest rates and other percentages in finance. One basis point is equal to 1/100th of 1%, or 0.01% (0.0001). |
| (4) | Russell 2000® Index measures the performance of the small-cap segment of the U.S. equity universe. The Russell 2000® Index is a subset of the Russell 3000® Index representing approximately 10% of the total market capitalization of that index. It includes approximately 2000 of the smallest securities based on a combination of their market cap and current index membership. The Index is not actively managed and does not reflect any deduction of fees, expenses or taxes. An investor may not invest directly into the Index. |
| (5) | The Russell 1000® Index is a stock market index that represents the highest-ranking 1,000 stocks in the Russell 3000 Index, which represents about 90% of the total market capitalization of that index. The Russell 1000® Index has a weighted average market capitalization of $81 billion; the median market capitalization is approximately $4.6 billion. The Index is not actively managed and does not reflect any deductions for fees, expenses or taxes. An investor may not invest directly into the Index. |
| (6) | The Russell 2000® Value Index measures the performance of small-cap value segment of the U.S. equity universe. It includes those Russell 2000 companies with lower price-to-book ratios and lower forecasted growth values. The Russell 2000® Value Index is constructed to provide a barometer for the small-cap value segment. The Index is completely reconstituted annually to ensure larger stocks do not distort the performance and characteristics of the true small-cap opportunity set and that the represented companies continue to reflect value characteristics. The Index is not actively managed and does not reflect any deductions for fees, expenses or taxes. An investor may not invest directly into the Index. |
| | |
| Annual Report | April 30, 2016 | | 3 |
| | |
| Emerald Growth Fund | | Manager Commentary |
| | April 30, 2016 (Unaudited) |
| | | | |
TOP TEN HOLDINGS (as a % of Net Assets)* | | |
Trex Co., Inc. | | 2.00% | |
MicroStrategy, Inc., Class A | | 1.98% | |
Veeva Systems, Inc., Class A | | 1.86% | |
EPAM Systems, Inc. | | 1.83% | |
WellCare Health Plans, Inc. | | 1.75% | |
Bank of the Ozarks, Inc. | | 1.73% | |
Apogee Enterprises, Inc. | | 1.72% | |
8x8, Inc. | | 1.56% | |
Imperva, Inc. | | 1.55% | |
Five Below, Inc. | | 1.51% | |
Top Ten Holdings | | 17.49% | |
INDUSTRY SECTOR ALLOCATION (as a % of Net Assets) | |
Technology | | 23.17% | |
Health Care | | 20.72% | |
Consumer Discretionary | | 18.39% | |
Financial Services | | 18.32% | |
Materials & Processing | | 7.02% | |
Producer Durables | | 5.98% | |
Utilities | | 2.98% | |
Energy | | 1.06% | |
Cash, Cash Equivalents, & Other Net Assets | | 2.36% | |
* Holdings are subject to change, and may not reflect the current or future position of the portfolio. | |
GROWTH OF $10,000 INVESTMENT IN THE FUND (for the period ended April 30, 2016)
Comparison of change in value of a $10,000 investment (includes applicable sales loads)
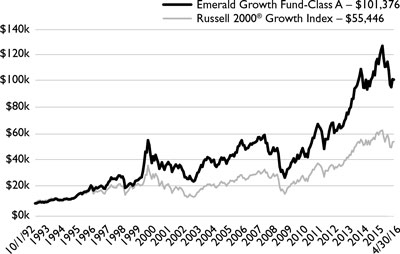
The chart represents historical performance of a hypothetical investment of $10,000 in the Fund since inception. Past performance does not guarantee future results. This chart does not reflect the deduction of taxes that a shareholder would pay on Fund distributions or the redemption of Fund shares.
AVERAGE ANNUAL TOTAL RETURN (for the period ended April 30, 2016)
| | | | | | | | | | | | | | | | | | | | | | | | | | | | |
| | | | | | | | | | | | | | | Since | | | Expense Ratio | |
| | | 1 Year | | | 3 Year | | | 5 Year | | | 10 Year | | | Inception1 | | | Gross2 | | | Net2 | |
Class A (NAV) | | | -10.28% | | | | 10.20% | | | | 8.18% | | | | 6.05% | | | | 10.55% | | | | 1.29% | | | | 1.29% | |
Class A (MOP) | | | -14.55% | | | | 8.42% | | | | 7.13% | | | | 5.53% | | | | 10.32% | | | | 1.29% | | | | 1.29% | |
Russell 2000® Growth Index† | | | -8.27% | | | | 8.50% | | | | 7.15% | | | | 6.14% | | | | 7.53% | | | | | | | | | |
Class C (NAV) | | | -10.87% | | | | 9.47% | | | | 7.46% | | | | 5.41% | | | | 4.70% | | | | 1.94% | | | | 1.94% | |
Class C (CDSC) | | | -11.73% | | | | 9.47% | | | | 7.46% | | | | 5.41% | | | | 4.70% | | | | 1.94% | | | | 1.94% | |
Russell 2000® Growth Index† | | | -8.27% | | | | 8.50% | | | | 7.15% | | | | 6.14% | | | | 7.53% | | | | | | | | | |
Investor Class | | | -10.36% | | | | 10.16% | | | | – | | | | – | | | | 8.44% | | | | 1.34% | | | | 1.34% | |
Russell 2000® Growth Index† | | | -8.27% | | | | 8.50% | | | | 7.15% | | | | 6.14% | | | | 7.35% | | | | | | | | | |
Institutional Class | | | -9.97% | | | | 10.55% | | | | 8.51% | | | | – | | | | 14.10% | | | | 0.99% | | | | 0.99% | |
Russell 2000® Growth Index† | | | -8.27% | | | | 8.50% | | | | 7.15% | | | | 6.14% | | | | – | | | | | | | | | |
The performance quoted represents past performance, does not guarantee future results and current performance may be lower or higher than the data quoted. The investment return and principal value of an investment will fluctuate so that shares, when redeemed, may be worth more or less than their original cost. Performance data current to the most recent month end may be obtained at www.emeraldmutualfunds.com.
Performance shown for periods prior to March 16, 2012, reflects the performance of the Forward Growth Fund, a series of Forward Funds (as a result of a reorganization of the Forward Growth Fund into the Emerald Growth Fund).
| | |
| 4 | | www.emeraldmutualfunds.com |
| | |
| Emerald Growth Fund | | Manager Commentary |
| | April 30, 2016 (Unaudited) |
|
Maximum Offering Price (MOP) for Class A shares includes the Fund’s maximum sales charge of 4.75%. Performance shown at NAV does not include these sales charges and would have been lower had it been taken into account. A Contingent Deferred Sales Charge (CDSC) of 1.00% may apply to Class C shares redeemed within the first 12 months after a purchase. 1 Inception Dates - Class A: 10/01/1992, Class C: 07/01/2000, Class Institutional: 10/21/2008, Class Investor: 05/01/2011 2 Emerald Mutual Fund Advisers Trust (“Emerald” or the “Adviser”) has agreed contractually to waive a portion of its fees and reimburse other expenses until August 31, 2016 in amounts necessary to limit the Fund’s operating expenses (exclusive of Acquired Fund Fees and Expenses, brokerage expenses, interest expenses, taxes and extraordinary expense) for Class A, Class C, Institutional Class, and Investor Class shares to an annual rate (as percentage of the Fund’s average daily net assets) of 1.29%, 1.94%, 0.99% and 1.34% respectively. The Adviser will be permitted to recover, on a class-by-class basis, expenses it has borne through the agreement described above to the extent that the Fund’s expenses in later periods fall below the annual rates set forth in the relevant agreement. The Fund will not be obligated to pay any such deferred fees and expenses more than three years after the year(s) in which the fees and expense were incurred. The Adviser may not discontinue this waiver prior to August 31, 2016, without the approval by the Fund’s Board of Trustees. Ratios as of the Prospectus dated August 31, 2015 and may differ from the ratios presented in the Financial Highlights. † The Russell 2000® Growth Index measures the performance of the small-cap growth segment of the U.S. equity universe. It includes those Russell 2000® Index companies with higher price-to-value ratios and higher forecasted growth values. The Index is not actively managed and does not reflect any deduction for fees, expenses or taxes. An Investor may not invest directly into the Index. Important Risks Investing in smaller companies generally will present greater investment risks, including: greater price volatility, greater sensitivity to changing economic conditions and less liquidity than the securities of larger, more mature companies. |
| | |
| Annual Report | April 30, 2016 | | 5 |
| | |
| Emerald Small Cap Value Fund | | Manager Commentary |
| | April 30, 2016 (Unaudited) |
April 30, 2016
Dear Shareholders:
Investment Results
The performance of the Emerald Small Cap Value Fund’s Investor Class, for the twelve months ended April 30, 2016, reflected a loss of -3.82% (net of fund fees and expenses) slightly lagging the Russell 2000® Value Index(1) which was down -3.71%.
The dollar continued to strengthen early in the New Year with a hangover of concerns from 2015 about the negative impacts from a potential devaluation of the Chinese Yuan and emerging market crisis, and continued commodity price weakness. In mid-February, however, the dollar began to weaken as the U.S. Federal Reserve (the “Fed”) seemingly reset expectations for interest rate policy normalization. Consequently, equities rose sharply as investors perceived the Fed to place further interest rate increases on hold.
Although the Fed’s historical dual mandate to promote full employment and to maintain price stability has guided Fed policy for many decades, the increasingly interconnected global economy appears to have created a new ‘dual mandate’ whereby Fed policy will also take into account the economic health of foreign markets as well. We believe the minutes from the March FOMC (Federal Open Market Committee) meeting made clear that the combination of “global economic and financial developments” and low inflation expectations skewed risk to the downside; and, thus, “a cautious approach to raising rates would be prudent.”(2) We interpret such a risk assessment as the most dovish thus far of Fed Chair Yellen’s central banking career and perhaps represents a ‘currency truce’ among major central bankers in order to recognize that a stronger dollar is a negative for China and other emerging markets, the global economy, and for U.S. net exports.
Bond markets also reacted enthusiastically to nuanced interest rate signals from the Fed. As a result, the yield curve has continued to flatten. Historically, yield curve flattening has been a negative for small cap stock performance because such a development is usually associated with a contraction in the U.S. business cycle. Consequently, small cap equities performance in general during the first calendar quarter of 2016 was negative as compared to large cap stocks.
The fund significantly underperformed the benchmark in the month of April. The market rally during that month was driven by lower quality risk-related stocks, according to Merrill Lynch (Bank of America/Merrill Lynch Equity and Quant Strategy, U.S. Performance Attribution, 02 May 2016). With our portfolio’s focus on investing in companies that generate high return on invested capital and equity, it was difficult to keep pace with the benchmark.
Investment Analysis
The Fund (net of fund fees and expenses) slightly underperformed its benchmark for the 12-month period ended April 30, 2016. At the sector level, relative outperformance was driven by stock selection within the financial services, and a relative underweight to the benchmark’s energy sector. Relative underperformance was experienced within the technology sector.
As mentioned in the October 2015 shareholder letter, the portfolio benefited from an increase to overall banks exposure earlier in the year, and then a trim to these positions as valuation became stretched towards the end of the year.
Negative stock selection in our technology holdings weighed on relative performance as holdings within the semiconductor industry were hurt by the slowdown in customers’ spending plans due to low visibility on consumer spending (particularly for mobile devices). However, we saw significant outperformance within the software holdings as they continue to experience meaningful growth from providing unique solutions in the security, compliance, and customer service verticals.
In the past twelve months, we have increased the portfolio’s exposure to the producer durables and materials sectors as we see more tangible signs of the resurging non-residential construction market, and meaningful price improvement for commodities such as steel.
Financial services and technology are two sectors where absolute portfolio weightings decreased. In each case, holdings that were trimmed or sold during this period had previously exceeded our predetermined price targets and, according to our sell discipline, exited the portfolio when the stock price declined by a given percentage amount from its earlier period high.
Market Outlook
While we recognize the downside risks from global growth, we have yet to see any meaningful spillover effects related to the Fed’s concerns highlighted above. A negative outcome associated with the Brexit referendum in late June could, however, wreak havoc for the Fed’s policy making and interfere with the rate normalization process despite any progress toward its ‘dual mandate’ objectives.
| | |
| 6 | | www.emeraldmutualfunds.com |
| | |
| Emerald Small Cap Value Fund | | Manager Commentary |
| | April 30, 2016 (Unaudited) |
Based upon improving U.S. economic data, a stabilization in China, and earnings expectations set at a low level, we believe the general tone from first quarter earnings reports could serve as a positive catalyst for the market. In terms of how value-oriented stocks could perform in the near term, we quote JP Morgan’s U.S. equity strategist, Dubravko Lakos-Bujas, who recently wrote, “Value remains unloved and offers higher opportunity with Value stocks having already been disproportionately penalized relative to Momentum stocks in the past two years, influenced by extreme macro positioning contingent upon a continuation of diverging policies between the Fed and foreign central banks.”(3) We will continue to seek attractive investment opportunities for our clients by focusing on high-quality companies identified and evaluated by our fundamental research and active portfolio management.
| | |
| Top Contributors | | Top Detractors |
| Perficient, Inc. | | Everi holdings, Inc. |
| Microsemi Corporation | | Gray Television, Inc. |
| CyrusOne, Inc. | | Arris International Plc |
| Generac holdings, Inc. | | Vonage Holdings Corp. |
| Corporate Office Properties Trust | | Carriage Services, Inc. |
| |
| Sincerely, | | |
| |
| Richard A. Giesen, Jr. | | Ori Elan |
| Managing Director – Value Equity Strategies | | Vice President |
| Portfolio Manager | | Portfolio Manager |
| |
| Emerald Mutual Fund Advisers Trust | | |
The views of Emerald Mutual Fund Advisors Trust and information discussed in this commentary are as of the date of publication, are subject to change, and may not reflect the writer’s current views. The views expressed are those of the author only, and represent an assessment of market conditions at a specific point in time, are opinions only and should not be relied upon as investment advice regarding a particular investment or markets in general. Such information does not constitute a recommendation to buy or sell specific securities or investment vehicles. It should not be assumed that any investment will be profitable or will equal the performance of the Fund or any securities or any sectors mentioned in this letter. The subject matter contained in this letter has been derived from several sources believed to be reliable and accurate at the time of compilation. Neither Emerald Mutual Fund Advisors Trust nor the Fund accepts any liability for losses either direct or consequential caused by the use of this information.
The Emerald Small Cap Value Fund is distributed by ALPS Distributors, Inc.
Diversification does not assure a profit or protect against a loss.
The Fund is subject to investment risks, including possible loss of the principal amount invested and therefore is not suitable for all investors. The Fund may not achieve its objectives.
| (1) | The Russell 2000® Value Index measures the performance of small-cap value segment of the U.S. equity universe. It includes those Russell 2000 companies with lower price-to-book ratios and lower forecasted growth values. The Russell 2000® Value Index is constructed to provide a comprehensive and unbiased barometer for the small-cap value segment. The Index is completely reconstituted annually to ensure larger stocks do not distort the performance and characteristics of the true small-cap opportunity set and that the represented companies continue to reflect value characteristics. The Index is not actively managed and does not reflect any deductions for fees, expenses or taxes. An investor may not invest directly into the Index. |
| (2) | https://www.federalreserve.gov/monetarypolicy/fomcminutes20160316.htm |
| (3) | J.P. Morgan, U.S. Portfolio Strategy, 7 April 2016 |
| | |
| Annual Report | April 30, 2016 | | 7 |
| | |
| Emerald Small Cap Value Fund | | Manager Commentary |
| | April 30, 2016 (Unaudited) |
| | | | |
TOP TEN HOLDINGS (as a % of Net Assets)* | | |
Employers Holdings, Inc. | | 3.11% | |
Great Western Bancorp, Inc. | | 3.09% | |
Perficient, Inc. | | 3.07% | |
CyrusOne, Inc., REIT | | 3.01% | |
First Merchants Corp. | | 2.89% | |
Carriage Services, Inc. | | 2.84% | |
Corporate Office Properties Trust, REIT | | 2.84% | |
Microsemi Corp. | | 2.83% | |
Cedar Realty Trust, Inc., REIT | | 2.79% | |
Ramco-Gershenson Properties Trust, REIT | | 2.66% | |
Top Ten Holdings | | 29.13% | |
INDUSTRY SECTOR ALLOCATION (as a % of Net Assets) | |
Financial Services | | 36.30% | |
Consumer Discretionary | | 17.26% | |
Technology | | 14.95% | |
Producer Durables | | 13.33% | |
Utilities | | 6.47% | |
Materials & Processing | | 5.21% | |
Health Care | | 1.61% | |
Cash, Cash Equivalents, & Other Net Assets | | 4.87% | |
* Holdings are subject to change, and may not reflect the current or future position of the portfolio. | |
GROWTH OF $10,000 INVESTMENT IN THE FUND (for the period ended April 30, 2016)
Comparison of change in value of a $10,000 investment (includes applicable sales loads)
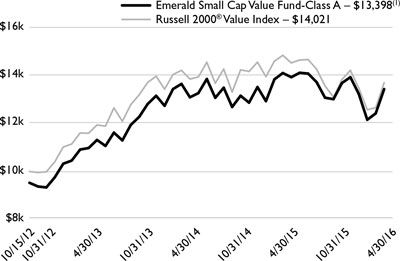
The chart represents historical performance of a hypothetical investment of $10,000 in the Fund since inception. Past performance does not guarantee future results. This chart does not reflect the deduction of taxes that a shareholder would pay on Fund distributions or the redemption of Fund shares.
AVERAGE ANNUAL TOTAL RETURN (for the period ended April 30, 2016)(2)
| | | | | | | | | | | | | | | | | | | | |
| | | | | | | | | Since | | | Expense Ratio | |
| | | 1 Year | | | 3 Years | | | Inception | | | Gross(3)(4) | | | Net(3)(4) | |
Class A (NAV) | | | -4.03% | | | | 6.85% | | | | 10.12% | | | | 1.62% | | | | 1.35% | |
Class A (MOP) | | | -8.61% | | | | 5.14% | | | | 8.62% | | | | 1.62% | | | | 1.35% | |
Russell 2000® Value Index(5) | | | -3.71% | | | | 6.50% | | | | 10.02% | | | | | | | | | |
Class C (NAV) | | | -4.66% | | | | 6.15% | | | | 9.41% | | | | 2.27% | | | | 2.00% | |
Class C (CDSC) | | | -5.59% | | | | 6.15% | | | | 9.41% | | | | 2.27% | | | | 2.00% | |
Russell 2000® Value Index(5) | | | -3.71% | | | | 6.50% | | | | 10.02% | | | | | | | | | |
Investor Class | | | -3.82% | | | | 6.99% | | | | 10.29% | | | | 1.52% | | | | 1.25% | |
Russell 2000® Value Index(5) | | | -3.71% | | | | 6.50% | | | | 10.02% | | | | | | | | | |
Institutional Class | | | -3.74% | | | | 7.20% | | | | 10.49% | | | | 1.27% | | | | 1.00% | |
Russell 2000® Value Index(5) | | | -3.71% | | | | 6.50% | | | | 10.02% | | | | | | | | | |
The performance quoted represents past performance, does not guarantee future results and current performance may be lower or higher than the data quoted. The investment return and principal value of an investment will fluctuate so that shares, when redeemed, may be worth more or less than their original cost. Performance data current to the most recent month end may be obtained at www.emeraldmutualfunds.com.
Maximum Offering Price (MOP) for Class A shares includes the Fund’s maximum sales charge of 4.75%. Performance shown at NAV does not include these sales charges and would have been lower had it been taken into account.
A Contingent Deferred Sales Charge (CDSC) of 1.00% may apply to Class C shares redeemed within the first 12 months after a purchase.
| | |
| 8 | | www.emeraldmutualfunds.com |
| | |
| Emerald Small Cap Value Fund | | Manager Commentary |
| | April 30, 2016 (Unaudited) |
|
(1) As of June 26, 2015, the Emerald Small Cap Value Fund was reorganized as a successor to the Elessar Small Cap Value Fund (the Predecessor Fund), a series of Elessar Investment Trust. The performance shown for periods prior to June 26, 2015 reflects the performance of the Predecessor Fund’s Institutional Class and Investor Class shares. The Predecessor Fund did not offer Class A or Class C shares. The performance shown for class A and C shares prior to June 30, 2015 reflect the historical performance of the Predecessor Fund’s Institutional and Investor Shares since inception on October 15, 2012, calculated using the fees and expenses of Class A and C shares, respectively. (2) Commencement Dates - Class A: 06/30/2015, Class C: 06/30/2015, Class Institutional: 10/15/2012, Class Investor:10/15/2012 (3) Emerald Mutual Fund Advisers Trust (“Emerald” or the “Adviser”) has agreed contractually to waive a portion of its fees and reimburse other expenses until August 31, 2016 in amounts necessary to limit the Fund’s operating expenses (exclusive of Acquired Fund Fees and Expenses, brokerage expenses, interest expenses, taxes and extraordinary expense) for Class A, Class C, Institutional Class, and Investor Class shares to an annual rate (as percentage of the Fund’s average daily net assets) of 1.35%, 2.00%, 1.00% and 1.25% respectively. The Adviser will be permitted to recover, on a class-by-class basis, expenses it has borne through the agreement described above (the “Expense Agreement”) to the extent that the Fund’s expenses in later periods fall below the annual rates set forth in the Expense Agreement. The Fund will not be obligated to pay any such deferred fees and expenses more than three years after the year(s) in which the fees and expenses were incurred. The Adviser may not discontinue this waiver prior to August 31, 2016, without the approval by the Fund’s Board of Trustees. (4) The total annual fund operating expenses shown is as stated in the fund’s prospectus current as of the date of this report. The prospectus may vary from the expense ratio shown elsewhere in this report as the ratio’s per the prospectus are based on estimated future expenses as of the date of the prospectus. (5) The Russell 2000® Value Index measures the performance of small-cap value segment of the U.S. equity universe. It includes those Russell 2000 companies with lower price-to-book ratios and lower forecasted growth values. The Russell 2000® Value Index is constructed to provide a comprehensive and unbiased barometer for the small-cap value segment. The Index is completely reconstituted annually to ensure larger stocks do not distort the performance and characteristics of the true small-cap opportunity set and that the represented companies continue to reflect value characteristics. The Index is not actively managed and does not reflect any deductions for fees, expenses or taxes. An investor may not invest directly into the Index. Important Risks Investing in smaller companies generally will present greater investment risks, including: greater price volatility, greater sensitivity to changing economic conditions and less liquidity than the securities of larger, more mature companies. |
| | |
| Annual Report | April 30, 2016 | | 9 |
| | |
| Emerald Insights Fund | | Manager Commentary |
| | April 30, 2016 (Unaudited) |
April 30, 2016
Dear Shareholders:
Investment Results
The performance of the Emerald Insights Fund’s Class A shares (without sales load), for the past year reflected a negative return of -11.75%, trailing the Russell Midcap Growth® Index(1) benchmark by 7.62%. Performance for the period was driven by outperformance in technology, materials and processing; and underperformance in healthcare, consumer, and financial services.
Investment Analysis
The first full year of the Fund’s relative performance can only be described as a disappointment. The reporting period was largely bifurcated, with growth equities leading for the first six months of the year, and value equities driving returns for the second half. The dislocation within growth equities was driven by a dramatic shift in investor sentiment regarding healthcare and energy as well as a “risk-off” positioning driven by fears of recession both domestically and globally. While the dramatic decline in energy was more understandable given the intense volatility of the commodity, the seismic shift in sentiment toward healthcare was initiated by a single tweet by Presidential candidate Hilary Clinton unveiling a plan to limit drug pricing. Since that moment in late September, healthcare stocks, particularly drug-related, have been under intense pressure and correlations(2) within the segment increased dramatically; and as of this writing, valuations of healthcare stocks remain depressed. On the economic front, while fears of a domestic recession abounded throughout the winter of 2015/2016, retail sales and non-farm payroll data came in above expectations in March providing some evidence of economic growth. Coupled with tightening high-yield spreads, more dovish Central Bank policy from the U.S. Federal Reserve (the “Fed”), improving oil prices, and some stabilization of emerging market currencies, growth equities began to show improvement at the end of our reporting year.
The Fund portfolio maintained a higher growth bias than the benchmark with overweights to banks, biotechs, and fast growing technology companies throughout the year. In keeping with our growth focus, the Fund was also slightly smaller than the benchmark in terms of market cap and underweight slow growing, higher valued Consumer Staples and Discretionary names. Given the “risk-off” mentality which pervaded the second half, performance suffered, as underweighted areas outperformed and overweighted areas underperformed; the notable exception being technology, which was overweighted to the benchmark for the year and outperformed the benchmark driven by stock selection.
Market Outlook
We have not strayed from our core theses surrounding investment in companies that we believe are high growth innovators with strong competitive moats, excellent management teams and low cost leadership. We believe the US economy is slowly grinding higher and external pressure, while real, will be offset by spurts of economic improvement - a good environment for growth stocks. As of the end of the reporting period, the Fund was overweight Technology, Energy, Materials, and Healthcare (albeit more focused on Biotech/Pharmaceuticals). The Fund remained underweight Consumer Discretionary and Consumer Staples as well as Producer Durables as we believe these sectors do not have growth or profitability expectations in keeping with their current valuations.
While we have adjusted the portfolio over the past several months, we think the risk of transformative changes to drug pricing is minimal, US oil production has peaked and should decline meaningfully this year, and the economy (employment) should muddle along, thus benefiting high growth banks. We also continue to see strong earnings and revenue growth from technology companies in many industries such as security and specialized semiconductors. Reinforcing our confidence in these positions is Credit Suisse’s commentary regarding the high relative valuations of the following industries: food, beverage & tobacco, utilities, large cap food & staples retail (all underweight areas in the Insights portfolio). The Fund is entering the new fiscal year with an average market cap only slightly below the benchmark, while portfolio valuation is meaningfully below the benchmark on price/earnings and price/cash flow metrics. Additionally, the Fund portfolio is made up of names that we believe may have significantly more earnings growth over the next 3-5 years than the Russell Midcap Growth benchmark (16% vs 13%) despite the discounted valuations. This disparity between valuations and growth continues to provide optimism regarding longer term portfolio performance, as growth companies should at some time be rewarded with higher valuations than their slower growth brethren.
As always, we focus on identifying innovative, higher growth companies with strong management teams and competitive differentiators. This focus tends to lead us towards secular trends that we pick up on rather early given the fundamental bottom-up work we do on our industries and companies. While we have not been rewarded for our investment in secular trends in the short term, we are hopeful that this trend reverses and investors gain more confidence in growth companies and themes and once again start rewarding companies for current and future growth.
| | |
| 10 | | www.emeraldmutualfunds.com |
| | |
| Emerald Insights Fund | | Manager Commentary |
| | April 30, 2016 (Unaudited) |
| | | | |
| Top Five Contributors | | Top Five Detractors | | |
| Dollar General Corporation | | Harman International Industries, Incorporated | | |
| SolarWinds, Inc. | | LinkedIn Corporation Class A | | |
| Acuity Brands, Inc. | | Akorn, Inc. | | |
| Depomed, Inc. | | bluebird bio, Inc. | | |
| St. Jude Medical, Inc. | | Fitbit, Inc. Class A | | |
Sincerely, | | | | |
| David A. Volpe, CFA | | Joseph W. Garner | | Stephen L. Amsterdam |
| Deputy Chief Investment Officer | | Director of Research | | Associate Portfolio Manager |
| Portfolio Manager | | Associate Portfolio Manager | | |
Emerald Mutual Fund Advisers Trust | | | | |
The views of Emerald Mutual Fund Advisors Trust and information discussed in this commentary are as of the date of publication, are subject to change, and may not reflect the writer’s current views. The views expressed are those of the author only, and represent an assessment of market conditions at a specific point in time, are opinions only and should not be relied upon as investment advice regarding a particular investment or markets in general. Such information does not constitute a recommendation to buy or sell specific securities or investment vehicles. It should not be assumed that any investment will be profitable or will equal the performance of the Fund or any securities or any sectors mentioned in this letter. The subject matter contained in this letter has been derived from several sources believed to be reliable and accurate at the time of compilation. Neither Emerald Mutual Fund Advisors Trust nor the Fund accepts any liability for losses either direct or consequential caused by the use of this information.
The Emerald Insights Fund is distributed by ALPS Distributors, Inc.
Diversification does not assure a profit or protect against a loss.
The Fund is subject to investment risks, including possible loss of the principal amount invested and therefore is not suitable for all investors. The Fund may not achieve its objectives.
| (1) | The Russell Midcap® Growth Index measures the performance of the mid-cap growth segment of the U.S. equity universe. It includes those Russell Midcap Index companies with higher price-to-book ratios and higher forecasted growth values. As of June 30, 2015, the Russell Midcap® Growth Index included securities issued by companies that ranged in size between $1.8 billion and $28.1 billion. The Index is not actively managed and does not reflect any deductions for fees, expenses or taxes. An investor may not invest directly into the Index. |
| (2) | Correlation is a statistical measure of how an index moves in relation to another index or model portfolio. A correlation ranges from -1 to 1. A correlation of 1 means the two indexes have moved in lockstep with each other. A correlation of -1 means the two indexes have moved in exactly the opposite direction. |
| | |
| Annual Report | April 30, 2016 | | 11 |
| | |
| Emerald Insights Fund | | Manager Commentary |
| | April 30, 2016 (Unaudited) |
| | | | |
TOP TEN HOLDINGS (as a % of Net Assets)* | | |
Southwest Airlines Co. | | 3.03% | |
Dollar General Corp. | | 2.42% | |
Wabtec Corp. | | 2.24% | |
IMAX Corp. | | 2.11% | |
S&P Global, Inc. | | 2.03% | |
Ross Stores, Inc. | | 2.02% | |
Middleby Corp. | | 1.94% | |
Palo Alto Networks, Inc. | | 1.92% | |
SVB Financial Group | | 1.91% | |
Vulcan Materials Co. | | 1.89% | |
Top Ten Holdings | | 21.51% | |
INDUSTRY SECTOR ALLOCATION (as a % of Net Assets) | |
Consumer Discretionary | | 23.64% | |
Technology | | 22.03% | |
Health Care | | 12.73% | |
Financial Services | | 10.44% | |
Producer Durables | | 10.64% | |
Materials & Processing | | 8.31% | |
Consumer Staples | | 6.09% | |
Energy | | 3.21% | |
Master Limited Partnerships | | 1.83% | |
Cash, Cash Equivalents, & Other Net Assets | | 1.08% | |
* Holdings are subject to change, and may not reflect the current or future position of the portfolio. | |
GROWTH OF $10,000 INVESTMENT IN THE FUND (for the period ended April 30, 2016)
Comparison of change in value of a $10,000 investment (includes applicable sales loads)
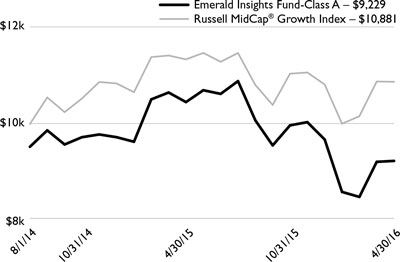
The chart represents historical performance of a hypothetical investment of $10,000 in the Fund since inception. Past performance does not guarantee future results. This chart does not reflect the deduction of taxes that a shareholder would pay on Fund distributions or the redemption of Fund shares.
AVERAGE ANNUAL TOTAL RETURN (for the period ended April 30, 2016)
| | | | | | | | | | | | |
| | | | | | | | Expense Ratio |
| | | 1 Year | | | Since Inception1 | | Gross2 | | | Net2 |
Class A (NAV) | | | -11.75% | | | -1.79% | | | 2.60% | | | 1.38% |
Class A (MOP) | | | -15.96% | | | -4.50% | | | 2.60% | | | 1.38% |
Russell MidCap® Growth Index† | | | -4.13% | | | 4.96% | | | | | | |
Class C (NAV) | | | -12.45% | | | -2.55% | | | 7.28% | | | 2.03% |
Class C (CDSC) | | | -13.33% | | | -2.55% | | | 7.28% | | | 2.03% |
Russell MidCap® Growth Index† | | | -4.13% | | | 4.96% | | | | | | |
Investor Class | | | -11.77% | | | -1.90% | | | 2.99% | | | 1.43% |
Russell MidCap® Growth Index† | | | -4.13% | | | 4.96% | | | | | | |
Institutional Class | | | -11.46% | | | -1.56% | | | 4.69% | | | 1.08% |
Russell MidCap® Growth Index† | | | -4.13% | | | 4.96% | | | | | | |
The performance quoted represents past performance, does not guarantee future results and current performance may be lower or higher than the data quoted. The investment return and principal value of an investment will fluctuate so that shares, when redeemed, may be worth more or less than their original cost. Performance data current to the most recent month end may be obtained at www.emeraldmutualfunds.com.
Maximum Offering Price (MOP) for Class A shares includes the Fund’s maximum sales charge of 4.75%. Performance shown at NAV does not include these sales charges and would have been lower had it been taken into account.
A Contingent Deferred Sales Charge (CDSC) of 1.00% may apply to Class C shares redeemed within the first 12 months after a purchase.
| 1 | Inception Date – August 1, 2014. |
| | |
| 12 | | www.emeraldmutualfunds.com |
| | |
| Emerald Insights Fund | | Manager Commentary |
| | April 30, 2016 (Unaudited) |
| | | | | | |
| | 2 | | Emerald Mutual Fund Advisers Trust (“Emerald” or the “Adviser”) has agreed contractually to waive a portion of its fees and reimburse other expenses until August 31, 2016 in amounts necessary to limit the Fund’s operating expenses (exclusive of Acquired Fund Fees and Expenses, brokerage expenses, interest expenses, taxes and extraordinary expense) for Class A, Class C, Institutional Class, and Investor Class shares to an annual rate (as percentage of the Fund’s average daily net assets) of 1.35%, 2.00%, 1.05% and 1.40% respectively. The Adviser will be permitted to recover, on a class-by-class basis, expenses it has borne through the agreement described above to the extent that the Fund’s expenses in later periods fall below the annual rates set forth in the relevant agreement. The Fund will not be obligated to pay any such deferred fees and expenses more than three years after the year(s) in which the fees and expense were incurred. The Adviser may not discontinue this waiver prior to August 31, 2016, without the approval by the Fund’s Board of Trustees. Ratios as of the Prospectus dated August 31, 2015 and may differ from the ratios presented in the Financial Highlights. | | |
| | | |
| | † | | The Russell Midcap® Growth Index measures the performance of the mid-cap growth segment of the U.S. equity universe. It includes those Russell Midcap Index companies with higher price-to-book ratios and higher forecasted growth values. As of June 30, 2015, the Russell Midcap Growth Index included securities issued by companies that ranged in size between $1.8 billion and $28.1 billion. The Index is not actively managed and does not reflect any deductions for fees, expenses or taxes. An investor may not invest directly into the Index. | | |
| | Important Risks Investing in smaller companies generally will present greater investment risks, including: greater price volatility, greater sensitivity to changing economic conditions and less liquidity than the securities of larger, more mature companies. |
| | |
| Annual Report | April 30, 2016 | | 13 |
| | |
| Emerald Banking and Finance Fund | | Manager Commentary |
| | April 30, 2016 (Unaudited) |
April 30, 2016
Dear Shareholders:
Investment Results
The Emerald Bank and Finance Fund outperformed the Russell 2000® Index(1) for the twelve months ended April 30, 2016, returning 8.39% vs. -5.94% for the Index. During the twelve months ended April 30, 2016, the Russell 2000® Financial Services Index(2) returned 2.70%, the SNL Small Cap U.S. Bank & Thrift Index(3) gained 8.95% versus a 1.21% gain delivered by the Standard & Poor’s 500 Index(4) and a loss of -3.71% for the Russell 2000 Value Index.
Interest rates, net interest margin expansion, the slowing global economy, commercial real estate loan exposure, energy exposure and mergers and acquisitions all remained key drivers for banks as we ended the reporting period. For many banks, the low rate environment, relatively slow loan growth and competition for credits pushed bank margins close to 3% in the first quarter of 2015. However, margins rebounded over the last six months as the pressure on earning asset yields moderated, while banks reduced interest bearing balances due and put those funds to work in their loan portfolios. We believe margins benefited modestly from the U.S. Federal Reserve’s decision to finally begin raising short term rates in mid-December 2015. Prior to the rate hike in December, LIBOR began increasing the last week of November 2015, and continued climbing leading up to, and following, the increase in short term rates (LIBOR rates are benchmark rates that some of the world’s leading banks charge each other for short-term loans. LIBOR stands for London Interbank Offered Rate). We believe however, that further rate increases will need to occur for margins to expand further.
Investment Analysis
We believe that despite the difficult, low rate and high regulatory expense, banking environment, community banks continue to grow revenue and earnings as a result of taking market share from their larger regional competitors. U.S. commercial banks with less than $10 billion in assets grew both revenue and earnings on a year-over-year basis in the first quarter of 2016. We have separated the banks by asset size — the sub-$1 billion banks, the $1 billion to $5 billion institutions, and those with between $5 billion and $10 billion in assets. In each bucket, banks saw year-over-year growth in operating revenue and earnings on a median basis. On a year-over-year basis, the sub-$1 billion asset banks reported a median increase in operating revenue of 5.40% and earnings of 6.29%, the $1 billion to $5 billion institutions grew operating revenue 6.57% and earnings 8.11%, and those with between $5 billion and $10 billion in assets grew operating revenue 9.24% and earnings 10.73%.
As expected and due to seasonality, loan growth for U.S. commercial banks with less than $10 billion in assets slowed in the first quarter of 2016 after strong growth rates in the fourth quarter of 2015.(5) According to FDIC (Federal Deposit Insurance Corporation) call report data for the quarter ended March 31, 2016, annualized loan growth at banks with less than $10 billion in assets slowed from a 13.7% annualized growth rate in Q4’15 to 4.6% in Q1’16. More surprisingly to us is that commercial and industrial loan growth of 3.7% at the sub $10 billion asset banks was slower than the 6.8% growth in commercial real estate loans at those same banks. We believe that plenty of opportunities exist to invest in community banks that are growing loans by greater than 15% year-over-year. We believe this loan growth is being driven primarily by taking market share from larger regional banks.
Bank regulators stated in December 2015 that they planned to pay “special attention” to banks with higher commercial real estate (or “CRE”) concentrations. The interagency regulatory guidance on CRE lending exposure has been in place since December 2006, but has received renewed attention after regulators issued a joint statement December 18, 2015, encouraging lenders to review the guidance in light of the emergence of looser lending standards observed by examiners.
The guidance states that banks may face increased regulatory scrutiny if they meet one of two thresholds: 1. Total CRE loans are at least 300% of risk-based capital and total CRE loans have grown by more than 50% over the last three years; 2. Total construction and land development (C&D) loans are at least 100% of risk-based capital. C&D loans are a component of total CRE loans. As of the end of 2015, 488 institutions met at least one of the criteria.
The guidance defines CRE loans as the summation of four different loan types reported in call reports: 1. Construction, land development, and other land loans; 2. Multifamily residential property loans; 3. Loans secured by non-owner-occupied nonfarm nonresidential properties; and 4. Loans not secured by real estate that are used to finance commercial real estate or construction and land development activities.
While the statement has focused investors on commercial real estate concentrations at community banks, we believe that the market has over-reacted as this is not new guidance but in fact, guidance that was issued in 2006. We believe that operating above the stated CRE concentrations, however, will not necessarily require an institution to raise more capital or slow loan growth. We believe that banks are instead evaluated on a case-by-case basis, and can operate with higher concentrations as long as they demonstrate robust risk management practices,
| | |
| 14 | | www.emeraldmutualfunds.com |
| | |
| Emerald Banking and Finance Fund | | Manager Commentary |
| | April 30, 2016 (Unaudited) |
including conducting regular appraisals, analyzing borrowers’ ability to repay credits, evaluating local economic conditions, and operating with enhanced reporting and systems.
On the energy front, we believe banks will continue to build their energy-related allowance for loan losses considerably in the second half of 2016 and more reserve-building could come later in 2017, as the impact of job cuts at oil and gas companies begins to wear on certain markets. Over the last six months, banks have steadily built their energy-related provisions as oil prices have remained depressed. Banks exposed to energy have increased provisioning to cushion the blow of an expected spike in defaults due to low oil prices. Banks had built a mountain of reserves from the 2008 credit crisis, negating the need for provisioning in recent years and making any increase appear more dramatic. Overall, the industry increased provisions for loan and lease losses by 42.39% in the fourth quarter of 2015, the largest quarter-over-quarter increase since the fourth quarter of 2007.(6) While we have not seen a great deal of losses nor do we believe there will be a large amount of losses, we have seen increased loan-loss reserves to guard against a prolonged slump in oil prices. Such prices started to fall in the summer of 2014 and, aside from modest recoveries at different points, they remain depressed. Oil prices have recently traded between $40 to $45 dollars per barrel, less than half of the level that they were at in early 2014.
Energy companies have already made significant headcount reductions, particularly in the area of the drilling oil and gas wells subsector, which reported a 38.4% year-over-year decline in jobs through September 2015, according to the Bureau of Labor Statistics. Additionally, support activity jobs in the oil and gas industry were 22.3% lower year over year in September 2015, and the oil and gas extraction category saw a 4.6% decline. We believe that if energy prices remain depressed for an extended period of time, stress in the energy sector could spill over to other lending segments if laid-off workers struggle to gain new employment. We therefore have a cautious view on commercial real estate and consumer loans in energy exposed geographies in the second half of 2016.
As community banks continued to deliver better loan growth rates than their large cap peers we remained focused on the profitability of these loans as well as the quality of the loans. During the first quarter earnings season, most community bank executives continued to report that credit quality remained strong and while they saw competition on pricing they had not experienced deterioration in credit quality. In fact, the only concerns that we have seen have been focused around energy related loans.
Market Outlook
Uncertainty has increased in the markets as investors worry that weak commodity prices and a global economic slowdown could push the U.S. economy into a recession. We, however, do not believe that we are heading for a recession in 2016. The U.S. economy continues to grow, though at an anemic pace in the first quarter of 2016, leaving the Fed cautious on rate increases. Gross Domestic Product expanded just 0.5% in the first quarter of 2016, according to the U.S. Department of Commerce, marking the weakest advance in two years.
As a result of the economic uncertainty, bank management teams have struggled with the decision to slow loan and deposit growth or growing the loan portfolio with lower yielding loans and increasing their overall costs of deposits to increase core deposits before rates move higher. While a handful of banks have built term funding in recent quarters to prepare for higher short-term rates, most institutions are shrinking the higher cost sources of funds. The prospect of rising rates indeed has prompted many institutions to consider what will happen to deposit costs when rates rise. The fourth quarter move higher in rates had no notable impact in the fourth quarter of 2015, as the cost of money market demand and other savings accounts hung just above zero in the period, according to an analysis of bank and thrift regulatory data by S&P Global Market Intelligence. Funding costs started dwindling in 2008, following the financial crisis that inflicted the banking sector and the Fed’s aggressive actions to bring down rates. Deposit costs drifted down further in ensuing years and have yet to rebound. As both consumers and businesses grew conservative following the crisis, increasingly opting to leave their money in bank accounts rather than spend it, most banks had little trouble gathering deposits in recent years and that remains the case early this year, according to several bankers’ commentary during the recent earnings season and ensuing conference presentations. We believe that since most banks are “flush” with deposits, many banks are likely to move gradually on raising payments to depositors when rates do eventually rise, yet they are widely expected to act more quickly to boost rates on loans in order to widen spreads, ramp up lending profitability and bolster margins.
A larger percentage of the banking industry consolidated in 2015, and we believe mergers and acquisitions activity will continue at a healthy pace in 2016 as persistently low interest rates and higher regulatory and compliance costs encourage banks to sell. The number of announced bank deals in 2015 actually declined from year-ago levels, dipping to 281 transactions from 287 deals a year earlier. While fewer deals surfaced in 2015, a greater percentage of the industry consolidated during the period. In 2015, announced bank deals equated to nearly 4.6% of banks in the industry, the highest percentage of consolidation since 2004. In 2014, announced bank deals equated to nearly 4.4% of banks in the industry. From 2004 to 2013, the measure ranged from 1.4% to 3.4%, according to SNL(7) data. In calendar year 2016, there have been 87 deal announcements as of April 30, according to S&P Global Market Intelligence, with an aggregate disclosed deal value of $7.24 billion and a median price-to-tangible book ratio of 129.61%. This was lower than the prior-year period, which saw 89 deal announcements with an aggregate disclosed deal value of $8.86 billion and a median price-to-tangible book ratio of 140.85%.
| | |
| Annual Report | April 30, 2016 | | 15 |
| | |
| Emerald Banking and Finance Fund | | Manager Commentary |
| | April 30, 2016 (Unaudited) |
We believe that the market remains in the early stages of a long term recovery in bank stocks and remain confident in our expectations for improved fundamentals and continued consolidation amongst the small-to-mid capitalization bank and thrift stocks. Our focus remains on seeking companies capable of producing above average organic growth, relatively stable net interest margins, and improving earnings power aided by lower efficiency ratios, with potential for accretive mergers & acquisitions activity, as we deploy Emerald’s 10-Step research process to seek out companies in this market environment that is poised for the potential of higher short-term interest rates.
| | |
| Top Five Contributors to Return Included | | Top Five Detractors to Return Included |
| LendingTree, Inc. | | LegacyTexas Financial Group, Inc. |
| Eagle Bancorp, Inc. | | Conifer Holdings Inc |
| ServisFirst Bancshares Inc | | First NBC Bank Holding Co. |
| FCB Financial Holdings, Inc. Class A | | SVB Financial Group |
| California Republic Bancorp | | BofI Holding, Inc |
| |
| Kenneth G. Mertz II, CFA | | Steven E. Russell, Esq. |
| Chief Investment Officer | | Portfolio Manager |
| Portfolio Manager | | |
| |
| Emerald Mutual Fund Advisers Trust | | |
The views of Emerald Mutual Fund Advisors Trust and information discussed in this commentary are as of the date of publication, are subject to change, and may not reflect the writer’s current views. The views expressed are those of the author only, and represent an assessment of market conditions at a specific point in time, are opinions only and should not be relied upon as investment advice regarding a particular investment or markets in general. Such information does not constitute a recommendation to buy or sell specific securities or investment vehicles. It should not be assumed that any investment will be profitable or will equal the performance of the Fund or any securities or any sectors mentioned in this letter. The subject matter contained in this letter has been derived from several sources believed to be reliable and accurate at the time of compilation. Neither Emerald Mutual Fund Advisors Trust nor the Fund accepts any liability for losses either direct or consequential caused by the use of this information.
The Emerald Banking and Finance Fund is distributed by ALPS Distributors, Inc.
Diversification does not assure a profit or protect against a loss.
The Fund is subject to investment risks, including possible loss of the principal amount invested and therefore is not suitable for all investors. The Fund may not achieve its objectives.
| (1) | Russell 2000® Index measures the performance of the small-cap segment of the U.S. equity universe. The Russell 2000® Index is a subset of the Russell 3000® Index representing approximately 10% of the total market capitalization of that index. It includes approximately 2000 of the smallest securities based on a combination of their market cap and current index membership. The Index is not actively managed and does not reflect any deduction of fees, expenses or taxes. An investor may not invest directly into the Index. |
| (2) | Russell 2000® Financial Services TR Index – is comprised of the smallest financial services companies in the Russell 3000 Index. The Index is not actively managed and does not reflect any deductions for fees, expense, or taxes. An investor may not invest directly in the Index. |
| (3) | SNL Small Cap Bank & Thrift Index: Includes all publicly traded (NYSE, NYSE Amex, NASDAQ, OTC BB, Pink Sheets) Banks and Thrifts in SNL’s coverage universe with $250M to $1B Total Common Market Capitalization as of most recent pricing data. Source: SNL Financial, data as of April 30, 2013. |
| (4) | Standard & Poor’s 500® Index is an unmanaged index of 500 common stocks chosen for the market size, liquidity and industry group representation. It is a market-value weighted index. The Index is not actively managed and does not reflect any deduction for fees, expenses or taxes. An investor may not invest directly into the Index. |
| (5) | SNL Data Dispatch, Friday, April 29, 2016 –“Community Banking ‘not for the fainthearted,’ but revenue opportunities exist” |
| (6) | SNL Data Dispatch, Wednesday March 16, 2016, “Provisioning Posts Largest QoQ Jump Since ’07 As Energy Worries Mount” |
| (7) | There is no specific article cite for the commentary. The data can be found in the SNL data base under the “Market Analysis – M&A Statistics” section of the database. |
| | |
| 16 | | www.emeraldmutualfunds.com |
| | |
| Emerald Banking and Finance Fund | | Manager Commentary |
| | April 30, 2016 (Unaudited) |
| | | | |
TOP TEN HOLDINGS (as a % of Net Assets)* | | |
Bank of the Ozarks, Inc. | | 3.97% | |
SVB Financial Group | | 3.80% | |
PrivateBancorp, Inc. | | 3.70% | |
Signature Bank | | 3.23% | |
Home BancShares, Inc. | | 3.10% | |
PacWest Bancorp | | 3.07% | |
Eagle Bancorp, Inc. | | 2.79% | |
California Republic Bancorp | | 2.62% | |
Western Alliance Bancorp | | 2.40% | |
Bridge Bancorp, Inc. | | 2.25% | |
Top Ten Holdings | | 30.93% | |
INDUSTRY SECTOR ALLOCATION (as a % of Net Assets) | |
Banks: Diversified | | 79.86% | |
Banks: Savings, Thrift & Mortgage Lending | | 7.65% | |
Commercial Banks | | 4.06% | |
Consumer Lending | | 1.87% | |
Real Estate Investment Trusts (REITs) | | 1.72% | |
Diversified Financial Services | | 1.64% | |
Insurance: Property-Casualty | | 1.41% | |
Securities Brokerage & Services | | 0.72% | |
Insurance | | 0.51% | |
Financial Data & Services | | 0.05% | |
Real Estate Management & Development | | 0.05% | |
Cash, Cash Equivalents, & Other Net Assets | | 0.46% | |
* Holdings are subject to change, and may not reflect the current or future position of the portfolio. | |
GROWTH OF $10,000 INVESTMENT IN THE FUND (for the period ended April 30, 2016)
Comparison of change in value of a $10,000 investment (includes applicable sales loads)
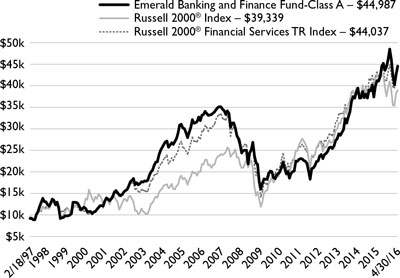
The chart represents historical performance of a hypothetical investment of $10,000 in the Fund since inception. Past performance does not guarantee future results. This chart does not reflect the deduction of taxes that a shareholder would pay on Fund distributions or the redemption of Fund shares.
AVERAGE ANNUAL TOTAL RETURN (for the period ended April 30, 2016)
| | | | | | | | | | | | | | | | | | | | | | | | | | | | |
| | | | | | | | | | | | | | | Since | | | Expense Ratio | |
| | | 1 Year | | | 3 Year | | | 5 Year | | | 10 Year | | | Inception1 | | | Gross2 | | | Net2 | |
Class A (NAV) | | | 8.39% | | | | 15.91% | | | | 13.97% | | | | 2.85% | | | | 8.42% | | | | 1.60% | | | | 1.60% | |
Class A (MOP) | | | 3.24% | | | | 14.05% | | | | 12.87% | | | | 2.35% | | | | 8.15% | | | | 1.60% | | | | 1.60% | |
Russell 2000® Index† | | | -5.94% | | | | 7.53% | | | | 6.98% | | | | 5.42% | | | | 7.40% | | | | | | | | | |
Russell 2000® Financial Services TR Index†† | | | 2.70% | | | | 8.91% | | | | 10.32% | | | | 3.60% | | | | 8.03% | | | | | | | | | |
Class C (NAV) | | | 7.67% | | | | 15.17% | | | | 13.26% | | | | 2.20% | | | | 8.53% | | | | 2.25% | | | | 2.25% | |
Class C (CDSC) | | | 6.67% | | | | 15.17% | | | | 13.26% | | | | 2.20% | | | | 8.53% | | | | 2.25% | | | | 2.25% | |
Russell 2000® Index† | | | -5.94% | | | | 7.53% | | | | 6.98% | | | | 5.42% | | | | 7.40% | | | | | | | | | |
Russell 2000® Financial Services TR Index†† | | | 2.70% | | | | 8.91% | | | | 10.32% | | | | 3.60% | | | | 8.03% | | | | | | | | | |
Investor Class | | | 8.36% | | | | 15.91% | | | | 14.07% | | | | – | | | | 12.14% | | | | 1.65% | | | | 1.65% | |
Russell 2000® Index† | | | -5.94% | | | | 7.53% | | | | 6.98% | | | | 5.42% | | | | 7.40% | | | | | | | | | |
Russell 2000® Financial Services TR Index†† | | | 2.70% | | | | 8.91% | | | | 10.32% | | | | 3.60% | | | | 8.03% | | | | | | | | | |
Institutional Class | | | 8.71% | | | | 16.29% | | | | – | | | | – | | | | 16.59% | | | | 1.30% | | | | 1.30% | |
Russell 2000® Index† | | | -5.94% | | | | 7.53% | | | | 6.98% | | | | 5.42% | | | | 7.40% | | | | | | | | | |
Russell 2000® Financial Services TR Index†† | | | 2.70% | | | | 8.91% | | | | 10.32% | | | | 3.60% | | | | 8.03% | | | | | | | | | |
| | |
| Annual Report | April 30, 2016 | | 17 |
| | |
| Emerald Banking and Finance Fund | | Manager Commentary |
| | April 30, 2016 (Unaudited) |
| | | | | | |
| | | The performance quoted represents past performance, does not guarantee future results and current performance may be lower or higher than the data quoted. The investment return and principal value of an investment will fluctuate so that shares, when redeemed, may be worth more or less than their original cost. Performance data current to the most recent month end may be obtained at www.emeraldmutualfunds.com. Performance shown for periods prior to March 16, 2012, reflects the performance of the Forward Banking & Finance Fund, a series of Forward Funds (as a result of a reorganization of the Forward Banking & Finance Fund into the Emerald Banking & Finance Fund). Maximum Offering Price (MOP) for Class A shares includes the Fund’s maximum sales charge of 4.75%. Performance shown at NAV does not include these sales charges and would have been lower had it been taken into account. A Contingent Deferred Sales Charge (CDSC) of 1.00% may apply to Class C shares redeemed within the first 12 months after a purchase. | | |
| | | 1 | | Inception Dates - Class A: 02/18/1997, Class C: 07/01/2000, Class Institutional: 03/19/2012, Class Investor: 03/16/2010 | | |
| | | 2 | | Emerald Mutual Fund Advisers Trust (“Emerald” or the “Adviser”) has agreed contractually to waive a portion of its fees and reimburse other expenses until August 31, 2016 in amounts necessary to limit the Fund’s operating expenses (exclusive of Acquired Fund Fees and Expenses, brokerage expenses, interest expenses, taxes and extraordinary expense) for Class A, Class C, Institutional Class, and Investor Class shares to an annual rate (as percentage of the Fund’s average daily net assets) of 1.84%, 2.49%, 1.54% and 1.89% respectively. The Adviser will be permitted to recover, on a class-by-class basis, expenses it has borne through the agreement described above to the extent that the Fund’s expenses in later periods fall below the annual rates set forth in the relevant agreement. The Fund will not be obligated to pay any such deferred fees and expenses more than three years after the year(s) in which the fees and expense were incurred. The Adviser may not discontinue this waiver prior to August 31, 2016, without the approval by the Fund’s Board of Trustees. Ratios as of the Prospectus dated August 31, 2015 and may differ from the ratios presented in the Financial Highlights. | | |
| | | † | | The Russell 2000® Index measures the performance of the small-cap segment of the U.S. equity universe. The Russell 2000® is a subset of the Russell 3000® Index representing approximately 10% of the total market capitalization of that index. It includes approximately 2000 of the smallest securities based on a combination of their market cap and current index membership. The index is not actively managed and does not reflect any deductions for fees, expenses or taxes. An investor may not invest directly into an index. | | |
| | | †† | | The Russell 2000® Financial Services TR Index is comprised of the smallest financial services companies in the Russell 3000 Index. The Index is not actively managed and does not reflect any deductions for fees, expense, or taxes. An investor may not invest directly in the Index. | | |
| | | Important Risks A fund that concentrates in a particular industry will involve a greater degree of risk than a fund with a more diversified portfolio. Investing in smaller companies generally will present greater investment risks, including: greater price volatility, greater sensitivity to changing economic conditions and less liquidity than the securities of larger, more mature companies. | | |
| | |
| | | |
18 | | www.emeraldmutualfunds.com |
| | |
| Emerald Funds | | Disclosure of Fund Expenses |
| | April 30, 2016 (Unaudited) |
As a shareholder of the Funds, you incur two types of costs: (1) transaction costs, including applicable sales charges (loads); and (2) ongoing costs, including management fees, distribution and service (12b-1) fees, shareholder services fees and other Fund expenses. This example is intended to help you understand your ongoing costs (in dollars) of investing in the Funds and to compare these costs with the ongoing costs of investing in other mutual funds. The example is based on an investment of $1,000 invested at the beginning of the (six-month) period and held for the entire period November 1, 2015 through April 30, 2016.
Actual Expenses
The first line for each share class of the Fund in the table below provides information about actual account values and actual expenses. You may use this information, together with the amount you invested, to estimate the expenses that you paid over the period. Simply divide your account value by $1,000 (for example, an $8,600 account value divided by $1,000 = 8.6), then multiply the result by the number in the applicable line under the heading titled “Expenses Paid During Period” to estimate the expenses you paid on your account during this period.
Hypothetical Example For Comparison Purposes
The second line for each share class of each Fund in the table below provides information about hypothetical account values and hypothetical expenses based on the Fund’s actual expense ratio and an assumed rate of return of 5% per year before expenses, which is not the Fund’s actual return. The hypothetical account values and expenses may not be used to estimate the actual ending account balance or expenses you paid for the period. You may use this information to compare the ongoing costs of investing in the Funds and other funds. To do so, compare this 5% hypothetical example with the 5% hypothetical examples that appear in the shareholder reports of other mutual funds.
Please note that the expenses shown in the table below are meant to highlight your ongoing costs only and do not reflect any transactional costs, such as sales charges (loads), redemption fees or exchange fees. Therefore, the second line for each share class of the Fund within the table is useful in comparing ongoing costs only, and will not help you determine the relative total costs of owning different funds. If these transactional costs were included, your costs would have been higher.
| | |
| Annual Report | April 30, 2016 | | 19 |
| | |
| Emerald Funds | | Disclosure of Fund Expenses |
| | April 30, 2016 (Unaudited) |
| | | | | | | | | | | | | | | | | | | | |
| | | Beginning Account Value 11/01/15 | | Ending Account Value 04/30/16 | | Expense Ratio(a) | | Expense Paid During Period 11/01/15 - 4/30/16(b) |
| Emerald Growth Fund | | | | | | | | |
Class A | | | | | | | | | | | | | | | | | | | | |
Actual | | | $ | 1,000.00 | | | | $ | 911.30 | | | | | 1.14 | % | | | $ | 5.42 | |
Hypothetical (5% return before expenses) | | | $ | 1,000.00 | | | | $ | 1,019.19 | | | | | 1.14 | % | | | $ | 5.72 | |
Class C | | | | | | | | | | | | | | | | | | | | |
Actual | | | $ | 1,000.00 | | | | $ | 908.00 | | | | | 1.79 | % | | | $ | 8.49 | |
Hypothetical (5% return before expenses) | | | $ | 1,000.00 | | | | $ | 1,015.96 | | | | | 1.79 | % | | | $ | 8.97 | |
Institutional Class | | | | | | | | | | | | | | | | | | | | |
Actual | | | $ | 1,000.00 | | | | $ | 912.70 | | | | | 0.84 | % | | | $ | 3.99 | |
Hypothetical (5% return before expenses) | | | $ | 1,000.00 | | | | $ | 1,020.69 | | | | | 0.84 | % | | | $ | 4.22 | |
Investor Class | | | | | | | | | | | | | | | | | | | | |
Actual | | | $ | 1,000.00 | | | | $ | 911.00 | | | | | 1.18 | % | | | $ | 5.61 | |
Hypothetical (5% return before expenses) | | | $ | 1,000.00 | | | | $ | 1,019.00 | | | | | 1.18 | % | | | $ | 5.92 | |
Emerald Small Cap Value Fund | | | | | | | | |
Class A | | | | | | | | | | | | | | | | | | | | |
Actual | | | $ | 1,000.00 | | | | $ | 976.90 | | | | | 1.35 | % | | | $ | 6.64 | |
Hypothetical (5% return before expenses) | | | $ | 1,000.00 | | | | $ | 1,018.15 | | | | | 1.35 | % | | | $ | 6.77 | |
Class C | | | | | | | | | | | | | | | | | | | | |
Actual | | | $ | 1,000.00 | | | | $ | 973.70 | | | | | 2.00 | % | | | $ | 9.81 | |
Hypothetical (5% return before expenses) | | | $ | 1,000.00 | | | | $ | 1,014.92 | | | | | 2.00 | % | | | $ | 10.02 | |
Institutional Class | | | | | | | | | | | | | | | | | | | | |
Actual | | | $ | 1,000.00 | | | | $ | 977.90 | | | | | 1.00 | % | | | $ | 4.92 | |
Hypothetical (5% return before expenses) | | | $ | 1,000.00 | | | | $ | 1,019.89 | | | | | 1.00 | % | | | $ | 5.02 | |
Investor Class | | | | | | | | | | | | | | | | | | | | |
Actual | | | $ | 1,000.00 | | | | $ | 977.10 | | | | | 1.25 | % | | | $ | 6.14 | |
Hypothetical (5% return before expenses) | | | $ | 1,000.00 | | | | $ | 1,018.65 | | | | | 1.25 | % | | | $ | 6.27 | |
Emerald Insights Fund | | | | | | | | |
Class A | | | | | | | | | | | | | | | | | | | | |
Actual | | | $ | 1,000.00 | | | | $ | 925.50 | | | | | 1.35 | % | | | $ | 6.46 | |
Hypothetical (5% return before expenses) | | | $ | 1,000.00 | | | | $ | 1,018.15 | | | | | 1.35 | % | | | $ | 6.77 | |
Class C | | | | | | | | | | | | | | | | | | | | |
Actual | | | $ | 1,000.00 | | | | $ | 921.90 | | | | | 2.00 | % | | | $ | 9.56 | |
Hypothetical (5% return before expenses) | | | $ | 1,000.00 | | | | $ | 1,014.92 | | | | | 2.00 | % | | | $ | 10.02 | |
Institutional Class | | | | | | | | | | | | | | | | | | | | |
Actual | | | $ | 1,000.00 | | | | $ | 927.60 | | | | | 1.05 | % | | | $ | 5.03 | |
Hypothetical (5% return before expenses) | | | $ | 1,000.00 | | | | $ | 1,019.64 | | | | | 1.05 | % | | | $ | 5.27 | |
Investor Class | | | | | | | | | | | | | | | | | | | | |
Actual | | | $ | 1,000.00 | | | | $ | 925.40 | | | | | 1.40 | % | | | $ | 6.70 | |
Hypothetical (5% return before expenses) | | | $ | 1,000.00 | | | | $ | 1,017.90 | | | | | 1.40 | % | | | $ | 7.02 | |
Emerald Banking and Finance Fund | | | | | | | | |
Class A | | | | | | | | | | | | | | | | | | | | |
| | |
| 20 | | www.emeraldmutualfunds.com |
| | |
| Emerald Funds | | Disclosure of Fund Expenses |
| | April 30, 2016 (Unaudited) |
| | | | | | | | | | | | | | | | | | | | |
| | | Beginning Account Value 11/01/15 | | Ending Account Value 04/30/16 | | Expense Ratio(a) | | Expense Paid During Period 11/01/15 - 4/30/16(b) |
Actual | | | $ | 1,000.00 | | | | $ | 966.30 | | | | | 1.47 | % | | | $ | 7.19 | |
Hypothetical (5% return before expenses) | | | $ | 1,000.00 | | | | $ | 1,017.55 | | | | | 1.47 | % | | | $ | 7.37 | |
Class C | | | | | | | | | | | | | | | | | | | | |
Actual | | | $ | 1,000.00 | | | | $ | 962.80 | | | | | 2.13 | % | | | $ | 10.39 | |
Hypothetical (5% return before expenses) | | | $ | 1,000.00 | | | | $ | 1,014.27 | | | | | 2.13 | % | | | $ | 10.67 | |
Institutional Class | | | | | | | | | | | | | | | | | | | | |
Actual | | | $ | 1,000.00 | | | | $ | 967.90 | | | | | 1.14 | % | | | $ | 5.58 | |
Hypothetical (5% return before expenses) | | | $ | 1,000.00 | | | | $ | 1,019.19 | | | | | 1.14 | % | | | $ | 5.72 | |
Investor Class | | | | | | | | | | | | | | | | | | | | |
Actual | | | $ | 1,000.00 | | | | $ | 966.40 | | | | | 1.46 | % | | | $ | 7.14 | |
Hypothetical (5% return before expenses) | | | $ | 1,000.00 | | | | $ | 1,017.60 | | | | | 1.46 | % | | | $ | 7.32 | |
| (a) | The Fund’s expense ratios have been based on the Fund’s most recent fiscal half-year expenses. |
| (b) | Expenses are equal to the Fund’s annualized expense ratio multiplied by the average account value over the period, multiplied by the number of days in the most recent fiscal half-year (182)/366 (to reflect the half-year period). | |
| | |
| Annual Report | April 30, 2016 | | 21 |
| | |
| Emerald Growth Fund | | Schedule of Investments |
| | April 30, 2016 |
| | | | | | | | |
| Shares | | | | | Value (Note 2) | |
| | |
| COMMON STOCKS: 97.64% | |
| | |
| Consumer Discretionary: 18.39% | |
| | 558,780 | | | American Eagle Outfitters, Inc. | | | $7,996,142 | |
| | 215,312 | | | Burlington Stores, Inc.(a) | | | 12,266,325 | |
| | 1,240,166 | | | Chegg, Inc.(a) | | | 5,630,354 | |
| | 26,173 | | | Churchill Downs, Inc. | | | 3,511,893 | |
| | 132,625 | | | Chuy’s Holdings, Inc.(a) | | | 4,050,367 | |
| | 296,677 | | | Dave & Buster’s Entertainment,
Inc.(a) | | | 11,481,400 | |
| | 174,696 | | | Diversified Restaurant Holdings,
Inc.(a) | | | 303,971 | |
| | 336,804 | | | Five Below, Inc.(a) | | | 14,044,727 | |
| | 52,760 | | | Hibbett Sports, Inc.(a) | | | 1,904,636 | |
| | 196,629 | | | Jack in the Box, Inc. | | | 13,282,289 | |
| | 360,040 | | | Kona Grill, Inc.(a) | | | 4,795,733 | |
| | 224,266 | | | Malibu Boats, Inc., Class A(a) | | | 3,947,082 | |
| | 304,623 | | | Marcus Corp. | | | 5,894,455 | |
| | 392,374 | | | MarineMax, Inc.(a) | | | 7,459,030 | |
| | 172,848 | | | Matthews International Corp., Class A | | | 9,098,719 | |
| | 95,830 | | | Nexstar Broadcasting Group, Inc., Class A | | | 4,918,954 | |
| | 352,607 | | | Ollie’s Bargain Outlet Holdings,
Inc.(a) | | | 9,326,455 | |
| | 434,880 | | | Penn National Gaming, Inc.(a) | | | 7,014,614 | |
| | 340,589 | | | Planet Fitness, Inc., Class A(a) | | | 5,231,447 | |
| | 209,891 | | | Red Robin Gourmet Burgers,
Inc.(a) | | | 13,613,530 | |
| | 801,650 | | | Sequential Brands Group, Inc.(a) | | | 4,449,157 | |
| | 296,085 | | | Steven Madden Ltd.(a) | | | 10,365,936 | |
| | 460,803 | | | Tile Shop Holdings, Inc.(a) | | | 8,220,725 | |
| | 385,958 | | | Tilly’s, Inc., Class A(a) | | | 2,427,676 | |
| | | | | | | 171,235,617 | |
| | |
| Energy: 1.06% | |
| | 190,999 | | | Parsley Energy, Inc., Class A(a) | | | 4,473,197 | |
| | 749,843 | | | Synergy Resources Corp.(a) | | | 5,413,866 | |
| | | | | | | 9,887,063 | |
| | |
| Financial Services: 18.32% | |
| | 213,982 | | | American Campus Communities, Inc., REIT | | | 9,575,695 | |
| | 211,510 | | | American Farmland Co., REIT | | | 1,461,534 | |
| | 179,313 | | | Atlas Financial Holdings, Inc.(a) | | | 3,150,529 | |
| | 390,795 | | | Bank of the Ozarks, Inc. | | | 16,139,834 | |
| | 533,175 | | | Bofl Holding, Inc.(a) | | | 10,860,775 | |
| | 87,000 | | | California Republic Bancorp(a) | | | 3,136,350 | |
| | 310,480 | | | CareTrust REIT, Inc. | | | 3,949,306 | |
| | 152,715 | | | ConnectOne Bancorp, Inc. | | | 2,628,225 | |
| | 169,020 | | | CubeSmart, REIT | | | 5,004,682 | |
| | 203,654 | | | Customers Bancorp, Inc.(a) | | | 5,290,931 | |
| | 256,298 | | | Education Realty Trust, Inc., REIT | | | 10,192,971 | |
| | 274,543 | | | FCB Financial Holdings, Inc., Class A(a) | | | 9,595,278 | |
| | 117,790 | | | First Choice Bank(a) | | | 1,825,745 | |
| | 68,399 | | | First Foundation, Inc.(a) | | | 1,542,397 | |
| | 148,203 | | | Howard Bancorp, Inc.(a) | | | 1,907,373 | |
| | | | | | | | |
| Shares | | | | | Value (Note 2) | |
| | |
| Financial Services (continued) | |
| | 142,835 | | | LendingTree, Inc.(a) | | | $12,779,447 | |
| | 397,651 | | | Live Oak Bancshares, Inc. | | | 6,259,027 | |
| | 171,312 | | | Marcus & Millichap, Inc.(a) | | | 4,296,505 | |
| | 144,926 | | | National Commerce Corp.(a) | | | 3,468,079 | |
| | 245,890 | | | Opus Bank | | | 8,881,547 | |
| | 249,359 | | | Pacific Premier Bancorp, Inc.(a) | | | 5,800,090 | |
| | 79,536 | | | Pinnacle Financial Partners, Inc. | | | 3,910,785 | |
| | 158,477 | | | PrivateBancorp, Inc. | | | 6,594,228 | |
| | 197,838 | | | QTS Realty Trust, Inc., REIT, Class A | | | 9,579,316 | |
| | 60,670 | | | Sovran Self Storage, Inc., REIT | | | 6,444,367 | |
| | 461,435 | | | Virtu Financial, Inc., Class A | | | 9,620,920 | |
| | 295,980 | | | Walker & Dunlop, Inc.(a) | | | 6,526,359 | |
| | 14,925 | | | Whitestone REIT | | | 200,443 | |
| | | | | | | 170,622,738 | |
| | |
| Health Care: 20.72% | |
| | 218,343 | | | Acadia Healthcare Co., Inc.(a) | | | 13,797,094 | |
| | 340,958 | | | Adamas Pharmaceuticals, Inc.(a) | | | 5,755,371 | |
| | 225,783 | | | Aimmune Therapeutics, Inc.(a) | | | 2,923,890 | |
| | 55,700 | | | Alder Biopharmaceuticals, Inc.(a) | | | 1,478,835 | |
| | 1,350,984 | | | Amicus Therapeutics, Inc.(a) | | | 10,091,850 | |
| | 69,460 | | | Anacor Pharmaceuticals, Inc.(a) | | | 4,357,920 | |
| | 313,431 | | | Applied Genetic Technologies
Corp.(a) | | | 4,924,001 | |
| | 439,768 | | | AtriCure, Inc.(a) | | | 6,992,311 | |
| | 130,330 | | | Bluebird Bio, Inc.(a) | | | 5,780,136 | |
| | 132,729 | | | Cantel Medical Corp. | | | 8,891,516 | |
| | 268,526 | | | Cepheid(a) | | | 7,663,732 | |
| | 25,730 | | | Greatbatch, Inc.(a) | | | 895,404 | |
| | 290,993 | | | Impax Laboratories, Inc.(a) | | | 9,704,617 | |
| | 346,207 | | | Imprivata, Inc.(a) | | | 4,196,029 | |
| | 408,287 | | | Insmed, Inc.(a) | | | 4,960,687 | |
| | 8,296 | | | Intercept Pharmaceuticals, Inc.(a) | | | 1,250,539 | |
| | 138,144 | | | Intrexon Corp.(a) | | | 3,692,589 | |
| | 523,946 | | | K2M Group Holdings, Inc.(a) | | | 8,519,362 | |
| | 156,593 | | | LDR Holding Corp.(a) | | | 4,220,181 | |
| | 345,320 | | | MacroGenics, Inc.(a) | | | 7,099,779 | |
| | 68,271 | | | NeoGenomics, Inc.(a) | | | 555,726 | |
| | 237,838 | | | Neos Therapeutics, Inc.(a) | | | 2,157,191 | |
| | 188,180 | | | Neurocrine Biosciences, Inc.(a) | | | 8,577,244 | |
| | 24,993 | | | Omnicell, Inc.(a) | | | 796,277 | |
| | 100,538 | | | PAREXEL International Corp.(a) | | | 6,142,872 | |
| | 371,068 | | | Portola Pharmaceuticals, Inc.(a) | | | 8,816,576 | |
| | 26,806 | | | Presbia PLC(a) | | | 105,884 | |
| | 278,419 | | | Relypsa, Inc.(a) | | | 5,039,384 | |
| | 94,332 | | | Spark Therapeutics, Inc.(a) | | | 3,385,575 | |
| | 304,582 | | | Teladoc, Inc.(a) | | | 3,700,671 | |
| | 629,962 | | | Veeva Systems, Inc., Class A(a) | | | 17,330,255 | |
| | 180,649 | | | WellCare Health Plans, Inc.(a) | | | 16,256,604 | |
| | 371,977 | | | ZIOPHARM Oncology, Inc.(a) | | | 2,923,739 | |
| | | | | | | 192,983,841 | |
| | |
| 22 | | www.emeraldmutualfunds.com |
| | |
| Emerald Growth Fund | | Schedule of Investments |
| | April 30, 2016 |
| | | | | | |
| Shares | | | | Value (Note 2) | |
| |
Materials & Processing: 7.02% | |
| 387,055 | | Apogee Enterprises, Inc. | | | $16,039,559 | |
| 493,637 | | Headwaters, Inc.(a) | | | 9,877,676 | |
| 435,435 | | Installed Building Products, Inc.(a) | | | 11,573,862 | |
| 310,843 | | Interface, Inc. | | | 5,290,548 | |
| 59,231 | | Masonite International Corp.(a) | | | 4,007,570 | |
| 392,748 | | Trex Co., Inc.(a) | | | 18,635,893 | |
| | | | | 65,425,108 | |
|
| |
Producer Durables: 5.98% | | | | |
| 110,142 | | Blue Bird Corp.(a) | | | 1,190,635 | |
| 244,464 | | Kforce, Inc. | | | 4,647,261 | |
| 336,190 | | Knoll, Inc. | | | 7,850,036 | |
| 379,933 | | Korn/Ferry International | | | 10,311,382 | |
| 222,681 | | Spirit Airlines, Inc.(a) | | | 9,782,376 | |
| 122,335 | | Tennant Co. | | | 6,533,912 | |
| 517,342 | | Tutor Perini Corp.(a) | | | 8,184,350 | |
| 129,027 | | Virgin America, Inc.(a) | | | 7,185,514 | |
| | | | | 55,685,466 | |
|
| |
Technology: 23.17% | | | | |
| 410,081 | | Alarm.com Holdings, Inc.(a) | | | 9,353,948 | |
| 267,966 | | Applied Optoelectronics, Inc.(a) | | | 3,001,219 | |
| 173,920 | | Cavium, Inc.(a) | | | 8,586,430 | |
| 289,476 | | ChannelAdvisor Corp.(a) | | | 3,606,871 | |
| 555,632 | | Ciena Corp.(a) | | | 9,351,287 | |
| 278,629 | | comScore, Inc.(a) | | | 8,531,620 | |
| 278,954 | | Cornerstone OnDemand, Inc.(a) | | | 9,582,070 | |
| 233,196 | | EPAM Systems, Inc.(a) | | | 17,006,984 | |
| 294,311 | | Everyday Health, Inc.(a) | | | 1,707,004 | |
| 314,845 | | Gigamon, Inc.(a) | | | 10,260,799 | |
| 406,824 | | GTT Communications, Inc.(a) | | | 6,501,047 | |
| 148,119 | | Guidewire Software, Inc.(a) | | | 8,438,339 | |
| 310,637 | | Imperva, Inc.(a) | | | 14,438,408 | |
| 50,834 | | Inphi Corp.(a) | | | 1,508,245 | |
| 85,585 | | IPG Photonics Corp.(a) | | | 7,417,652 | |
| 253,570 | | Lumentum Holdings, Inc.(a) | | | 6,415,321 | |
| 217,849 | | M/A-COM Technology Solutions Holdings, Inc.(a) | | | 8,907,846 | |
| 182,415 | | Mercury Systems, Inc.(a) | | | 3,834,363 | |
| 367,767 | | Microsemi Corp.(a) | | | 12,426,847 | |
| 103,006 | | MicroStrategy, Inc., Class A(a) | | | 18,471,036 | |
| 311,360 | | Model N, Inc.(a) | | | 3,325,325 | |
| 216,879 | | Proofpoint, Inc.(a) | | | 12,635,370 | |
| 319,061 | | Qlik Technologies, Inc.(a) | | | 9,823,888 | |
| 221,026 | | Reis, Inc. | | | 5,563,224 | |
| 505,729 | | Sigma Designs, Inc.(a) | | | 3,201,265 | |
| 249,760 | | Super Micro Computer, Inc.(a) | | | 6,721,042 | |
| 74,132 | | Synchronoss Technologies,
Inc.(a) | | | 2,303,281 | |
| 500,677 | | Telenav, Inc.(a) | | | 2,853,859 | |
| | | | | 215,774,590 | |
| | | | | | |
| Shares | | | | Value (Note 2) | |
| |
Utilities: 2.98% | | | | |
| 1,284,109 | | 8x8, Inc.(a) | | | $14,561,796 | |
| 2,824,405 | | Vonage Holdings Corp.(a) | | | 13,189,971 | |
| | | | | 27,751,767 | |
| | |
| | Total Common Stocks | | | | |
| | (Cost $911,999,829) | | | 909,366,190 | |
|
| |
SHORT TERM INVESTMENTS: 1.75% | | | | |
| 16,331,904 | | Dreyfus Government Cash Management Fund - Institutional Class 0.201% (7-Day Yield) | | | 16,331,904 | |
| | |
| | Total Short Term Investments | | | | |
| | (Cost $16,331,904) | | | 16,331,904 | |
| |
| |
Total Investments: 99.39% | | | | |
(Cost $928,331,733) | | | 925,698,094 | |
| |
Other Assets In Excess Of Liabilities: 0.61% | | | 5,695,567 | |
| |
Net Assets: 100.00% | | | $931,393,661 | |
| |
| (a) | Non-income producing security. |
For Fund compliance purposes, the Fund’s industry classifications refer to any one or more of the industry sub-classifications used by one or more widely recognized market indexes or ratings group indexes, and/or as defined by Fund management. This definition may not apply for purposes of this report, which may combine industry sub-classifications for reporting ease. Industries are shown as a percentage of net assets.
See Notes to Financial Statements.
| | |
| Annual Report | April 30, 2016 | | 23 |
| | |
| Emerald Small Cap Value Fund | | Schedule of Investments |
| | April 30, 2016 |
| | | | | | |
| Shares | | Value (Note 2) | |
| |
COMMON STOCKS: 95.13% | |
| |
Consumer Discretionary: 17.26% | |
| 6,012 | | Big Lots, Inc. | | | $275,710 | |
| 19,230 | | Carriage Services, Inc. | | | 469,789 | |
| 29,202 | | Gray Television, Inc.(a) | | | 375,246 | |
| 20,851 | | Interval Leisure Group, Inc. | | | 294,416 | |
| 14,625 | | MDC Partners, Inc., Class A | | | 296,010 | |
| 23,222 | | Party City Holdco, Inc.(a) | | | 332,771 | |
| 27,110 | | Stoneridge, Inc.(a) | | | 386,589 | |
| 14,306 | | Viad Corp. | | | 425,603 | |
| | | | | 2,856,134 | |
|
| |
Financial Services: 36.30% | |
| 66,762 | | Cedar Realty Trust, Inc., REIT | | | 461,993 | |
| 18,282 | | Corporate Office Properties Trust, REIT | | | 469,482 | |
| 11,268 | | CyrusOne, Inc., REIT | | | 497,256 | |
| 17,345 | | Employers Holdings, Inc. | | | 515,147 | |
| 144,469 | | Everi Holdings, Inc.(a) | | | 242,708 | |
| 18,082 | | First Financial Bancorp | | | 352,599 | |
| 18,663 | | First Merchants Corp. | | | 478,705 | |
| 18,244 | | Flushing Financial Corp. | | | 363,968 | |
| 16,207 | | Great Western Bancorp, Inc. | | | 510,844 | |
| 16,648 | | Live Oak Bancshares, Inc. | | | 262,040 | |
| 10,741 | | Opus Bank | | | 387,965 | |
| 20,662 | | Provident Financial Services, Inc. | | | 412,827 | |
| 24,821 | | Ramco-Gershenson Properties Trust, REIT | | | 439,580 | |
| 36,745 | | Real Industry, Inc.(a) | | | 324,826 | |
| 2,748 | | SVB Financial Group(a) | | | 286,561 | |
| | | | | 6,006,501 | |
|
| |
Health Care: 1.61% | |
| 17,279 | | Horizon Pharma PLC(a) | | | 265,578 | |
|
| |
Materials & Processing: 5.21% | |
| 11,281 | | Koppers Holdings, Inc.(a) | | | 283,492 | |
| 37,475 | | Mercer International, Inc. | | | 314,790 | |
| 10,443 | | Steel Dynamics, Inc. | | | 263,268 | |
| | | | | 861,550 | |
|
| |
Producer Durables: 13.33% | |
| 17,312 | | Darling Ingredients, Inc.(a) | | | 250,851 | |
| 13,315 | | Ducommun, Inc.(a) | | | 211,842 | |
| 8,509 | | EMCOR Group, Inc. | | | 412,516 | |
| 4,885 | | EnerSys | | | 285,137 | |
| 10,463 | | Generac Holdings, Inc.(a) | | | 398,850 | |
| 15,575 | | MasTec, Inc.(a) | | | 352,930 | |
| 4,539 | | Regal Beloit Corp. | | | 292,402 | |
| | | | | 2,204,528 | |
|
| |
Technology: 14.95% | |
| 16,308 | | ARRIS International PLC(a) | | | 371,333 | |
| 13,879 | | Microsemi Corp.(a) | | | 468,971 | |
| | | | | | |
| Shares | | Value (Note 2) | |
| |
Technology (continued) | |
| 24,320 | | Perficient, Inc.(a) | | | $507,802 | |
| 27,587 | | Rudolph Technologies, Inc.(a) | | | 382,633 | |
| 5,879 | | Synaptics, Inc.(a) | | | 420,642 | |
| 54,578 | | Xcerra Corp.(a) | | | 322,010 | |
| | | | | 2,473,391 | |
|
| |
Utilities: 6.47% | | | | |
| 10,878 | | Great Plains Energy, Inc. | | | 339,720 | |
| 74,194 | | Vonage Holdings Corp.(a) | | | 346,486 | |
| 17,900 | | West Corp. | | | 383,597 | |
| | | | | 1,069,803 | |
| | |
| | Total Common Stocks | | | | |
| | (Cost $14,359,349) | | | 15,737,485 | |
|
| |
SHORT TERM INVESTMENTS: 4.62% | |
| 764,627 | | Dreyfus Government Cash Management Fund - Institutional Class 0.201% (7-Day Yield) | | | 764,627 | |
| | |
| | Total Short Term Investments | | | | |
| | (Cost $764,627) | | | 764,627 | |
| |
| |
Total Investments: 99.75% | | | | |
(Cost $15,123,976) | | | 16,502,112 | |
| |
Other Assets In Excess Of Liabilities: 0.25% | | | 40,897 | |
| |
Net Assets: 100.00% | | | $16,543,009 | |
| |
| (a) | Non-income producing security. |
For Fund compliance purposes, the Fund’s industry classifications refer to any one or more of the industry sub-classifications used by one or more widely recognized market indexes or ratings group indexes, and/or as defined by Fund management. This definition may not apply for purposes of this report, which may combine industry sub-classifications for reporting ease. Industries are shown as a percentage of net assets.
See Notes to Financial Statements.
| | |
| 24 | | www.emeraldmutualfunds.com |
| | |
| Emerald Insights Fund | | Schedule of Investments |
| | April 30, 2016 |
| | | | | | |
| Shares | | Value (Note 2) | |
| |
COMMON STOCKS: 97.09% | | | | |
| |
Consumer Discretionary: 23.64% | | | | |
| 1,104 | | AO Smith Corp. | | | $85,251 | |
| 2,213 | | Brunswick Corp. | | | 106,290 | |
| 3,926 | | Dollar General Corp. | | | 321,579 | |
| 3,794 | | Foot Locker, Inc. | | | 233,103 | |
| 2,463 | | Harman International Industries, Inc. | | | 189,060 | |
| 9,011 | | Hilton Worldwide Holdings, Inc. | | | 198,692 | |
| 8,757 | | IMAX Corp.(a) | | | 280,224 | |
| 2,620 | | Jack in the Box, Inc. | | | 176,981 | |
| 3,334 | | MGM Resorts International(a) | | | 71,014 | |
| 2,836 | | Norwegian Cruise Line Holdings Ltd.(a) | | | 138,652 | |
| 492 | | O’Reilly Automotive, Inc.(a) | | | 129,239 | |
| 4,740 | | Ross Stores, Inc. | | | 269,137 | |
| 2,533 | | S&P Global, Inc. | | | 270,651 | |
| 1,229 | | Signet Jewelers Ltd. | | | 133,420 | |
| 638 | | Ulta Salon Cosmetics & Fragrance, Inc.(a) | | | 132,883 | |
| 2,287 | | Under Armour, Inc., Class A(a) | | | 100,491 | |
| 2,287 | | Under Armour, Inc., Class C(a) | | | 93,310 | |
| 1,234 | | Whirlpool Corp. | | | 214,889 | |
| | | | | 3,144,866 | |
|
| |
Consumer Staples: 6.09% | | | | |
| 660 | | Carlisle Cos., Inc. | | | 67,254 | |
| 3,394 | | Hain Celestial Group, Inc.(a) | | | 142,073 | |
| 1,934 | | Mead Johnson Nutrition Co. | | | 168,548 | |
| 1,552 | | Monster Beverage Corp.(a) | | | 223,830 | |
| 5,186 | | WhiteWave Foods Co.(a) | | | 208,529 | |
| | | | | 810,234 | |
|
| |
Energy: 3.21% | |
| 2,844 | | Cabot Oil & Gas Corp. | | | 66,549 | |
| 1,529 | | Diamondback Energy, Inc.(a) | | | 132,381 | |
| 3,335 | | Newfield Exploration Co.(a) | | | 120,894 | |
| 3,419 | | Spectra Energy Corp. | | | 106,912 | |
| | | | | 426,736 | |
|
| |
Financial Services: 10.44% | | | | |
| 1,465 | | Affiliated Managers Group, Inc.(a) | | | 249,519 | |
| 1,008 | | Alliance Data Systems Corp.(a) | | | 204,936 | |
| 3,092 | | Bank of the Ozarks, Inc. | | | 127,700 | |
| 2,970 | | BankUnited, Inc. | | | 102,465 | |
| 2,220 | | CubeSmart, REIT | | | 65,734 | |
| 2,450 | | Mid-America Apartment Communities, Inc., REIT | | | 234,490 | |
| 3,750 | | PacWest Bancorp | | | 149,925 | |
| 2,436 | | SVB Financial Group(a) | | | 254,026 | |
| | | | | 1,388,795 | |
|
| |
Health Care: 12.73% | | | | |
| 2,182 | | Abbott Laboratories | | | 84,880 | |
| 1,354 | | Acadia Healthcare Co., Inc.(a) | | | 85,559 | |
| 5,660 | | Akorn, Inc.(a) | | | 144,047 | |
| | | | | | |
| Shares | | Value (Note 2) | |
| |
Health Care (continued) | | | | |
| 1,758 | | Alnylam Pharmaceuticals, Inc.(a) | | | $117,856 | |
| 9,412 | | Amicus Therapeutics, Inc.(a) | | | 70,308 | |
| 1,851 | | Bluebird Bio, Inc.(a) | | | 82,092 | |
| 4,509 | | Cepheid(a) | | | 128,687 | |
| 7,735 | | Horizon Pharma PLC(a) | | | 118,887 | |
| 3,625 | | Impax Laboratories, Inc.(a) | | | 120,894 | |
| 810 | | Intercept Pharmaceuticals, Inc.(a) | | | 122,099 | |
| 6,310 | | Intrexon Corp.(a) | | | 168,666 | |
| 1,665 | | VCA, Inc.(a) | | | 104,845 | |
| 7,653 | | Veeva Systems, Inc., Class A(a) | | | 210,534 | |
| 1,496 | | WellCare Health Plans, Inc.(a) | | | 134,625 | |
| | | | | 1,693,979 | |
|
| |
Materials & Processing: 8.31% | | | | |
| 731 | | Acuity Brands, Inc. | | | 178,284 | |
| 4,573 | | Axalta Coating Systems Ltd.(a) | | | 130,193 | |
| 3,403 | | Crown Holdings, Inc.(a) | | | 180,223 | |
| 510 | | Martin Marietta Materials, Inc. | | | 86,307 | |
| 6,385 | | Masco Corp. | | | 196,083 | |
| 3,295 | | Steel Dynamics, Inc. | | | 83,067 | |
| 2,335 | | Vulcan Materials Co. | | | 251,316 | |
| | | | | 1,105,473 | |
|
| |
Producer Durables: 10.64% | | | | |
| 1,036 | | Dycom Industries, Inc.(a) | | | 73,142 | |
| 3,450 | | Korn/Ferry International | | | 93,633 | |
| 2,355 | | Middleby Corp.(a) | | | 258,202 | |
| 1,441 | | Old Dominion Freight Line, Inc.(a) | | | 95,178 | |
| 1,220 | | Snap-on, Inc. | | | 194,322 | |
| 9,023 | | Southwest Airlines Co. | | | 402,516 | |
| 3,592 | | Wabtec Corp. | | | 297,884 | |
| | | | | 1,414,877 | |
|
| |
Technology: 22.03% | | | | |
| 4,520 | | Activision Blizzard, Inc. | | | 155,804 | |
| 1,725 | | ARRIS International PLC(a) | | | 39,278 | |
| 1,255 | | Avago Technologies Ltd. | | | 182,916 | |
| 2,597 | | Cavium, Inc.(a) | | | 128,214 | |
| 980 | | Electronic Arts, Inc.(a) | | | 60,613 | |
| 1,813 | | EPAM Systems, Inc.(a) | | | 132,222 | |
| 384 | | Equinix, Inc., REIT | | | 126,854 | |
| 12,866 | | Fitbit, Inc., Class A(a) | | | 234,805 | |
| 2,093 | | Intuit, Inc. | | | 211,163 | |
| 1,438 | | IPG Photonics Corp.(a) | | | 124,631 | |
| 824 | | Lam Research Corp. | | | 62,954 | |
| 658 | | LinkedIn Corp., Class A(a) | | | 82,454 | |
| 14,642 | | ON Semiconductor Corp.(a) | | | 138,660 | |
| 1,689 | | Palo Alto Networks, Inc.(a) | | | 254,819 | |
| 4,085 | | PayPal Holdings, Inc.(a) | | | 160,050 | |
| 3,722 | | Proofpoint, Inc.(a) | | | 216,844 | |
| 2,364 | | SBA Communications Corp., Class A(a) | | | 243,587 | |
| 2,597 | | ServiceNow, Inc.(a) | | | 185,634 | |
| | |
| Annual Report | April 30, 2016 | | 25 |
| | |
| Emerald Insights Fund | | Schedule of Investments |
| | April 30, 2016 |
| | | | | | |
| Shares | | Value (Note 2) | |
| |
Technology (continued) | | | | |
| 2,832 | | Skyworks Solutions, Inc. | | | $189,234 | |
| | | | | 2,930,736 | |
| | |
| | Total Common Stocks | | | | |
| | (Cost $12,786,985) | | | 12,915,696 | |
|
MASTER LIMITED PARTNERSHIPS: 1.83% | |
| |
Financial Services: 1.83% | |
| 6,749 | | Lazard Ltd., Class A | | | 243,302 | |
| | |
| | Total Master Limited Partnerships | | | | |
| | (Cost $311,184) | | | 243,302 | |
|
| |
SHORT TERM INVESTMENTS: 2.00% | |
| 266,809 | | Dreyfus Government Cash Management Fund - Institutional Class 0.201% (7-Day Yield) | | | 266,809 | |
| | |
| | Total Short Term Investments | | | | |
| | (Cost $266,809) | | | 266,809 | |
| |
| |
Total Investments: 100.92% | | | | |
(Cost $13,364,978) | | | 13,425,807 | |
| |
Liabilities In Excess Of Other Assets: (0.92)% | | | (122,599) | |
| |
Net Assets: 100.00% | | | $13,303,208 | |
| |
| (a) | Non-income producing security. |
For Fund compliance purposes, the Fund’s industry classifications refer to any one or more of the industry sub-classifications used by one or more widely recognized market indexes or ratings group indexes, and/or as defined by Fund management. This definition may not apply for purposes of this report, which may combine industry sub- classifications for reporting ease. Industries are shown as a percentage of net assets.
See Notes to Financial Statements.
| | |
| 26 | | www.emeraldmutualfunds.com |
| | |
| Emerald Banking and Finance Fund | | Schedule of Investments |
| | April 30, 2016 |
| | | | | | |
| Shares | | Value (Note 2) | |
| |
COMMON STOCKS: 99.54% | | | | |
| |
Financial Services: 99.54% | | | | |
| |
Banks: Diversified: 79.86% | | | | |
| 100,000 | | 1st Source Corp. | | | $3,444,000 | |
| 113,100 | | Alerus Financial Corp. | | | 2,075,385 | |
| 53,798 | | American Business Bank(a) | | | 1,627,380 | |
| 171,237 | | Ameris Bancorp | | | 5,376,842 | |
| 293,286 | | Bank of the Ozarks, Inc. | | | 12,112,712 | |
| 180,325 | | BankUnited, Inc. | | | 6,221,212 | |
| 106,400 | | Baylake Corp. | | | 1,854,552 | |
| 171,605 | | BNC Bancorp | | | 3,837,088 | |
| 225,409 | | Bridge Bancorp, Inc. | | | 6,861,450 | |
| 221,489 | | California Republic Bancorp(a) | | | 7,984,678 | |
| 104,914 | | Cardinal Financial Corp. | | | 2,321,747 | |
| 203,323 | | CenterState Banks, Inc. | | | 3,312,132 | |
| 190,470 | | ConnectOne Bancorp, Inc. | | | 3,277,989 | |
| 922 | | Consumers Bancorp, Inc. | | | 14,936 | |
| 69,144 | | CU Bancorp(a) | | | 1,593,078 | |
| 190,303 | | Customers Bancorp, Inc.(a) | | | 4,944,072 | |
| 167,748 | | Eagle Bancorp, Inc.(a) | | | 8,504,824 | |
| 228,773 | | Equity Bancshares, Inc.,
Class A(a) | | | 4,797,370 | |
| 86,853 | | Farmers National Banc Corp. | | | 807,733 | |
| 191,017 | | FCB Financial Holdings, Inc., Class A(a) | | | 6,676,044 | |
| 13,963 | | First Bank(a) | | | 100,394 | |
| 119,800 | | First Business Financial Services, Inc. | | | 3,032,138 | |
| 142,037 | | First Foundation, Inc.(a) | | | 3,202,934 | |
| 149,550 | | First NBC Bank Holding Co.(a) | | | 3,251,217 | |
| 85,800 | | First of Long Island Corp. | | | 2,626,338 | |
| 246,394 | | Freedom Bank of Virginia(a) | | | 2,168,267 | |
| 24,096 | | FVC Bankcorp, Inc.(a) | | | 434,933 | |
| 109,516 | | Great Western Bancorp, Inc. | | | 3,451,944 | |
| 22,506 | | Guaranty Bancorp | | | 369,549 | |
| 220,296 | | Home BancShares, Inc. | | | 9,470,525 | |
| 16,003 | | HopFed Bancorp, Inc. | | | 180,034 | |
| 114,296 | | Howard Bancorp, Inc.(a) | | | 1,470,990 | |
| 15,250 | | Independent Bank Corp. | | | 717,207 | |
| 50,000 | | Independent Bank Corporation | | | 757,500 | |
| 54,120 | | John Marshall Bank(a) | | | 875,391 | |
| 220,060 | | Live Oak Bancshares, Inc. | | | 3,463,744 | |
| 44,420 | | MainSource Financial Group, Inc. | | | 970,577 | |
| 141,177 | | MainStreet Bank(a) | | | 1,616,477 | |
| 259,003 | | Malvern Bancorp, Inc.(a) | | | 4,081,887 | |
| 87,881 | | Mercantile Bank Corp. | | | 2,119,690 | |
| 45,870 | | Meridian Bancorp, Inc. | | | 670,619 | |
| 120,788 | | Meta Financial Group, Inc. | | | 5,993,501 | |
| 239,209 | | National Commerce Corp.(a) | | | 5,724,271 | |
| 224 | | Oak Valley Bancorp | | | 2,137 | |
| 87,388 | | Old Line Bancshares, Inc. | | | 1,614,930 | |
| 140,001 | | Opus Bank | | | 5,056,836 | |
| 60,410 | | Pacific Mercantile Bancorp(a) | | | 453,679 | |
| 169,325 | | Pacific Premier Bancorp, Inc.(a) | | | 3,938,499 | |
| 234,512 | | PacWest Bancorp | | | 9,375,790 | |
| 133,412 | | Pinnacle Financial Partners, Inc. | | | 6,559,868 | |
| | | | | | |
| Shares | | Value (Note 2) | |
| |
Banks: Diversified (continued) | | | | |
| 271,170 | | PrivateBancorp, Inc. | | | $11,283,384 | |
| 70,000 | | Puget Sound Bancorp, Inc.(a) | | | 1,296,750 | |
| 30,000 | | QCR Holdings, Inc. | | | 773,100 | |
| 97,812 | | Renasant Corp. | | | 3,358,864 | |
| 750 | | RidgeStone Financial Services | | | 16,969 | |
| 481,505 | | Royal Bancshares of Pennsylvania, Inc., Class A(a) | | | 1,420,440 | |
| 128,065 | | ServisFirst Bancshares, Inc. | | | 6,311,043 | |
| 71,512 | | Signature Bank(a) | | | 9,856,499 | |
| 66,236 | | Simmons First National Corp., Class A | | | 3,093,221 | |
| 46,032 | | Southern First Bancshares,
Inc.(a) | | | 1,173,816 | |
| 20,598 | | Southern National Bancorp of Virginia, Inc. | | | 253,355 | |
| 111,196 | | SVB Financial Group(a) | | | 11,595,519 | |
| 50,000 | | Unity Bancorp, Inc. | | | 588,000 | |
| 187,675 | | WashingtonFirst Bankshares, Inc. | | | 4,166,385 | |
| 61,970 | | Webster Financial Corp. | | | 2,270,581 | |
| 106,242 | | West Town Bank & Trust(a) | | | 2,098,280 | |
| 200,144 | | Western Alliance Bancorp(a) | | | 7,321,268 | |
| 212,524 | | Yadkin Financial Corp. | | | 5,317,350 | |
| | | | | 243,591,914 | |
|
| |
Banks: Savings, Thrift & Mortgage Lending: 7.65% | |
| 225,594 | | Atlantic Coast Financial Corp.(a) | | | 1,448,313 | |
| 157,210 | | First Choice Bank(a) | | | 2,436,755 | |
| 125,475 | | First Resource Bank | | | 840,682 | |
| 82,750 | | Flushing Financial Corp. | | | 1,650,863 | |
| 103,401 | | Heritage Financial Corp. | | | 1,907,748 | |
| 11,680 | | Home Bancorp, Inc. | | | 326,106 | |
| 18,520 | | Home Federal Bancorp, Inc. | | | 412,996 | |
| 182,919 | | OceanFirst Financial Corp. | | | 3,563,262 | |
| 235,753 | | Sterling Bancorp | | | 3,852,204 | |
| 49,746 | | Sunshine Bancorp, Inc.(a) | | | 700,424 | |
| 30,890 | | Sussex Bancorp | | | 415,471 | |
| 169,608 | | WSFS Financial Corp. | | | 5,790,417 | |
| | | | | 23,345,241 | |
|
| |
Commercial Banks: 4.06% | | | | |
| 30,814 | | County Bancorp, Inc. | | | 644,013 | |
| 146,082 | | Franklin Financial Network,
Inc.(a) | | | 4,432,128 | |
| 107,712 | | Investar Holding Corp. | | | 1,636,145 | |
| 62,200 | | Seacoast Commerce Banc Holdings(a) | | | 951,660 | |
| 129,815 | | Stonegate Bank | | | 4,089,172 | |
| 39,610 | | Triumph Bancorp, Inc.(a) | | | 629,403 | |
| | | | | 12,382,521 | |
|
| |
Consumer Lending: 1.87% | | | | |
| 63,644 | | LendingTree, Inc.(a) | | | 5,694,229 | |
|
| |
Diversified Financial Services: 1.64% | | | | |
| 37,460 | | HomeStreet, Inc.(a) | | | 807,263 | |
| | |
| Annual Report | April 30, 2016 | | 27 |
| | |
| Emerald Banking and Finance Fund | | Schedule of Investments |
| | April 30, 2016 |
| | | | | | |
| Shares | | Value (Note 2) | |
| |
Diversified Financial Services (continued) | |
| 147,723 | | MidWestOne Financial Group, Inc. | | | $4,189,424 | |
| | | | | 4,996,687 | |
|
| |
Financial Data & Services: 0.05% | | | | |
| 5,000 | | Black Knight Financial Services, Inc., Class A(a) | | | 159,900 | |
|
| |
Insurance: 0.51% | | | | |
| 50,000 | | James River Group Holdings Ltd. | | | 1,548,000 | |
|
| |
Insurance: Property-Casualty: 1.41% | | | | |
| 100,000 | | AmTrust Financial Services, Inc. | | | 2,485,000 | |
| 30,000 | | Atlas Financial Holdings,
Inc.(a) | | | 527,100 | |
| 40,000 | | Federated National Holdings Co. | | | 762,000 | |
| 31,441 | | United Insurance Holdings Corp. | | | 512,803 | |
| | | | | 4,286,903 | |
|
| |
Real Estate Investment Trusts (REITs): 1.72% | |
| 45,360 | | American Campus Communities, Inc., REIT | | | 2,029,860 | |
| 71,710 | | American Farmland Co., REIT | | | 495,516 | |
| 49,360 | | Education Realty Trust, Inc., REIT | | | 1,963,047 | |
| 92,800 | | Independence Realty Trust, Inc., REIT | | | 665,376 | |
| 8,100 | | Whitestone REIT | | | 108,783 | |
| | | | | 5,262,582 | |
|
| |
Real Estate Management & Development: 0.05% | |
| 5,740 | | Marcus & Millichap, Inc.(a) | | | 143,959 | |
|
| |
Securities Brokerage & Services: 0.72% | |
| 106,086 | | Virtu Financial, Inc., Class A | | | 2,211,893 | |
| | |
| | Total Common Stocks | | | | |
| | (Cost $258,410,259) | | | 303,623,829 | |
|
| |
SHORT TERM INVESTMENTS: 0.99% | | | | |
| 3,008,620 | | Dreyfus Government Cash Management Fund - Institutional Class 0.201% (7-Day Yield) | | | 3,008,620 | |
| | |
| | Total Short Term Investments | | | | |
| | (Cost $3,008,620) | | | 3,008,620 | |
| |
| |
Total Investments: 100.53% | | | | |
(Cost $261,418,879) | | | 306,632,449 | |
| |
Liabilities In Excess Of Other Assets: (0.53)% | | | (1,607,365) | |
| |
Net Assets: 100.00% | | | $305,025,084 | |
| |
| (a) | Non-income producing security. |
For Fund compliance purposes, the Fund’s industry classifications refer to any one or more of the industry sub-classifications used by one or more widely recognized market indexes or ratings group indexes, and/or as defined by Fund management. This definition may not apply for purposes of this report, which may combine industry sub-classifications for reporting ease. Industries are shown as a percentage of net assets.
See Notes to Financial Statements.
| | |
| 28 | | www.emeraldmutualfunds.com |
| | |
| Emerald Funds | | Statements of Assets and Liabilities |
| | April 30, 2016 |
| | | | | | | | | | | | | | | | | | | | | | | | |
| | | Emerald Growth Fund | | | Emerald Small Cap Value Fund | | | Emerald Insights Fund | | | Emerald Banking and Finance Fund | |
ASSETS: | | | | | | | | | | | | | | | | | | | | | | | | |
Investments, at value | | | | $ | 925,698,094 | | | | | $ | 16,502,112 | | | | | $ | 13,425,807 | | | | | $ | 306,632,449 | |
Cash | | | | | 1,610 | | | | | | 152 | | | | | | 34 | | | | | | 325 | |
Receivable for investments sold | | | | | 8,561,573 | | | | | | – | | | | | | 432,956 | | | | | | – | |
Receivable for shares sold | | | | | 2,731,110 | | | | | | 858,704 | | | | | | – | | | | | | 455,263 | |
Receivable due from advisor | | | | | – | | | | | | 8,132 | | | | | | – | | | | | | – | |
Interest and dividends receivable | | | | | 133,716 | | | | | | 4 | | | | | | 5,383 | | | | | | 60,784 | |
Other assets | | | | | 85,766 | | | | | | 15,314 | | | | | | 18,233 | | | | | | 36,265 | |
| | | | | | | | | | | | | | | | | | | | | | | | |
Total Assets | | | | | 937,211,869 | | | | | | 17,384,418 | | | | | | 13,882,413 | | | | | | 307,185,086 | |
| | | | | | | | | | | | | | | | | | | | | | | | |
LIABILITIES: | | | | | | | | | | | | | | | | | | | | | | | | |
Payable for investments purchased | | | | | 1,952,842 | | | | | | – | | | | | | 543,125 | | | | | | 471,756 | |
Payable for shares redeemed | | | | | 2,792,810 | | | | | | 808,724 | | | | | | – | | | | | | 1,165,289 | |
Investment advisory fees payable | | | | | 474,630 | | | | | | – | | | | | | 890 | | | | | | 229,154 | |
Payable to fund accounting and administration | | | | | 73,123 | | | | | | 3,139 | | | | | | 2,600 | | | | | | 25,196 | |
Payable for distribution and service fees | | | | | 280,583 | | | | | | 804 | | | | | | 4,618 | | | | | | 169,657 | |
Payable for trustee fees and expenses | | | | | 5,856 | | | | | | 69 | | | | | | 83 | | | | | | 1,728 | |
Payable for transfer agency fees | | | | | 61,191 | | | | | | 4,484 | | | | | | 5,219 | | | | | | 30,346 | |
Payable for chief compliance officer fee | | | | | 7,365 | | | | | | 121 | | | | | | 105 | | | | | | 2,410 | |
Payable for principal financial officer fee | | | | | 1,227 | | | | | | 20 | | | | | | 17 | | | | | | 402 | |
Payable for professional fees | | | | | 19,162 | | | | | | 18,906 | | | | | | 17,067 | | | | | | 17,764 | |
Accrued expenses and other liabilities | | | | | 149,419 | | | | | | 5,142 | | | | | | 5,481 | | | | | | 46,300 | |
| | | | | | | | | | | | | | | | | | | | | | | | |
Total Liabilities | | | | | 5,818,208 | | | | | | 841,409 | | | | | | 579,205 | | | | | | 2,160,002 | |
| | | | | | | | | | | | | | | | | | | | | | | | |
NET ASSETS | | | | $ | 931,393,661 | | | | | $ | 16,543,009 | | | | | $ | 13,303,208 | | | | | $ | 305,025,084 | |
| | | | | | | | | | | | | | | | | | | | | | | | |
NET ASSETS CONSIST OF: | | | | | | | | | | | | | | | | | | | | | | | | |
Paid-in capital (Note 5) | | | | $ | 982,524,158 | | | | | $ | 15,962,286 | | | | | $ | 14,383,810 | | | | | $ | 272,866,714 | |
Accumulated net investment loss | | | | | (1,937,256) | | | | | | (5,849) | | | | | | (19,899) | | | | | | (305,212) | |
Accumulated net realized loss | | | | | (46,559,602) | | | | | | (791,564) | | | | | | (1,121,532) | | | | | | (12,749,988) | |
Net unrealized appreciation/(depreciation) | | | | | (2,633,639) | | | | | | 1,378,136 | | | | | | 60,829 | | | | | | 45,213,570 | |
| | | | | | | | | | | | | | | | | | | | | | | | |
NET ASSETS | | | | $ | 931,393,661 | | | | | $ | 16,543,009 | | | | | $ | 13,303,208 | | | | | $ | 305,025,084 | |
| | | | | | | | | | | | | | | | | | | | | | | | |
INVESTMENTS, AT COST | | | | $ | 928,331,733 | | | | | $ | 15,123,976 | | | | | $ | 13,364,978 | | | | | $ | 261,418,879 | |
PRICING OF SHARES | | | | | | | | | | | | | | | | | | | | | | | | |
Class A: (a) | | | | | | | | | | | | | | | | | | | | | | | | |
Net Asset Value, offering and redemption price per share | | | | $ | 17.52 | | | | | $ | 13.00 | | | | | $ | 9.69 | | | | | $ | 31.27 | |
Net Assets | | | | $ | 323,602,827 | | | | | $ | 339,953 | | | | | $ | 11,388,130 | | | | | $ | 110,601,459 | |
Shares of beneficial interest outstanding | | | | | 18,475,590 | | | | | | 26,148 | | | | | | 1,175,467 | | | | | | 3,537,412 | |
Maximum offering price per share (NAV/.9525, based on maximum sales charge of 4.75% of the offering price) | | | | $ | 18.39 | | | | | $ | 13.65 | | | | | $ | 10.17 | | | | | $ | 32.83 | |
Class C: (a) | | | | | | | | | | | | | | | | | | | | | | | | |
Net Asset Value, offering and redemption price per share | | | | $ | 15.14 | | | | | $ | 12.94 | | | | | $ | 9.56 | | | | | $ | 28.20 | |
Net Assets | | | | $ | 42,074,673 | | | | | $ | 566,058 | | | | | $ | 100,543 | | | | | $ | 52,365,633 | |
Shares of beneficial interest outstanding | | | | | 2,778,503 | | | | | | 43,730 | | | | | | 10,513 | | | | | | 1,856,798 | |
Institutional Class: | | | | | | | | | | | | | | | | | | | | | | | | |
Net Asset Value, offering and redemption price per share | | | | $ | 18.04 | | | | | $ | 13.02 | | | | | $ | 9.73 | | | | | $ | 31.69 | |
Net Assets | | | | $ | 453,189,693 | | | | | $ | 13,691,313 | | | | | $ | 1,728,512 | | | | | $ | 61,654,426 | |
Shares of beneficial interest outstanding | | | | | 25,114,920 | | | | | | 1,051,378 | | | | | | 177,713 | | | | | | 1,945,705 | |
Investor Class: | | | | | | | | | | | | | | | | | | | | | | | | |
Net Asset Value, offering and redemption price per share | | | | $ | 17.46 | | | | | $ | 12.98 | | | | | $ | 9.67 | | | | | $ | 29.95 | |
Net Assets | | | | $ | 112,526,468 | | | | | $ | 1,945,685 | | | | | $ | 86,023 | | | | | $ | 80,403,566 | |
Shares of beneficial interest outstanding | | | | | 6,445,135 | | | | | | 149,911 | | | | | | 8,900 | | | | | | 2,684,872 | |
| (a) | Redemption price per share may be reduced for any applicable contingent deferred sales charge. For a description of a possible sales charge, please see the Funds’ Prospectus. |
See Notes to Financial Statements
| | |
| Annual Report | April 30, 2016 | | 29 |
| | |
| Emerald Funds | | Statements of Operations |
| | For the Year Ended April 30, 2016 |
| | | | | | | | | | | | | | | | | | | | | | | | | | | | | | | | | | | | | | | | |
| | | | | | | Emerald Growth
Fund | | | Emerald Small Cap Value Fund(a) | | Emerald Insights
Fund | | | | | | | Emerald Banking
and Finance Fund | |
| | | | | | | | | | For the Period | | | Year Ended | | | | | | | | | | |
| | | Year Ended
April 30, 2016 | | | October 1, 2015 to
April 30, 2016 | | | September 30, 2015 | | | Year Ended
April 30, 2016 | | | Year Ended
April 30, 2016 | |
INVESTMENT INCOME: | | | | | | | | | | | | | | | | | | | | | | | | | | | | | | | | | | | | | | | | |
Dividends | | | | | | | 2,586,095 | | | | | | | | 86,516 | | | | | | | | 266,520 | | | | | | | | 93,913 | | | | | | | | 3,240,912 | |
Foreign taxes withheld | | | | | | | – | | | | | | | | (852) | | | | | | | | (125) | | | | | | | | (447) | | | | | | | | – | |
| | | | | | | | | | | | | | | | | | | | | | | | | | | | | | | | | | | | | | | | |
Total Investment Income | | | | | | | 2,586,095 | | | | | | | | 85,664 | | | | | | | | 266,395 | | | | | | | | 93,466 | | | | | | | | 3,240,912 | |
| | | | | | | | | | | | | | | | | | | | | | | | | | | | | | | | | | | | | | | | |
| | | | | | | | | | | | | | | |
EXPENSES: | | | | | | | | | | | | | | | | | | | | | | | | | | | | | | | | | | | | | | | | |
Investment advisory fee (Note 6) | | | | | | | 4,678,661 | | | | | | | | 69,483 | | | | | | | | 144,285 | | | | | | | | 86,192 | | | | | | | | 2,414,429 | |
Recoupment of previously waived fees (Note 6) | | | | | | | 134,516 | | | | | | | | – | | | | | | | | – | | | | | | | | – | | | | | | | | – | |
Administration fee | | | | | | | 359,924 | | | | | | | | 6,455 | | | | | | | | 3,571 | | | | | | | | 9,948 | | | | | | | | 130,361 | |
Custodian fee | | | | | | | 70,868 | | | | | | | | 2,873 | | | | | | | | 7,120 | | | | | | | | 5,000 | | | | | | | | 28,397 | |
Professional fees | | | | | | | 32,754 | | | | | | | | 23,417 | | | | | | | | 22,242 | | | | | | | | 18,339 | | | | | | | | 23,305 | |
Transfer agent fee | | | | | | | 278,361 | | | | | | | | 16,746 | | | | | | | | 35,352 | | | | | | | | 31,622 | | | | | | | | 144,605 | |
Trustee fees and expenses | | | | | | | 20,485 | | | | | | | | 269 | | | | | | | | 165 | | | | | | | | 307 | | | | | | | | 6,886 | |
Registration/filing fees | | | | | | | 217,592 | | | | | | | | 28,936 | | | | | | | | 29,207 | | | | | | | | 26,816 | | | | | | | | 84,119 | |
Reports to shareholder and printing fees | | | | | | | 112,192 | | | | | | | | 5,169 | | | | | | | | 4,471 | | | | | | | | 2,389 | | | | | | | | 34,543 | |
Distribution and service fees | | | | | | | | | | | | | | | | | | | | | | | | | | | | | | | | | | | | | | | | |
Class A | | | | | | | 948,901 | | | | | | | | 67 | | | | | | | | 13 | | | | | | | | 35,326 | | | | | | | | 355,344 | |
Class C | | | | | | | 339,650 | | | | | | | | 450 | | | | | | | | 37 | | | | | | | | 672 | | | | | | | | 444,639 | |
Institutional Class | | | | | | | 150,914 | | | | | | | | – | | | | | | | | – | | | | | | | | 309 | | | | | | | | 11,158 | |
Investor Class | | | | | | | 353,978 | | | | | | | | 1,617 | | | | | | | | 1,077 | | | | | | | | 2,452 | | | | | | | | 235,338 | |
Chief compliance officer fee | | | | | | | 42,107 | | | | | | | | 439 | | | | | | | | 369 | | | | | | | | 678 | | | | | | | | 14,851 | |
Principal financial officer fee | | | | | | | 7,206 | | | | | | | | 73 | | | | | | | | 0 | | | | | | | | 117 | | | | | | | | 2,543 | |
Other | | | | | | | 27,494 | | | | | | | | 9,541 | | | | | | | | 15,004 | | | | | | | | 10,296 | | | | | | | | 14,393 | |
| | | | | | | | | | | | | | | | | | | | | | | | | | | | | | | | | | | | | | | | |
Total expenses before waiver | | | | | | | 7,775,603 | | | | | | | | 165,535 | | | | | | | | 262,913 | | | | | | | | 230,463 | | | | | | | | 3,944,911 | |
Less fees waived/reimbursed by investment advisor (Note 6) | | | | | | | – | | | | | | | | (70,785) | | | | | | | | (78,334) | | | | | | | | (76,576) | | | | | | | | – | |
| | | | | | | | | | | | | | | | | | | | | | | | | | | | | | | | | | | | | | | | |
Total Net Expenses | | | | | | | 7,775,603 | | | | | | | | 94,750 | | | | | | | | 184,579 | | | | | | | | 153,887 | | | | | | | | 3,944,911 | |
| | | | | | | | | | | | | | | | | | | | | | | | | | | | | | | | | | | | | | | | |
NET INVESTMENT INCOME/(LOSS): | | | | | | | (5,189,508) | | | | | | | | (9,086) | | | | | | | | 81,816 | | | | | | | | (60,421) | | | | | | | | (703,999) | |
| | | | | | | | | | | | | | | | | | | | | | | | | | | | | | | | | | | | | | | | |
| | | | | | | | | | | | | | | |
REALIZED AND UNREALIZED GAIN/(LOSS) | | | | | | | | | | | | | | | | | | | | | | | | | | | | | | | | | | | | | | | | |
Net realized gain/(loss) | | | | | | | (45,883,891) | | | | | | | | 205,540 | | | | | | | | (997,104) | | | | | | | | (991,477) | | | | | | | | (9,446,349) | |
Net change in unrealized appreciation/(depreciation) | | | | | | | (70,373,366) | | | | | | | | 243,735 | | | | | | | | 1,168,742 | | | | | | | | (608,622) | | | | | | | | 9,022,785 | |
| | | | | | | | | | | | | | | | | | | | | | | | | | | | | | | | | | | | | | | | |
NET REALIZED AND UNREALIZED GAIN/(LOSS) | | | | | | | (116,257,257) | | | | | | | | 449,275 | | | | | | | | 171,638 | | | | | | | | (1,600,099) | | | | | | | | (423,564) | |
| | | | | | | | | | | | | | | | | | | | | | | | | | | | | | | | | | | | | | | | |
NET INCREASE/(DECREASE) IN NET ASSETS RESULTING FROM OPERATIONS | | | | | | $ | (121,446,765) | | | | | | | $ | 440,189 | | | | | | | $ | 253,453 | | | | | | | $ | (1,660,520) | | | | | | | $ | (1,127,563) | |
| | | | | | | | | | | | | | | | | | | | | | | | | | | | | | | | | | | | | | | | |
| (a) | Effective March 3, 2015 the Board approved changing the fiscal year-end of the Fund from September 30 to April 30. |
See Notes to Financial Statements.
| | |
| 30 | | www.emeraldmutualfunds.com |
| | |
| Emerald Growth Fund | | Statements of Changes in Net Assets |
| | |
| | | | | | | | | | | | | | | | |
| | | Year Ended
April 30, 2016 | | | Year Ended
April 30, 2015 | |
OPERATIONS: | | | | | | | | | | | | | | | | |
Net investment loss | | | | | | $ | (5,189,508) | | | | | | | $ | (2,204,019) | |
Net realized gain/(loss) | | | | | | | (45,883,891) | | | | | | | | 26,045,665 | |
Net change in unrealized appreciation/(depreciation) | | | | | | | (70,373,366) | | | | | | | | 22,664,902 | |
| | | | | | | | | | | | | | | | |
| | | | | | |
Net increase/(decrease) in net assets resulting from operations | | | | | | | (121,446,765) | | | | | | | | 46,506,548 | |
| | | | | | | | | | | | | | | | |
| | | | | | |
DISTRIBUTIONS TO SHAREHOLDERS (NOTE 3): | | | | | | | | | | | | | | | | |
| | | | | | |
From net realized gains | | | | | | | | | | | | | | | | |
| | | | | | |
Class A | | | | | | | (8,925,260) | | | | | | | | (7,114,290) | |
Class C | | | | | | | (1,239,080) | | | | | | | | (872,458) | |
Institutional Class | | | | | | | (9,080,768) | | | | | | | | (10,131,634) | |
Investor Class | | | | | | | (3,291,011) | | | | | | | | (1,055,047) | |
| | | | | | | | | | | | | | | | |
Net decrease in net assets from distributions | | | | | | | (22,536,119) | | | | | | | | (19,173,429) | |
| | | | | | | | | | | | | | | | |
SHARE TRANSACTIONS (NOTE 5): | | | | | | | | | | | | | | | | |
Class A | | | | | | | | | | | | | | | | |
Proceeds from sale of shares | | | | | | | 381,182,773 | | | | | | | | 53,012,811 | |
Issued to shareholders in reinvestment of distributions | | | | | | | 8,212,776 | | | | | | | | 6,449,784 | |
Cost of shares redeemed | | | | | | | (133,632,331) | | | | | | | | (23,205,808) | |
| | | | | | | | | | | | | | | | |
Net increase from share transactions | | | | | | | 255,763,218 | | | | | | | | 36,256,787 | |
| | | | | | | | | | | | | | | | |
Class C | | | | | | | | | | | | | | | | |
Proceeds from sale of shares | | | | | | | 38,113,416 | | | | | | | | 5,349,541 | |
Issued to shareholders in reinvestment of distributions | | | | | | | 1,010,353 | | | | | | | | 745,415 | |
Cost of shares redeemed | | | | | | | (4,668,547) | | | | | | | | (3,205,852) | |
| | | | | | | | | | | | | | | | |
Net increase from share transactions | | | | | | | 34,455,222 | | | | | | | | 2,889,104 | |
| | | | | | | | | | | | | | | | |
Institutional Class | | | | | | | | | | | | | | | | |
Proceeds from sale of shares | | | | | | | 461,582,646 | | | | | | | | 44,366,418 | |
Issued to shareholders in reinvestment of distributions | | | | | | | 8,228,820 | | | | | | | | 9,651,464 | |
Cost of shares redeemed | | | | | | | (133,394,758) | | | | | | | | (29,629,924) | |
| | | | | | | | | | | | | | | | |
Net increase from share transactions | | | | | | | 336,416,708 | | | | | | | | 24,387,958 | |
| | | | | | | | | | | | | | | | |
Investor Class | | | | | | | | | | | | | | | | |
Proceeds from sale of shares | | | | | | | 171,962,946 | | | | | | | | 18,821,238 | |
Issued to shareholders in reinvestment of distributions | | | | | | | 2,169,384 | | | | | | | | 761,358 | |
Cost of shares redeemed | | | | | | | (62,270,391) | | | | | | | | (13,424,866) | |
| | | | | | | | | | | | | | | | |
Net increase from share transactions | | | | | | | 111,861,939 | | | | | | | | 6,157,730 | |
| | | | | | | | | | | | | | | | |
| | | | | | |
Net increase in net assets | | | | | | $ | 594,514,203 | | | | | | | $ | 97,024,698 | |
| | | | | | | | | | | | | | | | |
NET ASSETS: | | | | | | | | | | | | | | | | |
Beginning of period | | | | | | | 336,879,458 | | | | | | | | 239,854,760 | |
| | | | | | | | | | | | | | | | |
End of period (including accumulated net investment loss of $(1,937,256) and $(847,422)) | | | | | | $ | 931,393,661 | | | | | | | $ | 336,879,458 | |
| | | | | | | | | | | | | | | | |
| | |
| Annual Report | April 30, 2016 | | 31 |
| | |
| Emerald Growth Fund | | Statements of Changes in Net Assets |
| | |
| | | | | | | | | | | | | | | | |
| | | Year Ended
April 30, 2016 | | | Year Ended
April 30, 2015 | |
Other Information: | | | | | | | | | | | | | | | | |
SHARE TRANSACTIONS: | | | | | | | | | | | | | | | | |
Class A | | | | | | | | | | | | | | | | |
Sold | | | | | | | 19,174,156 | | | | | | | | 2,761,491 | |
Distributions reinvested | | | | | | | 443,454 | | | | | | | | 341,078 | |
Redeemed | | | | | | | (7,327,683) | | | | | | | | (1,218,757) | |
| | | | | | | | | | | | | | | | |
Net increase in shares outstanding | | | | | | | 12,289,927 | | | | | | | | 1,883,812 | |
| | | | | | | | | | | | | | | | |
Class C | | | | | | | | | | | | | | | | |
Sold | | | | | | | 2,128,222 | | | | | | | | 306,048 | |
Distributions reinvested | | | | | | | 62,950 | | | | | | | | 45,040 | |
Redeemed | | | | | | | (295,110) | | | | | | | | (193,449) | |
| | | | | | | | | | | | | | | | |
Net increase in shares outstanding | | | | | | | 1,896,062 | | | | | | | | 157,639 | |
| | | | | | | | | | | | | | | | |
Institutional Class | | | | | | | | | | | | | | | | |
Sold | | | | | | | 23,158,775 | | | | | | | | 2,257,859 | |
Distributions reinvested | | | | | | | 431,732 | | | | | | | | 498,012 | |
Redeemed | | | | | | | (6,952,343) | | | | | | | | (1,548,603) | |
| | | | | | | | | | | | | | | | |
Net increase in shares outstanding | | | | | | | 16,638,164 | | | | | | | | 1,207,268 | |
| | | | | | | | | | | | | | | | |
Investor Class | | | | | | | | | | | | | | | | |
Sold | | | | | | | 8,581,157 | | | | | | | | 977,034 | |
Distributions reinvested | | | | | | | 117,518 | | | | | | | | 40,390 | |
Redeemed | | | | | | | (3,431,264) | | | | | | | | (718,235) | |
| | | | | | | | | | | | | | | | |
Net increase in shares outstanding | | | | | | | 5,267,411 | | | | | | | | 299,189 | |
| | | | | | | | | | | | | | | | |
See Notes to Financial Statements.
| | |
| 32 | | www.emeraldmutualfunds.com |
| | |
| Emerald Small Cap Value Fund | | Statements of Changes in Net Assets |
| | |
| | | | | | | | | | | | | | | | | | | | | | | | |
| | | For the Period
October 1, 2015 to
April 30, 2016 (a) | | | Year Ended
September 30, 2015 | | | Year Ended
September 30, 2014 | |
OPERATIONS: | | | | | | | | | | | | | | | | | | | | | | | | |
Net investment income/(loss) | | | | | | $ | (9,086) | | | | | | | $ | 81,815 | | | | | | | $ | 94,747 | |
Net realized gain/(loss) | | | | | | | 205,540 | | | | | | | | (997,104) | | | | | | | | 525,638 | |
Realized capital gain from registered investment companies | | | | | | | – | | | | | | | | – | | | | | | | | 9,811 | |
Net change in unrealized appreciation/(depreciation) | | | | | | | 243,735 | | | | | | | | 1,168,742 | | | | | | | | (1,065,700) | |
| | | | | | | | | | | | | | | | | | | | | | | | |
Net increase/(decrease) in net assets resulting from operations | | | | | | | 440,189 | | | | | | | | 253,453 | | | | | | | | (435,504) | |
| | | | | | | | | | | | | | | | | | | | | | | | |
| | | | | | | | | |
DISTRIBUTIONS TO SHAREHOLDERS (NOTE 3): | | | | | | | | | | | | | | | | | | | | | | | | |
| | | | | | | | | |
From net investment income | | | | | | | | | | | | | | | | | | | | | | | | |
| | | | | | | | | |
Class A | | | | | | | (55) | | | | | | | | – | | | | | | | | – | |
Class C | | | | | | | (31) | | | | | | | | – | | | | | | | | – | |
Institutional Class | | | | | | | (78,137) | | | | | | | | (76,689) | | | | | | | | (9,753) | |
Investor Class | | | | | | | (3,585) | | | | | | | | (1,619) | | | | | | | | – | |
| | | | | | | | | |
From net realized gains | | | | | | | | | | | | | | | | | | | | | | | | |
| | | | | | | | | |
Class A | | | | | | | – | | | | | | | | (405) | | | | | | | | – | |
Class C | | | | | | | – | | | | | | | | (405) | | | | | | | | – | |
Institutional Class | | | | | | | – | | | | | | | | (505,155) | | | | | | | | (451,543) | |
Investor Class | | | | | | | – | | | | | | | | (11,254) | | | | | | | | (15,077) | |
| | | | | | | | | | | | | | | | | | | | | | | | |
Net decrease in net assets from distributions | | | | | | | (81,808) | | | | | | | | (595,527) | | | | | | | | (476,373) | |
| | | | | | | | | | | | | | | | | | | | | | | | |
SHARE TRANSACTIONS (NOTE 5): | | | | | | | | | | | | | | | | | | | | | | | | |
Class A (b) | | | | | | | | | | | | | | | | | | | | | | | | |
Proceeds from sale of shares | | | | | | | 327,544 | | | | | | | | 15,000 | | | | | | | | – | |
Issued to shareholders in reinvestment of distributions | | | | | | | 55 | | | | | | | | 405 | | | | | | | | – | |
| | | | | | | | | | | | | | | | | | | | | | | | |
Net increase from share transactions | | | | | | | 327,599 | | | | | | | | 15,405 | | | | | | | | – | |
| | | | | | | | | | | | | | | | | | | | | | | | |
Class C (c) | | | | | | | | | | | | | | | | | | | | | | | | |
Proceeds from sale of shares | | | | | | | 554,859 | | | | | | | | 15,000 | | | | | | | | – | |
Issued to shareholders in reinvestment of distributions | | | | | | | 31 | | | | | | | | 405 | | | | | | | | – | |
| | | | | | | | | | | | | | | | | | | | | | | | |
Net increase from share transactions | | | | | | | 554,890 | | | | | | | | 15,405 | | | | | | | | – | |
| | | | | | | | | | | | | | | | | | | | | | | | |
Institutional Class | | | | | | | | | | | | | | | | | | | | | | | | |
Proceeds from sale of shares | | | | | | | 631,324 | | | | | | | | 3,861,703 | | | | | | | | 16,524,710 | |
Issued to shareholders in reinvestment of distributions | | | | | | | 64,940 | | | | | | | | 483,048 | | | | | | | | 457,132 | |
Cost of shares redeemed | | | | | | | (3,833,338) | | | | | | | | (11,838,177) | | | | | | | | (170,658) | |
| | | | | | | | | | | | | | | | | | | | | | | | |
Net increase/(decrease) from share transactions | | | | | | | (3,137,074) | | | | | | | | (7,493,426) | | | | | | | | 16,811,184 | |
| | | | | | | | | | | | | | | | | | | | | | | | |
Investor Class | | | | | | | | | | | | | | | | | | | | | | | | |
Proceeds from sale of shares | | | | | | | 1,660,183 | | | | | | | | 83,181 | | | | | | | | 217,474 | |
Issued to shareholders in reinvestment of distributions | | | | | | | 3,585 | | | | | | | | 12,813 | | | | | | | | 14,598 | |
Cost of shares redeemed | | | | | | | (158,757) | | | | | | | | (173,977) | | | | | | | | (27,597) | |
| | | | | | | | | | | | | | | | | | | | | | | | |
Net increase/(decrease) from share transactions | | | | | | | 1,505,011 | | | | | | | | (77,983) | | | | | | | | 204,475 | |
| | | | | | | | | | | | | | | | | | | | | | | | |
Net increase/(decrease) in net assets | | | | | | $ | (391,193) | | | | | | | $ | (7,882,673) | | | | | | | $ | 16,103,782 | |
| | | | | | | | | | | | | | | | | | | | | | | | |
NET ASSETS: | | | | | | | | | | | | | | | | | | | | | | | | |
Beginning of period | | | | | | | 16,934,202 | | | | | | | | 24,816,875 | | | | | | | | 8,713,093 | |
| | | | | | | | | | | | | | | | | | | | | | | | |
End of period (including accumulated net investment income/(loss) of $(5,849), $81,801 and $97,138) | | | | | | $ | 16,543,009 | | | | | | | $ | 16,934,202 | | | | | | | $ | 24,816,875 | |
| | | | | | | | | | | | | | | | | | | | | | | | |
| | |
| Annual Report | April 30, 2016 | | 33 |
| | |
| Emerald Small Cap Value Fund | | Statements of Changes in Net Assets |
| | |
| | | | | | | | | | | | | | | | | | | | | | | | |
| | | For the Period
October 1, 2015 to
April 30, 2016 (a) | | | Year Ended
September 30, 2015 | | | Year Ended
September 30, 2014 | |
Other Information: | | | | | | | | | | | | | | | | | | | | | | | | |
SHARE TRANSACTIONS: | | | | | | | | | | | | | | | | | | | | | | | | |
Class A (b) | | | | | | | | | | | | | | | | | | | | | | | | |
Sold | | | | | | | 25,051 | | | | | | | | 1,063 | | | | | | | | – | |
Distributions reinvested | | | | | | | 4 | | | | | | | | 30 | | | | | | | | – | |
| | | | | | | | | | | | | | | | | | | | | | | | |
Net increase in shares outstanding | | | | | | | 25,055 | | | | | | | | 1,093 | | | | | | | | – | |
| | | | | | | | | | | | | | | | | | | | | | | | |
Class C (c) | | | | | | | | | | | | | | | | | | | | | | | | |
Sold | | | | | | | 42,635 | | | | | | | | 1,063 | | | | | | | | – | |
Distributions reinvested | | | | | | | 2 | | | | | | | | 30 | | | | | | | | – | |
| | | | | | | | | | | | | | | | | | | | | | | | |
Net increase in shares outstanding | | | | | | | 42,637 | | | | | | | | 1,093 | | | | | | | | – | |
| | | | | | | | | | | | | | | | | | | | | | | | |
Institutional Class | | | | | | | | | | | | | | | | | | | | | | | | |
Sold | | | | | | | 49,075 | | | | | | | | 289,259 | | | | | | | | 1,213,073 | |
Distributions reinvested | | | | | | | 5,138 | | | | | | | | 36,038 | | | | | | | | 34,657 | |
Redeemed | | | | | | | (301,180) | | | | | | | | (934,159) | | | | | | | | (12,776) | |
| | | | | | | | | | | | | | | | | | | | | | | | |
Net increase/(decrease) in shares outstanding | | | | | | | (246,967) | | | | | | | | (608,862) | | | | | | | | 1,234,954 | |
| | | | | | | | | | | | | | | | | | | | | | | | |
Investor Class | | | | | | | | | | | | | | | | | | | | | | | | |
Sold | | | | | | | 132,087 | | | | | | | | 6,169 | | | | | | | | 16,545 | |
Distributions reinvested | | | | | | | 284 | | | | | | | | 959 | | | | | | | | 1,108 | |
Redeemed | | | | | | | (13,942) | | | | | | | | (12,883) | | | | | | | | (2,047) | |
| | | | | | | | | | | | | | | | | | | | | | | | |
Net increase/(decrease) in shares outstanding | | | | | | | 118,429 | | | | | | | | (5,755) | | | | | | | | 15,606 | |
| | | | | | | | | | | | | | | | | | | | | | | | |
| (a) | Effective March 3, 2015 the Board approved changing the fiscal year-end of the Fund from September 30 to April 30. |
| (b) | Class A commenced operations on June 30, 2015. |
| (c) | Class C commenced operations on June 30, 2015. |
See Notes to Financial Statements.
| | |
| 34 | | www.emeraldmutualfunds.com |
| | |
| Emerald Insights Fund | | Statements of Changes in Net Assets |
| | |
| | | | | | | | | | | | | | | | |
| | | Year Ended
April 30, 2016 | | | For the Period
August 1, 2014
(Inception) to
April 30, 2015 | |
OPERATIONS: | | | | | | | | | | | | | | | | |
Net investment loss | | | | | | $ | (60,421) | | | | | | | $ | (23,625) | |
Net realized loss | | | | | | | (991,477) | | | | | | | | (143,101) | |
Net change in unrealized appreciation/(depreciation) on investments | | | | | | | (608,622) | | | | | | | | 669,451 | |
| | | | | | | | | | | | | | | | |
Net increase/(decrease) in net assets resulting from operations | | | | | | | (1,660,520) | | | | | | | | 502,725 | |
| | | | | | | | | | | | | | | | |
SHARE TRANSACTIONS (NOTE 5): | | | | | | | | | | | | | | | | |
Class A | | | | | | | | | | | | | | | | |
Proceeds from sale of shares | | | | | | | 7,019,638 | | | | | | | | 6,101,597 | |
Cost of shares redeemed | | | | | | | (644,531) | | | | | | | | (82,206) | |
| | | | | | | | | | | | | | | | |
Net increase from share transactions | | | | | | | 6,375,107 | | | | | | | | 6,019,391 | |
| | | | | | | | | | | | | | | | |
Class C | | | | | | | | | | | | | | | | |
Proceeds from sale of shares | | | | | | | 90,586 | | | | | | | | 24,453 | |
Cost of shares redeemed | | | | | | | (7,964) | | | | | | | | – | |
| | | | | | | | | | | | | | | | |
Net increase from share transactions | | | | | | | 82,622 | | | | | | | | 24,453 | |
| | | | | | | | | | | | | | | | |
Institutional Class | | | | | | | | | | | | | | | | |
Proceeds from sale of shares | | | | | | | 1,476,544 | | | | | | | | 265,616 | |
Cost of shares redeemed | | | | | | | (108,493) | | | | | | | | – | |
| | | | | | | | | | | | | | | | |
Net increase from share transactions | | | | | | | 1,368,051 | | | | | | | | 265,616 | |
| | | | | | | | | | | | | | | | |
Investor Class | | | | | | | | | | | | | | | | |
Proceeds from sale of shares | | | | | | | 980,954 | | | | | | | | 434,000 | |
Cost of shares redeemed | | | | | | | (1,089,191) | | | | | | | | – | |
| | | | | | | | | | | | | | | | |
Net increase/(decrease) from share transactions | | | | | | | (108,237) | | | | | | | | 434,000 | |
| | | | | | | | | | | | | | | | |
| | | | | | |
Net increase in net assets | | | | | | $ | 6,057,023 | | | | | | | $ | 7,246,185 | |
| | | | | | | | | | | | | | | | |
NET ASSETS: | | | | | | | | | | | | | | | | |
Beginning of period | | | | | | | 7,246,185 | | | | | | | | – | |
| | | | | | | | | | | | | | | | |
End of period (including accumulated net investment loss of $(19,899) and $(12,292)) | | | | | | $ | 13,303,208 | | | | | | | $ | 7,246,185 | |
| | | | | | | | | | | | | | | | |
Other Information: | | | | | | | | | | | | | | | | |
SHARE TRANSACTIONS: | | | | | | | | | | | | | | | | |
Class A | | | | | | | | | | | | | | | | |
Sold | | | | | | | 648,075 | | | | | | | | 599,167 | |
Redeemed | | | | | | | (63,986) | | | | | | | | (7,789) | |
| | | | | | | | | | | | | | | | |
Net increase in shares outstanding | | | | | | | 584,089 | | | | | | | | 591,378 | |
| | | | | | | | | | | | | | | | |
Class C | | | | | | | | | | | | | | | | |
Sold | | | | | | | 8,833 | | | | | | | | 2,457 | |
Redeemed | | | | | | | (777) | | | | | | | | – | |
| | | | | | | | | | | | | | | | |
Net increase in shares outstanding | | | | | | | 8,056 | | | | | | | | 2,457 | |
| | | | | | | | | | | | | | | | |
Institutional Class | | | | | | | | | | | | | | | | |
Sold | | | | | | | 163,820 | | | | | | | | 25,375 | |
Redeemed | | | | | | | (11,482) | | | | | | | | – | |
| | | | | | | | | | | | | | | | |
Net increase in shares outstanding | | | | | | | 152,338 | | | | | | | | 25,375 | |
| | | | | | | | | | | | | | | | |
Investor Class | | | | | | | | | | | | | | | | |
Sold | | | | | | | 89,665 | | | | | | | | 40,827 | |
Redeemed | | | | | | | (121,592) | | | | | | | | – | |
| | | | | | | | | | | | | | | | |
Net increase/(decrease) in shares outstanding | | | | | | | (31,927) | | | | | | | | 40,827 | |
| | | | | | | | | | | | | | | | |
See Notes to Financial Statements.
| | |
| Annual Report | April 30, 2016 | | 35 |
| | |
| Emerald Banking and Finance Fund | | Statements of Changes in Net Assets |
| | |
| | | | | | | | | | | | | | | | |
| | | Year Ended
April 30, 2016 | | | Year Ended
April 30, 2015 | |
OPERATIONS: | | | | | | | | | | | | | | | | |
Net investment loss | | | | | | $ | (703,999) | | | | | | | $ | (820,224) | |
Net realized gain/(loss) | | | | | | | (9,446,349) | | | | | | | | 2,239,110 | |
Net change in unrealized appreciation | | | | | | | 9,022,785 | | | | | | | | 10,618,634 | |
| | | | | | | | | | | | | | | | |
Net increase/(decrease) in net assets resulting from operations | | | | | | | (1,127,563) | | | | | | | | 12,037,520 | |
| | | | | | | | | | | | | | | | |
| | | | | | |
SHARE TRANSACTIONS (NOTE 5): | | | | | | | | | | | | | | | | |
Class A | | | | | | | | | | | | | | | | |
Proceeds from sale of shares | | | | | | | 139,134,278 | | | | | | | | 8,943,302 | |
Cost of shares redeemed | | | | | | | (75,700,736) | | | | | | | | (13,656,116) | |
| | | | | | | | | | | | | | | | |
Net increase/(decrease) from share transactions | | | | | | | 63,433,542 | | | | | | | | (4,712,814) | |
| | | | | | | | | | | | | | | | |
Class C | | | | | | | | | | | | | | | | |
Proceeds from sale of shares | | | | | | | 23,271,396 | | | | | | | | 4,050,687 | |
Cost of shares redeemed | | | | | | | (4,636,338) | | | | | | | | (3,175,681) | |
| | | | | | | | | | | | | | | | |
Net increase from share transactions | | | | | | | 18,635,058 | | | | | | | | 875,006 | |
| | | | | | | | | | | | | | | | |
Institutional Class | | | | | | | | | | | | | | | | |
Proceeds from sale of shares | | | | | | | 56,443,883 | | | | | | | | 3,363,492 | |
Cost of shares redeemed | | | | | | | (19,778,965) | | | | | | | | (4,043,673) | |
| | | | | | | | | | | | | | | | |
Net increase/(decrease) from share transactions | | | | | | | 36,664,918 | | | | | | | | (680,181) | |
| | | | | | | | | | | | | | | | |
Investor Class | | | | | | | | | | | | | | | | |
Proceeds from sale of shares | | | | | | | 112,489,510 | | | | | | | | 12,918,507 | |
Cost of shares redeemed | | | | | | | (56,677,531) | | | | | | | | (6,971,664) | |
| | | | | | | | | | | | | | | | |
Net increase from share transactions | | | | | | | 55,811,979 | | | | | | | | 5,946,843 | |
| | | | | | | | | | | | | | | | |
| | | | | | |
Net increase in net assets | | | | | | $ | 173,417,934 | | | | | | | $ | 13,466,374 | |
| | | | | | | | | | | | | | | | |
NET ASSETS: | | | | | | | | | | | | | | | | |
Beginning of period | | | | | | | 131,607,150 | | | | | | | | 118,140,776 | |
| | | | | | | | | | | | | | | | |
End of period (including accumulated net investment loss of $(305,212) and $(269,341)) | | | | | | $ | 305,025,084 | | | | | | | $ | 131,607,150 | |
| | | | | | | | | | | | | | | | |
| | | | | | |
Other Information: | | | | | | | | | | | | | | | | |
SHARE TRANSACTIONS: | | | | | | | | | | | | | | | | |
Class A | | | | | | | | | | | | | | | | |
Sold | | | | | | | 4,379,264 | | | | | | | | 327,474 | |
Redeemed | | | | | | | (2,525,433) | | | | | | | | (506,169) | |
| | | | | | | | | | | | | | | | |
Net increase/(decrease) in shares outstanding | | | | | | | 1,853,831 | | | | | | | | (178,695) | |
| | | | | | | | | | | | | | | | |
Class C | | | | | | | | | | | | | | | | |
Sold | | | | | | | 809,825 | | | | | | | | 162,947 | |
Redeemed | | | | | | | (169,473) | | | | | | | | (129,546) | |
| | | | | | | | | | | | | | | | |
Net increase in shares outstanding | | | | | | | 640,352 | | | | | | | | 33,401 | |
| | | | | | | | | | | | | | | | |
Institutional Class | | | | | | | | | | | | | | | | |
Sold | | | | | | | 1,770,911 | | | | | | | | 122,773 | |
Redeemed | | | | | | | (639,328) | | | | | | | | (147,805) | |
| | | | | | | | | | | | | | | | |
Net increase/(decrease) in shares outstanding | | | | | | | 1,131,583 | | | | | | | | (25,032) | |
| | | | | | | | | | | | | | | | |
Investor Class | | | | | | | | | | | | | | | | |
Sold | | | | | | | 3,679,872 | | | | | | | | 496,076 | |
Redeemed | | | | | | | (1,987,638) | | | | | | | | (272,502) | |
| | | | | | | | | | | | | | | | |
Net increase in shares outstanding | | | | | | | 1,692,234 | | | | | | | | 223,574 | |
| | | | | | | | | | | | | | | | |
See Notes to Financial Statements.
| | |
| 36 | | www.emeraldmutualfunds.com |
Intentionally Left Blank
| | |
| Emerald Growth Fund | | Financial Highlights |
| | For a share outstanding throughout the periods presented |
| | | | | | | | | | | | | | | | | | | | | | | | | | | | | | | | | | | | |
| | | | | | | | | | | | | | | CLASS A | | | | | | |
| |
| | | Year Ended
April 30, 2016 | | | Year Ended
April 30, 2015 | | | Year Ended
April 30, 2014 | | | Year Ended
April 30, 2013 | | | For the Period
January 1, 2012 to
April 30, 2012(a)(b) | | | Year Ended
December 31, 2011 | |
NET ASSET VALUE, BEGINNING OF PERIOD | | | | $ | 20.02 | | | | | $ | 18.11 | | | | | $ | 15.60 | | | | | $ | 16.20 | | | | | $ | 13.37 | | | | | $ | 13.57 | |
INCOME/(LOSS) FROM OPERATIONS: | | | | | | | | | | | | | | | | | | | | | | | | | | | | | | | | | | | | |
Net investment loss(c) | | | | | (0.15) | | | | | | (0.18) | | | | | | (0.21) | | | | | | (0.15) | | | | | | (0.05) | | | | | | (0.14) | |
Net realized and unrealized gain/(loss) on investments | | | | | (1.88) | | | | | | 3.43 | | | | | | 4.33 | | | | | | 1.40 | | | | | | 2.88 | | | | | | (0.06) | |
| | | | | | | | | | | | | | | | | | | | | | | | | | | | | | | | | | | | |
Total from Investment Operations | | | | | (2.03) | | | | | | 3.25 | | | | | | 4.12 | | | | | | 1.25 | | | | | | 2.83 | | | | | | (0.20) | |
| | | | | | | | | | | | | | | | | | | | | | | | | | | | | | | | | | | | |
| | | | | | | | | | | | |
LESS DISTRIBUTIONS: | | | | | | | | | | | | | | | | | | | | | | | | | | | | | | | | | | | | |
From capital gains | | | | | (0.47) | | | | | | (1.34) | | | | | | (1.61) | | | | | | (1.85) | | | | | | – | | | | | | – | |
| | | | | | | | | | | | | | | | | | | | | | | | | | | | | | | | | | | | |
Total Distributions | | | | | (0.47) | | | | | | (1.34) | | | | | | (1.61) | | | | | | (1.85) | | | | | | – | | | | | | – | |
| | | | | | | | | | | | | | | | | | | | | | | | | | | | | | | | | | | | |
NET INCREASE/(DECREASE) IN NET ASSET VALUE | | | | | (2.50) | | | | | | 1.91 | | | | | | 2.51 | | | | | | (0.60) | | | | | | 2.83 | | | | | | (0.20) | |
| | | | | | | | | | | | | | | | | | | | | | | | | | | | | | | | | | | | |
NET ASSET VALUE, END OF PERIOD | | | | $ | 17.52 | | | | | $ | 20.02 | | | | | $ | 18.11 | | | | | $ | 15.60 | | | | | $ | 16.20 | | | | | $ | 13.37 | |
| | | | | | | | | | | | | | | | | | | | | | | | | | | | | | | | | | | | |
| | | | | | | | | | | | |
TOTAL RETURN(d) | | | | | (10.28) | % | | | | | 18.38 | % | | | | | 26.01 | % | | | | | 9.14 | % | | | | | 21.17% | (e) | | | | | (1.47) | % |
RATIOS/SUPPLEMENTAL DATA: | | | | | | | | | | | | | | | | | | | | | | | | | | | | | | | | | | | | |
Net Assets, End of Period (000s) | | | | $ | 323,603 | | | | | $ | 123,828 | | | | | $ | 77,900 | | | | | $ | 46,605 | | | | | $ | 41,991 | | | | | $ | 37,008 | |
RATIOS TO AVERAGE NET ASSETS: | | | | | | | | | | | | | | | | | | | | | | | | | | | | | | | | | | | | |
Net Investment loss | | | | | (0.81) | % | | | | | (0.93) | % | | | | | (1.12) | % | | | | | (1.01) | % | | | | | (1.02)% | (f) | | | | | (1.03) | % |
Operating expenses excluding reimbursement/waiver | | | | | 1.17 | % | | | | | 1.29 | % | | | | | 1.31 | % | | | | | 1.38 | % | | | | | 1.36% | (f) | | | | | 1.36 | % |
Operating expenses including reimbursement/waiver | | | | | 1.17 | % | | | | | 1.29 | % | | | | | 1.29 | % | | | | | 1.29 | % | | | | | 1.29% | (f) | | | | | 1.29 | % |
PORTFOLIO TURNOVER RATE | | | | | 45% | (e) | | | | | 68 | % | | | | | 70 | % | | | | | 78 | % | | | | | 28% | (e) | | | | | 75 | % |
| (a) | Prior to its March 16, 2012 reorganization with and into the Emerald Growth Fund, the Fund was known as the Forward Growth Fund. |
| (b) | Effective March 13, 2012 the Board approved changing the fiscal year-end of the Fund from December 31 to April 30. |
| (c) | Per share amounts are based upon average shares outstanding. |
| (d) | Total return does not reflect the effect of sales charges. |
See Notes to Financial Statements.
| | |
| 38 | | www.emeraldmutualfunds.com |
| | |
| Emerald Growth Fund | | Financial Highlights |
| | For a share outstanding throughout the periods presented |
| | | | | | | | | | | | | | | | | | | | | | | | | | | | | | | | | | | | |
| | | | | | | | | | | | | | | CLASS C | | | | | | |
| |
| | | Year Ended
April 30, 2016 | | | Year Ended
April 30, 2015 | | | Year Ended
April 30, 2014 | | | Year Ended
April 30, 2013 | | | For the Period
January 1, 2012 to
April 30, 2012(a)(b) | | | Year Ended
December 31, 2011 | |
NET ASSET VALUE, BEGINNING OF PERIOD | | | | $ | 17.48 | | | | | $ | 16.07 | | | | | $ | 14.07 | | | | | $ | 14.89 | | | | | $ | 12.31 | | | | | $ | 12.58 | |
INCOME/(LOSS) FROM OPERATIONS: | | | | | | | | | | | | | | | | | | | | | | | | | | | | | | | | | | | | |
Net investment loss(c) | | | | | (0.24) | | | | | | (0.27) | | | | | | (0.30) | | | | | | (0.23) | | | | | | (0.08) | | | | | | (0.22) | |
Net realized and unrealized gain/(loss) on investments | | | | | (1.63) | | | | | | 3.02 | | | | | | 3.91 | | | | | | 1.26 | | | | | | 2.66 | | | | | | (0.05) | |
| | | | | | | | | | | | | | | | | | | | | | | | | | | | | | | | | | | | |
Total from Investment Operations | | | | | (1.87) | | | | | | 2.75 | | | | | | 3.61 | | | | | | 1.03 | | | | | | 2.58 | | | | | | (0.27) | |
| | | | | | | | | | | | | | | | | | | | | | | | | | | | | | | | | | | | |
| | | | | | | | | | | | |
LESS DISTRIBUTIONS: | | | | | | | | | | | | | | | | | | | | | | | | | | | | | | | | | | | | |
From capital gains | | | | | (0.47) | | | | | | (1.34) | | | | | | (1.61) | | | | | | (1.85) | | | | | | – | | | | | | – | |
| | | | | | | | | | | | | | | | | | | | | | | | | | | | | | | | | | | | |
Total Distributions | | | | | (0.47) | | | | | | (1.34) | | | | | | (1.61) | | | | | | (1.85) | | | | | | – | | | | | | – | |
| | | | | | | | | | | | | | | | | | | | | | | | | | | | | | | | | | | | |
NET INCREASE/(DECREASE) IN NET ASSET VALUE | | | | | (2.34) | | | | | | 1.41 | | | | | | 2.00 | | | | | | (0.82) | | | | | | 2.58 | | | | | | (0.27) | |
| | | | | | | | | | | | | | | | | | | | | | | | | | | | | | | | | | | | |
NET ASSET VALUE, END OF PERIOD | | | | $ | 15.14 | | | | | $ | 17.48 | | | | | $ | 16.07 | | | | | $ | 14.07 | | | | | $ | 14.89 | | | | | $ | 12.31 | |
| | | | | | | | | | | | | | | | | | | | | | | | | | | | | | | | | | | | |
| | | | | | | | | | | | |
TOTAL RETURN(d) | | | | | (10.87) | % | | | | | 17.58 | % | | | | | 25.19 | % | | | | | 8.43 | % | | | | | 20.96% | (e) | | | | | (2.15) | % |
RATIOS/SUPPLEMENTAL DATA: | | | | | | | | | | | | | | | | | | | | | | | | | | | | | | | | | | | | |
Net Assets, End of Period (000s) | | | | $ | 42,075 | | | | | $ | 15,427 | | | | | $ | 11,645 | | | | | $ | 4,946 | | | | | $ | 3,026 | | | | | $ | 2,743 | |
RATIOS TO AVERAGE NET ASSETS: | | | | | | | | | | | | | | | | | | | | | | | | | | | | | | | | | | | | |
Net Investment loss | | | | | (1.46) | % | | | | | (1.58) | % | | | | | (1.77) | % | | | | | (1.65) | % | | | | | (1.67)% | (f) | | | | | (1.68) | % |
Operating expenses excluding reimbursement/waiver | | | | | 1.81 | % | | | | | 1.94 | % | | | | | 1.96 | % | | | | | 2.03 | % | | | | | 2.01% | (f) | | | | | 2.01 | % |
Operating expenses including reimbursement/waiver | | | | | 1.81 | % | | | | | 1.94 | % | | | | | 1.94 | % | | | | | 1.94 | % | | | | | 1.94% | (f) | | | | | 1.94 | % |
PORTFOLIO TURNOVER RATE | | | | | 45% | (e) | | | | | 68 | % | | | | | 70 | % | | | | | 78 | % | | | | | 28% | (e) | | | | | 75 | % |
| (a) | Prior to its March 16, 2012 reorganization with and into the Emerald Growth Fund, the Fund was known as the Forward Growth Fund. |
| (b) | Effective March 13, 2012 the Board approved changing the fiscal year-end of the Fund from December 31 to April 30. |
| (c) | Per share amounts are based upon average shares outstanding. |
| (d) | Total return does not reflect the effect of sales charges. |
See Notes to Financial Statements.
| | |
| Annual Report | April 30, 2016 | | 39 |
| | |
| Emerald Growth Fund | | Financial Highlights |
| | For a share outstanding throughout the periods presented |
| | | | | | | | | | | | | | | | | | | | | | | | | | | | | | | | | | | | |
| | | | | | | | | | | | | | | INSTITUTIONAL CLASS | | | | | | |
| |
| | | Year Ended
April 30, 2016 | | | Year Ended
April 30, 2015 | | | Year Ended
April 30, 2014 | | | Year Ended
April 30, 2013 | | | For the Period
January 1, 2012 to
April 30, 2012(a)(b) | | | Year Ended
December 31, 2011 | |
NET ASSET VALUE, BEGINNING OF PERIOD | | | | $ | 20.54 | | | | | $ | 18.49 | | | | | $ | 15.86 | | | | | $ | 16.39 | | | | | $ | 13.51 | | | | | $ | 13.67 | |
INCOME/(LOSS) FROM OPERATIONS: | | | | | | | | | | | | | | | | | | | | | | | | | | | | | | | | | | | | |
Net investment loss(c) | | | | | (0.10) | | | | | | (0.12) | | | | | | (0.16) | | | | | | (0.11) | | | | | | (0.04) | | | | | | (0.10) | |
Net realized and unrealized gain/(loss) on investments | | | | | (1.93) | | | | | | 3.51 | | | | | | 4.40 | | | | | | 1.43 | | | | | | 2.92 | | | | | | (0.06) | |
| | | | | | | | | | | | | | | | | | | | | | | | | | | | | | | | | | | | |
Total from Investment Operations | | | | | (2.03) | | | | | | 3.39 | | | | | | 4.24 | | | | | | 1.32 | | | | | | 2.88 | | | | | | (0.16) | |
| | | | | | | | | | | | | | | | | | | | | | | | | | | | | | | | | | | | |
| | | | | | | | | | | | |
LESS DISTRIBUTIONS: | | | | | | | | | | | | | | | | | | | | | | | | | | | | | | | | | | | | |
From capital gains | | | | | (0.47) | | | | | | (1.34) | | | | | | (1.61) | | | | | | (1.85) | | | | | | – | | | | | | – | |
| | | | | | | | | | | | | | | | | | | | | | | | | | | | | | | | | | | | |
Total Distributions | | | | | (0.47) | | | | | | (1.34) | | | | | | (1.61) | | | | | | (1.85) | | | | | | – | | | | | | – | |
| | | | | | | | | | | | | | | | | | | | | | | | | | | | | | | | | | | | |
NET INCREASE/(DECREASE) IN NET ASSET VALUE | | | | | (2.50) | | | | | | 2.05 | | | | | | 2.63 | | | | | | (0.53) | | | | | | 2.88 | | | | | | (0.16) | |
| | | | | | | | | | | | | | | | | | | | | | | | | | | | | | | | | | | | |
NET ASSET VALUE, END OF PERIOD | | | | $ | 18.04 | | | | | $ | 20.54 | | | | | $ | 18.49 | | | | | $ | 15.86 | | | | | $ | 16.39 | | | | | $ | 13.51 | |
| | | | | | | | | | | | | | | | | | | | | | | | | | | | | | | | | | | | |
| | | | | | | | | | | | |
TOTAL RETURN | | | | | (9.97) | % | | | | | 18.77 | % | | | | | 26.35 | % | | | | | 9.47 | % | | | | | 21.32% | (d) | | | | | (1.17) | % |
RATIOS/SUPPLEMENTAL DATA: | | | | | | | | | | | | | | | | | | | | | | | | | | | | | | | | | | | | |
Net Assets, End of Period (000s) | | | | $ | 453,190 | | | | | $ | 174,107 | | | | | $ | 134,440 | | | | | $ | 86,238 | | | | | $ | 83,149 | | | | | $ | 64,930 | |
RATIOS TO AVERAGE NET ASSETS: | | | | | | | | | | | | | | | | | | | | | | | | | | | | | | | | | | | | |
Net Investment loss | | | | | (0.51) | % | | | | | (0.63) | % | | | | | (0.82) | % | | | | | (0.71) | % | | | | | (0.72)% | (e) | | | | | (0.72) | % |
Operating expenses excluding reimbursement/waiver | | | | | 0.87 | % | | | | | 0.99 | % | | | | | 1.00 | % | | | | | 1.08 | % | | | | | 1.06% | (e) | | | | | 1.06 | % |
Operating expenses including reimbursement/waiver | | | | | 0.87 | % | | | | | 0.99 | % | | | | | 0.99 | % | | | | | 0.99 | % | | | | | 0.99% | (e) | | | | | 0.99 | % |
PORTFOLIO TURNOVER RATE | | | | | 45% | (d) | | | | | 68 | % | | | | | 70 | % | | | | | 78 | % | | | | | 28% | (d) | | | | | 75 | % |
| (a) | Prior to its March 16, 2012 reorganization with and into the Emerald Growth Fund, the Fund was known as the Forward Growth Fund. |
| (b) | Effective March 13, 2012 the Board approved changing the fiscal year-end of the Fund from December 31 to April 30. |
| (c) | Per share amounts are based upon average shares outstanding. |
See Notes to Financial Statements.
| | |
| 40 | | www.emeraldmutualfunds.com |
| | |
| Emerald Growth Fund | | Financial Highlights |
| | For a share outstanding throughout the periods presented |
| | | | | | | | | | | | | | | | | | | | | | | | | | | | | | | | | | |
| | | | | | | | | | | | | | | INVESTOR CLASS | | | | |
| |
| | | Year Ended
April 30, 2016 | | | Year Ended
April 30, 2015 | | | Year Ended
April 30, 2014 | | | Year Ended
April 30, 2013 | | | For the Period
January 1, 2012 to
April 30, 2012(a)(b) | | | Period Ended
December 31, 2011(c) | |
NET ASSET VALUE, BEGINNING OF PERIOD | | | | $ | 19.97 | | | | | $ | 18.06 | | | | | $ | 15.57 | | | | | $ | 16.18 | | | | | $ | 13.35 | | | $ | 15.74 | |
INCOME/(LOSS) FROM OPERATIONS: | | | | | | | | | | | | | | | | | | | | | | | | | | | | | | | | | | |
Net investment loss(d) | | | | | (0.16) | | | | | | (0.17) | | | | | | (0.23) | | | | | | (0.16) | | | | | | (0.05) | | | | (0.09) | |
Net realized and unrealized gain/(loss) on investments | | | | | (1.88) | | | | | | 3.42 | | | | | | 4.33 | | | | | | 1.40 | | | | | | 2.88 | | | | (2.30) | |
| | | | | | | | | | | | | | | | | | | | | | | | | | | | | | | | | | |
Total from Investment Operations | | | | | (2.04) | | | | | | 3.25 | | | | | | 4.10 | | | | | | 1.24 | | | | | | 2.83 | | | | (2.39) | |
| | | | | | | | | | | | | | | | | | | | | | | | | | | | | | | | | | |
| | | | | | | | | | | |
LESS DISTRIBUTIONS: | | | | | | | | | | | | | | | | | | | | | | | | | | | | | | | | | | |
From capital gains | | | | | (0.47) | | | | | | (1.34) | | | | | | (1.61) | | | | | | (1.85) | | | | | | – | | | | – | |
| | | | | | | | | | | | | | | | | | | | | | | | | | | | | | | | | | |
Total Distributions | | | | | (0.47) | | | | | | (1.34) | | | | | | (1.61) | | | | | | (1.85) | | | | | | – | | | | – | |
| | | | | | | | | | | | | | | | | | | | | | | | | | | | | | | | | | |
NET INCREASE/(DECREASE) IN NET ASSET VALUE | | | | | (2.51) | | | | | | 1.91 | | | | | | 2.49 | | | | | | (0.61) | | | | | | 2.83 | | | | (2.39) | |
| | | | | | | | | | | | | | | | | | | | | | | | | | | | | | | | | | |
NET ASSET VALUE, END OF PERIOD | | | | $ | 17.46 | | | | | $ | 19.97 | | | | | $ | 18.06 | | | | | $ | 15.57 | | | | | $ | 16.18 | | | $ | 13.35 | |
| | | | | | | | | | | | | | | | | | | | | | | | | | | | | | | | | | |
| | | | | | | | | | | |
TOTAL RETURN | | | | | (10.36) | % | | | | | 18.44 | % | | | | | 25.93 | % | | | | | 9.08 | % | | | | | 21.20% | (e) | | | (15.18)% | (e) |
RATIOS/SUPPLEMENTAL DATA: | | | | | | | | | | | | | | | | | | | | | | | | | | | | | | | | | | |
Net Assets, End of Period (000s) | | | | $ | 112,526 | | | | | $ | 23,517 | | | | | $ | 15,870 | | | | | $ | 1,842 | | | | | $ | 1,085 | | | $ | 879 | |
RATIOS TO AVERAGE NET ASSETS: | | | | | | | | | | | | | | | | | | | | | | | | | | | | | | | | | | |
Net Investment loss | | | | | (0.84) | % | | | | | (0.91) | % | | | | | (1.18) | % | | | | | (1.05) | % | | | | | (1.07)% | (f) | | | (1.00)% | (f) |
Operating expenses excluding reimbursement/waiver | | | | | 1.19 | % | | | | | 1.27 | % | | | | | 1.34 | % | | | | | 1.43 | % | | | | | 1.41% | (f) | | | 1.43% | (f) |
Operating expenses including reimbursement/waiver | | | | | 1.19 | % | | | | | 1.27 | % | | | | | 1.34 | % | | | | | 1.34 | % | | | | | 1.34% | (f) | | | 1.34% | (f) |
PORTFOLIO TURNOVER RATE | | | | | 45% | (e) | | | | | 68 | % | | | | | 70 | % | | | | | 78 | % | | | | | 28% | (e) | | | 75% | (g) |
| (a) | Prior to its March 16, 2012 reorganization with and into the Emerald Growth Fund, the Fund was known as the Forward Growth Fund. |
| (b) | Effective March 13, 2012 the Board approved changing the fiscal year-end of the Fund from December 31 to April 30. |
| (c) | The Fund began offering Investor Class shares on May 2, 2011. |
| (d) | Per share amounts are based upon average shares outstanding. |
| (g) | Portfolio turnover is calculated at the Fund level and represents the year ended December 31, 2011. |
See Notes to Financial Statements.
| | |
| Annual Report | April 30, 2016 | | 41 |
| | |
| Emerald Small Cap Value Fund | | Financial Highlights |
| | For a share outstanding throughout the periods presented |
| | | | | | | | | | | | | | | | | | | | |
| | | CLASS A |
|
| | | For the Period
October 1, 2015 to
April 30, 2016(a) | | Period Ended
September 30, 2015(b) |
NET ASSET VALUE, BEGINNING OF PERIOD | | | | | | $ | 12.70 | | | | | | | | | $ | 14.12 | | | |
INCOME/(LOSS) FROM OPERATIONS: | | | | | | | | | | | | | | | | | | | | |
Net investment loss(c) | | | | | | | (0.09) | | | | | | | | | | (0.01) | | | |
Net realized and unrealized gain/(loss) on investments | | | | | | | 0.44 | | | | | | | | | | (1.03) | | | |
| | | | | | | | | | | | | | | | | | | | |
Total from Investment Operations | | | | | | | 0.35 | | | | | | | | | | (1.04) | | | |
| | | | | | | | | | | | | | | | | | | | |
| | | | | | |
LESS DISTRIBUTIONS: | | | | | | | | | | | | | | | | | | | | |
From investment income | | | | | | | (0.05) | | | | | | | | | | – | | | |
From capital gains | | | | | | | – | | | | | | | | | | (0.38) | | | |
| | | | | | | | | | | | | | | | | | | | |
Total Distributions | | | | | | | (0.05) | | | | | | | | | | (0.38) | | | |
| | | | | | | | | | | | | | | | | | | | |
NET INCREASE/(DECREASE) IN NET ASSET VALUE | | | | | | | 0.30 | | | | | | | | | | (1.42) | | | |
| | | | | | | | | | | | | | | | | | | | |
NET ASSET VALUE, END OF PERIOD | | | | | | $ | 13.00 | | | | | | | | | $ | 12.70 | | | |
| | | | | | | | | | | | | | | | | | | | |
| | | | | | |
TOTAL RETURN | | | | | | | 2.77% | (d) | | | | | | | | | (7.49)% | (d) | | |
RATIOS/SUPPLEMENTAL DATA: | | | | | | | | | | | | | | | | | | | | |
Net Assets, End of Period (000s) | | | | | | $ | 340 | | | | | | | | | $ | 14 | | | |
RATIOS TO AVERAGE NET ASSETS: | | | | | | | | | | | | | | | | | | | | |
Net Investment loss | | | | | | | (1.13)% | (e) | | | | | | | | | (0.24)% | (e) | | |
Operating expenses excluding reimbursement/waiver | | | | | | | 2.69% | (e) | | | | | | | | | 2.16% | (e) | | |
Operating expenses including reimbursement/waiver | | | | | | | 1.35% | (e) | | | | | | | | | 1.35% | (e) | | |
PORTFOLIO TURNOVER RATE | | | | | | | 31% | (d) | | | | | | | | | 69%(d) | (f) | | |
| (a) | Effective March 3, 2015 the Board approved changing the fiscal year-end of the Fund from September 30 to April 30. |
| (b) | Class A commenced operations on June 30, 2015. |
| (c) | Per share amounts are based upon average shares outstanding. |
| (f) | Portfolio turnover rate is calculated at the Fund level and represents the year ended September 30, 2015. |
See Notes to Financial Statements.
| | |
| 42 | | www.emeraldmutualfunds.com |
| | |
| Emerald Small Cap Value Fund | | Financial Highlights |
| | For a share outstanding throughout the periods presented |
| | | | | | | | | | | | | | | | |
| | | CLASS C |
|
| | | For the Period
October 1, 2015 to
April 30, 2016(a) | | Period Ended
September 30, 2015(b) |
NET ASSET VALUE, BEGINNING OF PERIOD | | | | $ | 12.68 | | | | | | | $ | 14.12 | | | |
INCOME/(LOSS) FROM OPERATIONS: | | | | | | | | | | | | | | | | |
Net investment loss(c) | | | | | (0.14) | | | | | | | | (0.03) | | | |
Net realized and unrealized gain/(loss) on investments | | | | | 0.43 | | | | | | | | (1.03) | | | |
| | | | | | | | | | | | | | | | |
Total from Investment Operations | | | | | 0.29 | | | | | | | | (1.06) | | | |
| | | | | | | | | | | | | | | | |
| | | | | | |
LESS DISTRIBUTIONS: | | | | | | | | | | | | | | | | |
From investment income | | | | | (0.03) | | | | | | | | – | | | |
From capital gains | | | | | – | | | | | | | | (0.38) | | | |
| | | | | | | | | | | | | | | | |
Total Distributions | | | | | (0.03) | | | | | | | | (0.38) | | | |
| | | | | | | | | | | | | | | | |
NET INCREASE/(DECREASE) IN NET ASSET VALUE | | | | | 0.26 | | | | | | | | (1.44) | | | |
| | | | | | | | | | | | | | | | |
NET ASSET VALUE, END OF PERIOD | | | | $ | 12.94 | | | | | | | $ | 12.68 | | | |
| | | | | | | | | | | | | | | | |
| | | | | | |
TOTAL RETURN | | | | | 2.28% | (d) | | | | | | | (7.63)% | (d) | | |
RATIOS/SUPPLEMENTAL DATA: | | | | | | | | | | | | | | | | |
Net Assets, End of Period (000s) | | | | $ | 566 | | | | | | | $ | 14 | | | |
RATIOS TO AVERAGE NET ASSETS: | | | | | | | | | | | | | | | | |
Net Investment loss | | | | | (2.06)% | (e) | | | | | | | (0.89)% | (e) | | |
Operating expenses excluding reimbursement/waiver | | | | | 3.37% | (e) | | | | | | | 2.81% | (e) | | |
Operating expenses including reimbursement/waiver | | | | | 2.00% | (e) | | | | | | | 2.00% | (e) | | |
PORTFOLIO TURNOVER RATE | | | | | 31% | (d) | | | | | | | 69%(d) | (f) | | |
| (a) | Effective March 3, 2015 the Board approved changing the fiscal year-end of the Fund from September 30 to April 30. |
| (b) | Class C commenced operations on June 30, 2015. |
| (c) | Per share amounts are based upon average shares outstanding. |
| (f) | Portfolio turnover rate is calculated at the Fund level and represents the year ended September 30, 2015. |
See Notes to Financial Statements.
| | |
| Annual Report | April 30, 2016 | | 43 |
| | |
| Emerald Small Cap Value Fund | | Financial Highlights |
| | For a share outstanding throughout the periods presented |
| | | | | | | | | | | | | | | | | | | | | | | | | | | | | | | | |
| | | INSTITUTIONAL CLASS | |
| |
| | | For the Period
October 1, 2015 to
April 30, 2016(a) | | | Year Ended
September 30, 2015(b) | | | Year Ended
September 30, 2014 | | | Period Ended
September 30, 2013(c) | |
NET ASSET VALUE, BEGINNING OF PERIOD | | | | | | $ | 12.71 | | | | | | | $ | 12.76 | | | | | | | $ | 12.56 | | | | | | | $ | 10.00 | |
INCOME FROM OPERATIONS: | | | | | | | | | | | | | | | | | | | | | | | | | | | | | | | | |
Net investment income/(loss)(d) | | | | | | | (0.01) | | | | | | | | 0.06 | | | | | | | | 0.09 | | | | | | | | 0.05 | |
Net realized and unrealized gain on investments | | | | | | | 0.38 | | | | | | | | 0.33 | | | | | | | | 0.76 | | | | | | | | 2.54 | |
| | | | | | | | | | | | | | | | | | | | | | | | | | | | | | | | |
Total from Investment Operations | | | | | | | 0.37 | | | | | | | | 0.39 | | | | | | | | 0.85 | | | | | | | | 2.59 | |
| | | | | | | | | | | | | | | | | | | | | | | | | | | | | | | | |
| | | | | | | | |
LESS DISTRIBUTIONS: | | | | | | | | | | | | | | | | | | | | | | | | | | | | | | | | |
From investment income | | | | | | | (0.06) | | | | | | | | (0.06) | | | | | | | | (0.01) | | | | | | | | (0.03) | |
From capital gains | | | | | | | – | | | | | | | | (0.38) | | | | | | | | (0.64) | | | | | | | | – | |
| | | | | | | | | | | | | | | | | | | | | | | | | | | | | | | | |
Total Distributions | | | | | | | (0.06) | | | | | | | | (0.44) | | | | | | | | (0.65) | | | | | | | | (0.03) | |
| | | | | | | | | | | | | | | | | | | | | | | | | | | | | | | | |
NET INCREASE/(DECREASE) IN NET ASSET VALUE | | | | | | | 0.31 | | | | | | | | (0.05) | | | | | | | | 0.20 | | | | | | | | 2.56 | |
| | | | | | | | | | | | | | | | | | | | | | | | | | | | | | | | |
NET ASSET VALUE, END OF PERIOD | | | | | | $ | 13.02 | | | | | | | $ | 12.71 | | | | | | | $ | 12.76 | | | | | | | $ | 12.56 | |
| | | | | | | | | | | | | | | | | | | | | | | | | | | | | | | | |
| | | | | | | | |
TOTAL RETURN | | | | | | | 2.94% | (e) | | | | | | | 2.93 | % | | | | | | | 6.64 | % | | | | | | | 25.99% | (e) |
SUPPLEMENTAL DATA: | | | | | | | | | | | | | | | | | | | | | | | | | | | | | | | | |
Net Assets, End of Period (000s) | | | | | | $ | 13,691 | | | | | | | $ | 16,507 | | | | | | | $ | 24,343 | | | | | | | $ | 8,442 | |
RATIOS TO AVERAGE NET ASSETS: | | | | | | | | | | | | | | | | | | | | | | | | | | | | | | | | |
Net Investment income/(loss) | | | | | | | (0.07)% | (f) | | | | | | | 0.45 | % | | | | | | | 0.65 | % | | | | | | | 0.48% | (f) |
Operating expenses excluding reimbursement/waiver | | | | | | | 1.75% | (f) | | | | | | | 1.43 | % | | | | | | | 1.29 | % | | | | | | | 1.95% | (f) |
Operating expenses including reimbursement/waiver | | | | | | | 1.00% | (f) | | | | | | | 1.00 | % | | | | | | | 1.00 | % | | | | | | | 1.00% | (f) |
PORTFOLIO TURNOVER RATE | | | | | | | 31% | (e) | | | | | | | 69 | % | | | | | | | 49 | % | | | | | | | 67% | (e) |
| (a) | Effective March 3, 2015 the Board approved changing the fiscal year-end of the Fund from September 30 to April 30. |
| (b) | Prior to its June 26, 2015 reorganization with and into the Emerald Small Cap Value Fund, the Fund was known as the Elessar Small Cap Value Fund. |
| (c) | For the period October 15, 2012 (commencement of investment operations) through September 30, 2013. |
| (d) | Per share amounts are based upon average shares outstanding. |
See Notes to Financial Statements.
| | |
| 44 | | www.emeraldmutualfunds.com |
| | |
| Emerald Small Cap Value Fund | | Financial Highlights |
| | For a share outstanding throughout the periods presented |
| | | | | | | | | | | | | | | | | | | | | | | | |
| | | | | INVESTOR CLASS | |
| | | For the Period
October 1, 2015 to
April 30, 2016(a) | | | Year Ended
September 30, 2015(b) | | | Year Ended
September 30, 2014 | | | Period Ended
September 30, 2013(c) | |
NET ASSET VALUE, BEGINNING OF PERIOD | | | | $ | 12.68 | | | | | $ | 12.73 | | | | | $ | 12.54 | | | | | $ | 10.00 | |
INCOME FROM OPERATIONS: | | | | | | | | | | | | | | | | | | | | | | | | |
Net investment income/(loss)(d) | | | | | (0.02) | | | | | | 0.03 | | | | | | 0.07 | | | | | | 0.02 | |
Net realized and unrealized gain on investments | | | | | 0.37 | | | | | | 0.35 | | | | | | 0.76 | | | | | | 2.54 | |
| | | | | | | | | | | | | | | | | | | | | | | | |
Total from Investment Operations | | | | | 0.35 | | | | | | 0.38 | | | | | | 0.83 | | | | | | 2.56 | |
| | | | | | | | | | | | | | | | | | | | | | | | |
| | | | | | | | |
LESS DISTRIBUTIONS: | | | | | | | | | | | | | | | | | | | | | | | | |
From investment income | | | | | (0.05) | | | | | | (0.05) | | | | | | – | | | | | | (0.02) | |
From capital gains | | | | | – | | | | | | (0.38) | | | | | | (0.64) | | | | | | – | |
| | | | | | | | | | | | | | | | | | | | | | | | |
Total Distributions | | | | | (0.05) | | | | | | (0.43) | | | | | | (0.64) | | | | | | (0.02) | |
| | | | | | | | | | | | | | | | | | | | | | | | |
NET INCREASE/(DECREASE) IN NET ASSET VALUE | | | | | 0.30 | | | | | | (0.05) | | | | | | 0.19 | | | | | | 2.54 | |
| | | | | | | | | | | | | | | | | | | | | | | | |
NET ASSET VALUE, END OF PERIOD | | | | $ | 12.98 | | | | | $ | 12.68 | | | | | $ | 12.73 | | | | | $ | 12.54 | |
| | | | | | | | | | | | | | | | | | | | | | | | |
| | | | | | | | |
TOTAL RETURN | | | | | 2.80%( | e) | | | | | 2.82 | % | | | | | 6.46 | % | | | | | 25.69%( | e) |
SUPPLEMENTAL DATA: | | | | | | | | | | | | | | | | | | | | | | | | |
Net Assets, End of Period (000s) | | | | $ | 1,946 | | | | | $ | 399 | | | | | $ | 474 | | | | | $ | 271 | |
RATIOS TO AVERAGE NET ASSETS: | | | | | | | | | | | | | | | | | | | | | | | | |
Net Investment income/(loss) | | | | | (0.25)% | (f) | | | | | 0.22 | % | | | | | 0.52 | % | | | | | 0.16% | (f) |
Operating expenses excluding reimbursement/waiver | | | | | 2.14% | (f) | | | | | 1.67 | % | | | | | 1.56 | % | | | | | 2.49% | (f) |
Operating expenses including reimbursement/waiver | | | | | 1.25% | (f) | | | | | 1.25 | % | | | | | 1.25 | % | | | | | 1.25% | (f) |
PORTFOLIO TURNOVER RATE | | | | | 31%( | e) | | | | | 69% | | | 49% | | | 67%( | e) |
| (a) | Effective March 3, 2015 the Board approved changing the fiscal year-end of the Fund from September 30 to April 30. |
| (b) | Prior to its June 26, 2015 reorganization with and into the Emerald Small Cap Value Fund, the Fund was known as the Elessar Small Cap Value Fund. |
| (c) | For the period October 15, 2012 (commencement of investment operations) through September 30, 2013. |
| (d) | Per share amounts are based upon average shares outstanding. |
See Notes to Financial Statements.
| | |
| Annual Report | April 30, 2016 | | 45 |
| | |
| Emerald Insights Fund | | Financial Highlights |
| | For a share outstanding throughout the period presented |
| | | | | | | | | | |
| | | CLASS A | |
| | | Year Ended
April 30, 2016 | | | For the Period
August 1, 2014
(Inception)
to April 30, 2015 | |
NET ASSET VALUE, BEGINNING OF PERIOD | | $ | 10.98 | | | | | $ | 10.00 | |
INCOME/(LOSS) FROM OPERATIONS: | | | | | | | | | | |
Net investment loss(a) | | | (0.05) | | | | | | (0.05) | |
Net realized and unrealized gain/(loss) on investments | | | (1.24) | | | | | | 1.03 | |
| | | | | | | | | | |
Total from Investment Operations | | | (1.29) | | | | | | 0.98 | |
| | | | | | | | | | |
| | | |
NET INCREASE/(DECREASE) IN NET ASSET VALUE | | | (1.29) | | | | | | 0.98 | |
| | | | | | | | | | |
NET ASSET VALUE, END OF PERIOD | | $ | 9.69 | | | | | $ | 10.98 | |
| | | | | | | | | | |
| | | |
TOTAL RETURN(b) | | | (11.75%) | | | | | | 9.80%(c) | |
RATIOS/SUPPLEMENTAL DATA: | | | | | | | | | | |
Net Assets, End of Period (000s) | | $ | 11,388 | | | | | $ | 6,493 | |
RATIOS TO AVERAGE NET ASSETS: | | | | | | | | | | |
Net Investment loss | | | (0.54%) | | | | | | (0.66%)(d | ) |
Operating expenses excluding reimbursement/waiver | | | 2.01% | | | | | | 2.57%(d)( | e) |
Operating expenses including reimbursement/waiver | | | 1.35% | | | | | | 1.35%(d)( | e) |
PORTFOLIO TURNOVER RATE | | | 99%(c | ) | | | | | 88%(c) | |
| (a) | Per share amounts are based upon average shares outstanding. |
| (b) | Total return does not reflect the effect of sales charges. |
| (e) | Expense ratios before reductions for startup costs may not be representative of longer term operating periods. |
See Notes to Financial Statements.
| | |
| 46 | | www.emeraldmutualfunds.com |
| | |
| Emerald Insights Fund | | Financial Highlights |
| | For a share outstanding throughout the period presented |
| | | | | | | | | | |
| | | CLASS C | |
| | | Year Ended April 30, 2016 | | | For the Period
August 1, 2014
(Inception)
to April 30, 2015 | |
NET ASSET VALUE, BEGINNING OF PERIOD | | $ | 10.92 | | | | | $ | 10.00 | |
INCOME/(LOSS) FROM OPERATIONS: | | | | | | | | | | |
Net investment loss(a) | | | (0.11) | | | | | | (0.10) | |
Net realized and unrealized gain/(loss) on investments | | | (1.25) | | | | | | 1.02 | |
| | | | | | | | | | |
Total from Investment Operations | | | (1.36) | | | | | | 0.92 | |
| | | | | | | | | | |
| | | |
NET INCREASE/(DECREASE) IN NET ASSET VALUE | | | (1.36) | | | | | | 0.92 | |
| | | | | | | | | | |
NET ASSET VALUE, END OF PERIOD | | $ | 9.56 | | | | | $ | 10.92 | |
| | | | | | | | | | |
| | | |
TOTAL RETURN(b) | | | (12.45%) | | | | | | 9.20%(c) | |
RATIOS/SUPPLEMENTAL DATA: | | | | | | | | | | |
Net Assets, End of Period (000s) | | $ | 101 | | | | | $ | 27 | |
RATIOS TO AVERAGE NET ASSETS: | | | | | | | | | | |
Net Investment loss | | | (1.17%) | | | | | | (1.34%)(d | ) |
Operating expenses excluding reimbursement/waiver | | | 2.70% | | | | | | 7.25%(d)( | e) |
Operating expenses including reimbursement/waiver | | | 2.00% | | | | | | 2.00%(d)( | e) |
PORTFOLIO TURNOVER RATE | | | 99%(c | ) | | | | | 88%(c) | |
| (a) | Per share amounts are based upon average shares outstanding. |
| (b) | Total return does not reflect the effect of sales charges. |
| (e) | Expense ratios before reductions for startup costs may not be representative of longer term operating periods. |
See Notes to Financial Statements.
| | |
| Annual Report | April 30, 2016 | | 47 |
| | |
| Emerald Insights Fund | | Financial Highlights |
| | For a share outstanding throughout the period presented |
| | | | | | | | | | |
| | | INSTITUTIONAL CLASS | |
| | | Year Ended
April 30, 2016 | | | For the Period
August 1, 2014
(Inception) to April 30, 2015 | |
NET ASSET VALUE, BEGINNING OF PERIOD | | $ | 10.99 | | | | | $ | 10.00 | |
INCOME/(LOSS) FROM OPERATIONS: | | | | | | | | | | |
Net investment loss(a) | | | (0.00)(b) | | | | | | (0.03) | |
Net realized and unrealized gain/(loss) on investments | | | (1.26) | | | | | | 1.02 | |
| | | | | | | | | | |
Total from Investment Operations | | | (1.26) | | | | | | 0.99 | |
| | | | | | | | | | |
| | | |
NET INCREASE/(DECREASE) IN NET ASSET VALUE | | | (1.26) | | | | | | 0.99 | |
| | | | | | | | | | |
NET ASSET VALUE, END OF PERIOD | | $ | 9.73 | | | | | $ | 10.99 | |
| | | | | | | | | | |
| | | |
TOTAL RETURN | | | (11.46%) | | | | | | 9.90%(c) | |
RATIOS/SUPPLEMENTAL DATA: | | | | | | | | | | |
Net Assets, End of Period (000s) | | $ | 1,729 | | | | | $ | 279 | |
RATIOS TO AVERAGE NET ASSETS: | | | | | | | | | | |
Net Investment loss | | | (0.05%) | | | | | | (0.34%)(d | ) |
Operating expenses excluding reimbursement/waiver | | | 1.90% | | | | | | 4.66%(d)( | e) |
Operating expenses including reimbursement/waiver | | | 1.05% | | | | | | 1.05%(d)( | e) |
PORTFOLIO TURNOVER RATE | | | 99%(c | ) | | | | | 88%(c) | |
| (a) | Per share amounts are based upon average shares outstanding. |
| (b) | Less than $0.005 per share. |
| (e) | Expense ratios before reductions for startup costs may not be representative of longer term operating periods. |
See Notes to Financial Statements.
| | |
| 48 | | www.emeraldmutualfunds.com |
| | |
| Emerald Insights Fund | | Financial Highlights |
| | For a share outstanding throughout the period presented |
| | | | | | | | | | | | |
| | | INVESTOR CLASS | |
| | | Year Ended
April 30, 2016 | | | For the Period
August 1, 2014
(Inception)
to April 30, 2015 | |
NET ASSET VALUE, BEGINNING OF PERIOD | | $ | 10.96 | | | | | | | $ | 10.00 | |
INCOME/(LOSS) FROM OPERATIONS: | | | | | | | | | | | | |
Net investment loss(a) | | | (0.08) | | | | | | | | (0.05) | |
Net realized and unrealized gain/(loss) on investments | | | (1.21) | | | | | | | | 1.01 | |
| | | | | | | | | | | | |
Total from Investment Operations | | | (1.29) | | | | | | | | 0.96 | |
| | | | | | | | | | | | |
| | | |
NET INCREASE/(DECREASE) IN NET ASSET VALUE | | | (1.29) | | | | | | | | 0.96 | |
| | | | | | | | | | | | |
NET ASSET VALUE, END OF PERIOD | | $ | 9.67 | | | | | | | $ | 10.96 | |
| | | | | | | | | | | | |
| | | |
TOTAL RETURN | | | (11.77%) | | | | | | | | 9.60%(b | ) |
RATIOS/SUPPLEMENTAL DATA: | | | | | | | | | | | | |
Net Assets, End of Period (000s) | | $ | 86 | | | | | | | $ | 448 | |
RATIOS TO AVERAGE NET ASSETS: | | | | | | | | | | | | |
Net Investment loss | | | (0.72%) | | | | | | | | (0.67%)(c) | |
Operating expenses excluding reimbursement/waiver | | | 1.91% | | | | | | | | 2.96%(c)( | d) |
Operating expenses including reimbursement/waiver | | | 1.40% | | | | | | | | 1.40%(c)( | d) |
PORTFOLIO TURNOVER RATE | | | 99%(b | ) | | | | | | | 88%(b) | |
| (a) | Per share amounts are based upon average shares outstanding. |
| (d) | Expense ratios before reductions for startup costs may not be representative of longer term operating periods. |
See Notes to Financial Statements.
| | |
| Annual Report | April 30, 2016 | | 49 |
| | |
| Emerald Banking and Finance Fund | | Financial Highlights |
| | For a share outstanding throughout the periods presented |
| | | | | | | | | | | | | | | | | | | | | | | | | | | | | | | | | | | | | | | | | | | | | | |
| | | | | CLASS A |
|
Year Ended April 30, 2016 | | | Year Ended
April 30, 2015 | | | Year Ended
April 30, 2014 | | | Year Ended
April 30, 2013 | | | For the Period
January 1, 2012 to
April 30, 2012(a)(b) | | | Year Ended
December 31, 2011 |
NET ASSET VALUE, BEGINNING OF PERIOD | | | | $ | 28.85 | | | | | | | $ | 26.11 | | | | | | | $ | 20.08 | | | | | | | $ | 16.96 | | | | | | | $ | 15.16 | | | | | $ 15.89 | | | | |
INCOME/(LOSS) FROM OPERATIONS:(c) | | | | | | | | | | | | | | | | | | | | | | | | | | | | | | | | | | | | | | | | | | | | | | |
Net investment loss(d) | | | | | (0.06) | | | | | | | | (0.16) | | | | | | | | (0.13) | | | | | | | | (0.01) | | | | | | | | (0.01) | | | | | (0.03) | | | | |
Net realized and unrealized gain/(loss) on investments | | | | | 2.48 | | | | | | | | 2.90 | | | | | | | | 6.16 | | | | | | | | 3.13 | | | | | | | | 1.81 | | | | | (0.70) | | | | |
| | | | | | | | | | | | | | | | | | | | | | | | | | | | | | | | | | | | | | | | | | | | |
Total from Investment Operations | | | | | 2.42 | | | | | | | | 2.74 | | | | | | | | 6.03 | | | | | | | | 3.12 | | | | | | | | 1.80 | | | | | (0.73) | | | | |
| | | | | | | | | | | | | | | | | | | | | | | | | | | | | | | | | | | | | | | | | | | | |
| | | | | | | | | | | | | | |
NET INCREASE/(DECREASE) IN NET ASSET VALUE | | | | | 2.42 | | | | | | | | 2.74 | | | | | | | | 6.03 | | | | | | | | 3.12 | | | | | | | | 1.80 | | | | | (0.73) | | | | |
| | | | | | | | | | | | | | | | | | | | | | | | | | | | | | | | | | | | | | | | | | | | |
NET ASSET VALUE, END OF PERIOD | | | | $ | 31.27 | | | | | | | $ | 28.85 | | | | | | | $ | 26.11 | | | | | | | $ | 20.08 | | | | | | | $ | 16.96 | | | | | $ 15.16 | | | | |
| | | | | | | | | | | | | | | | | | | | | | | | | | | | | | | | | | | | | | | | | | | | |
| | | | | | | | |
TOTAL RETURN(e) | | | | | 8.39% | | | | 10.49% | | | | 30.03% | | | | 18.40% | | | | 11.87% | (f) | | | | (4.59)% |
RATIOS/SUPPLEMENTAL DATA: | | | | | | | | | | | | | | | | | | | | | | | | | | | | | | | | | | | | | | | | | | | | | | |
Net Assets, End of Period (000s) | | | | $ | 110,601 | | | | | | | $ | 48,575 | | | | | | | $ | 48,622 | | | | | | | $ | 25,496 | | | | | | | $ | 21,363 | | | | | $20,412 | | |
RATIOS TO AVERAGE NET ASSETS: | | | | | | | | | | | | | | | | | | | | | | | | | | | | | | | | | | | | | | | | | | | | | | |
Net Investment loss | | | | | (0.21)% | | | | (0.58)% | | | | (0.53)% | | | | (0.06)% | | | | (0.24)% | (g) | | | | (0.22)% |
Operating expenses excluding reimbursement/waiver | | | | | 1.48% | | | | 1.60% | | | | 1.72% | | | | 1.88% | | | | 1.96% | (g) | | | | 1.90% |
Operating expenses including reimbursement/waiver | | | | | 1.48% | | | | 1.60% | | | | 1.72% | | | | 1.84% | | | | 1.85% | (g) | | | | n/a |
PORTFOLIO TURNOVER RATE | | | | | 30%(f) | | | | 33% | | | | 34% | | | | 53% | | | | 9% | (f) | | | | 27% |
| (a) | Prior to its March 16, 2012 reorganization with and into the Emerald Banking and Finance Fund, the Fund was known as the Forward Banking and Finance Fund. |
| (b) | Effective March 13, 2012 the Board approved changing the fiscal year-end of the Fund from December 31 to April 30. |
| (c) | The amount shown for a share outstanding throughout the period may not correlate with the Statement of Operations for the period due to the timing of sales and redemptions of Fund shares in relation to income earned and/or fluctuating market value of the investments of the Fund. |
| (d) | Per share amounts are based upon average shares outstanding. |
| (e) | Total return does not reflect the effect of sales charges. |
See Notes to Financial Statements.
| | |
| 50 | | www.emeraldmutualfunds.com |
| | |
| Emerald Banking and Finance Fund | | Financial Highlights |
| | For a share outstanding throughout the periods presented |
| | | | | | | | | | | | | | | | | | | | | | | | | | | | | | | | | | | | | | | | | | | | | | |
| | | | | CLASS C |
|
Year Ended April 30, 2016 | | | Year Ended
April 30, 2015 | | | Year Ended
April 30, 2014 | | | Year Ended
April 30, 2013 | | | For the Period
January 1, 2012 to
April 30, 2012(a)(b) | | | Year Ended
December 31, 2011 |
NET ASSET VALUE, BEGINNING OF PERIOD | | | | $ | 26.19 | | | | | | | $ | 23.86 | | | | | | | $ | 18.46 | | | | | | | $ | 15.70 | | | | | | | $ | 14.06 | | | | | $ 14.82 | | | | |
INCOME/(LOSS) FROM OPERATIONS:(c) | | | | | | | | | | | | | | | | | | | | | | | | | | | | | | | | | | | | | | | | | | | | | | |
Net investment loss(d) | | | | | (0.24) | | | | | | | | (0.30) | | | | | | | | (0.26) | | | | | | | | (0.11) | | | | | | | | (0.04) | | | | | (0.11) | | | | |
Net realized and unrealized gain/(loss) on investments | | | | | 2.25 | | | | | | | | 2.63 | | | | | | | | 5.66 | | | | | | | | 2.87 | | | | | | | | 1.68 | | | | | (0.65) | | | | |
| | | | | | | | | | | | | | | | | | | | | | | | | | | | | | | | | | | | | | | | | | | | |
Total from Investment Operations | | | | | 2.01 | | | | | | | | 2.33 | | | | | | | | 5.40 | | | | | | | | 2.76 | | | | | | | | 1.64 | | | | | (0.76) | | | | |
| | | | | | | | | | | | | | | | | | | | | | | | | | | | | | | | | | | | | | | | | | | | |
| | | | | | | | | | | | | | |
NET INCREASE/(DECREASE) IN NET ASSET VALUE | | | | | 2.01 | | | | | | | | 2.33 | | | | | | | | 5.40 | | | | | | | | 2.76 | | | | | | | | 1.64 | | | | | (0.76) | | | | |
| | | | | | | | | | | | | | | | | | | | | | | | | | | | | | | | | | | | | | | | | | | | |
NET ASSET VALUE, END OF PERIOD | | | | $ | 28.20 | | | | | | | $ | 26.19 | | | | | | | $ | 23.86 | | | | | | | $ | 18.46 | | | | | | | $ | 15.70 | | | | | $ 14.06 | | | | |
| | | | | | | | | | | | | | | | | | | | | | | | | | | | | | | | | | | | | | | | | | | | |
| | | | | | | | |
TOTAL RETURN(e) | | | | | 7.67% | | | | 9.77% | | | | 29.25% | | | | 17.58% | | | | 11.66% | (f) | | | | (5.13)% |
RATIOS/SUPPLEMENTAL DATA: | | | | | | | | | | | | | | | | | | | | | | | | | | | | | | | | | | | | | | | | | | | | | | |
Net Assets, End of Period (000s) | | | | $ | 52,366 | | | | | | | $ | 31,862 | | | | | | | $ | 28,222 | | | | | | | $ | 17,705 | | | | | | | $ | 14,690 | | | | | $13,675 | | |
RATIOS TO AVERAGE NET ASSETS: | | | | | | | | | | | | | | | | | | | | | | | | | | | | | | | | | | | | | | | | | | | | | | |
Net Investment loss | | | | | (0.87)% | | | | (1.23)% | | | | (1.18)% | | | | (0.68)% | | | | (0.82)% | (g) | | | | (0.77)% |
Operating expenses excluding reimbursement/waiver | | | | | 2.13% | | | | 2.25% | | | | 2.38% | | | | 2.54% | | | | 2.55% | (g) | | | | 2.45% |
Operating expenses including reimbursement/waiver | | | | | 2.13% | | | | 2.25% | | | | 2.38% | | | | 2.49% | | | | 2.44% | (g) | | | | n/a |
PORTFOLIO TURNOVER RATE | | | | | 30%(f) | | | | 33% | | | | 34% | | | | 53% | | | | 9% | (f) | | | | 27% |
| (a) | Prior to its March 16, 2012 reorganization with and into the Emerald Banking and Finance Fund, the Fund was known as the Forward Banking and Finance Fund. |
| (b) | Effective March 13, 2012 the Board approved changing the fiscal year-end of the Fund from December 31 to April 30. |
| (c) | The amount shown for a share outstanding throughout the period may not correlate with the Statement of Operations for the period due to the timing of sales and redemptions of Fund shares in relation to income earned and/or fluctuating market value of the investments of the Fund. |
| (d) | Per share amounts are based upon average shares outstanding. |
| (e) | Total return does not reflect the effect of sales charges. |
See Notes to Financial Statements.
| | |
| Annual Report | April 30, 2016 | | 51 |
| | |
| Emerald Banking and Finance Fund | | Financial Highlights |
| | For a share outstanding throughout the periods presented |
| | | | | | | | | | | | | | | | | | | | | | | | | | | | | | | | |
| | | | | INSTITUTIONAL CLASS | | | |
| | | Year Ended
April 30, 2016 | | | Year Ended
April 30, 2015 | | | Year Ended
April 30, 2014 | | | Year Ended
April 30, 2013 | | | For the Period
March 16, 2012 to
April 30, 2012(a) |
NET ASSET VALUE, BEGINNING OF PERIOD | | | | $ | 29.15 | | | | | $ | 26.29 | | | | | $ | 20.15 | | | | | $ | 16.96 | | | | | $ | 16.85 | | | |
INCOME/(LOSS) FROM OPERATIONS: | | | | | | | | | | | | | | | | | | | | | | | | | | | | | | | | |
Net investment income/(loss)(b) | | | | | 0.03 | | | | | | (0.07) | | | | | | (0.06) | | | | | | 0.01 | | | | | | (0.01) | | | |
Net realized and unrealized gain on investments | | | | | 2.51 | | | | | | 2.93 | | | | | | 6.20 | | | | | | 3.18 | | | | | | 0.12 | | | |
| | | | | | | | | | | | | | | | | | | | | | | | | | | | | | | | |
Total from Investment Operations | | | | | 2.54 | | | | | | 2.86 | | | | | | 6.14 | | | | | | 3.19 | | | | | | 0.11 | | | |
| | | | | | | | | | | | | | | | | | | | | | | | | | | | | | | | |
| | | | | | | | | | | |
NET INCREASE IN NET ASSET VALUE | | | | | 2.54 | | | | | | 2.86 | | | | | | 6.14 | | | | | | 3.19 | | | | | | 0.11 | | | |
| | | | | | | | | | | | | | | | | | | | | | | | | | | | | | | | |
NET ASSET VALUE, END OF PERIOD | | | | $ | 31.69 | | | | | $ | 29.15 | | | | | $ | 26.29 | | | | | $ | 20.15 | | | | | $ | 16.96 | | | |
| | | | | | | | | | | | | | | | | | | | | | | | | | | | | | | | |
| | | | | | | | | | |
TOTAL RETURN | | | | | 8.71 | % | | | | | 10.88 | % | | | | | 30.47 | % | | | | | 18.81 | % | | | | | 0.65%(c) |
RATIOS/SUPPLEMENTAL DATA: | | | | | | | | | | | | | | | | | | | | | | | | | | | | | | | | |
Net Assets, End of Period (000s) | | | | $ | 61,654 | | | | | $ | 23,730 | | | | | $ | 22,062 | | | | | $ | 4,321 | | | | | $ | 8 | | | |
RATIOS TO AVERAGE NET ASSETS: | | | | | | | | | | | | | | | | | | | | | | | | | | | | | | | | |
Net Investment income/(loss) | | | | | 0.11 | % | | | | | (0.25) | % | | | | | (0.23) | % | | | | | 0.06 | % | | | | | (0.27)%(d) |
Operating expenses excluding reimbursement/waiver | | | | | 1.15 | % | | | | | 1.27 | % | | | | | 1.37 | % | | | | | 1.62 | % | | | | | 1.83%(d) |
Operating expenses including reimbursement/waiver | | | | | 1.15 | % | | | | | 1.27 | % | | | | | 1.37 | % | | | | | 1.54 | % | | | | | 1.53%(d) |
PORTFOLIO TURNOVER RATE | | | | | 30% | (c) | | | | | 33 | % | | | | | 34 | % | | | | | 53 | % | | | | | 9%(c)(e) |
| (a) | The Fund began offering Institutional Class shares on March 16, 2012. |
| (b) | Per share amounts are based upon average shares outstanding. |
| (e) | Portfolio turnover rate is calculated at the Fund level and represents the period ended April 30, 2012. |
See Notes to Financial Statements.
| | |
| 52 | | www.emeraldmutualfunds.com |
| | |
| Emerald Banking and Finance Fund | | Financial Highlights |
| | For a share outstanding throughout the periods presented |
| | | | | | | | | | | | | | | | | | | | | | | | | | | | | | | | | | | | | | |
| | | INVESTOR CLASS |
| | | Year Ended
April 30, 2016 | | | Year Ended
April 30, 2015 | | | Year Ended
April 30, 2014 | | | Year Ended
April 30, 2013 | | | For the Period
January 1, 2012 to
April 30, 2012(a)(b) | | | Year Ended
December 31, 2011 |
NET ASSET VALUE, BEGINNING OF PERIOD | | | | $ | 27.64 | | | | | $ | 25.01 | | | | | $ | 19.23 | | | | | $ | 16.25 | | | | | $ | 14.50 | | | | | $ | 15.14 | | | |
INCOME/(LOSS) FROM OPERATIONS:(c) | | | | | | | | | | | | | | | | | | | | | | | | | | | | | | | | | | | | | | |
Net investment income/(loss)(d) | | | | | (0.07) | | | | | | (0.15) | | | | | | (0.12) | | | | | | (0.01) | | | | | | (0.00)(e) | | | | | | 0.07 | | | |
Net realized and unrealized gain/(loss) on investments | | | | | 2.38 | | | | | | 2.78 | | | | | | 5.90 | | | | | | 2.99 | | | | | | 1.75 | | | | | | (0.71) | | | |
| | | | | | | | | | | | | | | | | | | | | | | | | | | | | | | | | | | | | | |
Total from Investment Operations | | | | | 2.31 | | | | | | 2.63 | | | | | | 5.78 | | | | | | 2.98 | | | | | | 1.75 | | | | | | (0.64) | | | |
| | | | | | | | | | | | | | | | | | | | | | | | | | | | | | | | | | | | | | |
| | | | | | | | | | | | | |
NET INCREASE/(DECREASE) IN NET ASSET VALUE | | | | | 2.31 | | | | | | 2.63 | | | | | | 5.78 | | | | | | 2.98 | | | | | | 1.75 | | | | | | (0.64) | | | |
| | | | | | | | | | | | | | | | | | | | | | | | | | | | | | | | | | | | | | |
NET ASSET VALUE, END OF PERIOD | | | | $ | 29.95 | | | | | $ | 27.64 | | | | | $ | 25.01 | | | | | $ | 19.23 | | | | | $ | 16.25 | | | | | $ | 14.50 | | | |
| | | | | | | | | | | | | | | | | | | | | | | | | | | | | | | | | | | | | | |
| | | | | | | | | | | | |
TOTAL RETURN | | | | | 8.36 | % | | | | | 10.52 | % | | | | | 30.06 | % | | | | | 18.34 | % | | | | | 12.07% | (f) | | | | | (4.23)% |
RATIOS/SUPPLEMENTAL DATA: | | | | | | | | | | | | | | | | | | | | | | | | | | | | | | | | | | | | | | |
Net Assets, End of Period (000s) | | | | $ | 80,404 | | | | | $ | 27,440 | | | | | $ | 19,235 | | | | | $ | 6,255 | | | | | $ | 693 | | | | | $ | 136 | | | |
RATIOS TO AVERAGE NET ASSETS: | | | | | | | | | | | | | | | | | | | | | | | | | | | | | | | | | | | | | | |
Net Investment income/(loss) | | | | | (0.23) | % | | | | | (0.56) | % | | | | | (0.53) | % | | | | | (0.08) | % | | | | | (0.07)% | (g) | | | | | 0.47% |
Operating expenses excluding reimbursement/waiver | | | | | 1.48 | % | | | | | 1.58 | % | | | | | 1.69 | % | | | | | 1.94 | % | | | | | 1.88% | (g) | | | | | 1.48% |
Operating expenses including reimbursement/waiver | | | | | 1.48 | % | | | | | 1.58 | % | | | | | 1.69 | % | | | | | 1.89 | % | | | | | 1.72% | (g) | | | | | n/a |
PORTFOLIO TURNOVER RATE | | | | | 30% | (f) | | | | | 33 | % | | | | | 34 | % | | | | | 53 | % | | | | | 9% | (f) | | | | | 27% |
| (a) | Prior to its March 16, 2012 reorganization with and into the Emerald Banking and Finance Fund, the Fund was known as the Forward Banking and Finance Fund. |
| (b) | Effective March 13, 2012 the Board approved changing the fiscal year-end of the Fund from December 31 to April 30. |
| (c) | The amount shown for a share outstanding throughout the period may not correlate with the Statement of Operations for the period due to the timing of sales and redemptions of Fund shares in relation to income earned and/or fluctuating market value of the investments of the Fund. |
| (d) | Per share amounts are based upon average shares outstanding. |
| (e) | Less than $0.005 per share. |
See Notes to Financial Statements.
| | |
| Annual Report | April 30, 2016 | | 53 |
| | |
| Emerald Funds | | Notes to Financial Statements |
| | April 30, 2016 |
1. ORGANIZATION
Financial Investors Trust (the “Trust”), a Delaware statutory trust, is an open-end management investment company registered under the Investment Company Act of 1940, as amended (the “1940 Act”). As of April 30, 2016, the Trust had 34 registered funds. This annual report describes the Emerald Growth Fund, Emerald Small Cap Value Fund, Emerald Insights Fund, and Emerald Banking and Finance Fund (each a “Fund” and collectively, the “Funds”). Prior to March 16, 2012, the Emerald Banking and Finance Fund was known as the Forward Banking and Finance Fund and the Emerald Growth Fund was known as the Forward Growth Fund. Effective March 13, 2012, the Board of Trustees (the “Board”) approved changing the fiscal year end of the Funds from December 31 to April 30. The Emerald Small Cap Value Fund is a successor to a previously operational fund which was a series of Elessar Funds Investment Trust, a Delaware statutory trust, and was organized into a series of the Trust effective as of the close of business on June 26, 2015. Effective March 3, 2015, the Board approved changing the fiscal year end of the Emerald Small Cap Value Fund from September 30 to April 30.
The Emerald Growth Fund and Emerald Insights Fund seek to achieve long-term growth through capital appreciation. The Emerald Small Cap Value Fund seeks long-term capital appreciation. The Emerald Banking and Finance Fund seeks to achieve long term growth through capital appreciation with income as a secondary objective.
2. SIGNIFICANT ACCOUNTING POLICIES
The accompanying financial statements were prepared in accordance with accounting principles generally accepted in the United States of America (“U.S. GAAP”). The preparation of financial statements in conformity with U.S. GAAP requires management to make certain estimates and assumptions that affect the reported amounts of assets and liabilities and disclosures of contingent assets and liabilities at the date of the financial statements and the reported amounts of revenue and expenses during the period. Actual results could differ from those estimates. The Funds are considered an investment company for financial reporting purposes under U.S. GAAP. The following is a summary of significant accounting policies consistently followed by the Funds in preparation of their financial statements.
Investment Valuation: The Funds generally value their securities based on market prices determined at the close of regular trading on the New York Stock Exchange (“NYSE”), normally, 4:00 p.m. Eastern time, on each business day the NYSE is open for trading.
For equity securities and mutual funds that are traded on an exchange, the market price is usually the closing sale or official closing price on that exchange. In the case of equity securities not traded on an exchange, or if such closing prices are not otherwise available, the securities are valued at the mean of the most recent bid and ask prices on such day. Redeemable securities issued by open-end registered investment companies are valued at the investment company’s applicable net asset value.
The market price for debt obligations is generally the price supplied by an independent third-party pricing service approved by the Board of Trustees (the “Board”), which may use a matrix, formula or other objective method that takes into consideration quotations from dealers, market transactions in comparable investments, market indices and yield curves. If vendors are unable to supply a price, or if the price supplied is deemed to be unreliable, the market price may be determined using quotations received from one or more brokers–dealers that make a market in the security. Short–term debt obligations that will mature in 60 days or less are valued at amortized cost, unless it is determined that using this method would not reflect an investment’s fair value. Investments in non-exchange traded funds are fair valued at their respective net asset values.
Equity securities that are primarily traded on foreign securities exchanges are valued at the preceding closing values of such securities on their respective exchanges, except when an occurrence subsequent to the time a value was so established is likely to have changed such value. In such an event, the fair values of those securities are determined in good faith through consideration of other factors in accordance with procedures established by and under the general supervision of the Board.
When such prices or quotations are not available, or when Emerald Mutual Fund Advisers Trust, (the “Adviser”), believes that they are unreliable, securities may be priced using fair value procedures approved by the Board.
Fair Value Measurements: A three-tier hierarchy has been established to classify fair value measurements for disclosure purposes. Inputs refer broadly to the assumptions that market participants would use in pricing the asset or liability, including assumptions about risk. Inputs may be observable or unobservable. Observable inputs are inputs that reflect the assumptions market participants would use in pricing the asset or liability that are developed based on market data obtained from sources independent of the reporting entity. Unobservable inputs are inputs that reflect the reporting entity’s own assumptions about the assumptions market participants would use in pricing the asset or liability that are developed based on the best information available. Various inputs are used in determining the value of each Fund’s investments as of the reporting period end. The designated input levels are not necessarily an indication of the risk or liquidity associated with these investments.
| | |
| 54 | | www.emeraldmutualfunds.com |
| | |
| Emerald Funds | | Notes to Financial Statements |
| | April 30, 2016 |
These inputs are categorized in the following hierarchy under applicable financial accounting standards:
| | |
Level 1 – | | Unadjusted quoted prices in active markets for identical investments, unrestricted assets or liabilities that the Funds have the ability to access at the measurement date; |
Level 2 – | | Quoted prices which are not active, quoted prices for similar assets or liabilities in active markets or inputs other than quoted prices that are observable (either directly or indirectly) for substantially the full term of the asset or liability; and |
Level 3 – | | Significant unobservable prices or inputs (including the Funds’ own assumptions in determining the fair value of investments) where there is little or no market activity for the asset or liability at the measurement date. |
The following is a summary of each input used to value the Funds as of April 30, 2016:
| | | | | | | | | | | | | | | | |
| Investments in Securities at Value | | Level 1 -
Quoted Prices | | | Level 2 -
Other Significant
Observable Inputs | | | Level 3 -
Significant
Unobservable
Inputs | | | Total | |
| |
Emerald Growth Fund | | | | | | | | | | | | | | | | |
Common Stocks(a) | | $ | 909,366,190 | | | $ | – | | | $ | – | | | $ | 909,366,190 | |
Short Term Investments | | | 16,331,904 | | | | – | | | | – | | | | 16,331,904 | |
| |
TOTAL | | $ | 925,698,094 | | | $ | – | | | $ | – | | | $ | 925,698,094 | |
| |
| | | | |
| Investments in Securities at Value | | Level 1 -
Quoted Prices | | | Level 2 -
Other Significant
Observable Inputs | | | Level 3 -
Significant
Unobservable
Inputs | | | Total | |
| |
Emerald Small Cap Value Fund | | | | | | | | | | | | | | | | |
Common Stocks(a) | | $ | 15,737,485 | | | $ | – | | | $ | – | | | $ | 15,737,485 | |
Short Term Investments | | | 764,627 | | | | – | | | | – | | | | 764,627 | |
| |
TOTAL | | $ | 16,502,112 | | | $ | – | | | $ | – | | | $ | 16,502,112 | |
| |
| | | | |
| Investments in Securities at Value | | Level 1 -
Quoted Prices | | | Level 2 -
Other Significant
Observable Inputs | | | Level 3 -
Significant
Unobservable
Inputs | | | Total | |
| |
Emerald Insights Fund | | | | | | | | | | | | | | | | |
Common Stocks(a) | | $ | 12,915,696 | | | $ | – | | | $ | – | | | $ | 12,915,696 | |
Master Limited Partnerships(a) | | | 243,302 | | | | – | | | | – | | | | 243,302 | |
Short Term Investments | | | 266,809 | | | | – | | | | – | | | | 266,809 | |
| |
TOTAL | | $ | 13,425,807 | | | $ | – | | | $ | – | | | $ | 13,425,807 | |
| |
| | | | |
| Investments in Securities at Value | | Level 1 -
Quoted Prices | | | Level 2 -
Other Significant
Observable Inputs | | | Level 3 -
Significant
Unobservable
Inputs | | | Total | |
| |
Emerald Banking and Finance Fund | | | | | | | | | | | | | | | | |
Common Stocks | | | | | | | | | | | | | | | | |
Banks: Diversified | | $ | 239,807,170 | | | $ | 3,784,744 | | | $ | – | | | $ | 243,591,914 | |
Other(a) | | | 60,031,915 | | | | – | | | | – | | | | 60,031,915 | |
Short Term Investments | | | 3,008,620 | | | | – | | | | – | | | | 3,008,620 | |
| |
TOTAL | | $ | 302,847,705 | | | $ | 3,784,744 | | | $ | – | | | $ | 306,632,449 | |
| |
| (a) | For detailed descriptions of sector and industry, see the accompanying Schedule of Investments. |
| | |
| Annual Report | April 30, 2016 | | 55 |
| | |
| Emerald Funds | | Notes to Financial Statements |
| | April 30, 2016 |
The Funds recognize transfers between levels as of the end of the period. For the year ended April 30, 2016, the Funds had the following transfers between Level 1 and Level 2 securities.
| | | | | | | | | | | | | | | | | | | | | | |
| | | Level 1 | | | | | Level 2 | |
| Emerald Growth Fund | | Transfer In | | | | | Transfers (Out) | | | | | Transfer In | | | | | Transfers (Out) | |
| |
Common Stocks | | $ | 3,136,350 | | | | | $ | – | | | | | $ | – | | | | | $ | (3,136,350) | |
| |
Total | | $ | 3,136,350 | | | | | $ | – | | | | | $ | – | | | | | $ | (3,136,350) | |
| |
| | | |
| | | Level 1 | | | | | Level 2 | |
| Emerald Banking and Finance Fund | | Transfer In | | | | | Transfers (Out) | | | | | Transfer In | | | | | Transfers (Out) | |
| |
Common Stocks | | $ | 9,626,994 | | | | | $ | – | | | | | $ | – | | | | | $ | (9,626,994) | |
| |
Total | | $ | 9,626,994 | | | | | $ | – | | | | | $ | – | | | | | $ | (9,626,994) | |
| |
The above transfers from Level 2 to Level 1 were due to the ability to obtain a closing market price within an active market for a security that previously had no market to trade. For the year or period ended April 30, 2016, the Emerald Small Cap Value Fund and Emerald Insights Fund did not have any transfers between Level 1 and Level 2 securities.
For the year or period ended April 30, 2016, the Funds did not have any securities that used significant unobservable inputs (Level 3) in determining fair value.
Investment Transactions and Investment Income: Investment transactions are accounted for on the date the investments are purchased or sold (trade date). Realized gains and losses from investment transactions are reported on an identified cost basis, which is the same basis the Funds use for federal income tax purposes. Interest income, which includes accretion of discounts, is accrued and recorded as earned. Dividend income is recognized on the ex-dividend date or for certain foreign securities, as soon as information is available to the Funds. All of the realized and unrealized gains and losses and net investment income, are allocated daily to each class in proportion to its average daily net assets.
Real Estate Investment Trusts (“REITs”): The Funds may invest a portion of their assets in REITs and are subject to certain risks associated with direct investment in REITs. REITs may be affected by changes in the value of their underlying properties and by defaults by borrowers or tenants. REITs depend generally on their ability to generate cash flow to make distributions to shareowners, and certain REITs have self-liquidation provisions by which mortgages held may be paid in full and distributions of capital returns may be made at any time. In addition, the performance of a REIT may be affected by its failure to qualify for tax-free pass-through of income under the Internal Revenue Code of 1986, as amended (the “Code”), or its failure to maintain exemption from registration under the 1940 Act. A Fund’s investments in REITs may result in such Fund’s receipt of cash in excess of the REITs’ earnings. If the Fund receives such distributions all or a portion of these distributions will constitute a return of capital to such Fund. Receiving a return of capital distribution from REITs will reduce the amount of income available to be distributed to Fund shareholders. Income from REITs generally will not be eligible for treatment as qualified dividend income. As the final character of the distributions is not known until reported by the REITs on their 1099s, the Funds utilize an average of the prior year’s reallocation information as an estimate for the current year character of distributions.
Trust Expenses: Some expenses of the Trust can be directly attributed to the Funds. Expenses which cannot be directly attributed to the Funds are apportioned among all funds in the Trust based on average net assets of each fund.
Fund and Class Expenses: Expenses that are specific to a Fund or class of shares of a Fund, including distribution fees (Rule 12b-1 fees) and shareholder servicing fees, are charged directly to that Fund or share class. All expenses of a Fund, other than class specific expenses, are allocated daily to each class in proportion to its average daily net assets. Expenses that are common to the Funds generally are allocated among the Funds in proportion to their average daily net assets.
Federal Income Taxes: Each Fund complies with the requirements under Subchapter M of the Internal Revenue Code of 1986, as amended, applicable to regulated investment companies and intends to distribute substantially all of its net taxable income and net capital gains, if any, each year so that the Funds will not be subject to excise tax on undistributed income and gains. The Funds are not subject to income taxes to the extent such distributions are made.
As of and during the year ended April 30, 2016, the Funds did not have a liability for any unrecognized tax benefits. The Funds file U.S. federal, state, and local tax returns as required. The Funds’ tax returns are subject to examination by the relevant tax authorities until expiration of the applicable statute of limitations, which is generally three years after the filing of the tax return for federal purposes and four years for most state returns. Tax returns for open years have incorporated no uncertain tax positions that require a provision for income taxes.
| | |
| 56 | | www.emeraldmutualfunds.com |
| | |
| Emerald Funds | | Notes to Financial Statements |
| | April 30, 2016 |
Distributions to Shareholders: Each Fund normally pays dividends and distributes capital gains, if any, on an annual basis. Income dividend distributions are derived from dividends and other income each Fund receives from its investments, including short-term capital gains. Long term capital gain distributions are derived from gains realized when each Fund sells a security it has owned for more than a year. Each Fund may make additional distributions and dividends at other times if the portfolio manager believes doing so may be necessary for each Fund to avoid or reduce taxes.
3. TAX BASIS INFORMATION
Reclassifications: As of April 30, 2016, permanent differences on book and tax accounting were reclassified. These differences had no effect on net assets and were primarily attributed to treatment of certain investments and net investment loss. These reclassifications were as follows:
| | | | | | | | | | | | |
| | | Undistributed Net
Investment Loss | | | Accumulated Net
Realized Loss on
Investments | | | Paid-in Capital | |
| |
Emerald Growth Fund | | $ | 4,099,674 | | | $ | 700 | | | $ | (4,100,374) | |
Emerald Small Cap Value Fund | | | 3,244 | | | | – | | | | (3,244) | |
Emerald Insights Fund | | | 52,814 | | | | 11,400 | | | | (64,214) | |
Emerald Banking and Finance Fund | | | 668,128 | | | | – | | | | (668,128) | |
Included in those amounts reclassified was a net operating loss offset to Paid-in capital for the Emerald Growth Fund, the Emerald Insights Fund, and the Emerald Banking and Finance Fund in the amount of $4,099,674, $64,215, and $668,128 respectively.
Tax Basis of Investments: As of April 30, 2016, the aggregate cost of investments, gross unrealized appreciation/(depreciation) and net unrealized appreciation/(depreciation) for Federal tax purposes was as follows:
| | | | | | | | | | | | | | | | |
| | | Gross Appreciation
(excess of value over tax
cost) | | | Gross Depreciation
(excess of tax cost over
value) | | | Net Unrealized
Appreciation/(Depreciation) | | | Cost of Investments for
Income Tax Purposes | |
| |
Emerald Growth Fund | | $ | 94,911,567 | | | $ | (101,771,657) | | | $ | (6,860,090) | | | $ | 932,558,184 | |
Emerald Small Cap Value Fund | | | 2,497,981 | | | | (1,197,700) | | | | 1,300,281 | | | | 15,201,831 | |
Emerald Insights Fund | | | 982,931 | | | | (1,147,645) | | | | (164,714) | | | | 13,590,521 | |
Emerald Banking and Finance Fund | | | 54,463,858 | | | | (9,610,082) | | | | 44,853,776 | | | | 261,778,673 | |
Components of Distributable Earnings: As of April 30, 2016, components of distributable earnings were as follows:
| | | | | | | | | | | | | | | | |
| | | Emerald Growth
Fund | | | Emerald Small
Cap Value Fund | | | Emerald Insights
Fund | | | Emerald Banking
and Finance Fund | |
| |
Accumulated capital losses | | $ | (42,333,151) | | | $ | (713,709) | | | $ | (895,989) | | | $ | (12,390,194) | |
Net unrealized appreciation/(depreciation) on investments | | | (6,860,090) | | | | 1,300,281 | | | | (164,714) | | | | 44,853,776 | |
Other cumulative effect of timing differences | | | (1,937,256) | | | | (5,849) | | | | (19,899) | | | | (305,212) | |
| |
Total | | $ | (51,130,497) | | | $ | 580,723 | | | $ | (1,080,602) | | | $ | 32,158,370 | |
| |
Capital Losses: As of April 30, 2016, the Funds had capital loss carryforwards which may reduce the Funds’ taxable income arising from future net realized gains on investments, if any, to the extent permitted by the Code and thus may reduce the amount of the distributions to shareholders which would otherwise be necessary to relieve the Funds of any liability for federal tax. Pursuant to the Code, such capital loss carryforwards will expire as follows:
| | | | | | | | |
| | | Expiring in 2017 | | | Expiring in 2018 | |
| |
Emerald Banking and Finance Fund | | $ | 839,270 | | | $ | 1,370,886 | |
During the year ended April 30, 2016, $597,361 and $834,567 of capital loss carryforwards were utilized by the Emerald Small Cap Value Fund and the Emerald Banking and Finance Fund, respectively.
| | |
| Annual Report | April 30, 2016 | | 57 |
| | |
| Emerald Funds | | Notes to Financial Statements |
| | April 30, 2016 |
As of April 30, 2016, the following Funds had available for Federal income tax purposes unused capital losses that may be used to offset future realized capital gains. The flowing losses will be carried forward indefinitely to offset future realized gains:
| | | | | | | | |
| | | Short-Term | | | Long-Term | |
| |
Emerald Growth Fund | | $ | 6,923,759 | | | $ | – | |
Emerald Small Cap Value Fund | | | 283,893 | | | | – | |
Emerald Insights Fund | | | 314,807 | | | | 8,843 | |
Emerald Banking and Finance Fund | | | – | | | | – | |
| | | | |
The Emerald Growth Fund, Emerald Small Cap Value Fund, Emerald Insights Fund and the Emerald Banking and Finance Fund elected to defer to the period ending April 30, 2017 capital losses recognized during the period November 1, 2014 to April 30, 2016 in the amount of $35,409,392, $429,816, $572,339 and $10,180,038 respectively. Ordinary Losses: As of April 30, 2016, Emerald Growth Fund, Emerald Small Cap Value Fund, Emerald Insights Fund, and Emerald Banking and Finance Fund elected to defer to the period ending April 30, 2017, late year ordinary losses in the amount of $1,937,256, $5,849, $19,899 and $305,212, respectively. Tax Basis of Distributions to Shareholders: The character of distributions made during the year from net investment income or net realized gains may differ from its ultimate characterization for federal income tax purposes. Also, due to the timing of dividend distributions, the fiscal year in which amounts are distributed may differ from the fiscal year in which the income or realized gain were recorded by each Fund. The tax character of distributions paid by the Funds for the fiscal year or period ended April 30, 2016, were as follows: |
| | | | | | | | |
| | | Ordinary Income | | | Long-Term Capital Gain | |
| |
Emerald Growth Fund | | $ | – | | | $ | 22,536,119 | |
Emerald Small Cap Value Fund | | | 81,808 | | | | – | |
Emerald Insights Fund | | | – | | | | – | |
Emerald Banking and Finance Fund | | | – | | | | – | |
The tax character of distributions paid by the Funds for the fiscal year ended September 30, 2015, were as follows: | |
| | | Ordinary Income | | | Long-Term Capital Gain | |
| |
Emerald Small Cap Value Fund | | $ | 179,711 | | | $ | 415,816 | |
The tax character of distributions paid by the Funds for the fiscal year or period ended April 30, 2015, were as follows: | |
| | | Ordinary Income | | | Long-Term Capital Gain | |
| |
Emerald Growth Fund | | $ | 7,294,238 | | | $ | 11,879,191 | |
Emerald Insights Fund | | | – | | | | – | |
Emerald Banking and Finance Fund | | | – | | | | – | |
4. SECURITIES TRANSACTIONS
The cost of purchases and proceeds from sales of securities (excluding short-term securities) during the year or period ended April 30, 2016, was as follows:
| | | | | | | | |
| Funds | | Cost of Investments
Purchased | | | Proceeds from
Investments Sold | |
| |
Emerald Growth Fund | | $ | 1,018,280,403 | | | $ | 318,018,088 | |
Emerald Small Cap Value Fund | | | 4,748,816 | | | | 5,612,448 | |
Emerald Insights Fund | | | 18,583,973 | | | | 10,714,091 | |
Emerald Banking and Finance Fund | | | 248,729,896 | | | | 75,060,647 | |
| | |
| 58 | | www.emeraldmutualfunds.com |
| | |
| Emerald Funds | | Notes to Financial Statements |
| | April 30, 2016 |
5. SHARES OF BENEFICIAL INTEREST
The capitalization of the Trust consists of an unlimited number of shares of beneficial interest with no par value per share. Holders of the shares of the Funds of the Trust have one vote for each share held and a proportionate fraction of a vote for each fractional share. All shares issued and outstanding are fully paid and are transferable and redeemable at the option of the shareholder. Purchasers of the shares do not have any obligation to make payments to the Trust or its creditors (other than the purchase price for the shares) or make contributions to the Trust or its creditors solely by reason of the purchaser’s ownership of the shares. Shares have no pre-emptive rights.
6. MANAGEMENT AND RELATED-PARTY TRANSACTIONS
The Adviser, subject to the authority of the Board, is responsible for the overall management and administration of the Funds’ business affairs. The Adviser manages the investments of the Funds in accordance with the Funds’ investment objective, policies and limitations and investment guidelines established jointly by the Adviser and the Trustees. Pursuant to the Advisory Agreement, the Funds pay the Adviser fees for the services and facilities it provides payable on a monthly basis at the annual rate set forth below of the Funds’ average daily net assets.
Emerald Growth Fund
| | |
| Average Total Net Assets | | Contractual Fee |
|
Up to and including $250M | | 0.75% |
Over $250M and including $500M | | 0.65% |
Over $500M and including $750M | | 0.55% |
Over $750M | | 0.45% |
Emerald Small Cap Value Fund | | |
| Average Total Net Assets | | Contractual Fee |
|
Up to and including $250M | | 0.75% |
Over $250M and including $500M | | 0.65% |
Over $500M and including $750M | | 0.55% |
Over $750M | | 0.45% |
Emerald Insights Fund | | |
| Average Total Net Assets | | Contractual Fee |
|
Up to and including $250M | | 0.75% |
Over $250M and including $500M | | 0.65% |
Over $500M and including $750M | | 0.55% |
Over $750M | | 0.45% |
Emerald Banking and Finance Fund | | |
| Average Total Net Assets | | Contractual Fee |
|
Up to and including $100M | | 1.00% |
Over $100M | | 0.90% |
The Adviser has agreed contractually to waive a portion of its fees and reimburse other expenses until in amounts necessary to limit each Fund’s operating expenses (exclusive of Acquired Fund Fees and Expenses, brokerage expenses, interest expenses, taxes and extraordinary expense) for Class A, Class C, Institutional Class, and Investor Class shares to the annual rates (as percentages of a Fund’s average daily net assets) set forth in the tables below. This agreement was in effect for the entire fiscal year ended April 30, 2016 with the current agreement effective September 1, 2015 through August 31, 2016 for all Funds except the Emerald Small Cap Value Fund, which agreement is in effect June 26, 2015 through August 31, 2017. The Adviser will be permitted to recover, on a class-by-class basis, expenses it has borne through the expense agreement to the extent that a Fund’s expenses in later periods fall below the expense cap in effect at the time of the waiver or reimbursement. No Fund will be obligated to pay any such deferred fees and expenses more than three years after the year(s) in which the fees and expenses were incurred. The Adviser may not discontinue this waiver, prior to August 31, 2016 (with respect to all Funds except the Emerald Small Cap Value Fund) or August 31, 2017 (with respect to the Emerald Small Cap Value Fund), without the approval by the Fund’s Board of Trustees. Fees waived/reimbursed by the Adviser for the year or period ended April 30, 2016 are disclosed in the Statements of Operations.
| | |
| Annual Report | April 30, 2016 | | 59 |
| | |
| Emerald Funds | | Notes to Financial Statements |
| | April 30, 2016 |
| | | | | | |
| Emerald Growth Fund | | | | | | |
| Class A | | Class C | | Institutional Class | | Investor Class |
|
1.29% | | 1.94% | | 0.99% | | 1.34% |
| | | |
Emerald Small Cap Value Fund | | | | | | |
| Class A | | Class C | | Institutional Class | | Investor Class |
|
1.35% | | 2.00% | | 1.00% | | 1.25% |
| | | |
Emerald Insights Fund | | | | | | |
| Class A | | Class C | | Institutional Class | | Investor Class |
|
1.35% | | 2.00% | | 1.05% | | 1.40% |
| | |
| Emerald Banking and Finance Fund | | | | |
| Class A | | Class C | | Institutional Class | | Investor Class |
|
1.84% | | 2.49% | | 1.54% | | 1.89% |
For the year or period ended April 30, 2016, the fee waivers and/or reimbursements were as follows:
| | | | | | | | | | |
| Fund | | Fees Waived/ Reimbursed By Adviser | | Recoupment of Past Waived Fees By
Adviser |
Emerald Growth Fund | | | | | | | | | | |
Class A | | | $ | – | | | | $ | 49,069 | |
Class C | | | | – | | | | | 4,473 | |
Institutional Class | | | | – | | | | | 80,974 | |
Investor Class | | | | – | | | | | – | |
Emerald Small Cap Value Fund | | | | | | | | | | |
Class A | | | $ | 256 | | | | $ | – | |
Class C | | | | 617 | | | | | – | |
Institutional Class | | | | 64,181 | | | | | – | |
Investor Class | | | | 5,731 | | | | | – | |
Emerald Insights Fund | | | | | | | | | | |
Class A | | | $ | 67,047 | | | | $ | – | |
Class C | | | | 467 | | | | | – | |
Institutional Class | | | | 5,690 | | | | | – | |
Investor Class | | | | 3,372 | | | | | – | |
Emerald Banking and Finance Fund | | | | | | | | | | |
Class A | | | $ | – | | | | $ | – | |
Class C | | | | – | | | | | – | |
Institutional Class | | | | – | | | | | – | |
Investor Class | | | | – | | | | | – | |
For the year ended September 30, 2015, the fee waivers and/or reimbursements were as follows: | |
| Fund | | Fees Waived/ Reimbursed By Adviser | | Recoupment of Past Waived Fees By
Adviser |
Emerald Small Cap Value Fund | | | | | | | | | | |
Class A | | | $ | 30 | | | | $ | – | |
Class C | | | | 30 | | | | | – | |
Institutional Class | | | | 76,447 | | | | | – | |
Investor Class | | | | 1,827 | | | | | – | |
| | |
| 60 | | www.emeraldmutualfunds.com |
| | |
| Emerald Funds | | Notes to Financial Statements |
| | April 30, 2016 |
As of April 30, 2016, the balances of recoupable expenses for each Fund were as follows:
| | | | | | | | | | | | | | | | |
| Fund | | Expires 2017 | | | Expires 2018 | | | Expires 2019 | | | Total | |
| |
Emerald Growth Fund | | | | | | | | | | | | | | | | |
Class A | | $ | – | | | $ | – | | | $ | – | | | $ | – | |
Class C | | | – | | | | – | | | | – | | | | – | |
Institutional Class | | | – | | | | – | | | | – | | | | – | |
Investor Class | | | – | | | | – | | | | – | | | | – | |
Emerald Small Cap Value Fund | | | | | | | | | | | | | | | | |
Class A | | $ | – | | | $ | 30 | | | $ | 256 | | | $ | 286 | |
Class C | | | – | | | | 30 | | | | 617 | | | | 647 | |
Institutional Class | | | – | | | | 37,563 | | | | 64,181 | | | | 101,744 | |
Investor Class | | | – | | | | 852 | | | | 5,731 | | | | 6,583 | |
Emerald Insights Fund | | | | | | | | | | | | | | | | |
Class A | | $ | – | | | $ | 41,382 | | | $ | 67,047 | | | $ | 108,429 | |
Class C | | | – | | | | 921 | | | | 467 | | | | 1,388 | |
Institutional Class | | | – | | | | 3,464 | | | | 5,690 | | | | 9,154 | |
Investor Class | | | – | | | | 1,872 | | | | 3,372 | | | | 5,244 | |
Emerald Banking and Finance Fund | | | | | | | | | | | | | | | | |
Class A | | $ | – | | | $ | – | | | $ | – | | | $ | – | |
Class C | | | – | | | | – | | | | – | | | | – | |
Institutional Class | | | – | | | | – | | | | – | | | | – | |
Investor Class | | | – | | | | – | | | | – | | | | – | |
Distributor: ALPS Distributors, Inc. (“ADI” or the “Distributor”) (an affiliate of ALPS Fund Services Inc. (“ALPS”)) acts as the distributor of the Funds’ shares pursuant to a Distribution Agreement with the Trust. Shares are sold on a continuous basis by ADI as agent for the Funds, and ADI has agreed to use its best efforts to solicit orders for the sale of Funds’ shares, although it is not obliged to sell any particular amount of shares.
ADI is not entitled to any compensation for its services as Distributor. ADI is registered as a broker-dealer with the U.S. Securities and Exchange Commission.
Each Fund has adopted a separate Distribution and Services Plan (each a “Plan” and collectively, the “Plans”) pursuant to Rule 12b-1 of the 1940 Act. The Plans allow each Fund, as applicable, to use each Fund’s assets to pay fees in connection with the distribution and marketing of the Funds’ shares and/or the provision of shareholder services to the Funds’ shareholders. The Plan permits payment for services in connection with the administration of plans or programs that use shares of each Fund as their funding medium and for related expenses. The recipients of such payments may include other affiliates of the Adviser, broker-dealers, financial institutions, plan sponsors and administrators and other financial intermediaries through which investors may purchase shares of the Fund. The Plans permit each Fund to make total payments at an annual rate of up to 0.35%, 0.75% and 0.25% of the average daily net asset value of Class A, Class C and Investor Class, respectively. Because these fees are paid out of the Funds’ assets on an ongoing basis, over time they will increase the cost of an investment in the Funds, and Plan fees may cost an investor more than other types of sales charges.
Each Fund, except the Emerald Small Cap Value Fund, has adopted a Shareholder Services Plan (a “Shareholder Services Plan”) with respect to its Class C, Institutional Class and Investor Class shares. Under the Shareholder Services Plan, a Fund is authorized to compensate certain financial intermediaries, including broker-dealers and Fund affiliates which may include the Distributor, Adviser and/or the transfer agent (the “Participating Organizations”), an aggregate fee in an amount not to exceed on an annual basis 0.25%, 0.05% and 0.15% of the average daily net asset value of Class C, Institutional Class and Investor Class, respectively, of the Funds attributable to or held in the name of a Participating Organization pursuant to an agreement with such Participating Organization (the “Agreement”). Each Agreement will set forth the non-distribution related shareholder services to be performed by the Participating Organization for the benefit of a Fund’s shareholders who have elected to have such Participating Organization service their accounts. Any amount of such payment not paid to Participating Organizations during a Fund’s fiscal year for such service activities shall be reimbursed to the Fund as soon as practicable after the end of the fiscal year. Shareholder Services Plan fees are included with distribution and service fees on the Statements of Operations.
Effective June 26, 2015, the Emerald Small Cap Value Fund has adopted a Shareholder Services Plan (the “Plan”) with respect to its Class C shares. Under the Plan, the Fund is authorized to pay banks and its affiliates and other institutions, including broker-dealers and Fund affiliates which may include the Distributor, Adviser and/or the transfer agent (“Class C Participating Organizations”), an aggregate fee in an amount not to exceed on an annual basis 0.25% of the average daily net asset value of Class C shares of the Fund attributable to or held in the name of a Participating
| | |
| Annual Report | April 30, 2016 | | 61 |
| | |
| Emerald Funds | | Notes to Financial Statements |
| | April 30, 2016 |
Organization for its clients as compensation for providing shareholder service activities, which do not include distribution services pursuant to an agreement with a Participating Organization. Any amount of such payment not paid to the Participating Organizations during the Fund’s fiscal year for such service activities shall be reimbursed to the Fund as soon as practicable after the end of the fiscal year. Plan fees are included with distribution and service fees on the Statements of Operations.
Fund Administrator Fees and Expenses: ALPS Fund Services, Inc. (“ALPS”) serves as administrator to the Funds and the Funds have agreed to pay expenses incurred in connection with their administrative activities. Pursuant to an Administration Agreement, ALPS provides operational services to the Funds including, but not limited to, fund accounting and fund administration and generally assist in the Funds’ operations. Officers of the Trust are employees of ALPS. The Funds’ administration fee is accrued on a daily basis and paid monthly. Administration fees paid by the Funds for the year ended April 30, 2016 are disclosed in the Statements of Operations.
The Administrator is also reimbursed by the Funds for certain out-of-pocket expenses.
Transfer Agent: ALPS serves as transfer, dividend paying and shareholder servicing agent for the Funds. ALPS receives an annual minimum fee, a fee based upon the number of shareholder accounts, and is also reimbursed by the Funds for certain out-of-pocket expenses. Transfer agent fees paid by the Funds for the year ended April 30, 2016 are disclosed in the Statements of Operations.
Compliance Services: ALPS provides services that assist the Trust’s chief compliance officer in monitoring and testing the policies and procedures of the Trust in conjunction with requirements under Rule 38a-1 under the 1940 Act and receives an annual base fee. ALPS is reimbursed for certain out-of-pocket expenses by the Funds. Compliance service fees paid by the Funds for the year ended April 30, 2016 are disclosed in the Statements of Operations.
Principal Financial Officer: ALPS receives an annual fee for providing principal financial officer services to the Funds. Principal financial officer fees paid by the Fund for the year ended April 30, 2016 are disclosed in the Statements of Operations.
7. INDEMNIFICATIONS
Under the Trust’s organizational documents, its officers and Trustees are indemnified against certain liability arising out of the performance of their duties to the Trust. Additionally, in the normal course of business, the Trust enters into contracts with service providers that may contain general indemnification clauses, which may permit indemnification to the extent permissible under applicable law. The Trust’s maximum exposure under these arrangements is unknown, as this would involve future claims that may be made against the Trust that have not yet occurred.
| | |
| 62 | | www.emeraldmutualfunds.com |
| | |
| Report of Independent Registered Public Accounting Firm |
| | |
To the Shareholders and Board of Trustees of Financial Investors Trust:
We have audited the accompanying statements of assets and liabilities, including the schedules of investments, of Emerald Growth Fund, Emerald Small Cap Value Fund (formerly, the Elessar Small Cap Value Fund), Emerald Insights Fund, and Emerald Banking and Finance Fund (the “Funds”), four of the portfolios of Financial Investors Trust, as of April 30, 2016, and the related statements of operations for the year then ended (as to the Emerald Small Cap Value Fund, for the period from October 1, 2015 to April 30, 2016 and for the year ended September 30, 2015), the statements of changes in net assets for each of the two years in the period then ended (as to the Emerald Small Cap Value Fund, for the period from October 1, 2015 to April 30, 2016 and for the year ended September 30, 2015; and as to the Emerald Insights Fund, for the year ended April 30, 2016 and for the period from August 1, 2014 (inception) to April 30, 2015), and the financial highlights (as to the Emerald Growth Fund and the Emerald Banking and Finance Fund, for each of the four years in the period ended April 30, 2016 and for the period from January 1, 2012 to April 30, 2012; as to the Emerald Small Cap Value Fund, for the period from October 1, 2015 to April 30, 2016 and for the year ended September 30, 2015; and as to the Emerald Insights Fund, for the year ended April 30, 2016 and for the period from August 1, 2014 (inception) to April 30, 2015). These financial statements and financial highlights are the responsibility of the Funds’ management. Our responsibility is to express an opinion on these financial statements and financial highlights based on our audits. The financial highlights for Emerald Growth Fund and Emerald Banking and Finance Fund for the year ended December 31, 2011 were audited by other auditors whose report, dated February 28, 2012, expressed an unqualified opinion on such financial highlights. The statement of changes in net assets and financial highlights for the Emerald Small Cap Value Fund for the year ended September 30, 2014 and the financial highlights for the period from October 15, 2012 (commencement of investment operations) to September 30, 2013 were audited by other auditors whose report, dated November 24, 2014, expressed an unqualified opinion on such statement of changes in net assets and financial highlights.
We conducted our audits in accordance with the standards of the Public Company Accounting Oversight Board (United States). Those standards require that we plan and perform the audit to obtain reasonable assurance about whether the financial statements and financial highlights are free of material misstatement. The Funds are not required to have, nor were we engaged to perform, an audit of their internal control over financial reporting. Our audits included consideration of internal control over financial reporting as a basis for designing audit procedures that are appropriate in the circumstances, but not for the purpose of expressing an opinion on the effectiveness of the Funds’ internal control over financial reporting. Accordingly, we express no such opinion. An audit also includes examining, on a test basis, evidence supporting the amounts and disclosures in the financial statements, assessing the accounting principles used and significant estimates made by management, as well as evaluating the overall financial statement presentation. Our procedures included confirmation of securities owned as of April 30, 2016, by correspondence with the custodian and brokers; when replies were not received from brokers, we performed other auditing procedures. We believe that our audits provide a reasonable basis for our opinion.
In our opinion, the financial statements and financial highlights referred to above present fairly, in all material respects, the financial position of Emerald Growth Fund, Emerald Small Cap Value Fund, Emerald Insights Fund, and Emerald Banking and Finance Fund of Financial Investors Trust as of April 30, 2016, the results of their operations for the year then ended (as to the Emerald Small Cap Value Fund, for the period from October 1, 2015 to April 30, 2016 and for the year ended September 30, 2015), the changes in their net assets for each of the two years in the period then ended (as to the Emerald Small Cap Value Fund, for the period from October 1, 2015 to April 30, 2016 and for the year ended September 30, 2015; and as to the Emerald Insights Fund, for the year ended April 30, 2016 and for the period from August 1, 2014 (inception) to April 30, 2015), and the financial highlights (as to the Emerald Growth Fund and the Emerald Banking and Finance Fund, for each of the four years in the period ended April 30, 2016 and for the period from January 1, 2012 to April 30, 2012; as to the Emerald Small Cap Value Fund, for the period from October 1, 2015 to April 30, 2016 and for the year ended September 30, 2015; and as to the Emerald Insights Fund, for the year ended April 30, 2016 and for the period from August 1, 2014 (inception) to April 30, 2015), in conformity with accounting principles generally accepted in the United States of America.
DELOITTE & TOUCHE LLP
Denver, Colorado
June 28, 2016
| | |
| Annual Report | April 30, 2016 | | 63 |
| | |
| Disclosure Regarding Approval of Fund Advisory Agreements |
| | April 30, 2016 (Unaudited) |
Emerald Banking and Finance Fund, Emerald Growth Fund and Emerald Insights Fund
On December 15, 2015, the Trustees met in person to discuss, among other things, the approval of the Investment Advisory Agreement between the Trust and Emerald Mutual Fund Advisers Trust (the “Adviser”) (the “Emerald Advisory Agreement”) in accordance with Section 15(c) of the Investment Company Act of 1940, as amended. The Independent Trustees met with independent legal counsel during executive session and discussed the Emerald Advisory Agreement and other related materials.
In renewing and approving the Emerald Advisory Agreement, the Trustees, including the Independent Trustees, considered the following factors with respect to the Emerald Insights Fund, the Emerald Banking and Finance Fund and the Emerald Growth Fund (the “Emerald Reviewed Funds”):
Investment Advisory Fee Rate: The Trustees reviewed and considered the contractual annual advisory fee paid by the Trust, on behalf of the Emerald Reviewed Funds, to the Adviser of 1.00% of the Emerald Banking and Finance Fund’s and 0.75% of each of the Emerald Growth Fund’s and the Emerald Insights Fund’s daily average net assets, in light of the extent and quality of the advisory services provided by the Adviser to the Emerald Reviewed Funds.
The Board received and considered information including a comparison of each of the Emerald Reviewed Fund’s contractual advisory fees and total expenses (net of waivers) with those of funds in the expense groups and universes of funds provided by an independent provider of investment company data (“Independent Data Provider”). The Trustees noted that the Emerald Banking and Finance Fund’s contractual advisory fee rate was above its Independent Data Provider peer group average and median contractual advisory fee rates but within the range of its Independent Data Provider peer group’s contractual advisory fee rates. The Trustees further noted that each of the Emerald Growth Fund’s and the Emerald Insights Fund’s contractual advisory fee rates were below its respective Independent Data Provider peer group average and median contractual advisory fee rates.
Total Expense Ratios: Based on such information, the Trustees further reviewed and considered the total expense ratios (after waivers) of 1.60% for Class A, 2.25% for Class C, 1.27% for Institutional Class and 1.58% for Investor Class of the Emerald Banking and Finance Fund, 1.29% for Class A, 1.94% for Class C, 0.99% for Institutional Class and 1.27% for Investor Class of the Emerald Growth Fund and 1.35% for Class A, 2.00% for Class C, 1.05% for Institutional Class and 1.40% for Investor Class of the Emerald Insights Fund.
The Trustees noted that the total expense ratios (after waivers) for the Emerald Banking and Finance Fund’s Class A, Class C, Institutional Class and Investor Class shares were above the Independent Data Provider peer group average and median but within the range of the Independent Data Provider peer group’s total expense ratios (after waivers). They further noted that the total expense ratios (after waivers) for the Emerald Growth Fund’s Class A, Class C, Institutional Class and Investor Class were below the Independent Data Provider peer group average and median total expense ratios. The Trustees also noted that the total expense ratio (after waivers) for the Emerald Insights Fund’s Class A was below the Independent Data Provider peer group average but above the FUSE peer group median total expense ratios (after waivers), for the Fund’s Class C was below the Independent Data Provider peer group average and median total expense ratios (after waivers) and for each of the Fund’s Institutional Class and Investor Class was below the Independent Data Provider peer group average and the same as the median total expense ratios (after waivers).
Nature, Extent and Quality of the Services under the Emerald Advisory Agreement: The Trustees received and considered information regarding the nature, extent and quality of services to be provided to the Emerald Reviewed Funds under the Emerald Advisory Agreement. The Trustees reviewed certain background materials supplied by the Adviser in its presentation, including its Form ADV.
The Trustees reviewed and considered the Adviser’s investment advisory personnel, its history as an asset manager and its performance and the amount of assets currently under management by the Adviser and its affiliated entities. The Trustees also reviewed the research and decision-making processes utilized by the Adviser, including the methods adopted to seek to achieve compliance with the investment objectives, policies and restrictions of the Emerald Reviewed Funds.
The Trustees considered the background and experience of the Adviser’s management in connection with the Emerald Reviewed Funds, including reviewing the qualifications, backgrounds and responsibilities of the management team primarily responsible for the day-to-day portfolio management of the Emerald Reviewed Funds and the extent of the resources devoted to research and analysis of actual and potential investments.
The Trustees also reviewed, among other things, the Adviser’s insider trading policies and procedures and its Code of Ethics.
Performance: The Trustees reviewed performance information for each of the Emerald Reviewed Funds for the 3-month, 1-year, 3-year and 5-year, if applicable, periods ended September 30, 2015. That review included a comparison of each Emerald Reviewed Fund’s performance to the performance of the group of comparable funds selected by the Independent Data Provider. The Trustees noted the performance of all of the shares classes of each of the Emerald Banking and Finance Fund and the Emerald Growth Fund was above its respective Independent Data Provider peer group averages and
| | |
| 64 | | www.emeraldmutualfunds.com |
| | |
| Disclosure Regarding Approval of Fund Advisory Agreements |
| | April 30, 2016 (Unaudited) |
medians for the 3-month, 1-year, 3-year and 5-year periods ended September 30, 2015. They further noted the performance of the Emerald Insights Fund’s Class A and Class C shares was above its Independent Data Provider peer group averages and medians for the 3-month and 1-year periods ended September 30, 2015, for the Fund’s Institutional Class shares was above its Independent Data Provider peer group average and median for the 3-month period ended September 30, 2015 and for the Fund’s Investor Class shares was below its Independent Data Provider peer group average and median for the 3-month period and below its Independent Data Provider peer group average but the same as the median for the 1-year period ended September 30, 2015.
The Trustees also considered the Adviser’s discussion of each Emerald Reviewed Fund’s underlying portfolio diversification categories, its top contributors and top detractors, as well as the Adviser’s performance and reputation generally and its investment techniques, risk management controls and decision-making processes.
Comparable Accounts: The Trustees noted certain information provided by the Adviser regarding fees charged to its other clients utilizing a strategy similar to that employed by the Emerald Reviewed Funds.
Profitability: The Trustees received and considered a retrospective and projected profitability analysis prepared by the Adviser based on the fees payable under the Emerald Advisory Agreement with respect to each Emerald Reviewed Fund. The Trustees considered the profits, if any, anticipated to be realized by the Adviser in connection with the operation of each Emerald Reviewed Fund. The Board then reviewed the Adviser’s audited fiscal year 2013-2014 financial statements and a profitability projection for 2015 and 2016 in order to analyze the financial condition and stability and profitability of the Adviser.
Economies of Scale: The Trustees considered whether economies of scale in the provision of services to the Emerald Reviewed Funds are or will be passed along to the shareholders under the Emerald Advisory Agreement.
Other Benefits to the Adviser: The Trustees reviewed and considered any other incidental benefits derived or to be derived by the Adviser from its relationship with the Emerald Reviewed Funds, including whether soft dollar arrangements were used.
In renewing the Adviser as the Emerald Reviewed Funds’ investment adviser and renewing the Emerald Advisory Agreement and the fees charged under the Emerald Advisory Agreement, the Trustees concluded that no single factor reviewed by the Trustees was identified by the Trustees to be determinative as the principal factor in whether to renew the Emerald Advisory Agreement. Further, the Independent Trustees were advised by separate independent legal counsel throughout the process. The Trustees, including all of the Independent Trustees, concluded that:
| | ● | | the Emerald Banking and Finance Fund’s contractual advisory fee rate was above its Independent Data Provider peer group average and median contractual advisory fee rates but within the range of the Independent Data Provider peer group’s contractual advisory fee rates; |
| | ● | | the Emerald Growth Fund’s and the Emerald Insights Fund’s contractual advisory fee rates were below its Independent Data Provider peer group average and median contractual advisory fee rates; |
| | ● | | total expense ratios (after waivers) for the Emerald Banking and Finance Fund’s Class A, Class C, Institutional Class and Investor Class shares were above the Independent Data Provider peer group average and median but within the range of the Independent Data Provider peer group’s total expense ratios (after waivers); total expense ratios (after waivers) for the Emerald Growth Fund’s Class A, Class C, Institutional Class and Investor Class were below the Independent Data Provider peer group average and median total expense ratios; total expense ratio (after waivers) for the Emerald Insights Fund’s Class A was below the Independent Data Provider peer group average but above the Independent Data Provider peer group median total expense ratios (after waivers), for the Fund’s Class C was below the Independent Data Provider peer group average and median total expense ratios (after waivers) and for each of the Fund’s Institutional Class and Investor Class was below the Independent Data Provider peer group average and the same as the median total expense ratios (after waivers); |
| | ● | | the nature, extent and quality of services rendered by the Adviser under the Emerald Advisory Agreement with respect to the Emerald Reviewed Funds were adequate; |
| | ● | | the performance of all of the share classes of each of the Emerald Banking and Finance Fund and the Emerald Growth Fund was above its respective Independent Data Provider peer group averages and medians for the 3-month, 1-year, 3-year and 5-year periods ended September 30, 2015; performance of the Emerald Insights Fund’s Class A and Class C shares was above its Independent Data Provider peer group averages and medians for the 3-month and 1-year periods ended September 30, 2015, for the Fund’s Institutional Class shares was above its Independent Data Provider peer group average and median for the 3-month period ended September 30, 2015 and for the Fund’s Investor Class shares was below its Independent Data Provider peer group average and median for the 3-month period and below its Independent Data Provider peer group average but the same as the median for the 1-year period ended September 30, 2015; |
| | |
| Annual Report | April 30, 2016 | | 65 |
| | |
| Disclosure Regarding Approval of Fund Advisory Agreements |
| | April 30, 2016 (Unaudited) |
| | ● | | bearing in mind the limitations of comparing different types of managed accounts and the different levels of service typically associated with such accounts, the fee structures applicable to the Adviser’s other clients employing a comparable strategy to one or more of the Emerald Reviewed Funds were not indicative of any unreasonableness with respect to the advisory fees proposed to be payable by the Emerald Reviewed Funds; |
| | ● | | the profit, if any, realized by the Adviser in connection with the operation of the Emerald Reviewed Funds is not unreasonable to the Emerald Reviewed Funds; and |
| | ● | | there were no material economies of scale or other incidental benefits accruing to the Adviser in connection with its relationship with the Emerald Reviewed Funds. |
Based on the Trustees’ deliberations and their evaluation of the information described above, the Trustees, including all of the Independent Trustees, concluded that the Adviser’s compensation for investment advisory services is consistent with the best interests of the Emerald Reviewed Funds and their shareholders.
| | |
| 66 | | www.emeraldmutualfunds.com |
| | |
| Emerald Funds | | Additional Information |
| | April 30, 2016 (Unaudited) |
1. FUND HOLDINGS
The Funds file their complete schedule of portfolio holdings with the Securities and Exchange Commission (the “SEC”) for the first and third quarters of each fiscal year on Form N-Q within 60 days after the end of the period. Copies of the Funds’ Form N-Q are available without charge on the SEC website at http://www.sec.gov. You may also review and copy the Form N-Q at the SEC’s Public Reference Room in Washington, DC. For more information about the operation of the Public Reference Room, please call the SEC at 1-800-SEC-0330.
2. FUND PROXY VOTING POLICIES, PROCEDURES AND SUMMARIES
Each Fund’s policies and procedures used in determining how to vote proxies and information regarding how the Funds voted proxies relating to portfolio securities during the most recent prior 12-month period ending June 30 are available without charge, (1) upon request, by calling (toll-free) (855) 828-9909 and (2) on the SEC’s website at http://www.sec.gov.
3. TAX INFORMATION
The Funds designate the following for federal income tax purposes for distributions made during the calendar year ended December 31, 2015:
| | | | | | | | | | |
| | | QDI | | | DRD | | | |
|
Emerald Growth Fund | | | 0.00% | | | | 0.00% | | | |
Emerald Small Cap Value Fund | | | 55.77% | | | | 55.77% | | | |
Emerald Insights Fund | | | 0.00% | | | | 0.00% | | | |
Emerald Banking and Finance Fund | | | 0.00% | | | | 0.00% | | | |
In early 2016, if applicable, shareholders of record received this information for the distribution paid to them by the Funds during the calendar year 2015 via Form 1099. The Funds will notify shareholders in early 2017 of amounts paid to them by the Funds, if any, during the calendar year 2016.
Pursuant to Section 852(b)(3) of the Internal Revenue Code, Emerald Growth Fund designated $22,536,119 as long-term capital gain dividends.
| | |
| Annual Report | April 30, 2016 | | 67 |
| | |
| Emerald Funds | | Trustees and Officers |
| | April 30, 2016 (Unaudited) |
Additional information regarding the Fund’s trustees is included in the Statement of Additional Information, which can be obtained without charge by calling 855-845-9444.
| | | | | | | | | | |
| INDEPENDENT TRUSTEES |
| | | | | |
Name, Address* & Year of Birth | | Position(s) Held with Fund | | Term of Office and Length of Time Served | | Principal Occupation(s) During Past 5 Years** | | Number of Funds in Fund Complex Overseen by Trustee*** | | Other Directorships Held by Trustee During Past 5 Years** |
| Mary K. Anstine, 1940 | | Trustee | | Ms. Anstine was elected at a special meeting of shareholders held on March 21, 1997 and re-elected at a special meeting of shareholders held on August 7, 2009. | | Ms. Anstine was formerly an Executive Vice President of First Interstate Bank of Denver until 1994, President/Chief Executive Officer of HealthONE Alliance, Denver, Colorado, from 1994 to 2004, and has been retired since 2004. Ms. Anstine is also Trustee/Director of AV Hunter Trust and Colorado Uplift Board. Ms. Anstine was formerly a Director of the Trust Bank of Colorado (later purchased and now known as Northern Trust Bank), HealthONE and Denver Area Council of the Boy Scouts of America, and a member of the American Bankers Association Trust Executive Committee. | | 34 | | Ms. Anstine is a Trustee of ALPS ETF Trust (20 funds); ALPS Variable Investment Trust (9 funds); Reaves Utility Income Fund (1 fund); and Westcore Trust (12 funds). |
| John R. Moran, Jr., 1930 | | Trustee | | Mr. Moran was elected at a special meeting of shareholders held on March 21, 1997 and re-elected at a special meeting of shareholders held on August 7, 2009. | | Mr. Moran formerly served as President and CEO of The Colorado Trust, a private foundation serving the health and hospital community in the state of Colorado, from 1991 to 2007. During his career as an attorney from 1958 to 1991, Mr. Moran was formerly a partner with the firm of Kutak Rock & Campbell in Denver, Colorado and a member of the Colorado House of Representatives. Currently, Mr. Moran is a member of the Treasurer’s Investment Advisory Committee for the University of Colorado. | | 34 | | None. |
| | |
| 68 | | www.emeraldmutualfunds.com |
| | |
| Emerald Funds | | Trustees and Officers |
| | April 30, 2016 (Unaudited) |
| | | | | | | | | | |
| INDEPENDENT TRUSTEES |
Name, Address* & Year of Birth | | Position(s) Held with Fund | | Term of Office and Length of Time Served | | Principal Occupation(s) During Past 5 Years** | | Number of Funds in Fund Complex Overseen by Trustee*** | | Other Directorships Held by Trustee During Past 5 Years** |
| Jeremy W. Deems, 1976 | | Trustee | | Mr. Deems was appointed as a Trustee at the March 11, 2008 meeting of the Board of Trustees and elected at a special meeting of shareholders held on August 7, 2009. | | Mr. Deems is the Co-Founder, Chief Operations Officer and Chief Financial Officer of Green Alpha Advisors, LLC, a registered investment advisor, and Co-Portfolio Manager of the Shelton Green Alpha Fund. Prior to joining Green Alpha Advisors, Mr. Deems was CFO and Treasurer of Forward Management, LLC, ReFlow Management Co., LLC, ReFlow Fund, LLC, a private investment fund, and Sutton Place Management, LLC, an administrative services company, from 1998 to June 2007. From 2004 to 2005, Mr. Deems also served as Treasurer of the Forward Funds and the Sierra Club Funds. | | 34 | | Mr. Deems is a Trustee of ALPS ETF Trust (20 funds); ALPS Variable Investment Trust (9 funds), Reaves Utility Income Fund (1 fund) and Clough Funds Trust (1 fund). |
| Jerry G. Rutledge, 1944 | | Trustee | | Mr. Rutledge was elected at a special meeting of shareholders held on August 7, 2009. | | Mr. Rutledge is the President and owner of Rutledge’s Inc., a retail clothing business. Mr. Rutledge is currently Director of the American National Bank. He was from 1994 to 2007 a Regent of the University of Colorado. | | 34 | | Mr. Rutledge is a Trustee of Principal Real Estate Fund (1 fund), Clough Global Allocation Fund (1 fund), Clough Global Equity Fund (1 fund) and Clough Global Opportunities Fund (1 fund). |
Michael “Ross” Shell, 1970 | | Trustee | | Mr. Shell was elected at a special meeting of shareholders held on August 7, 2009. | | Mr. Shell is Founder and CEO of Red Idea, LLC, a strategic consulting/early stage venture firm (since June 2008). From 1999 to 2009, he was a part-owner and Director of Tesser, Inc., a brand agency. From December 2005 to May 2008, he was Director, Marketing and Investor Relations, of Woodbourne, a REIT/real estate hedge fund and private equity firm. Prior to this, from May 2004 to November 2005, he worked as a business strategy consultant; from June 2003 to April 2004, he was on the Global Client Services team of IDEO, a product design/innovation firm; and from 1999 to 2003, he was President of Tesser, Inc. Mr. Shell graduated with honors from Stanford University with a degree in Political Science. | | 34 | | None. |
| | |
| Annual Report | April 30, 2016 | | 69 |
| | |
| Emerald Funds | | Trustees and Officers |
| | April 30, 2016 (Unaudited) |
| | | | | | | | | | |
| INTERESTED TRUSTEE |
Name, Address* & Age | | Position(s) Held with Fund | | Term of Office and Length of Time Served | | Principal Occupation(s) During Past 5 Years** | | Number of Funds in Fund Complex Overseen by
Trustee*** | | Other Directorships
Held by Trustee |
| Edmund J. Burke, 1961 | | Trustee, Chairman and President | | Mr. Burke was elected as Chairman at the August 28, 2009 meeting of the Board of Trustees. Mr. Burke was elected as Trustee at a special meeting of shareholders held on August 7, 2009. Mr. Burke was elected President of the Trust at the December 17, 2002 meeting of the Board of Trustees. | | Mr. Burke is President and a Director of ALPS Holdings, Inc. (“AHI”) (since 2005) and Director of Boston Financial Data Services, Inc. (“BFDS”), ALPS Advisors, Inc. (“AAI”), ALPS Distributors, Inc. (“ADI”), ALPS Fund Services, Inc. (“AFS”) and ALPS Portfolio Solutions Distributor, Inc. (“APSD”) and from 2001-2008, was President of AAI, ADI, AFS and APSD. Because of his positions with AHI, BFDS, AAI, ADI, AFS and APSD, Mr. Burke is deemed an affiliate of the Trust as defined under the 1940 Act. Mr. Burke is Trustee and President of the Clough Global Allocation Fund (Trustee since 2006; President since 2004); Trustee and President of the Clough Global Equity Fund (Trustee since 2006; President since 2005); Trustee and President of the Clough Global Opportunities Fund (since 2006); Trustee of the Liberty All-Star Equity Fund; and Director of the Liberty All-Star Growth Fund, Inc. | | 34 | | Mr. Burke is a Trustee of Clough Global Allocation Fund (1 fund); Clough Global Equity Fund (1 fund); Clough Global Opportunities Fund (1 fund); Liberty All-Star Equity Fund (1 fund) and Clough Funds Trust (1 fund); and Director of the Liberty All-Star Growth Fund, Inc. (1 fund). |
| | |
| 70 | | www.emeraldmutualfunds.com |
| | |
| Emerald Funds | | Trustees and Officers |
| | April 30, 2016 (Unaudited) |
| | | | | | |
OFFICERS |
| | | |
Name, Address* & Year of Birth | | Position(s) Held with Fund | | Term of Office and
Length of Time Served | | Principal Occupation(s) During Past 5 Years** |
Kimberly R. Storms, 1972 | | Treasurer | | Ms. Storms was elected Treasurer of the Trust at the March 12, 2013 meeting of the Board of Trustees. | | Ms. Storms is Senior Vice President - Director of Fund Administration of ALPS. Because of her position with ALPS, Ms. Storms is deemed an affiliate of the Trust as defined under the 1940 Act. Ms. Storms is also Treasurer of Liberty All-Star Equity Fund, Liberty All-Star Growth Fund, Inc. and ALPS Series Trust. Ms. Storms also serves as a Board member and Treasurer of The Center for Trauma & Resilience, a nonprofit agency. |
JoEllen L. Legg, 1961 | | Secretary | | Ms. Legg was elected Secretary of the Trust at the September 15, 2015 meeting of the Board of Trustees. | | Ms. Legg joined ALPS in October 2007 and is currently Vice President, Assistant General Counsel of ALPS. Prior to joining ALPS, Ms. Legg served as Senior Counsel - Law (Corporate & Securities) for Adelphia Communications Corporation (February 2005 - March 2007). Prior to this, Ms. Legg held associate positions at Fried Frank Harris Shriver & Jacobson LLP (1998 - 2004) and at Patton Boggs LLP (2004 - 2005). Because of her position with ALPS, Ms. Legg is deemed an affiliate of the Trust as defined under the 1940 Act. Ms. Legg is also the Secretary of ALPS Series Trust and Reaves Utility Income Fund. |
Ted Uhl, 1974 | | Chief Compliance Officer (“CCO”) | | Mr. Uhl was appointed CCO of the Trust at the June 8, 2010 meeting of the Board of Trustees. | | Mr. Uhl joined ALPS in October 2006, and is currently Deputy Compliance Officer of ALPS. Prior to his current role, Mr. Uhl served as Senior Risk Manager for ALPS from October 2006 until June 2010. Because of his position with ALPS, Mr. Uhl is deemed an affiliate of the Trust as defined under the 1940 Act. Mr. Uhl is also CCO of the Reaves Utility Income Fund, Centre Funds and Transparent Value Trust. |
Jennell Panella, 1974 | | Assistant Treasurer | | Ms. Panella was elected Assistant Treasurer of the Trust at the September 15, 2015 meeting of the Board of Trustees. | | Ms. Panella joined ALPS in June 2012 and is currently Fund Controller of ALPS Fund Services, Inc. Prior to joining ALPS, Ms. Panella served as Financial Reporting Manager for Parker Global Strategies, LLC (2009-2012). Because of her position with ALPS, Ms. Panella is deemed an affiliate of the Trust as defined under the 1940 Act. Ms. Panella also serves as Assistant Treasurer of James Advantage Funds. |
Nate Mandeville, 1977 | | Assistant Treasurer | | Mr. Mandeville was elected Assistant Treasurer of the Trust at the September 15, 2015 meeting of the Board of Trustees. | | Mr. Mandeville joined ALPS in December 2013 and is Fund Controller for ALPS. Prior to joining ALPS, Mr. Mandeville worked for Great-West Financial (2011-2013), Virtuoso Sourcing Group (2008-2011) and Janus Capital Group (2000-2008). Because of his position with ALPS, Mr. Mandeville is deemed an affiliate of the Trust as defined under the 1940 Act. Mr. Mandeville also serves as Assistant Treasurer of ALPS Series Trust. |
| | |
| Annual Report | April 30, 2016 | | 71 |
| | |
| Emerald Funds | | Trustees and Officers |
| | April 30, 2016 (Unaudited) |
OFFICERS
| | | | | | |
Name, Address* & Year of Birth | | Position(s) Held with Fund | | Term of Office and
Length of Time Served | | Principal Occupation(s) During Past 5 Years** |
Sharon Akselrod, 1974 | | Assistant
Secretary | | Ms. Akselrod was elected Assistant Secretary of the Trust at the September 15, 2015 meeting of the Board of Trustees. | | Ms. Akselrod joined ALPS in August 2014 and is currently Senior Investment Company Act Paralegal of ALPS. Prior to joining ALPS, Ms. Akselrod served as Corporate Governance and Regulatory Associate for Nordstrom fsb (2013-2014) and Senior Legal Assistant – Legal Manager for AXA Equitable Life Insurance Company (2008-2013). Because of her position with ALPS, Ms. Akselrod is deemed an affiliate of the Trust as defined under the 1940 Act. |
Sareena Khwaja-Dixon 1980 | | Assistant
Secretary | | Ms. Khwaja-Dixon was elected Assistant Secretary of the Trust at the December 15, 2015 meeting of the Board of Trustees. | | Ms. Khwaja-Dixon joined ALPS in August 2015 and is currently Senior Counsel and Vice President of ALPS. Prior to joining ALPS, Ms. Khwaja-Dixon served as a Senior Paralegal/Paralegal for Russell Investments (2011-2015). Because of her position with ALPS, Ms. Khwaja-Dixon is deemed an affiliate of the Trust as defined under the 1940 Act. |
| * | All communications to Trustees and Officers may be directed to Financial Investors Trust c/o 1290 Broadway, Suite 1100, Denver, CO 80203. |
| ** | This is the period for which the Trustee or Officer began serving the Trust. Each Trustee serves an indefinite term, until his successor is elected. Officers are elected on an annual basis. |
| *** | The Fund Complex includes all series of the Trust (currently 34) and any other investment companies for which any Trustee serves as trustee for and which Emerald Mutual Fund Advisers Trust provides investment advisory services (currently none). |
| | |
| 72 | | www.emeraldmutualfunds.com |

Emerald Mutual Funds
P.O. Box 8556 Denver, CO 80201 (855) 828-9909 www.emeraldmutualfunds.com
Investment adviser:
Emerald Mutual Fund Advisers Trust P.O. Box 10666 Lancaster, PA 17605
Must be accompanied by or proceeded by a Prospectus.
The Emerald Mutual Funds are distributed by ALPS Distributors, Inc.

GRANDEUR PEAK FUNDS
ELEVATED GLOBAL INVESTING
ANNUAL
APRIL 30, 2016
EMERGING MARKETS OPPORTUNITIES FUND GPEOX | GPEIX
GLOBAL MICRO CAP FUND GPMCX
GLOBAL OPPORTUNITIES FUND GPGOX | GPGIX
GLOBAL REACH FUND GPROX | GPRIX
GLOBAL STALWARTS FUND GGSOX | GGSYX
INTERNATIONAL OPPORTUNITIES FUND GPIOX | GPIIX
INTERNATIONAL STALWARTS FUND GISOX | GISYX
| | |
 | | Grandeur Peak Funds |
TABLE OF CONTENTS
| | |
| Grandeur Peak Funds® | | Shareholder Letter |
| | April 30, 2016 (Unaudited) |
Dear Fellow Shareholders,
Market Commentary
Despite the recent rebound in equity markets, many economic outlooks continue to suggest a reasonable chance of a global recession in the near term. There’s no doubt that economies around the world are generally weak; growth is slowing and most major economies seem to be hooked on the opium of central bank intervention. Of course this is not new information, so what’s with the bounce in equity markets? Are we seeing the last gasp of a dying Bull market, a brief reprieve as we enter the early stages of a Bear market, or is the aging Bull market regaining its footing?
Bulls will argue that P/E’s are reasonable and the market will continue to have legs. Bears will argue that we are seven years into a Bull market, and with earnings and economic activity lackluster at best, the market is due to roll over, especially if central banks begin to remove the easy money that many would suggest has been propping up equity markets.
As bottom up stock-pickers, the best way we can answer this question is from our view of earnings. It is our strongly held belief that over the long-run stock prices follow earnings, and generally speaking earnings are currently coming in below expectations.
Consequently, it is harder for us to find high quality companies that we believe can consistently post strong earnings growth in this environment. Historically we have looked for companies that we thought could grow their earnings 15%+ per annum over the next 3-5 years, but in the current environment we have lowered our hurdle to 12%+. Fortunately, as we screen the global universe we do continue to find great companies that we believe can deliver solid, although slightly lower, growth.
Fund Commentary
We made some mistakes this year. We observed last year that although valuations of emerging market stocks looked cheap, their fundamentals were deteriorating; whereas developed market fundamentals were improving, but their valuations were expensive. We chose value over momentum and kept an overweight in emerging markets, which in hindsight was a mistake. Emerging market fundamentals went from bad to worse during the year, and as a result, emerging markets underperformed with generally poor earnings growth and weakening currencies. Given our weighting to emerging markets, this was a detractor across our global and international funds.
We made a similar value over momentum mistake in many developed markets as well. In selecting stocks, we regularly faced the choice between an attractively valued company with slowing business momentum or significantly paying up for a company with better momentum. Too often we picked the stock with better value. In general, the market moved into a more momentum driven phase this year and was very unforgiving of earnings shortfalls, even from companies where we thought slower growth was already baked into the price. So our prioritization of value over momentum hurt our performance across all funds.
In the Quality, Value, Momentum (“QVM”) matrix that we employ to evaluate buy/sell/trim decisions, M-momentum and V-value are equally weighted. However, with valuations hovering at what we thought were pretty lofty levels, we essentially double weighted value this year. We did not consciously lower our weight to Q-quality, but by passing on expensive high quality names our portfolios did become slightly lower in quality.
Technology was our strongest sector this year, where we tended to be overweight and outperform with our holdings. Energy was also a bit of a tailwind relative to benchmarks. Our energy picks did better than the industry, but our outperformance here was primarily driven by our chronic underweight in the Energy sector, which was battered this year. Industrials was our weakest sector, at least in part due to some company specific issues in India and weakness in our US trucking stocks.
We haven’t had a bad year relative to our benchmarks and peer groups, it just hasn’t been up to our expectations. The Global Opportunities, Global Reach, and International Opportunities Funds performed roughly in-line with their respective benchmarks, while the Emerging Markets Fund had the best relative performance, outpacing its benchmark by over three percentage points, but the worst absolute performance due to the sell-off in those markets. The new Global Stalwarts, International Stalwarts, and Global Micro Cap funds are each off to a nice start, a couple of points ahead of their benchmark for the period, but this is just the first 1/8 mile of a marathon race. See performance for each Fund during the period in the Performance Update section.
So, we would call it a mediocre year—a year where the market exposed one of our weaknesses as a team: we tend to be too value conscious. As we move forward we’re putting renewed emphasis on “captured earnings growth” and making sure that the names we own have better momentum. This was by far our biggest issue over the past year and we are focused on bringing momentum and value into a better balance.
Of course we don’t want to “throw the baby out with the bathwater,” but we believe market psychology isn’t likely to change much in the year ahead, and the unforgiving market is presenting us with some interesting opportunities. We haven’t seen a better “fallen angel” market since 2008: any company that has hit a bump in the road has seen its stock pummeled. While we don’t want to be too early to buy a fallen angel, we are licking
| | |
| Annual Report | April 30, 2016 | | 1 |
| | |
| Grandeur Peak Funds® | | Shareholder Letter |
| | April 30, 2016 (Unaudited) |
our chops a bit as we see opportunities. We won’t rush to buy fallen angels, but they are on our radar. While our strength was a weakness last year, we do believe that paying close attention to value is still a long-term strength of ours.
There is perhaps an even more valuable silver lining to this year. There can be no substitute for experience, and great companies learn from their mistakes. Across the firm we have been reflecting on the mistakes made this year and I am confident that our team, young and old, will be smarter going forward.
Detailed analysis and commentary of the latest quarter’s results can be found each quarter at www.grandeurpeakglobal.com.
Notes from the Road
Over the past year we have had over 2000 touches with companies from 57 different countries. To add some color to our global travels, here are Conner Whipple’s notes from a recent trip to South Korea (Conner is a Research Analyst on the Financials industry team):
In planning our trip to Korea, I was very excited to go back to the country that I called home for two years and to eat all the things I have missed since returning to the US. Of course, we were also hoping to find some interesting companies. The trip turned out to be difficult, mostly because both Blake and I got food poisoning. Traveling abroad to see companies is hard enough as it is – trying to get used to the time change, the strange foods that you cannot believe anyone actually eats, the crazy drivers, and being away from your family and a comfortable bed – but adding food poisoning into the mix is truly a bummer. That said, the trip was very valuable. We indeed met with some interesting companies; we also met with some not so interesting companies. However, even when we end up disappointed after a company meeting – that the company isn’t as high quality as we initially thought – we always gain some great insight into the industry or country that we could not have gained by sitting in front of a computer screen in Salt Lake City.
The Korean market has always been a little tougher for us. After this trip, I’m closer to knowing why. On this trip, it dawned on me that the management quality in Korea is much lower than surrounding countries. One example of this is a cosmetics company (one of what seems like a million in Korea) that we met with. The company, a recent IPO, was relatively successful in Korea with a strategy of targeting young women between the ages of 12 to 35 through gimmicky packaging. With this success, the company decided to expand into China and opened 50 test stores. Over the course of a year those test stores did not live up to expectations, in fact, the man we met with said they were far below expectations. The company took this as a sign that they needed to go public in order to fund further expansion into China. When we pushed him to explain why they wanted to expand so aggressively into China given that their test stores did so poorly he conjured the excuse of not having the right product mix initially for the Chinese market. His logic didn’t compute. I think a better explanation is that the company is facing saturation in the domestic Korean market and is hoping to find growth via expansion into China. We met with a number of companies that are telling the same story: “We need to expand into China.” But when pressed to explain why they believe they can do well there, we kept hearing the same answer: “the Chinese market is so big that we don’t need a competitive advantage in order to grow.” It was quite frustrating to see the same bad decisions mirrored across multiple products and industries.
Nevertheless, we did find some good companies; there are two names that stick out, and luckily we were able to see both of them at the beginning of the week, before the food poisoning. (Free tip: if you go to Korea and are thinking of having their famous fried chicken, just don’t). The first company we are thoroughly excited about is a healthcare company. We identified the company via the IPO tracking we do. The company is involved in synthesizing peptides to either combine with proteins in order to increase the efficacy of drugs or to replace the proteins all together. The company has a number of patents, but its real differentiating factor is more in the softer points of the company. The CEO is a US-educated scientist who has a knack for developing these peptides. He built the company with a focus around research and development and established a process that identifies which drugs to target. The company focuses on drugs that have large addressable markets and that have recently come off their patents. The strategy is to synthesize a proprietary version of the drug and add additional peptides to increase the drug’s efficacy and/or alleviate or eliminate the negative side effects of the original drug. The addressable market for these drugs is quite large and in most cases the drugs are critical to quality of life. After meeting with the company, we quickly contacted our Healthcare team and got them started on moving deeper into researching the company.
The second company was identified as part of a theme uncovered through an earlier Korean investment we made. In Korea, there are very tight restrictions around the number of new apartment buildings that can be built in the country. Due to these restrictions, there is a huge market for remodeling. The company that I visited (Blake was still suffering from the ill effects of the famous fried chicken) manufactures artificial stone surfaces for kitchens and bathrooms. The company’s strategy fits into Porter’s low-cost provider bucket via a more efficient process than its competitors. The company also benefits from being a smaller and more nimble player in the market – able to customize depending on a specific customer’s needs. In addition to the home remodel theme taking place in Korea, this company is also benefiting from European demand where artificial stone is being used more and more. We believe that strong demand for their products coupled with their high operating leverage should drive strong earnings growth.
| | |
| 2 | | 1.855.377.7325 | www.GrandeurPeakGlobal.com |
| | |
| Grandeur Peak Funds® | | Shareholder Letter |
| | April 30, 2016 (Unaudited) |
Business Update
We added three new funds to the Grandeur Peak fund family last fall, the Global Micro Cap Fund, the Global Stalwarts Fund, and the International Stalwarts Fund. Each is off to a nice a start and ahead of its respective benchmark. We opened the Global Micro Cap Fund under a “hard closed” status last October in order to tightly restrict the assets. At just $30 million under management, the Fund has optimum flexibility to invest in the smallest of companies. The two Stalwarts funds are the only funds in our family that are currently open to new investments. These are small/mid-cap (“SMID”) strategies focused on companies over $1.5 billion in market capitalization so as to not impinge on the capacity constraints of our other funds. These products were a natural extension for us as we already owned many of these SMID-cap companies in our existing portfolios. We are excited by the opportunities we see in the global SMID-cap market and believe our investment approach can add good value here.
In closing, we’d just like to say that our mediocre performance this year was not satisfying, and we’re sorry for that, but if we learn from some of our shortcomings it may prove to be the most important year in our firm’s long-term success. We can’t promise that we will do better next year, but we want you to know that we firmly believe in our game plan, we are learning from our mistakes, and most importantly, we will work tirelessly to do our best for you.
Sincerely,
Robert Gardiner, CFA
CEO, Co-Director of Research, & Portfolio Manager
Blake Walker
Chief Investment Officer & Portfolio Manager
Randy Pearce, CFA, MBA
Co-Director of Research & Portfolio Manager
The objective of all Grandeur Peak Funds is long-term growth of capital.
RISKS: Mutual fund investing involves risks and loss of principal is possible. Investing in small and micro-cap funds will be more volatile and loss of principal could be greater than investing in large cap or more diversified funds. Investing in foreign securities entails special risks, such as currency fluctuations and political uncertainties, which are described in more detail in the prospectus. Investments in emerging markets are subject to the same risks as other foreign securities and may be subject to greater risks than investments in foreign countries with more established economies and securities markets.
An investor should consider investment objectives, risks, charges, and expenses carefully before investing. To obtain a Grandeur Peak Funds prospectus, containing this and other information, visit www.grandeurpeakglobal.com or call 1-855-377-PEAK (7325). Please read it carefully before investing.
The views of Grandeur Peak Global Advisors, LLC and information discussed in this commentary are as of the date of publication, are subject to change, and may not reflect the writer’s current views. The views expressed of Grandeur Peak Global Advisors, LLC and represent an assessment of market conditions at a specific point in time, are opinions only and should not be relied upon as investment advice regarding a particular investment or markets in general. Such information does not constitute a recommendation to buy or sell specific securities or investment vehicles. It should not be assumed that any investment will be profitable or will equal the performance of the Funds or any securities or any sectors mentioned herein. The subject matter contained herein has been derived from several sources believed to be reliable and accurate at the time of compilation. Grandeur Peak Global Advisors, LLC nor the Funds do not accept any liability for losses either direct or consequential caused by the use of this information. Past performance does not guarantee future results.
Bull Market: A financial market of a group of securities in which prices are rising or are expected to rise. The term “bull market” is most often used to refer to the stock market, but can be applied to anything that is traded, such as bonds, currencies and commodities.
Bear Market: A market condition in which the prices of securities are falling, and widespread pessimism causes the negative sentiment to be self-sustaining. As investors anticipate losses in a bear market and selling continues, pessimism only grows.
PE: The Price-to-Earnings Ratio or P/E ratio is a ratio for valuing a company that measures its current share price relative to its per-share earnings.
Fallen Angel: A bond that was given an investment-grade rating but has since been reduced to junk bond status due to the weakening financial condition of the issuer. It is also a stock that has fallen substantially from its all-time highs.
| | |
| Annual Report | April 30, 2016 | | 3 |
| | |
| Grandeur Peak Funds® | | Shareholder Letter |
| | April 30, 2016 (Unaudited) |
A list of portfolio holdings as of 4/30/16 can be found on pages 20-49.
CFA® is trademark owned by CFA Institute.
ALPS Distributors, Inc. is the Distributor for the Grandeur Peak Funds.
The Funds are subject to investment risks, including possible loss of the principal amount invested and therefore are not suitable for all investors.
The Funds may not achieve their objectives.
Diversification does not ensure a profit or guarantee against loss.
| | |
| 4 | | 1.855.377.7325 | www.GrandeurPeakGlobal.com |
| | |
| Grandeur Peak Emerging Markets Opportunities Fund | | Performance Update |
| | April 30, 2016 (Unaudited) |
Cumulative Total Return Performance for the periods ended April 30, 2016
| | | | | | | | | | | | | | | | | | | | |
| | | | | | | | | | | Expense Ratio(b) | | | |
| | | 6 Months | | | 1 Year | | | Since
Inception(a) | | Gross | | | Net(c) | | | |
Grandeur Peak Emerging Markets Opportunities Fund – Investor (GPEOX) | | | -0.08% | | | | -11.62% | | | 1.78% | | | 1.82% | | | | 1.82% | | | |
Grandeur Peak Emerging Markets Opportunities Fund – Institutional (GPEIX) | | | -0.08% | | | | -11.44% | | | 1.98% | | | 1.57% | | | | 1.57% | | | |
Russell Emerging Markets Small Cap Index(d) | | | 0.34% | | | | -15.04% | | | -1.75% | | | | | | | | | | |
| (a) | Fund inception date of December 16, 2013. |
| (b) | Ratios as of the Prospectus dated August 31, 2015 and may differ from the ratios presented in the Financial Highlights. |
| (c) | Grandeur Peak Global Advisors, LLC (the “Adviser”), has agreed to waive and/or reimburse fees or expenses in order to limit Total Annual Fund Operating Expenses After Fee Waiver/Expense Reimbursement (excluding acquired fund fees and expenses, brokerage expenses, interest expenses, taxes and extraordinary expenses) to 1.95% and 1.70% of the Fund’s average daily net assets for the Fund’s Investor Class Shares and Institutional Class Shares, respectively. This agreement (the “Expense Agreement”) is in effect through August 31, 2016. The Adviser will be permitted to recover, on a class- by-class basis, expenses it has borne through the Expense Agreement to the extent that a Fund’s expenses in later periods fall below the expense cap in effect at the time of waiver or reimbursement. Notwithstanding the foregoing, the Fund will not be obligated to pay any such deferred fees and expenses more than three years after the end of the fiscal year in which the fee and expenses was deferred. The Expense Agreement may not be terminated or modified prior to August 31, 2016 except with the approval of the Fund’s Board of Trustees. |
| (d) | The Russell Emerging Markets Small Cap Index seeks to measure the performance of the small-cap equity universe of emerging countries. The Index is not actively managed and does not reflect any deductions for fees, expense, or taxes. An investor may not invest directly in the Index. |
Returns for periods greater than 1 year are annualized.
The returns shown above do not reflect the deduction of taxes a shareholder would pay on Fund distributions or redemption of Fund shares.
Performance data quoted represents past performance. Past performance does not guarantee future results. Investment return and principal value of an investment will fluctuate so that an investor’s shares, when sold or redeemed, may be worth more or less than the original cost. The Fund imposes a 2.00% redemption fee on shares held for less than 60 days. Current performance data may be higher or lower than actual data quoted. For the most current month-end performance data, please call 1-855-377-PEAK (7325).
Growth of $10,000 for the period ended April 30, 2016
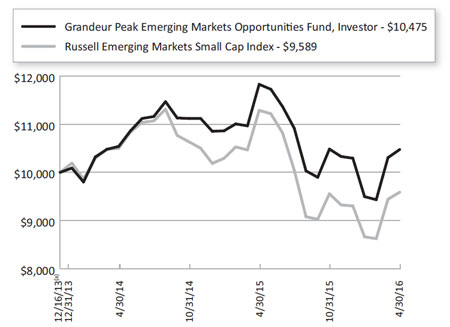
| | |
| Annual Report | April 30, 2016 | | 5 |
| | |
| Grandeur Peak Emerging Markets Opportunities Fund | | Performance Update |
| | April 30, 2016 (Unaudited) |
The graphs shown above represent a hypothetical investment of $10,000 in the Fund’s Investor Class shares for the period from inception to April 30, 2016. All returns reflect reinvested dividends, but do not reflect the deduction of taxes that an investor would pay on distributions or redemptions.
The Fund also offers Institutional Class shares, performance for which is not reflected in the graphs above. The performance of Institutional Class shares may be higher or lower than the performance of the Investor Class shares shown in the graphs above based upon differences in fees paid by shareholders investing in the Investor Class shares and Institutional Class shares.
| | | | | | |
| Regional Allocation (as a % of Net Assets)* | | | | | |
Asia ex Japan | | | 69.5 | % | | |
Africa/Middle East | | | 9.8 | % | | |
Latin America | | | 5.7 | % | | |
Europe | | | 3.9 | % | | |
North America | | | 3.0 | % | | |
Cash, Cash Equivalents, & Other Net Assets | | | 8.1 | % | | |
Total | | | 100.0 | % | | |
| | |
| Industry Sector Allocation (as a % of Net Assets)* | | | | | |
Financials | | | 24.0 | % | | |
Consumer | | | 20.0 | % | | |
Industrials | | | 17.6 | % | | |
Technology | | | 16.6 | % | | |
Health Care | | | 8.4 | % | | |
Energy & Materials | | | 5.3 | % | | |
Cash, Cash Equivalents, & Other Net Assets | | | 8.1 | % | | |
Total | | | 100.0 | % | | |
| | |
| Top 10 Holdings (as a % of Net Assets)* | | | | | |
Man Wah Holdings, Ltd. | | | 2.3 | % | | |
Value Partners Group, Ltd. | | | 2.3 | % | | |
Security Bank Corp. | | | 1.8 | % | | |
China Medical System Holdings, Ltd. | | | 1.7 | % | | |
Bank Negara Indonesia Persero Tbk PT | | | 1.4 | % | | |
Credito Real SAB de CV SOFOM ER | | | 1.4 | % | | |
WNS Holdings, Ltd., ADR | | | 1.4 | % | | |
BGEO Group PLC | | | 1.3 | % | | |
Parex Resources, Inc. | | | 1.3 | % | | |
Sporton International, Inc. | | | 1.2 | % | | |
Total | | | 16.1 | % | | |
| * | Holdings are subject to change, and may not reflect the current or future position of the portfolio. |
| | |
| 6 | | 1.855.377.7325 | www.GrandeurPeakGlobal.com |
| | |
| Grandeur Peak Global Micro Cap Fund | | Performance Update |
| | April 30, 2016 (Unaudited) |
Cumulative Total Return Performance for the periods ended April 30, 2016
| | | | | | | | |
| | | | | | Expense Ratio(b) |
| | | Since
Inception(a) | | | Gross | | Net(c) |
Grandeur Peak Global MicroCap – Institutional (GPMCX) | | | 3.80% | | | 2.30% | | 2.00% |
Russell Global Small Cap Index(d) | | | 0.90% | | | | | |
| (a) | Fund inception date of October 20, 2015. |
| (b) | Ratios as of the Prospectus dated June 29, 2015 and may differ from the ratios presented in the Financial Highlights. |
| (c) | Grandeur Peak Global Advisors, LLC (the “Adviser”), has agreed to waive and/or reimburse fees or expenses in order to limit Total Annual Fund Operating Expenses After Fee Waiver/Expense Reimbursement (excluding acquired fund fees and expenses, brokerage expenses, interest expenses, taxes and extraordinary expenses) to 2.25% and 2.00% of the Fund’s average daily net assets for the Fund’s Investor Class Shares and Institutional Class Shares, respectively. This agreement is in effect through August 31, 2016. The Adviser will be permitted to recover, on a class-by-class basis, expenses it has borne through this agreement to the extent that a Fund’s expenses in later periods fall below the annual rates set forth in this agreement or in previous agreements. Notwithstanding the foregoing, the Fund will not be obligated to pay any such deferred fees and expenses more than three years after the end of the fiscal year in which the fee and expenses was deferred This agreement may not be terminated or modified prior to this date except with the approval of the Fund’s Board of Trustees. |
| (d) | The Russell Global Small Cap Index seeks to measure the performance of the small-cap segment of the global equity universe. The Index is not actively managed and does not reflect any deductions for fees, expenses, or taxes. An investor may not invest directly in the Index. |
Returns for periods greater than 1 year are annualized.
The returns shown above do not reflect the deduction of taxes a shareholder would pay on Fund distributions or redemption of Fund shares.
Performance data quoted represents past performance. Past performance does not guarantee future results. Investment return and principal value of an investment will fluctuate so that an investor’s shares, when sold or redeemed, may be worth more or less than the original cost. The Fund imposes a 2.00% redemption fee on shares held for less than 60 days. Current performance data may be higher or lower than actual data quoted. For the most current month-end performance data, please call 1-855-377-PEAK (7325).
Growth of $10,000 for the period ended April 30, 2016
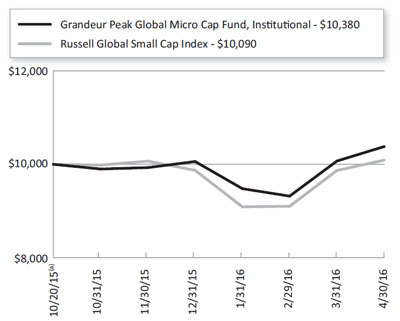
The graphs shown above represent a hypothetical investment of $10,000 in the Fund’s Institutional Class shares for the period from inception to April 30, 2016. All returns reflect reinvested dividends, but do not reflect the deduction of taxes that an investor would pay on distributions or redemptions.
| | |
| Annual Report | April 30, 2016 | | 7 |
| | |
| Grandeur Peak Global Micro Cap Fund | | Performance Update |
| | April 30, 2016 (Unaudited) |
| | | | | | |
| Regional Allocation (as a % of Net Assets)* | | | | | |
Asia ex Japan | | | 31.1 | % | | |
Europe | | | 23.7 | % | | |
North America | | | 19.8 | % | | |
Japan | | | 14.9 | % | | |
Australia/New Zealand | | | 4.0 | % | | |
Africa/Middle East | | | 2.8 | % | | |
Latin America | | | 2.0 | % | | |
Cash, Cash Equivalents, & Other Net Assets | | | 1.7 | % | | |
Total | | | 100.0 | % | | |
| | |
| Industry Sector Allocation (as a % of Net Assets)* | | | | | |
Consumer | | | 20.7 | % | | |
Financials | | | 20.2 | % | | |
Technology | | | 19.4 | % | | |
Industrials | | | 17.5 | % | | |
Health Care | | | 16.1 | % | | |
Energy & Materials | | | 4.4 | % | | |
Cash, Cash Equivalents, & Other Net Assets | | | 1.7 | % | | |
Total | | | 100.0 | % | | |
| | |
| Top 10 Holdings (as a % of Net Assets)* | | | | | |
Hard Off Corp. Co., Ltd. | | | 2.1 | % | | |
Cipher Pharmaceuticals, Inc. | | | 1.8 | % | | |
Syuppin Co., Ltd. | | | 1.8 | % | | |
Oxford Immunotec Global PLC | | | 1.4 | % | | |
Ananda Development PCL | | | 1.3 | % | | |
M&A Capital Partners Co., Ltd. | | | 1.2 | % | | |
Anest Iwata Corp. | | | 1.1 | % | | |
Future Architect, Inc. | | | 1.1 | % | | |
SoluCom | | | 1.1 | % | | |
Dr. Wu Skincare Co., Ltd. | | | 1.0 | % | | |
Total | | | 13.9 | % | | |
| * | Holdings are subject to change, and may not reflect the current or future position of the portfolio. |
| | |
| 8 | | 1.855.377.7325 | www.GrandeurPeakGlobal.com |
| | |
| Grandeur Peak Global Opportunities Fund | | Performance Update |
| | April 30, 2016 (Unaudited) |
Cumulative Total Return Performance for the periods ended April 30, 2016
| | | | | | | | | | | | | | | | | | | | | | | | | | | | | | |
| | | | | | | | | | | Expense Ratio(b) |
| | | 6 Months | | 1 Year | | 3 Years | | Since
Inception(a) | | Gross | | Net(c) |
Grandeur Peak Global Opportunities Fund – Investor (GPGOX) | | | | 1.48% | | | | | -5.03% | | | | | 9.46% | | | | | 14.57% | | | | | 1.63% | | | | | 1.63% | |
Grandeur Peak Global Opportunities Fund – Institutional (GPGIX) | | | | 1.64% | | | | | -5.12% | | | | | 9.57% | | | | | 14.86% | | | | | 1.38% | | | | | 1.38% | |
Russell Global Small Cap Index(d) | | | | 1.06% | | | | | -5.33% | | | | | 4.60% | | | | | 9.18% | | | | | | | | | | | |
Russell Global Index(e) | | | | -0.33% | | | | | -4.91% | | | | | 5.88% | | | | | 10.01% | | | | | | | | | | | |
| (a) | Fund inception date of October 17, 2011. |
| (b) | Ratios as of the Prospectus dated August 31, 2015 and may differ from the ratios presented in the Financial Highlights. |
| (c) | Grandeur Peak Global Advisors, LLC (the “Adviser”), has agreed to waive and/or reimburse fees or expenses in order to limit Total Annual Fund Operating Expenses After Fee Waiver/Expense Reimbursement (excluding acquired fund fees and expenses, brokerage expenses, interest expenses, taxes and extraordinary expenses) to 1.75% and 1.50% of the Fund’s average daily net assets for the Fund’s Investor Class Shares and Institutional Class Shares, respectively. This agreement (the “Expense Agreement”) is in effect through August 31, 2016. The Adviser will be permitted to recover, on a class- by-class basis, expenses it has borne the Expense Agreement to the extent that a Fund’s expenses in later periods fall below the expense cap in effect at the time of waiver or reimbursement. Notwithstanding the foregoing, the Fund will not be obligated to pay any such deferred fees and expenses more than three years after the end of the fiscal year in which the fee and expenses was deferred. The Expense Agreement may not be terminated or modified prior to August 31, 2016 except with the approval of the Fund’s Board of Trustees. |
| (d) | The Russell Global Small Cap Index seeks to measure the performance of the small-cap segment of the global equity universe. The Index is not actively managed and does not reflect any deductions for fees, expense, or taxes. An investor may not invest directly in the Index. |
| (e) | The Russell Global Index seeks to measure the performance of the global equity universe. The Index is not actively managed and does not reflect any deductions for fees, expense, or taxes. An investor may not invest directly in the Index. |
Returns for periods greater than 1 year are annualized.
The returns shown above do not reflect the deduction of taxes a shareholder would pay on Fund distributions or redemption of Fund shares.
Performance data quoted represents past performance. Past performance does not guarantee future results. Investment return and principal value of an investment will fluctuate so that an investor’s shares, when sold or redeemed, may be worth more or less than the original cost. The Fund imposes a 2.00% redemption fee on shares held for less than 60 days. Current performance data may be higher or lower than actual data quoted. For the most current month-end performance data, please call 1-855-377-PEAK (7325).
Growth of $10,000 for the period ended April 30, 2016
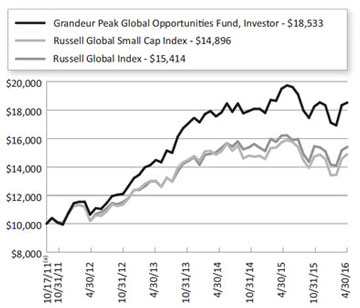
| | |
| Annual Report | April 30, 2016 | | 9 |
| | |
| Grandeur Peak Global Opportunities Fund | | Performance Update |
| | April 30, 2016 (Unaudited) |
The graphs shown above represent a hypothetical investment of $10,000 in the Fund’s Investor Class shares for the period from inception to April 30, 2016. All returns reflect reinvested dividends, but do not reflect the deduction of taxes that an investor would pay on distributions or redemptions.
The Fund also offers Institutional Class shares, performance for which is not reflected in the graphs above. The performance of Institutional Class shares may be higher or lower than the performance of the Investor Class shares shown in the graphs above based upon differences in fees paid by shareholders investing in the Investor Class shares and Institutional Class shares.
| | | | | | |
| Regional Allocation (as a % of Net Assets)* | | | | | |
North America | | | 33.2 | % | | |
Asia ex Japan | | | 27.6 | % | | |
Europe | | | 22.5 | % | | |
Japan | | | 8.8 | % | | |
Latin America | | | 2.7 | % | | |
Cash, Cash Equivalents, & Other Net Assets | | | 2.1 | % | | |
Africa/Middle East | | | 1.9 | % | | |
Australia/New Zealand | | | 1.2 | % | | |
Total | | | 100.0 | % | | |
| | |
| Industry Sector Allocation (as a % of Net Assets)* | | | | | |
Financials | | | 24.7 | % | | |
Industrials | | | 21.3 | % | | |
Technology | | | 20.5 | % | | |
Consumer | | | 16.4 | % | | |
Health Care | | | 11.6 | % | | |
Energy & Materials | | | 3.4 | % | | |
Cash, Cash Equivalents, & Other Net Assets | | | 2.1 | % | | |
Total | | | 100.0 | % | | |
| | |
| Top 10 Holdings (as a % of Net Assets)* | | | | | |
Man Wah Holdings, Ltd. | | | 2.5 | % | | |
First Republic Bank | | | 2.4 | % | | |
Power Integrations, Inc. | | | 2.1 | % | | |
Clinigen Group PLC | | | 1.9 | % | | |
Knight Transportation, Inc. | | | 1.6 | % | | |
PRA Group, Inc. | | | 1.5 | % | | |
Melexis NV | | | 1.3 | % | | |
Palfinger AG | | | 1.3 | % | | |
Trancom Co., Ltd. | | | 1.3 | % | | |
Inphi Corp. | | | 1.1 | % | | |
Total | | | 17.0 | % | | |
| * | Holdings are subject to change, and may not reflect the current or future position of the portfolio. |
| | |
| 10 | | 1.855.377.7325 | www.GrandeurPeakGlobal.com |
| | |
| Grandeur Peak Global Reach Fund | | Performance Update |
| | April 30, 2016 (Unaudited) |
Cumulative Total Return Performance for the periods ended April 30, 2016
| | | | | | | | | | | | | | | | | | | | | | | | | |
| | | | | | | | | Expense Ratio(b) |
| | | 6 Months | | 1 Year | | Since
Inception(a) | | Gross | | Net(c) |
Grandeur Peak Global Reach Fund – Investor (GPROX) | | | | 1.92% | | | | | -6.45% | | | | | 9.67% | | | | | 1.59% | | | | | 1.59% | |
Grandeur Peak Global Reach Fund – Institutional (GPRIX) | | | | 2.11% | | | | | -6.18% | | | | | 9.93% | | | | | 1.34% | | | | | 1.34% | |
Russell Global Small Cap Index(d) | | | | 1.06% | | | | | -5.33% | | | | | 5.04% | | | | | | | | | | | |
Russell Global Index(e) | | | | -0.33% | | | | | -4.91% | | | | | 6.33% | | | | | | | | | | | |
| (a) | Fund inception date of June 19, 2013. |
| (b) | Ratios as of the Prospectus dated August 31, 2015 and may differ from the ratios presented in the Financial Highlights. |
| (c) | Grandeur Peak Global Advisors, LLC (the “Adviser”), has agreed to waive and/or reimburse fees or expenses in order to limit Total Annual Fund Operating Expenses After Fee Waiver/Expense Reimbursement (excluding acquired fund fees and expenses, brokerage expenses, interest expenses, taxes and extraordinary expenses) to 1.60% and 1.35% of the Fund’s average daily net assets for the Fund’s Investor Class Shares and Institutional Class Shares, respectively. This agreement (the “Expense Agreement”) is in effect through August 31, 2016. The Adviser will be permitted to recover, on a class- by-class basis, expenses it has borne through the Expense Agreement to the extent that a Fund’s expenses in later periods fall below the expense cap in effect at the time of waiver or reimbursement. Notwithstanding the foregoing, the Fund will not be obligated to pay any such deferred fees and expenses more than three years after the end of the fiscal year in which the fee and expenses was deferred. The Expense Agreement may not be terminated or modified prior to August 31, 2016 except with the approval of the Fund’s Board of Trustees. |
| (d) | The Russell Global Small Cap Index seeks to measure the performance of the small-cap segment of the global equity universe. The Index is not actively managed and does not reflect any deductions for fees, expense, or taxes. An investor may not invest directly in the Index. |
| (e) | The Russell Global Index seeks to measure the performance of the global equity universe. The Index is not actively managed and does not reflect any deductions for fees, expense, or taxes. An investor may not invest directly in the Index. |
Returns for periods greater than 1 year are annualized.
The returns shown above do not reflect the deduction of taxes a shareholder would pay on Fund distributions or redemption of Fund shares.
Performance data quoted represents past performance. Past performance does not guarantee future results. Investment return and principal value of an investment will fluctuate so that an investor’s shares, when sold or redeemed, may be worth more or less than the original cost. The Fund imposes a 2.00% redemption fee on shares held for less than 60 days. Current performance data may be higher or lower than actual data quoted. For the most current month-end performance data, please call 1-855-377-PEAK (7325).
Growth of $10,000 for the period ended April 30, 2016
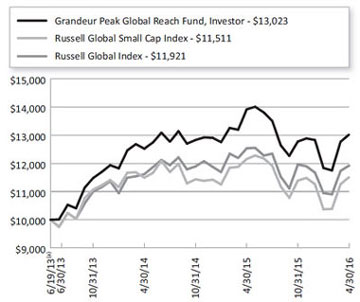
| | |
| Annual Report | April 30, 2016 | | 11 |
| | |
| Grandeur Peak Global Reach Fund | | Performance Update |
| | April 30, 2016 (Unaudited) |
The graphs shown above represent a hypothetical investment of $10,000 in the Fund’s Investor Class shares for the period from inception to April 30, 2016. All returns reflect reinvested dividends, but do not reflect the deduction of taxes that an investor would pay on distributions or redemptions.
The Fund also offers Institutional Class shares, performance for which is not reflected in the graphs above. The performance of Institutional Class shares may be higher or lower than the performance of the Investor Class shares shown in the graphs above based upon differences in fees paid by shareholders investing in the Investor Class shares and Institutional Class shares.
| | | | | | |
| Regional Allocation (as a % of Net Assets)* | | | | | |
Asia ex Japan | | | 31.9 | % | | |
North America | | | 28.6 | % | | |
Europe | | | 21.4 | % | | |
Japan | | | 7.3 | % | | |
Africa/Middle East | | | 4.4 | % | | |
Latin America | | | 2.6 | % | | |
Australia/New Zealand | | | 1.7 | % | | |
Cash, Cash Equivalents, & Other Net Assets | | | 2.1 | % | | |
Total | | | 100.0 | % | | |
| | |
| Industry Sector Allocation (as a % of Net Assets)* | | | | | |
Financials | | | 22.2 | % | | |
Consumer | | | 21.8 | % | | |
Technology | | | 19.4 | % | | |
Industrials | | | 18.9 | % | | |
Health Care | | | 12.0 | % | | |
Energy & Materials | | | 3.6 | % | | |
Cash, Cash Equivalents, & Other Net Assets | | | 2.1 | % | | |
Total | | | 100.0 | % | | |
| | |
| Top 10 Holdings (as a % of Net Assets)* | | | | | |
Man Wah Holdings, Ltd. | | | 2.0 | % | | |
First Republic Bank | | | 1.8 | % | | |
Clinigen Group PLC | | | 1.3 | % | | |
Inphi Corp. | | | 1.1 | % | | |
Skandiabanken ASA | | | 1.0 | % | | |
Hard Off Corp. Co., Ltd. | | | 1.0 | % | | |
Selamat Sempurna Tbk PT | | | 0.9 | % | | |
WNS Holdings, Ltd., ADR | | | 0.9 | % | | |
Value Partners Group, Ltd. | | | 0.8 | % | | |
PRA Group, Inc. | | | 0.8 | % | | |
Total | | | 11.6 | % | | |
| * | Holdings are subject to change, and may not reflect the current or future position of the portfolio. |
| | |
| 12 | | 1.855.377.7325 | www.GrandeurPeakGlobal.com |
| | |
| Grandeur Peak Global Stalwarts Fund | | Performance Update |
| | April 30, 2016 (Unaudited) |
Cumulative Total Return Performance for the periods ended April 30, 2016
| | | | | | | | | | | | | | | |
| | | | | Expense Ratio(b) |
| | | Since
Inception(a) | | Gross | | Net(c) |
Grandeur Peak Global Stalwarts – Investor (GGSOX) | | 8.55% | | | | 1.60% | | | | | 1.35% | |
Grandeur Peak Global Stalwarts – Institutional (GGSYX) | | 8.76% | | | | 1.35% | | | | | 1.10% | |
Russell Global SMID Cap Index(d) | | 6.34% | | | | | | | | | | |
Russell Global Index(e) | | 6.19% | | | | | | | | | | |
| (a) | Fund inception date of September 1, 2015. |
| (b) | Ratios as of the Prospectus dated June 29, 2015 and may differ from the ratios presented in the Financial Highlights. |
| (c) | Grandeur Peak Global Advisors, LLC (the “Adviser”), has agreed to waive and/or reimburse fees or expenses in order to limit Total Annual Fund Operating Expenses After Fee Waiver/Expense Reimbursement (excluding acquired fund fees and expenses, brokerage expenses, interest expenses, taxes and extraordinary expenses) to 1.35% and 1.10% of the Fund’s average daily net assets for the Fund’s Investor Class Shares and Institutional Class Shares, respectively. This agreement is in effect through August 31, 2016. The Adviser will be permitted to recover, on a class-by-class basis, expenses it has borne through this agreement to the extent that a Fund’s expenses in later periods fall below the annual rates set forth in this agreement or in previous agreements. Notwithstanding the foregoing, the Fund will not be obligated to pay any such deferred fees and expenses more than three years after the end of the fiscal year in which the fee and expenses was deferred. This agreement may not be terminated or modified prior to this date except with the approval of the Fund’s Board of Trustees. |
| (d) | The Russell Global SMid Cap Index is designed to measure the performance of small- and mid-cap (SMid) securities and all capitalization securities respectively of issuers located in countries throughout the world representing developed and emerging markets. The Index is not actively managed and does not reflect any deductions for fees, expenses, or taxes. An investor may not invest directly in the Index. |
| (e) | The Russell Global Index seeks to measure the performance of the global equity universe. The index is not actively managed and does not reflect any deductions for fees, expenses, or taxes. An investor may not invest directly in the Index. |
Returns for periods greater than 1 year are annualized.
The returns shown above do not reflect the deduction of taxes a shareholder would pay on Fund distributions or redemption of Fund shares.
Performance data quoted represents past performance. Past performance does not guarantee future results. Investment return and principal value of an investment will fluctuate so that an investor’s shares, when sold or redeemed, may be worth more or less than the original cost. The Fund imposes a 2.00% redemption fee on shares held for less than 60 days. Current performance data may be higher or lower than actual data quoted. For the most current month-end performance data, please call 1-855-377-PEAK (7325).
Growth of $10,000 for the period ended April 30, 2016

| | |
| Annual Report | April 30, 2016 | | 13 |
| | |
| Grandeur Peak Global Stalwarts Fund | | Performance Update |
| | April 30, 2016 (Unaudited) |
The graphs shown above represent a hypothetical investment of $10,000 in the Fund’s Investor Class shares for the period from inception to April 30, 2016. All returns reflect reinvested dividends, but do not reflect the deduction of taxes that an investor would pay on distributions or redemptions.
The Fund also offers Institutional Class shares, performance for which is not reflected in the graphs above. The performance of Institutional Class shares may be higher or lower than the performance of the Investor Class shares shown in the graphs above based upon differences in fees paid by shareholders investing in the Investor Class shares and Institutional Class shares.
| | | | | | |
| Regional Allocation (as a % of Net Assets)* | | | | | |
North America | | | 39.8 | % | | |
Asia ex Japan | | | 22.7 | % | | |
Europe | | | 18.2 | % | | |
Japan | | | 7.9 | % | | |
Latin America | | | 2.3 | % | | |
Africa/Middle East | | | 2.0 | % | | |
Australia/New Zealand | | | 0.5 | % | | |
Cash, Cash Equivalents, & Other Net Assets | | | 6.6 | % | | |
Total | | | 100.0 | % | | |
| | |
| Industry Sector Allocation (as a % of Net Assets)* | | | | | |
Financials | | | 25.5 | % | | |
Industrials | | | 23.8 | % | | |
Technology | | | 19.0 | % | | |
Consumer | | | 16.7 | % | | |
Health Care | | | 6.8 | % | | |
Energy & Materials | | | 1.6 | % | | |
Cash, Cash Equivalents, & Other Net Assets | | | 6.6 | % | | |
Total | | | 100.0 | % | | |
| | |
| Top 10 Holdings (as a % of Net Assets)* | | | | | |
MISUMI Group, Inc. | | | 2.7 | % | | |
Man Wah Holdings, Ltd. | | | 2.3 | % | | |
Value Partners Group, Ltd. | | | 2.3 | % | | |
First Republic Bank | | | 2.2 | % | | |
Knight Transportation, Inc. | | | 2.2 | % | | |
Power Integrations, Inc. | | | 2.2 | % | | |
Microchip Technology, Inc. | | | 1.9 | % | | |
MEDNAX, Inc. | | | 1.9 | % | | |
TransForce, Inc. | | | 1.8 | % | | |
PRA Group, Inc. | | | 1.8 | % | | |
Total | | | 21.3 | % | | |
| * | Holdings are subject to change, and may not reflect the current or future position of the portfolio. |
| | |
| 14 | | 1.855.377.7325 | www.GrandeurPeakGlobal.com |
| | |
| Grandeur Peak International Opportunities Fund | | Performance Update |
| | April 30, 2016 (Unaudited) |
Cumulative Total Return Performance for the periods ended April 30, 2016
| | | | | | | | | | | | | | | | | | | | | | | | | | | | | | |
| | | | | | | | | | | Expense Ratio(b) |
| | | 6 Months | | 1 Year | | 3 Years | | Since
Inception(a) | | Gross | | Net(c) |
Grandeur Peak International Opportunities Fund – Investor (GPIOX) | | | | 2.24% | | | | | -5.53% | | | | | 8.08% | | | | | 13.84% | | | | | 1.63% | | | | | 1.63% | |
Grandeur Peak International Opportunities Fund – Institutional (GPIIX) | | | | 2.76% | | | | | -5.02% | | | | | 8.36% | | | | | 14.14% | | | | | 1.38% | | | | | 1.38% | |
Russell Global ex-U.S. Small Cap Index(d) | | | | 3.22% | | | | | -4.81% | | | | | 2.84% | | | | | 6.96% | | | | | | | | | | | |
| (a) | Fund inception date of October 17, 2011. |
| (b) | Ratios as of the Prospectus dated August 31, 2015 and may differ from the ratios presented in the Financial Highlights. |
| (c) | Grandeur Peak Global Advisors, LLC (the “Adviser”), has agreed to waive and/or reimburse fees or expenses in order to limit Total Annual Fund Operating Expenses After Fee Waiver/Expense Reimbursements (excluding acquired fund fees and expenses, brokerage expenses, interest expenses, taxes and extraordinary expenses) to 1.75% and 1.50% of the Fund’s average daily net assets for the Fund’s Investor Class Shares and Institutional Class Shares, respectively. This agreement (the “Expense Agreement”) is in effect through August 31, 2016. The Adviser will be permitted to recover, on a class- by-class basis, expenses it has borne through the Expense Agreement to the extent that a Fund’s expenses in later periods fall below the expense cap in effect at the time of waiver or reimbursement. Notwithstanding the foregoing, the Funds will not be obligated to pay any such deferred fees and expenses more than three years after the end of the fiscal year in which the fee and expenses was deferred. The Expense Agreement may not be terminated or modified prior to August 31, 2016 except with the approval of the Fund’s Board of Trustees. |
| (d) | The Russell Global ex-U.S. Small Cap Index seeks to measure the performance of the small-cap segment of the global equity universe, excluding companies assigned to the United States. The Index is not actively managed and does not reflect any deductions for fees, expense, or taxes. An investor may not invest directly in the Index. |
Returns for periods greater than 1 year are annualized.
The returns shown above do not reflect the deduction of taxes a shareholder would pay on Fund distributions or redemption of Fund shares.
Performance data quoted represents past performance. Past performance does not guarantee future results. Investment return and principal value of an investment will fluctuate so that an investor’s shares, when sold or redeemed, may be worth more or less than the original cost. The Fund imposes a 2.00% redemption fee on shares held for less than 60 days. Current performance data may be higher or lower than actual data quoted. For the most current month-end performance data, please call 1-855-377-PEAK (7325).
Growth of $10,000 for the period ended April 30, 2016
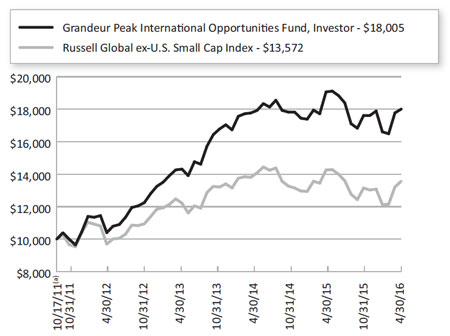
| | |
| Annual Report | April 30, 2016 | | 15 |
| | |
| Grandeur Peak International Opportunities Fund | | Performance Update |
| | April 30, 2016 (Unaudited) |
The graphs shown above represent a hypothetical investment of $10,000 in the Fund’s Investor Class shares for the period from inception to April 30, 2016. All returns reflect reinvested dividends, but do not reflect the deduction of taxes that an investor would pay on distributions or redemptions.
The Fund also offers Institutional Class shares, performance for which is not reflected in the graphs above. The performance of Institutional Class shares may be higher or lower than the performance of the Investor Class shares shown in the graphs above based upon differences in fees paid by shareholders investing in the Investor Class shares and Institutional Class shares.
| | | | | | |
| Regional Allocation (as a % of Net Assets)* | | | | | |
Asia ex Japan | | | 33.6 | % | | |
Europe | | | 32.9 | % | | |
Japan | | | 12.1 | % | | |
North America | | | 6.1 | % | | |
Africa/Middle East | | | 4.6 | % | | |
Latin America | | | 3.2 | % | | |
Australia/New Zealand | | | 2.3 | % | | |
Cash, Cash Equivalents, & Other Net Assets | | | 5.2 | % | | |
Total | | | 100.0 | % | | |
| | |
| Industry Sector Allocation (as a % of Net Assets)* | | | | | |
Industrials | | | 22.8 | % | | |
Financials | | | 22.8 | % | | |
Technology | | | 17.7 | % | | |
Consumer | | | 15.3 | % | | |
Health Care | | | 12.8 | % | | |
Energy & Materials | | | 3.4 | % | | |
Cash, Cash Equivalents, & Other Net Assets | | | 5.2 | % | | |
Total | | | 100.0 | % | | |
| | |
| Top 10 Holdings (as a % of Net Assets)* | | | | | |
Clinigen Group PLC | | | 2.5 | % | | |
Man Wah Holdings, Ltd. | | | 2.0 | % | | |
Palfinger AG | | | 1.2 | % | | |
Trancom Co., Ltd. | | | 1.2 | % | | |
Irish Residential Properties PLC, REIT | | | 1.2 | % | | |
Melexis NV | | | 1.2 | % | | |
EMIS Group PLC | | | 1.2 | % | | |
Value Partners Group, Ltd. | | | 1.2 | % | | |
MISUMI Group, Inc. | | | 1.1 | % | | |
Sporton International, Inc. | | | 1.1 | % | | |
Total | | | 13.9 | % | | |
| * | Holdings are subject to change, and may not reflect the current or future position of the portfolio. |
| | |
| 16 | | 1.855.377.7325 | www.GrandeurPeakGlobal.com |
| | |
| Grandeur Peak International Stalwarts Fund | | Performance Update |
| | April 30, 2016 (Unaudited) |
Cumulative Total Return Performance for the periods ended April 30, 2016
| | | | | | | | | | | | | | | |
| | | | | Expense Ratio(b) |
| | | Since
Inception(a) | | Gross | | Net(c) |
Grandeur Peak International Stalwarts – Investor | | | | 10.20% | | | | | 1.53% | | | | | 1.35% | |
Grandeur Peak International Stalwarts – Institutional | | | | 10.34% | | | | | 1.28% | | | | | 1.10% | |
Russell Global ex-U.S. SMID Cap Index(d) | | | | 7.79% | | | | | | | | | | | |
Russell Global ex-U.S. Small Cap Index(e) | | | | 8.13% | | | | | | | | | | | |
| (a) | Fund inception date of September 1, 2015. |
| (b) | Ratios as of the Prospectus dated June 29, 2015 and may differ from the ratios presented in the Financial Highlights. |
| (c) | Grandeur Peak Global Advisors, LLC (the “Adviser”), has agreed to waive and/or reimburse fees or expenses in order to limit Total Annual Fund Operating Expenses After Fee Waiver/Expense Reimbursement (excluding acquired fund fees and expenses, brokerage expenses, interest expenses, taxes and extraordinary expenses) to 1.35% and 1.10% of the Fund’s average daily net assets for the Fund’s Investor Class Shares and Institutional Class Shares, respectively. This agreement is in effect through August 31, 2016. The Adviser will be permitted to recover, on a class-by-class basis, expenses it has borne through this agreement to the extent that a Fund’s expenses in later periods fall below the annual rates set forth in this agreement or in previous agreements. Notwithstanding the foregoing, the Fund will not be obligated to pay any such deferred fees and expenses more than three years after the end of the fiscal year in which the fee and expenses was deferred. This agreement may not be terminated or modified prior to this date except with the approval of the Fund’s Board of Trustees. |
| (d) | The Russell Global ex-US SMID Cap Index is constructed to provide a comprehensive and unbiased barometer for the small- and mid-cap (SMid) segments excluding companies assigned to the United States. The Russell Global ex-US SMid Cap Index is reconstituted annually to accurately reflect the changes in the market over time. The Index is not actively managed and does not reflect any deductions for fees, expenses, or taxes. An investor may not invest directly in the Index. |
| (e) | The Russell Global ex-U.S. Small Cap Index is designed to measure the performance of small capitalization securities outside of the U.S. The Index is not actively managed and does not reflect any deductions for fees, expenses, or taxes. An investor may not invest directly in the Index. |
Returns for periods greater than 1 year are annualized.
The returns shown above do not reflect the deduction of taxes a shareholder would pay on Fund distributions or redemption of Fund shares.
Performance data quoted represents past performance. Past performance does not guarantee future results. Investment return and principal value of an investment will fluctuate so that an investor’s shares, when sold or redeemed, may be worth more or less than the original cost. The Fund imposes a 2.00% redemption fee on shares held for less than 60 days. Current performance data may be higher or lower than actual data quoted. For the most current month-end performance data, please call 1-855-377-PEAK (7325).
Growth of $10,000 for the period ended April 30, 2016
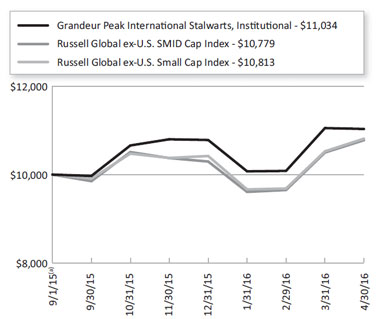
| | |
| Annual Report | April 30, 2016 | | 17 |
| | |
| Grandeur Peak International Stalwarts Fund | | Performance Update |
| | April 30, 2016 (Unaudited) |
The graphs shown above represent a hypothetical investment of $10,000 in the Fund’s Investor Class shares for the period from inception to April 30, 2016. All returns reflect reinvested dividends, but do not reflect the deduction of taxes that an investor would pay on distributions or redemptions.
The Fund also offers Institutional Class shares, performance for which is not reflected in the graphs above. The performance of Institutional Class shares may be higher or lower than the performance of the Investor Class shares shown in the graphs above based upon differences in fees paid by shareholders investing in the Investor Class shares and Institutional Class shares.
| | | | | | |
| Regional Allocation (as a % of Net Assets)* | | | | | |
Asia ex Japan | | | 32.8 | % | | |
Europe | | | 28.9 | % | | |
North America | | | 12.5 | % | | |
Japan | | | 11.9 | % | | |
Latin America | | | 3.3 | % | | |
Africa/Middle East | | | 3.0 | % | | |
Australia/New Zealand | | | 0.7 | % | | |
Cash, Cash Equivalents, & Other Net Assets | | | 6.9 | % | | |
Total | | | 100.0 | % | | |
| | |
| Industry Sector Allocation (as a % of Net Assets)* | | | | | |
Financials | | | 27.9 | % | | |
Industrials | | | 23.9 | % | | |
Consumer | | | 19.4 | % | | |
Technology | | | 15.1 | % | | |
Health Care | | | 4.7 | % | | |
Energy & Materials | | | 2.1 | % | | |
Cash, Cash Equivalents, & Other Net Assets | | | 6.9 | % | | |
Total | | | 100.0 | % | | |
| | |
| Top 10 Holdings (as a % of Net Assets)* | | | | | |
MISUMI Group, Inc. | | | 4.1 | % | | |
Man Wah Holdings, Ltd. | | | 3.0 | % | | |
TransForce, Inc. | | | 2.7 | % | | |
Value Partners Group, Ltd. | | | 2.6 | % | | |
Brembo SpA | | | 2.1 | % | | |
Stantec, Inc. | | | 2.1 | % | | |
CyberAgent, Inc. | | | 2.0 | % | | |
Aalberts Industries NV | | | 1.8 | % | | |
Nihon M&A Center, Inc. | | | 1.8 | % | | |
Puregold Price Club, Inc. | | | 1.7 | % | | |
Total | | | 23.9 | % | | |
| * | Holdings are subject to change, and may not reflect the current or future position of the portfolio. |
| | |
| 18 | | 1.855.377.7325 | www.GrandeurPeakGlobal.com |
| | |
| Grandeur Peak Funds® | | Disclosure of Fund Expenses |
| | April 30, 2016 (Unaudited) |
As a shareholder of a Fund, you incur two types of costs: (1) transaction costs, including sales charges (loads) on purchase payments, reinvested dividends, or other distributions; redemption fees; and exchange fees; and (2) ongoing costs, including management fees; distribution and/or service (12b-1) fees; and other Fund expenses. This example is intended to help you understand your ongoing costs (in dollars) of investing in the Fund and to compare these costs with the ongoing costs of investing in other mutual funds.
This example is based on an investment of $1,000 invested at the beginning of the period and held for the entire six-month period of November 1, 2015 through of April 30, 2016.
Actual Expenses The first line of the table provides information about actual account values and actual expenses. You may use the information in this line, together with the amount you invested, to estimate the expenses that you paid over the period. Simply divide your account value by $1,000 (for example, an $8,600 account value divided by $1,000 = 8.6), then multiply the result by the number in the first line under the heading “Expenses Paid During Period” to estimate the expenses you paid on your account during this period.
Hypothetical Example for Comparison Purposes The second line of the table provides information about hypothetical account values and hypothetical expenses based on the Fund’s actual expense ratio and an assumed rate of return of 5% per year before expenses, which is not the Fund’s actual return. The hypothetical account values and expenses may not be used to estimate the actual ending account balance or expenses you paid for the period. You may use this information to compare the ongoing costs of investing in the Fund and other mutual funds. To do so, compare this 5% hypothetical example with the 5% hypothetical examples that appear in the shareholder reports of the other funds.
Please note that the expenses shown in the table are meant to highlight your ongoing costs only and do not reflect any transactional costs, such as redemption fees or exchange fees. Therefore, the second line of the table is useful in comparing ongoing costs only and will not help you determine the relative total costs of owning different funds. In addition, if these transactional costs were included, your costs would have been higher.
| | |
| Annual Report | April 30, 2016 | | 19 |
| | |
| Grandeur Peak Funds® | | Disclosure of Fund Expenses |
| | April 30, 2016 (Unaudited) |
| | | | | | | | | | |
| | | Beginning Account
Value November 1, 2015 | | Ending Account
Value April 30, 2016 | | Expense Ratio(a) | | Expenses Paid
During period
November 1, 2015 -
April 30, 2016(b) | |
Grandeur Peak Emerging Markets Opportunities Fund | | | | | | | | | | |
Investor Class | | | | | | | | | | |
Actual | | $ 1,000.00 | | $ 999.20 | | 1.79% | | | $ 8.90 | |
Hypothetical (5% return before expenses) | | $ 1,000.00 | | $ 1,015.96 | | 1.79% | | | $ 8.97 | |
Institutional Class | | | | | | | | | | |
Actual | | $ 1,000.00 | | $ 999.20 | | 1.56% | | | $ 7.75 | |
Hypothetical (5% return before expenses) | | $ 1,000.00 | | $ 1,017.11 | | 1.56% | | | $ 7.82 | |
Grandeur Peak Global Micro Cap Fund | | | | | | | | | | |
Institutional Class | | | | | | | | | | |
Actual | | $ 1,000.00 | | $ 1,048.50 | | 2.00% | | | $ 10.19 | |
Hypothetical (5% return before expenses) | | $ 1,000.00 | | $ 1,014.92 | | 2.00% | | | $ 10.02 | |
Grandeur Peak Global Opportunities Fund | | | | | | | | | | |
Investor Class | | | | | | | | | | |
Actual | | $ 1,000.00 | | $ 1,014.80 | | 1.63% | | | $ 8.17 | |
Hypothetical (5% return before expenses) | | $ 1,000.00 | | $ 1,016.76 | | 1.63% | | | $ 8.17 | |
Institutional Class | | | | | | | | | | |
Actual | | $ 1,000.00 | | $ 1,016.40 | | 1.38% | | | $ 6.92 | |
Hypothetical (5% return before expenses) | | $ 1,000.00 | | $ 1,018.00 | | 1.38% | | | $ 6.92 | |
Grandeur Peak Global Reach Fund | | | | | | | | | | |
Investor Class | | | | | | | | | | |
Actual | | $ 1,000.00 | | $ 1,019.20 | | 1.60% | | | $ 8.03 | |
Hypothetical (5% return before expenses) | | $ 1,000.00 | | $ 1,016.91 | | 1.60% | | | $ 8.02 | |
Institutional Class | | | | | | | | | | |
Actual | | $ 1,000.00 | | $ 1,021.10 | | 1.34% | | | $ 6.73 | |
Hypothetical (5% return before expenses) | | $ 1,000.00 | | $ 1,018.20 | | 1.34% | | | $ 6.72 | |
Grandeur Peak Global Stalwarts Fund | | | | | | | | | | |
Investor Class | | | | | | | | | | |
Actual | | $ 1,000.00 | | $ 1,032.80 | | 1.35% | | | $ 6.82 | |
Hypothetical (5% return before expenses) | | $ 1,000.00 | | $ 1,018.15 | | 1.35% | | | $ 6.77 | |
Institutional Class | | | | | | | | | | |
Actual | | $ 1,000.00 | | $ 1,034.80 | | 1.10% | | | $ 5.57 | |
Hypothetical (5% return before expenses) | | $ 1,000.00 | | $ 1,019.39 | | 1.10% | | | $ 5.52 | |
Grandeur Peak International Opportunities Fund | | | | | | | | | | |
Investor Class | | | | | | | | | | |
Actual | | $ 1,000.00 | | $ 1,022.40 | | 1.62% | | | $ 8.15 | |
Hypothetical (5% return before expenses) | | $ 1,000.00 | | $ 1,016.81 | | 1.62% | | | $ 8.12 | |
Institutional Class | | | | | | | | | | |
Actual | | $ 1,000.00 | | $ 1,027.60 | | 1.38% | | | $ 6.96 | |
Hypothetical (5% return before expenses) | | $ 1,000.00 | | $ 1,018.00 | | 1.38% | | | $ 6.92 | |
Grandeur Peak International Stalwarts Fund | | | | | | | | | | |
Investor Class | | | | | | | | | | |
Actual | | $ 1,000.00 | | $ 1,033.80 | | 1.35% | | | $ 6.83 | |
Hypothetical (5% return before expenses) | | $ 1,000.00 | | $ 1,018.15 | | 1.35% | | | $ 6.77 | |
Institutional Class | | | | | | | | | | |
Actual | | $ 1,000.00 | | $ 1,035.10 | | 1.10% | | | $ 5.57 | |
Hypothetical (5% return before expenses) | | $ 1,000.00 | | $ 1,019.39 | | 1.10% | | | $ 5.52 | |
| (a) | The Fund’s expense ratios have been annualized based on the Fund’s most recent fiscal half-year expenses. |
| (b) | Expenses are equal to the Fund’s annualized expense ratio multiplied by the average account value over the period, multiplied by the number of days in the most recent fiscal half-year 182/366 (to reflect the half-year period). |
| | |
| 20 | | 1.855.377.7325 | www.GrandeurPeakGlobal.com |
| | |
| Grandeur Peak Emerging Markets Opportunities Fund | | Portfolio of Investments |
| | April 30, 2016 |
| | | | | | | | | | |
| | | Shares | | | Value (Note 2) | | | |
|
COMMON STOCKS (91.35%) | | | | | | | |
Argentina (0.44%) | | | | | | | | | | |
Globant SA(a) | | | 45,837 | | | $ | 1,626,755 | | | |
| | | | | | | |
| | | |
Bangladesh (0.78%) | | | | | | | | | | |
Islami Bank Bangladesh, Ltd. | | | 5,158,765 | | | | 1,454,657 | | | |
Olympic Industries, Ltd. | | | 330,763 | | | | 1,281,693 | | | |
Shasha Denims, Ltd. | | | 328,637 | | | | 155,565 | | | |
| | | | | | | |
| | | | | | | 2,891,915 | | | |
| | | | | | | |
| | | |
Brazil (2.32%) | | | | | | | | | | |
Atento SA(a) | | | 122,125 | | | | 1,044,169 | | | |
CETIP SA - Mercados Organizados | | | 123,574 | | | | 1,514,830 | | | |
FPC Par Corretora de Seguros SA | | | 407,400 | | | | 1,362,245 | | | |
Localiza Rent a Car SA | | | 38,200 | | | | 372,420 | | | |
M Dias Branco SA | | | 93,600 | | | | 2,120,067 | | | |
Valid Solucoes e Servicos de Seguranca em Meios de Pagamento e Identificacao SA | | | 217,600 | | | | 2,186,597 | | | |
| | | | | | | |
| | | | | | | 8,600,328 | | | |
| | | | | | | |
| | | |
China (11.14%) | | | | | | | | | | |
51job, Inc., ADR(a) | | | 44,750 | | | | 1,333,550 | | | |
Airtac International Group | | | 162,500 | | | | 1,078,194 | | | |
BBI Life Sciences Corp.(b) | | | 8,836,000 | | | | 1,742,846 | | | |
China Lesso Group Holdings, Ltd. | | | 3,467,000 | | | | 1,912,976 | | | |
China Medical System Holdings, Ltd. | | | 4,810,000 | | | | 6,262,940 | | | |
Dongpeng Holdings Co., Ltd. | | | 4,444,000 | | | | 2,406,219 | | | |
Essex Bio-technology, Ltd. | | | 3,801,000 | | | | 2,185,468 | | | |
Le Saunda Holdings, Ltd. | | | 2,341,400 | | | | 513,141 | | | |
Man Wah Holdings, Ltd. | | | 7,401,800 | | | | 8,645,246 | | | |
Minth Group, Ltd. | | | 1,161,000 | | | | 3,038,366 | | | |
O2Micro International, Ltd., ADR(a) | | | 542,425 | | | | 791,940 | | | |
On-Bright Electronics, Inc. | | | 370,900 | | | | 1,960,700 | | | |
Shandong Weigao Group Medical Polymer Co., Ltd., Class H | | | 1,846,000 | | | | 1,111,374 | | | |
Shanghai Haohai Biological Technology Co., Ltd., Class H(a)(b)(c) | | | 318,900 | | | | 1,845,919 | | | |
Silergy Corp. | | | 266,422 | | | | 3,551,963 | | | |
Sinosoft Technology Group, Ltd. | | | 3,852,000 | | | | 2,105,542 | | | |
Technovator International, Ltd.(a) | | | 97,000 | | | | 49,520 | | | |
| | | | | | | | | | |
| | | Shares | | | Value (Note 2) | | | |
|
China (continued) | | | | | | | | | | |
Xiabuxiabu Catering Management China Holdings Co., Ltd.(b)(c) | | | 1,188,500 | | | $ | 704,805 | | | |
| | | | | | | |
| | | | | | | 41,240,709 | | | |
| | | | | | | |
| | | |
Colombia (2.81%) | | | | | | | | | | |
Bolsa de Valores de Colombia | | | 384,090,414 | | | | 2,413,467 | | | |
Gran Tierra Energy, Inc.(a) | | | 1,124,500 | | | | 3,328,520 | | | |
Parex Resources, Inc.(a) | | | 463,931 | | | | 4,647,814 | | | |
| | | | | | | |
| | | | | | | 10,389,801 | | | |
| | | | | | | |
| | | |
Egypt (0.59%) | | | | | | | | | | |
Commercial International Bank Egypt SAE | | | 198,000 | | | | 1,007,398 | | | |
Integrated Diagnostics Holdings PLC(b)(c) | | | 251,500 | | | | 1,169,475 | | | |
| | | | | | | |
| | | | | | | 2,176,873 | | | |
| | | | | | | |
| | | |
Georgia (1.84%) | | | | | | | | | | |
BGEO Group PLC | | | 139,497 | | | | 4,667,619 | | | |
Georgia Healthcare Group PLC(a)(b)(c) | | | 756,656 | | | | 2,144,842 | | | |
| | | | | | | |
| | | | | | | 6,812,461 | | | |
| | | | | | | |
| | | |
Greece (0.61%) | | | | | | | | | | |
Sarantis SA | | | 223,934 | | | | 2,241,073 | | | |
| | | | | | | |
| | | |
Hong Kong (3.36%) | | | | | | | | | | |
International Housewares Retail Co., Ltd. | | | 8,196,000 | | | | 1,341,892 | | | |
Samsonite International SA | | | 231,000 | | | | 745,987 | | | |
Value Partners Group, Ltd. | | | 8,940,800 | | | | 8,587,059 | | | |
Vitasoy International Holdings, Ltd. | | | 940,900 | | | | 1,763,680 | | | |
| | | | | | | |
| | | | | | | 12,438,618 | | | |
| | | | | | | |
| | | |
India (15.40%) | | | | | | | | | | |
AIA Engineering, Ltd. | | | 81,250 | | | | 1,213,789 | | | |
Ajanta Pharma, Ltd. | | | 43,230 | | | | 987,062 | | | |
Alkem Laboratories, Ltd. | | | 185,834 | | | | 3,336,635 | | | |
Allcargo Logistics, Ltd. | | | 513,000 | | | | 1,191,818 | | | |
Bajaj Finance, Ltd. | | | 19,600 | | | | 2,017,946 | | | |
City Union Bank, Ltd. | | | 1,189,500 | | | | 1,683,914 | | | |
Credit Analysis & Research, Ltd. | | | 93,490 | | | | 1,424,972 | | | |
Cyient, Ltd. | | | 411,095 | | | | 2,847,854 | | | |
Dewan Housing Finance Corp., Ltd. | | | 1,202,000 | | | | 3,593,496 | | | |
Divi’s Laboratories, Ltd. | | | 94,500 | | | | 1,497,497 | | | |
Eros International Media, Ltd.(a) | | | 310,000 | | | | 863,448 | | | |
| | |
| See Notes to Financial Statements. | | |
Annual Report | April 30, 2016 | | 21 |
| | |
| Grandeur Peak Emerging Markets Opportunities Fund | | Portfolio of Investments |
| | April 30, 2016 |
| | | | | | | | | | |
| | | Shares | | | Value (Note 2) | | | |
|
India (continued) | | | | | | | | | | |
Essel Propack, Ltd. | | | 502,000 | | | $ | 1,382,714 | | | |
Hinduja Global Solutions, Ltd. | | | 194,500 | | | | 1,196,235 | | | |
Indiabulls Housing Finance, Ltd. | | | 294,000 | | | | 3,072,750 | | | |
Infinite Computer Solutions India,
Ltd.(a) | | | 529,500 | | | | 1,744,245 | | | |
Inox Wind, Ltd.(a) | | | 341,500 | | | | 1,399,362 | | | |
Jammu & Kashmir Bank, Ltd. | | | 1,858,199 | | | | 1,924,593 | | | |
Kolte-Patil Developers, Ltd. | | | 1,265,909 | | | | 2,368,450 | | | |
Kovai Medical Center and Hospital | | | 68,583 | | | | 749,626 | | | |
KPIT Technologies, Ltd. | | | 999,780 | | | | 2,410,144 | | | |
Kwality, Ltd. | | | 640,200 | | | | 1,177,030 | | | |
MBL Infrastructures, Ltd. | | | 773,000 | | | | 1,643,776 | | | |
MT Educare, Ltd. | | | 731,731 | | | | 1,867,663 | | | |
PC Jeweller, Ltd. | | | 84,000 | | | | 456,662 | | | |
PI Industries, Ltd. | | | 67,675 | | | | 655,273 | | | |
Poly Medicure, Ltd. | | | 91,722 | | | | 383,662 | | | |
Somany Ceramics, Ltd. | | | 80,760 | | | | 496,577 | | | |
Time Technoplast, Ltd. | | | 4,012,600 | | | | 2,894,662 | | | |
UFO Moviez India, Ltd. | | | 113,382 | | | | 874,082 | | | |
Vaibhav Global, Ltd.(a) | | | 251,319 | | | | 1,178,164 | | | |
Vardhman Textiles, Ltd. | | | 111,719 | | | | 1,476,281 | | | |
Vesuvius India, Ltd. | | | 171,200 | | | | 1,967,910 | | | |
WNS Holdings, Ltd., ADR(a) | | | 158,450 | | | | 5,021,280 | | | |
| | | | | | | |
| | | | | | | 56,999,572 | | | |
| | | | | | | |
| | | |
Indonesia (7.35%) | | | | | | | | | | |
Arwana Citramulia Tbk PT | | | 30,895,200 | | | | 1,405,605 | | | |
Astra Graphia Tbk PT | | | 8,442,500 | | | | 1,267,527 | | | |
Bank Negara Indonesia Persero Tbk PT | | | 14,605,500 | | | | 5,077,814 | | | |
Bank Tabungan Pensiunan Nasional Tbk PT(a) | | | 4,985,000 | | | | 1,013,027 | | | |
Bekasi Fajar Industrial Estate Tbk PT | | | 56,350,600 | | | | 1,204,949 | | | |
Express Transindo Utama Tbk PT(a) | | | 9,051,500 | | | | 133,837 | | | |
Hexindo Adiperkasa Tbk PT | | | 1,130,200 | | | | 151,259 | | | |
Indonesia Pondasi Raya Tbk PT(a) | | | 12,432,500 | | | | 1,536,622 | | | |
Link Net Tbk PT | | | 4,353,500 | | | | 1,391,417 | | | |
Lippo Cikarang Tbk PT(a) | | | 2,916,500 | | | | 1,619,909 | | | |
Panin Sekuritas Tbk PT | | | 7,155,500 | | | | 1,817,632 | | | |
Petra Foods, Ltd. | | | 866,400 | | | | 1,594,483 | | | |
Selamat Sempurna Tbk PT | | | 10,365,600 | | | | 3,709,860 | | | |
Surya Toto Indonesia Tbk PT | | | 1,979,500 | | | | 960,631 | | | |
Tempo Scan Pacific Tbk PT | | | 17,950,700 | | | | 2,722,278 | | | |
| | | | | | | | | | |
| | | Shares | | | Value (Note 2) | | | |
|
Indonesia (continued) | | | | | | | | | | |
Ultrajaya Milk Industry & Trading Co. Tbk PT(a) | | | 5,042,900 | | | $ | 1,600,283 | | | |
| | | | | | | |
| | | | | | | 27,207,133 | | | |
| | | | | | | |
| | | |
Malaysia (3.78%) | | | | | | | | | | |
7-Eleven Malaysia Holdings Bhd | | | 2,977,300 | | | | 1,059,375 | | | |
AEON Credit Service M Bhd | | | 631,100 | | | | 2,129,246 | | | |
Berjaya Auto Bhd | | | 2,649,600 | | | | 1,492,159 | | | |
Berjaya Food Bhd | | | 2,088,084 | | | | 1,010,234 | | | |
CB Industrial Product Holding Bhd | | | 3,838,800 | | | | 2,211,007 | | | |
GHL Systems Bhd(a) | | | 717,700 | | | | 160,754 | | | |
Kossan Rubber Industries | | | 1,188,000 | | | | 1,824,651 | | | |
My EG Services Bhd | | | 5,041,600 | | | | 2,594,040 | | | |
Nirvana Asia, Ltd.(b)(c) | | | 5,280,000 | | | | 1,490,699 | | | |
| | | | | | | |
| | | | | | | 13,972,165 | | | |
| | | | | | | |
| | | |
Mexico (2.33%) | | | | | | | | | | |
Banregio Grupo Financiero SAB de CV | | | 367,200 | | | | 2,204,739 | | | |
Credito Real SAB de CV SOFOM ER | | | 2,295,851 | | | | 5,050,841 | | | |
Unifin Financiera SAB de CV SOFOM ENR | | | 460,700 | | | | 1,351,200 | | | |
| | | | | | | |
| | | | | | | 8,606,780 | | | |
| | | | | | | |
| | | |
Oman (0.59%) | | | | | | | | | | |
Al Anwar Ceramic Tiles Co. | | | 1,015,026 | | | | 711,744 | | | |
Tethys Oil AB | | | 205,800 | | | | 1,473,579 | | | |
| | | | | | | |
| | | | | | | 2,185,323 | | | |
| | | | | | | |
| | | |
Pakistan (2.03%) | | | | | | | | | | |
Abbott Laboratories Pakistan, Ltd. | | | 113,300 | | | | 724,917 | | | |
Bank Al Habib, Ltd. | | | 1,609,000 | | | | 644,245 | | | |
Bata Pakistan, Ltd. | | | 11,160 | | | | 351,429 | | | |
DG Khan Cement Co., Ltd. | | | 548,500 | | | | 914,123 | | | |
Hum Network, Ltd. | | | 6,360,500 | | | | 668,248 | | | |
Kohinoor Textile Mills, Ltd. | | | 1,203,951 | | | | 852,571 | | | |
Meezan Bank, Ltd. | | | 2,317,500 | | | | 927,708 | | | |
Pak Elektron, Ltd. | | | 1,110,500 | | | | 666,968 | | | |
Shell Pakistan, Ltd. | | | 264,400 | | | | 693,856 | | | |
Systems, Ltd. | | | 1,981,500 | | | | 1,049,413 | | | |
| | | | | | | |
| | | | | | | 7,493,478 | | | |
| | | | | | | |
| | | |
Philippines (6.27%) | | | | | | | | | | |
Concepcion Industrial Corp. | | | 3,603,660 | | | | 3,689,164 | | | |
Metropolitan Bank & Trust Co. | | | 957,990 | | | | 1,660,073 | | | |
Pepsi-Cola Products Philippines, Inc. | | | 36,075,000 | | | | 2,854,455 | | | |
| | |
| See Notes to Financial Statements. | | |
22 | | 1.855.377.7325 | www.GrandeurPeakGlobal.com |
| | |
| Grandeur Peak Emerging Markets Opportunities Fund | | Portfolio of Investments |
| | April 30, 2016 |
| | | | | | | | | | |
| | | Shares | | | Value (Note 2) | | | |
|
Philippines (continued) | | | | | | | | | | |
Puregold Price Club, Inc. | | | 4,179,100 | | | $ | 3,583,041 | | | |
Robinsons Land Corp. | | | 3,948,600 | | | | 2,282,209 | | | |
Robinsons Retail Holdings, Inc. | | | 1,415,000 | | | | 2,323,753 | | | |
Security Bank Corp. | | | 1,880,600 | | | | 6,818,491 | | | |
| | | | | | | |
| | | | | | | 23,211,186 | | | |
| | | | | | | |
| | | |
Poland (0.65%) | | | | | | | | | | |
PGS Software SA | | | 8,733 | | | | 28,394 | | | |
Wawel SA | | | 3,914 | | | | 1,138,120 | | | |
Work Service SA | | | 432,107 | | | | 1,233,961 | | | |
| | | | | | | |
| | | | | | | 2,400,475 | | | |
| | | | | | | |
| | | |
Russia (0.72%) | | | | | | | | | | |
MD Medical Group Investments PLC, GDR(b) | | | 218,300 | | | | 1,211,565 | | | |
TCS Group Holding GDR PLC(a)(b) | | | 370,000 | | | | 1,461,500 | | | |
| | | | | | | |
| | | | | | | 2,673,065 | | | |
| | | | | | | |
| | | |
South Africa (6.36%) | | | | | | | | | | |
ARB Holdings, Ltd. | | | 1,134,108 | | | | 438,179 | | | |
Blue Label Telecoms, Ltd. | | | 3,689,823 | | | | 4,074,675 | | | |
Cartrack Holdings, Ltd. | | | 2,627,200 | | | | 1,716,370 | | | |
Clicks Group, Ltd. | | | 230,700 | | | | 1,684,964 | | | |
Comair, Ltd. | | | 6,720,142 | | | | 1,520,090 | | | |
EOH Holdings, Ltd. | | | 270,424 | | | | 2,632,005 | | | |
Interwaste Holdings, Ltd.(a) | | | 15,918,682 | | | | 995,250 | | | |
Invicta Holdings, Ltd. | | | 320,282 | | | | 1,221,708 | | | |
Italtile, Ltd. | | | 1,502,579 | | | | 1,335,250 | | | |
MiX Telematics, Ltd., Sponsored ADR | | | 218,036 | | | | 889,587 | | | |
Mr. Price Group, Ltd. | | | 117,900 | | | | 1,497,680 | | | |
OneLogix Group, Ltd. | | | 2,142,622 | | | | 510,247 | | | |
Super Group, Ltd.(a) | | | 389,780 | | | | 1,126,468 | | | |
Transaction Capital, Ltd. | | | 4,689,040 | | | | 3,886,877 | | | |
| | | | | | | |
| | | | | | | 23,529,350 | | | |
| | | | | | | |
| | | |
South Korea (6.23%) | | | | | | | | | | |
Access Bio, Inc.,
KDR(a) | | | 156,000 | | | | 1,052,870 | | | |
DGB Financial Group, Inc. | | | 317,000 | | | | 2,551,246 | | | |
Hy-Lok Corp. | | | 148,243 | | | | 3,701,521 | | | |
Interpark Holdings Corp. | | | 265,500 | | | | 2,052,883 | | | |
ISC Co., Ltd. | | | 182,857 | | | | 4,020,158 | | | |
Koh Young Technology, Inc. | | | 46,744 | | | | 1,723,054 | | | |
Kolao Holdings | | | 181,000 | | | | 1,628,269 | | | |
Solueta Co., Ltd.(a) | | | 144,000 | | | | 1,004,740 | | | |
TechWing, Inc. | | | 88,500 | | | | 998,091 | | | |
Vitzrocell Co., Ltd. | | | 348,795 | | | | 3,443,869 | | | |
| | | | | | | | | | |
| | | Shares | | | Value (Note 2) | | | |
|
South Korea (continued) | | | | | | | | | | |
Wins Co., Ltd. | | | 102,412 | | | $ | 892,532 | | | |
| | | | | | | |
| | | | | | | 23,069,233 | | | |
| | | | | | | |
| | | |
Sri Lanka (2.28%) | | | | | | | | | | |
Hatton National Bank PLC | | | 1,002,391 | | | | 1,418,769 | | | |
Hemas Holdings PLC | | | 3,804,326 | | | | 2,377,541 | | | |
Lanka Hospital Corp. PLC | | | 1,640,200 | | | | 677,389 | | | |
Royal Ceramics Lanka PLC | | | 3,593,775 | | | | 2,897,135 | | | |
Sampath Bank PLC | | | 657,838 | | | | 1,047,593 | | | |
| | | | | | | |
| | | | | | | 8,418,427 | | | |
| | | | | | | |
| | | |
Switzerland (0.36%) | | | | | | | | | | |
Wizz Air Holdings PLC(a)(b)(c) | | | 48,600 | | | | 1,335,024 | | | |
| | | | | | | |
| | | |
Taiwan (9.11%) | | | | | | | | | | |
ASPEED Technology, Inc. | | | 222,929 | | | | 2,039,006 | | | |
Chipbond Technology Corp. | | | 578,000 | | | | 770,595 | | | |
Cub Elecparts, Inc. | | | 88,002 | | | | 1,066,840 | | | |
Dr. Wu Skincare Co., Ltd. | | | 178,000 | | | | 1,887,452 | | | |
I Yuan Precision Ind. Co., Ltd. | | | 186,000 | | | | 735,281 | | | |
Materials Analysis Technology, Inc. | | | 1,223,000 | | | | 2,802,211 | | | |
Novatek Microelectronics Corp. | | | 577,000 | | | | 2,021,548 | | | |
Pacific Hospital Supply Co., Ltd. | | | 314,000 | | | | 926,822 | | | |
Polytronics Technology Corp. | | | 646,000 | | | | 1,191,734 | | | |
Sinmag Equipment Corp. | | | 891,133 | | | | 2,956,352 | | | |
Sitronix Technology Corp. | | | 1,275,000 | | | | 3,731,746 | | | |
Solidwizard Technology Co., Ltd. | | | 588,000 | | | | 1,996,279 | | | |
Sporton International, Inc. | | | 789,534 | | | | 4,332,853 | | | |
Test Research, Inc. | | | 1,990,000 | | | | 2,813,506 | | | |
Topoint Technology Co., Ltd. | | | 1,391,000 | | | | 931,560 | | | |
TSC Auto ID Technology Co., Ltd. | | | 133,400 | | | | 1,195,318 | | | |
UDE Corp. | | | 1,524,000 | | | | 1,417,543 | | | |
Voltronic Power Technology Corp. | | | 56,425 | | | | 890,470 | | | |
| | | | | | | |
| | | | | | | 33,707,116 | | | |
| | | | | | | |
| | | |
Thailand (1.08%) | | | | | | | | | | |
Ananda Development PCL | | | 26,165,000 | | | | 2,726,613 | | | |
Premier Marketing PCL | | | 4,566,900 | | | | 1,274,758 | | | |
| | | | | | | |
| | | | | | | 4,001,371 | | | |
| | | | | | | |
| | | |
Turkey (0.98%) | | | | | | | | | | |
EGE Seramik Sanayi ve Ticaret AS | | | 1,167,186 | | | | 1,889,690 | | | |
| | |
| See Notes to Financial Statements. | | |
Annual Report | April 30, 2016 | | 23 |
| | |
| Grandeur Peak Emerging Markets Opportunities Fund | | Portfolio of Investments |
| | April 30, 2016 |
| | | | | | | | | | |
| | | Shares | | | Value (Note 2) | | | |
|
Turkey (continued) | | | | | | | | | | |
Pinar SUT Mamulleri Sanayii AS | | | 283,846 | | | $ | 1,723,568 | | | |
| | | | | | | |
| | | | | | | 3,613,258 | | | |
| | | | | | | |
| | | |
United Arab Emirates (0.25%) | | | | | | | | | | |
Aramex PJSC | | | 1,018,125 | | | | 942,477 | | | |
| | | | | | | |
| | | |
United States (0.66%) | | | | | | | | | | |
First Cash Financial Services, Inc. | | | 53,650 | | | | 2,453,415 | | | |
| | | | | | | |
| | | |
Vietnam (1.03%) | | | | | | | | | | |
DHG Pharmaceutical JSC | | | 45,000 | | | | 170,607 | | | |
PetroVietnam Drilling and Well Services JSC | | | 1,092,500 | | | | 1,196,025 | | | |
Vietnam Dairy Products JSC | | | 389,589 | | | | 2,429,687 | | | |
Vietnam Sun Corp. | | | 4 | | | | 5 | | | |
| | | | | | | |
| | | | | | | 3,796,324 | | | |
| | | | | | | |
| | |
TOTAL COMMON STOCKS (Cost $349,002,049) | | | | 338,033,705 | | | |
| | | | | | | |
| | |
PREFERRED STOCKS (0.56%) | | | | | | | |
Brazil (0.56%) | | | | | | | | | | |
Banco ABC Brasil SA | | | 227,416 | | | | 776,954 | | | |
Banco Daycoval SA | | | 528,137 | | | | 1,300,667 | | | |
| | | | | | | |
| | | | | | | 2,077,621 | | | |
| | | | | | | |
| | |
TOTAL PREFERRED STOCKS (Cost $2,752,101) | | | | 2,077,621 | | | |
| | | | | | | |
| | |
TOTAL INVESTMENTS (91.91%) (Cost $351,754,150) | | | $ | 340,111,326 | | | |
| | |
Other Assets In Excess Of Liabilities (8.09%) | | | | 29,929,423 | | | |
| | | | | | | |
| | |
NET ASSETS (100.00%) | | | $ | 370,040,749 | | | |
| | | | | | | |
| (a) | Non-Income Producing Security. |
| (b) | Security was purchased pursuant to Regulation S under the Securities Act of 1933, which exempts securities offered and sold outside of the United States from registration. Such security cannot be sold in the United States without either an effective registration statement filed pursuant to the Securities Act of 1933, or pursuant to an exemption from registration. The security has been deemed liquid under guidelines approved by the Fund’s Board of Trustees. As of April 30, 2016, the aggregate market value of those securities was $13,106,675, representing 3.54% of net assets. |
| (c) | Security exempt from registration under Rule 144A of the Securities Act of 1933. These securities may be resold in the ordinary course of business in transactions exempt from registration, normally to qualified institutional buyers. As of April 30, 2016, these securities had a total aggregate market value of $8,690,764, representing 2.35% of net assets. |
For Fund compliance purposes, the Fund’s geographical classifications refer to any one or more of the country sub-classifications used by one or more widely recognized market indexes or ratings group indexes, and/or as defined by Fund management. This definition may not apply for purposes of this report, which may combine sub-classifications for reporting ease. Geographical regions are shown as a percentage of net assets.
| | |
| See Notes to Financial Statements. | | |
24 | | 1.855.377.7325 | www.GrandeurPeakGlobal.com |
| | |
| Grandeur Peak Global Micro Cap Fund | | Portfolio of Investments |
| | April 30, 2016 |
| | | | | | | | | | |
| | | Shares | | | Value (Note 2) | | | |
|
COMMON STOCKS (98.30%) | | | | | | | |
Australia (3.19%) | | | | | | | | | | |
AUB Group, Ltd. | | | 23,200 | | | $ | 153,469 | | | |
Beacon Lighting Group, Ltd. | | | 79,100 | | | | 109,461 | | | |
CTI Logistics, Ltd. | | | 158,141 | | | | 96,194 | | | |
Greencross, Ltd. | | | 42,500 | | | | 229,759 | | | |
LifeHealthcare Group, Ltd. | | | 69,700 | | | | 72,075 | | | |
Lycopodium, Ltd. | | | 121,926 | | | | 140,914 | | | |
Medical Developments International, Ltd. | | | 18,000 | | | | 85,539 | | | |
Reject Shop, Ltd. | | | 9,935 | | | | 93,822 | | | |
| | | | | | | |
| | | | | | | 981,233 | | | |
| | | | | | | |
| | | |
Bangladesh (0.11%) | | | | | | | | | | |
Shasha Denims, Ltd. | | | 69,200 | | | | 32,757 | | | |
| | | | | | | |
| | | |
Brazil (0.87%) | | | | | | | | | | |
FPC Par Corretora de Seguros SA | | | 61,700 | | | | 206,310 | | | |
QGEP Participacoes SA | | | 50,600 | | | | 60,027 | | | |
| | | | | | | |
| | | | | | | 266,337 | | | |
| | | | | | | |
| | | |
Britain (7.02%) | | | | | | | | | | |
AB Dynamics PLC | | | 41,900 | | | | 286,520 | | | |
Alliance Pharma PLC | | | 253,300 | | | | 166,549 | | | |
Arrow Global Group PLC | | | 44,700 | | | | 167,856 | | | |
Bioventix PLC | | | 7,799 | | | | 117,659 | | | |
City of London Investment Group PLC | | | 18,400 | | | | 82,537 | | | |
Clinigen Group PLC | | | 18,900 | | | | 148,020 | | | |
dotdigital group PLC | | | 215,000 | | | | 146,079 | | | |
IDOX PLC | | | 92,000 | | | | 75,783 | | | |
Morses Club PLC(a) | | | 64,438 | | | | 101,686 | | | |
On the Beach Group
PLC(a)(b)(c) | | | 33,000 | | | | 132,660 | | | |
Oxford Immunotec Global PLC(a) | | | 40,250 | | | | 421,015 | | | |
S&U PLC | | | 3,000 | | | | 93,367 | | | |
Sanne Group PLC | | | 17,913 | | | | 115,491 | | | |
Tracsis PLC | | | 14,300 | | | | 103,950 | | | |
| | | | | | | |
| | | | | | | 2,159,172 | | | |
| | | | | | | |
| | | |
Canada (3.33%) | | | | | | | | | | |
Biosyent, Inc.(a) | | | 39,293 | | | | 217,338 | | | |
Cipher Pharmaceuticals, Inc.(a) | | | 94,600 | | | | 559,442 | | | |
Delphi Energy Corp.(a) | | | 79,300 | | | | 74,579 | | | |
DIRTT Environmental Solutions(a) | | | 24,800 | | | | 107,130 | | | |
Sandvine Corp. | | | 29,900 | | | | 64,580 | | | |
| | | | | | | |
| | | | | | | 1,023,069 | | | |
| | | | | | | |
| | | | | | | | | | |
| | | Shares | | | Value (Note 2) | | | |
|
China (2.94%) | | | | | | | | | | |
BBI Life Sciences Corp.(c) | | | 716,000 | | | $ | 141,227 | | | |
Dongpeng Holdings Co., Ltd. | | | 227,000 | | | | 122,910 | | | |
Essex Bio-technology, Ltd. | | | 220,000 | | | | 126,494 | | | |
Le Saunda Holdings, Ltd. | | | 313,000 | | | | 68,597 | | | |
O2Micro International, Ltd., ADR(a) | | | 96,300 | | | | 140,598 | | | |
On-Bright Electronics, Inc. | | | 40,000 | | | | 211,453 | | | |
Xiabuxiabu Catering Management China Holdings Co.,
Ltd.(b)(c) | | | 158,000 | | | | 93,697 | | | |
| | | | | | | |
| | | | | | | 904,976 | | | |
| | | | | | | |
| | | |
Colombia (1.13%) | | | | | | | | | | |
Bolsa de Valores de Colombia | | | 20,370,422 | | | | 127,999 | | | |
Gran Tierra Energy, Inc.(a) | | | 74,450 | | | | 220,372 | | | |
| | | | | | | |
| | | | | | | 348,371 | | | |
| | | | | | | |
| | | |
France (5.63%) | | | | | | | | | | |
1000mercis | | | 1,800 | | | | 78,713 | | | |
ARGAN SA, REIT | | | 3,599 | | | | 91,693 | | | |
Esker SA | | | 6,700 | | | | 218,264 | | | |
Infotel SA | | | 9,000 | | | | 305,763 | | | |
Medicrea
International(a) | | | 16,100 | | | | 109,506 | | | |
MGI Digital Graphic Technology(a) | | | 4,300 | | | | 150,173 | | | |
Neurones | | | 7,600 | | | | 158,209 | | | |
SoluCom | | | 4,500 | | | | 334,721 | | | |
Tessi SA | | | 850 | | | | 141,127 | | | |
Thermador Groupe | | | 1,550 | | | | 141,738 | | | |
| | | | | | | |
| | | | | | | 1,729,907 | | | |
| | | | | | | |
| | | |
Georgia (0.80%) | | | | | | | | | | |
Georgia Healthcare Group PLC(a)(b)(c) | | | 49,000 | | | | 138,897 | | | |
TBC Bank JSC, GDR(c) | | | 10,300 | | | | 108,150 | | | |
| | | | | | | |
| | | | | | | 247,047 | | | |
| | | | | | | |
| | | |
Germany (1.80%) | | | | | | | | | | |
First Sensor AG(a) | | | 8,100 | | | | 98,314 | | | |
Nexus AG | | | 4,500 | | | | 78,837 | | | |
publity AG | | | 3,600 | | | | 152,109 | | | |
Softing AG | | | 14,035 | | | | 224,187 | | | |
| | | | | | | |
| | | | | | | 553,447 | | | |
| | | | | | | |
| | | |
Greece (0.57%) | | | | | | | | | | |
Sarantis SA | | | 17,478 | | | | 174,915 | | | |
| | | | | | | |
| | | |
Greenland (0.46%) | | | | | | | | | | |
GronlandsBANKEN A/S | | | 1,552 | | | | 142,791 | | | |
| | | | | | | |
| | |
| See Notes to Financial Statements. | | |
Annual Report | April 30, 2016 | | 25 |
| | |
| Grandeur Peak Global Micro Cap Fund | | Portfolio of Investments |
| | April 30, 2016 |
| | | | | | | | | | |
| | | Shares | | | Value (Note 2) | | | |
|
Hong Kong (1.11%) | | | | | | | | | | |
International Housewares Retail Co., Ltd. | | | 1,026,000 | | | $ | 167,982 | | | |
TK Group Holdings, Ltd. | | | 634,000 | | | | 172,458 | | | |
| | | | | | | |
| | | | | | | 340,440 | | | |
| | | | | | | |
| | | |
India (8.08%) | | | | | | | | | | |
City Union Bank, Ltd. | | | 117,500 | | | | 166,339 | | | |
Credit Analysis & Research, Ltd. | | | 3,000 | | | | 45,726 | | | |
Cyient, Ltd. | | | 10,140 | | | | 70,245 | | | |
Dewan Housing Finance Corp., Ltd. | | | 59,500 | | | | 177,881 | | | |
Eros International Media, Ltd.(a) | | | 48,000 | | | | 133,695 | | | |
Igarashi Motors India, Ltd. | | | 18,000 | | | | 165,997 | | | |
Jammu & Kashmir Bank, Ltd. | | | 127,200 | | | | 131,745 | | | |
Kolte-Patil Developers, Ltd. | | | 96,578 | | | | 180,692 | | | |
Kovai Medical Center and Hospital | | | 21,967 | | | | 240,104 | | | |
KPIT Technologies, Ltd. | | | 66,000 | | | | 159,104 | | | |
Kwality, Ltd. | | | 29,000 | | | | 53,318 | | | |
MBL Infrastructures, Ltd. | | | 54,500 | | | | 115,894 | | | |
MT Educare, Ltd. | | | 40,000 | | | | 102,096 | | | |
Persistent Systems, Ltd. | | | 10,500 | | | | 117,545 | | | |
Poly Medicure, Ltd. | | | 3,155 | | | | 13,197 | | | |
Somany Ceramics, Ltd. | | | 13,033 | | | | 80,137 | | | |
Tata Investment Corp., Ltd. | | | 18,400 | | | | 138,520 | | | |
Time Technoplast, Ltd. | | | 328,000 | | | | 236,617 | | | |
UFO Moviez India, Ltd. | | | 7,375 | | | | 56,855 | | | |
Vesuvius India, Ltd. | | | 8,570 | | | | 98,510 | | | |
| | | | | | | |
| | | | | | | 2,484,217 | | | |
| | | | | | | |
| | | |
Indonesia (3.24%) | | | | | | | | | | |
Arwana Citramulia Tbk PT | | | 1,672,600 | | | | 76,096 | | | |
Astra Graphia Tbk PT | | | 1,179,700 | | | | 177,116 | | | |
Bekasi Fajar Industrial Estate Tbk PT | | | 2,910,700 | | | | 62,240 | | | |
BFI Finance Indonesia Tbk PT | | | 746,000 | | | | 144,386 | | | |
Hexindo Adiperkasa Tbk PT | | | 634,500 | | | | 84,918 | | | |
Lippo Cikarang Tbk
PT(a) | | | 102,300 | | | | 56,820 | | | |
Panin Sekuritas Tbk PT | | | 272,700 | | | | 69,271 | | | |
Selamat Sempurna Tbk PT | | | 473,600 | | | | 169,502 | | | |
Surya Toto Indonesia Tbk PT | | | 318,000 | | | | 154,322 | | | |
| | | | | | | |
| | | | | | | 994,671 | | | |
| | | | | | | |
| | | |
Ireland (1.01%) | | | | | | | | | | |
Irish Residential Properties PLC, REIT | | | 241,800 | | | | 310,098 | | | |
| | | | | | | |
| | | | | | | | | | |
| | | Shares | | | Value (Note 2) | | | |
|
Israel (0.66%) | | | | | | | | | | |
Camtek, Ltd.(a) | | | 10,711 | | | $ | 23,671 | | | |
Hamlet Israel-Canada,
Ltd.(a) | | | 4,500 | | | | 34,697 | | | |
Silicom, Ltd. | | | 5,250 | | | | 144,953 | | | |
| | | | | | | |
| | | | | | | 203,321 | | | |
| | | | | | | |
| | | |
Italy (0.42%) | | | | | | | | | | |
Banca Sistema SpA(a)(b)(c) | | | 39,800 | | | | 128,516 | | | |
| | | | | | | |
| | | |
Japan (14.87%) | | | | | | | | | | |
AIT Corp. | | | 18,900 | | | | 159,691 | | | |
Amiyaki Tei Co., Ltd. | | | 5,500 | | | | 222,274 | | | |
Anest Iwata Corp. | | | 31,100 | | | | 338,183 | | | |
AP Company Co., Ltd.(a) | | | 9,500 | | | | 101,429 | | | |
ARCLAND SERVICE Co., Ltd. | | | 4,000 | | | | 115,413 | | | |
Central Automotive Products, Ltd. | | | 13,000 | | | | 109,351 | | | |
CMIC Holdings Co., Ltd. | | | 13,300 | | | | 201,625 | | | |
eGuarantee, Inc. | | | 8,500 | | | | 190,611 | | | |
Encourage Technologies Co., Ltd. | | | 4,000 | | | | 83,534 | | | |
Future Architect, Inc. | | | 47,700 | | | | 335,335 | | | |
GCA Savvian Corp. | | | 32,100 | | | | 311,044 | | | |
Hard Off Corp. Co., Ltd. | | | 44,400 | | | | 631,782 | | | |
JCU Corp. | | | 3,300 | | | | 107,312 | | | |
M&A Capital Partners Co., Ltd.(a) | | | 21,200 | | | | 364,226 | | | |
Monogatari Corp. | | | 1,300 | | | | 63,289 | | | |
Naigai Trans Line, Ltd. | | | 11,700 | | | | 106,224 | | | |
Prestige International, Inc. | | | 25,200 | | | | 296,053 | | | |
Quick Co., Ltd. | | | 15,500 | | | | 125,719 | | | |
Syuppin Co., Ltd. | | | 44,600 | | | | 543,248 | | | |
Trancom Co., Ltd. | | | 2,700 | | | | 164,944 | | | |
| | | | | | | |
| | | | | | | 4,571,287 | | | |
| | | | | | | |
| | | |
Malaysia (0.62%) | | | | | | | | | | |
AEON Credit Service M Bhd | | | 27,800 | | | | 93,793 | | | |
Berjaya Food Bhd | | | 201,300 | | | | 97,391 | | | |
| | | | | | | |
| | | | | | | 191,184 | | | |
| | | | | | | |
| | | |
Mexico (0.51%) | | | | | | | | | | |
Credito Real SAB de CV SOFOM ER | | | 70,700 | | | | 155,539 | | | |
| | | | | | | |
| | | |
New Zealand (0.82%) | | | | | | | | | | |
CBL Corp., Ltd. | | | 62,000 | | | | 103,900 | | | |
Trilogy International, Ltd. | | | 65,412 | | | | 148,897 | | | |
| | | | | | | |
| | | | | | | 252,797 | | | |
| | | | | | | |
| | | |
Norway (2.01%) | | | | | | | | | | |
Medistim ASA | | | 25,862 | | | | 170,232 | | | |
Multiconsult ASA(b)(c) | | | 19,400 | | | | 226,482 | | | |
| | |
| See Notes to Financial Statements. | | |
26 | | 1.855.377.7325 | www.GrandeurPeakGlobal.com |
| | |
| Grandeur Peak Global Micro Cap Fund | | Portfolio of Investments |
| | April 30, 2016 |
| | | | | | | | | | |
| | | Shares | | | Value (Note 2) | | | |
|
Norway (continued) | | | | | | | | | | |
Skandiabanken ASA(a)(b)(c) | | | 37,900 | | | $ | 221,229 | | | |
| | | | | | | |
| | | | | | | 617,943 | | | |
| | | | | | | |
| | | |
Oman (0.39%) | | | | | | | | | | |
Tethys Oil AB | | | 16,900 | | | | 121,008 | | | |
| | | | | | | |
| | | |
Philippines (0.74%) | | | | | | | | | | |
Concepcion Industrial Corp. | | | 97,900 | | | | 100,223 | | | |
Pepsi-Cola Products Philippines, Inc. | | | 1,624,000 | | | | 128,500 | | | |
| | | | | | | |
| | | | | | | 228,723 | | | |
| | | | | | | |
| | | |
Poland (0.42%) | | | | | | | | | | |
PGS Software SA | | | 39,450 | | | | 128,263 | | | |
| | | | | | | |
| | | |
Singapore (1.06%) | | | | | | | | | | |
CSE Global, Ltd. | | | 171,600 | | | | 54,867 | | | |
Riverstone Holdings, Ltd. | | | 372,800 | | | | 270,276 | | | |
| | | | | | | |
| | | | | | | 325,143 | | | |
| | | | | | | |
| | | |
South Africa (1.73%) | | | | | | | | | | |
ARB Holdings, Ltd. | | | 283,543 | | | | 109,551 | | | |
Cartrack Holdings, Ltd. | | | 178,400 | | | | 116,550 | | | |
Interwaste Holdings, Ltd.(a) | | | 800,000 | | | | 50,017 | | | |
MiX Telematics, Ltd., Sponsored ADR | | | 23,575 | | | | 96,186 | | | |
Transaction Capital, Ltd. | | | 191,900 | | | | 159,071 | | | |
| | | | | | | |
| | | | | | | 531,375 | | | |
| | | | | | | |
| | | |
South Korea (2.73%) | | | | | | | | | | |
Hy-Lok Corp. | | | 10,550 | | | | 263,426 | | | |
ISC Co., Ltd. | | | 14,155 | | | | 311,201 | | | |
Koh Young Technology, Inc. | | | 3,250 | | | | 119,800 | | | |
Vitzrocell Co., Ltd. | | | 8,470 | | | | 83,630 | | | |
Wins Co., Ltd. | | | 7,100 | | | | 61,877 | | | |
| | | | | | | |
| | | | | | | 839,934 | | | |
| | | | | | | |
| | | |
Sri Lanka (1.12%) | | | | | | | | | | |
Royal Ceramics Lanka PLC | | | 267,000 | | | | 215,243 | | | |
Sampath Bank PLC | | | 80,421 | | | | 128,069 | | | |
| | | | | | | |
| | | | | | | 343,312 | | | |
| | | | | | | |
| | | |
Sweden (3.93%) | | | | | | | | | | |
Bufab Holding AB | | | 27,400 | | | | 214,104 | | | |
HIQ International AB | | | 25,200 | | | | 157,687 | | | |
Moberg Pharma AB(a) | | | 45,400 | | | | 274,759 | | | |
Odd Molly International AB | | | 34,826 | | | | 159,159 | | | |
Opus Group AB | | | 205,900 | | | | 111,277 | | | |
| | | | | | | | | | |
| | | Shares | | | Value (Note 2) | | | |
|
Sweden (continued) | | | | | | | | | | |
Vitec Software Group AB, Class B | | | 35,500 | | | $ | 290,659 | | | |
| | | | | | | |
| | | | | | | 1,207,645 | | | |
| | | | | | | |
| | | |
Taiwan (5.25%) | | | | | | | | | | |
ASPEED Technology, Inc. | | | 16,000 | | | | 146,343 | | | |
Dr. Wu Skincare Co., Ltd. | | | 29,400 | | | | 311,748 | | | |
I Yuan Precision Ind. Co., Ltd. | | | 29,000 | | | | 114,640 | | | |
Materials Analysis Technology, Inc. | | | 57,000 | | | | 130,602 | | | |
Pacific Hospital Supply Co., Ltd. | | | 32,000 | | | | 94,453 | | | |
Sinmag Equipment Corp. | | | 25,000 | | | | 82,938 | | | |
Sitronix Technology Corp. | | | 73,000 | | | | 213,661 | | | |
Sporton International, Inc. | | | 24,000 | | | | 131,708 | | | |
TSC Auto ID Technology Co., Ltd. | | | 13,000 | | | | 116,485 | | | |
Tung Thih Electronic Co., Ltd. | | | 12,000 | | | | 214,678 | | | |
UDE Corp. | | | 60,000 | | | | 55,809 | | | |
| | | | | | | |
| | | | | | | 1,613,065 | | | |
| | | | | | | |
| | | |
Thailand (1.56%) | | | | | | | | | | |
Ananda Development PCL | | | 3,897,000 | | | | 406,100 | | | |
Premier Marketing PCL | | | 263,000 | | | | 73,411 | | | |
| | | | | | | |
| | | | | | | 479,511 | | | |
| | | | | | | |
| | | |
Turkey (1.34%) | | | | | | | | | | |
EGE Seramik Sanayi ve Ticaret AS | | | 157,900 | | | | 255,642 | | | |
Pinar SUT Mamulleri Sanayii AS | | | 25,500 | | | | 154,841 | | | |
| | | | | | | |
| | | | | | | 410,483 | | | |
| | | | | | | |
| | | |
United States (15.97%) | | | | | | | | | | |
Alliance Fiber Optic Products, Inc.(a) | | | 7,300 | | | | 135,196 | | | |
Aratana Therapeutics,
Inc.(a) | | | 33,800 | | | | 203,138 | | | |
Atlas Financial Holdings, Inc.(a) | | | 7,600 | | | | 133,532 | | | |
Bank of Marin Bancorp | | | 2,575 | | | | 126,226 | | | |
BioDelivery Sciences International, Inc.(a) | | | 32,550 | | | | 110,019 | | | |
Chase Corp. | | | 1,125 | | | | 63,326 | | | |
Diamond Hill Investment Group, Inc. | | | 900 | | | | 157,734 | | | |
Duluth Holdings, Inc., Class B(a) | | | 3,225 | | | | 76,723 | | | |
Entellus Medical, Inc.(a) | | | 6,900 | | | | 100,326 | | | |
ePlus, Inc.(a) | | | 1,082 | | | | 86,982 | | | |
Escalade, Inc. | | | 17,000 | | | | 202,810 | | | |
| | |
| See Notes to Financial Statements. | | |
Annual Report | April 30, 2016 | | 27 |
| | |
| Grandeur Peak Global Micro Cap Fund | | Portfolio of Investments |
| | April 30, 2016 |
| | | | | | | | | | |
| | | Shares | | | Value (Note 2) | | | |
|
United States (continued) | | | | | | | | | | |
Evolution Petroleum Corp. | | | 27,850 | | | $ | 154,289 | | | |
FormFactor, Inc.(a) | | | 15,875 | | | | 122,237 | | | |
Health Insurance Innovations, Inc., Class A(a) | | | 15,261 | | | | 95,076 | | | |
Hennessy Advisors, Inc. | | | 3,109 | | | | 95,602 | | | |
Hibbett Sports, Inc.(a) | | | 4,920 | | | | 177,612 | | | |
Hingham Institution for Savings | | | 1,365 | | | | 174,706 | | | |
Inphi Corp.(a) | | | 5,800 | | | | 172,086 | | | |
K2M Group Holdings, Inc.(a) | | | 7,375 | | | | 119,918 | | | |
LGI Homes, Inc.(a) | | | 4,725 | | | | 132,347 | | | |
Malibu Boats, Inc., Class A(a) | | | 15,561 | | | | 273,874 | | | |
Mastech Holdings, Inc.(a) | | | 12,950 | | | | 90,262 | | | |
MCBC Holdings, Inc.(a) | | | 12,925 | | | | 173,454 | | | |
Misonix, Inc.(a) | | | 17,475 | | | | 104,326 | | | |
OTC Markets Group, Inc., Class A | | | 9,400 | | | | 158,672 | | | |
Reis, Inc. | | | 4,375 | | | | 110,119 | | | |
Resources Connection, Inc. | | | 7,385 | | | | 109,076 | | | |
Sportsman’s Warehouse Holdings, Inc.(a) | | | 21,385 | | | | 243,361 | | | |
STAAR Surgical Co.(a) | | | 15,175 | | | | 116,999 | | | |
Transcat, Inc.(a) | | | 15,166 | | | | 161,215 | | | |
Trecora Resources(a) | | | 16,100 | | | | 184,345 | | | |
TriMas Corp.(a) | | | 5,900 | | | | 106,790 | | | |
Vascular Solutions, Inc.(a) | | | 5,513 | | | | 192,679 | | | |
Veracyte, Inc.(a) | | | 41,750 | | | | 242,150 | | | |
| | | | | | | |
| | | | | | | 4,907,207 | | | |
| | | | | | | |
| | | |
Vietnam (0.86%) | | | | | | | | | | |
Binh Minh Plastics JSC | | | 20,000 | | | | 126,526 | | | |
Traphaco JSC | | | 27,000 | | | | 138,101 | | | |
| | | | | | | |
| | | | | | | 264,627 | | | |
| | | | | | | |
| | | |
TOTAL COMMON STOCKS (Cost $28,823,022) | | | | | | | 30,214,331 | | | |
| | | | | | | |
| | | |
TOTAL INVESTMENTS (98.30%) (Cost $28,823,022) | | | | | | $ | 30,214,331 | | | |
| | | |
Other Assets In Excess Of Liabilities (1.70%) | | | | | | | 521,123 | | | |
| | | | | | | |
| | | |
NET ASSETS (100.00%) | | | | | | $ | 30,735,454 | | | |
| | | | | | | |
| (a) | Non-Income Producing Security. |
| (b) | Security exempt from registration under Rule 144A of the Securities Act of 1933. These securities may be resold in the ordinary course of business in transactions exempt from registration, normally to qualified institutional buyers. As of April 30, 2016, these securities had a total aggregate market value of $941,481, representing 3.06% of net assets. |
| (c) | Security was purchased pursuant to Regulation S under the Securities Act of 1933, which exempts securities offered and sold outside of the United States from registration. Such security cannot be sold in the United States without either an effective registration statement filed pursuant to the Securities Act of 1933, or pursuant to an exemption from registration. The security has been deemed liquid under guidelines approved by the Fund’s Board of Trustees. As of April 30, 2016, the aggregate market value of those securities was $1,190,857, representing 3.87% of net assets. |
For Fund compliance purposes, the Fund’s geographical classifications refer to any one or more of the country sub-classifications used by one or more widely recognized market indexes or ratings group indexes, and/or as defined by Fund management. This definition may not apply for purposes of this report, which may combine sub-classifications for reporting ease. Geographical regions are shown as a percentage of net assets.
| | |
| See Notes to Financial Statements. | | |
28 | | 1.855.377.7325 | www.GrandeurPeakGlobal.com |
| | |
| Grandeur Peak Global Opportunities Fund | | Portfolio of Investments |
| | April 30, 2016 |
| | | | | | | | | | |
| | | Shares | | | Value (Note 2) | | | |
|
COMMON STOCKS (97.66%) | | | | | | | | | | |
Argentina (0.27%) | | | | | | | | | | |
Globant SA(a) | | | 48,525 | | | $ | 1,722,152 | | | |
| | | | | | | |
| | | |
Australia (1.15%) | | | | | | | | | | |
CTI Logistics, Ltd. | | | 1,502,587 | | | | 913,993 | | | |
Magellan Financial Group, Ltd. | | | 250,164 | | | | 4,089,562 | | | |
Reject Shop, Ltd. | | | 229,178 | | | | 2,164,253 | | | |
| | | | | | | |
| | | | | | | 7,167,808 | | | |
| | | | | | | |
| | | |
Austria (1.25%) | | | | | | | | | | |
Palfinger AG | | | 255,283 | | | | 7,848,575 | | | |
| | | | | | | |
| | | |
Belgium (1.33%) | | | | | | | | | | |
Melexis NV | | | 151,235 | | | | 8,350,339 | | | |
| | | | | | | |
| | | |
Brazil (0.95%) | | | | | | | | | | |
CETIP SA - Mercados Organizados | | | 207,071 | | | | 2,538,377 | | | |
FPC Par Corretora de Seguros SA | | | 440,200 | | | | 1,471,920 | | | |
Valid Solucoes e Servicos de Seguranca em Meios de Pagamento e Identificacao SA | | | 190,100 | | | | 1,910,258 | | | |
| | | | | | | |
| | | | | | | 5,920,555 | | | |
| | | | | | | |
| | | |
Britain (5.73%) | | | | | | | | | | |
Abcam PLC | | | 213,853 | | | | 1,846,707 | | | |
Alliance Pharma PLC | | | 2,168,600 | | | | 1,425,893 | | | |
Clinigen Group PLC | | | 1,477,376 | | | | 11,570,467 | | | |
Diploma PLC | | | 169,900 | | | | 1,815,945 | | | |
EMIS Group PLC | | | 378,117 | | | | 5,270,717 | | | |
On the Beach Group PLC(a)(b)(c) | | | 359,200 | | | | 1,443,981 | | | |
Oxford Immunotec Global
PLC(a) | | | 202,280 | | | | 2,115,849 | | | |
RPS Group PLC | | | 1,687,239 | | | | 4,301,967 | | | |
Sanne Group PLC | | | 506,450 | | | | 3,265,250 | | | |
Ultra Electronics Holdings PLC | | | 107,250 | | | | 2,767,471 | | | |
| | | | | | | |
| | | | | | | 35,824,247 | | | |
| | | | | | | |
| | | |
Canada (2.54%) | | | | | | | | | | |
Biosyent, Inc.(a) | | | 197,900 | | | | 1,094,625 | | | |
Cipher Pharmaceuticals, Inc.(a) | | | 710,800 | | | | 4,203,504 | | | |
DIRTT Environmental
Solutions(a) | | | 146,600 | | | | 633,276 | | | |
Home Capital Group, Inc. | | | 121,228 | | | | 3,631,912 | | | |
Richelieu Hardware, Ltd. | | | 220,665 | | | | 3,913,124 | | | |
| | | | | | | | | | |
| | | Shares | | | Value (Note 2) | | | |
|
Canada (continued) | | | | | | | | | | |
Stantec, Inc. | | | 93,228 | | | $ | 2,389,585 | | | |
| | | | | | | |
| | | | | | | 15,866,026 | | | |
| | | | | | | |
| | | |
Chile (0.22%) | | | | | | | | | | |
Banco de Chile | | | 12,411,000 | | | | 1,360,622 | | | |
| | | | | | | |
| | | |
China (5.87%) | | | | | | | | | | |
BBI Life Sciences Corp.(c) | | | 10,839,500 | | | | 2,138,024 | | | |
China Medical System Holdings, Ltd. | | | 3,045,000 | | | | 3,964,793 | | | |
Dongpeng Holdings Co., Ltd. | | | 5,758,000 | | | | 3,117,689 | | | |
Le Saunda Holdings, Ltd. | | | 2,684,920 | | | | 588,426 | | | |
Man Wah Holdings, Ltd. | | | 13,380,800 | | | | 15,628,672 | | | |
O2Micro International, Ltd., ADR(a) | | | 905,240 | | | | 1,321,650 | | | |
On-Bright Electronics, Inc. | | | 622,900 | | | | 3,292,855 | | | |
Silergy Corp. | | | 394,852 | | | | 5,264,204 | | | |
Xiabuxiabu Catering Management China Holdings Co., Ltd.(b)(c) | | | 2,313,000 | | | | 1,371,656 | | | |
| | | | | | | |
| | | | | | | 36,687,969 | | | |
| | | | | | | |
| | | |
Colombia (1.26%) | | | | | | | | | | |
Gran Tierra Energy, Inc.(a) | | | 1,200,400 | | | | 3,553,184 | | | |
Parex Resources, Inc.(a) | | | 429,100 | | | | 4,298,866 | | | |
| | | | | | | |
| | | | | | | 7,852,050 | | | |
| | | | | | | |
| | | |
Egypt (0.10%) | | | | | | | | | | |
Integrated Diagnostics | | | | | | | | | | |
Holdings PLC(b)(c) | | | 131,600 | | | | 611,940 | | | |
| | | | | | | |
| | | |
France (2.02%) | | | | | | | | | | |
Alten SA | | | 17,853 | | | | 1,103,899 | | | |
Esker SA | | | 30,047 | | | | 978,832 | | | |
Infotel SA | | | 34,520 | | | | 1,172,770 | | | |
Medicrea International(a) | | | 167,370 | | | | 1,138,384 | | | |
MGI Digital Graphic Technology(a) | | | 43,650 | | | | 1,524,434 | | | |
Neurones | | | 45,508 | | | | 947,341 | | | |
SoluCom | | | 40,021 | | | | 2,976,861 | | | |
Tessi SA | | | 8,566 | | | | 1,422,233 | | | |
Thermador Groupe | | | 14,678 | | | | 1,342,211 | | | |
| | | | | | | |
| | | | | | | 12,606,965 | | | |
| | | | | | | |
| | | |
Georgia (0.84%) | | | | | | | | | | |
BGEO Group PLC | | | 156,500 | | | | 5,236,546 | | | |
| | | | | | | |
| | | |
Germany (2.85%) | | | | | | | | | | |
Aroundtown Property Holdings PLC(a) | | | 387,100 | | | | 1,941,431 | | | |
Nexus AG | | | 122,992 | | | | 2,154,730 | | | |
Norma Group SE | | | 69,968 | | | | 3,598,049 | | | |
| | |
| See Notes to Financial Statements. | | |
Annual Report | April 30, 2016 | | 29 |
| | |
| Grandeur Peak Global Opportunities Fund | | Portfolio of Investments |
| | April 30, 2016 |
| | | | | | | | | | |
| | | Shares | | | Value (Note 2) | | | |
|
Germany (continued) | | | | | | | | | | |
PATRIZIA Immobilien AG(a) | | | 154,722 | | | $ | 3,584,038 | | | |
publity AG | | | 36,900 | | | | 1,559,112 | | | |
Softing AG | | | 102,054 | | | | 1,630,155 | | | |
Wirecard AG | | | 77,685 | | | | 3,354,871 | | | |
| | | | | | | |
| | | | | | | 17,822,386 | | | |
| | | | | | | |
| | | |
Hong Kong (1.90%) | | | | | | | | | | |
International Housewares | | | | | | | | | | |
Retail Co., Ltd. | | | 10,697,000 | | | | 1,751,368 | | | |
Samsonite International SA | | | 578,000 | | | | 1,866,583 | | | |
Tsui Wah Holdings, Ltd. | | | 2,811,400 | | | | 554,531 | | | |
Value Partners Group, Ltd. | | | 5,785,000 | | | | 5,556,118 | | | |
Vitasoy International | | | | | | | | | | |
Holdings, Ltd. | | | 1,135,483 | | | | 2,128,418 | | | |
| | | | | | | |
| | | | | | | 11,857,018 | | | |
| | | | | | | |
| | | |
India (8.17%) | | | | | | | | | | |
AIA Engineering, Ltd. | | | 38,400 | | | | 573,655 | | | |
Ajanta Pharma, Ltd. | | | 95,167 | | | | 2,172,930 | | | |
Alkem Laboratories, Ltd. | | | 230,131 | | | | 4,131,984 | | | |
Bajaj Finance, Ltd. | | | 33,775 | | | | 3,477,353 | | | |
City Union Bank, Ltd. | | | 1,356,267 | | | | 1,919,998 | | | |
Credit Analysis & Research, Ltd. | | | 85,120 | | | | 1,297,397 | | | |
Cyient, Ltd. | | | 359,116 | | | | 2,487,770 | | | |
Dewan Housing Finance Corp., Ltd. | | | 660,000 | | | | 1,973,134 | | | |
Eros International Media, Ltd.(a) | | | 336,000 | | | | 935,866 | | | |
Hinduja Global Solutions, Ltd. | | | 288,100 | | | | 1,771,904 | | | |
Indiabulls Housing Finance, Ltd. | | | 334,000 | | | | 3,490,811 | | | |
Jammu & Kashmir Bank, Ltd. | | | 1,261,500 | | | | 1,306,574 | | | |
Kolte-Patil Developers, Ltd. | | | 710,097 | | | | 1,328,555 | | | |
KPIT Technologies, Ltd. | | | 1,080,850 | | | | 2,605,577 | | | |
MBL Infrastructures, Ltd. | | | 470,500 | | | | 1,000,513 | | | |
MT Educare, Ltd. | | | 587,689 | | | | 1,500,011 | | | |
PC Jeweller, Ltd. | | | 135,833 | | | | 738,450 | | | |
Persistent Systems, Ltd. | | | 127,700 | | | | 1,429,574 | | | |
Poly Medicure, Ltd. | | | 37,068 | | | | 155,051 | | | |
Supreme Industries, Ltd. | | | 164,644 | | | | 1,986,749 | | | |
Tata Investment Corp., Ltd. | | | 191,137 | | | | 1,438,931 | | | |
Time Technoplast, Ltd. | | | 1,804,205 | | | | 1,301,541 | | | |
UFO Moviez India, Ltd. | | | 134,815 | | | | 1,039,313 | | | |
Vaibhav Global, Ltd.(a) | | | 158,363 | | | | 742,394 | | | |
Vesuvius India, Ltd. | | | 53,365 | | | | 613,420 | | | |
WNS Holdings, Ltd., ADR(a) | | | 172,075 | | | | 5,453,057 | | | |
Yes Bank, Ltd. | | | 295,500 | | | | 4,200,840 | | | |
| | | | | | | |
| | | | | | | 51,073,352 | | | |
| | | | | | | |
| | | | | | | | | | |
| | | Shares | | | Value (Note 2) | | | |
|
Indonesia (3.27%) | | | | | | | | | | |
Arwana Citramulia Tbk PT | | | 41,549,800 | | | $ | 1,890,346 | | | |
Astra Graphia Tbk PT | | | 8,201,900 | | | | 1,231,404 | | | |
Bank Negara Indonesia Persero Tbk PT | | | 7,019,500 | | | | 2,440,431 | | | |
Bank Rakyat Indonesia Persero Tbk PT | | | 2,251,000 | | | | 1,766,595 | | | |
Bank Tabungan Pensiunan Nasional Tbk PT(a) | | | 2,139,100 | | | | 434,697 | | | |
Panin Sekuritas Tbk PT | | | 4,960,800 | | | | 1,260,137 | | | |
Petra Foods, Ltd. | | | 1,572,400 | | | | 2,893,773 | | | |
Selamat Sempurna Tbk PT | | | 14,442,000 | | | | 5,168,808 | | | |
Tempo Scan Pacific Tbk PT | | | 15,553,000 | | | | 2,358,659 | | | |
Ultrajaya Milk Industry & Trading Co. Tbk PT(a) | | | 3,254,500 | | | | 1,032,763 | | | |
| | | | | | | |
| | | | | | | 20,477,613 | | | |
| | | | | | | |
| | | |
Ireland (0.29%) | | | | | | | | | | |
Irish Residential Properties PLC, REIT | | | 1,396,146 | | | | 1,790,496 | | | |
| | | | | | | |
| | | |
Israel (0.09%) | | | | | | | | | | |
Hamlet Israel-Canada,
Ltd.(a) | | | 75,283 | | | | 580,472 | | | |
| | | | | | | |
| | | |
Italy (0.73%) | | | | | | | | | | |
Brembo SpA | | | 84,960 | | | | 4,563,568 | | | |
| | | | | | | |
| | | |
Japan (8.77%) | | | | | | | | | | |
AIT Corp. | | | 327,500 | | | | 2,767,129 | | | |
Amiyaki Tei Co., Ltd. | | | 63,400 | | | | 2,562,218 | | | |
Anest Iwata Corp. | | | 330,100 | | | | 3,589,527 | | | |
AP Company Co., Ltd.(a) | | | 83,400 | | | | 890,436 | | | |
ARCLAND SERVICE Co., Ltd. | | | 61,600 | | | | 1,777,368 | | | |
Century Tokyo Leasing Corp. | | | 36,600 | | | | 1,298,543 | | | |
CMIC Holdings Co., Ltd. | | | 148,120 | | | | 2,245,466 | | | |
CyberAgent, Inc. | | | 55,500 | | | | 2,712,406 | | | |
Future Architect, Inc. | | | 437,200 | | | | 3,073,549 | | | |
GCA Savvian Corp. | | | 365,800 | | | | 3,544,547 | | | |
Hard Off Corp. Co., Ltd. | | | 198,700 | | | | 2,827,367 | | | |
JCU Corp. | | | 53,200 | | | | 1,730,000 | | | |
M&A Capital Partners Co., Ltd.(a) | | | 112,300 | | | | 1,929,365 | | | |
MISUMI Group, Inc. | | | 246,500 | | | | 3,600,197 | | | |
Monogatari Corp. | | | 50,300 | | | | 2,448,816 | | | |
Naigai Trans Line, Ltd. | | | 55,300 | | | | 502,066 | | | |
Prestige International, Inc. | | | 305,600 | | | | 3,590,226 | | | |
SK Kaken Co., Ltd. | | | 25,000 | | | | 2,120,536 | | | |
Suruga Bank, Ltd. | | | 73,500 | | | | 1,492,105 | | | |
Syuppin Co., Ltd. | | | 189,500 | | | | 2,308,195 | | | |
Trancom Co., Ltd. | | | 128,170 | | | | 7,829,934 | | | |
| | | | | | | |
| | | | | | | 54,839,996 | | | |
| | | | | | | |
| | |
| See Notes to Financial Statements. | | |
30 | | 1.855.377.7325 | www.GrandeurPeakGlobal.com |
| | |
| Grandeur Peak Global Opportunities Fund | | Portfolio of Investments |
| | April 30, 2016 |
| | | | | | | | | | |
| | | Shares | | | Value (Note 2) | | | |
|
Luxembourg (1.00%) | | | | | | | | | | |
Grand City Properties SA | | | 116,300 | | | $ | 2,568,837 | | | |
L’Occitane International SA | | | 1,897,753 | | | | 3,660,017 | | | |
| | | | | | | |
| | | | | | | 6,228,854 | | | |
| | | | | | | |
| | | |
Malaysia (0.94%) | | | | | | | | | | |
AEON Credit Service M Bhd | | | 542,680 | | | | 1,830,928 | | | |
Berjaya Auto Bhd | | | 2,708,400 | | | | 1,525,273 | | | |
Berjaya Food Bhd | | | 640,500 | | | | 309,880 | | | |
My EG Services Bhd | | | 4,284,400 | | | | 2,204,440 | | | |
| | | | | | | |
| | | | | | | 5,870,521 | | | |
| | | | | | | |
| | | |
Mexico (0.88%) | | | | | | | | | | |
Banregio Grupo Financiero SAB de CV | | | 383,034 | | | | 2,299,809 | | | |
Credito Real SAB de CV SOFOM ER | | | 1,451,843 | | | | 3,194,035 | | | |
| | | | | | | |
| | | | | | | 5,493,844 | | | |
| | | | | | | |
| | | |
Netherlands (0.59%) | | | | | | | | | | |
Aalberts Industries NV | | | 83,222 | | | | 2,851,178 | | | |
Arcadis NV | | | 49,721 | | | | 851,434 | | | |
| | | | | | | |
| | | | | | | 3,702,612 | | | |
| | | | | | | |
| | | |
New Zealand (0.10%) | | | | | | | | | | |
CBL Corp., Ltd. | | | 371,943 | | | | 623,302 | | | |
| | | | | | | |
| | | |
Norway (1.08%) | | | | | | | | | | |
Medistim ASA | | | 152,700 | | | | 1,005,123 | | | |
Multiconsult ASA(b)(c) | | | 113,000 | | | | 1,319,200 | | | |
Skandiabanken ASA(a)(b)(c) | | | 761,300 | | | | 4,443,836 | | | |
| | | | | | | |
| | | | | | | 6,768,159 | | | |
| | | | | | | |
| | | |
Philippines (1.27%) | | | | | | | | | | |
Pepsi-Cola Products Philippines, Inc. | | | 29,394,900 | | | | 2,325,888 | | | |
Security Bank Corp. | | | 1,553,640 | | | | 5,633,032 | | | |
| | | | | | | |
| | | | | | | 7,958,920 | | | |
| | | | | | | |
| | | |
Poland (0.18%) | | | | | | | | | | |
Wawel SA | | | 3,856 | | | | 1,121,255 | | | |
| | | | | | | |
| | | |
Singapore (0.66%) | | | | | | | | | | |
CSE Global, Ltd. | | | 4,531,250 | | | | 1,448,814 | | | |
Riverstone Holdings, Ltd. | | | 3,729,200 | | | | 2,703,625 | | | |
| | | | | | | |
| | | | | | | 4,152,439 | | | |
| | | | | | | |
| | | |
South Africa (1.50%) | | | | | | | | | | |
Cartrack Holdings, Ltd. | | | 4,257,400 | | | | 2,781,393 | | | |
Clicks Group, Ltd. | | | 246,349 | | | | 1,799,259 | | | |
EOH Holdings, Ltd. | | | 167,000 | | | | 1,625,391 | | | |
Italtile, Ltd. | | | 1,177,166 | | | | 1,046,076 | | | |
| | | | | | | | | | |
| | | Shares | | | Value
(Note 2) | | | |
|
South Africa (continued) | | | | | | | | | | |
MiX Telematics, Ltd., Sponsored ADR | | | 127,000 | | | $ | 518,160 | | | |
Super Group, Ltd.(a) | | | 567,307 | | | | 1,639,522 | | | |
| | | | | | | |
| | | | | | | 9,409,801 | | | |
| | | | | | | |
| | | |
South Korea (1.84%) | | | | | | | | | | |
Hy-Lok Corp. | | | 242,907 | | | | 6,065,213 | | | |
ISC Co., Ltd. | | | 158,603 | | | | 3,486,927 | | | |
Koh Young Technology, Inc. | | | 53,781 | | | | 1,982,449 | | | |
| | | | | | | |
| | | | | | | 11,534,589 | | | |
| | | | | | | |
| | | |
Sweden (2.81%) | | | | | | | | | | |
AddLife AB(a) | | | 56,913 | | | | 719,346 | | | |
AddTech AB, Class B | | | 182,127 | | | | 2,290,634 | | | |
Beijer Alma AB | | | 95,000 | | | | 2,241,780 | | | |
Bufab Holding AB | | | 375,410 | | | | 2,933,457 | | | |
HIQ International AB | | | 107,868 | | | | 674,977 | | | |
Indutrade AB | | | 54,100 | | | | 3,033,607 | | | |
Moberg Pharma AB(a) | | | 280,180 | | | | 1,695,639 | | | |
Nibe Industrier AB, Class B | | | 88,000 | | | | 3,057,363 | | | |
Opus Group AB | | | 1,671,640 | | | | 903,426 | | | |
| | | | | | | |
| | | | | | | 17,550,229 | | | |
| | | | | | | |
| | | |
Switzerland (1.59%) | | | | | | | | | | |
Leonteq AG | | | 13,900 | | | | 967,190 | | | |
Luxoft Holding, Inc.(a) | | | 29,425 | | | | 1,701,059 | | | |
VZ Holding AG | | | 19,575 | | | | 6,091,043 | | | |
Wizz Air Holdings
PLC(a)(b)(c) | | | 43,700 | | | | 1,200,423 | | | |
| | | | | | | |
| | | | | | | 9,959,715 | | | |
| | | | | | | |
| | | |
Taiwan (2.42%) | | | | | | | | | | |
ASPEED Technology, Inc. | | | 221,237 | | | | 2,023,530 | | | |
Cub Elecparts, Inc. | | | 118,948 | | | | 1,441,995 | | | |
Dr. Wu Skincare Co., Ltd. | | | 7,000 | | | | 74,226 | | | |
Novatek Microelectronics Corp. | | | 441,000 | | | | 1,545,066 | | | |
Polytronics Technology Corp. | | | 200,700 | | | | 370,249 | | | |
Sinmag Equipment Corp. | | | 240,842 | | | | 798,998 | | | |
Sporton International, Inc. | | | 718,803 | | | | 3,944,691 | | | |
Test Research, Inc. | | | 663,708 | | | | 938,365 | | | |
TSC Auto ID Technology Co., Ltd. | | | 115,200 | | | | 1,032,239 | | | |
UDE Corp. | | | 1,574,000 | | | | 1,464,050 | | | |
Voltronic Power Technology Corp. | | | 93,210 | | | | 1,470,992 | | | |
| | | | | | | |
| | | | | | | 15,104,401 | | | |
| | | | | | | |
| | | |
Thailand (0.67%) | | | | | | | | | | |
Ananda Development PCL | | | 21,576,000 | | | | 2,248,401 | | | |
| | |
| See Notes to Financial Statements. | | |
Annual Report | April 30, 2016 | | 31 |
| | |
| Grandeur Peak Global Opportunities Fund | | Portfolio of Investments |
| | April 30, 2016 |
| | | | | | | | | | |
| | | Shares | | | Value
(Note 2) | | | |
|
Thailand (continued) | | | | | | | | | | |
Premier Marketing PCL | | | 6,965,300 | | | $ | 1,944,222 | | | |
| | | | | | | |
| | | | | | | 4,192,623 | | | |
| | | | | | | |
| | | |
Turkey (0.25%) | | | | | | | | | | |
EGE Seramik Sanayi ve Ticaret AS | | | 952,000 | | | | 1,541,301 | | | |
| | | | | | | |
| | | |
United Arab Emirates (0.17%) | | | | | | | | | | |
Aramex PJSC | | | 1,162,100 | | | | 1,075,755 | | | |
| | | | | | | |
| | | |
United States (29.77%) | | | | | | | | | | |
Alamo Group, Inc. | | | 27,000 | | | | 1,523,880 | | | |
Amsurg Corp.(a) | | | 47,880 | | | | 3,877,322 | | | |
Aratana Therapeutics, Inc.(a) | | | 292,075 | | | | 1,755,371 | | | |
BioDelivery Sciences International, Inc.(a) | | | 488,325 | | | | 1,650,538 | | | |
Diamond Hill Investment Group, Inc. | | | 34,950 | | | | 6,125,337 | | | |
Dril-Quip, Inc.(a) | | | 26,125 | | | | 1,693,422 | | | |
Duluth Holdings, Inc., Class B(a) | | | 65,900 | | | | 1,567,761 | | | |
EPAM Systems, Inc.(a) | | | 55,650 | | | | 4,058,554 | | | |
Escalade, Inc. | | | 125,635 | | | | 1,498,826 | | | |
ExlService Holdings, Inc.(a) | | | 56,050 | | | | 2,712,259 | | | |
Fastenal Co. | | | 43,225 | | | | 2,022,498 | | | |
First Cash Financial Services, Inc. | | | 69,650 | | | | 3,185,094 | | | |
First Republic Bank | | | 214,300 | | | | 15,069,576 | | | |
FormFactor, Inc.(a) | | | 106,725 | | | | 821,782 | | | |
Genpact, Ltd.(a) | | | 89,025 | | | | 2,482,907 | | | |
Gentex Corp. | | | 195,725 | | | | 3,139,429 | | | |
Health Insurance Innovations, Inc.,
Class A(a) | | | 119,500 | | | | 744,485 | | | |
Hibbett Sports, Inc.(a) | | | 65,500 | | | | 2,364,550 | | | |
Home BancShares, Inc. | | | 86,900 | | | | 3,735,831 | | | |
Inphi Corp.(a) | | | 240,675 | | | | 7,140,827 | | | |
K2M Group Holdings, Inc.(a) | | | 144,250 | | | | 2,345,505 | | | |
Knight Transportation, Inc. | | | 370,970 | | | | 9,856,673 | | | |
LGI Homes, Inc.(a) | | | 100,426 | | | | 2,812,932 | | | |
Linear Technology Corp. | | | 47,525 | | | | 2,113,912 | | | |
Littelfuse, Inc. | | | 13,950 | | | | 1,624,896 | | | |
Malibu Boats, Inc.,
Class A(a) | | | 179,150 | | | | 3,153,040 | | | |
MarketAxess Holdings, Inc. | | | 39,900 | | | | 4,898,124 | | | |
MEDNAX, Inc.(a) | | | 64,375 | | | | 4,589,294 | | | |
Microchip Technology, Inc. | | | 88,795 | | | | 4,314,549 | | | |
MSC Industrial Direct Co., Inc., Class A | | | 41,875 | | | | 3,245,313 | | | |
NorthStar Asset Management Group, Inc. | | | 137,975 | | | | 1,716,409 | | | |
| | | | | | | | | | |
| | | Shares | | | Value
(Note 2) | | | |
|
United States (continued) | | | | | | | | | | |
NorthStar Realty Finance Corp., REIT | | | 185,225 | | | $ | 2,369,028 | | | |
Paycom Software, Inc.(a) | | | 61,800 | | | | 2,361,378 | | | |
Power Integrations, Inc. | | | 274,100 | | | | 13,225,325 | | | |
PRA Group, Inc.(a) | | | 283,500 | | | | 9,406,530 | | | |
Resources Connection, Inc. | | | 256,265 | | | | 3,785,034 | | | |
Roadrunner Transportation Systems, Inc.(a) | | | 546,775 | | | | 6,462,881 | | | |
Signature Bank(a) | | | 26,600 | | | | 3,666,278 | | | |
Silicon Laboratories, Inc.(a) | | | 87,715 | | | | 4,105,062 | | | |
Spirit Airlines, Inc.(a) | | | 55,075 | | | | 2,419,445 | | | |
Sportsman’s Warehouse Holdings, Inc.(a) | | | 380,775 | | | | 4,333,220 | | | |
Sprouts Farmers Market, Inc.(a) | | | 114,525 | | | | 3,214,717 | | | |
STAAR Surgical Co.(a) | | | 379,825 | | | | 2,928,451 | | | |
SVB Financial Group(a) | | | 16,600 | | | | 1,731,048 | | | |
Synaptics, Inc.(a) | | | 14,650 | | | | 1,048,208 | | | |
Syntel, Inc.(a) | | | 82,000 | | | | 3,487,460 | | | |
Trecora Resources(a) | | | 112,600 | | | | 1,289,270 | | | |
TriMas Corp.(a) | | | 156,500 | | | | 2,832,650 | | | |
Universal Truckload Services, Inc. | | | 274,207 | | | | 3,910,192 | | | |
Vascular Solutions, Inc.(a) | | | 56,618 | | | | 1,978,799 | | | |
Veracyte, Inc.(a) | | | 241,448 | | | | 1,400,398 | | | |
Virtusa Corp.(a) | | | 65,125 | | | | 2,314,543 | | | |
| | | | | | | |
| | | | | | | 186,110,813 | | | |
| | | | | | | |
| | | |
Vietnam (0.34%) | | | | | | | | | | |
DHG Pharmaceutical JSC | | | 72,440 | | | | 274,640 | | | |
Vietnam Dairy Products JSC | | | 299,000 | | | | 1,864,726 | | | |
| | | | | | | |
| | | | | | | 2,139,366 | | | |
| | | | | | | |
| | |
TOTAL COMMON STOCKS (Cost $534,553,272) | | | | 610,599,194 | | | |
| | | | | | | |
| | |
PREFERRED STOCKS (0.25%) | | | | | | | |
Brazil (0.25%) | | | | | | | | | | |
Banco Daycoval SA | | | 627,000 | | | | 1,544,142 | | | |
| | | | | | | |
| | |
TOTAL PREFERRED STOCKS (Cost $2,697,170) | | | | 1,544,142 | | | |
| | | | | | | |
| | |
TOTAL INVESTMENTS (97.91%) (Cost $537,250,442) | | | $ | 612,143,336 | | | |
| | |
Other Assets In Excess Of Liabilities (2.09%) | | | | 13,042,795 | | | |
| | | | | | | |
| | |
NET ASSETS (100.00%) | | | $ | 625,186,131 | | | |
| | | | | | | |
| | |
| See Notes to Financial Statements. | | |
32 | | 1.855.377.7325 | www.GrandeurPeakGlobal.com |
| | |
| Grandeur Peak Global Opportunities Fund | | Portfolio of Investments |
| | April 30, 2016 |
| (a) | Non-Income Producing Security. |
| (b) | Security exempt from registration under Rule 144A of the Securities Act of 1933. These securities may be resold in the ordinary course of business in transactions exempt from registration, normally to qualified institutional buyers. As of April 30, 2016, these securities had a total aggregate market value of $10,391,036, representing 1.66% of net assets. |
| (c) | Security was purchased pursuant to Regulation S under the Securities Act of 1933, which exempts securities offered and sold outside of the United States from registration. Such security cannot be sold in the United States without either an effective registration statement filed pursuant to the Securities Act of 1933, or pursuant to an exemption from registration. The security has been deemed liquid under guidelines approved by the Fund’s Board of Trustees. As of April 30, 2016, the aggregate market value of those securities was $12,529,060, representing 2.00% of net assets. |
For Fund compliance purposes, the Fund’s geographical classifications refer to any one or more of the country sub-classifications used by one or more widely recognized market indexes or ratings group indexes, and/or as defined by Fund management. This definition may not apply for purposes of this report, which may combine sub-classifications for reporting ease. Geographical regions are shown as a percentage of net assets.
| | |
| See Notes to Financial Statements. | | |
Annual Report | April 30, 2016 | | 33 |
| | |
| Grandeur Peak Global Reach Fund | | Portfolio of Investments |
| | April 30, 2016 |
| | | | | | | | | | |
| | | Shares | | | Value
(Note 2) | | | |
|
COMMON STOCKS (97.53%) | | | | | | | | | | |
Argentina (0.32%) | | | | | | | | | | |
Globant SA(a) | | | 25,913 | | | $ | 919,652 | | | |
| | | | | | | |
| | | |
Australia (1.23%) | | | | | | | | | | |
Beacon Lighting Group, Ltd. | | | 477,900 | | | | 661,336 | | | |
CTI Logistics, Ltd. | | | 323,146 | | | | 196,563 | | | |
Greencross, Ltd. | | | 86,300 | | | | 466,545 | | | |
LifeHealthcare Group, Ltd. | | | 213,200 | | | | 220,465 | | | |
Magellan Financial Group, Ltd. | | | 56,664 | | | | 926,316 | | | |
Reject Shop, Ltd. | | | 114,088 | | | | 1,077,395 | | | |
| | | | | | | |
| | | | | | | 3,548,620 | | | |
| | | | | | | |
| | | |
Austria (0.42%) | | | | | | | | | | |
Palfinger AG | | | 39,148 | | | | 1,203,590 | | | |
| | | | | | | |
| | | |
Belgium (0.27%) | | | | | | | | | | |
Melexis NV | | | 14,085 | | | | 777,694 | | | |
| | | | | | | |
| | | |
Brazil (0.94%) | | | | | | | | | | |
CETIP SA - Mercados Organizados | | | 50,190 | | | | 615,253 | | | |
FPC Par Corretora de Seguros SA | | | 224,200 | | | | 749,669 | | | |
M Dias Branco SA | | | 32,900 | | | | 745,195 | | | |
QGEP Participacoes SA | | | 243,000 | | | | 288,272 | | | |
Valid Solucoes e Servicos de Seguranca em Meios de Pagamento e Identificacao SA | | | 30,100 | | | | 302,466 | | | |
| | | | | | | |
| | | | | | | 2,700,855 | | | |
| | | | | | | |
| | | |
Britain (5.98%) | | | | | | | | | | |
AB Dynamics PLC | | | 191,800 | | | | 1,311,564 | | | |
Abcam PLC | | | 129,089 | | | | 1,114,735 | | | |
Alliance Pharma PLC | | | 960,700 | | | | 631,677 | | | |
Arrow Global Group PLC | | | 229,100 | | | | 860,307 | | | |
Bioventix PLC | | | 15,800 | | | | 238,365 | | | |
Clinigen Group PLC | | | 475,730 | | | | 3,725,807 | | | |
Close Brothers Group PLC | | | 14,817 | | | | 262,397 | | | |
Diploma PLC | | | 68,800 | | | | 735,356 | | | |
dotdigital group PLC | | | 1,716,856 | | | | 1,166,492 | | | |
EMIS Group PLC | | | 49,596 | | | | 691,338 | | | |
Exova Group PLC | | | 128,000 | | | | 299,244 | | | |
Gamma Communications PLC | | | 47,925 | | | | 315,641 | | | |
IDOX PLC | | | 550,000 | | | | 453,048 | | | |
Morses Club PLC(a) | | | 173,400 | | | | 273,633 | | | |
On the Beach Group
PLC(a)(b)(c) | | | 199,100 | | | | 800,380 | | | |
Oxford Immunotec Global
PLC(a) | | | 85,050 | | | | 889,623 | | | |
| | | | | | | | | | |
| | | Shares | | | Value
(Note 2) | | | |
|
Britain (continued) | | | | | | | | | | |
RPS Group PLC | | | 166,299 | | | $ | 424,014 | | | |
S&U PLC | | | 8,700 | | | | 270,766 | | | |
SafeCharge International Group, Ltd. | | | 125,700 | | | | 441,718 | | | |
Sanne Group PLC | | | 159,600 | | | | 1,028,994 | | | |
Topps Tiles PLC | | | 319,695 | | | | 635,287 | | | |
Ultra Electronics Holdings PLC | | | 14,850 | | | | 383,188 | | | |
WANdisco PLC(a) | | | 100,245 | | | | 314,917 | | | |
| | | | | | | |
| | | | | | | 17,268,491 | | | |
| | | | | | | |
| | | |
Canada (2.65%) | | | | | | | | | | |
Biosyent, Inc.(a) | | | 81,400 | | | | 450,240 | | | |
Cipher Pharmaceuticals,
Inc.(a) | | | 265,800 | | | | 1,571,878 | | | |
Delphi Energy Corp.(a) | | | 411,600 | | | | 387,095 | | | |
DIRTT Environmental
Solutions(a) | | | 342,900 | | | | 1,481,245 | | | |
Home Capital Group, Inc. | | | 30,746 | | | | 921,130 | | | |
Ritchie Bros. Auctioneers, Inc. | | | 31,175 | | | | 894,411 | | | |
Stantec, Inc. | | | 33,820 | | | | 866,862 | | | |
TransForce, Inc. | | | 57,096 | | | | 1,077,575 | | | |
| | | | | | | |
| | | | | | | 7,650,436 | | | |
| | | | | | | |
| | | |
Chile (0.11%) | | | | | | | | | | |
Banco de Chile | | | 3,011,441 | | | | 330,145 | | | |
| | | | | | | |
| | | |
China (5.98%) | | | | | | | | | | |
BBI Life Sciences Corp.(c) | | | 5,592,500 | | | | 1,103,086 | | | |
China Lesso Group Holdings, Ltd. | | | 1,247,000 | | | | 688,053 | | | |
China Medical System Holdings, Ltd. | | | 1,829,000 | | | | 2,381,480 | | | |
Dongpeng Holdings Co., Ltd. | | | 2,408,000 | | | | 1,303,820 | | | |
Essex Bio-technology, Ltd. | | | 1,109,000 | | | | 637,644 | | | |
Man Wah Holdings, Ltd. | | | 5,033,600 | | | | 5,879,206 | | | |
O2Micro International, Ltd., ADR(a) | | | 317,894 | | | | 464,125 | | | |
On-Bright Electronics, Inc. | | | 151,000 | | | | 798,236 | | | |
Shandong Weigao Group Medical Polymer Co., Ltd., Class H | | | 424,000 | | | | 255,267 | | | |
Shanghai Haohai Biological Technology Co., Ltd.,
Class H(a)(b)(c) | | | 78,700 | | | | 455,547 | | | |
Sihuan Pharmaceutical Holdings Group, Ltd. | | | 2,559,000 | | | | 590,521 | | | |
Silergy Corp. | | | 108,925 | | | | 1,452,198 | | | |
Sinosoft Technology Group, Ltd. | | | 1,225,000 | | | | 669,597 | | | |
| | |
| See Notes to Financial Statements. | | |
34 | | 1.855.377.7325 | www.GrandeurPeakGlobal.com |
| | |
| Grandeur Peak Global Reach Fund | | Portfolio of Investments |
| | April 30, 2016 |
| | | | | | | | | | |
| | | Shares | | | Value
(Note 2) |
|
China (continued) | | | | | | | | | | |
Xiabuxiabu Catering Management China Holdings Co., Ltd.(b)(c) | | | 988,000 | | | $ | 585,904 | | | |
| | | | | | | |
| | | | | | | 17,264,684 | | | |
| | | | | | | |
| | | |
Colombia (1.16%) | | | | | | | | | | |
Gran Tierra Energy, Inc.(a) | | | 594,395 | | | | 1,759,409 | | | |
Parex Resources, Inc.(a) | | | 158,261 | | | | 1,585,511 | | | |
| | | | | | | |
| | | | | | | 3,344,920 | | | |
| | | | | | | |
| | | |
Denmark (0.29%) | | | | | | | | | | |
Ringkjoebing Landbobank A/S | | | 4,007 | | | | 842,125 | | | |
| | | | | | | |
| | | |
Egypt (0.19%) | | | | | | | | | | |
Integrated Diagnostics Holdings PLC(b)(c) | | | 120,000 | | | | 558,000 | | | |
| | | | | | | |
| | | |
Finland (0.19%) | | | | | | | | | | |
Aktia Bank OYJ | | | 27,700 | | | | 278,166 | | | |
Ferratum OYJ(c) | | | 10,500 | | | | 279,535 | | | |
| | | | | | | |
| | | | | | | 557,701 | | | |
| | | | | | | |
| | | |
France (1.95%) | | | | | | | | | | |
Alten SA | | | 11,300 | | | | 698,710 | | | |
Ausy(a) | | | 8,238 | | | | 435,801 | | | |
Esker SA | | | 26,009 | | | | 847,287 | | | |
Infotel SA | | | 21,960 | | | | 746,061 | | | |
Medicrea International(a) | | | 86,569 | | | | 588,808 | | | |
MGI Digital Graphic Technology(a) | | | 17,352 | | | | 606,002 | | | |
Neurones | | | 19,682 | | | | 409,720 | | | |
Prodware | | | 35,504 | | | | 264,657 | | | |
SoluCom | | | 11,533 | | | | 857,853 | | | |
Thermador Groupe | | | 1,943 | | | | 177,675 | | | |
| | | | | | | |
| | | | | | | 5,632,574 | | | |
| | | | | | | |
| | | |
Georgia (0.84%) | | | | | | | | | | |
BGEO Group PLC | | | 40,400 | | | | 1,351,799 | | | |
Georgia Healthcare Group PLC(a)(b)(c) | | | 379,700 | | | | 1,076,310 | | | |
| | | | | | | |
| | | | | | | 2,428,109 | | | |
| | | | | | | |
| | | |
Germany (2.63%) | | | | | | | | | | |
Aroundtown Property Holdings PLC(a) | | | 155,400 | | | | 779,381 | | | |
CANCOM SE | | | 13,000 | | | | 663,230 | | | |
Elmos Semiconductor AG | | | 36,653 | | | | 458,727 | | | |
First Sensor AG(a) | | | 44,719 | | | | 542,778 | | | |
Nexus AG | | | 35,769 | | | | 626,647 | | | |
Norma Group SE | | | 36,860 | | | | 1,895,496 | | | |
PATRIZIA Immobilien
AG(a) | | | 41,938 | | | | 971,467 | | | |
| | | | | | | | | | |
| | | Shares | | | Value
(Note 2) |
|
Germany (continued) | | | | | | | | | | |
publity AG | | | 7,000 | | | $ | 295,767 | | | |
Wirecard AG | | | 31,796 | | | | 1,373,129 | | | |
| | | | | | | |
| | | | | | | 7,606,622 | | | |
| | | | | | | |
| | | |
Greece (0.40%) | | | | | | | | | | |
Sarantis SA | | | 114,898 | | | | 1,149,869 | | | |
| | | | | | | |
| | | |
Hong Kong (2.65%) | | | | | | | | | | |
International Housewares Retail Co., Ltd. | | | 7,762,000 | | | | 1,270,835 | | | |
Samsonite International SA | | | 552,400 | | | | 1,783,911 | | | |
Tsui Wah Holdings, Ltd. | | | 2,957,000 | | | | 583,250 | | | |
Value Partners Group, Ltd. | | | 2,527,000 | | | | 2,427,020 | | | |
Vitasoy International Holdings, Ltd. | | | 847,000 | | | | 1,587,668 | | | |
| | | | | | | |
| | | | | | | 7,652,684 | | | |
| | | | | | | |
| | | |
India (7.86%) | | | | | | | | | | |
AIA Engineering, Ltd. | | | 46,500 | | | | 694,661 | | | |
Ajanta Pharma, Ltd. | | | 12,918 | | | | 294,954 | | | |
Alkem Laboratories, Ltd. | | | 43,482 | | | | 780,716 | | | |
Bajaj Finance, Ltd. | | | 10,400 | | | | 1,070,747 | | | |
Bajaj Finserv, Ltd. | | | 10,000 | | | | 282,730 | | | |
City Union Bank, Ltd. | | | 669,400 | | | | 947,636 | | | |
Cyient, Ltd. | | | 168,200 | | | | 1,165,203 | | | |
Dewan Housing Finance Corp., Ltd. | | | 289,800 | | | | 866,385 | | | |
Divi’s Laboratories, Ltd. | | | 18,000 | | | | 285,237 | | | |
Eros International Media, Ltd.(a) | | | 470,328 | | | | 1,310,012 | | | |
Essel Propack, Ltd. | | | 215,042 | | | | 592,314 | | | |
Glenmark Pharmaceuticals, Ltd. | | | 42,400 | | | | 530,208 | | | |
Hinduja Global Solutions, Ltd. | | | 95,289 | | | | 586,057 | | | |
Igarashi Motors India, Ltd. | | | 62,087 | | | | 572,571 | | | |
Indiabulls Housing Finance, Ltd. | | | 73,278 | | | | 765,867 | | | |
Inox Wind, Ltd.(a) | | | 194,698 | | | | 797,813 | | | |
Jammu & Kashmir Bank, Ltd. | | | 674,500 | | | | 698,600 | | | |
Kolte-Patil Developers, Ltd. | | | 134,373 | | | | 251,405 | | | |
Kovai Medical Center and Hospital | | | 14,267 | | | | 155,941 | | | |
Kwality, Ltd. | | | 125,314 | | | | 230,394 | | | |
MBL Infrastructures, Ltd. | | | 329,406 | | | | 700,478 | | | |
MT Educare, Ltd. | | | 529,217 | | | | 1,350,768 | | | |
Persistent Systems, Ltd. | | | 25,132 | | | | 281,347 | | | |
PI Industries, Ltd. | | | 45,500 | | | | 440,561 | | | |
Poly Medicure, Ltd. | | | 81,374 | | | | 340,377 | | | |
Sintex Industries, Ltd. | | | 355,000 | | | | 444,218 | | | |
Time Technoplast, Ltd. | | | 896,073 | | | | 646,421 | | | |
| | |
| See Notes to Financial Statements. | | |
Annual Report | April 30, 2016 | | 35 |
| | |
| Grandeur Peak Global Reach Fund | | Portfolio of Investments |
| | April 30, 2016 |
| | | | | | | | | | |
| | | Shares | | | Value
(Note 2) |
|
India (continued) | | | | | | | | | | |
UFO Moviez India, Ltd. | | | 70,483 | | | $ | 543,366 | | | |
Vaibhav Global, Ltd.(a) | | | 102,142 | | | | 478,834 | | | |
Vesuvius India, Ltd. | | | 24,830 | | | | 285,416 | | | |
WNS Holdings, Ltd., ADR(a) | | | 80,200 | | | | 2,541,538 | | | |
Yes Bank, Ltd. | | | 123,000 | | | | 1,748,573 | | | |
| | | | | | | |
| | | | | | | 22,681,348 | | | |
| | | | | | | |
| | | |
Indonesia (3.54%) | | | | | | | | | | |
Astra Graphia Tbk PT | | | 1,942,500 | | | | 291,640 | | | |
Bank Negara Indonesia Persero Tbk PT | | | 2,895,500 | | | | 1,006,663 | | | |
Bank Rakyat Indonesia Persero Tbk PT | | | 1,604,500 | | | | 1,259,219 | | | |
Hexindo Adiperkasa Tbk PT | | | 1,115,500 | | | | 149,291 | | | |
Indonesia Pondasi Raya Tbk PT(a) | | | 4,349,000 | | | | 537,524 | | | |
Panin Sekuritas Tbk PT | | | 2,425,000 | | | | 615,996 | | | |
Petra Foods, Ltd. | | | 1,017,500 | | | | 1,872,560 | | | |
Selamat Sempurna Tbk PT | | | 7,197,200 | | | | 2,575,886 | | | |
Surya Toto Indonesia Tbk PT | | | 1,225,000 | | | | 594,480 | | | |
Tempo Scan Pacific Tbk PT | | | 5,739,800 | | | | 870,458 | | | |
Ultrajaya Milk Industry & Trading Co. Tbk PT(a) | | | 1,368,700 | | | | 434,335 | | | |
| | | | | | | |
| | | | | | | 10,208,052 | | | |
| | | | | | | |
| | | |
Ireland (0.41%) | | | | | | | | | | |
Irish Residential Properties PLC, REIT | | | 918,677 | | | | 1,178,163 | | | |
| | | | | | | |
| | | |
Israel (1.60%) | | | | | | | | | | |
Caesarstone Sdot-Yam,
Ltd.(a) | | | 7,115 | | | | 263,468 | | | |
Camtek, Ltd.(a) | | | 3,680 | | | | 8,133 | | | |
Hamlet Israel-Canada, Ltd.(a) | | | 80,510 | | | | 620,775 | | | |
Kornit Digital, Ltd.(a) | | | 95,126 | | | | 963,626 | | | |
Silicom, Ltd. | | | 23,075 | | | | 637,101 | | | |
Wix.com, Ltd.(a) | | | 86,425 | | | | 2,136,426 | | | |
| | | | | | | |
| | | | | | | 4,629,529 | | | |
| | | | | | | |
| | | |
Italy (0.95%) | | | | | | | | | | |
Banca Sistema SpA(a)(b)(c) | | | 90,932 | | | | 293,623 | | | |
Brembo SpA | | | 38,571 | | | | 2,071,815 | | | |
Telit Communications PLC | | | 133,100 | | | | 382,638 | | | |
| | | | | | | |
| | | | | | | 2,748,076 | | | |
| | | | | | | |
| | | |
Japan (7.28%) | | | | | | | | | | |
AIT Corp. | | | 70,200 | | | | 593,137 | | | |
Amiyaki Tei Co., Ltd. | | | 28,500 | | | | 1,151,786 | | | |
Anest Iwata Corp. | | | 94,700 | | | | 1,029,773 | | | |
AP Company Co., Ltd.(a) | | | 79,400 | | | | 847,729 | | | |
CMIC Holdings Co., Ltd. | | | 50,000 | | | | 757,989 | | | |
CyberAgent, Inc. | | | 13,200 | | | | 645,113 | | | |
| | | | | | | | | | |
| | | Shares | | | Value
(Note 2) |
|
Japan (continued) | | | | | | | | | | |
eGuarantee, Inc. | | | 13,500 | | | $ | 302,735 | | | |
Encourage Technologies Co., Ltd. | | | 23,400 | | | | 488,673 | | | |
Future Architect, Inc. | | | 160,200 | | | | 1,126,218 | | | |
GCA Savvian Corp. | | | 118,700 | | | | 1,150,185 | | | |
Hard Off Corp. Co., Ltd. | | | 195,300 | | | | 2,778,987 | | | |
JCU Corp. | | | 15,800 | | | | 513,797 | | | |
M&A Capital Partners Co., Ltd.(a) | | | 64,200 | | | | 1,102,985 | | | |
MISUMI Group, Inc. | | | 116,200 | | | | 1,697,132 | | | |
Monogatari Corp. | | | 9,900 | | | | 481,974 | | | |
Naigai Trans Line, Ltd. | | | 32,200 | | | | 292,342 | | | |
Prestige International, Inc. | | | 48,900 | | | | 574,483 | | | |
Quick Co., Ltd. | | | 58,700 | | | | 476,110 | | | |
Sawai Pharmaceutical Co., Ltd. | | | 10,900 | | | | 725,301 | | | |
SK Kaken Co., Ltd. | | | 6,000 | | | | 508,928 | | | |
Suruga Bank, Ltd. | | | 54,000 | | | | 1,096,241 | | | |
Syuppin Co., Ltd. | | | 124,900 | | | | 1,521,338 | | | |
Trancom Co., Ltd. | | | 11,700 | | | | 714,756 | | | |
Trust Tech, Inc. | | | 33,000 | | | | 439,483 | | | |
| | | | | | | |
| | | | | | | 21,017,195 | | | |
| | | | | | | |
| | | |
Luxembourg (0.90%) | | | | | | | | | | |
Grand City Properties SA | | | 52,200 | | | | 1,152,995 | | | |
L’Occitane International SA | | | 752,000 | | | | 1,450,311 | | | |
| | | | | | | |
| | | | | | | 2,603,306 | | | |
| | | | | | | |
| | | |
Malaysia (0.79%) | | | | | | | | | | |
AEON Credit Service M Bhd | | | 108,600 | | | | 366,402 | | | |
Berjaya Auto Bhd | | | 1,291,800 | | | | 727,495 | | | |
Berjaya Food Bhd | | | 1,396,300 | | | | 675,543 | | | |
CB Industrial Product Holding Bhd | | | 876,633 | | | | 504,908 | | | |
| | | | | | | |
| | | | | | | 2,274,348 | | | |
| | | | | | | |
| | | |
Mexico (0.92%) | | | | | | | | | | |
Banregio Grupo Financiero SAB de CV | | | 139,557 | | | | 837,927 | | | |
Credito Real SAB de CV SOFOM ER | | | 825,035 | | | | 1,815,066 | | | |
| | | | | | | |
| | | | | | | 2,652,993 | | | |
| | | | | | | |
| | | |
Netherlands (0.74%) | | | | | | | | | | |
Aalberts Industries NV | | | 56,582 | | | | 1,938,494 | | | |
Arcadis NV | | | 12,200 | | | | 208,916 | | | |
| | | | | | | |
| | | | | | | 2,147,410 | | | |
| | | | | | | |
| | | |
New Zealand (0.50%) | | | | | | | | | | |
CBL Corp., Ltd. | | | 168,394 | | | | 282,195 | | | |
| | |
| See Notes to Financial Statements. | | |
36 | | 1.855.377.7325 | www.GrandeurPeakGlobal.com |
| | |
| Grandeur Peak Global Reach Fund | | Portfolio of Investments |
| | April 30, 2016 |
| | | | | | | | | | |
| | | Shares | | | Value
(Note 2) | | | |
|
New Zealand (continued) | | | | | | | | | | |
Trilogy International, Ltd. | | | 512,272 | | | $ | 1,166,082 | | | |
| | | | | | | |
| | | | | | | 1,448,277 | | | |
| | | | | | | |
| | | |
Norway (1.59%) | | | | | | | | | | |
Medistim ASA | | | 75,150 | | | | 494,663 | | | |
Multiconsult ASA(b)(c) | | | 63,000 | | | | 735,483 | | | |
Skandiabanken ASA(a)(b)(c) | | | 492,400 | | | | 2,874,221 | | | |
SpareBank 1 SMN | | | 77,800 | | | | 478,288 | | | |
| | | | | | | |
| | | | | | | 4,582,655 | | | |
| | | | | | | |
| | | |
Oman (0.17%) | | | | | | | | | | |
Tethys Oil AB | | | 69,200 | | | | 495,489 | | | |
| | | | | | | |
| | | |
Philippines (1.55%) | | | | | | | | | | |
Concepcion Industrial Corp. | | | 594,600 | | | | 608,708 | | | |
Pepsi-Cola Products Philippines, Inc. | | | 15,380,100 | | | | 1,216,959 | | | |
Puregold Price Club, Inc. | | | 922,700 | | | | 791,097 | | | |
Robinsons Land Corp. | | | 725,300 | | | | 419,208 | | | |
Security Bank Corp. | | | 395,700 | | | | 1,434,690 | | | |
| | | | | | | |
| | | | | | | 4,470,662 | | | |
| | | | | | | |
| | | |
Poland (0.46%) | | | | | | | | | | |
PGS Software SA | | | 75,476 | | | | 245,394 | | | |
Wawel SA | | | 2,541 | | | | 738,877 | | | |
Work Service SA | | | 122,000 | | | | 348,393 | | | |
| | | | | | | |
| | | | | | | 1,332,664 | | | |
| | | | | | | |
| | | |
Russia (0.02%) | | | | | | | | | | |
MD Medical Group Investments PLC, GDR(c) | | | 11,855 | | | | 65,795 | | | |
| | | | | | | |
| | | |
Singapore (0.38%) | | | | | | | | | | |
CSE Global, Ltd. | | | 1,694,000 | | | | 541,636 | | | |
Riverstone Holdings, Ltd. | | | 765,800 | | | | 555,196 | | | |
| | | | | | | |
| | | | | | | 1,096,832 | | | |
| | | | | | | |
| | | |
South Africa (2.43%) | | | | | | | | | | |
ARB Holdings, Ltd. | | | 1,846,120 | | | | 713,276 | | | |
Blue Label Telecoms, Ltd. | | | 787,302 | | | | 869,418 | | | |
Cartrack Holdings, Ltd. | | | 1,975,900 | | | | 1,290,871 | | | |
Clicks Group, Ltd. | | | 113,900 | | | | 831,891 | | | |
EOH Holdings, Ltd. | | | 52,600 | | | | 511,949 | | | |
Interwaste Holdings, Ltd.(a) | | | 8,654,310 | | | | 541,075 | | | |
Italtile, Ltd. | | | 921,472 | | | | 818,856 | | | |
Super Group, Ltd.(a) | | | 286,800 | | | | 828,855 | | | |
Transaction Capital, Ltd. | | | 741,100 | | | | 614,319 | | | |
| | | | | | | |
| | | | | | | 7,020,510 | | | |
| | | | | | | |
| | | |
South Korea (2.49%) | | | | | | | | | | |
Bluecom Co., Ltd. | | | 38,500 | | | | 467,988 | | | |
| | | | | | | | | | |
| | | Shares | | | Value
(Note 2) | | | |
|
South Korea (continued) | | | | | | | | | | |
DGB Financial Group, Inc. | | | 146,500 | | | $ | 1,179,046 | | | |
Hy-Lok Corp. | | | 46,840 | | | | 1,169,561 | | | |
Interpark Holdings Corp. | | | 96,500 | | | | 746,151 | | | |
ISC Co., Ltd. | | | 76,029 | | | | 1,671,517 | | | |
Koh Young Technology, Inc. | | | 17,143 | | | | 631,917 | | | |
TechWing, Inc. | | | 58,000 | | | | 654,116 | | | |
Vitzrocell Co., Ltd. | | | 67,073 | | | | 662,253 | | | |
| | | | | | | |
| | | | | | | 7,182,549 | | | |
| | | | | | | |
| | | |
Spain (0.00%)(d) | | | | | | | | | | |
Let’s GOWEX SA(a)(e) | | | 10,700 | | | | 1 | | | |
| | | | | | | |
| | | |
Sri Lanka (0.66%) | | | | | | | | | | |
Hemas Holdings PLC | | | 1,170,961 | | | | 731,801 | | | |
Royal Ceramics Lanka PLC | | | 1,460,600 | | | | 1,177,468 | | | |
| | | | | | | |
| | | | | | | 1,909,269 | | | |
| | | | | | | |
| | | |
Sweden (1.46%) | | | | | | | | | | |
Bufab Holding AB | | | 131,950 | | | | 1,031,059 | | | |
HIQ International AB | | | 90,026 | | | | 563,332 | | | |
Indutrade AB | | | 7,400 | | | | 414,948 | | | |
Moberg Pharma AB(a) | | | 111,100 | | | | 672,373 | | | |
Opus Group AB | | | 436,918 | | | | 236,129 | | | |
Svenska Handelsbanken AB, Class A | | | 55,000 | | | | 732,151 | | | |
Vitec Software Group AB, Class B | | | 67,500 | | | | 552,662 | | | |
| | | | | | | |
| | | | | | | 4,202,654 | | | |
| | | | | | | |
| | | |
Switzerland (1.62%) | | | | | | | | | | |
Baloise Holding AG | | | 4,700 | | | | 581,559 | | | |
Leonteq AG | | | 6,000 | | | | 417,492 | | | |
Luxoft Holding, Inc.(a) | | | 7,800 | | | | 450,918 | | | |
VZ Holding AG | | | 6,950 | | | | 2,162,593 | | | |
Wizz Air Holdings PLC(a)(b)(c) | | | 39,100 | | | | 1,074,063 | | | |
| | | | | | | |
| | | | | | | 4,686,625 | | | |
| | | | | | | |
| | | |
Taiwan (3.94%) | | | | | | | | | | |
ASPEED Technology, Inc. | | | 71,771 | | | | 656,449 | | | |
Chailease Holding Co., Ltd. | | | 337,000 | | | | 566,316 | | | |
Chipbond Technology Corp. | | | 162,000 | | | | 215,980 | | | |
Cub Elecparts, Inc. | | | 56,510 | | | | 685,065 | | | |
Dr. Wu Skincare Co., Ltd. | | | 212,000 | | | | 2,247,977 | | | |
I Yuan Precision Ind. Co., Ltd. | | | 132,000 | | | | 521,812 | | | |
Novatek Microelectronics Corp. | | | 153,000 | | | | 536,043 | | | |
Polytronics Technology Corp. | | | 145,000 | | | | 267,495 | | | |
Sinmag Equipment Corp. | | | 156,371 | | | | 518,764 | | | |
Sitronix Technology Corp. | | | 286,000 | | | | 837,082 | | | |
| | |
| See Notes to Financial Statements. | | |
Annual Report | April 30, 2016 | | 37 |
| | |
| Grandeur Peak Global Reach Fund | | Portfolio of Investments |
| | April 30, 2016 |
| | | | | | | | | | |
| | | Shares | | | Value (Note 2) | | | |
|
Taiwan (continued) | | | | | | | | | | |
Solidwizard Technology Co., Ltd. | | | 74,000 | | | $ | 251,233 | | | |
Sporton International, Inc. | | | 271,630 | | | | 1,490,668 | | | |
Test Research, Inc. | | | 488,440 | | | | 690,567 | | | |
TSC Auto ID Technology Co., Ltd. | | | 51,600 | | | | 462,357 | | | |
Tung Thih Electronic Co., Ltd. | | | 66,000 | | | | 1,180,727 | | | |
UDE Corp. | | | 270,000 | | | | 251,139 | | | |
| | | | | | | |
| | | | | | | 11,379,674 | | | |
| | | | | | | |
| | | |
Thailand (0.59%) | | | | | | | | | | |
Ananda Development PCL | | | 8,600,100 | | | | 896,203 | | | |
Premier Marketing PCL | | | 2,878,100 | | | | 803,363 | | | |
| | | | | | | |
| | | | | | | 1,699,566 | | | |
| | | | | | | |
| | | |
Turkey (0.52%) | | | | | | | | | | |
EGE Seramik Sanayi ve Ticaret AS | | | 436,800 | | | | 707,185 | | | |
Pinar SUT Mamulleri Sanayii AS | | | 132,600 | | | | 805,173 | | | |
| | | | | | | |
| | | | | | | 1,512,358 | | | |
| | | | | | | |
| | | |
United States (25.01%) | | | | | | | | | | |
Alamo Group, Inc. | | | 11,753 | | | | 663,339 | | | |
Amsurg Corp.(a) | | | 15,137 | | | | 1,225,794 | | | |
Aratana Therapeutics, Inc.(a) | | | 190,950 | | | | 1,147,610 | | | |
Atlas Financial Holdings,
Inc.(a) | | | 30,775 | | | | 540,717 | | | |
BioDelivery Sciences International, Inc.(a) | | | 260,900 | | | | 881,842 | | | |
BofI Holding, Inc.(a) | | | 14,725 | | | | 299,948 | | | |
Demandware, Inc.(a) | | | 7,100 | | | | 327,168 | | | |
Diamond Hill Investment Group, Inc. | | | 5,850 | | | | 1,025,271 | | | |
Duluth Holdings, Inc., Class B(a) | | | 30,393 | | | | 723,049 | | | |
DXP Enterprises, Inc.(a) | | | 24,625 | | | | 538,056 | | | |
EPAM Systems, Inc.(a) | | | 11,050 | | | | 805,876 | | | |
ePlus, Inc.(a) | | | 12,896 | | | | 1,036,709 | | | |
Escalade, Inc. | | | 102,102 | | | | 1,218,077 | | | |
Evolent Health, Inc., Class
A(a) | | | 20,100 | | | | 241,401 | | | |
Evolution Petroleum Corp. | | | 207,925 | | | | 1,151,904 | | | |
ExlService Holdings,
Inc.(a) | | | 17,325 | | | | 838,357 | | | |
Fastenal Co. | | | 31,700 | | | | 1,483,243 | | | |
First Cash Financial Services, Inc. | | | 16,150 | | | | 738,539 | | | |
First Republic Bank | | | 75,550 | | | | 5,312,676 | | | |
FormFactor, Inc.(a) | | | 139,574 | | | | 1,074,720 | | | |
Genesee & Wyoming, Inc., Class A(a) | | | 8,825 | | | | 574,596 | | | |
| | | | | | | | | | |
| | | Shares | | | Value (Note 2) | | | |
|
United States (continued) | | | | | | | | | | |
Genpact, Ltd.(a) | | | 23,575 | | | $ | 657,507 | | | |
Gentex Corp. | | | 89,975 | | | | 1,443,199 | | | |
Geospace Technologies Corp.(a) | | | 14,560 | | | | 238,202 | | | |
Health Insurance Innovations, Inc., Class A(a) | | | 46,725 | | | | 291,097 | | | |
Hennessy Advisors, Inc. | | | 21,050 | | | | 647,287 | | | |
Hibbett Sports, Inc.(a) | | | 19,175 | | | | 692,217 | | | |
Hingham Institution for Savings | | | 4,775 | | | | 611,152 | | | |
Home BancShares, Inc. | | | 26,825 | | | | 1,153,207 | | | |
Inphi Corp.(a) | | | 105,750 | | | | 3,137,602 | | | |
K2M Group Holdings, Inc.(a) | | | 35,025 | | | | 569,506 | | | |
Knight Transportation, Inc. | | | 38,500 | | | | 1,022,945 | | | |
LGI Homes, Inc.(a) | | | 24,550 | | | | 687,645 | | | |
LinkedIn Corp., Class A(a) | | | 2,475 | | | | 310,142 | | | |
Littelfuse, Inc. | | | 4,800 | | | | 559,104 | | | |
Malibu Boats, Inc., Class A(a) | | | 65,844 | | | | 1,158,854 | | | |
Marin Software, Inc.(a) | | | 96,400 | | | | 246,784 | | | |
MarketAxess Holdings, Inc. | | | 9,005 | �� | | | 1,105,454 | | | |
Mastech Holdings, Inc.(a) | | | 72,898 | | | | 508,099 | | | |
MaxLinear, Inc., Class A(a) | | | 46,550 | | | | 779,712 | | | |
MEDNAX, Inc.(a) | | | 28,975 | | | | 2,065,628 | | | |
Microchip Technology, Inc. | | | 13,775 | | | | 669,327 | | | |
Misonix, Inc.(a) | | | 34,776 | | | | 207,613 | | | |
MSC Industrial Direct Co., Inc., Class A | | | 14,925 | | | | 1,156,687 | | | |
NorthStar Asset Management Group, Inc. | | | 23,300 | | | | 289,852 | | | |
NorthStar Realty Finance Corp., REIT | | | 57,037 | | | | 729,503 | | | |
NxStage Medical, Inc.(a) | | | 73,600 | | | | 1,186,432 | | | |
OTC Markets Group, Inc., Class A | | | 20,325 | | | | 343,086 | | | |
Palo Alto Networks, Inc.(a) | | | 4,175 | | | | 629,882 | | | |
Patrick Industries, Inc.(a) | | | 12,250 | | | | 561,663 | | | |
Paycom Software, Inc.(a) | | | 22,425 | | | | 856,859 | | | |
Power Integrations, Inc. | | | 36,440 | | | | 1,758,230 | | | |
PRA Group, Inc.(a) | | | 72,650 | | | | 2,410,527 | | | |
Proto Labs, Inc.(a) | | | 21,550 | | | | 1,289,337 | | | |
Qualys, Inc.(a) | | | 23,075 | | | | 581,029 | | | |
Quanta Services, Inc.(a) | | | 39,700 | | | | 941,684 | | | |
Reis, Inc. | | | 17,200 | | | | 432,924 | | | |
Resources Connection, Inc. | | | 25,650 | | | | 378,851 | | | |
Roadrunner Transportation Systems, Inc.(a) | | | 125,550 | | | | 1,484,001 | | | |
Signature Bank(a) | | | 14,350 | | | | 1,977,861 | | | |
Silicon Laboratories, Inc.(a) | | | 21,550 | | | | 1,008,540 | | | |
Spirit Airlines, Inc.(a) | | | 23,900 | | | | 1,049,927 | | | |
| | |
| See Notes to Financial Statements. | | |
38 | | 1.855.377.7325 | www.GrandeurPeakGlobal.com |
| | |
| Grandeur Peak Global Reach Fund | | Portfolio of Investments |
| | April 30, 2016 |
| | | | | | | | | | |
| | | Shares | | | Value (Note 2) |
|
United States (continued) | | | | | | | | | | |
Sportsman’s Warehouse Holdings, Inc.(a) | | | 126,075 | | | $ | 1,434,734 | | | |
Sprouts Farmers Market, Inc.(a) | | | 39,250 | | | | 1,101,748 | | | |
STAAR Surgical Co.(a) | | | 57,611 | | | | 444,181 | | | |
SVB Financial Group(a) | | | 5,525 | | | | 576,147 | | | |
Synaptics, Inc.(a) | | | 11,825 | | | | 846,079 | | | |
Syntel, Inc.(a) | | | 9,325 | | | | 396,592 | | | |
Textura Corp.(a) | | | 20,250 | | | | 534,398 | | | |
Transcat, Inc.(a) | | | 165,377 | | | | 1,757,958 | | | |
Trecora Resources(a) | | | 25,750 | | | | 294,838 | | | |
TriMas Corp.(a) | | | 63,025 | | | | 1,140,753 | | | |
TubeMogul, Inc.(a) | | | 57,420 | | | | 744,163 | | | |
Universal Truckload Services, Inc. | | | 3,170 | | | | 45,204 | | | |
Vascular Solutions, Inc.(a) | | | 23,796 | | | | 831,670 | | | |
Veracyte, Inc.(a) | | | 159,563 | | | | 925,465 | | | |
Virtusa Corp.(a) | | | 20,675 | | | | 734,790 | | | |
WW Grainger, Inc. | | | 3,100 | | | | 727,012 | | | |
| | | | | | | |
| | | | | | | 72,213,782 | | | |
| | | | | | | |
| | | |
Vietnam (0.95%) | | | | | | | | | | |
Binh Minh Plastics JSC | | | 70,930 | | | | 448,723 | | | |
DHG Pharmaceutical JSC | | | 101,666 | | | | 385,444 | | | |
PetroVietnam Drilling and Well Services JSC | | | 269,330 | | | | 294,852 | | | |
Traphaco JSC | | | 89,000 | | | | 455,222 | | | |
Vietnam Dairy Products JSC | | | 185,243 | | | | 1,155,275 | | | |
| | | | | | | |
| | | | | | | 2,739,516 | | | |
| | | | | | | |
| | | |
TOTAL COMMON STOCKS (Cost $267,802,515) | | | | | | | 281,616,069 | | | |
| | | | | | | |
| | | |
PREFERRED STOCKS (0.39%) | | | | | | | | | | |
Brazil (0.39%) | | | | | | | | | | |
Banco Daycoval SA | | | 167,200 | | | | 411,771 | | | |
Itau Unibanco Holding SA | | | 75,200 | | | | 719,366 | | | |
| | | | | | | |
| | | | | | | 1,131,137 | | | |
| | | | | | | |
| | | |
TOTAL PREFERRED STOCKS (Cost $1,109,176) | | | | | | | 1,131,137 | | | |
| | | | | | | |
| | |
TOTAL INVESTMENTS (97.92%) (Cost $268,911,691) | | | $ | 282,747,206 | | | |
| | |
Other Assets In Excess Of Liabilities (2.08%) | | | | 5,996,127 | | | |
| | | | | | | |
| | | |
NET ASSETS (100.00%) | | | | | | $ | 288,743,333 | | | |
| | | | | | | |
| (a) | Non-Income Producing Security. |
| (b) | Security exempt from registration under Rule 144A of the Securities Act of 1933. These securities may be resold in the ordinary course of business in transactions exempt from registration, normally to qualified institutional buyers. As of April 30, 2016, these securities had a total aggregate market value of $8,453,531, representing 2.93% of net assets. |
| (c) | Security was purchased pursuant to Regulation S under the Securities Act of 1933, which exempts securities offered and sold outside of the United States from registration. Such security cannot be sold in the United States without either an effective registration statement filed pursuant to the Securities Act of 1933, or pursuant to an exemption from registration. The security has been deemed liquid under guidelines approved by the Fund’s Board of Trustees. As of April 30, 2016, the aggregate market value of those securities was $9,901,946, representing 3.43% of net assets. |
| (e) | Fair valued security under the procedures approved by the Fund’s Board of Trustees. |
For Fund compliance purposes, the Fund’s geographical classifications refer to any one or more of the country sub-classifications used by one or more widely recognized market indexes or ratings group indexes, and/or as defined by Fund management. This definition may not apply for purposes of this report, which may combine sub-classifications for reporting ease. Geographical regions are shown as a percentage of net assets.
| | |
| See Notes to Financial Statements. | | |
Annual Report | April 30, 2016 | | 39 |
| | |
| Grandeur Peak Global Stalwarts Fund | | Portfolio of Investments |
| | April 30, 2016 |
| | | | | | | | | | |
| | | Shares | | | Value (Note 2) |
|
COMMON STOCKS (92.58%) | | | | | | | | | | |
Australia (0.50%) | | | | | | | | | | |
Magellan Financial Group, Ltd. | | | 11,185 | | | $ | 182,847 | | | |
| | | | | | | |
| | | |
Belgium (0.75%) | | | | | | | | | | |
Melexis NV | | | 4,985 | | | | 275,243 | | | |
| | | | | | | |
| | | |
Brazil (0.44%) | | | | | | | | | | |
CETIP SA - Mercados Organizados | | | 13,125 | | | | 160,893 | | | |
| | | | | | | |
| | | |
Britain (2.95%) | | | | | | | | | | |
Abcam PLC | | | 14,525 | | | | 125,429 | | | |
B&M European Value Retail SA | | | 46,100 | | | | 186,854 | | | |
Diploma PLC | | | 39,750 | | | | 424,861 | | | |
Ultra Electronics Holdings PLC | | | 13,425 | | | | 346,418 | | | |
| | | | | | | |
| | | | | | | 1,083,562 | | | |
| | | | | | | |
| | | |
Canada (5.60%) | | | | | | | | | | |
Gildan Activewear, Inc. | | | 7,044 | | | | 218,781 | | | |
Home Capital Group, Inc. | | | 6,991 | | | | 209,446 | | | |
Ritchie Bros. Auctioneers, Inc. | | | 14,125 | | | | 405,246 | | | |
Stantec, Inc. | | | 21,292 | | | | 545,749 | | | |
TransForce, Inc. | | | 35,773 | | | | 675,145 | | | |
| | | | | | | |
| | | | | | | 2,054,367 | | | |
| | | | | | | |
| | | |
Chile (0.42%) | | | | | | | | | | |
Banco de Chile | | | 1,403,900 | | | | 153,910 | | | |
| | | | | | | |
| | | |
China (4.39%) | | | | | | | | | | |
AAC Technologies Holdings, Inc. | | | 24,400 | | | | 169,704 | | | |
China Lesso Group Holdings, Ltd. | | | 198,500 | | | | 109,526 | | | |
China Medical System Holdings, Ltd. | | | 361,000 | | | | 470,046 | | | |
Man Wah Holdings, Ltd. | | | 736,500 | | | | 860,226 | | | |
| | | | | | | |
| | | | | | | 1,609,502 | | | |
| | | | | | | |
| | | |
Colombia (0.65%) | | | | | | | | | | |
Parex Resources, Inc.(a) | | | 23,700 | | | | 237,434 | | | |
| | | | | | | |
| | | |
Egypt (0.27%) | | | | | | | | | | |
Commercial International Bank Egypt SAE | | | 19,357 | | | | 98,486 | | | |
| | | | | | | |
| | | |
France (0.95%) | | | | | | | | | | |
Alten SA | | | 5,657 | | | | 349,788 | | | |
| | | | | | | |
| | | | | | | | | | |
| | | Shares | | | Value (Note 2) |
|
Germany (2.47%) | | | | | | | | | | |
Aroundtown Property Holdings PLC(a) | | | 39,600 | | | $ | 198,607 | | | |
Norma Group SE | | | 5,440 | | | | 279,748 | | | |
PATRIZIA Immobilien AG(a) | | | 7,635 | | | | 176,860 | | | |
Wirecard AG | | | 5,800 | | | | 250,476 | | | |
| | | | | | | |
| | | | | | | 905,691 | | | |
| | | | | | | |
| | | |
Hong Kong (3.65%) | | | | | | | | | | |
Samsonite International SA | | | 70,500 | | | | 227,671 | | | |
Value Partners Group, Ltd. | | | 875,900 | | | | 841,245 | | | |
Vitasoy International Holdings, Ltd. | | | 144,500 | | | | 270,860 | | | |
| | | | | | | |
| | | | | | | 1,339,776 | | | |
| | | | | | | |
| | | |
India (5.45%) | | | | | | | | | | |
AIA Engineering, Ltd. | | | 17,000 | | | | 253,962 | | | |
Ajanta Pharma, Ltd. | | | 6,875 | | | | 156,975 | | | |
Alkem Laboratories, Ltd. | | | 10,324 | | | | 185,367 | | | |
Bajaj Finance, Ltd. | | | 1,700 | | | | 175,026 | | | |
Bajaj Finserv, Ltd. | | | 3,000 | | | | 84,819 | | | |
Colgate-Palmolive India, Ltd. | | | 9,000 | | | | 114,091 | | | |
Divi’s Laboratories, Ltd. | | | 7,500 | | | | 118,849 | | | |
Indiabulls Housing Finance, Ltd. | | | 14,200 | | | | 148,412 | | | |
WNS Holdings, Ltd., ADR(a) | | | 13,250 | | | | 419,892 | | | |
Yes Bank, Ltd. | | | 24,200 | | | | 344,028 | | | |
| | | | | | | |
| | | | | | | 2,001,421 | | | |
| | | | | | | |
| | | |
Indonesia (1.80%) | | | | | | | | | | |
Bank Negara Indonesia Persero Tbk PT | | | 689,000 | | | | 239,541 | | | |
Bank Rakyat Indonesia Persero Tbk PT | | | 364,600 | | | | 286,140 | | | |
Petra Foods, Ltd. | | | 72,500 | | | | 133,425 | | | |
| | | | | | | |
| | | | | | | 659,106 | | | |
| | | | | | | |
| | | |
Israel (0.33%) | | | | | | | | | | |
Caesarstone Sdot-Yam, Ltd.(a) | | | 3,275 | | | | 121,273 | | | |
| | | | | | | |
| | | |
Italy (1.42%) | | | | | | | | | | |
Brembo SpA | | | 9,683 | | | | 520,116 | | | |
| | | | | | | |
| | | |
Japan (7.87%) | | | | | | | | | | |
Century Tokyo Leasing Corp. | | | 5,200 | | | | 184,493 | | | |
CyberAgent, Inc. | | | 10,200 | | | | 498,496 | | | |
MISUMI Group, Inc. | | | 67,900 | | | | 991,697 | | | |
Nihon M&A Center, Inc. | | | 6,400 | | | | 381,353 | | | |
Sawai Pharmaceutical Co., Ltd. | | | 4,500 | | | | 299,436 | | | |
| | |
| See Notes to Financial Statements. | | |
40 | | 1.855.377.7325 | www.GrandeurPeakGlobal.com |
| | |
| Grandeur Peak Global Stalwarts Fund | | Portfolio of Investments |
| | April 30, 2016 |
| | | | | | | | | | |
| | | Shares | | | Value (Note 2) |
|
Japan (continued) | | | | | | | | | | |
Seria Co., Ltd. | | | 3,000 | | | $ | 178,478 | | | |
Suruga Bank, Ltd. | | | 17,400 | | | | 353,233 | | | |
| | | | | | | |
| | | | | | | 2,887,186 | | | |
| | | | | | | |
| | | |
Luxembourg (1.65%) | | | | | | | | | | |
Grand City Properties SA | | | 14,000 | | | | 309,232 | | | |
L’Occitane International SA | | | 153,400 | | | | 295,848 | | | |
| | | | | | | |
| | | | | | | 605,080 | | | |
| | | | | | | |
| | | |
Mexico (0.75%) | | | | | | | | | | |
Banregio Grupo Financiero SAB de CV | | | 45,700 | | | | 274,392 | | | |
| | | | | | | |
| | | |
Netherlands (1.64%) | | | | | | | | | | |
Aalberts Industries NV | | | 12,810 | | | | 438,869 | | | |
Arcadis NV | | | 9,527 | | | | 163,143 | | | |
| | | | | | | |
| | | | | | | 602,012 | | | |
| | | | | | | |
| | | |
Philippines (3.38%) | | | | | | | | | | |
Puregold Price Club, Inc. | | | 509,000 | | | | 436,402 | | | |
Robinsons Retail Holdings, Inc. | | | 220,900 | | | | 362,768 | | | |
Security Bank Corp. | | | 121,300 | | | | 439,798 | | | |
| | | | | | | |
| | | | | | | 1,238,968 | | | |
| | | | | | | |
| | | |
South Africa (1.35%) | | | | | | | | | | |
EOH Holdings, Ltd. | | | 30,050 | | | | 292,473 | | | |
Mr. Price Group, Ltd. | | | 16,100 | | | | 204,518 | | | |
| | | | | | | |
| | | | | | | 496,991 | | | |
| | | | | | | |
| | | |
South Korea (0.61%) | | | | | | | | | | |
DGB Financial Group, Inc. | | | 28,000 | | | | 225,347 | | | |
| | | | | | | |
| | | |
Sweden (3.11%) | | | | | | | | | | |
Hexpol AB | | | 23,362 | | | | 241,462 | | | |
Indutrade AB | | | 6,425 | | | | 360,276 | | | |
Nibe Industrier AB, Class B | | | 5,077 | | | | 176,389 | | | |
Svenska Handelsbanken AB, Class A | | | 27,300 | | | | 363,413 | | | |
| | | | | | | |
| | | | | | | 1,141,540 | | | |
| | | | | | | |
| | | |
Switzerland (3.32%) | | | | | | | | | | |
Baloise Holding AG | | | 2,490 | | | | 308,103 | | | |
Leonteq AG | | | 2,700 | | | | 187,871 | | | |
Luxoft Holding, Inc.(a) | | | 3,075 | | | | 177,766 | | | |
VZ Holding AG | | | 1,150 | | | | 357,839 | | | |
Wizz Air Holdings PLC(a)(b)(c) | | | 6,800 | | | | 186,793 | | | |
| | | | | | | |
| | | | | | | 1,218,372 | | | |
| | | | | | | |
| | | | | | | | | | |
| | | Shares | | | Value (Note 2) |
|
Taiwan (2.68%) | | | | | | | | | | |
Catcher Technology Co., Ltd. | | | 46,000 | | | $ | 323,753 | | | |
Chailease Holding Co., Ltd. | | | 88,000 | | | | 147,881 | | | |
Largan Precision Co., Ltd. | | | 5,000 | | | | 351,905 | | | |
Novatek Microelectronics Corp. | | | 46,000 | | | | 161,163 | | | |
| | | | | | | |
| | | | | | | 984,702 | | | |
| | | | | | | |
| | | |
United States (33.47%) | | | | | | | | | | |
Amazon.com, Inc.(a) | | | 175 | | | | 115,428 | | | |
Amsurg Corp.(a) | | | 7,075 | | | | 572,933 | | | |
Carter’s, Inc. | | | 2,625 | | | | 280,009 | | | |
Dril-Quip, Inc.(a) | | | 1,475 | | | | 95,609 | | | |
EPAM Systems, Inc.(a) | | | 3,400 | | | | 247,962 | | | |
Fastenal Co. | | | 9,950 | | | | 465,560 | | | |
First Republic Bank | | | 11,650 | | | | 819,228 | | | |
Genesee & Wyoming, Inc., Class A(a) | | | 2,750 | | | | 179,052 | | | |
Genpact, Ltd.(a) | | | 9,475 | | | | 264,258 | | | |
Gentex Corp. | | | 23,625 | | | | 378,945 | | | |
Home BancShares, Inc. | | | 4,156 | | | | 178,666 | | | |
Knight Transportation, Inc. | | | 30,575 | | | | 812,378 | | | |
Linear Technology Corp. | | | 7,650 | | | | 340,272 | | | |
LinkedIn Corp., Class A(a) | | | 725 | | | | 90,850 | | | |
Littelfuse, Inc. | | | 2,300 | | | | 267,904 | | | |
MarketAxess Holdings, Inc. | | | 2,925 | | | | 359,073 | | | |
MEDNAX, Inc.(a) | | | 9,600 | | | | 684,384 | | | |
Microchip Technology, Inc. | | | 14,250 | | | | 692,408 | | | |
MSC Industrial Direct Co., Inc., Class A | | | 3,950 | | | | 306,125 | | | |
NorthStar Asset Management Group, Inc. | | | 7,625 | | | | 94,855 | | | |
NorthStar Realty Finance Corp., REIT | | | 9,937 | | | | 127,094 | | | |
Palo Alto Networks, Inc.(a) | | | 1,325 | | | | 199,903 | | | |
Paycom Software, Inc.(a) | | | 6,350 | | | | 242,634 | | | |
Power Integrations, Inc. | | | 16,375 | | | | 790,094 | | | |
PRA Group, Inc.(a) | | | 19,725 | | | | 654,476 | | | |
Proto Labs, Inc.(a) | | | 4,125 | | | | 246,799 | | | |
Quanta Services, Inc.(a) | | | 14,600 | | | | 346,312 | | | |
Signature Bank(a) | | | 2,075 | | | | 285,997 | | | |
Silicon Laboratories, Inc.(a) | | | 7,450 | | | | 348,660 | | | |
Spirit Airlines, Inc.(a) | | | 5,075 | | | | 222,945 | | | |
Sprouts Farmers Market,
Inc.(a) | | | 16,950 | | | | 475,787 | | | |
SVB Financial Group(a) | | | 975 | | | | 101,673 | | | |
Synaptics, Inc.(a) | | | 4,100 | | | | 293,355 | | | |
Syntel, Inc.(a) | | | 3,325 | | | | 141,412 | | | |
Tyler Technologies, Inc.(a) | | | 800 | | | | 117,128 | | | |
Virtusa Corp.(a) | | | 4,558 | | | | 161,991 | | | |
| | |
| See Notes to Financial Statements. | | |
Annual Report | April 30, 2016 | | 41 |
| | |
| Grandeur Peak Global Stalwarts Fund | | Portfolio of Investments |
| | April 30, 2016 |
| | | | | | | | | | |
| | | Shares | | | Value (Note 2) |
|
United States (continued) | | | | | | | | | | |
WW Grainger, Inc. | | | 1,185 | | | $ | 277,906 | | | |
| | | | | | | |
| | | | | | | 12,280,065 | | | |
| | | | | | | |
| | | |
Vietnam (0.71%) | | | | | | | | | | |
Vietnam Dairy Products JSC | | | 41,820 | | | | 260,812 | | | |
| | | | | | | |
| | | |
TOTAL COMMON STOCKS (Cost $31,758,099) | | | | | | | 33,968,882 | | | |
| | | | | | | |
| | | |
PREFERRED STOCKS (0.83%) | | | | | | | | | | |
Brazil (0.83%) | | | | | | | | | | |
Itau Unibanco Holding SA | | | 31,950 | | | | 305,635 | | | |
| | | | | | | |
| | | |
TOTAL PREFERRED STOCKS (Cost $210,691) | | | | | | | 305,635 | | | |
| | | | | | | |
| | |
TOTAL INVESTMENTS (93.41%) (Cost $31,968,790) | | | $ | 34,274,517 | | | |
| | |
Other Assets In Excess Of Liabilities (6.59%) | | | | 2,418,821 | | | |
| | | | | | | |
| | |
NET ASSETS (100.00%) | | | $ | 36,693,338 | | | |
| | | | | | | |
| (a) | Non-Income Producing Security. |
| (b) | Security exempt from registration under Rule 144A of the Securities Act of 1933. These securities may be resold in the ordinary course of business in transactions exempt from registration, normally to qualified institutional buyers. As of April 30, 2016, these securities had a total aggregate market value of $186,793, representing 0.51% of net assets. |
| (c) | Security was purchased pursuant to Regulation S under the Securities Act of 1933, which exempts securities offered and sold outside of the United States from registration. Such security cannot be sold in the United States without either an effective registration statement filed pursuant to the Securities Act of 1933, or pursuant to an exemption from registration. The security has been deemed liquid under guidelines approved by the Fund’s Board of Trustees. As of April 30, 2016, the aggregate market value of those securities was $186,793, representing 0.51% of net assets. |
For Fund compliance purposes, the Fund’s geographical classifications refer to any one or more of the country sub-classifications used by one or more widely recognized market indexes or ratings group indexes, and/or as defined by Fund management. This definition may not apply for purposes of this report, which may combine sub-classifications for reporting ease. Geographical regions are shown as a percentage of net assets.
| | |
| See Notes to Financial Statements. | | |
42 | | 1.855.377.7325 | www.GrandeurPeakGlobal.com |
| | |
| Grandeur Peak International Opportunities Fund | | Portfolio of Investments |
| | April 30, 2016 |
| | | | | | | | | | |
| | | Shares | | | Value (Note 2) |
|
COMMON STOCKS (94.40%) | | | |
Australia (2.05%) | | | | | | | | | | |
CTI Logistics, Ltd. | | | 1,533,161 | | | $ | 932,591 | | | |
Greencross, Ltd. | | | 983,600 | | | | 5,317,428 | | | |
Magellan Financial Group, Ltd. | | | 254,400 | | | | 4,158,810 | | | |
Medical Developments International, Ltd. | | | 703,338 | | | | 3,342,393 | | | |
Reject Shop, Ltd. | | | 74,431 | | | | 702,893 | | | |
| | | | | | | |
| | | | | | | 14,454,115 | | | |
| | | | | | | |
| | | |
Austria (1.20%) | | | | | | | | | | |
Palfinger AG | | | 273,840 | | | | 8,419,102 | | | |
| | | | | | | |
| | | |
Belgium (1.17%) | | | | | | | | | | |
Melexis NV | | | 149,684 | | | | 8,264,702 | | | |
| | | | | | | |
| | | |
Brazil (1.51%) | | | | | | | | | | |
CETIP SA - Mercados Organizados | | | 234,014 | | | | 2,868,657 | | | |
FPC Par Corretora de Seguros SA | | | 646,500 | | | | 2,161,736 | | | |
Localiza Rent a Car SA | | | 36,000 | | | | 350,972 | | | |
M Dias Branco SA | | | 112,900 | | | | 2,557,217 | | | |
Valid Solucoes e Servicos de Seguranca em Meios de Pagamento e Identificacao SA | | | 270,100 | | | | 2,714,155 | | | |
| | | | | | | |
| | | | | | | 10,652,737 | | | |
| | | | | | | |
| | | |
Britain (8.69%) | | | | | | | | | | |
Abcam PLC | | | 381,366 | | | | 3,293,249 | | | |
Alliance Pharma PLC | | | 4,003,600 | | | | 2,632,439 | | | |
Arrow Global Group PLC | | | 1,422,000 | | | | 5,339,834 | | | |
Clinigen Group PLC | | | 2,263,073 | | | | 17,723,865 | | | |
Diploma PLC | | | 465,100 | | | | 4,971,137 | | | |
EMIS Group PLC | | | 587,200 | | | | 8,185,204 | | | |
Exova Group PLC | | | 587,400 | | | | 1,373,248 | | | |
On the Beach Group
PLC(a)(b)(c) | | | 815,500 | | | | 3,278,303 | | | |
Oxford Immunotec Global PLC(a) | | | 237,180 | | | | 2,480,903 | | | |
RPS Group PLC | | | 1,050,211 | | | | 2,677,732 | | | |
SafeCharge International Group, Ltd. | | | 409,300 | | | | 1,438,308 | | | |
Sanne Group PLC | | | 461,800 | | | | 2,977,376 | | | |
Tracsis PLC | | | 190,900 | | | | 1,387,695 | | | |
Ultra Electronics Holdings PLC | | | 130,800 | | | | 3,375,153 | | | |
| | | | | | | |
| | | | | | | 61,134,446 | | | |
| | | | | | | |
| | | |
Canada (4.28%) | | | | | | | | | | |
Biosyent, Inc.(a) | | | 288,500 | | | | 1,595,752 | | | |
| | | | | | | | | | |
| | | Shares | | | Value (Note 2) |
|
Canada (continued) | | | | | | | | | | |
Cipher Pharmaceuticals,
Inc.(a) | | | 895,100 | | | $ | 5,293,411 | | | |
DIRTT Environmental Solutions(a) | | | 865,900 | | | | 3,740,478 | | | |
Home Capital Group, Inc. | | | 175,042 | | | | 5,244,145 | | | |
Richelieu Hardware, Ltd. | | | 262,050 | | | | 4,647,017 | | | |
Sandvine Corp. | | | 857,700 | | | | 1,852,528 | | | |
Stantec, Inc. | | | 158,352 | | | | 4,058,819 | | | |
TransForce, Inc. | | | 196,100 | | | | 3,701,003 | | | |
| | | | | | | |
| | | | | | | 30,133,153 | | | |
| | | | | | | |
| | | |
China (6.70%) | | | | | | | | | | |
BBI Life Sciences Corp.(c) | | | 11,509,500 | | | | 2,270,177 | | | |
China Lesso Group Holdings, Ltd. | | | 4,668,000 | | | | 2,575,648 | | | |
China Medical System Holdings, Ltd. | | | 5,683,000 | | | | 7,399,644 | | | |
Dongpeng Holdings Co., Ltd. | | | 8,743,000 | | | | 4,733,927 | | | |
Le Saunda Holdings, Ltd. | | | 5,405,680 | | | | 1,184,707 | | | |
Man Wah Holdings, Ltd. | | | 11,838,400 | | | | 13,827,161 | | | |
Minth Group, Ltd. | | | 1,515,000 | | | | 3,964,793 | | | |
O2Micro International, Ltd., ADR(a) | | | 1,030,316 | | | | 1,504,261 | | | |
On-Bright Electronics, Inc. | | | 379,000 | | | | 2,003,519 | | | |
Silergy Corp. | | | 358,199 | | | | 4,775,543 | | | |
Sinosoft Technology Group, Ltd. | | | 3,132,000 | | | | 1,711,983 | | | |
Xiabuxiabu Catering Management China Holdings Co., Ltd.(b)(c) | | | 2,004,500 | | | | 1,188,709 | | | |
| | | | | | | |
| | | | | | | 47,140,072 | | | |
| | | | | | | |
| | | |
Colombia (1.32%) | | | | | | | | | | |
Gran Tierra Energy, Inc.(a) | | | 1,178,037 | | | | 3,486,989 | | | |
Parex Resources, Inc.(a) | | | 576,275 | | | | 5,773,314 | | | |
| | | | | | | |
| | | | | | | 9,260,303 | | | |
| | | | | | | |
| | | |
Denmark (0.41%) | | | | | | | | | | |
Ringkjoebing Landbobank A/S | | | 13,763 | | | | 2,892,481 | | | |
| | | | | | | |
| | | |
Egypt (0.10%) | | | | | | | | | | |
Integrated Diagnostics Holdings PLC(b)(c) | | | 154,200 | | | | 717,030 | | | |
| | | | | | | |
| | | |
Finland (0.61%) | | | | | | | | | | |
Aktia Bank OYJ | | | 288,873 | | | | 2,900,889 | | | |
Ferratum OYJ(c) | | | 51,807 | | | | 1,379,228 | | | |
| | | | | | | |
| | | | | | | 4,280,117 | | | |
| | | | | | | |
| | | |
France (3.47%) | | | | | | | | | | |
Alten SA | | | 57,500 | | | | 3,555,382 | | | |
| | |
| See Notes to Financial Statements. | | |
Annual Report | April 30, 2016 | | 43 |
| | |
| Grandeur Peak International Opportunities Fund | | Portfolio of Investments |
| | April 30, 2016 |
| | | | | | | | | | |
| | | Shares | | | Value (Note 2) |
|
France (continued) | | | | | | | | | | |
ARGAN SA, REIT | | | 77,896 | | | $ | 1,984,585 | | | |
Esker SA | | | 92,500 | | | | 3,013,343 | | | |
Infotel SA | | | 45,900 | | | | 1,559,390 | | | |
Medicrea International(a) | | | 193,596 | | | | 1,316,762 | | | |
MGI Digital Graphic Technology(a) | | | 71,550 | | | | 2,498,815 | | | |
Neurones | | | 79,220 | | | | 1,649,124 | | | |
Prodware | | | 268,000 | | | | 1,997,747 | | | |
SoluCom | | | 44,377 | | | | 3,300,871 | | | |
Tessi SA | | | 12,400 | | | | 2,058,801 | | | |
Thermador Groupe | | | 16,307 | | | | 1,491,173 | | | |
| | | | | | | |
| | | | | | | 24,425,993 | | | |
| | | | | | | |
| | | |
Georgia (1.02%) | | | | | | | | | | |
BGEO Group PLC | | | 214,811 | | | | 7,187,652 | | | |
| | | | | | | |
| | | |
Germany (4.24%) | | | | | | | | | | |
Aroundtown Property Holdings PLC(a) | | | 638,500 | | | | 3,202,282 | | | |
CANCOM SE | | | 70,600 | | | | 3,601,851 | | | |
First Sensor AG(a) | | | 191,264 | | | | 2,321,473 | | | |
Nexus AG | | | 275,316 | | | | 4,823,336 | | | |
Norma Group SE | | | 48,103 | | | | 2,473,659 | | | |
PATRIZIA Immobilien
AG(a) | | | 154,459 | | | | 3,577,946 | | | |
publity AG | | | 41,000 | | | | 1,732,347 | | | |
Softing AG | | | 96,691 | | | | 1,544,489 | | | |
Wirecard AG | | | 151,211 | | | | 6,530,134 | | | |
| | | | | | | |
| | | | | | | 29,807,517 | | | |
| | | | | | | |
| | | |
Hong Kong (1.89%) | | | | | | | | | | |
International Housewares Retail Co., Ltd. | | | 10,854,000 | | | | 1,777,073 | | | |
Value Partners Group, Ltd. | | | 8,449,000 | | | | 8,114,717 | | | |
Vitasoy International Holdings, Ltd. | | | 1,797,338 | | | | 3,369,039 | | | |
| | | | | | | |
| | | | | | | 13,260,829 | | | |
| | | | | | | |
| | | |
India (7.15%) | | | | | | | | | | |
AIA Engineering, Ltd. | | | 131,924 | | | | 1,970,805 | | | |
Ajanta Pharma, Ltd. | | | 69,805 | | | | 1,593,844 | | | |
Alkem Laboratories, Ltd. | | | 313,843 | | | | 5,635,027 | | | |
Bajaj Finance, Ltd. | | | 38,226 | | | | 3,935,612 | | | |
City Union Bank, Ltd. | | | 1,976,565 | | | | 2,798,122 | | | |
Credit Analysis & Research, Ltd. | | | 106,300 | | | | 1,620,222 | | | |
Cyient, Ltd. | | | 434,267 | | | | 3,008,378 | | | |
Dewan Housing Finance Corp., Ltd. | | | 1,033,000 | | | | 3,088,254 | | | |
Divi’s Laboratories, Ltd. | | | 133,500 | | | | 2,115,511 | | | |
Hinduja Global Solutions, Ltd. | | | 340,600 | | | | 2,094,795 | | | |
| | | | | | | | | | |
| | | Shares | | | Value (Note 2) |
| | | |
India (continued) | | | | | | | | | | |
Indiabulls Housing Finance, Ltd. | | | 225,000 | | | $ | 2,351,594 | | | |
Jammu & Kashmir Bank, Ltd. | | | 1,821,000 | | | | 1,886,065 | | | |
Kolte-Patil Developers, Ltd. | | | 816,794 | | | | 1,528,179 | | | |
KPIT Technologies, Ltd. | | | 1,038,821 | | | | 2,504,259 | | | |
MBL Infrastructures, Ltd. | | | 580,500 | | | | 1,234,427 | | | |
PC Jeweller, Ltd. | | | 160,067 | | | | 870,197 | | | |
Time Technoplast, Ltd. | | | 4,384,100 | | | | 3,162,659 | | | |
UFO Moviez India, Ltd. | | | 132,458 | | | | 1,021,143 | | | |
Vaibhav Global, Ltd.(a) | | | 258,200 | | | | 1,210,422 | | | |
WNS Holdings, Ltd.,
ADR(a) | | | 209,750 | | | | 6,646,978 | | | |
| | | | | | | |
| | | | | | | 50,276,493 | | | |
| | | | | | | |
| | | |
Indonesia (3.93%) | | | | | | | | | | |
Astra Graphia Tbk PT | | | 10,792,000 | | | | 1,620,273 | | | |
Bank Negara Indonesia Persero Tbk PT | | | 12,030,500 | | | | 4,182,578 | | | |
Bank Tabungan Pensiunan Nasional Tbk PT(a) | | | 2,566,200 | | | | 521,490 | | | |
Bekasi Fajar Industrial Estate Tbk PT | | | 65,215,500 | | | | 1,394,508 | | | |
Indonesia Pondasi Raya Tbk PT(a) | | | 18,859,500 | | | | 2,330,982 | | | |
Lippo Cikarang Tbk PT(a) | | | 2,189,000 | | | | 1,215,835 | | | |
Panin Sekuritas Tbk PT | | | 8,494,000 | | | | 2,157,636 | | | |
Petra Foods, Ltd. | | | 1,854,600 | | | | 3,413,120 | | | |
Selamat Sempurna Tbk PT | | | 16,888,700 | | | | 6,044,485 | | | |
Tempo Scan Pacific Tbk PT | | | 19,383,500 | | | | 2,939,566 | | | |
Ultrajaya Milk Industry & Trading Co. Tbk PT(a) | | | 5,739,500 | | | | 1,821,338 | | | |
| | | | | | | |
| | | | | | | 27,641,811 | | | |
| | | | | | | |
| | | |
Ireland (1.19%) | | | | | | | | | | |
Irish Residential Properties PLC, REIT | | | 6,533,476 | | | | 8,378,898 | | | |
| | | | | | | |
| | | |
Israel (0.66%) | | | | | | | | | | |
Sarine Technologies, Ltd. | | | 1,358,600 | | | | 1,666,870 | | | |
Wix.com, Ltd.(a) | | | 120,075 | | | | 2,968,254 | | | |
| | | | | | | |
| | | | | | | 4,635,124 | | | |
| | | | | | | |
| | | |
Italy (0.76%) | | | | | | | | | | |
Banca Sistema SpA(a)(b)(c) | | | 600,062 | | | | 1,937,626 | | | |
Brembo SpA | | | 62,900 | | | | 3,378,630 | | | |
| | | | | | | |
| | | | | | | 5,316,256 | | | |
| | | | | | | |
| | | |
Japan (12.16%) | | | | | | | | | | |
AIT Corp. | | | 465,700 | | | | 3,934,815 | | | |
Amiyaki Tei Co., Ltd. | | | 53,000 | | | | 2,141,917 | | | |
Anest Iwata Corp. | | | 594,600 | | | | 6,465,716 | | | |
AP Company Co., Ltd.(a) | | | 165,300 | | | | 1,764,857 | | | |
| | |
| See Notes to Financial Statements. | | |
44 | | 1.855.377.7325 | www.GrandeurPeakGlobal.com |
| | |
| Grandeur Peak International Opportunities Fund | | Portfolio of Investments |
| | April 30, 2016 |
| | | | | | | | | | |
| | | Shares | | | Value (Note 2) |
|
Japan (continued) | | | | | | | | | | |
ARCLAND SERVICE Co., Ltd. | | | 55,300 | | | $ | 1,595,592 | | | |
CMIC Holdings Co., Ltd. | | | 181,955 | | | | 2,758,397 | | | |
CyberAgent, Inc. | | | 106,500 | | | | 5,204,887 | | | |
eGuarantee, Inc. | | | 123,700 | | | | 2,773,949 | | | |
Future Architect, Inc. | | | 822,100 | | | | 5,779,425 | | | |
GCA Savvian Corp. | | | 620,200 | | | | 6,009,645 | | | |
Hard Off Corp. Co., Ltd. | | | 289,300 | | | | 4,116,543 | | | |
JCU Corp. | | | 80,300 | | | | 2,611,259 | | | |
M&A Capital Partners Co., Ltd.(a) | | | 130,300 | | | | 2,238,613 | | | |
Medical Data Vision Co., Ltd.(a) | | | 19,200 | | | | 489,384 | | | |
MISUMI Group, Inc. | | | 536,200 | | | | 7,831,342 | | | |
Monogatari Corp. | | | 41,500 | | | | 2,020,395 | | | |
Prestige International, Inc. | | | 490,900 | | | | 5,767,152 | | | |
Quick Co., Ltd. | | | 268,000 | | | | 2,173,722 | | | |
Sawai Pharmaceutical Co., Ltd. | | | 40,000 | | | | 2,661,654 | | | |
SK Kaken Co., Ltd. | | | 31,000 | | | | 2,629,464 | | | |
Syuppin Co., Ltd. | | | 253,600 | | | | 3,088,963 | | | |
Trancom Co., Ltd. | | | 137,790 | | | | 8,417,622 | | | |
Trust Tech, Inc. | | | 227,600 | | | | 3,031,102 | | | |
| | | | | | | |
| | | | | | | 85,506,415 | | | |
| | | | | | | |
| | | |
Luxembourg (1.25%) | | | | | | | | | | |
Grand City Properties SA | | | 187,800 | | | | 4,148,130 | | | |
L’Occitane International SA | | | 2,401,212 | | | | 4,630,991 | | | |
| | | | | | | |
| | | | | | | 8,779,121 | | | |
| | | | | | | |
| | | |
Malaysia (2.16%) | | | | | | | | | | |
7-Eleven Malaysia Holdings Bhd | | | 3,690,000 | | | | 1,312,966 | | | |
AEON Credit Service M Bhd | | | 745,040 | | | | 2,513,664 | | | |
Berjaya Auto Bhd | | | 4,720,000 | | | | 2,658,134 | | | |
Berjaya Food Bhd | | | 2,056,016 | | | | 994,719 | | | |
CB Industrial Product Holding Bhd | | | 3,120,600 | | | | 1,797,350 | | | |
My EG Services Bhd | | | 7,147,600 | | | | 3,677,634 | | | |
Nirvana Asia, Ltd.(b)(c) | | | 7,888,000 | | | | 2,227,013 | | | |
| | | | | | | |
| | | | | | | 15,181,480 | | | |
| | | | | | | |
| | | |
Mexico (1.39%) | | | | | | | | | | |
Banregio Grupo Financiero SAB de CV | | | 560,065 | | | | 3,362,737 | | | |
Credito Real SAB de CV SOFOM ER | | | 2,908,024 | | | | 6,397,614 | | | |
| | | | | | | |
| | | | | | | 9,760,351 | | | |
| | | | | | | |
| | | |
Netherlands (1.01%) | | | | | | | | | | |
Aalberts Industries NV | | | 169,497 | | | | 5,806,952 | | | |
| | | | | | | | | | |
| | | Shares | | | Value (Note 2) |
|
Netherlands (continued) | | | | | | | | | | |
Arcadis NV | | | 77,800 | | | $ | 1,332,265 | | | |
| | | | | | | |
| | | | | | | 7,139,217 | | | |
| | | | | | | |
| | | |
New Zealand (0.26%) | | | | | | | | | | |
CBL Corp., Ltd. | | | 1,073,666 | | | | 1,799,249 | | | |
| | | | | | | |
| | | |
Norway (1.96%) | | | | | | | | | | |
Medistim ASA | | | 420,559 | | | | 2,768,262 | | | |
Skandiabanken ASA(a)(b)(c) | | | 1,179,900 | | | | 6,887,274 | | | |
SpareBank 1 SMN | | | 673,500 | | | | 4,140,446 | | | |
| | | | | | | |
| | | | | | | 13,795,982 | | | |
| | | | | | | |
| | | |
Oman (0.47%) | | | | | | | | | | |
Al Anwar Ceramic Tiles Co. | | | 2,135,760 | | | | 1,497,611 | | | |
Tethys Oil AB | | | 253,500 | | | | 1,815,123 | | | |
| | | | | | | |
| | | | | | | 3,312,734 | | | |
| | | | | | | |
| | | |
Philippines (2.18%) | | | | | | | | | | |
Concepcion Industrial Corp. | | | 2,772,000 | | | | 2,837,771 | | | |
Pepsi-Cola Products Philippines, Inc. | | | 34,685,500 | | | | 2,744,510 | | | |
Puregold Price Club, Inc. | | | 2,756,000 | | | | 2,362,915 | | | |
Security Bank Corp. | | | 2,038,960 | | | | 7,392,657 | | | |
| | | | | | | |
| | | | | | | 15,337,853 | | | |
| | | | | | | |
| | | |
Singapore (0.79%) | | | | | | | | | | |
ARA Asset Management, Ltd. | | | 337,312 | | | | 297,219 | | | |
CSE Global, Ltd. | | | 5,921,055 | | | | 1,893,188 | | | |
Riverstone Holdings, Ltd. | | | 4,622,000 | | | | 3,350,894 | | | |
| | | | | | | |
| | | | | | | 5,541,301 | | | |
| | | | | | | |
| | | |
South Africa (3.11%) | | | | | | | | | | |
Blue Label Telecoms, Ltd. | | | 3,626,500 | | | | 4,004,747 | | | |
Cartrack Holdings, Ltd. | | | 4,849,500 | | | | 3,168,216 | | | |
Clicks Group, Ltd. | | | 273,485 | | | | 1,997,453 | | | |
EOH Holdings, Ltd. | | | 301,756 | | | | 2,936,955 | | | |
Italtile, Ltd. | | | 3,988,625 | | | | 3,544,448 | | | |
MiX Telematics, Ltd., Sponsored ADR | | | 209,800 | | | | 855,984 | | | |
Mr. Price Group, Ltd. | | | 171,600 | | | | 2,179,830 | | | |
OneLogix Group, Ltd. | | | 2,450,980 | | | | 583,680 | | | |
Super Group, Ltd.(a) | | | 788,297 | | | | 2,278,185 | | | |
Transaction Capital, Ltd. | | | 353,000 | | | | 292,612 | | | |
| | | | | | | |
| | | | | | | 21,842,110 | | | |
| | | | | | | |
| | | |
South Korea (3.50%) | | | | | | | | | | |
DGB Financial Group, Inc. | | | 251,500 | | | | 2,024,096 | | | |
Hy-Lok Corp. | | | 286,501 | | | | 7,153,724 | | | |
Interpark Holdings Corp. | | | 358,000 | | | | 2,768,106 | | | |
ISC Co., Ltd. | | | 273,285 | | | | 6,008,240 | | | |
Koh Young Technology, Inc. | | | 73,383 | | | | 2,705,008 | | | |
| | |
| See Notes to Financial Statements. | | |
Annual Report | April 30, 2016 | | 45 |
| | |
| Grandeur Peak International Opportunities Fund | | Portfolio of Investments |
| | April 30, 2016 |
| | | | | | | | | | |
| | | Shares | | | Value (Note 2) |
|
South Korea (continued) | | | | | | | | | | |
Kolao Holdings | | | 173,500 | | | $ | 1,560,800 | | | |
Vitzrocell Co., Ltd. | | | 243,898 | | | | 2,408,156 | | | |
| | | | | | | |
| | | | | | | 24,628,130 | | | |
| | | | | | | |
| | | |
Sweden (3.89%) | | | | | | | | | | |
AddLife AB(a) | | | 113,441 | | | | 1,433,825 | | | |
AddTech AB, Class B | | | 363,013 | | | | 4,565,661 | | | |
Beijer Alma AB | | | 71,800 | | | | 1,694,314 | | | |
Bufab Holding AB | | | 716,600 | | | | 5,599,518 | | | |
HIQ International AB | | | 253,096 | | | | 1,583,731 | | | |
Indutrade AB | | | 67,950 | | | | 3,810,233 | | | |
Moberg Pharma AB(a) | | | 457,200 | | | | 2,766,958 | | | |
Nibe Industrier AB, Class B | | | 98,381 | | | | 3,418,028 | | | |
Odd Molly International AB | | | 72,938 | | | | 333,334 | | | |
Opus Group AB | | | 3,980,568 | | | | 2,151,270 | | | |
| | | | | | | |
| | | | | | | 27,356,872 | | | |
| | | | | | | |
| | | |
Switzerland (1.97%) | | | | | | | | | | |
Leonteq AG | | | 19,200 | | | | 1,335,974 | | | |
Luxoft Holding, Inc.(a) | | | 41,175 | | | | 2,380,327 | | | |
VZ Holding AG | | | 23,980 | | | | 7,461,722 | | | |
Wizz Air Holdings PLC(a)(b)(c) | | | 97,600 | | | | 2,681,037 | | | |
| | | | | | | |
| | | | | | | 13,859,060 | | | |
| | | | | | | |
| | | |
Taiwan (4.47%) | | | | | | | | | | |
ASPEED Technology, Inc. | | | 225,958 | | | | 2,066,710 | | | |
Cub Elecparts, Inc. | | | 142,981 | | | | 1,733,345 | | | |
Materials Analysis Technology, Inc. | | | 1,032,000 | | | | 2,364,580 | | | |
Novatek Microelectronics Corp. | | | 739,000 | | | | 2,589,123 | | | |
Polytronics Technology Corp. | | | 1,130,300 | | | | 2,085,166 | | | |
Sinmag Equipment Corp. | | | 678,810 | | | | 2,251,966 | | | |
Sitronix Technology Corp. | | | 841,000 | | | | 2,461,489 | | | |
Sporton International, Inc. | | | 1,411,507 | | | | 7,746,155 | | | |
Test Research, Inc. | | | 2,114,252 | | | | 2,989,176 | | | |
TSC Auto ID Technology Co., Ltd. | | | 251,100 | | | | 2,249,958 | | | |
UDE Corp. | | | 1,545,000 | | | | 1,437,076 | | | |
Voltronic Power Technology Corp. | | | 91,836 | | | | 1,449,308 | | | |
| | | | | | | |
| | | | | | | 31,424,052 | | | |
| | | | | | | |
| | | |
Thailand (0.73%) | | | | | | | | | | |
Ananda Development PCL | | | 26,514,800 | | | | 2,763,065 | | | |
Premier Marketing PCL | | | 8,478,400 | | | | 2,366,573 | | | |
| | | | | | | |
| | | | | | | 5,129,638 | | | |
| | | | | | | |
| | | |
United Arab Emirates (0.24%) | | | | | | | | | | |
Aramex PJSC | | | 1,855,000 | | | | 1,717,172 | | | |
| | | | | | | |
| | | | | | | | | | |
| | | Shares | | | Value (Note 2) |
|
United States (0.44%) | | | | | | | | | | |
First Cash Financial Services, Inc. | | | 67,025 | | | $ | 3,065,053 | | | |
| | | | | | | |
| | | |
Vietnam (0.07%) | | | | | | | | | | |
DHG Pharmaceutical JSC | | | 126,000 | | | | 477,701 | | | |
| | | | | | | |
| | |
TOTAL COMMON STOCKS (Cost $591,870,570) | | | | 663,932,322 | | | |
| | | | | | | |
| | |
PREFERRED STOCKS (0.38%) | | | | | | | |
Brazil (0.38%) | | | | | | | | | | |
Banco ABC Brasil SA | | | 61,670 | | | | 210,692 | | | |
Banco Daycoval SA | | | 987,600 | | | | 2,432,208 | | | |
| | | | | | | |
| | | | | | | 2,642,900 | | | |
| | | | | | | |
| | |
TOTAL PREFERRED STOCKS (Cost $4,277,088) | | | | 2,642,900 | | | |
| | | | | | | |
| | |
TOTAL INVESTMENTS (94.78%) (Cost $596,147,658) | | | $ | 666,575,222 | | | |
| | |
Other Assets In Excess Of Liabilities (5.22%) | | | | 36,717,610 | | | |
| | | | | | | |
| | |
NET ASSETS (100.00%) | | | $ | 703,292,832 | | | |
| | | | | | | |
| (a) | Non-Income Producing Security. |
| (b) | Security exempt from registration under Rule 144A of the Securities Act of 1933. These securities may be resold in the ordinary course of business in transactions exempt from registration, normally to qualified institutional buyers. As of April 30, 2016, these securities had a total aggregate market value of $18,916,992, representing 2.69% of net assets. |
| (c) | Security was purchased pursuant to Regulation S under the Securities Act of 1933, which exempts securities offered and sold outside of the United States from registration. Such security cannot be sold in the United States without either an effective registration statement filed pursuant to the Securities Act of 1933, or pursuant to an exemption from registration. The security has been deemed liquid under guidelines approved by the Fund’s Board of Trustees. As of April 30, 2016, the aggregate market value of those securities was $22,566,397, representing 3.21% of net assets. |
For Fund compliance purposes, the Fund’s geographical classifications refer to any one or more of the country sub-classifications used by one or more widely recognized market indexes or ratings group indexes, and/or as defined by Fund management. This definition may not apply for purposes of this report, which may combine sub-classifications for reporting ease. Geographical regions are shown as a percentage of net assets.
| | |
| See Notes to Financial Statements. | | |
46 | | 1.855.377.7325 | www.GrandeurPeakGlobal.com |
| | |
| Grandeur Peak International Stalwarts Fund | | Portfolio of Investments |
| | April 30, 2016 |
| | | | | | | | | | |
| | | Shares | | | Value (Note 2) |
|
COMMON STOCKS (91.87%) | | | | | | | | | | |
Australia (0.73%) | | | | | | | | | | |
Magellan Financial Group, Ltd. | | | 63,427 | | | $ | 1,036,874 | | | |
| | | | | | | |
| | | |
Belgium (1.31%) | | | | | | | | | | |
Melexis NV | | | 33,461 | | | | 1,847,527 | | | |
| | | | | | | |
| | | |
Brazil (0.55%) | | | | | | | | | | |
CETIP SA - Mercados Organizados | | | 63,700 | | | | 780,866 | | | |
| | | | | | | |
| | | |
Britain (4.54%) | | | | | | | | | | |
Abcam PLC | | | 83,550 | | | | 721,488 | | | |
B&M European Value Retail SA | | | 272,000 | | | | 1,102,479 | | | |
Close Brothers Group PLC | | | 38,929 | | | | 689,399 | | | |
Diploma PLC | | | 197,400 | | �� | | 2,109,874 | | | |
Ultra Electronics Holdings PLC | | | 68,950 | | | | 1,779,181 | | | |
| | | | | | | |
| | | | | | | 6,402,421 | | | |
| | | | | | | |
| | | |
Canada (8.20%) | | | | | | | | | | |
Gildan Activewear, Inc. | | | 39,088 | | | | 1,214,043 | | | |
Home Capital Group, Inc. | | | 41,238 | | | | 1,235,464 | | | |
Ritchie Bros. Auctioneers, Inc. | | | 82,525 | | | | 2,367,642 | | | |
Stantec, Inc. | | | 114,270 | | | | 2,928,926 | | | |
TransForce, Inc. | | | 202,922 | | | | 3,829,754 | | | |
| | | | | | | |
| | | | | | | 11,575,829 | | | |
| | | | | | | |
| | | |
Chile (0.72%) | | | | | | | | | | |
Banco de Chile | | | 9,270,650 | | | | 1,016,344 | | | |
| | | | | | | |
| | | |
China (5.94%) | | | | | | | | | | |
AAC Technologies Holdings, Inc. | | | 147,500 | | | | 1,025,877 | | | |
China Lesso Group Holdings, Ltd. | | | 1,208,000 | | | | 666,534 | | | |
China Medical System Holdings, Ltd. | | | 1,871,600 | | | | 2,436,948 | | | |
Man Wah Holdings, Ltd. | | | 3,642,100 | | | | 4,253,945 | | | |
| | | | | | | |
| | | | | | | 8,383,304 | | | |
| | | | | | | |
| | | |
Colombia (0.82%) | | | | | | | | | | |
Parex Resources, Inc.(a) | | | 115,200 | | | | 1,154,112 | | | |
| | | | | | | |
| | | |
Egypt (0.39%) | | | | | | | | | | |
Commercial International Bank Egypt SAE | | | 107,703 | | | | 547,978 | | | |
| | | | | | | |
| | | | | | | | | | |
| | | Shares | | | Value (Note 2) |
|
France (1.52%) | | | | | | | | | | |
Alten SA | | | 34,664 | | | $ | 2,143,369 | | | |
| | | |
Germany (4.07%) | | | | | | | | | | |
Aroundtown Property Holdings PLC(a) | | | 199,900 | | | | 1,002,563 | | | |
Norma Group SE | | | 34,950 | | | | 1,797,276 | | | |
PATRIZIA Immobilien AG(a) | | | 57,900 | | | | 1,341,217 | | | |
Wirecard AG | | | 36,950 | | | | 1,595,707 | | | |
| | | | | | | |
| | | | | | | 5,736,763 | | | |
| | | | | | | |
| | | |
Hong Kong (4.88%) | | | | | | | | | | |
Samsonite International SA | | | 434,760 | | | | 1,404,007 | | | |
Value Partners Group, Ltd. | | | 3,830,000 | | | | 3,678,467 | | | |
Vitasoy International Holdings, Ltd. | | | 961,000 | | | | 1,801,356 | | | |
| | | | | | | |
| | | | | | | 6,883,830 | | | |
| | | | | | | |
| | | |
India (7.96%) | | | | | | | | | | |
AIA Engineering, Ltd. | | | 97,400 | | | | 1,455,053 | | | |
Ajanta Pharma, Ltd. | | | 44,500 | | | | 1,016,060 | | | |
Alkem Laboratories, Ltd. | | | 48,674 | | | | 873,938 | | | |
Bajaj Finance, Ltd. | | | 9,025 | | | | 929,182 | | | |
Bajaj Finserv, Ltd. | | | 17,500 | | | | 494,778 | | | |
Colgate-Palmolive India, Ltd. | | | 57,000 | | | | 722,576 | | | |
Divi’s Laboratories, Ltd. | | | 43,000 | | | | 681,400 | | | |
Indiabulls Housing Finance, Ltd. | | | 73,500 | | | | 768,187 | | | |
WNS Holdings, Ltd., ADR(a) | | | 76,100 | | | | 2,411,609 | | | |
Yes Bank, Ltd. | | | 131,950 | | | | 1,875,807 | | | |
| | | | | | | |
| | | | | | | 11,228,590 | | | |
| | | | | | | |
| | | |
Indonesia (2.67%) | | | | | | | | | | |
Bank Negara Indonesia Persero Tbk PT | | | 3,549,200 | | | | 1,233,931 | | | |
Bank Rakyat Indonesia Persero Tbk PT | | | 2,346,500 | | | | 1,841,544 | | | |
Petra Foods, Ltd. | | | 376,600 | | | | 693,077 | | | |
| | | | | | | |
| | | | | | | 3,768,552 | | | |
| | | | | | | |
| | | |
Israel (0.41%) | | | | | | | | | | |
Caesarstone Sdot-Yam,
Ltd.(a) | | | 15,775 | | | | 584,148 | | | |
| | | | | | | |
| | | |
Italy (2.14%) | | | | | | | | | | |
Brembo SpA | | | 56,303 | | | | 3,024,277 | | | |
| | | | | | | |
| | | |
Japan (11.86%) | | | | | | | | | | |
Century Tokyo Leasing Corp. | | | 28,600 | | | | 1,014,709 | | | |
CyberAgent, Inc. | | | 58,900 | | | | 2,878,571 | | | |
MISUMI Group, Inc. | | | 393,900 | | | | 5,753,013 | | | |
| | |
| See Notes to Financial Statements. | | |
Annual Report | April 30, 2016 | | 47 |
| | |
| Grandeur Peak International Stalwarts Fund | | Portfolio of Investments |
| | April 30, 2016 |
| | | | | | | | | | |
| | | Shares | | | Value (Note 2) |
|
Japan (continued) | | | | | | | | | | |
Nihon M&A Center, Inc. | | | 41,900 | | | $ | 2,496,673 | | | |
Sawai Pharmaceutical Co., Ltd. | | | 23,100 | | | | 1,537,105 | | | |
Seria Co., Ltd. | | | 15,500 | | | | 922,134 | | | |
Suruga Bank, Ltd. | | | 104,800 | | | | 2,127,519 | | | |
| | | | | | | |
| | | | | | | 16,729,724 | | | |
| | | | | | | |
| | | |
Luxembourg (2.83%) | | | | | | | | | | |
Grand City Properties SA | | | 98,400 | | | | 2,173,461 | | | |
L’Occitane International SA | | | 946,000 | | | | 1,824,461 | | | |
| | | | | | | |
| | | | | | | 3,997,922 | | | |
| | | | | | | |
| | | |
Mexico (1.36%) | | | | | | | | | | |
Banregio Grupo Financiero SAB de CV | | | 320,550 | | | | 1,924,643 | | | |
| | | | | | | |
| | | |
Netherlands (2.55%) | | | | | | | | | | |
Aalberts Industries NV | | | 75,985 | | | | 2,603,239 | | | |
Arcadis NV | | | 57,980 | | | | 992,863 | | | |
| | | | | | | |
| | | | | | | 3,596,102 | | | |
| | | | | | | |
| | | |
Philippines (4.77%) | | | | | | | | | | |
Puregold Price Club, Inc. | | | 2,868,200 | | | | 2,459,112 | | | |
Robinsons Retail Holdings, Inc. | | | 1,156,320 | | | | 1,898,942 | | | |
Security Bank Corp. | | | 654,200 | | | | 2,371,933 | | | |
| | | | | | | |
| | | | | | | 6,729,987 | | | |
| | | | | | | |
| | | |
South Africa (2.20%) | | | | | | | | | | |
EOH Holdings, Ltd. | | | 182,000 | | | | 1,771,384 | | | |
Mr. Price Group, Ltd. | | | 104,900 | | | | 1,332,542 | | | |
| | | | | | | |
| | | | | | | 3,103,926 | | | |
| | | | | | | |
| | | |
South Korea (0.99%) | | | | | | | | | | |
DGB Financial Group, Inc. | | | 172,950 | | | | 1,391,918 | | | |
| | | | | | | |
| | | |
Sweden (4.85%) | | | | | | | | | | |
Hexpol AB | | | 170,225 | | | | 1,759,388 | | | |
Indutrade AB | | | 32,850 | | | | 1,842,033 | | | |
Nibe Industrier AB, Class B | | | 41,100 | | | | 1,427,928 | | | |
Svenska Handelsbanken AB, Class A | | | 136,700 | | | | 1,819,727 | | | |
| | | | | | | |
| | | | | | | 6,849,076 | | | |
| | | | | | | |
| | | |
Switzerland (5.13%) | | | | | | | | | | |
Baloise Holding AG | | | 12,900 | | | | 1,596,195 | | | |
Leonteq AG | | | 16,300 | | | | 1,134,187 | | | |
Luxoft Holding, Inc.(a) | | | 18,825 | | | | 1,088,273 | | | |
VZ Holding AG | | | 7,539 | | | | 2,345,868 | | | |
| | | | | | | | | | |
| | | Shares | | | Value (Note 2) |
|
Switzerland (continued) | | | | | | | | | | |
Wizz Air Holdings
PLC(a)(b)(c) | | | 39,000 | | | $ | 1,071,316 | | | |
| | | | | | | |
| | | | | | | 7,235,839 | | | |
| | | | | | | |
| | | |
Taiwan (4.66%) | | | | | | | | | | |
Catcher Technology Co., Ltd. | | | 234,000 | | | | 1,646,917 | | | |
Chailease Holding Co., Ltd. | | | 769,000 | | | | 1,292,277 | | | |
Largan Precision Co., Ltd. | | | 24,000 | | | | 1,689,145 | | | |
Novatek Microelectronics Corp. | | | 270,000 | | | | 945,958 | | | |
Vanguard International Semiconductor Corp. | | | 654,000 | | | | 1,002,707 | | | |
| | | | | | | |
| | | | | | | 6,577,004 | | | |
| | | | | | | |
| | | |
United States (2.93%) | | | | | | | | | | |
EPAM Systems, Inc.(a) | | | 19,400 | | | | 1,414,842 | | | |
Genpact, Ltd.(a) | | | 63,050 | | | | 1,758,464 | | | |
Syntel, Inc.(a) | | | 22,450 | | | | 954,799 | | | |
| | | | | | | |
| | | | | | | 4,128,105 | | | |
| | | | | | | |
| | | |
Vietnam (0.89%) | | | | | | | | | | |
Vietnam Dairy Products JSC | | | 200,370 | | | | 1,249,616 | | | |
| | | | | | | |
| | |
TOTAL COMMON STOCKS (Cost $123,241,971) | | | | 129,628,646 | | | |
| | | | | | | |
| |
PREFERRED STOCKS (1.19%) | | | |
Brazil (1.19%) | | | | | | | | | | |
Itau Unibanco Holding SA | | | 174,700 | | | | 1,671,187 | | | |
| | | | | | | |
| | |
TOTAL PREFERRED STOCKS (Cost $1,180,530) | | | | 1,671,187 | | | |
| | | | | | | |
| | |
TOTAL INVESTMENTS (93.06%) (Cost $124,422,501) | | | $ | 131,299,833 | | | |
| | |
Other Assets In Excess Of Liabilities (6.94%) | | | | 9,798,006 | | | |
| | | | | | | |
| | |
NET ASSETS (100.00%) | | | $ | 141,097,839 | | | |
| | | | | | | |
| (a) | Non-Income Producing Security. |
| (b) | Security exempt from registration under Rule 144A of the Securities Act of 1933. These securities may be resold in the ordinary course of business in transactions exempt from registration, normally to qualified institutional buyers. As of April 30, 2016, these securities had a total aggregate market value of $1,071,316, representing 0.76% of net assets. |
| | |
| See Notes to Financial Statements. | | |
48 | | 1.855.377.7325 | www.GrandeurPeakGlobal.com |
| | |
| Grandeur Peak International Stalwarts Fund | | Portfolio of Investments |
| | April 30, 2016 |
| (c) | Security was purchased pursuant to Regulation S under the Securities Act of 1933, which exempts securities offered and sold outside of the United States from registration. Such security cannot be sold in the United States without either an effective registration statement filed pursuant to the Securities Act of 1933, or pursuant to an exemption from registration. The security has been deemed liquid under guidelines approved by the Fund’s Board of Trustees. As of April 30, 2016, the aggregate market value of those securities was $1,071,316, representing 0.76% of net assets. |
For Fund compliance purposes, the Fund’s geographical classifications refer to any one or more of the country sub-classifications used by one or more widely recognized market indexes or ratings group indexes, and/or as defined by Fund management. This definition may not apply for purposes of this report, which may combine sub-classifications for reporting ease. Geographical regions are shown as a percentage of net assets.
| | |
| See Notes to Financial Statements. | | |
Annual Report | April 30, 2016 | | 49 |
| | |
| Grandeur Peak Funds® | | Statements of Assets and Liabilities |
| | April 30, 2016 |
| | | | | | | | | | | | | | | | |
| | | Grandeur Peak | | | Grandeur Peak | | | Grandeur Peak | | | | |
| | | Emerging Markets | | | Global Micro Cap | | | Global Opportunities | | | Grandeur Peak | |
| | | Opportunities Fund | | | Fund | | | Fund | | | Global Reach Fund | |
ASSETS | | | | | | | | | | | | | | | | |
Investments, at value (Cost - see below) | | $ | 340,111,326 | | | $ | 30,214,331 | | | $ | 612,143,336 | | | $ | 282,747,206 | |
Cash | | | 29,292,044 | | | | 532,096 | | | | 12,012,755 | | | | 5,560,207 | |
Foreign cash, at value
(Cost $405,175, $344,567, $2,069,783 and $479,962, respectively) | | | 405,349 | | | | 347,047 | | | | 2,083,369 | | | | 489,350 | |
Dividends and interest receivable | | | 374,141 | | | | 75,599 | | | | 1,279,547 | | | | 454,070 | |
Receivable for investments sold | | | 1,837,210 | | | | 83,182 | | | | 1,406,812 | | | | 1,261,835 | |
Receivable for fund shares subscribed | | | 269,400 | | | | – | | | | 79,760 | | | | 50,845 | |
Deferred offering cost | | | – | | | | 28,369 | | | | – | | | | – | |
Prepaid and other assets | | | 14,340 | | | | 2,906 | | | | 11,849 | | | | 4,863 | |
Total assets | | | 372,303,810 | | | | 31,283,530 | | | | 629,017,428 | | | | 290,568,376 | |
| | | | |
LIABILITIES | | | | | | | | | | | | | | | | |
Payable for investments purchased | | | 952,441 | | | | 433,919 | | | | 2,823,003 | | | | 1,012,098 | |
Foreign capital gains tax | | | 67,101 | | | | – | | | | – | | | | – | |
Payable for fund shares redeemed | | | 683,683 | | | | 35,262 | | | | 191,988 | | | | 403,651 | |
Advisory fees payable | | | 408,879 | | | | 38,635 | | | | 637,544 | | | | 288,786 | |
Administration fees payable | | | 22,066 | | | | 4,526 | | | | 32,017 | | | | 24,671 | |
Custodian fees payable | | | 62,976 | | | | 11,508 | | | | 46,243 | | | | 36,337 | |
Payable for trustee fees and expenses | | | 2,331 | | | | 190 | | | | 3,975 | | | | 1,861 | |
Payable for chief compliance officer fee | | | 762 | | | | 62 | | | | 1,299 | | | | 609 | |
Payable for principal financial officer fees | | | 139 | | | | 11 | | | | 236 | | | | 111 | |
Distribution and service fees payable | | | 4,420 | | | | – | | | | 35,950 | | | | 13,555 | |
Payable for transfer agency fees | | | 3,850 | | | | 3,725 | | | | 10,384 | | | | 7,299 | |
Accrued expenses and other liabilities | | | 54,413 | | | | 20,238 | | | | 48,658 | | | | 36,065 | |
Total liabilities | | | 2,263,061 | | | | 548,076 | | | | 3,831,297 | | | | 1,825,043 | |
NET ASSETS | | $ | 370,040,749 | | | $ | 30,735,454 | | | $ | 625,186,131 | | | $ | 288,743,333 | |
| | |
| | | | |
NET ASSETS CONSISTS OF | | | | | | | | | | | | | | | | |
Paid-in capital (Note 5) | | $ | 394,287,232 | | | $ | 29,441,489 | | | $ | 551,068,706 | | | $ | 288,163,243 | |
Accumulated net investment income/(loss) | | | 895,515 | | | | (13,704) | | | | (666,687) | | | | (102,771) | |
Accumulated net realized loss | | | (13,448,955) | | | | (87,986) | | | | (119,091) | | | | (13,165,285) | |
Net unrealized appreciation/(depreciation) | | | (11,693,043) | | | | 1,395,655 | | | | 74,903,203 | | | | 13,848,146 | |
NET ASSETS | | $ | 370,040,749 | | | $ | 30,735,454 | | | $ | 625,186,131 | | | $ | 288,743,333 | |
| | |
| | | | |
INVESTMENTS, AT COST | | $ | 351,754,150 | | | $ | 28,823,022 | | | $ | 537,250,442 | | | $ | 268,911,691 | |
| | | | |
PRICING OF SHARES | | | | | | | | | | | | | | | | |
Investor Class | | | | | | | | | | | | | | | | |
Net Assets | | $ | 20,547,706 | | | $ | – | | | $ | 173,156,063 | | | $ | 66,983,920 | |
Net Asset Value, offering and redemption price per share | | $ | 9.82 | | | $ | – | | | $ | 3.01 | | | $ | 12.31 | |
Shares of beneficial interest outstanding | | | 2,092,573 | | | | – | | | | 57,575,439 | | | | 5,439,594 | |
Institutional Class | | | | | | | | | | | | | | | | |
Net Assets | | $ | 349,493,043 | | | $ | 30,735,454 | | | $ | 452,030,068 | | | $ | 221,759,413 | |
Net Asset Value, offering and redemption price per share | | $ | 9.85 | | | $ | 10.38 | | | $ | 3.03 | | | $ | 12.33 | |
Shares of beneficial interest outstanding | | | 35,465,075 | | | | 2,959,868 | | | | 148,977,297 | | | | 17,988,216 | |
| | |
| See Notes to Financial Statements. | | |
50 | | 1.855.377.7325 | www.GrandeurPeakGlobal.com |
| | |
| Grandeur Peak Funds® | | Statements of Assets and Liabilities |
| | April 30, 2016 |
| | | | | | | | | | | | | | |
| | | Grandeur Peak | | | Grandeur Peak | | | Grandeur Peak | | | |
| | | Global Stalwarts | | | International | | | International | | | |
| | | Fund | | | Opportunities Fund | | | Stalwarts Fund | | | |
ASSETS | | | | | | | | | | | | | | |
Investments, at value (Cost - see below) | | $ | 34,274,517 | | | $ | 666,575,222 | | | $ | 131,299,833 | | | |
Cash | | | 2,062,712 | | | | 28,612,780 | | | | 6,320,053 | | | |
Foreign cash, at value
(Cost $59,729, $1,360,918 and $335,257, respectively) | | | 60,648 | | | | 1,354,872 | | | | 336,151 | | | |
Dividends and interest receivable | | | 52,320 | | | | 1,770,940 | | | | 274,985 | | | |
Receivable for investments sold | | | 378,848 | | | | 6,813,516 | | | | 2,865,544 | | | |
Receivable for fund shares subscribed | | | 11,346 | | | | 60,328 | | | | 330,896 | | | |
Deferred offering cost | | | 22,793 | | | | – | | | | 23,592 | | | |
Prepaid and other assets | | | 2,987 | | | | 12,281 | | | | 1,840 | | | |
Total assets | | | 36,866,171 | | | | 705,199,939 | | | | 141,452,894 | | | |
| | | | |
LIABILITIES | | | | | | | | | | | | | | |
Payable for investments purchased | | | 61,216 | | | | 856,642 | | | | 56,126 | | | |
Foreign capital gains tax | | | 24,016 | | | | – | | | | 132,482 | | | |
Payable for fund shares redeemed | | | – | | | | 144,334 | | | | 15,290 | | | |
Advisory fees payable | | | 39,594 | | | | 721,749 | | | | 81,824 | | | |
Administration fees payable | | | 4,766 | | | | 35,793 | | | | 7,721 | | | |
Custodian fees payable | | | 14,484 | | | | 59,706 | | | | 17,529 | | | |
Payable for trustee fees and expenses | | | 222 | | | | 4,553 | | | | 887 | | | |
Payable for chief compliance officer fee | | | 72 | | | | 1,488 | | | | 290 | | | |
Payable for principal financial officer fees | | | 13 | | | | 271 | | | | 53 | | | |
Distribution and service fees payable | | | 3,776 | | | | 25,282 | | | | 4,471 | | | |
Payable for transfer agency fees | | | 4,514 | | | | 7,518 | | | | 3,776 | | | |
Accrued expenses and other liabilities | | | 20,160 | | | | 49,771 | | | | 34,606 | | | |
Total liabilities | | | 172,833 | | | | 1,907,107 | | | | 355,055 | | | |
NET ASSETS | | $ | 36,693,338 | | | $ | 703,292,832 | | | $ | 141,097,839 | | | |
| | | | | | | | | | | | | | | |
| | | | |
NET ASSETS CONSISTS OF | | | | | | | | | | | | | | |
Paid-in capital (Note 5) | | $ | 34,688,405 | | | $ | 633,758,554 | | | $ | 135,566,984 | | | |
Accumulated net investment income | | | 108,751 | | | | 286,799 | | | | 628,490 | | | |
Accumulated net realized loss | | | (388,639) | | | | (1,234,415) | | | | (1,860,931) | | | |
Net unrealized appreciation | | | 2,284,821 | | | | 70,481,894 | | | | 6,763,296 | | | |
NET ASSETS | | $ | 36,693,338 | | | $ | 703,292,832 | | | $ | 141,097,839 | | | |
| | | | | | | | | | | | | | | |
| | | | |
INVESTMENTS, AT COST | | $ | 31,968,790 | | | $ | 596,147,658 | | | $ | 124,422,501 | | | |
| | | | |
PRICING OF SHARES | | | | | | | | | | | | | | |
Investor Class | | | | | | | | | | | | | | |
Net Assets | | $ | 19,131,409 | | | $ | 123,921,553 | | | $ | 22,027,885 | | | |
Net Asset Value, offering and redemption price per share | | $ | 10.85 | | | $ | 3.09 | | | $ | 11.02 | | | |
Shares of beneficial interest outstanding | | | 1,762,740 | | | | 40,064,701 | | | | 1,999,012 | | | |
Institutional Class | | | | | | | | | | | | | | |
Net Assets | | $ | 17,561,929 | | | $ | 579,371,279 | | | $ | 119,069,954 | | | |
Net Asset Value, offering and redemption price per share | | $ | 10.87 | | | $ | 3.11 | | | $ | 11.03 | | | |
Shares of beneficial interest outstanding | | | 1,615,419 | | | | 186,571,815 | | | | 10,797,609 | | | |
| | |
| See Notes to Financial Statements. | | |
Annual Report | April 30, 2016 | | 51 |
| | |
| Grandeur Peak Funds® | | Statements of Operations |
| | For the Year or Period Ended April 30, 2016 |
| | | | | | | | | | | | | | | | |
| | | Grandeur Peak | | | Grandeur Peak | | | Grandeur Peak | | | | |
| | | Emerging Markets | | | Global Micro Cap | | | Global Opportunities | | | Grandeur Peak | |
| | | Opportunities Fund | | | Fund(a) | | | Fund | | | Global Reach Fund | |
INVESTMENT INCOME | | | | | | | | | | | | | | | | |
Dividends | | $ | 10,030,451 | | | $ | 255,842 | | | $ | 11,834,876 | | | $ | 5,665,205 | |
Interest | | | 76 | | | | 3 | | | | – | | | | 170 | |
Foreign taxes withheld | | | (919,008) | | | | (21,459) | | | | (887,519) | | | | (441,318) | |
Total investment income | | | 9,111,519 | | | | 234,386 | | | | 10,947,357 | | | | 5,224,057 | |
| | | | |
EXPENSES | | | | | | | | | | | | | | | | |
Investment advisor fees (Note 6) | | | 5,310,667 | | | | 220,495 | | | | 8,165,731 | | | | 3,407,429 | |
Recoupment of previously waived fees (Note 6) | | | – | | | | – | | | | – | | | | 144,124 | |
Administrative fees | | | 159,399 | | | | 9,004 | | | | 254,152 | | | | 141,581 | |
Distribution and service fees - Investor Class | | | 62,453 | | | | – | | | | 431,729 | | | | 176,793 | |
Transfer agent fees | | | 39,060 | | | | 19,195 | | | | 87,151 | | | | 66,115 | |
Professional fees | | | 76,256 | | | | 21,227 | | | | 58,909 | | | | 59,504 | |
Printing fees | | | 16,010 | | | | 2,227 | | | | 43,058 | | | | 26,508 | |
Registration fees | | | 40,899 | | | | 4,853 | | | | 32,782 | | | | 37,422 | |
Custodian fees | | | 431,467 | | | | 44,671 | | | | 315,028 | | | | 266,115 | |
Trustee fees and expenses | | | 10,285 | | | | 570 | | | | 17,152 | | | | 8,138 | |
Chief compliance officer fees | | | 8,793 | | | | 377 | | | | 14,638 | | | | 6,942 | |
Principal financial officer fees | | | 1,782 | | | | 69 | | | | 2,958 | | | | 1,404 | |
Offering costs | | | – | | | | 13,789 | | | | – | | | | – | |
Other expenses | | | 17,325 | | | | 2,077 | | | | 26,193 | | | | 15,014 | |
Total expenses | | | 6,174,396 | | | | 338,554 | | | | 9,449,481 | | | | 4,357,089 | |
Less fees waived/reimbursed by investment advisor (Note 6) | | | – | | | | (44,561) | | | | – | | | | – | |
NET INVESTMENT INCOME/(LOSS) | | | 2,937,123 | | | | (59,607) | | | | 1,497,876 | | | | 866,968 | |
| | | | |
REALIZED AND UNREALIZED GAIN/(LOSS) ON INVESTMENTS | | | | | | | | | | | | | | | | |
Net realized gain/(loss) on investments | | | (6,454,920) | | | | (87,987) | | | | 16,958,417 | | | | (10,247,128) | |
Net realized loss on foreign currency transactions | | | (287,775) | | | | (9,737) | | | | (200,129) | | | | (145,330) | |
Net change in unrealized appreciation/(depreciation) on investments (net of foreign capital gains tax of $(531,696), $–, $(725,970) and $(411,508), respectively) | | | (50,778,596) | | | | 1,391,309 | | | | (56,991,664) | | | | (14,063,953) | |
Net change in unrealized appreciation/(depreciation) on translation of assets and liabilities in foreign currencies | | | 3,949 | | | | 4,346 | | | | 17,443 | | | | (1,559) | |
NET REALIZED AND UNREALIZED GAIN/(LOSS) ON INVESTMENTS AND FOREIGN CURRENCY TRANSACTIONS | | | (57,517,342) | | | | 1,297,931 | | | | (40,215,933) | | | | (24,457,970) | |
NET INCREASE/(DECREASE) IN NET ASSETS RESULTING FROM OPERATIONS | | $ | (54,580,219) | | | $ | 1,238,324 | | | $ | (38,718,057) | | | $ | (23,591,002) | |
| | | | | | | | | | | | | | | | | |
| (a) | Represents the period October 21, 2015 (commencement of operations) to April 30, 2016. |
| | |
| See Notes to Financial Statements. | | |
52 | | 1.855.377.7325 | www.GrandeurPeakGlobal.com |
| | |
| Grandeur Peak Funds® | | Statements of Operations |
| | For the Year or Period Ended April 30, 2016 |
| | | | | | | | | | | | |
| | | Grandeur Peak | | | Grandeur Peak | | | Grandeur Peak | |
| | | Global Stalwarts | | | International | | | International | |
| | | Fund(a) | | | Opportunities Fund | | | Stalwarts Fund(a) | |
INVESTMENT INCOME | | | | | | | | | | | | |
Dividends | | $ | 220,241 | | | $ | 17,032,769 | | | $ | 998,487 | |
Interest | | | – | | | | 2,450 | | | | – | |
Foreign taxes withheld | | | (16,858) | | | | (1,500,412) | | | | (91,893) | |
Total investment income | | | 203,383 | | | | 15,534,807 | | | | 906,594 | |
| | | |
EXPENSES | | | | | | | | | | | | |
Investment advisor fees (Note 6) | | | 121,516 | | | | 9,535,702 | | | | 422,911 | |
Recoupment of previously waived fees (Note 6) | | | – | | | | – | | | | – | |
Administrative fees | | | 10,033 | | | | 294,627 | | | | 23,565 | |
Distribution and service fees - Investor Class | | | 19,864 | | | | 339,866 | | | | 18,387 | |
Transfer agent fees | | | 24,127 | | | | 66,257 | | | | 21,601 | |
Professional fees | | | 17,820 | | | | 63,162 | | | | 22,294 | |
Printing fees | | | 1,997 | | | | 30,734 | | | | 2,297 | |
Registration fees | | | 3,804 | | | | 32,511 | | | | 13,417 | |
Custodian fees | | | 65,029 | | | | 428,608 | | | | 88,697 | |
Trustee fees and expenses | | | 569 | | | | 20,033 | | | | 2,000 | |
Chief compliance officer fees | | | 389 | | | | 17,153 | | | | 1,367 | |
Principal financial officer fees | | | 71 | | | | 3,467 | | | | 249 | |
Offering costs | | | 30,658 | | | | – | | | | 31,113 | |
Other expenses | | | 3,222 | | | | 29,643 | | | | 3,459 | |
Total expenses | | | 299,099 | | | | 10,861,763 | | | | 651,357 | |
Less fees waived/reimbursed by investment advisor (Note 6) | | | (112,151) | | | | – | | | | (51,467) | |
NET INVESTMENT INCOME | | | 16,435 | | | | 4,673,044 | | | | 306,704 | |
| | | |
REALIZED AND UNREALIZED GAIN/(LOSS) ON INVESTMENTS | | | | | | | | | | | | |
Net realized loss on investments | | | (379,184) | | | | (1,178,156) | | | | (1,861,968) | |
Net realized gain/(loss) on foreign currency transactions | | | 62,597 | | | | (222,466) | | | | 320,527 | |
Net change in unrealized appreciation/(depreciation) on investments (net of foreign capital gains tax of $24,016, $(730,034) and $132,482, respectively) | | | 2,281,711 | | | | (51,592,486) | | | | 6,744,850 | |
Net change in unrealized appreciation/(depreciation) on translation of assets and liabilities in foreign currencies | | | 3,110 | | | | (60,543) | | | | 18,446 | |
NET REALIZED AND UNREALIZED GAIN/(LOSS) ON INVESTMENTS AND FOREIGN CURRENCY TRANSACTIONS | | | 1,968,234 | | | | (53,053,651) | | | | 5,221,855 | |
NET INCREASE/(DECREASE) IN NET ASSETS RESULTING FROM OPERATIONS | | $ | 1,984,669 | | | $ | (48,380,607) | | | $ | 5,528,559 | |
| | | | | | | | | | | | | |
| (a) | Represents the period September 2, 2015 (commencement of operations) to April 30, 2016. |
| | |
| See Notes to Financial Statements. | | |
Annual Report | April 30, 2016 | | 53 |
| | |
| Grandeur Peak Emerging Markets Opportunities Fund | | Statements of Changes in Net Assets |
| | | | | | | | | | |
| | | For the | | | For the | | | |
| | | Year Ended | | | Year Ended | | | |
| | | April 30, 2016 | | | April 30, 2015 | | | |
OPERATIONS | | | | | | | | | | |
Net investment income | | $ | 2,937,123 | | | $ | 1,653,817 | | | |
Net realized gain/(loss) | | | (6,742,695) | | | | 12,553,431 | | | |
Net change in unrealized appreciation/(depreciation) | | | (50,774,647) | | | | 29,470,012 | | | |
Net increase/(decrease) in net assets resulting from operations | | | (54,580,219) | | | | 43,677,260 | | | |
| | | |
DISTRIBUTIONS TO SHAREHOLDERS (NOTE 3) | | | | | | | | | | |
Net investment income | | | | | | | | | | |
Investor Class | | | – | | | | (54,833) | | | |
Institutional Class | | | – | | | | (1,137,527) | | | |
Net realized gains on investments | | | | | | | | | | |
Investor Class | | | (784,769) | | | | (924,569) | | | |
Institutional Class | | | (12,306,838) | | | | (8,862,626) | | | |
Net decrease in net assets from distributions | | | (13,091,607) | | | | (10,979,555) | | | |
| | | |
CAPITAL SHARE TRANSACTIONS (NOTE 5) | | | | | | | | | | |
Investor Class | | | | | | | | | | |
Proceeds from sales of shares | | | 1,471,368 | | | | 18,678,785 | | | |
Distributions reinvested | | | 766,668 | | | | 967,793 | | | |
Cost of shares redeemed | | | (16,030,060) | | | | (10,477,031) | | | |
Redemption fees | | | 2,624 | | | | 723 | | | |
Net increase/(decrease) from capital shares transactions | | | (13,789,400) | | | | 9,170,270 | | | |
| | | |
Institutional Class | | | | | | | | | | |
Proceeds from sales of shares | | | 11,860,125 | | | | 142,994,927 | | | |
Distributions reinvested | | | 11,059,498 | | | | 9,195,374 | | | |
Cost of shares redeemed | | | (39,363,942) | | | | (9,885,549) | | | |
Redemption fees | | | 1,324 | | | | 1,347 | | | |
Net increase/(decrease) from capital shares transactions | | | (16,442,995) | | | | 142,306,099 | | | |
| | | |
Net increase/(decrease) in net assets | | | (97,904,221) | | | | 184,174,074 | | | |
| | | |
NET ASSETS | | | | | | | | | | |
Beginning of year | | | 467,944,970 | | | | 283,770,896 | | | |
End of year* | | $ | 370,040,749 | | | $ | 467,944,970 | | | |
| | | | | | | | | | | |
| | | |
*Including accumulated net investment income/(loss) of: | | $ | 895,515 | | | $ | (1,379,046) | | | |
| | | |
OTHER INFORMATION | | | | | | | | | | |
Shares Transactions | | | | | | | | | | |
Investor Class | | | | | | | | | | |
Issued | | | 144,484 | | | | 1,678,743 | | | |
Issued to shareholders in reinvestment of distributions | | | 79,530 | | | | 92,083 | | | |
Redeemed | | | (1,598,285) | | | | (959,085) | | | |
Net increase/(decrease) in share transactions | | | (1,374,271) | | | | 811,741 | | | |
| | | | | | | | | | | |
| | | |
Institutional Class | | | | | | | | | | |
Issued | | | 1,186,242 | | | | 12,912,043 | | | |
Issued to shareholders in reinvestment of distributions | | | 1,143,692 | | | | 874,085 | | | |
Redeemed | | | (4,011,166) | | | | (914,887) | | | |
Net increase/(decrease) in share transactions | | | (1,681,232) | | | | 12,871,241 | | | |
| | | | | | | | | | | |
| | |
| See Notes to Financial Statements. | | |
54 | | 1.855.377.7325 | www.GrandeurPeakGlobal.com |
| | |
| Grandeur Peak Global Micro Cap Fund | | Statement of Changes in Net Assets |
| | | | |
| | | For the Period | |
| | | October 21, 2015 | |
| | | (Commencement | |
| | | of Operations) to | |
| | | April 30, 2016 | |
OPERATIONS | | | | |
Net investment loss | | $ | (59,607) | |
Net realized loss | | | (97,724) | |
Net change in unrealized appreciation | | | 1,395,655 | |
Net increase in net assets resulting from operations | | | 1,238,324 | |
| |
CAPITAL SHARE TRANSACTIONS (NOTE 5) | | | | |
Institutional Class | | | | |
Proceeds from sales of shares | | | 31,071,815 | |
Cost of shares redeemed | | | (1,575,834) | |
Redemption fees | | | 1,149 | |
Net increase from capital shares transactions | | | 29,497,130 | |
| |
Net increase in net assets | | | 30,735,454 | |
| |
NET ASSETS | | | | |
Beginning of period | | | – | |
End of period* | | $ | 30,735,454 | |
| | | | | |
| |
*Including accumulated net investment loss of: | | $ | (13,704) | |
| |
OTHER INFORMATION | | | | |
Shares Transactions | | | | |
Institutional Class | | | | |
Issued | | | 3,118,442 | |
Redeemed | | | (158,574) | |
Net increase in share transactions | | | 2,959,868 | |
| | | | | |
| | |
| See Notes to Financial Statements. | | |
Annual Report | April 30, 2016 | | 55 |
| | |
| Grandeur Peak Global Opportunities Fund | | Statements of Changes in Net Assets |
| | | | | | | | | | |
| | | For the | | | For the | | | |
| | | Year Ended | | | Year Ended | | | |
| | | April 30, 2016 | | | April 30, 2015 | | | |
OPERATIONS | | | | | | | | | | |
Net investment income | | $ | 1,497,876 | | | $ | 1,998,221 | | | |
Net realized gain | | | 16,758,288 | | | | 64,188,443 | | | |
Net change in unrealized appreciation/(depreciation) | | | (56,974,221) | | | | 8,724,491 | | | |
Net increase/(decrease) in net assets resulting from operations | | | (38,718,057) | | | | 74,911,155 | | | |
| | | |
DISTRIBUTIONS TO SHAREHOLDERS (NOTE 3) | | | | | | | | | | |
Net investment income | | | | | | | | | | |
Investor Class | | | (109,124) | | | | (418,468) | | | |
Institutional Class | | | (1,035,196) | | | | (1,900,259) | | | |
Net realized gains on investments | | | | | | | | | | |
Investor Class | | | (13,697,007) | | | | (12,966,230) | | | |
Institutional Class | | | (34,852,047) | | | | (32,097,504) | | | |
Net decrease in net assets from distributions | | | (49,693,374) | | | | (47,382,461) | | | |
| | | |
CAPITAL SHARE TRANSACTIONS (NOTE 5) | | | | | | | | | | |
Investor Class | | | | | | | | | | |
Proceeds from sales of shares | | | 16,451,459 | | | | 12,505,211 | | | |
Distributions reinvested | | | 13,160,455 | | | | 12,613,027 | | | |
Cost of shares redeemed | | | (33,495,791) | | | | (47,705,840) | | | |
Redemption fees | | | 981 | | | | 1,678 | | | |
Net decrease from capital shares transactions | | | (3,882,896) | | | | (22,585,924) | | | |
| | | |
Institutional Class | | | | | | | | | | |
Proceeds from sales of shares | | | 21,799,233 | | | | 35,606,279 | | | |
Distributions reinvested | | | 34,499,590 | | | | 32,205,349 | | | |
Cost of shares redeemed | | | (66,675,634) | | | | (54,015,246) | | | |
Redemption fees | | | 663 | | | | 1,133 | | | |
Net increase/(decrease) from capital shares transactions | | | (10,376,148) | | | | 13,797,515 | | | |
| | | |
Net increase/(decrease) in net assets | | | (102,670,475) | | | | 18,740,285 | | | |
| | | |
NET ASSETS | | | | | | | | | | |
Beginning of year | | | 727,856,606 | | | | 709,116,321 | | | |
End of year* | | $ | 625,186,131 | | | $ | 727,856,606 | | | |
| | | | | | | | | | | |
| | | |
*Including accumulated net investment loss of: | | $ | (666,687) | | | $ | (687,723) | | | |
| | | |
OTHER INFORMATION | | | | | | | | | | |
Shares Transactions | | | | | | | | | | |
Investor Class | | | | | | | | | | |
Issued | | | 5,378,903 | | | | 3,751,583 | | | |
Issued to shareholders in reinvestment of distributions | | | 4,386,818 | | | | 3,966,361 | | | |
Redeemed | | | (10,866,076) | | | | (14,276,987) | | | |
Net decrease in share transactions | | | (1,100,355) | | | | (6,559,043) | | | |
| | | | | | | | | | | |
| | | |
Institutional Class | | | | | | | | | | |
Issued | | | 7,034,568 | | | | 10,612,822 | | | |
Issued to shareholders in reinvestment of distributions | | | 11,423,705 | | | | 10,064,172 | | | |
Redeemed | | | (21,633,925) | | | | (16,204,159) | | | |
Net increase/(decrease) in share transactions | | | (3,175,652) | | | | 4,472,835 | | | |
| | | | | | | | | | | |
| | |
| See Notes to Financial Statements. | | |
56 | | 1.855.377.7325 | www.GrandeurPeakGlobal.com |
| | |
| Grandeur Peak Global Reach Fund | | Statements of Changes in Net Assets |
| | | | | | | | | | |
| | | For the | | | For the | | | |
| | | Year Ended | | | Year Ended | | | |
| | | April 30, 2016 | | | April 30, 2015 | | | |
OPERATIONS | | | | | | | | | | |
Net investment income | | $ | 866,968 | | | $ | 458,861 | | | |
Net realized gain/(loss) | | | (10,392,458) | | | | 10,206,381 | | | |
Net change in unrealized appreciation/(depreciation) | | | (14,065,512) | | | | 20,804,164 | | | |
Net increase/(decrease) in net assets resulting from operations | | | (23,591,002) | | | | 31,469,406 | | | |
| | | |
DISTRIBUTIONS TO SHAREHOLDERS (NOTE 3) | | | | | | | | | | |
Net investment income | | | | | | | | | | |
Investor Class | | | (31,050) | | | | (39,255) | | | |
Institutional Class | | | (548,683) | | | | (429,550) | | | |
Net realized gains on investments | | | | | | | | | | |
Investor Class | | | (2,531,840) | | | | (920,561) | | | |
Institutional Class | | | (8,291,704) | | | | (2,653,424) | | | |
Net decrease in net assets from distributions | | | (11,403,277) | | | | (4,042,790) | | | |
| | | |
CAPITAL SHARE TRANSACTIONS (NOTE 5) | | | | | | | | | | |
Investor Class | | | | | | | | | | |
Proceeds from sales of shares | | | 8,664,894 | | | | 50,078,072 | | | |
Distributions reinvested | | | 2,432,032 | | | | 913,417 | | | |
Cost of shares redeemed | | | (22,513,189) | | | | (16,658,848) | | | |
Redemption fees | | | 112 | | | | 11,400 | | | |
Net increase/(decrease) from capital shares transactions | | | (11,416,151) | | | | 34,344,041 | | | |
| | | |
Institutional Class | | | | | | | | | | |
Proceeds from sales of shares | | | 14,482,195 | | | | 163,642,642 | | | |
Distributions reinvested | | | 8,452,696 | | | | 2,839,814 | | | |
Cost of shares redeemed | | | (35,375,478) | | | | (15,137,030) | | | |
Redemption fees | | | 1,064 | | | | 3,537 | | | |
Net increase/(decrease) from capital shares transactions | | | (12,439,523) | | | | 151,348,963 | | | |
| | | |
Net increase/(decrease) in net assets | | | (58,849,953) | | | | 213,119,620 | | | |
| | | |
NET ASSETS | | | | | | | | | | |
Beginning of year | | | 347,593,286 | | | | 134,473,666 | | | |
End of year* | | $ | 288,743,333 | | | $ | 347,593,286 | | | |
| | | | | | | | | | | |
| | | |
*Including accumulated net investment loss of: | | $ | (102,771) | | | $ | (188,078) | | | |
| | | |
OTHER INFORMATION | | | | | | | | | | |
Shares Transactions | | | | | | | | | | |
Investor Class | | | | | | | | | | |
Issued | | | 687,256 | | | | 3,913,617 | | | |
Issued to shareholders in reinvestment of distributions | | | 199,838 | | | | 72,379 | | | |
Redeemed | | | (1,845,147) | | | | (1,303,058) | | | |
Net increase/(decrease) in share transactions | | | (958,053) | | | | 2,682,938 | | | |
| | | | | | | | | | | |
| | | |
Institutional Class | | | | | | | | | | |
Issued | | | 1,168,635 | | | | 12,894,402 | | | |
Issued to shareholders in reinvestment of distributions | | | 694,552 | | | | 225,203 | | | |
Redeemed | | | (2,925,982) | | | | (1,179,712) | | | |
Net increase/(decrease) in share transactions | | | (1,062,795) | | | | 11,939,893 | | | |
| | | | | | | | | | | |
| | |
| See Notes to Financial Statements. | | |
Annual Report | April 30, 2016 | | 57 |
| | |
| Grandeur Peak Global Stalwarts Fund | | Statement of Changes in Net Assets |
| | | | |
| | | For the Period | |
| | | September 2, 2015 | |
| | | (Commencement | |
| | | of Operations) to | |
| | | April 30, 2016 | |
OPERATIONS | | | | |
Net investment income | | $ | 16,435 | |
Net realized loss | | | (316,587) | |
Net change in unrealized appreciation | | | 2,284,821 | |
Net increase in net assets resulting from operations | | | 1,984,669 | |
| |
DISTRIBUTIONS TO SHAREHOLDERS (NOTE 3) | | | | |
Net investment income | | | | |
Investor Class | | | (1,406) | |
Institutional Class | | | (1,599) | |
Net realized gains on investments | | | | |
Investor Class | | | (5,451) | |
Institutional Class | | | (4,017) | |
Net decrease in net assets from distributions | | | (12,473) | |
| |
CAPITAL SHARE TRANSACTIONS (NOTE 5) | | | | |
Investor Class | | | | |
Proceeds from sales of shares | | | 19,927,627 | |
Distributions reinvested | | | 6,798 | |
Cost of shares redeemed | | | (1,840,013) | |
Redemption fees | | | 756 | |
Net increase from capital shares transactions | | | 18,095,168 | |
| |
Institutional Class | | | | |
Proceeds from sales of shares | | | 17,799,288 | |
Distributions reinvested | | | 5,140 | |
Cost of shares redeemed | | | (1,178,526) | |
Redemption fees | | | 72 | |
Net increase from capital shares transactions | | | 16,625,974 | |
| |
Net increase in net assets | | | 36,693,338 | |
| |
NET ASSETS | | | | |
Beginning of period | | | – | |
End of period* | | $ | 36,693,338 | |
| | | | | |
| |
*Including accumulated net investment income of: | | $ | 108,751 | |
| |
OTHER INFORMATION | | | | |
Shares Transactions | | | | |
Investor Class | | | | |
Issued | | | 1,940,844 | |
Issued to shareholders in reinvestment of distributions | | | 639 | |
Redeemed | | | (178,743) | |
Net increase in share transactions | | | 1,762,740 | |
| | | | | |
Institutional Class | | | | |
Issued | | | 1,727,174 | |
Issued to shareholders in reinvestment of distributions | | | 483 | |
Redeemed | | | (112,238) | |
Net increase in share transactions | | | 1,615,419 | |
| | | | | |
| | |
| See Notes to Financial Statements. | | |
58 | | 1.855.377.7325 | www.GrandeurPeakGlobal.com |
| | |
| Grandeur Peak International Opportunities Fund | | Statements of Changes in Net Assets |
| | |
| | | | | | | | |
| | | For the
Year Ended
April 30, 2016 | | | For the
Year Ended
April 30, 2015 | |
OPERATIONS | | | | | | | | |
Net investment income | | $ | 4,673,044 | | | $ | 4,559,749 | |
Net realized gain/(loss) | | | (1,400,622) | | | | 62,562,011 | |
Net change in unrealized depreciation | | | (51,653,029) | | | | (7,154,588) | |
Net increase/(decrease) in net assets resulting from operations | | | (48,380,607) | | | | 59,967,172 | |
| | |
DISTRIBUTIONS TO SHAREHOLDERS (NOTE 3) | | | | | | | | |
Net investment income | | | | | | | | |
Investor Class | | | (333,339) | | | | (519,202) | |
Institutional Class | | | (2,890,960) | | | | (3,324,759) | |
Net realized gains on investments | | | | | | | | |
Investor Class | | | (5,176,781) | | | | (9,145,192) | |
Institutional Class | | | (25,904,418) | | | | (39,074,979) | |
Net decrease in net assets from distributions | | | (34,305,498) | | | | (52,064,132) | |
| | |
CAPITAL SHARE TRANSACTIONS (NOTE 5) | | | | | | | | |
Investor Class | | | | | | | | |
Proceeds from sales of shares | | | 22,706,144 | | | | 27,042,166 | |
Distributions reinvested | | | 5,342,478 | | | | 9,427,674 | |
Cost of shares redeemed | | | (62,519,592) | | | | (18,351,671) | |
Redemption fees | | | 5,300 | | | | 293 | |
Net increase/(decrease) from capital shares transactions | | | (34,465,670) | | | | 18,118,462 | |
| | |
Institutional Class | | | | | | | | |
Proceeds from sales of shares | | | 25,906,118 | | | | 25,311,158 | |
Distributions reinvested | | | 25,634,915 | | | | 36,728,280 | |
Cost of shares redeemed | | | (87,311,199) | | | | (43,279,215) | |
Redemption fees | | | 8,941 | | | | 1,597 | |
Net increase/(decrease) from capital shares transactions | | | (35,761,225) | | | | 18,761,820 | |
| | |
Net increase/(decrease) in net assets | | | (152,913,000) | | | | 44,783,322 | |
| | |
NET ASSETS | | | | | | | | |
Beginning of year | | | 856,205,832 | | | | 811,422,510 | |
End of year* | | $ | 703,292,832 | | | $ | 856,205,832 | |
| | | | | | | | | |
| | |
*Including accumulated net investment income/(loss) of: | | $ | 286,799 | | | $ | (181,274) | |
| | |
OTHER INFORMATION | | | | | | | | |
Shares Transactions | | | | | | | | |
Investor Class | | | | | | | | |
Issued | | | 7,180,441 | | | | 8,289,054 | |
Issued to shareholders in reinvestment of distributions | | | 1,740,221 | | | | 3,021,690 | |
Redeemed | | | (19,692,604) | | | | (5,468,291) | |
Net increase/(decrease) in share transactions | | | (10,771,942) | | | | 5,842,453 | |
| | | | | | | | | |
| | |
Institutional Class | | | | | | | | |
Issued | | | 8,230,251 | | | | 7,532,407 | |
Issued to shareholders in reinvestment of distributions | | | 8,323,024 | | | | 11,734,275 | |
Redeemed | | | (28,793,205) | | | | (13,091,622) | |
| |
Net increase/(decrease) in share transactions | | | (12,239,930) | | | | 6,175,060 | |
| | | | | | | | | |
| | |
| See Notes to Financial Statements. | | |
Annual Report | April 30, 2016 | | 59 |
| | |
| Grandeur Peak International Stalwarts Fund | | Statement of Changes in Net Assets |
| | | | |
| | | For the Period September 2, 2015 (Commencement of Operations) to April 30, 2016 | |
OPERATIONS | | | | |
Net investment income | | $ | 306,704 | |
Net realized loss | | | (1,541,441) | |
Net change in unrealized appreciation | | | 6,763,296 | |
Net increase in net assets resulting from operations | | | 5,528,559 | |
| |
DISTRIBUTIONS TO SHAREHOLDERS (NOTE 3) | | | | |
Net investment income | | | | |
Institutional Class | | | (30,017) | |
Net decrease in net assets from distributions | | | (30,017) | |
| |
CAPITAL SHARE TRANSACTIONS (NOTE 5) | | | | |
Investor Class | | | | |
Proceeds from sales of shares | | | 22,223,231 | |
Cost of shares redeemed | | | (1,404,112) | |
Redemption fees | | | 1,506 | |
Net increase from capital shares transactions | | | 20,820,625 | |
| |
Institutional Class | | | | |
Proceeds from sales of shares | | | 122,552,744 | |
Distributions reinvested | | | 29,459 | |
Cost of shares redeemed | | | (7,803,828) | |
Redemption fees | | | 297 | |
Net increase from capital shares transactions | | | 114,778,672 | |
| |
Net increase in net assets | | | 141,097,839 | |
| |
NET ASSETS | | | | |
Beginning of period | | | – | |
End of period* | | $ | 141,097,839 | |
| | | | | |
*Including accumulated net investment income of: | | $ | 628,490 | |
| |
OTHER INFORMATION | | | | |
Shares Transactions | | | | |
Investor Class | | | | |
Issued | | | 2,133,944 | |
Redeemed | | | (134,932) | |
Net increase in share transactions | | | 1,999,012 | |
| | | | | |
Institutional Class | | | | |
Issued | | | 11,528,096 | |
Issued to shareholders in reinvestment of distributions | | | 2,720 | |
Redeemed | | | (733,207) | |
Net increase in share transactions | | | 10,797,609 | |
| | | | | |
| | |
| See Notes to Financial Statements. | | |
60 | | 1.855.377.7325 | www.GrandeurPeakGlobal.com |
| | |
| Grandeur Peak Emerging Markets Opportunities Fund | | Financial Highlights |
For a Share Outstanding Throughout the Periods Presented |
| | | | | | | | | | | | |
| Investor Class | | Year Ended
April 30, 2016 | | | Year Ended
April 30, 2015 | | | For the Period
December 16,
2013
(Inception) to
April 30, 2014 | |
NET ASSET VALUE, BEGINNING OF PERIOD | | $ | 11.51 | | | $ | 10.53 | | | $ | 10.00 | |
| | | |
INCOME FROM INVESTMENT OPERATIONS | | | | | | | | | | | | |
Net investment income/(loss)(a) | | | 0.07 | | | | 0.02 | | | | (0.05) | |
Net realized and unrealized gain/(loss) on investments | | | (1.41) | | | | 1.22 | | | | 0.58 | |
Total income/(loss) from investment operations | | | (1.34) | | | | 1.24 | | | | 0.53 | |
| | | |
DISTRIBUTIONS | | | | | | | | | | | | |
From net investment income | | | – | | | | (0.01) | | | | – | |
From net realized gain on investments | | | (0.35) | | | | (0.25) | | | | – | |
Total distributions | | | (0.35) | | | | (0.26) | | | | – | |
| | | |
REDEMPTION FEES ADDED TO PAID-IN CAPITAL | | | 0.00 | (b) | | | 0.00 | (b) | | | 0.00 ( | b) |
| | | |
INCREASE/DECREASE IN NET ASSET VALUE | | | (1.69) | | | | 0.98 | | | | 0.53 | |
NET ASSET VALUE, END OF PERIOD | | $ | 9.82 | | | $ | 11.51 | | | $ | 10.53 | |
| | | | | | | | | | | | | |
| | | |
TOTAL RETURN | | | (11.62) | % | | | 12.06 | % | | | 5.30%(c) | |
| | | |
RATIOS AND SUPPLEMENTAL DATA | | | | | | | | | | | | |
Net assets, end of period (in 000s) | | $ | 20,548 | | | $ | 39,896 | | | $ | 27,952 | |
| | | |
RATIOS TO AVERAGE NET ASSETS | | | | | | | | | | | | |
Expenses (excluding fees waived/reimbursed by investment advisor) | | | 1.77 | % | | | 1.82 | % | | | 2.01%(d)(e) | |
Expenses (including fees waived/reimbursed by investment advisor) | | | 1.77 | % | | | 1.82 | % | | | 1.95%(d)(e) | |
Net investment income/(loss) | | | 0.69 | % | | | 0.22 | % | | | (0.55)%(d) | |
| | | |
PORTFOLIO TURNOVER RATE | | | 40 | % | | | 53 | % | | | 26%(c) | |
| (a) | Per share numbers have been calculated using the average shares method. |
| (b) | Less than $0.005 or ($0.005) per share. |
| (e) | Expense ratios during startup periods may not be representative of longer term operating periods. |
| | |
| See Notes to Financial Statements. | | |
Annual Report | April 30, 2016 | | 61 |
| | |
| Grandeur Peak Emerging Markets Opportunities Fund | | Financial Highlights |
For a Share Outstanding Throughout the Periods Presented |
| | | | | | | | | | | | |
| Institutional Class | | Year Ended
April 30, 2016 | | | Year Ended
April 30, 2015 | | | For the Period December 16, 2013 (Inception) to April 30, 2014 | |
NET ASSET VALUE, BEGINNING OF PERIOD | | $ | 11.52 | | | $ | 10.54 | | | $ | 10.00 | |
| | | |
INCOME FROM INVESTMENT OPERATIONS | | | | | | | | | | | | |
Net investment income/(loss)(a) | | | 0.08 | | | | 0.05 | | | | (0.03) | |
Net realized and unrealized gain/(loss) on investments | | | (1.40) | | | | 1.21 | | | | 0.57 | |
Total income/(loss) from investment operations | | | (1.32) | | | | 1.26 | | | | 0.54 | |
| | | |
DISTRIBUTIONS | | | | | | | | | | | | |
From net investment income | | | – | | | | (0.03) | | | | – | |
From net realized gain on investments | | | (0.35) | | | | (0.25) | | | | – | |
Total distributions | | | (0.35) | | | | (0.28) | | | | – | |
| | | |
REDEMPTION FEES ADDED TO PAID-IN CAPITAL | | | 0.00 | (b) | | | 0.00 | (b) | | | 0.00 | (b) |
| | | |
INCREASE/DECREASE IN NET ASSET VALUE | | | (1.67) | | | | 0.98 | | | | 0.54 | |
NET ASSET VALUE, END OF PERIOD | | $ | 9.85 | | | $ | 11.52 | | | $ | 10.54 | |
| | | | | | | | | | | | | |
| | | |
TOTAL RETURN | | | (11.44) | % | | | 12.22 | % | | | 5.40% | (c) |
| | | |
RATIOS AND SUPPLEMENTAL DATA | | | | | | | | | | | | |
Net assets, end of period (in 000s) | | $ | 349,493 | | | $ | 428,048 | | | $ | 255,819 | |
| | | |
RATIOS TO AVERAGE NET ASSETS | | | | | | | | | | | | |
Expenses (excluding fees waived/reimbursed by investment advisor) | | | 1.55 | % | | | 1.58 | % | | | 1.76%(d) | (e) |
Expenses (including fees waived/reimbursed by investment advisor) | | | 1.55 | % | | | 1.58 | % | | | 1.70%(d) | (e) |
Net investment income/(loss) | | | 0.75 | % | | | 0.43 | % | | | (0.37)% | (d) |
| | | |
PORTFOLIO TURNOVER RATE | | | 40 | % | | | 53 | % | | | 26% | (c) |
| (a) | Per share numbers have been calculated using the average shares method. |
| (b) | Less than $0.005 or ($0.005) per share. |
| (e) | Expense ratios during startup periods may not be representative of longer term operating periods. |
| | |
| See Notes to Financial Statements. | | |
62 | | 1.855.377.7325 | www.GrandeurPeakGlobal.com |
| | |
| Grandeur Peak Global Micro Cap Fund | | Financial Highlights |
| | For a Share Outstanding Throughout the Periods Presented |
| | | | |
| Institutional Class | | For the Period October 21, 2015 (Commencement of Operations) to April 30, 2016 | |
NET ASSET VALUE, BEGINNING OF PERIOD | | $ | 10.00 | |
| |
INCOME FROM INVESTMENT OPERATIONS | | | | |
Net investment loss(a) | | | (0.02) | |
Net realized and unrealized gain on investments | | | 0.40 | |
Total income from investment operations | | | 0.38 | |
| |
REDEMPTION FEES ADDED TO PAID-IN CAPITAL | | | 0.00 (b) | |
| |
INCREASE IN NET ASSET VALUE | | | 0.38 | |
NET ASSET VALUE, END OF PERIOD | | $ | 10.38 | |
| | | | | |
| |
TOTAL RETURN | | | 3.80% (c) | |
| |
RATIOS AND SUPPLEMENTAL DATA | | | | |
Net assets, end of period (in 000s) | | $ | 30,735 | |
| |
RATIOS TO AVERAGE NET ASSETS | | | | |
Expenses (excluding fees waived/reimbursed by investment advisor) | | | 2.30%(d)(e) | |
Expenses (including fees waived/reimbursed by investment advisor) | | | 2.00%(d)(e) | |
Net investment loss | | | (0.41)%(d) | |
| |
PORTFOLIO TURNOVER RATE | | | 8%(c) | |
| (a) | Per share numbers have been calculated using the average shares method. |
| (b) | Less than $0.005 or ($0.005) per share. |
| (e) | Expense ratios during startup periods may not be representative of longer term operating periods. |
| | |
| See Notes to Financial Statements. | | |
Annual Report | April 30, 2016 | | 63 |
| | |
| Grandeur Peak Global Opportunities Fund | | Financial Highlights |
| | For a Share Outstanding Throughout the Periods Presented |
| | | | | | | | | | | | | | | | | | | | |
| Investor Class | | Year Ended
April 30, 2016 | | | Year Ended
April 30, 2015 | | | Year Ended
April 30, 2014 | | | Year Ended
April 30, 2013 | | | For the Period
October 17, 2011
(Inception) to
April 30, 2012 | |
NET ASSET VALUE, BEGINNING OF PERIOD | | $ | 3.43 | | | $ | 3.31 | | | $ | 2.77 | | | $ | 2.31 | | | $ | 2.00 | |
| | | | | |
INCOME FROM INVESTMENT OPERATIONS | | | | | | | | | | | | | | | | | | | | |
Net investment income/(loss)(a) | | | 0.00 | (b) | | | 0.00 | (b) | | | (0.00) | (b) | | | 0.00 | (b) | | | (0.00) | (b) |
Net realized and unrealized gain/(loss) on investments | | | (0.18) | | | | 0.35 | | | | 0.67 | | | | 0.51 | | | | 0.31 | |
Total income/(loss) from investment operations | | | (0.18) | | | | 0.35 | | | | 0.67 | | | | 0.51 | | | | 0.31 | |
| | | | | |
DISTRIBUTIONS | | | | | | | | | | | | | | | | | | | | |
From net investment income | | | (0.00) | (b) | | | (0.01) | | | | – | | | | (0.01) | | | | – | |
From net realized gain on investments | | | (0.24) | | | | (0.22) | | | | (0.13) | | | | (0.04) | | | | – | |
Total distributions | | | (0.24) | | | | (0.23) | | | | (0.13) | | | | (0.05) | | | | – | |
| | | | | |
REDEMPTION FEES ADDED TO PAID-IN CAPITAL | | | 0.00 | (b) | | | 0.00 | (b) | | | 0.00 | (b) | | | 0.00 | (b) | | | 0.00 | (b) |
| | | | | |
INCREASE/DECREASE IN NET ASSET VALUE | | | (0.42) | | | | 0.12 | | | | 0.54 | | | | 0.46 | | | | 0.31 | |
NET ASSET VALUE, END OF PERIOD | | $ | 3.01 | | | $ | 3.43 | | | $ | 3.31 | | | $ | 2.77 | | | $ | 2.31 | |
| | | | | | | | | | | | | | | | | | | | | |
| | | | | |
TOTAL RETURN | | | (5.03) | % | | | 11.09 | % | | | 24.31 | % | | | 22.34 | % | | | 15.50% | (c) |
| | | | | |
RATIOS AND SUPPLEMENTAL DATA | | | | | | | | | | | | | | | | | | | | |
Net assets, end of period (in 000s) | | $ | 173,156 | | | $ | 201,462 | | | $ | 216,247 | | | $ | 132,384 | | | $ | 73,154 | |
| | | | | |
RATIOS TO AVERAGE NET ASSETS | | | | | | | | | | | | | | | | | | | | |
Expenses (excluding fees waived/ reimbursed by investment advisor) | | | 1.62 | % | | | 1.62 | % | | | 1.68 | % | | | 1.76 | % | | | 2.30% | (d) |
Expenses (including fees waived/ reimbursed by investment advisor) | | | 1.62 | % | | | 1.62 | % | | | 1.68 | % | | | 1.75 | % | | | 1.75% | (d) |
Net investment income/(loss) | | | 0.06 | % | | | 0.12 | % | | | (0.15) | % | | | 0.19 | % | | | (0.04)% | (d) |
| | | | | |
PORTFOLIO TURNOVER RATE | | | 32 | % | | | 37 | % | | | 38 | % | | | 35 | % | | | 42% | (c) |
| (a) | Per share numbers have been calculated using the average shares method. |
| (b) | Less than $0.005 or ($0.005) per share. |
| | |
| See Notes to Financial Statements. | | |
64 | | 1.855.377.7325 | www.GrandeurPeakGlobal.com |
| | |
| Grandeur Peak Global Opportunities Fund | | Financial Highlights |
| | For a Share Outstanding Throughout the Periods Presented |
| | | | | | | | | | | | | | | | | | | | |
| Institutional Class | | Year Ended
April 30, 2016 | | | Year Ended
April 30, 2015 | | | Year Ended
April 30, 2014 | | | Year Ended
April 30, 2013 | | | For the Period
October 17, 2011
(Inception) to
April 30, 2012 | |
NET ASSET VALUE, BEGINNING OF PERIOD | | $ | 3.46 | | | $ | 3.34 | | | $ | 2.79 | | | $ | 2.32 | | | $ | 2.00 | |
| | | | | |
INCOME FROM INVESTMENT OPERATIONS | | | | | | | | | | | | | | | | | | | | |
Net investment income(a) | | | 0.01 | | | | 0.01 | | | | 0.00 (b) | | | | 0.01 | | | | 0.00 (b) | |
Net realized and unrealized gain/(loss) on investments | | | (0.19) | | | | 0.34 | | | | 0.68 | | | | 0.52 | | | | 0.32 | |
Total income/(loss) from investment operations | | | (0.18) | | | | 0.35 | | | | 0.68 | | | | 0.53 | | | | 0.32 | |
| | | | | |
DISTRIBUTIONS | | | | | | | | | | | | | | | | | | | | |
From net investment income | | | (0.01) | | | | (0.01) | | | | (0.00) (b) | | | | (0.02) | | | | – | |
From net realized gain on investments | | | (0.24) | | | | (0.22) | | | | (0.13) | | | | (0.04) | | | | – | |
Total distributions | | | (0.25) | | | | (0.23) | | | | (0.13) | | | | (0.06) | | | | – | |
| | | | | |
REDEMPTION FEES ADDED TO PAID-IN CAPITAL | | | 0.00 (b) | | | | 0.00 (b) | | | | 0.00 (b) | | | | 0.00 (b) | | | | 0.00 (b) | |
| | | | | |
INCREASE/DECREASE IN NET ASSET VALUE | | | (0.43) | | | | 0.12 | | | | 0.55 | | | | 0.47 | | | | 0.32 | |
NET ASSET VALUE, END OF PERIOD | | $ | 3.03 | | | $ | 3.46 | | | $ | 3.34 | | | $ | 2.79 | | | $ | 2.32 | |
| | | | | | | | | | | | | | | | | | | | | |
| | | | | |
TOTAL RETURN | | | (5.12)% | | | | 11.20% | | | | 24.67% | | | | 22.86% | | | | 16.00%(c) | |
| | | | | |
RATIOS AND SUPPLEMENTAL DATA | | | | | | | | | | | | | | | | | | | | |
Net assets, end of period (in 000s) | | $ | 452,030 �� | | | $ | 526,394 | | | $ | 492,869 | | | $ | 217,953 | | | $ | 77,737 | |
| | | | | |
RATIOS TO AVERAGE NET ASSETS | | | | | | | | | | | | | | | | | | | | |
Expenses (excluding fees waived/ reimbursed by investment advisor) | | | 1.38% | | | | 1.38% | | | | 1.44% | | | | 1.51% | | | | 2.03%(d) | |
Expenses (including fees waived/ reimbursed by investment advisor) | | | 1.38% | | | | 1.38% | | | | 1.44% | | | | 1.50% | | | | 1.50%(d) | |
Net investment income | | | 0.30% | | | | 0.35% | | | | 0.08% | | | | 0.37% | | | | 0.40%(d) | |
| | | | | |
PORTFOLIO TURNOVER RATE | | | 32% | | | | 37% | | | | 38% | | | | 35% | | | | 42%(c) | |
| (a) | Per share numbers have been calculated using the average shares method. |
| (b) | Less than $0.005 or ($0.005) per share. |
| | |
| See Notes to Financial Statements. | | |
Annual Report | April 30, 2016 | | 65 |
| | |
| Grandeur Peak Global Reach Fund | | Financial Highlights |
| | For a Share Outstanding Throughout the Periods Presented |
| | | | | | | | | | | | |
| Investor Class | | Year Ended
April 30, 2016 | | | Year Ended
April 30, 2015 | | | For the Period
June 19, 2013
(Inception) to
April 30, 2014 | |
NET ASSET VALUE, BEGINNING OF PERIOD | | $ | 13.65 | | | $ | 12.43 | | | $ | 10.00 | |
| | | |
INCOME FROM INVESTMENT OPERATIONS | | | | | | | | | | | | |
Net investment income/(loss)(a) | | | 0.01 | | | | 0.00 | (b) | | | (0.02) | |
Net realized and unrealized gain/(loss) on investments | | | (0.89) | | | | 1.37 | | | | 2.54 | |
Total income/(loss) from investment operations | | | (0.88) | | | | 1.37 | | | | 2.52 | |
| | | |
DISTRIBUTIONS | | | | | | | | | | | | |
From net investment income | | | (0.01) | | | | (0.01) | | | | (0.02) | |
From net realized gain on investments | | | (0.45) | | | | (0.14) | | | | (0.08) | |
Total distributions | | | (0.46) | | | | (0.15) | | | | (0.10) | |
| | | |
REDEMPTION FEES ADDED TO PAID-IN CAPITAL | | | 0.00 | (b) | | | 0.00 | (b) | | | 0.01 | |
| | | |
INCREASE/DECREASE IN NET ASSET VALUE | | | (1.34) | | | | 1.22 | | | | 2.43 | |
NET ASSET VALUE, END OF PERIOD | | $ | 12.31 | | | $ | 13.65 | | | $ | 12.43 | |
| | | | | | | | | | | | | |
| | | |
TOTAL RETURN | | | (6.45) | % | | | 11.09 | % | | | 25.31%(c) | |
| | | |
RATIOS AND SUPPLEMENTAL DATA | | | | | | | | | | | | |
Net assets, end of period (in 000s) | | $ | 66,984 | | | $ | 87,354 | | | $ | 46,163 | |
| | | |
RATIOS TO AVERAGE NET ASSETS | | | | | | | | | | | | |
Expenses (excluding fees waived/reimbursed by investment advisor) | | | 1.60 | % | | | 1.60 | % | | | 1.91%(d)(e) | |
Expenses (including fees waived/reimbursed by investment advisor) | | | 1.60 | % | | | 1.60 | % | | | 1.60%(d)(e) | |
Net investment income/(loss) | | | 0.10 | % | | | 0.03 | % | | | (0.17)%(d) | |
| | | |
PORTFOLIO TURNOVER RATE | | | 46 | % | | | 46 | % | | | 39%(c) | |
| (a) | Per share numbers have been calculated using the average shares method. |
| (b) | Less than $0.005 or ($0.005) per share. |
| (e) | Expense ratios during startup periods may not be representative of longer term operating periods. |
| | |
| See Notes to Financial Statements. | | |
66 | | 1.855.377.7325 | www.GrandeurPeakGlobal.com |
| | |
| Grandeur Peak Global Reach Fund | | Financial Highlights |
| | For a Share Outstanding Throughout the Periods Presented |
| | | | | | | | | | | | |
| Institutional Class | | Year Ended
April 30, 2016 | | | Year Ended
April 30, 2015 | | | For the Period
June 19, 2013
(Inception) to
April 30, 2014 | |
NET ASSET VALUE, BEGINNING OF PERIOD | | $ | 13.66 | | | $ | 12.42 | | | $ | 10.00 | |
| | | |
INCOME FROM INVESTMENT OPERATIONS | | | | | | | | | | | | |
Net investment income(a) | | | 0.04 | | | | 0.03 | | | | 0.02 | |
Net realized and unrealized gain/(loss) on investments | | | (0.89) | | | | 1.37 | | | | 2.52 | |
Total income/(loss) from investment operations | | | (0.85) | | | | 1.40 | | | | 2.54 | |
| | | |
DISTRIBUTIONS | | | | | | | | | | | | |
From net investment income | | | (0.03) | | | | (0.02) | | | | (0.04) | |
From net realized gain on investments | | | (0.45) | | | | (0.14) | | | | (0.08) | |
Total distributions | | | (0.48) | | | | (0.16) | | | | (0.12) | |
| | | |
REDEMPTION FEES ADDED TO PAID-IN CAPITAL | | | 0.00 | (b) | | | 0.00 | (b) | | | 0.00 (b) | |
| | | |
INCREASE/DECREASE IN NET ASSET VALUE | | | (1.33) | | | | 1.24 | | | | 2.42 | |
NET ASSET VALUE, END OF PERIOD | | $ | 12.33 | | | $ | 13.66 | | | $ | 12.42 | |
| | | | | | | | | | | | | |
| | | |
TOTAL RETURN | | | (6.18) | % | | | 11.41 | % | | | 25.45%(c) | |
| | | |
RATIOS AND SUPPLEMENTAL DATA | | | | | | | | | | | | |
Net assets, end of period (in 000s) | | $ | 221,759 | | | $ | 260,239 | | | $ | 88,311 | |
| | | |
RATIOS TO AVERAGE NET ASSETS | | | | | | | | | | | | |
Expenses (excluding fees waived/reimbursed by investment advisor) | | | 1.35 | % | | | 1.35 | % | | | 1.75%(d)(e) | |
Expenses (including fees waived/reimbursed by investment advisor) | | | 1.35 | % | | | 1.35 | % | | | 1.35%(d)(e) | |
Net investment income | | | 0.34 | % | | | 0.23 | % | | | 0.21%(d) | |
| | | |
PORTFOLIO TURNOVER RATE | | | 46 | % | | | 46 | % | | | 39%(c) | |
| (a) | Per share numbers have been calculated using the average shares method. |
| (b) | Less than $0.005 or ($0.005) per share. |
| (e) | Expense ratios during startup periods may not be representative of longer term operating periods. |
| | |
| See Notes to Financial Statements. | | |
Annual Report | April 30, 2016 | | 67 |
| | |
| Grandeur Peak Global Stalwarts Fund | | Financial Highlights |
| | For a Share Outstanding Throughout the Periods Presented |
| | | | |
| Investor Class | | For the Period September 2, 2015 (Commencement of Operations) to April 30, 2016 | |
| |
NET ASSET VALUE, BEGINNING OF PERIOD | | $ | 10.00 | |
| |
INCOME FROM INVESTMENT OPERATIONS | | | | |
Net investment income(a) | | | 0.00 (b) | |
Net realized and unrealized gain on investments | | | 0.85 | |
| |
Total income from investment operations | | | 0.85 | |
| |
| |
DISTRIBUTIONS | | | | |
From net investment income | | | (0.00) (b) | |
From net realized gain on investments | | | (0.00) (b) | |
| |
Total distributions | | | (0.00) (b) | |
| |
| |
REDEMPTION FEES ADDED TO PAID-IN CAPITAL | | | 0.00 (b) | |
| |
| |
INCREASE IN NET ASSET VALUE | | | 0.85 | |
| |
NET ASSET VALUE, END OF PERIOD | | $ | 10.85 | |
| |
| |
TOTAL RETURN | | | 8.55%(c) | |
| |
RATIOS AND SUPPLEMENTAL DATA | | | | |
Net assets, end of period (in 000s) | | $ | 19,131 | |
| |
RATIOS TO AVERAGE NET ASSETS | | | | |
Expenses (excluding fees waived/reimbursed by investment advisor) | | | 2.06%(d)(e) | |
Expenses (including fees waived/reimbursed by investment advisor) | | | 1.35%(d)(e) | |
Net investment income | | | 0.00%(d)(f) | |
| |
PORTFOLIO TURNOVER RATE | | | 24%(c) | |
| (a) | Per share numbers have been calculated using the average shares method. |
| (b) | Less than $0.005 or ($0.005) per share. |
| (e) | Expense ratios during startup periods may not be representative of longer term operating periods. |
| (f) | Less than 0.005% of average net assets. |
| | |
| See Notes to Financial Statements. | | |
68 | | 1.855.377.7325 | www.GrandeurPeakGlobal.com |
| | |
| Grandeur Peak Global Stalwarts Fund | | Financial Highlights |
| | For a Share Outstanding Throughout the Periods Presented |
| | | | |
| Institutional Class | | For the Period September 2, 2015 (Commencement of Operations) to April 30, 2016 | |
| |
NET ASSET VALUE, BEGINNING OF PERIOD | | $ | 10.00 | |
| |
INCOME FROM INVESTMENT OPERATIONS | | | | |
Net investment income(a) | | | 0.02 | |
Net realized and unrealized gain on investments | | | 0.85 | |
| |
Total income from investment operations | | | 0.87 | |
| |
| |
DISTRIBUTIONS | | | | |
From net investment income | | | (0.00) (b) | |
From net realized gain on investments | | | (0.00) (b) | |
| |
Total distributions | | | (0.00) (b) | |
| |
| |
REDEMPTION FEES ADDED TO PAID-IN CAPITAL | | | 0.00 (b) | |
| |
| |
INCREASE IN NET ASSET VALUE | | | 0.87 | |
| |
NET ASSET VALUE, END OF PERIOD | | $ | 10.87 | |
| |
| |
TOTAL RETURN | | | 8.76%(c) | |
| |
RATIOS AND SUPPLEMENTAL DATA | | | | |
Net assets, end of period (in 000s) | | $ | 17,562 | |
| |
RATIOS TO AVERAGE NET ASSETS | | | | |
Expenses (excluding fees waived/reimbursed by investment advisor) | | | 1.86%(d)(e) | |
Expenses (including fees waived/reimbursed by investment advisor) | | | 1.10%(d)(e) | |
Net investment income | | | 0.22%(d) | |
| |
PORTFOLIO TURNOVER RATE | | | 24%(c) | |
| (a) | Per share numbers have been calculated using the average shares method. |
| (b) | Less than $0.005 or ($0.005) per share. |
| (e) | Expense ratios during startup periods may not be representative of longer term operating periods. |
| | |
| See Notes to Financial Statements. | | |
Annual Report | April 30, 2016 | | 69 |
| | |
| Grandeur Peak International Opportunities Fund | | Financial Highlights |
| | For a Share Outstanding Throughout the Periods Presented |
| | | | | | | | | | | | | | | | | | | | |
| Investor Class | | Year Ended April 30, 2016 | | | Year Ended April 30, 2015 | | | Year Ended April 30, 2014 | | | Year Ended April 30, 2013 | | | For the Period October 17, 2011 (Inception) to April 30, 2012 | |
| |
NET ASSET VALUE, BEGINNING OF PERIOD | | $ | 3.42 | | | $ | 3.41 | | | $ | 2.83 | | | $ | 2.29 | | | $ | 2.00 | |
| | | | | |
INCOME FROM INVESTMENT OPERATIONS | | | | | | | | | | | | | | | | | | | | |
Net investment income(a) | | | 0.01 | | | | 0.01 | | | | 0.01 | | | | 0.01 | | | | 0.00 (b) | |
Net realized and unrealized gain/(loss) on investments | | | (0.20) | | | | 0.21 | | | | 0.68 | | | | 0.55 | | | | 0.29 | |
| |
Total income/(loss) from investment operations | | | (0.19) | | | | 0.22 | | | | 0.69 | | | | 0.56 | | | | 0.29 | |
| |
| | | | | |
DISTRIBUTIONS | | | | | | | | | | | | | | | | | | | | |
From net investment income | | | (0.01) | | | | (0.01) | | | | (0.02) | | | | (0.01) | | | | – | |
From net realized gain on investments | | | (0.13) | | | | (0.20) | | | | (0.09) | | | | (0.01) | | | | – | |
| |
Total distributions | | | (0.14) | | | | (0.21) | | | | (0.11) | | | | (0.02) | | | | – | |
| |
| | | | | |
REDEMPTION FEES ADDED TO PAID-IN CAPITAL | | | 0.00 | (b) | | | 0.00 | (b) | | | 0.00 | (b) | | | 0.00 | (b) | | | 0.00 (b) | |
| |
| | | | | |
INCREASE/DECREASE IN NET ASSET VALUE | | | (0.33) | | | | 0.01 | | | | 0.58 | | | | 0.54 | | | | 0.29 | |
| |
NET ASSET VALUE, END OF PERIOD | | $ | 3.09 | | | $ | 3.42 | | | $ | 3.41 | | | $ | 2.83 | | | $ | 2.29 | |
| |
| | | | | |
TOTAL RETURN | | | (5.53) | % | | | 7.25 | % | | | 24.59 | % | | | 24.57 | % | | | 14.50%(c) | |
| | | | | |
RATIOS AND SUPPLEMENTAL DATA | | | | | | | | | | | | | | | | | | | | |
Net assets, end of period (in 000s) | | $ | 123,922 | | | $ | 173,842 | | | $ | 153,296 | | | $ | 96,550 | | | $ | 9,274 | |
| | | | | |
RATIOS TO AVERAGE NET ASSETS | | | | | | | | | | | | | | | | | | | | |
Expenses (excluding fees waived/ reimbursed by investment advisor) | | | 1.62 | % | | | 1.62 | % | | | 1.73 | % | | | 1.88 | % | | | 2.94%(d) | |
Expenses (including fees waived/ reimbursed by investment advisor) | | | 1.62 | % | | | 1.62 | % | | | 1.73 | % | | | 1.75 | % | | | 1.75%(d) | |
Net investment income | | | 0.45 | % | | | 0.37 | % | | | 0.20 | % | | | 0.26 | % | | | 0.33%(d) | |
| | | | | |
PORTFOLIO TURNOVER RATE | | | 34 | % | | | 36 | % | | | 37 | % | | | 52 | % | | | 24%(c) | |
| (a) | Per share numbers have been calculated using the average shares method. |
| (b) | Less than $0.005 or ($0.005) per share. |
| | |
| See Notes to Financial Statements. | | |
70 | | 1.855.377.7325 | www.GrandeurPeakGlobal.com |
| | |
| Grandeur Peak International Opportunities Fund | | Financial Highlights |
| | For a Share Outstanding Throughout the Periods Presented |
| | | | | | | | | | | | | | | | | | | | |
| Institutional Class | | Year Ended April 30, 2016 | | | Year Ended April 30, 2015 | | | Year Ended April 30, 2014 | | | Year Ended April 30, 2013 | | | For the Period October 17, 2011 (Inception) to April 30, 2012 | |
| |
NET ASSET VALUE, BEGINNING OF PERIOD | | $ | 3.43 | | | $ | 3.42 | | | $ | 2.84 | | | $ | 2.29 | | | $ | 2.00 | |
| | | | | |
INCOME FROM INVESTMENT OPERATIONS | | | | | | | | | | | | | | | | | | | | |
Net investment income(a) | | | 0.02 | | | | 0.02 | | | | 0.01 | | | | 0.01 | | | | 0.01 | |
Net realized and unrealized gain/(loss) on investments | | | (0.20) | | | | 0.21 | | | | 0.69 | | | | 0.57 | | | | 0.28 | |
| |
Total income/(loss) from investment operations | | | (0.18) | | | | 0.23 | | | | 0.70 | | | | 0.58 | | | | 0.29 | |
| |
| | | | | |
DISTRIBUTIONS | | | | | | | | | | | | | | | | | | | | |
From net investment income | | | (0.01) | | | | (0.02) | | | | (0.03) | | | | (0.02) | | | | – | |
From net realized gain on investments | | | (0.13) | | | | (0.20) | | | | (0.09) | | | | (0.01) | | | | – | |
| |
Total distributions | | | (0.14) | | | | (0.22) | | | | (0.12) | | | | (0.03) | | | | – | |
| |
| | | | | |
REDEMPTION FEES ADDED TO PAID-IN CAPITAL | | | 0.00 | (b) | | | 0.00 | (b) | | | 0.00 | (b) | | | 0.00 | (b) | | | 0.00 (b) | |
| |
| | | | | |
INCREASE/DECREASE IN NET ASSET VALUE | | | (0.32) | | | | 0.01 | | | | 0.58 | | | | 0.55 | | | | 0.29 | |
| |
NET ASSET VALUE, END OF PERIOD | | $ | 3.11 | | | $ | 3.43 | | | $ | 3.42 | | | $ | 2.84 | | | $ | 2.29 | |
| |
| | | | | |
TOTAL RETURN | | | (5.02) | % | | | 7.41 | % | | | 24.70 | % | | | 25.11 | % | | | 14.50%(c) | |
| | | | | |
RATIOS AND SUPPLEMENTAL DATA | | | | | | | | | | | | | | | | | | | | |
Net assets, end of period (in 000s) | | $ | 579,371 | | | $ | 682,364 | | | $ | 658,127 | | | $ | 250,962 | | | $ | 55,458 | |
| | | | | |
RATIOS TO AVERAGE NET ASSETS | | | | | | | | | | | | | | | | | | | | |
Expenses (excluding fees waived/ reimbursed by investment advisor) | | | 1.38 | % | | | 1.38 | % | | | 1.46 | % | | | 1.59 | % | | | 2.50%(d) | |
Expenses (including fees waived/ reimbursed by investment advisor) | | | 1.38 | % | | | 1.38 | % | | | 1.46 | % | | | 1.50 | % | | | 1.50%(d) | |
Net investment income | | | 0.65 | % | | | 0.61 | % | | | 0.42 | % | | | 0.51 | % | | | 0.56%(d) | |
| | | | | |
PORTFOLIO TURNOVER RATE | | | 34 | % | | | 36 | % | | | 37 | % | | | 52 | % | | | 24%(c) | |
| (a) | Per share numbers have been calculated using the average shares method. |
| (b) | Less than $0.005 or ($0.005) per share. |
| | |
| See Notes to Financial Statements. | | |
Annual Report | April 30, 2016 | | 71 |
| | |
| Grandeur Peak International Stalwarts Fund | | Financial Highlights |
| | For a Share Outstanding Throughout the Periods Presented |
| | | | |
| Investor Class | | For the Period September 2, 2015 (Commencement of Operations) to April 30, 2016 | |
| |
NET ASSET VALUE, BEGINNING OF PERIOD | | $ | 10.00 | |
| |
INCOME FROM INVESTMENT OPERATIONS | | | | |
Net investment income(a) | | | 0.03 | |
Net realized and unrealized gain on investments | | | 0.99 | |
| |
Total income from investment operations | | | 1.02 | |
| |
| |
REDEMPTION FEES ADDED TO PAID-IN CAPITAL | | | 0.00 (b) | |
| |
| |
INCREASE IN NET ASSET VALUE | | | 1.02 | |
| |
NET ASSET VALUE, END OF PERIOD | | $ | 11.02 | |
| |
| |
TOTAL RETURN | | | 10.20%(c) | |
| |
RATIOS AND SUPPLEMENTAL DATA | | | | |
Net assets, end of period (in 000s) | | $ | 22,028 | |
| |
RATIOS TO AVERAGE NET ASSETS | | | | |
Expenses (excluding fees waived/reimbursed by investment advisor) | | | 1.45%(d)(e) | |
Expenses (including fees waived/reimbursed by investment advisor) | | | 1.35%(d)(e) | |
Net investment income | | | 0.44%(d) | |
| |
PORTFOLIO TURNOVER RATE | | | 59%(c) | |
| (a) | Per share numbers have been calculated using the average shares method. |
| (b) | Less than $0.005 or ($0.005) per share. |
| (e) | Expense ratios during startup periods may not be representative of longer term operating periods. |
| | |
| See Notes to Financial Statements. | | |
72 | | 1.855.377.7325 | www.GrandeurPeakGlobal.com |
| | |
| Grandeur Peak International Stalwarts Fund | | Financial Highlights |
| | For a Share Outstanding Throughout the Periods Presented |
| | | | |
| Institutional Class | | For the Period September 2, 2015 (Commencement of Operations) to April 30, 2016 | |
| |
NET ASSET VALUE, BEGINNING OF PERIOD | | $ | 10.00 | |
| |
INCOME FROM INVESTMENT OPERATIONS | | | | |
Net investment income(a) | | | 0.04 | |
Net realized and unrealized gain on investments | | | 0.99 | |
| |
Total income from investment operations | | | 1.03 | |
| |
| |
DISTRIBUTIONS | | | | |
From net investment income | | | (0.00) (b) | |
| |
Total distributions | | | (0.00) (b) | |
| |
| |
REDEMPTION FEES ADDED TO PAID-IN CAPITAL | | | 0.00 (b) | |
| |
| |
INCREASE IN NET ASSET VALUE | | | 1.03 | |
| |
NET ASSET VALUE, END OF PERIOD | | $ | 11.03 | |
| |
| |
TOTAL RETURN | | | 10.34%(c) | |
| |
RATIOS AND SUPPLEMENTAL DATA | | | | |
Net assets, end of period (in 000s) | | $ | 119,070 | |
| |
RATIOS TO AVERAGE NET ASSETS | | | | |
Expenses (excluding fees waived/reimbursed by investment advisor) | | | 1.20%(d)(e) | |
Expenses (including fees waived/reimbursed by investment advisor) | | | 1.10%(d)(e) | |
Net investment income | | | 0.60%(d) | |
| |
PORTFOLIO TURNOVER RATE | | | 59%(c) | |
| (a) | Per share numbers have been calculated using the average shares method. |
| (b) | Less than $0.005 or ($0.005) per share. |
| (e) | Expense ratios during startup periods may not be representative of longer term operating periods. |
| | |
| See Notes to Financial Statements. | | |
Annual Report | April 30, 2016 | | 73 |
| | |
| Grandeur Peak Funds® | | Notes to Financial Statements |
| | April 30, 2016 |
1. ORGANIZATION
Financial Investors Trust (the “Trust”), a Delaware statutory trust, is an open-end management investment company registered under the Investment Company Act of 1940, as amended (“1940 Act”). As of April 30, 2016, the Trust had 34 registered funds. This annual report describes the Grandeur Peak Emerging Markets Opportunities Fund, Grandeur Peak Global Micro Cap Fund, Grandeur Peak Global Opportunities Fund, Grandeur Peak Global Reach Fund, Grandeur Peak Global Stalwarts Fund, Grandeur Peak International Opportunities Fund, and Grandeur Peak International Stalwarts Fund (individually a “Fund” and collectively, the “Funds”). The Funds seek long-term growth of capital. The Funds offer Investor Class (except the Grandeur Peak Global Micro Cap Fund) and Institutional Class shares.
2. SIGNIFICANT ACCOUNTING POLICIES
The accompanying financial statements were prepared in accordance with accounting principles generally accepted in the United States of America (“U.S. GAAP”). The preparation of financial statements in conformity with U.S. GAAP requires management to make certain estimates and assumptions that affect the reported amounts of assets and liabilities and disclosures of contingent assets and liabilities at the date of the financial statements and the reported amounts of revenue and expenses during the period. Actual results could differ from those estimates. The Funds are considered an investment company for financial reporting purposes under U.S. GAAP. The following is a summary of significant accounting policies consistently followed by the Funds in preparation of their financial statements.
Investment Valuation: The Funds generally value their securities based on market prices determined at the close of regular trading on the New York Stock Exchange (“NYSE”), normally 4:00 p.m. Eastern Time, on each day the NYSE is open for trading.
For equity securities and mutual funds that are traded on an exchange, the market price is usually the closing sale or official closing price on that exchange. In the case of equity securities not traded on an exchange, or if such closing prices are not otherwise available, the securities are valued at the mean of the most recent bid and ask prices on such day. Redeemable securities issued by open-end registered investment companies are valued at the investment company’s applicable net asset value.
Equity securities that are primarily traded on foreign securities exchanges are valued at the closing values of such securities on their respective foreign exchanges, except when an event occurs subsequent to the close of the foreign exchange and the close of the NYSE that was likely to have changed such value. In such an event, the fair value of those securities are determined in good faith through consideration of other factors in accordance with procedures established by and under the general supervision of the Board of Trustees (the “Board”). The Funds will use a fair valuation model provided by an independent pricing service, which is intended to reflect fair value when a security’s value or a meaningful portion of each Fund’s portfolio is believed to have been materially affected by a valuation event that has occurred between the close of the exchange or market on which the security is traded and the close of the regular trading day on the NYSE. The Funds’ valuation procedures set forth certain triggers which instruct when to use the fair valuation model.
Forward currency exchange contracts have a fair value determined by the prevailing foreign currency exchange daily rates and current foreign currency exchange forward rates. The foreign currency exchange forward rates are calculated using an automated system that estimates rates on the basis of the current day foreign currency exchange rates and forward foreign currency exchange rates supplied by a pricing service.
When such prices or quotations are not available, or when Grandeur Peak Global Advisors, LLC (the “Adviser”) believes that they are unreliable, securities may be priced using fair value procedures approved by the Board.
Fair Value Measurements: The Funds disclose the classification of their fair value measurements following a three-tier hierarchy based on the inputs used to measure fair value. Inputs refer broadly to the assumptions that market participants would use in pricing the asset or liability, including assumptions about risk. Inputs may be observable or unobservable. Observable inputs reflect the assumptions market participants would use in pricing the asset or liability that are developed based on market data obtained from sources independent of the reporting entity. Unobservable inputs reflect the reporting entity’s own assumptions about the assumptions market participants would use in pricing the asset or liability that are developed based on the best information available.
| | |
| 74 | | 1.855.377.7325 | www.GrandeurPeakGlobal.com |
| | |
| Grandeur Peak Funds® | | Notes to Financial Statements |
| | April 30, 2016 |
Various inputs are used in determining the value of the Funds’ investments as of the end of the reporting period. When inputs used fall into different levels of the fair value hierarchy, the level in the hierarchy within which the fair value measurement falls is determined based on the lowest level input that is significant to the fair value measurement in its entirety. The designated input levels are not necessarily an indication of the risk or liquidity associated with these investments. These inputs are categorized in the following hierarchy under applicable financial accounting standards:
Level 1 – Unadjusted quoted prices in active markets for identical investments, unrestricted assets or liabilities that the Funds have the ability to access at the measurement date;
Level 2 – Quoted prices which are not active, quoted prices for similar assets or liabilities in active markets or inputs other than quoted prices that are observable (either directly or indirectly) for substantially the full term of the asset or liability; and
Level 3 – Significant unobservable prices or inputs (including the Funds’ own assumptions in determining the fair value of investments) where there is little or no market activity for the asset or liability at the measurement date.
The following is a summary of each Fund’s investments in the fair value hierarchy as of April 30, 2016:
| | | | | | | | | | | | | | | | |
| Investments in Securities at Value | | Level 1 - Quoted
and Unadjusted
Prices | | | Level 2 - Other
Significant
Observable Inputs | | | Level 3 - Significant
Unobservable
Inputs | | | Total | |
| |
Grandeur Peak Emerging Markets Opportunities Fund | | | | | | | | | | | | | | | | |
Common Stocks | | | 338,033,705 | | | | – | | | | – | | | | 338,033,705 | |
Preferred Stocks | | | 2,077,621 | | | | – | | | | – | | | | 2,077,621 | |
| |
Total | | $ | 340,111,326 | | | $ | – | | | $ | – | | | $ | 340,111,326 | |
| |
| | | | |
| Investments in Securities at Value | | Level 1 - Quoted
and Unadjusted
Prices | | | Level 2 - Other
Significant
Observable Inputs | | | Level 3 - Significant
Unobservable
Inputs | | | Total | |
| |
Grandeur Peak Global Micro Cap Fund | | | | | | | | | | | | | | | | |
Common Stocks | | | | | | | | | | | | | | | | |
Britain | | $ | 2,057,486 | | | $ | 101,686 | | | $ | – | | | $ | 2,159,172 | |
Other | | | 28,055,159 | | | | – | | | | – | | | | 28,055,159 | |
| |
Total | | $ | 30,112,645 | | | $ | 101,686 | | | $ | – | | | $ | 30,214,331 | |
| |
| | | | |
| Investments in Securities at Value | | Level 1 - Quoted
and Unadjusted
Prices | | | Level 2 - Other
Significant
Observable Inputs | | | Level 3 - Significant
Unobservable
Inputs | | | Total | |
| |
Grandeur Peak Global Opportunities Fund | | | | | | | | | | | | | | | | |
Common Stocks | | | 610,599,194 | | | | – | | | | – | | | | 610,599,194 | |
Preferred Stocks | | | 1,544,142 | | | | – | | | | – | | | | 1,544,142 | |
| |
Total | | $ | 612,143,336 | | | $ | – | | | $ | – | | | $ | 612,143,336 | |
| |
| | | | |
| Investments in Securities at Value | | Level 1 - Quoted
and Unadjusted
Prices | | | Level 2 - Other
Significant
Observable Inputs | | | Level 3 - Significant
Unobservable
Inputs | | | Total | |
| |
Grandeur Peak Global Reach Fund | | | | | | | | | | | | | | | | |
Common Stocks | | | | | | | | | | | | | | | | |
Britain | | $ | 16,994,858 | | | $ | 273,633 | | | $ | – | | | $ | 17,268,491 | |
Spain | | | – | | | | – | | | | 1 | | | | 1 | |
Other | | | 264,347,577 | | | | – | | | | – | | | | 264,347,577 | |
Preferred Stocks | | | 1,131,137 | | | | – | | | | – | | | | 1,131,137 | |
| |
Total | | $ | 282,473,572 | | | $ | 273,633 | | | $ | 1 | | | $ | 282,747,206 | |
| |
| | |
| Annual Report | April 30, 2016 | | 75 |
| | |
| Grandeur Peak Funds® | | Notes to Financial Statements |
| | April 30, 2016 |
| | | | | | | | | | | | | | | | |
| Investments in Securities at Value | | Level 1 - Quoted
and Unadjusted
Prices | | | Level 2 - Other
Significant
Observable Inputs | | | Level 3 - Significant
Unobservable
Inputs | | | Total | |
| |
Grandeur Peak Global Stalwarts Fund | | | | | | | | | | | | | | | | |
Common Stocks | | | 33,968,882 | | | | – | | | | – | | | | 33,968,882 | |
Preferred Stocks | | | 305,635 | | | | – | | | | – | | | | 305,635 | |
| |
Total | | $ | 34,274,517 | | | $ | – | | | $ | – | | | $ | 34,274,517 | |
| |
| | | | |
| Investments in Securities at Value | | Level 1 - Quoted
and Unadjusted
Prices | | | Level 2 - Other
Significant
Observable Inputs | | | Level 3 - Significant
Unobservable
Inputs | | | Total | |
| |
Grandeur Peak International Opportunities Fund | | | | | | | | | | | | | | | | |
Common Stocks | | | 663,932,322 | | | | – | | | | – | | | | 663,932,322 | |
Preferred Stocks | | | 2,642,900 | | | | – | | | | – | | | | 2,642,900 | |
| |
Total | | $ | 666,575,222 | | | $ | – | | | $ | – | | | $ | 666,575,222 | |
| |
| | | | |
| Investments in Securities at Value | | Level 1 - Quoted
and Unadjusted
Prices | | | Level 2 - Other
Significant
Observable Inputs | | | Level 3 - Significant
Unobservable
Inputs | | | Total | |
| |
Grandeur Peak International Stalwarts Fund | | | | | | | | | | | | | | | | |
Common Stocks | | | 129,628,646 | | | | – | | | | – | | | | 129,628,646 | |
Preferred Stocks | | | 1,671,187 | | | | – | | | | – | | | | 1,671,187 | |
| |
Total | | $ | 131,299,833 | | | $ | – | | | $ | – | | | $ | 131,299,833 | |
| |
The Fund utilizes a fair value evaluation service with respect to international securities with an earlier market closing than the Fund’s net asset value computation cutoff. When events trigger the use of the fair value evaluation service on a reporting period date, it results in certain securities transferring from a Level 1 to a Level 2 classification. When the trigger is not met at a period end, it could result in securities transferring from a Level 2 to a Level 1 classification. The transfer amount disclosed in the table below represents the value of the securities as of April 30, 2016 transferred in/(out) of Level 1 and Level 2 during the reporting period that were also held as of April 30, 2015.
The Grandeur Peak Emerging Markets Opportunities Fund had the following transfers in Level 1 from Level 2 at April 30, 2016:
| | | | | | | | |
| | | Level 1 - Quoted and Unadjusted Prices | | Level 2 - Other Significant Observable Inputs |
| | | Transfers In | | Transfers (Out) | | Transfers In | | Transfers (Out) |
|
Common Stocks | | $ 173,655,991 | | $ – | | $ – | | $ (173,655,991) |
|
Total | | $ 173,655,991 | | $ – | | $ – | | $ (173,655,991) |
|
|
The Grandeur Peak Global Opportunities Fund had the following transfers in Level 1 from Level 2 at April 30, 2016: |
| | |
| | | Level 1 - Quoted and Unadjusted Prices | | Level 2 - Other Significant Observable Inputs |
| | | Transfers In | | Transfers (Out) | | Transfers In | | Transfers (Out) |
|
Common Stocks | | $ 237,464,550 | | $ – | | $ – | | $ (237,464,550) |
|
Total | | $ 237,464,550 | | $ – | | $ – | | $ (237,464,550) |
|
|
The Grandeur Peak Global Reach Fund had the following transfers in Level 1 from Level 2 at April 30, 2016: |
| | |
| | | Level 1 - Quoted and Unadjusted Prices | | Level 2 - Other Significant Observable Inputs |
| | | Transfers In | | Transfers (Out) | | Transfers In | | Transfers (Out) |
|
Common Stocks | | $ 95,962,785 | | $ – | | $ – | | $ (95,962,785) |
|
Total | | $ 95,962,785 | | $ – | | $ – | | $ (95,962,785) |
|
| | |
| 76 | | 1.855.377.7325 | www.GrandeurPeakGlobal.com |
| | |
Grandeur Peak Funds® | | Notes to Financial Statements |
| | April 30, 2016 |
The Grandeur Peak International Opportunities Fund had the following transfers in Level 1 from Level 2 at April 30, 2016:
| | | | | | | | | | | | | | | | | | | | |
| | | Level 1 - Quoted and Unadjusted Prices | | | | | Level 2 - Other Significant Observable Inputs |
| | | | | | |
| | | Transfers In | | | Transfers (Out) | | | | | Transfers In | | | Transfers (Out) | | | |
|
Common Stocks | | | $ 350,268,416 | | | | $ – | | | | | | $ – | | | | $ (350,268,416 | ) | | |
|
Total | | | $ 350,268,416 | | | | $ – | | | | | | $ – | | | | $ (350,268,416 | ) | | |
|
The following is a reconciliation of the investments in which significant unobservable inputs (Level 3) were used in determining fair value:
| | | | | | | | | | | | | | |
| Grandeur Peak Emerging Markets Opportunities Fund | | | | Common Stocks | | | | | Total | | | |
| | |
Balance as of April 30, 2015 | | | | $ | 1,654,510 | | | | | $ | 1,654,510 | | | |
Accrued Discount/Premium | | | | | – | | | | | | – | | | |
Return of Capital | | | | | – | | | | | | – | | | |
Realized Gain/(Loss) | | | | | (780,910) | | | | | | (780,910) | | | |
Change in Unrealized Appreciation/(Depreciation) | | | | | (140,396) | | | | | | (140,396) | | | |
Purchases | | | | | – | | | | | | – | | | |
Sales Proceeds | | | | | (733,204) | | | | | | (733,204) | | | |
Transfer into Level 3 | | | | | – | | | | | | – | | | |
Transfer out of Level 3 | | | | | – | | | | | | – | | | |
| | |
Balance as of April 30, 2016 | | | | $ | – | | | | | $ | – | | | |
| | |
Net change in unrealized Appreciation/(Depreciation) included in the Statements of Operations attributable to Level 3 investments held at April 30, 2016 | | | | $ | – | | | | | $ | – | | | |
| | | | | |
| Grandeur Peak Global Opportunities Fund | | | | Common Stocks | | | | | Total | | | |
| | |
Balance as of April 30, 2015 | | | | $ | 2,538,049 | | | | | $ | 2,538,049 | | | |
Accrued Discount/Premium | | | | | – | | | | | | – | | | |
Return of Capital | | | | | – | | | | | | – | | | |
Realized Gain/(Loss) | | | | | (1,387,639) | | | | | | (1,387,639) | | | |
Change in Unrealized Appreciation/(Depreciation) | | | | | (27,697) | | | | | | (27,697) | | | |
Purchases | | | | | – | | | | | | – | | | |
Sales Proceeds | | | | | (1,122,713) | | | | | | (1,122,713) | | | |
Transfer into Level 3 | | | | | – | | | | | | – | | | |
Transfer out of Level 3 | | | | | – | | | | | | – | | | |
| | |
Balance as of April 30, 2016 | | | | $ | – | | | | | $ | – | | | |
| | |
Net change in unrealized Appreciation/(Depreciation) included in the Statement of Operations attributable to Level 3 investments held at April 30, 2016 | | | | $ | – | | | | | $ | – | | | |
| | | | | |
| Grandeur Peak Global Reach Fund | | | | Common Stocks | | | | | Total | | | |
| | |
Balance as of April 30, 2015 | | | | $ | 706,018 | | | | | $ | 706,018 | | | |
Accrued Discount/Premium | | | | | – | | | | | | – | | | |
Return of Capital | | | | | – | | | | | | – | | | |
Realized Gain/(Loss) | | | | | (398,540) | | | | | | (398,540) | | | |
Change in Unrealized Appreciation/(Depreciation) | | | | | (122,267) | | | | | | (122,267) | | | |
Purchases | | | | | 718,715 | | | | | | 718,715 | | | |
Sales Proceeds | | | | | (313,404) | | | | | | (313,404) | | | |
Transfer into Level 3 | | | | | – | | | | | | – | | | |
Transfer out of Level 3 | | | | | (590,521) | | | | | | (590,521) | | | |
| | |
Balance as of April 30, 2016 | | | | $ | 1 | | | | | $ | 1 | | | |
| | |
Net change in unrealized Appreciation/(Depreciation) included in the Statement of Operations attributable to Level 3 investments held at April 30, 2016 | | | | $ | – | | | | | $ | – | | | |
| | |
| Annual Report | April 30, 2016 | | 77 |
| | |
| Grandeur Peak Funds® | | Notes to Financial Statements |
| | April 30, 2016 |
| | | | | | | | | | | | | | |
| Grandeur Peak International Opportunities Fund | | | | Common Stocks | | | | | Total | | | |
| | |
Balance as of April 30, 2015 | | | | $ | 2,070,865 | | | | | $ | 2,070,865 | | | |
Accrued Discount/Premium | | | | | – | | | | | | – | | | |
Return of Capital | | | | | – | | | | | | – | | | |
Realized Gain/(Loss) | | | | | (1,179,637) | | | | | | (1,179,637) | | | |
Change in Unrealized Appreciation/(Depreciation) | | | | | 23,304 | | | | | | 23,304 | | | |
Purchases | | | | | – | | | | | | – | | | |
Sales Proceeds | | | | | (914,532) | | | | | | (914,532) | | | |
Transfer into Level 3 | | | | | – | | | | | | – | | | |
Transfer out of Level 3 | | | | | – | | | | | | – | | | |
| | |
Balance as of April 30, 2016 | | | | $ | – | | | | | $ | – | | | |
| | |
Net change in unrealized Appreciation/(Depreciation) included in the Statement of Operations attributable to Level 3 investments held at April 30, 2016 | | | | $ | – | | | | | $ | – | | | |
Change in unrealized appreciation/depreciation on Level 3 securities is included on the Statements of Operations under Net change in unrealized appreciation/(depreciation) on investments. Realized gain (loss) on Level 3 securities is included on the Statements of Operations under Net realized gain/(loss) on investments. Due to the ability to obtain a closing market price within an active market for a security that previously had no market to trade, the security was transferred to level 1 for all Funds.
Investment Transactions and Investment Income: Investment transactions are accounted for on the date the investments are purchased or sold (trade date). Realized gains and losses from investment transactions are reported on an identified cost basis. Interest income, which includes accretion of discounts and amortization of premiums, is accrued and recorded as earned. Dividend income is recognized on the ex-dividend date or for certain foreign securities, as soon as information is available to the Funds. All of the realized and unrealized gains and losses and net investment income, are allocated daily to each class in proportion to its average daily net assets.
Cash Management Transactions: The Funds subscribe to the Brown Brothers Harriman & Co. (“BBH”) Cash Management Service (“CMS”), whereby cash balances are automatically swept into overnight offshore demand deposits with either the BBH Grand Cayman branch or a branch of a pre-approved commercial bank. This fully automated program allows the Funds to earn interest on cash balances. Excess cash with deposit institutions domiciled outside of the U.S. are subject to sovereign actions in the jurisdiction of the deposit institution including, but not limited to, freeze, seizure or diminution. Cash balances in the BBH CMS are included on the Statements of Assets and Liabilities under Cash and Foreign Cash, at Value. As of April 30, 2016, the Funds had the following cash balances participating in the BBH CMS:
| | | | | | |
| Fund | | | | | |
Grandeur Peak Emerging Markets Opportunities Fund | | $ | 29,288,198 | | | |
Grandeur Peak Global Micro Cap Fund | | | 531,990 | | | |
Grandeur Peak Global Opportunities Fund | | | 12,011,334 | | | |
Grandeur Peak Global Reach Fund | | | 5,559,837 | | | |
Grandeur Peak Global Stalwarts Fund | | | 2,062,563 | | | |
Grandeur Peak International Opportunities Fund | | | 28,609,396 | | | |
Grandeur Peak International Stalwarts Fund | | | 6,319,568 | | | |
As of April 30, 2016, the Funds had the following foreign cash balances participating in the BBH CMS (cost and value of foreign cash balances are equal):
| | | | | | |
| Fund | | | | | |
Grandeur Peak Emerging Markets Opportunities Fund | | $ | 119 | | | |
Grandeur Peak Global Micro Cap Fund | | | 30,680 | | | |
Grandeur Peak Global Opportunities Fund | | | 798,615 | | | |
Grandeur Peak Global Reach Fund | | | 340,567 | | | |
Grandeur Peak Global Stalwarts Fund | | | 11,808 | | | |
Grandeur Peak International Opportunities Fund | | | 806,918 | | | |
Grandeur Peak International Stalwarts Fund | | | 16,794 | | | |
| | |
| 78 | | 1.855.377.7325 | www.GrandeurPeakGlobal.com |
| | |
| Grandeur Peak Funds® | | Notes to Financial Statements |
| | April 30, 2016 |
Foreign Securities: The Funds may directly purchase securities of foreign issuers. Investing in securities of foreign issuers involves special risks not typically associated with investing in securities of U.S. issuers. The risks include possible reevaluation of currencies, the inability to repatriate foreign currency, less complete financial information about companies and possible future adverse political and economic developments. Moreover, securities of many foreign issuers and their markets may be less liquid and their prices more volatile than those of securities of comparable U.S. issuers.
Foreign Currency Translation: The books and records of the Funds are maintained in U.S. dollars. Investment valuations and other assets and liabilities initially expressed in foreign currencies are converted each business day into U.S. dollars based upon current exchange rates. Prevailing foreign exchange rates may generally be obtained at the close of the NYSE (normally, 4:00 p.m. Eastern Time). The portion of realized and unrealized gains or losses on investments due to fluctuations in foreign currency exchange rates is not separately disclosed and is included in realized and unrealized gains or losses on investments, when applicable.
Foreign Currency Spot Contracts: The Funds may enter into foreign currency spot contracts to facilitate transactions in foreign securities or to convert foreign currency receipts into U.S. dollars. A foreign currency spot contract is an agreement between two parties to buy and sell currencies at the current market rate, for settlement generally within two business days. The U.S. dollar value of the contracts is determined using current currency exchange rates supplied by a pricing service.
The contract is marked-to-market daily for settlements beyond one day and any change in market value is recorded as an unrealized gain or loss. When the contract is closed, a realized gain or loss is recorded equal to the difference between the value on the open and close date. Losses may arise from changes in the value of the foreign currency, or if the counterparties do not perform under the contract’s terms. The maximum potential loss from such contracts is the aggregate face value in U.S. dollars at the time the contract was opened.
Trust Expenses: Some expenses of the Trust can be directly attributed to the Funds. Expenses which cannot be directly attributed to the Funds are apportioned among all funds in the Trust based on average net assets of each fund.
Fund and Class Expenses: Expenses that are specific to a Fund or class of shares of a Fund, including distribution fees (Rule 12b-1 fees), are charged directly to that Fund or share class. Expenses that are common to all Funds generally are allocated among the Funds in proportion to their average daily net assets.
Offering Costs: Offering costs, including costs of printing initial prospectuses, legal and registration fees, are being amortized over twelve months from the inception date of the Funds. Amounts amortized during the period ended April 30, 2016 for the Grandeur Peak Micro Cap Fund, Grandeur Peak Global Stalwarts Fund, and Grandeur Peak International Stalwarts Fund are shown on the Statements of Operations. As of April 30, 2016, the Grandeur Peak Emerging Markets Opportunities Fund, Grandeur Peak Global Opportunities Fund, Grandeur Peak Global Reach Fund, and Grandeur Peak International Opportunities Fund fully amortized all offering costs.
Federal Income Taxes: The Funds comply with the requirements under Subchapter M of the Internal Revenue Code of 1986, as amended, applicable to regulated investment companies and intend to distribute substantially all of their net taxable income and net capital gains, if any, each year so that it will not be subject to excise tax on undistributed income and gains. The Funds are not subject to income taxes to the extent such distributions are made.
As of and during the year ended April 30, 2016, the Grandeur Peak Emerging Markets Opportunities Fund, the Grandeur Peak Global Stalwarts Fund, and the Grandeur Peak International Stalwarts Fund had a liability for unrecognized capital gains tax in the amount of $67,101, $24,016, and $132,482 respectively. The Funds file U.S. federal, state, and local tax returns as required. The Funds’ tax returns are subject to examination by the relevant tax authorities until expiration of the applicable statute of limitations, which is generally three years after the filing of the tax return for federal purposes and four years for most state returns. Tax returns for open years have incorporated no uncertain tax positions that require a provision for income taxes.
Distributions to Shareholders: Each Fund normally pays dividends and distributes capital gains, if any, on an annual basis. Income dividend distributions are derived from dividends and other income each Fund receives from their investments, including short term capital gains. Long term capital gain distributions are derived from gains realized when each Fund sells a security it has owned for more than a year. Each Fund may make additional distributions and dividends at other times if the portfolio manager believes doing so may be necessary for each Fund to avoid or reduce taxes. The Funds intend to pass through foreign tax credits to shareholders.
| | |
| Annual Report | April 30, 2016 | | 79 |
| | |
| Grandeur Peak Funds® | | Notes to Financial Statements |
| | April 30, 2016 |
3. TAX BASIS INFORMATION
Reclassifications: As of April 30, 2016, permanent differences in book and tax accounting were reclassified. These differences had no effect on net assets and are primarily attributed to the differing book/tax treatment of foreign currency transactions, non-deductible expenses, PFIC investments, book/tax distribution differences and certain other investments. The reclassifications were as follows:
| | | | | | | | | | | | |
| Fund | | Paid-in Capital | | | Accumulated Net Investment Income/(Loss) | | | Accumulated Net Realized Gain/(Loss) on Investments | |
Grandeur Peak Emerging Markets Opportunities Fund | | $ | 84,013 | | | $ | (662,562) | | | $ | 578,549 | |
Grandeur Peak Global Micro Cap Fund | | | (55,641) | | | | 45,903 | | | | 9,738 | |
Grandeur Peak Global Opportunities Fund | | | 909,015 | | | | (332,520) | | | | (576,495) | |
Grandeur Peak Global Reach Fund | | | 104,299 | | | | (201,928) | | | | 97,629 | |
Grandeur Peak Global Stalwarts Fund | | | (32,737) | | | | 95,321 | | | | (62,584) | |
Grandeur Peak International Opportunities Fund | | | 570,787 | | | | (980,672) | | | | 409,885 | |
Grandeur Peak International Stalwarts Fund | | | (32,313) | | | | 351,803 | | | | (319,490) | |
The Grandeur Peak Global Micro Cap Fund included the amounts reclassified was a net operating loss offset of $40,367.
Tax Basis of Investments: As of April 30, 2016, the aggregate cost of investments, gross unrealized appreciation/(depreciation) and net unrealized appreciation for Federal tax purposes was as follows:
| | | | | | | | | | | | | | | | | | | | |
| | | Gross
Appreciation
(excess of value
over tax cost) | | | Gross
Depreciation
(excess of tax
cost over value) | | | Net
Appreciation/ (Depreciation)
of Foreign
Currency | | | Net Unrealized
Appreciation/ (Depreciation) | | | Cost of
Investments for
Income Tax
Purposes | |
Grandeur Peak Emerging Markets Opportunities Fund | | $ | 40,349,756 | | | $ | (52,391,592) | | | $ | (50,219) | | | $ | (12,092,055) | | | $ | 352,153,162 | |
Grandeur Peak Global Micro Cap Fund | | | 3,087,136 | | | | (1,716,239) | | | | 4,346 | | | | 1,375,243 | | | | 28,843,434 | |
Grandeur Peak Global Opportunities Fund | | | 139,406,464 | | | | (65,299,348) | | | | 10,309 | | | | 74,117,425 | | | | 538,036,220 | |
Grandeur Peak Global Reach Fund | | | 44,139,437 | | | | (31,398,558) | | | | 12,631 | | | | 12,753,510 | | | | 270,006,327 | |
Grandeur Peak Global Stalwarts Fund | | | 3,186,587 | | | | (1,040,392) | | | | (20,906) | | | | 2,125,289 | | | | 32,128,322 | |
Grandeur Peak International Opportunities Fund | | | 134,047,172 | | | | (64,526,244) | | | | 54,330 | | | | 69,575,258 | | | | 597,054,294 | |
Grandeur Peak International Stalwarts Fund | | | 10,903,498 | | | | (4,236,737) | | | | (114,036) | | | | 6,552,725 | | | | 124,633,072 | |
Components of Earnings: As of April 30, 2016, components of distributable earnings on a tax basis were as follows:
| | | | | | | | | | | | | | | | |
| | | Undistributed Ordinary Income | | | Accumulated Capital
Gains/(Losses) | | | Net Unrealized
Appreciation/ (Depreciation)
on Investments and
Foreign Currency | | | Total Distributable
Earnings | |
Grandeur Peak Emerging Markets Opportunities Fund | | $ | 895,515 | | | $ | (13,049,943) | | | $ | (12,092,055) | | | $ | (24,246,483) | |
Grandeur Peak Global Micro Cap Fund | | | – | | | | (81,278) | | | | 1,375,243 | | | | 1,293,965 | |
Grandeur Peak Global Opportunities Fund | | | – | | | | – | | | | 74,117,425 | | | | 74,117,425 | |
Grandeur Peak Global Reach Fund | | | – | | | | (12,173,420) | | | | 12,753,510 | | | | 580,090 | |
Grandeur Peak Global Stalwarts Fund | | | 108,751 | | | | (229,107) | | | | 2,125,289 | | | | 2,004,933 | |
Grandeur Peak International Opportunities Fund | | | 1,028,951 | | | | (1,069,931) | | | | 69,575,258 | | | | 69,534,278 | |
Grandeur Peak International Stalwarts Fund | | | 628,490 | | | | (1,650,360) | | | | 6,552,725 | | | | 5,530,855 | |
Tax Basis of Distributions to Shareholders: The character of distributions made during the year from net investment income or net realized gains may differ from its ultimate characterization for federal income tax purposes. Also, due to the timing of dividend distributions, the fiscal year in which amounts are distributed may differ from the fiscal year in which the income or realized gain were recorded by the Funds.
| | |
| 80 | | 1.855.377.7325 | www.GrandeurPeakGlobal.com |
| | |
| Grandeur Peak Funds® | | Notes to Financial Statements |
| | April 30, 2016 |
The tax character of distributions paid by the Funds for the fiscal year and or period ended April 30, 2016 were as follows:
| | | | | | | | |
| | | Ordinary Income | | | Long-Term Capital
Gain | |
Grandeur Peak Emerging Markets Opportunities Fund | | $ | 37 | | | $ | 13,091,570 | |
Grandeur Peak Global Micro Cap Fund | | | – | | | | – | |
Grandeur Peak Global Opportunities Fund | | | 4,220,786 | | | | 45,472,588 | |
Grandeur Peak Global Reach Fund | | | 4,111,213 | | | | 7,292,064 | |
Grandeur Peak Global Stalwarts Fund | | | 12,473 | | | | – | |
Grandeur Peak International Opportunities Fund | | | 5,508,633 | | | | 28,796,865 | |
Grandeur Peak International Stalwarts Fund | | | 30,017 | | | | – | |
The tax character of distributions paid by the Funds for the fiscal year and or period ended April 30, 2015 were as follows:
| | | | | | | | |
| | | Ordinary Income | | | Long-Term Capital
Gain | |
Grandeur Peak Emerging Markets Opportunities Fund | | $ | 10,934,864 | | | $ | 44,691 | |
Grandeur Peak Global Opportunities Fund | | | 9,456,832 | | | | 37,925,629 | |
Grandeur Peak Global Reach Fund | | | 3,157,372 | | | | 885,418 | |
Grandeur Peak International Opportunities Fund | | | 19,542,293 | | | | 32,521,839 | |
As of April 30, 2016, the following Funds had available for Federal income tax purposes unused capital losses that may be used to offset future realized capital gains. The following losses will be carried forward indefinitely to offset future realized gains:
| | | | | | | | |
| Fund | | Short-Term | | | Long-Term | |
Grandeur Peak Emerging Markets Opportunities | | $ | 4,370,674 | | | $ | – | |
Grandeur Peak International Opportunities | | | 161,958 | | | | – | |
Grandeur Peak International Stalwarts | | | 8,620 | | | | – | |
The Fund elects to defer to the period ending April 30, 2017, capital losses recognized during the period November 1, 2015 to April 30, 2016 in the amount of:
| | | | |
| Fund | | Capital Losses Recognized | |
Grandeur Peak Emerging Markets Opportunities | | $ | 8,679,269 | |
Grandeur Peak Global Micro Cap | | | 81,278 | |
Grandeur Peak Global Reach | | | 12,173,420 | |
Grandeur Peak Global Stalwarts | | | 229,107 | |
Grandeur Peak International Opportunities | | | 907,973 | |
Grandeur Peak International Stalwarts | | | 1,641,740 | |
4. SECURITIES TRANSACTIONS
The cost of purchases and proceeds from sales of securities (excluding short term securities) during the year ended April 30, 2016 were as follows:
| | | | | | | | | | |
| Fund | | Purchases of Securities | | | Proceeds From Sales of
Securities | | | |
Grandeur Peak Emerging Markets Opportunities Fund | | $ | 145,096,371 | | | $ | 170,867,458 | | | |
Grandeur Peak Global Micro Cap Fund | | | 30,761,668 | | | | 1,850,649 | | | |
Grandeur Peak Global Opportunities Fund | | | 208,367,901 | | | | 274,322,261 | | | |
Grandeur Peak Global Reach Fund | | | 142,356,988 | | | | 174,573,388 | | | |
Grandeur Peak Global Stalwarts Fund | | | 38,014,050 | | | | 5,616,546 | | | |
Grandeur Peak International Opportunities Fund | | | 243,622,862 | | | | 312,361,003 | | | |
Grandeur Peak International Stalwarts Fund | | | 175,332,106 | | | | 49,048,679 | | | |
| | |
| Annual Report | April 30, 2016 | | 81 |
| | |
| Grandeur Peak Funds® | | Notes to Financial Statements |
| | April 30, 2016 |
5. SHARES OF BENEFICIAL INTEREST
The capitalization of the Trust consists of an unlimited number of shares of beneficial interest with no par value per share. Holders of the shares of the Funds of the Trust have one vote for each share held and a proportionate fraction of a vote for each fractional share. All shares issued and outstanding are fully paid and are transferable and redeemable at the option of the shareholder. Purchasers of the share do not have any obligation to make payments to the Trust or its creditors solely by reason of the purchasers’ ownership of the shares. Shares have no pre-emptive rights.
Shares redeemed within 60 days of purchase may incur a 2% short-term redemption fee deducted from the redemption amount. For the year ended April 30, 2016 and the year ended April 30, 2015, the redemption fees charged by the Funds are presented in the Statements of Changes in Net Assets.
6. MANAGEMENT AND RELATED-PARTY TRANSACTIONS
The Adviser, subject to the authority of the Board, is responsible for the overall management and administration of the Funds’ business affairs. The Adviser manages the investments of the Funds in accordance with the Funds’ investment objective, policies and limitations and investment guidelines established jointly by the Adviser and the Trustees. Pursuant to the Advisory Agreement, (the “Advisory Agreement”), each Fund pays the Adviser an annual management fee based on each Fund’s average daily net assets. The management fee is paid on a monthly basis. The following table reflects the Funds’ advisory fee rates.
| | | | |
| Fund | | Advisory Fee | | |
Grandeur Peak Emerging Markets Opportunities Fund | | 1.35% | | |
Grandeur Peak Global Micro Cap Fund | | 1.50% | | |
Grandeur Peak Global Opportunities Fund | | 1.25% | | |
Grandeur Peak Global Reach Fund | | 1.10% | | |
Grandeur Peak Global Stalwarts Fund | | 0.80% | | |
Grandeur Peak International Opportunities Fund | | 1.25% | | |
Grandeur Peak International Stalwarts Fund | | 0.80% | | |
The Adviser has contractually agreed to limit certain of each Funds’ expenses. The following table reflects the Funds’ expense cap.
| | | | | | |
| Fund | | Expense Cap | | Term of Expense Limit Agreements | | |
Grandeur Peak Emerging Markets Opportunities Fund | | | | | | |
Investor Class | | 1.95% | | September 1, 2015 – August 31, 2016 / | | |
Institutional Class | | 1.70% | | June 10, 2014 – August 31, 2015 | | |
Grandeur Peak Global Micro Cap Fund | | | | | | |
Investor Class | | 2.25% | | June 29, 2015 – August 31, 2016 | | |
Institutional Class | | 2.00% | | | | |
Grandeur Peak Global Opportunities Fund | | | | | | |
Investor Class | | 1.75% | | September 1, 2015 – August 31, 2016 / | | |
Institutional Class | | 1.50% | | June 10, 2014 – August 31, 2015 | | |
Grandeur Peak Global Reach Fund | | | | | | |
Investor Class | | 1.60% | | September 1, 2015 – August 31, 2016 / | | |
Institutional Class | | 1.35% | | June 10, 2014 – August 31, 2015 | | |
Grandeur Peak Global Stalwarts Fund | | | | | | |
Investor Class | | 1.35% | | June 29, 2015 – August 31, 2016 | | |
Institutional Class | | 1.10% | | | | |
Grandeur Peak International Opportunities Fund | | | | | | |
Investor Class | | 1.75% | | September 1, 2015 – August 31, 2016 / | | |
Institutional Class | | 1.50% | | June 10, 2014 – August 31, 2015 | | |
Grandeur Peak International Stalwarts Fund | | | | | | |
Investor Class | | 1.35% | | June 29, 2015 – August 31, 2016 | | |
Institutional Class | | 1.10% | | | | |
Pursuant to these agreements, each Fund will reimburse the Adviser for any fee waivers and expense reimbursements made by the Adviser, provided that any such reimbursements made by the Funds to the Adviser will not cause the Funds’ expense limitation to exceed expense
| | |
| 82 | | 1.855.377.7325 | www.GrandeurPeakGlobal.com |
| | |
| Grandeur Peak Funds® | | Notes to Financial Statements |
| | April 30, 2016 |
limitations in existence at the time the expense was incurred, or at the time of the reimbursement, whichever is lower, and the reimbursement is made within three years after the expenses were incurred. Fees waived/reimbursed by adviser for the year ended April 30, 2016 are disclosed in the Statements of Operations.
For the year ended April 30, 2016, the fee waivers/reimbursements and/or recoupments were as follows:
| | | | | | | | |
| Fund | | Fees
Waived/Reimbursed
By Adviser | | | Recoupment of Previously Waived Fees By Adviser | |
Grandeur Peak Emerging Markets Opportunities Fund | | | | | | | | |
Investor Class | | $ | – | | | $ | – | |
Institutional Class | | | – | | | | – | |
Grandeur Peak Global Micro Cap Fund | | | | | | | | |
Investor Class | | $ | – | | | $ | – | |
Institutional Class | | | 44,561 | | | | – | |
Grandeur Peak Global Opportunities Fund | | | | | | | | |
Investor Class | | $ | – | | | $ | – | |
Institutional Class | | | – | | | | – | |
Grandeur Peak Global Reach Fund | | | | | | | | |
Investor Class | | $ | – | | | $ | 45,810 | |
Institutional Class | | | – | | | | 98,314 | |
Grandeur Peak Global Stalwarts Fund | | | | | | | | |
Investor Class | | $ | 56,762 | | | $ | – | |
Institutional Class | | | 55,389 | | | | – | |
Grandeur Peak International Opportunities Fund | | | | | | | | |
Investor Class | | $ | – | | | $ | – | |
Institutional Class | | | – | | | | – | |
Grandeur Peak International Stalwarts Fund | | | | | | | | |
Investor Class | | $ | 7,314 | | | $ | – | |
Institutional Class | | | 44,153 | | | | – | |
As of April 30, 2016, the balances of recoupable expenses for each Fund were as follows: | |
| Fund | | Expires 2019 | | | Total | |
Grandeur Peak Emerging Markets Opportunities Fund | | | | | | | | |
Investor Class | | $ | – | | | $ | – | |
Institutional Class | | | – | | | | – | |
Grandeur Peak Global Micro Cap Fund | | | | | | | | |
Institutional Class | | $ | 44,561 | | | $ | 44,561 | |
Grandeur Peak Global Opportunities Fund | | | | | | | | |
Investor Class | | $ | – | | | $ | – | |
Institutional Class | | | – | | | | – | |
Grandeur Peak Global Reach Fund | | | | | | | | |
Investor Class | | $ | – | | | $ | – | |
Institutional Class | | | – | | | | – | |
Grandeur Peak Global Stalwarts Fund | | | | | | | | |
Investor Class | | $ | 56,762 | | | $ | 56,762 | |
Institutional Class | | | 55,389 | | | | 55,389 | |
Grandeur Peak International Opportunities Fund | | | | | | | | |
Investor Class | | $ | – | | | $ | – | |
Institutional Class | | | – | | | | – | |
Grandeur Peak International Stalwarts Fund | | | | | | | | |
Investor Class | | $ | 7,314 | | | $ | 7,314 | |
Institutional Class | | | 44,153 | | | | 44,153 | |
| | |
| Annual Report | April 30, 2016 | | 83 |
| | |
| Grandeur Peak Funds® | | Notes to Financial Statements |
| | April 30, 2016 |
Administrator Fees and Expenses
ALPS Fund Services, Inc. (“ALPS”) serves as administrator to the Funds and the Funds have agreed to pay expenses incurred in connection with their administrative activities. Pursuant to an Administration Agreement, ALPS provides operational services to the Funds including, but not limited to, fund accounting and fund administration and generally assists in the Funds’ operations. Officers of the Trust are employees of ALPS. The Funds’ administration fee is accrued on a daily basis and paid monthly. Administration fees paid by the Funds for the year ended April 30, 2016 are disclosed in the Statements of Operations.
ALPS is reimbursed by the Fund for certain out-of-pocket expenses.
Transfer Agent
ALPS serves as transfer, dividend paying and shareholder servicing agent for the Funds. ALPS receives an annual minimum fee, a fee based upon the number of shareholder accounts, and is also reimbursed by the Funds for certain out-of-pocket expenses. Transfer agent fees paid by the Funds for the year ended April 30, 2016 are disclosed in the Statements of Operations.
Compliance Services
ALPS provides services that assist the Trust’s chief compliance officer in monitoring and testing the policies and procedures of the Trust in conjunction with requirements under Rule 38a-1 under the 1940 Act and receives an annual base fee. ALPS is reimbursed for certain out-of-pocket expenses by the Funds. Compliance service fees paid by the Funds for the year ended April 30, 2016 are disclosed in the Statements of Operations.
Principal Financial Officer
ALPS receives an annual fee for providing principal financial officer services to the Funds. Principal financial officer fees paid by the Fund for the year ended April 30, 2016 are disclosed in the Statements of Operations.
Distributor: ALPS Distributors, Inc. (“ADI” or the “Distributor”) (an affiliate of ALPS) acts as the distributor of the Funds’ shares pursuant to a Distribution Agreement with the Trust. Shares are sold on a continuous basis by ADI as agent for the Funds, and ADI has agreed to use its best efforts to solicit orders for the sale of each Fund’s shares, although it is not obliged to sell any particular amount of shares. ADI is not entitled to any compensation for its services as Distributor. ADI is registered as a broker-dealer with the U.S. Securities and Exchange Commission.
Each Fund has adopted a Distribution and Services (Rule 12b-1) Plan pursuant to Rule 12b-1 of the 1940 Act (the “Plan”) for its Investor Class shares. The Plan allows the Funds to use Investor Class assets to pay fees in connection with the distribution and marketing of Investor Class shares and/or the provision of shareholder services to Investor Class shareholders. The Plan permits payment for services in connection with the administration of plans or programs that use Investor Class shares of each Fund as their funding medium and for related expenses. The recipients of such payments may include the Distributor, other affiliates of the Adviser, broker-dealers, financial institutions, plan sponsors and administrators and other financial intermediaries through which investors may purchase shares of the Fund. The Plan permits the Funds to make total payments at an annual rate of up to 0.25% of each Fund’s average daily net assets attributable to its Investor Class shares. The expenses of the Plan are reflected as distribution and service fees in the Statements of Operations.
7. INDEMNIFICATIONS
Under the Trust’s organizational documents, its officers and Trustees are indemnified against certain liability arising out of the performance of their duties to the Trust. Additionally, in the normal course of business, the Trust enters into contracts with service providers that may contain general indemnification clauses, which may permit indemnification to the extent permissible under applicable law. The Trust’s maximum exposure under these arrangements is unknown, as this would involve future claims that may be made against the Trust that have not yet occurred.
| | |
| 84 | | 1.855.377.7325 | www.GrandeurPeakGlobal.com |
| | |
| Grandeur Peak Funds® | | Report of Independent Registered Public Accounting Firm |
To the Shareholders and Board of Trustees of Financial Investors Trust:
We have audited the accompanying statements of assets and liabilities, including the portfolios of investments, of Grandeur Peak Emerging Markets Opportunities Fund, Grandeur Peak Global Micro Cap Fund, Grandeur Peak Global Opportunities Fund, Grandeur Peak Global Reach Fund, Grandeur Peak Global Stalwarts Fund, Grandeur Peak International Opportunities Fund, and Grandeur Peak International Stalwarts Fund, six of the portfolios constituting Financial Investors Trust, as of April 30, 2016, and the related statements of operations for the year then ended (as to the Grandeur Peak Global Micro Cap Fund, for the period from October 21, 2015 (commencement of operations) to April 30, 2016; and as to the Grandeur Peak Global Stalwarts Fund and Grandeur Peak International Stalwarts Fund, for the period from September 2, 2015 (commencement of operations) to April 30, 2016), the statements of changes in net assets for each of the two years in the period then ended (as to the Grandeur Peak Global Micro Cap Fund, for the period from October 21, 2015 (commencement of operations) to April 30, 2016; and as to the Grandeur Peak Global Stalwarts Fund and Grandeur Peak International Stalwarts Fund, for the period from September 2, 2015 (commencement of operations) to April 30, 2016), and the financial highlights for each of the periods presented. These financial statements and financial highlights are the responsibility of the Funds’ management. Our responsibility is to express an opinion on these financial statements and financial highlights based on our audits.
We conducted our audits in accordance with the standards of the Public Company Accounting Oversight Board (United States). Those standards require that we plan and perform the audit to obtain reasonable assurance about whether the financial statements and financial highlights are free of material misstatement. The Funds are not required to have, nor were we engaged to perform, an audit of their internal control over financial reporting. Our audits included consideration of internal control over financial reporting as a basis for designing audit procedures that are appropriate in the circumstances, but not for the purpose of expressing an opinion on the effectiveness of the Funds’ internal control over financial reporting. Accordingly, we express no such opinion. An audit also includes examining, on a test basis, evidence supporting the amounts and disclosures in the financial statements, assessing the accounting principles used and significant estimates made by management, as well as evaluating the overall financial statement presentation. Our procedures included confirmation of securities owned as of April 30, 2016, by correspondence with the custodian and brokers; when replies were not received from brokers, we performed other auditing procedures. We believe that our audits provide a reasonable basis for our opinion.
In our opinion, the financial statements and financial highlights referred to above present fairly, in all material respects, the financial position of Grandeur Peak Emerging Markets Opportunities Fund, Grandeur Peak Global Micro Cap Fund, Grandeur Peak Global Opportunities Fund, Grandeur Peak Global Reach Fund, Grandeur Peak Global Stalwarts Fund, Grandeur Peak International Opportunities Fund, and Grandeur Peak International Stalwarts Fund of Financial Investors Trust as of April 30, 2016, and the results of their operations, the changes in their net assets, and the financial highlights for each of the periods presented, in conformity with accounting principles generally accepted in the United States of America.
DELOITTE & TOUCHE LLP
Denver, Colorado
June 28, 2016
| | |
| Annual Report | April 30, 2016 | | 85 |
| | |
| Grandeur Peak Funds® | | Additional Information |
| | April 30, 2016 (Unaudited) |
1. FUND HOLDINGS
The Funds file their complete schedule of portfolio holdings with the Securities and Exchange Commission (the “SEC”) for the first and third quarters of each fiscal year on Form N-Q within 60 days after the end of the period. Copies of the Funds’ Form N-Q are available without charge on the SEC website at http://www.sec.gov. You may also review and copy the Form N-Q at the SEC’s Public Reference Room in Washington, DC. For more information about the operation of the Public Reference Room, please call the SEC at 1-800-SEC-0330.
2. FUND PROXY VOTING POLICIES, PROCEDURES AND SUMMARIES
The Funds’ policies and procedures used in determining how to vote proxies and information regarding how the Funds voted proxies relating to portfolio securities during the most recent prior 12-month period ending June 30 are available without charge, (1) upon request, by calling (toll-free) 855-377-PEAK(7325) and (2) on the SEC’s website at http://www.sec.gov.
3. TAX DESIGNATIONS
The Funds designate the following for federal income tax purposes for distributions made during the fiscal year ended April 30, 2016:
| | | | | | | | | | |
| | | Foreign Taxes Paid | | | Foreign Source Income | | | |
Global Opportunities Fund | | $ | 829,096 | | | $ | 9,251,144 | | | |
International Opportunities Fund | | $ | 1,392,363 | | | $ | 14,683,836 | | | |
Global Reach Fund | | $ | 429,369 | | | $ | 5,830,986 | | | |
Emerging Markets Opportunities Fund | | $ | 919,008 | | | $ | 9,251,208 | | | |
Global Micro Cap Fund | | $ | 21,008 | | | $ | 173,486 | | | |
Global Stalwarts Fund | | $ | 15,260 | | | $ | 119,152 | | | |
International Stalwarts Fund | | $ | 86,112 | | | $ | 627,502 | | | |
Of the distributions paid by the Funds from ordinary income for the calendar year ended December 31, 2015, the following percentages met the requirements to be treated as qualifying for the corporate dividends received deduction and qualified dividend income:
| | | | | | | | |
| | | Dividend Received Deduction | | Qualified Dividend Income | | | |
Global Opportunities Fund | | 26.08% | | | 100% | | | |
International Opportunities Fund | | – | | | 100% | | | |
Global Reach Fund | | – | | | 81.42% | | | |
Emerging Markets Opportunities Fund | | – | | | – | | | |
Global Micro Cap Fund | | – | | | – | | | |
Global Stalwarts Fund | | 60.19% | | | 100% | | | |
International Stalwarts Fund | | – | | | 51.24% | | | |
In early 2016, if applicable, shareholders of record received this information for the distributions paid to them by the Funds during the calendar year 2015 via Form 1099. The Funds will notify shareholders in early 2017 of amounts paid to them by the Funds, if any, during the calendar year 2016.
Pursuant to Section 852(b)(3) of the Internal Revenue Code, the Funds designated the following as long-term capital gain dividends:
| | | | | | |
| | | Long-term Capital Gain | | | |
Global Opportunities Fund | | $ | 45,472,588 | | | |
International Opportunities Fund | | $ | 28,796,865 | | | |
Global Reach Fund | | $ | 7,292,064 | | | |
Emerging Markets Opportunities Fund | | $ | 13,091,570 | | | |
Global Micro Cap Fund | | | – | | | |
Global Stalwarts Fund | | | – | | | |
International Stalwarts Fund | | | – | | | |
The amounts above include $816,953 of earnings and profits distributed to shareholders on redemptions for the Global Opportunities Fund. All other funds did not include redemptions to shareholders as distributions of earnings and profit.
| | |
| 86 | | 1.855.377.7325 | www.GrandeurPeakGlobal.com |
| | |
| Grandeur Peak Funds® | | Trustees and Officers |
| | April 30, 2016 (Unaudited) |
Additional information regarding the Fund’s trustees is included in the Statement of Additional Information, which can be obtained without charge by calling 855-377-PEAK.
| | | | | | | | | | |
| INDEPENDENT TRUSTEES |
Name, Address* & Year of Birth | | Position(s) Held with Fund | | Term of Office and Length of Time Served | | Principal Occupation(s) During Past 5 Years** | | Number of Funds in Fund Complex Overseen by Trustee*** | | Other Directorships Held by Trustee During Past 5 Years** |
Mary K. Anstine, 1940 | | Trustee | | Ms. Anstine was elected at a special meeting of shareholders held on March 21, 1997 and re-elected at a special meeting of shareholders held on August 7, 2009. | | Ms. Anstine was formerly an Executive Vice President of First Interstate Bank of Denver until 1994, President/Chief Executive Officer of HealthONE Alliance, Denver, Colorado, from 1994 to 2004, and has been retired since 2004. Ms. Anstine is also Trustee/Director of AV Hunter Trust and Colorado Uplift Board. Ms. Anstine was formerly a Director of the Trust Bank of Colorado (later purchased and now known as Northern Trust Bank), HealthONE and Denver Area Council of the Boy Scouts of America, and a member of the American Bankers Association Trust Executive Committee. | | 34 | | Ms. Anstine is a Trustee of ALPS ETF Trust (20 funds); ALPS Variable Investment Trust (9 funds); Reaves Utility Income Fund (1 fund); and Westcore Trust (12 funds). |
John R. Moran, Jr., 1930 | | Trustee | | Mr. Moran was elected at a special meeting of shareholders held on March 21, 1997 and re-elected at a special meeting of shareholders held on August 7, 2009. | | Mr. Moran formerly served as President and CEO of The Colorado Trust, a private foundation serving the health and hospital community in the state of Colorado, from 1991 to 2007. During his career as an attorney from 1958 to 1991, Mr. Moran was formerly a partner with the firm of Kutak Rock & Campbell in Denver, Colorado and a member of the Colorado House of Representatives. Currently, Mr. Moran is a member of the Treasurer’s Investment Advisory Committee for the University of Colorado. | | 34 | | None. |
| | |
| Annual Report | April 30, 2016 | | 87 |
| | |
| Grandeur Peak Funds® | | Trustees and Officers |
| | April 30, 2016 (Unaudited) |
| | | | | | | | | | |
| INDEPENDENT TRUSTEES |
Name, Address* & Year of Birth | | Position(s) Held with Fund | | Term of Office and Length of Time Served | | Principal Occupation(s) During Past 5 Years** | | Number of Funds in Fund Complex Overseen by Trustee*** | | Other Directorships Held by Trustee During Past 5 Years** |
Jeremy W. Deems, 1976 | | Trustee | | Mr. Deems was appointed as a Trustee at the March 11, 2008 meeting of the Board of Trustees and elected at a special meeting of shareholders held on August 7, 2009. | | Mr. Deems is the Co-Founder, Chief Operations Officer and Chief Financial Officer of Green Alpha Advisors, LLC, a registered investment advisor, and Co-Portfolio Manager of the Shelton Green Alpha Fund. Prior to joining Green Alpha Advisors, Mr. Deems was CFO and Treasurer of Forward Management, LLC, ReFlow Management Co., LLC, ReFlow Fund, LLC, a private investment fund, and Sutton Place Management, LLC, an administrative services company, from 1998 to June 2007. From 2004 to 2005, Mr. Deems also served as Treasurer of the Forward Funds and the Sierra Club Funds. | | 34 | | Mr. Deems is a Trustee of ALPS ETF Trust (20 funds); ALPS Variable Investment Trust (9 funds), Reaves Utility Income Fund (1 fund) and Clough Funds Trust (1 fund). |
Jerry G. Rutledge, 1944 | | Trustee | | Mr. Rutledge was elected at a special meeting of shareholders held on August 7, 2009. | | Mr. Rutledge is the President and owner of Rutledge’s Inc., a retail clothing business. Mr. Rutledge is currently Director of the American National Bank. He was from 1994 to 2007 a Regent of the University of Colorado. | | 34 | | Mr. Rutledge is a Trustee of Principal Real Estate Fund (1 fund), Clough Global Allocation Fund (1 fund), Clough Global Equity Fund (1 fund) and Clough Global Opportunities Fund (1 fund). |
Michael “Ross” Shell, 1970 | | Trustee | | Mr. Shell was elected at a special meeting of shareholders held on August 7, 2009. | | Mr. Shell is Founder and CEO of Red Idea, LLC, a strategic consulting/early stage venture firm (since June 2008). From 1999 to 2009, he was a part-owner and Director of Tesser, Inc., a brand agency. From December 2005 to May 2008, he was Director, Marketing and Investor Relations, of Woodbourne, a REIT/real estate hedge fund and private equity firm. Prior to this, from May 2004 to November 2005, he worked as a business strategy consultant; from June 2003 to April 2004, he was on the Global Client Services team of IDEO, a product design/innovation firm; and from 1999 to 2003, he was President of Tesser, Inc. Mr. Shell graduated with honors from Stanford University with a degree in Political Science. | | 34 | | None. |
| | |
| 88 | | 1.855.377.7325 | www.GrandeurPeakGlobal.com |
| | |
| Grandeur Peak Funds® | | Trustees and Officers |
| | April 30, 2016 (Unaudited) |
| | | | | | | | | | |
| INTERESTED TRUSTEE |
Name,
Address* & Age | | Position(s) Held with Fund | | Term of Office and Length of
Time Served | | Principal Occupation(s)
During Past 5 Years** | | Number of
Funds in
Fund
Complex
Overseen by
Trustee*** | | Other Directorships
Held by Trustee |
Edmund J. Burke, 1961 | | Trustee, Chairman and President | | Mr. Burke was elected as Chairman at the August 28, 2009 meeting of the Board of Trustees. Mr. Burke was elected as Trustee at a special meeting of shareholders held on August 7, 2009. Mr. Burke was elected President of the Trust at the December 17, 2002 meeting of the Board of Trustees. | | Mr. Burke is President and a Director of ALPS Holdings, Inc. (“AHI”) (since 2005) and Director of Boston Financial Data Services, Inc. (“BFDS”), ALPS Advisors, Inc. (“AAI”), ALPS Distributors, Inc. (“ADI”), ALPS Fund Services, Inc. (“AFS”) and ALPS Portfolio Solutions Distributor, Inc. (“APSD”) and from 2001-2008, was President of AAI, ADI, AFS and APSD. Because of his positions with AHI, BFDS, AAI, ADI, AFS and APSD, Mr. Burke is deemed an affiliate of the Trust as defined under the 1940 Act. Mr. Burke is Trustee and President of the Clough Global Allocation Fund (Trustee since 2006; President since 2004); Trustee and President of the Clough Global Equity Fund (Trustee since 2006; President since 2005); Trustee and President of the Clough Global Opportunities Fund (since 2006); Trustee of the Liberty All-Star Equity Fund; and Director of the Liberty All-Star Growth Fund, Inc. | | 34 | | Mr. Burke is a Trustee of Clough Global Allocation Fund (1 fund); Clough Global Equity Fund (1 fund); Clough Global Opportunities Fund (1 fund); Liberty All-Star Equity Fund (1 fund) and Clough Funds Trust (1 fund); and Director of the Liberty All-Star Growth Fund, Inc. (1 fund). |
| | |
| Annual Report | April 30, 2016 | | 89 |
| | |
| Grandeur Peak Funds® | | Trustees and Officers |
| | April 30, 2016 (Unaudited) |
OFFICERS
| | | | | | |
Name, Address* & Year of Birth | | Position(s) Held with Fund | | Term of Office and Length of Time Served | | Principal Occupation(s) During Past 5 Years** |
Kimberly R. Storms, 1972 | | Treasurer | | Ms. Storms was elected Treasurer of the Trust at the March 12, 2013 meeting of the Board of Trustees. | | Ms. Storms is Senior Vice President - Director of Fund Administration of ALPS. Because of her position with ALPS, Ms. Storms is deemed an affiliate of the Trust as defined under the 1940 Act. Ms. Storms is also Treasurer of Liberty All-Star Equity Fund, Liberty All-Star Growth Fund, Inc. and ALPS Series Trust. Ms. Storms also serves as a Board member and Treasurer of The Center for Trauma & Resilience, a nonprofit agency. |
JoEllen L. Legg, 1961 | | Secretary | | Ms. Legg was elected Secretary of the Trust at the September 15, 2015 meeting of the Board of Trustees. | | Ms. Legg joined ALPS in October 2007 and is currently Vice President, Assistant General Counsel of ALPS. Prior to joining ALPS, Ms. Legg served as Senior Counsel - Law (Corporate & Securities) for Adelphia Communications Corporation (February 2005 - March 2007). Prior to this, Ms. Legg held associate positions at Fried Frank Harris Shriver & Jacobson LLP (1998 - 2004) and at Patton Boggs LLP (2004 - 2005). Because of her position with ALPS, Ms. Legg is deemed an affiliate of the Trust as defined under the 1940 Act. Ms. Legg is also the Secretary of ALPS Series Trust and Reaves Utility Income Fund. |
Ted Uhl, 1974 | | Chief Compliance Officer (“CCO”) | | Mr. Uhl was appointed CCO of the Trust at the June 8, 2010 meeting of the Board of Trustees. | | Mr. Uhl joined ALPS in October 2006, and is currently Deputy Compliance Officer of ALPS. Prior to his current role, Mr. Uhl served as Senior Risk Manager for ALPS from October 2006 until June 2010. Because of his position with ALPS, Mr. Uhl is deemed an affiliate of the Trust as defined under the 1940 Act. Mr. Uhl is also CCO of the Reaves Utility Income Fund, Centre Funds and Transparent Value Trust. |
Jennell Panella, 1974 | | Assistant Treasurer | | Ms. Panella was elected Assistant Treasurer of the Trust at the September 15, 2015 meeting of the Board of Trustees. | | Ms. Panella joined ALPS in June 2012 and is currently Fund Controller of ALPS Fund Services, Inc. Prior to joining ALPS, Ms. Panella served as Financial Reporting Manager for Parker Global Strategies, LLC (2009-2012). Because of her position with ALPS, Ms. Panella is deemed an affiliate of the Trust as defined under the 1940 Act. Ms. Panella also serves as Assistant Treasurer of James Advantage Funds. |
Nate Mandeville, 1977 | | Assistant Treasurer | | Mr. Mandeville was elected Assistant Treasurer of the Trust at the September 15, 2015 meeting of the Board of Trustees. | | Mr. Mandeville joined ALPS in December 2013 and is Fund Controller for ALPS. Prior to joining ALPS, Mr. Mandeville worked for Great-West Financial (2011-2013), Virtuoso Sourcing Group (2008-2011) and Janus Capital Group (2000-2008). Because of his position with ALPS, Mr. Mandeville is deemed an affiliate of the Trust as defined under the 1940 Act. Mr. Mandeville also serves as Assistant Treasurer of ALPS Series Trust. |
| | |
| 90 | | 1.855.377.7325 | www.GrandeurPeakGlobal.com |
| | |
| Grandeur Peak Funds® | | Trustees and Officers |
| | April 30, 2016 (Unaudited) |
OFFICERS
| | | | | | |
Name, Address* & Year of Birth | | Position(s) Held with Fund | | Term of Office and Length of Time Served | | Principal Occupation(s) During Past 5 Years** |
Sharon Akselrod, 1974 | | Assistant Secretary | | Ms. Akselrod was elected Assistant Secretary of the Trust at the September 15, 2015 meeting of the Board of Trustees. | | Ms. Akselrod joined ALPS in August 2014 and is currently Senior Investment Company Act Paralegal of ALPS. Prior to joining ALPS, Ms. Akselrod served as Corporate Governance and Regulatory Associate for Nordstrom fsb (2013-2014) and Senior Legal Assistant – Legal Manager for AXA Equitable Life Insurance Company (2008-2013). Because of her position with ALPS, Ms. Akselrod is deemed an affiliate of the Trust as defined under the 1940 Act. |
Sareena Khwaja-Dixon 1980 | | Assistant Secretary | | Ms. Khwaja-Dixon was elected Assistant Secretary of the Trust at the December 15, 2015 meeting of the Board of Trustees. | | Ms. Khwaja-Dixon joined ALPS in August 2015 and is currently Senior Counsel and Vice President of ALPS. Prior to joining ALPS, Ms. Khwaja-Dixon served as a Senior Paralegal/Paralegal for Russell Investments (2011- 2015). Because of her position with ALPS, Ms. Khwaja-Dixon is deemed an affiliate of the Trust as defined under the 1940 Act. |
| * | All communications to Trustees and Officers may be directed to Financial Investors Trust c/o 1290 Broadway, Suite 1100, Denver, CO 80203. |
| ** | This is the period for which the Trustee or Officer began serving the Trust. Each Trustee and/or Officer serves an indefinite term, until his successor is elected. Officers are elected on an annual basis. |
| *** | Except as otherwise indicated, each individual has held the office shown or other offices in the same company for the last five years. |
| **** | The Fund Complex includes all series of the Trust (currently 34) and any other investment companies for which Grandeur Peak Global Advisors LLC provides investment advisory services (currently none). |
| | |
| Annual Report | April 30, 2016 | | 91 |

Contact Us
| | | | | | |
| | | |
| Mail: | | Grandeur Peak Funds, P.O. Box 13664, Denver, CO 80201 | | E-Mail: | | grandeurpeakglobal@alpsinc.com |
| | | |
| Phone: | | 1.855.377.PEAK (7325) | | Web: | | www.GrandeurPeakGlobal.com |
PATHWAY
ADVISORS FUNDS
ANNUAL
April 30, 2016
Pathway Advisors Conservative Fund | PWCNX
Pathway Advisors Aggressive Growth Fund | PWAGX
TABLE OF CONTENTS
| | |
| Pathway Advisors Funds | | Shareholder Letter |
| | April 30, 2016 (Unaudited) |
May 18, 2016
Dear Shareholder:
Below is a table of our year-to-date and one year performance as of 4/30/16. We’ve also included the annualized since inception return through the same period
| | | | | | |
| | | Calendar YTD | | One Year | | Since Inception |
Pathway Advisors Conservative | | 1.49% | | -2.63% | | 2.55% |
Pathway Advisors Aggressive Growth | | 1.97% | | -5.43% | | 6.94% |
The performance data quoted represents past performance. Past performance does not guarantee future results. The investment return and principal value of an investment will fluctuate so that an Investor’s shares, when redeemed, may not be worth more or less than their original cost and current performance may be lower or higher than the performance quoted. To obtain the most recent month-end performance data, please call 1-888-288-1121 or visit www.pathwayadvisorsfunds.com.
Hanson McClain, Inc. (the “Adviser”) has agreed contractually to limit the amount of the Fund’s total annual expenses, exclusive of Acquired Fund Fees and Expenses, brokerage expenses, interest expenses, taxes and extraordinary expenses, to 1.88% of the Fund’s average daily net assets. This agreement is in effect through August 31, 2016. The Adviser will be permitted to recover expenses it has borne through the agreement described above to the extent that the Fund’s expenses in later periods fall below the annual rates set forth in the relevant agreement. The Fund will not be obligated to pay any such deferred fees and expenses more than three years after the end of the fiscal year in which the fees and expense were deferred. The Adviser may not discontinue or modify this waiver without the approval by the Fund’s Board of Trustees.
The factors that helped the Aggressive fund the most for the last year were exposure to liquid alternatives, fixed income exposure, and some individual manager performance. The factors that helped the Conservative fund the most for the last year were domestic equities, liquid alternatives, and our balanced exposure. The first four months of the year have been a roller-coaster ride, first with concerns of China’s economy and capital markets and a glut of oil supply that saw oil prices briefly trade in the mid-$20’s per barrel, and second as the Federal Reserve (the “Fed”) walked back or talked down its need to raise rates in the immediate future. This along with oil prices and high yield spreads coming back down gave room for investors to regain some confidence in the equity markets and the diminishing prospect of a recession. The bounce back in commodity prices also saw a welcome decline in the US dollar relative to other currencies. This is both welcome to multinational corporations that translate much of their profits back to dollars as well as for investors in overseas markets. While the concerns of slower global growth have not abated recently, there does seem to be a more dovish tone with the Federal Reserve as it relates to the timing and extent of future rate hikes. Higher consumer prices and, particularly, higher wage growth will need to be robust enough to warrant hikes, given that much of the developed and emerging world is dealing with very slow growth, and in several cases, negative interest rates. With oil prices now back up near $50 per barrel and retail sales showing signs of weakness, a Fed that is more apt to keep rates lower for longer may be necessary should domestic growth slow further.
| | |
| Annual Report | April 30, 2016 | | 1 |
| | |
| Pathway Advisors Funds | | Shareholder Letter |
| | April 30, 2016 (Unaudited) |
Adding to the uncertainty this year also is the path of Donald Trump as the presumptive GOP nominee and the prolonged battle between democratic presumptive nominee Hillary Clinton and Bernie Sanders. There is an aura of populism and “anti-establishment” that is in the air, not only in our country, but also in several places overseas. To the extent that trade agreements, that have long been a part of several integrated economies, are possibly put at risk of breaking or being renegotiated, this will only add to the unusual uncertainty that we are experiencing. Added still are concerns about aging demographics in the developed world and the battle between social policies to raise wages and the ability for companies to use more automation, there is the potential for the income gap to actually widen instead of shrinking. This fuels the angst and discontent of many, but without really addressing how the problem is solved. Most of the world is not growing fast enough and is not financially healthy enough to bridge this gap via social policy on the public side or via higher demand of labor and higher employment participation on the private side. Countries are dealing with debt servicing, budget balancing, and pension reforms on the fiscal side while central banks, with the exception of the US, have coordinated monetary policies that have encouraged monetary expansion and currency devaluation. A large exodus of middle-eastern refugees and the spread of ISIS have also added complexity to the situation in Europe while Japan is still struggling to combat deflation after several years of getting no traction.
For US investors, while yields seem paltry at 1.8% to go out 10 years on a government bond, these yields are actually quite attractive on a relative basis compared to the rest of the world. Yield seekers, have in some cases, reached for yield in much riskier asset classes, whether out of choice or a feeling of necessity to augment income. These asset classes have had exposure to falling energy prices, in the case of Master Limited Partnerships, higher valuations, in the case of some Real Estate Investment Trusts and many dividend-paying equities, or higher credit risk, in the case of high yield bonds and bank loans. The higher risk relative to things like Certificate of Deposits or high quality corporate bonds is massive. We continue to caution investors to stick with their financial plan and allocating to asset classes in a portfolio that is representative of their willingness and capacity to bear risk. While periods of high uncertainty lend themselves to higher volatility and higher correlations of risky asset classes, we believe that diversification of asset classes is still paramount and that discipline to sticking to one’s investment objective and risk profile will add more to investor’s returns than trying to time in and out of asset classes, based on emotions. We continue to appreciate your confidence and trust in the management of your assets.
Sincerely,
David Schauer
Chief Investment Officer
The views of Hanson McClain, Inc. and information discussed in this commentary are as of the date of publication, are subject to change, and may not reflect the writer’s current views. The views expressed are those of the author only, and represent an assessment of market conditions at a specific point in time, are opinions only and should not be relied upon as investment advice regarding a particular investment or markets in general. Such information does not constitute a recommendation to buy or sell specific securities or investment vehicles. It should not be assumed that any investment will be profitable or will equal the performance of the portfolios or any securities or any sectors mentioned in this letter. The subject matter contained in this letter has been derived from several sources believed to be reliable and accurate at the time of compilation. Neither Hanson McClain, Inc. nor the Funds accept any liability for losses either direct or consequential caused by the use of this information.
| | |
| 2 | | www.pathwayadvisorsfunds.com |
| | |
| Pathway Advisors Funds | | Shareholder Letter |
| | April 30, 2016 (Unaudited) |
The Pathway Advisors Aggressive Growth Fund invests in underlying funds that use investment techniques and financial instruments that may be considered aggressive, including the use of futures contracts, options on futures contracts, securities and indices, forward contracts, swap agreements and similar instruments, exposes an underlying fund to potentially dramatic changes (losses) in the value of certain of its portfolio holdings.
The Pathway Advisors Conservative Fund invests in underlying funds that invest long or short in fixed-income securities subjects the Fund to additional risks that include credit risk, interest risk, maturity risk, investment-grade securities risk, municipal securities risk and prepayment risk. These risks could affect the value of a particular investment by the Fund, possibly causing the Fund’s share price and total return to be reduced and fluctuate more than other types of investments.
The Pathway Advisors Funds are distributed by ALPS Distributors, Inc.
The Pathway Advisors Funds are subject to investment risks, including possible loss of the principal amount invested and therefore are not suitable for all investors. The Funds may not achieve their objectives.
Diversification does not assure a profit or protect against a loss.
| | |
| Annual Report | April 30, 2016 | | 3 |
| | |
| Pathway Advisors Conservative Fund | | Performance Update |
| | April 30, 2016 (Unaudited) |
Cumulative Total Return for the period ended April 30, 2016
| | | | | | | | | | |
| | | Calendar YTD | | One Year | | | Three Years | | Since Inception* |
Pathway Advisors Conservative Fund | | 1.49% | | | -2.63% | | | 1.03% | | 2.55% |
S&P 500® Total Return Index1 | | 1.74% | | | 1.21% | | | 11.26% | | 13.64% |
Russell 2000® Index3 | | 0.03% | | | -5.94% | | | 7.53% | | 11.51% |
Barclays Capital U.S. Aggregate Bond Index2 | | 3.43% | | | 2.72% | | | 2.29% | | 2.20% |
| * | Fund inception date of July 30, 2012. |
The returns shown above do not reflect the deduction of taxes a shareholder would pay on Fund distributions or redemption of Fund shares.
Performance data quoted represents past performance. Past performance does not guarantee future results. Investment return and principal value of an investment will fluctuate so that an investor’s shares, when sold or redeemed, may be worth more or less than the original cost. Current performance data may be higher or lower than actual data quoted. For the most current month-end performance data, please call 1-888-288-1121 or visit www.pathwayadvisorsfunds.com.
| 1 | The S&P 500® Total Return Index is an unmanaged index of 500 common stocks chosen for the market size, liquidity and industry group representation. It is a market-value weighted index. The Index is not actively managed and does not reflect any deduction for fees, expenses or taxes. An investor may not invest directly into the Index. |
| 2 | The Barclays Capital U.S. Aggregate Bond Index is a market capitalization-weighted index, meaning the securities in the index are weighted according to the market size of each bond type. Most U.S. traded investment grade bonds are represented. Municipal bonds, and Treasury Inflation-Protected Securities are excluded, due to tax treatment issues. The Index includes Treasury securities, Government agency bonds, Mortgage-backed bonds, Corporate bonds, and a small amount of foreign bonds traded in U.S. The Index is not actively managed and does not reflect any deduction for fees, expenses or taxes. An investor may not invest directly into the Index. |
| 3 | The Russell 2000® Index measures the performance of the small-cap segment of the U.S. equity universe. The Russell 2000® Index is a subset of the Russell 3000® Index representing approximately 10% of the total market capitalization of that index. It includes approximately 2000 of the smallest securities based on a combination of their market cap and current index membership. The Index is not actively managed and does not reflect any deduction for fees, expenses or taxes. An investor may not invest directly into the Index. |
| | |
| 4 | | www.pathwayadvisorsfunds.com |
| | |
| Pathway Advisors Conservative Fund | | Performance Update |
| | April 30, 2016 (Unaudited) |
Growth of $10,000 for the period ended April 30, 2016
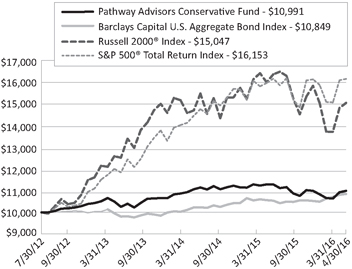
The graphs shown above represent a hypothetical investment of $10,000 in the Fund’s Investor Class shares for the period from inception to 4/30/16. All returns reflect reinvested dividends, but do not reflect the deduction of taxes that an investor would pay on distributions or redemptions.
| | |
| Annual Report | April 30, 2016 | | 5 |
| | |
| Pathway Advisors Conservative Fund | | Performance Update |
| | April 30, 2016 (Unaudited) |
| | |
| Top Ten Long Holdings | | (as a % of Net Assets)* |
iShares® Core U.S. Aggregate Bond ETF | | 20.01% |
DoubleLine Total Return Bond Fund - Class I | | 13.72% |
Metropolitan West Total Return Bond Fund - Class I | | 12.12% |
Vanguard® Total Stock Market ETF | | 11.25% |
Hartford World Bond Fund - Class Y | | 7.98% |
Goldman Sachs Strategic Income Fund - Institutional Class | | 6.07% |
Loomis Sayles Bond Fund - Institutional Class | | 5.01% |
Ivy High Income Fund - Class I | | 4.01% |
Vanguard® Global Minimum Volatility Fund - Class Admiral | | 4.00% |
Vanguard® Wellington Fund - Class Admiral | | 3.01% |
Top Ten Holdings | | 87.18% |
Portfolio Allocation (as a % of Net Assets as of April 30, 2016)*

| * | Holdings are subject to change, and may not reflect the current or future position of the portfolio. |
| | |
| 6 | | www.pathwayadvisorsfunds.com |
| | |
| Pathway Advisors Aggressive Growth Fund | | Performance Update |
| | April 30, 2016 (Unaudited) |
Cumulative Total Return for the period ended April 30, 2016
| | | | | | | | |
| | | Calendar YTD | | One Year | | Three Years | | Since Inception* |
Pathway Advisors Aggressive Growth Fund | | 1.97% | | -5.43% | | 3.76% | | 6.94% |
MSCI EAFE® Index1 | | -0.20% | | -9.32% | | 1.48% | | 7.31% |
S&P 500® Total Return Index2 | | 1.74% | | 1.21% | | 11.26% | | 13.64% |
Russell 2000® Index3 | | 0.03% | | -5.94% | | 7.53% | | 11.51% |
| * | Fund inception date of July 30, 2012. |
The returns shown above do not reflect the deduction of taxes a shareholder would pay on Fund distributions or redemption of Fund shares.
Performance data quoted represents past performance. Past performance does not guarantee future results. Investment return and principal value of an investment will fluctuate so that an investor’s shares, when sold or redeemed, may be worth more or less than the original cost. Current performance data may be higher or lower than actual data quoted. For the most current month-end performance data, please call 1-888-288-1121 or visit www.pathwayadvisorsfunds.com.
| 1 | MSCI EAFE® Index (Europe, Australasia, Far East) is a free float-adjusted market capitalization weighted index designed to measure developed market equity performance. The MSCI EAFE® Index is composed of companies representative of the market structure of Developed Market countries. The index includes reinvestment of dividends, net of foreign withholding taxes. The Index is not actively managed and does not reflect any deduction for fees, expenses or taxes. An investor may not invest directly into the Index. |
| 2 | The S&P 500® Total Return Index is an unmanaged index of 500 common stocks chosen for the market size, liquidity and industry group representation. It is a market-value weighted index. The Index is not actively managed and does not reflect any deduction for fees, expenses or taxes. An investor may not invest directly into the Index. |
| 3 | The Russell 2000® Index measures the performance of the small-cap segment of the U.S. equity universe. The Russell 2000® Index is a subset of the Russell 3000® Index representing approximately 10% of the total market capitalization of that index. It includes approximately 2000 of the smallest securities based on a combination of their market cap and current index membership. The Index is not actively managed and does not reflect any deduction for fees, expenses or taxes. An investor may not invest directly into the Index. |
Source: MSCI. MSCI makes no express or implied warranties or representations and shall have no liability whatsoever with respect to any MSCI data contained herein. The MSCI data may not be further redistributed or used to create indices or financial products. This report is not approved or produced by MSCI.
| | |
| Annual Report | April 30, 2016 | | 7 |
| | |
| Pathway Advisors Aggressive Growth Fund | | Performance Update |
| | April 30, 2016 (Unaudited) |
Growth of $10,000 for the period ended April 30, 2016
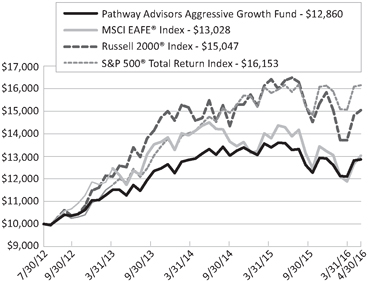
The graphs shown above represent a hypothetical investment of $10,000 in the Fund’s Investor Class shares for the period from inception 4/30/16. All returns reflect reinvested dividends, but do not reflect the deduction of taxes that an investor would pay on distributions or redemptions.
| | |
| 8 | | www.pathwayadvisorsfunds.com |
| | |
| Pathway Advisors Aggressive Growth Fund | | Performance Update |
| | April 30, 2016 (Unaudited) |
| | |
| Top Ten Long Holdings | | (as a % of Net Assets)* |
Vanguard® Total Stock Market ETF | | 31.53% |
Vanguard® S&P 500® ETF | | 10.02% |
Vanguard® Global Minimum Volatility Fund - Class Admiral | | 8.97% |
Goldman Sachs ActiveBeta U.S. Large Cap Equity ETF | | 8.03% |
Principal MidCap Fund - Institutional Class | | 6.13% |
Vanguard® High Dividend Yield ETF | | 4.00% |
Deutsche Global Infrastructure Fund - Institutional Class | | 3.98% |
iShares® MSCI EAFE Small-Cap ETF | | 3.92% |
Vanguard® FTSE Emerging Markets ETF | | 3.08% |
iShares® MSCI Emerging Markets Minimum Volatility ETF | | 3.04% |
Top Ten Holdings | | 82.70% |
Portfolio Allocation (as a % of Net Assets as of April 30, 2016)*
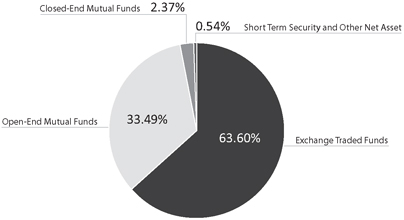
| * | Holdings are subject to change, and may not reflect the current or future position of the portfolio. |
| | |
| Annual Report | April 30, 2016 | | 9 |
| | |
| Pathway Advisors Funds | | Disclosure of Fund Expenses |
| | April 30, 2016 (Unaudited) |
As a shareholder of a Fund, you incur two types of costs: (1) transaction costs, including sales charges (loads) on purchase payments, reinvested dividends, or other distributions; redemption fees; and exchange fees; and (2) ongoing costs, including management fees; distribution and/or service (12b-1) fees; and other fund operating expenses. This example is intended to help you understand your ongoing costs (in dollars), of investing in the Fund and to compare these costs with the ongoing costs of investing in other mutual funds.
This example is based on an investment of $1,000 invested at the beginning of the period and held for the entire six-month period of November 1, 2015 through April 30, 2016.
Actual Expenses The first line of the table below provides information about actual account values and actual expenses. You may use the information in this line, together with the amount you invested, to estimate the expenses that you paid over the period. Simply divide your account value by $1,000 (for example, an $8,600 account value divided by $1,000 = 8.6), then multiply the result by the number in the first line under the heading “Expenses Paid During Period” to estimate the expenses you paid on your account during this period.
Hypothetical Example for Comparison Purposes The second line of the table below provides information about hypothetical account values and hypothetical expenses based on the Fund’s actual expense ratio and an assumed rate of return of 5% per year before expenses, which is not the Fund’s actual return. The hypothetical account values and expenses may not be used to estimate the actual ending account balance or expenses you paid for the period. You may use this information to compare the ongoing costs of investing in the Fund and other mutual funds. To do so, compare this 5% hypothetical example with the 5% hypothetical examples that appear in the shareholder reports of the other funds.
Please note that the expenses shown in the table are meant to highlight your ongoing costs only and do not reflect any transactional costs, such as sales charges (loads), redemption fees, or exchange fees. Therefore, the second line of the table is useful in comparing the ongoing costs only and will not help you determine the relative total costs of owning different funds. In addition, if these transactional costs were included, your costs would have been higher.
| | | | | | | | | | | | | | |
| | | Beginning
Account Value
11/01/15 | | | Ending
Account Value
04/30/16 | | | Expense
Ratio(a) | | Expenses Paid
During Period
11/01/15-
04/30/16(b) | |
Pathway Advisors Conservative Fund | | | | | | | | | | | |
Actual | | $ | 1,000.00 | | | $ | 997.10 | | | 1.88% | | $ | 9.34 | |
Hypothetical | | | | | | | | | | | | | | |
(5% return before expenses) | | $ | 1,000.00 | | | $ | 1,015.51 | | | 1.88% | | $ | 9.42 | |
Pathway Advisors Aggressive Growth Fund | | | | | | | | | | | |
Actual | | $ | 1,000.00 | | | $ | 994.80 | | | 1.88% | | $ | 9.32 | |
Hypothetical | | | | | | | | | | | | | | |
(5% return before expenses) | | $ | 1,000.00 | | | $ | 1,015.51 | | | 1.88% | | $ | 9.42 | |
| (a) | Annualized, based on the Funds’ most recent fiscal half year expenses. |
| (b) | Expenses are equal to the Fund’s annualized expense ratio multiplied by the average account value over the period, multiplied by the number of days in the most recent fiscal half-year (182)/366 (to reflect the half-year period). |
| | |
| 10 | | www.pathwayadvisorsfunds.com |
| | |
| Pathway Advisors Conservative Fund | | Portfolio of Investments |
| | April 30, 2016 |
| | | | | | | | | | | | |
| Description | | | Shares | | | Value (Note 2) | |
| |
CLOSED-END MUTUAL FUNDS (1.14%) | | | | | | | | | |
Stone Ridge Reinsurance Risk Premium Interval Fund | | | | 31,188 | | | $ | 319,990 | |
| | | | | | | | | | | | |
TOTAL CLOSED-END MUTUAL FUNDS (Cost $315,000) | | | | | | | | 319,990 | |
| |
EXCHANGE TRADED FUNDS (33.24%) | | | | | | | | | |
iShares® Core U.S. Aggregate Bond ETF | | | | 50,645 | | | | 5,616,024 | |
Vanguard® High Dividend Yield ETF | | | | 8,000 | | | | 556,320 | |
Vanguard® Total Stock Market ETF | | | | 29,934 | | | | 3,158,336 | |
| | | | | | | | | | | | |
TOTAL EXCHANGE TRADED FUNDS (Cost $9,294,317) | | | | | | | | 9,330,680 | |
| |
OPEN-END MUTUAL FUNDS (64.96%) | | | | | | | | | |
AQR Style Premia Alternative Fund - Class I | | | | 29,762 | | | | 301,786 | |
Catalyst Hedged Futures Strategy Fund - Class I | | | | 51,636 | | | | 575,225 | |
Deutsche Global Infrastructure Fund - Institutional Class | | | | 61,147 | | | | 839,554 | |
DoubleLine Total Return Bond Fund - Class I | | | | 354,535 | | | | 3,850,248 | |
Goldman Sachs Strategic Income Fund - Institutional Class | | | | 180,015 | | | | 1,702,941 | |
Hartford World Bond Fund - Class Y | | | | 217,324 | | | | 2,240,615 | |
Ivy High Income Fund - Class I | | | | 158,269 | | | | 1,126,875 | |
LoCorr Market Trend Fund - Class I(a) | | | | 24,917 | | | | 294,767 | |
Loomis Sayles Bond Fund - Institutional Class | | | | 104,239 | | | | 1,407,222 | |
Metropolitan West Total Return Bond Fund - Class I | | | | 313,372 | | | | 3,403,215 | |
Putnam Capital Spectrum Fund - Class Y | | | | 16,182 | | | | 524,956 | |
Vanguard® Global Minimum Volatility Fund - Class Admiral | | | | 49,015 | | | | 1,122,938 | |
Vanguard® Wellington Fund - Class Admiral | | | | 12,930 | | | | 844,047 | |
| | | | | | | | | | | | |
TOTAL OPEN-END MUTUAL FUNDS (Cost $18,524,987) | | | | | | | | 18,234,389 | |
| |
| | | |
| | | 7-Day
Yield | | | Shares | | | Value (Note 2) | |
| |
SHORT TERM INVESTMENTS (0.49%) | | | | | | | | | | | | |
Dreyfus Cash Management, Institutional Shares | | | 0.299% | | | | 136,225 | | | | 136,225 | |
| | | | | | | | | | | | |
TOTAL SHORT TERM INVESTMENTS (Cost $136,225) | | | | | | | | | | | 136,225 | |
| |
TOTAL INVESTMENTS (99.83%) (Cost $28,270,529) | | | | | | | | | | $ | 28,021,284 | |
| | | |
Other Assets In Excess Of Liabilities (0.17%) | | | | | | | | | | | 47,459 | |
| |
NET ASSETS (100.00%) | | | | | | | | | | $ | 28,068,743 | |
| |
Common Abbreviations:
AQR - AQR Capital Management LLC.
| | |
See Notes to Financial Statements. | | |
Annual Report | April 30, 2016 | | 11 |
| | |
| Pathway Advisors Aggressive Growth Fund | | Portfolio of Investments |
| | April 30, 2016 |
| | | | | | | | | | | | |
| Description | | | Shares | | | Value (Note 2) | |
| |
CLOSED-END MUTUAL FUNDS (2.37%) | | | | | | | | | |
Stone Ridge Reinsurance Risk Premium Interval Fund | | | | 74,257 | | | $ | 761,881 | |
| | | | | | | | | | | | |
TOTAL CLOSED-END MUTUAL FUNDS (Cost $750,000) | | | | | | | | 761,881 | |
| |
EXCHANGE TRADED FUNDS (63.60%) | | | | | | | | | |
Goldman Sachs ActiveBeta U.S. Large Cap Equity ETF | | | | 62,000 | | | | 2,584,160 | |
iShares® MSCI EAFE Small-Cap ETF | | | | 25,000 | | | | 1,259,750 | |
iShares® MSCI Emerging Markets Minimum Volatility ETF | | | | 19,000 | | | | 977,740 | |
Vanguard® FTSE Emerging Markets ETF | | | | 28,336 | | | | 989,776 | |
Vanguard® High Dividend Yield ETF | | | | 18,500 | | | | 1,286,490 | |
Vanguard® S&P 500® ETF | | | | 17,040 | | | | 3,224,309 | |
Vanguard® Total Stock Market ETF | | | | 96,137 | | | | 10,143,416 | |
| | | | | | | | | | | | |
TOTAL EXCHANGE TRADED FUNDS (Cost $20,320,761) | | | | | | | | 20,465,641 | |
| |
OPEN-END MUTUAL FUNDS (33.49%) | | | | | | | | | |
361 Managed Futures Fund - Class I(a) | | | | 27,545 | | | | 296,383 | |
AQR Style Premia Alternative Fund - Class I | | | | 93,838 | | | | 951,513 | |
Boston Partners Long/Short Equity Fund - Institutional Class | | | | 33,576 | | | | 666,156 | |
Catalyst Hedged Futures Strategy Fund - Class I | | | | 52,902 | | | | 589,329 | |
Deutsche Global Infrastructure Fund - Institutional Class | | | | 93,246 | | | | 1,280,269 | |
Ivy High Income Fund - Class I | | | | 126,528 | | | | 900,882 | |
LoCorr Market Trend Fund - Class I(a) | | | | 52,036 | | | | 615,584 | |
Principal MidCap Fund - Institutional Class | | | | 92,919 | | | | 1,972,668 | |
Putnam Capital Spectrum Fund - Class Y | | | | 18,957 | | | | 614,971 | |
Vanguard® Global Minimum Volatility Fund - Class Admiral | | | | 125,980 | | | | 2,886,202 | |
| | | | | | | | | | | | |
TOTAL OPEN-END MUTUAL FUNDS (Cost $11,017,630) | | | | | | | | 10,773,957 | |
| |
| | | |
| | | 7-Day
Yield | | | Shares | | | Value (Note 2) | |
| |
SHORT TERM INVESTMENTS (0.83%) | | | | | | | | | | | | |
Dreyfus Cash Management, Institutional Shares | | | 0.299% | | | | 266,681 | | | | 266,681 | |
| | | | | | | | | | | | |
TOTAL SHORT TERM INVESTMENTS (Cost $266,681) | | | | | | | | | | | 266,681 | |
| |
TOTAL INVESTMENTS (100.29%) (Cost $32,355,072) | | | | | | | | | | $ | 32,268,160 | |
Liabilities in Excess of Other Assets (-0.29%) | | | | | | | | | | | (92,987) | |
| |
NET ASSETS (100.00%) | | | | | | | | | | $ | 32,175,173 | |
| |
| (a) | Non-income producing security. |
| | |
| 12 | | www.pathwayadvisorsfunds.com |
| | |
| Pathway Advisors Aggressive Growth Fund | | Portfolio of Investments |
| | April 30, 2016 |
Common Abbreviations:
AQR - AQR Capital Management LLC.
EAFE - Europe, Australia, and Fare East.
FTSE - Financial Times and Stock Exchange.
MSCI - Morgan Stanley Capital International.
S&P - Standard & Poor’s.
See Notes to Financial Statements.
| | |
| Annual Report | April 30, 2016 | | 13 |
| | |
| Pathway Advisors Funds | | Statements of Assets and Liabilities |
| | April 30, 2016 |
| | | | | | | | |
| | | Pathway Advisors
Conservative Fund | | | Pathway Advisors
Aggressive Growth
Fund | |
| | | | |
ASSETS | | | | | | | | |
Investments, at value | | $ | 28,021,284 | | | $ | 32,268,160 | |
Receivable for investments sold | | | 110,441 | | | | – | |
Dividends receivable | | | 19,626 | | | | 82 | |
Other assets | | | 3,739 | | | | 3,913 | |
| |
Total assets | | | 28,155,090 | | | | 32,272,155 | |
| |
LIABILITIES | | | | | | | | |
Investment advisory fees payable | | | 13,877 | | | | 18,003 | |
Distributions and service fees payable | | | 39,766 | | | | 44,750 | |
Payable for trustee fees and expenses | | | 190 | | | | 212 | |
Payable for chief compliance officer fees | | | 1,617 | | | | 1,810 | |
Payable for principal financial officer fees | | | 393 | | | | 440 | |
Payable for administration fees | | | 8,136 | | | | 9,166 | |
Payable for transfer agency fees | | | 4,479 | | | | 4,773 | |
Payable for professional fees | | | 15,554 | | | | 15,602 | |
Payable for custody fees | | | 941 | | | | 1,085 | |
Payable for reports to shareholders | | | 522 | | | | 588 | |
Accrued expenses and other liabilities | | | 872 | | | | 553 | |
| |
Total liabilities | | | 86,347 | | | | 96,982 | |
| |
NET ASSETS | | $ | 28,068,743 | | | $ | 32,175,173 | |
| |
| | |
NET ASSETS CONSIST OF | | | | | | | | |
Paid-in capital (Note 5) | | $ | 29,090,774 | | | $ | 33,837,418 | |
Accumulated net investment income | | | – | | | | 23,710 | |
Accumulated net realized loss | | | (772,786) | | | | (1,599,043) | |
Net unrealized depreciation | | | (249,245) | | | | (86,912) | |
| |
NET ASSETS | | $ | 28,068,743 | | | $ | 32,175,173 | |
| |
INVESTMENTS, AT COST | | $ | 28,270,529 | | | $ | 32,355,072 | |
| |
PRICING OF SHARES | | | | | | | | |
Net Asset Value, offering and redemption price per share | | $ | 10.24 | | | $ | 11.40 | |
Net Assets | | $ | 28,068,743 | | | $ | 32,175,173 | |
Shares of beneficial interest outstanding (unlimited number of shares, no par value common stock authorized) | | | 2,742,151 | | | | 2,821,309 | |
| | |
See Notes to Financial Statements. | | |
14 | | www.pathwayadvisorsfunds.com |
| | |
| Pathway Advisors Funds | | Statements of Operations |
| | For the Year Ended April 30, 2016 |
| | | | | | | | |
| | | Pathway
Advisors
Conservative
Fund | | | Pathway
Advisors
Aggressive
Growth Fund | |
| | | | |
INVESTMENT INCOME | | | | | | | | |
Dividends from other investment companies | | $ | 804,241 | | | $ | 854,565 | |
| |
Total investment income | | | 804,241 | | | | 854,565 | |
| |
| | |
EXPENSES | | | | | | | | |
Investment advisory fees (Note 6) | | | 307,197 | | | | 358,632 | |
Administration fees | | | 94,129 | | | | 109,398 | |
Transfer agency fees | | | 42,272 | | | | 44,635 | |
Distribution and service fees | | | 107,001 | | | | 112,011 | |
Professional fees | | | 20,474 | | | | 21,253 | |
Custody fees | | | 6,065 | | | | 6,567 | |
Reports to shareholders | | | 2,265 | | | | 2,496 | |
Trustee fees and expenses | | | 967 | | | | 1,088 | |
Registration fees | | | 20,727 | | | | 18,517 | |
Chief compliance officer fees | | | 18,945 | | | | 22,053 | |
Principal financial officer fees | | | 4,616 | | | | 5,370 | |
Other | | | 7,801 | | | | 5,852 | |
| |
Total expenses before waivers | | | 632,459 | | | | 707,872 | |
Less fees waived/reimbursed by adviser (Note 6) | | | (54,905) | | | | (33,578) | |
| |
Total net expenses | | | 577,554 | | | | 674,294 | |
| |
NET INVESTMENT INCOME | | | 226,687 | | | | 180,271 | |
| |
Net realized loss on investments | | | (925,400) | | | | (1,783,187) | |
Net realized capital gain distributions from other investment companies | | | 222,471 | | | | 211,094 | |
Net change in unrealized depreciation on investments | | | (457,648) | | | | (984,103) | |
| |
NET REALIZED AND UNREALIZED LOSS ON INVESTMENTS | | | (1,160,577) | | | | (2,556,196) | |
| |
NET DECREASE IN NET ASSETS RESULTING FROM OPERATIONS | | $ | (933,890) | | | $ | (2,375,925) | |
| |
| | |
See Notes to Financial Statements. | | |
Annual Report | April 30, 2016 | | 15 |
| | |
Pathway Advisors Conservative Fund | | Statements of Changes in Net Assets |
| | | | | | | | |
| | | For the Year Ended
April 30, 2016 | | | For the Year Ended
April 30, 2015 | |
| |
OPERATIONS | | | | | | | | |
Net investment income | | $ | 226,687 | | | $ | 105,099 | |
Net realized gain/(loss) | | | (925,400) | | | | 177,216 | |
Net realized capital gain distributions from other investment companies | | | 222,471 | | | | 33,763 | |
Net change in unrealized appreciation/(depreciation) | | | (457,648) | | | | 70,829 | |
| |
Net increase/(decrease) in net assets resulting from operations | | | (933,890) | | | | 386,907 | |
| |
DISTRIBUTIONS (NOTE 3) | | | | | | | | |
Net investment income | | | (246,348) | | | | (107,965) | |
Net realized gains on investments | | | (163,651) | | | | (122,319) | |
| |
Net decrease in net assets from distributions | | | (409,999) | | | | (230,284) | |
| |
BENEFICIAL INTEREST TRANSACTIONS (NOTE 5) | | | | | | | | |
Shares sold | | | 5,728,733 | | | | 29,628,281 | |
Dividends reinvested | | | 409,999 | | | | 230,284 | |
Shares redeemed | | | (9,073,843) | | | | (3,090,468) | |
| |
Net increase/(decrease) in net assets derived from beneficial interest transactions | | | (2,935,111) | | | | 26,768,097 | |
| |
Net increase/(decrease) in net assets | | | (4,279,000) | | | | 26,924,720 | |
NET ASSETS: | | | | | | | | |
Beginning of period | | | 32,347,743 | | | | 5,423,023 | |
| |
End of period* | | $ | 28,068,743 | | | $ | 32,347,743 | |
| |
* Includes accumulated net investment income of: | | $ | 0 | | | $ | 13,927 | |
| | |
See Notes to Financial Statements. | | |
16 | | www.pathwayadvisorsfunds.com |
| | |
Pathway Advisors Aggressive Growth Fund | | Statements of Changes in Net Assets |
| | | | | | | | | | | | |
| | | | | For the
Year Ended
April 30, 2016 | | | | | For the
Year Ended
April 30, 2015 | |
| |
OPERATIONS | | | | | | | | | | | | |
Net investment income | | $ | | | 180,271 | | | $ | | | 103,324 | |
Net realized gain/(loss) | | | | | (1,783,187) | | | | | | 1,154,117 | |
Net realized capital gain distributions from other investment companies | | | | | 211,094 | | | | | | 74,206 | |
Net change in unrealized depreciation | | | | | (984,103) | | | | | | (115,782) | |
| |
Net increase/(decrease) in net assets resulting from operations | | | | | (2,375,925) | | | | | | 1,215,865 | |
| |
DISTRIBUTIONS (NOTE 3) | | | | | | | | | | | | |
Net investment income | | | | | (120,011) | | | | | | (150,330) | |
Net realized gains on investments | | | | | (194,209) | | | | | | (1,134,772) | |
| |
Net decrease in net assets from distributions | | | | | (314,220) | | | | | | (1,285,102) | |
| |
BENEFICIAL INTEREST TRANSACTIONS (NOTE 5) | | | | | | | | | | | | |
Shares sold | | | | | 5,078,344 | | | | | | 31,104,559 | |
Dividends reinvested | | | | | 314,220 | | | | | | 1,285,089 | |
Shares redeemed | | | | | (9,897,746) | | | | | | (9,573,718) | |
| |
Net increase/(decrease) in net assets derived from beneficial interest transactions | | | | | (4,505,182) | | | | | | 22,815,930 | |
| |
Net increase/(decrease) in net assets | | | | | (7,195,327) | | | | | | 22,746,693 | |
NET ASSETS: | | | | | | | | | | | | |
Beginning of period | | | | | 39,370,500 | | | | | | 16,623,807 | |
| |
End of period* | | $ | | | 32,175,173 | | | $ | | | 39,370,500 | |
| |
* Includes accumulated net investment income/(loss) of: | | $ | | | 23,710 | | | $ | | | (36,521) | |
| | |
See Notes to Financial Statements. | | |
Annual Report | April 30, 2016 | | 17 |
| | |
| Pathway Advisors Conservative Fund | | Financial Highlights |
| | For a share outstanding throughout the periods presented. |
| | | | | | | | | | | | | | | | | | | | | | | | |
| | | For the Year
Ended
April 30, 2016 | | | For the Year
Ended
April 30, 2015 | | | For the Year
Ended
April 30, 2014 | | | For the Period
Ended
April 30, 2013(a) | |
| |
| | | | | | | | |
NET ASSET VALUE, BEGINNING OF PERIOD | | | | $ | 10.66 | | | | | $ | 10.61 | | | | | $ | 10.51 | | | | | $ | 10.00 | |
INCOME FROM OPERATIONS | | | | | | | | | | | | | | | | | | | | | | | | |
Net investment income(b) | | | | | 0.08 | | | | | | 0.12 | | | | | | 0.16 | | | | | | 0.14 | |
Net realized and unrealized gain/(loss) on investments | | | | | (0.36) | | | | | | 0.23 | | | | | | 0.10 | | | | | | 0.52 | |
| | | | | | | | | | | | | | | | | | | | | | | | |
Total from Investment Operations | | | | | (0.28) | | | | | | 0.35 | | | | | | 0.26 | | | | | | 0.66 | |
| | | | | | | | | | | | | | | | | | | | | | | | |
| | | | | | | | |
LESS DISTRIBUTIONS | | | | | | | | | | | | | | | | | | | | | | | | |
Net investment income | | | | | (0.08) | | | | | | (0.14) | | | | | | (0.13) | | | | | | (0.13) | |
Net realized gain on investments | | | | | (0.06) | | | | | | (0.16) | | | | | | (0.03) | | | | | | (0.02) | |
| | | | | | | | | | | | | | | | | | | | | | | | |
Total Distributions | | | | | (0.14) | | | | | | (0.30) | | | | | | (0.16) | | | | | | (0.15) | |
| | | | | | | | | | | | | | | | | | | | | | | | |
NET INCREASE/(DECREASE) IN NET ASSET VALUE | | | | | (0.42) | | | | | | 0.05 | | | | | | 0.10 | | | | | | 0.51 | |
| | | | | | | | | | | | | | | | | | | | | | | | |
NET ASSET VALUE, END OF PERIOD | | | | $ | 10.24 | | | | | $ | 10.66 | | | | | $ | 10.61 | | | | | $ | 10.51 | |
| | | | | | | | | | | | | | | | | | | | | | | | |
TOTAL RETURN(c) | | | | | (2.63%) | | | | | | 3.28% | | | | | | 2.53% | | | | | | 6.59% | |
| | | | | | | | |
RATIOS/SUPPLEMENTAL DATA | | | | | | | | | | | | | | | | | | | | | | | | |
Net assets, End of Period (000s) | | | | $ | 28,069 | | | | | $ | 32,348 | | | | | $ | 5,423 | | | | | $ | 1,364 | |
RATIOS TO AVERAGE NET ASSETS: | | | | | | | | | | | | | | | | | | | | | | | | |
Operating Expenses: | | | | | | | | | | | | | | | | | | | | | | | | |
Excluding reimbursement/waiver(d) | | | | | 2.06% | | | | | | 2.65% | | | | | | 4.84% | | | | | | 49.62% (e)(f) | |
Including reimbursement/waiver(d) | | | | | 1.88% | | | | | | 1.88% | | | | | | 1.91% (g) | | | | | | 1.98% (e)(f) | |
Net investment income including reimbursement/waiver(d) | | | | | 0.74% | | | | | | 1.10% | | | | | | 1.57% | | | | | | 1.83% (e) | |
PORTFOLIO TURNOVER RATE | | | | | 39% | | | | | | 50% | | | | | | 38% | | | | | | 18% (h) | |
| | |
| 18 | | www.pathwayadvisorsfunds.com |
| | |
| Pathway Advisors Conservative Fund | | Financial Highlights |
| | For a share outstanding throughout the periods presented. |
| (a) | The Fund commenced operations on July 31, 2012. |
| (b) | Calculated using the average shares method. |
| (c) | Total investment return is calculated assuming a purchase of a common share at the opening of the first day and a sale at closing on the last day of each period reported. Dividends and distributions, if any, are assumed for purposes of this calculation to be reinvested at prices obtained under the Fund’s dividend reinvestment plan. Total returns would have been lower had certain expenses not been waived during the period. Total investment returns do not reflect brokerage commissions, if any, and are not annualized. |
| (d) | The ratios exclude the impact of expenses of the underlying funds in which the Fund invests as represented in the Portfolio of Investments. |
| (f) | Expense ratios before reductions for startup periods may not be representative of longer term operating periods. |
| (g) | Contractual expense limitation changed from 1.98% to 1.88% effective October 1, 2013. (See Note 6). |
| | |
See Notes to Financial Statements. | | |
Annual Report | April 30, 2016 | | 19 |
| | |
| Pathway Advisors Aggressive Growth Fund | | Financial Highlights |
| | For a share outstanding throughout the periods presented. |
| | | | | | | | | | | | | | | | | | | | | | | | |
| | | For the Year
Ended
April 30, 2016 | | | For the Year
Ended
April 30, 2015 | | | For the Year
Ended
April 30, 2014 | | | For the Period
Ended
April 30, 2013(a) | |
| |
| | | | | | | | |
NET ASSET VALUE, BEGINNING OF PERIOD | | | | $ | 12.16 | | | | | $ | 12.65 | | | | | $ | 11.40 | | | | | $ | 10.00 | |
INCOME FROM OPERATIONS | | | | | | | | | | | | | | | | | | | | | | | | |
Net investment income(b) | | | | | 0.06 | | | | | | 0.07 | | | | | | 0.10 | | | | | | 0.03 | |
Net realized and unrealized gain/(loss) on investments | | | | | (0.72) | | | | | | 0.58 | | | | | | 1.27 | | | | | | 1.47 | |
| | | | | | | | | | | | | | | | | | | | | | | | |
Total from Investment Operations | | | | | (0.66) | | | | | | 0.65 | | | | | | 1.37 | | | | | | 1.50 | |
| | | | | | | | | | | | | | | | | | | | | | | | |
| | | | | | | | |
LESS DISTRIBUTIONS | | | | | | | | | | | | | | | | | | | | | | | | |
Net investment income | | | | | (0.04) | | | | | | (0.13) | | | | | | (0.09) | | | | | | (0.08) | |
Net realized gain on investments | | | | | (0.06) | | | | | | (1.01) | | | | | | (0.03) | | | | | | (0.02) | |
| | | | | | | | | | | | | | | | | | | | | | | | |
Total Distributions | | | | | (0.10) | | | | | | (1.14) | | | | | | (0.12) | | | | | | (0.10) | |
| | | | | | | | | | | | | | | | | | | | | | | | |
NET INCREASE/(DECREASE) IN NET ASSET VALUE | | | | | (0.76) | | | | | | (0.49) | | | | | | 1.25 | | | | | | 1.40 | |
| | | | | | | | | | | | | | | | | | | | | | | | |
NET ASSET VALUE, END OF PERIOD | | | | $ | 11.40 | | | | | $ | 12.16 | | | | | $ | 12.65 | | | | | $ | 11.40 | |
| | | | | | | | | | | | | | | | | | | | | | | | |
TOTAL RETURN(c) | | | | | (5.43%) | | | | | | 5.41% | | | | | | 12.05% | | | | | | 15.14% | |
| | | | | | | | |
RATIOS/SUPPLEMENTAL DATA | | | | | | | | | | | | | | | | | | | | | | | | |
Net assets, End of Period (000s) | | | | $ | 32,175 | | | | | $ | 39,371 | | | | | $ | 16,624 | | | | | $ | 1,579 | |
RATIOS TO AVERAGE NET ASSETS: | | | | | | | | | | | | | | | | | | | | | | | | |
Operating Expenses: | | | | | | | | | | | | | | | | | | | | | | | | |
Excluding reimbursement/waiver(d) | | | | | 1.97% | | | | | | 2.29% | | | | | | 3.16% | | | | | | 44.74% (e)(f) | |
Including reimbursement/waiver(d) | | | | | 1.88% | | | | | | 1.88% | | | | | | 1.90% (g) | | | | | | 1.98% (e)(f) | |
Net investment income including reimbursement/waiver(d) | | | | | 0.50% | | | | | | 0.58% | | | | | | 0.85% | | | | | | 0.39% (e) | |
PORTFOLIO TURNOVER RATE | | | | | 56% | | | | | | 65% | | | | | | 18% | | | | | | 31% (h) | |
| | |
| 20 | | www.pathwayadvisorsfunds.com |
| | |
| Pathway Advisors Aggressive Growth Fund | | Financial Highlights |
| | For a share outstanding throughout the periods presented. |
| (a) | The Fund commenced operations on July 31, 2012. |
| (b) | Calculated using the average shares method. |
| (c) | Total investment return is calculated assuming a purchase of a common share at the opening of the first day and a sale at closing on the last day of each period reported. Dividends and distributions, if any, are assumed for purposes of this calculation to be reinvested at prices obtained under the Fund’s dividend reinvestment plan. Total returns would have been lower had certain expenses not been waived during the period. Total investment returns do not reflect brokerage commissions, if any, and are not annualized. |
| (d) | The ratios exclude the impact of expenses of the underlying funds in which the Fund invests as represented in the Portfolio of Investments. |
| (f) | Expense ratios before reductions for startup periods may not be representative of longer term operating periods. |
| (g) | Contractual expense limitation changed from 1.98% to 1.88% effective October 1, 2013. (See Note 6). |
| | |
See Notes to Financial Statements. | | |
Annual Report | April 30, 2016 | | 21 |
| | |
| Pathway Advisors Funds | | Notes to Financial Statements |
| | April 30, 2016 |
1. ORGANIZATION
Financial Investors Trust (the “Trust”), a Delaware statutory trust, is an open-end management investment company registered under the Investment Company Act of 1940, as amended (“1940 Act”). As of April 30, 2016, the Trust has 34 registered funds. This annual report describes Pathway Advisors Conservative Fund and Pathway Advisors Aggressive Growth Fund (individually a “Fund” and collectively, the “Funds”). The Pathway Advisors Conservative Fund seeks total return through a primary emphasis on income with a secondary emphasis on growth of capital. The Pathway Advisors Aggressive Growth Fund seeks total return through a primary emphasis on growth with a secondary emphasis on income.
2. SIGNIFICANT ACCOUNTING POLICIES
The accompanying financial statements were prepared in accordance with accounting principles generally accepted in the United States of America (“U.S. GAAP”). The preparation of financial statements in conformity with U.S. GAAP requires management to make certain estimates and assumptions that affect the reported amounts of assets and liabilities and disclosures of contingent assets and liabilities at the date of the financial statements and the reported amounts of revenue and expenses during the period. Actual results could differ from those estimates. The Funds are considered an investment company for financial reporting purposes under U.S. GAAP. The following is a summary of significant accounting policies consistently followed by the Funds in preparation of their financial statements.
Investment Valuation: The Funds generally value their securities based on market prices determined at the close of regular trading on the New York Stock Exchange (“NYSE”), normally 4:00 p.m. Eastern Time, on each day the NYSE is open for trading.
For equity securities and mutual funds that are traded on an exchange, the market price is usually the closing sale or official closing price on that exchange. In the case of equity securities not traded on an exchange, or if such closing prices are not otherwise available, the securities are valued at the mean of the most recent bid and ask prices on such day. Redeemable securities issued by open-end registered investment companies are valued at the investment company’s applicable net asset value, with the exception of exchange-traded open-end investment companies, which are priced as equity securities.
The market price for debt obligations is generally the price supplied by an independent third-party pricing service approved by the Board of Trustees (the “Board”), which may use a matrix, formula or other objective method that takes into consideration quotations from dealers, market transactions in comparable investments, market indices and yield curves. If vendors are unable to supply a price, or if the price supplied is deemed to be unreliable, the market price may be determined using quotations received from one or more broker-dealers that make a market in the security.
When such prices or quotations are not available, or when Hanson McClain, Inc. (the “Adviser”) believes that they are unreliable, securities may be priced using fair value procedures approved by the Board.
| | |
| 22 | | www.pathwayadvisorsfunds.com |
| | |
| Pathway Advisors Funds | | Notes to Financial Statements |
| | April 30, 2016 |
Fair Value Measurements: The Funds disclose the classification of their fair value measurements following a three-tier hierarchy based on the inputs used to measure fair value. Inputs refer broadly to the assumptions that market participants would use in pricing the asset or liability, including assumptions about risk. Inputs may be observable or unobservable. Observable inputs reflect the assumptions market participants would use in pricing the asset or liability that are developed based on market data obtained from sources independent of the reporting entity. Unobservable inputs reflect the reporting entity’s own assumptions about the assumptions market participants would use in pricing the asset or liability that are developed based on the best information available.
Various inputs are used in determining the value of the Funds’ investments as of the end of the reporting period. When inputs used fall into different levels of the fair value hierarchy, the level in the hierarchy within which the fair value measurement falls is determined based on the lowest level input that is significant to the fair value measurement in its entirety. The designated input levels are not necessarily an indication of the risk or liquidity associated with these investments. These inputs are categorized in the following hierarchy under applicable financial accounting standards:
| | |
Level 1 – | | Unadjusted quoted prices in active markets for identical investments, unrestricted assets or liabilities that the Funds have the ability to access at the measurement date; |
| |
Level 2 – | | Quoted prices which are not active, quoted prices for similar assets or liabilities in active markets or inputs other than quoted prices that are observable (either directly or indirectly) for substantially the full term of the asset or liability; and |
| |
Level 3 – | | Significant unobservable prices or inputs (including the Funds’ own assumptions in determining the fair value of investments) where there is little or no market activity for the asset or liability at the measurement date. |
The following is a summary of the inputs used to value the Funds’ investments as of April 30, 2016:
Pathway Advisors Conservative Fund
| | | | | | | | | | | | | | | | |
| Investments in Securities at Value | | Level 1 -
Quoted Prices | | | Level 2 -
Other Significant
Observable
Inputs | | | Level 3 -
Significant
Unobservable
Inputs | | | Total | |
Closed-End Mutual Funds | | $ | – | | | $ | 319,990 | | | $ | – | | | $ | 319,990 | |
Exchange Traded Funds | | | 9,330,680 | | | | – | | | | – | | | | 9,330,680 | |
Open-End Mutual Funds | | | 18,234,389 | | | | – | | | | – | | | | 18,234,389 | |
Short Term Investments | | | 136,225 | | | | – | | | | – | | | | 136,225 | |
| |
Total | | $ | 27,701,294 | | | $ | 319,990 | | | $ | – | | | $ | 28,021,284 | |
| |
| | |
| Annual Report | April 30, 2016 | | 23 |
| | |
| Pathway Advisors Funds | | Notes to Financial Statements |
| | April 30, 2016 |
Pathway Advisors Aggressive Growth Fund
| | | | | | | | | | | | | | | | |
| Investments in Securities at Value | | Level 1 -
Quoted Prices | | | Level 2 -
Other Significant
Observable
Inputs | | | Level 3 -
Significant
Unobservable
Inputs | | | Total | |
Closed-End Mutual Funds | | $ | – | | | $ | 761,881 | | | $ | – | | | $ | 761,881 | |
Exchange Traded Funds | | | 20,465,641 | | | | – | | | | – | | | | 20,465,641 | |
Open-End Mutual Funds | | | 10,773,957 | | | | – | | | | – | | | | 10,773,957 | |
Short Term Investments | | | 266,681 | | | | – | | | | – | | | | 266,681 | |
| |
Total | | $ | 31,506,279 | | | $ | 761,881 | | | $ | – | | | $ | 32,268,160 | |
| |
The Funds recognize transfers between levels as of the end of the period. For the year ended April 30, 2016, the Funds did not have any transfers between Level 1 and Level 2 securities. For the year ended April 30, 2016, the Funds did not have any securities that used significant unobservable inputs (Level 3) in determining fair value.
Investment Transactions and Investment Income: Investment transactions are accounted for on the date the investments are purchased or sold (trade date basis). Net realized gains and losses from investment transactions are reported on an identified cost basis. Interest income, which includes accretion of discounts and amortization of premiums, is accrued and recorded as earned. Dividend income is recognized on the ex-dividend date or for certain foreign securities, as soon as information is available to the Funds.
Trust Expenses: Some expenses of the Trust can be directly attributed to the Funds. Expenses which cannot be directly attributed to the Funds are apportioned among all funds in the Trust based on average net assets of each fund.
Fund Expenses: Expenses that are specific to a Fund are charged directly to that Fund.
Federal Income Taxes: The Funds comply with the requirements under Subchapter M of the Internal Revenue Code of 1986, as amended, applicable to regulated investment companies and intend to distribute substantially all of their net taxable income and net capital gains, if any, each year, so that it will not be subject to excise tax on undistributed income and gains. The Funds are not subject to income taxes to the extent such distributions are made.
As of and during the year ended April 30, 2016, the Funds did not have a liability for any unrecognized tax benefits. The Funds file U.S. federal, state, and local tax returns as required. The Funds’ tax returns are subject to examination by the relevant tax authorities until expiration of the applicable statute of limitations, which is generally three years after the filing of the tax return for federal purposes and four years for most state returns. Tax returns for open years have incorporated no uncertain tax positions that require a provision for income taxes.
Distributions to Shareholders: Each Fund normally pays dividends and distributes capital gains, if any, on an annual basis. Income dividend distributions are derived from dividends and other income each Fund receives from its investments, including short-term capital gains. Long term capital gain distributions are derived from gains realized when each Fund sells a security it has
| | |
| 24 | | www.pathwayadvisorsfunds.com |
| | |
| Pathway Advisors Funds | | Notes to Financial Statements |
| | April 30, 2016 |
owned for more than a year. Each Fund may make additional distributions and dividends at other times if the portfolio manager believes doing so may be necessary for each Fund to avoid or reduce taxes.
3. TAX BASIS INFORMATION
Reclassifications: As of April 30, 2016, permanent differences in book and tax accounting were reclassified. These differences had no effect on net assets and were primarily attributed to non-deductible expenses and book-tax distribution differences. The reclassifications were as follows:
| | | | | | | | | | | | |
| Fund | | Paid-in Capital | | | Accumulated Net
Investment Income | | | Accumulated Net
Realized Loss on
Investments | |
| |
Pathway Advisors Conservative Fund | | $ | (645) | | | $ | 5,734 | | | $ | (5,089) | |
Pathway Advisors Aggressive Growth Fund | | | – | | | | (29) | | | | 29 | |
Tax Basis of Investments: As of April 30, 2016, the costs of investments for federal income tax purposes and accumulated net unrealized appreciation/(depreciation) on investments were as follows:
| | | | | | | | | | | | | | | | |
| | | Gross
Appreciation
(excess of value
over tax cost) | | | Gross
Depreciation
(excess of tax
cost over value) | | | Net Unrealized
Depreciation | | | Cost of
Investments for
Income Tax
Purposes | |
| |
Pathway Advisors Conservative Fund | | $ | 245,384 | | | $ | (535,823) | | | $ | (290,439 | ) | | $ | 28,311,723 | |
Pathway Advisors Aggressive Growth Fund | | | 579,594 | | | | (689,985) | | | | (110,391 | ) | | | 32,378,551 | |
Components of Distributable Earnings: As of April 30, 2016, components of distributable earnings were as follows:
| | | | | | | | |
| | | Pathway Advisors
Conservative Fund | | | Pathway Advisors
Aggressive Growth
Fund | |
| |
Undistributed ordinary income | | $ | – | | | $ | 23,710 | |
Accumulated capital loss | | | (731,592) | | | | (1,575,564) | |
Net unrealized depreciation on investments | | | (290,439) | | | | (110,391) | |
| |
Total distributable earnings | | $ | (1,022,031) | | | $ | (1,662,245) | |
| |
Capital Losses: As of April 30, 2016, the following Fund had available for Federal income tax purposes unused capital losses that may be used to offset future realized capital gains. The following losses will be carried forward indefinitely to offset future realized gains:
| | | | | | | | |
| | | Short-Term | | | Long-Term | |
| |
Pathway Advisors Aggressive Growth Fund | | $ | 304,821 | | | $ | 129,914 | |
| | |
| Annual Report | April 30, 2016 | | 25 |
| | |
| Pathway Advisors Funds | | Notes to Financial Statements |
| | April 30, 2016 |
The Funds elect to defer to the period ending April 30, 2017, capital losses recognized during the period November 1, 2015 to April 30, 2016 in the amount of:
| | | | |
| | | Capital Losses | |
| |
Pathway Advisors Conservative Fund | | $ | 731,592 | |
Pathway Advisors Aggressive Growth Fund | | | 1,140,829 | |
Tax Basis of Distributions to Shareholders: The character of distributions made during the period from net investment income or net realized gains may differ from its ultimate characterization for federal income tax purposes. Also, due to the timing of dividend distributions, the fiscal year in which amounts are distributed may differ from the fiscal year in which the income or realized gain were recorded by the Funds.
The tax character of distributions paid by the Funds for the year ended April 30, 2016, were as follows:
| | | | | | | | |
| | | Ordinary Income | | | Long-Term Capital Gain | |
| |
Pathway Advisors Conservative Fund | | $ | 251,101 | | | $ | 158,898 | |
Pathway Advisors Aggressive Growth Fund | | | 120,040 | | | | 194,180 | |
The tax character of distributions paid by the Funds for the year ended April 30, 2015, were as follows:
| | | | | | | | |
| | | Ordinary Income | | | Long-Term Capital Gain | |
| |
Pathway Advisors Conservative Fund | | $ | 156,882 | | | $ | 73,402 | |
Pathway Advisors Aggressive Growth Fund | | | 576,858 | | | | 708,244 | |
4. SECURITIES TRANSACTIONS
Purchases and sales of securities (excluding short-term securities) during the year ended April 30, 2016, were as follows:
| | | | | | |
| Fund | | Purchases of
Securities | | | Proceeds From Sales
of Securities |
|
Pathway Advisors Conservative Fund | | $ | 11,897,487 | | | $ 14,823,667 |
Pathway Advisors Aggressive Growth Fund | | | 19,869,060 | | | 24,233,765 |
5. BENEFICIAL SHARE TRANSACTIONS
The capitalization of the Trust consists of an unlimited number of shares of beneficial interest with no par value per share. Holders of the shares of the Funds of the Trust have one vote for each share held and a proportionate fraction of a vote for each fractional share. All shares issued and outstanding are fully paid and are transferable and redeemable at the option of the shareholder. Purchasers of the shares do not have any obligation to make payments to the Trust or its creditors solely by reason of the purchasers’ ownership of the shares. Shares have no pre-emptive rights.
| | |
| 26 | | www.pathwayadvisorsfunds.com |
| | |
| Pathway Advisors Funds | | Notes to Financial Statements |
| | April 30, 2016 |
Transactions in shares of capital stock:
Pathway Advisors Conservative Fund
| | | | | | | | |
| | | For the Year Ended | | | For the Year Ended | |
| | | April 30, 2016 | | | April 30, 2015 | |
| |
Common Shares Outstanding - Beginning of Period | | | 3,033,100 | | | | 510,894 | |
Common Shares Sold | | | 553,787 | | | | 2,789,052 | |
Common Shares Issued as Reinvestment of Dividends | | | 40,434 | | | | 21,828 | |
Common Shares Redeemed | | | (885,170) | | | | (288,674) | |
| |
Common Shares Outstanding - End of Period | | | 2,742,151 | | | | 3,033,100 | |
| |
| | | | | | | | |
Pathway Advisors Aggressive Growth Fund | | | | | | |
| | | For the Year Ended | | | For the Year Ended | |
| | | April 30, 2016 | | | April 30, 2015 | |
| |
Common Shares Outstanding - Beginning of Period | | | 3,236,511 | | | | 1,314,394 | |
Common Shares Sold | | | 438,519 | | | | 2,567,170 | |
Common Shares Issued as Reinvestment of Dividends | | | 27,758 | | | | 108,082 | |
Common Shares Redeemed | | | (881,479) | | | | (753,135) | |
| |
Common Shares Outstanding - End of Period | | | 2,821,309 | | | | 3,236,511 | |
| |
6. MANAGEMENT AND RELATED PARTY TRANSACTIONS
Investment Advisory
The Adviser, subject to the authority of the Board, is responsible for the overall management and administration of the Funds’ business affairs. The Adviser manages the investments of the Funds in accordance with the Funds’ investment objective, policies and limitations and investment guidelines established jointly by the Adviser and the Board. Pursuant to the Investment Advisory Agreement (“Advisory Agreement”), the Adviser is entitled to an investment advisory fee, computed daily and payable monthly of 1.00% of the average daily net assets for each Fund. The management fee is paid on a monthly basis.
The Adviser has agreed contractually to limit the amount of each Fund’s total annual expenses, exclusive of acquired fund fees and expenses, brokerage expenses, interest expenses, taxes and extraordinary expenses, to 1.88% of each Fund’s average daily net assets. This agreement is in effect from September 1, 2015 through August 31, 2016. The Adviser will be permitted to recover expenses it has borne through the agreement described above to the extent that a Fund’s expenses in later periods fall below the expense cap in effect at the time of the waiver or reimbursement. A Fund will not be obligated to pay any such deferred fees and expenses more than three years after the end of the fiscal year in which the fees and expense were deferred. The Adviser may not discontinue or modify this waiver without the approval by the Funds’ Board.
| | |
| Annual Report | April 30, 2016 | | 27 |
| | |
| Pathway Advisors Funds | | Notes to Financial Statements |
| | April 30, 2016 |
For the year ended April 30, 2016, the fee waivers and/or reimbursements were as follows:
| | | | | | | | |
| | | Fees Waived/ | | | Recoupment of Past | |
| | | Reimbursed By Adviser | | | Waived Fees By Adviser | |
| |
Pathway Advisors Conservative Fund | | $ | 54,905 | | | $ | – | |
Pathway Advisors Aggressive Growth Fund | | | 33,578 | | | | – | |
As of April 30, 2016, the balances of recoupable expenses for each Fund were as follows:
| | | | | | | | | | | | | | | | |
| Fund | | Expires 2017 | | | Expires 2018 | | | Expires 2019 | | | Total | |
| |
Pathway Advisors Conservative Fund | | $ | 97,471 | | | $ | 73,567 | | | $ | 54,905 | | | $ | 225,943 | |
Pathway Advisors Aggressive Growth Fund | | | 120,826 | | | | 72,255 | | | | 33,578 | | | | 226,659 | |
Fees waived/reimbursed by adviser for the year ended April 30, 2016 are disclosed in the Statement of Operations.
Fund Administrator Fees and Expenses
ALPS Fund Services, Inc. (“ALPS”) serves as administrator to the Funds and the Funds have agreed to pay expenses incurred in connection with their administrative activities. Pursuant to an Administration Agreement, ALPS provides operational services to the Funds including, but not limited to, fund accounting and fund administration and generally assists in the Funds’ operations. Officers of the Trust are employees of ALPS. The Funds’ administration fee is accrued on a daily basis and paid monthly. Administration fees paid by the Funds for the year ended April 30, 2016 are disclosed in the Statements of Operations.
ALPS is reimbursed by the Funds for certain out-of-pocket expenses.
Transfer Agent
ALPS serves as transfer, dividend paying and shareholder servicing agent for the Funds. ALPS receives an annual minimum fee, a fee based upon the number of shareholder accounts, and is also reimbursed by each Fund for certain out-of-pocket expenses. Transfer agent fees paid by the Funds for the year ended April 30, 2016 are disclosed in the Statement of Operations.
Compliance Services
ALPS provides services that assist the Trust’s chief compliance officer in monitoring and testing the policies and procedures of the Trust in conjunction with requirements under Rule 38a-1 under the 1940 Act and receives an annual base fee. ALPS is reimbursed for certain out-of-pocket expenses by the Funds. Compliance service fees paid by the Funds for the year ended April 30, 2016 are disclosed in the Statement of Operations.
Principal Financial Officer
ALPS receives an annual fee for providing principal financial officer services to the Funds. Principal Financial Officer fees paid by the Funds for the year ended April 30, 2016 are disclosed in the Statement of Operations.
| | |
| 28 | | www.pathwayadvisorsfunds.com |
| | |
| Pathway Advisors Funds | | Notes to Financial Statements |
| | April 30, 2016 |
Distributor
ALPS Distributors, Inc. (“ADI” or the “Distributor”) (an affiliate of ALPS) acts as the distributor of the Funds’ shares pursuant to a Distribution Agreement with the Trust. Shares are sold on a continuous basis by ADI as agent for the Funds, and ADI has agreed to use its best efforts to solicit orders for the sale of the Funds’ shares, although it is not obliged to sell any particular amount of shares. ADI is not entitled to any compensation for its services as Distributor. ADI is registered as a broker-dealer with the U.S. Securities and Exchange Commission.
Each Fund has adopted a separate Distribution and Services Plan (each a “Plan” and collectively, the “Plans”) pursuant to Rule 12b-1 of the 1940 Act. The Plans allow each Fund, as applicable, to use each Fund’s assets to pay fees in connection with the distribution and marketing of the Funds’ shares and/or the provision of shareholder services to the Funds’ shareholders. The Plan permits payment for services in connection with the administration of plans or programs that use shares of each Fund as their funding medium and for related expenses. The recipients of such payments may include other affiliates of the Adviser, broker-dealers, financial institutions, plan sponsors and administrators and other financial intermediaries through which investors may purchase shares of the Fund. The Plans permit each Fund to make total payments at an annual rate of up to 0.25% of each Funds’ average daily net assets. Because these fees are paid out of the Funds’ assets on an ongoing basis, over time they will increase the cost of an investment in the Funds, and Plan fees may cost an investor more than other types of sales charges.
Each Fund has adopted a Shareholder Services Plan (a “Shareholder Services Plan”) with respect to its shares. Under the Shareholder Services Plan, each Fund is authorized to compensate certain financial intermediaries, including broker-dealers and Fund affiliates, which may include the Distributor, Adviser and/or the transfer agent (“Participating Organizations”), an aggregate fee in an amount not to exceed on an annual basis 0.15% of the average daily net asset value of shares of the Funds attributable to or held in the name of a Participating Organization for its clients as compensation for providing services pursuant to an agreement with a Participating Organization. Any amount of such payment not paid during the Funds’ fiscal year for such service activities shall be reimbursed to the Funds as soon as practicable after the end of the fiscal year. Shareholder Services Plan fees are included within “Distribution and service fees” on the Statement of Operations.
7. INDEMNIFICATIONS
Under the Trust’s organizational documents, its officers and Trustees are indemnified against certain liability arising out of the performance of their duties to the Trust. Additionally, in the normal course of business, the Trust enters into contracts with service providers that may contain general indemnification clauses, which may permit indemnification to the extent permissible under applicable laws. The Trust’s maximum exposure under these arrangements is unknown, as this would involve future claims that may be made against the Trust that have not yet occurred.
8. SUBSEQUENT EVENT
The Board, based upon the recommendation of the Adviser, has determined to close and liquidate the Funds. The Board concluded that it would be in the best interests of each Fund and its shareholders that the Funds be closed and liquidated as series of the Trust effective as of the close
| | |
| Annual Report | April 30, 2016 | | 29 |
| | |
| Pathway Advisors Funds | | Notes to Financial Statements |
| | April 30, 2016 |
of business on July 15, 2016. On June 8, 2016, the Board approved a Plan of Termination, Dissolution and Liquidation (the “Plan”) that determines the manner in which the Funds will be liquidated. Pursuant to the Plan and in anticipation of the Funds’ liquidation, each Fund will be closed to new shareholder purchases effective as of the close of business on June 30, 2016 and closed to all existing shareholder purchases on July 5, 2016. However, any distributions declared to shareholders of a Fund after June 30, 2016, and until the close of trading on the New York Stock Exchange on July 15, 2016 will be automatically reinvested in additional shares of the Fund unless a shareholder specifically requests that such distributions be paid in cash.
| | |
| 30 | | www.pathwayadvisorsfunds.com |
| | |
| Pathway Advisors Funds | | Report of Independent Registered Public Accounting Firm |
To the Shareholders and Board of Trustees of Financial Investors Trust:
We have audited the accompanying statements of assets and liabilities, including the portfolios of investments, of Pathway Advisors Conservative Fund and Pathway Advisors Aggressive Growth Fund (the “Funds”), two of the portfolios constituting Financial Investors Trust, as of April 30, 2016, and the related statements of operations for the year then ended, the statements of changes in net assets for each of the two years in the period then ended, and the financial highlights for each of the three years in the period then ended and for the period from July 31, 2012 (commencement of operations) to April 30, 2013. These financial statements and financial highlights are the responsibility of the Funds’ management. Our responsibility is to express an opinion on these financial statements and financial highlights based on our audits.
We conducted our audits in accordance with the standards of the Public Company Accounting Oversight Board (United States). Those standards require that we plan and perform the audit to obtain reasonable assurance about whether the financial statements and financial highlights are free of material misstatement. The Funds are not required to have, nor were we engaged to perform, an audit of their internal control over financial reporting. Our audits included consideration of internal control over financial reporting as a basis for designing audit procedures that are appropriate in the circumstances, but not for the purpose of expressing an opinion on the effectiveness of the Funds’ internal control over financial reporting. Accordingly, we express no such opinion. An audit also includes examining, on a test basis, evidence supporting the amounts and disclosures in the financial statements, assessing the accounting principles used and significant estimates made by management, as well as evaluating the overall financial statement presentation. Our procedures included confirmation of securities owned as of April 30, 2016, by correspondence with the custodian; when replies were not received from brokers, we performed other auditing procedures. We believe that our audits provide a reasonable basis for our opinion.
In our opinion, the financial statements and financial highlights referred to above present fairly, in all material respects, the financial position of Pathway Advisors Conservative Fund and Pathway Advisors Aggressive Growth Fund as of April 30, 2016, the results of their operations for the year then ended, the changes in their net assets for each of the two years in the period then ended, and the financial highlights for each of the three years in the period then ended and for the period from July 31, 2012 (commencement of operations) to April 30, 2013, in conformity with accounting principles generally accepted in the United States of America.
As discussed in Note 8, the Board, based upon the recommendation of the Adviser, has determined to close and liquidate the Funds. The Board concluded that it would be in the best interests of each Fund and its shareholders that the Funds be closed and liquidated as series of the Trust effective as of the close of business on July 15, 2016. On June 8, 2016, the Board approved a Plan of Termination, Dissolution and Liquidation (the “Plan”) that determines the manner in which the Funds will be liquidated.
|
DELOITTE & TOUCHE LLP |
| Denver, Colorado |
| June 28, 2016 |
| | |
| Annual Report | April 30, 2016 | | 31 |
| | |
| Pathway Advisors Funds | | Additional Information |
| | April 30, 2016 (Unaudited) |
1. FUND HOLDINGS
The Funds file their complete schedule of portfolio holdings with the Securities and Exchange Commission (the “SEC”) for the first and third quarters of each fiscal year on Form N-Q within 60 days after the end of the period. Copies of the Funds’ Form N-Q are available without charge on the SEC website at http://www.sec.gov. You may also review and copy the Form N-Q at the SEC’s Public Reference Room in Washington, DC. For more information about the operation of the Public Reference Room, please call the SEC at 1-800-SEC-0330.
2. FUND PROXY VOTING POLICIES, PROCEDURES AND SUMMARIES
The Funds’ policies and procedures used in determining how to vote proxies and information regarding how the Fund voted proxies relating to portfolio securities during the most recent prior 12-month period ending June 30 are available without charge, (1) upon request, by calling (toll-free) 888-288-1121 and (2) on the SEC’s website at http://www.sec.gov.
3. TAX DESIGNATIONS
The Funds designate the following as a percentage of taxable ordinary income distributions, or up to the maximum amount allowable, for the calendar year ended December 31, 2015:
| | | | | | | | |
| | | Dividends Received | | | Qualified Dividend | |
| | | Deduction | | | Income | |
| |
Pathway Advisors Conservative Fund | | | 2.63% | | | | 57.66% | |
Pathway Advisors Aggressive Growth Fund | | | 26.50% | | | | 100.00% | |
In early 2016, if applicable, shareholders of record received this information for the distributions paid to them by the Funds during the calendar year 2015 via Form 1099. The Funds will notify shareholders in early 2017 of amounts paid to them by the Funds, if any, during the calendar year 2016.
Pursuant to Section 852(b)(3) of the Internal Revenue Code, Pathway Advisors Conservative Fund and Pathway Advisors Aggressive Growth Fund designated $158,898 and $194,180 respectively, as long-term capital gain dividends.
Please consult a tax advisor if you have questions about federal or state income tax laws, or how to prepare your tax returns.
| | |
| 32 | | www.pathwayadvisorsfunds.com |
| | |
| Pathway Advisors Funds | | Trustees & Officers |
| | April 30, 2016 (Unaudited) |
Additional information regarding the Fund’s trustees is included in the Statement of Additional Information, which can be obtained without charge by calling 888-288-1121.
INDEPENDENT TRUSTEES
| | | | | | | | | | |
Name, Address* & Year of Birth | | Position(s) Held with Fund | | Term of Office and Length of Time Served | | Principal Occupation(s) During Past 5 Years** | | Number of Funds in Fund Complex Overseen by Trustee*** | | Other Directorships Held by Trustee During Past 5 Years** |
Mary K. Anstine, 1940 | | Trustee | | Ms. Anstine was elected at a special meeting of shareholders held on March 21, 1997 and re-elected at a special meeting of shareholders held on August 7, 2009. | | Ms. Anstine was formerly an Executive Vice President of First Interstate Bank of Denver until 1994, President/Chief Executive Officer of HealthONE Alliance, Denver, Colorado, from 1994 to 2004, and has been retired since 2004. Ms. Anstine is also Trustee/Director of AV Hunter Trust and Colorado Uplift Board. Ms. Anstine was formerly a Director of the Trust Bank of Colorado (later purchased and now known as Northern Trust Bank), HealthONE and Denver Area Council of the Boy Scouts of America, and a member of the American Bankers Association Trust Executive Committee. | | 34 | | Ms. Anstine is a Trustee of ALPS ETF Trust (20 funds); ALPS Variable Investment Trust (9 funds); Reaves Utility Income Fund (1 fund); and Westcore Trust (12 funds). |
John R. Moran, Jr., 1930 | | Trustee | | Mr. Moran was elected at a special meeting of shareholders held on March 21, 1997 and re-elected at a special meeting of shareholders held on August 7, 2009. | | Mr. Moran formerly served as President and CEO of The Colorado Trust, a private foundation serving the health and hospital community in the state of Colorado, from 1991 to 2007. During his career as an attorney from 1958 to 1991, Mr. Moran was formerly a partner with the firm of Kutak Rock & Campbell in Denver, Colorado and a member of the Colorado House of Representatives. Currently, Mr. Moran is a member of the Treasurer’s Investment Advisory Committee for the University of Colorado. | | 34 | | None. |
| | |
| Annual Report | April 30, 2016 | | 33 |
| | |
| Pathway Advisors Funds | | Trustees & Officers |
| | April 30, 2016 (Unaudited) |
INDEPENDENT TRUSTEES (continued)
| | | | | | | | | | |
Name, Address* & Year of Birth | | Position(s) Held with Fund | | Term of Office and Length of Time Served | | Principal Occupation(s) During Past 5 Years** | | Number of Funds in Fund Complex Overseen by Trustee*** | | Other Directorships Held by Trustee During Past 5 Years** |
Jeremy W. Deems, 1976 | | Trustee | | Mr. Deems was appointed as a Trustee at the March 11, 2008 meeting of the Board of Trustees and elected at a special meeting of shareholders held on August 7, 2009. | | Mr. Deems is the Co-Founder, Chief Operations Officer and Chief Financial Officer of Green Alpha Advisors, LLC, a registered investment advisor, and Co-Portfolio Manager of the Shelton Green Alpha Fund. Prior to joining Green Alpha Advisors, Mr. Deems was CFO and Treasurer of Forward Management, LLC, ReFlow Management Co., LLC, ReFlow Fund, LLC, a private investment fund, and Sutton Place Management, LLC, an administrative services company, from 1998 to June 2007. From 2004 to 2005, Mr. Deems also served as Treasurer of the Forward Funds and the Sierra Club Funds. | | 34 | | Mr. Deems is a Trustee of ALPS ETF Trust (20 funds); ALPS Variable Investment Trust (9 funds), Reaves Utility Income Fund (1 fund) and Clough Funds Trust (1 fund). |
| Jerry G. Rutledge 1944 | | Trustee | | Mr. Rutledge was elected at a special meeting of shareholders held on August 7, 2009. | | Mr. Rutledge is the President and owner of Rutledge’s Inc., a retail clothing business. Mr. Rutledge is currently Director of the American National Bank. He was from 1994 to 2007 a Regent of the University of Colorado. | | 34 | | Mr. Rutledge is a Trustee of Principal Real Estate Fund (1 fund), Clough Global Allocation Fund (1 fund), Clough Global Equity Fund (1 fund) and Clough Global Opportunities Fund (1 fund). |
| | |
| 34 | | www.pathwayadvisorsfunds.com |
| | |
| Pathway Advisors Funds | | Trustees & Officers |
| | April 30, 2016 (Unaudited) |
INDEPENDENT TRUSTEES (continued)
| | | | | | | | | | |
Name, Address* & Year of Birth | | Position(s) Held with Fund | | Term of Office and Length of Time Served | | Principal Occupation(s) During Past 5 Years** | | Number of
Funds in
Fund
Complex
Overseen
by
Trustee*** | | Other
Directorships
Held by Trustee
During Past 5
Years** |
| Michael “Ross” Shell, 1970 | | Trustee | | Mr. Shell was elected at a special meeting of shareholders held on August 7, 2009. | | Mr. Shell is Founder and CEO of Red Idea, LLC, a strategic consulting/early stage venture firm (since June 2008). From 1999 to 2009, he was a part-owner and Director of Tesser, Inc., a brand agency. From December 2005 to May 2008, he was Director, Marketing and Investor Relations, of Woodbourne, a REIT/real estate hedge fund and private equity firm. Prior to this, from May 2004 to November 2005, he worked as a business strategy consultant; from June 2003 to April 2004, he was on the Global Client Services team of IDEO, a product design/innovation firm; and from 1999 to 2003, he was President of Tesser, Inc. Mr. Shell graduated with honors from Stanford University with a degree in Political Science. | | 34 | | None. |
| | |
| Annual Report | April 30, 2016 | | 35 |
| | |
| Pathway Advisors Funds | | Trustees & Officers |
| | April 30, 2016 (Unaudited) |
INTERESTED TRUSTEE
| | | | | | | | | | |
Name, Address* & Age | | Position(s) Held with Fund | | Term of Office and
Length of Time Served | | Principal Occupation(s) During Past 5 Years** | | Number of
Funds in Fund Complex
Overseen by Trustee*** | | Other
Directorships
Held by Trustee |
| Edmund J. Burke, 1961 | | Trustee, Chairman and President | | Mr. Burke was elected as Chairman at the August 28, 2009 meeting of the Board of Trustees. Mr. Burke was elected as Trustee at a special meeting of shareholders held on August 7, 2009. Mr. Burke was elected President of the Trust at the December 17, 2002 meeting of the Board of Trustees. | | Mr. Burke is President and a Director of ALPS Holdings, Inc. (“AHI”) (since 2005) and Director of Boston Financial Data Services, Inc. (“BFDS”), ALPS Advisors, Inc. (“AAI”), ALPS Distributors, Inc. (“ADI”), ALPS Fund Services, Inc. (“AFS”) and ALPS Portfolio Solutions Distributor, Inc. (“APSD”) and from 2001-2008, was President of AAI, ADI, AFS and APSD. Because of his positions with AHI, BFDS, AAI, ADI, AFS and APSD, Mr. Burke is deemed an affiliate of the Trust as defined under the 1940 Act. Mr. Burke is Trustee and President of the Clough Global Allocation Fund (Trustee since 2006; President since 2004); Trustee and President of the Clough Global Equity Fund (Trustee since 2006; President since 2005); Trustee and President of the Clough Global Opportunities Fund (since 2006); Trustee of the Liberty All-Star Equity Fund; and Director of the Liberty All-Star Growth Fund, Inc. | | 34 | | Mr. Burke is a Trustee of Clough Global Allocation Fund (1 fund); Clough Global Equity Fund (1 fund); Clough Global Opportunities Fund (1 fund); Liberty All-Star Equity Fund (1 fund) and Clough Funds Trust (1 fund); and Director of the Liberty All-Star Growth Fund, Inc. (1 fund). |
| | |
| 36 | | www.pathwayadvisorsfunds.com |
| | |
| Pathway Advisors Funds | | Trustees & Officers |
| | April 30, 2016 (Unaudited) |
OFFICERS
| | | | | | |
Name, Address* & Year of Birth | | Position(s) Held with Fund | | Term of Office and Length of Time Served | | Principal Occupation(s) During Past 5 Years** |
| Kimberly R. Storms, 1972 | | Treasurer | | Ms. Storms was elected Treasurer of the Trust at the March 12, 2013 meeting of the Board of Trustees. | | Ms. Storms is Senior Vice President - Director of Fund Administration of ALPS. Because of her position with ALPS, Ms. Storms is deemed an affiliate of the Trust as defined under the 1940 Act. Ms. Storms is also Treasurer of Liberty All-Star Equity Fund, Liberty All-Star Growth Fund, Inc. and ALPS Series Trust. Ms. Storms also serves as a Board member and Treasurer of The Center for Trauma & Resilience, a nonprofit agency. |
JoEllen L. Legg, 1961 | | Secretary | | Ms. Legg was elected Secretary of the Trust at the September 15, 2015 meeting of the Board of Trustees. | | Ms. Legg joined ALPS in October 2007 and is currently Vice President, Assistant General Counsel of ALPS. Prior to joining ALPS, Ms. Legg served as Senior Counsel - Law (Corporate & Securities) for Adelphia Communications Corporation (February 2005 - March 2007). Prior to this, Ms. Legg held associate positions at Fried Frank Harris Shriver & Jacobson LLP (1998 - 2004) and at Patton Boggs LLP (2004 - 2005). Because of her position with ALPS, Ms. Legg is deemed an affiliate of the Trust as defined under the 1940 Act. Ms. Legg is also the Secretary of ALPS Series Trust and Reaves Utility Income Fund. |
| Ted Uhl, 1974 | | Chief Compliance Officer (“CCO”) | | Mr. Uhl was appointed CCO of the Trust at the June 8, 2010 meeting of the Board of Trustees. | | Mr. Uhl joined ALPS in October 2006, and is currently Deputy Compliance Officer of ALPS. Prior to his current role, Mr. Uhl served as Senior Risk Manager for ALPS from October 2006 until June 2010. Because of his position with ALPS, Mr. Uhl is deemed an affiliate of the Trust as defined under the 1940 Act. Mr. Uhl is also CCO of the Reaves Utility Income Fund, Centre Funds and Transparent Value Trust. |
| Jennell Panella, 1974 | | Assistant Treasurer | | Ms. Panella was elected Assistant Treasurer of the Trust at the September 15, 2015 meeting of the Board of Trustees. | | Ms. Panella joined ALPS in June 2012 and is currently Fund Controller of ALPS Fund Services, Inc. Prior to joining ALPS, Ms. Panella served as Financial Reporting Manager for Parker Global Strategies, LLC (2009-2012). Because of her position with ALPS, Ms. Panella is deemed an affiliate of the Trust as defined under the 1940 Act. Ms. Panella also serves as Assistant Treasurer of James Advantage Funds. |
| Nate Mandeville, 1977 | | Assistant Treasurer | | Mr. Mandeville was elected Assistant Treasurer of the Trust at the September 15, 2015 meeting of the Board of Trustees. | | Mr. Mandeville joined ALPS in December 2013 and is Fund Controller for ALPS. Prior to joining ALPS, Mr. Mandeville worked for Great-West Financial (2011-2013), Virtuoso Sourcing Group (2008-2011) and Janus Capital Group (2000-2008). Because of his position with ALPS, Mr. Mandeville is deemed an affiliate of the Trust as defined under the 1940 Act. Mr. Mandeville also serves as Assistant Treasurer of ALPS Series Trust. |
| Sharon Akselrod, 1974 | | Assistant Secretary | | Ms. Akselrod was elected Assistant Secretary of the Trust at the September 15, 2015 meeting of the Board of Trustees. | | Ms. Akselrod joined ALPS in August 2014 and is currently Senior Investment Company Act Paralegal of ALPS. Prior to joining ALPS, Ms. Akselrod served as Corporate Governance and Regulatory Associate for Nordstrom fsb (2013-2014) and Senior Legal Assistant – Legal Manager for AXA Equitable Life Insurance Company (2008-2013). Because of her position with ALPS, Ms. Akselrod is deemed an affiliate of the Trust as defined under the 1940 Act. |
| | |
| Annual Report | April 30, 2016 | | 37 |
| | |
| Pathway Advisors Funds | | Trustees & Officers |
| | April 30, 2016 (Unaudited) |
OFFICERS (continued)
| | | | | | |
Name, Address* & Year of Birth | | Position(s) Held with Fund | | Term of Office and Length of Time Served | | Principal Occupation(s) During Past 5 Years** |
| Sareena Khwaja-Dixon 1980 | | Assistant Secretary | | Ms. Khwaja-Dixon was elected Assistant Secretary of the Trust at the December 15, 2015 meeting of the Board of Trustees. | | Ms. Khwaja-Dixon joined ALPS in August 2015 and is currently Senior Counsel and Vice President of ALPS. Prior to joining ALPS, Ms. Khwaja-Dixon served as a Senior Paralegal/Paralegal for Russell Investments (2011- 2015). Because of her position with ALPS, Ms. Khwaja-Dixon is deemed an affiliate of the Trust as defined under the 1940 Act. |
| * | All communications to Trustees and Officers may be directed to Financial Investors Trust c/o 1290 Broadway, Suite 1100, Denver, CO 80203. |
| ** | This is the period for which the Trustee or Officer began serving the Trust. Each Trustee serves an indefinite term, until his successor is elected. Officers are elected on an annual basis. |
| *** | The Fund Complex includes all series of the Trust (currently 34) and any other investment companies for which any Trustee serves as trustee for and which Hanson McClain, Inc. provides investment advisory services (currently none). |
| | |
| 38 | | www.pathwayadvisorsfunds.com |
Page Intentionally Left Blank
Table of Contents
| | |
| Redmont Resolute Fund II | | Shareholder Letter |
| | April 30, 2016 (Unaudited) |
PERFORMANCE:
April 30, 2016
The Fund outperformed the HFRX Global Index by approximately 510 basis pointsii over the twelve months ending April 30, 2016. Since inception, the Fund has outperformed the HFRX Global Index by over 260 basis points annualized. When compared to the peer group (Morningstar MultiAlternative Universe), the Fund has outperformed the Universe over all time periods – by over 280 basis points during the past twelve months and 245 basis points annualized since inception. Relative to the S&P 500® Index, the Fund has performed as we expected - participating but trailing in strong up markets while protecting capital and outperforming in negative markets.
Tactical Managers – Tactical managers were a drag on performance as positions in Japan and Europe detracted. In contrast, FPA Crescent performed well relative to the HFRX Macro Index with less international exposure than Morgan Stanley Multi-Asset and Pinebridge.
Long/Short Managers – Long/Short equity managers performed well relative to the HFRX Equity Hedge Index which reacted to sharp declines in global equities during the period. Dalton European Long/Short and Boston Partners Research Long/Short posted positive returns for the period.
Opportunistic Managers – The Opportunistic allocation contributed to performance led by AQR Multi-Strategy. AQR Risk Parity was the main detractor during the period. Stadion was a slight detractor through August until being removed from the portfolio. Weiss Alpha Balanced Risk replaced the allocation to Stadion, adding to performance since its inception.
REDMONT RESOLUTE FUND II
Table 1 notes the performance for Fund II as of quarter end under standard reporting (since inception) as well as of April 30th.
Table 1 i. ii. iii. iv. v.
| | | | | | | | | | | | | | | | | | | | | | | | |
| Performance (amounts greater than one year are annualized) | |
| | |
| Redmont Resolute Fund II | | Standardized Performance Data as of March 31, 2016 | | | Non-Standardized Performance Data as of April 30, 2016 | |
| | | Year-to-Date | | | 1-Year | | | Since Inception
(12/30/11) | | | Year-to-Date | | | 1-Year | | | Since Inception
(12/30/11) | |
Resolute Fund II - I Class | | | -0.37% | | | | -2.58% | | | | 3.51% | | | | 0.37% | | | | -2.02% | | | | 3.66% | |
HFRX Global Index | | | -1.87% | | | | -7.36% | | | | 0.89% | | | | -1.47% | | | | -7.18% | | | | 0.97% | |
S&P 500® Index | | | 1.35% | | | | 1.78% | | | | 14.74% | | | | 1.74% | | | | 1.21% | | | | 14.54% | |
Morningstar Multi-Alternative Universe | | | -0.72% | | | | -5.24% | | | | 1.16% | | | | -1.83% | | | | -4.86% | | | | 1.17% | |
| | | Gross Expense
Ratio | | | Less Expense
Waivers | | | Net Expense
Ratio | | | Net Ratio ex Dividend & Short Expense | |
Resolute Fund II - I Class | | | 1.69% | | | | -1.34% | | | | 0.35% | | | | | | | | 0.27% | | | | | |
| | | | | | | | | | | | | | | | | | | | | | | | |
This performance analysis section shows the fund’s historical performance. Past performance is not indicative of future results. Investment return and value of shares will fluctuate. Upon redemption, shares may be worth more or less than their original cost. The current performance may be higher or lower than the quoted performance. Call 1-855-268-2242 or visit www.redmontfunds.com for the most recent month end performance results. The Fund has a redemption fee of 2.00% for shares redeemed within the first 90 days of purchase. Maximum Offering Price (MOP) for Class A includes the Fund’s maximum sales charge of 5.50%. Performance shown at NAV does not include these sales charges and would have been lower had it been taken into account.
Note: “Non-Standardized” performance includes month-end periods other than quarter-end. Examples include April, May, July, August, etc.
| | |
| Annual Report | April 30, 2016 | | 1 |
| | |
| Redmont Resolute Fund II | | Shareholder Letter |
| | April 30, 2016 (Unaudited) |
Portfolio Changes:
The overall allocation has remained unchanged during 2015, but we did make a manager change as we continue to identify unique strategies that add value to the portfolio. Within the Opportunistic allocation, Stadion was replaced by Weiss Alpha Balanced Strategy on September 1st. This move is expected to improve risk-adjusted performance.
Closing:
We seek to add value both in our allocation and manager selection decisions. The changes outlined above should continue to provide additional value going forward. We appreciate your investment in our Redmont Resolute Fund, please feel free to contact us with any questions.
Sincerely,

R. Scott Graham, CFA & Michael T. Lytle, CFA
Portfolio Managersii.
| | |
| Redmont Resolute Fund II | | Shareholder Letter |
| | April 30, 2016 (Unaudited) |
Underlying Allocation Weights & Performance:
The current allocation remained roughly unchanged during the fiscal year ended April 30, 2016. Figure 1 lists the long-term target asset allocation for the Fund as well as the allocation for the Fund as of April 30, 2016.
Figure 1
| | | | | | | | |
| | Target Asset Allocation | | | | April 30, 2016 Allocation | | |
| | 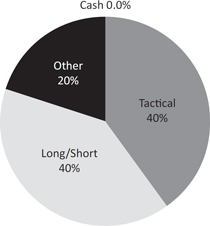 | | | | 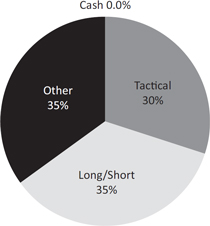 | | |
Holdings and allocations subject to change and may not reflect the current or future position of the portfolio.
| | |
| Annual Report | April 30, 2016 | | 3 |
| | |
| Redmont Resolute Fund II | | Shareholder Letter |
| | April 30, 2016 (Unaudited) |
IMPORTANT NOTES AND DISCLOSURES
The Fund’s investment objectives, risks, charges and expenses must be considered before investing. The prospectus contains this and other important information about the investment company and may be obtained by calling 1-855-268-2242 or by visiting www.redmontfunds.com. Read it carefully before investing.
The views of Highland Associates, Inc. and information discussed in this commentary are as of the date of publication, are subject to change and may not reflect the writer’s current views. The views expressed are those of the author only and represent an assessment of market conditions at a specific point in time, are opinions only and should not be relied upon as investment advice regarding a particular investment or markets in general. Such information does not constitute a recommendation to buy or sell specific securities or investment vehicles. It should not be assumed that any investment will be profitable or will equal the performance of the portfolios or any securities or any sectors mentioned in this letter. The subject matter contained in this letter has been derived from several sources believed to be reliable and accurate at the time of compilation. Neither Highland Associates, Inc. nor the Fund accept any liability for losses either direct or consequential caused by the use of this information.
RISKS:
The Fund is structured with an Underlying Investment Strategy. This strategy adopts the risks of investments in Other Investment Companies. These risks include, but are not limited to higher expenses, allocation risk, underlying fund risk, transparency risk, and underlying fund managed portfolio risk. Investments which focus on alternative strategies are subject to increased risk and loss of principal and are not suitable for all investors. Swap Risk involves swap agreements and are subject to counterparty default risk and may not perform as intended. Derivatives Risk involves the exercise of skill and judgment. Derivatives may expire worthless or not perform as expected. Equity risk may cause the value of the securities held by the Fund to fall due to general market and economic conditions, perceptions regarding the industries in which the issuers of securities held by the Fund participate, or factors relating to specific companies in which the Fund invest.
The Fund’s investments in non-U.S. issuers may be even more volatile and may present more risks than investments in U.S. issuers.
Commodity Risk may subject the Funds to greater volatility than traditional investments because of global supply and demand, changes in interest rates, commodity index volatility, and factors affecting a particular industry or commodity. Commodity-linked investments may not move in the same direction and to the same extent as the underlying commodities.
| ii. | Basis Point = 0.01%, 100 basis points would equal 1.0% |
| iii. | The S&P 500® Index is an unmanaged index of 500 common stocks chosen for market size, liquidity, and industry group representation. It is a market-value weighted index. The S&P 500® Index figures do not reflect any fees, expenses, or taxes. Investors cannot invest directly in this index. |
| iv. | The Morningstar Multi-Alternative Universe is designed to represent the exposure to alternative investment tactics. Funds in this category have the majority of their assets exposed to alternative strategies. An investor’s exposure to different tactics may change slightly over time in response to market movements. Funds in this category include both funds with static allocations to alternative strategies and funds tactically allocating among alternative strategies and asset classes. The gross short exposure is greater than 20%. |
| v. | The HFRX Global Index is designed to be representative of the overall composition of the hedge fund universe, and includes convertible arbitrage, distressed securities, equity hedge, equity market neutral, event driven, macro, merger arbitrage, and relative value strategies. Investors cannot invest directly in an index. |
| vi. | Highland Associates, Inc. has agreed to waive the portion of its 1.50% Management Fee in excess of any sub-advisory fees paid by the Adviser to sub-advisors in connection with the Redmont Resolute Fund II. This agreement is in effect through August 31, 2017. The Adviser may not discontinue this agreement to waive fees without the approval by the Fund’s Board of Trustees. |
| vii. | R. Scott Graham and Michael T. Lytle are registered representatives of ALPS Distributors, Inc. CFA Institute Marks are trademarks owned by the CFA Institute. |
ALPS Distributors, Inc. is the distributor for the Redmont Funds. R. Scott Graham and Michael T. Lytle are registered representatives of ALPS Distributors, Inc. CFA Institute Marks are trademarks owned by the CFA Institute.
| | |
| Redmont Resolute Fund II | | Performance Update |
| | April 30, 2016 (Unaudited) |
| | | | | | | | | | | | | | | | |
| Performance (for the period ended April 30, 2016) | | |
Redmont Resolute Fund II | | |
Cumulative Total Return (for the period ended April 30, 2016) | | Year-to-Date | | | 1 Year | | | 3 Year | | | Since
Inception* | | |
Redmont Resolute Fund II - Class I - NAV | | | 0.37% | | | | -2.02% | | | | 1.63% | | | 3.66% | |
S&P 500® Index | | | 1.74% | | | | 1.21% | | | | 11.26% | | | 14.54% | |
Dow Jones U.S Select Dividend Index | | | 10.18% | | | | 8.85% | | | | 11.82% | | | 14.35% | |
HFRX Global Hedge Fund Index | | | -1.47% | | | | -7.18% | | | | -0.99% | | | 0.97% | |
| |
* Fund inception date of 12/30/11. (a) The HFRX Global Hedge Fund Index is designed to be representative of the overall composition of the hedge fund universe and includes convertible arbitrage, distressed securities, equity hedge, equity market neutral, event driven, macro, merger arbitrage and relative value strategies. The index is not actively managed and does not reflect any deduction of fees, expenses or taxes. An investor may not invest directly in an index. (b) The S&P 500® Index is the Standard & Poor’s composite index of 500 stocks, a widely recognized, unmanaged index of common stock prices. The index is not actively managed and does not reflect any deduction of fees, expenses or taxes. An investor may not invest directly in an index. (c) The Dow Jones U.S. Select Dividend Index represents the country’s top stocks by dividend yield, selected annually and subject to screening and buffering criteria. The index is not actively managed and does not reflect any deductions of fees, expenses or taxes. An investor may not invest directly in an index. | | |
Performance data quoted represents past performance. Past performance does not guarantee future results. Investment return and principal value of an investment will fluctuate so that an investor’s shares, when sold or redeemed, may be worth more or less than the original cost. Current performance data may be higher or lower than actual data quoted. For the most current month-end performance data please call 1-855-268-2242. The table does not reflect the deduction of taxes that a shareholder would pay on Fund distributions or the redemption of Fund shares. | | |
Top Ten Holdings*
(for the period ended April 30, 2016)
| | |
As a percentage of Net Assets |
PIMCO Short-Term Fund, Institutional Class | | 17.12% |
FPA Crescent Fund | | 11.01% |
AQR Risk Parity Fund, Class I | | 9.03% |
AQR Multi Strategy Alternative Fund, Class I | | 8.96% |
Diamond Hill Long-Short Fund, Class Y | | 8.75% |
Morgan Stanley Institutional Fund, Inc. - Multi-Asset Portfolio, Class I | | 8.00% |
Nuveen Symphony Floating Rate Income Fund, Class I | | 0.86% |
JPMorgan Chase & Co. | | 0.15% |
Exxon Mobile Corp. | | 0.14% |
Credit Suisse Floating Rate High Income Fund, Institutional Class | | 0.14% |
Top Ten Holdings | | |
* Holdings are subject to change, and may not reflect the current or future position of the portfolio. |
Performance of $10,000 Initial Investment (for the period ended April 30, 2016)
Comparison of change in value of a $10,000 investment
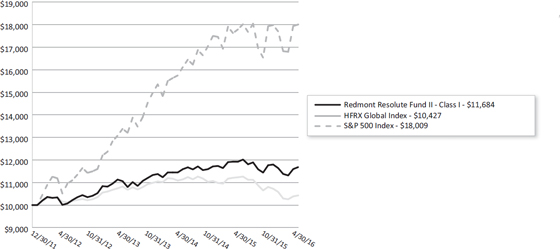
The chart represents historical performance of a hypothetical investment of $10,000 in the Fund since inception. Past performance does not guarantee future results. This chart does not reflect the deduction of taxes that a shareholder would pay on Fund distributions or the redemption of Fund shares.
| | |
| Annual Report | April 30, 2016 | | 5 |
| | |
| Redmont Resolute Fund II | | Disclosure of Fund Expenses |
| | April 30, 2016 (Unaudited) |
As a shareholder of the Fund, you incur two types of costs: (1) transaction costs, including applicable sales charges (loads), redemption fees; and (2) ongoing costs, including management fees, distribution and service (12b-1) fees, shareholder services fees and other Fund operating expenses. This example is intended to help you understand your ongoing costs (in dollars) of investing in the Fund and to compare these costs with the ongoing costs of investing in other mutual funds.
This example is based on an investment of $1,000 invested at the beginning of the period and held for the six-month period of November 1, 2015 to April 30, 2016.
Actual Expenses. The first line of the table below provides information about actual account values and actual expenses. You may use the information in this line, together with the amount you invested to estimate the expenses that you paid over the period. Simply divide your account value by $1,000 (for example, an $8,600 account value divided by $1,000 = 8.6), then multiply the result by the number in the first line of the table below under the heading titled “Expenses Paid During Period” to estimate the expenses you paid on your account during this period.
Hypothetical Example for Comparison Purposes. The second line of the table below provides information about hypothetical account values and hypothetical expenses based on the Fund’s actual expense ratio and an assumed rate of return of 5% per year before expenses, which is not the Fund’s actual return. The hypothetical account values and expenses may not be used to estimate the actual ending account balance or expenses you paid for the period. You may use this information to compare the ongoing costs of investing in the Fund and other mutual funds. To do so, compare this 5% hypothetical example with the 5% hypothetical examples that appear in the shareholder reports of the other funds.
Please note that the expenses shown in the table below are meant to highlight your ongoing costs only and do not reflect any transactional costs, such as applicable sales charges (loads), redemption fees, or exchange fees. Therefore, the second line of the table below is useful in comparing ongoing costs only and will not help you determine the relative total costs of owning different funds. In addition, if these transactional costs were included, your costs would have been higher.
| | | | | | | | | | | | | | | | | | | | |
| | | BEGINNING
ACCOUNT VALUE
11/01/15 | | ENDING
ACCOUNT VALUE
04/30/16 | | EXPENSE
RATIO(a) | | EXPENSES PAID
DURING PERIOD
11/01/15-04/30/16(b) |
| Redmont Resolute Fund II | | | | | | | | |
Class I | | | | | | | | | | | | | | | | | | | | |
Actual | | | $ | 1,000.00 | | | | $ | 992.90 | | | | | 0.35 | % | | | $ | 1.73 | |
Hypothetical (5% return before expenses) | | | $ | 1,000.00 | | | | $ | 1,023.12 | | | | | 0.35 | % | | | $ | 1.76 | |
| (a) | Annualized, based on the Fund’s most recent fiscal half year expenses. |
| (b) | Expenses are equal to the Fund’s annualized expense ratio multiplied by the average account value over the period, multiplied by the number of days in the most recent fiscal half-year (182)/366 (to reflect the half-year period). |
| | |
| Redmont Resolute Fund II | | Schedule of Investments |
| | April 30, 2016 |
| | | | | | | | |
| | | | | | Value | |
| Description | | Shares | | | (Note 2) | |
| |
CLOSED END FUNDS (0.01%) | | | | | | | | |
Better Capital PCC, Ltd. | | | 4,383 | | | $ | 5,267 | |
Electra Private Equity PLC | | | 695 | | | | 35,979 | |
Goldman Sachs BDC, Inc. | | | 401 | | | | 7,880 | |
HgCapital Trust PLC | | | 578 | | | | 9,881 | |
Princess Private Equity Holding, Ltd. | | | 1,252 | | | | 10,505 | |
Riverstone Energy, Ltd.(a) | | | 61 | | | | 724 | |
| | | | | | | | |
| | | | | | | 70,236 | |
| | | | | | | | |
| | |
TOTAL CLOSED END FUNDS (Cost $73,477) | | | | | | | 70,236 | |
| |
| | |
COMMON STOCKS (14.25%) | | | | | | | | |
ADVERTISING (0.07%) | | | | | | | | |
Omnicom Group, Inc.(b) | | | 2,580 | | | | 214,063 | |
The Interpublic Group of Companies, Inc. | | | 11,526 | | | | 264,406 | |
| | | | | | | | |
| | | | | | | 478,469 | |
| | | | | | | | |
| | |
AEROSPACE & DEFENSE (0.59%) | | | | | | | | |
Airbus Group SE | | | 2,467 | | | | 154,264 | |
Cubic Corp. | | | 1,343 | | | | 55,829 | |
Finmeccanica SpA(a) | | | 410 | | | | 5,178 | |
General Dynamics Corp.(b) | | | 5,820 | | | | 817,826 | |
Harris Corp.(b) | | | 6,910 | | | | 552,869 | |
IHI Corp. | | | 17,000 | | | | 39,145 | |
L-3 Communications Holdings, Inc. | | | 707 | | | | 92,992 | |
Lockheed Martin Corp.(b) | | | 3,072 | | | | 713,871 | |
Northrop Grumman Corp.(b) | | | 1,879 | | | | 387,563 | |
Raytheon Co.(b) | | | 3,884 | | | | 490,743 | |
Spirit AeroSystems Holdings, Inc., Class A(a) | | | 2,100 | | | | 99,015 | |
The Boeing Co. | | | 1,043 | | | | 140,596 | |
United Technologies Corp.(b) | | | 4,634 | | | | 483,651 | |
| | | | | | | | |
| | | | | | | 4,033,542 | |
| | | | | | | | |
| | |
AGRICULTURE (0.16%) | | | | | | | | |
Altria Group, Inc. | | | 1,042 | | | | 65,344 | |
Archer-Daniels-Midland Co. | | | 8,934 | | | | 356,824 | |
British American Tobacco PLC | | | 4,585 | | | | 279,364 | |
Bunge, Ltd. | | | 293 | | | | 18,313 | |
Japan Tobacco, Inc. | | | 1,400 | | | | 59,605 | |
Philip Morris International, Inc. | | | 744 | | | | 73,001 | |
Reynolds American, Inc. | | | 4,992 | | | | 247,603 | |
| | | | | | | | |
| | | | | | | 1,100,054 | |
| | | | | | | | |
| | |
AIRLINES (0.13%) | | | | | | | | |
Alaska Air Group, Inc. | | | 1,400 | | | | 98,602 | |
American Airlines Group, Inc. | | | 443 | | | | 15,368 | |
ANA Holdings, Inc. | | | 23,000 | | | | 66,579 | |
Delta Air Lines, Inc.(b) | | | 10,811 | | | | 450,494 | |
Southwest Airlines Co. | | | 351 | | | | 15,658 | |
United Continental Holdings, Inc.(a) | | | 4,723 | | | | 216,361 | |
| | | | | | | | |
| | | | | | | 863,062 | |
| | | | | | | | |
| | |
| See Notes to Financial Statements. | | |
Annual Report | April 30, 2016 | | 7 |
| | |
| Redmont Resolute Fund II | | Schedule of Investments |
| | April 30, 2016 |
| | | | | | | | |
| | | | | | Value | |
| Description | | Shares | | | (Note 2) | |
| |
APPAREL (0.04%) | | | | | | | | |
Asics Corp. | | | 400 | | | $ | 8,312 | |
Carter’s, Inc. | | | 100 | | | | 10,667 | |
Christian Dior SE | | | 681 | | | | 119,579 | |
LVMH Moet Hennessy Louis Vuitton SE | | | 388 | | | | 64,465 | |
Michael Kors Holdings, Ltd.(a) | | | 219 | | | | 11,314 | |
NIKE, Inc., Class B | | | 381 | | | | 22,456 | |
| | | | | | | | |
| | | | | | | 236,793 | |
| | | | | | | | |
| | |
AUTO MANUFACTURERS (0.16%) | | | | | | | | |
Bayerische Motoren Werke AG | | | 1,700 | | | | 156,700 | |
Daihatsu Motors Co., Ltd. | | | 5,200 | | | | 73,308 | |
Fiat Chrysler Auto NV | | | 3,983 | | | | 31,971 | |
Ford Motor Co. | | | 7,400 | | | | 100,344 | |
Fuji Heavy Industries, Ltd. | | | 4,300 | | | | 150,177 | |
General Motors Co. | | | 769 | | | | 24,454 | |
Hino Motors, Ltd. | | | 300 | | | | 3,051 | |
Honda Motor Co., Ltd. | | | 1,800 | | | | 50,625 | |
Mazda Motor Corp. | | | 5,200 | | | | 85,257 | |
Mitsubishi Motors Corp. | | | 3,000 | | | | 12,660 | |
Suzuki Motor Corp. | | | 3,800 | | | | 109,821 | |
Toyota Motor Corp. | | | 6,000 | | | | 318,835 | |
| | | | | | | | |
| | | | | | | 1,117,203 | |
| | | | | | | | |
| | |
AUTO PARTS & EQUIPMENT (0.19%) | | | | | | | | |
Aisin Seiki Co., Ltd. | | | 700 | | | | 28,487 | |
Bridgestone Corp. | | | 3,700 | | | | 143,132 | |
Cie Generale des Etablissements Michelin | | | 1,360 | | | | 141,945 | |
Continental AG | | | 637 | | | | 139,898 | |
Denso Corp. | | | 2,200 | | | | 87,897 | |
JTEKT Corp. | | | 2,400 | | | | 32,278 | |
Koito Manufacturing Co., Ltd. | | | 400 | | | | 18,195 | |
Lear Corp. | | | 2,617 | | | | 301,295 | |
NGK Insulators, Ltd. | | | 1,000 | | | | 21,748 | |
NHK Spring Co., Ltd. | | | 300 | | | | 2,780 | |
Tenneco, Inc.(a) | | | 6,060 | | | | 322,998 | |
The Goodyear Tire & Rubber Co. | | | 2,236 | | | | 64,777 | |
| | | | | | | | |
| | | | | | | 1,305,430 | |
| | | | | | | | |
| | |
BANKS (1.34%) | | | | | | | | |
Agricultural Bank of China, Ltd., Class H | | | 6,000 | | | | 2,174 | |
Banco de Sabadell SA | | | 6,637 | | | | 12,684 | |
Banco Santander SA | | | 41,883 | | | | 212,023 | |
Bank of America Corp.(b) | | | 37,474 | | | | 545,621 | |
Bank of Ireland(a) | | | 357,458 | | | | 108,467 | |
Bank of Montreal | | | 2,966 | | | | 193,226 | |
BB&T Corp.(b) | | | 10,784 | | | | 381,538 | |
BNP Paribas SA | | | 3,828 | | | | 202,682 | |
Capital One Financial Corp.(b) | | | 9,729 | | | | 704,282 | |
Chongqing Rural Commercial Bank Co., Ltd., Class H | | | 15,000 | | | | 7,909 | |
Citigroup, Inc.(b) | | | 19,743 | | | | 913,706 | |
Citizens Financial Group, Inc. | | | 9,372 | | | | 214,150 | |
Comerica, Inc. | | | 960 | | | | 42,624 | |
| | |
| See Notes to Financial Statements. | | |
8 | | www.redmontfunds.com |
| | |
| Redmont Resolute Fund II | | Schedule of Investments |
| | April 30, 2016 |
| | | | | | | | |
| | | | | | Value | |
| Description | | Shares | | | (Note 2) | |
| |
BANKS (1.34%) (continued) | | | | | | | | |
Concordia Financial Group, Ltd.(a) | | | 17,900 | | | $ | 86,203 | |
Cullen/Frost Bankers, Inc. | | | 1,088 | | | | 69,621 | |
DnB ASA | | | 10,741 | | | | 137,533 | |
East West Bancorp, Inc. | | | 1,776 | | | | 66,582 | |
Fifth Third Bancorp(b) | | | 28,172 | | | | 515,829 | |
First Horizon National Corp. | | | 4,885 | | | | 68,781 | |
First Republic Bank | | | 1,111 | | | | 78,126 | |
Hokuhoku Financial Group, Inc. | | | 37,000 | | | | 48,684 | |
HSBC Holdings PLC | | | 46,949 | | | | 310,413 | |
Huntington Bancshares, Inc.(b) | | | 28,307 | | | | 284,768 | |
Industrial & Commercial Bank of China, Ltd., Class H | | | 37,000 | | | | 20,082 | |
Intesa Sanpaolo SpA | | | 60,313 | | | | 167,129 | |
Intesa Sanpaolo SpA RSP | | | 45,635 | | | | 119,976 | |
Investec PLC | | | 1,557 | | | | 11,898 | |
Japan Post Bank Co., Ltd. | | | 3,700 | | | | 46,772 | |
JPMorgan Chase & Co.(b) | | | 16,727 | | | | 1,057,146 | |
KBC Groep NV | | | 2,149 | | | | 120,649 | |
Keycorp | | | 377 | | | | 4,633 | |
M&T Bank Corp. | | | 439 | | | | 51,943 | |
Mitsubishi UFJ Financial Group, Inc. | | | 47,100 | | | | 230,232 | |
Mizuho Financial Group, Inc. | | | 103,900 | | | | 163,857 | |
Morgan Stanley | | | 4,937 | | | | 133,595 | |
Popular, Inc. | | | 2,367 | | | | 70,347 | |
Regions Financial Corp. | | | 5,470 | | | | 51,309 | |
State Street Corp.(b) | | | 2,782 | | | | 173,319 | |
Sumitomo Mitsui Financial Group, Inc. | | | 1,100 | | | | 35,285 | |
SunTrust Banks, Inc.(b) | | | 8,490 | | | | 354,373 | |
The Chiba Bank, Ltd. | | | 12,000 | | | | 63,609 | |
The Goldman Sachs Group, Inc.(b) | | | 2,211 | | | | 362,847 | |
The Iyo Bank, Ltd. | | | 2,200 | | | | 15,135 | |
Wells Fargo & Co.(b) | | | 14,379 | | | | 718,662 | |
| | | | | | | | |
| | | | | | | 9,180,424 | |
| | | | | | | | |
| | |
BEVERAGES (0.18%) | | | | | | | | |
Anheuser-Busch InBev NV | | | 253 | | | | 31,316 | |
Asahi Group Holdings, Ltd. | | | 3,400 | | | | 112,130 | |
Brown-Forman Corp., Class B | | | 119 | | | | 11,462 | |
Carlsberg A/S, Class B | | | 1,444 | | | | 140,630 | |
Coca-Cola Enterprises, Inc. | | | 354 | | | | 18,578 | |
Coca-Cola HBC AG | | | 5,765 | | | | 117,929 | |
Constellation Brands, Inc., Class A(b) | | | 2,253 | | | | 351,603 | |
Dr. Pepper Snapple Group, Inc. | | | 485 | | | | 44,091 | |
Heineken Holding NV | | | 1,554 | | | | 128,278 | |
Heineken NV | | | 1,552 | | | | 145,457 | |
Kirin Holdings Co., Ltd. | | | 3,500 | | | | 52,352 | |
PepsiCo, Inc. | | | 784 | | | | 80,721 | |
The Coca-Cola Co. | | | 554 | | | | 24,819 | |
| | | | | | | | |
| | | | | | | 1,259,366 | |
| | | | | | | | |
| | |
BIOTECHNOLOGY (0.13%) | | | | | | | | |
Amgen, Inc. | | | 1,112 | | | | 176,030 | |
Biogen, Inc.(a) | | | 61 | | | | 16,774 | |
| | |
| See Notes to Financial Statements. | | |
Annual Report | April 30, 2016 | | 9 |
| | |
| Redmont Resolute Fund II | | Schedule of Investments |
| | April 30, 2016 |
| | | | | | | | |
| | | | | | Value | |
| Description | | Shares | | | (Note 2) | |
| |
BIOTECHNOLOGY (0.13%) (continued) | | | | | | | | |
Gilead Sciences, Inc.(b) | | | 8,018 | | | $ | 707,268 | |
Regeneron Pharmaceuticals, Inc.(a) | | | 28 | | | | 10,548 | |
| | | | | | | | |
| | | | | | | 910,620 | |
| | | | | | | | |
| | |
BUILDING MATERIALS (0.10%) | | | | | | | | |
Continental Building Products, Inc.(a) | | | 11,139 | | | | 218,436 | |
Daikin Industries, Ltd. | | | 1,600 | | | | 133,594 | |
Masco Corp.(b) | | | 11,259 | | | | 345,764 | |
| | | | | | | | |
| | | | | | | 697,794 | |
| | | | | | | | |
| | |
CHEMICALS (0.36%) | | | | | | | | |
Air Liquide SA | | | 1,518 | | | | 172,081 | |
Air Water, Inc. | | | 1,000 | | | | 15,658 | |
Asahi Kasei Corp. | | | 4,000 | | | | 28,560 | |
BASF SE | | | 2,860 | | | | 236,280 | |
Daicel Corp. | | | 5,400 | | | | 70,291 | |
EI du Pont de Nemours & Co. | | | 825 | | | | 54,376 | |
Hitachi Chemical Co., Ltd. | | | 3,500 | | | | 61,711 | |
Lonza Group AG | | | 810 | | | | 134,761 | |
LyondellBasell Industries NV, Class A | | | 3,643 | | | | 301,167 | |
PPG Industries, Inc. | | | 5,001 | | | | 552,060 | |
Praxair, Inc. | | | 40 | | | | 4,698 | |
Shin-Etsu Chemical Co., Ltd. | | | 2,500 | | | | 145,747 | |
The Dow Chemical Co. | | | 2,933 | | | | 154,305 | |
The Valspar Corp. | | | 4,024 | | | | 429,321 | |
Yara International ASA | | | 3,197 | | | | 128,009 | |
| | | | | | | | |
| | | | | | | 2,489,025 | |
| | | | | | | | |
| | |
COMMERCIAL SERVICES (0.23%) | | | | | | | | |
Adecco SA | | | 1,903 | | | | 122,496 | |
Aggreko PLC | | | 564 | | | | 8,958 | |
Dai Nippon Printing Co., Ltd. | | | 10,000 | | | | 97,838 | |
Equifax, Inc. | | | 950 | | | | 114,237 | |
EVERTEC, Inc. | | | 6,801 | | | | 91,609 | |
ManpowerGroup, Inc.(b) | | | 3,723 | | | | 286,783 | |
Moody’s Corp.(b) | | | 1,384 | | | | 132,476 | |
Nielsen Holdings PLC | | | 51 | | | | 2,659 | |
PayPal Holdings, Inc.(a) | | | 3,081 | | | | 120,714 | |
Recruit Holdings Co., Ltd. | | | 500 | | | | 16,048 | |
RELX PLC | | | 7,579 | | | | 133,996 | |
Robert Half International, Inc.(b) | | | 5,586 | | | | 214,000 | |
The Western Union Co. | | | 5,248 | | | | 104,960 | |
Total System Services, Inc. | | | 3,075 | | | | 157,256 | |
United Rentals, Inc.(a) | | | 43 | | | | 2,878 | |
| | | | | | | | |
| | | | | | | 1,606,908 | |
| | | | | | | | |
| | |
COMPUTERS (0.51%) | | | | | | | | |
Accenture PLC, Class A | | | 122 | | | | 13,776 | |
Amdocs, Ltd.(b) | | | 7,247 | | | | 409,745 | |
Apple, Inc. | | | 5,240 | | | | 491,198 | |
Brocade Communications Systems, Inc. | | | 25,670 | | | | 246,689 | |
Cognizant Technology Solutions Corp., Class A(a) | | | 1,220 | | | | 71,212 | |
| | |
| See Notes to Financial Statements. | | |
10 | | www.redmontfunds.com |
| | |
| Redmont Resolute Fund II | | Schedule of Investments |
| | April 30, 2016 |
| | | | | | | | |
| | | | | | Value | |
| Description | | Shares | | | (Note 2) | |
| |
COMPUTERS (0.51%) (continued) | | | | | | | | |
Computer Sciences Corp. | | | 6,056 | | | $ | 200,635 | |
EMC Corp.(b) | | | 23,963 | | | | 625,674 | |
Fujitsu, Ltd. | | | 6,000 | | | | 22,038 | |
Hewlett Packard Enterprise Co. | | | 32,432 | | | | 540,317 | |
Hewlett-Packard Co. | | | 40,059 | | | | 491,524 | |
International Business Machines Corp. | | | 1,813 | | | | 264,589 | |
Itochu Techno-Solutions Corp. | | | 5,700 | | | | 115,714 | |
NetApp, Inc. | | | 449 | | | | 10,614 | |
Western Digital Corp. | | | 127 | | | | 5,190 | |
| | | | | | | | |
| | | | | | | 3,508,915 | |
| | | | | | | | |
| | |
CONTAINERS & PACKAGING (0.07%) | | | | | | | | |
WestRock Co.(b) | | | 11,340 | | | | 474,579 | |
| | | | | | | | |
| | |
COSMETICS & PERSONAL CARE (0.06%) | | | | | | | | |
Beiersdorf AG | | | 550 | | | | 49,350 | |
Colgate-Palmolive Co. | | | 859 | | | | 60,920 | |
Kao Corp. | | | 2,300 | | | | 132,207 | |
The Procter & Gamble Co. | | | 2,076 | | | | 166,329 | |
| | | | | | | | |
| | | | | | | 408,806 | |
| | | | | | | | |
| | |
DISTRIBUTION & WHOLESALE (0.13%) | | | | | | | | |
Arrow Electronics, Inc.(a)(b) | | | 9,968 | | | | 619,013 | |
Genuine Parts Co. | | | 278 | | | | 26,680 | |
ITOCHU Corp. | | | 8,500 | | | | 113,040 | |
Marubeni Corp. | | | 18,300 | | | | 100,805 | |
Wolseley PLC | | | 176 | | | | 9,826 | |
| | | | | | | | |
| | | | | | | 869,364 | |
| | | | | | | | |
| | |
DIVERSIFIED FINANCIAL SERVICES (0.62%) | | | | | | | | |
AEON Financial Service Co., Ltd. | | | 900 | | | | 20,944 | |
Alliance Data Systems Corp.(a)(b) | | | 2,490 | | | | 506,242 | |
Ally Financial, Inc.(a) | | | 15,649 | | | | 278,709 | |
American Express Co. | | | 2,253 | | | | 147,414 | |
Ameriprise Financial, Inc. | | | 125 | | | | 11,987 | |
Brait SE(a) | | | 5,924 | | | | 66,239 | |
CME Group, Inc. | | | 573 | | | | 52,664 | |
Daiwa Securities Group, Inc. | | | 14,000 | | | | 85,026 | |
Discover Financial Services(b) | | | 12,259 | | | | 689,814 | |
E*Trade Financial Corp.(a) | | | 1,067 | | | | 26,867 | |
Intermediate Capital Group PLC | | | 3,674 | | | | 32,961 | |
Legg Mason, Inc. | | | 2,414 | | | | 77,514 | |
MasterCard, Inc., Class A | | | 284 | | | | 27,545 | |
Navient Corp.(b) | | | 21,232 | | | | 290,241 | |
ORIX Corp. | | | 500 | | | | 7,455 | |
Partners Group Holding AG | | | 575 | | | | 236,761 | |
Raymond James Financial, Inc.(b) | | | 7,138 | | | | 372,389 | |
SLM Corp.(a)(b) | | | 32,409 | | | | 219,409 | |
Synchrony Financial(a)(b) | | | 10,773 | | | | 329,331 | |
T Rowe Price Group, Inc. | | | 1,462 | | | | 110,074 | |
TD Ameritrade Holding Corp.(b) | | | 8,446 | | | | 251,944 | |
| | |
| See Notes to Financial Statements. | | |
Annual Report | April 30, 2016 | | 11 |
| | |
| Redmont Resolute Fund II | | Schedule of Investments |
| | April 30, 2016 |
| | | | | | | | |
| Description | | Shares | | | Value (Note 2) | |
| |
DIVERSIFIED FINANCIAL SERVICES (0.62%) (continued) | | | | | | | | |
The Charles Schwab Corp.(b) | | | 9,446 | | | $ | 268,361 | |
The NASDAQ OMX Group, Inc. | | | 1,325 | | | | 81,766 | |
Visa, Inc., Class A | | | 632 | | | | 48,816 | |
| | | | | | | | |
| | | | | | | 4,240,473 | |
| | | | | | | | |
| | |
ELECTRIC (0.28%) | | | | | | | | |
AES Corp. | | | 35,668 | | | | 398,055 | |
Ameren Corp. | | | 784 | | | | 37,632 | |
Avangrid, Inc. | | | 1,707 | | | | 68,451 | |
Chubu Electric Power Co., Inc. | | | 6,500 | | | | 88,611 | |
Consolidated Edison, Inc. | | | 178 | | | | 13,279 | |
Duke Energy Corp. | | | 52 | | | | 4,097 | |
E.ON SE | | | 12,911 | | | | 133,187 | |
EDP - Energias de Portugal SA | | | 34,789 | | | | 123,648 | |
Electric Power Development Co., Ltd. | | | 700 | | | | 21,809 | |
Endesa SA | | | 14,209 | | | | 298,311 | |
Enel SpA | | | 16,023 | | | | 72,618 | |
Engie SA | | | 7,252 | | | | 119,576 | |
Entergy Corp. | | | 888 | | | | 66,760 | |
Exelon Corp. | | | 3,832 | | | | 134,465 | |
FirstEnergy Corp. | | | 234 | | | | 7,626 | |
Iberdrola SA | | | 5,962 | | | | 42,353 | |
MDU Resources Group, Inc. | | | 1,207 | | | | 24,212 | |
Public Service Enterprise Group, Inc. | | | 576 | | | | 26,571 | |
RWE AG(a) | | | 895 | | | | 13,369 | |
SSE PLC | | | 3,488 | | | | 76,957 | |
The Chugoku Electric Power Co., Inc. | | | 5,000 | | | | 67,011 | |
The Kansai Electric Power Co., Inc.(a) | | | 1,300 | | | | 11,940 | |
Tohoku Electric Power Co., Inc. | | | 5,800 | | | | 76,752 | |
| | | | | | | | |
| | | | | | | 1,927,290 | |
| | | | | | | | |
| | |
ELECTRICAL COMPONENTS & EQUIPMENT (0.08%) | | | | | | | | |
AMETEK, Inc.(b) | | | 7,325 | | | | 352,259 | |
Brother Industries, Ltd. | | | 1,000 | | | | 12,002 | |
Emerson Electric Co. | | | 2,234 | | | | 122,043 | |
Hitachi, Ltd. | | | 19,000 | | | | 92,072 | |
| | | | | | | | |
| | | | | | | 578,376 | |
| | | | | | | | |
| | |
ELECTRONICS (0.36%) | | | | | | | | |
Alps Electric Co., Ltd. | | | 200 | | | | 3,741 | |
Avnet, Inc.(b) | | | 8,942 | | | | 367,695 | |
Flextronics International, Ltd.(a)(b) | | | 56,128 | | | | 681,955 | |
Hirose Elect Co., Ltd. | | | 700 | | | | 88,881 | |
Hitachi High-Technologies Corp. | | | 1,700 | | | | 48,252 | |
Honeywell International, Inc.(b) | | | 3,058 | | | | 349,438 | |
Hoya Corp. | | | 3,000 | | | | 120,141 | |
Jabil Circuit, Inc.(b) | | | 19,039 | | | | 330,517 | |
Kyocera Corp. | | | 1,900 | | | | 97,732 | |
Murata Manufacturing Co., Ltd. | | | 300 | | | | 41,715 | |
TE Connectivity, Ltd. | | | 5,168 | | | | 307,393 | |
| | | | | | | | |
| | | | | | | 2,437,460 | |
| | | | | | | | |
| | |
| See Notes to Financial Statements. | | |
12 | | www.redmontfunds.com |
| | |
| Redmont Resolute Fund II | | Schedule of Investments |
| | April 30, 2016 |
| | | | | | | | |
| Description | | Shares | | | Value (Note 2) | |
| |
ENERGY & ALTERNATE SOURCES (0.00%)(c) | | | | | | | | |
First Solar, Inc.(a) | | | 25 | | | $ | 1,396 | |
| | | | | | | | |
| | |
ENGINEERING & CONSTRUCTION (0.05%) | | | | | | | | |
ACS Actividades de Construccion y Servicios SA | | | 3,546 | | | | 117,242 | |
Aena SA(a)(d)(e) | | | 917 | | | | 130,779 | |
Japan Airport Terminal Co., Ltd. | | | 600 | | | | 22,641 | |
Kajima Corp. | | | 14,000 | | | | 90,132 | |
| | | | | | | | |
| | | | | | | 360,794 | |
| | | | | | | | |
| | |
ENTERTAINMENT (0.06%) | | | | | | | | |
Six Flags Entertainment Corp.(b) | | | 6,403 | | | | 384,500 | |
| | | | | | | | |
| | |
FOOD (0.20%) | | | | | | | | |
Carrefour SA | | | 6,200 | | | | 175,673 | |
Danone SA | | | 1,950 | | | | 136,583 | |
General Mills, Inc. | | | 1,311 | | | | 80,417 | |
Koninklijke Ahold NV | | | 10,519 | | | | 228,851 | |
Mondelez International, Inc., Class A | | | 4,115 | | | | 176,780 | |
Nestle SA | | | 3,197 | | | | 238,284 | |
NH Foods, Ltd. | | | 1,000 | | | | 22,848 | |
Nissin Foods Holdings Co., Ltd. | | | 1,000 | | | | 47,744 | |
Pilgrim’s Pride Corp.(a) | | | 729 | | | | 19,617 | |
Seven & I Holdings Co., Ltd. | | | 400 | | | | 17,079 | |
The Kroger Co. | | | 711 | | | | 25,162 | |
Tyson Foods, Inc., Class A(b) | | | 2,911 | | | | 191,602 | |
| | | | | | | | |
| | | | | | | 1,360,640 | |
| | | | | | | | |
| | |
FOOD SERVICE (0.02%) | | | | | | | | |
Compass Group PLC | | | 8,627 | | | | 153,659 | |
| | | | | | | | |
| | |
FOREST PRODUCTS & PAPER (0.04%) | | | | | | | | |
International Paper Co. | | | 120 | | | | 5,192 | |
Mondi PLC | | | 6,206 | | | | 118,608 | |
UPM-Kymmene OYJ | | | 6,998 | | | | 133,658 | |
| | | | | | | | |
| | | | | | | 257,458 | |
| | | | | | | | |
| | |
GAS (0.03%) | | | | | | | | |
AGL Resources, Inc. | | | 433 | | | | 28,517 | |
Gas Natural SDG SA | | | 402 | | | | 8,362 | |
National Fuel Gas Co. | | | 585 | | | | 32,468 | |
Osaka Gas Co., Ltd. | | | 13,000 | | | | 48,481 | |
Sempra Energy | | | 161 | | | | 16,639 | |
UGI Corp. | | | 1,123 | | | | 45,190 | |
| | | | | | | | |
| | | | | | | 179,657 | |
| | | | | | | | |
| | |
HAND & MACHINE TOOLS (0.10%) | | | | | | | | |
Fuji Electric Holdings Co., Ltd. | | | 19,000 | | | | 84,821 | |
Schindler Holding AG, Participation Certificates | | | 650 | | | | 118,373 | |
SMC Corp. | | | 400 | | | | 102,801 | |
| | |
| See Notes to Financial Statements. | | |
Annual Report | April 30, 2016 | | 13 |
| | |
| Redmont Resolute Fund II | | Schedule of Investments |
| | April 30, 2016 |
| | | | | | | | |
| Description | | Shares | | | Value (Note 2) | |
| |
HAND & MACHINE TOOLS (0.10%) (continued) | | | | | | | | |
Stanley Black & Decker, Inc.(b) | | | 3,551 | | | $ | 397,428 | |
| | | | | | | | |
| | | | | | | 703,423 | |
| | | | | | | | |
| | |
HEALTHCARE - PRODUCTS (0.17%) | | | | | | | | |
Abbott Laboratories | | | 1,022 | | | | 39,756 | |
CR Bard, Inc. | | | 323 | | | | 68,531 | |
Edwards Lifesciences Corp.(a) | | | 156 | | | | 16,569 | |
Getinge AB, Class B | | | 1,234 | | | | 26,092 | |
Hologic, Inc.(a) | | | 1,869 | | | | 62,780 | |
Intuitive Surgical, Inc.(a) | | | 102 | | | | 63,889 | |
Lifco AB, Class B | | | 716 | | | | 18,545 | |
Medtronic PLC | | | 109 | | | | 8,627 | |
Sonova Holding AG | | | 893 | | | | 119,340 | |
St Jude Medical, Inc.(b) | | | 4,885 | | | | 372,237 | |
Zimmer Biomet Holdings, Inc.(b) | | | 3,024 | | | | 350,088 | |
| | | | | | | | |
| | | | | | | 1,146,454 | |
| | | | | | | | |
| | |
HEALTHCARE - SERVICES (0.42%) | | | | | | | | |
Aetna, Inc. | | | 297 | | | | 33,344 | |
Anthem, Inc.(b) | | | 5,246 | | | | 738,479 | |
Centene Corp.(a) | | | 1 | | | | 36 | |
Cigna Corp. | | | 3,353 | | | | 464,525 | |
DaVita HealthCare Partners, Inc.(a)(b) | | | 4,071 | | | | 300,847 | |
HCA Holdings, Inc.(a) | | | 583 | | | | 47,001 | |
ICON PLC(a)(b) | | | 3,754 | | | | 253,695 | |
Laboratory Corp. of America Holdings(a) | | | 4,149 | | | | 519,953 | |
UnitedHealth Group, Inc. | | | 3,857 | | | | 507,890 | |
Universal Health Services, Inc., Class B | | | 38 | | | | 5,080 | |
| | | | | | | | |
| | | | | | | 2,870,850 | |
| | | | | | | | |
| | |
HOLDING COMPANIES - DIVERSIFIED (0.03%) | | | | | | | | |
Ackermans & van Haaren NV | | | 278 | | | | 36,193 | |
Leucadia National Corp. | | | 3,875 | | | | 64,635 | |
Schouw & Co. | | | 275 | | | | 16,078 | |
Wendel SA | | | 507 | | | | 58,577 | |
| | | | | | | | |
| | | | | | | 175,483 | |
| | | | | | | | |
| | |
HOME BUILDERS (0.07%) | | | | | | | | |
Barratt Developments PLC | | | 15,465 | | | | 120,327 | |
Iida Group Holdings Co., Ltd. | | | 4,100 | | | | 80,574 | |
Persimmon PLC | | | 1,164 | | | | 33,795 | |
PulteGroup, Inc. | | | 14,604 | | | | 268,568 | |
| | | | | | | | |
| | | | | | | 503,264 | |
| | | | | | | | |
| | |
HOME FURNISHINGS (0.03%) | | | | | | | | |
Hoshizaki Electric Co., Ltd. | | | 500 | | | | 43,562 | |
Leggett & Platt, Inc. | | | 251 | | | | 12,372 | |
Panasonic Corp. | | | 14,300 | | | | 133,646 | |
Sony Corp. | | | 700 | | | | 18,276 | |
| | | | | | | | |
| | | | | | | 207,856 | |
| | | | | | | | |
| | |
| See Notes to Financial Statements. | | |
14 | | www.redmontfunds.com |
| | |
| Redmont Resolute Fund II | | Schedule of Investments |
| | April 30, 2016 |
| | | | | | | | |
| Description | | Shares | | | Value (Note 2) | |
| |
HOUSEHOLD PRODUCTS & WARES (0.00%)(c) | | | | | | | | |
Henkel AG & Co. KGaA | | | 212 | | | $ | 21,539 | |
| | | | | | | | |
| | |
HOUSEWARES (0.12%) | | | | | | | | |
Avery Dennison Corp.(b) | | | 6,507 | | | | 472,473 | |
Newell Brands, Inc.(b) | | | 6,325 | | | | 288,040 | |
The Clorox Co. | | | 490 | | | | 61,363 | |
| | | | | | | | |
| | | | | | | 821,876 | |
| | | | | | | | |
| | |
INSURANCE (1.02%) | | | | | | | | |
Admiral Group PLC | | | 4,177 | | | | 113,337 | |
Aflac, Inc. | | | 2,191 | | | | 151,113 | |
Alleghany Corp.(a) | | | 423 | | | | 220,501 | |
Allianz SE | | | 1,972 | | | | 334,754 | |
American International Group, Inc. | | | 4,920 | | | | 274,634 | |
American National Insurance Co. | | | 249 | | | | 28,914 | |
AmTrust Financial Services, Inc. | | | 2,210 | | | | 54,919 | |
Aon PLC | | | 2,804 | | | | 294,756 | |
Aspen Insurance Holdings, Ltd. | | | 2,210 | | | | 102,434 | |
Aviva PLC | | | 18,374 | | | | 116,087 | |
AXA SA | | | 13,148 | | | | 331,439 | |
Baloise Holding AG | | | 928 | | | | 114,827 | |
Berkshire Hathaway, Inc., Class B(a)(b) | | | 4,439 | | | | 645,786 | |
Chubb, Ltd.(b) | | | 3,436 | | | | 404,967 | |
Cincinnati Financial Corp. | | | 215 | | | | 14,192 | |
CNO Financial Group, Inc.(b) | | | 15,531 | | | | 285,304 | |
Direct Line Insurance Group PLC | | | 4,704 | | | | 24,874 | |
Legal & General Group PLC | | | 37,846 | | | | 123,371 | |
MetLife, Inc.(b) | | | 9,910 | | | | 446,941 | |
MS&AD Insurance Group Holdings, Inc. | | | 2,600 | | | | 72,539 | |
Principal Financial Group, Inc. | | | 80 | | | | 3,414 | |
Prudential Financial, Inc. | | | 549 | | | | 42,624 | |
Swiss Re AG | | | 369 | | | | 32,734 | |
The Allstate Corp.(b) | | | 6,915 | | | | 449,821 | |
The Dai-ichi Life Insurance Co., Ltd. | | | 6,500 | | | | 83,633 | |
The Hartford Financial Services Group, Inc. | | | 155 | | | | 6,879 | |
The Progressive Corp. | | | 3,906 | | | | 127,336 | |
The Travelers Companies, Inc.(b) | | | 3,565 | | | | 391,794 | |
Tokio Marine Holdings, Inc. | | | 3,700 | | | | 128,283 | |
Torchmark Corp. | | | 1,864 | | | | 107,907 | |
Unum Group | | | 15,732 | | | | 538,192 | |
Validus Holdings, Ltd. | | | 4,433 | | | | 204,317 | |
WR Berkley Corp. | | | 3,805 | | | | 213,080 | |
XL Group PLC(b) | | | 14,784 | | | | 483,880 | |
| | | | | | | | |
| | | | | | | 6,969,583 | |
| | | | | | | | |
| | |
INTERNET (0.44%) | | | | | | | | |
Alibaba Group Holding, Ltd., Sponsored ADR(a) | | | 3,192 | | | | 245,592 | |
Alphabet, Inc., Class A(a) | | | 541 | | | | 382,963 | |
Alphabet, Inc., Class C(a) | | | 263 | | | | 182,262 | |
Amazon.com, Inc.(a) | | | 193 | | | | 127,301 | |
Baidu, Inc., Sponsored ADR(a) | | | 1,610 | | | | 312,823 | |
| | |
| See Notes to Financial Statements. | | |
Annual Report | April 30, 2016 | | 15 |
| | |
| Redmont Resolute Fund II | | Schedule of Investments |
| | April 30, 2016 |
| | | | | | | | |
| Description | | Shares | | | Value (Note 2) | |
| |
INTERNET (0.44%) (continued) | | | | | | | | |
CDW Corp.(b) | | | 12,504 | | | $ | 481,404 | |
eBay, Inc.(a)(b) | | | 17,614 | | | | 430,310 | |
F5 Networks, Inc.(a) | | | 606 | | | | 63,478 | |
Facebook, Inc., Class A(a) | | | 1,780 | | | | 209,292 | |
IAC/InterActiveCorp | | | 3,881 | | | | 179,846 | |
Kakaku.com, Inc. | | | 1,700 | | | | 31,843 | |
Mixi, Inc. | | | 400 | | | | 14,211 | |
Netflix, Inc.(a) | | | 46 | | | | 4,141 | |
Nexon Co., Ltd. | | | 3,100 | | | | 48,481 | |
Phoenix New Media, Ltd., ADR(a) | | | 12,696 | | | | 50,911 | |
Rakuten, Inc. | | | 300 | | | | 3,441 | |
Rocket Internet SE(a)(d)(e) | | | 1,191 | | | | 28,639 | |
Symantec Corp. | | | 1,229 | | | | 20,457 | |
The Priceline Group, Inc.(a) | | | 152 | | | | 204,236 | |
YY, Inc., ADR(a) | | | 108 | | | | 6,785 | |
| | | | | | | | |
| | | | | | | 3,028,416 | |
| | | | | | | | |
| | |
INVESTMENT COMPANIES (0.06%) | | | | | | | | |
American Capital, Ltd.(a) | | | 2,844 | | | | 44,935 | |
Apollo Investment Corp. | | | 4,632 | | | | 26,958 | |
Ares Capital Corp. | | | 4,271 | | | | 64,877 | |
BlackRock Capital Investment Corp. | | | 940 | | | | 7,906 | |
Capital Southwest Corp. | | | 531 | | | | 7,540 | |
China Merchants China Direct Investments, Ltd. | | | 4,000 | | | | 6,363 | |
Compass Diversified Holdings | | | 640 | | | | 10,291 | |
Fifth Street Finance Corp. | | | 1,724 | | | | 9,344 | |
FS Investment Corp. | | | 4,267 | | | | 39,726 | |
Golub Capital BDC, Inc. | | | 597 | | | | 10,477 | |
Investment AB Kinnevik, Class B | | | 1,906 | | | | 54,827 | |
Main Street Capital Corp. | | | 527 | | | | 16,453 | |
Medley Capital Corp. | | | 818 | | | | 5,563 | |
Melrose Industries PLC | | | 2,015 | | | | 10,991 | |
New Mountain Finance Corp. | | | 1,475 | | | | 18,467 | |
PennantPark Investment Corp. | | | 1,080 | | | | 7,117 | |
Prospect Capital Corp. | | | 4,873 | | | | 36,450 | |
Solar Capital, Ltd. | | | 504 | | | | 8,886 | |
TCP Capital Corp. | | | 568 | | | | 8,395 | |
TICC Capital Corp. | | | 885 | | | | 4,584 | |
TPG Specialty Lending, Inc. | | | 552 | | | | 9,069 | |
Triangle Capital Corp. | | | 433 | | | | 9,201 | |
Zeder Investments, Ltd. | | | 24,536 | | | | 11,927 | |
| | | | | | | | |
| | | | | | | 430,347 | |
| | | | | | | | |
| | |
IRON & STEEL (0.06%) | | | | | | | | |
Hitachi Metals, Ltd. | | | 200 | | | | 2,143 | |
JFE Holdings, Inc. | | | 2,000 | | | | 29,690 | |
Nippon Steel & Sumitomo Metal Corp. | | | 3,800 | | | | 83,536 | |
Nucor Corp. | | | 2,030 | | | | 101,053 | |
Steel Dynamics, Inc. | | | 8,900 | | | | 224,369 | |
| | | | | | | | |
| | | | | | | 440,791 | |
| | | | | | | | |
| | |
| See Notes to Financial Statements. | | |
16 | | www.redmontfunds.com |
| | |
| Redmont Resolute Fund II | | Schedule of Investments |
| | April 30, 2016 |
| | | | | | | | |
| Description | | Shares | | | Value (Note 2) | |
| |
LEISURE TIME (0.04%) | | | | | | | | |
Carnival Corp. | | | 1,475 | | | $ | 72,349 | |
Carnival PLC | | | 3,498 | | | | 173,624 | |
| | | | | | | | |
| | | | | | | 245,973 | |
| | | | | | | | |
| | |
LODGING (0.00%)(c) | | | | | | | | |
Marriott International, Inc., Class A | | | 123 | | | | 8,621 | |
Starwood Hotels & Resorts Worldwide, Inc. | | | 156 | | | | 12,773 | |
Wyndham Worldwide Corp. | | | 104 | | | | 7,379 | |
| | | | | | | | |
| | | | | | | 28,773 | |
| | | | | | | | |
| | |
MACHINERY - CONSTRUCTION & MINING (0.05%) | | | | | | | | |
ABB, Ltd. | | | 7,037 | | | | 148,765 | |
Atlas Copco AB, Class B | | | 3,453 | | | | 82,859 | |
Hitachi Construction Machinery Co., Ltd. | | | 4,800 | | | | 79,760 | |
Komatsu, Ltd. | | | 400 | | | | 7,167 | |
| | | | | | | | |
| | | | | | | 318,551 | |
| | | | | | | | |
| | |
MACHINERY - DIVERSIFIED (0.07%) | | | | | | | | |
Amada Holdings Co., Ltd. | | | 300 | | | | 3,138 | |
BWX Technologies, Inc. | | | 2,800 | | | | 93,492 | |
Deere & Co. | | | 1,384 | | | | 116,408 | |
FANUC Corp. | | | 100 | | | | 15,512 | |
Hollysys Automation Technologies, Ltd.(a) | | | 5,134 | | | | 98,419 | |
Kawasaki Heavy Industries, Ltd. | | | 23,000 | | | | 68,308 | |
Rockwell Automation, Inc. | | | 244 | | | | 27,687 | |
Sumitomo Heavy Industries, Ltd. | | | 10,000 | | | | 44,455 | |
| | | | | | | | |
| | | | | | | 467,419 | |
| | | | | | | | |
| | |
MEDIA (0.54%) | | | | | | | | |
CBS Corp., Class B(b) | | | 6,791 | | | | 379,685 | |
Comcast Corp., Class A(b) | | | 10,517 | | | | 639,013 | |
Discovery Communications, Inc., Class C(a) | | | 209 | | | | 5,597 | |
ITV PLC | | | 33,871 | | | | 111,453 | |
Liberty Braves Group, Class C(a)(b) | | | 552 | | | | 8,233 | |
Liberty Broadband Corp., Class C(a)(b) | | | 1,612 | | | | 92,287 | |
Liberty Global PLC LiLAC, Class C(a) | | | 2,111 | | | | 85,728 | |
Liberty Global PLC, Class C(a) | | | 17,556 | | | | 642,550 | |
Liberty Media Corp., Class C(a)(b) | | | 1,382 | | | | 24,876 | |
Liberty SiriusXM Group, Class C(a)(b) | | | 5,529 | | | | 177,039 | |
News Corp., Class A | | | 258 | | | | 3,204 | |
Scripps Networks Interactive, Inc., Class A | | | 3,964 | | | | 247,156 | |
Starz, Class A(a) | | | 8,654 | | | | 235,475 | |
TEGNA, Inc. | | | 13,778 | | | | 321,854 | |
The Walt Disney Co. | | | 1,036 | | | | 106,977 | |
Time Warner Cable, Inc. | | | 658 | | | | 139,568 | |
Time Warner, Inc. | | | 4,695 | | | | 352,782 | |
Viacom, Inc., Class B | | | 477 | | | | 19,509 | |
Vivendi SA | | | 6,688 | | | | 128,350 | |
| | | | | | | | |
| | | | | | | 3,721,336 | |
| | | | | | | | |
| | |
METAL FABRICATE & HARDWARE (0.02%) | | | | | | | | |
Assa Abloy AB, Class B | | | 6,395 | | | | 134,104 | |
| | |
| See Notes to Financial Statements. | | |
Annual Report | April 30, 2016 | | 17 |
| | |
| Redmont Resolute Fund II | | Schedule of Investments |
| | April 30, 2016 |
| | | | | | | | |
| Description | | Shares | | | Value (Note 2) | |
| |
METAL FABRICATE & HARDWARE (0.02%) (continued) | | | | | | | | |
NSK, Ltd. | | | 200 | | | $ | 1,854 | |
| | | | | | | | |
| | | | | | | 135,958 | |
| | | | | | | | |
| | |
MINING (0.09%) | | | | | | | | |
Antofagasta PLC | | | 14,758 | | | | 104,196 | |
Barrick Gold Corp. | | | 17,587 | | | | 340,639 | |
Freeport-McMoRan, Inc. | | | 276 | | | | 3,864 | |
Newmont Mining Corp. | | | 141 | | | | 4,931 | |
Norsk Hydro ASA | | | 30,256 | | | | 131,630 | |
| | | | | | | | |
| | | | | | | 585,260 | |
| | | | | | | | |
| | |
MISCELLANEOUS MANUFACTURING (0.33%) | | | | | | | | |
3M Co. | | | 1,116 | | | | 186,796 | |
Danaher Corp.(b) | | | 6,237 | | | | 603,430 | |
Dover Corp. | | | 1,747 | | | | 114,778 | |
FUJIFILM Holdings Corp. | | | 3,100 | | | | 133,119 | |
General Electric Co. | | | 6,687 | | | | 205,625 | |
Illinois Tool Works, Inc. | | | 1,151 | | | | 120,303 | |
Ingersoll-Rand PLC(b) | | | 5,679 | | | | 372,202 | |
Konica Minolta, Inc. | | | 300 | | | | 2,729 | |
Parker-Hannifin Corp. | | | 124 | | | | 14,386 | |
Siemens AG | | | 68 | | | | 7,095 | |
Textron, Inc.(b) | | | 13,557 | | | | 524,385 | |
| | | | | | | | |
| | | | | | | 2,284,848 | |
| | | | | | | | |
| | |
OFFICE & BUSINESS EQUIPMENT (0.00%)(c) | | | | | | | | |
Canon, Inc. | | | 500 | | | | 14,624 | |
Pitney Bowes, Inc. | | | 257 | | | | 5,389 | |
| | | | | | | | |
| | | | | | | 20,013 | |
| | | | | | | | |
| | |
OIL & GAS (1.18%) | | | | | | | | |
Anadarko Petroleum Corp. | | | 10,014 | | | | 528,339 | |
Antero Resources Corp.(a) | | | 2,982 | | | | 84,391 | |
BP PLC | | | 29,611 | | | | 161,707 | |
California Resources Corp. | | | 698 | | | | 1,536 | |
Canadian Natural Resources, Ltd.(b) | | | 15,031 | | | | 451,231 | |
Chevron Corp. | | | 1,580 | | | | 161,444 | |
ConocoPhillips | | | 439 | | | | 20,980 | |
Devon Energy Corp. | | | 620 | | | | 21,502 | |
Diamond Offshore Drilling, Inc. | | | 1,350 | | | | 32,751 | |
Diamondback Energy, Inc.(a) | | | 9,330 | | | | 807,791 | |
Energen Corp. | | | 6,100 | | | | 259,189 | |
EOG Resources, Inc. | | | 4,183 | | | | 345,599 | |
EQT Corp. | | | 3,730 | | | | 261,473 | |
Exxon Mobil Corp. | | | 10,689 | | | | 944,908 | |
Galp Energia SGPS SA | | | 9,003 | | | | 123,655 | |
Hess Corp. | | | 130 | | | | 7,751 | |
Idemitsu Kosan Co., Ltd. | | | 3,800 | | | | 84,143 | |
Inpex Corp. | | | 11,400 | | | | 95,164 | |
Kosmos Energy, Ltd.(a) | | | 20,375 | | | | 132,030 | |
Marathon Oil Corp. | | | 1,377 | | | | 19,402 | |
Marathon Petroleum Corp. | | | 8,336 | | | | 325,771 | |
| | |
| See Notes to Financial Statements. | | |
18 | | www.redmontfunds.com |
| | |
| Redmont Resolute Fund II | | Schedule of Investments |
| | April 30, 2016 |
| | | | | | | | |
| Description | | Shares | | | Value (Note 2) | |
| |
OIL & GAS (1.18%) (continued) | | | | | | | | |
Memorial Resource Development Corp.(a) | | | 1,515 | | | $ | 19,816 | |
Murphy Oil Corp. | | | 507 | | | | 18,120 | |
Occidental Petroleum Corp. | | | 7,453 | | | | 571,272 | |
OMV AG | | | 4,103 | | | | 123,138 | |
Parsley Energy, Inc., Class A(a)(b) | | | 36,878 | | | | 863,683 | |
PBF Energy, Inc., Class A | | | 231 | | | | 7,434 | |
Phillips 66 | | | 5,931 | | | | 486,994 | |
Rice Energy, Inc.(a)(b) | | | 18,027 | | | | 312,047 | |
Rowan Cos. PLC, Class A | | | 1,204 | | | | 22,647 | |
Royal Dutch Shell PLC, Class A | | | 1,096 | | | | 28,497 | |
Royal Dutch Shell PLC, Class B | | | 1,257 | | | | 32,803 | |
RSP Permian, Inc.(a) | | | 12,333 | | | | 377,513 | |
Southwestern Energy Co.(a) | | | 7,295 | | | | 97,972 | |
Tesoro Corp. | | | 635 | | | | 50,603 | |
TOTAL SA | | | 838 | | | | 42,153 | |
Transocean, Ltd. | | | 1,181 | | | | 13,085 | |
Valero Energy Corp. | | | 2,279 | | | | 134,165 | |
WPX Energy, Inc.(a) | | | 4,057 | | | | 39,191 | |
| | | | | | | | |
| | | | | | | 8,111,890 | |
| | | | | | | | |
| | |
OIL & GAS SERVICES (0.02%) | | | | | | | | |
Baker Hughes, Inc. | | | 766 | | | | 37,044 | |
FMC Technologies, Inc.(a) | | | 67 | | | | 2,043 | |
Halliburton Co. | | | 67 | | | | 2,768 | |
Saipem SpA(a) | | | 45,717 | | | | 21,881 | |
Schlumberger, Ltd. | | | 1,244 | | | | 99,928 | |
| | | | | | | | |
| | | | | | | 163,664 | |
| | | | | | | | |
| | |
PACKAGING & CONTAINERS (0.30%) | | | | | | | | |
Ball Corp. | | | 40 | | | | 2,855 | |
Berry Plastics Group, Inc.(a)(b) | | | 16,874 | | | | 607,802 | |
Crown Holdings, Inc.(a)(b) | | | 3,780 | | | | 200,189 | |
Graphic Packaging Holding Co.(b) | | | 53,671 | | | | 712,751 | |
Packaging Corp. of America(b) | | | 5,441 | | | | 353,012 | |
Sealed Air Corp. | | | 3,700 | | | | 175,232 | |
Silgan Holdings, Inc. | | | 583 | | | | 29,581 | |
| | | | | | | | |
| | | | | | | 2,081,422 | |
| | | | | | | | |
| | |
PHARMACEUTICALS (0.93%) | | | | | | | | |
AbbVie, Inc.(b) | | | 5,249 | | | | 320,189 | |
Actelion, Ltd. | | | 64 | | | | 10,341 | |
Alfresa Holdings Corp. | | | 1,200 | | | | 24,113 | |
Allergan PLC(a) | | | 38 | | | | 8,229 | |
AmerisourceBergen Corp. | | | 438 | | | | 37,274 | |
Astellas Pharma, Inc. | | | 4,700 | | | | 66,127 | |
AstraZeneca PLC | | | 96 | | | | 5,510 | |
Bayer AG | | | 2,142 | | | | 247,109 | |
Bristol-Myers Squibb Co. | | | 197 | | | | 14,220 | |
Cardinal Health, Inc.(b) | | | 6,299 | | | | 494,220 | |
Chugai Pharmaceutical Co., Ltd. | | | 2,000 | | | | 70,677 | |
Daiichi Sankyo Co., Ltd. | | | 4,800 | | | | 117,338 | |
Eisai Co., Ltd. | | | 1,900 | | | | 122,054 | |
| | |
| See Notes to Financial Statements. | | |
Annual Report | April 30, 2016 | | 19 |
| | |
| Redmont Resolute Fund II | | Schedule of Investments |
| | April 30, 2016 |
| | | | | | | | |
| Description | | Shares | | | Value (Note 2) | |
| |
PHARMACEUTICALS (0.93%) (continued) | | | | | | | | |
Endo International PLC(a) | | | 2,148 | | | $ | 57,996 | |
Express Scripts Holding Co.(a)(b) | | | 7,073 | | | | 521,492 | |
GlaxoSmithKline PLC | | | 1,855 | | | | 39,545 | |
Johnson & Johnson | | | 7,927 | | | | 888,458 | |
McKesson Corp.(b) | | | 2,554 | | | | 428,612 | |
Medipal Holdings Corp. | | | 6,400 | | | | 105,805 | |
Merck & Co., Inc. | | | 12,119 | | | | 664,606 | |
Novartis AG | | | 1,881 | | | | 143,531 | |
Novartis AG, Sponsored ADR | | | 2,302 | | | | 174,883 | |
Novo Nordisk A/S, Class B | | | 4,739 | | | | 264,594 | |
Orion OYJ, Class B | | | 145 | | | | 5,057 | |
Perrigo Co. PLC | | | 2,069 | | | | 200,010 | |
Pfizer, Inc. | | | 17,025 | | | | 556,888 | |
Roche Holding AG | | | 616 | | | | 155,718 | |
Sanofi | | | 391 | | | | 32,285 | |
Shire PLC | | | 2,936 | | | | 182,794 | |
Sumitomo Dainippon Pharma Co., Ltd. | | | 7,700 | | | | 102,980 | |
Takeda Pharmaceutical Co., Ltd. | | | 700 | | | | 34,618 | |
Teva Pharmaceutical Industries, Ltd., Sponsored ADR | | | 4,741 | | | | 258,148 | |
UCB SA | | | 518 | | | | 38,761 | |
| | | | | | | | |
| | | | | | | 6,394,182 | |
| | | | | | | | |
| | |
PIPELINES (0.00%)(c) | | | | | | | | |
Oneok, Inc. | | | 219 | | | | 7,917 | |
The Williams Cos., Inc. | | | 744 | | | | 14,426 | |
| | | | | | | | |
| | | | | | | 22,343 | |
| | | | | | | | |
| | |
PRIVATE EQUITY (0.11%) | | | | | | | | |
3i Group PLC | | | 25,543 | | | | 176,758 | |
Alaris Royalty Corp. | | | 525 | | | | 12,557 | |
Allied Minds PLC(a) | | | 400 | | | | 2,245 | |
Altamir | | | 666 | | | | 8,312 | |
Apollo Global Management LLC, Class A | | | 1,856 | | | | 31,385 | |
AURELIUS SE & Co. KGaA | | | 409 | | | | 24,456 | |
Bure Equity AB | | | 1,269 | | | | 11,062 | |
Deutsche Beteiligungs AG | | | 252 | | | | 7,449 | |
Eurazeo SA | | | 1,015 | | | | 71,477 | |
Gimv NV | | | 594 | | | | 32,988 | |
Hercules Capital, Inc. | | | 978 | | | | 12,000 | |
IP Group PLC(a) | | | 7,649 | | | | 19,212 | |
Jafco Co., Ltd. | | | 900 | | | | 26,306 | |
KKR & Co. LP | | | 5,648 | | | | 76,813 | |
Onex Corp. | | | 1,559 | | | | 96,706 | |
Ratos AB, Class B | | | 3,780 | | | | 22,114 | |
Safeguard Scientifics, Inc.(a) | | | 347 | | | | 4,788 | |
The Blackstone Group LP | | | 3,006 | | | | 82,485 | |
The Carlyle Group LP | | | 2,131 | | | | 35,673 | |
| | | | | | | | |
| | | | | | | 754,786 | |
| | | | | | | | |
| | |
REAL ESTATE (0.03%) | | | | | | | | |
Aeon Mall Co., Ltd. | | | 5,400 | | | | 77,701 | |
Daito Trust Construction Co., Ltd. | | | 400 | | | | 58,252 | |
| | |
| See Notes to Financial Statements. | | |
20 | | www.redmontfunds.com |
| | |
| Redmont Resolute Fund II | | Schedule of Investments |
| | April 30, 2016 |
| | | | | | | | |
| Description | | Shares | | | Value (Note 2) | |
| |
REAL ESTATE (0.03%) (continued) | | | | | | | | |
Mitsubishi Estate Co., Ltd. | | | 4,000 | | | $ | 79,737 | |
Nomura Real Estate Holdings, Inc. | | | 1,000 | | | | 19,022 | |
| | | | | | | | |
| | | | | | | 234,712 | |
| | | | | | | | |
| | |
REAL ESTATE INVESTMENT TRUSTS (0.13%) | | | | | | | | |
American Homes 4 Rent, Class A | | | 12,265 | | | | 194,032 | |
Apartment Investment & Management Co., Class A | | | 929 | | | | 37,216 | |
Boston Properties, Inc.(b) | | | 1,498 | | | | 193,032 | |
Brixmor Property Group, Inc. | | | 1,571 | | | | 39,668 | |
Equity Residential | | | 1,849 | | | | 125,861 | |
H&R Real Estate Investment Trust | | | 1,298 | | | | 22,676 | |
Host Hotels & Resorts, Inc. | | | 1,557 | | | | 24,632 | |
Japan Retail Fund Investment Corp. | | | 32 | | | | 80,030 | |
Nippon Prologis REIT, Inc. | | | 2 | | | | 4,899 | |
Public Storage | | | 96 | | | | 23,502 | |
SL Green Realty Corp. | | | 1,094 | | | | 114,958 | |
The Macerich Co. | | | 231 | | | | 17,574 | |
| | | | | | | | |
| | | | | | | 878,080 | |
| | | | | | | | |
| | |
RETAIL (0.39%) | | | | | | | | |
ABC-Mart, Inc. | | | 700 | | | | 47,105 | |
Advance Auto Parts, Inc. | | | 12 | | | | 1,873 | |
Aeon Co., Ltd. | | | 2,400 | | | | 37,071 | |
Alimentation Couche-Tard, Inc., Class B | | | 237 | | | | 10,389 | |
AutoZone, Inc.(a) | | | 38 | | | | 29,079 | |
Best Buy Co., Inc. | | | 426 | | | | 13,666 | |
Costco Wholesale Corp. | | | 35 | | | | 5,185 | |
CVS Health Corp.(b) | | | 3,066 | | | | 308,133 | |
Darden Restaurants, Inc. | | | 69 | | | | 4,295 | |
FamilyMart Co., Ltd. | | | 1,600 | | | | 87,068 | |
Fast Retailing Co., Ltd. | | | 200 | | | | 54,859 | |
Foot Locker, Inc. | | | 3,178 | | | | 195,256 | |
GNC Holdings, Inc., Class A | | | 302 | | | | 7,357 | |
Isetan Mitsukoshi Holdings, Ltd. | | | 3,500 | | | | 38,947 | |
J Front Retailing Co., Ltd. | | | 6,000 | | | | 75,620 | |
Lowe’s Companies, Inc.(b) | | | 4,483 | | | | 340,798 | |
McDonald’s Corp. | | | 181 | | | | 22,895 | |
Next PLC | | | 125 | | | | 9,288 | |
O’Reilly Automotive, Inc.(a) | | | 734 | | | | 192,807 | |
Pandora A/S | | | 296 | | | | 38,436 | |
PVH Corp. | | | 227 | | | | 21,701 | |
Starbucks Corp. | | | 1,309 | | | | 73,605 | |
Target Corp.(b) | | | 7,923 | | | | 629,879 | |
The Home Depot, Inc. | | | 861 | | | | 115,279 | |
The TJX Companies, Inc. | | | 361 | | | | 27,371 | |
Tiffany & Co. | | | 51 | | | | 3,639 | |
Walgreens Boots Alliance, Inc. | | | 100 | | | | 7,928 | |
Wal-Mart Stores, Inc. | | | 3,821 | | | | 255,510 | |
| | | | | | | | |
| | | | | | | 2,655,039 | |
| | | | | | | | |
| | |
SEMICONDUCTORS (0.33%) | | | | | | | | |
ARM Holdings PLC | | | 9,476 | | | | 129,805 | |
| | |
| See Notes to Financial Statements. | | |
Annual Report | April 30, 2016 | | 21 |
| | |
| Redmont Resolute Fund II | | Schedule of Investments |
| | April 30, 2016 |
| | | | | | | | |
| Description | | Shares | | | Value (Note 2) | |
| |
SEMICONDUCTORS (0.33%) (continued) | | | | | | | | |
ASML Holding NV | | | 454 | | | $ | 43,876 | |
Avago Technologies, Ltd. | | | 4,664 | | | | 679,778 | |
Intel Corp. | | | 1,488 | | | | 45,057 | |
NVIDIA Corp. | | | 1,035 | | | | 36,773 | |
ON Semiconductor Corp.(a)(b) | | | 37,474 | | | | 354,879 | |
Qorvo, Inc.(a) | | | 4,702 | | | | 211,731 | |
Texas Instruments, Inc.(b) | | | 12,658 | | | | 722,012 | |
Xilinx, Inc. | | | 146 | | | | 6,290 | |
| | | | | | | | |
| | | | | | | 2,230,201 | |
| | | | | | | | |
| | |
SHIPBUILDING (0.09%) | | | | | | | | |
Huntington Ingalls Industries, Inc.(b) | | | 4,201 | | | | 608,179 | |
| | | | | | | | |
| | | | | | | 608,179 | |
| | | | | | | | |
| | |
SOFTWARE (0.41%) | | | | | | | | |
Activision Blizzard, Inc. | | | 3,005 | | | | 103,582 | |
Actua Corp.(a) | | | 474 | | | | 4,494 | |
Adobe Systems, Inc.(a) | | | 162 | | | | 15,264 | |
Amadeus IT Holding SA, Class A | | | 3,158 | | | | 143,703 | |
Citrix Systems, Inc.(a) | | | 969 | | | | 79,303 | |
Electronic Arts, Inc.(a) | | | 1,515 | | | | 93,703 | |
Fidelity National Information Services, Inc. | | | 3,970 | | | | 261,226 | |
Intuit, Inc. | | | 352 | | | | 35,513 | |
Microsoft Corp.(b) | | | 17,204 | | | | 857,963 | |
NetEase, Inc., ADR(b) | | | 1,497 | | | | 210,628 | |
Oracle Corp.(b) | | | 23,170 | | | | 923,556 | |
Red Hat, Inc.(a) | | | 314 | | | | 23,038 | |
salesforce.com, Inc.(a) | | | 194 | | | | 14,705 | |
The Dun & Bradstreet Corp. | | | 704 | | | | 77,729 | |
| | | | | | | | |
| | | | | | | 2,844,407 | |
| | | | | | | | |
| | |
TELECOMMUNICATIONS (0.38%) | | | | | | | | |
Arista Networks, Inc.(a) | | | 900 | | | | 59,958 | |
AT&T, Inc. | | | 3,633 | | | | 141,033 | |
BT Group PLC | | | 27,531 | | | | 178,286 | |
CenturyLink, Inc. | | | 3,622 | | | | 112,101 | |
China Telecom Corp., Ltd., Class H | | | 320,000 | | | | 159,239 | |
Cisco Systems, Inc.(b) | | | 18,227 | | | | 501,060 | |
Hikari Tsushin, Inc. | | | 500 | | | | 38,722 | |
Juniper Networks, Inc. | | | 754 | | | | 17,644 | |
KDDI Corp. | | | 6,800 | | | | 202,530 | |
Nippon Telegraph & Telephone Corp. | | | 3,400 | | | | 155,428 | |
NTT DOCOMO, Inc. | | | 2,100 | | | | 51,257 | |
Orange SA | | | 9,140 | | | | 151,544 | |
Proximus SADP | | | 2,648 | | | | 89,068 | |
SoftBank Corp. | | | 1,200 | | | | 67,534 | |
Verizon Communications, Inc. | | | 13,159 | | | | 670,319 | |
Vodafone Group PLC | | | 4,176 | | | | 13,375 | |
| | | | | | | | |
| | | | | | | 2,609,098 | |
| | | | | | | | |
| | |
| See Notes to Financial Statements. | | |
22 | | www.redmontfunds.com |
| | |
| Redmont Resolute Fund II | | Schedule of Investments |
| | April 30, 2016 |
| | | | | | | | |
| Description | | Shares | | | Value (Note 2) | |
| |
TOYS, GAMES & HOBBIES (0.00%)(c) | | | | | | | | |
Hasbro, Inc. | | | 197 | | | $ | 16,674 | |
| | | | | | | | |
| | |
TRANSPORTATION (0.10%) | | | | | | | | |
AP Moeller-Maersk A/S, Class A | | | 17 | | | | 23,147 | |
AP Moeller-Maersk A/S, Class B | | | 81 | | | | 113,904 | |
Central Japan Railway Co. | | | 800 | | | | 146,128 | |
CH Robinson Worldwide, Inc. | | | 146 | | | | 10,362 | |
East Japan Railway Co. | | | 200 | | | | 18,466 | |
Expeditors International of Washington, Inc. | | | 1,335 | | | | 66,229 | |
Hankyu Hanshin Holdings | | | 12,000 | | | | 78,383 | |
Kamigumi Co., Ltd. | | | 3,000 | | | | 28,139 | |
Nippon Express Co., Ltd. | | | 8,000 | | | | 38,271 | |
Nippon Yusen KK | | | 9,000 | | | | 18,355 | |
Royal Mail PLC | | | 17,604 | | | | 125,241 | |
United Parcel Service, Inc., Class B | | | 337 | | | | 35,409 | |
| | | | | | | | |
| | | | | | | 702,034 | |
| | | | | | | | |
| | |
WATER (0.00%)(c) | | | | | | | | |
PICO Holdings, Inc.(a) | | | 470 | | | | 4,667 | |
| | | | | | | | |
| | |
TOTAL COMMON STOCKS (Cost $90,313,862) | | | | | | | 97,861,448 | |
| |
| | |
EXCHANGE TRADED FUNDS (0.20%) | | | | | | | | |
iShares® Europe ETF | | | 2,948 | | | | 118,834 | |
iShares® iBoxx $ Investment Grade Corporate Bond ETF | | | 6,900 | | | | 830,277 | |
iShares® MSCI Emerging Markets UCITS ETF | | | 299 | | | | 9,648 | |
iShares® MSCI Japan ETF | | | 9,295 | | | | 106,149 | |
iShares® MSCI World UCITS ETF DIST | | | 2,493 | | | | 87,979 | |
iShares® Russell 1000 Value ETF | | | 1,079 | | | | 108,860 | |
SPDR® S&P 500® ETF Trust | | | 557 | | | | 114,909 | |
| | | | | | | | |
| | | | | | | 1,376,656 | |
| | | | | | | | |
| | |
TOTAL EXCHANGE TRADED FUNDS (Cost $1,324,812) | | | | | | | 1,376,656 | |
| |
| | |
LIMITED PARTNERSHIPS (0.02%) | | | | | | | | |
OIL & GAS (0.02%) | | | | | | | | |
Viper Energy Partners LP | | | 6,792 | | | | 129,591 | |
| | | | | | | | |
| | |
TOTAL LIMITED PARTNERSHIPS (Cost $139,888) | | | | | | | 129,591 | |
| |
| | |
OPEN-END MUTUAL FUNDS (63.88%) | | | | | | | | |
AQR Multi Strategy Alternative Fund, Class I(a) | | | 6,482,232 | | | | 61,516,378 | |
AQR Risk Parity Fund, Class I | | | 6,407,286 | | | | 62,022,531 | |
Credit Suisse Floating Rate High Income Fund, Institutional Class | | | 140,601 | | | | 930,780 | |
Diamond Hill Long-Short Fund, Class Y | | | 2,491,230 | | | | 60,113,375 | |
FPA Crescent Fund | | | 2,394,160 | | | | 75,607,584 | |
| | |
| See Notes to Financial Statements. | | |
Annual Report | April 30, 2016 | | 23 |
| | |
| Redmont Resolute Fund II | | Schedule of Investments |
| | April 30, 2016 |
| | | | | | | | |
| Description | | Shares | | | Value (Note 2) | |
| |
OPEN-END MUTUAL FUNDS (63.88%) (continued) | | | | | | | | |
Morgan Stanley Institutional Fund, Inc. - Multi-Asset Portfolio, Class I | | | 5,360,735 | | | $ | 54,947,530 | |
Nuveen Symphony Floating Rate Income Fund, Class I | | | 305,520 | | | | 5,905,696 | |
PIMCO Short-Term Fund, Institutional Class | | | 12,122,392 | | | | 117,587,207 | |
| | | | | | | | |
| | | | | | | 438,631,081 | |
| | | | | | | | |
| | |
TOTAL OPEN-END MUTUAL FUNDS (Cost $438,042,637) | | | | | | | 438,631,081 | |
| |
| | |
PREFERRED STOCKS (0.02%) | | | | | | | | |
AUTO MANUFACTURERS (0.00%)(c) | | | | | | | | |
Bayerische Motoren Werke AG | | | 67 | | | | 5,320 | |
| | | | | | | | |
| | |
HOUSEHOLD PRODUCTS & WARES (0.02%) | | | | | | | | |
Henkel AG & Co. KGaA | | | 1,237 | | | | 141,190 | |
| | | | | | | | |
| | |
TOTAL PREFERRED STOCKS (Cost $150,450) | | | | | | | 146,510 | |
| |
| | | | | | | | |
| | |
| Description | | Principal Amount | | | Value (Note 2) | |
| |
ASSET-BACKED SECURITIES (0.11%) | | | | | | | | |
Honda Auto Receivables Owner Trust 2015-3 A2 | | | | | | | | |
0.92%, 11/20/2017 | | $ | 652,293 | | | | 652,320 | |
Toyota Auto Receivables Owner Trust 2015-A A2 | | | | | | | | |
0.71%, 07/17/2017 | | | 120,494 | | | | 120,457 | |
| | | | | | | | |
| | | | | | | 772,777 | |
| | | | | | | | |
| | |
TOTAL ASSET-BACKED SECURITIES (Cost $772,778) | | | | | | | 772,777 | |
| |
| | |
CORPORATE BONDS (1.85%) | | | | | | | | |
(0.01%) | | | | | | | | |
Amcor Finance USA, Inc. | | | | | | | | |
3.63%, 04/28/2026(d) | | | 18,000 | | | | 18,156 | |
Clean Harbors, Inc. | | | | | | | | |
5.13%, 06/01/2021(d) | | | 17,000 | | | | 17,213 | |
| | | | | | | | |
| | | | | | | 35,369 | |
| | | | | | | | |
| | |
ADVERTISING (0.01%) | | | | | | | | |
Omnicom Group, Inc. | | | | | | | | |
3.60%, 04/15/2026 | | | 18,000 | | | | 18,795 | |
The Interpublic Group of Companies, Inc. | | | | | | | | |
4.20%, 04/15/2024 | | | 24,000 | | | | 25,153 | |
| | | | | | | | |
| | | | | | | 43,948 | |
| | | | | | | | |
| | |
AEROSPACE & DEFENSE (0.03%) | | | | | | | | |
BAE Systems Holdings, Inc. | | | | | | | | |
3.80%, 10/07/2024(d) | | | 25,000 | | | | 25,911 | |
4.75%, 10/07/2044(d) | | | 16,000 | | | | 16,810 | |
| | |
| See Notes to Financial Statements. | | |
24 | | www.redmontfunds.com |
| | |
| Redmont Resolute Fund II | | Schedule of Investments |
| | April 30, 2016 |
| | | | | | | | |
| Description | | Principal Amount | | | Value (Note 2) | |
| |
AEROSPACE & DEFENSE (0.03%) (continued) | | | | | | | | |
Harris Corp. | | | | | | | | |
4.85%, 04/27/2035 | | $ | 22,000 | | | $ | 23,595 | |
5.05%, 04/27/2045 | | | 20,000 | | | | 21,705 | |
Moog, Inc. | | | | | | | | |
5.25%, 12/01/2022(d) | | | 40,000 | | | | 40,600 | |
Orbital ATK, Inc. | | | | | | | | |
5.50%, 10/01/2023(d) | | | 37,000 | | | | 39,035 | |
The Boeing Co. | | | | | | | | |
0.95%, 05/15/2018 | | | 54,000 | | | | 54,017 | |
2.20%, 10/30/2022 | | | 15,000 | | | | 15,203 | |
| | | | | | | | |
| | | | | | | 236,876 | |
| | | | | | | | |
| | |
AIRLINES (0.02%) | | | | | | | | |
Air Canada | | | | | | | | |
6.75%, 10/01/2019(d) | | | 40,000 | | | | 42,000 | |
Allegiant Travel Co. | | | | | | | | |
5.50%, 07/15/2019 | | | 40,000 | | | | 41,375 | |
United Airlines 2013-1 Class B Pass Through Trust | | | | | | | | |
5.38%, 08/15/2021 | | | 25,906 | | | | 27,040 | |
| | | | | | | | |
| | | | | | | 110,415 | |
| | | | | | | | |
| | |
AUTO MANUFACTURERS (0.05%) | | | | | | | | |
American Honda Finance Corp. | | | | | | | | |
1.20%, 07/14/2017 | | | 89,000 | | | | 89,283 | |
BMW US Capital LLC | | | | | | | | |
1.50%, 04/11/2019(d) | | | 19,000 | | | | 19,074 | |
Hyundia Capital America | | | | | | | | |
2.40%, 10/30/2018(d) | | | 39,000 | | | | 39,341 | |
JB Poindexter & Co., Inc. | | | | | | | | |
9.00%, 04/01/2022(d) | | | 21,000 | | | | 22,208 | |
PACCAR Financial Corp. | | | | | | | | |
1.65%, 02/25/2019 | | | 6,000 | | | | 6,039 | |
2.20%, 09/15/2019 | | | 63,000 | | | | 64,389 | |
Toyota Motor Credit Corp. | | | | | | | | |
1.70%, 02/19/2019 | | | 100,000 | | | | 101,069 | |
2.00%, 10/24/2018 | | | 11,000 | | | | 11,208 | |
| | | | | | | | |
| | | | | | | 352,611 | |
| | | | | | | | |
| | |
AUTO PARTS & EQUIPMENT (0.00%)(c) | | | | | | | | |
TI Group Automotive Systems LLC | | | | | | | | |
8.75%, 07/15/2023(d) | | | 25,000 | | | | 24,625 | |
| | | | | | | | |
| | |
BANKS (0.42%) | | | | | | | | |
Abbey National Treasury Services PLC | | | | | | | | |
2.50%, 03/14/2019 | | | 20,000 | | | | 20,320 | |
Bank of America Corp. | | | | | | | | |
2.63%, 10/19/2020 | | | 11,000 | | | | 11,108 | |
4.25%, 10/22/2026 | | | 62,000 | | | | 63,464 | |
7.25%, 10/15/2025 | | | 7,000 | | | | 8,261 | |
| | |
| See Notes to Financial Statements. | | |
Annual Report | April 30, 2016 | | 25 |
| | |
| Redmont Resolute Fund II | | Schedule of Investments |
| | April 30, 2016 |
| | | | | | | | |
| Description | | Principal Amount | | | Value (Note 2) | |
| |
BANKS (0.42%) (continued) | | | | | | | | |
Bank of America Corp., Series L | | | | | | | | |
2.60%, 01/15/2019 | | $ | 61,000 | | | $ | 62,096 | |
3.95%, 04/21/2025 | | | 23,000 | | | | 23,000 | |
BankUnited, Inc. | | | | | | | | |
4.88%, 11/17/2025 | | | 38,000 | | | | 38,301 | |
BNP Paribas SA | | | | | | | | |
7.63%, Perpetual Maturity(d)(f)(g) | | | 225,000 | | | | 231,187 | |
Citigroup, Inc. | | | | | | | | |
3.88%, 03/26/2025 | | | 9,000 | | | | 8,952 | |
4.40%, 06/10/2025 | | | 84,000 | | | | 86,931 | |
4.45%, 09/29/2027 | | | 30,000 | | | | 30,678 | |
6.00%, 10/31/2033 | | | 10,000 | | | | 11,313 | |
Credit Agricole SA | | | | | | | | |
8.13%, Perpetual Maturity(d)(f)(g) | | | 250,000 | | | | 258,986 | |
Credit Suisse Group AG | | | | | | | | |
7.50%, Perpetual Maturity(d)(f)(g) | | | 200,000 | | | | 199,316 | |
Credit Suisse New York | | | | | | | | |
1.70%, 04/27/2018 | | | 38,000 | | | | 37,987 | |
Fifth Third Bancorp, Series J | | | | | | | | |
4.90%, Perpetual Maturity(f)(g) | | | 48,000 | | | | 42,060 | |
First Horizon National Corp. | | | | | | | | |
3.50%, 12/15/2020 | | | 55,000 | | | | 55,258 | |
Intesa Sanpaolo SpA | | | | | | | | |
7.70%, Perpetual Maturity(d)(f)(g) | | | 215,000 | | | | 198,875 | |
JPMorgan Chase & Co. | | | | | | | | |
2.55%, 03/01/2021 | | | 50,000 | | | | 50,730 | |
2.75%, 06/23/2020 | | | 10,000 | | | | 10,245 | |
3.25%, 09/23/2022 | | | 71,000 | | | | 73,848 | |
4.95%, 06/01/2045 | | | 9,000 | | | | 9,767 | |
JPMorgan Chase & Co., Series U | | | | | | | | |
6.13%, Perpetual Maturity(f)(g) | | | 9,000 | | | | 9,249 | |
Lloyds Bank PLC | | | | | | | | |
6.50%, 09/14/2020(d) | | | 100,000 | | | | 112,215 | |
Lloyds Banking Group PLC | | | | | | | | |
7.50%, Perpetual Maturity(f)(g) | | | 205,000 | | | | 203,770 | |
Morgan Stanley | | | | | | | | |
2.80%, 06/16/2020 | | | 11,000 | | | | 11,231 | |
4.10%, 05/22/2023 | | | 87,000 | | | | 90,180 | |
4.75%, 03/22/2017 | | | 41,000 | | | | 42,275 | |
5.00%, 11/24/2025 | | | 22,000 | | | | 23,979 | |
Nordea Bank AB | | | | | | | | |
5.50%, Perpetual Maturity(d)(f)(g) | | | 215,000 | | | | 211,463 | |
Regions Financial Corp. | | | | | | | | |
3.20%, 02/08/2021 | | | 21,000 | | | | 21,199 | |
7.38%, 12/10/2037 | | | 71,000 | | | | 90,823 | |
Royal Bank of Canada | | | | | | | | |
4.65%, 01/27/2026 | | | 20,000 | | | | 20,872 | |
Royal Bank of Scotland Group PLC | | | | | | | | |
8.00%, Perpetual Maturity(f)(g) | | | 230,000 | | | | 221,016 | |
SunTrust Banks, Inc. | | | | | | | | |
2.90%, 03/03/2021 | | | 14,000 | | | | 14,257 | |
| | |
| See Notes to Financial Statements. | | |
26 | | www.redmontfunds.com |
| | |
| Redmont Resolute Fund II | | Schedule of Investments |
| | April 30, 2016 |
| | | | | | | | |
| Description | | Principal Amount | | | Value (Note 2) | |
| |
BANKS (0.42%) (continued) | | | | | | | | |
The Bank of Nova Scotia | | | | | | | | |
4.50%, 12/16/2025 | | $ | 25,000 | | | $ | 25,800 | |
The Goldman Sachs Group, Inc. | | | | | | | | |
4.25%, 10/21/2025 | | | 28,000 | | | | 28,630 | |
4.75%, 10/21/2045 | | | 11,000 | | | | 11,693 | |
5.15%, 05/22/2045 | | | 5,000 | | | | 5,152 | |
6.13%, 02/15/2033 | | | 22,000 | | | | 27,003 | |
6.75%, 10/01/2037 | | | 63,000 | | | | 76,532 | |
The Goldman Sachs Group, Inc., Series M | | | | | | | | |
5.38%, Perpetual Maturity(f)(g) | | | 10,000 | | | | 9,662 | |
US Bancorp | | | | | | | | |
3.10%, 04/27/2026 | | | 9,000 | | | | 9,062 | |
Wells Fargo & Co. | | | | | | | | |
4.30%, 07/22/2027 | | | 34,000 | | | | 36,139 | |
Wells Fargo & Co., Series U | | | | | | | | |
5.88%, Perpetual Maturity(f)(g) | | | 22,000 | | | | 23,526 | |
Wells Fargo Capital X | | | | | | | | |
5.95%, 12/15/2036 | | | 17,000 | | | | 17,527 | |
| | | | | | | | |
| | | | | | | 2,875,938 | |
| | | | | | | | |
| | |
BEVERAGES (0.03%) | | | | | | | | |
Anheuser-Busch InBev Worldwide, Inc. | | | | | | | | |
1.38%, 07/15/2017 | | | 46,000 | | | | 46,209 | |
1.90%, 02/01/2019 | | | 13,000 | | | | 13,191 | |
2.65%, 02/01/2021 | | | 26,000 | | | | 26,731 | |
3.30%, 02/01/2023 | | | 12,000 | | | | 12,626 | |
3.65%, 02/01/2026 | | | 16,000 | | | | 16,906 | |
4.70%, 02/01/2036 | | | 47,000 | | | | 51,618 | |
4.90%, 02/01/2046 | | | 19,000 | | | | 21,522 | |
Diageo Capital PLC | | | | | | | | |
5.75%, 10/23/2017 | | | 28,000 | | | | 29,862 | |
| | | | | | | | |
| | | | | | | 218,665 | |
| | | | | | | | |
| | |
BUILDING MATERIALS (0.01%) | | | | | | | | |
Griffon Corp. | | | | | | | | |
5.25%, 03/01/2022 | | | 11,000 | | | | 11,096 | |
Standard Industries, Inc. | | | | | | | | |
6.00%, 10/15/2025(d) | | | 50,000 | | | | 54,125 | |
| | | | | | | | |
| | | | | | | 65,221 | |
| | | | | | | | |
| | |
CHEMICALS (0.03%) | | | | | | | | |
A Schulman, Inc. | | | | | | | | |
6.88%, 06/01/2023(d) | | | 30,000 | | | | 30,225 | |
Airgas, Inc. | | | | | | | | |
3.05%, 08/01/2020 | | | 12,000 | | | | 12,262 | |
Eco Services Operations LLC / Eco Finance Corp. | | | | | | | | |
8.50%, 11/01/2022(d) | | | 45,000 | | | | 43,650 | |
Lubrizol Corp. | | | | | | | | |
6.50%, 10/01/2034 | | | 14,000 | | | | 18,110 | |
PQ Corp. | | | | | | | | |
6.75%, 11/15/2022(d) | | | 7,000 | | | | 7,228 | |
| | |
| See Notes to Financial Statements. | | |
Annual Report | April 30, 2016 | | 27 |
| | |
| Redmont Resolute Fund II | | Schedule of Investments |
| | April 30, 2016 |
| | | | | | | | |
| Description | | Principal Amount | | | Value (Note 2) | |
| |
CHEMICALS (0.03%) (continued) | | | | | | | | |
RPM International, Inc. | | | | | | | | |
5.25%, 06/01/2045 | | $ | 57,000 | | | $ | 56,516 | |
The Valspar Corp. | | | | | | | | |
3.95%, 01/15/2026 | | | 15,000 | | | | 15,555 | |
Tronox Finance LLC | | | | | | | | |
7.50%, 03/15/2022(d) | | | 25,000 | | | | 20,875 | |
| | | | | | | | |
| | | | | | | 204,421 | |
| | | | | | | | |
| | |
COAL (0.00%)(c) | | | | | | | | |
SunCoke Energy Partners LP / SunCoke Energy Partners Finance Corp. | | | | | | | | |
7.38%, 02/01/2020(d) | | | 3,000 | | | | 2,310 | |
7.38%, 02/01/2020(d) | | | 9,000 | | | | 6,930 | |
| | | | | | | | |
| | | | | | | 9,240 | |
| | | | | | | | |
| | |
COMMERCIAL SERVICES (0.03%) | | | | | | | | |
Automatic Data Processing, Inc. | | | | | | | | |
2.25%, 09/15/2020 | | | 5,000 | | | | 5,163 | |
Great Lakes Dredge & Dock Corp. | | | | | | | | |
7.38%, 02/01/2019 | | | 46,000 | | | | 44,045 | |
Harland Clarke Holdings Corp. | | | | | | | | |
6.88%, 03/01/2020(d) | | | 55,000 | | | | 50,325 | |
President and Fellows of Harvard College | | | | | | | | |
3.62%, 10/01/2037 | | | 34,000 | | | | 34,477 | |
Quad Graphics, Inc. | | | | | | | | |
7.00%, 05/01/2022 | | | 60,000 | | | | 48,300 | |
Total System Services, Inc. | | | | | | | | |
3.80%, 04/01/2021 | | | 6,000 | | | | 6,234 | |
4.80%, 04/01/2026 | | | 4,000 | | | | 4,199 | |
United Rentals North | | | | | | | | |
5.50%, 07/15/2025 | | | 40,000 | | | | 39,929 | |
| | | | | | | | |
| | | | | | | 232,672 | |
| | | | | | | | |
| | |
COMPUTERS (0.05%) | | | | | | | | |
Apple, Inc. | | | | | | | | |
2.85%, 05/06/2021 | | | 18,000 | | | | 18,927 | |
2.85%, 02/23/2023 | | | 22,000 | | | | 22,711 | |
4.50%, 02/23/2036 | | | 8,000 | | | | 8,747 | |
Diebold, Inc. | | | | | | | | |
8.50%, 04/15/2024(d) | | | 46,000 | | | | 46,690 | |
Hewlett-Packard Co. | | | | | | | | |
4.90%, 10/15/2025(d) | | | 21,000 | | | | 21,784 | |
6.00%, 09/15/2041 | | | 40,000 | | | | 37,741 | |
6.20%, 10/15/2035(d) | | | 31,000 | | | | 31,036 | |
6.35%, 10/15/2045(d) | | | 23,000 | | | | 22,854 | |
International Business Machines Corp. | | | | | | | | |
1.80%, 05/17/2019 | | | 100,000 | | | | 101,304 | |
| | | | | | | | |
| | | | | | | 311,794 | |
| | | | | | | | |
| | |
CONTAINERS & PACKAGING (0.01%) | | | | | | | | |
Brambles USA, Inc. | | | | | | | | |
4.13%, 10/23/2025(d) | | | 12,000 | | | | 12,474 | |
| | |
| See Notes to Financial Statements. | | |
28 | | www.redmontfunds.com |
| | |
| Redmont Resolute Fund II | | Schedule of Investments |
| | April 30, 2016 |
| | | | | | | | |
| Description | | Principal Amount | | | Value (Note 2) | |
| |
CONTAINERS & PACKAGING (0.01%) (continued) | | | | | | | | |
Crown Cork & Seal Co., Inc. | | | | | | | | |
7.38%, 12/15/2026 | | $ | 20,000 | | | $ | 21,925 | |
| | | | | | | | |
| | | | | | | 34,399 | |
| | | | | | | | |
| | |
DISTRIBUTION & WHOLESALE (0.01%) | | | | | | | | |
H&E Equipment Services, Inc. | | | | | | | | |
7.00%, 09/01/2022 | | | 41,000 | | | | 41,615 | |
| | | | | | | | |
| | |
DIVERSIFIED FINANCIAL SERVICES (0.09%) | | | | | | | | |
Aircastle, Ltd. | | | | | | | | |
5.00%, 04/01/2023 | | | 14,000 | | | | 14,289 | |
Ally Financial, Inc. | | | | | | | | |
5.75%, 11/20/2025 | | | 65,000 | | | | 66,056 | |
Credit Acceptance Corp. | | | | | | | | |
7.38%, 03/15/2023 | | | 45,000 | | | | 42,862 | |
Discover Financial Services | | | | | | | | |
3.75%, 03/04/2025 | | | 26,000 | | | | 25,806 | |
Enova International, Inc. | | | | | | | | |
9.75%, 06/01/2021 | | | 60,000 | | | | 45,300 | |
General Electric Capital Corp. | | | | | | | | |
5.88%, 01/14/2038 | | | 35,000 | | | | 46,216 | |
General Electric Co. | | | | | | | | |
1.25%, 05/15/2017 | | | 57,000 | | | | 57,245 | |
National Rural Utilities Cooperative Finance Corp. | | | | | | | | |
0.95%, 04/24/2017 | | | 9,000 | | | | 9,006 | |
1.10%, 01/27/2017 | | | 37,000 | | | | 37,072 | |
2.00%, 01/27/2020 | | | 26,000 | | | | 26,294 | |
2.30%, 11/01/2020 | | | 7,000 | | | | 7,158 | |
4.75%, 04/30/2043(g) | | | 42,000 | | | | 40,215 | |
Navient Corp. | | | | | | | | |
5.63%, 08/01/2033 | | | 87,000 | | | | 61,770 | |
Quicken Loans, Inc. | | | | | | | | |
5.75%, 05/01/2025(d) | | | 40,000 | | | | 37,800 | |
Springleaf Finance Corp. | | | | | | | | |
8.25%, 12/15/2020 | | | 9,000 | | | | 9,338 | |
Synchrony Financial | | | | | | | | |
4.25%, 08/15/2024 | | | 32,000 | | | | 32,890 | |
TD Ameritrade Holding Corp. | | | | | | | | |
2.95%, 04/01/2022 | | | 13,000 | | | | 13,370 | |
Visa, Inc. | | | | | | | | |
4.30%, 12/14/2045 | | | 14,000 | | | | 15,466 | |
| | | | | | | | |
| | | | | | | 588,153 | |
| | | | | | | | |
| | |
ELECTRIC (0.11%) | | | | | | | | |
AES Corp. | | | | | | | | |
5.50%, 03/15/2024 | | | 50,000 | | | | 50,875 | |
Arizona Public Service Co. | | | | | | | | |
2.20%, 01/15/2020 | | | 10,000 | | | | 10,136 | |
Dominion Resources, Inc. | | | | | | | | |
5.75%, 10/01/2054(g) | | | 30,000 | | | | 28,950 | |
| | |
| See Notes to Financial Statements. | | |
Annual Report | April 30, 2016 | | 29 |
| | |
| Redmont Resolute Fund II | | Schedule of Investments |
| | April 30, 2016 |
| | | | | | | | |
| Description | | Principal Amount | | | Value (Note 2) | |
| |
ELECTRIC (0.11%) (continued) | | | | | | | | |
Duke Energy Progress LLC | | | | | | | | |
3.00%, 09/15/2021 | | $ | 21,000 | | | $ | 22,201 | |
Dynegy, Inc. | | | | | | | | |
7.38%, 11/01/2022 | | | 50,000 | | | | 49,625 | |
Electricite de France SA | | | | | | | | |
2.35%, 10/13/2020(d) | | | 56,000 | | | | 56,715 | |
3.63%, 10/13/2025(d) | | | 8,000 | | | | 8,287 | |
4.95%, 10/13/2045(d) | | | 29,000 | | | | 31,572 | |
Entergy Arkansas, Inc. | | | | | | | | |
3.50%, 04/01/2026 | | | 6,000 | | | | 6,101 | |
4.95%, 12/15/2044 | | | 25,000 | | | | 25,955 | |
Entergy Louisiana LLC | | | | | | | | |
4.95%, 01/15/2045 | | | 54,000 | | | | 55,408 | |
Exelon Corp. | | | | | | | | |
3.40%, 04/15/2026 | | | 13,000 | | | | 13,276 | |
4.45%, 04/15/2046 | | | 14,000 | | | | 14,505 | |
4.95%, 06/15/2035(d) | | | 6,000 | | | | 6,607 | |
5.10%, 06/15/2045(d) | | | 14,000 | | | | 15,916 | |
Exelon Generation Co. LLC | | | | | | | | |
2.95%, 01/15/2020 | | | 14,000 | | | | 14,222 | |
FirstEnergy Corp., Series C | | | | | | | | |
7.38%, 11/15/2031 | | | 42,000 | | | | 51,133 | |
Georgia Power Co. | | | | | | | | |
3.25%, 04/01/2026 | | | 6,000 | | | | 6,250 | |
Hydro-Quebec | | | | | | | | |
1.38%, 06/19/2017 | | | 53,000 | | | | 53,254 | |
Louisville Gas & Electric Co. | | | | | | | | |
4.38%, 10/01/2045 | | | 4,000 | | | | 4,490 | |
NRG Energy, Inc. | | | | | | | | |
6.25%, 07/15/2022 | | | 50,000 | | | | 49,266 | |
Oglethorpe Power Corp. | | | | | | | | |
4.25%, 04/01/2046 | | | 9,000 | | | | 8,933 | |
South Carolina Electric & Gas Co. | | | | | | | | |
5.10%, 06/01/2065 | | | 10,000 | | | | 11,350 | |
Southern Power Co. | | | | | | | | |
4.15%, 12/01/2025 | | | 19,000 | | | | 19,876 | |
Talen Energy Supply LLC | | | | | | | | |
6.50%, 06/01/2025 | | | 65,000 | | | | 58,018 | |
The Southern Co. | | | | | | | | |
1.30%, 08/15/2017 | | | 76,000 | | | | 75,980 | |
Trans-Allegheny Interstate Line Co. | | | | | | | | |
3.85%, 06/01/2025(d) | | | 10,000 | | | | 10,495 | |
| | | | | | | | |
| | | | | | | 759,396 | |
| | | | | | | | |
| | |
ELECTRICAL COMPONENTS & EQUIPMENT (0.02%) | | | | | | | | |
Belden, Inc. | | | | | | | | |
5.25%, 07/15/2024(d) | | | 50,000 | | | | 49,000 | |
EnerSys | | | | | | | | |
5.00%, 04/30/2023(d) | | | 20,000 | | | | 20,000 | |
General Cable Corp. | | | | | | | | |
5.75%, 10/01/2022 | | | 55,000 | | | | 49,637 | |
| | |
| See Notes to Financial Statements. | | |
30 | | www.redmontfunds.com |
| | |
| Redmont Resolute Fund II | | Schedule of Investments |
| | April 30, 2016 |
| | | | | | | | |
| Description | | Principal Amount | | | Value (Note 2) | |
| |
ELECTRICAL COMPONENTS & EQUIPMENT (0.02%) (continued) | | | | | | | | |
Hubbell, Inc. | | | | | | | | |
3.35%, 03/01/2026 | | | $ 16,000 | | | $ | 16,116 | |
| | | | | | | | |
| | | | | | | 134,753 | |
| | | | | | | | |
| | |
ELECTRONICS (0.00%)(c) | | | | | | | | |
Avnet, Inc. | | | | | | | | |
4.63%, 04/15/2026 | | | 10,000 | | | | 10,316 | |
Corning, Inc. | | | | | | | | |
1.50%, 05/08/2018 | | | 11,000 | | | | 10,963 | |
Flextronics International, Ltd. | | | | | | | | |
4.75%, 06/15/2025 | | | 11,000 | | | | 11,027 | |
| | | | | | | | |
| | | | | | | 32,306 | |
| | | | | | | | |
| | |
ENERGY & ALTERNATE SOURCES (0.01%) | | | | | | | | |
TerraForm Power Operating LLC | | | | | | | | |
5.88%, 02/01/2023(d) | | | 50,000 | | | | 43,875 | |
| | | | | | | | |
| | |
ENGINEERING & CONSTRUCTION (0.00%)(c) | | | | | | | | |
Sydney Airport Finance Co. Pty., Ltd. | | | | | | | | |
3.63%, 04/28/2026(d) | | | 7,000 | | | | 7,058 | |
Weekley Homes LLC | | | | | | | | |
6.00%, 02/01/2023 | | | 25,000 | | | | 23,375 | |
| | | | | | | | |
| | | | | | | 30,433 | |
| | | | | | | | |
| | |
ENTERTAINMENT (0.03%) | | | | | | | | |
Cinemark USA, Inc. | | | | | | | | |
4.88%, 06/01/2023(d) | | | 50,000 | | | | 49,880 | |
International Game Technology | | | | | | | | |
7.50%, 06/15/2019 | | | 45,000 | | | | 49,781 | |
Regal Entertainment Group | | | | | | | | |
5.75%, 06/15/2023 | | | 25,000 | | | | 25,719 | |
Scientific Games International, Inc. | | | | | | | | |
10.00%, 12/01/2022 | | | 55,000 | | | | 45,733 | |
| | | | | | | | |
| | | | | | | 171,113 | |
| | | | | | | | |
| | |
FOOD (0.02%) | | | | | | | | |
Dean Foods Co. | | | | | | | | |
6.50%, 03/15/2023(d) | | | 34,000 | | | | 35,785 | |
JBS USA LLC / JBS USA Finance, Inc. | | | | | | | | |
5.88%, 07/15/2024(d) | | | 50,000 | | | | 46,750 | |
Kraft Heinz Foods Co. | | | | | | | | |
4.88%, 02/15/2025(d) | | | 27,000 | | | | 29,889 | |
SUPERVALU, Inc. | | | | | | | | |
7.75%, 11/15/2022 | | | 45,000 | | | | 39,263 | |
| | | | | | | | |
| | | | | | | 151,687 | |
| | | | | | | | |
| | |
FOREST PRODUCTS & PAPER (0.05%) | | | | | | | | |
Cascades, Inc. | | | | | | | | |
5.75%, 07/15/2023(d) | | | 40,000 | | | | 38,300 | |
Clearwater Paper Corp. | | | | | | | | |
4.50%, 02/01/2023 | | | 40,000 | | | | 39,800 | |
| | |
| See Notes to Financial Statements. | | |
Annual Report | April 30, 2016 | | 31 |
| | |
| Redmont Resolute Fund II | | Schedule of Investments |
| | April 30, 2016 |
| | | | | | | | |
| Description | | Principal Amount | | | Value (Note 2) | |
| |
FOREST PRODUCTS & PAPER (0.05%) (continued) | | | | | | | | |
Domtar Corp. | | | | | | | | |
6.75%, 02/15/2044 | | | $ 46,000 | | | $ | 48,563 | |
Georgia-Pacific LLC | | | | | | | | |
3.60%, 03/01/2025(d) | | | 78,000 | | | | 81,569 | |
3.73%, 07/15/2023(d) | | | 57,000 | | | | 60,380 | |
5.40%, 11/01/2020(d) | | | 30,000 | | | | 33,838 | |
PH Glatfelter Co. | | | | | | | | |
5.38%, 10/15/2020 | | | 10,000 | | | | 10,150 | |
| | | | | | | | |
| | | | | | | 312,600 | |
| | | | | | | | |
| | |
GAS (0.00%)(c) | | | | | | | | |
Dominion Gas Holdings LLC | | | | | | | | |
4.80%, 11/01/2043 | | | 22,000 | | | | 23,007 | |
| | | | | | | | |
| | |
HAND & MACHINE TOOLS (0.01%) | | | | | | | | |
Stanley Black & Decker, Inc. | | | | | | | | |
5.75%, 12/15/2053(g) | | | 51,000 | | | | 53,869 | |
| | | | | | | | |
| | |
HEALTHCARE - PRODUCTS (0.01%) | | | | | | | | |
Danaher Corp. | | | | | | | | |
3.35%, 09/15/2025 | | | 13,000 | | | | 13,794 | |
4.38%, 09/15/2045 | | | 12,000 | | | | 13,461 | |
Greatbatch, Ltd. | | | | | | | | |
9.13%, 11/01/2023(d) | | | 15,000 | | | | 14,963 | |
| | | | | | | | |
| | | | | | | 42,218 | |
| | | | | | | | |
| | |
HEALTHCARE - SERVICES (0.04%) | | | | | | | | |
Centene Corp. | | | | | | | | |
5.63%, 02/15/2021(d) | | | 3,000 | | | | 3,158 | |
6.13%, 02/15/2024(d) | | | 12,000 | | | | 12,630 | |
HCA, Inc. | | | | | | | | |
5.25%, 06/15/2026 | | | 24,000 | | | | 24,990 | |
5.38%, 02/01/2025 | | | 30,000 | | | | 30,713 | |
IASIS Healthcare LLC / IASIS Capital Corp. | | | | | | | | |
8.38%, 05/15/2019 | | | 56,000 | | | | 53,760 | |
Laboratory Corp. of America Holdings | | | | | | | | |
3.20%, 02/01/2022 | | | 10,000 | | | | 10,193 | |
3.60%, 02/01/2025 | | | 22,000 | | | | 22,454 | |
4.70%, 02/01/2045 | | | 7,000 | | | | 7,159 | |
RegionalCare Hospital Partners Holdings, Inc. | | | | | | | | |
8.25%, 05/01/2023(d) | | | 50,000 | | | | 52,125 | |
UnitedHealth Group, Inc. | | | | | | | | |
1.40%, 12/15/2017 | | | 16,000 | | | | 16,088 | |
2.13%, 03/15/2021 | | | 19,000 | | | | 19,187 | |
3.35%, 07/15/2022 | | | 11,000 | | | | 11,676 | |
| | | | | | | | |
| | | | | | | 264,133 | |
| | | | | | | | |
| | |
| See Notes to Financial Statements. | | |
32 | | www.redmontfunds.com |
| | |
| Redmont Resolute Fund II | | Schedule of Investments |
| | April 30, 2016 |
| | | | | | | | |
| Description | | Principal Amount | | | Value (Note 2) | |
| |
HOLDING COMPANIES - DIVERSIFIED (0.01%) | | | | | | | | |
Opal Acquisition, Inc. | | | | | | | | |
8.88%, 12/15/2021(d) | | | $ 45,000 | | | $ | 36,956 | |
| | | | | | | | |
| | |
HOME BUILDERS (0.00%)(c) | | | | | | | | |
Mattamy Group Corp. | | | | | | | | |
6.50%, 11/15/2020(d) | | | 25,000 | | | | 24,375 | |
| | | | | | | | |
| | |
HOUSEHOLD PRODUCTS & WARES (0.00%)(c) | | | | | | | | |
Kimberly-Clark Corp. | | | | | | | | |
1.85%, 03/01/2020 | | | 12,000 | | | | 12,235 | |
| | | | | | | | |
| | |
HOUSEWARES (0.00%)(c) | | | | | | | | |
Newell Brands, Inc. | | | | | | | | |
4.20%, 04/01/2026 | | | 10,000 | | | | 10,557 | |
5.38%, 04/01/2036 | | | 7,000 | | | | 7,682 | |
| | | | | | | | |
| | | | | | | 18,239 | |
| | | | | | | | |
| | |
INSURANCE (0.07%) | | | | | | | | |
American International Group, Inc. | | | | | | | | |
3.30%, 03/01/2021 | | | 13,000 | | | | 13,405 | |
3.88%, 01/15/2035 | | | 56,000 | | | | 52,071 | |
Assurant, Inc. | | | | | | | | |
6.75%, 02/15/2034 | | | 98,000 | | | | 117,911 | |
Jackson National Life Global Funding | | | | | | | | |
3.05%, 04/29/2026(d) | | | 42,000 | | | | 42,033 | |
Massachusetts Mutual Life Insurance Co. | | | | | | | | |
4.50%, 04/15/2065(d) | | | 24,000 | | | | 22,010 | |
MetLife, Inc. | | | | | | | | |
4.60%, 05/13/2046 | | | 9,000 | | | | 9,488 | |
New York Life Global Funding | | | | | | | | |
1.65%, 05/15/2017(d) | | | 64,000 | | | | 64,500 | |
Pacific LifeCorp. | | | | | | | | |
6.00%, 02/10/2020(d) | | | 29,000 | | | | 32,211 | |
Principal Life Global Funding II | | | | | | | | |
3.00%, 04/18/2026(d) | | | 14,000 | | | | 14,035 | |
Prudential Financial, Inc. | | | | | | | | |
5.38%, 05/15/2045(g) | | | 11,000 | | | | 11,195 | |
5.63%, 06/15/2043(g) | | | 49,000 | | | | 51,133 | |
XLIT, Ltd. | | | | | | | | |
4.45%, 03/31/2025 | | | 9,000 | | | | 9,056 | |
5.50%, 03/31/2045 | | | 21,000 | | | | 20,598 | |
| | | | | | | | |
| | | | | | | 459,646 | |
| | | | | | | | |
| | |
INTERNET (0.01%) | | | | | | | | |
Cogent Communications Holdings, Inc. | | | | | | | | |
5.38%, 03/01/2022(d) | | | 45,000 | | | | 45,000 | |
| | |
| See Notes to Financial Statements. | | |
Annual Report | April 30, 2016 | | 33 |
| | |
| Redmont Resolute Fund II | | Schedule of Investments |
| | April 30, 2016 |
| | | | | | | | |
| Description | | Principal Amount | | | Value (Note 2) | |
| |
INTERNET (0.01%) (continued) | | | | | | | | |
Netflix, Inc. | | | | | | | | |
5.88%, 02/15/2025 | | | $ 45,000 | | | $ | 47,475 | |
| | | | | | | | |
| | | | | | | 92,475 | |
| | | | | | | | |
| | |
IRON & STEEL (0.02%) | | | | | | | | |
AK Steel Corp. | | | | | | | | |
8.75%, 12/01/2018 | | | 50,000 | | | | 51,875 | |
ArcelorMittal | | | | | | | | |
7.25%, 02/25/2022 | | | 55,000 | | | | 58,128 | |
Steel Dynamics, Inc. | | | | | | | | |
5.13%, 10/01/2021 | | | 40,000 | | | | 41,100 | |
| | | | | | | | |
| | | | | | | 151,103 | |
| | | | | | | | |
| | |
LEISURE TIME (0.02%) | | | | | | | | |
NCL Corp., Ltd. | | | | | | | | |
4.63%, 11/15/2020(d) | | | 40,000 | | | | 40,850 | |
Royal Caribbean Cruises, Ltd. | | | | | | | | |
5.25%, 11/15/2022 | | | 32,000 | | | | 34,440 | |
Sabre GLBL, Inc. | | | | | | | | |
5.38%, 04/15/2023(d) | | | 45,000 | | | | 46,125 | |
Viking Cruises, Ltd. | | | | | | | | |
6.25%, 05/15/2025(d) | | | 55,000 | | | | 44,275 | |
| | | | | | | | |
| | | | | | | 165,690 | |
| | | | | | | | |
| | |
LODGING (0.03%) | | | | | | | | |
Caesars Entertainment Resort Properties LLC | | | | | | | | |
8.00%, 10/01/2020 | | | 50,000 | | | | 49,375 | |
Golden Nugget Escrow, Inc. | | | | | | | | |
8.50%, 12/01/2021(d) | | | 40,000 | | | | 41,700 | |
Interval Acquisition Corp. | | | | | | | | |
5.63%, 04/15/2023(d) | | | 45,000 | | | | 46,125 | |
MGP Escrow Issuer LLC / MGP Escrow Co.-Issuer, Inc. | | | | | | | | |
5.63%, 05/01/2024(d) | | | 27,000 | | | | 28,165 | |
Quapaw Downstream Development Authority of the Quapaw Tribe of Oklahoma | | | | | | | | |
10.50%, 07/01/2019(d) | | | 45,000 | | | | 43,031 | |
| | | | | | | | |
| | | | | | | 208,396 | |
| | | | | | | | |
| | |
MACHINERY - DIVERSIFIED (0.02%) | | | | | | | | |
ATS Automation Tooling Systems, Inc. | | | | | | | | |
6.50%, 06/15/2023(d) | | | 20,000 | | | | 20,650 | |
John Deere Capital Corp. | | | | | | | | |
1.13%, 06/12/2017 | | | 49,000 | | | | 49,156 | |
1.55%, 12/15/2017 | | | 53,000 | | | | 53,601 | |
| | | | | | | | |
| | | | | | | 123,407 | |
| | | | | | | | |
| | |
MEDIA (0.07%) | | | | | | | | |
21st Century Fox America, Inc. | | | | | | | | |
4.95%, 10/15/2045 | | | 4,000 | | | | 4,451 | |
Block Communications, Inc. | | | | | | | | |
7.25%, 02/01/2020(d) | | | 4,000 | | | | 4,040 | |
Cable One, Inc. | | | | | | | | |
5.75%, 06/15/2022(d) | | | 45,000 | | | | 46,350 | |
| | |
| See Notes to Financial Statements. | | |
34 | | www.redmontfunds.com |
| | |
| Redmont Resolute Fund II | | Schedule of Investments |
| | April 30, 2016 |
| | | | | | | | |
| Description | | Principal Amount | | | Value (Note 2) | |
| |
MEDIA (0.07%) (continued) | | | | | | | | |
CCO Safari II LLC | | | | | | | | |
3.58%, 07/23/2020(d) | | | $ 19,000 | | | $ | 19,747 | |
6.38%, 10/23/2035(d) | | | 8,000 | | | | 9,252 | |
CCOH Safari LLC | | | | | | | | |
5.75%, 02/15/2026(d) | | | 45,000 | | | | 46,575 | |
Cequel Communications Holdings I LLC / Cequel Capital Corp. | | | | | | | | |
6.38%, 09/15/2020(d) | | | 20,000 | | | | 20,600 | |
Clear Channel Worldwide Holdings, Inc., Series A | | | | | | | | |
6.50%, 11/15/2022 | | | 50,000 | | | | 48,750 | |
Emerald Expositions Holding, Inc. | | | | | | | | |
9.00%, 06/15/2021(d) | | | 40,000 | | | | 39,100 | |
Lee Enterprises, Inc. | | | | | | | | |
9.50%, 03/15/2022(d) | | | 50,000 | | | | 50,625 | |
McGraw-Hill Global | | | | | | | | |
7.88%, 05/15/2024 | | | 4,000 | | | | 4,110 | |
Sirius XM Radio, Inc. | | | | | | | | |
5.38%, 04/15/2025(d) | | | 35,000 | | | | 35,875 | |
The McClatchy Co. | | | | | | | | |
9.00%, 12/15/2022 | | | 55,000 | | | | 52,903 | |
The Walt Disney Co. | | | | | | | | |
1.50%, 09/17/2018 | | | 18,000 | | | | 18,224 | |
1.65%, 01/08/2019 | | | 9,000 | | | | 9,152 | |
Time Warner, Inc. | | | | | | | | |
4.85%, 07/15/2045 | | | 12,000 | | | | 12,973 | |
Time, Inc. | | | | | | | | |
5.75%, 04/15/2022(d) | | | 47,000 | | | | 45,502 | |
| | | | | | | | |
| | | | | | | 468,229 | |
| | | | | | | | |
| | |
METAL FABRICATE & HARDWARE (0.01%) | | | | | | | | |
JMC Steel Group, Inc. | | | | | | | | |
8.25%, 03/15/2018(d) | | | 25,000 | | | | 24,125 | |
Valmont Industries, Inc. | | | | | | | | |
5.25%, 10/01/2054 | | | 60,000 | | | | 53,018 | |
| | | | | | | | |
| | | | | | | 77,143 | |
| | | | | | | | |
| | |
MINING (0.02%) | | | | | | | | |
Aleris International, Inc. | | | | | | | | |
9.50%, 04/01/2021(d) | | | 25,000 | | | | 26,188 | |
FMG Resources August 2006 Pty., Ltd. | | | | | | | | |
8.25%, 11/01/2019(d) | | | 25,000 | | | | 26,129 | |
9.75%, 03/01/2022(d) | | | 45,000 | | | | 47,588 | |
Goldcorp, Inc. | | | | | | | | |
5.45%, 06/09/2044 | | | 31,000 | | | | 30,200 | |
Kaiser Aluminum Corp. | | | | | | | | |
5.88%, 05/15/2024(d) | | | 15,000 | | | | 15,347 | |
| | | | | | | | |
| | | | | | | 145,452 | |
| | | | | | | | |
| | |
MISCELLANEOUS MANUFACTURING (0.02%) | | | | | | | | |
Gates Global LLC / Gates Global Co. | | | | | | | | |
6.00%, 07/15/2022(d) | | | 25,000 | | | | 21,875 | |
General Electric Co. | | | | | | | | |
2.70%, 10/09/2022 | | | 30,000 | | | | 31,000 | |
| | |
| See Notes to Financial Statements. | | |
Annual Report | April 30, 2016 | | 35 |
| | |
| Redmont Resolute Fund II | | Schedule of Investments |
| | April 30, 2016 |
| | | | | | | | |
| Description | | Principal Amount | | | Value (Note 2) | |
| |
MISCELLANEOUS MANUFACTURING (0.02%) (continued) | | | | | | | | |
Ingersoll-Rand Global Holding Co., Ltd. | | | | | | | | |
5.75%, 06/15/2043 | | | $ 54,000 | | | | $ 65,138 | |
Ingersoll-Rand Luxembourg Finance SA | | | | | | | | |
4.65%, 11/01/2044 | | | 12,000 | | | | 12,471 | |
Textron, Inc. | | | | | | | | |
4.00%, 03/15/2026 | | | 19,000 | | | | 19,549 | |
Trinity Industries, Inc. | | | | | | | | |
4.55%, 10/01/2024 | | | 17,000 | | | | 15,828 | |
| | | | | | | | |
| | | | | | | 165,861 | |
| | | | | | | | |
| | |
OIL & GAS (0.11%) | | | | | | | | |
Anadarko Finance Co., Series B | | | | | | | | |
7.50%, 05/01/2031 | | | 10,000 | | | | 11,491 | |
Anadarko Petroleum Corp. | | | | | | | | |
6.45%, 09/15/2036 | | | 63,000 | | | | 68,137 | |
Baytex Energy Corp. | | | | | | | | |
5.63%, 06/01/2024(d) | | | 25,000 | | | | 19,125 | |
BP Capital Markets PLC | | | | | | | | |
1.68%, 05/03/2019 | | | 16,000 | | | | 16,037 | |
3.12%, 05/04/2026 | | | 13,000 | | | | 13,151 | |
3.25%, 05/06/2022 | | | 19,000 | | | | 19,589 | |
Calumet Specialty Products Partners LP / Calumet Finance Corp. | | | | | | | | |
6.50%, 04/15/2021 | | | 54,000 | | | | 37,530 | |
Carrizo Oil & Gas, Inc. | | | | | | | | |
6.25%, 04/15/2023 | | | 24,000 | | | | 23,220 | |
Chevron Corp. | | | | | | | | |
1.37%, 03/02/2018 | | | 28,000 | | | | 28,131 | |
1.96%, 03/03/2020 | | | 12,000 | | | | 12,148 | |
ConocoPhillips Co. | | | | | | | | |
1.50%, 05/15/2018 | | | 6,000 | | | | 5,971 | |
Denbury Resources, Inc. | | | | | | | | |
5.50%, 05/01/2022 | | | 33,000 | | | | 21,615 | |
Exxon Mobil Corp. | | | | | | | | |
1.31%, 03/06/2018 | | | 19,000 | | | | 19,123 | |
Hess Corp. | | | | | | | | |
5.60%, 02/15/2041 | | | 13,000 | | | | 12,749 | |
7.88%, 10/01/2029 | | | 22,000 | | | | 24,957 | |
Hilcorp Energy I LP / Hilcorp Finance Co. | | | | | | | | |
5.00%, 12/01/2024(d) | | | 45,000 | | | | 42,075 | |
Laredo Petroleum, Inc. | | | | | | | | |
7.38%, 05/01/2022 | | | 23,000 | | | | 22,655 | |
Legacy Reserves LP / Legacy Reserves Finance Corp. | | | | | | | | |
6.63%, 12/01/2021 | | | 45,000 | | | | 14,906 | |
MEG Energy Corp. | | | | | | | | |
6.38%, 01/30/2023(d) | | | 50,000 | | | | 38,344 | |
Murphy Oil USA, Inc. | | | | | | | | |
6.00%, 08/15/2023 | | | 40,000 | | | | 42,025 | |
Newfield Exploration Co. | | | | | | | | |
5.38%, 01/01/2026 | | | 25,000 | | | | 24,875 | |
Noble Energy, Inc. | | | | | | | | |
3.90%, 11/15/2024 | | | 17,000 | | | | 16,924 | |
5.05%, 11/15/2044 | | | 19,000 | | | | 18,044 | |
| | |
| See Notes to Financial Statements. | | |
36 | | www.redmontfunds.com |
| | |
| Redmont Resolute Fund II | | Schedule of Investments |
| | April 30, 2016 |
| | | | | | | | |
| Description | | Principal Amount | | | Value (Note 2) | |
| |
OIL & GAS (0.11%) (continued) | | | | | | | | |
Oasis Petroleum, Inc. | | | | | | | | |
6.88%, 03/15/2022 | | | $ 30,000 | | | | $ 26,925 | |
Occidental Petroleum Corp. | | | | | | | | |
4.40%, 04/15/2046 | | | 14,000 | | | | 14,923 | |
PBF Holding Co. LLC / PBF Finance Corp. | | | | | | | | |
7.00%, 11/15/2023(d) | | | 25,000 | | | | 24,406 | |
Petroleos Mexicanos | | | | | | | | |
5.50%, 06/27/2044 | | | 12,000 | | | | 10,620 | |
Sanchez Energy Corp. | | | | | | | | |
6.13%, 01/15/2023 | | | 30,000 | | | | 22,575 | |
Shell International Finance BV | | | | | | | | |
1.25%, 11/10/2017 | | | 17,000 | | | | 17,024 | |
2.13%, 05/11/2020 | | | 19,000 | | | | 19,265 | |
2.25%, 11/10/2020 | | | 21,000 | | | | 21,353 | |
SM Energy Co. | | | | | | | | |
5.63%, 06/01/2025 | | | 5,000 | | | | 4,225 | |
WPX Energy, Inc. | | | | | | | | |
7.50%, 08/01/2020 | | | 25,000 | | | | 23,937 | |
| | | | | | | | |
| | | | | | | 738,075 | |
| | | | | | | | |
| | |
OIL & GAS SERVICES (0.00%)(c) | | | | | | | | |
Bristow Group, Inc. | | | | | | | | |
6.25%, 10/15/2022 | | | 25,000 | | | | 20,625 | |
| | | | | | | | |
| | |
PACKAGING & CONTAINERS (0.02%) | | | | | | | | |
Berry Plastics Corp. | | | | | | | | |
5.13%, 07/15/2023 | | | 45,000 | | | | 45,562 | |
Novelis, Inc. | | | | | | | | |
8.75%, 12/15/2020 | | | 25,000 | | | | 25,938 | |
Owens - Brockway Glass Container, Inc. | | | | | | | | |
5.38%, 01/15/2025(d) | | | 44,000 | | | | 45,210 | |
| | | | | | | | |
| | | | | | | 116,710 | |
| | | | | | | | |
| | |
PHARMACEUTICALS (0.02%) | | | | | | | | |
Baxalta, Inc. | | | | | | | | |
3.60%, 06/23/2022(d) | | | 19,000 | | | | 19,540 | |
Endo Finance LLC / Endo Finco, Inc. | | | | | | | | |
7.75%, 01/15/2022(d) | | | 5,000 | | | | 5,175 | |
Express Scripts Holding Co. | | | | | | | | |
4.50%, 02/25/2026 | | | 17,000 | | | | 18,271 | |
Forest Laboratories LLC | | | | | | | | |
4.88%, 02/15/2021(d) | | | 43,000 | | | | 47,057 | |
Valeant Pharmaceuticals International, Inc. | | | | | | | | |
5.38%, 03/15/2020(d) | | | 31,000 | | | | 27,609 | |
| | | | | | | | |
| | | | | | | 117,652 | |
| | | | | | | | |
| | |
PIPELINES (0.04%) | | | | | | | | |
Columbia Pipeline Group, Inc. | | | | | | | | |
2.45%, 06/01/2018(d) | | | 8,000 | | | | 7,995 | |
Energy Transfer Equity LP | | | | | | | | |
7.50%, 10/15/2020 | | | 30,000 | | | | 30,375 | |
| | |
| See Notes to Financial Statements. | | |
Annual Report | April 30, 2016 | | 37 |
| | |
| Redmont Resolute Fund II | | Schedule of Investments |
| | April 30, 2016 |
| | | | | | | | |
| Description | | Principal Amount | | | Value (Note 2) | |
| |
PIPELINES (0.04%) (continued) | | | | | | | | |
Energy Transfer Partners LP | | | | | | | | |
4.90%, 03/15/2035 | | | $ 13,000 | | | | $ 11,204 | |
5.15%, 03/15/2045 | | | 13,000 | | | | 11,092 | |
Enterprise Products Operating LLC | | | | | | | | |
3.95%, 02/15/2027 | | | 11,000 | | | | 11,407 | |
Genesis Energy LP | | | | | | | | |
5.63%, 06/15/2024 | | | 40,000 | | | | 36,400 | |
Kinder Morgan Energy Partners LP | | | | | | | | |
6.50%, 04/01/2020 | | | 45,000 | | | | 48,972 | |
Kinder Morgan, Inc. | | | | | | | | |
5.00%, 02/15/2021(d) | | | 11,000 | | | | 11,401 | |
Rose Rock Midstream LP / Rose Rock Finance Corp. | | | | | | | | |
5.63%, 07/15/2022 | | | 30,000 | | | | 24,750 | |
Tesoro Logistics LP | | | | | | | | |
6.13%, 10/15/2021 | | | 70,000 | | | | 71,925 | |
TransCanada Trust | | | | | | | | |
5.63%, 05/20/2075(g) | | | 15,000 | | | | 13,500 | |
| | | | | | | | |
| | | | | | | 279,021 | |
| | | | | | | | |
| | |
REAL ESTATE (0.01%) | | | | | | | | |
Greystar Real Estate Partners LLC | | | | | | | | |
8.25%, 12/01/2022(d) | | | 25,000 | | | | 26,125 | |
Kennedy-Wilson, Inc. | | | | | | | | |
5.88%, 04/01/2024 | | | 40,000 | | | | 39,250 | |
| | | | | | | | |
| | | | | | | 65,375 | |
| | | | | | | | |
| | |
REAL ESTATE INVESTMENT TRUSTS (0.04%) | | | | | | | | |
Communications Sales & Leasing, Inc./CSC Capital LLC | | | | | | | | |
6.00%, 04/15/2023(d) | | | 50,000 | | | | 49,875 | |
CTR Partnership LP/CareTrust Capital LLC | | | | | | | | |
5.88%, 06/01/2021 | | | 39,000 | | | | 39,487 | |
DuPont Fabros Technology LP | | | | | | | | |
5.63%, 06/15/2023 | | | 45,000 | | | | 46,575 | |
ESH Hospitality, Inc. | | | | | | | | |
5.25%, 05/01/2025(d) | | | 45,000 | | | | 44,606 | |
Essex Portfolio LP | | | | | | | | |
3.38%, 04/15/2026 | | | 7,000 | | | | 7,075 | |
iStar, Inc. | | | | | | | | |
6.50%, 07/01/2021 | | | 35,000 | | | | 34,562 | |
Omega Healthcare Investors, Inc. | | | | | | | | |
4.50%, 04/01/2027 | | | 43,000 | | | | 41,387 | |
4.95%, 04/01/2024 | | | 27,000 | | | | 27,672 | |
5.25%, 01/15/2026 | | | 16,000 | | | | 16,391 | |
| | | | | | | | |
| | | | | | | 307,630 | |
| | | | | | | | |
| | |
RETAIL (0.04%) | | | | | | | | |
Conn’s, Inc. | | | | | | | | |
7.25%, 07/15/2022 | | | 70,000 | | | | 54,775 | |
Costco Wholesale Corp. | | | | | | | | |
2.25%, 02/15/2022 | | | 21,000 | | | | 21,348 | |
CVS Pass-Through Trust | | | | | | | | |
5.93%, 01/10/2034(d) | | | 33,040 | | | | 36,753 | |
| | |
| See Notes to Financial Statements. | | |
| 38 | | www.redmontfunds.com |
| | |
| Redmont Resolute Fund II | | Schedule of Investments |
| | April 30, 2016 |
| | | | | | | | |
| Description | | Principal Amount | | | Value (Note 2) | |
| |
RETAIL (0.04%) (continued) | | | | | | | | |
Dollar General Corp. | | | | | | | | |
4.13%, 07/15/2017 | | | $ 37,000 | | | | $ 38,170 | |
GameStop Corp. | | | | | | | | |
5.50%, 10/01/2019(d) | | | 40,000 | | | | 39,250 | |
Kohls Corp. | | | | | | | | |
5.55%, 07/17/2045 | | | 9,000 | | | | 8,117 | |
McDonald’s Corp. | | | | | | | | |
3.70%, 01/30/2026 | | | 11,000 | | | | 11,783 | |
4.70%, 12/09/2035 | | | 14,000 | | | | 15,290 | |
4.88%, 12/09/2045 | | | 11,000 | | | | 12,474 | |
O’Reilly Automotive, Inc. | | | | | | | | |
3.55%, 03/15/2026 | | | 6,000 | | | | 6,258 | |
PF Chang’s China Bistro, Inc. | | | | | | | | |
10.25%, 06/30/2020(d) | | | 50,000 | | | | 46,000 | |
The Home Depot, Inc. | | | | | | | | |
2.00%, 04/01/2021 | | | 10,000 | | | | 10,121 | |
| | | | | | | | |
| | | | | | | 300,339 | |
| | | | | | | | |
| | |
SAVINGS & LOANS (0.03%) | | | | | | | | |
First Niagara Financial Group, Inc. | | | | | | | | |
6.75%, 03/19/2020 | | | 146,000 | | | | 164,797 | |
7.25%, 12/15/2021 | | | 37,000 | | | | 42,898 | |
| | | | | | | | |
| | | | | | | 207,695 | |
| | | | | | | | |
| | |
SEMICONDUCTORS (0.01%) | | | | | | | | |
Intel Corp. | | | | | | | | |
1.35%, 12/15/2017 | | | 39,000 | | | | 39,272 | |
Micron Technology, Inc. | | | | | | | | |
5.63%, 01/15/2026(d) | | | 12,000 | | | | 9,600 | |
7.50%, 09/15/2023(d) | | | 40,000 | | | | 41,500 | |
| | | | | | | | |
| | | | | | | 90,372 | |
| | | | | | | | |
| | |
SOFTWARE (0.03%) | | | | | | | | |
Blackboard, Inc. | | | | | | | | |
7.75%, 11/15/2019(d) | | | 42,000 | | | | 33,810 | |
Fidelity National Information Services, Inc. | | | | | | | | |
5.00%, 10/15/2025 | | | 13,000 | | | | 13,193 | |
First Data Corp. | | | | | | | | |
5.38%, 08/15/2023(d) | | | 20,000 | | | | 20,750 | |
Microsoft Corp. | | | | | | | | |
1.30%, 11/03/2018 | | | 17,000 | | | | 17,145 | |
Oracle Corp. | | | | | | | | |
2.80%, 07/08/2021 | | | 34,000 | | | | 35,647 | |
3.90%, 05/15/2035 | | | 5,000 | | | | 5,100 | |
Rackspace Hosting, Inc. | | | | | | | | |
6.50%, 01/15/2024(d) | | | 50,000 | | | | 49,687 | |
| | | | | | | | |
| | | | | | | 175,332 | |
| | | | | | | | |
| | |
| See Notes to Financial Statements. | | |
Annual Report | April 30, 2016 | | 39 |
| | |
| Redmont Resolute Fund II | | Schedule of Investments |
| | April 30, 2016 |
| | | | | | | | | | |
| Description | | | | Principal Amount | | | Value (Note 2) | |
| |
TELECOMMUNICATIONS (0.10%) | | | | | | | | | | |
AT&T, Inc. | | | | | | | | | | |
4.35%, 06/15/2045 | | | | $ | 28,000 | | | $ | 26,587 | |
4.50%, 05/15/2035 | | | | | 29,000 | | | | 29,302 | |
4.75%, 05/15/2046 | | | | | 16,000 | | | | 16,177 | |
5.80%, 02/15/2019 | | | | | 8,000 | | | | 8,892 | |
CenturyLink, Inc. | | | | | | | | | | |
5.63%, 04/01/2025 | | | | | 50,000 | | | | 45,599 | |
CISCO Systems, Inc. | | | | | | | | | | |
1.40%, 02/28/2018 | | | | | 24,000 | | | | 24,185 | |
2.13%, 03/01/2019 | | | | | 44,000 | | | | 45,149 | |
2.20%, 02/28/2021 | | | | | 21,000 | | | | 21,456 | |
Frontier Communications Corp. | | | | | | | | | | |
11.00%, 09/15/2025(d) | | | | | 70,000 | | | | 70,963 | |
Intelsat Jackson Holdings SA | | | | | | | | | | |
7.25%, 04/01/2019 | | | | | 60,000 | | | | 49,425 | |
Plantronics, Inc. | | | | | | | | | | |
5.50%, 05/31/2023(d) | | | | | 20,000 | | | | 20,100 | |
Sprint Communications, Inc. | | | | | | | | | | |
7.00%, 03/01/2020(d) | | | | | 40,000 | | | | 41,250 | |
Sprint Corp. | | | | | | | | | | |
7.25%, 09/15/2021 | | | | | 117,000 | | | | 95,063 | |
T-Mobile USA, Inc. | | | | | | | | | | |
6.50%, 01/15/2026 | | | | | 45,000 | | | | 47,869 | |
Verizon Communications, Inc. | | | | | | | | | | |
4.40%, 11/01/2034 | | | | | 8,000 | | | | 8,175 | |
4.52%, 09/15/2048 | | | | | 48,000 | | | | 48,984 | |
4.67%, 03/15/2055 | | | | | 27,000 | | | | 26,295 | |
4.86%, 08/21/2046 | | | | | 30,000 | | | | 32,242 | |
6.40%, 09/15/2033 | | | | | 5,000 | | | | 6,283 | |
| | | | | | | | | | |
| | | | | | | | | 663,996 | |
| | | | | | | | | | |
| | | |
TRANSPORTATION (0.00%)(c) | | | | | | | | | | |
Canadian Pacific Railway Co. | | | | | | | | | | |
6.13%, 09/15/2115 | | | | | 11,000 | | | | 13,001 | |
Union Pacific Corp. | | | | | | | | | | |
4.38%, 11/15/2065 | | | | | 15,000 | | | | 15,458 | |
| | | | | | | | | | |
| | | | | | | | | 28,459 | |
| | | | | | | | | | |
| | | |
TRUCKING & LEASING (0.00%)(c) | | | | | | | | | | |
Penske Truck Leasing Co. LP / PTL Finance Corp. | | | | | | | | | | |
3.38%, 02/01/2022(d) | | | | | 13,000 | | | | 13,091 | |
| | | | | | | | | | |
| | | |
TOTAL CORPORATE BONDS (Cost $12,521,343) | | | | | | | | | 12,678,931 | |
| |
| | | |
| Description | | Currency | | Principal Amount | | | Value (Note 2) | |
| |
FOREIGN GOVERNMENT BONDS (0.47%) | | | | | | | | | | |
Austria Government Bond | | | | | | | | | | |
3.15%, 06/20/2044(d) | | EUR | | | 6,000 | | | | 9,639 | |
| | |
| See Notes to Financial Statements. | | |
40 | | www.redmontfunds.com |
| | |
| Redmont Resolute Fund II | | Schedule of Investments |
| | April 30, 2016 |
| | | | | | | | | | |
| | | |
| Description | | Currency | | Principal Amount | | | Value (Note 2) | |
| |
Belgium Government Bond | | | | | | | | | | |
0.80%, 06/22/2025(d) | | EUR | | | 20,000 | | | $ | 23,451 | |
3.75%, 06/22/2045 | | EUR | | | 50,000 | | | | 84,656 | |
4.00%, 03/28/2032 | | EUR | | | 19,000 | | | | 30,658 | |
4.25%, 03/28/2041(d) | | EUR | | | 25,000 | | | | 44,626 | |
4.50%, 03/28/2026(d) | | EUR | | | 7,000 | | | | 11,049 | |
5.00%, 03/28/2035(d) | | EUR | | | 19,000 | | | | 35,104 | |
5.50%, 03/28/2028 | | EUR | | | 18,000 | | | | 31,471 | |
Bundesrepublik Deutschland | | | | | | | | | | |
1.00%, 08/15/2025 | | EUR | | | 18,000 | | | | 22,098 | |
4.75%, 07/04/2040 | | EUR | | | 10,000 | | | | 20,928 | |
Buoni Poliennali | | | | | | | | | | |
3.75%, 09/01/2024 | | EUR | | | 14,000 | | | | 19,112 | |
Buoni Poliennali Del | | | | | | | | | | |
9.00%, 11/01/2023 | | EUR | | | 18,000 | | | | 32,274 | |
France Government Bond OAT | | | | | | | | | | |
4.00%, 10/25/2038 | | EUR | | | 12,000 | | | | 20,407 | |
4.50%, 04/25/2041 | | EUR | | | 33,000 | | | | 61,227 | |
5.75%, 10/25/2032 | | EUR | | | 10,000 | | | | 19,383 | |
Ireland Government Bond | | | | | | | | | | |
2.00%, 02/18/2045 | | EUR | | | 10,000 | | | | 11,611 | |
5.40%, 03/13/2025 | | EUR | | | 19,000 | | | | 30,125 | |
Italy Buoni Poliennali Del Tesoro | | | | | | | | | | |
5.00%, 09/01/2040 | | EUR | | | 7,000 | | | | 11,615 | |
6.50%, 11/01/2027 | | EUR | | | 29,000 | | | | 49,538 | |
Japan Government Five Year Bond | | | | | | | | | | |
0.20%, 12/20/2017 | | JPY | | | 12,300,000 | | | | 116,463 | |
Japan Government Ten Year Bond | | | | | | | | | | |
1.70%, 09/20/2017 | | JPY | | | 12,000,000 | | | | 115,848 | |
Japan Government Thirty Year Bond | | | | | | | | | | |
2.50%, 09/20/2035 | | JPY | | | 4,700,000 | | | | 62,771 | |
Japan Government Twenty Year Bond | | | | | | | | | | |
1.20%, 09/20/2035 | | JPY | | | 2,100,000 | | | | 23,202 | |
Japan Government Two Year Bond | | | | | | | | | | |
0.10%, 06/15/2017 | | JPY | | | 12,200,000 | | | | 115,129 | |
0.10%, 07/15/2017 | | JPY | | | 12,200,000 | | | | 115,162 | |
0.10%, 08/15/2017 | | JPY | | | 11,100,000 | | | | 104,812 | |
0.10%, 09/15/2017 | | JPY | | | 9,700,000 | | | | 91,626 | |
0.10%, 11/15/2017 | | JPY | | | 12,400,000 | | | | 117,202 | |
0.10%, 01/15/2018 | | JPY | | | 12,400,000 | | | | 117,250 | |
Mexico Government International Bond | | | | | | | | | | |
3.50%, 01/21/2021 | | USD | | | 230,000 | | | | 238,625 | |
4.13%, 01/21/2026 | | USD | | | 230,000 | | | | 242,075 | |
4.75%, 03/08/2044 | | USD | | | 57,000 | | | | 57,712 | |
Panama Government International Bond | | | | | | | | | | |
5.20%, 01/30/2020 | | USD | | | 220,000 | | | | 243,100 | |
Poland Government International Bond | | | | | | | | | | |
3.00%, 03/17/2023 | | USD | | | 240,000 | | | | 242,407 | |
3.25%, 04/06/2026 | | USD | | | 250,000 | | | | 250,325 | |
Province of Quebec Canada | | | | | | | | | | |
2.50%, 04/20/2026 | | USD | | | 66,000 | | | | 65,965 | |
| | |
| See Notes to Financial Statements. | | |
Annual Report | April 30, 2016 | | 41 |
| | |
| Redmont Resolute Fund II | | Schedule of Investments |
| | April 30, 2016 |
| | | | | | | | | | |
| | | |
| Description | | Currency | | Principal Amount | | | Value (Note 2) | |
| |
Spain Government Bond | | | | | | | | | | |
4.90%, 07/30/2040(d) | | EUR | | | 12,000 | | | $ | 19,285 | |
5.15%, 10/31/2044(d) | | EUR | | | 15,000 | | | | 25,318 | |
6.00%, 01/31/2029 | | EUR | | | 28,000 | | | | 46,876 | |
Sweden Government Bond | | | | | | | | | | |
1.00%, 11/12/2026 | | SEK | | | 570,000 | | | | 71,905 | |
United Kingdom Gilt | | | | | | | | | | |
2.25%, 09/07/2023 | | GBP | | | 25,000 | | | | 38,821 | |
2.75%, 09/07/2024 | | GBP | | | 8,000 | | | | 12,830 | |
4.25%, 03/07/2036 | | GBP | | | 32,000 | | | | 61,439 | |
4.50%, 09/07/2034 | | GBP | | | 20,000 | | | | 39,284 | |
4.50%, 12/07/2042 | | GBP | | | 15,000 | | | | 31,117 | |
| | | | | | | | | | |
| | | | | | | | | 3,235,521 | |
| | | | | | | | | | |
| | | |
TOTAL FOREIGN GOVERNMENT BONDS (Cost $3,094,676) | | | | | | | | | 3,235,521 | |
| |
| | | |
GOVERNMENT BONDS (0.21%) | | | | | | | | | | |
Tennessee Valley Authority | | | | | | | | | | |
1.75%, 10/15/2018 | | | | $ | 21,000 | | | | 21,413 | |
| | | | | | | | | | |
| | | |
U.S. Treasury Bonds | | | | | | | | | | |
1.63%, 02/15/2026 | | | | | 83,000 | | | | 81,512 | |
2.50%, 02/15/2045 | | | | | 14,000 | | | | 13,521 | |
3.00%, 11/15/2045 | | | | | 88,000 | | | | 94,105 | |
3.13%, 11/15/2041 | | | | | 47,000 | | | | 51,855 | |
3.13%, 08/15/2044 | | | | | 14,000 | | | | 15,353 | |
4.50%, 02/15/2036 | | | | | 29,000 | | | | 39,454 | |
5.25%, 11/15/2028 | | | | | 38,000 | | | | 51,716 | |
| | | | | | | | | | |
| | | | | | | | | 347,516 | |
| | | | | | | | | | |
| | | |
U.S. Treasury Inflation Indexed Notes | | | | | | | | | | |
0.13%, 04/15/2018 | | | | | 89,238 | | | | 90,752 | |
| | | | | | | | | | |
| | |
| See Notes to Financial Statements. | | |
42 | | www.redmontfunds.com |
| | |
| Redmont Resolute Fund II | | Schedule of Investments |
| | April 30, 2016 |
| | | | | | | | | | |
| | | |
| Description | | Currency | | Principal Amount | | | Value (Note 2) | |
| |
U.S. Treasury Notes | | | | | | | | | | |
0.50%, 06/30/2016 | | | | $ | 96,000 | | | $ | 96,038 | |
0.50%, 01/31/2017 | | | | | 150,000 | | | | 149,985 | |
1.38%, 03/31/2020 | | | | | 25,000 | | | | 25,228 | |
1.38%, 04/30/2020 | | | | | 20,000 | | | | 20,173 | |
1.38%, 09/30/2020 | | | | | 76,000 | | | | 76,479 | |
1.50%, 01/31/2022 | | | | | 10,000 | | | | 10,032 | |
1.50%, 02/28/2023 | | | | | 75,000 | | | | 74,534 | |
1.75%, 12/31/2020 | | | | | 48,000 | | | | 49,058 | |
1.75%, 02/28/2022 | | | | | 78,000 | | | | 79,266 | |
1.75%, 03/31/2022 | | | | | 54,000 | | | | 54,848 | |
1.75%, 04/30/2022 | | | | | 10,000 | | | | 10,152 | |
1.88%, 11/30/2021 | | | | | 10,000 | | | | 10,252 | |
1.88%, 05/31/2022 | | | | | 26,000 | | | | 26,580 | |
1.88%, 08/31/2022 | | | | | 48,000 | | | | 48,997 | |
2.00%, 08/31/2021 | | | | | 63,000 | | | | 65,036 | |
2.00%, 10/31/2021 | | | | | 59,000 | | | | 60,866 | |
2.00%, 07/31/2022 | | | | | 6,000 | | | | 6,171 | |
2.13%, 12/31/2021 | | | | | 43,000 | | | | 44,638 | |
2.13%, 05/15/2025 | | | | | 49,000 | | | | 50,382 | |
2.25%, 11/15/2024 | | | | | 18,000 | | | | 18,718 | |
| | | | | | | | | | |
| | | | | | | | | 977,433 | |
| | | | | | | | | | |
| | | |
TOTAL GOVERNMENT BONDS (Cost $1,410,866) | | | | | | | | | 1,437,114 | |
| |
| | | |
| Description | | | | Principal Amount/
Shares | | | Value (Note 2) | |
| |
SHORT TERM INVESTMENTS (7.18%) | | | | | | | | | | |
MONEY MARKET FUNDS (6.72%) | | | | | | | | | | |
Dreyfus Treasury Cash Management Fund, Institutional Class, 7-day yield, 0.162% | | | | | 46,122,189 | | | | 46,122,189 | |
| | | | | | | | | | |
| | | |
U.S. TREASURY BILLS (0.46%) | | | | | | | | | | |
0.577%, 03/30/2017(b)(h) | | | | | 3,185,000 | | | | 3,170,582 | |
| | | | | | | | | | |
| | | |
TOTAL SHORT TERM INVESTMENTS (Cost $49,290,249) | | | | | | | | | 49,292,771 | |
| |
| | | |
TOTAL INVESTMENTS (88.20%) (Cost $597,135,038) | | | | | | | | $ | 605,632,636 | |
| | | |
SEGREGATED CASH WITH BROKERS (16.81%)(i) | | | | | | | | | 115,404,100 | |
| | | |
SECURITIES SOLD SHORT (-4.53%) (Proceeds $29,740,232) | | | | | | | | | (31,093,639) | |
| | | |
LIABILITIES IN EXCESS OF OTHER ASSETS (-0.48%) | | | | | | | | | (3,284,221) | |
| |
NET ASSETS (100.00%) | | | | | | | | $ | 686,658,876 | |
| |
| | |
| See Notes to Financial Statements. | | |
Annual Report | April 30, 2016 | | 43 |
| | |
| Redmont Resolute Fund II | | Schedule of Investments |
| | April 30, 2016 |
SCHEDULE OF SECURITIES SOLD SHORT
| | | | | | | | |
| Description | | Shares | | | Value (Note 2) | |
| |
COMMON STOCKS (-4.53%) | | | | | | | | |
APPAREL (-0.06%) | | | | | | | | |
Gildan Activewear, Inc. | | | (6,077) | | | $ | (188,752) | |
Under Armour, Inc., Class A | | | (2,738) | | | | (120,308) | |
Under Armour, Inc., Class C | | | (2,738) | | | | (111,710) | |
| | | | | | | | |
| | | | | | | (420,770) | |
| | | | | | | | |
AUTO MANUFACTURERS (-0.07%) | | | | | | | | |
Ferrari NV | | | (4,769) | | | | (218,659) | |
Tesla Motors, Inc. | | | (1,216) | | | | (292,764) | |
| | | | | | | | |
| | | | | | | (511,423) | |
| | | | | | | | |
AUTO PARTS & EQUIPMENT (-0.06%) | | | | | | | | |
Autoliv, Inc. | | | (2,433) | | | | (297,970) | |
Dorman Products, Inc. | | | (2,009) | | | | (108,064) | |
| | | | | | | | |
| | | | | | | (406,034) | |
| | | | | | | | |
BANKS (-0.42%) | | | | | | | | |
BancorpSouth, Inc. | | | (5,389) | | | | (126,588) | |
Bank of Hawaii Corp. | | | (1,749) | | | | (119,649) | |
BOK Financial Corp. | | | (1,866) | | | | (112,296) | |
Community Bank System, Inc. | | | (5,020) | | | | (198,641) | |
Cullen/Frost Bankers, Inc. | | | (2,546) | | | | (162,919) | |
CVB Financial Corp. | | | (12,712) | | | | (218,392) | |
First Financial Bankshares, Inc. | | | (6,692) | | | | (216,687) | |
Glacier Bancorp, Inc. | | | (6,947) | | | | (179,858) | |
HDFC Bank, Ltd., ADR | | | (1,451) | | | | (91,224) | |
Home BancShares, Inc. | | | (1,502) | | | | (64,571) | |
IBERIABANK Corp. | | | (2,096) | | | | (123,643) | |
MB Financial, Inc. | | | (2,653) | | | | (92,218) | |
Prosperity Bancshares, Inc. | | | (2,267) | | | | (119,630) | |
Texas Capital Bancshares, Inc. | | | (2,592) | | | | (118,766) | |
Trustmark Corp. | | | (6,285) | | | | (154,045) | |
UMB Financial Corp. | | | (2,611) | | | | (145,563) | |
United Bankshares, Inc. | | | (7,207) | | | | (278,839) | |
Valley National Bancorp | | | (15,463) | | | | (146,280) | |
Westamerica Bancorporation | | | (5,045) | | | | (245,792) | |
| | | | | | | | |
| | | | | | | (2,915,601) | |
| | | | | | | | |
BEVERAGES (-0.04%) | | | | | | | | |
Monster Beverage Corp. | | | (1,765) | | | | (254,548) | |
| | | | | | | | |
| | |
BIOTECHNOLOGY (-0.02%) | | | | | | | | |
Illumina, Inc. | | | (856) | | | | (115,551) | |
| | | | | | | | |
| | |
BUILDING MATERIALS (-0.04%) | | | | | | | | |
Fortune Brands Home & Security, Inc. | | | (2,673) | | | | (148,111) | |
Trex Co., Inc. | | | (3,274) | | | | (155,351) | |
| | | | | | | | |
| | | | | | | (303,462) | |
| | | | | | | | |
CHEMICALS (-0.15%) | | | | | | | | |
Axalta Coating Systems, Ltd. | | | (6,817) | | | | (194,080) | |
Balchem Corp. | | | (2,101) | | | | (128,917) | |
FMC Corp. | | | (5,007) | | | | (216,603) | |
International Flavors & Fragrances, Inc. | | | (1,771) | | | | (211,581) | |
NewMarket Corp. | | | (700) | | | | (284,242) | |
| | | | | | | | |
| | | | | | | (1,035,423) | |
| | | | | | | | |
| | |
| See Notes to Financial Statements. | | |
44 | | www.redmontfunds.com |
| | |
| Redmont Resolute Fund II | | Schedule of Investments |
| | April 30, 2016 |
| | | | | | | | |
| Description | | Shares | | | Value (Note 2) | |
| |
COMMERCIAL SERVICES (-0.22%) | | | | | | | | |
Aramark | | | (8,649) | | | $ | (289,828) | |
Cimpress NV | | | (2,742) | | | | (240,939) | |
CoStar Group, Inc. | | | (754) | | | | (148,772) | |
Monro Muffler Brake, Inc. | | | (4,578) | | | | (316,889) | |
Nord Anglia Education, Inc. | | | (6,908) | | | | (146,657) | |
Rollins, Inc. | | | (5,695) | | | | (153,025) | |
Verisk Analytics, Inc. | | | (2,640) | | | | (204,811) | |
| | | | | | | | |
| | | | | | | (1,500,921) | |
| | | | | | | | |
COMPUTERS (-0.11%) | | | | | | | | |
Electronics for Imaging, Inc. | | | (5,470) | | | | (217,925) | |
Unisys Corp. | | | (13,099) | | | | (100,993) | |
Wipro, Ltd., ADR | | | (33,445) | | | | (406,357) | |
| | | | | | | | |
| | | | | | | (725,275) | |
| | | | | | | | |
COSMETICS & PERSONAL CARE (-0.04%) | | | | | | | | |
Colgate-Palmolive Co. | | | (3,459) | | | | (245,312) | |
| | | | | | | | |
| | |
DISTRIBUTION & WHOLESALE (-0.03%) | | | | | | | | |
WW Grainger, Inc. | | | (934) | | | | (219,042) | |
| | | | | | | | |
| | |
DIVERSIFIED FINANCIAL SERVICES (-0.08%) | | | | | | | | |
Credit Acceptance Corp. | | | (269) | | | | (52,797) | |
Eaton Vance Corp. | | | (6,928) | | | | (239,224) | |
Financial Engines, Inc. | | | (4,659) | | | | (150,066) | |
WisdomTree Investments, Inc. | | | (11,684) | | | | (127,239) | |
| | | | | | | | |
| | | | | | | (569,326) | |
| | | | | | | | |
ELECTRIC (-0.04%) | | | | | | | | |
Ormat Technologies, Inc. | | | (5,723) | | | | (248,378) | |
| | | | | | | | |
| | |
ELECTRONICS (-0.13%) | | | | | | | | |
Itron, Inc. | | | (11,216) | | | | (461,202) | |
National Instruments Corp. | | | (14,778) | | | | (407,429) | |
| | | | | | | | |
| | | | | | | (868,631) | |
| | | | | | | | |
FOOD (-0.22%) | | | | | | | | |
B&G Foods, Inc. | | | (6,924) | | | | (285,338) | |
Campbell Soup Co. | | | (3,720) | | | | (229,561) | |
McCormick & Co., Inc. | | | (2,090) | | | | (196,000) | |
The Kroger Co. | | | (5,080) | | | | (179,781) | |
The WhiteWave Foods Co. | | | (5,950) | | | | (239,250) | |
TreeHouse Foods, Inc. | | | (2,521) | | | | (222,857) | |
Whole Foods Market, Inc. | | | (6,414) | | | | (186,519) | |
| | | | | | | | |
| | | | | | | (1,539,306) | |
| | | | | | | | |
HAND & MACHINE TOOLS (-0.01%) | | | | | | | | |
Franklin Electric Co., Inc. | | | (1,485) | | | | (46,911) | |
| | | | | | | | |
| | |
HEALTHCARE - PRODUCTS (-0.21%) | | | | | | | | |
Edwards Lifesciences Corp. | | | (1,469) | | | | (156,022) | |
Henry Schein, Inc. | | | (1,135) | | | | (191,475) | |
IDEXX Laboratories, Inc. | | | (3,011) | | | | (253,978) | |
Intuitive Surgical, Inc. | | | (307) | | | | (192,293) | |
Nevro Corp. | | | (1,889) | | | | (127,035) | |
The Cooper Cos, Inc. | | | (1,084) | | | | (165,939) | |
West Pharmaceutical Services, Inc. | | | (3,525) | | | | (250,980) | |
| | |
| See Notes to Financial Statements. | | |
Annual Report | April 30, 2016 | | 45 |
| | |
| Redmont Resolute Fund II | | Schedule of Investments |
| | April 30, 2016 |
| | | | | | | | |
| Description | | Shares | | | Value (Note 2) | |
| |
HEALTHCARE - PRODUCTS (-0.21%) (continued) | | | | | | | | |
Wright Medical Group NV | | | (5,657) | | | $ | (106,238) | |
| | | | | | | | |
| | | | | | | (1,443,960) | |
| | | | | | | | |
HEALTHCARE - SERVICES (-0.03%) | | | | | | | | |
Brookdale Senior Living, Inc. | | | (10,074) | | | | (185,966) | |
| | | | | | | | |
| | |
HOME FURNISHINGS (-0.02%) | | | | | | | | |
Leggett & Platt, Inc. | | | (3,254) | | | | (160,390) | |
| | | | | | | | |
| | |
INSURANCE (-0.05%) | | | | | | | | |
Arch Capital Group, Ltd. | | | (2,610) | | | | (183,979) | |
Mercury General Corp. | | | (3,245) | | | | (171,660) | |
| | | | | | | | |
| | | | | | | (355,639) | |
| | | | | | | | |
INTERNET (-0.26%) | | | | | | | | |
58.com, Inc., ADR | | | (2,460) | | | | (134,439) | |
Amazon.com, Inc. | | | (404) | | | | (266,474) | |
Cogent Communications Holdings, Inc. | | | (6,941) | | | | (268,617) | |
F5 Networks, Inc. | | | (1,620) | | | | (169,695) | |
MercadoLibre, Inc. | | | (1,834) | | | | (229,048) | |
Netflix, Inc. | | | (2,221) | | | | (199,957) | |
Wayfair, Inc., Class A | | | (3,410) | | | | (128,727) | |
WebMD Health Corp. | | | (2,438) | | | | (152,960) | |
Zillow Group, Inc., Class A | | | (8,479) | | | | (212,145) | |
| | | | | | | | |
| | | | | | | (1,762,062) | |
| | | | | | | | |
IRON & STEEL (-0.03%) | | | | | | | | |
Vale SA, Sponsored ADR | | | (34,361) | | | | (194,827) | |
| | | | | | | | |
| | |
LEISURE TIME (-0.03%) | | | | | | | | |
Norwegian Cruise Line Holdings, Ltd. | | | (2,323) | | | | (113,572) | |
Qunar Cayman Islands, Ltd., ADR | | | (1,872) | | | | (76,396) | |
| | | | | | | | |
| | | | | | | (189,968) | |
| | | | | | | | |
MACHINERY - CONSTRUCTION & MINING (-0.03%) | | | | | | | | |
Caterpillar, Inc. | | | (2,773) | | | | (215,518) | |
| | | | | | | | |
| | |
MACHINERY - DIVERSIFIED (-0.15%) | | | | | | | | |
CNH Industrial NV | | | (16,784) | | | | (129,908) | |
Cognex Corp. | | | (7,283) | | | | (258,765) | |
Deere & Co. | | | (3,037) | | | | (255,442) | |
Flowserve Corp. | | | (4,511) | | | | (220,182) | |
Wabtec Corp. | | | (2,362) | | | | (195,881) | |
| | | | | | | | |
| | | | | | | (1,060,178) | |
| | | | | | | | |
MEDIA (-0.03%) | | | | | | | | |
FactSet Research Systems, Inc. | | | (1,171) | | | | (176,528) | |
| | | | | | | | |
| | |
METAL FABRICATE & HARDWARE (-0.02%) | | | | | | | | |
Sun Hydraulics Corp. | | | (3,410) | | | | (120,646) | |
| | | | | | | | |
| | |
MINING (-0.05%) | | | | | | | | |
Goldcorp, Inc. | | | (12,540) | | | | (252,681) | |
Teck Resources, Ltd., Class B | | | (6,550) | | | | (80,237) | |
| | | | | | | | |
| | | | | | | (332,918) | |
| | | | | | | | |
MISCELLANEOUS MANUFACTURING (-0.04%) | | | | | | | | |
Actuant Corp., Class A | | | (5,918) | | | | (158,070) | |
| | |
| See Notes to Financial Statements. | | |
46 | | www.redmontfunds.com |
| | |
| Redmont Resolute Fund II | | Schedule of Investments |
| | April 30, 2016 |
| | | | | | | | |
| Description | | Shares | | | Value (Note 2) | |
| |
MISCELLANEOUS MANUFACTURING (-0.04%) (continued) | | | | | | | | |
Aptargroup, Inc. | | | (1,877) | | | $ | (142,652) | |
| | | | | | | | |
| | | | | | | (300,722) | |
| | | | | | | | |
OIL & GAS (-0.25%) | | | | | | | | |
Cabot Oil & Gas Corp. | | | (9,720) | | | | (227,448) | |
Chevron Corp. | | | (3,780) | | | | (386,240) | |
Continental Resources, Inc. | | | (8,287) | | | | (308,774) | |
Helmerich & Payne, Inc. | | | (2,393) | | | | (158,225) | |
Hess Corp. | | | (4,141) | | | | (246,887) | |
Matador Resources Co. | | | (12,635) | | | | (272,284) | |
Transocean, Ltd. | | | (10,972) | | | | (121,570) | |
| | | | | | | | |
| | | | | | | (1,721,428) | |
| | | | | | | | |
OIL & GAS SERVICES (-0.07%) | | | | | | | | |
National Oilwell Varco, Inc. | | | (8,989) | | | | (323,964) | |
Weatherford International PLC | | | (20,578) | | | | (167,299) | |
| | | | | | | | |
| | | | | | | (491,263) | |
| | | | | | | | |
PACKAGING & CONTAINERS (-0.03%) | | | | | | | | |
Ball Corp. | | | (2,097) | | | | (149,684) | |
Bemis Co., Inc. | | | (1,770) | | | | (88,818) | |
| | | | | | | | |
| | | | | | | (238,502) | |
| | | | | | | | |
PHARMACEUTICALS (-0.05%) | | | | | | | | |
Akorn, Inc. | | | (3,140) | | | | (79,913) | |
Bristol-Myers Squibb Co. | | | (2,366) | | | | (170,778) | |
Dexcom, Inc. | | | (1,986) | | | | (127,858) | |
| | | | | | | | |
| | | | | | | (378,549) | |
| | | | | | | | |
PIPELINES (-0.07%) | | | | | | | | |
Kinder Morgan, Inc. | | | (15,667) | | | | (278,246) | |
Spectra Energy Corp. | | | (6,980) | | | | (218,264) | |
| | | | | | | | |
| | | | | | | (496,510) | |
| | | | | | | | |
REAL ESTATE INVESTMENT TRUSTS (-0.14%) | | | | | | | | |
Equinix, Inc. | | | (1,318) | | | | (435,401) | |
Iron Mountain, Inc. | | | (7,295) | | | | (266,486) | |
Realty Income Corp. | | | (3,863) | | | | (228,690) | |
| | | | | | | | |
| | | | | | | (930,577) | |
| | | | | | | | |
RETAIL (-0.45%) | | | | | | | | |
Bob Evans Farms, Inc. | | | (5,197) | | | | (236,671) | |
Buffalo Wild Wings, Inc. | | | (1,806) | | | | (241,390) | |
Casey’s General Stores, Inc. | | | (1,649) | | | | (184,688) | |
Chipotle Mexican Grill, Inc. | | | (381) | | | | (160,390) | |
Coach, Inc. | | | (4,747) | | | | (191,162) | |
Dollar Tree, Inc. | | | (3,568) | | | | (284,405) | |
Jack in the Box, Inc. | | | (3,306) | | | | (223,320) | |
lululemon athletica, Inc. | | | (4,198) | | | | (275,179) | |
Nordstrom, Inc. | | | (3,816) | | | | (195,112) | |
PriceSmart, Inc. | | | (3,241) | | | | (280,476) | |
Texas Roadhouse, Inc. | | | (10,168) | | | | (414,041) | |
The Cheesecake Factory, Inc. | | | (3,860) | | | | (196,899) | |
Tiffany & Co. | | | (2,903) | | | | (207,129) | |
| | | | | | | | |
| | | | | | | (3,090,862) | |
| | | | | | | | |
SAVINGS & LOANS (-0.03%) | | | | | | | | |
New York Community Bancorp, Inc. | | | (13,872) | | | | (208,496) | |
| | | | | | | | |
| | |
| See Notes to Financial Statements. | | |
Annual Report | April 30, 2016 | | 47 |
| | |
| Redmont Resolute Fund II | | Schedule of Investments |
| | April 30, 2016 |
| | | | | | | | |
| Description | | Shares | | | Value (Note 2) | |
| |
SEMICONDUCTORS (-0.03%) | | | | | | | | |
Cavium, Inc. | | | (4,437) | | | $ | (219,055) | |
| | | | | | | | |
| | |
SOFTWARE (-0.44%) | | | | | | | | |
2U, Inc. | | | (4,495) | | | | (125,995) | |
ACI Worldwide, Inc. | | | (7,826) | | | | (156,442) | |
Acxiom Corp. | | | (9,712) | | | | (213,373) | |
athenahealth, Inc. | | | (1,671) | | | | (222,744) | |
Blackbaud, Inc. | | | (5,274) | | | | (325,775) | |
Demandware, Inc. | | | (1,704) | | | | (78,520) | |
Guidewire Software, Inc. | | | (5,166) | | | | (294,307) | |
Medidata Solutions, Inc. | | | (7,152) | | | | (312,042) | |
NetSuite, Inc. | | | (4,548) | | | | (368,570) | |
Proofpoint, Inc. | | | (3,141) | | | | (182,995) | |
Synchronoss Technologies, Inc. | | | (4,342) | | | | (134,906) | |
Veeva Systems, Inc., Class A | | | (9,956) | | | | (273,889) | |
Workday, Inc., Class A | | | (4,145) | | | | (310,792) | |
| | | | | | | | |
| | | | | | | (3,000,350) | |
| | | | | | | | |
TELECOMMUNICATIONS (-0.22%) | | | | | | | | |
Arista Networks, Inc. | | | (3,016) | | | | (200,926) | |
CenturyLink, Inc. | | | (6,708) | | | | (207,613) | |
Finisar Corp. | | | (14,984) | | | | (246,637) | |
Frontier Communications Corp. | | | (38,612) | | | | (214,683) | |
Sprint Corp. | | | (74,001) | | | | (253,823) | |
Telefonica SA, Sponsored ADR | | | (20,455) | | | | (223,164) | |
ViaSat, Inc. | | | (2,035) | | | | (156,084) | |
| | | | | | | | |
| | | | | | | (1,502,930) | |
| | | | | | | | |
TRANSPORTATION (-0.06%) | | | | | | | | |
Heartland Express, Inc. | | | (8,569) | | | | (155,185) | |
JB Hunt Transport Services, Inc. | | | (1,469) | | | | (121,751) | |
Old Dominion Freight Line, Inc. | | | (1,710) | | | | (112,945) | |
| | | | | | | | |
| | | | | | | (389,881) | |
| | | | | | | | |
| | |
TOTAL COMMON STOCKS (Proceeds $29,740,232) | | | | | | | (31,093,639) | |
| |
| | |
TOTAL SECURITIES SOLD SHORT (Proceeds $29,740,232) | | | | | | $ | (31,093,639) | |
| |
SCHEDULE OF WRITTEN OPTIONS
| | | | | | | | | | | | | | |
| Description | | Number of
Contracts | | Exercise Price | | | Maturity Date | | | Value (Note 2) | |
| |
WRITTEN OPTIONS | | | | | | | | | | | | | | |
Call Options | | | | | | | | | | | | | | |
Anadarko Petroleum Corp. | | (63) | | $ | 35.00 | | | | 05/20/2016 | | | $ | (109,620) | |
Diamondback Energy, Inc. | | (20) | | | 85.00 | | | | 06/17/2016 | | | | (11,200) | |
Diamondback Energy, Inc. | | (30) | | | 65.00 | | | | 06/17/2016 | | | | (64,950) | |
EOG Resources, Inc. | | (36) | | | 70.00 | | | | 07/15/2016 | | | | (49,680) | |
Exxon Mobil Corp. | | (55) | | | 75.00 | | | | 07/15/2016 | | | | (73,975) | |
Occidental Petroleum Corp. | | (46) | | | 70.00 | | | | 05/20/2016 | | | | (32,545) | |
| | |
| See Notes to Financial Statements. | | |
48 | | www.redmontfunds.com |
| | |
| Redmont Resolute Fund II | | Schedule of Investments |
| | April 30, 2016 |
| | | | | | | | | | | | | | |
| Description | | Number of
Contracts | | Exercise Price | | | Maturity Date | | | Value (Note 2) | |
| |
WRITTEN OPTIONS (continued) | | | | | | | | | | | | | | |
Call Options (continued) | | | | | | | | | | | | | | |
Phillips 66 | | (31) | | $ | 80.00 | | | | 05/20/2016 | | | $ | (10,850) | |
| | | | | | | | | | | | | | |
| | | |
TOTAL WRITTEN OPTIONS (Proceeds $135,671) | | | | | | | | | | $ | (352,820) | |
| | | | | | | | | | | | | | |
| (a) | Non-income producing security. |
| (b) | Security position either entirely or partially held in a segregated account as collateral for securities sold short, written options, and futures contracts. Aggregate total market value of $27,072,764. |
| (d) | Security exempt from registration under rule 144A of the securities act of 1933. This security may be resold in transactions exempt from registration, normally to qualified institutional buyers. At period end, the market value of those securities was $4,844,259, representing 0.71% of the Fund’s net assets. |
| (e) | Securities were purchased pursuant to Regulation S under the Securities Act of 1933, which exempts securities offered and sold outside the United States from registration. Such securities cannot be sold in the United States without either an effective registration statement filed pursuant to Securities Act of 1933, or pursuant to an exemption from registration. These securities have been deemed liquid under guidelines approved by the Fund’s Board of Trustees. At period end, the aggregate market value of those securities was $159,418, representing 0.02% of net assets. |
| (f) | This security has no contractual maturity date, is not redeemable and contractually pays an indefinite stream of interest. |
| (g) | The rate shown on floating or adjustable rate securities represents the coupon rate at period end. |
| (h) | Rate shown represents the bond equivalent yield to maturity at date of purchase. |
| (i) | Includes cash which is being held as collateral for securities sold short, written options, forward foreign currency contracts, and total return swap contracts. |
OUTSTANDING FORWARD FOREIGN CURRENCY CONTRACTS
| | | | | | | | | | | | | | | | | | | | | | | | | | | | |
| Counterparty | | Foreign
Currency | | | | Contracted
Amount** | | | | | Purchase/Sale
Contract | | | | Settlement
Date | | | | Current Value | | | | | Unrealized
Appreciation/
(Depreciation) | |
Morgan Stanley | | GBP | | | | | 36,800 | | | | | Purchase | | | | 05/05/2016 | | | | $ | 53,771 | | | | | $ | 1,213 | |
Morgan Stanley | | INR | | | | | 59,200,000 | | | | | Purchase | | | | 06/15/2016 | | | | | 884,283 | | | | | | 19,923 | |
Morgan Stanley | | JPY | | | | | 4,348,474 | | | | | Purchase | | | | 05/06/2016 | | | | | 40,875 | | | | | | 1,753 | |
| | | | | | | | | | | | | | | | | | | | | | | | | | | | |
| | | | | | | | | | | | | | | | | | | | | | | | | | $ | 22,889 | |
| | | | | | | | | | | | | | | | | | | | | | | | | | | | |
| | | | | | | | | | | |
Morgan Stanley | | CHF | | | | | 2,240,000 | | | | | Sale | | | | 06/15/2016 | | | | $ | 2,340,157 | | | | | $ | (53,126) | |
Morgan Stanley | | EUR | | | | | 536,000 | | | | | Sale | | | | 06/06/2016 | | | | | 614,504 | | | | | | (26,678) | |
Morgan Stanley | | EUR | | | | | 5,400,000 | | | | | Sale | | | | 06/15/2016 | | | | | 6,192,710 | | | | | | (160,487) | |
Morgan Stanley | | EUR | | | | | 69,400 | | | | | Sale | | | | 07/06/2016 | | | | | 79,637 | | | | | | (341) | |
Morgan Stanley | | GBP | | | | | 61,200 | | | | | Sale | | | | 05/05/2016 | | | | | 89,424 | | | | | | (1,067) | |
Morgan Stanley | | GBP | | | | | 103,900 | | | | | Sale | | | | 06/07/2016 | | | | | 151,833 | | | | | | (7,673) | |
Morgan Stanley | | GBP | | | | | 2,310,000 | | | | | Sale | | | | 06/15/2016 | | | | | 3,375,788 | | | | | | (56,697) | |
Morgan Stanley | | JPY | | | | | 49,813,474 | | | | | Sale | | | | 05/06/2016 | | | | | 468,237 | | | | | | (25,628) | |
Morgan Stanley | | JPY | | | | | 58,592,000 | | | | | Sale | | | | 06/06/2016 | | | | | 551,306 | | | | | | (35,122) | |
Morgan Stanley | | JPY | | | | | 1,140,000,000 | | | | | Sale | | | | 06/15/2016 | | | | | 10,729,428 | | | | | | (689,681) | |
Morgan Stanley | | SEK | | | | | 586,100 | | | | | Sale | | | | 07/06/2016 | | | | | 73,168 | | | | | | (788) | |
| | | | | | | | | | | | | | | | | | | | | | | | | | | | |
| | | | | | | | | | | | | | | | | | | | | | | | | | $ | (1,057,288) | |
| | | | | | | | | | | | | | | | | | | | | | | | | | | | |
| ** | The contracted amount is stated in the currency in which the contract is denominated. |
| | |
| See Notes to Financial Statements. | | |
Annual Report | April 30, 2016 | | 49 |
| | |
| Redmont Resolute Fund II | | Schedule of Investments |
| | April 30, 2016 |
FUTURES CONTRACTS
At April 30, 2016, the Fund had outstanding futures contracts:
| | | | | | | | | | | | | | | | | | | | | | | | | | |
| Description | | Position | | | | | | | | | | Contracts | | | | Expiration
Date | | | | Underlying Face
Amount at Value | | | Unrealized
Appreciation | |
| |
Commodity Contracts | | | | | | | | | | | | | | | | | | | | | | | | | | |
Copper Future | | Long | | | | | | | | | | 5 | | | | 07/28/2016 | | | | $ | 285,440 | | | $ | 20,047 | |
Corn Future | | Long | | | | | | | | | | 20 | | | | 07/15/2016 | | | | | 391,740 | | | | 32,428 | |
Gold 100 Oz. Future | | Long | | | | | | | | | | 2 | | | | 06/29/2016 | | | | | 258,100 | | | | 6,994 | |
Sugar No. 11 (World) Future | | Long | | | | | | | | | | 7 | | | | 07/01/2016 | | | | | 127,946 | | | | 14,322 | |
WTI Crude Future | | Long | | | | | | | | | | 12 | | | | 06/22/2016 | | | | | 560,280 | | | | 43,763 | |
Equity Contracts | | | | | | | | | | | | | | | | | | | | | | | | | | |
Mexican Bolsa Index Future | | Long | | | | | | | | | | 174 | | | | 06/20/2016 | | | | | 4,643,634 �� | | | | 124,795 | |
Russell 2000® E-Mini Future | | Long | | | | | | | | | | 50 | | | | 06/20/2016 | | | | | 5,638,000 | | | | 335,128 | |
Interest Rate Contracts | | | | | | | | | | | | | | | | | | | | | | | | | | |
U.S. 10 Year Treasury Note Future | | Short | | | | | | | | | | 20 | | | | 06/22/2016 | | | | | (2,601,240) | | | | 15,296 | |
U.S. 2 Year Treasury Note Future | | Short | | | | | | | | | | 4 | | | | 07/01/2016 | | | | | (874,500) | | | | 928 | |
U.S. 5 Year Treasury Note Future | | Short | | | | | | | | | | 22 | | | | 07/01/2016 | | | | | (2,660,108) | | | | 5,562 | |
U.S. Treasury Long Bond Future | | Short | | | | | | | | | | 14 | | | | 06/22/2016 | | | | | (2,286,382) | | | | 36,497 | |
| | | | | | | | | | | | | | | | | | | | | | |
| | | | | | | | | | | | | | | | | | | | $ | 3,482,910 | | | $ | 635,760 | |
| | | | | | | | | | | | | | | | | | | | | | |
| | | | | | | | | | | |
| Description | | Position | | | | | | | | | | Contracts | | | | Expiration
Date | | | | Underlying Face
Amount at Value | | | Unrealized
Depreciation | |
| |
Commodity Contracts | | | | | | | | | | | | | | | | | | | | | | | | | | |
Live Cattle Future | | Long | | | | | | | | | | 2 | | | | 07/01/2016 | | | | $ | 91,940 | | | $ | (10,433) | |
Equity Contracts | | | | | | | | | | | | | | | | | | | | | | | | | | |
E-Mini S&P 500® Future | | Short | | | | | | | | | | 100 | | | | 06/20/2016 | | | | | (10,295,500) | | | | (260,393) | |
Euro STOXX 50® Index Future | | Long | | | | | | | | | | 230 | | | | 06/20/2016 | | | | | 7,840,275 | | | | (10,504) | |
FTSE® 100 Index Future | | Short | | | | | | | | | | 26 | | | | 06/20/2016 | | | | | (2,359,934) | | | | (39,324) | |
Mini MSCI EAFE Index Future | | Short | | | | | | | | | | 17 | | | | 06/20/2016 | | | | | (1,412,615) | | | | (24,528) | |
Mini MSCI Emerging Markets Index Future | | Short | | | | | | | | | | 11 | | | | 06/20/2016 | | | | | (461,120) | | | | (15,426) | |
Russell 1000® Value Future | | Short | | | | | | | | | | 18 | | | | 06/20/2016 | | | | | (1,780,380) | | | | (68,441) | |
SGX CNX Nifty Index Future | | Long | | | | | | | | | | 171 | | | | 05/27/2016 | | | | | 2,699,235 | | | | (41,620) | |
Tokyo Price Index Future | | Long | | | | | | | | | | 66 | | | | 06/10/2016 | | | | | 8,228,289 | | | | (108,285) | |
| | | | | | | | | | | | | | | | | | | | | | |
| | | | | | | | | | | | | | | | | | | | $ | 2,550,190 | | | $ | (578,954) | |
| | | | | | | | | | | | | | | | | | | | | | |
TOTAL RETURN SWAP CONTRACTS*
| | | | | | | | | | | | | | |
| Counterparty | | Reference Obligation | | Notional Amount | | | Rate Paid by the Fund | | Termination Date | | Unrealized
Appreciation | |
| |
Morgan Stanley | | Impala Segregated Portfolio(a) | | $ | 59,330,358 | | | 1-Month LIBOR BBA | | 03/20/2019 | | $ | 156,334 | |
Morgan Stanley | | Melchior Segregated Portfolio(b) | | | 57,509,104 | | | 1-Month LIBOR BBA | | 03/20/2019 | | | 193,005 | |
Morgan Stanley | | WABR Cayman Company Limited(c) | | | 114,947,812 | | | 1-Month LIBOR BBA | | 09/01/2020 | | | 357,608 | |
| | | | | | | | | | | | | | |
| | | | $ | 231,787,274 | | | | | | | $ | 706,947 | |
| | | | | | | | | | | | | | |
| * | The Fund receives payments based on any positive return of the Reference Obligation less the rate paid by the Fund. The Fund makes payments on any negative return of such Reference Obligation plus the rate paid by the Fund. |
| (a) | European equity long/short strategy that employs a flexible, low-net strategy (0% to 50%), and long exposure will vary between 60% and 100%. The portfolio is primarily comprised of large and mid-cap stocks listed on European exchanges. |
| (b) | Global equity long/short strategy that uses a long-biased strategy that is focused on cyclical sectors. The strategy has a net exposure that ranges between 50% and 80%, and long exposure varies between 80% and 100%. The strategy is comprised of large cap stocks listed on exchanges of developed and emerging market countries. |
| (c) | Weiss Alpha Balanced Risk incorporates an absolute return oriented approach within a risk parity framework. Active absolute return strategies include fundamental long/short equity, credit relative value, discretionary macro, and equity market neutral strategies. The strategy also maintains a passive risk weighted allocation to equities and fixed income, but each of the three allocations is equally risk weighted subject to a 40% limit on the absolute return allocation. Gross equity long exposure will typically be 140% or less, and net equity exposure will vary between 5% and 35%. |
| | |
| See Notes to Financial Statements. | | |
50 | | www.redmontfunds.com |
| | |
| Redmont Resolute Fund II | | Schedule of Investments |
| | April 30, 2016 |
Currency Abbreviations
CHF - Swiss Franc
EUR - Euro
GBP - Great British Pound
INR - Indian Rupee
JPY - Japanese Yen
SEK - Swedish Krona
USD - United States Dollar
Common Abbreviations:
AQR - AQR Capital Management LLC.
BBA - British Bankers Association.
Bolsa - The Spanish term for stock exchange.
CNX Nifty - The National Stock Exchange of India’s benchmark stock market index for Indian equity market.
FPA - First Pacific Advisors LLC.
FTSE - Financial Times and the London Stock Exchange.
LIBOR - London Interbank Offered Rate.
MSCI - Morgan Stanley Capital International.
PIMCO - Pacific Investment Management Company.
S&P - Standard & Poor’s.
SGX - Singapore Exchange.
SPDR - Standard & Poor’s Depositary Receipt.
UCITS - Undertakings for Collective Investment in Transferable Securities.
| | |
| See Notes to Financial Statements. | | |
Annual Report | April 30, 2016 | | 51 |
| | |
| Redmont Resolute Fund II | | Statement of Assets and Liabilities |
| | April 30, 2016 |
| | | | |
| | | Redmont Resolute Fund II | |
| |
ASSETS | | | | |
Investments, at value | | $ | 605,632,636 | |
Unrealized appreciation on total return swap contracts | | | 706,947 | |
Unrealized appreciation on forward currency contracts | | | 22,889 | |
Deposits with brokers for securities sold short and written options | | | 30,354,362 | |
Deposits with brokers for total return swap contracts | | | 83,070,000 | |
Deposits with brokers for forward currency contracts | | | 1,980,000 | |
Foreign currency, at value (Cost $2,927) | | | 2,940 | |
Receivable for investments sold | | | 1,494,795 | |
Receivable for dividends | | | 602,941 | |
Other assets | | | 10,717 | |
| |
Total assets | | | 723,878,227 | |
| |
LIABILITIES | | | | |
Securities sold short (Proceeds $29,740,232) | | | 31,093,639 | |
Written options, at value (Premiums received $135,671) | | | 352,820 | |
Unrealized depreciation on forward currency contracts | | | 1,057,288 | |
Foreign cash due to broker for securities sold short (Cost $242) | | | 262 | |
Investment advisory fees payable | | | 537,520 | |
Payable for dividend expense on securities sold short | | | 16,727 | |
Payable for interest expense on total return swap contracts | | | 23,353 | |
Payable for total return swap reset | | | 1,089,434 | |
Payable for investments purchased | | | 702,530 | |
Variation margin payable | | | 140,294 | |
Payable for shares redeemed | | | 2,000,000 | |
Trustee fees and expenses payable | | | 4,327 | |
Chief compliance officer fee payable | | | 8,102 | |
Principal financial officer fees payable | | | 1,667 | |
Administration fees payable | | | 100,570 | |
Transfer agent fees payable | | | 12,213 | |
Professional fees payable | | | 28,512 | |
Custody fees payable | | | 45,313 | |
Accrued expenses and other liabilities | | | 4,780 | |
| |
Total liabilities | | | 37,219,351 | |
| |
NET ASSETS | | $ | 686,658,876 | |
| |
NET ASSETS CONSIST OF | | | | |
Paid-in capital (Note 6) | | $ | 682,861,049 | |
Accumulated net loss | | | (826,971) | |
Accumulated net realized loss | | | (2,037,621) | |
Net unrealized appreciation | | | 6,662,419 | |
| |
NET ASSETS | | $ | 686,658,876 | |
| |
INVESTMENTS, AT COST | | $ | 597,135,038 | |
| |
PRICING OF SHARES | | | | |
Class I: | | | | |
Net Asset Value, offering and redemption price per share | | $ | 10.75 | |
Net Assets | | $ | 686,658,876 | |
Shares of beneficial interest outstanding (unlimited number of shares, no par value common stock authorized) | | | 63,881,394 | |
| | |
| See Notes to Financial Statements. | | |
52 | | www.redmontfunds.com |
| | |
| Redmont Resolute Fund II | | Statement of Operations |
| | For the Year Ended April 30, 2016 |
| | | | |
| | | Redmont Resolute Fund II | |
| |
INVESTMENT INCOME | | | | |
Dividends | | $ | 12,023,960 | |
Interest | | | 652,240 | |
Foreign taxes withheld | | | (66,794) | |
| |
Total investment income | | | 12,609,406 | |
| |
| |
EXPENSES | | | | |
Investment advisory fees (Note 7) | | | 10,239,849 | |
Broker fees and charges on securities sold short | | | 160,963 | |
Administration fees | | | 409,770 | |
Transfer agency fees | | | 45,155 | |
Professional fees | | | 44,333 | |
Custody fees | | | 120,465 | |
Reports to shareholders and printing fees | | | 6,987 | |
Trustee fees and expenses | | | 17,994 | |
Registration/filing fees | | | 7,081 | |
Chief compliance officer fees | | | 48,461 | |
Principal financial officer fees | | | 9,969 | |
Dividend expense on securities sold short | | | 414,517 | |
Other | | | 28,078 | |
| |
Total expenses before waivers | | | 11,553,622 | |
Less fees waived/reimbursed by investment adviser (Note 7) | | | | |
Class I | | | (9,145,448) | |
| |
Total net expenses | | | 2,408,174 | |
| |
NET INVESTMENT INCOME | | | 10,201,232 | |
| |
Net realized loss on investments | | | (3,636,378) | |
Net realized gain on securities sold short | | | 1,702,848 | |
Net realized gain on written options | | | 131,838 | |
Net realized loss on futures contracts | | | (3,782,936) | |
Net realized loss on total return swap contracts | | | (4,051,748) | |
Net realized loss on foreign currency transactions | | | (18) | |
| |
Total net realized loss | | | (9,636,394) | |
| |
Net realized capital gain distributions from other investment companies | | | 5,483,000 | |
| |
| |
Net change in unrealized depreciation on investments | | | (22,583,780) | |
Net change in unrealized appreciation on securities sold short | | | 213,008 | |
Net change in unrealized depreciation on written options | | | (201,916) | |
Net change in unrealized appreciation on futures contracts | | | 1,150,797 | |
Net change in unrealized appreciation on total return swap contracts | | | 2,461,738 | |
Net change in unrealized depreciation on translation of assets and liabilities in foreign currency transactions | | | (1,029,682) | |
| |
Total net change in unrealized depreciation | | | (19,989,835) | |
| |
NET REALIZED AND UNREALIZED LOSS ON INVESTMENTS | | | (24,143,229) | |
| |
NET DECREASE IN NET ASSETS RESULTING FROM OPERATIONS | | $ | (13,941,997) | |
| |
| | |
| See Notes to Financial Statements. | | |
Annual Report | April 30, 2016 | | 53 |
| | |
| Redmont Resolute Fund II | | Statements of Changes in Net Assets |
| | |
| | | | | | | | | | |
| | | Redmont Resolute Fund II | |
| | | | |
| | | For the Year Ended April 30, 2016 | | | | | For the Year Ended April 30, 2015 | |
| |
OPERATIONS | | | | | | | | | | |
Net investment income | | $ | 10,201,232 | | | | | $ | 11,793,052 | |
Net realized gain/(loss) | | | (9,636,394) | | | | | | 19,405,734 | |
Net realized gain distributions from other investment companies | | | 5,483,000 | | | | | | 3,191,369 | |
Net change in unrealized depreciation | | | (19,989,835) | | | | | | (7,606,167) | |
| |
Net increase/(decrease) in net assets resulting from operations | | | (13,941,997) | | | | | | 26,783,988 | |
| |
DISTRIBUTIONS (NOTE 4) | | | | | | | | | | |
| | | |
Net investment income | | | | | | | | | | |
| | | |
Class I | | | (11,108,106) | | | | | | (14,088,339) | |
| | | |
Net realized gains on investments | | | | | | | | | | |
| | | |
Class I | | | (10,242,050) | | | | | | (4,443,526) | |
| |
Net decrease in net assets from distributions | | | (21,350,156) | | | | | | (18,531,865) | |
| |
BENEFICIAL INTEREST TRANSACTIONS (NOTE 6) | | | | | | | | | | |
Shares sold | | | | | | | | | | |
Class I | | | 49,423,534 | | | | | | 97,459,393 | |
Dividends reinvested | | | | | | | | | | |
Class I | | | 21,244,058 | | | | | | 18,500,507 | |
Shares redeemed, net of redemption fees | | | | | | | | | | |
Class I | | | (37,982,086) | | | | | | (39,895,825) | |
| |
Net increase in net assets derived from beneficial interest transactions | | | 32,685,506 | | | | | | 76,064,075 | |
| |
Net increase/(decrease) in Net Assets | | | (2,606,647) | | | | | | 84,316,198 | |
NET ASSETS: | | | | | | | | | | |
Beginning of period | | | 689,265,523 | | | | | | 604,949,325 | |
| |
End of period* | | $ | 686,658,876 | | | | | $ | 689,265,523 | |
| |
* Includes accumulated net investment income/(loss) of: | | $ | (826,971) | | | | | $ | 4,809,515 | |
| | |
| See Notes to Financial Statements. | | |
54 | | www.redmontfunds.com |
| | |
| Redmont Resolute Fund II | | Financial Highlights |
| | For a share outstanding throughout the periods presented |
| | | | | | | | | | | | | | | | | | | | |
| | | Class I | |
| | | For the
Year Ended
April 30, 2016 | | | For the
Year Ended
April 30, 2015 | | | For the
Year Ended
April 30, 2014 | | | For the
Year Ended
April 30, 2013 | | | For the
Period Ended
April 30, 2012(a) | |
| | | | | |
NET ASSET VALUE, BEGINNING OF PERIOD | | $ | 11.32 | | | $ | 11.18 | | | $ | 11.05 | | | $ | 10.34 | | | $ | 10.00 | |
INCOME/(LOSS) FROM OPERATIONS | | | | | | | | | | | | | | | | | | | | |
Net investment income/(loss)(b) | | | 0.16 | | | | 0.20 | | | | 0.13 | | | | 0.11 | | | | (0.03) | |
Net realized and unrealized gain/(loss) on investments | | | (0.39) | | | | 0.26 | | | | 0.19 | | | | 0.68 | | | | 0.37 | |
| | | | | | | | | | | | | | | | | | | | |
Total from Investment Operations | | | (0.23) | | | | 0.46 | | | | 0.32 | | | | 0.79 | | | | 0.34 | |
| | | | | | | | | | | | | | | | | | | | |
| | | | | |
LESS DISTRIBUTIONS | | | | | | | | | | | | | | | | | | | | |
Net investment income | | | (0.18) | | | | (0.24) | | | | (0.11) | | | | (0.08) | | | | – | |
Net realized gain on investments | | | (0.16) | | | | (0.08) | | | | (0.08) | | | | – | | | | – | |
| | | | | | | | | | | | | | | | | | | | |
Total Distributions | | | (0.34) | | | | (0.32) | | | | (0.19) | | | | (0.08) | | | | – | |
| | | | | | | | | | | | | | | | | | | | |
NET INCREASE/(DECREASE) IN NET ASSET VALUE | | | (0.57) | | | | 0.14 | | | | 0.13 | | | | 0.71 | | | | 0.34 | |
| | | | | | | | | | | | | | | | | | | | |
NET ASSET VALUE, END OF PERIOD | | $ | 10.75 | | | $ | 11.32 | | | $ | 11.18 | | | $ | 11.05 | | | $ | 10.34 | |
| | | | | | | | | | | | | | | | | | | | |
TOTAL RETURN(c) | | | (2.02) | % | | | 4.16 | % | | | 2.85 | % | | | 7.65 | % | | | 3.40 | % |
| | | | | |
RATIOS/SUPPLEMENTAL DATA | | | | | | | | | | | | | | | | | | | | |
Net assets, End of Period (000s) | | $ | 686,659 | | | $ | 689,266 | | | $ | 604,949 | | | $ | 446,319 | | | $ | 78,498 | |
RATIOS TO AVERAGE NET ASSETS: | | | | | | | | | | | | | | | | | | | | |
Operating expenses excluding reimbursement/waiver(d) | | | 1.69% | (e) | | | 1.68% | (e) | | | 1.69% | (e) | | | 1.32 | % | | | 1.63% | (f) |
Operating expenses including reimbursement/waiver(d) | | | 0.35% | (e) | | | 0.33% | (e) | | | 0.29% | (e) | | | 0.22 | % | | | 1.13% | (f) |
Net investment income/(loss) including reimbursement/waiver(d) | | | 1.49 | % | | | 1.79 | % | | | 1.19 | % | | | 1.08 | % | | | (0.97)% | (f) |
PORTFOLIO TURNOVER RATE | | | 27 | % | | | 54 | % | | | 114 | % | | | 51 | % | | | 18% | (g) |
| (a) | The Fund’s inception was December 30, 2011. |
| (b) | Calculated using the average shares method. |
| (c) | Total investment return is calculated assuming a purchase of a common share at the opening of the first day and a sale at closing on the last day of each period reported. Dividends and distributions, if any, are assumed for purposes of this calculation to be reinvested at prices obtained under the Fund’s dividend reinvestment plan. Total returns would have been lower had certain expenses not been waived during the period. Total investment returns do not reflect brokerage commissions, if any, and are not annualized. |
| (d) | The ratios exclude the impact of expenses of the underlying funds in which the Fund invests as represented in the Schedule of Investments. |
| (e) | Dividend and interest expense on securities sold short totaled 0.08%, 0.10%, and 0.08% of average net assets for the years ended April 30, 2016, 2015, and 2014, respectively. |
| | |
| See Notes to Financial Statements. | | |
Annual Report | April 30, 2016 | | 55 |
| | |
| Redmont Resolute Fund II | | Notes to Financial Statements |
| | April 30, 2016 |
1. ORGANIZATION
Financial Investors Trust (the “Trust”), a Delaware statutory trust, is an open-end management investment company registered under the Investment Company Act of 1940, as amended (“1940 Act”). As of April 30, 2016, the Trust has 34 registered funds. This annual report describes the Redmont Resolute Fund II (the “Fund”). The Fund seeks to provide long-term total return with reduced volatility and reduced correlation to the conventional stock and bond markets. The Fund offers Class I shares.
2. SIGNIFICANT ACCOUNTING POLICIES
The accompanying financial statements were prepared in accordance with accounting principles generally accepted in the United States of America (“U.S. GAAP”). The preparation of financial statements in conformity with U.S. GAAP requires management to make certain estimates and assumptions that affect the reported amounts of assets and liabilities and disclosures of contingent assets and liabilities at the date of the financial statements and the reported amounts of revenue and expenses during the period. Actual results could differ from those estimates. The Fund is considered an investment company for financial reporting purposes under U.S. GAAP. The following is a summary of significant accounting policies consistently followed by the Fund in preparation of its financial statements.
Investment Valuation: The Fund generally values its securities based on market prices determined at the close of regular trading on the New York Stock Exchange (“NYSE”), normally 4:00 p.m. Eastern Time, on each day the NYSE is open for trading.
For equity securities and mutual funds that are traded on an exchange, the market price is usually the closing sale or official closing price on that exchange. In the case of equity securities not traded on an exchange, or if such closing prices are not otherwise available, the securities are valued at the mean of the most recent bid and ask prices on such day. Redeemable securities issued by open-end registered investment companies are valued at the investment company’s applicable net asset value, with the exception of exchange-traded open-end investment companies, which are priced as equity securities.
The market price for debt obligations is generally the price supplied by an independent third-party pricing service approved by the Board of Trustees (the “Board”), which may use a matrix, formula or other objective method that takes into consideration quotations from dealers, market transactions in comparable investments, market indices and yield curves. If vendors are unable to supply a price, or if the price supplied is deemed to be unreliable, the market price may be determined using quotations received from one or more brokers–dealers that make a market in the security. Municipal securities having a remaining maturity of greater than 60 days, are typically valued at the evaluated bid price formulated by an independent pricing service. Corporate Bonds, U.S. Government & Agency, and U.S. Treasury Bonds & Notes are valued using market models that consider trade data, quotations from dealers and active market makers, relevant yield curve and spread data, creditworthiness, trade data or market information on comparable securities, and other relevant security specific information. Mortgage-related and asset-backed securities are valued based on models that consider trade data, prepayment and default projections, benchmark yield and spread data and estimated cash flows of each tranche of the issuer. Publicly traded foreign government debt securities are typically traded internationally in the over-the-counter market and are valued at the mean between the bid and asked prices as of the close of business of that market.
Futures contracts that are listed or traded on a national securities exchange, commodities exchange, contract market or comparable over the counter market, and that are freely transferrable, are valued at their closing settlement price on the exchange on which they are primarily traded or based upon the current settlement price for a like instrument acquired on the day on which the instrument is being valued. A settlement price may not be used if the market makes a limit move with respect to a particular commodity. Over-the-counter swap contracts for which market quotations are readily available are valued based on quotes received from independent pricing services or one or more dealers that make markets in such securities. Options contracts listed for trading on a securities exchange or board of trade are valued at the last quoted sales price or, in the absence of a sale at the mean of the last bid and asked price.
Forward currency exchange contracts have a fair value determined by the current foreign currency exchange forward rates. The foreign currency exchange forward rates are calculated using an automated system that estimates rates on the basis of the current day foreign currency exchange rates and forward foreign currency exchange rates supplied by a pricing service. Foreign exchange rates and forward foreign currency exchange rates may generally be obtained at the close of the NYSE, normally 4:00 p.m. Eastern Time.
When such prices or quotations are not available, or when Highland Associates, Inc. (the “Adviser”) believes that they are unreliable, securities may be priced using fair value procedures approved by the Board.
Fair Value Measurements: The Fund discloses the classification of its fair value measurements following a three-tier hierarchy based on the inputs used to measure fair value. Inputs refer broadly to the assumptions that market participants would use in pricing the asset or liability, including assumptions about risk. Inputs may be observable or unobservable. Observable inputs reflect the assumptions market participants would
| | |
| Redmont Resolute Fund II | | Notes to Financial Statements |
| | April 30, 2016 |
use in pricing the asset or liability that are developed based on market data obtained from sources independent of the reporting entity. Unobservable inputs reflect the reporting entity’s own assumptions about the assumptions market participants would use in pricing the asset or liability that are developed based on the best information available.
Various inputs are used in determining the value of the Fund’s investments as of the end of the reporting period. When inputs used fall into different levels of the fair value hierarchy, the level in the hierarchy within which the fair value measurement falls is determined based on the lowest level input that is significant to the fair value measurement in its entirety. The designated input levels are not necessarily an indication of the risk or liquidity associated with these investments. These inputs are categorized in the following hierarchy under applicable financial accounting standards:
| | |
| Level 1 – | | Unadjusted quoted prices in active markets for identical investments, unrestricted assets or liabilities that the Fund has the ability to access at the measurement date; |
| |
| Level 2 – | | Quoted prices which are not active, quoted prices for similar assets or liabilities in active markets or inputs other than quoted prices that are observable (either directly or indirectly) for substantially the full term of the asset or liability; and |
| |
| Level 3 – | | Significant unobservable prices or inputs (including the Fund’s own assumptions in determining the fair value of investments) where there is little or no market activity for the asset or liability at the measurement date. |
The following is a summary of the inputs used to value the Fund’s investments as of April 30, 2016:
Redmont Resolute Fund II
| | | | | | | | | | | | | | | | |
| Investments in Securities at Value | | Level 1 -
Quoted Prices | | | Level 2 - Other Significant Observable Inputs | | | Level 3 - Significant Unobservable Inputs | | | Total | |
| |
Closed End Funds | | $ | 70,236 | | | $ | – | | | $ | – | | | $ | 70,236 | |
Common Stocks(*) | | | 97,861,448 | | | | – | | | | – | | | | 97,861,448 | |
Exchange Traded Funds | | | 1,376,656 | | | | – | | | | – | | | | 1,376,656 | |
Limited Partnerships | | | 129,591 | | | | – | | | | – | | | | 129,591 | |
Open-End Mutual Funds | | | 438,631,081 | | | | – | | | | – | | | | 438,631,081 | |
Preferred Stocks(*) | | | 146,510 | | | | – | | | | – | | | | 146,510 | |
Asset-Backed Securities | | | – | | | | 772,777 | | | | – | | | | 772,777 | |
Corporate Bonds(*) | | | – | | | | 12,678,931 | | | | – | | | | 12,678,931 | |
Foreign Government Bonds | | | – | | | | 3,235,521 | | | | – | | | | 3,235,521 | |
Government Bonds | | | – | | | | 1,437,114 | | | | – | | | | 1,437,114 | |
Short Term Investments | | | | | | | | | | | | | | | | |
Money Market Funds | | | 46,122,189 | | | | – | | | | – | | | | 46,122,189 | |
U.S. Treasury Bills | | | – | | | | 3,170,582 | | | | – | | | | 3,170,582 | |
| |
Total | | $ | 584,337,711 | | | $ | 21,294,925 | | | $ | – | | | $ | 605,632,636 | |
| |
| | | | |
| Other Financial Instruments | | | | | | | | | | | | |
| |
Assets: | | | | | | | | | | | | | | | | |
Forward Foreign Currency Contracts | | $ | – | | | $ | 22,889 | | | $ | – | | | $ | 22,889 | |
Futures Contracts | | | 635,760 | | | | – | | | | – | | | | 635,760 | |
Total Return Swap Contracts | | | – | | | | 706,947 | | | | – | | | | 706,947 | |
Liabilities: | | | | | | | | | | | | | | | | |
Common Stocks Sold Short(*) | | | (31,093,639) | | | | – | | | | – | | | | (31,093,639) | |
Written Options | | | (210,655) | | | | (142,165) | | | | – | | | | (352,820) | |
Forward Foreign Currency Contracts | | | – | | | | (1,057,288) | | | | – | | | | (1,057,288) | |
Futures Contracts | | | (578,954) | | | | – | | | | – | | | | (578,954) | |
| |
Total | | $ | (31,247,488) | | | $ | (427,293) | | | $ | – | | | $ | (31,717,105) | |
| |
| * | For detailed descriptions, see the accompanying Schedule of Investments. |
The Fund recognizes transfers between levels as of the end of the period. For the year ended April 30, 2016, the Fund did not have any transfers between Level 1 and Level 2 securities. There were no Level 3 securities held during the period.
| | |
| | | |
Annual Report | April 30, 2016 | | 57 |
| | |
| Redmont Resolute Fund II | | Notes to Financial Statements |
| | April 30, 2016 |
Trust Expenses: Some expenses of the Trust can be directly attributed to the Fund. Expenses which cannot be directly attributed to the Fund are apportioned among all funds in the Trust based on average net assets of the Fund.
Federal Income Taxes: The Fund complies with the requirements under Subchapter M of the Internal Revenue Code of 1986, as amended, applicable to regulated investment companies and intend to distribute substantially all of their net taxable income and net capital gains, if any, each year so that the Fund will not be subject to excise tax on undistributed income and gains. The Fund is not subject to income taxes to the extent such distributions are made.
As of and during the year ended April 30, 2016, the Fund did not have a liability for any unrecognized tax benefits. The Fund files U.S. federal, state, and local tax returns as required. The Fund’s tax returns are subject to examination by the relevant tax authorities until expiration of the applicable statute of limitations, which is generally three years after the filing of the tax return for federal purposes and four years for most state returns. Tax returns for open years have incorporated no uncertain tax positions that require a provision for income taxes.
Investment Transactions and Investment Income: Investment transactions are accounted for on the date the investments are purchased or sold (trade date basis). Net realized gains and losses from investment transactions are reported on an identified cost basis. Interest income, which includes accretion of discounts and amortization of premiums, is accrued and recorded as earned. Dividend income is recognized on the ex-dividend date or for certain foreign securities, as soon as information is available to the Fund. All of the realized and unrealized gains and losses and net investment income, are allocated daily to each class in proportion its average daily net assets.
Short Sales: The Fund may make short sales of securities consistent with its strategies. A short sale is a transaction in which a Fund sells a security it does not own in anticipation that the market price of that security will decline.
When a Fund makes a short sale, it must borrow the security sold short and deliver it to the broker dealer through which it made the short sale as collateral for its obligation to deliver the security upon conclusion of the sale. The Fund may have to pay a fee to borrow particular securities and is often obligated to pay over any accrued interest and dividends on such borrowed securities.
If the price of the security sold short increases between the time of the short sale and the time that a Fund replaces the borrowed security, the Fund will incur a loss; conversely, if the price declines, the Fund will realize a capital gain. Any gain will be decreased, and any loss increased, by the transaction costs described above. The successful use of short selling may be adversely affected by imperfect correlation between movements in the price of the security sold short and the securities being hedged.
To the extent that a Fund engages in short sales, it will provide collateral to the broker-dealer and (except in the case of short sales “against the box”) will maintain additional asset coverage in the form of segregated or “earmarked” assets determined to be liquid in accordance with procedures established by the Board and that is equal to the current market value of the securities sold short, or will ensure that such positions are covered by “offsetting” positions, until the Fund replaces the borrowed security. A short sale is “against the box” to the extent that the Fund contemporaneously owns, or has the right to obtain at no added cost, securities identical to those sold short. The Fund may engage in short selling to the extent permitted by the federal securities laws and rules and interpretations thereunder. To the extent a Fund engages in short selling in foreign (non-U.S.) jurisdictions, the Fund will do so to the extent permitted by the laws and regulations of such jurisdiction.
Distributions to Shareholders: The Fund normally pays dividends and distributes capital gains, if any, on an annual basis. Income dividend distributions are derived from interest and dividends and other income the Fund receives from their investments, including distributions of short term capital gains. Capital gain distributions are derived from gains realized when the Fund sells a security it has owned for more than a year. The Fund may make additional distributions and dividends at other times if its portfolio manager or managers believe doing so may be necessary for the Fund to avoid or reduce taxes.
3. DERIVATIVE INSTRUMENTS
Swap Contracts: The Fund may enter into swap transactions for hedging purposes or to seek to increase total return. At the present time, the Fund primarily enters into swap transactions for the purpose of increasing total return. Risks may arise as a result of the failure of the counterparty to the swap contract to comply with the terms of the swap contract. The loss incurred by the failure of a counterparty is generally limited to the net payment to be received by the Fund and/or the termination value at the end of the contract.
Therefore, the Fund considers the creditworthiness of each counterparty to a contract in evaluating potential credit risk. Additionally, risks may arise from unanticipated movements in interest rates or in the value of the underlying reference asset or index. Entering into these agreements
| | |
| Redmont Resolute Fund II | | Notes to Financial Statements |
| | April 30, 2016 |
involves, to varying degrees, market risk, liquidity risk and elements of credit, legal and documentation risk that are not directly reflected in the amounts recognized in the Statements of Assets and Liabilities.
The Fund invests in total return swaps to obtain exposure to a security or market without owning such security or investing directly in that market or to transfer the risk/return of one market (e.g., fixed income) to another market (e.g., equity) (equity risk and/or interest rate risk). Total return swaps are agreements in which there is an exchange of cash flows whereby one party commits to make payments based on the total return (coupons plus capital gains/losses) of an underlying instrument in exchange for fixed or floating rate interest payments. To the extent the total return of the instrument or index underlying the transaction exceeds or falls short of the offsetting interest rate obligation, the Fund will receive a payment from or make a payment to the counterparty. The Fund may pay or receive cash as collateral on these contracts which may be recorded as an asset and/or liability. The Fund must set aside liquid assets, or engage in other appropriate measures, to cover its obligations under these contracts. Swaps are marked to market daily using either pricing vendor quotations, counterparty prices or model prices and the change in value, if any, is recorded as an unrealized gain or loss. Upfront payments made and/or received by the Fund are recorded as an asset and/or liability and realized gains or losses are recognized ratably over the contract’s term/event, with the exception of forward starting interest rate swaps, whose realized gains or losses are recognized ratably from the effective start date. Periodic payments received or made on swap contracts are recorded as realized gains or losses. Gains or losses are realized upon termination of a swap contract and are recorded on the Statement of Operations. Swap agreements held at April 30, 2016 are disclosed in the Schedule of Investments.
International Swaps and Derivatives Association, Inc. Master Agreements (“ISDA Master Agreements”) govern OTC financial derivative transactions entered into by the Fund and those counterparties. The ISDA Master Agreements maintain provisions for general obligations, representations, agreements, collateral and events of default or termination. Events of termination include conditions that may entitle counterparties to elect to terminate early and cause settlement of all outstanding transactions under the applicable ISDA Master Agreement. Any election to early terminate could be material to the financial statements.
Option Contracts: The Fund may enter into options transactions for hedging purposes and for non-hedging purposes such as seeking to enhance return. The Fund may write covered put and call options on any stocks or stock indices, currencies traded on domestic and foreign securities exchanges, or futures contracts on stock indices, interest rates and currencies traded on domestic and, to the extent permitted by the CFTC, foreign exchanges. A call option on an asset written by a Fund obligates the Fund to sell the specified asset to the holder (purchaser) at a stated price (the exercise price) if the option is exercised before a specified date (the expiration date). A put option on an asset written by a Fund obligates the Fund to buy the specified asset from the purchaser at the exercise price if the option is exercised before the expiration date. Premiums received when writing options are recorded as liabilities and are subsequently adjusted to the current value of the options written. Premiums received from writing options that expire are treated as realized gains. Premiums received from writing options, which are either exercised or closed, are offset against the proceeds received or amount paid on the transaction to determine realized gains or losses which are recorded on the Statement of Operations.
Written option activity for the year ended April 30, 2016 was as follows:
Redmont Resolute Fund II
| | | | |
| | |
| | | Written Call Options |
|
| | | Contracts | | Premiums |
|
Outstanding, April 30, 2015 | | (181) | | $ 72,275 |
Written | | (1,038) | | 459,846 |
Covered | | 513 | | (184,922) |
Exercised | | 182 | | (120,406) |
Expired | | 243 | | (91,122) |
|
Outstanding, April 30, 2016 | | (281) | | $ 135,671 |
|
Futures: The Fund may enter into futures contracts for hedging purposes. A futures contract represents a commitment for the future purchase or sale of an asset at a specified price on a specified date. Upon entering into a futures contract, the Fund is required to deposit an initial margin with the broker in an amount equal to a certain percentage of the contract amount. The Fund receives from or pays to the broker, on a daily basis, an amount of cash equal to the daily fluctuation in value of the contract. Such receipts or payments are known as “variation margin,” and are recorded by the Fund as unrealized gains or losses. When the futures contract is closed, the Fund records a gain or loss equal to the difference between the value of the contract at the time it was opened and the value at the time it was closed.
A Fund’s potential losses from the use of futures extend beyond its initial investment in such contracts. The use of futures contracts involves, to varying degrees, elements of market risk in excess of the amount recognized in the Statements of Assets and Liabilities. The predominant risk is that the movement of a futures contract’s price may result in a loss, which could render a Fund’s hedging strategy unsuccessful. There is minimal counterparty credit risk since futures contracts are exchange traded and the exchange’s clearinghouse, as counterparty to all exchange traded futures, guarantees the futures against default.
| | |
| Annual Report | April 30, 2016 | | 59 |
| | |
| Redmont Resolute Fund II | | Notes to Financial Statements |
| | April 30, 2016 |
Risk Exposure: The following tables disclose the amounts related to the Fund’s use of derivative instruments.
The effect of derivatives instruments on the Statements of Assets and Liabilities as of April 30, 2016:
| | | | | | | | | | | | |
| Risk Exposure | | Asset Derivatives Statements
of Assets and Liabilities
Location | | Fair Value | | | Liability Derivatives Statements
of Assets and Liabilities Location | | Fair Value | |
| |
Redmont Resolute Fund II | | | | | | | | | | | | |
Equity Contracts (Total Return Swap Contracts) | | Unrealized appreciation on total return swap contracts | | $ | 706,947 | | | Unrealized depreciation on total return swap contracts | | $ | – | |
Equity Contracts (Written Options) | | N/A | | | N/A | | | Written options, at value | | | 352,820 | |
Foreign Currency Contracts (Forward Currency Contracts) | | Unrealized appreciation on forward currency contracts | | | 22,889 | | | Unrealized depreciation on forward currency contracts | | | 1,057,288 | |
Futures Contracts* | | Unrealized appreciation on futures contracts | | | 635,760(a) | | | Unrealized depreciation on futures contracts | | | 578,954(a) | |
| |
Total | | | | $ | 1,365,596 | | | | | $ | 1,989,062 | |
| |
| | | | |
| | * Risk Exposure to Fund | | | | | | | | | | |
| | Commodity Contracts | | $ | 117,554 | | | | | $ | 10,433 | |
| | Equity Contracts | | | 459,923 | | | | | | 568,521 | |
| | Interest Rate Contracts | | | 58,283 | | | | | | – | |
| | | | | | |
| | | | $ | 635,760 | | | | | $ | 578,954 | |
| | | | | | |
| (a) | Reflects cumulative unrealized appreciation (depreciation) of futures contracts as reported in the Schedule of Investments. The value reflected on the accompanying Statement of Assets and Liabilities is only the unsettled variation margin receivable as of April 30, 2016. |
| | |
| Redmont Resolute Fund II | | Notes to Financial Statements |
| | April 30, 2016 |
The effect of derivatives instruments on the Statements of Operations for the year ended April 30, 2016:
| | | | | | | | | | |
| Risk Exposure | | Statement of Operations Location | | Realized Gain/(Loss)
on Derivatives
Recognized in Income | | | Change in Unrealized
Appreciation/(Depreciation)
on Derivatives Recognized in Income | |
| |
Redmont Resolute Fund II | | | | | | | | | | |
Equity Contracts
(Total Return Swap Contracts) | | Net realized loss on total return swap contracts/Net change in unrealized appreciation on total return swap contracts | | $ | (4,051,748) | | | $ | 2,461,738 | |
Equity Contracts
(Purchased Options) | | Net realized gain on purchased options | | | 91,122 | | | | – | |
Equity Contracts
(Written Options) | | Net realized gain on written options/Net change in unrealized depreciation on written options | | | 131,838 | | | | (201,916) | |
Foreign Currency Contracts
(Forward Currency Contracts) | | Net realized gain on foreign currency transactions/Net change in unrealized depreciation on translation of assets and liabilities in foreign currency transactions | | | 5,210 | | | | (1,034,399) | |
Futures Contracts* | | Net realized loss on futures contracts/Net change in unrealized appreciation on futures contracts | | | (3,782,936) | | | | 1,150,797 | |
| |
Total | | | | $ | (7,606,514) | | | $ | 2,376,220 | |
| |
| | | |
| | *Risk Exposure to Fund | | | | | | | | |
| | Commodity Contracts | | $ | (28,211) | | | $ | 107,121 | |
| | Equity Contracts | | | (2,511,181) | | | | 122,152 | |
| | Interest Rate Contracts | | | (252,202) | | | | 87,811 | |
| | Foreign Currency Contracts | | | (991,342) | | | | 833,713 | |
| | | | | | |
| | | | $ | (3,782,936) | | | $ | 1,150,797 | |
| |
Volume of Derivative Instruments for the Fund during the year ended April 30, 2016 was as follows:
| | | | | | | | | | |
| Derivative Type | | Unit of Measurement | | | | Monthly Average | | | |
|
Redmont II | | | | | | | | | | |
Equity Swap Contracts | | Notional Quantity | | | | | 230,077,235 | | | |
Forward Currency Contracts | | Notional Quantity | | | | | 294,869,442 | | | |
Futures Contracts | | Contracts | | | | | 266 | | | |
Written Option Contracts | | Contracts | | | | | 325 | | | |
Purchased Option Contracts | | Contracts | | | | | 0 | | | |
Certain derivative contracts and repurchase agreements are executed under either standardized netting agreements or, for exchange-traded derivatives, the relevant contracts for a particular exchange which contain enforceable netting provisions. A derivative netting arrangement creates an enforceable right of set-off that becomes effective, and affects the realization of settlement on individual assets, liabilities and collateral amounts, only following a specified event of default or early termination. Default events may include the failure to make payments or deliver securities timely, material adverse changes in financial condition or insolvency, the breach of minimum regulatory capital requirements, or loss of license, charter or other legal authorization necessary to perform under the contract.
| | |
| | | |
Annual Report | April 30, 2016 | | 61 |
| | |
| Redmont Resolute Fund II | | Notes to Financial Statements |
| | April 30, 2016 |
The following table presents financial instruments that are subject to enforceable netting arrangements or other similar agreements as of April 30, 2016:
| | | | | | | | | | | | | | | | | | | | | | | | | | | | | | | | | | | | |
Redmont Resolute Fund II | |
| |
Offsetting of Derivatives Assets | |
| | | | | | | | | | | | | | | Gross Amounts Not Offset in the Statement of Assets and Liabilities | |
| | | | | | | | | | | | | | | | |
| Description | | Gross Amounts of
Recognized Assets | | | Gross Amounts
Offset in the
Statement of
Assets and
Liabilities | | | Net Amounts
Presented in the
Statement of Assets
and Liabilities | | | | | | Financial
Instruments
Available for
Offset (a) | | | | | | Cash Collateral
Received(a) | | | | | | Net Receivable
Amount | |
| |
Forward Currency Contracts | | $ | 22,889 | | | $ | – | | | $ | 22,889 | | | $ | | | | | (22,889) | | | $ | | | | | – | | | $ | | | | | – | |
Total Return Swap Contracts | | | 706,947 | | | | – | | | | 706,947 | | | | | | | | – | | | | | | | | – | | | | | | | | (706,947) | |
| |
Total | | $ | 729,836 | | | $ | – | | | $ | 729,836 | | | $ | | | | | (22,889) | | | $ | | | | | – | | | $ | | | | | (706,947) | |
| |
Redmont Resolute Fund II | |
Offsetting of Derivatives Liabilities | |
| |
| | | | | |
| | | | | | | | | | | | | | | Gross Amounts Not Offset in the Statement of Assets and Liabilities | |
| | | | | | | | | | | | | | | | |
| Description | | Gross Amounts of
Recognized
Liabilities | | | Gross Amounts
Offset in the
Statement of
Financial Position | | | Net Amounts
Presented in the
Statement of
Financial Position | | | | | | Financial
Instruments
Available for
Offset (a) | | | | | | Cash Collateral
Pledged(a) | | | | | | Net Payable
Amount | |
| |
Forward Currency Contracts | | $ | 1,057,288 | | | $ | – | | | $ | 1,057,288 | | | $ | | | | | (22,889 | ) | | $ | | | | | 1,034,399 | | | $ | | | | | – | |
| |
Total | | $ | 1,057,288 | | | $ | – | | | $ | 1,057,288 | | | $ | | | | | (22,889 | ) | | $ | | | | | 1,034,399 | | | $ | | | | | – | |
| |
| (a) | These amounts are limited to the derivative asset/liability balance and, accordingly, do not include excess collateral received/pledged. |
4. TAX BASIS INFORMATION
Reclassifications: As of April 30, 2016, permanent differences in book and tax accounting were reclassified. These differences had no effect on net assets and were primarily attributed to differing book and tax treatment of investments in swaps. The reclassifications were as follows:
| | | | | | | | | | | | | | | | | | | | | | |
| | | | | Undistributed Net
Investment Loss | | | | | | Accumulated Net
Realized Gain on
Investments | | | | | | Paid-in Capital | |
| |
Redmont Resolute Fund II | | $ | | | (4,729,612) | | | $ | | | | | 4,729,612 | | | $ | | | | | – | |
Tax Basis of Investments: As of April 30, 2016, the aggregate cost of investments, gross unrealized appreciation/(depreciation) and net unrealized appreciation for Federal tax purposes were as follows:
| | | | | | | | | | | | | | | | | | | | | | | | |
| | | Gross Appreciation
(excess of value over
tax cost) | | | Gross Depreciation
(excess of tax cost
over value) | | | Net Depreciation of
Derivatives and
Foreign Currency | | | | | | Net Unrealized
Appreciation | | | Cost of Investments
for Income Tax
Purposes | |
| |
Redmont Resolute Fund II | | $ | 26,446,313 | | | $ | (20,283,729) | | | $ | (1,835,179) | | | $ | | | | | 4,327,405 | | | $ | 599,470,052 | |
| | |
| Redmont Resolute Fund II | | Notes to Financial Statements |
| | April 30, 2016 |
Components of Earnings: As of April 30, 2016, components of distributable earnings were as follows:
| | | | | | | | | | | | | | |
| | | Accumulated Capital
Gains | | | Undistributed Ordinary
Income | | | Net Unrealized
Appreciation | | | Other Cumulative
Effect of Timing
Differences |
|
Redmont Resolute Fund II | | $ | 331,833 | | | $ | – | | | $ | 4,327,405 | | | $ (861,411) |
Capital Losses: As of April 30, 2016, the Fund elects to defer to the period ending April 30, 2017, late year ordinary losses in the amount of $1,115,254.
Tax Basis of Distributions to Shareholders: The character of distributions made during the year from net investment income or net realized gains may differ from its ultimate characterization for federal income tax purposes. Also, due to the timing of dividend distributions, the fiscal year in which amounts are distributed may differ from the fiscal year in which the income or realized gain were recorded by the Fund.
The tax character of distributions paid by the Fund for the fiscal year ended April 30, 2016, were as follows:
| | | | | | | | |
| | | Ordinary Income | | | Long-Term Capital Gains | |
| |
Redmont Resolute Fund II | | $ | 11,135,675 | | | $ | 10,214,481 | |
The tax character of distributions paid by the Fund for the fiscal year ended April 30, 2015, were as follows:
| | | | | | | | |
| | | Ordinary Income | | | Long-Term Capital Gains | |
| |
Redmont Resolute Fund II | | $ | 14,088,339 | | | $ | 4,443,526 | |
5. SECURITIES TRANSACTIONS
Purchases and sales of securities, excluding short-term securities and U.S. Government Obligations during the year ended April 30, 2016 were as follows:
| | | | | | | | |
| Fund | | Purchases of Securities | | | Proceeds From Sales of Securities | |
| |
Redmont Resolute Fund II | | | $ 181,203,313 | | | | $ 144,391,302 | |
Purchases and sales of U.S. Government Obligations during the year ended April 30, 2016 were as follows:
| | | | | | | | |
| Fund | | Purchases of Securities | | | Proceeds From Sales of Securities | |
| |
Redmont Resolute Fund II | | | $ 6,217,309 | | | | $ 3,192,119 | |
| | |
| | | |
Annual Report | April 30, 2016 | | 63 |
| | |
| Redmont Resolute Fund II | | Notes to Financial Statements |
| | April 30, 2016 |
6. BENEFICIAL SHARE TRANSACTIONS
The capitalization of the Trust consists of an unlimited number of shares of beneficial interest with no par value per share. Holders of the shares of the Fund of the Trust have one vote for each share held and a proportionate fraction of a vote for each fractional share. All shares issued and outstanding are fully paid and are transferable and redeemable at the option of the shareholder. Purchasers of the shares do not have any obligation to make payments to the Trust or its creditors solely by reason of the purchasers’ ownership of the shares. Shares have no pre-emptive rights.
Transactions in common shares were as follows:
Redmont Resolute Fund II
| | | | | | | | | | |
| Class I: | | For the Year Ended
April 30, 2016 | | | | | For the Year Ended
April 30, 2015 | |
| |
Common Shares Outstanding - Beginning of Period | | | 60,903,896 | | | | | | 54,134,098 | |
Common Shares Sold | | | 4,465,406 | | | | | | 8,615,477 | |
Common Shares Issued as Reinvestment of Dividends | | | 1,981,722 | | | | | | 1,660,728 | |
Common Shares Redeemed | | | (3,469,630) | | | | | | (3,506,407) | |
| |
Common Shares Outstanding - End of Period | | | 63,881,394 | | | | | | 60,903,896 | |
| |
Shares redeemed within 30 days of purchase may incur a 2% short-term redemption fee deducted from the redemption amount. Redemption fees are reflected in the “Shares redeemed, net of redemption fees” in the Statements of Changes in Net Assets. For the year ended April 30, 2016 and the year ended April 30, 2015, the Fund retained fees as follows:
| | | | | | | | | | |
| Fund | | For the Year Ended
April 30, 2016 | | | For the Year Ended
April 30, 2015 | | | |
|
Redmont Resolute Fund II | | $ | – | | | $ | – | | | |
7. MANAGEMENT AND RELATED PARTY TRANSACTIONS
Investment Advisory
The Adviser, subject to the authority of the Board, is responsible for the overall management and administration of the Fund’s business affairs. Pursuant to the Investment Advisory Agreement (the “Advisory Agreement”), the Adviser is entitled to an investment advisory fee, computed daily and payable monthly of 1.50% of the average daily net assets for the Fund. The management fee is paid on a monthly basis.
The Adviser entered into an Investment Sub-Advisory Agreement with Robeco Investment Management, Inc. (“Robeco”) and with Pinebridge Investments LLC (“Pinebridge). The Investment Sub-Advisory Agreements are in accordance with the Fund’s investment objective, policies and limitations and investment guidelines established jointly by the Adviser and the Board. The Adviser determines the allocation of the Fund’s assets among Robeco, Pinebridge and other open-end investment companies. The Fund is not required to invest with any minimum number of sub-advisers or open-end investment companies, and do not have minimum or maximum limitations with respect to allocations of assets to Robeco and Prinebridge (collectively the “Sub-Advisers”), investment strategy or market sector. Highland may change the allocation of the Fund’s assets among the available investment options, and may add or remove sub-advisers, at any time. Each Sub-Adviser is responsible for the day-to-day management of its allocated portion of Fund assets. Highland has ultimate responsibility, subject to the oversight of the Board of the Fund, to oversee the Sub-Advisers, and to recommend their hiring, termination and replacement.
Pursuant to each Investment Sub-Advisory Agreement, the Adviser pays the Sub-Advisers an annual sub-advisory management fee which is based on the Fund’s average quarterly market value of the assets managed by the Sub-Advisers. The Adviser is required to pay all fees due to Sub-Advisers out of the management fee the Adviser receives from the Fund. The following table reflects the Fund’s contractual sub-advisory fee rates.
| | | | | | |
| Sub-Advisers | | Average Daily
Market Value of the Fund | | Contractual
Sub-Advisory Fee | | |
|
| | First $50 Million | | 0.55% | | |
Pinebridge Investments LLC | | Over $50 Million | | 0.50% | | |
| | First $50 Million | | 1.25% | | |
Robeco Investment Management, Inc. | | Over $50 Million | | 1.00% | | |
| | |
| Redmont Resolute Fund II | | Notes to Financial Statements |
| | April 30, 2016 |
The Adviser has agreed, with respect to the Fund’s Class I shares, to waive the portion of its 1.50% management fee in excess of any sub-advisory fees paid by the Adviser to Sub-Adviser in connection with the Fund. This agreement is in effect August 31, 2013 through August 31, 2017. The Adviser may not discontinue this agreement to waive fees prior to August 31, 2017 without the approval of the Fund’s Board of Trustees. The Adviser is not permitted to recoup any amounts waived or reimbursed to the extent actual fees and expenses for a fiscal period are less than the expense limitation cap. Fees waived/reimbursed by adviser for the year ended April 30, 2016 are disclosed in the Statement of Operations.
For the year ended April 30, 2016, the fee waivers and/or reimbursements were as follows:
| | |
| | | Fees Waived/ Reimbursed By Adviser |
|
Redmont Resolute Fund II - Class I | | $ (9,145,448) |
Administrator Fees and Expenses
ALPS Fund Services, Inc. (“ALPS”) serves as administrator to the Fund, and the Fund has agreed to pay expenses incurred in connection with its administrative activities. Pursuant to an Administration Agreement, ALPS provides operational services to the Fund including, but not limited to, fund accounting and fund administration and generally assists in the Fund’s operations. Officers of the Trust are employees of ALPS. The Fund’s administration fee is accrued on a daily basis and paid monthly. Administration fees paid by the Fund for the year ended April 30, 2016 are disclosed in the Statement of Operations.
ALPS is reimbursed by the Fund for certain out-of-pocket expenses.
Transfer Agent
ALPS serves as transfer, dividend paying and shareholder servicing agent for the Fund. ALPS receives an annual minimum fee, a fee based upon the number of shareholder accounts and is also reimbursed by the Fund for certain out-of-pocket expenses. Transfer agent fees paid by the Fund for the year ended April 30, 2016 are disclosed in the Statement of Operations.
Compliance Services
ALPS provides services that assist the Fund’s chief compliance officer in monitoring and testing the policies and procedures of the Fund in conjunction with requirements under Rule 38a-1 under the 1940 Act and receives an annual base fee. ALPS is reimbursed for certain out-of-pocket expenses by the Fund. Compliance service fees paid by the Fund for the year ended April 30, 2016 are disclosed in the Statement of Operations.
Principal Financial Officer
ALPS receives an annual fee for providing principal financial officer services to the Fund. Principal financial officer fees paid by the Fund for the year ended April 30, 2016 are disclosed in the Statement of Operations.
Distributor
ALPS Distributors, Inc. (“ADI” or the “Distributor”) (an affiliate of ALPS) acts as the distributor of the Fund’s shares pursuant to a Distribution Agreement with the Trust on behalf of the Fund. Shares are sold on a continuous basis by ADI as agent for the Fund, and ADI has agreed to use its best efforts to solicit orders for the sale of Fund’s shares, although it is not obliged to sell any particular amount of shares. ADI is not entitled to any compensation for its services as Distributor. ADI is registered as a broker-dealer with the U.S. Securities and Exchange Commission.
8. INDEMNIFICATIONS
Under the Trust’s organizational documents, its officers and Trustees are indemnified against certain liability arising out of the performance of their duties to the Trust. Additionally, in the normal course of business, the Trust enters into contracts with service providers that may contain general indemnification clauses which may permit indemnification to the extent permissible under applicable law. The Trust’s maximum exposure under these arrangements is unknown, as this would involve future claims that may be made against the Trust that have not yet occurred.
| | |
| | | |
Annual Report | April 30, 2016 | | 65 |
| | |
| Redmont Resolute Fund II | | Report of Independent Registered Accounting Firm |
| | April 30, 2016 |
To the Shareholders and Board of Trustees of Financial Investors Trust:
We have audited the accompanying statement of assets and liabilities, including the schedule of investments, of Redmont Resolute Fund II (the “Fund”), one of the portfolios constituting Financial Investors Trust, as of April 30, 2016, and the related statement of operations for the year then ended, the statements of changes in net assets for each of the two years in the period then ended, and the financial highlights for each of the four years in the period then ended and for the period from December 30, 2011 (inception) to April 30, 2012. These financial statements and financial highlights are the responsibility of the Fund’s management. Our responsibility is to express an opinion on these financial statements and financial highlights based on our audits.
We conducted our audits in accordance with the standards of the Public Company Accounting Oversight Board (United States). Those standards require that we plan and perform the audit to obtain reasonable assurance about whether the financial statements and financial highlights are free of material misstatement. The Fund is not required to have, nor were we engaged to perform, an audit of its internal control over financial reporting. Our audits included consideration of internal control over financial reporting as a basis for designing audit procedures that are appropriate in the circumstances, but not for the purpose of expressing an opinion on the effectiveness of the Fund’s internal control over financial reporting. Accordingly, we express no such opinion. An audit also includes examining, on a test basis, evidence supporting the amounts and disclosures in the financial statements, assessing the accounting principles used and significant estimates made by management, as well as evaluating the overall financial statement presentation. Our procedures included confirmation of securities owned as of April 30, 2016, by correspondence with the custodian and brokers; when replies were not received from brokers, we performed other auditing procedures. We believe that our audits provide a reasonable basis for our opinion.
In our opinion, the financial statements and financial highlights referred to above present fairly, in all material respects, the financial position of Redmont Resolute Fund II of Financial Investors Trust as of April 30, 2016, the results of its operations for the year then ended, the changes in its net assets for each of the two years in the period then ended, and the financial highlights for each of the four years in the period then ended and for the period from December 30, 2011 (inception) to April 30, 2012, in conformity with accounting principles generally accepted in the United States of America.
DELOITTE & TOUCHE LLP
Denver, Colorado
June 28, 2016
| | |
| Redmont Resolute Fund II | | Disclosure Regarding Approval of Fund Advisory Agreements |
| | April 30, 2016 (Unaudited) |
On December 15, 2015, the Trustees met in person to discuss, among other things, the approval of the investment advisory agreement between the Trust and Highland Associates, Inc. (the “Adviser”) (the “Investment Advisory Agreement”), the investment sub-advisory agreement among the Trust, the Adviser and Robeco Investment Management, Inc. (“Robeco”) and the investment sub-adviser agreement among the Trust, the Adviser and PineBridge Investments LLC (“PineBridge”), in accordance with Section 15(c) of the Investment Company Act of 1940, as amended. The Independent Trustees met with independent legal counsel during executive session and discussed the Investment Advisory Agreement and the Investment Sub-Advisory Agreements and other related materials.
In renewing and approving the Investment Advisory Agreement with the Adviser, the Investment Sub-Advisory Agreement with Robeco and the Investment Sub-Advisory Agreement with Pinebridge, the Trustees, including the Independent Trustees, considered the following factors with respect to the Redmont Resolute Fund II (the “Redmont Fund):
Investment Advisory and Sub-Advisory Fee Rate: The Trustees reviewed and considered the contractual advisory fee rates paid by the Trust, on behalf of the Redmont Fund, to the Adviser of 1.50% of the Redmont Fund’s daily average net assets, in light of the extent and quality of the advisory services provided by the Adviser to the Redmont Fund. The Trustees also reviewed and considered the contractual sub-advisory fee rates paid by the Adviser to Robeco of 1.25% of Redmont Resolute Fund II’s daily average net assets allocated to Robeco for the first $50 million, and 1.00% of Redmont Resolute Fund II’s daily average net assets allocated to Robeco above $50 million, in light of the extent and quality of the advisory services provided by Robeco to Redmont Resolute Fund II. The Trustees also reviewed and considered the contractual annual sub-advisory fee paid by the Adviser to PineBridge of 0.55% of the Redmont Fund’s daily average net assets allocated to PineBridge for the first $50 million, and 0.50% of the balance of the Redmont Fund’s daily average net assets allocated to PineBridge above $50 million, in light of the extent and quality of the advisory services provided by it to the Redmont Fund.
The Board received and considered information including a comparison of the Redmont Fund’s contractual and actual advisory fees and overall expenses with those of funds in the expense groups and universes of funds provided by an independent provider of investment company data (the “Independent Data Provider”). The Trustees noted that both of the Redmont Fund’s contractual advisory fee rates were above the Independent Data Provider peer group averages and below the Independent Data Provider peer group medians of contractual advisory fee rates.
Total Expense Ratios: Based on such information, the Trustees further reviewed and considered the total expense ratios (after waivers) of 0.23% for Class I of Redmont Resolute Fund II. The Trustees noted that the total expense ratios (after waivers) for Redmont Resolute Fund II’s Class I shares were below the Independent Data Provider peer group average and median total expense ratios (after waivers).
Nature, Extent and Quality of the Services under the Investment Advisory and Sub-Advisory Agreements: The Trustees received and considered information regarding the nature, extent and quality of services to be provided to the Redmont Fund under the Investment Advisory and Sub-Advisory Agreements. The Trustees reviewed certain background materials supplied by the Adviser, Robeco and PineBridge in their presentations, including their Forms ADV.
The Trustees reviewed and considered the Adviser’s, Robeco’s and PineBridge’s investment advisory personnel, their history as asset managers and their performance and the amount of assets currently under management by the Adviser, Robeco and PineBridge and their affiliated entities. The Trustees also reviewed the research and decision-making processes utilized by the Adviser, Robeco and PineBridge, including the methods adopted to seek to achieve compliance with the investment objectives, policies and restrictions of the Redmont Funds.
The Trustees considered the background and experience of the Adviser’s, Robeco’s and PineBridge’s management in connection with the Redmont Fund, including reviewing the qualifications, backgrounds and responsibilities of the management team primarily responsible for the day-to-day portfolio management of the Redmont Fund and the extent of the resources devoted to research and analysis of actual and potential investments.
The Trustees also reviewed, among other things, the Adviser’s, Robeco’s and PineBridge’s insider trading policies and procedures and their Codes of Ethics.
Performance: The Trustees reviewed performance information for the Redmont Fund for the 3-month, 1-year and 3-year periods ended September 30, 2015. That review included a comparison of the Redmont Fund’s performance to the performance of a group of comparable funds selected by the Independent Data Provider. The Trustees noted that the performance of the Redmont Fund’s Class I shares was below its Independent Data Provider peer group averages and medians for the 3-month, 1-year and 3-year periods ended September 30, 2015. The Trustees also considered the Adviser’s, Robeco’s and PineBridge’s discussion of the Redmont Fund’s underlying portfolio diversification categories, its top contributors and top detractors, as well as the Adviser’s, Robeco’s and PineBridge’s performance and reputation generally and their investment techniques, risk management controls and decision-making processes.
| | |
| | | |
Annual Report | April 30, 2016 | | 67 |
| | |
| Redmont Resolute Fund II | | Disclosure Regarding Approval of Fund Advisory Agreements |
| | April 30, 2016 (Unaudited) |
Comparable Accounts: The Trustees noted certain information provided by the Adviser, Robeco and PineBridge regarding fees charged to its other clients utilizing a strategy similar to that employed by the Redmont Fund.
Profitability: The Trustees received and considered retrospective and projected profitability analyses prepared by the Adviser, Robeco and PineBridge based on the fees payable under the Investment Advisory Agreement with the Adviser and the Investment Sub-Advisory Agreements with each of Robeco and PineBridge, with respect to each Redmont Fund, as applicable. The Trustees considered the profits, if any, anticipated to be realized by the Adviser, Robeco and PineBridge in connection with the operation of the Redmont Fund. The Board then reviewed the Adviser’s unaudited balance sheet as of September 30, 2015 and Profit and Loss for January through September 2015 in order to analyze the financial condition and stability and profitability of the Adviser. The Board also reviewed Robeco’s and PineBridge’s 2013 and 2014 financial statements in order to analyze the financial condition and stability and profitability of Robeco and PineBridge.
Economies of Scale: The Trustees considered whether economies of scale in the provision of services to the Redmont Fund will be passed along to the shareholders under the agreements.
Other Benefits to the Adviser: The Trustees reviewed and considered any other incidental benefits derived or to be derived by the Adviser from its relationship with the Redmont Fund, including whether soft dollar arrangements were used.
In renewing the Adviser as the investment adviser of the Redmont Fund, Robeco and PineBridge as the sub-adviser of the Redmont Fund and the fees charged under the Investment Advisory and Sub-Advisory Agreements, the Trustees concluded that no single factor reviewed by the Trustees was identified by the Trustees to be determinative as the principal factor in whether to renew the Investment Advisory and Sub-Advisory Agreements. Further, the Independent Trustees were advised by separate independent legal counsel throughout the process. The Trustees, including all of the Independent Trustees, concluded that:
| | ● | | the contractual advisory fee rates were below the Independent Data Provider peer group averages and medians for the Redmont Fund; |
| | ● | | Robeco’s and PineBridge’s fees under their respective sub-advisory agreements are paid directly by the Adviser; |
| | ● | | the total expense ratios (after waivers) for Redmont Fund’s Class I shares were below the Independent Data Provider peer group average and median total expense ratios (after waivers); |
| | ● | | the nature, extent and quality of services rendered by the Adviser, Robeco and PineBridge under the Investment Advisory and Sub-Advisory Agreements, respectively, with respect to the Redmont Fund, as applicable, were adequate; |
| | ● | | the performance of Redmont Fund’s Class I shares were below their Independent Data Provider peer group averages and medians for the 3-month, 1-year and 3-year periods ended September 30, 2015; |
| | ● | | bearing in mind the limitations of comparing different types of managed accounts and the different levels of service typically associated with such accounts, the fee structures applicable to the Adviser’s, Robeco’s and PineBridge’s other clients employing a comparable strategy to the Redmont Fund were not indicative of any unreasonableness with respect to the advisory and sub-advisory fees payable by the Redmont Fund; |
| | ● | | the profit, if any, realized by the Adviser, Robeco and PineBridge in connection with the operation of the Redmont Fund, as applicable, is not unreasonable to the Redmont Fund; and |
| | ● | | there were no material economies of scale or other incidental benefits accruing to the Adviser, Robeco and PineBridge in connection with their relationship with the Redmont Fund. |
Based on the Trustees’ deliberations and their evaluation of the information described above, the Trustees, including all of the Independent Trustees, concluded that the Adviser’s, Robeco’s and PineBridge’s compensation for investment advisory and sub-advisory services is consistent with the best interests of the Redmont Fund and its shareholders.
| | |
| Redmont Resolute Fund II | | Additional Information |
| | April 30, 2016 (Unaudited) |
1. FUND HOLDINGS
The Fund files its complete schedule of portfolio holdings with the Securities and Exchange Commission (the “SEC”) for the first and third quarters of each fiscal year on Form N-Q within 60 days after the end of the period. Copies of the Fund’s Form N-Q are available without charge on the SEC website at http://www.sec.gov. You may also review and copy the Form N-Q at the SEC’s Public Reference Room in Washington, D.C. For more information about the operation of the Public Reference Room, please call the SEC at 1-800-SEC-0330.
2. FUND PROXY VOTING POLICIES, PROCEDURES AND SUMMARIES
Fund policies and procedures used in determining how to vote proxies and information regarding how each of the Funds voted proxies relating to portfolio securities during the most recent prior 12-month period ending June 30 are available without charge, (1) upon request, by calling (toll-free) (866) 759-5679 and (2) on the SEC’s website at http://www.sec.gov.
3. TAX DESIGNATIONS
The Fund designates the following for federal income tax purposes for distributions made during the calendar year ended December 31, 2015:
| | | | | | | | | | |
| | | QDI | | | DRD | | | |
|
Redmont Resolute Fund II | | | 21.80 | % | | | 9.59 | % | | |
In early 2016, if applicable, shareholders of record received this information for the distribution paid to them by the Fund during the calendar year 2015 via Form 1099. The Fund will notify shareholders in early 2017 of amounts paid to them by the Funds, if any, during the calendar year 2016.
Pursuant to Section 852(b)(3) of the Internal Revenue Code, Redmont Resolute II designates $10,214,481 as long-term capital gain distributions.
| | |
| | | |
Annual Report | April 30, 2016 | | 69 |
| | |
| Redmont Resolute Fund II | | Trustees & Officers |
| | April 30, 2016 (Unaudited) |
Additional information regarding the Fund’s trustees is included in the Statement of Additional Information, which can be obtained without charge by calling 855-845-9444.
INDEPENDENT TRUSTEES
| | | | | | | | | | |
Name, Address* & Year of Birth | | Position(s)
Held with
Fund | | Term of Office and Length of Time Served | | Principal
Occupation(s) During Past 5 Years** | | Number of
Funds in
Fund
Complex
Overseen
by Trustee*** | | Other Directorships Held
by Trustee During Past 5 Years** |
Mary K. Anstine, 1940 | | Trustee | | Ms. Anstine was elected at a special meeting of shareholders held on March 21, 1997 and re-elected at a special meeting of shareholders held on August 7, 2009. | | Ms. Anstine was formerly an Executive Vice President of First Interstate Bank of Denver until 1994, President/Chief Executive Officer of HealthONE Alliance, Denver, Colorado, from 1994 to 2004, and has been retired since 2004. Ms. Anstine is also Trustee/Director of AV Hunter Trust and Colorado Uplift Board. Ms. Anstine was formerly a Director of the Trust Bank of Colorado (later purchased and now known as Northern Trust Bank), HealthONE and Denver Area Council of the Boy Scouts of America, and a member of the American Bankers Association Trust Executive Committee. | | 34 | | Ms. Anstine is a Trustee of ALPS ETF Trust (20 funds); ALPS Variable Investment Trust (9 funds); Reaves Utility Income Fund (1 fund); and Westcore Trust (12 funds). |
John R. Moran, Jr., 1930 | | Trustee | | Mr. Moran was elected at a special meeting of shareholders held on March 21, 1997 and re-elected at a special meeting of shareholders held on August 7, 2009. | | Mr. Moran formerly served as President and CEO of The Colorado Trust, a private foundation serving the health and hospital community in the state of Colorado, from 1991 to 2007. During his career as an attorney from 1958 to 1991, Mr. Moran was formerly a partner with the firm of Kutak Rock & Campbell in Denver, Colorado and a member of the Colorado House of Representatives. Currently, Mr. Moran is a member of the Treasurer’s Investment Advisory Committee for the University of Colorado. | | 34 | | None. |
| | |
| Redmont Resolute Fund II | | Trustees & Officers |
| | April 30, 2016 (Unaudited) |
INDEPENDENT TRUSTEES
| | | | | | | | | | |
Name, Address* & Year of Birth | | Position(s)
Held with
Fund | | Term of Office and Length of Time Served | | Principal
Occupation(s) During Past 5 Years** | | Number of
Funds in
Fund
Complex
Overseen
by Trustee*** | | Other Directorships Held
by Trustee During Past 5 Years** |
Jeremy W. Deems, 1976 | | Trustee | | Mr. Deems was appointed as a Trustee at the March 11, 2008 meeting of the Board of Trustees and elected at a special meeting of shareholders held on August 7, 2009. | | Mr. Deems is the Co-Founder, Chief Operations Officer and Chief Financial Officer of Green Alpha Advisors, LLC, a registered investment advisor, and Co-Portfolio Manager of the Shelton Green Alpha Fund. Prior to joining Green Alpha Advisors, Mr. Deems was CFO and Treasurer of Forward Management, LLC, ReFlow Management Co., LLC, ReFlow Fund, LLC, a private investment fund, and Sutton Place Management, LLC, an administrative services company, from 1998 to June 2007. From 2004 to 2005, Mr. Deems also served as Treasurer of the Forward Funds and the Sierra Club Funds. | | 34 | | Mr. Deems is a Trustee of ALPS ETF Trust (20 funds); ALPS Variable Investment Trust (9 funds), Reaves Utility Income Fund (1 fund) and Clough Funds Trust (1 fund). |
Jerry G. Rutledge, 1944 | | Trustee | | Mr. Rutledge was elected at a special meeting of shareholders held on August 7, 2009. | | Mr. Rutledge is the President and owner of Rutledge’s Inc., a retail clothing business. Mr. Rutledge is currently Director of the American National Bank. He was from 1994 to 2007 a Regent of the University of Colorado. | | 34 | | Mr. Rutledge is a Trustee of Principal Real Estate Fund (1 fund), Clough Global Allocation Fund (1 fund), Clough Global Equity Fund (1 fund) and Clough Global Opportunities Fund (1 fund). |
Michael “Ross” Shell, 1970 | | Trustee | | Mr. Shell was elected at a special meeting of shareholders held on August 7, 2009. | | Mr. Shell is Founder and CEO of Red Idea, LLC, a strategic consulting/early stage venture firm (since June 2008). From 1999 to 2009, he was a part-owner and Director of Tesser, Inc., a brand agency. From December 2005 to May 2008, he was Director, Marketing and Investor Relations, of Woodbourne, a REIT/real estate hedge fund and private equity firm. Prior to this, from May 2004 to November 2005, he worked as a business strategy consultant; from June 2003 to April 2004, he was on the Global Client Services team of IDEO, a product design/innovation firm; and from 1999 to 2003, he was President of Tesser, Inc. Mr. Shell graduated with honors from Stanford University with a degree in Political Science. | | 34 | | None. |
| | |
| | | |
Annual Report | April 30, 2016 | | 71 |
| | |
| Redmont Resolute Fund II | | Trustees & Officers |
| | April 30, 2016 (Unaudited) |
INTERESTED TRUSTEE
| | | | | | | | | | |
Name, Address* & Age | | Position(s)
Held with
Fund | | Term of Office and Length of Time Served | | Principal
Occupation(s) During Past 5 Years** | | Number of
Funds in
Fund
Complex
Overseen by
Trustee*** | | Other Directorships Held by Trustee |
Edmund J. Burke, 1961 | | Trustee, Chairman and President | | Mr. Burke was elected as Chairman at the August 28, 2009 meeting of the Board of Trustees. Mr. Burke was elected as Trustee at a special meeting of shareholders held on August 7, 2009. Mr. Burke was elected President of the Trust at the December 17, 2002 meeting of the Board of Trustees. | | Mr. Burke is President and a Director of ALPS Holdings, Inc. (“AHI”) (since 2005) and Director of Boston Financial Data Services, Inc. (“BFDS”), ALPS Advisors, Inc. (“AAI”), ALPS Distributors, Inc. (“ADI”), ALPS Fund Services, Inc. (“AFS”) and ALPS Portfolio Solutions Distributor, Inc. (“APSD”) and from 2001-2008, was President of AAI, ADI, AFS and APSD. Because of his positions with AHI, BFDS, AAI, ADI, AFS and APSD, Mr. Burke is deemed an affiliate of the Trust as defined under the 1940 Act. Mr. Burke is Trustee and President of the Clough Global Allocation Fund (Trustee since 2006; President since 2004); Trustee and President of the Clough Global Equity Fund (Trustee since 2006; President since 2005); Trustee and President of the Clough Global Opportunities Fund (since 2006); Trustee of the Liberty All-Star Equity Fund; and Director of the Liberty All-Star Growth Fund, Inc. | | 34 | | Mr. Burke is a Trustee of Clough Global Allocation Fund (1 fund); Clough Global Equity Fund (1 fund); Clough Global Opportunities Fund (1 fund); Liberty All-Star Equity Fund (1 fund) and Clough Funds Trust (1 fund); and Director of the Liberty All-Star Growth Fund, Inc. (1 fund). |
| | |
| Redmont Resolute Fund II | | Trustees & Officers |
| | April 30, 2016 (Unaudited) |
OFFICERS
| | | | | | |
Name, Address* & Year of Birth | | Position(s) Held with Fund �� | | Term of Office and
Length of Time Served | | Principal Occupation(s) During Past 5 Years** |
Kimberly R. Storms, 1972 | | Treasurer | | Ms. Storms was elected Treasurer of the Trust at the March 12, 2013 meeting of the Board of Trustees. | | Ms. Storms is Senior Vice President - Director of Fund Administration of ALPS. Because of her position with ALPS, Ms. Storms is deemed an affiliate of the Trust as defined under the 1940 Act. Ms. Storms is also Treasurer of Liberty All-Star Equity Fund, Liberty All-Star Growth Fund, Inc. and ALPS Series Trust. Ms. Storms also serves as a Board member and Treasurer of The Center for Trauma & Resilience, a nonprofit agency. |
JoEllen L. Legg, 1961 | | Secretary | | Ms. Legg was elected Secretary of the Trust at the September 15, 2015 meeting of the Board of Trustees. | | Ms. Legg joined ALPS in October 2007 and is currently Vice President, Assistant General Counsel of ALPS. Prior to joining ALPS, Ms. Legg served as Senior Counsel - Law (Corporate & Securities) for Adelphia Communications Corporation (February 2005 - March 2007). Prior to this, Ms. Legg held associate positions at Fried Frank Harris Shriver & Jacobson LLP (1998 - 2004) and at Patton Boggs LLP (2004 - 2005). Because of her position with ALPS, Ms. Legg is deemed an affiliate of the Trust as defined under the 1940 Act. Ms. Legg is also the Secretary of ALPS Series Trust and Reaves Utility Income Fund. |
Ted Uhl, 1974 | | Chief Compliance Officer (“CCO”) | | Mr. Uhl was appointed CCO of the Trust at the June 8, 2010 meeting of the Board of Trustees. | | Mr. Uhl joined ALPS in October 2006, and is currently Deputy Compliance Officer of ALPS. Prior to his current role, Mr. Uhl served as Senior Risk Manager for ALPS from October 2006 until June 2010. Because of his position with ALPS, Mr. Uhl is deemed an affiliate of the Trust as defined under the 1940 Act. Mr. Uhl is also CCO of the Reaves Utility Income Fund, Centre Funds and Transparent Value Trust. |
Jennell Panella, 1974 | | Assistant Treasurer | | Ms. Panella was elected Assistant Treasurer of the Trust at the September 15, 2015 meeting of the Board of Trustees. | | Ms. Panella joined ALPS in June 2012 and is currently Fund Controller of ALPS Fund Services, Inc. Prior to joining ALPS, Ms. Panella served as Financial Reporting Manager for Parker Global Strategies, LLC (2009-2012). Because of her position with ALPS, Ms. Panella is deemed an affiliate of the Trust as defined under the 1940 Act. Ms. Panella also serves as Assistant Treasurer of James Advantage Funds. |
Nate Mandeville, 1977 | | Assistant Treasurer | | Mr. Mandeville was elected Assistant Treasurer of the Trust at the September 15, 2015 meeting of the Board of Trustees. | | Mr. Mandeville joined ALPS in December 2013 and is Fund Controller for ALPS. Prior to joining ALPS, Mr. Mandeville worked for Great-West Financial (2011-2013), Virtuoso Sourcing Group (2008-2011) and Janus Capital Group (2000-2008). Because of his position with ALPS, Mr. Mandeville is deemed an affiliate of the Trust as defined under the 1940 Act. Mr. Mandeville also serves as Assistant Treasurer of ALPS Series Trust. |
| | |
| | | |
Annual Report | April 30, 2016 | | 73 |
| | |
| Redmont Resolute Fund II | | Trustees & Officers |
| | April 30, 2016 (Unaudited) |
OFFICERS
| | | | | | |
Name, Address* & Year of Birth | | Position(s) Held with Fund | | Term of Office and
Length of Time Served | | Principal Occupation(s) During Past 5 Years** |
Sharon Akselrod, 1974 | | Assistant Secretary | | Ms. Akselrod was elected Assistant Secretary of the Trust at the September 15, 2015 meeting of the Board of Trustees. | | Ms. Akselrod joined ALPS in August 2014 and is currently Senior Investment Company Act Paralegal of ALPS. Prior to joining ALPS, Ms. Akselrod served as Corporate Governance and Regulatory Associate for Nordstrom fsb (2013-2014) and Senior Legal Assistant – Legal Manager for AXA Equitable Life Insurance Company (2008-2013). Because of her position with ALPS, Ms. Akselrod is deemed an affiliate of the Trust as defined under the 1940 Act. |
Sareena Khwaja-Dixon 1980 | | Assistant Secretary | | Ms. Khwaja-Dixon was elected Assistant Secretary of the Trust at the December 15, 2015 meeting of the Board of Trustees. | | Ms. Khwaja-Dixon joined ALPS in August 2015 and is currently Senior Counsel and Vice President of ALPS. Prior to joining ALPS, Ms. Khwaja-Dixon served as a Senior Paralegal/Paralegal for Russell Investments (2011-2015). Because of her position with ALPS, Ms. Khwaja-Dixon is deemed an affiliate of the Trust as defined under the 1940 Act. |
| * | All communications to Trustees and Officers may be directed to Financial Investors Trust c/o 1290 Broadway, Suite 1100, Denver, CO 80203. |
| ** | This is the period for which the Trustee or Officer began serving the Trust. Each Trustee serves an indefinite term, until his successor is elected. Officers are elected on an annual basis. |
| *** | The Fund Complex includes all series of the Trust (currently 34) and any other investment companies for which any Trustee serves as trustee for and which Highland Associates, Inc., Robeco Investment Management, Inc. and/or Pinebridge Investment LLC provides investment advisory services (currently none). |
Page Intentionally Left Blank


| | | | | | |
| | ANNUAL REPORT | | |
| | |
| | April 30, 2016 | | |
Seafarer Overseas Growth and Income Fund | | |
| | | |
| | Investor Class | | SFGIX | | |
| | | |
| | Institutional Class | | SIGIX | | |

TABLE OF CONTENTS
| | |
| Seafarer Overseas Growth and Income Fund | | Letter to Shareholders |
April 30, 2016
LETTER TO SHAREHOLDERS
May 15, 2016
Dear Fellow Shareholders,
I am honored to address you again on behalf of the Seafarer Overseas Growth and Income Fund. This report addresses the Fund’s 2015-16 fiscal year (May 1, 2015 to April 30, 2016).
During the fiscal year, the Fund declined -8.32%, while the Fund’s benchmark, the MSCI Emerging Markets Total Return Index, fell -17.56%.1 By way of broader comparison, the S&P 500 Index increased 1.21%.
From the Fund’s inception (February 15, 2012) through the end of the fiscal year (April 30, 2016), the Fund generated an annualized rate of return of 5.88%.2 The benchmark index fell at an annualized rate of -2.64% over the same period.
The Fund began the fiscal year with a net asset value of $12.66 per share. During the ensuing twelve months, the Fund paid two distributions: $0.060 per share in June 2015 and $0.081 per share in December 2015. Those payments brought the cumulative distribution per share, as measured from the Fund’s inception to the end of the fiscal year, to $1.172. The Fund finished the fiscal year with a value of $11.46 per share.3
Performance Review
Everyone at Seafarer is proud of the Fund and its performance record. Yet as I write this letter, I do so with a degree of disappointment and frustration. The emerging markets have been a poor investment destination over the past four years, and it is wearying to contemplate a fiscal year in which the Fund generated a substantial loss.
There are a number of considerations that place the Fund’s performance in better stead: during the fiscal year, the Fund outpaced its benchmark in relative terms by a substantial margin; as of the fiscal year end, the Fund produced annualized gains since its inception, even as the index failed to do so; and over its life, the Fund’s performance has been substantially less volatile than that of the index.
Yet even if the Fund’s long-term performance is thus far in keeping with its objectives, I am acutely aware that many shareholders have subscribed to the Fund only recently. Such shareholders only know the Fund for the losses it has wrought within their portfolios. As such, I sincerely appreciate the patience afforded by all, given the challenging investment climate within the developing world.
China’s economy and its stock markets cast a substantial shadow over both the Fund and the index during the fiscal year. Early in 2015, immediately prior to the commencement of the fiscal period, Chinese markets rose rapidly for a variety of reasons, forming a mini-bubble of sorts. The bubble burst in the middle of May 2015, ostensibly when officials sought to restrict access to the margin financing that had stoked frenzied trading among small investors. Chinese equities plunged shortly thereafter, with no safe harbor in the market.
Prior to the collapse, I was aware that valuation conditions were extreme and warranted caution, even as I did not know when or how a correction might occur. Given such uncertainty, I attempted to mitigate risk by reducing the portfolio’s allocation to the China, and by emphasizing those positions I thought offered “defensive valuations.” At the time, I thought certain securities might have prices low enough and dividend yields high enough to partially withstand the correction in the market. Unfortunately, this tactic proved fruitless. In May 2015, the Fund held eight China-linked securities (seven stocks listed on the Hong Kong Stock Exchange, and one convertible bond). All the equities fell in tandem with the broader market, and while the bond fared somewhat better, the Fund’s “defensive”
| | |
| Annual Report – April 30, 2016 | | 1 |
| | |
| Seafarer Overseas Growth and Income Fund | | Letter to Shareholders |
April 30, 2016
positions in China were not the haven I imagined them to be. Still, by the middle of the fiscal year, the Fund was ahead of the index, even as the emerging markets declined broadly in sympathy with China’s correction.
As the emerging markets slumped into the late summer of 2015, they were further rattled by the announcement that China would sever the long-standing exchange rate relationship between its currency, the renminbi, and the U.S. dollar. For the 20 years preceding the August announcement, China either formally pegged its currency to the dollar, or it maintained a “dirty peg,” an arrangement in which the authorities made small, manual adjustments to the currency’s value versus the dollar. However, the announcement in August heralded the end of the dirty peg: the Chinese authorities announced the currency would instead adopt a market-based arrangement – still subject to certain restrictions and trading guidelines – but in which the market would play a dominant role in setting the daily value of the currency. I describe the new system as a “dirty float,” as opposed to a freely-floating currency.
Unfortunately for China, the implementation of the new currency arrangement was not well communicated, and the timing shocked many observers; the new policy was poorly received. (For the record: I have always thought China would announce exactly this policy at a time of perceived weakness, when external observers least expected it. The only thing that shocked me about the announcement was that it occurred at least three years earlier than I had imagined – in other words, China adopted this essential reform faster and more aggressively than I ever thought possible.)
The furor over the change has since died down, in large part because markets were so rattled that China felt obliged to temporarily reinstate some of the stability associated with the former “dirty peg” system. However, in my view, no one should suffer under the illusion that China has reversed course. Last August, China ended what was the most important, de-facto currency union in the world – the informal, but rigid link between the dollar and the renminbi. For more on the potential consequences of China’s decision, please see my Letter to Shareholders as of October 31, 2015, particularly the section entitled “China’s Prominence.”4
Stocks markets in the developing world enjoyed a brief period of calm during the late fall of 2015. However, this calm was shattered in the first weeks of 2016 when Chinese stocks plunged again, mysteriously. At the time, pundits speculated that China’s currency was to blame: the popular view was that the renminbi was unstable, and would soon come unglued. Many speculated that the currency’s instability was somehow instigating the panicked downturn in Chinese equities. That explanation was widespread, but it lacked merit. The renminbi was nowhere near as unstable as the pundits then suggested; and the small fluctuations that occurred did not provide a satisfactory explanation for the swift and broad-based decline in Chinese stocks. Simply put, this was not a case where the tail was wagging the dog.
I would suggest two possible causes for China’s swoon in January.5 First, the behaviors of China’s currency and equity markets were both consistent with deteriorating domestic liquidity conditions. The erratic behavior of the two markets might portend distress within China’s financial sector – not necessarily a “hard economic landing” (e.g. an abrupt economic deceleration), but more likely acute liquidity distress, the sort that might trigger a major bankruptcy (or chain of bankruptcies). Second, perceptions of instability and schisms within the senior leadership of the Chinese government might also have destabilized markets. The two scenarios are only speculation on my part, though I believe both hold a degree of truth.
During January’s sharp decline, the Fund held up better than the market overall, mainly because of the limited, “defensive” exposure to China that was implemented prior to the beginning of the fiscal year. However, in short order, China no longer dominated headlines within the developing world; by the end of January, Brazil was at the forefront, as a long-simmering graft scandal there came to a head.
| | |
| 2 | | (855) 732-9220 seafarerfunds.com |
| | |
| Seafarer Overseas Growth and Income Fund | | Letter to Shareholders |
April 30, 2016
A dogged team of prosecutors laid out evidence against senior political leaders previously deemed untouchable. The investigation culminated in an impeachment vote, and President Rousseff – the architect of many economic policies that have gone awry – was suspended from office. Brazilian stocks and the local currency moved swiftly higher, driven by the speculative hope that a new government might arrest the country’s economic decline. The Fund and the benchmark both rallied in response, and most emerging markets – including China – climbed from the lows of January.
The Fund sustained its outperformance through the end of the fiscal year because of its substantial exposure to Brazilian stocks. For the past two years, the Fund maintained a meaningful allocation to the country, despite its very weak performance as measured in dollars. The Fund’s goal was to accumulate shares of profitable companies, capable of generating reasonable profits and dividends even amid the country’s economic crisis.
By holding the shares of “survivors” until the economy stabilized, I hoped the Fund would profit from the eventual recovery of such companies. It was not my intention for the Fund to speculate on the political environment in Brazil, nor did I wish to gamble on the short-term performance of the economy. Yet Brazilian stocks reacted swiftly and positively to the mere idea that the country’s economic distress might diminish, driven by a prospective change in government. The market’s sharp recovery seemed to confirm the basic cheapness that I thought was present in many Brazilian equities.
Still, political speculation was at the root of the stock market’s rally, not a recovery in economic fundamentals. The Fund’s allocation to Brazil was no accident, and happily, that exposure had a beneficial impact on performance versus the index. Nevertheless, after the rally subsided I reduced the Fund’s allocation to Brazil, as I did not wish for a large and growing portion of its capital to be “held hostage” to the rapidly vacillating sentiment associated with the country’s politics. Accordingly, the Fund’s allocation to Brazilian equities (well over 15% after the market’s surge) was trimmed at the margin, and the proceeds were distributed broadly throughout the remainder of the portfolio.
Amid a fiscal year dominated by such volatility, two of the Fund’s best performing positions warrant description. Aselsan and Arçelik are mid-capitalization companies located in Turkey. Aselsan is a systems engineering company; Arçelik is a maker of “white good” consumer appliances, such as refrigerators, air conditioners and washing machines. The Fund has held the former position for four years, and the Fund added the latter two and a half years ago. When the two positions were added to the Fund, neither was remarkable for its obvious cheapness or for its pronounced growth prospects. Further, both were domiciled in a country that was struggling with political crisis and bouts of severe currency weakness. Neither company was particularly well known within the global investment community, in large part because both then had (and still have) capitalizations below $5 billion, lower than the minimum thresholds that global funds often set. Yet both have contributed handsomely to the Fund’s long-term returns, arguably because both embody the growth and income strategy that drives the Fund.
Despite operating in different industries, and despite facing uncertain conditions in their respective markets, both firms enjoyed strong competitive advantages and tangible, incremental opportunities for growth. The steady nature of their businesses meant that each was able to realize meaningful expansion over the past few years, even as many industries in the developing world experienced contraction amid waning demand and extreme currency fluctuations.
The two companies’ stable revenues and disciplined cost controls allowed for the production of healthy profit margins amid the market turmoil. Neither business has extensive requirements for capital investment, and thus both were able to translate a large portion of their earnings into free cash flows. Most importantly, the companies enjoyed sufficient liquidity and solvency, enabling them to pay out a substantial portion of their cash flows consistently to shareholders. The companies’ consistent dividends burnished the liquidity of their shares, buffering them against the extreme volatility that has been evident for the past four years.
| | |
| Annual Report – April 30, 2016 | | 3 |
| | |
| Seafarer Overseas Growth and Income Fund | | Letter to Shareholders |
April 30, 2016
The balanced, multi-dimensional set of characteristics exhibited by these two companies exemplifies what I search for in the growth and income strategy. The Fund was able to initiate (and subsequently augment) both positions at reasonable valuations, particularly as assessed by prospective cash flow yield and dividend yield. The Fund’s strategy usually works best when reasonable valuations (defined primarily by yield) can be overlaid on companies with sustainable growth in revenues and cash flow. Ultimately, I think this set of conditions is what allowed Aselsan and Arçelik to stand out amid a year fraught with losses – despite being two relatively unknown, small-to-mid sized companies, hailing from a part of the world that many professional investors deem too risky to contemplate.
Seafarer’s Evolution
The assets in the Seafarer Overseas Growth and Income Fund grew considerably during the past fiscal year, from $183 million to $1,219 million. The firm is five years old. At the firm’s inception, I made plans for its future. I did not think the present scale would be attainable for many more years, if ever. We are grateful for the growth the firm has experienced, and for shareholders’ willingness to entrust us with their capital.
Seafarer’s growth has engendered interest in our plans for the company. We have developed a vision that should guide our firm’s development over the next fifteen years. I will share a brief outline of that vision below, particularly as it impacts four key areas: scale, strategies, team and culture.
Scale
Regarding scale: though the firm has already grown faster than expected, our long-term plan calls for further expansion. We take nothing for granted, especially the prospect of future growth. Nevertheless, we are preparing for a long-term vision in which the firm attains a scale that is somewhat larger than it is today. However, I am determined that the firm will remain, unmistakably, a “boutique” in both its investment practices and its relationship with shareholders and clients – and therefore there are definitive limits to the growth we will pursue.
We believe growth will afford two main benefits to shareholders and clients: better cost efficiencies and greater investment resources. One of the long-term goals of the firm is to lower the cost associated with overseas investment.6 Our analysis suggests that greater size will yield meaningful economies of scale, which we will reflect in lower costs to the firm’s clients over time. We also believe that additional scale will allow the firm to augment the resources of the firm in a beneficial manner, particularly with respect to technology systems and personnel. Seafarer is committed to making substantial investments in its research team and its technology over time, in keeping with its scale.
As the firm pursues new avenues for growth, we intend to explore opportunities to attract clients abroad. We believe that diversification of the firm’s client base is essential to the firm’s long-term stability and strength; expansion overseas is one powerful way for us to diversify our business. Such efforts will undoubtedly introduce complexity to our business. However, we think this complexity will ultimately prompt us to serve all of our clients better, as we will continue to “raise the bar” with respect to our compliance standards and fiduciary obligations.
Strategies
Regarding strategies: the firm’s plans for the future include the management of at least two strategies, and perhaps one or two more beyond. Unlike some other small firms, I do not believe there is only “one right way” to invest in the emerging markets. Rather, our aim is to identify, study and exploit persistent market inefficiencies (i.e., inefficiencies we believe will endure 15 years or longer). Today, we are confident that there are at least two structural inefficiencies that we can harness to the benefit of our shareholders and clients; we intend to explore other possibilities over the next decade, and perhaps one or two will be manifest in new strategies.
| | |
| 4 | | (855) 732-9220 seafarerfunds.com |
| | |
| Seafarer Overseas Growth and Income Fund | | Letter to Shareholders |
April 30, 2016
Today, Seafarer is best known for its “Growth and Income” strategy. That strategy seeks to exploit a pervasive inefficiency whereby markets habitually undervalue companies growing at low but sustainable rates, and overvalue companies growing at high (but perhaps unsustainable) rates. Dividends and other current income act as a signal to identify and evaluate companies that might be capable of sustained growth.
I am pleased to introduce a second strategy at Seafarer, one that seeks “value” in the emerging markets. On May 31, 2016 Seafarer launched the Seafarer Overseas Value Fund. This strategy aims to exploit certain long-term structural changes in the developing world, changes that we believe will force various companies to realize a portion of the value that is embedded in their balance sheets. The strategy is founded on the premise that some shares have been overlooked because markets favor rapid growth prospects over balance sheet analysis. I am pleased to announce that my colleague, Paul Espinosa, will serve as Lead Manager to the new fund, and I will support him as the Fund’s Co-Manager.
Though Seafarer may one day expand beyond “Growth and Income” and “Value,” our vision does not allow for a plethora of strategies. Our curiosity and our desire to serve our clients and shareholders drive us to explore new possibilities; yet we are committed to being highly selective and responsible in our efforts. We will not proliferate strategies lightly.
Team
As the firm grows, so too will the team that supports the firm’s activities. Seafarer is committed to investing responsibly in its people, so as to ensure the organization is fit for long-term evolution. We are especially keen to expand the operational and administrative breadth of our team within the next 18 months.
Many investors are keen to understand how the investment research team might change or grow. The team will certainly expand, but at a measured pace.
I believe in teams comprised of highly-skilled generalists, in which all members are endowed with substantial authority and responsibility. I prefer to keep teams small to maximize communication, constructive criticism, decisiveness, and accountability. Small teams also tend to minimize politics and unnecessary bureaucracy. Our goal is to make informed decisions on a timely basis, something that I believe small teams do very well.
The expansion of the research team will be limited and selective. Our research process is one in which skilled analysts work to “discover” the rare securities that fit our strategic parameters over the long term. Accordingly, we see no need to “cover” the full extent of the emerging markets, as much of the universe is not germane to our investment strategies. We think a large team would do little to help our clients’ success, and might impede it.
Over time, the firm’s evolution will necessitate greater specialization by strategy. My intention is for the team to be comprised of generalists from a county/sector perspective, capable of analyzing a broad swathe of companies. Seafarer’s team will be organized by strategy, with portfolio managers and analysts named to clusters that support specific investment mandates and any associated portfolios.
As Seafarer’s research team grows, you will see it evolve in a manner that emphasizes accountability, integrity and strategic continuity. With this in mind, I am pleased to announce the promotion of Kate Jaquet and Paul Espinosa to Co-Managers for the Seafarer Overseas Growth and Income Fund. As lead manager of the Fund, I remain the author of its strategy. However, Kate and Paul will be afforded a higher degree of discretion in my planned absence (e.g. work-related travel or personal vacation). I have had the privilege to work alongside both for several years now, and both have developed a broad and deep understanding of the Growth and Income strategy, the Fund and its construction. I am very pleased to enact this promotion – Kate and Paul have earned it.
| | |
| Annual Report – April 30, 2016 | | 5 |
| | |
| Seafarer Overseas Growth and Income Fund | | Letter to Shareholders |
April 30, 2016
Apart from these promotions, I am pleased to welcome Jia Zhu to our research team as an Analyst. Jia joins us with a great deal of experience in East Asia, and she will contribute to our research efforts around the globe.
Culture
In my estimation, one of the hardest things to do in a growing company is to preserve the investment culture that gave rise to the firm’s initial success. A strong culture often has intangible elements that are not transmitted quickly or easily. The problem of transmission is compounded because any capable organization must remain open to change, progress and development. Thus it is no solution to rigidly enforce a historic culture simply for the sake of doing so. A capable organization must promote a culture that embodies continuity and change at once.
I believe Seafarer’s culture, though young, is worth preserving as the firm evolves. It is a culture that is suited to a small, focused boutique, managed by a team of accountable professionals. The firm is dedicated to delivering an investment experience to its clients that is founded on long-term performance, low costs, transparent communications, and whenever possible, risk adjusted returns.
My pledge to shareholders and clients is that Seafarer will not grow at a pace that overwhelms its unique culture. I do not want Seafarer to become so large that, culturally, the professionals at the firm lose sight of, or contact with, the clients they serve. Seafarer’s ownership structure and governance is arranged such that I have the control to deliver upon this commitment.
This promise will present certain challenges: even as the firm aspires to grow, it will remain “small at heart,” and small in terms of support personnel. We will not hire ghostwriters or large numbers of marketing staff to apply polish to the rough edges of our firm. Doing so will not only drive up costs, it will also dilute the intimate connection between the people at Seafarer and the clients they serve. We are committed to delivering insights directly from the individuals who manage your money.
We are honored to serve as your investment adviser in the emerging markets, and we appreciate your investment in the Funds.
Sincerely,
Andrew Foster
Chief Investment Officer
Seafarer Capital Partners, LLC
The MSCI Emerging Markets Total Return Index, Standard (Large+Mid Cap) Core, Gross (dividends reinvested), USD is a free float-adjusted market capitalization index designed to measure equity market performance of emerging markets. Index code: GDUEEGF. It is not possible to invest directly in this or any index.
The S&P 500 Total Return Index is a stock market index based on the market capitalizations of 500 large companies with common stock listed on the NYSE or NASDAQ. It is not possible to invest directly in this or any index.
The Fund is subject to investment risks, including possible loss of the principal amount invested and therefore is not suitable for all investors. The Fund may not achieve its objectives. Diversification does not ensure a profit or guarantee against loss.
Information on the Seafarer website is provided for textual reference only, and is not incorporated by reference into this letter or report.
| | |
| 6 | | (855) 732-9220 seafarerfunds.com |
| | |
| Seafarer Overseas Growth and Income Fund | | Letter to Shareholders |
April 30, 2016
The views and information discussed in this commentary are as of the date of publication, are subject to change, and may not reflect the writer’s current views. The views expressed represent an assessment of market conditions at a specific point in time, are opinions only and should not be relied upon as investment advice regarding a particular investment or markets in general. Such information does not constitute a recommendation to buy or sell specific securities or investment vehicles. It should not be assumed that any investment will be profitable or will equal the performance of the portfolios or any securities or any sectors mentioned herein. The subject matter contained herein has been derived from several sources believed to be reliable and accurate at the time of compilation. Seafarer does not accept any liability for losses either direct or consequential caused by the use of this information.
| 1 | References to the “Fund” pertain to the Fund’s Institutional share class (ticker: SIGIX). The Investor share class (ticker: SFGIX) declined -8.39% during the fiscal year. |
| 2 | The Fund’s Investor share class generated an annualized rate of return of 5.75% from the Fund’s inception through the end of the fiscal year. |
| 3 | The Fund’s Investor share class began the fiscal year with a net asset value of $12.64 per share. The Fund paid two distributions: $0.059 per share in June 2015 and $0.076 per share in December 2015. Those two payments brought the cumulative distribution per share, as measured from the Fund’s inception to the end of the fiscal year, to $1.130. The Fund finished the fiscal year with a value of $11.44 per share. |
| 4 | The Letter to Shareholders as of October 31, 2015 is available at: www.seafarerfunds.com/fund/shareholder-letter/2015/10/semi-annual |
| 5 | For additional discussion on this topic, refer to the portfolio review for the fourth quarter of 2015, which is available at: www.seafarerfunds.com/fund/portfolio-review/2015/12/Q4 |
| 6 | The long-term goals of the firm are described in an essay from 2012 titled “What are the Firm’s Goals?”, which is available at: www.seafarerfunds.com/ask-seafarer/#what-are-the-firms-goals |
| | |
| Annual Report – April 30, 2016 | | 7 |
| | |
| Seafarer Overseas Growth and Income Fund | | Portfolio Review |
April 30, 2016
Seafarer Overseas Growth and Income Fund Performance
| | | | | | | | | | |
Total Return (As of April 30, 2016) | | 1 Year | | 3 Years | | Since
Inception* -
Annualized | | Gross
Expense
Ratio** | | |
Investor Class (SFGIX) | | -8.39% | | 1.67% | | 5.75% | | 1.15% | | |
Institutional Class (SIGIX) | | -8.32% | | 1.82% | | 5.88% | | 1.05% | | |
MSCI Emerging Markets Total Return Index^ | | -17.56% | | -4.23% | | -2.64% | | | | |
All performance is in U.S. dollars with gross (pre-tax) dividends and/or distributions reinvested. The performance data quoted represents past performance and does not guarantee future results. Future returns may be lower or higher. The investment return and principal value will fluctuate so that an investor’s shares, when redeemed, may be worth more or less than the original cost. Shares of the Fund redeemed or exchanged within 90 days of purchase are subject to a 2% redemption fee. Performance does not reflect this fee, which if deducted would reduce an individual’s return. To obtain the Fund’s most recent month-end performance, visit seafarerfunds.com or call (855) 732-9220.
| * | Inception Date: February 15, 2012. |
| ** | Seafarer Capital Partners, LLC has agreed contractually to waive and/or reimburse fees or expenses in order to limit Total Annual Fund Operating Expenses After Fee Waiver/Expense Reimbursements (excluding brokerage expenses, interest expenses, taxes and extraordinary expenses) to 1.15% and 1.05% of the Fund’s average daily net assets for the Investor and Institutional share classes, respectively. This agreement is in effect through August 31, 2017. |
| ^ | The MSCI Emerging Markets Total Return Index, Standard (Large+Mid Cap) Core, Gross (dividends reinvested), USD is a free float-adjusted market capitalization index designed to measure equity market performance of emerging markets. Index code: GDUEEGF. The index is not actively managed and does not reflect any deductions for fees, expense or taxes. An investor may not invest directly in an index. |
| | |
| 8 | | (855) 732-9220 seafarerfunds.com |
| | |
| Seafarer Overseas Growth and Income Fund | | Portfolio Review |
April 30, 2016
Performance of a $10,000 Investment Since Inception
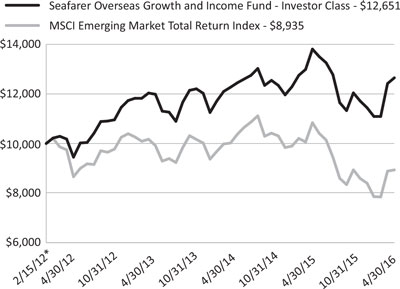
* Inception Date: February 15, 2012.
The chart shown above represents historical performance of a hypothetical investment of $10,000 in the Fund’s Investor Class shares for the period from inception to April 30, 2016. All returns reflect reinvested dividends and/or distributions, but do not reflect the deduction of taxes that an investor would pay on distributions or redemptions.
The Fund also offers Institutional Class shares, performance for which is not reflected in the chart above. The performance of Institutional Class shares may be higher or lower than the performance of the Investor Class shares shown above based upon differences in fees paid by shareholders investing in the Investor Class shares and Institutional Class shares.
Investment Objective
The Fund seeks to provide long-term capital appreciation along with some current income. The Fund seeks to mitigate adverse volatility in returns as a secondary objective.
Strategy
The Fund invests primarily in the securities of companies located in developing countries. The Fund invests in several asset classes including dividend-paying common stocks, preferred stocks, convertible bonds, and fixed-income securities.
The Fund seeks to offer investors a relatively stable means of participating in a portion of developing countries’ growth prospects, while providing some downside protection compared to a portfolio that invests only in the common stocks of those countries.
| | |
| Annual Report – April 30, 2016 | | 9 |
| | |
| Seafarer Overseas Growth and Income Fund | | Portfolio Review |
April 30, 2016
Fund Characteristics
| | | | |
Inception Date | | | February 15, 2012 | |
Net Assets | | | $1,219.0M | |
Portfolio Turnover1 | | | 7% | |
| | | | | | | | |
| | | Investor Class | | | Institutional Class | |
Ticker | | | SFGIX | | | | SIGIX | |
NAV | | | $11.44 | | | | $11.46 | |
30-Day SEC Yield | | | 1.86% | | | | 1.96% | |
Fund Distribution Yield | | | 0.96% | | | | 1.01% | |
Gross Expense Ratio | | | 1.14% | | | | 1.03% | |
Redemption Fee (within 90 calendar days) | | | 2.00% | | | | 2.00% | |
Minimum Initial Investment | | | $2,500 | | | | $100,000 | |
Minimum Initial Investment - Automatic Investment Plan | | | $1,500 | | | | $100,000 | |
Minimum Initial Investment - Retirement Account | | | $1,000 | | | | $100,000 | |
Underlying Portfolio Holdings
| | | | |
Number of Holdings | | | 46 | |
% of Net Assets in Top 10 Holdings | | | 40% | |
Weighted Average Market Cap | | | $23.2B | |
Market Cap of Portfolio Median Dollar | | | $6.5B | |
Gross Portfolio Yield2 | | | 3.5% | |
Price / Book Value2 | | | 1.6 | |
Price / Earnings2,3 | | | 12.9 | |
Earnings Per Share Growth2,3 | | | 9% | |
| 1 | For the year ended April 30, 2016. |
| 2 | Calculated as a harmonic average of the underlying portfolio holdings. A harmonic average is the reciprocal of the arithmetic mean of the reciprocals. Harmonic averages are generally preferable to weighted averages or other techniques when measuring the fundamental characteristics (e.g., earnings per share, book value per share) of a portfolio of securities. |
| 3 | Based on consensus earnings estimates for next year. Excludes securities for which consensus earnings estimates are not available. |
30-Day SEC Yield: a standard yield calculation developed by the Securities and Exchange Commission (SEC). It represents net investment income earned by the Fund over a 30-day period, expressed as an annual percentage rate based on the Fund’s share price at the end of the 30-day period. The 30-Day Yield should be regarded as an estimate of the Fund’s rate of investment income, and it may not equal the Fund’s actual income distribution rate.
Fund Distribution Yield: a measure of the sum of the Fund’s income distributions during the trailing 380 days divided by the previous month’s NAV (adjusted upward for any capital gains distributed over the same time period).
Gross Portfolio Yield: gross yield for the underlying portfolio, estimated based on the dividend yield for common and preferred stocks and yield to maturity for bonds. This measure of yield does not account for offsetting Fund expenses and other costs, and consequently it should not be construed as the yield that an investor in the Fund would receive.
Price / Book Value: the value of a company’s common shares, divided by the company’s book value.
Price / Earnings: the market price of a company’s common shares divided by the earnings per common share as forecast for next year.
Earnings Per Share (EPS) Growth: forecast growth rate of earnings per common share next year, expressed as a percentage.
Past performance does not guarantee future results.
Sources: ALPS Fund Services, Inc., Bloomberg, Seafarer.
| | |
| 10 | | (855) 732-9220 seafarerfunds.com |
| | |
| Seafarer Overseas Growth and Income Fund | | Portfolio Review |
April 30, 2016
Top 10 Holdings
| | | | | | | | | | | | | | | | |
Holding | | Sector | | Country | | Issuer Mkt Cap ($B) | | Yield1 | | | Price / Book | | Price / Earnings2 | | EPS Growth2 |
| | | | | | | |
| | | | | | | | |
Bank Pekao SA | | Financials | | Poland | | $10.7 | | | 6.4% | | | 1.7 | | 18 | | 12% |
| | | | | | | |
Hang Lung Properties, Ltd. | | Financials | | China /
Hong Kong | | $9.0 | | | 4.9% | | | 0.5 | | 14 | | 1% |
| | | | | | | |
Samsung Electronics Co. Ltd., Pfd. | | Information
Technology | | South
Korea | | $156.3 | | | 2.0% | | | 0.7 | | 8 | | -1% |
| | | | | | | |
Sanlam, Ltd. | | Financials | | South
Africa | | $10.4 | | | 3.6% | | | 2.6 | | 13 | | 9% |
| | | | | | | |
Singapore Telecommunications Ltd. | | Telecom.
Services | | Singapore | | $45.9 | | | 4.5% | | | 2.5 | | 15 | | 5% |
| | | | | | | |
Infosys, Ltd. ADR | | Information
Technology | | India | | $43.3 | | | 1.9% | | | 4.6 | | 17 | | 10% |
| | | | | | | |
Banco Bradesco SA | | Financials | | Brazil | | $43.2 | | | 3.4% | | | 1.6 | | 8 | | 7% |
Astra International Tbk PT | | Consumer
Discretionary | | Indonesia | | $20.7 | | | 3.2% | | | 2.6 | | 13 | | 12% |
| | | | | | | |
TOTVS SA | | Information
Technology | | Brazil | | $1.3 | | | 2.6% | | | 3.7 | | 15 | | 23% |
| | | | | | | |
Hisamitsu Pharmaceutical Co., Inc. | | Health Care | | Japan | | $4.7 | | | 1.5% | | | 2.0 | | 24 | | -3% |
| | | | | | | |
Cumulative Weight of Top 10 Holdings: | | | | 40% | | | | | | | | | | | | |
Total Number of Holdings: | | | | 46 | | | | | | | | | | | | |
| 1 | Yield = dividend yield for common and preferred stocks and yield to maturity for bonds. |
| 2 | Based on consensus earnings estimates for next year. |
Portfolio holdings are subject to change and may not reflect the current or future position of the portfolio.
Sources: ALPS Fund Services, Inc., Bloomberg, Seafarer.
| | |
| Annual Report – April 30, 2016 | | 11 |
| | |
| Seafarer Overseas Growth and Income Fund | | Portfolio Review |
April 30, 2016
Portfolio Composition
| | | | |
| Region/Country | | % Net Assets | |
East and South Asia | | | 51 | |
China / Hong Kong | | | 15 | |
India | | | 8 | |
Indonesia | | | 4 | |
Japan | | | 3 | |
Malaysia | | | 1 | |
Singapore | | | 6 | |
South Korea | | | 8 | |
Taiwan | | | 5 | |
Vietnam | | | 1 | |
Eastern Europe | | | 13 | |
Poland | | | 8 | |
Turkey | | | 5 | |
Latin America | | | 22 | |
Brazil | | | 15 | |
Mexico | | | 7 | |
Middle East and Africa | | | 6 | |
South Africa | | | 6 | |
Cash and Other Assets, Less Liabilities | | | 8 | |
Total | | | 100 | |
| |
| Asset Class | | % Net Assets | |
Common Stock | | | 72 | |
Preferred Stock | | | 9 | |
ADR | | | 5 | |
Foreign Currency Government Bond | | | 2 | |
Foreign Currency Convertible Bond | | | 2 | |
Foreign Currency Corporate Bond | | | 1 | |
USD Convertible Bond | | | 1 | |
Cash and Other Assets, Less Liabilities | | | 8 | |
Total | | | 100 | |
| |
| Market Capitalization of Issuer | | % Net Assets | |
Large Cap (over $10 billion) | | | 39 | |
Mid Cap ($1 - $10 billion) | | | 41 | |
Small Cap (under $1 billion) | | | 10 | |
Not Applicable | | | 2 | |
Cash and Other Assets, Less Liabilities | | | 8 | |
Total | | | 100 | |
| | | | |
| Sector | | % Net Assets | |
Consumer Discretionary | | | 12 | |
Consumer Staples | | | 3 | |
Energy | | | – | |
Financials* | | | 24 | |
Government | | | 2 | |
Health Care | | | 11 | |
Industrials | | | 6 | |
Information Technology | | | 23 | |
Materials | | | 3 | |
Telecommunication Services | | | 6 | |
Utilities | | | 2 | |
Cash and Other Assets, Less Liabilities | | | 8 | |
Total | | | 100 | |
| * | The Fund’s holdings in the Financials sector include property-related stocks, which are classified within the “Financials sector” according to the Global Industry Classification Standard (GICS) methodology utilized herein. Property-related holdings comprised 5% of the Fund’s net assets as of April 30, 2016. |
Due to rounding, percentage values may not sum to 100%. Values less than 0.5% may be rounded to 0%.
| | |
| 12 | | (855) 732-9220 seafarerfunds.com |
| | |
| Seafarer Overseas Growth and Income Fund | | Portfolio Review |
April 30, 2016
Top 5 Performance Contributors and Detractors
For the year ended April 30, 2016
| | |
| Contributors | | % Net Assets1 |
Infosys, Ltd. ADR | | 4.3 |
Aselsan Elektronik Sanayi Ve Ticaret AS | | 2.1 |
Bao Viet Holdings | | 0.8 |
Arcelik AS | | 1.9 |
Hisamitsu Pharmaceutical Co., Inc. | | 3.0 |
| |
| Detractors | | % Net Assets1 |
Sun Pharma Advanced Research Co., Ltd. | | 2.3 |
Shandong Weigao Group Medical Polymer Co., Ltd. | | 2.6 |
PGE Polska Grupa Energetyczna SA | | 2.0 |
Valid Solucoes | | 1.9 |
Hang Lung Properties, Ltd. | | 4.4 |
Source: Bloomberg.
| | |
| Annual Report – April 30, 2016 | | 13 |
| | |
| Seafarer Overseas Growth and Income Fund | | Disclosure of Fund Expenses |
April 30, 2016 (Unaudited)
As a shareholder of the Fund you will incur two types of costs: (1) transaction costs, including applicable redemption fees; and (2) ongoing costs, including management fees and other Fund expenses. The following examples are intended to help you understand your ongoing costs (in dollars) of investing in the Fund and to compare these costs with the ongoing costs of investing in other mutual funds. The examples are based on an investment of $1,000 invested on November 1, 2015 and held until April 30, 2016.
Actual Expenses. The first line of the table below provides information about actual account values and actual expenses. You may use the information in this line, together with the amount you invested, to estimate the expenses that you paid over the period. Simply divide your account value by $1,000 (for example, an $8,600 account value divided by $1,000 = 8.6), then multiply the result by the number in the first line under the heading “Expenses Paid During Period” to estimate the expenses you paid on your account during this period.
Hypothetical Example for Comparison Purposes. The second line of the table below provides information about hypothetical account values and hypothetical expenses based on the Fund’s actual expense ratio and an assumed rate of return of 5% per year before expenses, which is not the Fund’s actual return. The hypothetical account values and expenses may not be used to estimate the actual ending account balance or expenses you paid for the period. You may use this information to compare the ongoing costs of investing in the Fund and other mutual funds. To do so, compare this 5% hypothetical example with the 5% hypothetical examples that appear in the shareholder reports of the other mutual funds.
Please note the expenses shown in the table are meant to highlight your ongoing costs only and do not reflect transactional costs, such as redemption fees or exchange fees. Therefore, the second line of the table below is useful in comparing ongoing costs only, and will not help you determine the relative total costs of owning different funds. In addition, if these transactional costs were included, your costs would have been higher.
| | | | | | | | | | | | | | | | | | | | |
| | | Beginning
Account Value
11/01/15 | | Ending
Account Value
04/30/16 | | Expense
Ratio(a) | | Expenses Paid
During Period
11/01/15 - 04/30/16(b) |
Investor Class | | | | | | | | | | | | | | | | | | | | |
Actual | | | | $ 1,000.00 | | | | | $ 1,050.60 | | | | | 1.10% | | | | | $ 5.61 | |
Hypothetical (5% return before expenses) | | | | $ 1,000.00 | | | | | $ 1,019.39 | | | | | 1.10% | | | | | $ 5.52 | |
| | | | |
| | | | | | | | | | | | | | | | | | | | | |
Institutional Class | | | | | | | | | | | | | | | | | | | | |
Actual | | | | $ 1,000.00 | | | | | $ 1,050.90 | | | | | 1.01% | | | | | $ 5.15 | |
Hypothetical (5% return before expenses) | | | | $ 1,000.00 | | | | | $ 1,019.84 | | | | | 1.01% | | | | | $ 5.07 | |
| (a) | Annualized, based on the Fund’s most recent fiscal half year expenses. |
| (b) | Expenses are equal to the Fund’s annualized expense ratio multiplied by the average account value over the period, multiplied by the number of days in the most recent fiscal half-year (182)/366 (to reflect the half-year period). |
| | |
| 14 | | (855) 732-9220 seafarerfunds.com |
| | |
| Seafarer Overseas Growth and Income Fund | | Portfolio of Investments |
April 30, 2016
| | | | | | | | | | |
| | | Currency | | Shares | | | Value | |
| |
COMMON STOCKS (76.4%) | | | | | | | | | | |
Brazil (8.0%) | | | | | | | | | | |
TOTVS SA | | BRL | | | 4,738,000 | | | $ | 38,725,065 | |
Odontoprev SA | | BRL | | | 11,575,000 | | | | 35,641,274 | |
Valid Solucoes e Servicos de Seguranca em Meios de Pagamento e Identificacao SA | | BRL | | | 2,315,100 | | | | 23,263,751 | |
| | | | | | | | | | |
| | | |
Total Brazil | | | | | | | | | 97,630,090 | |
| | | | | | | | | | |
| | | |
China / Hong Kong (13.4%) | | | | | | | | | | |
Hang Lung Properties, Ltd. | | HKD | | | 26,750,000 | | | | 53,383,439 | |
Shandong Weigao Group Medical Polymer Co., Ltd., Class H | | HKD | | | 53,500,000 | | | | 32,209,388 | |
Texwinca Holdings, Ltd. | | HKD | | | 28,849,000 | | | | 28,116,701 | |
Xinhua Winshare Publishing and Media Co., Ltd., Class H | | HKD | | | 21,500,000 | | | | 20,095,012 | |
Greatview Aseptic Packaging Co., Ltd. | | HKD | | | 35,719,000 | | | | 18,142,926 | |
Pico Far East Holdings, Ltd. | | HKD | | | 41,004,000 | | | | 11,206,601 | |
| | | | | | | | | | |
| | | |
Total China / Hong Kong | | | | | | | | | 163,154,067 | |
| | | | | | | | | | |
| | | |
India (8.0%) | | | | | | | | | | |
Infosys, Ltd., Sponsored ADR | | USD | | | 2,765,000 | | | | 51,982,000 | |
Sun Pharma Advanced Research Co., Ltd.(a) | | INR | | | 6,114,274 | | | | 27,649,276 | |
Balkrishna Industries, Ltd. | | INR | | | 1,320,303 | | | | 13,254,783 | |
Cyient, Ltd. | | INR | | | 729,289 | | | | 5,052,138 | |
| | | | | | | | | | |
| | | |
Total India | | | | | | | | | 97,938,197 | |
| | | | | | | | | | |
| | | |
Indonesia (3.8%) | | | | | | | | | | |
Astra International Tbk PT | | IDR | | | 91,500,000 | | | | 46,658,894 | |
| | | | | | | | | | |
| | | |
Total Indonesia | | | | | | | | | 46,658,894 | |
| | | | | | | | | | |
| | | |
Japan (3.0%) | | | | | | | | | | |
Hisamitsu Pharmaceutical Co., Inc. | | JPY | | | 747,500 | | | | 36,742,716 | |
| | | | | | | | | | |
| | | |
Total Japan | | | | | | | | | 36,742,716 | |
| | | | | | | | | | |
| | | |
Malaysia (0.6%) | | | | | | | | | | |
Hartalega Holdings Bhd | | MYR | | | 6,850,000 | | | | 7,522,462 | |
| | | | | | | | | | |
| | | |
Total Malaysia | | | | | | | | | 7,522,462 | |
| | | | | | | | | | |
| | |
| Annual Report – April 30, 2016 | | 15 |
| | |
| Seafarer Overseas Growth and Income Fund | | Portfolio of Investments |
April 30, 2016
| | | | | | | | | | |
| | | Currency | | Shares | | | Value | |
| |
Mexico (5.8%) | | | | | | | | | | |
Grupo Financiero Banorte SAB de CV | | MXN | | | 6,390,000 | | | $ | 36,331,446 | |
Bolsa Mexicana de Valores SAB de CV | | MXN | | | 13,712,000 | | | | 22,738,234 | |
Grupo Herdez SAB de CV | | MXN | | | 5,176,622 | | | | 11,388,499 | |
| | | | | | | | | | |
| | | |
Total Mexico | | | | | | | | | 70,458,179 | |
| | | | | | | | | | |
| | | |
Poland (8.0%) | | | | | | | | | | |
Bank Pekao SA | | PLN | | | 1,315,000 | | | | 53,486,095 | |
PGE SA | | PLN | | | 7,025,000 | | | | 24,257,457 | |
Asseco Poland SA | | PLN | | | 1,258,411 | | | | 19,089,062 | |
| | | | | | | | | | |
| | | |
Total Poland | | | | | | | | | 96,832,614 | |
| | | | | | | | | | |
| | | |
Singapore (6.1%) | | | | | | | | | | |
Singapore Telecommunications, Ltd. | | SGD | | | 18,150,000 | | | | 52,094,286 | |
SIA Engineering Co., Ltd. | | SGD | | | 7,921,700 | | | | 22,324,603 | |
| | | | | | | | | | |
| | | |
Total Singapore | | | | | | | | | 74,418,889 | |
| | | | | | | | | | |
| | | |
South Africa (6.0%) | | | | | | | | | | |
Sanlam, Ltd. | | ZAR | | | 10,925,000 | | | | 52,954,813 | |
EOH Holdings, Ltd. | | ZAR | | | 2,065,000 | | | | 20,098,400 | |
| | | | | | | | | | |
| | | |
Total South Africa | | | | | | | | | 73,053,213 | |
| | | | | | | | | | |
| | | |
South Korea (3.5%) | | | | | | | | | | |
Dongsuh Co., Inc. | | KRW | | | 1,100,000 | | | | 31,134,808 | |
Sindoh Co., Ltd. | | KRW | | | 255,000 | | | | 10,943,918 | |
| | | | | | | | | | |
| | | |
Total South Korea | | | | | | | | | 42,078,726 | |
| | | | | | | | | | |
| | | |
Taiwan (5.1%) | | | | | | | | | | |
Taiwan Semiconductor Manufacturing Co., Ltd. | | TWD | | | 7,175,000 | | | | 33,368,989 | |
Vanguard International Semiconductor Corp. | | TWD | | | 15,500,000 | | | | 23,764,456 | |
Taiwan Semiconductor Manufacturing Co., Ltd., Sponsored ADR | | USD | | | 200,000 | | | | 4,718,000 | |
| | | | | | | | | | |
| | | |
Total Taiwan | | | | | | | | | 61,851,445 | |
| | | | | | | | | | |
| | | |
Turkey (4.0%) | | | | | | | | | | |
Aselsan Elektronik Sanayi Ve Ticaret AS | | TRY | | | 3,575,000 | | | | 25,502,859 | |
| | |
| 16 | | (855) 732-9220 seafarerfunds.com |
| | |
| Seafarer Overseas Growth and Income Fund | | Portfolio of Investments |
April 30, 2016
| | | | | | | | | | |
| | | Currency | | Shares | | | Value | |
| |
Turkey (continued) | | | | | | | �� | | | |
Arcelik AS | | TRY | | | 3,521,000 | | | $ | 23,645,315 | |
| | | | | | | | | | |
| | | |
Total Turkey | | | | | | | | | 49,148,174 | |
| | | | | | | | | | |
| | | |
Vietnam (1.1%) | | | | | | | | | | |
Bao Viet Holdings | | VND | | | 3,425,000 | | | | 9,373,878 | |
Nam Long Investment Corp. | | VND | | | 3,150,000 | | | | 3,307,161 | |
Vietnam National Reinsurance Corp. | | VND | | | 815,790 | | | | 677,141 | |
| | | | | | | | | | |
| | | |
Total Vietnam | | | | | | | | | 13,358,180 | |
| | | | | | | | | | |
| | | |
TOTAL COMMON STOCKS (Cost $923,609,844) | | | | | | | | | 930,845,846 | |
| |
| | | |
PREFERRED STOCKS (9.3%) | | | | | | | | | | |
Brazil (5.0%) | | | | | | | | | | |
Banco Bradesco SA, ADR | | USD | | | 6,464,897 | | | | 48,292,781 | |
Vale SA | | BRL | | | 2,750,000 | | | | 12,609,580 | |
| | | | | | | | | | |
| | | |
Total Brazil | | | | | | | | | 60,902,361 | |
| | | | | | | | | | |
| | | |
South Korea (4.3%) | | | | | | | | | | |
Samsung Electronics Co., Ltd. | | KRW | | | 58,000 | | | | 53,092,856 | |
| | | | | | | | | | |
| | | |
Total South Korea | | | | | | | | | 53,092,856 | |
| | | | | | | | | | |
| | | |
TOTAL PREFERRED STOCKS (Cost $87,789,655) | | | | | | | | | 113,995,217 | |
| |
| | | | | | | | | | | | | | | | |
| | | Currency | | | Rate | | | Maturity
Date | | Principal Amount | | Value | |
| |
USD CORPORATE BONDS (1.0%) | | | | | | | | | | | | | | | | |
Brazil (1.0%) | | | | | | | | | | | | | | | | |
Cielo SA / Cielo USA, Inc.(b) | | | USD | | | | 3.75% | | | 11/16/22 | | $ 13,440,000 | | | 12,183,360 | |
| | | | | | | | | | | | | | | | |
| | | | | |
Total Brazil | | | | | | | | | | | | | | | 12,183,360 | |
| | | | | | | | | | | | | | | | |
| | | | | |
TOTAL CORPORATE BONDS (Cost $11,576,282) | | | | | | | | | | | | | | | 12,183,360 | |
| |
| | |
| Annual Report – April 30, 2016 | | 17 |
| | |
| Seafarer Overseas Growth and Income Fund | | Portfolio of Investments |
April 30, 2016
| | | | | | | | | | | | | | | | | | |
| | | Currency | | | Rate | | | Maturity
Date | | Principal Amount | | | Value | |
| |
FOREIGN CURRENCY CONVERTIBLE BONDS (1.6%) | | | | | | | | | | | | | | | |
China / Hong Kong (1.6%) | | | | | | | | | | | | | | | | | | |
ASM Pacific Technology, Ltd. | | | HKD | | | | 2.00% | | | 03/28/19 | | | $ 150,000,000 | | | $ | 19,458,482 | |
| | | | | | | | | | | | | | | | | | |
| | | | | |
Total China / Hong Kong | | | | | | | | | | | | | | | | | 19,458,482 | |
| | | | | | | | | | | | | | | | | | |
| | | |
TOTAL FOREIGN CURRENCY CONVERTIBLE BONDS (Cost $19,855,437) | | | | | | | | | | 19,458,482 | |
| |
| | | | | |
FOREIGN CURRENCY CORPORATE BONDS (1.4%) | | | | | | | | | | | | | | | | | | |
Mexico (1.4%) | | | | | | | | | | | | | | | | | | |
America Movil SAB de CV | | | MXN | | | | 7.13% | | | 12/09/24 | | | 144,710,000 | | | | 8,171,382 | |
America Movil SAB de CV | | | MXN | | | | 6.45% | | | 12/05/22 | | | 145,000,000 | | | | 8,196,185 | |
| | | | | | | | | | | | | | | | | | |
| | | | | |
Total Mexico | | | | | | | | | | | | | | | | | 16,367,567 | |
| | | | | | | | | | | | | | | | | | |
| | | |
TOTAL FOREIGN CURRENCY CORPORATE BONDS (Cost $16,086,289) | | | | | | | | | | 16,367,567 | |
| |
| | | |
FOREIGN CURRENCY GOVERNMENT BONDS (2.4%) | | | | | | | | | | | |
Brazil (0.9%) | | | | | | | | | | | | | | | | | | |
Brazilian Government International Bond | | | BRL | | | | 10.25% | | | 01/10/28 | | | 40,000,000 | | | | 10,700,007 | |
| | | | | | | | | | | | | | | | | | |
| | | | | |
Total Brazil | | | | | | | | | | | | | | | | | 10,700,007 | |
| | | | | | | | | | | | | | | | | | |
| | | | | |
Indonesia (0.6%) | | | | | | | | | | | | | | | | | | |
Indonesia Treasury Bond, Series FR70 | | | IDR | | | | 8.38% | | | 03/15/24 | | | 100,000,000,000 | | | | 7,939,870 | |
| | | | | | | | | | | | | | | | | | |
| | | | | |
Total Indonesia | | | | | | | | | | | | | | | | | 7,939,870 | |
| | | | | | | | | | | | | | | | | | |
| | | | | |
Turkey (0.9%) | | | | | | | | | | | | | | | | | | |
Turkey Government Bond | | | TRY | | | | 8.80% | | | 09/27/23 | | | 30,000,000 | | | | 10,604,003 | |
| | | | | | | | | | | | | | | | | | |
| | | | | |
Total Turkey | | | | | | | | | | | | | | | | | 10,604,003 | |
| | | | | | | | | | | | | | | | | | |
| | | |
TOTAL FOREIGN CURRENCY GOVERNMENT BONDS (Cost $28,356,179) | | | | | | | | | | 29,243,880 | |
| |
| | |
| 18 | | (855) 732-9220 seafarerfunds.com |
| | |
| Seafarer Overseas Growth and Income Fund | | Portfolio of Investments |
April 30, 2016
| | | | |
TOTAL INVESTMENTS (Cost $1,087,273,686) (92.1%) | | | $ 1,122,094,352 | |
| |
Cash and Other Assets, Less Liabilities (7.9%) | | | 96,879,453 | |
| |
NET ASSETS (100.0%) | | | $ 1,218,973,805 | |
| |
| (a) | Non-income producing security. |
| (b) | Security was purchased pursuant to Regulation S under the Securities Act of 1933, which exempts securities offered and sold outside of the United States from registration. Such security cannot be sold in the United States without either an effective registration statement filed pursuant to the Securities Act of 1933, or pursuant to an exemption from registration. The security has been deemed liquid under guidelines approved by the Fund’s Board of Trustees. As of April 30, 2016, the aggregate market value of those securities was $12,183,360, representing 1.0% of net assets. |
Currency Abbreviations
| | | | |
BRL | | - | | Brazil Real |
HKD | | - | | Hong Kong Dollar |
IDR | | - | | Indonesia Rupiah |
INR | | - | | India Rupee |
JPY | | - | | Japan Yen |
KRW | | - | | South Korea Won |
MXN | | - | | Mexico Peso |
MYR | | - | | Malaysia Ringgit |
PLN | | - | | Poland Zloty |
SGD | | - | | Singapore Dollar |
TRY | | - | | Turkey Lira |
TWD | | - | | Taiwan New Dollar |
USD | | - | | United States Dollar |
VND | | - | | Vietnam Dong |
ZAR | | - | | South Africa Rand |
For Fund compliance purposes, the Fund’s geographical classifications refer to any one or more of the sub-classifications used by one or more widely recognized market indexes or ratings group indexes, and/or as defined by Fund management. This definition may not apply for purposes of this report, which may combine sub-classifications for reporting ease. Geographical regions are shown as a percentage of net assets.
See Accompanying Notes to Financial Statements.
| | |
| Annual Report – April 30, 2016 | | 19 |
| | |
| Seafarer Overseas Growth and Income Fund | | Statement of Assets and Liabilities |
April 30, 2016
| | | | |
ASSETS: | | | | |
| |
Investments, at value | | $ | 1,122,094,352 | |
Cash | | | 96,646,265 | |
Foreign currency, at value (Cost $13,781,839) | | | 13,861,121 | |
Receivable for investments sold | | | 189,953 | |
Receivable for shares sold | | | 4,011,813 | |
Interest and dividends receivable | | | 3,547,632 | |
Prepaid expenses and other assets | | | 20,430 | |
| |
Total Assets | | | 1,240,371,566 | |
| |
LIABILITIES: | | | | |
Payable for investments purchased | | | 19,599,103 | |
Administrative fees payable | | | 75,538 | |
Shareholder service plan fees payable | | | 340,276 | |
Payable for shares redeemed | | | 308,123 | |
Investment advisory fees payable | | | 699,461 | |
Payable for chief compliance officer fee | | | 10,568 | |
Trustee fees and expenses payable | | | 11,801 | |
Payable for principal financial officer fees | | | 1,667 | |
Audit and tax fees payable | | | 20,253 | |
Accrued expenses and other liabilities | | | 330,971 | |
| |
Total Liabilities | | | 21,397,761 | |
| |
NET ASSETS | | $ | 1,218,973,805 | |
| |
NET ASSETS CONSIST OF: | | | | |
Paid-in capital (Note 5) | | $ | 1,192,202,956 | |
Accumulated net investment income | | | 3,665,408 | |
Accumulated net realized loss | | | (11,777,648) | |
Net unrealized appreciation | | | 34,883,089 | |
| |
NET ASSETS | | $ | 1,218,973,805 | |
| |
INVESTMENTS, AT COST | | $ | 1,087,273,686 | |
PRICING OF SHARES | | | | |
Investor Class: | | | | |
Net Asset Value, offering and redemption price per share | | $ | 11.44 | |
Net Assets | | $ | 613,795,442 | |
Shares of beneficial interest outstanding | | | 53,658,405 | |
Institutional Class: | | | | |
Net Asset Value, offering and redemption price per share | | $ | 11.46 | |
Net Assets | | $ | 605,178,363 | |
Shares of beneficial interest outstanding | | | 52,796,408 | |
See Accompanying Notes to Financial Statements.
| | |
| 20 | | (855) 732-9220 seafarerfunds.com |
| | |
| Seafarer Overseas Growth and Income Fund | | Statement of Operations |
For the Year Ended April 30, 2016
| | | | |
INVESTMENT INCOME: | | | | |
Dividends | | | $ 16,471,169 | |
Foreign taxes withheld on dividends | | | (1,180,730) | |
Interest and other income | | | 2,152,872 | |
| |
Total investment income | | | 17,443,311 | |
| |
| |
EXPENSES: | | | | |
Investment advisory fees (Note 6) | | | 4,856,230 | |
Administrative and transfer agency fees | | | 384,981 | |
Trustee fees and expenses | | | 18,866 | |
Registration/filing fees | | | 125,167 | |
Shareholder service plan fees | | | | |
Investor Class | | | 475,338 | |
Institutional Class | | | 149,502 | |
Recoupment of previously waived fees | | | | |
Investor Class | | | 200,614 | |
Institutional Class | | | 176,598 | |
Legal fees | | | 21,430 | |
Audit fees | | | 23,829 | |
Reports to shareholders and printing fees | | | 56,172 | |
Custody fees | | | 477,041 | |
Chief compliance officer fees | | | 10,568 | |
Principal financial officer fees | | | 3,333 | |
Miscellaneous | | | 17,125 | |
| |
Total expenses | | | 6,996,794 | |
| |
NET INVESTMENT INCOME: | | | 10,446,517 | |
| |
Net realized loss on investments | | | (11,401,544) | |
Net realized loss on foreign currency transactions | | | (681,378) | |
| |
Net realized loss | | | (12,082,922) | |
| |
Net change in unrealized appreciation on investments (net of foreign capital gains tax of $(233,737)) | | | 20,324,451 | |
Net change in unrealized appreciation on translation of assets and liabilities in foreign currency transactions | | | 67,371 | |
| |
Net unrealized appreciation | | | 20,391,822 | |
| |
NET REALIZED AND UNREALIZED GAIN ON INVESTMENTS AND FOREIGN CURRENCY TRANSLATIONS | | | 8,308,900 | |
| |
NET INCREASE IN NET ASSETS RESULTING FROM OPERATIONS | | | $ 18,755,417 | |
| |
See Accompanying Notes to Financial Statements.
| | |
| Annual Report – April 30, 2016 | | 21 |
| | |
| Seafarer Overseas Growth and Income Fund | | Statements of Changes in Net Assets |
| | | | | | | | |
| | | Year Ended April 30, 2016 | | | Year Ended April 30, 2015 | |
| | | | |
OPERATIONS: | | | | | | | | |
Net investment income | | | $ 10,446,517 | | | | $ 1,478,828 | |
Net realized gain/(loss) | | | (12,082,922) | | | | 3,072,569 | |
Net change in unrealized appreciation | | | 20,391,822 | | | | 11,219,064 | |
| |
Net increase in net assets resulting from operations | | | 18,755,417 | | | | 15,770,461 | |
| |
DISTRIBUTIONS TO SHAREHOLDERS (NOTE 3): | | | | | | | | |
From net investment income | | | | | | | | |
Investor Class | | | $ (2,584,508) | | | | $ (553,066) | |
Institutional Class | | | (2,856,743) | | | | (1,354,908) | |
From net realized gains on investments | | | | | | | | |
Investor Class | | | (883,213) | | | | (462,598) | |
Institutional Class | | | (865,671) | | | | (1,176,662) | |
| |
Net decrease in net assets from distributions | | | (7,190,135) | | | | (3,547,234) | |
| |
BENEFICIAL INTEREST TRANSACTIONS (NOTE 5): | | | | | | | | |
Shares sold | | | | | | | | |
Investor Class | | | $ 641,922,494 | | | | $ 35,017,066 | |
Institutional Class | | | 559,784,411 | | | | 82,647,370 | |
Dividends reinvested | | | | | | | | |
Investor Class | | | 3,453,383 | | | | 1,000,415 | |
Institutional Class | | | 2,613,473 | | | | 2,292,073 | |
Shares Redeemed, net of redemption fees | | | | | | | | |
Investor Class | | | (95,043,203) | | | | (12,562,924) | |
Institutional Class | | | (88,578,872) | | | | (11,165,061) | |
| |
Net increase in net assets derived from beneficial interest transactions | | | 1,024,151,686 | | | | 97,228,939 | |
| |
| | |
Net increase in net assets | | | $ 1,035,716,968 | | | | $ 109,452,166 | |
| | |
NET ASSETS: | | | | | | | | |
Beginning of period | | | $ 183,256,837 | | | | $ 73,804,671 | |
| |
End of period (including accumulated net investment income/(loss) of $3,665,408 and ($444,614), respectively) | | | $ 1,218,973,805 | | | | $ 183,256,837 | |
| |
| | |
| 22 | | (855) 732-9220 seafarerfunds.com |
| | |
| Seafarer Overseas Growth and Income Fund | | Statements of Changes in Net Assets |
| | | | | | | | |
| | | Year Ended
April 30, 2016 | | | Year Ended
April 30, 2015 | |
| | | | |
Other Information: | | | | | | | | |
SHARE TRANSACTIONS: | | | | | | | | |
Investor Class | | | | | | | | |
Sold | | | 58,019,970 | | | | 2,904,763 | |
Distributions reinvested | | | 324,192 | | | | 90,196 | |
Redeemed | | | (8,922,148) | | | | (1,105,772) | |
| |
Net increase in shares outstanding | | | 49,422,014 | | | | 1,889,187 | |
| |
Institutional Class | | | | | | | | |
Sold | | | 50,734,276 | | | | 6,996,213 | |
Distributions reinvested | | | 243,396 | | | | 206,966 | |
Redeemed | | | (8,430,296) | | | | (977,140) | |
| |
Net increase in shares outstanding | | | 42,547,376 | | | | 6,226,039 | |
| |
See Accompanying Notes to Financial Statements.
| | |
| Annual Report – April 30, 2016 | | 23 |
Financial Highlights
For a share outstanding through the periods presented
|
| Investor Class |
NET ASSET VALUE, BEGINNING OF PERIOD |
INCOME FROM OPERATIONS: |
Net investment income(a) |
Net realized and unrealized gain/(loss) on investments |
Total from investment operations |
|
LESS DISTRIBUTIONS: |
From net investment income |
From net realized gains on investments |
Total distributions |
REDEMPTION FEES ADDED TO PAID IN CAPITAL |
NET INCREASE/(DECREASE) IN NET ASSET VALUE |
NET ASSET VALUE, END OF PERIOD |
| |
|
TOTAL RETURN(d) |
SUPPLEMENTAL DATA: |
Net assets, end of period (in 000s) |
RATIOS TO AVERAGE NET ASSETS: |
Operating expenses excluding reimbursement/waiver |
Operating expenses including reimbursement/waiver |
Net investment income including reimbursement/waiver |
PORTFOLIO TURNOVER RATE(g) |
| (a) | Calculated using the average shares method. |
| (b) | Less than $(0.005) per share. |
| (c) | Less than $0.005 per share. |
| (d) | Total returns are for the period indicated and have not been annualized. Total returns would have been lower had certain expenses not been waived during the period. Returns shown do not reflect the deduction of taxes that a shareholder would pay on Fund distributions or the redemption of Fund shares. |
| (f) | Effective September 1, 2015, the Adviser agreed to limit expenses to 1.15%. The Adviser agreed to limit expenses to 1.25% for the period September 1, 2014 through August 31, 2015. Prior to September 1, 2014, the Adviser agreed to limit expenses to 1.40%. (See Note 6). |
| (g) | Portfolio turnover rate for periods less than one full year have not been annualized. |
| | |
| 24 | | (855) 732-9220 seafarerfunds.com |
Seafarer Overseas Growth and Income Fund
| | | | | | | | | | | | | | | | | | |
Year Ended April 30, 2016 | | | Year Ended
April 30, 2015 | | | Year Ended
April 30, 2014 | | | Year Ended
April 30, 2013 | | | For the Period
February 15, 2012
(Inception) to
April 30, 2012 |
| $ | 12.64 | | | $ | 11.58 | | | $ | 11.91 | | | $ | 10.18 | | | $ | 10.00 | |
| | | | | | | | | | | | | | | | | | |
| | 0.16 | | | | 0.14 | | | | 0.19 | | | | 0.10 | | | | 0.05 | |
| | (1.23) | | | | 1.26 | | | | 0.02 | | | | 1.74 | | | | 0.13 | |
| | (1.07) | | | | 1.40 | | | | 0.21 | | | | 1.84 | | | | 0.18 | |
| | | | |
| | | | | | | | | | | | | | | | | | |
| | (0.11) | | | | (0.19) | | | | (0.26) | | | | (0.11) | | | | – | |
| | (0.02) | | | | (0.15) | | | | (0.28) | | | | (0.00) | (b) | | | – | |
| | (0.13) | | | | (0.34) | | | | (0.54) | | | | (0.11) | | | | – | |
| | 0.00 | (c) | | | 0.00 | (c) | | | 0.00 | (c) | | | 0.00 | (c) | | | – | |
| | (1.20) | | | | 1.06 | | | | (0.33) | | | | 1.73 | | | | 0.18 | |
| $ | 11.44 | | | $ | 12.64 | | | $ | 11.58 | | | $ | 11.91 | | | $ | 10.18 | |
| | | | | | | | | | | | | | | | | | | |
| | | | |
| | (8.39%) | | | | 12.55% | | | | 1.93% | | | | 18.24% | | | | 1.80% | |
| | | | | | | | | | | | | | | | | | |
| $ | 613,795 | | | $ | 53,543 | | | $ | 27,181 | | | $ | 26,348 | | | $ | 1,443 | |
| | | | | | | | | | | | | | | | | | |
| | 1.14% | | | | 1.30% | | | | 1.78% | | | | 2.82% | | | | 18.96% | (e) |
| | 1.14% | (f) | | | 1.30% | (f) | | | 1.40% | | | | 1.49% | | | | 1.60% | (e) |
| | 1.50% | | | | 1.19% | | | | 1.66% | | | | 0.90% | | | | 2.61% | (e) |
| | 7% | | | | 28% | | | | 51% | | | | 39% | | | | 5% | |
See Accompanying Notes to Financial Statements.
| | |
| Annual Report – April 30, 2016 | | 25 |
Financial Highlights
For a share outstanding through the periods presented
|
| Institutional Class |
NET ASSET VALUE, BEGINNING OF PERIOD |
INCOME FROM OPERATIONS: |
Net investment income(a) |
Net realized and unrealized gain/(loss) on investments |
Total from investment operations |
|
LESS DISTRIBUTIONS: |
From net investment income |
From net realized gains on investments |
Total distributions |
REDEMPTION FEES ADDED TO PAID IN CAPITAL |
NET INCREASE/(DECREASE) IN NET ASSET VALUE |
NET ASSET VALUE, END OF PERIOD |
| |
|
TOTAL RETURN(d) |
SUPPLEMENTAL DATA: |
Net assets, end of period (in 000s) |
RATIOS TO AVERAGE NET ASSETS: |
Operating expenses excluding reimbursement/waiver |
Operating expenses including reimbursement/waiver |
Net investment income including reimbursement/waiver |
PORTFOLIO TURNOVER RATE(g) |
| (a) | Calculated using the average shares method. |
| (b) | Less than $(0.005) per share. |
| (c) | Less than $0.005 per share. |
| (d) | Total returns are for the period indicated and have not been annualized. Total returns would have been lower had certain expenses not been waived during the period. Returns shown do not reflect the deduction of taxes that a shareholder would pay on Fund distributions or the redemption of Fund shares. |
| (f) | Effective September 1, 2014, the Adviser agreed to limit expenses to 1.05%. Prior to September 1, 2014, the Adviser agreed to limit expenses to 1.25%. (See Note 6). |
| (g) | Portfolio turnover rate for periods less than one full year have not been annualized. |
| | |
| 26 | | (855) 732-9220 seafarerfunds.com |
Seafarer Overseas Growth and Income Fund
| | | | | | | | | | | | | | | | | | |
| | | | |
Year Ended
April 30, 2016 | | | Year Ended
April 30, 2015 | | | Year Ended
April 30, 2014 | | | Year Ended
April 30, 2013 | | | For the Period
February 15, 2012
(Inception) to
April 30, 2012 |
| $ | 12.66 | | | $ | 11.59 | | | $ | 11.91 | | | $ | 10.18 | | | $ | 10.00 | |
| | | | | | | | | | | | | | | | | | |
| | 0.19 | | | | 0.15 | | | | 0.21 | | | | 0.14 | | | | 0.04 | |
| | (1.26) | | | | 1.28 | | | | 0.02 | | | | 1.71 | | | | 0.14 | |
| | (1.07) | | | | 1.43 | | | | 0.23 | | | | 1.85 | | | | 0.18 | |
| | | | |
| | | | | | | | | | | | | | | | | | |
| | (0.12) | | | | (0.21) | | | | (0.27) | | | | (0.12) | | | | – | |
| | (0.02) | | | | (0.15) | | | | (0.28) | | | | (0.00) | (b) | | | – | |
| | (0.14) | | | | (0.36) | | | | (0.55) | | | | (0.12) | | | | – | |
| | 0.01 | | | | 0.00 | (c) | | | 0.00 | (c) | | | 0.00 | (c) | | | – | |
| | (1.20) | | | | 1.07 | | | | (0.32) | | | | 1.73 | | | | 0.18 | |
| $ | 11.46 | | | $ | 12.66 | | | $ | 11.59 | | | $ | 11.91 | | | $ | 10.18 | |
| | | |
| | | | |
| | (8.32%) | | | | 12.76% | | | | 2.12% | | | | 18.33% | | | | 1.80% | |
| | | | | | | | | | | | | | | | | | |
| $ | 605,178 | | | $ | 129,714 | | | $ | 46,624 | | | $ | 11,486 | | | $ | 1,346 | |
| | | | | | | | | | | | | | | | | | |
| | 1.03% | | | | 1.18% | | | | 1.61% | | | | 2.88% | | | | 21.65% | (e) |
| | 1.03% | | | | 1.10% | (f) | | | 1.25% | | | | 1.35% | | | | 1.45% | (e) |
| | 1.72% | | | | 1.30% | | | | 1.89% | | | | 1.28% | | | | 2.00% | (e) |
| | 7% | | | | 28% | | | | 51% | | | | 39% | | | | 5% | |
See Accompanying Notes to Financial Statements.
| | |
| Annual Report – April 30, 2016 | | 27 |
| | |
| Seafarer Overseas Growth and Income Fund | | Notes to Financial Statements |
April 30, 2016
1. ORGANIZATION
Financial Investors Trust (the “Trust”), a Delaware statutory trust, is an open-end management investment company registered under the Investment Company Act of 1940, as amended (“1940 Act”). As of April 30, 2016, the Trust had 34 registered funds. This annual report describes the Seafarer Overseas Growth and Income Fund (the “Fund”). The Fund seeks to provide long-term capital appreciation along with some current income; it also seeks to mitigate adverse volatility in returns as a secondary objective. The Fund offers Investor Class and Institutional Class shares.
2. SIGNIFICANT ACCOUNTING POLICIES
The accompanying financial statements were prepared in accordance with accounting principles generally accepted in the United States of America (“U.S. GAAP”). The preparation of financial statements in conformity with U.S. GAAP requires management to make certain estimates and assumptions that affect the reported amounts of assets and liabilities and disclosures of contingent assets and liabilities at the date of the financial statements and the reported amounts of revenue and expenses during the period. Actual results could differ from those estimates. The Fund is considered an investment company for financial reporting purposes under U.S. GAAP. The following is a summary of significant accounting policies consistently followed by the Fund in preparation of its financial statements.
Investment Valuation: The Fund generally values its securities based on market prices determined at the close of regular trading on the New York Stock Exchange (“NYSE”), normally 4:00 p.m. Eastern Time, on each day the NYSE is open for trading.
For equity securities and mutual funds that are traded on an exchange, the market price is usually the closing sale or official closing price on that exchange. In the case of equity securities not traded on an exchange, or if such closing prices are not otherwise available, the securities are valued at the mean of the most recent bid and ask prices on such day. Redeemable securities issued by open-end registered investment companies are valued at the investment company’s applicable net asset value, with the exception of exchange-traded open-end investment companies, which are priced as equity securities.
Equity securities that are primarily traded on foreign securities exchanges are valued at the closing values of such securities on their respective foreign exchanges, except when an event occurs subsequent to the close of the foreign exchange but before the close of the NYSE, such that the securities’ value would likely change. In such an event, the fair values of those securities are determined in good faith through consideration of other factors in accordance with procedures established by and under the general supervision of the Board of Trustees (the “Board”). The Fund will use a fair valuation model provided by an independent pricing service, which is intended to reflect fair value when a security’s value or a meaningful portion of the Fund’s portfolio is believed to have been materially affected by a valuation event that has occurred between the close of the exchange or market on which the security is traded and the close of the regular trading day on the NYSE. The Fund’s valuation procedures set forth certain triggers that inform the Fund when to use the fair valuation model.
The market price for debt obligations is generally the price supplied by an independent third-party pricing service approved by the Board of Trustees (the “Board”), which may use a matrix, formula or other objective method that takes into consideration quotations from dealers, market transactions in comparable investments, market indices and yield curves. If vendors are unable to supply a price, or if the price supplied is deemed to be unreliable, the market price may be determined using quotations received from one or more broker–dealers that make a market in the security. Corporate bonds and convertible bonds are valued using market models that consider trade data, quotations from dealers and active market makers, relevant yield curve and spread data, creditworthiness, trade data or market
| | |
| 28 | | (855) 732-9220 seafarerfunds.com |
| | |
| Seafarer Overseas Growth and Income Fund | | Notes to Financial Statements |
April 30, 2016
information on comparable securities, and other relevant security specific information. Publicly traded foreign government debt securities and foreign corporate bonds are typically traded internationally in the over-the-counter market and are valued at the mean between the bid and asked prices as of the close of business of that market.
Forward currency exchange contracts have a market value determined by the prevailing foreign currency exchange daily rates and current foreign currency exchange forward rates. The foreign currency exchange forward rates are calculated using an automated system that estimates rates on the basis of the current day foreign currency exchange rates and forward foreign currency exchange rates supplied by a pricing service.
When such prices or quotations are not available, or when Seafarer Capital Partners, LLC (the “Adviser”) believes that they are unreliable, securities may be priced using fair value procedures approved by the Board.
Certain foreign countries impose a tax on capital gains which is accrued by the Fund based on unrealized appreciation, if any, on affected securities. The tax is paid when the gain is realized.
Fair Value Measurements: The Fund discloses the classification of its fair value measurements following a three-tier hierarchy based on the inputs used to measure fair value. Inputs refer broadly to the assumptions that market participants would use in pricing the asset or liability, including assumptions about risk. Inputs may be observable or unobservable. Observable inputs reflect the assumptions market participants would use in pricing the asset or liability. Such inputs are developed based on market data obtained from sources independent of the reporting entity. Unobservable inputs reflect the reporting entity’s own assumptions about the assumptions market participants would use in pricing the asset or liability, which are developed based on the information available and the reporting entity’s best efforts to interpret such information.
Various inputs are used in determining the value of the Fund’s investments as of the end of the reporting period. When inputs used fall into different levels of the fair value hierarchy, the level in the hierarchy within which the fair value measurement falls is determined based on the lowest level input that is significant to the fair value measurement in its entirety. The designated input levels are not necessarily an indication of the risk or liquidity associated with these investments. These inputs are categorized in the following hierarchy under applicable financial accounting standards:
| | |
Level 1 – | | Unadjusted quoted prices in active markets for identical investments, unrestricted assets or liabilities that a Fund has the ability to access at the measurement date; |
| |
Level 2 – | | Quoted prices which are not active, quoted prices for similar assets or liabilities in active markets or inputs other than quoted prices that are observable (either directly or indirectly) for substantially the full term of the asset or liability; and |
| |
Level 3 – | | Significant unobservable prices or inputs (including the Fund’s own assumptions in determining the fair value of investments) where there is little or no market activity for the asset or liability at the measurement date. |
| | |
| Annual Report – April 30, 2016 | | 29 |
| | |
| Seafarer Overseas Growth and Income Fund | | Notes to Financial Statements |
April 30, 2016
The following is a summary of each input used to value the Fund as of April 30, 2016:
| | | | | | | | | | | | | | | | |
Investments in Securities at Value(a) | | Level 1 -
Quoted Prices | | | Level 2 -
Other Significant
Observable
Inputs | | Level 3 -
Significant
Unobservable
Inputs | | Total |
Common Stocks | | $ | 930,845,846 | | | $ | – | | | $ | – | | | $ | 930,845,846 | |
Preferred Stocks | | | 113,995,217 | | | | – | | | | – | | | | 113,995,217 | |
Corporate Bonds | | | – | | | | 12,183,360 | | | | – | | | | 12,183,360 | |
Foreign Currency | | | | | | | | | | | | | | | | |
Convertible | | | | | | | | | | | | | | | | |
Bonds | | | – | | | | 19,458,482 | | | | – | | | | 19,458,482 | |
Foreign Currency | | | | | | | | | | | | | | | | |
Corporate | | | | | | | | | | | | | | | | |
Bonds | | | – | | | | 16,367,567 | | | | – | | | | 16,367,567 | |
Foreign Currency | | | | | | | | | | | | | | | | |
Government | | | | | | | | | | | | | | | | |
Bonds | | | – | | | | 29,243,880 | | | | – | | | | 29,243,880 | |
Total | | $ | 1,044,841,063 | | | $ | 77,253,289 | | | $ | – | | | $ | 1,122,094,352 | |
| | | | | | | | | | | | | | | | | |
| (a) | For detailed descriptions of security by country, see the accompanying Portfolio of Investments. |
The Fund recognizes transfers between levels as of the end of the period. For the year ended April 30, 2016, the Fund did not have any securities that used significant unobservable inputs (Level 3) in determining fair value.
Security amounts the Fund transferred between Levels 1 and 2 at April 30, 2016 were as follows:
| | | | | | | | | | | | | | | | |
| Seafarer Overseas | | | | | | | | | | | |
| Growth and | | Level 1 | | | Level 2 | |
| Income Fund | | Transfers In | | | Transfers (Out) | | | Transfers In | | | Transfers (Out) |
Common Stocks | | $ | 600,306,800 | | | $ | – | | | $ | – | | | $ | (600,306,800) | |
Preferred Stocks | | $ | 53,092,856 | | | $ | – | | | $ | – | | | $ | (53,092,856) | |
Total | | $ | 653,399,656 | | | $ | – | | | $ | – | | | $ | (653,399,656) | |
| | | | | | | | | | | | | | | | | |
The Fund utilizes a fair value evaluation service with respect to international securities with an earlier market closing than the Funds’ net asset value computation cutoff. When events trigger the use of the fair value evaluation service on a reporting period date, it results in certain securities transferring from a Level 1 to a Level 2 classification. The transfer amounts disclosed in the table above represent the value of the securities as of April 30, 2016 transferred in/(out) of Level 1 and Level 2 during the reporting period that were also held at April 30, 2015.
Investment Transactions and Investment Income: Investment transactions are accounted for on the date the investments are purchased or sold (trade date). Realized gains and losses from investment transactions are reported on an identified cost basis. Interest income, which includes accretion of discounts and amortization of premiums, is accrued and recorded as earned. Dividend income is recognized on the ex-dividend date or for certain foreign securities, as soon as information is available to the Fund. All of the realized and unrealized gains and losses and net investment income are allocated daily to each class in proportion to its average daily net assets.
| | |
| 30 | | (855) 732-9220 seafarerfunds.com |
| | |
| Seafarer Overseas Growth and Income Fund | | Notes to Financial Statements |
April 30, 2016
Foreign Securities: The Fund may directly purchase securities of foreign issuers. Investing in securities of foreign issuers involves special risks not typically associated with investing in securities of U.S. issuers. The risks include possible reevaluation of currencies, the inability to repatriate foreign currency, less complete financial information about companies and possible future adverse political and economic developments. Moreover, securities of many foreign issuers and their markets may be less liquid and their prices more volatile than those of securities of comparable U.S. issuers.
Foreign Currency Translation: The books and records of the Fund are maintained in U.S. dollars. Investment valuations and other assets and liabilities initially expressed in foreign currencies are converted each business day into U.S. dollars based upon current exchange rates. Prevailing foreign exchange rates may generally be obtained at the close of the NYSE (normally, 4:00 p.m. Eastern time). The portion of realized and unrealized gains or losses on investments due to fluctuations in foreign currency exchange rates is not separately disclosed and is included in realized and unrealized gains or losses on investments, when applicable.
Foreign Currency Spot Contracts: The Fund may enter into foreign currency spot contracts to facilitate transactions in foreign securities or to convert foreign currency receipts into U.S. dollars. A foreign currency spot contract is an agreement between two parties to buy and sell currencies at the current market rate, for settlement generally within two business days. The U.S. dollar value of the contracts is determined using current currency exchange rates supplied by a pricing service. The contract is marked-to-market daily for settlements beyond one day and any change in market value is recorded as an unrealized gain or loss. When the contract is closed, the Fund records a realized gain or loss equal to the difference between the value on the open and close date. Losses may arise from changes in the value of the foreign currency, or if the counterparties do not perform under the contract’s terms. The maximum potential loss from such contracts is the aggregate face value in U.S. dollars at the time the contract was opened.
Trust Expenses: Some expenses of the Trust can be directly attributed to the Fund. Expenses which cannot be directly attributed to the Fund are apportioned among all funds in the Trust based on average net assets of each fund.
Fund and Class Expenses: Expenses that are specific to the Fund or class of shares of the Fund, including shareholder servicing fees, are charged directly to the Fund or share class. All expenses of the Fund, other than class specific expenses, are allocated daily to each class in proportion to its average daily net assets.
Federal Income Taxes: The Fund complies with the requirements under Subchapter M of the Internal Revenue Code of 1986, as amended, applicable to regulated investment companies and intends to distribute substantially all of its net taxable income and net capital gains, if any, each year so that it will not be subject to excise tax on undistributed income and gains. The Fund is not subject to income taxes to the extent such distributions are made.
As of and during the year ended April 30, 2016, the Fund did not have a liability for any unrecognized tax benefits. The Fund files U.S. federal, state, and local tax returns as required. The Fund’s tax returns are subject to examination by the relevant tax authorities until expiration of the applicable statute of limitations, which is generally three years after the filing of the tax return for federal purposes and four years for most state returns. Tax returns for open years have incorporated no uncertain tax positions that require a provision for income taxes.
| | |
| Annual Report – April 30, 2016 | | 31 |
| | |
| Seafarer Overseas Growth and Income Fund | | Notes to Financial Statements |
April 30, 2016
Distributions to Shareholders: The Fund normally pays dividends from net investment income, if any, on a semi-annual basis. The Fund normally distributes capital gains, if any, on an annual basis. Income dividend distributions are derived from dividends and other income the Fund receives from its investments, including short term capital gains. Long term capital gain distributions are derived from gains realized when the Fund sells a security it has owned for more than one year. The Fund may make additional distributions and dividends at other times if the Adviser believes doing so may be necessary for the Fund to avoid or reduce taxes.
3. TAX BASIS INFORMATION
Reclassifications: As of April 30, 2016, permanent differences in book and tax accounting were reclassified. These differences had no effect on net assets and were primarily attributed to differences in the tax character of distributions, PFICs and foreign currency. The reclassifications were as follows:
| | | | | | | | | | | | |
| | | Paid-in Capital | | | Accumulated Net
Investment Income | | | Accumulated Net Realized Loss on Investments | |
Seafarer Overseas Growth and Income Fund | | $ | 213,491 | | | $ | (895,244) | | | $ | 681,753 | |
Tax Basis of Investments: As of April 30, 2016, the aggregate cost of investments, gross unrealized appreciation/ (depreciation) and net unrealized appreciation for Federal tax purposes were as follows:
| | | | | | | | | | | | | | | | | | | | |
| | | Cost of
Investments | | | Gross
Unrealized
Appreciation | | | Gross
Unrealized
Depreciation | | | Net
Depreciation
on Foreign
Currencies | | | Net Unrealized
Appreciation | |
Seafarer Overseas Growth and Income Fund | | $ | 1,090,230,033 | | | $ | 97,309,672 | | | $ | (65,445,353) | | | $ | 62,423 | | | $ | 31,926,742 | |
Components of Distributable Earnings: As of April 30, 2016, components of distributable earnings were as follows:
| | | | |
Accumulated net investment income | | $ | 4,003,091 | |
Accumulated net realized loss | | | (9,158,984) | |
Net unrealized appreciation on investments | | | 31,926,742 | |
Total distributable earnings | | $ | 26,770,849 | |
| | | | | |
| | |
| 32 | | (855) 732-9220 seafarerfunds.com |
| | |
| Seafarer Overseas Growth and Income Fund | | Notes to Financial Statements |
April 30, 2016
Capital Losses: As of April 30, 2016, the Fund has available for Federal income tax purposes unused capital losses that may be used to offset future realized capital gains. The Fund has $267,648 in short-term losses and $246,508 in long-term losses that will be carried forward indefinitely to offset future realized gains.
The fund elects to defer to the period ending April 30, 2017, capital losses recognized during the period November 1, 2015 to April 30, 2016 in the amount of $8,644,828.
Tax Basis of Distributions to Shareholders: The character of distributions made during the year from net investment income or net realized gains may differ from its ultimate characterization for federal income tax purposes. Also, due to the timing of dividend distributions, the fiscal year in which amounts are distributed may differ from the fiscal year in which the income or realized gain is recorded by the Fund.
The tax character of distributions paid by the Fund for the fiscal year ended April 30, 2016, were as follows:
| | | | | | | | |
| | | Ordinary Income | | | Long-Term Capital Gain | |
Seafarer Overseas Growth and Income Fund | | $ | 5,441,611 | | | $ | 1,748,524 | |
The tax character of distributions paid by the Fund for the fiscal year ended April 30, 2015, were as follows:
| | | | | | | | |
| | | Ordinary Income | | | Long-Term Capital Gain | |
Seafarer Overseas Growth and Income Fund | | $ | 1,973,654 | | | $ | 1,573,580 | |
4. SECURITIES TRANSACTIONS
The cost of purchases and proceeds from sales of securities excluding short term securities during the year ended April 30, 2016, were as follows:
| | | | | | | | |
| | | Purchases of
Securities | | | Proceeds From Sales
of Securities | |
Seafarer Overseas Growth and Income Fund | | $ | 978,855,606 | | | $ | 43,356,209 | |
| | |
| Annual Report – April 30, 2016 | | 33 |
| | |
| Seafarer Overseas Growth and Income Fund | | Notes to Financial Statements |
April 30, 2016
5. SHARES OF BENEFICIAL INTEREST
The capitalization of the Trust consists of an unlimited number of shares of beneficial interest with no par value per share. Holders of the shares of the Fund of the Trust have one vote for each share held and a proportionate fraction of a vote for each fractional share. All shares issued and outstanding are fully paid and are transferable and redeemable at the option of the shareholder. Purchasers of the shares do not have any obligation to make payments to the Trust or its creditors solely by reason of the purchasers’ ownership of the shares. Shares have no pre-emptive rights.
Shares redeemed within 90 days of purchase may incur a 2% short-term redemption fee deducted from the redemption amount. The redemption fee is reflected in the “Shares redeemed, net of redemption fees” in the Statements of Changes in Net Assets. During the years ended April 30, 2016, and April 30, 2015, the Fund retained the following redemption fees:
| | | | |
| Fund | | For the Year ended
April 30, 2016 | | For the Year ended
April 30, 2015 |
Seafarer Overseas Growth and Income Fund | | | | |
Investor Class | | $ 136,085 | | $ 10,091 |
Institutional Class | | $ 152,697 | | $ 6,959 |
6. MANAGEMENT AND RELATED-PARTY TRANSACTIONS
The Adviser, subject to the authority of the Board, is responsible for the overall management and administration of the Fund’s business affairs. The Adviser manages the investments of the Fund in accordance with the Fund’s investment objective, policies, limitations and investment guidelines established jointly by the Adviser and the Trustees. Pursuant to the advisory agreement with the Trust, the Adviser is entitled to investment advisory fees, computed daily at an annual rate of 0.75% of the average daily net assets of the Fund. The management fee is paid on a monthly basis.
Effective September 1, 2014, the Adviser contractually agreed to limit certain Fund expenses (excluding brokerage expenses, interest expenses, taxes and extraordinary expenses), to 1.25% and 1.05% of the Fund’s average daily net assets in the Investor and Institutional share classes, respectively, through August 31, 2015. Effective September 1, 2015, the Adviser has agreed contractually to waive and/or reimburse fees or expenses in order to limit Total Annual Fund Operating Expenses After Fee Waiver / Expense Reimbursements (excluding brokerage expenses, interest expenses, taxes and extraordinary expenses) to 1.15% and 1.05% of the Fund’s average daily net assets for the Investor and Institutional share classes respectively. This agreement (the “Expense Agreement”) is in effect through August 31, 2017. The Adviser will be permitted to recover, on a class-by-class basis, expenses it has borne through the Expense Agreement to the extent that the Fund’s expenses in later periods fall below the expense cap in effect at the time of waiver or reimbursement. The Fund will not be obligated to pay any such deferred fees and expenses more than three years after the end of the fiscal year(s) in which the fees and expenses were deferred. This agreement may not be terminated or modified prior to August 31, 2017 except with the approval of the Fund’s Board of Trustees. During the year ended April 30, 2016, the Adviser agreed that it will only seek to recoup waived management fees and will not recoup any reimbursed expenses from the prior three years. As of April 30, 2016, the Adviser has recouped all available waived management fees from the Fund. This amount is disclosed on the Statement of Operations as “Recoupment of previously waived fees”.
| | |
| 34 | | (855) 732-9220 seafarerfunds.com |
| | |
| Seafarer Overseas Growth and Income Fund | | Notes to Financial Statements |
April 30, 2016
Fund Administrator Fees and Expenses
ALPS Fund Services, Inc. (“ALPS” and the “Administrator”) (an affiliate of ALPS Distributors, Inc.) provides administrative, fund accounting and other services to the Fund under the Administration, Bookkeeping and Pricing Services Agreement with the Trust. Under this Agreement, ALPS is paid fees by the Fund, accrued on a daily basis and paid on a monthly basis following the end of the month, based on the greater of (a) an annual total fee of $151,120 (subject to an annual cost of living increase), or (b) the following fee schedule:
| | | | |
| Average Total Net Assets | | Contractual Fee | | |
Between $0-$500M | | 0.05% | | |
$500M-$1B | | 0.03% | | |
Above $1B | | 0.02% | | |
The Administrator is also reimbursed by the Fund for certain out-of-pocket expenses. Administration fees paid by the Fund for the year ended April 30, 2016 are disclosed in the Statements of Operations.
Transfer Agent
ALPS serves as transfer, dividend paying and shareholder servicing agent for the Fund (“Transfer Agent”). ALPS is compensated based upon a $26,420 annual base fee for the Fund, and annually $9 per direct open account and $7 per open account through NSCC. The Transfer Agent is also reimbursed by the Fund for certain out-of-pocket expenses. Transfer agent fees paid by the Fund for the year ended April 30, 2016 are disclosed in the Statement of Operations.
Compliance Services
ALPS provides services that assist the Trust’s chief compliance officer in monitoring and testing the policies and procedures of the Trust in conjunction with requirements under Rule 38a-1 under the 1940 Act under the Chief Compliance Officer Services Agreement with the Trust. Under this Agreement, ALPS is paid an annual base fee of $31,704 and is reimbursed for certain out-of-pocket expenses. Compliance service fees paid by the Fund for the year ended April 30, 2016 are disclosed in the Statement of Operations.
Principal Financial Officer
ALPS provides principal financial officer services to the Fund under the Principal Financial Officer Services Agreement with the Trust. Under this Agreement, ALPS is paid an annual base fee of $10,000 and is reimbursed for certain out-of-pocket expenses. Principal financial officer fees paid by the Fund for the year ended April 30, 2016 are disclosed in the Statement of Operations.
Distributor
ALPS Distributors, Inc. (“ADI” or the “Distributor”) (an affiliate of ALPS) acts as the distributor of the Fund’s shares pursuant to the Distribution Agreement with the Trust. Under a side letter agreement, the Adviser pays ADI an annual base fee of $12,000 for the distribution services. The Adviser also reimburses ADI for certain out-of-pocket expenses. Shares are sold on a continuous basis by ADI as agent for the Fund, and ADI has agreed to use its best efforts to solicit orders for the sale of the Fund’s shares, although it is not obliged to sell any particular amount of shares. ADI is registered as a broker-dealer with the U.S. Securities and Exchange Commission.
Shareholder Service Plan for Investor Class and Institutional Class Shares
The Fund has adopted a Shareholder Services Plan (a “Services Plan”) for each of its share classes. Under the Services Plan, the Fund is authorized to enter into shareholder service agreements with investment advisers, financial institutions and other service providers (“Participating Organizations”) to maintain and provide certain administrative and servicing functions in relation to the accounts of shareholders. Shareholder service arrangements typically include processing orders for shares, generating account and confirmation statements, sub-accounting, account maintenance, tax reporting, and disbursing cash dividends as well as other investment or administrative services required for the particular Participating Organization’s products, programs, platform and accounts. The Services Plan will cause the Fund to pay an aggregate fee, not to exceed on an annual basis 0.15% and 0.05% of the
| | |
| Annual Report – April 30, 2016 | | 35 |
| | |
| Seafarer Overseas Growth and Income Fund | | Notes to Financial Statements |
April 30, 2016
average daily net asset value of the Investor and Institutional share classes, respectively. Such payment will be made on assets attributable to or held in the name of a Participating Organization, on behalf of its clients as compensation for providing service activities pursuant to an agreement with a Participating Organization. Any amount of such payment not paid to the Participating Organizations during the Fund’s fiscal year for such service activities shall be reimbursed to the Fund as soon as practicable after the end of the fiscal year.
7. INDEMNIFICATIONS
Under the Trust’s organizational documents, its officers and Trustees are indemnified against certain liability arising out of the performance of their duties to the Trust. Additionally, in the normal course of business, the Trust enters into contracts with service providers that may contain general indemnification clauses, which may permit indemnification to the extent permissible under the applicable law. The Trust’s maximum exposure under these arrangements is unknown, as this would involve future claims that may be made against the Trust that have not yet occurred.
| | |
| 36 | | (855) 732-9220 seafarerfunds.com |
| | |
| Seafarer Overseas Growth and Income Fund | | Report of Independent Registered Public Accounting Firm |
April 30, 2016
To the Shareholders and Board of Trustees of Financial Investors Trust:
We have audited the accompanying statement of assets and liabilities, including the portfolio of investments, of Seafarer Overseas Growth and Income Fund (the “Fund”), one of the portfolios constituting Financial Investors Trust, as of April 30, 2016, and the related statement of operations for the year then ended, the statements of changes in net assets for each of the two years in the period then ended, and the financial highlights for each of the four years in the period then ended and for the period from February 15, 2012 (inception) to April 30, 2012. These financial statements and financial highlights are the responsibility of the Fund’s management. Our responsibility is to express an opinion on these financial statements and financial highlights based on our audits.
We conducted our audits in accordance with the standards of the Public Company Accounting Oversight Board (United States). Those standards require that we plan and perform the audit to obtain reasonable assurance about whether the financial statements and financial highlights are free of material misstatement. The Fund is not required to have, nor were we engaged to perform, an audit of its internal control over financial reporting. Our audits included consideration of internal control over financial reporting as a basis for designing audit procedures that are appropriate in the circumstances, but not for the purpose of expressing an opinion on the effectiveness of the Fund’s internal control over financial reporting. Accordingly, we express no such opinion. An audit also includes examining, on a test basis, evidence supporting the amounts and disclosures in the financial statements, assessing the accounting principles used and significant estimates made by management, as well as evaluating the overall financial statement presentation. Our procedures included confirmation of securities owned as of April 30, 2016, by correspondence with the custodian and brokers; when replies were not received from brokers, we performed other auditing procedures. We believe that our audits provide a reasonable basis for our opinion.
In our opinion, the financial statements and financial highlights referred to above present fairly, in all material respects, the financial position of Seafarer Overseas Growth and Income Fund of Financial Investors Trust as of April 30, 2016, the results of its operations for the year then ended, the changes in its net assets for each of the two years in the period then ended, and the financial highlights for each of the four years in the period then ended and for the period from February 15, 2012 (inception) to April 30, 2012, in conformity with accounting principles generally accepted in the United States of America.
DELOITTE & TOUCHE LLP
Denver, Colorado
June 28, 2016
| | |
| Annual Report – April 30, 2016 | | 37 |
| | |
| Seafarer Overseas Growth and Income Fund | | Disclosure Regarding Approval of Fund Advisory Agreement |
April 30, 2016 (Unaudited)
On December 15, 2015, the Trustees met in person to discuss, among other things, the approval of the investment advisory agreement between the Trust and Seafarer Capital Partners, LLC (the “Adviser”) (the “Investment Advisory Agreement”), in accordance with Section 15(c) of the Investment Company Act of 1940, as amended. The Independent Trustees met with independent legal counsel during executive session and discussed the Investment Advisory Agreement and other related materials.
In renewing and approving the Investment Advisory Agreement with the Adviser, the Trustees, including the Independent Trustees, considered the following factors with respect to the Seafarer Overseas Growth and Income Fund (the “Seafarer Fund”):
Investment Advisory Fee Rate: The Trustees reviewed and considered the contractual annual advisory fee paid by the Trust, on behalf of the Seafarer Fund, to the Adviser of 0.75% of the Seafarer Fund’s daily average net assets, in light of the extent and quality of the advisory services provided by the Adviser to the Seafarer Fund.
The Board received and considered information including a comparison of the Seafarer Fund’s contractual and actual management fees and overall expenses with those of funds in the expense group and universes of funds selected by an independent provider of investment company data (the “Independent Data Provider”). The Trustees noted that the contractual management fee rate for the Institutional Class shares of the Seafarer Fund was below the average and median contractual management fee rates of the Independent Data Provider expense group.
Total Expense Ratios: Based on such information, the Trustees further reviewed and considered the total expense ratio (after waivers) of 1.098% for the Institutional Class of the Seafarer Fund. The Trustees noted that the Seafarer Fund’s total expense ratio (after waivers) was below the average and median total expense ratios of the Independent Data Provider expense group.
Nature, Extent and Quality of the Services under the Investment Advisory Agreement: The Trustees received and considered information regarding the nature, extent and quality of services provided to the Seafarer Fund under the Investment Advisory Agreement. The Trustees reviewed certain background materials supplied by the Adviser in its presentation, including its Form ADV.
The Trustees reviewed and considered the Adviser’s investment advisory personnel, its history as an asset manager and its performance and the amount of assets currently under management by the Adviser and its affiliated entities. The Trustees also reviewed the research and decision-making processes utilized by the Adviser, including the methods adopted to seek to achieve compliance with the investment objectives, policies and restrictions of the Seafarer Fund.
The Trustees considered the background and experience of the Adviser’s management in connection with the Seafarer Fund, including reviewing the qualifications, backgrounds and responsibilities of the management team primarily responsible for the day-to-day portfolio management of the Seafarer Fund and the extent of the resources devoted to research and analysis of actual and potential investments.
The Trustees also reviewed, among other things, the Adviser’s insider trading policies and procedures and its Code of Ethics.
Performance: The Trustees reviewed performance information for the Seafarer Fund for the 1-year, 2-year, 3-year and since inception (February 15, 2012) periods ended October 31, 2015. That review included a comparison of the Seafarer Fund’s performance to the performance universe of a group of funds selected by Independent Data Provider. The Trustees noted the performance of the Seafarer Fund was above its respective performance universe average and benchmark for these periods. The Trustees also considered the Adviser’s discussion of the Seafarer Fund’s underlying portfolio diversification categories, its top contributors and top detractors, as well as the Adviser’s performance
| | |
| 38 | | (855) 732-9220 seafarerfunds.com |
| | |
| Seafarer Overseas Growth and Income Fund | | Disclosure Regarding Approval of Fund Advisory Agreement |
April 30, 2016 (Unaudited)
and reputation generally and its investment techniques, risk management controls and decision-making processes.
Comparable Accounts: The Trustees noted certain information provided by the Adviser regarding fees charged to other Adviser clients and considered the Adviser’s statements indicating that there were no clients with investment mandates directly comparable to that of the Seafarer Fund.
Profitability: The Trustees received and considered a retrospective, if applicable, and projected profitability analysis prepared by the Adviser based on the fees payable under the Investment Advisory Agreement with respect to the Seafarer Fund. The Trustees considered the profits, if any, anticipated to be realized by the Adviser in connection with the operation of the Seafarer Fund. The Board then reviewed the Adviser’s unaudited financial statements, including profit and loss statements for the fiscal year 2014 and the period of October 1, 2014 to September 30, 2015 and balance sheets as of December 31, 2014 and September 30, 2015 in order to analyze the financial condition and stability and profitability of the Adviser.
Economies of Scale: The Trustees considered whether economies of scale in the provision of services to the Seafarer Fund will be passed along to the shareholders under the proposed agreements.
Other Benefits to the Adviser: The Trustees reviewed and considered any other incidental benefits derived or to be derived by the Adviser from its relationship with the Seafarer Fund, including whether soft dollar arrangements were used.
In renewing the Adviser as the Seafarer Fund’s investment adviser and renewing the Investment Advisory Agreement and the fees charged under the Investment Advisory Agreement, the Trustees concluded that no single factor reviewed by the Trustees was identified by the Trustees to be determinative as the principal factor in whether to renew the Investment Advisory Agreement. Further, the Independent Trustees were advised by separate independent legal counsel throughout the process. The Trustees, including all of the Independent Trustees, concluded that:
| | • | | the contractual management fee rate was below the average and median expense group contractual management fee rate for the Institutional Class of the Seafarer Fund; |
| | • | | the total expense ratio (after waivers) was below the average and median expense group total expense ratios (after waivers) for the Institutional Class of the Seafarer Fund; |
| | • | | the nature, extent and quality of services rendered by the Adviser under the Investment Advisory Agreement with respect to the Seafarer Fund were adequate; |
| | • | | the performance of the Institutional Class of the Seafarer Fund was above the average of the funds in its Independent Data Provider performance universe for the 1-year, 2-year, 3- year and since inception periods ended October 31, 2015; |
| | • | | bearing in mind the limitations of comparing different types of managed accounts and the different levels of service typically associated with such accounts, the fee structures applicable to the Adviser’s other clients were not indicative of any unreasonableness with respect to the advisory fees proposed to be payable by the Seafarer Fund; |
| | • | | the profit, if any, realized by the Adviser in connection with the operation of the Seafarer Fund is not unreasonable to the Seafarer Fund; and |
| | • | | there were no material economies of scale or other incidental benefits accruing to the Adviser in connection with its relationship with the Seafarer Fund. |
| | |
| Annual Report – April 30, 2016 | | 39 |
| | |
| Seafarer Overseas Growth and Income Fund | | Disclosure Regarding Approval of Fund Advisory Agreement |
April 30, 2016 (Unaudited)
During the review process, the Trustees noted certain instances where clarification or follow-up was appropriate and others where the Trustees determined that further clarification or follow-up was not necessary. In those instances where clarification or follow-up was requested, the Board determined that in each case either information responsive to its requests had been provided, or where any request was outstanding in whole or in part, given the totality of the information provided with respect to the Investment Advisory Agreement, the Board had received sufficient information to renew and approve the Investment Advisory Agreement.
Based on the Trustees’ deliberations and their evaluation of the information described above, the Trustees, including all of the Independent Trustees, concluded that the Adviser’s compensation for investment advisory services is consistent with the best interests of the Seafarer Fund and its shareholders.
| | |
| 40 | | (855) 732-9220 seafarerfunds.com |
| | |
| Seafarer Overseas Growth and Income Fund | | Additional Information |
April 30, 2016 (Unaudited)
1. FUND HOLDINGS
The Fund files its complete schedule of portfolio holdings with the Securities and Exchange Commission (the “SEC”) for the first and third quarters of each fiscal year on Form N-Q within 60 days after the end of the period. Copies of the Fund’s Form N-Q are available without charge on the SEC website at http://www.sec.gov. You may also review and copy the Form N-Q at the SEC’s Public Reference Room in Washington, D.C. For more information about the operation of the Public Reference Room, please call the SEC at 1-800-SEC-0330.
2. FUND PROXY VOTING POLICIES, PROCEDURES AND SUMMARIES
The Fund’s policies and procedures used in determining how to vote proxies and information regarding how the Fund voted proxies relating to portfolio securities during the most recent prior 12-month period ending June 30 are available without charge, (1) upon request, by calling toll-free (855) 732-9220 and (2) on the SEC’s website at http://www.sec.gov.
3. TAX DESIGNATIONS (UNAUDITED)
The Fund designates the following as a percentage of taxable ordinary income distributions, or up to the maximum amount allowable, for the calendar year ended December 31, 2015:
| | |
| Dividends Received Deduction | | Qualified Dividend Income |
0.00% | | 63.20% |
In early 2016, if applicable, shareholders of record received this information for the distributions paid to them by the Fund during the calendar year 2015 via Form 1099. The Fund will notify shareholders in early 2017 of amounts paid to them by the Fund, if any, during the calendar year 2016.
The Fund designates foreign taxes paid in the amount of $989,458 and foreign source income in the amount of $16,454,435 for federal income tax purposes for the year ended April 30, 2016.
Pursuant to section 852(b)(3), the Fund designates $1,748,524 as a long-term capital gain distribution.
Please consult a tax advisor if you have questions about federal or state income tax laws, or how to prepare your tax returns.
| | |
| Annual Report – April 30, 2016 | | 41 |
| | |
| Seafarer Overseas Growth and Income Fund | | Trustees and Officers |
April 30, 2016 (Unaudited)
Additional information regarding the Fund’s trustees is included in the Statement of Additional Information, which can be obtained without charge by calling 888-288-1121.
INDEPENDENT TRUSTEES
| | | | | | | | | | |
Name,
Address*
& Year
of Birth | | Position(s)
Held with
Fund | | Term of
Office and
Length of
Time Served | | Principal Occupation(s)
During Past 5 Years** | | Number of
Funds in
Fund
Complex
Overseen
by
Trustee*** | | Other
Directorships
Held by Trustee
During Past
5 Years** |
Mary K. Anstine, 1940 | | Trustee | | Ms. Anstine was elected at a special meeting of shareholders held on March 21, 1997 and re-elected at a special meeting of shareholders held on August 7, 2009. | | Ms. Anstine was formerly an Executive Vice President of First Interstate Bank of Denver until 1994, President/Chief Executive Officer of HealthONE Alliance, Denver, Colorado, from 1994 to 2004, and has been retired since 2004. Ms. Anstine is also Trustee/Director of AV Hunter Trust and Colorado Uplift Board. Ms. Anstine was formerly a Director of the Trust Bank of Colorado (later purchased and now known as Northern Trust Bank), HealthONE and Denver Area Council of the Boy Scouts of America, and a member of the American Bankers Association Trust Executive Committee. | | 34 | | Ms. Anstine is a Trustee of ALPS ETF Trust (20 funds); ALPS Variable Investment Trust (9 funds); Reaves Utility Income Fund (1 fund); and Westcore Trust (12 funds). |
John R. Moran, Jr., 1930 | | Trustee | | Mr. Moran was elected at a special meeting of shareholders held on March 21, 1997 and re-elected at a special meeting of shareholders held on August 7, 2009. | | Mr. Moran formerly served as President and CEO of The Colorado Trust, a private foundation serving the health and hospital community in the state of Colorado, from 1991 to 2007. During his career as an attorney from 1958 to 1991, Mr. Moran was formerly a partner with the firm of Kutak Rock & Campbell in Denver, Colorado and a member of the Colorado House of Representatives. Currently, Mr. Moran is a member of the Treasurer’s Investment Advisory Committee for the University of Colorado. | | 34 | | None. |
| | |
| 42 | | (855) 732-9220 seafarerfunds.com |
| | |
| Seafarer Overseas Growth and Income Fund | | Trustees and Officers |
April 30, 2016 (Unaudited)
INDEPENDENT TRUSTEES (continued)
| | | | | | | | | | |
Name,
Address*
& Year
of Birth | | Position(s)
Held with
Fund | | Term of
Office and
Length of
Time Served | | Principal Occupation(s)
During Past 5 Years** | | Number of
Funds in
Fund
Complex
Overseen
by
Trustee*** | | Other
Directorships
Held by Trustee
During Past
5 Years** |
Jeremy W. Deems, 1976 | | Trustee | | Mr. Deems was appointed as a Trustee at the March 11, 2008 meeting of the Board of Trustees and elected at a special meeting of shareholders held on August 7, 2009. | | Mr. Deems is the Co-Founder, Chief Operations Officer and Chief Financial Officer of Green Alpha Advisors, LLC, a registered investment advisor, and Co-Portfolio Manager of the Shelton Green Alpha Fund. Prior to joining Green Alpha Advisors, Mr. Deems was CFO and Treasurer of Forward Management, LLC, ReFlow Management Co., LLC, ReFlow Fund, LLC, a private investment fund, and Sutton Place Management, LLC, an administrative services company, from 1998 to June 2007. From 2004 to 2005, Mr. Deems also served as Treasurer of the Forward Funds and the Sierra Club Funds. | | 34 | | Mr. Deems is a Trustee of ALPS ETF Trust (20 funds); ALPS Variable Investment Trust (9 funds), Reaves Utility Income Fund (1 fund) and Clough Funds Trust (1 fund). |
Jerry G. Rutledge 1944 | | Trustee | | Mr. Rutledge was elected at a special meeting of shareholders held on August 7, 2009. | | Mr. Rutledge is the President and owner of Rutledge’s Inc., a retail clothing business. Mr. Rutledge is currently Director of the American National Bank. He was from 1994 to 2007 a Regent of the University of Colorado. | | 34 | | Mr. Rutledge is a Trustee of Principal Real Estate Fund (1 fund), Clough Global Allocation Fund (1 fund), Clough Global Equity Fund (1 fund) and Clough Global Opportunities Fund (1 fund). |
| | |
| Annual Report – April 30, 2016 | | 43 |
| | |
| Seafarer Overseas Growth and Income Fund | | Trustees and Officers |
April 30, 2016 (Unaudited)
INDEPENDENT TRUSTEES (continued)
| | | | | | | | | | |
Name,
Address*
& Year
of Birth | | Position(s)
Held with
Fund | | Term of
Office and
Length of
Time Served | | Principal Occupation(s)
During Past 5 Years** | | Number of
Funds in
Fund
Complex
Overseen
by
Trustee*** | | Other
Directorships
Held by Trustee
During Past
5 Years** |
Michael “Ross” Shell, 1970 | | Trustee | | Mr. Shell was elected at a special meeting of shareholders held on August 7, 2009. | | Mr. Shell is Founder and CEO of Red Idea, LLC, a strategic consulting/early stage venture firm (since June 2008). From 1999 to 2009, he was a part-owner and Director of Tesser, Inc., a brand agency. From December 2005 to May 2008, he was Director, Marketing and Investor Relations, of Woodbourne, a REIT/real estate hedge fund and private equity firm. Prior to this, from May 2004 to November 2005, he worked as a business strategy consultant; from June 2003 to April 2004, he was on the Global Client Services team of IDEO, a product design/innovation firm; and from 1999 to 2003, he was President of Tesser, Inc. Mr. Shell graduated with honors from Stanford University with a degree in Political Science. | | 34 | | None. |
| | |
| 44 | | (855) 732-9220 seafarerfunds.com |
| | |
| Seafarer Overseas Growth and Income Fund | | Trustees and Officers |
April 30, 2016 (Unaudited)
INTERESTED TRUSTEE
| | | | | | | | | | |
Name,
Address*
& Age | | Position(s) Held with Fund | | Term of
Office and
Length of
Time Served | | Principal Occupation(s)
During Past 5 Years** | | Number of
Funds in
Fund
Complex
Overseen
by
Trustee*** | | Other
Directorships
Held by
Trustee |
Edmund J. Burke, 1961 | | Trustee, Chairman and President | | Mr. Burke was elected as Chairman at the August 28, 2009 meeting of the Board of Trustees. Mr. Burke was elected as Trustee at a special meeting of shareholders held on August 7, 2009. Mr. Burke was elected President of the Trust at the December 17, 2002 meeting of the Board of Trustees. | | Mr. Burke is President and a Director of ALPS Holdings, Inc. (“AHI”) (since 2005) and Director of Boston Financial Data Services, Inc. (“BFDS”), ALPS Advisors, Inc. (“AAI”), ALPS Distributors, Inc. (“ADI”), ALPS Fund Services, Inc. (“AFS”) and ALPS Portfolio Solutions Distributor, Inc. (“APSD”) and from 2001-2008, was President of AAI, ADI, AFS and APSD. Because of his positions with AHI, BFDS, AAI, ADI, AFS and APSD, Mr. Burke is deemed an affiliate of the Trust as defined under the 1940 Act. Mr. Burke is Trustee and President of the Clough Global Allocation Fund (Trustee since 2006; President since 2004); Trustee and President of the Clough Global Equity Fund (Trustee since 2006; President since 2005); Trustee and President of the Clough Global Opportunities Fund (since 2006); Trustee of the Liberty All-Star Equity Fund; and Director of the Liberty All-Star Growth Fund, Inc. | | 34 | | Mr. Burke is a Trustee of Clough Global Allocation Fund (1 fund); Clough Global Equity Fund (1 fund); Clough Global Opportunities Fund (1 fund); Liberty All-Star Equity Fund (1 fund) and Clough Funds Trust (1 fund); and Director of the Liberty All-Star Growth Fund, Inc. (1 fund). |
| | |
| Annual Report – April 30, 2016 | | 45 |
| | |
| Seafarer Overseas Growth and Income Fund | | Trustees and Officers |
April 30, 2016 (Unaudited)
OFFICERS
| | | | | | |
Name,
Address*
& Year
of Birth | | Position(s)
Held with
Fund | | Term of Office
and Length of
Time Served | | Principal Occupation(s) During Past 5 Years** |
Kimberly R. Storms, 1972 | | Treasurer | | Ms. Storms was elected Treasurer of the Trust at the March 12, 2013 meeting of the Board of Trustees. | | Ms. Storms is Senior Vice President - Director of Fund Administration of ALPS. Because of her position with ALPS, Ms. Storms is deemed an affiliate of the Trust as defined under the 1940 Act. Ms. Storms is also Treasurer of Liberty All-Star Equity Fund, Liberty All-Star Growth Fund, Inc. and ALPS Series Trust. Ms. Storms also serves as a Board member and Treasurer of The Center for Trauma & Resilience, a nonprofit agency. |
JoEllen L. Legg, 1961 | | Secretary | | Ms. Legg was elected Secretary of the Trust at the September 15, 2015 meeting of the Board of Trustees. | | Ms. Legg joined ALPS in October 2007 and is currently Vice President, Assistant General Counsel of ALPS. Prior to joining ALPS, Ms. Legg served as Senior Counsel - Law (Corporate & Securities) for Adelphia Communications Corporation (February 2005 - March 2007). Prior to this, Ms. Legg held associate positions at Fried Frank Harris Shriver & Jacobson LLP (1998 - 2004) and at Patton Boggs LLP (2004 - 2005). Because of her position with ALPS, Ms. Legg is deemed an affiliate of the Trust as defined under the 1940 Act. Ms. Legg is also the Secretary of ALPS Series Trust and Reaves Utility Income Fund. |
Ted Uhl, 1974 | | Chief Compliance Officer (“CCO”) | | Mr. Uhl was appointed CCO of the Trust at the June 8, 2010 meeting of the Board of Trustees. | | Mr. Uhl joined ALPS in October 2006, and is currently Deputy Compliance Officer of ALPS. Prior to his current role, Mr. Uhl served as Senior Risk Manager for ALPS from October 2006 until June 2010. Because of his position with ALPS, Mr. Uhl is deemed an affiliate of the Trust as defined under the 1940 Act. Mr. Uhl is also CCO of the Reaves Utility Income Fund, Centre Funds and Transparent Value Trust. |
Jennell Panella, 1974 | | Assistant Treasurer | | Ms. Panella was elected Assistant Treasurer of the Trust at the September 15, 2015 meeting of the Board of Trustees. | | Ms. Panella joined ALPS in June 2012 and is currently Fund Controller of ALPS Fund Services, Inc. Prior to joining ALPS, Ms. Panella served as Financial Reporting Manager for Parker Global Strategies, LLC (2009-2012). Because of her position with ALPS, Ms. Panella is deemed an affiliate of the Trust as defined under the 1940 Act. Ms. Panella also serves as Assistant Treasurer of James Advantage Funds. |
Nate Mandeville, 1977 | | Assistant Treasurer | | Mr. Mandeville was elected Assistant Treasurer of the Trust at the September 15, 2015 meeting of the Board of Trustees. | | Mr. Mandeville joined ALPS in December 2013 and is Fund Controller for ALPS. Prior to joining ALPS, Mr. Mandeville worked for Great-West Financial (2011-2013), Virtuoso Sourcing Group (2008-2011) and Janus Capital Group (2000-2008). Because of his position with ALPS, Mr. Mandeville is deemed an affiliate of the Trust as defined under the 1940 Act. Mr. Mandeville also serves as Assistant Treasurer of ALPS Series Trust. |
Sharon Akselrod, 1974 | | Assistant Secretary | | Ms. Akselrod was elected Assistant Secretary of the Trust at the September 15, 2015 meeting of the Board of Trustees. | | Ms. Akselrod joined ALPS in August 2014 and is currently Senior Investment Company Act Paralegal of ALPS. Prior to joining ALPS, Ms. Akselrod served as Corporate Governance and Regulatory Associate for Nordstrom fsb (2013-2014) and Senior Legal Assistant – Legal Manager for AXA Equitable Life Insurance Company (2008-2013). Because of her position with ALPS, Ms. Akselrod is deemed an affiliate of the Trust as defined under the 1940 Act. |
| | |
| 46 | | (855) 732-9220 seafarerfunds.com |
| | |
| Seafarer Overseas Growth and Income Fund | | Trustees and Officers |
April 30, 2016 (Unaudited)
OFFICERS (continued)
| | | | | | |
Name,
Address*
& Year
of Birth | | Position(s)
Held with
Fund | | Term of Office
and Length of
Time Served | | Principal Occupation(s) During Past 5 Years** |
Sareena Khwaja-Dixon 1980 | | Assistant Secretary | | Ms. Khwaja-Dixon was elected Assistant Secretary of the Trust at the December 15, 2015 meeting of the Board of Trustees. | | Ms. Khwaja-Dixon joined ALPS in August 2015 and is currently Senior Counsel and Vice President of ALPS. Prior to joining ALPS, Ms. Khwaja-Dixon served as a Senior Paralegal/Paralegal for Russell Investments (2011- 2015). Because of her position with ALPS, Ms. Khwaja-Dixon is deemed an affiliate of the Trust as defined under the 1940 Act. |
| * | All communications to Trustees and Officers may be directed to Financial Investors Trust c/o 1290 Broadway, Suite 1100, Denver, CO 80203. |
| ** | This is the period for which the Trustee or Officer began serving the Trust. Each Trustee serves an indefinite term, until his successor is elected. Officers are elected on an annual basis. |
| *** | The Fund Complex includes all series of the Trust (currently 34) and any other investment companies for which any Trustee serves as trustee for and which Seafarer Capital Partners, LLC provides investment advisory services (currently none). |
| | |
| Annual Report – April 30, 2016 | | 47 |

Seafarer Funds distributed by ALPS Distributors, Inc.
Must be accompanied or preceded by a prospectus.
Stonebridge Small-Cap Growth Fund (SBSGX)
ANNUAL REPORT
APRIL 30, 2016
Table of Contents
April 30, 2016
| | |
| Stonebridge Small-Cap Growth Fund | | Letter to Shareholders |
April 30, 2016 (Unaudited) |
May 13, 2016
Dear Shareholders:
On April 27, 2016, Stonebridge Capital Management informed the Board of Trustees of its contractually required 60-day notice of resignation as adviser to the Stonebridge Small-Cap Growth Fund. As such, this will be our last letter to shareholders of the Fund. We appreciate your loyalty over several decades and are saddened that the economics of advising to a small mutual fund have become so challenging.
OVERVIEW
The performance of the Fund has significantly improved over the last six months as several investments in the portfolio positively inflected due to improving fundamentals at the individual company level. Further, the Fund had much less exposure to industries such as biotech and social media that saw a major sell-off during the first calendar quarter of 2016. During the twelve-month period ending April 30, 2016, the Fund’s health care exposure added significant outperformance to the Fund as did the Fund’s exposure to the industrial sector. The biggest detractor to performance over the last twelve months was the Fund’s exposure to consumer discretionary companies and financials.
The top three performers over the last six months include Genomic Health (health care), Chefs’ Warehouse (consumer staples) and Tandem Diabetes Care (health care). The Fund continues to own all three positions. The three worst performing holdings over the last six months were Nimble Storage (technology), WisdomTree Investments (financials) and Advisory Board (health care). The Fund has exited its position of Advisory Board and is waiting for Nimble’s upcoming quarterly earnings release for additional data.
STONEBRIDGE SMALL-CAP GROWTH FUND
For the six months ending April 30, 2016, the Stonebridge Small-Cap Growth Fund declined by 0.82% versus a much broader decline of 4.98% for the Russell 2000 Growth Index, the Fund’s benchmark. During the last fiscal year, April 30, 2015 to April 30, 2016, the Stonebridge Small-Cap Growth Fund declined by 12.92%. Over the past twelve months, the Fund made some key adjustments to its sector allocations; increasing its financial and technology exposure while reducing its industrial and telecommunications exposure. As we indicated in our last shareholder letter dated November 12, 2015, the technology and health care sectors in combination remain greater than 50% of the Fund’s exposure and that remains true today. As such, these sectors continue to be key areas of focus for the Fund’s investment strategy and success in the near-term. The Fund also continues to favor energy companies as we believe crude oil prices remain too low and that demand for crude oil remains strong and that the growth in supply of crude oil is limited. Last, while the Fund’s strategy remains cautious on the overall state of consumer spending, it does have investment positions in consumer companies with strong growth opportunities and market-leading positions.
| | |
| Annual Report | April 30, 2016 | | 1 |
| | |
| Stonebridge Small-Cap Growth Fund | | Letter to Shareholders |
April 30, 2016 (Unaudited)
Stonebridge Small-Cap Growth Fund (SBSGX) Sector Allocation
as a Percent of Net Assets as of April 30, 2016*

* Holdings are subject to change, and may not reflect the current or future position of the portfolio.
Change in value of a $10,000 investment in Stonebridge Small-Cap
Growth Fund (SBSGX) vs. the Russell 2000® Growth Index and
the S&P 500® Total Return Index from April 30, 2006 to April 30, 2016
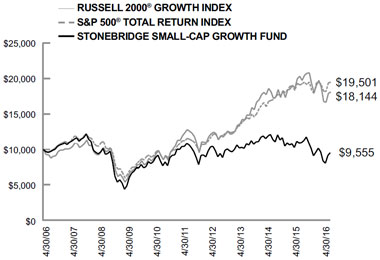
Average Annual Total Returns for the Years Ended April 30, 2016
| | | | | | | | | | | | |
| | | 1 Year | | | 5 Years | | | 10 Years | |
Stonebridge Small-Cap Growth Fund (SBSGX) | | | -12.92% | | | | -2.54% | | | | -0.45% | |
Russell 2000® Growth Index(1) | | | -8.27% | | | | 7.15% | | | | 6.14% | |
S&P 500® Total Return Index(2) | | | 1.21% | | | | 11.02% | | | | 6.91% | |
| | |
| 2 | | Stonebridge Small-Cap Growth Fund |
| | |
| Stonebridge Small-Cap Growth Fund | | Letter to Shareholders |
April 30, 2016 (Unaudited)
Average annual total returns reflect reinvestment of all dividends and capital gains distributions, any fee waivers in effect and any expense reimbursements. Without the fee waivers and expense reimbursements, the total return figures would be lower. Past performance is not indicative of future results and current performance may be lower or higher than the performance quoted. Investment return and principal value will fluctuate and shares, when redeemed, may be worth more or less than their original cost. The total returns shown do not reflect the deduction of taxes that a shareholder would pay on fund distributions or the redemption of fund shares. To obtain the most recent month-end performance, please call the Fund’s toll-free number at 1-800-639-3935.
Effective as of the close of business February 15, 2013, Stonebridge Small-Cap Growth Fund (SBAGX) (the “Acquired Fund”) and Stonebridge Institutional Small-Cap Growth Fund (SBSCX) (the “Acquiring Fund”), each a series of Stonebridge Funds Trust were reorganized into a newly created fund, which is named the Stonebridge Small-Cap Growth Fund (SBSGX) (the “Fund”), under the Financial Investors Trust. The Fund’s performance for periods prior to the close of business February 15, 2013 is that of the Acquiring Fund.
Stonebridge Capital Management, Inc. (the “Adviser”) has contractually agreed to limit the amount of the Fund’s Total Annual Fund Operating Expenses, exclusive of brokerage expenses, interest expenses, taxes and extraordinary expenses, to an annual rate of 1.96% of the Fund’s average daily net assets. This agreement is in effect through August 31, 2016. The Adviser will be permitted to recover expenses it has borne through the agreement described above to the extent that the Fund’s expenses in later periods fall below the annual rates set forth in the relevant agreement. The Fund will not be obligated to pay any such deferred fees and expenses more than three years after the end of the fiscal year in which the fees and expenses were deferred. The Adviser may not discontinue the waiver without the approval by the Fund’s Board of Trustees.
As of the Prospectus dated August 31, 2015, the gross annual expense ratio for the Stonebridge Small-Cap Growth Fund was 2.12%. At October 31, 2015, the Fund’s gross annual expense ratio was 2.28% and the Fund’s annual net expense ratio was 2.20%.
CONCLUSION
While we remain the adviser to the Fund, we will continue to manage the Fund in accordance with its stated strategy. We seek to identify strong businesses that we believe exhibit competitive advantages, growing market share, and healthy balance sheets, and that are poised to rapidly grow earnings in excess of market expectations. We are positioning the Fund toward those businesses and economic sectors that we believe contain the best opportunities for future growth and investment returns. Although we are most excited about the outlook for technology, health care and energy companies, we believe that we will continue to find opportunities for the Fund across sectors that can deliver solid performance results for shareholders.
Richard C. Barrett, CFA
Matthew W. Markatos, CFA
Portfolio Managers
| | |
| Annual Report | April 30, 2016 | | 3 |
| | |
| Stonebridge Small-Cap Growth Fund | | Letter to Shareholders |
April 30, 2016 (Unaudited)
Performance quoted above represents past performance. Past Performance does not guarantee future results.
The views of Stonebridge Capital Management, Inc. and information discussed in this commentary are as of the date of publication, are subject to change, and may not reflect the writer’s current views. The views expressed are those of the author only, and represent an assessment of market conditions at a specific point in time, are opinions only and should not be relied upon as investment advice regarding a particular investment or markets in general. Such information does not constitute a recommendation to buy or sell specific securities or investment vehicles. It should not be assumed that any investment will be profitable or will equal the performance of the portfolios or any securities or any sectors mentioned in this letter. The subject matter contained in this letter has been derived from several sources believed to be reliable and accurate at the time of compilation. Neither Stonebridge Capital Management, Inc. nor the Fund accepts any liability for losses either direct or consequential caused by the use of this information.
The Stonebridge Small-Cap Growth Fund is distributed by ALPS Distributors, Inc.
The Fund is subject to investment risks, including possible loss of the principal amount invested and therefore is not suitable for all investors. The Fund may not achieve its objectives.
Diversification does not ensure a profit or guarantee against loss.
DEFINITIONS:
| (1) | The Russell 2000® Growth Index is an unmanaged index that measures the performance of those Russell 2000® Index companies with higher price-to-book ratios and higher forecasted growth values. The Russell 2000® Index measures the performance of the 2,000 smallest companies in the Russell 3000® Index, which measures the performance of the 3,000 largest U.S. companies in terms of market capitalization. The Russell 2000® Growth Index is constructed to provide a comprehensive and unbiased barometer of the small-cap growth market. This is a total return index which reflects the reinvestment of income dividends and capital gain distributions, if any, but does not reflect fees, brokerage commissions, or other expenses of investing. The Index is not actively managed and does not reflect any deductions for fees, expenses or taxes. An investor may not invest directly in the Index. |
| (2) | The S&P 500® Total Return Index is an unmanaged index of 500 common stocks chosen for the market size, liquidity and industry group representation. It is a market-value weighted index. The Index is not actively managed and does not reflect any deduction for fees, expenses or taxes. An investor may not invest directly into the Index. |
| | |
| 4 | | Stonebridge Small-Cap Growth Fund |
| | |
| Stonebridge Small-Cap Growth Fund | | Disclosure of Fund Expenses |
| | April 30, 2016 (Unaudited) |
As a shareholder of the Fund, you incur two types of costs: (1) transaction costs (such as the 2% fee on redemption of Fund shares made within 30 days of purchase); and (2) ongoing costs, including management fees and other fund operating expenses. The following examples are intended to help you understand your ongoing costs (in dollars) of investing in the Fund and to compare these costs with the ongoing costs of investing in other mutual funds. The examples are based on an investment of $1,000 invested on November 1, 2015 and held until April 30, 2016.
Actual Expenses — The first line of the table below provides information about actual account values and actual expenses. You may use the information in this line, together with the amount you invested, to estimate the expenses that you paid over the period. Simply divide your account value by $1,000 (for example, an $8,600 account value divided by $1,000 = 8.6), then multiply the result by the number in the first line under the heading “Expense Paid During Period” to estimate the expenses you paid on your account during this period.
Hypothetical Example For Comparison Purposes — The second line of the table below provides information about hypothetical account values and hypothetical expenses based on the Fund’s actual expense ratio and an assumed rate of return of 5% per year before expenses, which is not the Fund’s actual return. The hypothetical account values and expenses may not be used to estimate the actual ending account balance or expenses you paid for the period. You may use this information to compare the ongoing costs of investing in the Fund and other mutual funds. To do so, compare this 5% hypothetical example with the 5% hypothetical examples that appear in the shareholder reports of the other funds.
Please note the expenses shown in the table are meant to highlight your ongoing costs only and do not reflect transactional costs, such as redemption fees or exchange fees. Therefore, the second line of the table is useful in comparing ongoing costs only, and will not help you determine the relative total costs of owning different funds. In addition, if these transactional costs were included, your costs would have been higher.
Stonebridge Small-Cap Growth Fund
| | | | | | | | |
| | | Beginning Account
Value at 11/01/15 | | Ending Account
Value at 4/30/16 | | Expense Ratio(1) | | Expense Paid
During Period
11/01/15 to
4/30/16(2) |
Actual Fund Return | | $ 1,000.00 | | $ 991.80 | | 1.96% | | $ 9.71 |
Hypothetical Fund Return
(5% return before expenses) | | $ 1,000.00 | | $ 1,015.12 | | 1.96% | | $ 9.82 |
| (1) | The Fund’s expense ratios have been annualized based on the Fund’s most recent fiscal half-year expenses. |
| (2) | Expenses are equal to the Fund’s annualized expense ratio multiplied by the average account value over the period, multiplied by the number of days in the most recent fiscal half-year (182)/366 (to reflect the half-year period). |
| | |
| Annual Report | April 30, 2016 | | 5 |
| | |
| Stonebridge Small-Cap Growth Fund | | Statement of Investments |
| | April 30, 2016 |
| | | | | | | | |
| | | Shares | | | Market Value | |
COMMON STOCKS (98.20%) | | | | | | | | |
CONSUMER DISCRETIONARY - (15.42%) | | | | | | | | |
Hotels, Restaurants & Leisure (6.23%) | | | | | | | | |
Belmond, Ltd. - Class A** | | | 33,000 | | | $ | 302,280 | |
El Pollo Loco Holdings, Inc.** | | | 20,000 | | | | 263,800 | |
Interval Leisure Group, Inc. | | | 18,000 | | | | 254,160 | |
| | | | | | | | |
| | | | | | | 820,240 | |
| | | | | | | | |
Household Durables (3.17%) | | | | | | | | |
TRI Pointe Group, Inc.** | | | 36,000 | | | | 417,600 | |
| | | | | | | | |
| | |
Media (3.23%) | | | | | | | | |
MDC Partners, Inc. - Class A | | | 21,000 | | | | 425,040 | |
| | | | | | | | |
| | |
Specialty Retail (2.79%) | | | | | | | | |
GNC Holdings, Inc. - Class A | | | 10,000 | | | | 243,600 | |
Select Comfort Corp.** | | | 5,000 | | | | 123,400 | |
| | | | | | | | |
| | | | | | | 367,000 | |
| | | | | | | | |
TOTAL CONSUMER DISCRETIONARY | | | | | | | 2,029,880 | |
| | | | | | | | |
| | |
CONSUMER STAPLES - (0.88%) | | | | | | | | |
Food & Staples Retailing (0.88%) | | | | | | | | |
The Chefs’ Warehouse, Inc.** | | | 6,000 | | | | 115,620 | |
| | | | | | | | |
| | |
TOTAL CONSUMER STAPLES | | | | | | | 115,620 | |
| | | | | | | | |
| | |
ENERGY - (6.38%) | | | | | | | | |
Energy Equipment & Services (3.06%) | | | | | | | | |
Superior Energy Services, Inc. | | | 12,500 | | | | 210,750 | |
US Silica Holdings, Inc. | | | 7,500 | | | | 191,625 | |
| | | | | | | | |
| | | | | | | 402,375 | |
| | | | | | | | |
Oil, Gas & Consumable Fuels (3.32%) | | | | | | | | |
Sanchez Energy Corp.** | | | 12,500 | | | | 112,375 | |
Synergy Resources Corp.** | | | 45,000 | | | | 324,900 | |
| | | | | | | | |
| | | | | | | 437,275 | |
| | | | | | | | |
TOTAL ENERGY | | | | | | | 839,650 | |
| | | | | | | | |
| | |
FINANCIALS - (7.76%) | | | | | | | | |
Capital Markets (4.67%) | | | | | | | | |
Fifth Street Asset Management, Inc. | | | 35,000 | | | | 124,950 | |
WisdomTree Investments, Inc. | | | 45,000 | | | | 490,050 | |
| | | | | | | | |
| | | | | | | 615,000 | |
| | | | | | | | |
See Notes to Financial Statements.
| | |
| 6 | | Stonebridge Small-Cap Growth Fund |
| | |
| Stonebridge Small-Cap Growth Fund | | Statement of Investments |
April 30, 2016
| | | | | | | | |
| | | Shares | | | Market Value | |
FINANCIALS (continued) | | | | | | | | |
Thrifts & Mortgage Finance (3.09%) | | | | | | | | |
BofI Holding, Inc.** | | | 20,000 | | | $ | 407,400 | |
| | | | | | | | |
| | |
TOTAL FINANCIALS | | | | | | | 1,022,400 | |
| | | | | | | | |
| | |
HEALTH CARE - (18.62%) | | | | | | | | |
Biotechnology (10.29%) | | | | | | | | |
ACADIA Pharmaceuticals, Inc.** | | | 6,000 | | | | 193,800 | |
Array BioPharma, Inc.** | | | 40,000 | | | | 127,600 | |
Cepheid** | | | 13,000 | | | | 371,020 | |
Exact Sciences Corp.** | | | 19,000 | | | | 133,380 | |
Genomic Health, Inc.** | | | 14,500 | | | | 381,060 | |
PTC Therapeutics, Inc.** | | | 20,000 | | | | 148,400 | |
| | | | | | | | |
| | | | | | | 1,355,260 | |
| | | | | | | | |
Health Care - Technology (2.04%) | | | | | | | | |
Allscripts Healthcare Solutions, Inc.** | | | 20,000 | | | | 268,000 | |
| | | | | | | | |
| | |
Health Care Equipment & Supplies (4.84%) | | | | | | | | |
Merit Medical Systems, Inc.** | | | 13,000 | | | | 263,250 | |
Tandem Diabetes Care, Inc.** | | | 13,000 | | | | 144,690 | |
Trinity Biotech PLC - Sponsored ADR | | | 20,000 | | | | 230,000 | |
| | | | | | | | |
| | | | | | | 637,940 | |
| | | | | | | | |
Life Sciences Tools & Services (1.45%) | | | | | | | | |
Luminex Corp.** | | | 9,500 | | | | 190,950 | |
| | | | | | | | |
| | |
TOTAL HEALTH CARE | | | | | | | 2,452,150 | |
| | | | | | | | |
| | |
INDUSTRIALS - (10.91%) | | | | | | | | |
Aerospace & Defense (1.40%) | | | | | | | | |
Astronics Corp.** | | | 5,000 | | | | 184,750 | |
| | | | | | | | |
| | |
Commercial Services & Supplies (0.98%) | | | | | | | | |
Ritchie Bros. Auctioneers, Inc. | | | 4,500 | | | | 129,105 | |
| | | | | | | | |
| | |
Construction & Engineering (3.82%) | | | | | | | | |
KBR, Inc. | | | 15,000 | | | | 233,400 | |
Tutor Perini Corp.** | | | 17,000 | | | | 268,940 | |
| | | | | | | | |
| | | | | | | 502,340 | |
| | | | | | | | |
See Notes to Financial Statements.
| | |
| Annual Report | April 30, 2016 | | 7 |
| | |
| Stonebridge Small-Cap Growth Fund | | Statement of Investments |
April 30, 2016
| | | | | | | | |
| | | Shares | | | Market Value | |
INDUSTRIALS (continued) | | | | | | | | |
Professional Services (4.71%) | | | | | | | | |
The Advisory Board Co.** | | | 11,500 | | | $ | 363,860 | |
WageWorks, Inc.** | | | 4,750 | | | | 255,835 | |
| | | | | | | | |
| | | | | | | 619,695 | |
| | | | | | | | |
TOTAL INDUSTRIALS | | | | | | | 1,435,890 | |
| | | | | | | | |
| | |
INFORMATION TECHNOLOGY - (35.65%) | | | | | | | | |
Communication Equipment (2.11%) | | | | | | | | |
NetScout Systems, Inc.** | | | 12,500 | | | | 278,250 | |
| | | | | | | | |
| | |
Electronic Equipment, Instruments & Components (3.39%) | | | | | | | | |
DTS, Inc.** | | | 15,000 | | | | 327,300 | |
MicroVision, Inc.** | | | 55,000 | | | | 118,800 | |
| | | | | | | | |
| | | | | | | 446,100 | |
| | | | | | | | |
Internet Software & Services (12.77%) | | | | | | | | |
Apigee Corp.** | | | 41,000 | | | | 397,700 | |
Bazaarvoice, Inc.** | | | 90,000 | | | | 301,500 | |
Cornerstone OnDemand, Inc.** | | | 9,500 | | | | 326,325 | |
Envestnet, Inc.** | | | 7,500 | | | | 235,350 | |
Marin Software, Inc.** | | | 45,000 | | | | 115,200 | |
SPS Commerce, Inc.** | | | 6,000 | | | | 305,580 | |
| | | | | | | | |
| | | | | | | 1,681,655 | |
| | | | | | | | |
Semiconductors & Semiconductor Equipment (4.62%) | | | | | | | | |
Applied Micro Circuits Corp.** | | | 53,000 | | | | 330,720 | |
FormFactor, Inc.** | | | 36,000 | | | | 277,200 | |
| | | | | | | | |
| | | | | | | 607,920 | |
| | | | | | | | |
Software (9.45%) | | | | | | | | |
Callidus Software, Inc.** | | | 28,500 | | | | 521,550 | |
FireEye, Inc.** | | | 9,500 | | | | 164,825 | |
MobileIron, Inc.** | | | 49,000 | | | | 187,670 | |
PROS Holdings, Inc.** | | | 12,500 | | | | 147,000 | |
Zix Corp.** | | | 60,000 | | | | 223,800 | |
| | | | | | | | |
| | | | | | | 1,244,845 | |
| | | | | | | | |
Technology Hardware, Storage & Peripherals (3.31%) | | | | | | | | |
Nimble Storage, Inc.** | | | 59,000 | | | | 435,420 | |
| | | | | | | | |
| | |
TOTAL INFORMATION TECHNOLOGY | | | | | | | 4,694,190 | |
| | | | | | | | |
See Notes to Financial Statements.
| | |
| 8 | | Stonebridge Small-Cap Growth Fund |
| | |
| Stonebridge Small-Cap Growth Fund | | Statement of Investments |
April 30, 2016
| | | | | | | | |
| | | Shares | | | Market Value | |
TELECOMMUNICATION SERVICES - (2.58%) | | | | | | | | |
Diversified Telecommunication Services (2.58%) | | | | | | | | |
8x8, Inc.** | | | 30,000 | | | $ | 340,200 | |
| | | | | | | | |
| | |
TOTAL TELECOMMUNICATION SERVICES | | | | | | | 340,200 | |
| | | | | | | | |
| | |
TOTAL COMMON STOCKS | | | | | | | | |
(Cost $12,536,557) | | | | | | | 12,929,980 | |
| | | | | | | | |
| | |
MONEY MARKET MUTUAL FUNDS (3.20%) | | | | | | | | |
Fidelity® Institutional Money Market Government Portfolio - Class I (0.23% 7 Day Yield) | | | 421,406 | | | | 421,406 | |
| | | | | | | | |
| | |
TOTAL MONEY MARKET MUTUAL FUNDS | | | | | | | | |
(Cost $421,406) | | | | | | | 421,406 | |
| | | | | | | | |
| | |
TOTAL INVESTMENTS (101.40%) | | | | | | | | |
(Cost $12,957,963) | | | | | | $ | 13,351,386 | |
LIABILITIES IN EXCESS OF OTHER ASSETS (-1.40%) | | | | | | | (183,776) | |
| | | | | | | | |
NET ASSETS (100.00%) | | | | | | $ | 13,167,610 | |
| | | | | | | | |
| ** | Non-Income Producing Security. |
For Fund compliance purposes, the Fund’s industry classifications refer to any one or more of the industry sub-classifications used by one or more widely recognized market indexes or ratings group indexes, and/or as defined by Fund management. This definition may not apply for purposes of this report, which may combine industry sub-classifications for reporting ease. Industries are shown as a percentage of net assets.
See Notes to Financial Statements.
| | |
| Annual Report | April 30, 2016 | | 9 |
| | |
| Stonebridge Small-Cap Growth Fund | | Statement of Assets and Liabilities |
April 30, 2016
| | | | |
ASSETS: | | | | |
Investments, at value | | $ | 13,351,386 | |
Receivable for investments sold | | | 704,883 | |
Dividends receivable | | | 57 | |
Due from advisor | | | 8,603 | |
Prepaid and other assets | | | 10,719 | |
| | | | |
Total assets | | | 14,075,648 | |
| | | | |
| |
LIABILITIES: | | | | |
Payable for investments purchased | | | 858,392 | |
Payable for fund shares redeemed | | | 9,575 | |
Administration and fund accounting fees payable | | | 7,817 | |
Payable for transfer agent fees | | | 9,211 | |
Payable for professional fees | | | 16,046 | |
Payable for trustee fees and expenses | | | 81 | |
Payable for chief compliance officer fees | | | 1,761 | |
Accrued expenses and other liabilities | | | 5,155 | |
| | | | |
Total liabilities | | | 908,038 | |
| | | | |
Net Assets | | $ | 13,167,610 | |
| | | | |
| |
COMPOSITION OF NET ASSETS: | | | | |
Paid-in capital (Note 5) | | $ | 15,391,324 | |
Accumulated net investment loss | | | (63,916) | |
Accumulated net realized loss on investments | | | (2,553,221) | |
Net unrealized appreciation in value of investments | | | 393,423 | |
| | | | |
Net Assets | | $ | 13,167,610 | |
| | | | |
| |
NET ASSET VALUE PER SHARE: | | | | |
Net Assets | | $ | 13,167,610 | |
Shares outstanding | | | 1,809,809 | |
Net asset value, offering and redemption price per share* | | $ | 7.28 | |
| | | | |
| |
Investments, at cost | | $ | 12,957,963 | |
| | | | |
| * | A charge of 2% is imposed on the redemption proceeds of shares held 30 days or less (Note 5). |
See Notes to Financial Statements.
| | |
| 10 | | Stonebridge Small-Cap Growth Fund |
| | |
| Stonebridge Small-Cap Growth Fund | | Statement of Operations |
For the Year Ended April 30, 2016
| | | | |
INCOME: | | | | |
Dividends | | $ | 111,306 | |
Foreign taxes withheld on dividends | | | (4,046) | |
| | | | |
Total Income | | | 107,260 | |
| | | | |
| |
EXPENSES: | | | | |
Investment advisory fees (Note 6) | | | 107,115 | |
Administration fees | | | 79,422 | |
Transfer agent fees | | | 74,458 | |
Fund accounting fees and expenses | | | 3,746 | |
Custodian fees | | | 5,000 | |
Professional fees | | | 26,887 | |
Printing fees | | | 10,751 | |
Registration fees | | | 17,077 | |
Trustee fees and expenses | | | 338 | |
Chief compliance officer fees | | | 21,136 | |
Insurance | | | 174 | |
Other | | | 10,748 | |
| | | | |
Total Expenses | | | 356,852 | |
| | | | |
Less fees waived/reimbursed by investment advisor (Note 6) | | | (58,045) | |
Net Expenses | | | 298,807 | |
| | | | |
Net Investment Loss | | | (191,547) | |
| | | | |
| |
REALIZED AND UNREALIZED GAIN/(LOSS) ON INVESTMENTS: | | | | |
Net realized loss on investments | | | (1,940,524) | |
Change in net unrealized appreciation of investments | | | 66,315 | |
| | | | |
Net Realized and Unrealized Loss on Investments | | | (1,874,209) | |
| | | | |
Net Decrease in Net Assets Resulting From Operations | | $ | (2,065,756) | |
| | | | |
See Notes to Financial Statements.
| | |
| Annual Report | April 30, 2016 | | 11 |
| | |
| Stonebridge Small-Cap Growth Fund | | Statements of Changes in Net Assets |
| | | | | | | | |
| | | For the Year Ended April 30, 2016 | | | For the Year Ended April 30, 2015 | |
| |
OPERATIONS: | | | | | | | | |
Net investment loss | | $ | (191,547) | | | $ | (298,479) | |
Net realized loss on investments | | | (1,940,524) | | | | (505,161) | |
Change in net unrealized appreciation of investments | | | 66,315 | | | | 110,963 | |
| | | | |
Decrease in Net Assets Resulting from Operations | | | (2,065,756) | | | | (692,677) | |
| | | | |
| | |
DISTRIBUTIONS (Note 3): | | | | | | | | |
From net realized gains | | | – | | | | (1,202,412) | |
| | | | |
Total distributions | | | – | | | | (1,202,412) | |
| | | | |
| | |
CAPITAL SHARE TRANSACTIONS (NOTE 5): | | | | | | | | |
Net decrease in shareholder activity derived from beneficial interest transactions, net of redemption fees | | | (1,144,431) | | | | (431,599) | |
| | | | |
| | |
NET DECREASE IN NET ASSETS | | | (3,210,187) | | | | (2,326,688) | |
| | |
NET ASSETS: | | | | | | | | |
Beginning of period | | | 16,377,797 | | | | 18,704,485 | |
| | | | |
End of period* | | $ | 13,167,610 | | | $ | 16,377,797 | |
| | | | |
| | |
* Includes accumulated net investment loss of: | | $ | (63,916) | | | $ | (88,332) | |
See Notes to Financial Statements.
| | |
| 12 | | Stonebridge Small-Cap Growth Fund |
Page Intentionally Left Blank
Stonebridge Small-Cap Growth Fund
For a share outstanding through the periods presented
|
|
PER SHARE DATA |
Net asset value, beginning of period |
|
INCOME/(LOSS) FROM INVESTMENT OPERATIONS: |
Net investment loss |
Net realized and unrealized gain/(loss) on investments |
Total Income/(Loss) from Investment Operations |
|
DISTRIBUTIONS TO SHAREHOLDERS: |
From net realized gain on investments |
Total Distributions to Shareholders |
Net Increase/(Decrease) in Net Asset Value |
Net asset value, end of period |
Total Return |
|
Ratios & Supplemental Data: |
Net assets, end of period (in 000s) |
Ratios to average net assets: |
Expenses (excluding fee waivers) |
Expenses (including fee waivers) |
Net investment loss (including fee waivers) |
Portfolio Turnover Rate |
| (1) | The Fund’s fiscal year end changed from October 31st to April 30th. See Note 1. |
| (2) | Calculated using the average shares method. |
| (3) | Total return not annualized for periods less than one full year. |
| (4) | Effective October 1, 2015, the Adviser contractually agreed to limit expenses to 1.96%. (See Note 6) |
| (6) | Portfolio turnover rate for periods less than one full year have not been annualized. |
See Notes to Financial Statements.
| | |
| 14 | | Stonebridge Small-Cap Growth Fund |
Financial Highlights
| | | | | | | | | | | | | | | | | | | | | | |
Year Ended
April 30, 2016 | | | Year Ended
April 30, 2015 | | | Year Ended
April 30, 2014 | | | Six Months
Ended April 30,
2013(1) | | | Year Ended
October 31,
2012 | | | Year Ended October 31, 2011 | |
| | |
| | | | | | | | | | | | | | | | | | | | | | |
| | $8.36 | | | | $9.42 | | | | $8.74 | | | | $8.42 | | | | $7.90 | | | | $7.91 | |
| | |
| | | | | | | | | | | | | | | | | | | | | | |
| | | | | | | | | | | | | | | | | | | | | | | |
| | (0.10)(2) | | | | (0.15)(2) | | | | (0.20)(2) | | | | (0.15)(2) | | | | (0.30) | | | | (0.26) | |
| | (0.98) | | | | (0.27) | | | | 1.26 | | | | 0.47 | | | | 0.82 | | | | 0.25 | |
| | |
| | (1.08) | | | | (0.42) | | | | 1.06 | | | | 0.32 | | | | 0.52 | | | | (0.01) | |
| | |
| | | | | | | | | | | | | | | | | | | | | | |
| | | | | | | | | | | | | | | | | | | | | | | |
| | – | | | | (0.64) | | | | (0.38) | | | | – | | | | – | | | | – | |
| | |
| | – | | | | (0.64) | | | | (0.38) | | | | – | | | | – | | | | – | |
| | |
| | (1.08) | | | | (1.06) | | | | 0.68 | | | | 0.32 | | | | 0.52 | | | | (0.01) | |
| | |
| | $7.28 | | | | $8.36 | | | | $9.42 | | | | $8.74 | | | | $8.42 | | | | $7.90 | |
| | |
| | (12.92)% | | | | (3.83)% | | | | 12.20% | | | | 3.80%(3) | | | | 6.58% | | | | (0.13)% | |
| | |
| | | | | | | | | | | | | | | | | | | | | | |
| | | | | | | | | | | | | | | | | | | | | | | |
| | $13,168 | | | | $16,378 | | | | $18,704 | | | | $17,842 | | | | $12,673�� | | | | $12,457 | |
| | |
| | | | | | | | | | | | | | | | | | | | | | |
| | 2.50% | | | | 2.12% | | | | 2.25% | | | | 3.86%(5) | | | | 3.89% | | | | 3.36% | |
| | |
| | 2.09%(4) | | | | N/A | | | | N/A | | | | N/A | | | | N/A | | | | N/A | |
| | |
| | (1.34)%(4) | | | | (1.73)% | | | | (2.09)% | | | | (3.52)%(5) | | | | (3.58)% | | | | (2.96)% | |
| | |
| | 157% | | | | 138% | | | | 152% | | | | 89%(6) | | | | 222% | | | | 195% | |
| | |
| | |
| Annual Report | April 30, 2015 | | 15 |
| | |
| Stonebridge Small-Cap Growth Fund | | Notes to Financial Statements |
| | April 30, 2016 |
1. ORGANIZATION
Financial Investors Trust (the “Trust”), a Delaware statutory trust, is an open-end management investment company registered under the Investment Company Act of 1940, as amended (“1940 Act”). As of April 30, 2016, the Trust had 34 registered funds. The Fund seeks long-term growth of capital.
The Fund is a successor to a previously operational fund which was a series of the Stonebridge Funds Trust, a Delaware statutory trust, and was organized into a series of the Trust effective as of the close of business on February 15, 2013. As a result, the Fund’s fiscal year end changed from October 31 to April 30.
2. SIGNIFICANT ACCOUNTING POLICIES
The accompanying financial statements were prepared in accordance with accounting principles generally accepted in the United States of America (“U.S. GAAP”). The preparation of financial statements in conformity with U.S. GAAP requires management to make certain estimates and assumptions that affect the reported amounts of assets and liabilities and disclosures of contingent assets and liabilities at the date of the financial statements and the reported amounts of revenue and expenses during the period. Actual results could differ from those estimates. The Fund is considered an investment company for financial reporting purposes under U.S. GAAP. The following is a summary of significant accounting policies consistently followed by the Fund in preparation of its financial statements.
Investment Valuation: The Fund generally values its securities based on market prices determined at the close of regular trading on the New York Stock Exchange (“NYSE”), normally 4:00 p.m. Eastern Time, on each day the NYSE is open for trading.
For equity securities and mutual funds that are traded on an exchange, the market price is usually the closing sale or official closing price on that exchange. In the case of equity securities not traded on an exchange, or if such closing prices are not otherwise available, the securities are valued at the mean of the most recent bid and ask prices on such day. Redeemable securities issued by open-end registered investment companies are valued at the investment company’s applicable net asset value, with the exception of exchange-traded open-end investment companies, which are priced as equity securities.
The market price for debt obligations is generally the price supplied by an independent third-party pricing service approved by the Board of Trustees (the “Board”), which may use a matrix, formula or other objective method that takes into consideration quotations from dealers, market transactions in comparable investments, market indices and yield curves. If vendors are unable to supply a price, or if the price supplied is deemed to be unreliable, the market price may be determined using quotations received from one or more broker-dealers that make a market in the security. Investments in non-exchange traded funds are fair valued at their respective net asset values.
When such prices or quotations are not available, or when Stonebridge Capital Management, Inc. (the “Adviser”) believes that they are unreliable, securities may be priced using fair value procedures approved by the Board.
| | |
| 16 | | Stonebridge Small-Cap Growth Fund |
| | |
| Stonebridge Small-Cap Growth Fund | | Notes to Financial Statements |
April 30, 2016
Fair Value Measurements: The Fund discloses the classification of its fair value measurements following a three-tier hierarchy based on the inputs used to measure fair value. Inputs refer broadly to the assumptions that market participants would use in pricing the asset or liability, including assumptions about risk. Inputs may be observable or unobservable. Observable inputs reflect the assumptions market participants would use in pricing the asset or liability that are developed based on market data obtained from sources independent of the reporting entity.
Unobservable inputs reflect the reporting entity’s own assumptions about the assumptions market participants would use in pricing the asset or liability that are developed based on the best information available.
Various inputs are used in determining the value of the Fund’s investments as of the end of the reporting period. When inputs used fall into different levels of the fair value hierarchy, the level in the hierarchy within which the fair value measurement falls is determined based on the lowest level input that is significant to the fair value measurement in its entirety. The designated input levels are not necessarily an indication of the risk or liquidity associated with these investments. These inputs are categorized in the following hierarchy under applicable financial accounting standards:
| | |
Level 1 – | | Unadjusted quoted prices in active markets for identical investments, unrestricted assets or liabilities that the Fund has the ability to access at the measurement date; |
| |
Level 2 – | | Quoted prices which are not active, quoted prices for similar assets or liabilities in active markets or inputs other than quoted prices that are observable (either directly or indirectly) for substantially the full term of the asset or liability; and |
| |
Level 3 – | | Significant unobservable prices or inputs (including the Fund’s own assumptions in determining the fair value of investments) where there is little or no market activity for the asset or liability at the measurement date. |
The following is a summary of each input used to value the Fund as of April 30, 2016:
| | | | | | | | | | | | | | | | |
| | | Valuation Inputs | | | | |
| | | | | | | | |
| Investments in Securities at Value | | Level 1 | | | Level 2 | | | Level 3 | | | Total | |
| |
Common Stocks* | | $ | 12,929,980 | | | $ | – | | | $ | – | | | $ | 12,929,980 | |
Money Market Mutual Funds | | | 421,406 | | | | – | | | | – | | | | 421,406 | |
| |
Total | | $ | 13,351,386 | | | $ | – | | | $ | – | | | $ | 13,351,386 | |
| |
* For detailed descriptions, see the accompanying Statement of Investments.
The Fund recognizes transfers between levels as of the end of the period. For the year ended April 30, 2016, the Fund did not have any transfers between Level 1 and Level 2 securities. For the year ended April 30, 2016, the Fund did not have any securities that used significant unobservable inputs (Level 3) in determining fair value.
Investment Transactions and Investment Income: Investment transactions are accounted for on the date the investments are purchased or sold (trade date). Realized gains and losses from investment transactions are reported on an identified cost basis. Interest income, which includes accretion of discounts, is accrued and recorded as earned. Dividend income is recognized on the ex-dividend date or for certain foreign securities, as soon as information is available to the Fund.
| | |
| Annual Report | April 30, 2016 | | 17 |
| | |
| Stonebridge Small-Cap Growth Fund | | Notes to Financial Statements |
April 30, 2016
Trust Expenses: Some expenses of the Trust can be directly attributed to the Fund. Expenses which cannot be directly attributed to the Fund are apportioned among all funds in the Trust based on average net assets of each fund.
Fund Expenses: Expenses that are specific to the Fund are charged directly to the Fund.
Federal Income Taxes: The Fund complies with the requirements under Subchapter M of the Internal Revenue Code of 1986, as amended (the “Code”), applicable to regulated investment companies and intends to distribute substantially all of their net taxable income and net capital gains, if any, each year so that it will not be subject to excise tax on undistributed income and gains. The Fund is not subject to income taxes to the extent such distributions are made.
As of and during the year ended April 30, 2016, the Fund did not have a liability for any unrecognized tax benefits. The Fund files U.S. federal, state, and local tax returns as required. The Fund’s tax returns are subject to examination by the relevant tax authorities until expiration of the applicable statute of limitations, which is generally three years after the filing of the tax return for federal purposes and four years for most state returns. Tax returns for open years have incorporated no uncertain tax positions that require a provision for income taxes.
Distributions to Shareholders: The Fund normally pays dividends and distributes capital gains, if any, on an annual basis. Income dividend distributions are derived from dividends and other income the Fund receives from its investments, including short term capital gains. Long term capital gain distributions are derived from gains realized when the Fund sells a security it has owned for more than a year. The Fund may make additional distributions and dividends at other times if the portfolio manager believes doing so may be necessary for the Fund to avoid or reduce taxes.
3. TAX BASIS INFORMATION
Reclassifications: As of April 30, 2016, permanent differences on book and tax accounting were reclassified. These differences had no effect on net assets and were primarily attributed to the differing treatment of a net investment loss. These reclassifications were as follows:
| | | | |
Undistributed Net Investment Loss | | $ | 215,963 | |
Paid-in Capital | | | (215,963) | |
Included in those amounts reclassified was a net operating loss offset to Paid-in capital in the amount of $215,963.
Tax Basis of Investments: As of April 30, 2016, the aggregate cost of investments, gross unrealized appreciation/(depreciation) and net unrealized appreciation for Federal tax purposes was as follows:
| | | | |
Gross appreciation (excess of value over tax cost) | | $ | 1,463,371 | |
Gross depreciation (excess of tax cost over value) | | | (1,083,922) | |
| |
Net unrealized appreciation | | $ | 379,449 | |
| |
Cost of investments for income tax purposes | | $ | 12,971,937 | |
| |
| | |
| 18 | | Stonebridge Small-Cap Growth Fund |
| | |
| Stonebridge Small-Cap Growth Fund | | Notes to Financial Statements |
April 30, 2016
Components of Earnings: As of April 30, 2016, components of distributable earnings were as follows:
| | | | |
Accumulated capital losses | | $ | (2,539,247) | |
Net unrealized appreciation on investments | | | 379,449 | |
Other cumulative effect of timing differences | | | (63,916) | |
| |
Total | | $ | (2,223,714) | |
| |
Ordinary Losses: As of April 30, 2016, the Fund elects to defer to the period ending April 30, 2017, late year ordinary losses in the amount of $63,916.
Capital Losses: Capital loss carryovers used during the period ended April 30, 2016 were 39,199.
Capital losses deferred to the next tax year were as follows – Short-Term in the amount of $555,912.
As of April 30, 2016, the Fund elects to defer to the period ending April 30, 2017, capital losses recognized during the period November 1, 2015 to April 30, 2016 in the amount of $1,983,335.
Tax Basis of Distributions to Shareholders: The character of distributions made during the year from net investment income or net realized gains may differ from its ultimate characterization for federal income tax purposes. Also, due to the timing of dividend distributions, the fiscal year in which amounts are distributed may differ from the fiscal year in which the income or realized gain was recorded by the Fund.
There were no distributions paid during the year ended April 30, 2016.
The tax character of distributions paid during the year ended April 30, 2015, were as follows:
| | | | | | | | |
| | | Ordinary Income | | | Long-Term Capital
Gain | |
| |
Stonebridge Small-Cap Growth Fund | | $ | 962,886 | | | $ | 239,526 | |
4. SECURITIES TRANSACTIONS
The cost of purchases and proceeds from sales of securities (excluding short-term securities) during the year ended April 30, 2016, was as follows:
| | | | | | | | |
| | | Purchases | | | Sales | |
| |
Stonebridge Small-Cap Growth Fund | | $ | 22,094,193 | | | $ | 23,420,456 | |
5. SHARES OF BENEFICIAL INTEREST
The capitalization of the Trust consists of an unlimited number of shares of beneficial interest with no par value per share. Holders of the shares of the Fund of the Trust have one vote for each share held and a proportionate fraction of a vote for each fractional share. All shares issued and outstanding are fully paid and are transferable and redeemable at the option of the shareholder.
| | |
| Annual Report | April 30, 2016 | | 19 |
| | |
| Stonebridge Small-Cap Growth Fund | | Notes to Financial Statements |
April 30, 2016
Purchasers of the shares do not have any obligation to make payments to the Trust or its creditors (other than the purchase price for the shares) or make contributions to the Trust or its creditors solely by reason of the purchasers’ ownership of the shares. Shares have no pre-emptive rights.
| | | | | | | | | | | | | | | | |
| | | Year Ended
April 30, 2016
Shares | | | Year Ended
April 30, 2016
Amount | | | Year Ended
April 30, 2015
Shares | | | Year Ended
April 30, 2015
Amount | |
| |
Shares sold | | | 55,610 | | | $ | 404,839 | | | | 22,272 | | | $ | 193,865 | |
Shares issued in reinvestment of dividends | | | – | | | | – | | | | 154,444 | | | | 1,179,954 | |
| |
Total | | | 55,610 | | | | 404,839 | | | | 176,716 | | | | 1,373,819 | |
| |
Less shares redeemed, net of redemption fees | | | (203,700) | | | | (1,549,270 | ) | | | (204,934) | | | | (1,805,418) | |
| |
Net Decrease | | | (148,090) | | | $ | (1,144,431 | ) | | | (28,218) | | | $ | (431,599) | |
| |
Shares redeemed within 30 days of purchase will incur a 2% short-term redemption fee deducted from the redemption amount. Redemption fees are reflected in the “Net increase/(decrease) in shareholder activity derived from beneficial interest transactions, net of redemption fees” in the Statements of Changes in Net Assets.
For the years ended April 30, 2016 and April 30, 2015, the Fund did not receive any redemption fees.
6. MANAGEMENT AND RELATED-PARTY TRANSACTIONS
The Trust has entered into an advisory agreement with the Adviser with respect to the Fund. The advisory agreement has been approved by the Board and shareholders. Pursuant to the advisory agreement with the Trust, the Adviser is entitled to investment advisory fees, computed daily and payable monthly at an annual rate of 0.75% of the average daily net assets of the Fund. The management fee is paid on a monthly basis.
The Adviser has contractually agreed to limit the amount of the Fund’s Total Annual Fund Operating Expenses, exclusive of acquired fund fees and expenses, brokerage expenses, interest expenses, taxes and extraordinary expenses, to an annual rate of 1.96% of the Fund’s average daily net assets. This agreement is in effect from October 1, 2015 through August 31, 2016. The Adviser will be permitted to recover expenses it has borne through the agreement described above to the extent that the Fund’s expenses in later periods fall below the annual rates set forth in the relevant agreement. The Fund will not be obligated to pay any such deferred fees and expenses more than three years after the end of the fiscal year in which the fees and expenses were deferred. The Adviser may not discontinue the waiver without the approval by the Fund’s Board.
| | |
| 20 | | Stonebridge Small-Cap Growth Fund |
| | |
| Stonebridge Small-Cap Growth Fund | | Notes to Financial Statements |
April 30, 2016
For the year ended April 30, 2016, the fee waivers and/or reimbursements were as follows:
| | | | |
| | | Fees Waived/
Reimbursed By Adviser | |
| |
Stonebridge Small-Cap Growth Fund | | $ | 58,045 | |
As of April 30, 2016, the balances of recoupable expenses for the Fund were as follows:
| | | | | | | | |
| Fund | | Expires 2019 | | | Total | |
| |
Stonebridge Small-Cap Growth Fund | | $ | 58,045 | | | $ | 58,045 | |
Fund Administrator Fees and Expenses
ALPS Fund Services, Inc. (“ALPS”) serves as administrator to the Fund and the Fund has agreed to pay expenses incurred in connection with their administrative activities. Pursuant to an Administration Agreement, ALPS provides operational services to the Fund including, but not limited to fund accounting and fund administration and generally assists in the Fund’s operations. Officers of the Trust are employees of ALPS. The Fund’s administration fee is accrued on a daily basis and paid monthly. Administration fees paid by the Fund for the year ended April 30, 2016 are disclosed in the Statement of Operations.
ALPS is reimbursed by the Fund for certain out-of-pocket expenses.
Transfer Agent
ALPS serves as transfer, dividend paying and shareholder servicing agent for the Fund. ALPS receives an annual minimum fee, a fee based upon the number of shareholder accounts, and is also reimbursed by the Fund for certain out-of-pocket expenses. Transfer agent fees paid by the Fund for the year ended April 30, 2016 are disclosed in the Statement of Operations.
Compliance Services
ALPS provides services that assist the Trust’s chief compliance officer in monitoring and testing the policies and procedures of the Trust in conjunction with requirements under Rule 38a-1 under the 1940 Act and receives an annual base fee. ALPS is reimbursed for certain out-of-pocket expenses by the Fund. Compliance service fees paid by the Fund for the year ended April 30, 2016 are disclosed in the Statement of Operations.
Principal Financial Officer
ALPS provides principal financial officer services to the Fund. The Fund is not charged a fee for principal financial officer services.
Distributor
ALPS Distributors, Inc. (“ADI” or the “Distributor”) (an affiliate of ALPS) acts as the distributor of the Fund’s shares pursuant to a Distribution Agreement with the Trust. Shares are sold on a continuous basis by ADI as agent for the Fund, and ADI has agreed to use its best efforts to solicit orders for the sale of the Fund’s shares, although it is not obliged to sell any particular amount of shares. ADI is not entitled to any compensation for its services as Distributor. ADI is registered as a broker-dealer with the U.S. Securities and Exchange Commission.
| | |
| Annual Report | April 30, 2016 | | 21 |
| | |
| Stonebridge Small-Cap Growth Fund | | Notes to Financial Statements |
April 30, 2016
7. INDEMNIFICATIONS
Under the Trust’s organizational documents, its officers and Trustees are indemnified against certain liability arising out of the performance of their duties to the Trust. Additionally, in the normal course of business, the Trust enters into contracts with service providers that may contain general indemnification clauses, which may permit indemnification to the extent permissible under applicable law. The Trust’s maximum exposure under these arrangements is unknown, as this would involve future claims that may be made against the Trust that have not yet occurred.
8. SUBSEQUENT EVENT
On April 27, 2016, Stonebridge Capital Management notified the Board of its intent to resign as Investment Adviser to the Fund. This resignation will be effective June 27, 2016. The Board concluded that it would be in the best interests of the Fund and its shareholders that the Fund be closed and liquidated as a series of the Trust effective as of the close of business on June 27, 2016. On June 8, 2016, the Board approved a Plan of Termination, Dissolution and Liquidation (the “Plan”) that determines the manner in which the Fund will be liquidated on June 27, 2016. Pursuant to the Plan and in anticipation of the Fund’s liquidation, the Fund will be closed to new purchases effective as of the close of business on June 8, 2016. However, any distributions declared to shareholders of the Fund after June 8, 2016, and until the close of trading on the New York Stock Exchange on June 27, 2016 will be automatically reinvested in additional shares of the Fund unless a shareholder specifically requests that such distributions be paid in cash.
| | |
| 22 | | Stonebridge Small-Cap Growth Fund |
Report of Independent Registered Public Accounting Firm
To the Shareholders and Board of Trustees of Financial Investors Trust:
We have audited the accompanying statement of assets and liabilities, including the statement of investments, of Stonebridge Small-Cap Growth Fund (the “Fund”), one of the portfolios constituting Financial Investors Trust, as of April 30, 2016, and the related statement of operations for the year then ended, the statements of changes in net assets for each of the two years in the period then ended, and the financial highlights for each of the three years in the period then ended and for the period from November 1, 2012 to April 30, 2013. These financial statements and financial highlights are the responsibility of the Fund’s management. Our responsibility is to express an opinion on these financial statements and financial highlights based on our audits. The financial highlights for each of the two years in the period ended October 31, 2012 were audited by other auditors whose report, dated December 11, 2012, expressed an unqualified opinion on such financial highlights.
We conducted our audits in accordance with the standards of the Public Company Accounting Oversight Board (United States). Those standards require that we plan and perform the audit to obtain reasonable assurance about whether the financial statements and financial highlights are free of material misstatement. The Fund is not required to have, nor were we engaged to perform, an audit of its internal control over financial reporting. Our audits included consideration of internal control over financial reporting as a basis for designing audit procedures that are appropriate in the circumstances, but not for the purpose of expressing an opinion on the effectiveness of the Fund’s internal control over financial reporting. Accordingly, we express no such opinion. An audit also includes examining, on a test basis, evidence supporting the amounts and disclosures in the financial statements, assessing the accounting principles used and significant estimates made by management, as well as evaluating the overall financial statement presentation. Our procedures included confirmation of securities owned as of April 30, 2016, by correspondence with the custodian and brokers; when replies were not received from brokers, we performed other auditing procedures. We believe that our audits provide a reasonable basis for our opinion.
In our opinion, the financial statements and financial highlights referred to above present fairly, in all material respects, the financial position of Stonebridge Small-Cap Growth Fund of Financial Investors Trust as of April 30, 2016, the results of its operations for the year then ended, the changes in its net assets for each of the two years in the period then ended, and the financial highlights for each of the three years in the period then ended and for the period from November 1, 2012 to April 30, 2013, in conformity with accounting principles generally accepted in the United States of America.
As discussed in Note 8, on April 27, 2016, Stonebridge Capital Management notified the Board of its intent to resign as Investment Adviser to the Fund effective June 27, 2016. On June 8, 2016, the Board approved a Plan of Termination, Dissolution and Liquidation (the “Plan”) that determines the manner in which the Fund will be liquidated on June 27, 2016.
DELOITTE & TOUCHE LLP
Denver, Colorado
June 28, 2016
| | |
| Annual Report | April 30, 2016 | | 23 |
| | |
| Stonebridge Small-Cap Growth Fund | | Additional Information |
April 30, 2016 (Unaudited)
1. FUND HOLDINGS
The Fund files its complete schedule of portfolio holdings with the Securities and Exchange Commission (the “SEC”) for the first and third quarters of each fiscal year on Form N-Q within 60 days after the end of the period. Copies of the Fund’s Form N-Q are available without charge on the SEC website at http://www.sec.gov. You may also review and copy the Form N-Q at the SEC’s Public Reference Room in Washington, DC. For more information about the operation of the Public Reference Room, please call the SEC at 1-800-SEC-0330.
2. FUND PROXY VOTING POLICIES, PROCEDURES AND SUMMARIES
The Fund’s policies and procedures used in determining how to vote proxies and information regarding how the Fund voted proxies relating to portfolio securities during the most recent prior 12-month period ending June 30 are available without charge, (1) upon request, by calling (toll-free) 800-639-3935 and (2) on the SEC’s website at http://www.sec.gov.
3. TAX DESIGNATIONS
The Fund designates the following for federal income tax purposes for the calendar year ended December 31, 2015:
| | | | |
| | | Qualified Dividend Income | | Dividend Received Deduction |
|
Stonebridge Small-Cap Growth Fund | | 0.00% | | 0.00% |
|
Pursuant to Section 852(b)(3) of the Internal Revenue Code, the Stonebridge Small-Cap Growth Fund designated $0 as long-term capital gain dividends.
| | |
| 24 | | Stonebridge Small-Cap Growth Fund |
| | |
| Stonebridge Small-Cap Growth Fund | | Trustees and Officers |
| | April 30, 2016 (Unaudited) |
|
Additional information regarding the Fund’s trustees is included in the Statement of Additional Information, which can be obtained without charge by calling 888-288-1121. |
|
INDEPENDENT TRUSTEES |
| | | | | | | | | | |
Name, Address* & Year of Birth | | Position(s) Held with Fund | | Term of Office and Length of Time Served | | Principal Occupation(s) During Past 5 Years** | | Number of Funds in Fund Complex Overseen by Trustee*** | | Other Directorships Held by Trustee During Past 5 Years** |
Mary K. Anstine, 1940 | | Trustee | | Ms. Anstine was elected at a special meeting of shareholders held on March 21, 1997 and re-elected at a special meeting of shareholders held on August 7, 2009. | | Ms. Anstine was formerly an Executive Vice President of First Interstate Bank of Denver until 1994, President/Chief Executive Officer of HealthONE Alliance, Denver, Colorado, from 1994 to 2004, and has been retired since 2004. Ms. Anstine is also Trustee/Director of AV Hunter Trust and Colorado Uplift Board. Ms. Anstine was formerly a Director of the Trust Bank of Colorado (later purchased and now known as Northern Trust Bank), HealthONE and Denver Area Council of the Boy Scouts of America, and a member of the American Bankers Association Trust Executive Committee. | | 36 | | Ms. Anstine is a Trustee of ALPS ETF Trust (20 funds); ALPS Variable Investment Trust (9 funds); Reaves Utility Income Fund (1 fund); and Westcore Trust (12 funds). |
John R. Moran, Jr., 1930 | | Trustee | | Mr. Moran was elected at a special meeting of shareholders held on March 21, 1997 and re-elected at a special meeting of shareholders held on August 7, 2009. | | Mr. Moran formerly served as President and CEO of The Colorado Trust, a private foundation serving the health and hospital community in the state of Colorado, from 1991 to 2007. During his career as an attorney from 1958 to 1991, Mr. Moran was formerly a partner with the firm of Kutak Rock & Campbell in Denver, Colorado and a member of the Colorado House of Representatives. Currently, Mr. Moran is a member of the Treasurer’s Investment Advisory Committee for the University of Colorado. | | 36 | | None. |
| | |
| Annual Report | April 30, 2016 | | 25 |
| | |
| Stonebridge Small-Cap Growth Fund | | Trustees and Officers |
INDEPENDENT TRUSTEES (continued) | | April 30, 2016 (Unaudited) |
| | | | | | | | | | |
Name, Address* & Year of Birth | | Position(s) Held with Fund | | Term of Office and Length of Time Served | | Principal Occupation(s) During Past 5 Years** | | Number of Funds in Fund Complex Overseen by Trustee*** | | Other Directorships Held by Trustee During Past 5 Years** |
Jeremy W. Deems, 1976 | | Trustee | | Mr. Deems was appointed as a Trustee at the March 11, 2008 meeting of the Board of Trustees and elected at a special meeting of shareholders held on August 7, 2009. | | Mr. Deems is the Co-Founder, Chief Operations Officer and Chief Financial Officer of Green Alpha Advisors, LLC, a registered investment advisor, and Co-Portfolio Manager of the Shelton Green Alpha Fund. Prior to joining Green Alpha Advisors, Mr. Deems was CFO and Treasurer of Forward Management, LLC, ReFlow Management Co., LLC, ReFlow Fund, LLC, a private investment fund, and Sutton Place Management, LLC, an administrative services company, from 1998 to June 2007. From 2004 to 2005, Mr. Deems also served as Treasurer of the Forward Funds and the Sierra Club Funds. | | 34 | | Mr. Deems is a Trustee of ALPS ETF Trust (20 funds); ALPS Variable Investment Trust (9 funds), Reaves Utility Income Fund (1 fund) and Clough Funds Trust (1 fund). |
Jerry G. Rutledge 1944 | | Trustee | | Mr. Rutledge was elected at a special meeting of shareholders held on August 7, 2009. | | Mr. Rutledge is the President and owner of Rutledge’s Inc., a retail clothing business. Mr. Rutledge is currently Director of the American National Bank. He was from 1994 to 2007 a Regent of the University of Colorado. | | 34 | | Mr. Rutledge is a Trustee of Principal Real Estate Fund (1 fund), Clough Global Allocation Fund (1 fund), Clough Global Equity Fund (1 fund) and Clough Global Opportunities Fund (1 fund). |
*All communications to Trustees and Officers may be directed to Financial Investors Trust c/o 1290 Broadway, Suite 1100, Denver, CO 80203.
**This is the period for which the Trustee or Officer began serving the Trust. Each Trustee serves an indefinite term, until his successor is elected. Officers are elected on an annual basis.
*** The Fund Complex includes all series of the Trust (currently 36) and any other investment companies for which any Trustee serves as trustee for and which Stonebridge Capital Management, Inc. provides investment advisory services (currently none).
| | |
| 26 | | Stonebridge Small-Cap Growth Fund |
| | |
| Stonebridge Small-Cap Growth Fund | | Trustees and Officers |
INDEPENDENT TRUSTEES (continued) | | April 30, 2016 (Unaudited) |
| | | | | | | | | | |
Name, Address* & Year of Birth | | Position(s) Held with Fund | | Term of Office and Length of Time Served | | Principal Occupation(s) During Past 5 Years** | | Number of Funds in Fund Complex Overseen by Trustee*** | | Other Directorships Held by Trustee During Past 5 Years** |
Michael “Ross” Shell, 1970 | | Trustee | | Mr. Shell was elected at a special meeting of shareholders held on August 7, 2009. | | Mr. Shell is Founder and CEO of Red Idea, LLC, a strategic consulting/early stage venture firm (since June 2008). From 1999 to 2009, he was a part-owner and Director of Tesser, Inc., a brand agency. From December 2005 to May 2008, he was Director, Marketing and Investor Relations, of Woodbourne, a REIT/real estate hedge fund and private equity firm. Prior to this, from May 2004 to November 2005, he worked as a business strategy consultant; from June 2003 to April 2004, he was on the Global Client Services team of IDEO, a product design/innovation firm; and from 1999 to 2003, he was President of Tesser, Inc. Mr. Shell graduated with honors from Stanford University with a degree in Political Science. | | 34 | | None. |
| | |
| Annual Report | April 30, 2016 | | 27 |
| | |
| Stonebridge Small-Cap Growth Fund | | Trustees and Officers |
| | April 30, 2016 (Unaudited) |
| | | | | | | | | | |
INTERESTED TRUSTEE |
Name, Address* & Age | | Position(s) Held with Fund | | Term of Office and Length of Time Served | | Principal Occupation(s) During Past 5 Years** | | Number of Funds in Fund Complex Overseen by Trustee*** | | Other Directorships Held by Trustee |
Edmund J. Burke, 1961 | | Trustee, Chairman and President | | Mr. Burke was elected as Chairman at the August 28, 2009 meeting of the Board of Trustees. Mr. Burke was elected as Trustee at a special meeting of shareholders held on August 7, 2009. Mr. Burke was elected President of the Trust at the December 17, 2002 meeting of the Board of Trustees. | | Mr. Burke is President and a Director of ALPS Holdings, Inc. (“AHI”) (since 2005) and Director of Boston Financial Data Services, Inc. (“BFDS”), ALPS Advisors, Inc. (“AAI”), ALPS Distributors, Inc. (“ADI”), ALPS Fund Services, Inc. (“AFS”) and ALPS Portfolio Solutions Distributor, Inc. (“APSD”) and from 2001-2008, was President of AAI, ADI, AFS and APSD. Because of his positions with AHI, BFDS, AAI, ADI, AFS and APSD, Mr. Burke is deemed an affiliate of the Trust as defined under the 1940 Act. Mr. Burke is Trustee and President of the Clough Global Allocation Fund (Trustee since 2006; President since 2004); Trustee and President of the Clough Global Equity Fund (Trustee since 2006; President since 2005); Trustee and President of the Clough Global Opportunities Fund (since 2006); Trustee of the Liberty All-Star Equity Fund; and Director of the Liberty All-Star Growth Fund, Inc. | | 34 | | Mr. Burke is a Trustee of Clough Global Allocation Fund (1 fund); Clough Global Equity Fund (1 fund); Clough Global Opportunities Fund (1 fund); Liberty All-Star Equity Fund (1 fund) and Clough Funds Trust (1 fund); and Director of the Liberty All-Star Growth Fund, Inc. (1 fund). |
*All communications to Trustees and Officers may be directed to Financial Investors Trust c/o 1290 Broadway, Suite 1100, Denver, CO 80203.
**This is the period for which the Trustee or Officer began serving the Trust. Each Trustee serves an indefinite term, until his successor is elected. Officers are elected on an annual basis.
*** The Fund Complex includes all series of the Trust (currently 34) and any other investment companies for which any Trustee serves as trustee for and which Stonebridge Capital Management, Inc. provides investment advisory services (currently none).
| | |
| 28 | | Stonebridge Small-Cap Growth Fund |
| | |
| Stonebridge Small-Cap Growth Fund | | Trustees and Officers |
| | April 30, 2016 (Unaudited) |
| | | | | | |
Name, Address* & Year of Birth | | Position(s) Held with Fund | | Term of Office and Length of Time Served | | Principal Occupation(s) During Past 5 Years** |
Kimberly R. Storms, 1972 | | Treasurer | | Ms. Storms was elected Treasurer of the Trust at the March 12, 2013 meeting of the Board of Trustees. | | Ms. Storms is Senior Vice President - Director of Fund Administration of ALPS. Because of her position with ALPS, Ms. Storms is deemed an affiliate of the Trust as defined under the 1940 Act. Ms. Storms is also Treasurer of Liberty All-Star Equity Fund, Liberty All-Star Growth Fund, Inc. and ALPS Series Trust. Ms. Storms also serves as a Board member and Treasurer of The Center for Trauma & Resilience, a nonprofit agency. |
JoEllen L. Legg, 1961 | | Secretary | | Ms. Legg was elected Secretary of the Trust at the September 15, 2015 meeting of the Board of Trustees. | | Ms. Legg joined ALPS in October 2007 and is currently Vice President, Assistant General Counsel of ALPS. Prior to joining ALPS, Ms. Legg served as Senior Counsel - Law (Corporate & Securities) for Adelphia Communications Corporation (February 2005 - March 2007). Prior to this, Ms. Legg held associate positions at Fried Frank Harris Shriver & Jacobson LLP (1998 - 2004) and at Patton Boggs LLP (2004 - 2005). Because of her position with ALPS, Ms. Legg is deemed an affiliate of the Trust as defined under the 1940 Act. Ms. Legg is also the Secretary of ALPS Series Trust and Reaves Utility Income Fund. |
Ted Uhl, 1974 | | Chief Compliance Officer (“CCO”) | | Mr. Uhl was appointed CCO of the Trust at the June 8, 2010 meeting of the Board of Trustees. | | Mr. Uhl joined ALPS in October 2006, and is currently Deputy Compliance Officer of ALPS. Prior to his current role, Mr. Uhl served as Senior Risk Manager for ALPS from October 2006 until June 2010. Because of his position with ALPS, Mr. Uhl is deemed an affiliate of the Trust as defined under the 1940 Act. Mr. Uhl is also CCO of the Reaves Utility Income Fund, Centre Funds and Transparent Value Trust. |
Jennell Panella, 1974 | | Assistant Treasurer | | Ms. Panella was elected Assistant Treasurer of the Trust at the September 15, 2015 meeting of the Board of Trustees. | | Ms. Panella joined ALPS in June 2012 and is currently Fund Controller of ALPS Fund Services, Inc. Prior to joining ALPS, Ms. Panella served as Financial Reporting Manager for Parker Global Strategies, LLC (2009-2012). Because of her position with ALPS, Ms. Panella is deemed an affiliate of the Trust as defined under the 1940 Act. Ms. Panella also serves as Assistant Treasurer of James Advantage Funds. |
Nate Mandeville, 1977 | | Assistant Treasurer | | Mr. Mandeville was elected Assistant Treasurer of the Trust at the September 15, 2015 meeting of the Board of Trustees. | | Mr. Mandeville joined ALPS in December 2013 and is Fund Controller for ALPS. Prior to joining ALPS, Mr. Mandeville worked for Great-West Financial (2011-2013), Virtuoso Sourcing Group (2008-2011) and Janus Capital Group (2000-2008). Because of his position with ALPS, Mr. Mandeville is deemed an affiliate of the Trust as defined under the 1940 Act. Mr. Mandeville also serves as Assistant Treasurer of ALPS Series Trust. |
Sharon Akselrod, 1974 | | Assistant Secretary | | Ms. Akselrod was elected Assistant Secretary of the Trust at the September 15, 2015 meeting of the Board of Trustees. | | Ms. Akselrod joined ALPS in August 2014 and is currently Senior Investment Company Act Paralegal of ALPS. Prior to joining ALPS, Ms. Akselrod served as Corporate Governance and Regulatory Associate for Nordstrom fsb (2013-2014) and Senior Legal Assistant – Legal Manager for AXA Equitable Life Insurance Company (2008-2013). Because of her position with ALPS, Ms. Akselrod is deemed an affiliate of the Trust as defined under the 1940 Act. |
| | |
| Annual Report | April 30, 2016 | | 29 |
| | |
| Stonebridge Small-Cap Growth Fund | | Trustees and Officers |
OFFICERS (continued) | | April 30, 2016 (Unaudited) |
| | | | | | |
Name, Address* & Year of Birth | | Position(s) Held with Fund | | Term of Office and Length of Time Served | | Principal Occupation(s) During Past 5 Years** |
Sareena Khwaja-Dixon 1980 | | Assistant Secretary | | Ms. Khwaja-Dixon was elected Assistant Secretary of the Trust at the December 15, 2015 meeting of the Board of Trustees. | | Ms. Khwaja-Dixon joined ALPS in August 2015 and is currently Senior Counsel and Vice President of ALPS. Prior to joining ALPS, Ms. Khwaja-Dixon served as a Senior Paralegal/Paralegal for Russell Investments (2011- 2015). Because of her position with ALPS, Ms. Khwaja-Dixon is deemed an affiliate of the Trust as defined under the 1940 Act. |
*All communications to Trustees and Officers may be directed to Financial Investors Trust c/o 1290 Broadway, Suite 1100, Denver, CO 80203.
**This is the period for which the Trustee or Officer began serving the Trust. Each Trustee serves an indefinite term, until his successor is elected. Officers are elected on an annual basis.
*** The Fund Complex includes all series of the Trust (currently 34) and any other investment companies for which any Trustee serves as trustee for and which Stonebridge Capital Management, Inc. provides investment advisory services (currently none).
| | |
| 30 | | Stonebridge Small-Cap Growth Fund |
Page Intentionally Left Blank
This report and its financial statements are submitted for the general information of the shareholders of the Fund. The report is not authorized for distribution to prospective investors in the Fund unless preceded or accompanied by a prospectus.
Table of Contents
www.vulcanvaluepartners.com
Shareholder Letter
April 30, 2016 (Unaudited)
PORTFOLIO REVIEW
General
Vulcan Value Partners Fund and Vulcan Value Partners Small Cap Fund have produced exceptional long-term returns as both funds have outperformed their respective benchmarks inception to date. Vulcan Value Partners Fund and Vulcan Value Partners Small Cap Fund received a 4-Star Overall Morningstar Ranking. (As of April 30, 2016 out of 1,476 Large Growth, and 646 Small Blend Funds, respectively, derived from a weighted average of the Funds’ three-, five- and ten-year (if applicable) Morningstar metrics, which are based on risk-adjusted return performance.)*
As we have often said, we place no weight on short-term results, good or bad, and neither should you. In fact, we have made and will continue to make decisions that negatively impact short-term performance when we think we can improve our long-term returns and lower risk. We encourage you to focus on our long-term results, the consistent execution of our investment philosophy, our outstanding team, and our conflict-free, fiduciary structure. We feel our compliance department does excellent work and has an enviable operating environment. Everyone at Vulcan Value Partners is required to invest in publicly traded equities exclusively through Vulcan Value Partners. This policy eliminates a lot of conflicts and focuses energy on where it should be focused – you, our client partners. These characteristics are what drive our long-term results, which is all that we care about.
The lower our price to value ratios, the higher our margin of safety. Our goal is to mitigate risk. We believe returns will take care of themselves over our five year horizon. It is very important to understand that market volatility is not risk. We define risk as the probability of permanently losing capital over our five-year time horizon. Our investment discipline requires us only to invest in companies that we believe have inherently stable values. As a result, market price volatility creates opportunities for us to mitigate risk by improving our price to value ratios.
This counterintuitive result is possible because of our dual discipline. One critical variable is our ability to find the few businesses with stable values and to have the discipline to avoid the many that do not have stable values, no matter how discounted they might be at a point in time. Most of the businesses that qualify for investment at Vulcan Value Partners in terms of value stability are overpriced most of the time. So, the second critical variable is to be disciplined about the price we are willing to pay for these outstanding businesses.
Ironic to some, but not to us, historically when markets are volatile and when our short-term results are at their worst, we are mitigating risk and planting the seeds for exceptional long-term compounding. Your stable, long-term capital allows us to take advantage of sellers who confuse stock price volatility with risk and/or do not have our long-term time horizon. Together, we form a powerful partnership that gives us a sustainable advantage over other market participants.
Increasingly, these market participants include mindless index and exchange traded funds, and factor-based approaches such as “smart beta.”1 To paraphrase my business partner Adam McClain, smart beta reminds us of someone who thinks they have discovered something wonderful when they smell bacon cooking and then eat the grease instead of the meat. Thank you very much, but we prefer to do the real work and enjoy the bacon. With more capital being deployed based on
| | |
| Annual Report | April 30, 2016 | | 1 |
Shareholder Letter
April 30, 2016 (Unaudited)
flavor of the week factors instead of a coherent investment philosophy based on a comprehensive set of fundamentals, our opportunities to find mispriced companies should improve over time.
We have no idea where markets will head over the remainder of the year, but we hope they will decline. Please rest assured that if they do, we will rigorously follow our investment discipline and redeploy capital into companies with stable values at more attractive price to value ratios. For a real world example of this process taking place, keep on reading about Hilton in the Vulcan Value Partners Fund section below.
Vulcan Value Partners Large Cap Fund Review
In the discussion that follows, we highlight a few holdings in the Vulcan Value Partners Fund.
Parker-Hannifin, one of our largest holdings, is the world’s leading motion control company.2 It is a wonderful business and extremely well managed. Parker-Hannifin’s short-term results have been hurt by the very strong dollar and weak demand in the global industrial economy. Despite these headwinds, which have reduced Parker-Hannifin’s top line, the company has done a terrific job of managing costs and protecting profit margins. We expect conditions to remain challenging over the course of 2016. While we wait for the global economy to improve, Parker-Hannifin is producing strong free cash flow and using its free cash to repurchase stock at a discount to our estimate of intrinsic worth.
Oracle is also one of our largest holdings. Like Parker-Hannifin, Oracle has faced a significant headwind from the strong dollar. More importantly, the company is rapidly shifting its business mix to Cloud-based delivery of its software products. Cloud-based revenues are more profitable over time than on-premise software license fees. However, Oracle’s consolidated growth has slowed because Cloud sales do not have one-time setup fees, while on-premise sales do. Investors with shorter time horizons than ours have punished Oracle’s stock for the last couple of years because of its slowing consolidated growth. Assuming Oracle’s Cloud business continues to grow at high double-digit rates, the company’s consolidated growth rate should begin to accelerate sometime over the next twelve months and continue to accelerate for many years to come. Recently, as an inflection point has become more visible to short-term investors, they have pushed up Oracle’s stock price, and we have been rewarded for our patience.
A new purchase during the period, Hilton Worldwide Holdings, is a company that I have followed and owned numerous times over my career, making very attractive returns each time over several decades. Shortly after Vulcan Value Partners was formed, Blackstone took Hilton private at a price well in excess of our estimate of fair value. Since it was private, it was no longer available to us. A little over two years ago, Hilton did an initial public offering (IPO) and was available again. Hilton came public at a price too high to be of interest to us but we continued to follow it as we do with the relatively small number of companies we have found with stable values. Following these sound but over-priced companies is a big benefit to us. Our values are based on a set of fundamental assumptions about the companies we follow. If the companies we follow exceed our expectations, then our assumptions are conservative as are our values. Hilton’s results were much better than we expected, and yet the stock price declined, particularly during the fourth quarter of 2015. When markets declined in January, Hilton declined more. With a steadily rising value and a declining stock price, we were able to purchase Hilton at a substantial discount to our conservative estimate of intrinsic worth.
| | |
| 2 | | www.vulcanvaluepartners.com |
Shareholder Letter
April 30, 2016 (Unaudited)
Please note that nothing changed about Hilton’s business except that its value grew. Stock market and stock price volatility created an opportunity for us to mitigate risk and improve our long-term prospects. Because we limit ourselves to companies with stable values like Hilton, stock price volatility is not risk. Instead, stock price volatility is a tool that can be used to lower risk for disciplined, long-term investors like Vulcan Value Partners and you, our client partners.
Chubb was our top contributor in the Fund over the period. On July 1, 2015, ACE, Ltd announced a takeover offer for Chubb. We bought Chubb during the financial crisis. It had been a steady compounder for us with both price and estimated value rising at double digit rates since we bought it. ACE’s offer is right on top of our estimate of fair value. Interestingly, using the same valuation criteria, Chubb sold for 55% of our estimate of fair value in March of 2009. With ACE’s bid, Chubb’s price rose 36%, and just before the 4th of July holiday weekend, we were able to sell our entire stake and redeploy our capital back into other outstanding businesses with larger estimated margins of safety. Consequently, we enjoyed a nice gain, roughly maintained our overall price to value ratio, and remained fully invested in Large Cap.
Fossil Group was our biggest detractor in the Large Cap Fund during the period. We forecasted that 2015 was going to be a down year when we purchased Fossil and factored it into our valuation. It now looks like 2016 is going to be a down year as well, which we did not expect. While we would prefer to have been more accurate in our forecast for Fossil, we understand the reasons why and remain supportive of Fossil’s management team. Fossil has a very strong competitive position in the watch industry with global distribution and scale, strong internally developed brands, and a broad portfolio of third party brands. Fossil is the preferred partner for leading lifestyle brands including Michael Kors, Burberry, Armani Exchange, DKNY, Diesel, Tory Burch, Kate Spade, Adidas, and others. We think Fossil’s competitive strengths will enable it to compete effectively in the rapidly expanding wearables market. Fossil is investing heavily to participate in the wearables market, which is the main reason we expect 2016 to be a down year. If Fossil fails in wearables and retreats to traditional watches, it is extremely discounted. If Fossil is modestly successful in wearables, it is one of the most discounted companies we have ever owned.3
Vulcan Value Partners Small Cap Fund Review
In the discussion that follows, we highlight a few holdings in the Vulcan Value Partners Small Cap Fund.
Fossil Group was our biggest detractor in the Small Cap Fund during the period. We forecasted that 2015 was going to be a down year when we purchased Fossil and factored it into our valuation. It now looks like 2016 is going to be a down year as well, which we did not expect. While we would prefer to have been more accurate in our forecast for Fossil, we understand the reasons why and remain supportive of Fossil’s management team. Fossil has a very strong competitive position in the watch industry with global distribution and scale, strong internally developed brands, and a broad portfolio of third party brands. Fossil is the preferred partner for leading lifestyle brands including Michael Kors, Burberry, Armani Exchange, DKNY, Diesel, Tory Burch, Kate Spade, Adidas, and others. We think Fossil’s competitive strengths will enable it to compete effectively in the rapidly expanding wearables market. Fossil is investing heavily to participate in the wearables market, which is the main reason we expect 2016 to be a down year. If Fossil fails in wearables and retreats to traditional watches, it is extremely discounted. If Fossil is modestly successful in wearables, it could be one of the most discounted companies we have ever owned.3
| | |
| Annual Report | April 30, 2016 | | 3 |
Shareholder Letter
April 30, 2016 (Unaudited)
La Quinta Holdings, a new purchase, is a small cap version of Hilton. In fact, it was also taken private by Blackstone and had an IPO roughly two years ago. La Quinta is a much smaller company than Hilton and focuses on the limited service segment of the hotel market. Its results, while positive, were below inflated expectations when it IPO’d. With the stock price down significantly and its value stable, we were able to purchase La Quinta at an attractive price to value ratio.
Nu Skin returned approximately negative 25% during the period. Since buying Nu Skin, following our investment discipline, we reduced our weight in Nu Skin prior to its stock price decline because its price had risen faster than its estimated value in the first quarter. We are optimistic that its estimated value could compound at double digit rates over the next five years.
Closing
Approximately a year ago we announced that we were closing to new investors to protect the high quality of our client base and to preserve investment capacity for you, our client partners. It was a great decision. Market volatility is not risk to disciplined, long-term investors. We define risk as the probability of permanently losing capital over our five-year time horizon. It is an opportunity to lower risk by improving our margin of safety. Your patient capital alongside of ours and our shared long-term time horizon allows us to execute our investment philosophy which is based upon using short-term market disruptions to improve our long-term prospects.
Thank you for the confidence you have placed in us.
C.T. Fitzpatrick
Chief Executive Officer
Vulcan Value Partners, LLC
| 1 | Smart beta defines a set of investment strategies that emphasize the use of alternative index construction rules to traditional market capitalization based indices. Smart beta emphasizes capturing investment factors or market inefficiencies in a rules-based and transparent way. |
| | See http://www.investopedia.com/terms/s/smart-beta.asp |
| 2 | Parker-Hannifin has the number one position in the motion and control industry; sourced from the Parker Hannifin presentation for the Gabelli Aircraft Supplier Conference September 9, 2015. |
| 3 | Discount is the difference between our estimated intrinsic value and the market price of a security. |
For each fund with at least a three-year history, Morningstar calculates a Morningstar Rating™ based on a Morningstar Risk-Adjusted Return measure that accounts for variation in a fund’s monthly performance (including the effects of sales charges, loads, and redemption fees), placing more emphasis on downward variations and rewarding consistent performance. The top 10% of funds in each category receive 5 stars, the next 22.5% receive 4 stars, the next 35% receive 3 stars, the next 22.5% receive 2 stars and the bottom 10% receive 1 star. (Each share class is counted as a fraction of one fund within this scale and rated separately, which may cause slight variations in the distribution percentages.) The Overall Morningstar Rating for a fund is derived from a weighted average of the performance figures associated with its three-, five- and ten-year (if applicable) Morningstar Rating metrics, as of April 30, 2016. Morningstar Rating is for the retail share class only; other classes may
| | |
| 4 | | www.vulcanvaluepartners.com |
Shareholder Letter
April 30, 2016 (Unaudited)
have different performance characteristics. © 2016 Morningstar, Inc. All Rights Reserved. The information contained herein: (1) is proprietary to Morningstar and/or its content providers; (2) may not be copied or distributed; and (3) is not warranted to be accurate, complete or timely. Neither Morningstar nor its content providers are responsible for any damages or losses arising from any use of this information. Vulcan Value Partners Fund (VVPLX) was rated 3 Stars out of 1,476 for the 3-year period and 5 Stars out of 1,296 for the 5 year period against Large Growth Funds. Vulcan Value Partners Small Cap Fund (VVPSX) was rated 3 Stars out of 646 for the 3-year period and 5 Stars out of 562 for the 5-year period against Small Blend Funds. All information in this report is as of the date shown in the upper right hand corner unless otherwise indicated.
This letter reflects our views, opinions, and portfolio holdings as of April 30, 2016. Our views may change at any time based upon market or other conditions and Vulcan Value Partners disclaims any responsibility to update our views. Our views should not be relied on as investment advice and, because investment decisions for the fund are based on numerous factors, may not be relied on as an indication of trading intent on behalf of the fund. Certain statements that we make may constitute “forward-looking statements”. Forward-looking statements are not guarantees, and they involve risks, uncertainties and assumptions. Past Performance does not guarantee future results.
Please see page 6 and 9 for 1 year and inception to date returns for the Vulcan Value Partners Fund and Vulcan Value Partners Small Cap Fund, respectively.
Margin of Safety is a favorable difference between the price of a company’s shares and the estimated intrinsic value of those shares.
Free Cash Flow is a measure of how much a business generates after accounting for capital expenditures. It is calculated as operating cash flow less capital expenditures.
Return of Capital is a return from an investment that is not considered income. The return of capital is when some or all of the money an investor has in an investment is paid back, thus decreasing the value of the investment.
Price to Book Ratio is a ratio used to compare a stock’s market value to its book value. It is calculated by dividing the current closing price of the stock by the latest quarter’s book value per share.
The views of the Vulcan Value Partners, LLC and information discussed in this commentary are as of the date of publication, are subject to change, and may not reflect the writer’s current views. The views expressed represent an assessment of market conditions at a specific point in time, are opinions only and should not be relied upon as investment advice regarding a particular investment or markets in general. Such information does not constitute a recommendation to buy or sell specific securities or investment vehicles. It should not be assumed that any investment will be profitable or will equal the performance of the Funds or any securities or any sectors mentioned in this letter. The subject matter contained in this letter has been derived from several sources believed to be reliable and accurate at the time of compilation. Neither Vulcan Value Partners, LLC nor the Funds accept any liability for losses either direct or consequential caused by the use of this information.
Diversification does not assure a profit or protect against loss.
The primary and secondary benchmark indexes are not actively managed and do not reflect any deductions for fees, expenses or taxes. An investor may not invest directly in an index.
The Funds are distributed by ALPS Distributors, Inc.
| | |
| Annual Report | April 30, 2016 | | 5 |
Fund Overview
April 30, 2016 (Unaudited)
VULCAN VALUE PARTNERS FUND
Average Annual Total Returns (as of 4/30/16)
| | | | | | | | | | | | | | | | | | | | | | | | |
| | | | | | | | | | | | Since | | | Expense Ratios | |
| | | 1 Year | | | 3 Year | | | 5 Year | | | Inception* | | | Total | | | Net** | |
| |
Vulcan Value Partners Fund | | | -6.49% | | | | 10.23% | | | | 12.50% | | | | 12.52% | | | | 1.08% | | | | 1.08% | |
S&P 500® Total Return Index*** | | | 1.21% | | | | 11.26% | | | | 11.02% | | | | 12.39% | | | | | | | | | |
Russell 1000® Value Index*** | | | -0.40% | | | | 9.59% | | | | 10.13% | | | | 11.79% | | | | | | | | | |
Performance data quoted represents past performance. Past performance does not guarantee future results. Investment return and principal value of an investment will fluctuate so that an investor’s shares, when sold or redeemed, may be worth more or less than the original cost. The Fund imposes a 2.00% redemption fee on shares held for less than 90 days. Current performance data may be higher or lower than actual data quoted. For the most current month-end performance data, please call 1-877-421-5078.
The table does not reflect the deduction of taxes that a shareholder would pay on Fund distributions or the redemption of Fund shares.
Subject to investment risks, including possible loss of the principal amount invested.
| * | Fund inception date of 12/30/09. |
| ** | Vulcan Value Partners, LLC (“Vulcan” or the “Adviser”) has contractually agreed to limit the Fund’s total annual fund operating expenses (exclusive of Acquired Fund Fees and Expenses, brokerage expenses, interest expense, taxes and extraordinary expenses) to 1.25% of the Fund’s average daily net assets. This agreement (the “Expense Agreement”) is in effect through August 31, 2016. The Adviser will be permitted to recover, on a class-by-class basis, expenses it has borne through the Expense Agreement to the extent that the Fund’s expenses in later periods fall below the expense cap in effect at the time of waiver or reimbursement. Notwithstanding the foregoing, the Fund will not be obligated to pay any such fees and expenses more than three years after the end of the fiscal year in which the fees or expenses were foregone or reimbursed. The Adviser may not discontinue or modify this waiver prior to August 31, 2016 without the approval by the Fund’s Board of Trustees. |
| *** | Indices are not actively managed and do not reflect any deduction for fees, expenses or taxes. An investor may not invest directly in an index. |
| | |
| 6 | | www.vulcanvaluepartners.com |
Fund Overview
April 30, 2016 (Unaudited)
Performance of $10,000 Initial Investment (for the period ended April 30, 2016)
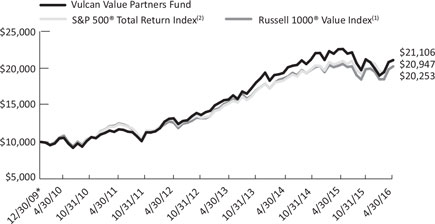
The chart above represents historical performance of a hypothetical investment of $10,000 in the Fund since inception. Past performance does not guarantee future results. This chart does not reflect the deduction of taxes that a shareholder would pay on Fund distributions or the redemption of Fund shares.
| * | Fund inception date of 12/30/09. |
| (1) | The Russell 1000® Value Index measures the performance of the large-cap value segment of the U.S. equity universe. It includes those Russell 1000® companies with lower price-to-book ratios and lower expected growth values. The index is not actively managed and does not reflect any deductions for fees, expense or taxes. An investor may not invest directly in an index. |
| (2) | The S&P 500® Total Return Index is an unmanaged index of 500 common stocks chosen for market size, liquidity and industry group representation. It is a market-value weighted index. The index is not actively managed and does not reflect any deductions for fees, expense or taxes. An investor may not invest directly in an index. |
Investing in the Fund is subject to investment risks, including possible loss of the principal amount invested.
Industry Allocation (as a % of Net Assets)*
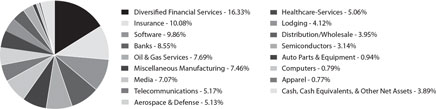
| * | Holdings are subject to change, and may not reflect the current or future position of the portfolio. |
| | |
| Annual Report | April 30, 2016 | | 7 |
Disclosure of Fund Expenses
April 30, 2016 (Unaudited)
As a shareholder of the Vulcan Value Partners Fund (the “Fund”), you will incur two types of costs: (1) transaction costs, including applicable redemption fees; and (2) ongoing costs, including management fees and other fund operating expenses. The following examples are intended to help you understand your ongoing costs (in dollars) of investing in the Fund and to compare these costs with the ongoing costs of investing in other mutual funds. The examples are based on an investment of $1,000 invested on November 1, 2015 and held until April 30, 2016.
Actual Expenses. The first line of each table below provides information about actual account values and actual expenses. You may use the information in this line, together with the amount you invested, to estimate the expenses that you paid over the period. Simply divide your account value by $1,000 (for example, an $8,600 account value divided by $1,000 = 8.6), then multiply the result by the number in the first line under the heading “Expenses Paid During Period” to estimate the expenses you paid on your account during this period.
Hypothetical Example for Comparison Purposes. The second line of the table below provides information about hypothetical account values and hypothetical expenses based on the Fund’s actual expense ratio and an assumed rate of return of 5% per year before expenses, which is not the Fund’s actual return. The hypothetical account values and expenses may not be used to estimate the actual ending account balance or expenses you paid for the period. You may use this information to compare the ongoing costs of investing in the Fund and other mutual funds. To do so, compare this 5% hypothetical example with the 5% hypothetical examples that appear in the shareholder reports of the other mutual funds.
Please note the expenses shown in the table are meant to highlight ongoing Fund costs only and do not reflect transactional costs, such as redemption fees or exchange fees. Therefore, the second line of the table below is useful in comparing your ongoing costs only, and will not help you determine the relative total costs of owning different funds. In addition, if these transactional costs were included, your costs would have been higher.
Vulcan Value Partners Fund
| | | | | | | | | | | | |
| | | Beginning Account
Value 11/1/15 | | Ending Account
Value 4/30/16 | | Expense
Ratio(a) | | | Expenses Paid During period 11/1/15 - 4/30/16(b) | |
| | | | |
Actual | | $ 1,000.00 | | $ 995.40 | | | 1.08% | | | | $ 5.36 | |
Hypothetical (5% return before expenses) | | $ 1,000.00 | | $ 1,019.49 | | | 1.08% | | | | $ 5.42 | |
| (a) | The Fund’s expense ratios have been annualized based on the Fund’s most recent fiscal half-year expenses. |
| (b) | Expenses are equal to the Fund’s annualized expense ratio multiplied by the average account value over the period, multiplied by the number of days in the most recent fiscal half-year (182)/366 (to reflect the half-year period). |
| | |
| 8 | | www.vulcanvaluepartners.com |
Fund Overview
April 30, 2016 (Unaudited)
VULCAN VALUE PARTNERS SMALL CAP FUND
Average Annual Total Returns (as of 4/30/16)
| | | | | | | | | | | | | | | | | | | | |
| | | | | | | | | | | | Since | | Expense Ratios |
| | | 1 Year | | | 3 Year | | | 5 Year | | | Inception* | | Total | | | Net** |
|
Vulcan Value Partners Small Cap Fund | | | -5.04% | | | | 6.88% | | | | 10.15% | | | 13.98% | | | 1.26% | | | 1.25% |
Russell 2000® Value Index*** | | | -3.71% | | | | 6.50% | | | | 6.77% | | | 10.15% | | | | | | |
Russell 2000® Index*** | | | -5.94% | | | | 7.53% | | | | 6.98% | | | 11.07% | | | | | | |
Performance data quoted represents past performance. Past performance does not guarantee future results. Investment return and principal value of an investment will fluctuate so that an investor’s shares, when sold or redeemed, may be worth more or less than the original cost. The Fund imposes a 2.00% redemption fee on shares held for less than 90 days. Current performance data may be higher or lower than actual data quoted. For the most current month-end performance data, please call 1-877-421-5078.
The table does not reflect the deduction of taxes that a shareholder would pay on Fund distributions or the redemption of Fund shares.
Subject to investment risks, including possible loss of the principal amount invested.
| * | Fund inception date of 12/30/09. |
| ** | Vulcan Value Partners, LLC (“Vulcan” or the “Adviser”) has contractually agreed to limit the Fund’s total annual fund operating expenses (exclusive of Acquired Fund Fees and Expenses, brokerage expenses, interest expense, taxes and extraordinary expenses) to 1.25% of the Fund’s average daily net assets. This agreement (the “Expense Agreement”) is in effect through August 31, 2016. The Adviser will be permitted to recover, on a class-by-class basis, expenses it has borne through the Expense Agreement to the extent that the Fund’s expenses in later periods fall below the expense cap in effect at the time of waiver or reimbursement. Notwithstanding the foregoing, the Fund will not be obligated to pay any such fees and expenses more than three years after the end of the fiscal year in which the fees or expenses were foregone or reimbursed. The Adviser may not discontinue or modify this waiver prior to August 31, 2016 without the approval by the Fund’s Board of Trustees. |
| *** | Indices are not actively managed and do not reflect any deduction for fees, expenses or taxes. An investor may not invest directly in an index. |
| | |
| Annual Report | April 30, 2016 | | 9 |
Fund Overview
April 30, 2016 (Unaudited)
Performance of $10,000 Initial Investment (for the period ended April 30, 2016)
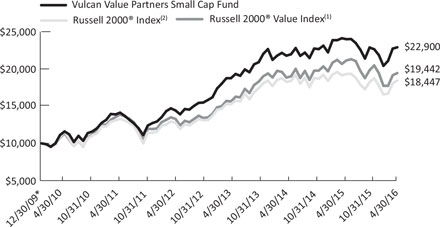
The chart above represents historical performance of a hypothetical investment of $10,000 in the Fund since inception. Past performance does not guarantee future results. This chart does not reflect the deduction of taxes that a shareholder would pay on Fund distributions or the redemption of Fund shares.
| * | Fund inception date of 12/30/09. |
| (1) | The Russell 2000® Value Index measures the performance of small-cap value segment of the U.S. equity universe. It includes those Russell 2000® companies with lower price-to-book ratios and lower forecasted growth values. The index is not actively managed and does not reflect any deductions for fees, expense or taxes. An investor may not invest directly in an index. |
| (2) | The Russell 2000® Index measures the performance of the small-cap segment of the U.S. equity universe. The Russell 2000® Index is a subset of the Russell 3000® Index representing approximately 8% of the total market capitalization of that index. It includes approximately 2,000 of the smallest securities based on a combination of their market cap and current index membership. The index is not actively managed and does not reflect any deductions for fees, expense or taxes. An investor may not invest directly in an index. |
Investing in the Fund is subject to investment risks, including possible loss of the principal amount invested.
Industry Allocation (as a % of Net Assets)*
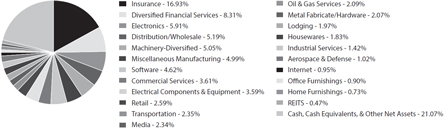
| * | Holdings are subject to change, and may not reflect the current or future position of the portfolio. |
| | |
| 10 | | www.vulcanvaluepartners.com |
Disclosure of Fund Expenses
April 30, 2016 (Unaudited)
As a shareholder of the Vulcan Value Partners Small Cap Fund (the “Fund”), you will incur two types of costs: (1) transaction costs, including applicable redemption fees; and (2) ongoing costs, including management fees and other fund operating expenses. The following examples are intended to help you understand your ongoing costs (in dollars) of investing in the Fund and to compare these costs with the ongoing costs of investing in other mutual funds. The examples are based on an investment of $1,000 invested on November 1, 2015 and held until April 30, 2016.
Actual Expenses. The first line of each table below provides information about actual account values and actual expenses. You may use the information in this line, together with the amount you invested, to estimate the expenses that you paid over the period. Simply divide your account value by $1,000 (for example, an $8,600 account value divided by $1,000 = 8.6), then multiply the result by the number in the first line under the heading “Expenses Paid During Period” to estimate the expenses you paid on your account during this period.
Hypothetical Example for Comparison Purposes. The second line of the table below provides information about hypothetical account values and hypothetical expenses based on the Fund’s actual expense ratio and an assumed rate of return of 5% per year before expenses, which is not the Fund’s actual return. The hypothetical account values and expenses may not be used to estimate the actual ending account balance or expenses you paid for the period. You may use this information to compare the ongoing costs of investing in the Fund and other mutual funds. To do so, compare this 5% hypothetical example with the 5% hypothetical examples that appear in the shareholder reports of the other mutual funds.
Please note the expenses shown in the table are meant to highlight ongoing Fund costs only and do not reflect transactional costs, such as redemption fees or exchange fees. Therefore, the second line of the table below is useful in comparing your ongoing costs only, and will not help you determine the relative total costs of owning different funds. In addition, if these transactional costs were included, your costs would have been higher.
Vulcan Value Partners Small Cap Fund
| | | | | | | | | | |
| | | | |
| | | Beginning Account
Value 11/1/15 | | Ending Account
Value 4/30/16 | | Expense
Ratio(a) | | Expenses Paid During period 11/1/15 - 4/30/16(b) | |
| | | | |
Actual | | $ 1,000.00 | | $ 1,001.30 | | 1.25% | | | $ 6.22 | |
Hypothetical (5% return before expenses) | | $ 1,000.00 | | $ 1,018.65 | | 1.25% | | | $ 6.27 | |
| (a) | The Fund’s expense ratios have been annualized based on the Fund’s most recent fiscal half-year expenses. |
| (b) | Expenses are equal to the Fund’s annualized expense ratio multiplied by the average account value over the period, multiplied by the number of days in the most recent fiscal half-year (182)/366 (to reflect the half-year period). |
| | |
| Annual Report | April 30, 2016 | | 11 |
| | |
| Statement of Investments | | Vulcan Value Partners Fund |
| April 30, 2016 | | |
| | | | | | | | | | |
| | | Shares | | | | | Value (Note 2) | |
COMMON STOCKS (96.11%) | | | | | | | | | | |
Communications (12.24%) | | | | | | | | | | |
Media (7.07%) | | | | | | | | | | |
Discovery Communications, Inc., Class C(a) | | | 1,982,716 | | | | | $ | 53,097,134 | |
Time Warner, Inc. | | | 334,626 | | | | | | 25,143,798 | |
Walt Disney Co. | | | 288,610 | | | | | | 29,801,869 | |
| | | | | | | |
| | | | | | | | | 108,042,801 | |
| | | | | | | |
| | | |
Telecommunications (5.17%) | | | | | | | | | | |
Cisco Systems, Inc. | | | 2,268,831 | | | | | | 62,370,164 | |
Verizon Communications, Inc. | | | 327,109 | | | | | | 16,662,932 | |
| | | | | | | |
| | | | | | | | | 79,033,096 | |
| | | | | | | |
| | | |
TOTAL COMMUNICATIONS | | | | | | | | | 187,075,897 | |
| | | | | | | | | | |
| | | |
Consumer, Cyclical (9.78%) | | | | | | | | | | |
Apparel (0.77%) | | | | | | | | | | |
LVMH Moet Hennessy Louis Vuitton SE | | | 70,965 | | | | | | 11,790,609 | |
| | | | | | | |
| | | |
Auto Parts&Equipment (0.94%) | | | | | | | | | | |
GKN PLC | | | 3,500,000 | | | | | | 14,252,797 | |
| | | | | | | |
| | | |
Distribution/Wholesale (3.95%) | | | | | | | | | | |
Fossil Group, Inc.(a) | | | 1,489,979 | | | | | | 60,344,149 | |
| | | | | | | |
| | | |
Lodging (4.12%) | | | | | | | | | | |
Hilton Worldwide Holdings, Inc. | | | 1,751,449 | | | | | | 38,619,451 | |
Intercontinental Hotels Group PLC, ADR | | | 607,009 | | | | | | 24,365,341 | |
| | | | | | | |
| | | | | | | | | 62,984,792 | |
| | | | | | | |
| | | |
TOTAL CONSUMER, CYCLICAL | | | | | | | | | 149,372,347 | |
| | | | | | | | | | |
| | | |
Consumer, Non-cyclical (5.06%) | | | | | | | | | | |
Healthcare-Services (5.06%) | | | | | | | | | | |
Aetna, Inc. | | | 240,296 | | | | | | 26,978,032 | |
Anthem, Inc. | | | 357,940 | | | | | | 50,387,214 | |
| | | | | | | |
| | | | | | | | | 77,365,246 | |
| | | | | | | |
| | | |
TOTAL CONSUMER, NON-CYCLICAL | | | | | | | | | 77,365,246 | |
| | | | | | | | | | |
| | |
| 12 | | www.vulcanvaluepartners.com |
| | |
| Vulcan Value Partners Fund | | Statement of Investments |
| | April 30, 2016 |
| | | | | | | | | | | | |
| | | Shares | | | | | | Value (Note 2) | |
| |
Energy (7.69%) | | | | | | | | | | | | |
Oil & Gas Services (7.69%) | | | | | | | | | | | | |
National Oilwell Varco, Inc. | | | 3,260,027 | | | | | | | $ | 117,491,373 | |
| | | | | | | | |
| | | |
TOTAL ENERGY | | | | | | | | | | | 117,491,373 | |
| | | | | | | | | | | | |
| | | |
Financial (34.96%) | | | | | | | | | | | | |
Banks (8.55%) | | | | | | | | | | | | |
Bank of New York Mellon Corp. | | | 1,457,422 | | | | | | | | 58,646,661 | |
State Street Corp. | | | 1,155,030 | | | | | | | | 71,958,369 | |
| | | | | | | | |
| | | | | | | | | | | 130,605,030 | |
| | | | | | | | |
| | | |
Diversified Financial Services (16.33%) | | | | | | | | | | | | |
Aberdeen Asset Management PLC | | | 10,575,157 | | | | | | | | 46,154,826 | |
Franklin Resources, Inc. | | | 1,968,626 | | | | | | | | 73,508,495 | |
Mastercard, Inc., Class A | | | 516,264 | | | | | | | | 50,072,445 | |
T. Rowe Price Group, Inc. | | | 409,476 | | | | | | | | 30,829,448 | |
Visa, Inc., Class A | | | 633,873 | | | | | | | | 48,960,351 | |
| | | | | | | | |
| | | | | | | | | | | 249,525,565 | |
| | | | | | | | |
| | | |
Insurance (10.08%) | | | | | | | | | | | | |
Axis Capital Holdings, Ltd. | | | 1,007,288 | | | | | | | | 53,658,232 | |
Everest Re Group, Ltd. | | | 226,170 | | | | | | | | 41,818,833 | |
Swiss Re AG | | | 660,049 | | | | | | | | 58,553,289 | |
| | | | | | | | |
| | | | | | | | | | | 154,030,354 | |
| | | | | | | | |
| | | |
TOTAL FINANCIAL | | | | | | | | | | | 534,160,949 | |
| | | | | | | | | | | | |
| | | |
Industrial (12.59%) | | | | | | | | | | | | |
Aerospace & Defense (5.13%) | | | | | | | | | | | | |
Boeing Co. | | | 411,735 | | | | | | | | 55,501,878 | |
United Technologies Corp. | | | 219,314 | | | | | | | | 22,889,802 | |
| | | | | | | | |
| | | | | | | | | | | 78,391,680 | |
| | | | | | | | |
| | | |
Miscellaneous Manufacturing (7.46%) | | | | | | | | | | | | |
Dover Corp. | | | 617,747 | | | | | | | | 40,585,978 | |
Parker-Hannifin Corp. | | | 633,216 | | | | | | | | 73,465,720 | |
| | | | | | | | |
| | | | | | | | | | | 114,051,698 | |
| | | | | | | | |
| | | |
TOTAL INDUSTRIAL | | | | | | | | | | | 192,443,378 | |
| | | | | | | | | | | | |
| | | |
Technology (13.79%) | | | | | | | | | | | | |
Computers (0.79%) | | | | | | | | | | | | |
Apple, Inc. | | | 128,629 | | | | | | | | 12,057,682 | |
| | | | | | | | |
| | |
| Annual Report | April 30, 2016 | | 13 |
| | |
| Statement of Investments | | Vulcan Value Partners Fund |
| April 30, 2016 | | |
| | | | | | | | | | | | | | | | |
| | | | | | Shares | | | | | | Value
(Note 2) | |
| |
Technology (continued) | | | | | | | | | | | | | | | | |
Semiconductors (3.14%) | | | | | | | | | | | | | | | | |
QUALCOMM, Inc. | | | | | | | 948,167 | | | | | | | $ | 47,901,397 | |
| | | | | | | | | | | | |
| | | | |
Software (9.86%) | | | | | | | | | | | | | | | | |
Check Point Software Technologies, Ltd.(a) | | | | | | | 363,325 | | | | | | | | 30,108,743 | |
Oracle Corp. | | | | | | | 3,025,900 | | | | | | | | 120,612,374 | |
| | | | | | | | | | | | |
| | | | | | | | | | | | | | | 150,721,117 | |
| | | | | | | | | | | | |
| | | | |
TOTAL TECHNOLOGY | | | | | | | | | | | | | | | 210,680,196 | |
| | | | | | | | | | | | | | | | |
| | | | |
TOTAL COMMON STOCKS (Cost $1,391,374,309) | | | | | | | | | | | | | | | 1,468,589,386 | |
| |
| | | | |
| | | 7-Day
Yield | | | Shares | | | | | | Value
(Note 2) | |
| |
SHORT TERM INVESTMENTS (3.08%) | | | | | | | | | | | | | | | | |
Money Market Fund (3.08%) | | | | | | | | | | | | | | | | |
Dreyfus Treasury Prime Cash Management Fund, Institutional Shares | | | 0.162% | | | | 46,988,436 | | | | | | | | 46,988,436 | |
| | | | | | | | | | | | | | | | |
| | | | |
TOTAL SHORT TERM INVESTMENTS (Cost $46,988,436) | | | | | | | | | | | | | | | 46,988,436 | |
| |
| | | | |
TOTAL INVESTMENTS (99.19%) (Cost $1,438,362,745) | | | | | | | | | | | | | | $ | 1,515,577,822 | |
| | | | |
Other Assets In Excess Of Liabilities (0.81%) | | | | | | | | | | | | | | | 12,502,608 | |
| |
| | | | |
NET ASSETS (100.00%) | | | | | | | | | | | | | | $ | 1,528,080,430 | |
| |
| (a) | Non-Income Producing Security. |
For Fund compliance purposes, the Fund’s industry classifications refer to any one or more of the industry sub-classifications used by one or more widely recognized market indexes or ratings group indexes, and/or as defined by Fund management. This definition may not apply for purposes of this report, which may combine industry sub-classifications for reporting ease. Industries are shown as a percentage of net assets.
See Accompanying Notes to Financial Statements.
| | |
| 14 | | www.vulcanvaluepartners.com |
| | |
| Vulcan Value Partners Small Cap Fund | | Statement of Investments |
| | April 30, 2016 |
| | | | | | | | | | |
| | | Shares | | | | | Value (Note 2) | |
| |
COMMON STOCKS (78.93%) | | | | | | | | | | |
Communications (3.29%) | | | | | | | | | | |
Internet (0.95%) | | | | | | | | | | |
Trade Me Group, Ltd. | | | 3,407,727 | | | | | $ | 10,830,651 | |
| | | | | | | |
| | | |
Media (2.34%) | | | | | | | | | | |
SAI Global, Ltd. | | | 9,680,569 | | | | | | 26,866,261 | |
| | | | | | | |
| | | |
TOTAL COMMUNICATIONS | | | | | | | | | 37,696,912 | |
| | | | | | | | | | |
| | | |
Consumer, Cyclical (13.21%) | | | | | | | | | | |
Distribution/Wholesale (5.19%) | | | | | | | | | | |
Fossil Group, Inc.(a) | | | 1,469,127 | | | | | | 59,499,644 | |
| | | | | | | |
| | | |
Home Furnishings (0.73%) | | | | | | | | | | |
Select Comfort Corp.(a) | | | 337,936 | | | | | | 8,340,260 | |
| | | | | | | |
| | | |
Housewares (1.83%) | | | | | | | | | | |
Tupperware Brands Corp. | | | 360,526 | | | | | | 20,935,745 | |
| | | | | | | |
| | | |
Lodging (1.97%) | | | | | | | | | | |
La Quinta Holdings, Inc.(a) | | | 1,774,012 | | | | | | 22,654,133 | |
| | | | | | | |
| | | |
Office Furnishings (0.90%) | | | | | | | | | | |
Herman Miller, Inc. | | | 343,816 | | | | | | 10,372,929 | |
| | | | | | | |
| | | |
Retail (2.59%) | | | | | | | | | | |
Nu Skin Enterprises, Inc., Class A | | | 727,987 | | | | | | 29,680,030 | |
| | | | | | | |
| | | |
TOTAL CONSUMER, CYCLICAL | | | | | | | | | 151,482,741 | |
| | | | | | | | | | |
| | | |
Consumer, Non-cyclical (3.61%) | | | | | | | | | | |
Commercial Services (3.61%) | | | | | | | | | | |
Navigant Consulting, Inc.(a) | | | 962,648 | | | | | | 15,363,862 | |
Savills PLC | | | 2,402,559 | | | | | | 26,047,920 | |
| | | | | | | |
| | | | | | 41,411,782 | |
| | | |
TOTAL CONSUMER, NON-CYCLICAL | | | | | | | | | 41,411,782 | |
| | | | | | | | | | |
| | | |
Energy (2.09%) | | | | | | | | | | |
Oil & Gas Services (2.09%) | | | | | | | | | | |
Thermon Group Holdings, Inc.(a) | | | 1,281,801 | | | | | | 24,020,951 | |
| | | | | | | |
| | | |
TOTAL ENERGY | | | | | | | | | 24,020,951 | |
| | | | | | | | | | |
| | |
| Annual Report | April 30, 2016 | | 15 |
| | |
| Statement of Investments | | Vulcan Value Partners Small Cap Fund |
| April 30, 2016 | | |
| | | | | | | | | | | | |
| | | Shares | | | | | | Value
(Note 2) | |
| |
Financial (25.71%) | | | | | | | | | | | | |
Diversified Financial Services (8.31%) | | | | | | | | | | | | |
Ashmore Group PLC | | | 9,403,284 | | | | | | | $ | 42,194,364 | |
Eaton Vance Corp. | | | 643,834 | | | | | | | | 22,231,588 | |
Virtus Investment Partners, Inc. | | | 394,731 | | | | | | | | 30,875,859 | |
| | | | | | | | |
| | | | | | | | | | | 95,301,811 | |
| | | | | | | | |
| | | |
Insurance (16.93%) | | | | | | | | | | | | |
Aspen Insurance Holdings, Ltd. | | | 1,077,165 | | | | | | | | 49,926,598 | |
Axis Capital Holdings, Ltd. | | | 821,083 | | | | | | | | 43,739,091 | |
Everest Re Group, Ltd. | | | 165,386 | | | | | | | | 30,579,871 | |
Navigators Group, Inc.(a) | | | 591,373 | | | | | | | | 48,853,324 | |
Safety Insurance Group, Inc. | | | 371,931 | | | | | | | | 21,055,014 | |
| | | | | | | | |
| | | | | | | | | | | 194,153,898 | |
| | | | | | | | |
| | | |
REITS (0.47%) | | | | | | | | | | | | |
Outfront Media, Inc. | | | 249,983 | | | | | | | | 5,422,131 | |
| | | | | | | | |
| | | |
TOTAL FINANCIAL | | | | | | | | | | | 294,877,840 | |
| | | | | | | | | | | | |
| | | |
Industrial (24.40%) | | | | | | | | | | | | |
Aerospace & Defense (1.02%) | | | | | | | | | | | | |
Curtiss-Wright Corp. | | | 152,087 | | | | | | | | 11,646,822 | |
| | | | | | | | |
| | | |
Electrical Components & Equipment (3.59%) | | | | | | | | | | | | |
EnerSys | | | 705,171 | | | | | | | | 41,160,831 | |
| | | | | | | | |
| | | |
Electronics (5.91%) | | | | | | | | | | | | |
Ituran Location and Control, Ltd. | | | 1,583,952 | | | | | | | | 32,946,202 | |
Woodward, Inc. | | | 643,416 | | | | | | | | 34,879,581 | |
| | | | | | | �� | |
| | | | | | | | | | | 67,825,783 | |
| | | | | | | | |
| | | |
Industrial Services (1.42%) | | | | | | | | | | | | |
MSC Industrial Direct Co., Inc., Class A | | | 209,839 | | | | | | | | 16,262,523 | |
| | | | | | | | |
| | | |
Machinery-Diversified (5.05%) | | | | | | | | | | | | |
Concentric AB | | | 2,123,280 | | | | | | | | 24,060,729 | |
Lindsay Corp. | | | 443,673 | | | | | | | | 33,923,237 | |
| | | | | | | | |
| | | | | | | | | | | 57,983,966 | |
| | | | | | | | |
| | | |
Metal Fabricate/Hardware (2.07%) | | | | | | | | | | | | |
Timken Co. | | | 666,298 | | | | | | | | 23,740,198 | |
| | | | | | | | |
| | | |
Miscellaneous Manufacturing (2.99%) | | | | | | | | | | | | |
Crane Co. | | | 402,032 | | | | | | | | 22,340,918 | |
| | |
| 16 | | www.vulcanvaluepartners.com |
| | |
| Vulcan Value Partners Small Cap Fund | | Statement of Investments |
| | April 30, 2016 |
| | | | | | | | | | | | | | | | |
| | | | | | Shares | | | | | | Value
(Note 2) | |
| |
Industrial (continued) | | | | | | | | | | | | | | | | |
Miscellaneous Manufacturing (continued) | | | | | | | | | | | | | | | | |
Donaldson Co., Inc. | | | | | | | 367,240 | | | | | | | $ | 12,001,403 | |
| | | | | | | | | | | | |
| | | | | | | | | | | | | | | 34,342,321 | |
| | | | | | | | | | | | |
| | | | |
Transportation (2.35%) | | | | | | | | | | | | | | | | |
Forward Air Corp. | | | | | | | 591,746 | | | | | | | | 26,971,783 | |
| | | | | | | | | | | | |
| | | | |
TOTAL INDUSTRIAL | | | | | | | | | | | | | | | 279,934,227 | |
| | | | | | | | | | | | | | | | |
| | | | |
Industrials (2.00%) | | | | | | | | | | | | | | | | |
Miscellaneous Manufacturing (2.00%) | | | | | | | | | | | | | | | | |
Actuant Corp., Class A | | | | | | | 859,198 | | | | | | | | 22,949,179 | |
| | | | | | | | | | | | |
| | | | |
TOTAL INDUSTRIALS | | | | | | | | | | | | | | | 22,949,179 | |
| | | | | | | | | | | | | | | | |
| | | | |
Technology (4.62%) | | | | | | | | | | | | | | | | |
Software (4.62%) | | | | | | | | | | | | | | | | |
ACI Worldwide, Inc.(a) | | | | | | | 2,649,969 | | | | | | | | 52,972,880 | |
| | | | | | | | | | | | |
| | | | |
TOTAL TECHNOLOGY | | | | | | | | | | | | | | | 52,972,880 | |
| | | | | | | | | | | | | | | | |
| | | | |
TOTAL COMMON STOCKS (Cost $874,942,883) | | | | | | | | | | | | | | | 905,346,512 | |
| |
| | | | |
| | | 7-Day
Yield | | | Shares | | | | | | Value
(Note 2) | |
| |
SHORT TERM INVESTMENTS (20.19%) | | | | | | | | | | | | | | | | |
Money Market Fund (20.19%) | | | | | | | | | | | | | | | | |
Dreyfus Treasury Prime Cash Management Fund, Institutional Shares | | | 0.162 | % | | | 231,550,483 | | | | | | | | 231,550,483 | |
| | | | | | | | | | | | | | | | |
| | | | |
TOTAL SHORT TERM INVESTMENTS (Cost $231,550,483) | | | | | | | | | | | | | | | 231,550,483 | |
| |
| | | | |
TOTAL INVESTMENTS (99.12%) (Cost $1,106,493,366) | | | | | | | | | | | | | | $ | 1,136,896,995 | |
| | | | |
Other Assets In Excess Of Liabilities (0.88%) | | | | | | | | | | | | | | | 10,109,923 | |
| |
| | | | |
NET ASSETS (100.00%) | | | | | | | | | | | | | | $ | 1,147,006,918 | |
| |
| (a) | Non-Income Producing Security. |
| | |
| Annual Report | April 30, 2016 | | 17 |
| | |
| Statement of Investments | | Vulcan Value Partners Small Cap Fund |
| April 30, 2016 | | |
For Fund compliance purposes, the Fund’s industry classifications refer to any one or more of the industry sub-classifications used by one or more widely recognized market indexes or ratings group indexes, and/or as defined by Fund management. This definition may not apply for purposes of this report, which may combine industry sub-classifications for reporting ease. Industries are shown as a percentage of net assets.
| | |
See Accompanying Notes to Financial Statements. |
| 18 | | www.vulcanvaluepartners.com |
|
| Statements of Assets and Liabilities |
| April 30, 2016 |
| | | | | | | | |
| | | Vulcan Value Partners Fund | | | Vulcan Value Partners Small Cap Fund | |
| |
ASSETS: | | | | | | | | |
Investments, at value | | $ | 1,515,577,822 | | | $ | 1,136,896,995 | |
Foreign currency, at value (Cost $2,042,478 and $–) | | | 2,057,169 | | | | – | |
Receivable for investments sold | | | 11,483,324 | | | | 15,724,286 | |
Receivable for shares sold | | | 1,575,587 | | | | 963,311 | |
Dividends receivable | | | 1,669,782 | | | | 1,135,539 | |
Other assets | | | 23,161 | | | | 20,563 | |
| |
Total assets | | | 1,532,386,845 | | | | 1,154,740,694 | |
| |
| | |
LIABILITIES: | | | | | | | | |
Payable for investments purchased | | | – | | | | 4,858,738 | |
Payable for shares redeemed | | | 2,827,556 | | | | 1,606,153 | |
Payable to adviser | | | 1,253,802 | | | | 1,074,779 | |
Payable for administration fees | | | 35,161 | | | | 26,400 | |
Payable for transfer agency fees | | | 14,589 | | | | 11,143 | |
Payable for delegated transfer agent equivalent services fees | | | 21,402 | | | | 50,957 | |
Payable for professional fees | | | 23,864 | | | | 21,957 | |
Payable for trustee fees and expenses | | | 10,439 | | | | 7,526 | |
Payable for principal financial officer fees | | | 490 | | | | 344 | |
Accrued expenses and other liabilities | | | 119,112 | | | | 75,779 | |
| |
Total liabilities | | | 4,306,415 | | | | 7,733,776 | |
| |
NET ASSETS | | $ | 1,528,080,430 | | | $ | 1,147,006,918 | |
| |
| | |
NET ASSETS CONSIST OF: | | | | | | | | |
| | |
Paid-in capital (Note 5) | | $ | 1,490,753,963 | | | $ | 1,158,155,077 | |
Accumulated net investment income | | | 9,450,857 | | | | 2,656,416 | |
Accumulated net realized loss | | | (49,418,194) | | | | (44,219,575) | |
Net unrealized appreciation | | | 77,293,804 | | | | 30,415,000 | |
| |
NET ASSETS | | $ | 1,528,080,430 | | | $ | 1,147,006,918 | |
| |
| | |
INVESTMENTS, AT COST | | $ | 1,438,362,745 | | | $ | 1,106,493,366 | |
| | |
PRICING OF SHARES: | | | | | | | | |
Net Asset Value, offering and redemption price per share | | $ | 17.17 | | | $ | 16.58 | |
Shares of beneficial interest outstanding (unlimited number of shares, no par value common stock authorized) | | | 88,974,041 | | | | 69,190,114 | |
| | |
See Accompanying Notes to Financial Statements. |
| Annual Report | April 30, 2016 | | 19 |
| | |
| Statements of Operations | | |
| For the Year Ended April 30, 2016 | | |
| | | | | | | | |
| | | Vulcan Value Partners Fund | | | Vulcan Value Partners Small Cap Fund | |
| |
INVESTMENT INCOME: | | | | | | | | |
Dividends | | $ | 37,120,339 | | | $ | 20,918,758 | |
Foreign taxes withheld | | | (817,964) | | | | (740,534) | |
| |
Total investment income | | | 36,302,375 | | | | 20,178,224 | |
| |
| | |
EXPENSES: | | | | | | | | |
Investment advisory fees (Note 6) | | | 16,695,200 | | | | 12,451,815 | |
Administrative fees | | | 457,897 | | | | 298,485 | |
Transfer agency fees | | | 138,740 | | | | 117,218 | |
Delegated transfer agent equivalent services fees | | | 146,428 | | | | 332,051 | |
Professional fees | | | 50,040 | | | | 38,877 | |
Custodian fees | | | 246,260 | | | | 138,437 | |
Principal financial officer fees | | | 6,070 | | | | 3,930 | |
Trustee fees and expenses | | | 44,485 | | | | 29,079 | |
Recoupment of previously waived fees | | | – | | | | 20,833 | |
Other | | | 168,450 | | | | 103,857 | |
| |
Total net expenses | | | 17,953,570 | | | | 13,534,582 | |
| |
NET INVESTMENT INCOME | | | 18,348,805 | | | | 6,643,642 | |
| |
| | |
Net realized gain on investments | | | 10,263,423 | | | | 2,709,397 | |
Net realized loss on foreign currency transactions | | | (14,845) | | | | (35,259) | |
| |
Net realized gain | | | 10,248,578 | | | | 2,674,138 | |
| |
Net change in unrealized depreciation of investments | | | (154,933,695) | | | | (62,880,530) | |
Net change in unrealized appreciation on translation of assets and liabilities denominated in foreign currencies | | | 78,727 | | | | 11,371 | |
| |
Net change in unrealized depreciation | | | (154,854,968) | | | | (62,869,159) | |
| |
NET REALIZED AND UNREALIZED LOSS ON INVESTMENTS | | | (144,606,390) | | | | (60,195,021) | |
| |
NET DECREASE IN NET ASSETS RESULTING FROM OPERATIONS | | $ | (126,257,585) | | | $ | (53,551,379) | |
| |
| | |
See Accompanying Notes to Financial Statements. |
| 20 | | www.vulcanvaluepartners.com |
| | |
| Vulcan Value Partners Fund | | Statements of Changes in Net Assets |
| | | | | | | | |
| | | For the Year Ended April 30, 2016 | | | For the Year Ended April 30, 2015 | |
| |
OPERATIONS: | | | | | | | | |
Net investment income | | $ | 18,348,805 | | | $ | 14,655,614 | |
Net realized gain | | | 10,248,578 | | | | 98,001,413 | |
Net change in unrealized appreciation/(depreciation) | | | (154,854,968) | | | | 79,272,468 | |
| |
Net increase/(decrease) in net assets resulting from operations | | | (126,257,585) | | | | 191,929,495 | |
| |
| | |
DISTRIBUTIONS TO SHAREHOLDERS (Note 3): | | | | | | | | |
From net investment income | | | (12,104,797) | | | | (12,786,089) | |
From net realized gains on investments | | | (119,403,152) | | | | (68,848,994) | |
| |
Net decrease in net assets from distributions | | | (131,507,949) | | | | (81,635,083) | |
| |
| | |
SHARE TRANSACTIONS (Note 5): | | | | | | | | |
Proceeds from sales of shares | | | 572,087,701 | | | | 787,552,477 | |
Issued to shareholders in reinvestment of distributions | | | 108,659,155 | | | | 66,389,769 | |
Cost of shares redeemed, net of redemption fees | | | (665,005,259) | | | | (123,961,345) | |
| |
Net increase from share transactions | | | 15,741,597 | | | | 729,980,901 | |
| |
| | |
Net increase/(decrease) in net assets | | | (242,023,937) | | | | 840,275,313 | |
| |
| | |
NET ASSETS: | | | | | | | | |
Beginning of year | | | 1,770,104,367 | | | | 929,829,054 | |
| |
End of year* | | $ | 1,528,080,430 | | | $ | 1,770,104,367 | |
| |
| | |
*Includes accumulated net investment income of: | | $ | 9,450,857 | | | $ | 3,221,845 | |
| | |
See Accompanying Notes to Financial Statements. |
| Annual Report | April 30, 2016 | | 21 |
| | |
| Statements of Changes in Net Assets | | Vulcan Value Partners Small Cap Fund |
| | | | | | | | |
| | | For the Year Ended April 30, 2016 | | | For the Year Ended April 30, 2015 | |
| |
OPERATIONS: | | | | | | | | |
Net investment income | | $ | 6,643,642 | | | $ | 5,831,901 | |
Net realized gain | | | 2,674,138 | | | | 75,800,547 | |
Net change in unrealized appreciation/(depreciation) | | | (62,869,159) | | | | 22,946,461 | |
| |
Net increase/(decrease) in net assets resulting from operations | | | (53,551,379) | | | | 104,578,909 | |
| |
| | |
DISTRIBUTIONS TO SHAREHOLDERS (Note 3): | | | | | | | | |
From net investment income | | | (3,951,718) | | | | (5,724,213) | |
From net realized gains on investments | | | (63,400,984) | | | | (94,956,634) | |
| |
Net decrease in net assets from distributions | | | (67,352,702) | | | | (100,680,847) | |
| |
| | |
SHARE TRANSACTIONS (Note 5): | | | | | | | | |
Proceeds from sales of shares | | | 333,969,377 | | | | 286,238,909 | |
Issued to shareholders in reinvestment of distributions | | | 55,331,982 | | | | 84,059,577 | |
Cost of shares redeemed, net of redemption fees | | | (254,512,720) | | | | (307,320,451) | |
| |
Net increase from share transactions | | | 134,788,639 | | | | 62,978,035 | |
| |
| | |
Net increase in net assets | | | 13,884,558 | | | | 66,876,097 | |
| |
| | |
NET ASSETS: | | | | | | | | |
Beginning of year | | | 1,133,122,360 | | | | 1,066,246,263 | |
| |
End of year* | | $ | 1,147,006,918 | | | $ | 1,133,122,360 | |
| |
| | |
*Includes accumulated net investment income/(loss) of: | | $ | 2,656,416 | | | $ | – | |
| | |
See Accompanying Notes to Financial Statements. |
| 22 | | www.vulcanvaluepartners.com |
Intentionally Left Blank
|
| Financial Highlights |
| For a share outstanding throughout the years presented. |
|
|
NET ASSET VALUE, BEGINNING OF PERIOD |
|
INCOME/(LOSS) FROM OPERATIONS: |
|
Net investment income(a) |
Net realized and unrealized gain/(loss) on investments |
|
Total from investment operations |
|
|
LESS DISTRIBUTIONS TO SHAREHOLDERS: |
From net investment income |
From net realized gains on investments |
|
Total distributions |
|
|
Redemption fees added to paid-in capital |
|
Increase/(decrease) in net asset value |
|
NET ASSET VALUE, END OF YEAR |
|
|
Total return |
|
RATIOS AND SUPPLEMENTAL DATA: |
Net assets, end of year (000’s) |
|
Ratio of expenses to average net assets without fee waivers/reimbursements |
Ratio of expenses to average net assets including fee waivers/reimbursements |
Net investment income to average net assets including fee waivers/reimbursements |
|
Portfolio turnover rate |
| (a) | Per share numbers have been calculated using the average shares method. |
| (b) | Less than $0.005 per share. |
| | |
See Accompanying Notes to Financial Statements. |
| 24 | | www.vulcanvaluepartners.com |
|
| Vulcan Value Partners Fund |
|
| | | | | | | | | | | | | | | | | | | | | | | |
For the Year Ended April 30, 2016 | | For the Year Ended April 30, 2015 | | For the Year Ended April 30, 2014 | | For the Year Ended April 30, 2013 | | For the Year Ended April 30, 2012 |
| | $ | 19.97 | | | | $ | 18.20 | | | | $ | 15.28 | | | | $ | 13.03 | | | | $ | 11.66 | |
| | | | | | | | | | | | | | | | | | | | | | | | |
| | | | |
| | | 0.20 | | | | | 0.22 | | | | | 0.14 | | | | | 0.15 | | | | | 0.02 | |
| | | (1.51) | | | | | 2.77 | | | | | 3.33 | | | | | 2.35 | | | | | 1.45 | |
| | | (1.31) | | | | | 2.99 | | | | | 3.47 | | | | | 2.50 | | | | | 1.47 | |
| | | | |
| | | | | | | | | | | | | | | | | | | | | | | | |
| | | (0.13) | | | | | (0.17) | | | | | (0.11) | | | | | (0.12) | | | | | (0.01) | |
| | | (1.36) | | | | | (1.05) | | | | | (0.44) | | | | | (0.13) | | | | | (0.09) | |
| | | (1.49) | | | | | (1.22) | | | | | (0.55) | | | | | (0.25) | | | | | (0.10) | |
| | | | |
| | | 0.00 | (b) | | | | 0.00 | (b) | | | | 0.00 | (b) | | | | 0.00 | (b) | | | | 0.00 | (b) |
| | | (2.80) | | | | | 1.77 | | | | | 2.92 | | | | | 2.25 | | | | | 1.37 | |
| | $ | 17.17 | | | | $ | 19.97 | | | | $ | 18.20 | | | | $ | 15.28 | | | | $ | 13.03 | |
| | | | |
| | | | |
| | | (6.49%) | | | | | 16.61% | | | | | 22.84% | | | | | 19.33% | | | | | 12.73% | |
| | | | |
| | | | | | | | | | | | | | | | | | | | | | | | |
| | $ | 1,528,080 | | | | $ | 1,770,104 | | | | $ | 929,829 | | | | $ | 447,297 | | | | $ | 125,087 | |
| | | | |
| | | 1.08% | | | | | 1.08% | | | | | 1.09% | | | | | 1.18% | | | | | 1.51% | |
| | | 1.08% | | | | | 1.08% | | | | | 1.09% | | | | | 1.18% | | | | | 1.50% | |
| | | 1.10% | | | | | 1.12% | | | | | 0.80% | | | | | 1.06% | | | | | 0.16% | |
| | | | |
| | | 85% | | | | | 64% | | | | | 56% | | | | | 24% | | | | | 49% | |
| | |
| Annual Report | April 30, 2016 | | 25 |
| | |
| Financial Highlights | | |
| For a share outstanding throughout the years presented. | | |
|
NET ASSET VALUE, BEGINNING OF PERIOD |
INCOME/(LOSS) FROM OPERATIONS: |
|
Net investment income/(loss)(a) |
Net realized and unrealized gain/(loss) on investments |
Total from investment operations |
|
LESS DISTRIBUTIONS TO SHAREHOLDERS: |
From net investment income |
From net realized gains on investments |
Total distributions |
|
Redemption fees added to paid-in capital |
Increase/(decrease) in net asset value |
NET ASSET VALUE, END OF YEAR |
| |
|
Total return |
|
RATIOS AND SUPPLEMENTAL DATA: |
Net assets, end of year (000’s) |
|
Ratio of expenses to average net assets without fee waivers/reimbursements |
Ratio of expenses to average net assets including fee waivers/reimbursements |
|
Net investment income/(loss) to average net assets including fee waivers/reimbursements |
|
Portfolio turnover rate |
| (a) | Per share numbers have been calculated using the average shares method. |
| (b) | Less than $0.005 per share. |
| | |
See Accompanying Notes to Financial Statements. |
| 26 | | www.vulcanvaluepartners.com |
Vulcan Value Partners Small Cap Fund
| | | | | | | | | | | | | | | | | | | | | | | |
For the Year
Ended April 30,
2016 | | For the Year
Ended April 30,
2015 | | For the Year
Ended April 30,
2014 | | For the Year
Ended April 30,
2013 | | For the Year
Ended April 30,
2012 |
| | $ | 18.61 | | | | $ | 18.74 | | | | $ | 16.97 | | | | $ | 13.18 | | | | $ | 13.72 | |
| | | | | | | | | | | | | | | | | | | | | | | | |
| | | | |
| | | 0.10 | | | | | 0.10 | | | | | (0.01) | | | | | 0.03 | | | | | 0.02 | |
| | | (1.05) | | | | | 1.77 | | | | | 2.76 | | | | | 3.91 | | | | | 0.17 | |
| | | (0.95) | | | | | 1.87 | | | | | 2.75 | | | | | 3.94 | | | | | 0.19 | |
| | | | |
| | | | | | | | | | | | | | | | | | | | | | | | |
| | | (0.06) | | | | | (0.11) | | | | | – | | | | | (0.06) | | | | | – | |
| | | (1.02) | | | | | (1.89) | | | | | (0.98) | | | | | (0.09) | | | | | (0.73) | |
| | | (1.08) | | | | | (2.00) | | | | | (0.98) | | | | | (0.15) | | | | | (0.73) | |
| | | | |
| | | 0.00 | (b) | | | | 0.00 | (b) | | | | 0.00 | (b) | | | | 0.00 | (b) | | | | 0.00 | (b) |
| | | (2.03) | | | | | (0.13) | | | | | 1.77 | | | | | 3.79 | | | | | (0.54) | |
| | $ | 16.58 | | | | $ | 18.61 | | | | $ | 18.74 | | | | $ | 16.97 | | | | $ | 13.18 | |
| | | | | | | | | | | | | | | | | | | | | | | | |
| | | | |
| | | (5.04%) | | | | | 10.74% | | | | | 16.11% | | | | | 30.07% | | | | | 2.10% | |
| | | | |
| | $ | 1,147,00 | 7 | | | $ | 1,133,12 | 2 | | | $ | 1,066,24 | 6 | | | $ | 425,152 | | | | $ | 40,103 | |
| | | | |
| | | 1.25% | | | | | 1.26% | | | | | 1.30% | | | | | 1.38% | | | | | 1.86% | |
| | | 1.25% | | | | | 1.25% | | | | | 1.25% | | | | | 1.28% | | | | | 1.50% | |
| | | | |
| | | 0.61% | | | | | 0.56% | | | | | (0.05%) | | | | | 0.21% | | | | | 0.15% | |
| | | | |
| | | | | | | | | | | | | | | | | | | | | | | | |
| | | | |
| | | 80% | | | | | 73% | | | | | 70% | | | | | 57% | | | | | 57% | |
| | |
| Annual Report | April 30, 2016 | | 27 |
Notes to Financial Statements
April 30, 2016
1. ORGANIZATION
Financial Investors Trust (the “Trust”) is organized as a Delaware statutory trust and is registered as an open-end management investment company under the Investment Company Act of 1940, as amended (“1940 Act”). As of April 30, 2016, the Trust had 34 registered funds. This annual report describes the Vulcan Value Partners Fund and Vulcan Value Partners Small Cap Fund (each a “Fund” and collectively, the “Funds”). The Funds seek to achieve long-term capital appreciation. The Funds are classified as a non-diversified investment company for purpose of the 1940 Act.
2. SIGNIFICANT ACCOUNTING POLICIES
The accompanying financial statements were prepared in accordance with accounting principles generally accepted in the United States of America (“U.S. GAAP”). The preparation of financial statements in conformity with U.S. GAAP requires management to make certain estimates and assumptions that affect the reported amounts of assets and liabilities and disclosures of contingent assets and liabilities at the date of the financial statements and the reported amounts of revenue and expenses during the period. Actual results could differ from those estimates. The Funds are considered an investment company for financial reporting purposes under U.S. GAAP. The following is a summary of significant accounting policies consistently followed by the Funds in preparation of their financial statements.
Investment Valuation: The Funds generally value their securities based on market prices determined at the close of regular trading on the New York Stock Exchange (“NYSE”), normally 4:00 p.m. Eastern Time, on each day the NYSE is open for trading.
For equity securities and mutual funds that are traded on an exchange, the market price is usually the closing sale or official closing price on that exchange. In the case of equity securities not traded on an exchange, or if such closing prices are not otherwise available, the securities are valued at the mean of the most recent bid and ask prices on such day. Redeemable securities issued by open-end registered investment companies are valued at the investment company’s applicable net asset value.
The market price for debt obligations is generally the price supplied by an independent third-party pricing service approved by the Board of Trustees (the “Board”), which may use a matrix, formula or other objective method that takes into consideration quotations from dealers, market transactions in comparable investments, market indices and yield curves. If vendors are unable to supply a price, or if the price supplied is deemed to be unreliable, the market price may be determined using quotations received from one or more broker–dealers that make a market in the security.
When such prices or quotations are not available, or when Vulcan Value Partners, LLC (“Vulcan” or the “Adviser”) believes that they are unreliable, securities may be priced using fair value procedures approved by the Board.
| | |
| 28 | | www.vulcanvaluepartners.com |
| | |
| | | Notes to Financial Statements |
| | April 30, 2016 |
Fair Value Measurements: A three-tier hierarchy has been established to classify fair value measurements for disclosure purposes. Inputs refer broadly to the assumptions that market participants would use in pricing the asset or liability, including assumptions about risk. Inputs may be observable or unobservable. Observable inputs are inputs that reflect the assumptions market participants would use in pricing the asset or liability that are developed based on market data obtained from sources independent of the reporting entity. Unobservable inputs are inputs that reflect the reporting entity’s own assumptions about the assumptions market participants would use in pricing the asset or liability that are developed based on the best information available. Various inputs are used in determining the value of each Fund’s investments as of the reporting period end. The designated input levels are not necessarily an indication of the risk or liquidity associated with these investments. These inputs are categorized in the following hierarchy under applicable financial accounting standards:
| | |
Level 1 – | | Unadjusted quoted prices in active markets for identical investments, unrestricted assets or liabilities that the Funds have the ability to access at the measurement date; |
Level 2 – | | Quoted prices which are not active, quoted prices for similar assets or liabilities in active markets or inputs other than quoted prices that are observable (either directly or indirectly) for substantially the full term of the asset or liability; and |
Level 3 – | | Significant unobservable prices or inputs (including the Funds’ own assumptions in determining the fair value of investments) where there is little or no market activity for the asset or liability at the measurement date. |
The following is a summary of each input used to value each Fund’s investments as of April 30, 2016.
Vulcan Value Partners Fund:
| | | | | | | | | | | | | | | | |
| | | | | | Level 2 - Other | | | Level 3 - | | | | |
| | | Level 1 - | | | Significant | | | Significant | | | | |
| Investments in Securities at | | Unadjusted | | | Observable | | | Unobservable | | | | |
| Value | | Quoted Prices | | | Inputs | | | Inputs | | | Total | |
| |
Common Stocks(a) | | $ | 1,468,589,386 | | | $ | – | | | $ | – | | | $ | 1,468,589,386 | |
Short Term Investments | | | 46,988,436 | | | | – | | | | – | | | | 46,988,436 | |
| |
TOTAL | | $ | 1,515,577,822 | | | $ | – | | | $ | – | | | $ | 1,515,577,822 | |
| |
Vulcan Value Partners Small Cap Fund:
| | | | | | | | | | | | | | | | |
| | | | | | Level 2 - Other | | | Level 3 - | | | | |
| | | Level 1 - | | | Significant | | | Significant | | | | |
| Investments in Securities at | | Unadjusted | | | Observable | | | Unobservable | | | | |
| Value | | Quoted Prices | | | Inputs | | | Inputs | | | Total | |
| |
Common Stocks(a) | | $ | 905,346,512 | | | $ | – | | | $ | – | | | $ | 905,346,512 | |
Short Term Investments | | | 231,550,483 | | | | – | | | | – | | | | 231,550,483 | |
| |
TOTAL | | $ | 1,136,896,995 | | | $ | – | | | $ | – | | | $ | 1,136,896,995 | |
| |
| (a) | For detailed descriptions, see the accompanying Statements of Investments |
| | |
| Annual Report | April 30, 2016 | | 29 |
| | |
| Notes to Financial Statements | | |
| April 30, 2016 | | |
The Funds recognize transfers between levels as of the end of period. For the year ended April 30, 2016, the Vulcan Small Cap Funds did have transfers between Level 1 and Level 2. The below transfers from Level 2 to Level 1 were due to the Funds’ ability to obtain a closing market price. For the year ended April 30, 2016, the Funds did not have any securities that used significant unobservable inputs (Level 3) in determining fair value.
Transfers into and out of Levels 1 and 2 as of April 30, 2016 were as follows:
| | | | | | | | | | | | | | | | |
| | | Level 1 | | | Level 2 | |
| Vulcan Value | | | | | | | | | | | | |
| Partners Small | | | | | | | | | | | | |
| Cap Fund | | Transfer In | | | Transfers (Out) | | | Transfer In | | | Transfers (Out) | |
| |
Common Stocks | | $ | 69,062,625 | | | $ | – | | | $ | – | | | $ | (69,062,625) | |
| |
Total | | $ | 69,062,625 | | | $ | – | | | $ | – | | | $ | (69,062,625) | |
| |
Investment Transactions and Investment Income: Investment transactions are accounted for on the date the investments are purchased or sold (trade date). Realized gains and losses from investment transactions are reported on an identified cost basis, which is the same basis the Funds use for federal income tax purposes. Interest income, which includes accretion of discounts and amortization of premiums, is accrued and recorded as earned. Dividend income is recognized on the ex-dividend date or for certain foreign securities, as soon as information is available to the Funds. All of the realized and unrealized gains and losses and net investment income, are allocated daily to each class in proportion to its average daily net assets.
Foreign Securities: The Funds may directly purchase securities of foreign issuers. Investing in securities of foreign issuers involves special risks not typically associated with investing in securities of U.S. issuers. The risks include possible reevaluation of currencies, the inability to repatriate foreign currency, less complete financial information about companies and possible future adverse political and economic developments. Moreover, securities of many foreign issuers and their markets may be less liquid and their prices more volatile than those of securities of comparable U.S. issuers.
Foreign Currency Translation: The books and records of the Fund are maintained in U.S. dollars. Investment valuations and other assets and liabilities initially expressed in foreign currencies are converted each business day into U.S. dollars based upon current exchange rates. Prevailing foreign exchange rates may generally be obtained at the close of the NYSE (normally, 4:00 p.m. Eastern Time). The portion of realized and unrealized gains or losses on investments due to fluctuations in foreign currency exchange rates is not separately disclosed and is included in realized and unrealized gains or losses on investments, when applicable.
Trust Expenses: Some expenses of the Trust can be directly attributed to the Funds. Expenses which cannot be directly attributed are apportioned among all funds in the Trust based on average net assets of each fund.
Fund Expenses: Expenses that are specific to a Fund are charged directly to that Fund.
| | |
| 30 | | www.vulcanvaluepartners.com |
| | |
| | | Notes to Financial Statements |
| | April 30, 2016 |
Federal Income Taxes: Each Fund complies with the requirements under Subchapter M of the Internal Revenue Code of 1986, as amended, applicable to regulated investment companies and intends to distribute substantially all of its net taxable income and net capital gains, if any, each year so that it will not be subject to excise tax on undistributed income and gains. The Funds are not subject to income taxes to the extent such distributions are made.
As of and during the year ended April 30, 2016, the Funds did not have a liability for any unrecognized tax benefits. The Funds file U.S. federal, state, and local tax returns as required. The Fund’s tax returns are subject to examination by the relevant tax authorities until expiration of the applicable statute of limitations, which is generally three years after the filing of the tax return for federal purposes and four years for most state returns. Tax returns for open years have incorporated no uncertain tax positions that require a provision for income taxes.
Distributions to Shareholders: Each Fund normally pays dividends and distributes capital gains, if any, on an annual basis. Income dividend distributions are derived from dividends and other income each Fund receives from its investments, including short-term capital gains. Long term capital gain distributions are derived from gains realized when each Fund sells a security it has owned for more than a year. Each Fund may make additional distributions and dividends at other times if the portfolio manager believes doing so may be necessary for each Fund to avoid or reduce taxes.
3. TAX BASIS INFORMATION:
Reclassifications: As of April 30, 2016, permanent differences in book and tax accounting were reclassified. These differences had no effect on net assets and were primarily attributed to foreign currency reclassifications and book/tax distribution differences. The reclassifications were as follows:
| | | | | | | | | | | | |
| | | | | | Accumulated Net | | | Accumulated Net | |
| | | | | | Investment | | | Realized Loss on | |
| Fund | | Paid-in Capital | | | Income | | | Investments | |
| |
Vulcan Value Partners Fund | | $ | – | | | $ | (14,996) | | | $ | 14,996 | |
Vulcan Value Partners Small Cap Fund | | | – | | | | (35,508) | | | | 35,508 | |
Tax Basis of Investments: As of April 30, 2016, the aggregate cost of investments, gross unrealized appreciation/ (depreciation) and net unrealized appreciation for federal tax purposes was as follows:
| | | | | | | | |
| | | Vulcan Value Partners | | | Vulcan Value Partners | |
| | | Fund | | | Small Cap Fund | |
| |
Gross appreciation | | | | | | | | |
(excess of value over tax cost) | | $ | 186,735,663 | | | $ | 102,761,060 | |
Gross depreciation | | | | | | | | |
(excess of tax cost over value) | | | (141,636,640) | | | | (74,165,067) | |
Net appreciation of foreign currency and derivatives | | | 78,727 | | | | 11,371 | |
| |
Net unrealized appreciation | | $ | 45,177,750 | | | $ | 28,607,364 | |
| |
Cost of investments for income tax purposes | | $ | 1,470,478,799 | | | $ | 1,108,301,002 | |
| |
| | |
| Annual Report | April 30, 2016 | | 31 |
| | |
| Notes to Financial Statements | | |
| April 30, 2016 | | |
Components of Earnings: As of April 30, 2016, components of distributable earnings were as follows:
| | | | | | | | |
| | | | | | Vulcan Value | |
| | | Vulcan Value | | | Partners Small Cap | |
| | | Partners Fund | | | Fund | |
| |
Undistributed ordinary income | | $ | 9,450,857 | | | $ | 2,656,416 | |
Accumulated capital losses | | | (17,302,140) | | | | (42,411,939) | |
Net unrealized appreciation on investments | | | 45,177,750 | | | | 28,607,364 | |
| |
Total | | $ | 37,326,467 | | | $ | (11,148,159) | |
| |
As of April 30, 2016, the Vulcan Value Partners Fund and the Vulcan Value Small Cap Fund elect to defer to the period ending April 30, 2017, capital losses recognized during the period November 1, 2015 to April 30, 2016 in the amounts of $17,302,140 and $42,411,939, respectively.
Capital Losses: As of April 30, 2016, the Funds have no accumulated capital loss carryforwards.
Tax Basis of Distributions to Shareholders: The character of distributions made during the year from net investment income or net realized gains may differ from its ultimate characterization for federal income tax purposes. Also, due to the timing of dividend distributions, the fiscal year in which amounts are distributed may differ from the fiscal year in which the income or realized gain were recorded by each Fund.
The tax character of distributions paid by the Funds for the fiscal years ended April 30, 2016 and April 30, 2015 were as follows:
| | | | | | | | |
| | | | | | Long-Term Capital | |
| | | Ordinary Income | | | Gain | |
| |
2016 | | | | | | | | |
Vulcan Value Partners Fund | | $ | 48,548,716 | | | $ | 82,959,233 | |
Vulcan Value Partners Small Cap Fund | | | 10,661,578 | | | | 56,691,124 | |
| | |
| | | | | | Long-Term Capital | |
| | | Ordinary Income | | | Gain | |
| |
2015 | | | | | | | | |
Vulcan Value Partners Fund | | $ | 48,380,968 | | | $ | 33,254,115 | |
Vulcan Value Partners Small Cap Fund | | | 64,217,648 | | | | 36,463,199 | |
| | | | | | | | |
| | | | | | | | |
| | | | | | | | |
| |
| | |
| 32 | | www.vulcanvaluepartners.com |
| | |
| | | Notes to Financial Statements |
| | April 30, 2016 |
4. SECURITIES TRANSACTIONS
The cost of purchases and proceeds from sales of securities (excluding short-term securities) during the year ended April 30, 2016 were as follows:
| | | | | | | | |
| | | | | | Proceeds From Sales of | |
| Fund | | Purchase of Securities | | | Securities | |
| |
Vulcan Value Partners Fund | | $ | 1,373,453,895 | | | $ | 1,528,274,216 | |
Vulcan Value Partners Small Cap Fund | | | 780,103,038 | | | | 822,632,509 | |
5. CAPITAL SHARE TRANSACTIONS
The capitalization of the Trust consists of an unlimited number of shares of beneficial interest with no par value per share. Holders of the shares of the Funds of the Trust have one vote for each share held and a proportionate fraction of a vote for each fractional share. All shares issued and outstanding are fully paid and are transferable and redeemable at the option of the shareholder. Purchasers of the shares do not have any obligation to make payments to the Trust or its creditors solely by reason of the purchasers’ ownership of the shares. Shares have no pre-emptive rights.
Shares redeemed within 90 days of purchase may incur a 2% short-term redemption fee deducted from the redemption amount. The Vulcan Value Partners Fund and the Vulcan Value Partners Small Cap Fund retained $100,356 and $10,334, respectively, for the year ended April 30, 2016, and $22,469 and $17,712, respectively, for the year ended April 30, 2015, which is reflected in the “Cost of shares redeemed, net of redemption fees” in the Statements of Changes in Net Assets.
Transactions in shares of capital stock for the dates listed below were as follows:
Vulcan Value Partners Fund
| | | | | | | | |
| | | For the Year Ended | | | For the Year Ended | |
| | | April 30, 2016 | | | April 30, 2015 | |
| |
Shares Sold | | | 32,133,506 | | | | 40,549,413 | |
Shares Issued in Reinvestment of Dividends | | | 6,372,007 | | | | 3,392,456 | |
Less Shares Redeemed | | | (38,169,154) | | | | (6,399,329) | |
| |
Net Increase | | | 336,359 | | | | 37,542,540 | |
| |
Vulcan Value Partners Small Cap Fund
| | | | | | | | |
| | | For the Year Ended | | | For the Year Ended | |
| | | April 30, 2016 | | | April 30, 2015 | |
| |
Shares Sold | | | 20,302,249 | | | | 15,540,687 | |
Shares Issued in Reinvestment of Dividends | | | 3,358,435 | | | | 4,815,937 | |
Less Shares Redeemed | | | (15,350,234) | | | | (16,362,540) | |
| |
Net Increase | | | 8,310,450 | | | | 3,994,084 | |
| |
| | |
| Annual Report | April 30, 2016 | | 33 |
| | |
| Notes to Financial Statements | | |
| April 30, 2016 | | |
6. MANAGEMENT AND RELATED-PARTY TRANSACTIONS
The Adviser, subject to the authority of the Board, is responsible for the overall management and administration of the Funds’ business affairs. The Adviser manages the investments of the Funds in accordance with each Fund’s investment objective, policies and limitations and investment guidelines established jointly by the Adviser and the Board. Pursuant to the Investment Advisory Agreement (the “Advisory Agreement”), the Funds pay the Adviser an annual management fee of 1.00% and 1.15% for Vulcan Value Partners Fund and Vulcan Value Partners Small Cap Fund, respectively, based on each Fund’s average daily net assets. The management fee is paid on a monthly basis.
The Adviser has contractually agreed to limit the Fund’s total annual fund operating expenses (exclusive of Acquired Fund Fees and Expenses, brokerage expenses, interest expense, taxes and extraordinary expenses) to 1.25% of each Fund’s average daily net assets. This agreement (the “Expense Agreement”) is in effect from June 10, 2015 through August 31, 2016. The Adviser will be permitted to recover, on a class-by-class basis, expenses it has borne through the Expense Agreement to the extent that the Funds’ expenses in later periods fall below the expense cap in effect at the time of waiver or reimbursement. Notwithstanding the foregoing, the Funds will not be obligated to pay any such fees and expenses more than three years after the end of the fiscal year in which the fees or expenses were foregone or reimbursed. The Adviser may not discontinue or modify this waiver prior to August 31, 2016 without the approval by the Funds’ Board of Trustees.
For the year ended April 30, 2016, the fee waivers and/or reimbursements were as follows:
| | | | |
| Fund | | Recoupment of Previously
Waived Fees by Adviser | |
Vulcan Value Partners Fund | | $ | – | |
Vulcan Value Partners Small Cap Fund | | | 20,833 | |
As of April 30, 2016, the balances of recoupable expenses for each Fund were as follows:
| | | | | | | | | | | | | | | | |
| Fund | | Expires 2016 | | | Expires 2017 | | | Expires 2018 | | | Total | |
Vulcan Value Partners Fund | | $ | – | | | $ | – | | | $ | – | | | $ | – | |
Vulcan Value Partners Small Cap Fund | | | 161,158 | | | | 400,224 | | | | 79,989 | | | | 641,371 | |
Fund Administrator Fees and Expenses: ALPS Fund Services, Inc. (“ALPS”) serves as administrator to the Funds and the Funds have agreed to pay expenses incurred in connection with their administrative activities. Pursuant to an Administration Agreement, ALPS provides operational services to the Funds including, but not limited to fund accounting and fund administration and generally assist in each Fund’s operations. Officers of the Trust are employees of ALPS. The Funds’ administration fee is accrued on a daily basis and paid monthly. Administration fees paid by the Funds for the year ended April 30, 2016 are disclosed in the Statements of Operations.
ALPS is reimbursed by the Funds for certain out-of-pocket expenses.
| | |
| 34 | | www.vulcanvaluepartners.com |
| | |
| | | Notes to Financial Statements |
| | April 30, 2016 |
Transfer Agent: ALPS serves as transfer, dividend paying and shareholder servicing agent for the Funds. ALPS receives an annual minimum fee, a fee based upon the number of shareholder accounts, and is also reimbursed by the Funds for certain out-of-pocket expenses. Transfer agent fees paid by the Funds for the year ended April 30, 2016 are disclosed in the Statement of Operations.
Compliance Services: ALPS provides services that assist the Trust’s chief compliance officer in monitoring and testing the policies and procedures of the Trust in conjunction with requirements under Rule 38a-1 under the 1940 Act and receives an annual base fee. ALPS is reimbursed for certain out-of-pocket expenses by the Funds. Vulcan pays this fee on behalf of the Funds.
Principal Financial Officer: ALPS Fund Services, Inc. (“ALPS” and the “Administrator”) (an affiliate of ADI) receives an annual fee for providing principal financial officer services to the Funds. Principal financial officer fees paid by the Fund for the year ended April 30, 2016 are disclosed in the Statement of Operations.
Distributor: ALPS Distributors, Inc. (“ADI” or the “Distributor”) (an affiliate of ALPS Fund Services, Inc.) acts as the distributor of each Fund’s shares pursuant to a Distribution Agreement with the Trust. Shares are sold on a continuous basis by ADI as agent for the Funds, and ADI has agreed to use its best efforts to solicit orders for the sale of each Fund’s shares, although it is not obliged to sell any particular amount of shares. ADI is not entitled to any compensation for its services as Distributor. ADI is registered as a broker-dealer with the U.S. Securities and Exchange Commission.
Certain intermediaries may charge networking, omnibus account or other administrative fees with respect to transactions in shares of the Funds. Transactions may be processed through the National Securities Clearing Corporation (“NSCC”) or similar systems or processed on a manual basis. These fees are paid by the Funds to the Distributor, which uses such fees to reimburse intermediaries. In the event an intermediary receiving payments from the Distributor on behalf of the Funds converts from a networking structure to an omnibus account structure or otherwise experiences increased costs, fees borne by the Funds may increase. Fees are disclosed on the Statements of Operations as “Delegated transfer agent equivalent services fees”.
7. INDEMNIFICATIONS
Under the Trust’s organizational documents, its Officers and Trustees are indemnified against certain liability arising out of the performance of their duties to the Trust. Additionally, in the normal course of business, the Trust enters into contracts with service providers that may contain general indemnification clauses which may permit indemnification to the extent permissible under applicable law. The Trust’s maximum exposure under these arrangements is unknown, as this would involve future claims that may be made against the Trust that have not yet occurred.
| | |
| Annual Report | April 30, 2016 | | 35 |
Report of Independent Registered Public Accounting Firm
To the Shareholders and Board of Trustees of Financial Investors Trust:
We have audited the accompanying statements of assets and liabilities, including the statements of investments, of Vulcan Value Partners Fund and Vulcan Value Partners Small Cap Fund (the “Funds”), two of the portfolios constituting Financial Investors Trust, as of April 30, 2016, and the related statements of operations for the year then ended, the statements of changes in net assets for each of the two years in the period then ended, and the financial highlights for each of the five years in the period then ended. These financial statements and financial highlights are the responsibility of the Funds’ management. Our responsibility is to express an opinion on these financial statements and financial highlights based on our audits.
We conducted our audits in accordance with the standards of the Public Company Accounting Oversight Board (United States). Those standards require that we plan and perform the audit to obtain reasonable assurance about whether the financial statements and financial highlights are free of material misstatement. The Funds are not required to have, nor were we engaged to perform, an audit of their internal control over financial reporting. Our audits included consideration of internal control over financial reporting as a basis for designing audit procedures that are appropriate in the circumstances, but not for the purpose of expressing an opinion on the effectiveness of the Funds’ internal control over financial reporting. Accordingly, we express no such opinion. An audit also includes examining, on a test basis, evidence supporting the amounts and disclosures in the financial statements, assessing the accounting principles used and significant estimates made by management, as well as evaluating the overall financial statement presentation. Our procedures included confirmation of securities owned as of April 30, 2016, by correspondence with the custodian and brokers; when replies were not received from brokers, we performed other auditing procedures. We believe that our audits provide a reasonable basis for our opinion.
In our opinion, the financial statements and financial highlights referred to above present fairly, in all material respects, the financial position of Vulcan Value Partners Fund and Vulcan Value Partners Small Cap Fund of Financial Investors Trust as of April 30, 2016, the results of their operations for the year then ended, the changes in their net assets for each of the two years in the period then ended, and the financial highlights for each of the five years in the period then ended, in conformity with accounting principles generally accepted in the United States of America.
DELOITTE & TOUCHE LLP
Denver, Colorado
June 28, 2016
| | |
| 36 | | www.vulcanvaluepartners.com |
Disclosure Regarding Approval of Fund Advisory Agreements
April 30, 2016 (Unaudited)
On December 15, 2015, the Trustees met in person to discuss, among other things, the approval of the investment advisory agreement between the Trust and Vulcan Value Partners, LLC (the “Adviser”) (the “Investment Advisory Agreement”), in accordance with Section 15(c) of the Investment Company Act of 1940, as amended. The Independent Trustees met with independent legal counsel during executive session and discussed the Investment Advisory Agreement and other related materials.
In renewing and approving the Investment Advisory Agreement with the Adviser, the Trustees, including the Independent Trustees, considered the following factors with respect to the Vulcan Value Partners Small Cap Fund and Vulcan Value Partners Fund (the “Vulcan Funds”):
Investment Advisory Fee Rate: The Trustees reviewed and considered the contractual annual advisory fee paid by the Trust, on behalf of the Vulcan Funds, to the Adviser of 1.00% of the Vulcan Value Partners Fund’s daily average net assets and 1.15% of the Vulcan Value Partners Small Cap Fund’s daily average net assets, in light of the extent and quality of the advisory services provided by the Adviser to the Vulcan Funds.
The Board received and considered information including a comparison of each of the Vulcan Fund’s contractual and actual advisory fees and overall expenses with those of funds in the peer groups and universes of funds provided by an independent provider of investment company data (the “Independent Data Provider”) and by the Adviser. The Trustees noted that the contractual advisory fee rates for both Vulcan Funds were above the Independent Data Provider peer group average and median contractual advisory fee rates.
Total Expense Ratios: Based on such information, the Trustees further reviewed and considered the total expense ratios (after waivers) of 1.08% for the Vulcan Value Partners Fund and 1.25% for the Vulcan Value Partners Small Cap Fund. The Trustees noted that each of the Vulcan Funds’ total expense ratios (after waivers) were above the Independent Data Provider peer group average and median total expense ratios (after waivers).
Nature, Extent and Quality of the Services under the Investment Advisory Agreement: The Trustees received and considered information regarding the nature, extent and quality of services to be provided to the Vulcan Funds under the Investment Advisory Agreement. The Trustees reviewed certain background materials supplied by the Adviser in its presentation, including its Form ADV.
The Trustees reviewed and considered the Adviser’s investment advisory personnel, its history as an asset manager and its performance and the amount of assets currently under management by the Adviser and its affiliated entities. The Trustees also reviewed the research and decision-making processes utilized by the Adviser, including the methods adopted to seek to achieve compliance with the investment objectives, policies and restrictions of the Vulcan Funds.
The Trustees considered the background and experience of the Adviser’s management in connection with the Vulcan Funds, including reviewing the qualifications, backgrounds and responsibilities of the management team primarily responsible for the day-to-day portfolio management of the Vulcan Funds and the extent of the resources devoted to research and analysis of actual and potential investments.
| | |
| Annual Report | April 30, 2016 | | 37 |
Disclosure Regarding Approval of Fund Advisory Agreements
April 30, 2016 (Unaudited)
The Trustees also reviewed, among other things, the Adviser’s insider trading policies and procedures and its Code of Ethics.
Performance: The Trustees reviewed performance information for each of the Vulcan Funds for the 3-month, 1-year, 3-year and 5-year periods ended September 30, 2015. That review included a comparison of each Vulcan Fund’s performance to the performance of a group of comparable funds selected by Independent Data Provider. The Trustees noted the performance of each Vulcan Fund was above its respective Independent Data Provider peer group average and median performance for the 1-year, 3-year and 5-year periods ended September 30, 2015. The Trustees also considered the Adviser’s discussion of each Vulcan Fund’s underlying portfolio diversification categories, its top contributors and top detractors, as well as the Adviser’s performance and reputation generally and its investment techniques, risk management controls and decision-making processes.
Comparable Accounts: The Trustees noted certain information provided by the Adviser regarding fees charged to its other clients utilizing a strategy similar to that employed by the Vulcan Fund.
Profitability: The Trustees received and considered a retrospective and projected profitability analysis prepared by the Adviser based on the fees payable under the Investment Advisory Agreement with respect to each Vulcan Fund. The Trustees considered the profits, if any, anticipated to be realized by the Adviser in connection with the operation of each Vulcan Fund. The Board then reviewed the Adviser’s audited calendar year 2013-2014 financial statements in order to analyze the financial condition and stability and profitability of the Adviser.
Economies of Scale: The Trustees considered whether economies of scale in the provision of services to the Vulcan Funds will be passed along to the shareholders under the proposed agreements.
Other Benefits to the Adviser: The Trustees reviewed and considered any other incidental benefits derived or to be derived by the Adviser from its relationship with the Vulcan Funds, including whether soft dollar arrangements were used.
In renewing the Adviser as the Vulcan Funds’ investment adviser and renewing the Investment Advisory Agreement and the fees charged under the Investment Advisory Agreement, the Trustees concluded that no single factor reviewed by the Trustees was identified by the Trustees to be determinative as the principal factor in whether to renew the Investment Advisory Agreement. Further, the Independent Trustees were advised by separate independent legal counsel throughout the process. The Trustees, including all of the Independent Trustees, concluded that:
| | ● | | each Vulcan Fund’s contractual advisory fee rate was above its Independent Data Provider peer group average and median contractual advisory fee rates; |
| | ● | | each Vulcan Fund’s total expense ratio (after waivers) was above its Independent Data Provider peer group average and median total expense ratios (after waivers); |
| | ● | | the nature, extent and quality of services rendered by the Adviser under the Investment Advisory Agreement with respect to the Vulcan Funds were adequate; |
| | |
| 38 | | www.vulcanvaluepartners.com |
Disclosure Regarding Approval of Fund Advisory Agreements
April 30, 2016 (Unaudited)
| | ● | | the performance of each Vulcan Fund was above its Independent Data Provider peer group performance for the 1-year, 3-year and 5-year periods ended September 30, 2015; |
| | ● | | bearing in mind the limitations of comparing different types of managed accounts and the different levels of service typically associated with such accounts, the fee structures applicable to the Adviser’s other clients employing a comparable strategy to one or more of the Vulcan Funds were not indicative of any unreasonableness with respect to the advisory fees proposed to be payable by the Vulcan Funds; |
| | ● | | the profit, if any, realized by the Adviser in connection with the operation of each Vulcan Fund is not unreasonable to such Vulcan Fund; and |
| | ● | | there were no material economies of scale or other incidental benefits accruing to the Adviser in connection with its relationship with the Vulcan Funds. |
Based on the Trustees’ deliberations and their evaluation of the information described above, the Trustees, including all of the Independent Trustees, concluded that the Adviser’s compensation for investment advisory services is consistent with the best interests of the Vulcan Funds and their shareholders.
| | |
| Annual Report | April 30, 2016 | | 39 |
Additional Information
April 30, 2016 (Unaudited)
1. FUND HOLDINGS
The Funds files their complete schedule of portfolio holdings with the Securities and Exchange Commission (the “SEC”) for the first and third quarters of each fiscal year on Form N-Q within 60 days after the end of the period. Copies of the Funds’ Form N-Q are available without charge on the SEC website at http://www.sec.gov. You may also review and copy the Form N-Q at the SEC’s Public Reference Room in Washington, DC. For more information about the operation of the Public Reference Room, please call the SEC at 1-800-SEC-0330.
2. FUND PROXY VOTING POLICIES, PROCEDURES AND SUMMARIES
The Funds’ policies and procedures used in determining how to vote proxies and information regarding how the Fund voted proxies relating to portfolio securities during the most recent prior 12-month period ending June 30 are available without charge, (1) upon request, by calling (toll-free) (866)-759-5679 and (2) on the SEC’s website at http://www.sec.gov.
3. TAX DESIGNATIONS
The Funds designate the following for federal income tax purposes for the calendar year ended December 31, 2015:
| | | | |
| | | Qualified Dividend
Income | | Dividend Received
Deduction |
Vulcan Value Partners Fund | | 58.67% | | 54.33% |
Vulcan Value Partners Small Cap Fund | | 100.00% | | 100.00% |
Pursuant to Section 852(b)(3) of the Internal Revenue Code, the Vulcan Value Partners Fund designated $82,959,233, and the Vulcan Value Partners Small Cap Fund designated $56,691,124 as long-term capital gain dividends.
| | |
| 40 | | www.vulcanvaluepartners.com |
Trustees and Officers
April 30, 2016 (Unaudited)
Additional information regarding the Fund’s trustees is included in the Statement of Additional Information, which can be obtained without charge by calling 888-288-1121.
INDEPENDENT TRUSTEES
| | | | | | | | | | |
Name, Address* & Year of Birth | | Position(s) Held with Fund | | Term of Office and Length of Time Served | | Principal Occupation(s) During Past 5 Years** | | Number of Funds in Fund Complex Overseen by Trustee*** | | Other Directorships
Held by Trustee
During Past
5 Years** |
Mary K. Anstine, 1940 | | Trustee | | Ms. Anstine was elected at a special meeting of shareholders held on March 21, 1997 and re-elected at a special meeting of shareholders held on August 7, 2009. | | Ms. Anstine was formerly an Executive Vice President of First Interstate Bank of Denver until 1994, President/Chief Executive Officer of HealthONE Alliance, Denver, Colorado, from 1994 to 2004, and has been retired since 2004. Ms. Anstine is also Trustee/Director of AV Hunter Trust and Colorado Uplift Board. Ms. Anstine was formerly a Director of the Trust Bank of Colorado (later purchased and now known as Northern Trust Bank), HealthONE and Denver Area Council of the Boy Scouts of America, and a member of the American Bankers Association Trust Executive Committee. | | 34 | | Ms. Anstine is a Trustee of ALPS ETF Trust (20 funds); ALPS Variable Investment Trust (9 funds); Reaves Utility Income Fund (1 fund); and Westcore Trust (12 funds). |
John R. Moran, Jr., 1930 | | Trustee | | Mr. Moran was elected at a special meeting of shareholders held on March 21, 1997 and re-elected at a special meeting of shareholders held on August 7, 2009. | | Mr. Moran formerly served as President and CEO of The Colorado Trust, a private foundation serving the health and hospital community in the state of Colorado, from 1991 to 2007. During his career as an attorney from 1958 to 1991, Mr. Moran was formerly a partner with the firm of Kutak Rock & Campbell in Denver, Colorado and a member of the Colorado House of Representatives. Currently, Mr. Moran is a member of the Treasurer’s Investment Advisory Committee for the University of Colorado. | | 34 | | None. |
| | |
| Annual Report | April 30, 2016 | | 41 |
Trustees and Officers
April 30, 2016 (Unaudited)
INDEPENDENT TRUSTEES (continued)
| | | | | | | | | | |
Name, Address* & Year of Birth | | Position(s) Held with Fund | | Term of Office and Length of Time Served | | Principal Occupation(s) During Past 5 Years** | | Number of Funds in Fund Complex Overseen by Trustee*** | | Other Directorships
Held by Trustee
During Past
5 Years** |
Jeremy W. Deems, 1976 | | Trustee | | Mr. Deems was appointed as a Trustee at the March 11, 2008 meeting of the Board of Trustees and elected at a special meeting of shareholders held on August 7, 2009. | | Mr. Deems is the Co-Founder, Chief Operations Officer and Chief Financial Officer of Green Alpha Advisors, LLC, a registered investment advisor, and Co-Portfolio Manager of the Shelton Green Alpha Fund. Prior to joining Green Alpha Advisors, Mr. Deems was CFO and Treasurer of Forward Management, LLC, ReFlow Management Co., LLC, ReFlow Fund, LLC, a private investment fund, and Sutton Place Management, LLC, an administrative services company, from 1998 to June 2007. From 2004 to 2005, Mr. Deems also served as Treasurer of the Forward Funds and the Sierra Club Funds. | | 34 | | Mr. Deems is a Trustee of ALPS ETF Trust (20 funds); ALPS Variable Investment Trust (9 funds), Reaves Utility Income Fund (1 fund) and Clough Funds Trust (1 fund). |
Jerry G. Rutledge 1944 | | Trustee | | Mr. Rutledge was elected at a special meeting of shareholders held on August 7, 2009. | | Mr. Rutledge is the President and owner of Rutledge’s Inc., a retail clothing business. Mr. Rutledge is currently Director of the American National Bank. He was from 1994 to 2007 a Regent of the University of Colorado. | | 34 | | Mr. Rutledge is a Trustee of Principal Real Estate Fund (1 fund), Clough Global Allocation Fund (1 fund), Clough Global Equity Fund (1 fund) and Clough Global Opportunities Fund (1 fund). |
| | |
| 42 | | www.vulcanvaluepartners.com |
Trustees and Officers
April 30, 2016 (Unaudited)
INDEPENDENT TRUSTEES (continued)
| | | | | | | | | | |
Name, Address* & Year of Birth | | Position(s) Held with Fund | | Term of Office and Length of Time Served | | Principal Occupation(s) During Past 5 Years** | | Number of Funds in Fund Complex Overseen by Trustee*** | | Other Directorships
Held by Trustee
During Past
5 Years** |
Michael “Ross” Shell, 1970 | | Trustee | | Mr. Shell was elected at a special meeting of shareholders held on August 7, 2009. | | Mr. Shell is Founder and CEO of Red Idea, LLC, a strategic consulting/early stage venture firm (since June 2008). From 1999 to 2009, he was a part-owner and Director of Tesser, Inc., a brand agency. From December 2005 to May 2008, he was Director, Marketing and Investor Relations, of Woodbourne, a REIT/real estate hedge fund and private equity firm. Prior to this, from May 2004 to November 2005, he worked as a business strategy consultant; from June 2003 to April 2004, he was on the Global Client Services team of IDEO, a product design/innovation firm; and from 1999 to 2003, he was President of Tesser, Inc. Mr. Shell graduated with honors from Stanford University with a degree in Political Science. | | 34 | | None. |
| | |
| Annual Report | April 30, 2016 | | 43 |
Trustees and Officers
April 30, 2016 (Unaudited)
INTERESTED TRUSTEE
| | | | | | | | | | |
Name, Address* & Age | | Position(s) Held with Fund | | Term of Office and Length of Time Served | | Principal Occupation(s) During Past 5 Years** | | Number of Funds in Fund Complex Overseen by Trustee*** | | Other Directorships Held by Trustee |
Edmund J. Burke, 1961 | | Trustee, Chairman and President | | Mr. Burke was elected as Chairman at the August 28, 2009 meeting of the Board of Trustees. Mr. Burke was elected as Trustee at a special meeting of shareholders held on August 7, 2009. Mr. Burke was elected President of the Trust at the December 17, 2002 meeting of the Board of Trustees. | | Mr. Burke is President and a Director of ALPS Holdings, Inc. (“AHI”) (since 2005) and Director of Boston Financial Data Services, Inc. (“BFDS”), ALPS Advisors, Inc. (“AAI”), ALPS Distributors, Inc. (“ADI”), ALPS Fund Services, Inc. (“AFS”) and ALPS Portfolio Solutions Distributor, Inc. (“APSD”) and from 2001-2008, was President of AAI, ADI, AFS and APSD. Because of his positions with AHI, BFDS, AAI, ADI, AFS and APSD, Mr. Burke is deemed an affiliate of the Trust as defined under the 1940 Act. Mr. Burke is Trustee and President of the Clough Global Allocation Fund (Trustee since 2006; President since 2004); Trustee and President of the Clough Global Equity Fund (Trustee since 2006; President since 2005); Trustee and President of the Clough Global Opportunities Fund (since 2006); Trustee of the Liberty All-Star Equity Fund; and Director of the Liberty All-Star Growth Fund, Inc. | | 34 | | Mr. Burke is a Trustee of Clough Global Allocation Fund (1 fund); Clough Global Equity Fund (1 fund); Clough Global Opportunities Fund (1 fund); Liberty All-Star Equity Fund (1 fund) and Clough Funds Trust (1 fund); and Director of the Liberty All-Star Growth Fund, Inc. (1 fund). |
| | |
| 44 | | www.vulcanvaluepartners.com |
Trustees and Officers
April 30, 2016 (Unaudited)
OFFICERS
| | | | | | | | | | | | |
Name, Address* & Year of Birth | | | | Position(s)
Held with
Fund | | | | Term of Office and Length of Time Served | | | | Principal Occupation(s) During Past 5 Years** |
Kimberly R. Storms, 1972 | | | | Treasurer | | | | Ms. Storms was elected Treasurer of the Trust at the March 12, 2013 meeting of the Board of Trustees. | | | | Ms. Storms is Senior Vice President - Director of Fund Administration of ALPS. Because of her position with ALPS, Ms. Storms is deemed an affiliate of the Trust as defined under the 1940 Act. Ms. Storms is also Treasurer of Liberty All-Star Equity Fund, Liberty All-Star Growth Fund, Inc. and ALPS Series Trust. Ms. Storms also serves as a Board member and Treasurer of The Center for Trauma & Resilience, a nonprofit agency. |
JoEllen L. Legg, 1961 | | | | Secretary | | | | Ms. Legg was elected Secretary of the Trust at the September 15, 2015 meeting of the Board of Trustees. | | | | Ms. Legg joined ALPS in October 2007 and is currently Vice President, Assistant General Counsel of ALPS. Prior to joining ALPS, Ms. Legg served as Senior Counsel - Law (Corporate & Securities) for Adelphia Communications Corporation (February 2005 - March 2007). Prior to this, Ms. Legg held associate positions at Fried Frank Harris Shriver & Jacobson LLP (1998 - 2004) and at Patton Boggs LLP (2004 - 2005). Because of her position with ALPS, Ms. Legg is deemed an affiliate of the Trust as defined under the 1940 Act. Ms. Legg is also the Secretary of ALPS Series Trust and Reaves Utility Income Fund. |
Ted Uhl, 1974 | | | | Chief Compliance Officer (“CCO”) | | | | Mr. Uhl was appointed CCO of the Trust at the June 8, 2010 meeting of the Board of Trustees. | | | | Mr. Uhl joined ALPS in October 2006, and is currently Deputy Compliance Officer of ALPS. Prior to his current role, Mr. Uhl served as Senior Risk Manager for ALPS from October 2006 until June 2010. Because of his position with ALPS, Mr. Uhl is deemed an affiliate of the Trust as defined under the 1940 Act. Mr. Uhl is also CCO of the Reaves Utility Income Fund, Centre Funds and Transparent Value Trust. |
Jennell Panella, 1974 | | | | Assistant Treasurer | | | | Ms. Panella was elected Assistant Treasurer of the Trust at the September 15, 2015 meeting of the Board of Trustees. | | | | Ms. Panella joined ALPS in June 2012 and is currently Fund Controller of ALPS Fund Services, Inc. Prior to joining ALPS, Ms. Panella served as Financial Reporting Manager for Parker Global Strategies, LLC (2009-2012). Because of her position with ALPS, Ms. Panella is deemed an affiliate of the Trust as defined under the 1940 Act. Ms. Panella also serves as Assistant Treasurer of James Advantage Funds. |
Nate Mandeville, 1977 | | | | Assistant Treasurer | | | | Mr. Mandeville was elected Assistant Treasurer of the Trust at the September 15, 2015 meeting of the Board of Trustees. | | | | Mr. Mandeville joined ALPS in December 2013 and is Fund Controller for ALPS. Prior to joining ALPS, Mr. Mandeville worked for Great-West Financial (2011-2013), Virtuoso Sourcing Group (2008-2011) and Janus Capital Group (2000-2008). Because of his position with ALPS, Mr. Mandeville is deemed an affiliate of the Trust as defined under the 1940 Act. Mr. Mandeville also serves as Assistant Treasurer of ALPS Series Trust. |
Sharon Akselrod, 1974 | | | | Assistant Secretary | | | | Ms. Akselrod was elected Assistant Secretary of the Trust at the September 15, 2015 meeting of the Board of Trustees. | | | | Ms. Akselrod joined ALPS in August 2014 and is currently Senior Investment Company Act Paralegal of ALPS. Prior to joining ALPS, Ms. Akselrod served as Corporate Governance and Regulatory Associate for Nordstrom fsb (2013-2014) and Senior Legal Assistant – Legal Manager for AXA Equitable Life Insurance Company (2008-2013). Because of her position with ALPS, Ms. Akselrod is deemed an affiliate of the Trust as defined under the 1940 Act. |
| | |
| Annual Report | April 30, 2016 | | 45 |
Trustees and Officers
April 30, 2016 (Unaudited)
OFFICERS (continued)
| | | | | | | | | | | | |
Name, Address* & Year of Birth | | | | Position(s)
Held with
Fund | | | | Term of Office and Length of Time Served | | | | Principal Occupation(s) During Past 5 Years** |
Sareena Khwaja-Dixon 1980 | | | | Assistant Secretary | | | | Ms. Khwaja-Dixon was elected Assistant Secretary of the Trust at the December 15, 2015 meeting of the Board of Trustees. | | | | Ms. Khwaja-Dixon joined ALPS in August 2015 and is currently Senior Counsel and Vice President of ALPS. Prior to joining ALPS, Ms. Khwaja-Dixon served as a Senior Paralegal/Paralegal for Russell Investments (2011-2015). Because of her position with ALPS, Ms. Khwaja-Dixon is deemed an affiliate of the Trust as defined under the 1940 Act. |
| | * | All communications to Trustees and Officers may be directed to Financial Investors Trust c/o 1290 Broadway, Suite 1100, Denver, CO 80203. | |
| | ** | This is the period for which the Trustee or Officer began serving the Trust. Each Trustee serves an indefinite term, until his or her successor is elected. Officers are elected on an annual basis. | |
| | *** | The Fund Complex includes all series of the Trust (currently 34) and any other investment companies for which any Trustee serves as trustee for and which Vulcan Value Partners, LLC, Inc. provides investment advisory services (currently none). | |
| | |
| 46 | | www.vulcanvaluepartners.com |
This page left intentionally blank.

The Funds are neither insured nor guaranteed by the U.S. Government, the FDIC, the Federal Reserve Board or any other governmental agency or insurer.
This material must be accompanied or preceded by a prospectus.
Managed Accounts are available only for institutional and private clients of Vulcan Value Partners, LLC, a federally registered investment advisor. Vulcan Value Partners Funds are distributed by ALPS Distributors, Inc. Separately Managed Accounts and related investment advisory services are provided by Vulcan Value Partners, LLC, a federally regulated investment advisor. ALPS Distributors, Inc. is not affiliated with Vulcan Value Partners, LLC.
| | (a) | The Registrant, as of the end of the period covered by this report, has adopted a code of ethics that applies to the Registrant’s principal executive officer, principal financial officer, principal accounting officer or controller or any persons performing similar functions on behalf of the Registrant. |
| | (c) | During the period covered by this report, no amendments to the provisions of the code of ethics described in Item 2(a) above were made. |
| | (d) | During the period covered by this report, no implicit or explicit waivers to the provisions of the code of ethics described in Item 2(a) above were granted. |
| | (f) | The Registrant’s Code of Ethics is attached as an Exhibit to this report. |
| Item 3. | Audit Committee Financial Expert. |
The Board of Trustees of the Registrant has determined that the Registrant has at least one Audit Committee Financial Expert serving on its audit committee. The Board of Trustees of the Registrant has designated Jeremy W. Deems as the Registrant’s “Audit Committee Financial Expert.” Mr. Deems is “independent” as defined in paragraph (a)(2) of Item 3 to Form N-CSR.
| Item 4. | Principal Accountant Fees and Services. |
| | (a) | Audit Fees: For the Registrant’s fiscal years ended April 30, 2016 and April 30, 2015, the aggregate fees billed for professional services rendered by the principal accountant for the audit of the Registrant’s annual financial statements or services that are normally provided by the accountant in connection with statutory and regulatory filings or engagements for those fiscal years were $316,200 and $259,000, respectively. |
| | (b) | Audit-Related Fees: For the Registrant’s fiscal years ended April 30, 2016 and April 30, 2015, the aggregate fees billed for assurance and related services by the principal accountant that were reasonably related to the performance of the audit of the Registrant’s financial statements and are not reported under paragraph (a) of this Item were $0 and $0, respectively. |
3
| | (c) | Tax Fees: For the Registrant’s fiscal years ended April 30, 2016 and April 30, 2015, the aggregate fees billed for professional services rendered by the principal accountant for tax compliance, tax advice and tax planning were $50,850 and $45,185, respectively. The fiscal year 2016 and 2015 tax fees were for services for dividend calculation, excise tax preparation and tax return preparation. |
| | (d) | All Other Fees: For the Registrant’s fiscal years ended April 30, 2016 and April 30, 2015, no fees were billed to Registrant by the principal accountant for products and services, other than the services reported in paragraphs (a) through (c) of this Item. |
| | (e)(1) | Audit Committee Pre-Approval Policies and Procedures: All services to be performed by the Registrant’s principal accountant must be pre-approved by the Registrant’s Audit Committee. The Chairman of the Audit Committee may pre-approve non-audit services to be performed by the Registrant’s principal accountant on an interim basis, subject to ratification by the Audit Committee at its next regularly scheduled meeting. |
| | (e)(2) | No services described in paragraphs (b) through (d) of this Item were approved by the Registrant’s Audit Committee pursuant to paragraph (c)(7)(i)(C) of Rule 2-01 of Regulation S-X. |
| | (g) | The aggregate non-audit fees billed by the Registrant’s accountant to the Registrant, and rendered to the Registrant’s investment adviser (not including any sub-adviser whose role is primarily portfolio management and is subcontracted with or overseen by another investment adviser), and any entity controlling, controlled by, or under common control with the adviser that provides ongoing services to the Registrant, were $85,069 in fiscal year ended April 30, 2016 and $68,301 in fiscal year ended April 30, 2015. These fees consisted of non-audit fees billed to (i) the Registrant of $50,850 in fiscal year ended April 30, 2016 and $45,185 in fiscal year ended April 30, 2015 as described in response to paragraph (c) above and (ii) to ALPS Fund Services, Inc. (“AFS”), an entity under common control with ALPS Advisors, Inc., the Registrant’s investment adviser, of $34,219 in fiscal year ended April 30, 2016 and $23,116 in fiscal year ended April 30, 2015. The non-audit fees billed to AFS related to SSAE 16 services and other compliance-related matters. |
| | (h) | The Registrant’s audit committee has considered whether the provision of non-audit services that were rendered to the Registrant’s investment adviser (not including any sub-adviser whose role is primarily portfolio management and is subcontracted with or overseen by another investment adviser), and any entity controlling, controlled by, or under common control with the investment adviser that provides ongoing services to the Registrant that were not pre-approved pursuant to paragraph (c)(7)(ii) of Rule 2-01 of Regulation S-X, is compatible with maintaining the principal accountant’s independence. The Registrant’s audit |
4
| | committee determined that the provision of such non-audit services is compatible with maintaining the principal accountant’s independence. |
| Item 5. | Audit Committee of Listed Registrants. |
Not applicable to the Registrant.
| | (a) | Schedule of Investments is included as part of the Reports to Stockholders filed under Item 1 of this Form N-CSR. |
| Item 7. | Disclosure of Proxy Voting Policies and Procedures for Closed-End Management Investment Companies. |
Not applicable to the Registrant.
| Item 8. | Portfolio Managers of Closed-End Management Investment Companies. |
Not applicable to the Registrant.
| Item 9. | Purchases of Equity Securities by Closed-End Management Investment Company and Affiliated Purchasers. |
Not applicable to the Registrant.
Item 10. Submission of Matters to a Vote of Security Holders.
There have been no material changes to the procedures by which shareholders may recommend nominees to the Registrant’s Board of Trustees, where those changes were implemented after the Registrant last provided disclosure in response to the requirements of Item 407(c)(2)(iv) of Regulation S-K, or this Item.
Item 11. Controls and Procedures.
| | (a) | The Registrant’s principal executive officer and principal financial officer have concluded that the Registrant’s disclosure controls and procedures (as defined in Rule 30a-3(c) under the Investment Company Act of 1940, as amended) are effective based on their evaluation of these controls and procedures as of a date within 90 days of the filing date of this report. |
| | (b) | There was no change in the Registrant’s internal control over financial reporting (as defined in Rule 30a-3(d) under the Investment Company Act of 1940, as amended) during the second fiscal quarter of the period covered by this report that has materially affected, or is reasonably likely to materially affect, the Registrant’s internal control over financial reporting. |
5
Item 12. Exhibits.
| | (a)(1) | Registrant’s Code of Ethics for Principal Executive and Senior Financial Officers, which is the subject of the disclosure required by Item 2 of Form N-CSR, is attached hereto as Exhibit 12(a)(1). |
| | (a)(2) | The certifications required by Rule 30a-2(a) of the Investment Company Act of 1940, as amended, and Section 302 of the Sarbanes-Oxley Act of 2002 are attached hereto as Exhibit 99.Cert. |
| | (b) | The certifications by the Registrant’s principal executive officer and principal financial officer, as required by Rule 30a-2(b) of the Investment Company Act of 1940, as amended, and Section 906 of the Sarbanes-Oxley Act of 2002 are attached hereto as Exhibit 99.906Cert. |
6
SIGNATURES
Pursuant to the requirements of the Securities Exchange Act of 1934 and the Investment Company Act of 1940, the Registrant has duly caused this report to be signed on its behalf by the undersigned, thereunto duly authorized.
| | |
| FINANCIAL INVESTORS TRUST |
| |
| By: | | /s/ Edmund J. Burke |
| | Edmund J. Burke (Principal Executive Officer) |
| | President |
| |
| Date: | | July 11, 2016 |
Pursuant to the requirements of the Securities Exchange Act of 1934 and the Investment Company Act of 1940, this report has been signed below by the following persons on behalf of the Registrant and in the capacities and on the dates indicated.
| | |
| FINANCIAL INVESTORS TRUST |
| |
| By: | | /s/ Edmund J. Burke |
| | Edmund J. Burke (Principal Executive Officer) |
| | President |
| |
| Date: | | July 11, 2016 |
| |
| By: | | /s/ Kimberly R. Storms |
| | Kimberly R. Storms (Principal Financial Officer) |
| | Treasurer |
| |
| Date: | | July 11, 2016 |
7