UNITED STATES
SECURITIES AND EXCHANGE COMMISSION
Washington, D.C. 20549
FORM N-CSR
CERTIFIED SHAREHOLDER REPORT OF REGISTERED
MANAGEMENT INVESTMENT COMPANIES
Investment Company Act file number: 811-08194
FINANCIAL INVESTORS TRUST
(Exact name of registrant as specified in charter)
1290 Broadway, Suite 1100, Denver, Colorado 80203
(Address of principal executive offices) (Zip code)
Karen Gilomen, Esq., Secretary
Financial Investors Trust
1290 Broadway, Suite 1100
Denver, Colorado 80203
(Name and address of agent for service)
Registrant’s telephone number, including area code: 303-623-2577
Date of fiscal year end: October 31
Date of reporting period: November 1, 2016 – October 31, 2017
Item 1. Reports to Stockholders.
TABLE OF
CONTENTS
| Disclosure of Fund Expenses | 1 |
| ALPS | Alerian MLP Infrastructure Index Fund | |
| Management Commentary | 6 |
| Performance Update | 7 |
| Statement of Investments | 9 |
| Statement of Assets and Liabilities | 10 |
| Statement of Operations | 11 |
| Statements of Changes in Net Assets | 12 |
| Financial Highlights | 13 |
| ALPS | CoreCommodity Management CompleteCommodities® Strategy Fund | |
| Management Commentary | 19 |
| Performance Update | 21 |
| Consolidated Statement of Investments | 23 |
| Consolidated Statement of Assets and Liabilities | 29 |
| Consolidated Statement of Operations | 30 |
| Consolidated Statements of Changes in Net Assets | 31 |
| Consolidated Financial Highlights | 32 |
| ALPS | Kotak India Growth Fund | |
| Management Commentary | 35 |
| Performance Update | 38 |
| Consolidated Statement of Investments | 40 |
| Consolidated Statement of Assets and Liabilities | 42 |
| Consolidated Statement of Operations | 43 |
| Consolidated Statements of Changes in Net Assets | 44 |
| Consolidated Financial Highlights | 45 |
| ALPS | Metis Global Micro Cap Value Fund | |
| Management Commentary | 48 |
| Performance Update | 50 |
| Statement of Investments | 52 |
| Statement of Assets and Liabilities | 56 |
| Statement of Operations | 57 |
| Statement of Changes in Net Assets | 58 |
| Financial Highlights | 59 |
| ALPS | Red Rocks Listed Private Equity Fund | |
| Management Commentary | 62 |
| Performance Update | 64 |
| Statement of Investments | 67 |
| Statement of Assets and Liabilities | 69 |
| Statement of Operations | 70 |
| Statements of Changes in Net Assets | 71 |
| Financial Highlights | 72 |
| ALPS | WMC Research Value Fund | |
| Management Commentary | 76 |
| Performance Update | 78 |
| Statement of Investments | 80 |
| Statement of Assets and Liabilities | 84 |
| Statement of Operations | 85 |
| Statements of Changes in Net Assets | 86 |
| Financial Highlights | 87 |
| Clough China Fund | |
| Management Commentary | 90 |
| Performance Update | 93 |
| Statement of Investments | 95 |
| Statement of Assets and Liabilities | 97 |
| Statement of Operations | 98 |
| Statements of Changes in Net Assets | 99 |
| Financial Highlights | 100 |
| RiverFront Global Allocation Series | |
| Management Commentary | 103 |
| Performance Update | 106 |
| Statements of Investments | 116 |
| Statements of Assets and Liabilities | 124 |
| Statements of Operations | 126 |
| Statements of Changes in Net Assets | 127 |
| Financial Highlights | 132 |
| Notes to Financial Statements | 149 |
| Report of Independent Registered Public Accounting Firm | 183 |
| Additional Information | 184 |
| Trustees and Officers | 200 |
alpsfunds.com
Disclosure of Fund Expenses
October 31, 2017 (Unaudited)
Examples. As a shareholder of the Funds, you incur two types of costs: (1) transaction costs, including applicable sales charges (loads) and redemption fees; and (2) ongoing costs, including management fees, distribution and service (12b-1) fees, shareholder service fees and other Fund expenses. The following examples are intended to help you understand your ongoing costs (in dollars) of investing in the Funds and to compare these costs with the ongoing costs of investing in other mutual funds. The examples are based on an investment of $1,000 invested on November 1, 2016 and held until April 30, 2017.
Actual Expenses. The first line under each class in the table below provides information about actual account values and actual expenses. You may use the information in this line, together with the amount you invested, to estimate the expenses that you paid over the period. Simply divide your account value by $1,000 (for example, an $8,600 account value divided by $1,000 = 8.6), then multiply the result by the number in the first line under the heading “Expenses Paid During Period May 1, 2017 – October, 31 2017” to estimate the expenses you paid on your account during this period.
Hypothetical Example for Comparison Purposes. The second line under each class in the table below provides information about hypothetical account values and hypothetical expenses based on the Fund’s actual expense ratio and an assumed rate of return of 5% per year before expenses, which is not the Fund’s actual return. The hypothetical account values and expenses may not be used to estimate the actual ending account balance or expenses you paid for the period. You may use this information to compare the ongoing costs of investing in the Funds and other mutual funds. To do so, compare these 5% hypothetical examples with the 5% hypothetical examples that appear in the shareholder reports of the other funds.
Please note that the expenses shown in the table are meant to highlight your ongoing costs only and do not reflect any transactional costs, such as sales charges or redemption fees. Therefore, the second line under each class in the table below is useful in comparing ongoing costs only, and will not help you determine the relative total costs of owning different funds. In addition, if these transactional costs were included, your costs would have been higher.
1 | October 31, 2017
Disclosure of Fund Expenses
October 31, 2017 (Unaudited)
| Beginning Account Value May 1, 2017 | Ending Account Value October 31, 2017 | Expense Ratio(a) | Expenses Paid During Period May 1, 2017 - October 31, 2017(b) | |||||
| ALPS | Alerian MLP Infrastructure Index Fund | ||||||||
| Class A | ||||||||
| Actual | $1,000.00 | $861.30 | 1.21% | $5.68 | ||||
| Hypothetical (5% return before expenses) | $1,000.00 | $1,019.11 | 1.21% | $6.16 | ||||
| Class C | ||||||||
| Actual | $1,000.00 | $857.60 | 1.85% | $8.66 | ||||
| Hypothetical (5% return before expenses) | $1,000.00 | $1,015.88 | 1.85% | $9.40 | ||||
| Class I | ||||||||
| Actual | $1,000.00 | $863.10 | 0.85% | $3.99 | ||||
| Hypothetical (5% return before expenses) | $1,000.00 | $1,020.92 | 0.85% | $4.33 | ||||
| ALPS | CoreCommodity Management CompleteCommodities® Strategy Fund(c) | ||||||||
| Class A | ||||||||
| Actual | $1,000.00 | $1,049.50 | 1.39% | $7.18 | ||||
| Hypothetical (5% return before expenses) | $1,000.00 | $1,018.20 | 1.39% | $7.07 | ||||
| Class C | ||||||||
| Actual | $1,000.00 | $1,045.50 | 2.05% | $10.57 | ||||
| Hypothetical (5% return before expenses) | $1,000.00 | $1,014.87 | 2.05% | $10.41 | ||||
| Class I | ||||||||
| Actual | $1,000.00 | $1,050.70 | 1.15% | $5.94 | ||||
| Hypothetical (5% return before expenses) | $1,000.00 | $1,019.41 | 1.15% | $5.85 | ||||
| ALPS | Kotak India Growth Fund(d) | ||||||||
| Class A | ||||||||
| Actual | $1,000.00 | $1,068.40 | 1.87% | $9.75 | ||||
| Hypothetical (5% return before expenses) | $1,000.00 | $1,015.78 | 1.87% | $9.50 | ||||
| Class C | ||||||||
| Actual | $1,000.00 | $1,064.50 | 2.59% | $13.48 | ||||
| Hypothetical (5% return before expenses) | $1,000.00 | $1,012.15 | 2.59% | $13.14 | ||||
| Class I | ||||||||
| Actual | $1,000.00 | $1,069.80 | 1.59% | $8.30 | ||||
| Hypothetical (5% return before expenses) | $1,000.00 | $1,017.19 | 1.59% | $8.08 | ||||
| ALPS | Metis Global Micro Cap Value Fund | ||||||||
| Class A | ||||||||
| Actual | $1,000.00 | $1,063.10 | 2.07% | $10.76 | ||||
| Hypothetical (5% return before expenses) | $1,000.00 | $1,014.77 | 2.07% | $10.51 | ||||
| Class C | ||||||||
| Actual | $1,000.00 | $1,060.40 | 2.70% | $14.02 | ||||
| Hypothetical (5% return before expenses) | $1,000.00 | $1,011.59 | 2.70% | $13.69 | ||||
| Class I | ||||||||
| Actual | $1,000.00 | $1,064.90 | 1.70% | $8.85 | ||||
| Hypothetical (5% return before expenses) | $1,000.00 | $1,016.64 | 1.70% | $8.64 | ||||
2 | October 31, 2017
Disclosure of Fund Expenses
October 31, 2017 (Unaudited)
| Beginning Account Value May 1, 2017 | Ending Account Value October 31, 2017 | Expense Ratio(a) | Expenses Paid During Period May 1, 2017 - October 31, 2017(b) | |||||
| ALPS | Red Rocks Listed Private Equity Fund | ||||||||
| Class A | ||||||||
| Actual | $1,000.00 | $1,121.20 | 1.28% | $6.84 | ||||
| Hypothetical (5% return before expenses) | $1,000.00 | $1,018.75 | 1.28% | $6.51 | ||||
| Class C | ||||||||
| Actual | $1,000.00 | $1,116.60 | 2.03% | $10.83 | ||||
| Hypothetical (5% return before expenses) | $1,000.00 | $1,014.97 | 2.03% | $10.31 | ||||
| Class I | ||||||||
| Actual | $1,000.00 | $1,122.10 | 1.06% | $5.67 | ||||
| Hypothetical (5% return before expenses) | $1,000.00 | $1,019.86 | 1.06% | $5.40 | ||||
| Class R | ||||||||
| Actual | $1,000.00 | $1,120.60 | 1.45% | $7.75 | ||||
| Hypothetical (5% return before expenses) | $1,000.00 | $1,017.90 | 1.45% | $7.38 | ||||
| ALPS | WMC Research Value Fund | ||||||||
| Class A | ||||||||
| Actual | $1,000.00 | $1,037.50 | 1.15% | $5.91 | ||||
| Hypothetical (5% return before expenses) | $1,000.00 | $1,019.41 | 1.15% | $5.85 | ||||
| Class C | ||||||||
| Actual | $1,000.00 | $1,034.50 | 1.90% | $9.74 | ||||
| Hypothetical (5% return before expenses) | $1,000.00 | $1,015.63 | 1.90% | $9.65 | ||||
| Class I | ||||||||
| Actual | $1,000.00 | $1,038.80 | 0.90% | $4.63 | ||||
| Hypothetical (5% return before expenses) | $1,000.00 | $1,020.67 | 0.90% | $4.58 | ||||
| Clough China Fund | ||||||||
| Class A | ||||||||
| Actual | $1,000.00 | $1,208.20 | 1.95% | $10.85 | ||||
| Hypothetical (5% return before expenses) | $1,000.00 | $1,015.38 | 1.95% | $9.91 | ||||
| Class C | ||||||||
| Actual | $1,000.00 | $1,203.90 | 2.70% | $15.00 | ||||
| Hypothetical (5% return before expenses) | $1,000.00 | $1,011.59 | 2.70% | $13.69 | ||||
| Class I | ||||||||
| Actual | $1,000.00 | $1,210.20 | 1.70% | $9.47 | ||||
| Hypothetical (5% return before expenses) | $1,000.00 | $1,016.64 | 1.70% | $8.64 | ||||
3 | October 31, 2017
Disclosure of Fund Expenses
October 31, 2017 (Unaudited)
| Beginning Account Value May 1, 2017 | Ending Account Value October 31, 2017 | Expense Ratio(a) | Expenses Paid During Period May 1, 2017 - October 31, 2017(b) | |||||
| RiverFront Conservative Income Builder Fund | ||||||||
| Class A | ||||||||
| Actual | $1,000.00 | $1,041.90 | 1.15% | $5.92 | ||||
| Hypothetical (5% return before expenses) | $1,000.00 | $1,019.41 | 1.15% | $5.85 | ||||
| Class C | ||||||||
| Actual | $1,000.00 | $1,038.30 | 1.90% | $9.76 | ||||
| Hypothetical (5% return before expenses) | $1,000.00 | $1,015.63 | 1.90% | $9.65 | ||||
| Class I | ||||||||
| Actual | $1,000.00 | $1,044.10 | 0.90% | $4.64 | ||||
| Hypothetical (5% return before expenses) | $1,000.00 | $1,020.67 | 0.90% | $4.58 | ||||
| RiverFront Dynamic Equity Income Fund | ||||||||
| Class A | ||||||||
| Actual | $1,000.00 | $1,082.00 | 1.15% | $6.03 | ||||
| Hypothetical (5% return before expenses) | $1,000.00 | $1,019.41 | 1.15% | $5.85 | ||||
| Class C | ||||||||
| Actual | $1,000.00 | $1,077.70 | 1.90% | $9.95 | ||||
| Hypothetical (5% return before expenses) | $1,000.00 | $1,015.63 | 1.90% | $9.65 | ||||
| Class I | ||||||||
| Actual | $1,000.00 | $1,083.90 | 0.90% | $4.73 | ||||
| Hypothetical (5% return before expenses) | $1,000.00 | $1,020.67 | 0.90% | $4.58 | ||||
| RiverFront Global Allocation Fund | ||||||||
| Class A | ||||||||
| Actual | $1,000.00 | $1,090.30 | 1.15% | $6.06 | ||||
| Hypothetical (5% return before expenses) | $1,000.00 | $1,019.41 | 1.15% | $5.85 | ||||
| Class C | ||||||||
| Actual | $1,000.00 | $1,085.60 | 1.90% | $9.99 | ||||
| Hypothetical (5% return before expenses) | $1,000.00 | $1,015.63 | 1.90% | $9.65 | ||||
| Class I | ||||||||
| Actual | $1,000.00 | $1,091.60 | 0.90% | $4.74 | ||||
| Hypothetical (5% return before expenses) | $1,000.00 | $1,020.67 | 0.90% | $4.58 | ||||
| RiverFront Global Growth Fund | ||||||||
| Class A | ||||||||
| Actual | $1,000.00 | $1,097.80 | 1.15% | $6.08 | ||||
| Hypothetical (5% return before expenses) | $1,000.00 | $1,019.41 | 1.15% | $5.85 | ||||
| Class C | ||||||||
| Actual | $1,000.00 | $1,093.10 | 1.90% | $10.02 | ||||
| Hypothetical (5% return before expenses) | $1,000.00 | $1,015.63 | 1.90% | $9.65 | ||||
| Class I | ||||||||
| Actual | $1,000.00 | $1,098.30 | 0.90% | $4.76 | ||||
| Hypothetical (5% return before expenses) | $1,000.00 | $1,020.67 | 0.90% | $4.58 | ||||
| Class L | ||||||||
| Actual | $1,000.00 | $1,099.10 | 0.90% | $4.76 | ||||
| Hypothetical (5% return before expenses) | $1,000.00 | $1,020.67 | 0.90% | $4.58 | ||||
| Investor Class | ||||||||
| Actual | $1,000.00 | $1,097.70 | 1.15% | $6.08 | ||||
| Hypothetical (5% return before expenses) | $1,000.00 | $1,019.41 | 1.15% | $5.85 | ||||
4 | October 31, 2017
Disclosure of Fund Expenses
October 31, 2017 (Unaudited)
| Beginning Account Value May 1, 2017 | Ending Account Value October 31, 2017 | Expense Ratio(a) | Expenses Paid During Period May 1, 2017 - October 31, 2017(b) | |||||
| RiverFront Moderate Growth & Income Fund | ||||||||
| Class A | ||||||||
| Actual | $1,000.00 | $1,057.10 | 1.15% | $5.96 | ||||
| Hypothetical (5% return before expenses) | $1,000.00 | $1,019.41 | 1.15% | $5.85 | ||||
| Class C | ||||||||
| Actual | $1,000.00 | $1,053.80 | 1.90% | $9.84 | ||||
| Hypothetical (5% return before expenses) | $1,000.00 | $1,015.63 | 1.90% | $9.65 | ||||
| Class I | ||||||||
| Actual | $1,000.00 | $1,058.60 | 0.90% | $4.67 | ||||
| Hypothetical (5% return before expenses) | $1,000.00 | $1,020.67 | 0.90% | $4.58 | ||||
| (a) | Annualized, based on the Fund’s most recent fiscal half year expenses. |
| (b) | Expenses are equal to the Fund’s annualized expense ratio multiplied by the average account value over the period, multiplied by the number of days in the most recent fiscal half year (181), divided by 365. |
| (c) | Includes expenses of the CoreCommodity Management Cayman Commodity Fund Ltd. (wholly-owned subsidiary), exclusive of the subsidiary’s management fee. |
| (d) | Includes expenses of the Kotak Mauritius Portfolio (wholly-owned subsidiary). |
5 | October 31, 2017
| ALPS | Alerian MLP Infrastructure Index Fund | |
| Management Commentary | October 31, 2017 (Unaudited) |
During the twelve-month period of November 1, 2016 to October 31, 2017 the Alerian MLP Infrastructure Index Fund’s (“Fund”) Class A shares delivered a net return of -6.32% at Net Asset Value. Class A delivered a net return of -11.45% at MOP, Class C was -7.86% with CDSC, and Class I was -5.96%.
This compares to the Alerian MLP Infrastructure Index (“AMZI”), the Fund’s index, which fell 11.4% and 5.3% on a price-return and total-return basis, respectively. The difference in performance between the AMZI and the Fund is primarily attributable to the Fund’s operating expenses and the impact of the Fund’s C Corporation tax election.
During the period, Dominion Energy Midstream Partners (DM), Holly Energy Partners (HEP), and Rice Midstream Partners (RMP) were added to, and NGL Energy Partners (NGL) was removed from, the index during its quarterly rebalancings. ONEOK Partners (OKS) was removed from the index due to its merger with ONEOK Inc (OKE), which is not an index constituent. Energy Transfer Partners (ETP) was removed from the index due to its merger with Sunoco Logistics Partners (SXL), an existing constituent. After the merger closed, the company changed its name and ticker to Energy Transfer Partners and ETP.
The top performer in the AMZI during the period was Phillips 66 Partners (PSXP), which returned 14.0% on a price-return basis. Laggards during the period include ETP, Enbridge Energy Partners (EEP), Genesis Energy (GEL), and Plains All American Pipeline (PAA), all of which fell more than 30%.
All four laggards cut their distribution during the period, PAA for the second time. (ETP’s cut was due to the merger.) Williams Partners (WPZ) also cut its distribution. However, four companies in the index grew their distributions during the period by more than 20%: PSXP, Antero Midstream Partners (AM), Shell Midstream Partners (SHLX), and Valero Energy Partners (VLP).
Energy MLPs rallied from November through January, largely as a function of the new administration and its pro-energy stance. Expedited regulatory approvals, including those for the Dakota Access Pipeline and Keystone XL, resulted in energy infrastructure MLPs rallying further. However, as the price of oil fell below $50 per barrel in March, midstream companies sold off along with the broader energy sector. While oil prices stabilized and recovered through the summer and fall, MLPs did not recover in tandem.
New energy infrastructure project announcements continued throughout the year, especially in the Permian and SCOOP/STACK regions. But investor interest largely centered on balance sheets, and announcements of slowed distribution growth, self-funding measures, or even distribution cuts were greeted positively—or at least with acceptance—by the market. Buybacks, once anomalies in the sector, have started to gain interest among management teams as they believe the market has failed to reward the traditional uses of cash.
MLPs may continue to experience volatility in the coming months if commodity prices do the same. MLP investors will likely further scrutinize balance sheets for appropriate uses of cash and analyze distribution policies for long-term sustainability before they are again comfortable trading MLPs to premium valuations. Beyond the short term, fundamentals remain intact for MLPs to build out US energy infrastructure over the next several decades.
The views of the author and information discussed in this commentary are as of the date of publication, are subject to change, and may not reflect the writer’s current views. The views expressed are those of the author only, and represent an assessment of market conditions at a specific point in time, are opinions only and should not be relied upon as investment advice regarding a particular investment or markets in general. Such information does not constitute a recommendation to buy or sell specific securities or investment vehicles. It should not be assumed that any investment will be profitable or will equal the performance of the fund(s) or any securities or any sectors mentioned in this letter. The subject matter contained in this letter has been derived from several sources believed to be reliable and accurate at the time of compilation. Neither ALPS Advisors, Inc., Alerian, nor the Fund accept any liability for losses either direct or consequential caused by the use of this information.
Diversification cannot guarantee gain or prevent losses.
ALPS | Alerian MLP Infrastructure Index Fund (NYSE: ALERX) delivers exposure to the Alerian MLP Infrastructure Index (NYSE: AMZI), a capped, float-adjusted, capitalization-weighted composite of energy infrastructure Master Limited Partnerships that earn the majority of their cash flow from the transportation, storage, and processing of energy commodities.
6 | October 31, 2017
| ALPS | Alerian MLP Infrastructure Index Fund | |
| Performance Update | October 31, 2017 (Unaudited) |
Performance of $10,000 Initial Investment (as of October 31, 2017)
Comparison of change in value of a $10,000 investment (includes maximum sales charges of 5.50%)

The chart above represents historical performance of a hypothetical investment of $10,000 in the Fund since inception. Past performance does not guarantee future results. This chart does not reflect the deduction of taxes that a shareholder would pay on Fund distributions or the redemption of Fund shares.
Average Annual Total Returns (as of October 31, 2017)
| 6 Month | 1 Year | 3 Year | Since Inception^ | Total Expense Ratio | What You Pay* | |
| Class A (NAV) | -13.87% | -6.32% | -12.17% | -2.90% | 1.75% | 1.25% |
| Class A (MOP) | -18.61% | -11.45% | -13.82% | -4.03% | ||
| Class C (NAV) | -14.24% | -7.00% | -12.49% | -3.27% | 2.35% | 1.85% |
| Class C (CDSC) | -15.05% | -7.86% | -12.49% | -3.27% | ||
| Class I | -13.69% | -5.96% | -11.90% | -2.65% | 1.35% | 0.85% |
| Alerian MLP Infrastructure Index1 | -13.50% | -5.25% | -12.43% | – |
Performance data quoted represents past performance. Past performance does not guarantee future results. Investment return and principal value of an investment will fluctuate so that an investor’s shares, when sold or redeemed, may be worth more or less than the original cost. Current performance data may be higher or lower than actual data quoted. For the most current month-end performance data please call 1-866-759-5679.
Maximum Offering Price (MOP) for Class A shares includes the Fund’s maximum sales charge of 5.50%. Performance shown at NAV does not include these sales charges and would have been lower had it been taken into account. If you invest $1 million or more, either as a lump sum or through the Fund’s accumulation or letter of intent programs, you can purchase Class A shares without an initial sales charge (load). A Contingent Deferred Sales Charge (“CDSC”) of 1.00% may apply to Class C shares redeemed within the first 12 months after a purchase, and on Class A shares redeemed within the first 18 months after a purchase in excess of $1 million.
Performance less than 1 year is cumulative.
7 | October 31, 2017
| ALPS | Alerian MLP Infrastructure Index Fund | |
| Performance Update | October 31, 2017 (Unaudited) |
| 1 | Alerian MLP Infrastructure Index is comprised of midstream energy Master Limited Partnerships. The index is not actively managed and does not reflect any deductions for fees, expenses or taxes. An investor may not invest directly in an index. |
| ^ | Fund inception date of December 31, 2012. |
| * | What You Pay reflects the Advisor’s and Sub-Advisor’s decision to contractually limit expenses through February 28, 2018. Please see the prospectus for additional information. |
The Fund is “non-diversified” and will generally be more volatile than diversified funds.
Investments in securities of MLPs involve risks that differ from an investment in common stock. MLPs are controlled by their general partners, which generally have conflicts of interest and limited fiduciary duties to the MLP, which may permit the general partner to favor its own interests over the MLPs. The benefit you are expected to derive from the Fund’s investment in MLPs depends largely on the MLPs being treated as partnerships for federal income tax purposes. As a partnership, an MLP has no federal income tax liability at the entity level. Therefore, treatment of one or more MLPs as a corporation for federal income tax purposes could affect the Fund’s ability to meet its investment objective and would reduce the amount of cash available to pay or distribute to you. Legislative, judicial, or administrative changes and differing interpretations, possibly on a retroactive basis, could negatively impact the value of an investment in MLPs and therefore the value of your investment in the Fund.
The table does not reflect the deduction of taxes that a shareholder would pay on Fund distributions or the redemption of Fund shares.
This Fund is not suitable for all investors and is subject to investment risks, including possible loss of the principal amount invested.
There is no guarantee that the Fund will continue to hold any one particular security or stay invested in any one particular company. The composition of the Fund’s top holdings is subject to change. Performance figures are historical and reflect the change in share price, reinvested distributions, changes in net asset value, sales charges and capital gains distributions, if any. Not FDIC Insured – No Bank Guarantee – May Lose Value
Top Ten Holdings (as a % of Net Assets) †
| Magellan Midstream Partners LP | 10.61% |
| Enterprise Products Partners LP | 9.78% |
| Energy Transfer Partners LP | 9.53% |
| MPLX LP | 8.48% |
| Williams Partners LP | 7.86% |
| Plains All American Pipeline LP | 7.00% |
| Buckeye Partners LP | 6.25% |
| Western Gas Partners LP | 4.02% |
| EQT Midstream Partners LP | 3.58% |
| Spectra Energy Partners LP | 2.88% |
| Top Ten Holdings | 69.99% |
| † | Holdings are subject to change, and may not reflect the current or future position of the Portfolio. Table presents approximate values only. |
Industry Sector Allocation (as a % of Total Investments)

8 | October 31, 2017
ALPS | Alerian MLP Infrastructure Index Fund
| Statement of Investments | October 31, 2017 |
| Shares | Value (Note 2) | |||||||
| MASTER LIMITED PARTNERSHIPS (99.34%) | ||||||||
| Gathering & Processing (28.08%) | ||||||||
| Oil & Gas (1.86%) | ||||||||
| Antero Midstream Partners LP | 29,200 | $ | 838,040 | |||||
| Oil & Gas Services (1.27%) | ||||||||
| Rice Midstream Partners LP | 27,704 | 574,581 | ||||||
| Pipelines (24.95%) | ||||||||
| DCP Midstream LP | 34,164 | 1,130,145 | ||||||
| EnLink Midstream Partners LP | 61,714 | 944,841 | ||||||
| MPLX LP | 108,494 | 3,825,498 | ||||||
| Western Gas Partners LP | 37,868 | 1,813,499 | ||||||
| Williams Partners LP | 95,702 | 3,544,802 | ||||||
| 11,258,785 | ||||||||
| TOTAL GATHERING & PROCESSING | 12,671,406 | |||||||
| Pipeline Transportation | Natural Gas (30.86%) | ||||||||
| Pipelines (30.86%) | ||||||||
| Boardwalk Pipeline Partners LP | 46,998 | 658,912 | ||||||
| Dominion Midstream Partners LP | 18,308 | 586,772 | ||||||
| Energy Transfer Partners LP | 247,003 | 4,300,322 | ||||||
| Enterprise Products Partners LP | 180,116 | 4,412,842 | ||||||
| EQT Midstream Partners LP | 22,136 | 1,617,256 | ||||||
| Spectra Energy Partners LP | 30,091 | 1,297,524 | ||||||
| TC PipeLines LP | 19,734 | 1,051,625 | ||||||
| 13,925,253 | ||||||||
| TOTAL PIPELINE TRANSPORTATION | NATURAL GAS | 13,925,253 | |||||||
| Pipeline Transportation | Petroleum (40.40%) | ||||||||
| Pipelines (40.40%) | ||||||||
| Andeavor Logistics LP | 27,853 | 1,258,399 | ||||||
| Buckeye Partners LP | 53,093 | 2,819,769 | ||||||
| Enbridge Energy Partners LP | 81,405 | 1,227,587 | ||||||
| Genesis Energy LP | 40,565 | 944,759 | ||||||
| Holly Energy Partners LP | 15,631 | 534,424 | ||||||
| Magellan Midstream Partners LP | 69,680 | 4,787,713 | ||||||
| NuStar Energy LP | 29,897 | 995,570 | ||||||
| Phillips 66 Partners LP | 17,462 | 880,259 | ||||||
| Plains All American Pipeline LP | 158,073 | 3,156,718 | ||||||
| Shell Midstream Partners LP | 33,362 | 847,728 | ||||||
| Tallgrass Energy Partners LP | 17,731 | 773,781 | ||||||
| 18,226,707 | ||||||||
| TOTAL PIPELINE TRANSPORTATION | PETROLEUM | 18,226,707 | |||||||
| TOTAL MASTER LIMITED PARTNERSHIPS | ||||||||
| (Cost $43,411,190) | 44,823,366 | |||||||
| 7-Day Yield | Shares | Value (Note 2) | ||||||||||
| SHORT TERM INVESTMENTS (0.23%) | ||||||||||||
| Money Market Fund (0.23%) | ||||||||||||
| State Street Institutional Treasury Plus Money Market Fund | 0.930 | % | 104,487 | $ | 104,487 | |||||||
| TOTAL SHORT TERM INVESTMENTS | ||||||||||||
| (Cost $104,487) | 104,487 | |||||||||||
| TOTAL INVESTMENTS (99.57%) | ||||||||||||
| (Cost $43,515,677) | $ | 44,927,853 | ||||||||||
| Other Assets In Excess Of Liabilities (0.43%) | 194,644 | |||||||||||
| NET ASSETS (100.00%) | $ | 45,122,497 | ||||||||||
For Fund compliance purposes, the Fund’s industry classifications refer to any one or more of the industry sub-classifications used by one or more widely recognized market indexes or ratings group indexes, and/or as defined by Fund management. This definition may not apply for purposes of this report, which may combine industry sub-classifications for reporting ease. Industries are shown as a percent of net assets.
See Notes to Financial Statements.
9 | October 31, 2017
ALPS | Alerian MLP Infrastructure Index Fund
| Statement of Assets and Liabilities | October 31, 2017 |
| ASSETS | ||||
| Investments, at value | $ | 44,927,853 | ||
| Receivable for investments sold | 216,445 | |||
| Receivable for shares sold | 118,161 | |||
| Dividends receivable | 216,482 | |||
| Deferred tax asset(a) | – | |||
| Income tax receivable | 6,734 | |||
| Prepaid expenses and other assets | 3,871 | |||
| Total Assets | 45,489,546 | |||
| LIABILITIES | ||||
| Franchise tax payable | 338 | |||
| Payable for shares redeemed | 55,219 | |||
| Investment advisory fees payable | 13,497 | |||
| Administration and transfer agency fees payable | 10,190 | |||
| Distribution and services fees payable | 13,307 | |||
| Trustees’ fees and expenses payable | 269 | |||
| Professional fees payable | 45,702 | |||
| Accrued expenses and other liabilities | 228,527 | |||
| Total Liabilities | 367,049 | |||
| NET ASSETS | $ | 45,122,497 | ||
| NET ASSETS CONSIST OF | ||||
| Paid-in capital | $ | 56,131,801 | ||
| Accumulated net investment loss, net of deferred income taxes | (1,699,956 | ) | ||
| Accumulated net realized loss, net of deferred income taxes | (10,718,460 | ) | ||
| Net unrealized appreciation, net of deferred income taxes | 1,409,112 | |||
| NET ASSETS | $ | 45,122,497 | ||
| INVESTMENTS, AT COST | $ | 43,515,677 | ||
| PRICING OF SHARES | ||||
| Class A: | ||||
| Net Asset Value, offering and redemption price per share | $ | 6.00 | ||
| Net Assets | $ | 15,776,374 | ||
| Shares of beneficial interest outstanding (unlimited number of shares, no par value common stock authorized) | 2,630,285 | |||
| Maximum offering price per share ((NAV/0.9450), based on maximum sales charge of 5.50% of the offering price) | $ | 6.35 | ||
| Class C: | ||||
| Net Asset Value, offering and redemption price per share(b) | $ | 5.87 | ||
| Net Assets | $ | 8,283,409 | ||
| Shares of beneficial interest outstanding (unlimited number of shares, no par value common stock authorized) | 1,411,290 | |||
| Class I: | ||||
| Net Asset Value, offering and redemption price per share | $ | 6.09 | ||
| Net Assets | $ | 21,062,714 | ||
| Shares of beneficial interest outstanding (unlimited number of shares, no par value common stock authorized) | 3,460,615 | |||
| (a) | Any net tax benefit was fully offset by a 100% valuation allowance recorded as of October 31, 2017. See Note 4 for additional information. |
| (b) | Redemption price per share may be reduced for any applicable contingent deferred sales charge. For a description of a possible sales charge, please see the Fund’s Prospectus. |
See Notes to Financial Statements.
10 | October 31, 2017
ALPS | Alerian MLP Infrastructure Index Fund
| Statement of Operations | For the Year Ended October 31, 2017 |
| INVESTMENT INCOME | ||||
| Dividends | $ | 1,385 | ||
| Distributions from master limited partnerships | 2,993,911 | |||
| Less return of capital distributions | (2,993,911 | ) | ||
| Total Investment Income | 1,385 | |||
| EXPENSES | ||||
| Investment advisory fees | 313,906 | |||
| Administrative fees | 46,678 | |||
| Transfer agency fees | 3,045 | |||
| Distribution and service fees | ||||
| Class A | 42,914 | |||
| Class C | 91,046 | |||
| Professional fees | 93,421 | |||
| Reports to shareholders and printing fees | 9,106 | |||
| State registration fees | 45,287 | |||
| Insurance fees | 365 | |||
| Franchise tax expenses | 2,165 | |||
| Custody fees | 12,720 | |||
| Trustees’ fees and expenses | 1,007 | |||
| Miscellaneous expenses | 14,997 | |||
| Total Expenses | 676,657 | |||
| Less fees waived/reimbursed by investment advisor (Note 8) | ||||
| Class A | (44,452 | ) | ||
| Class C | (32,605 | ) | ||
| Class I | (84,344 | ) | ||
| Net Expenses | 515,256 | |||
| Net Investment Loss, before provision for income taxes | (513,871 | ) | ||
| Provision for income tax | – | |||
| Net Investment Loss, net of provision for income taxes | (513,871 | ) | ||
| REALIZED AND UNREALIZED GAIN/(LOSS) | ||||
| Net realized loss on investments, before provision for income taxes | (159,887 | ) | ||
| Provision for income tax | – | |||
| Net Realized Loss on investments, net of provision for income taxes | (159,887 | ) | ||
| Net change in unrealized depreciation on investment, before provision for income taxes | (2,657,985 | ) | ||
| Provision for income tax | – | |||
| Net Change in Unrealized Depreciation on Investments, net of provision for income taxes | (2,657,985 | ) | ||
| NET REALIZED AND UNREALIZED LOSS ON INVESTMENTS, NET OF PROVISION FOR INCOME TAXES | (2,817,872 | ) | ||
| NET DECREASE IN NET ASSETS RESULTING FROM OPERATIONS | $ | (3,331,743 | ) | |
See Notes to Financial Statements.
11 | October 31, 2017
| ALPS | Alerian MLP Infrastructure Index Fund | ||||
Statements of Changes in Net Assets
| For the Year Ended October 31, 2017 | For the Year Ended October 31, 2016 | |||||||
| OPERATIONS | ||||||||
| Net investment loss, net of provision for income taxes | $ | (513,871 | ) | $ | (404,789 | ) | ||
| Net realized loss on investments, net of provision for income taxes | (159,887 | ) | (8,137,420 | ) | ||||
| Net change in unrealized appreciation/(depreciation) on investments, net of provision for income taxes | (2,657,985 | ) | 8,857,590 | |||||
| Net Increase/(Decrease) in Net Assets Resulting from Operations | (3,331,743 | ) | 315,381 | |||||
| DISTRIBUTIONS | ||||||||
| Distributions to shareholders from net investment income | ||||||||
| Class A | – | (35,289 | ) | |||||
| Class C | – | (29,661 | ) | |||||
| Class I | – | (64,431 | ) | |||||
| Distributions to shareholders from tax return of capital | ||||||||
| Class A | (952,360 | ) | (821,410 | ) | ||||
| Class C | (672,687 | ) | (690,411 | ) | ||||
| Class I | (1,692,759 | ) | (1,499,725 | ) | ||||
| Net Decrease in Net Assets from Distributions | (3,317,806 | ) | (3,140,927 | ) | ||||
| BENEFICIAL INTEREST TRANSACTIONS (NOTE 6) | ||||||||
| Shares sold | ||||||||
| Class A | 11,083,335 | 9,184,684 | ||||||
| Class C | 2,392,655 | 4,730,039 | ||||||
| Class I | 8,036,386 | 19,959,806 | ||||||
| Distributions reinvested | ||||||||
| Class A | 863,894 | 783,421 | ||||||
| Class C | 661,826 | 705,911 | ||||||
| Class I | 1,605,089 | 1,469,292 | ||||||
| Shares redeemed, net of redemption fees | ||||||||
| Class A | (5,438,931 | ) | (12,504,205 | ) | ||||
| Class C | (2,475,466 | ) | (3,582,134 | ) | ||||
| Class I | (5,649,510 | ) | (4,384,484 | ) | ||||
| Net Increase in Net Assets Derived from Beneficial Interest Transactions | 11,079,278 | 16,362,330 | ||||||
| Net increase in net assets | 4,429,729 | 13,536,784 | ||||||
| NET ASSETS | ||||||||
| Beginning of year | 40,692,768 | 27,155,984 | ||||||
| End of year * | $ | 45,122,497 | $ | 40,692,768 | ||||
| *Including accumulated net investment loss, net of deferred income taxes, of: | $ | (1,699,956 | ) | $ | (1,186,085 | ) | ||
| See Notes to Financial Statements. |
12 | October 31, 2017
| ALPS | | Alerian MLP Infrastructure Index Fund – Class A |
Financial Highlights
Selected data for a share of beneficial interest outstanding throughout the periods indicated:
| For the Year Ended October 31, 2017 | For the Year Ended October 31, 2016 | For the Year Ended October 31, 2015 | For the Fiscal Period Ended October 31, 2014(a) | For the Year Ended April 30, 2014 | For the Period January 2, 2013 (Commencement) to April 30, 2013 | |||||||||||||||||||
| Net asset value, beginning of period | $ | 6.90 | $ | 7.60 | $ | 11.32 | $ | 11.23 | $ | 11.10 | $ | 10.00 | ||||||||||||
| INCOME/(LOSS) FROM INVESTMENT OPERATIONS: | ||||||||||||||||||||||||
| Net investment loss(b) | (0.08 | ) | (0.08 | ) | (0.15 | ) | (0.05 | ) | (0.09 | ) | (0.03 | ) | ||||||||||||
| Net realized and unrealized gain/(loss) | (0.32 | ) | (0.02 | ) | (2.83 | ) | 0.67 | 0.90 | 1.29 | |||||||||||||||
| Total from investment operations | (0.40 | ) | (0.10 | ) | (2.98 | ) | 0.62 | 0.81 | 1.26 | |||||||||||||||
| DISTRIBUTIONS: | ||||||||||||||||||||||||
| From net investment income | – | (0.02 | ) | (0.00 | )(c) | (0.03 | ) | (0.36 | ) | – | ||||||||||||||
| From tax return of capital | (0.50 | ) | (0.58 | ) | (0.74 | ) | (0.50 | ) | (0.32 | ) | (0.16 | ) | ||||||||||||
| Total distributions | (0.50 | ) | (0.60 | ) | (0.74 | ) | (0.53 | ) | (0.68 | ) | (0.16 | ) | ||||||||||||
| REDEMPTION FEES ADDED TO PAID-IN CAPITAL (NOTE 6) | – | 0.00 | (c) | – | – | – | – | |||||||||||||||||
| Net increase/(decrease) in net asset value | (0.90 | ) | (0.70 | ) | (3.72 | ) | 0.09 | 0.13 | 1.10 | |||||||||||||||
| Net asset value, end of year | $ | 6.00 | $ | 6.90 | $ | 7.60 | $ | 11.32 | $ | 11.23 | $ | 11.10 | ||||||||||||
| TOTAL RETURN(d) | (6.32 | )% | (0.63 | )% | (27.23 | )% | 5.61 | % | 7.59 | % | 12.68 | % | ||||||||||||
| RATIOS/SUPPLEMENTAL DATA: | ||||||||||||||||||||||||
| Net assets, end of year (000s) | $ | 15,776 | $ | 11,122 | $ | 14,393 | $ | 10,619 | $ | 8,223 | $ | 928 | ||||||||||||
| Ratio of expenses to average net assets before waivers, franchise tax expense and income tax expense/benefit | 1.55 | % | 1.71 | % | 1.77 | % | 2.20 | %(e) | 3.09 | % | 5.51 | %(e)(f) | ||||||||||||
| Ratio of expense waivers to average net assets | (0.36 | %) | (0.50 | %) | (0.53 | %) | (0.97 | %)(e) | (1.84 | %) | (4.26 | %)(e)(f) | ||||||||||||
| Ratio of expenses to average net assets net of waivers before franchise tax expense and income tax expense/benefit | 1.19 | % | 1.21 | % | 1.24 | % | 1.23 | %(e) | 1.25 | % | 1.25 | %(e)(f) | ||||||||||||
| Ratio of franchise tax expense and income tax expense/(benefit) to average net assets(g) | 0.01 | % | (0.02 | %) | (4.03 | %) | 4.49 | %(e) | 5.38 | % | 20.55 | %(e) | ||||||||||||
| Ratio of total expenses to average net assets | 1.20 | % | 1.19 | % | (2.79 | %) | 5.72 | %(e) | 6.63 | % | 21.80 | %(e) | ||||||||||||
| Ratio of investment loss to average net assets before waivers, franchise tax expense and income tax expense/benefit | (1.55 | %) | (1.71 | %) | (1.77 | %) | (2.20 | %)(e) | (3.09 | %) | (5.51 | %)(e)(f) | ||||||||||||
| Ratio of expense waivers to average net assets | (0.36 | %) | (0.50 | %) | (0.53 | %) | (0.97 | %)(e) | (1.84 | %) | (4.26 | %)(e)(f) | ||||||||||||
| Ratio of investment loss to average net assets net of waivers before franchise tax expense and income tax expense/benefit | (1.19 | %) | (1.21 | %) | (1.24 | %) | (1.23 | %)(e) | (1.25 | %) | (1.25 | %)(e)(f) | ||||||||||||
| Ratio of franchise tax expense and income tax (expense)/benefit to average net assets(h) | (0.01 | %) | (0.02 | %) | (0.34 | %) | 0.43 | %(e) | 0.43 | % | 0.40 | %(e) | ||||||||||||
| Ratio of net investment loss to average net assets | (1.20 | %) | (1.23 | %) | (1.58 | %) | (0.80 | %)(e) | (0.82 | %) | (0.85 | %)(e) | ||||||||||||
| Portfolio turnover rate(i) | 37 | % | 63 | % | 52 | % | 7 | % | 63 | % | 3 | % | ||||||||||||
| See Notes to Financial Statements. |
13 | October 31, 2017
| ALPS | Alerian MLP Infrastructure Index Fund – Class A |
Financial Highlights
Selected data for a share of beneficial interest outstanding throughout the periods indicated:
| (a) | Effective May 1, 2014, the Board approved changing the fiscal year-end of the Funds from April 30 to October 31. |
| (b) | Calculated using the average shares method. |
| (c) | Less than $0.005 or ($0.005) per share. |
| (d) | Total returns are for the period indicated and have not been annualized. Total returns would have been lower had certain expenses not been waived during the period. Returns shown do not reflect the deduction of taxes that a shareholder would pay on Fund distributions or the redemption of Fund shares. Returns shown exclude any applicable sales charges. |
| (e) | Annualized. |
| (f) | Expense ratios before reductions for startup periods may not be representative of longer term operating periods. |
| (g) | Adjustment for income tax expense estimate for the ratio calculation is derived from the net investment loss, and realized and unrealized gains/losses. |
| (h) | Adjustment for income tax benefit for the ratio calculation is derived from net investment loss only. |
| (i) | Portfolio turnover rate for periods less than one full year have not been annualized. |
See Notes to Financial Statements.
14 | October 31, 2017
ALPS | Alerian MLP Infrastructure Index Fund – Class C
Financial Highlights
Selected data for a share of beneficial interest outstanding throughout the periods indicated:
| For the Year Ended October 31, 2017 | For the Year Ended October 31, 2016 | For the Year Ended October 31, 2015 | For the Fiscal Period Ended October 31, 2014(a) | For the Year Ended April 30, 2014 | For the Period January 2, 2013 (Commencement) to April 30, 2013 | |||||||||||||||||||
| Net asset value, beginning of period | $ | 6.81 | $ | 7.54 | $ | 11.23 | $ | 11.17 | $ | 11.09 | $ | 10.00 | ||||||||||||
| INCOME/(LOSS) FROM INVESTMENT OPERATIONS: | ||||||||||||||||||||||||
| Net investment loss(b) | (0.13 | ) | (0.12 | ) | (0.22 | ) | (0.07 | ) | (0.13 | ) | (0.05 | ) | ||||||||||||
| Net realized and unrealized gain/(loss) | (0.31 | ) | (0.01 | ) | (2.73 | ) | 0.66 | 0.89 | 1.30 | |||||||||||||||
| Total from investment operations | (0.44 | ) | (0.13 | ) | (2.95 | ) | 0.59 | 0.76 | 1.25 | |||||||||||||||
| DISTRIBUTIONS: | ||||||||||||||||||||||||
| From net investment income | – | (0.02 | ) | (0.00 | )(c) | (0.08 | ) | (0.35 | ) | – | ||||||||||||||
| From tax return of capital | (0.50 | ) | (0.58 | ) | (0.74 | ) | (0.45 | ) | (0.33 | ) | (0.16 | ) | ||||||||||||
| Total distributions | (0.50 | ) | (0.60 | ) | (0.74 | ) | (0.53 | ) | (0.68 | ) | (0.16 | ) | ||||||||||||
| Net increase/(decrease) in net asset value | (0.94 | ) | (0.73 | ) | (3.69 | ) | 0.06 | 0.08 | 1.09 | |||||||||||||||
| Net asset value, end of year | $ | 5.87 | $ | 6.81 | $ | 7.54 | $ | 11.23 | $ | 11.17 | $ | 11.09 | ||||||||||||
| TOTAL RETURN(d) | (7.00 | )% | (1.04 | )% | (27.18 | )% | 5.37 | % | 7.13 | % | 12.58 | % | ||||||||||||
| RATIOS/SUPPLEMENTAL DATA: | ||||||||||||||||||||||||
| Net assets, end of year (000s) | $ | 8,283 | $ | 9,078 | $ | 8,291 | $ | 6,773 | $ | 3,429 | $ | 563 | ||||||||||||
| Ratio of expenses to average net assets before waivers, franchise tax expense and income tax expense/benefit | 2.21 | % | 2.35 | % | 2.38 | % | 2.82 | %(e) | 3.71 | % | 7.01 | %(e)(f) | ||||||||||||
| Ratio of expense waivers to average net assets | (0.36 | %) | (0.50 | %) | (0.53 | %) | (0.97 | %)(e) | (1.86 | %) | (5.16 | %)(e)(f) | ||||||||||||
| Ratio of expenses to average net assets net of waivers before franchise tax expense and income tax expense/benefit | 1.85 | % | 1.85 | % | 1.85 | % | 1.85 | %(e) | 1.85 | % | 1.85 | %(e)(f) | ||||||||||||
| Ratio of franchise tax expense and income tax expense/(benefit) to average net assets(g) | 0.01 | % | (0.02 | %) | (4.09 | %) | 4.27 | %(e) | 5.16 | % | 20.55 | %(e) | ||||||||||||
| Ratio of total expenses to average net assets | 1.86 | % | 1.83 | % | (2.24 | %) | 6.12 | %(e) | 7.01 | % | 22.40 | %(e) | ||||||||||||
| Ratio of investment loss to average net assets before waivers, franchise tax expense and income tax expense/benefit | (2.21 | %) | (2.35 | %) | (2.38 | %) | (2.82 | %)(e) | (3.71 | %) | (7.01 | %)(e)(f) | ||||||||||||
| Ratio of expense waivers to average net assets | (0.36 | %) | (0.50 | %) | (0.53 | %) | (0.97 | %)(e) | (1.86 | %) | (5.16 | %)(e)(f) | ||||||||||||
| Ratio of investment loss to average net assets net of waivers before franchise tax expense and income tax expense/benefit | (1.85 | %) | (1.85 | %) | (1.85 | %) | (1.85 | %)(e) | (1.85 | %) | (1.85 | %)(e)(f) | ||||||||||||
| Ratio of franchise tax expense and income tax (expense)/benefit to average net assets(h) | (0.01 | %) | (0.02 | %) | (0.40 | %) | 0.65 | %(e) | 0.65 | % | 0.40 | %(e) | ||||||||||||
| Ratio of net investment loss to average net assets | (1.86 | %) | (1.87 | %) | (2.25 | %) | (1.20 | %)(e) | (1.20 | %) | (1.45 | %)(e) | ||||||||||||
| Portfolio turnover rate(i) | 37 | % | 63 | % | 52 | % | 7 | % | 63 | % | 3 | % | ||||||||||||
See Notes to Financial Statements.
15 | October 31, 2017
ALPS | Alerian MLP Infrastructure Index Fund – Class C
Financial Highlights
Selected data for a share of beneficial interest outstanding throughout the periods indicated:
| (a) | Effective May 1, 2014, the Board approved changing the fiscal year-end of the Funds from April 30 to October 31. |
| (b) | Calculated using the average shares method. |
| (c) | Less than $0.005 or ($0.005) per share. |
| (d) | Total returns are for the period indicated and have not been annualized. Total returns would have been lower had certain expenses not been waived during the period. Returns shown do not reflect the deduction of taxes that a shareholder would pay on Fund distributions or the redemption of Fund shares. Returns shown exclude any applicable sales charges. |
| (e) | Annualized. |
| (f) | Expense ratios before reductions for startup periods may not be representative of longer term operating periods. |
| (g) | Adjustment for income tax expense estimate for the ratio calculation is derived from the net investment loss, and realized and unrealized gains/losses. |
| (h) | Adjustment for income tax benefit for the ratio calculation is derived from net investment loss only. |
| (i) | Portfolio turnover rate for periods less than one full year have not been annualized. |
See Notes to Financial Statements.
16 | October 31, 2017
ALPS | Alerian MLP Infrastructure Index Fund – Class I
Financial Highlights
Selected data for a share of beneficial interest outstanding throughout the periods indicated:
| For the Year Ended October 31, 2017 | For the Year Ended October 31, 2016 | For the Year Ended October 31, 2015 | For the Fiscal Period Ended October 31, 2014(a) | For the Year Ended April 30, 2014 | For the Period January 2, 2013 (Commencement) to April 30, 2013 | |||||||||||||||||||
| Net asset value, beginning of period | $ | 6.97 | $ | 7.66 | $ | 11.36 | $ | 11.25 | $ | 11.11 | $ | 10.00 | ||||||||||||
| INCOME/(LOSS) FROM INVESTMENT OPERATIONS: | ||||||||||||||||||||||||
| Net investment loss(b) | (0.06 | ) | (0.06 | ) | (0.11 | ) | (0.03 | ) | (0.06 | ) | (0.02 | ) | ||||||||||||
| Net realized and unrealized gain/(loss) | (0.32 | ) | (0.03 | ) | (2.85 | ) | 0.67 | 0.88 | 1.29 | |||||||||||||||
| Total from investment operations | (0.38 | ) | (0.09 | ) | (2.96 | ) | 0.64 | 0.82 | 1.27 | |||||||||||||||
| DISTRIBUTIONS: | ||||||||||||||||||||||||
| From net investment income | – | (0.02 | ) | (0.00 | )(c) | (0.04 | ) | (0.27 | ) | – | ||||||||||||||
| From tax return of capital | (0.50 | ) | (0.58 | ) | (0.74 | ) | (0.49 | ) | (0.41 | ) | (0.16 | ) | ||||||||||||
| Total distributions | (0.50 | ) | (0.60 | ) | (0.74 | ) | (0.53 | ) | (0.68 | ) | (0.16 | ) | ||||||||||||
| Net increase/(decrease) in net asset value | (0.88 | ) | (0.69 | ) | (3.70 | ) | 0.11 | 0.14 | 1.11 | |||||||||||||||
| Net asset value, end of year | $ | 6.09 | $ | 6.97 | $ | 7.66 | $ | 11.36 | $ | 11.25 | $ | 11.11 | ||||||||||||
| TOTAL RETURN(d) | (5.96 | )% | (0.48 | )% | (26.95 | )% | 5.78 | % | 7.68 | % | 12.78 | % | ||||||||||||
| RATIOS/SUPPLEMENTAL DATA: | ||||||||||||||||||||||||
| Net assets, end of year (000s) | $ | 21,063 | $ | 20,492 | $ | 4,472 | $ | 6,658 | $ | 1,507 | $ | 2,256 | ||||||||||||
| Ratio of expenses to average net assets before waivers, franchise tax expense and income tax expense/benefit | 1.21 | % | 1.35 | % | 1.38 | % | 1.81 | %(e) | 3.03 | % | 6.01 | %(e)(f) | ||||||||||||
| Ratio of expense waivers to average net assets | (0.36 | %) | (0.50 | %) | (0.53 | %) | (0.96 | %)(e) | (2.18 | %) | (5.16 | %)(e)(f) | ||||||||||||
| Ratio of expenses to average net assets net of waivers before franchise tax expense and income tax expense/benefit | 0.85 | % | 0.85 | % | 0.85 | % | 0.85 | %(e) | 0.85 | % | 0.85 | %(e)(f) | ||||||||||||
| Ratio of franchise tax expense and income tax expense/(benefit) to average net assets(g) | 0.01 | % | (0.02 | %) | (3.92 | %) | 4.63 | %(e) | 5.53 | % | 20.55 | %(e) | ||||||||||||
| Ratio of total expenses to average net assets | 0.86 | % | 0.83 | % | (3.07 | %) | 5.48 | %(e) | 6.38 | % | 21.40 | %(e) | ||||||||||||
| Ratio of investment loss to average net assets before waivers, franchise tax expense and income tax expense/benefit | (1.21 | %) | (1.35 | %) | (1.38 | %) | (1.81 | %)(e) | (3.03 | %) | (6.01 | %)(e)(f) | ||||||||||||
| Ratio of expense waivers to average net assets | (0.36 | %) | (0.50 | %) | (0.53 | %) | (0.96 | %)(e) | (2.18 | %) | (5.16 | %)(e)(f) | ||||||||||||
| Ratio of investment loss to average net assets net of waivers before franchise tax expense and income tax expense/benefit | (0.85 | %) | (0.85 | %) | (0.85 | %) | (0.85 | %)(e) | (0.85 | %) | (0.85 | %)(e)(f) | ||||||||||||
| Ratio of franchise tax expense and income tax (expense)/benefit to average net assets(h) | (0.01 | %) | (0.02 | %) | (0.23 | %) | 0.28 | %(e) | 0.29 | % | 0.40 | %(e) | ||||||||||||
| Ratio of net investment loss to average net assets | (0.86 | %) | (0.87 | %) | (1.08 | %) | (0.57 | %)(e) | (0.56 | %) | (0.45 | %)(e) | ||||||||||||
| Portfolio turnover rate(i) | 37 | % | 63 | % | 52 | % | 7 | % | 63 | % | 3 | % | ||||||||||||
See Notes to Financial Statements.
17 | October 31, 2017
ALPS | Alerian MLP Infrastructure Index Fund – Class I
Financial Highlights
Selected data for a share of beneficial interest outstanding throughout the periods indicated:
| (a) | Calculated using the average shares method. |
| (b) | Total returns are for the period indicated and have not been annualized. Total returns would have been lower had certain expenses not been waived during the period. Returns shown do not reflect the deduction of taxes that a shareholder would pay on Fund distributions or the redemption of Fund shares. |
| (c) | Adjustment for income tax expense estimate for the ratio calculation is derived from the net investment loss, and realized and unrealized gains/losses. |
| (d) | Adjustment for income tax benefit for the ratio calculation is derived from net investment loss only. |
| (e) | Portfolio turnover rate for periods less than one full year have not been annualized. |
| (f) | Effective May 1, 2014, the Board approved changing the fiscal year-end of the Funds from April 30 to October 31. |
| (g) | Less than $0.005 or ($0.005) per share. |
| (h) | Annualized. |
| (i) | Expense ratios before reductions for startup periods may not be representative of longer term operating periods. |
See Notes to Financial Statements.
18 | October 31, 2017
ALPS | CoreCommodity Management CompleteCommodities® Strategy Fund
| Management Commentary | October 31, 2017 (Unaudited) |
The 12 month period ending on October 31, 2017 produced modestly positive returns for commodities, as measured by the diversified Bloomberg Commodity Index Total Return, up 2.35%. On the other hand, commodity equities appreciated much more robustly during the period, climbing 22.37% as measured by the Standard and Poor’s Global Natural Resources Net Total Return Index. Commodity equities performed almost equal to the broader Standard & Poor’s 500 Total Return Index for the period which posted 23.63% gains. The ALPS CoreCommodity Complete Commodities Strategy Fund (the “Fund”) (JCRIX) delivered a net positive return of +5.03% (JCRAX was -0.86% at MOP and JCRCX was up +3.10% with CDSC).
The Fund outperformed its benchmark, the Bloomberg Commodity Index Total Return (“BCOM”), by 268 basis points during this period (measured against the performance of the “I” shares). The Fund employs a strategy that combines an actively managed portfolio of commodity futures related exposure (collateralized by U.S. Treasury Inflation Protected Securities (“TIPS”)), commodity equities, and physical commodity ETF’s. At the end of October, the Fund allocated approximately 71.8% of its assets toward commodity futures related investments and approximately 28.2% of its assets in commodity equities. The Fund was more than 99% invested at the end of the period.
During the 12month period ending in October 2017, the Fund held sector weights which averaged approximately 43% energy, 36% agriculture, 13% industrial metals, and 8% precious metals. Within each sector, the Fund allocated differing quantities of individual commodities compared to BCOM weightings while maintaining an unleveraged, diversified portfolio.
In terms of weighting, the Fund’s agricultural sector was the closest of the four to the BCOM; 36% for the Fund and 35% for BCOM. Interestingly, the Fund’s greatest gross outperformance by sector occurred within agriculture. The Fund’s agriculture futures-related investments lost -8.1% for the 12 month period ending October 2017 while BCOM’s Agriculture sub-index total return recorded an -8.7% decline. The primary driver of the outperformance on the futures side was individual weighting and selection. The Fund held a greater percentage of live cattle futures relative to BCOM. Live cattle was near the top in performance, up 31.86% for the year. On the flip side, the Fund held higher percentage weightings in both coffee and sugar futures then BCOM, two of the worst performers in the BCOM, down -28.64% and -26.08% respectively. Another major positive difference between the Fund’s performance in the agricultural sector and the BCOM was derived from the inclusion of commodity producers’ equities. Those producers had a net positive performance within the portfolio of +21.0%. The combined performance of the Fund’s futures and equity exposure to agriculture was down approximately -30 basis points for period. BCOM’s Agriculture sub-index total return fell -8.7%. Applying the appropriate weighting for the sector, the contribution to return resulted in about 320 basis points of outperformance at the Fund level.
Energy prices appreciated during the 12 month period ending in October 2017. Petroleum products led the way, with reformulated gasoline (RBOB) and heating oil gaining 20.30% and 16.14% respectively. Brent North Sea crude went higher, posting a 14.85% year over year performance while West Texas Intermediate added 6.29%. The Fund held a significant overweight in this sector relative to BCOM, an average of 43% compared to 29% for BCOM. The Fund concentrated most of its overweight in petroleum and products within energy, while remaining underweighted natural gas relative to BCOM. Natural gas prices fell -12.74% for the period, resulting in Fund’s outperformance versus BCOM. Within the energy sector, energy-related producers (equities) did not fare as well as the futures, falling just about -20 basis points for the period. However the combined performance of the Fund’s energy sector produced a total return of +7.3% vs. BCOM Energy Sub-Index Total Return’s +2.3%. After adjusting for weighting in the total portfolio, the Fund’s Energy portion outperformed by about 230 basis points in the energy sector.
Industrial metals provided the largest sector advance within the BCOM for the 12 month period ending in October 2017. BCOM Industrial Metals’ sub-index total return moved significantly higher, up 29.5% for the period. Copper prices rose 38.90% while aluminum climbed 21.82%. Nickel registered a 15.67% gain. Global growth rates nudged higher while supplies remained relatively constrained. The anticipated infrastructure stimulus in the United States did not move forward as of the October close. The Fund held an underweight relative to BCOM in industrial metals, 13% vs. 19% for BCOM. The combined portfolio of futures and producers (equities) provided a total return of +29.9%, about 40 basis points above BCOM Industrial Sub-Index Total Return performance. However, the underweight in the sector resulted in a -160 basis point underperformance.
Precious metals prices struggled during the 12 month period ending in October 2017, declining by approximately -280 basis points within the BCOM. The Fund held an underweight in this sector relative to BCOM, 8% vs 16% for the period. Gold prices went down modestly, -1.66%, while silver prices declined by -8.12%. The Fund’s combined portfolio of futures-related and commodity producer investments in precious metals declined by -6.40% compared to BCOM’s -2.80%. Adjusting for weightings in the Fund’s overall portfolio and for the whole BCOM Index, the difference in contribution to returns was negligible. The Fund’s Precious allocation essentially performed in line with BCOM Precious sub-index total return for the period.
The US Dollar weakened during the 12 month period ending in October 2017, dropping -3.96% as measured by the US Dollar Index (“DXY”). Since most commodities are priced in Dollars, commodity prices tend to be inversely related to Dollar moves. Because of this tendency, the positive results for many commodities this year was somewhat consistent with the negative Dollar performance.
The Fund’s top equity holdings at the end of October 2017 included Sanderson Farms Inc (SAFM) +61.06% YTD, Yara International (YAR NO) +24.22% YTD, Lundin Mining Corporation (LUN CN) +62.15% YTD, Ingredion Incorporated (INGR US) +1.66% YTD, Marathon
19 | October 31, 2017
ALPS | CoreCommodity Management CompleteCommodities® Strategy Fund
| Management Commentary | October 31, 2017 (Unaudited) |
Petroleum Corporation (MPC US) +21.22% YTD, Fortescue Metal Group Ltd. (FMG AU) -12.86% YTD, Marine Harvest NO (MHG NO) +14.72 % YTD, Valero Energy Corp. (VLO US) +19.14% YTD, Kubota Corporation (6326 JP) +31.56 YTD, OZ Minerals Ltd. (OZL AU) +12.07% YTD
TIPS and nominal US Treasuries are held by the Fund to invest excess cash and as collateral for commodity futures related investments held in the Fund’s Cayman Island subsidiary. Nominal yields on the benchmark 10 year note were at 1.825% at the end of October 2016 and ended the twelve month period higher, 2.38%. Committee members of the FOMC raised short term interest rates via the Federal Funds rate three times during the past year from 50 basis points to 125 basis points. The desire to “normalize” rates and the Fed’s balance sheet has been a factor helping to move rates higher. We still believe that there may be considerable resistance to raising rates from here. Certainly the pace of the interest rate hikes will likely be determined by the economic data, including readings on inflation. Nonetheless, we believe we may be nearing the end of what has been a significant multi-year rally in US treasury prices. As a result, we continue to invest in TIPS and nominal US Treasuries with limited duration exposure. At the end of October 2017, our weighted average maturity was approximately 0.9 years in our TIPS and nominal US Treasury portfolio.
We strongly believe that the long term fundamental drivers of commodity demand and ultimately higher prices are still in place. Population growth is likely to remain unabated regardless of the economic environment in the US and Europe. A billion more people are likely to be added to the world population over the next decade or so. The trend of wealth distribution is tipping toward the developing world as those economies grow at faster rates relative to the slow or negative growth occurring in the developed countries. The improving global quality of life is contributing to ever increasing demand for raw materials and food. Incremental gains in disposable income in the developing nations have led to competition for the commodities needed for more complex and costly lifestyles.
While it is true that commodity prices have rallied significantly in percentage terms from the lows established in the first quarter of 2016, the absolute price levels of many commodities, including crude oil, have not gone high enough to stimulate the necessary capital expenditures to assure future supply growth to satisfy future demand. Producers need profit margins to operate, to explore for new sources, and to secure financing. Throughout a good portion of the 12 month period ending in October, the US and the world has been draining above-ground supplies from storage. Current demand is outstripping supplies in certain commodities. Ultimately that could lead to higher, more volatile prices. The price cycle for many commodities seems to be shifting from favoring consumers to rewarding the producers. We believe Commodities may become much more interesting from an investment point of view as sentiment for the asset class ascends with these potential price increases.
The Standard & Poor’s Global Natural Resources Index includes 90 of the largest publicly-traded companies in natural resources and commodities businesses that meet specific investability requirements, offering investors diversified and investable equity exposure across 3 primary commodity-related sectors: agribusiness, energy, and metals & mining. It does not reflect any deduction for fees, expenses, or taxes.
The Standard & Poor’s 500® Index is a composite index of 500 stocks, a widely recognized, unmanaged index of common stock prices which does not reflect any deduction for fees, expenses, or taxes
An investor may not invest directly in an index.
The views of the author and information discussed in this commentary are as of the date of publication, are subject to change, and may not reflect the writer’s current views. The views expressed are those of the author only, and represent an assessment of market conditions at a specific point in time, are opinions only and should not be relied upon as investment advice regarding a particular investment or markets in general. Such information does not constitute a recommendation to buy or sell specific securities or investment vehicles. It should not be assumed that any investment will be profitable or will equal the performance of the fund(s) or any securities or any sectors mentioned in this letter. The subject matter contained in this letter has been derived from several sources believed to be reliable and accurate at the time of compilation. Neither ALPS Advisors, Inc., CoreCommodity Management, LLC, nor the Fund accepts any liability for losses either direct or consequential caused by the use of this information.
Diversification cannot guarantee gain or prevent losses.
20 | October 31, 2017
ALPS | CoreCommodity Management CompleteCommodities® Strategy Fund
| Performance Update | October 31, 2017 (Unaudited) |
Performance of $10,000 Initial Investment (as of October 31, 2017)
Comparison of change in value of a $10,000 investment (includes maximum sales charges of 5.50%)

The chart above represents historical performance of a hypothetical investment of $10,000 in the Fund since inception. Past performance does not guarantee future results. This chart does not reflect the deduction of taxes that a shareholder would pay on Fund distributions or the redemption of Fund shares.
Average Annual Total Returns (as of October 31, 2017)
| 6 Month | 1 Year | 3 Year | 5 Year | Since Inception^ | Total Expense Ratio | What You Pay* | |
| Class A (NAV) | 5.08% | 4.85% | -7.15% | -6.50% | -1.75% | 1.45% | 1.45% |
| Class A (MOP) | -0.65% | -0.86% | -8.89% | -7.56% | -2.51% | ||
| Class C (NAV) | 4.69% | 4.10% | -7.76% | -7.10% | -2.35% | 2.05% | 2.05% |
| Class C (CDSC) | 3.69% | 3.10% | -7.76% | -7.10% | -2.35% | ||
| Class I | 5.07% | 5.03% | -6.92% | -6.25% | -1.49% | 1.15% | 1.15% |
| TR/CC CRB Total Return Index 1 | 3.75% | 1.51% | -11.32% | -8.49% | -3.98% | ||
| Bloomberg Commodity TR Index1 | 3.13% | 2.35% | -9.54% | -9.37% | -4.67% |
Performance data quoted represents past performance. Past performance does not guarantee future results. Investment return and principal value of an investment will fluctuate so that an investor’s shares, when sold or redeemed, may be worth more or less than the original cost. Current performance data may be higher or lower than actual data quoted. For the most current month-end performance data, please call 1-866-759-5679.
Maximum Offering Price (MOP) for Class A shares includes the Fund’s maximum sales charge of 5.50%. Performance shown at NAV does not include these sales charges and would have been lower had it been taken into account. If you invest $1 million or more, either as a lump sum or through the Fund’s accumulation or letter of intent programs, you can purchase Class A shares without an initial sales charge (load). A Contingent Deferred Sales Charge (“CDSC”) of 1.00% may apply to Class C shares redeemed within the first 12 months after a purchase, and on Class A shares redeemed within the first 18 months after a purchase in excess of $1 million. The Fund imposes a 2.00% redemption fee on shares held for less than 30 days.
Performance less than 1 year is cumulative.
21 | October 31, 2017
ALPS | CoreCommodity Management CompleteCommodities® Strategy Fund
| Performance Update | October 31, 2017 (Unaudited) |
| 1 | Thomson Reuters/CC CRB Total Return Index and the Bloomberg Commodity TR Index (formerly the Dow Jones-UBS Commodity Index) are unmanaged indices used as a measurement of change in commodity market conditions based on the performance of a basket of different commodities. Each index is composed of a different basket of commodities, a different weighting of the commodities in the basket, and a different re-balancing schedule. The indices are not actively managed and do not reflect any deduction for fees, expenses or taxes. An investor may not invest directly in an index. |
| ^ | Fund Inception date of June 29, 2010. |
| * | What You Pay reflects the Advisor’s decision to contractually limit expenses through February 28, 2018. Please see the prospectus for additional information. |
Investments in securities of MLPs involve risks that differ from an investment in common stock. MLPs are controlled by their general partners, which generally have conflicts of interest and limited fiduciary duties to the MLP, which may permit the general partner to favor its own interests over the MLPs. The benefit you are expected to derive from the Fund’s investment in MLPs depends largely on the MLPs being treated as partnerships for federal income tax purposes. As a partnership, an MLP has no federal income tax liability at the entity level. Therefore, treatment of one or more MLPs as a corporation for federal income tax purposes could affect the Fund’s ability to meet its investment objective and would reduce the amount of cash available to pay or distribute to you. Legislative, judicial, or administrative changes and differing interpretations, possibly on a retroactive basis, could negatively impact the value of an investment in MLPs and therefore the value of your investment in the Fund.
Investing in commodity-related securities involves risk and considerations not present when investing in more conventional securities. The Fund may be more susceptible to high volatility of commodity markets.
Derivatives generally are more sensitive to changes in economic or market conditions than other types of investments; this could result in losses that significantly exceed the Fund’s original investment.
The table does not reflect the deduction of taxes that a shareholder would pay on Fund distributions or the redemption of Fund shares.
This Fund is not suitable for all investors, and is subject to investment risks, including possible loss of the principal amount invested.
There is no guarantee that the Fund will continue to hold any one particular security or stay invested in any one particular company. The composition of the Fund’s top holdings is subject to change. Performance figures are historical and reflect the change in share price, reinvested distributions, changes in net asset value, sales charges and capital gains distributions, if any.
Not FDIC Insured – No Bank Guarantee – May Lose Value
Asset Type Allocation (as a % of Net Assets) †
| Common Stocks | 27.17 | % | ||
| Government Bonds | 58.57 | % | ||
| Master Limited Partnerships | 0.28 | % | ||
| U.S. Treasury Bills | 5.55 | % | ||
| Rights | 0.01 | % | ||
| Short Term Investments and Other Assets | 8.42 | % | ||
| Total | 100.00 | % | ||
| † | Holdings are subject to change, and may not reflect the current or future position of the portfolio. Table presents approximate values only. |
Industry Sector Allocation (as a % of Net Assets)

22 | October 31, 2017
ALPS | CoreCommodity Management CompleteCommodities® Strategy Fund
| Consolidated Statement of Investments | October 31, 2017 |
| Shares | Value (Note 2) | |||||||
| COMMON STOCKS (27.17%) | ||||||||
| Argentina (0.12%) | ||||||||
| Adecoagro SA(a) | 50,405 | $ | 512,115 | |||||
| YPF SA, Sponsored ADR | 6,231 | 153,033 | ||||||
| 665,148 | ||||||||
| Australia (1.86%) | ||||||||
| Alumina, Ltd. | 306,469 | 548,861 | ||||||
| BHP Billiton, Ltd. | 3,582 | 72,759 | ||||||
| BlueScope Steel, Ltd. | 116,156 | 1,141,477 | ||||||
| Fortescue Metals Group, Ltd. | 502,640 | 1,784,987 | ||||||
| GrainCorp, Ltd., Class A | 85,256 | 554,631 | ||||||
| Iluka Resources, Ltd. | 60,429 | 434,282 | ||||||
| Incitec Pivot, Ltd. | 328,759 | 961,173 | ||||||
| Independence Group NL | 77,396 | 237,533 | ||||||
| Newcrest Mining, Ltd. | 1,623 | 27,837 | ||||||
| Northern Star Resources, Ltd. | 7,245 | 28,945 | ||||||
| Nufarm, Ltd. | 95,715 | 665,160 | ||||||
| Oil Search, Ltd. | 102,346 | 578,080 | ||||||
| OZ Minerals, Ltd. | 253,710 | 1,563,124 | ||||||
| Regis Resources, Ltd. | 42,843 | 127,553 | ||||||
| Santos, Ltd.(a) | 7,201 | 24,801 | ||||||
| South32, Ltd. | 276,844 | 714,045 | ||||||
| Western Areas, Ltd. | 156,235 | 333,613 | ||||||
| Woodside Petroleum, Ltd. | 8,211 | 193,116 | ||||||
| 9,991,977 | ||||||||
| Austria (0.07%) | ||||||||
| OMV AG | 21 | 1,262 | ||||||
| voestalpine AG | 6,748 | 371,286 | ||||||
| 372,548 | ||||||||
| Brazil (0.71%) | ||||||||
| BRF SA, ADR(a) | 33,459 | 450,693 | ||||||
| Cia de Saneamento Basico do Estado de Sao Paulo, ADR | 112,065 | 1,022,033 | ||||||
| Cia Siderurgica Nacional SA, Sponsored ADR(a) | 211,328 | 534,660 | ||||||
| Gerdau SA, Sponsored ADR | 426,813 | 1,412,751 | ||||||
| Vale SA, Sponsored ADR | 42,979 | 420,764 | ||||||
| 3,840,901 | ||||||||
| Canada (5.19%) | ||||||||
| Advantage Oil & Gas, Ltd.(a) | 80,500 | 426,180 | ||||||
| Agnico Eagle Mines, Ltd. | 7,290 | 325,353 | ||||||
| Agrium, Inc. | 2,571 | 280,033 | ||||||
| Alamos Gold, Inc., Class A | 9,173 | 57,973 | ||||||
| ARC Resources, Ltd. | 62,887 | 766,772 | ||||||
| Barrick Gold Corp. | 38,175 | 551,629 | ||||||
| Baytex Energy Corp.(a) | 57,800 | 159,050 | ||||||
| Birchcliff Energy, Ltd. | 128,800 | 524,145 | ||||||
| Bonavista Energy Corp. | 122,700 | 260,598 | ||||||
| Cameco Corp. | 31,300 | 254,782 | ||||||
| Canadian Energy Services & Technology Corp. | 32,100 | 172,928 | ||||||
| Canadian Solar, Inc.(a) | 19,387 | 341,405 | ||||||
| Cenovus Energy, Inc. | 104,000 | 1,009,286 | ||||||
| Shares | Value (Note 2) | |||||||
| Canada (continued) | ||||||||
| Centerra Gold, Inc.(a) | 101,400 | $ | 688,523 | |||||
| Crescent Point Energy Corp. | 183,878 | 1,512,245 | ||||||
| Crew Energy, Inc.(a) | 144,400 | 489,131 | ||||||
| Detour Gold Corp.(a) | 20,500 | 218,491 | ||||||
| Dominion Diamond Corp. | 18,268 | 260,319 | ||||||
| Eldorado Gold Corp. | 20,618 | 25,773 | ||||||
| Encana Corp. | 8,286 | 96,946 | ||||||
| Enerflex, Ltd. | 11,100 | 151,000 | ||||||
| Enerplus Corp. | 52,400 | 480,499 | ||||||
| First Majestic Silver Corp.(a) | 17,477 | 117,970 | ||||||
| First Quantum Minerals, Ltd. | 33,500 | 374,704 | ||||||
| Franco-Nevada Corp. | 4,108 | 326,340 | ||||||
| Freehold Royalties, Ltd. | 26,200 | 320,468 | ||||||
| Goldcorp, Inc. | 16,461 | 214,981 | ||||||
| Gran Tierra Energy, Inc.(a) | 49,870 | 108,218 | ||||||
| Guyana Goldfields, Inc.(a) | 10,300 | 36,726 | ||||||
| Hudbay Minerals, Inc. | 38,900 | 289,164 | ||||||
| Husky Energy, Inc.(a) | 55,413 | 718,166 | ||||||
| IAMGOLD Corp.(a) | 16,452 | 90,321 | ||||||
| Imperial Oil, Ltd. | 1,300 | 42,151 | ||||||
| Ivanhoe Mines, Ltd., Class A(a) | 62,600 | 226,604 | ||||||
| Kelt Exploration, Ltd.(a) | 64,000 | 350,733 | ||||||
| Kinross Gold Corp.(a) | 21,873 | 86,398 | ||||||
| Lundin Mining Corp. | 333,800 | 2,545,999 | ||||||
| MEG Energy Corp.(a) | 35,900 | 159,450 | ||||||
| Mullen Group, Ltd. | 20,800 | 272,959 | ||||||
| Nevsun Resources, Ltd. | 95,900 | 225,979 | ||||||
| New Gold, Inc.(a) | 27,527 | 90,564 | ||||||
| NuVista Energy, Ltd.(a) | 24,200 | 150,441 | ||||||
| OceanaGold Corp. | 105,400 | 282,679 | ||||||
| Osisko Gold Royalties, Ltd. | 29,369 | 369,702 | ||||||
| Pan American Silver Corp. | 12,674 | 206,966 | ||||||
| Paramount Resources, Ltd., Class A(a) | 15,300 | 261,859 | ||||||
| Parex Resources, Inc.(a) | 43,000 | 571,956 | ||||||
| Pason Systems, Inc. | 13,400 | 194,545 | ||||||
| Peyto Exploration & Development Corp. | 63,300 | 863,561 | ||||||
| Potash Corp. of Saskatchewan, Inc. | 12,771 | 248,651 | ||||||
| PrairieSky Royalty, Ltd. | 21,436 | 570,585 | ||||||
| Precision Drilling Corp.(a) | 89,606 | 267,922 | ||||||
| Pretium Resources, Inc.(a) | 12,944 | 145,879 | ||||||
| Raging River Exploration, Inc.(a) | 147,000 | 867,119 | ||||||
| Secure Energy Services, Inc. | 42,200 | 275,097 | ||||||
| Seven Generations Energy, Ltd., Class A(a) | 55,100 | 831,988 | ||||||
| ShawCor, Ltd. | 12,200 | 264,407 | ||||||
| Spartan Energy Corp.(a) | 79,600 | 421,415 | ||||||
| SSR Mining, Inc.(a) | 63,433 | 608,957 | ||||||
| Teck Resources, Ltd., Class B | 7,468 | 152,646 | ||||||
| TORC Oil & Gas, Ltd. | 129,200 | 680,000 | ||||||
| Torex Gold Resources, Inc.(a) | 13,700 | 188,918 | ||||||
| Tourmaline Oil Corp.(a) | 33,600 | 614,910 | ||||||
| Trican Well Service, Ltd.(a) | 96,300 | 362,030 | ||||||
| Turquoise Hill Resources, Ltd.(a) | 71,705 | 220,134 | ||||||
| Vermilion Energy, Inc. | 29,800 | 1,017,048 | ||||||
| Wheaton Precious Metals Corp. | 26,614 | 551,974 | ||||||
| Whitecap Resources, Inc. | 134,200 | 963,252 | ||||||
23 | October 31, 2017
ALPS | CoreCommodity Management CompleteCommodities® Strategy Fund
| Consolidated Statement of Investments | October 31, 2017 |
| Shares | Value (Note 2) | |||||||
| Canada (continued) | ||||||||
| Yamana Gold, Inc. | 44,266 | $ | 115,534 | |||||
| 27,921,131 | ||||||||
| Chile (0.21%) | ||||||||
| Sociedad Quimica y Minera de Chile SA, Sponsored ADR | 18,938 | 1,131,356 | ||||||
| China (0.29%) | ||||||||
| China Petroleum & Chemical Corp., Class H | 252,358 | 185,353 | ||||||
| CNOOC, Ltd., Sponsored ADR | 7,211 | 985,743 | ||||||
| PetroChina Co., Ltd., ADR | 5,807 | 380,359 | ||||||
| 1,551,455 | ||||||||
| Colombia (0.09%) | ||||||||
| Ecopetrol SA, Sponsored ADR | 44,505 | 493,560 | ||||||
| Denmark (0.20%) | ||||||||
| FLSmidth & Co. A/S | 6,011 | 412,134 | ||||||
| Vestas Wind Systems A/S | 7,588 | 669,329 | ||||||
| 1,081,463 | ||||||||
| Faroe Islands (0.13%) | ||||||||
| Bakkafrost P/F | 15,902 | 710,411 | ||||||
| Finland (0.07%) | ||||||||
| Outokumpu OYJ | 4,521 | 42,762 | ||||||
| Outotec OYJ(a) | 43,438 | 345,843 | ||||||
| 388,605 | ||||||||
| Germany (0.26%) | ||||||||
| K+S AG | 4,580 | 111,075 | ||||||
| Nordex SE(a) | 24,833 | 256,696 | ||||||
| Salzgitter AG | 10,429 | 504,273 | ||||||
| SMA Solar Technology AG | 11,067 | 513,013 | ||||||
| 1,385,057 | ||||||||
| Great Britain (0.98%) | ||||||||
| Antofagasta PLC | 9,379 | 118,899 | ||||||
| BP PLC, Sponsored ADR | 27,744 | 1,128,349 | ||||||
| Ensco PLC, Class A | 188,618 | 1,016,651 | ||||||
| FMC Technologies, Inc.(a) | 32,080 | 878,671 | ||||||
| John Wood Group PLC | 37,393 | 353,356 | ||||||
| Petrofac, Ltd. | 12,709 | 70,776 | ||||||
| Royal Dutch Shell PLC, Class A, Sponsored ADR | 3,991 | 251,553 | ||||||
| Royal Dutch Shell PLC, Class B | 6,862 | 220,690 | ||||||
| Subsea 7 SA | 40,450 | 679,944 | ||||||
| Tullow Oil PLC(a) | 17,523 | 42,357 | ||||||
| United Utilities Group PLC | 48,296 | 534,323 | ||||||
| 5,295,569 | ||||||||
| India (0.09%) | ||||||||
| Vedanta Resources PLC | 41,024 | 483,836 | ||||||
| Shares | Value (Note 2) | |||||||
| Israel (0.09%) | ||||||||
| SolarEdge Technologies, Inc.(a) | 15,457 | $ | 507,762 | |||||
| Tower Semiconductor, Ltd.(a) | 1 | 19 | ||||||
| 507,781 | ||||||||
| Italy (0.05%) | ||||||||
| Eni SpA, Sponsored ADR | 8,120 | 265,118 | ||||||
| Japan (2.08%) | ||||||||
| Daido Steel Co., Ltd. | 4,600 | 289,257 | ||||||
| GS Yuasa Corp. | 108,000 | 538,552 | ||||||
| Hitachi Metals, Ltd. | 48,800 | 627,462 | ||||||
| Inpex Corp. | 98,133 | 1,039,543 | ||||||
| Japan Petroleum Exploration Co., Ltd. | 19,200 | 393,270 | ||||||
| Kobe Steel, Ltd.(a) | 17,400 | 145,376 | ||||||
| Kubota Corp. | 85,800 | 1,600,851 | ||||||
| Kurita Water Industries, Ltd. | 16,616 | 524,616 | ||||||
| Maruichi Steel Tube, Ltd. | 16,300 | 494,569 | ||||||
| Megmilk Snow Brand Co., Ltd. | 4,100 | 114,305 | ||||||
| Mitsubishi Materials Corp. | 23,200 | 875,318 | ||||||
| Nippon Suisan Kaisha, Ltd. | 122,300 | 742,157 | ||||||
| Nisshin Steel Co., Ltd. | 29,000 | 419,806 | ||||||
| OSAKA Titanium Technologies Co., Ltd. | 8,500 | 129,475 | ||||||
| Sakata Seed Corp. | 15,600 | 469,900 | ||||||
| Sumitomo Forestry Co., Ltd. | 65,559 | 1,097,791 | ||||||
| Toho Zinc Co., Ltd. | 10,400 | 502,142 | ||||||
| Tokyo Steel Manufacturing Co., Ltd. | 73,400 | 630,037 | ||||||
| UACJ Corp. | 5,400 | 157,671 | ||||||
| Yamato Kogyo Co., Ltd. | 14,400 | 382,463 | ||||||
| 11,174,561 | ||||||||
| Jersey (0.12%) | ||||||||
| Randgold Resources, Ltd., ADR | 6,578 | 646,420 | ||||||
| Luxembourg (0.29%) | ||||||||
| APERAM SA | 9,087 | 488,868 | ||||||
| ArcelorMittal(a) | 5,056 | 144,970 | ||||||
| Ternium SA, Sponsored ADR | 29,709 | 921,276 | ||||||
| 1,555,114 | ||||||||
| Mexico (0.29%) | ||||||||
| Grupo Lala SAB de CV | 129,600 | 200,162 | ||||||
| Grupo Mexico SAB de CV, Series B | 209,383 | 680,951 | ||||||
| Industrias Penoles SAB de CV | 30,177 | 703,594 | ||||||
| 1,584,707 | ||||||||
| Netherlands (0.31%) | ||||||||
| Core Laboratories N.V. | 5,819 | 581,317 | ||||||
| Frank’s International N.V. | 36,103 | 238,641 | ||||||
| Fugro N.V.(a) | 27,192 | 350,480 | ||||||
| SBM Offshore N.V. | 27,872 | 497,390 | ||||||
| 1,667,828 | ||||||||
| Norway (1.51%) | ||||||||
| Aker BP ASA | 13,582 | 312,280 | ||||||
| Aker Solutions ASA(a)(b) | 25,002 | 137,193 | ||||||
| DNO ASA(a) | 266,580 | 323,107 | ||||||
24 | October 31, 2017
ALPS | CoreCommodity Management CompleteCommodities® Strategy Fund
| Consolidated Statement of Investments | October 31, 2017 |
| Shares | Value (Note 2) | |||||||
| Norway (continued) | ||||||||
| Leroy Seafood Group ASA | 124,475 | $ | 747,642 | |||||
| Marine Harvest ASA | 86,700 | 1,693,028 | ||||||
| Petroleum Geo-Services ASA(a) | 73,782 | 120,772 | ||||||
| Salmar ASA | 16,124 | 481,075 | ||||||
| Statoil ASA | 37,100 | 751,266 | ||||||
| TGS NOPEC Geophysical Co. ASA | 21,048 | 483,166 | ||||||
| Yara International ASA | 64,314 | 3,053,497 | ||||||
| 8,103,026 | ||||||||
| Peru (0.25%) | ||||||||
| Cia de Minas Buenaventura SAA, ADR | 2,365 | 32,613 | ||||||
| Southern Copper Corp. | 30,868 | 1,325,781 | ||||||
| 1,358,394 | ||||||||
| Singapore (0.21%) | ||||||||
| Wilmar International, Ltd. | 445,761 | 1,108,598 | ||||||
| South Africa (0.55%) | ||||||||
| African Rainbow Minerals, Ltd. | 79,916 | 701,220 | ||||||
| Exxaro Resources, Ltd. | 59,833 | 608,370 | ||||||
| Gold Fields, Ltd., Sponsored ADR | 127,938 | 507,914 | ||||||
| Impala Platinum Holdings, Ltd.(a) | 40,468 | 112,256 | ||||||
| Kumba Iron Ore, Ltd. | 15,133 | 291,127 | ||||||
| Sasol, Ltd. | 21,474 | 628,284 | ||||||
| Sibanye Gold, Ltd., Sponsored ADR | 16,963 | 87,020 | ||||||
| 2,936,191 | ||||||||
| South Korea (0.13%) | ||||||||
| POSCO, Sponsored ADR | 9,708 | 708,490 | ||||||
| Spain (0.09%) | ||||||||
| Acerinox SA | 32,798 | 471,256 | ||||||
| Sweden (0.49%) | ||||||||
| Boliden AB | 42,117 | 1,474,056 | ||||||
| Holmen AB, B Shares | 9,683 | 475,958 | ||||||
| Lundin Petroleum AB(a) | 11,251 | 264,622 | ||||||
| SSAB AB, A Shares(a) | 88,212 | 433,070 | ||||||
| 2,647,706 | ||||||||
| Switzerland (0.29%) | ||||||||
| Ferrexpo PLC | 135,944 | 458,969 | ||||||
| Glencore PLC | 13,047 | 62,902 | ||||||
| Noble Corp. PLC(a) | 25,665 | 106,766 | ||||||
| Syngenta AG | 1,169 | 539,300 | ||||||
| Transocean, Ltd.(a) | 31,936 | 335,328 | ||||||
| Weatherford International PLC(a) | 20,498 | 71,128 | ||||||
| 1,574,393 | ||||||||
| United States (10.15%) | ||||||||
| AK Steel Holding Corp.(a) | 242,162 | 1,111,524 | ||||||
| Alcoa Corp.(a) | 10,666 | 509,621 | ||||||
| American States Water Co. | 6,377 | 342,764 | ||||||
| American Water Works Co., Inc. | 4,056 | 355,955 | ||||||
| Andersons, Inc. | 11,781 | 441,198 | ||||||
| Antero Resources Corp.(a) | 34,762 | 674,383 | ||||||
| Shares | Value (Note 2) | |||||||
| United States (continued) | ||||||||
| Apache Corp. | 4,072 | $ | 168,459 | |||||
| Archer-Daniels-Midland Co. | 12,057 | 492,770 | ||||||
| Archrock, Inc. | 16,961 | 203,532 | ||||||
| Baker Hughes a GE Co. | 8,673 | 272,592 | ||||||
| Bristow Group, Inc. | 10,530 | 99,403 | ||||||
| Bunge, Ltd. | 14,386 | 989,469 | ||||||
| Cabot Oil & Gas Corp. | 12,214 | 338,328 | ||||||
| Calgon Carbon Corp. | 32,061 | 695,724 | ||||||
| California Resources Corp.(a) | 12,276 | 135,404 | ||||||
| California Water Service Group | 2,166 | 90,972 | ||||||
| Callon Petroleum Co.(a) | 25,078 | 278,115 | ||||||
| Cal-Maine Foods, Inc.(a) | 29,240 | 1,315,800 | ||||||
| Carpenter Technology Corp. | 11,547 | 574,925 | ||||||
| Carrizo Oil & Gas, Inc.(a) | 36,427 | 644,394 | ||||||
| Century Aluminum Co.(a) | 18,820 | 263,480 | ||||||
| Chesapeake Energy Corp.(a) | 11,489 | 44,807 | ||||||
| Chevron Corp. | 4,200 | 486,738 | ||||||
| Cimarex Energy Co. | 162 | 18,943 | ||||||
| Cliffs Natural Resources, Inc.(a) | 104,060 | 620,198 | ||||||
| ConocoPhillips | 6,841 | 349,917 | ||||||
| CONSOL Energy, Inc.(a) | 13,252 | 213,755 | ||||||
| Continental Resources, Inc.(a) | 34,896 | 1,420,616 | ||||||
| Darling Ingredients, Inc.(a) | 15,237 | 278,075 | ||||||
| Deere & Co. | 2,429 | 322,766 | ||||||
| Devon Energy Corp. | 5,070 | 187,083 | ||||||
| Diamond Offshore Drilling, Inc.(a) | 3,190 | 53,369 | ||||||
| Diamondback Energy, Inc.(a) | 7,413 | 794,377 | ||||||
| Dril-Quip, Inc.(a) | 18,368 | 773,293 | ||||||
| Energen Corp.(a) | 700 | 36,190 | ||||||
| Energy Recovery, Inc.(a) | 41,392 | 319,132 | ||||||
| EOG Resources, Inc. | 2,235 | 223,209 | ||||||
| EP Energy Corp., Class A(a) | 95,197 | 257,032 | ||||||
| EQT Corp. | 1,777 | 111,134 | ||||||
| Exxon Mobil Corp. | 6,588 | 549,110 | ||||||
| First Solar, Inc.(a) | 6,824 | 374,092 | ||||||
| Forum Energy Technologies, Inc.(a) | 14,276 | 205,574 | ||||||
| Freeport-McMoRan, Inc.(a) | 66,966 | 936,185 | ||||||
| Gulfport Energy Corp.(a) | 1,352 | 18,522 | ||||||
| Halcon Resources Corp.(a) | 103,746 | 682,649 | ||||||
| Halliburton Co. | 564 | 24,105 | ||||||
| Harsco Corp.(a) | 20,191 | 429,059 | ||||||
| Hecla Mining Co. | 101,434 | 478,768 | ||||||
| Helix Energy Solutions Group, Inc.(a) | 35,512 | 242,192 | ||||||
| Helmerich & Payne, Inc. | 2,271 | 123,338 | ||||||
| Hess Corp. | 1,505 | 66,461 | ||||||
| HollyFrontier Corp. | 28,340 | 1,047,163 | ||||||
| Ingredion, Inc. | 17,185 | 2,154,140 | ||||||
| Kaiser Aluminum Corp. | 4,013 | 398,009 | ||||||
| Kinder Morgan, Inc. | 5,763 | 104,368 | ||||||
| Kosmos Energy, Ltd.(a) | 61,883 | 475,261 | ||||||
| Laredo Petroleum, Inc.(a) | 21,121 | 251,762 | ||||||
| Marathon Oil Corp. | 3,240 | 46,073 | ||||||
| Marathon Petroleum Corp. | 31,343 | 1,872,431 | ||||||
| Matador Resources Co.(a) | 12,767 | 338,964 | ||||||
| McDermott International, Inc.(a) | 76,972 | 509,555 | ||||||
| Monsanto Co. | 9,359 | 1,133,375 | ||||||
| Mosaic Co. | 39,530 | 883,100 | ||||||
25 | October 31, 2017
ALPS | CoreCommodity Management CompleteCommodities® Strategy Fund
| Consolidated Statement of Investments | October 31, 2017 |
| Shares | Value (Note 2) | |||||||
| United States (continued) | ||||||||
| Murphy Oil Corp. | 442 | $ | 11,824 | |||||
| Nabors Industries, Ltd. | 11,916 | 67,087 | ||||||
| National Oilwell Varco, Inc. | 3,499 | 119,631 | ||||||
| Newfield Exploration Co.(a) | 25,632 | 789,209 | ||||||
| Newmont Mining Corp. | 16,228 | 586,804 | ||||||
| Noble Energy, Inc. | 28,251 | 787,355 | ||||||
| Oasis Petroleum, Inc.(a) | 107,621 | 1,017,018 | ||||||
| Occidental Petroleum Corp. | 1,977 | 127,655 | ||||||
| Oceaneering International, Inc. | 32,310 | 653,308 | ||||||
| Oil States International, Inc.(a) | 23,227 | 535,382 | ||||||
| Parsley Energy, Inc., Class A(a) | 13,039 | 346,837 | ||||||
| Patterson-UTI Energy, Inc. | 9,324 | 184,429 | ||||||
| PDC Energy, Inc.(a) | 20,568 | 1,047,528 | ||||||
| Phillips 66 | 10,779 | 981,751 | ||||||
| Pilgrim’s Pride Corp.(a) | 46,006 | 1,462,071 | ||||||
| Pioneer Natural Resources Co. | 5,918 | 885,747 | ||||||
| Potlatch Corp. REIT | 10,894 | 564,309 | ||||||
| QEP Resources, Inc.(a) | 56,900 | 509,255 | ||||||
| Range Resources Corp. | 26,273 | 475,804 | ||||||
| Rayonier, Inc. REIT | 20,885 | 626,132 | ||||||
| Resolute Energy Corp.(a) | 18,090 | 543,243 | ||||||
| Rice Energy, Inc.(a) | 16,471 | 466,953 | ||||||
| Rowan Cos. PLC, Class A(a) | 46,085 | 660,398 | ||||||
| Royal Gold, Inc. | 862 | 72,503 | ||||||
| RSP Permian, Inc.(a) | 24,166 | 831,552 | ||||||
| Sanchez Energy Corp.(a) | 18,026 | 78,053 | ||||||
| Sanderson Farms, Inc. | 28,506 | 4,263,643 | ||||||
| Schlumberger, Ltd. | 8,909 | 570,176 | ||||||
| Schnitzer Steel Industries, Inc., Class A | 18,302 | 538,994 | ||||||
| SJW Group | 6,870 | 407,460 | ||||||
| Southwestern Energy Co.(a) | 26,093 | 144,816 | ||||||
| SRC Energy, Inc.(a) | 32,058 | 305,833 | ||||||
| SunCoke Energy, Inc.(a) | 4,214 | 46,733 | ||||||
| Superior Energy Services, Inc.(a) | 12,336 | 108,804 | ||||||
| Tahoe Resources, Inc. | 67,000 | 321,471 | ||||||
| TimkenSteel Corp.(a) | 3,384 | 47,376 | ||||||
| Tyson Foods, Inc., Class A | 5,219 | 380,517 | ||||||
| United States Steel Corp. | 3,059 | 77,454 | ||||||
| Valero Energy Corp. | 20,330 | 1,603,834 | ||||||
| Walter Energy, Inc.(a) | 68,768 | 1,375 | ||||||
| Weyerhaeuser Co. REIT | 21,210 | 761,651 | ||||||
| Whiting Petroleum Corp.(a) | 73,699 | 442,931 | ||||||
| WPX Energy, Inc.(a) | 24,490 | 276,247 | ||||||
| 54,584,855 | ||||||||
| TOTAL COMMON STOCKS | ||||||||
| (Cost $135,691,409) | 146,207,455 | |||||||
| MASTER LIMITED PARTNERSHIPS (0.28%) | ||||||||
| United States (0.28%) | ||||||||
| Alliance Resource Partners LP | 29,972 | 590,449 | ||||||
| Buckeye Partners LP | 977 | 51,888 | ||||||
| Energy Transfer Partners LP | 3,886 | 67,655 | ||||||
| Enterprise Products Partners LP | 10,676 | 261,563 | ||||||
| Magellan Midstream Partners LP | 2,054 | 141,130 | ||||||
| Shares | Value (Note 2) | |||||||
| United States (continued) | ||||||||
| MPLX LP | 1,555 | $ | 54,829 | |||||
| Plains All American Pipeline LP | 3,090 | 61,707 | ||||||
| SunCoke Energy Partners LP | 12,203 | 219,654 | ||||||
| Williams Partners LP | 1,242 | 46,004 | ||||||
| 1,494,879 | ||||||||
| TOTAL MASTER LIMITED PARTNERSHIPS | ||||||||
| (Cost $1,908,009) | 1,494,879 | |||||||
| RIGHTS (0.01%) | ||||||||
| Australia (0.01%) | ||||||||
| Nufarm, Ltd., Expires 11/16/2017 | 21,270 | 27,674 | ||||||
| TOTAL RIGHTS | ||||||||
| (Cost $–) | 27,674 | |||||||
| Principal Amount | Value (Note 2) | |||||||
| GOVERNMENT BONDS (58.57%) | ||||||||
| U.S. Treasury Bonds (58.57%) | ||||||||
| United States Treasury Inflation Indexed Bonds | ||||||||
| 1.625%, 1/15/18 | $ | 70,310,400 | $ | 70,643,184 | ||||
| 0.125%, 4/15/19(c) | 182,863,813 | 183,385,853 | ||||||
| United States Treasury Notes | ||||||||
| 0.750%, 1/31/18(c) | 38,000,000 | 37,958,565 | ||||||
| 1.625%, 3/31/19(c) | 23,250,000 | 23,282,241 | ||||||
| 315,269,843 | ||||||||
| TOTAL GOVERNMENT BONDS | ||||||||
| (Cost $316,304,620) | 315,269,843 | |||||||
| 7-Day Yield | Shares | Value (Note 2) | ||||||||||
| SHORT TERM INVESTMENTS (6.85%) | ||||||||||||
| Money Market Fund (6.85%) | ||||||||||||
| Dreyfus Treasury Prime Cash Management Fund, Institutional Shares | 0.921 | % | 36,869,166 | 36,869,166 | ||||||||
| TOTAL SHORT TERM INVESTMENTS | ||||||||||||
| (Cost $36,869,166) | 36,869,166 | |||||||||||
| U.S. TREASURY BILLS (5.55%) | ||||||||||||
| U.S. Treasury Bills (5.55%) | ||||||||||||
| United States Treasury Bills(d) | 1.127 | % | 30,000,000 | 29,875,645 | ||||||||
| TOTAL U.S. TREASURY BILLS | ||||||||||||
| (Cost $29,878,291) | 29,875,645 | |||||||||||
| TOTAL INVESTMENTS (98.43%) | ||||||||||||
| (Cost $520,651,495) | $ | 529,744,662 | ||||||||||
| Other Assets In Excess Of Liabilities (1.57%)(e) | 8,451,636 | |||||||||||
| NET ASSETS -100.00% | $ | 538,196,298 | ||||||||||
26 | October 31, 2017
ALPS | CoreCommodity Management CompleteCommodities® Strategy Fund
| Consolidated Statement of Investments | October 31, 2017 |
| (a) | Non-Income Producing Security. |
| (b) | These securities initially sold to other parties pursuant to Regulation S under the 1933 Act and subsequently resold to the Fund. At period end, the aggregate market value of those securities was $137,193, representing 0.025% of the Fund’s net assets. |
| (c) | Security, or portion of security, is being held as collateral for total return swap contracts and futures contracts aggregating a total market value of $37,797,030. |
| (d) | Rate shown represents the bond equivalent yield to maturity at date of purchase. |
| (e) | Includes cash which is being held as collateral for total return swap contracts in the amount of $2,880. |
For Fund compliance purposes, the Fund’s industry and geographical classifications refer to any one or more of the industry sub-classifications used by one or more widely recognized market indexes or ratings group indexes, and/or as defined by Fund management. This definition may not apply for purposes of this report, which may combine sub-classifications for reporting ease. Industries and regions are shown as a percent of net assets.
FUTURES CONTRACTS
| Description | Counterparty | Position | Contracts | Expiration Date | Notional Amount/Fair Value (Note 2) | Unrealized Appreciation | ||||||||||
| Brent Crude Future | Morgan Stanley & Co., LLC | Long | 991 | 11/30/17 | $ | 60,391,540 | $ | 3,232,786 | ||||||||
| LME Copper Future | Morgan Stanley & Co., LLC | Long | 27 | 12/18/17 | 4,611,094 | 222,884 | ||||||||||
| LME Nickel Future | Morgan Stanley & Co., LLC | Long | 36 | 12/18/17 | 2,651,940 | 231,892 | ||||||||||
| LME Zinc Future | Morgan Stanley & Co., LLC | Long | 9 | 12/18/17 | 740,250 | 64,057 | ||||||||||
| $ | 68,394,824 | $ | 3,751,619 | |||||||||||||
| Description | Counterparty | Position | Contracts | Expiration Date | Notional Amount/Fair Value (Note 2) | Unrealized Depreciation | ||||||||||
| Copper Future | Morgan Stanley & Co., LLC | Short | (55) | 12/27/17 | $ | (4,263,875 | ) | $ | (105,986 | ) | ||||||
| Gold 100 Oz Future | Morgan Stanley & Co., LLC | Short | (27) | 12/27/17 | (3,430,350 | ) | (4,760 | ) | ||||||||
| Platinum Future | Morgan Stanley & Co., LLC | Long | 90 | 01/29/18 | 4,138,200 | (79,806 | ) | |||||||||
| Silver Future | Morgan Stanley & Co., LLC | Long | 63 | 12/27/17 | 5,258,295 | (254,892 | ) | |||||||||
| WTI Crude Future | Morgan Stanley & Co., LLC | Short | (379) | 11/20/17 | (20,610,020 | ) | (1,034,840 | ) | ||||||||
| $ | (18,907,750 | ) | $ | (1,480,284 | ) | |||||||||||
See Notes to Financial Statements.
27 | October 31, 2017
ALPS | CoreCommodity Management CompleteCommodities® Strategy Fund
| Consolidated Statement of Investments | October 31, 2017 |
TOTAL RETURN SWAP CONTRACTS(a)
| Swap Counterparty | Reference Obligation | Notional Dollars Long/(Short) | Floating Rate/Fixed Amount Paid by Fund | Termination Date | Unrealized Appreciation | ||||||||
| UBS | CRB 3m Fwd TR Index ** | $ | 61,003,137 | USB3MTA + 32 bps* | 11/30/17 | $ | 876 | ||||||
| Total Appreciation | $ | 876 | |||||||||||
| Swap Counterparty | Reference Obligation | Notional Dollars Long/(Short) | Floating Rate/Fixed Amount Paid by Fund | Termination Date | Unrealized Depreciation | ||||||||
| Citigroup | CRB 3m Fwd TR Index ** | $ | 105,703,841 | USB3MTA + 27 bps* | 9/29/18 | $ | (588 | ) | |||||
| Societe Generale | CRB 3m Fwd TR Index ** | 73,056,617 | USB3MTA + 35 bps* | 11/30/17 | (407 | ) | |||||||
| Bank of America - Merrill Lynch | CRB 3m Fwd TR Index ** | 100,302,910 | USB3MTA + 35 bps* | 6/29/18 | (1 | ) | |||||||
| Bank of America - Merrill Lynch | ML eXtra Silver GA6 | 1,153,474 | USB3MTA + 10 bps* | 6/29/18 | - | ||||||||
| $ | (996 | ) | |||||||||||
| Swap Counterparty | Reference Obligation | Notional Dollars Long/(Short) | Floating Rate/Fixed Amount Paid by Fund | Termination Date | Unrealized Depreciation | ||||||||
| Bank of America - Merrill Lynch | MLCS Silver J-F3 | $ | (1,147,256 | ) | USB3MTA* | 6/29/18 | $ | - | |||||
| $ | - | ||||||||||||
| Total Depreciation | $ | (996 | ) | ||||||||||
| (a) | For long positions in the total return swap, the Fund receives payments based on any positive return of the Reference Obligation less the rate paid by the Fund. The Fund makes payments on any negative return of such Reference Obligations plus the rate paid by the fund. For short positions in the total return swap, the Fund makes payments based on any positive return of the Reference Obligation less the rate received by the Fund. The Fund receives payments on any negative return of such Reference Obligations plus the rate received by the Fund. |
| * | United States Auction Results 3 Month Treasury Bill High Discount. Total return swap resets monthly. |
| ** | CRB - Commodity Research Bureau |
See Notes to Financial Statements.
28 | October 31, 2017
ALPS | CoreCommodity Management CompleteCommodities® Strategy Fund
| Consolidated Statement of Assets and Liabilities | October 31, 2017 |
| ASSETS | ||||
| Investments, at value | $ | 529,744,662 | ||
| Cash | 370,861 | |||
| Foreign currency, at value (Cost $44,809) | 43,483 | |||
| Unrealized appreciation on total return swap contracts | 876 | |||
| Receivable for investments sold | 722,083 | |||
| Receivable for shares sold | 191,745 | |||
| Receivable for variation margin on futures contracts | 231,785 | |||
| Receivable due from broker for total return swap contracts | 8,204,434 | |||
| Deposit with broker for futures contracts (Note 3) | 521,555 | |||
| Cash collateral pledged for total return swap contracts (Note 3) | 2,880 | |||
| Dividends and interest receivable | 675,700 | |||
| Prepaid expenses and other assets | 21,135 | |||
| Total Assets | 540,731,199 | |||
| LIABILITIES | ||||
| Payable for investments purchased | 230,044 | |||
| Payable due to broker for total return swap contracts | 828,429 | |||
| Payable for shares redeemed | 826,241 | |||
| Unrealized depreciation on total return swap contracts | 996 | |||
| Investment advisory fees payable | 370,802 | |||
| Administration and transfer agency fees payable | 148,328 | |||
| Distribution and services fees payable | 28,170 | |||
| Trustees’ fees and expenses payable | 3,031 | |||
| Professional fees payable | 39,795 | |||
| Accrued expenses and other liabilities | 59,065 | |||
| Total Liabilities | 2,534,901 | |||
| NET ASSETS | $ | 538,196,298 | ||
| NET ASSETS CONSIST OF | ||||
| Paid-in capital | $ | 566,597,425 | ||
| Accumulated net investment income | 11,459,725 | |||
| Accumulated net realized loss | (51,223,874 | ) | ||
| Net unrealized appreciation | 11,363,022 | |||
| NET ASSETS | $ | 538,196,298 | ||
| INVESTMENTS, AT COST | $ | 520,651,495 | ||
| PRICING OF SHARES | ||||
| Class A: | ||||
| Net Asset Value, offering and redemption price per share | $ | 7.64 | ||
| Net Assets | $ | 47,844,738 | ||
| Shares of beneficial interest outstanding (unlimited number of shares, no par value common stock authorized) | 6,262,601 | |||
| Maximum offering price per share ((NAV/0.9450), based on maximum sales charge of 5.50% of the offering price) | $ | 8.08 | ||
| Class C: | ||||
| Net Asset Value, offering and redemption price per share(a) | $ | 7.36 | ||
| Net Assets | $ | 7,641,600 | ||
| Shares of beneficial interest outstanding (unlimited number of shares, no par value common stock authorized) | 1,037,709 | |||
| Class I: | ||||
| Net Asset Value, offering and redemption price per share | $ | 7.67 | ||
| Net Assets | $ | 482,709,960 | ||
| Shares of beneficial interest outstanding (unlimited number of shares, no par value common stock authorized) | 62,973,244 | |||
| (a) | Redemption price per share may be reduced for any applicable contingent deferred sales charge. For a description of a possible sales charge, please see the Fund’s Prospectus. |
See Notes to Financial Statements.
29 | October 31, 2017
ALPS | CoreCommodity Management CompleteCommodities® Strategy Fund
| Consolidated Statement of Operations | For the Year Ended October 31, 2017 |
| INVESTMENT INCOME | ||||
| Dividends | $ | 3,458,618 | ||
| Foreign taxes withheld on dividends | (250,363 | ) | ||
| Interest and other income, net of premium amortization and accretion of discount | 3,539,027 | |||
| Total Investment Income | 6,747,282 | |||
| EXPENSES | ||||
| Investment advisory fees | 4,650,672 | |||
| Administrative fees | 626,863 | |||
| Transfer agency fees | 590,117 | |||
| Distribution and service fees | ||||
| Class A | 139,248 | |||
| Class C | 77,522 | |||
| Professional fees | 42,317 | |||
| Reports to shareholders and printing fees | 78,351 | |||
| State registration fees | 58,593 | |||
| Insurance fees | 4,008 | |||
| Franchise tax expenses | 6,891 | |||
| Custody fees | 72,304 | |||
| Trustees’ fees and expenses | 17,432 | |||
| Repayment of previously waived fees | ||||
| Class A | 4,900 | |||
| Class C | 1,270 | |||
| Class I | 71,189 | |||
| Miscellaneous expenses | 17,757 | |||
| Total Expenses | 6,459,434 | |||
| Net Expenses | 6,459,434 | |||
| Net Investment Income | 287,848 | |||
| Net realized loss on investments | (2,023,659 | ) | ||
| Net realized gain on written options | 113,811 | |||
| Net realized gain on futures contracts | 4,433,484 | |||
| Net realized gain on total return swap contracts | 4,288,933 | |||
| Net realized loss on foreign currency transactions | (9,204 | ) | ||
| Net Realized Gain | 6,803,365 | |||
| Net change in unrealized appreciation on investments | 10,928,065 | |||
| Net change in unrealized appreciation on futures contracts | 3,601,793 | |||
| Net change in unrealized appreciation on total return swap contracts | 185,143 | |||
| Net change in unrealized appreciation on translation of assets and liabilities denominated in foreign currencies | 7,727 | |||
| Net Change in Unrealized Appreciation | 14,722,728 | |||
| NET REALIZED AND UNREALIZED GAIN ON INVESTMENTS | 21,526,093 | |||
| NET INCREASE IN NET ASSETS RESULTING FROM OPERATIONS | $ | 21,813,941 | ||
See Notes to Financial Statements.
30 | October 31, 2017
ALPS | CoreCommodity Management CompleteCommodities® Strategy Fund
Consolidated Statements of Changes in Net Assets
| For the Year Ended October 31, 2017 | For the Year Ended October 31, 2016 | |||||||
| OPERATIONS | ||||||||
| Net investment income/(loss) | $ | 287,848 | $ | (1,039,338 | ) | |||
| Net realized gain/(loss) | 6,803,365 | (17,457,179 | ) | |||||
| Net change in unrealized appreciation | 14,722,728 | 27,254,320 | ||||||
| Net Increase in Net Assets Resulting from Operations | 21,813,941 | 8,757,803 | ||||||
| DISTRIBUTIONS | ||||||||
| Dividends to shareholders from net investment income | ||||||||
| Class A | (15,061 | ) | – | |||||
| Class I | (491,956 | ) | – | |||||
| Net Decrease in Net Assets from Distributions | (507,017 | ) | – | |||||
| BENEFICIAL INTEREST TRANSACTIONS (NOTE 6) | ||||||||
| Shares sold | ||||||||
| Class A | 29,389,655 | 14,218,147 | ||||||
| Class C | 3,802,844 | 1,998,098 | ||||||
| Class I | 213,799,975 | 266,508,024 | ||||||
| Dividends reinvested | ||||||||
| Class A | 12,719 | – | ||||||
| Class I | 450,481 | – | ||||||
| Shares redeemed, net of redemption fees | ||||||||
| Class A | (12,292,578 | ) | (14,961,123 | ) | ||||
| Class C | (3,621,065 | ) | (3,101,717 | ) | ||||
| Class I | (215,121,025 | ) | (173,760,311 | ) | ||||
| Net Increase in Net Assets Derived from Beneficial Interest Transactions | 16,421,006 | 90,901,118 | ||||||
| Net increase in net assets | 37,727,930 | 99,658,921 | ||||||
| NET ASSETS | ||||||||
| Beginning of year | 500,468,368 | 400,809,447 | ||||||
| End of year * | $ | 538,196,298 | $ | 500,468,368 | ||||
| *Including accumulated net investment income/(loss) of: | $ | 11,459,725 | $ | (325,361 | ) | |||
See Notes to Financial Statements.
31 | October 31, 2017
ALPS | CoreCommodity Management CompleteCommodities® Strategy Fund – Class A
Consolidated Financial Highlights
Selected data for a share of beneficial interest outstanding throughout the periods indicated:
| For the Year Ended October 31, 2017 | For the Year Ended October 31, 2016 | For the Year Ended October 31, 2015 | For the Fiscal Period Ended October 31, 2014(a) | For the Year Ended April 30, 2014 | For the Year Ended April 30, 2013(b) | |||||||||||||||||||
| Net asset value, beginning of period(c) | $ | 7.29 | $ | 7.15 | $ | 9.56 | $ | 10.87 | $ | 10.40 | $ | 11.18 | ||||||||||||
| INCOME/(LOSS) FROM INVESTMENT OPERATIONS: | ||||||||||||||||||||||||
| Net investment income/(loss)(d) | (0.01 | )(e) | (0.03 | )(e) | (0.09 | )(e) | 0.00 | (e)(f) | (0.06 | )(e) | (0.03 | )(e) | ||||||||||||
| Net realized and unrealized gain/(loss) | 0.36 | 0.17 | (2.32 | ) | (1.31 | ) | 0.53 | (0.69 | ) | |||||||||||||||
| Total from investment operations | 0.35 | 0.14 | (2.41 | ) | (1.31 | ) | 0.47 | (0.72 | ) | |||||||||||||||
| DISTRIBUTIONS: | ||||||||||||||||||||||||
| From net investment income | (0.00 | )(f) | – | – | – | – | – | |||||||||||||||||
| Tax return of capital | – | – | – | – | – | (0.06 | ) | |||||||||||||||||
| Total distributions | (0.00 | )(f) | – | – | – | – | (0.06 | ) | ||||||||||||||||
| REDEMPTION FEES ADDED TO PAID-IN CAPITAL (NOTE 6) | 0.00 | (f) | 0.00 | (f) | 0.00 | (f) | 0.00 | (f) | 0.00 | (f) | 0.00 | (f) | ||||||||||||
| Net increase/(decrease) in net asset value | 0.35 | 0.14 | (2.41 | ) | (1.31 | ) | 0.47 | (0.78 | ) | |||||||||||||||
| Net asset value, end of year | $ | 7.64 | $ | 7.29 | $ | 7.15 | $ | 9.56 | $ | 10.87 | $ | 10.40 | ||||||||||||
| TOTAL RETURN(g) | 4.85 | % | 1.96 | % | (25.21 | )% | (12.05 | )% | 4.52 | % | (6.44 | )% | ||||||||||||
| RATIOS/SUPPLEMENTAL DATA: | ||||||||||||||||||||||||
| Net assets, end of year (000s) | $ | 47,845 | $ | 29,468 | $ | 30,085 | $ | 39,971 | $ | 112,562 | $ | 104,234 | ||||||||||||
| Ratio of expenses to average net assets excluding fee waivers and reimbursements | 1.38 | % | 1.41 | % | 1.47 | % | 1.46 | %(h) | 1.50 | % | 1.50 | % | ||||||||||||
| Ratio of expenses to average net assets including fee waivers and reimbursements | 1.38 | % | 1.41 | % | 1.45 | % | 1.45 | %(h) | 1.45 | % | 1.40 | % | ||||||||||||
| Ratio of net investment income/(loss) to average net assets | (0.10 | )% | (0.48 | )% | (1.12 | )% | 0.09 | %(h) | (0.60 | )% | (0.30 | )% | ||||||||||||
| Portfolio turnover rate(i) | 66 | % | 50 | % | 52 | % | 12 | % | 28 | % | 117 | % | ||||||||||||
| (a) | Effective May 1, 2014, the Board approved changing the fiscal year-end of the Funds from April 30 to October 31. |
| (b) | Prior to April 30, 2013 the ALPS | CoreCommodity Management CompleteCommodities® Strategy Fund was known as the Jefferies Asset Management Commodity Strategy Allocation Fund. |
| (c) | Per share amounts and ratios to average net assets include income and expenses of the CoreCommodity Management Cayman Commodity Fund Ltd. (wholly-owned subsidiary). |
| (d) | Calculated using the average shares method. |
| (e) | The per share amount does not correspond to activity reflected in the Statement of Operations due to class specific expenses during the period. |
| (f) | Less than $0.005 or ($0.005) per share. |
| (g) | Total returns are for the period indicated and have not been annualized. Total returns would have been lower had certain expenses not been waived during the period. Returns shown do not reflect the deduction of taxes that a shareholder would pay on Fund distributions or the redemption of Fund shares. Returns shown exclude any applicable sales charges. |
| (h) | Annualized. |
| (i) | Portfolio turnover rate for periods less than one full year have not been annualized. |
See Notes to Financial Statements.
32 | October 31, 2017
ALPS | CoreCommodity Management CompleteCommodities® Strategy Fund – Class C
Consolidated Financial Highlights
Selected data for a share of beneficial interest outstanding throughout the periods indicated:
| For the Year Ended October 31, 2017 | For the Year Ended October 31, 2016 | For the Year Ended October 31, 2015 | For the Fiscal Period Ended October 31, 2014(a) | For the Year Ended April 30, 2014 | For the Year Ended April 30, 2013(b) | |||||||||||||||||||
| Net asset value, beginning of period(c) | $ | 7.07 | $ | 6.98 | $ | 9.39 | $ | 10.71 | $ | 10.31 | $ | 11.15 | ||||||||||||
| INCOME/(LOSS) FROM INVESTMENT OPERATIONS: | ||||||||||||||||||||||||
| Net investment loss(d) | (0.06 | )(e) | (0.08 | )(e) | (0.14 | )(e) | (0.04 | )(e) | (0.12 | )(e) | (0.10 | )(e) | ||||||||||||
| Net realized and unrealized gain/(loss) | 0.35 | 0.17 | (2.27 | ) | (1.28 | ) | 0.52 | (0.69 | ) | |||||||||||||||
| Total from investment operations | 0.29 | 0.09 | (2.41 | ) | (1.32 | ) | 0.40 | (0.79 | ) | |||||||||||||||
| DISTRIBUTIONS: | ||||||||||||||||||||||||
| Tax return of capital | – | – | – | – | – | (0.05 | ) | |||||||||||||||||
| Total distributions | – | – | – | – | – | (0.05 | ) | |||||||||||||||||
| REDEMPTION FEES ADDED TO PAID-IN CAPITAL (NOTE 6) | – | – | 0.00 | (f) | 0.00 | (f) | 0.00 | (f) | 0.00 | (f) | ||||||||||||||
| Net increase/(decrease) in net asset value | 0.29 | 0.09 | (2.41 | ) | (1.32 | ) | 0.40 | (0.84 | ) | |||||||||||||||
| Net asset value, end of year | $ | 7.36 | $ | 7.07 | $ | 6.98 | $ | 9.39 | $ | 10.71 | $ | 10.31 | ||||||||||||
| TOTAL RETURN(g) | 4.10 | % | 1.29 | % | (25.67 | )% | (12.32 | )% | 3.88 | % | (7.10 | )% | ||||||||||||
| RATIOS/SUPPLEMENTAL DATA: | ||||||||||||||||||||||||
| Net assets, end of year (000s) | $ | 7,642 | $ | 7,260 | $ | 8,335 | $ | 12,534 | $ | 13,996 | $ | 19,444 | ||||||||||||
| Ratio of expenses to average net assets excluding fee waivers and reimbursements | 2.05 | % | 2.05 | % | 2.07 | % | 2.07 | %(h) | 2.10 | % | 2.14 | % | ||||||||||||
| Ratio of expenses to average net assets including fee waivers and reimbursements | 2.05 | % | 2.05 | % | 2.05 | % | 2.05 | %(h) | 2.05 | % | 2.05 | % | ||||||||||||
| Ratio of net investment loss to average net assets | (0.81 | )% | (1.13 | )% | (1.74 | )% | (0.82 | )%(h) | (1.16 | )% | (0.92 | )% | ||||||||||||
| Portfolio turnover rate(i) | 66 | % | 50 | % | 52 | % | 12 | % | 28 | % | 117 | % | ||||||||||||
| (a) | Effective May 1, 2014, the Board approved changing the fiscal year-end of the Funds from April 30 to October 31. |
| (b) | Prior to April 30, 2013 the ALPS | CoreCommodity Management CompleteCommodities® Strategy Fund was known as the Jefferies Asset Management Commodity Strategy Allocation Fund. |
| (c) | Per share amounts and ratios to average net assets include income and expenses of the CoreCommodity Management Cayman Commodity Fund Ltd. (wholly-owned subsidiary). |
| (d) | Calculated using the average shares method. |
| (e) | The per share amount does not correspond to activity reflected in the Statement of Operations due to class specific expenses during the period. |
| (f) | Less than $0.005 or ($0.005) per share. |
| (g) | Total returns are for the period indicated and have not been annualized. Total returns would have been lower had certain expenses not been waived during the period. Returns shown do not reflect the deduction of taxes that a shareholder would pay on Fund distributions or the redemption of Fund shares. Returns shown exclude any applicable sales charges. |
| (h) | Annualized. |
| (i) | Portfolio turnover rate for periods less than one full year have not been annualized. |
See Notes to Financial Statements.
33 | October 31, 2017
ALPS | CoreCommodity Management CompleteCommodities® Strategy Fund – Class I
Consolidated Financial Highlights
Selected data for a share of beneficial interest outstanding throughout the periods indicated:
| For the Year Ended October 31, 2017 | For the Year Ended October 31, 2016 | For the Year Ended October 31, 2015 | For the Fiscal Period Ended October 31, 2014(a) | For the Year Ended April 30, 2014 | For the Year Ended April 30, 2013(b) | |||||||||||||||||||
| Net asset value, beginning of period(c) | $ | 7.31 | $ | 7.15 | $ | 9.57 | $ | 10.87 | $ | 10.37 | $ | 11.12 | ||||||||||||
| INCOME/(LOSS) FROM INVESTMENT OPERATIONS: | ||||||||||||||||||||||||
| Net investment income/(loss)(d) | 0.01 | (0.02 | ) | (0.06 | ) | (0.01 | ) | (0.03 | ) | (0.00 | )(e) | |||||||||||||
| Net realized and unrealized gain/(loss) | 0.36 | 0.18 | (2.31 | ) | (1.29 | ) | 0.53 | (0.69 | ) | |||||||||||||||
| Total from investment operations | 0.37 | 0.16 | (2.37 | ) | (1.30 | ) | 0.50 | (0.69 | ) | |||||||||||||||
| DISTRIBUTIONS: | ||||||||||||||||||||||||
| From net investment income | (0.01 | ) | – | (0.05 | ) | – | – | – | ||||||||||||||||
| Tax return of capital | – | – | – | – | – | (0.06 | ) | |||||||||||||||||
| Total distributions | (0.01 | ) | – | (0.05 | ) | – | – | (0.06 | ) | |||||||||||||||
| REDEMPTION FEES ADDED TO PAID-IN CAPITAL (NOTE 6) | 0.00 | (e) | 0.00 | (e) | 0.00 | (e) | 0.00 | (e) | 0.00 | (e) | 0.00 | (e) | ||||||||||||
| Net increase/(decrease) in net asset value | 0.36 | 0.16 | (2.42 | ) | (1.30 | ) | 0.50 | (0.75 | ) | |||||||||||||||
| Net asset value, end of year | $ | 7.67 | $ | 7.31 | $ | 7.15 | $ | 9.57 | $ | 10.87 | $ | 10.37 | ||||||||||||
| TOTAL RETURN(f) | 5.03 | % | 2.24 | % | (24.88 | )% | (11.96 | )% | 4.82 | % | (6.16 | )% | ||||||||||||
| RATIOS/SUPPLEMENTAL DATA: | ||||||||||||||||||||||||
| Net assets, end of year (000s) | $ | 482,710 | $ | 463,741 | $ | 362,389 | $ | 393,618 | $ | 266,293 | $ | 187,146 | ||||||||||||
| Ratio of expenses to average net assets excluding fee waivers and reimbursements | 1.15 | % | 1.15 | % | 1.17 | % | 1.16 | %(g) | 1.16 | % | 1.17 | % | ||||||||||||
| Ratio of expenses to average net assets including fee waivers and reimbursements | 1.15 | % | 1.15 | % | 1.15 | % | 1.15 | %(g) | 1.15 | % | 1.15 | % | ||||||||||||
| Ratio of net investment income/(loss) to average net assets | 0.08 | % | (0.22 | )% | (0.73 | )% | (0.12 | )%(g) | (0.26 | )% | (0.02 | )% | ||||||||||||
| Portfolio turnover rate(h) | 66 | % | 50 | % | 52 | % | 12 | % | 28 | % | 117 | % | ||||||||||||
| (a) | Effective May 1, 2014, the Board approved changing the fiscal year-end of the Funds from April 30 to October 31. |
| (b) | Prior to April 30, 2013 the ALPS | CoreCommodity Management CompleteCommodities® Strategy Fund was known as the Jefferies Asset Management Commodity Strategy Allocation Fund. |
| (c) | Per share amounts and ratios to average net assets include income and expenses of the CoreCommodity Management Cayman Commodity Fund Ltd. (wholly-owned subsidiary). |
| (d) | Calculated using the average shares method. |
| (e) | Less than $0.005 or ($0.005) per share. |
| (f) | Total returns are for the period indicated and have not been annualized. Total returns would have been lower had certain expenses not been waived during the period. Returns shown do not reflect the deduction of taxes that a shareholder would pay on Fund distributions or the redemption of Fund shares. |
| (g) | Annualized. |
| (h) | Portfolio turnover rate for periods less than one full year have not been annualized. |
See Notes to Financial Statements.
34 | October 31, 2017
ALPS | Kotak India Growth Fund
| Management Commentary | October 31, 2017 (Unaudited) |
Performance
ALPS | Kotak India Growth Fund (the “Fund”) was launched on February 14, 2011. During the 12-month period ended 31st Oct 2017 (hereinafter also referred to as “the period”), the Fund’s Class A Shares, INDAX, delivered a total return of 19.45% at Net Asset Value, Class C, INFCX, delivered 17.60% with CDSC, and Class I, INDIX, delivered 19.68% as against the benchmark Nifty 500 Index (“NSE500”) which returned 26.18% during the period without taking into account sales charges for Class A and C Shares.
The Indian equity market after an initial pull back on the sudden announcement of demonetization in November 2016, was upbeat in the period (Nov-16 to Oct-17) and was in line with global emerging markets though the mid markets segment did well on the back of strong flows from domestic investors. The period saw net FII (Foreign Institutional Investor) inflows to the tune of around USD1.94 bn into the Indian equity market and inflows of around USD17 bn in debt markets. The domestic mutual fund industry along with insurance companies continued to see strong momentum in flows and invested over $33.4 bn over the past 12 months, the highest ever. On the currency side, the INR appreciated by about 3% through the year against the dollar. (Source – Bloomberg, Kotak Institutional Equities)
On the domestic front, the economy got disrupted by two major events, (1) demonetization of INR.500 and INR1,000 currency notes last November, and (2) introduction of the uniform Goods and Services Tax (GST) regime from July 1, 2017. Both these measures, though disruptive in the short term have meaningful positive tailwinds for the economy on both the short and the medium term. Demonetization should lead to financialization of the savings and GST will lead to formalization of the economy.
Demonetization of the currency was a sudden and unexpected measure. Cash has been the predominant way of transacting in India. Prior to demonetization, the total currency in circulation was around $280 bn equivalent. The two high value currency notes of INR 500 and INR 1000 that were demonetized accounted for 86% of the currency in circulation. A prolonged cash shortage post the demonetization impacted the economic growth and some impact of the same is even felt today in the economy. However, demonetization was an important signaling tool that the government would do whatever it takes to curb counterfeit currency and tackle black money and the shadow economy.
On the positive side, this event has given a big push towards non cash based transactions. Credit cards, debit cards, mobile wallet payments, digital banking transactions have all seen a significant jump in usage. Cash that was in circulation had to be deposited into the banking system for exchange and this has led to healthy growth in bank deposits. Lazy money is finding its way into efficient financial assets like bank deposits, equity mutual funds, insurance products, clear financialization of the household savings. In the past year, mutual funds and insurance companies have seen their best ever inflows.
On 1st of July 2017, the much awaited Uniform Goods and Services Tax (GST) was rolled out. This in our view is the biggest reform on the indirect taxes in India. Hitherto, the tax structure in India was complex, multilayered and inefficient. Businesses were subject to multiple federal, state and local body taxes and often there was cascading of taxes. This inefficient system was the prime reason for rise of shadow non taxing paying economy which by many estimates accounts for almost 40% of the GDP. Our investee companies which are fully tax compliant faced competition from these shadow businesses that enjoyed a significant price arbitrage just by avoiding taxes. Overall, India’s tax to GDP suffers because of this very large shadow economy.
Post the implementation of GST, all indirect taxes have been subsumed under GST. All input taxes are offset against the final taxes payable. Local body levies like Octroi (local tax body) have been done away with. The economic borders within India where goods were subjected to taxation and physical checks while being transported inter states has been done away with giving significant advantages on logistics and making India a unified single economic unit. Overall tax rates have also been rationalized and most goods are now subject to lower taxes in the GST regime as compared to the earlier regime along with full input tax credits and benefits of lower logistics costs. Combined with demonetization which has hit the cash economy, GST implementation has hit the unorganized shadow economy. In our view, it’s becoming increasingly difficult for these business to continue avoid paying taxes and sooner than later, they will have to migrate to become compliant. This gives a level playing field to our investee companies. We expect our companies to see market share gains at the cost of these shadow businesses along with possible margin tailwinds. It’s pertinent to note that Indian economy is a highly fragmented especially on the distribution side and such big changes disrupts the chain before the system adapts. In the initial couple of months, we did see some challenges and now gradually we are reverting to normalization. The government has also been proactive as has ironed out some procedural issues and further rationalized the tax rates. Our portfolio has been positioned to benefit from the changes post the GST implementation. We see significant benefits to accrue to many of our investee companies on market share gains and profitability.
The other major change during the year was the implementation of the new Insolvency and Bankruptcy code, 2016. One of the major challenges of the Indian economy has been the stress in the banking system and this new measure will help resolve this situation. Recently the government also announced a significant recapitalization for the state owned banks (where the government of India owns a majority stake) to the tune of around $32 billion. Along with the new bankruptcy code, the recapitalization of the banks can potentially help banks to provide for the stressed assets and prepare for the next round of credit growth. One of the reasons for the lackluster investment cycle has been weak balance sheets of these corporate state owned lenders.
35 | October 31, 2017
ALPS | Kotak India Growth Fund
| Management Commentary | October 31, 2017 (Unaudited) |
On the global front, the past year was dominated by worries of US protectionism, roadmap of reforming the US tax code, continued debate on Chinese economy and despite all that, resilience of emerging market flows and currencies. During the year we also saw comeback of the commodities with oil moving up to its highest levels in the last two years on the back of production cuts by OPEC and Russia. Non-oil commodity prices, like steel, aluminum, zinc, etc. also saw a rally in this period led by mine closures as well as resurgence in demand. Oil price movement has had some impact on the current account deficit for India. Being dependent largely on imported oil, a $1 increase in oil prices leads to about $10 billion trade deficit increase. The trade deficit is likely to be around 2%-2.25% of GDP at current levels of oil prices.
Portfolio Composition
The portfolio continues to be positioned in a way as to benefit from improving macroeconomic tailwind from the four broad investment themes in India – consumption lead by favorable demographics, financial services, infrastructure and outsourcing. The fund may invest across the spectrum of market capitalizations in order to take advantage of any opportunistic mispricing arising from market conditions, valuation differential, earnings growth or liquidity flows.
As of 31st Oct 2017, Financials remains the largest sector (30.04% wt.), followed by Materials (16.53%) and Industrials (11.22%). The top 5 holdings in the portfolio are HDFC Bank, ICICI Bank, Infosys Ltd, Reliance Industries and Axis Bank. Large active deviations in the portfolio are in Materials (+6.64% deviation from benchmark), Industrials (+2.53% deviation), Utilities (-3.66% deviation) and Energy (-2.57%). In terms of market capitalization focus, as of 31st Oct, the fund is invested 67.95% in large caps, 22.98% in midcaps and 5.95% in small-caps.
During the period, some of the names within our favored sectors where we initiated new positions and which we continue to hold as of this report are Arvind Ltd, Brigade Enterprises, Dalmia Bharat, Emami Ltd, Federal Bank, ICICI Prudential, RBL Bank, Kajaria Ceramics, Jubilant Foodworks and Petronet LNG. Some of the stocks where we booked profit and exited completely include Bank of Baroda, Dish TV, Equitas, Gateway Distriparks, Jyothy Labs and Idea Cellular.
Outlook
The Indian economy has seen continuous improvement on macro-economic indicators, namely, inflation, current account, fiscal deficit, currency for the past 3 years. The central bank, RBI, has over the past 3 years has cut policy rates by 200 bps. On the other hand while corporate earnings hadn’t kept pace with the improvement in macro, valuation multiples moved up on improving macro and in expectations of reform implementation.
In the past few months, macro-economic factors are seeing some slippage but remain in a comfortable zone. Inflation has picked up a bit on the combination of base effect and the firming up of global commodity prices. The current account deficit has expanded a bit on oil price increase. On the positive side, after 3 years of below
expectations corporate earnings growth, we see strong earnings recovery over the next 12-24 months. The past four quarters were impacted by demonetization and GST implementation and as such on a low base and general uptick in the economy, consensus earnings growth are close to 20% growth over the next one year.
The July to Sep (Q2FY18) quarterly earnings season bodes well for the outlook and corporate earnings recovery. After a significant period of time, the pace of downward revision in earnings has moderated giving confidence to growth and improvement on Return on Equity. At present policy uncertainty is low. The positive impacts of the implementation of the GST, insolvency and bankruptcy code, the banking sector recapitalization have yet to be felt in the economy. Post the implementation of indirect tax reform GST, the government has set up a panel for overhauling the direct tax code. One of the key expectations from this is the likely lowering of corporate tax rates from 30% to 25%. However, there are many state level elections in India over the next 12 months and a general election in 2019 which one needs to be aware of. Any adverse outcomes on these elections can have impact on further policy reform. Global disruptions, including a sharp rise in oil prices, tightening of liquidity at a faster than envisaged pace and geo political developments remain the key risks to our constructive outlook on equity markets.
Mr. Nitin Jain
Fund Manager
Basis Point – a unit that is equal to 1/100th of 1% and is used to denote the change in a financial instrument.
PE – A valuation ratio of a company’s current share price compared to its per-share earnings.
Nifty 50 is an Index computed from performance of 50 top stocks from different sectors listed on the NSE (India’s National Stock Exchange). The companies which form the Nifty 50 may vary from time to time based on many factors considered by the NSE.
NSE500 is an Index of India comprised of the top 500 companies listed on the NSE.
NSEMCAP is an index of Midcap securities listed on the NSE.
The Nifty Midcap Index is a free float capitalization-weighted index designed to represent the midcap segment of the market in India. The index was developed with a base value of 1000 as of January 1, 2003. This index replaces the old Nifty Midcap 200 Index which was discontinued effective July 18, 2005. The views of the author and information discussed in this commentary are as of the date of publication, are subject to change, and may not reflect the writer’s current views. The views expressed are those of the author only, and represent an assessment of market conditions at a specific point in time, are opinions only and should not be relied upon as investment advice regarding a particular investment or markets in general. Such information does not constitute a recommendation to buy or sell specific securities or
36 | October 31, 2017
ALPS | Kotak India Growth Fund
| Management Commentary | October 31, 2017 (Unaudited) |
investment vehicles. It should not be assumed that any investment will be profitable or will equal the performance of the fund or any securities or any sectors mentioned in this letter. The subject matter contained in this letter has been derived from several sources believed to be reliable and accurate at the time of compilation. Neither ALPS Advisors, Inc., Kotak Mahindra (UK) Limited, nor the Fund accepts any liability for losses either direct or consequential caused by the use of this information.
Diversification cannot guarantee gain or prevent losses.
37 | October 31, 2017
ALPS | Kotak India Growth Fund
| Performance Update | October 31, 2017 (Unaudited) |
Performance of $10,000 Initial Investment (as of October 31, 2017)
Comparison of change in value of a $10,000 investment (includes maximum sales charges of 5.50%)
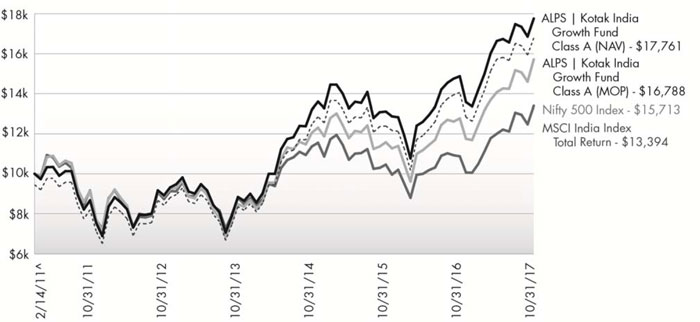
The chart above represents historical performance of a hypothetical investment of $10,000 in the Fund since inception. Past performance does not guarantee future results. This chart does not reflect the deduction of taxes that a shareholder would pay on Fund distributions or the redemption of Fund shares.
Average Annual Total Returns (as of October 31, 2017)
| 6 Month | 1 Year | 3 Year | 5 Year | Since Inception^ | Total Expense Ratio | What You Pay* | |
| Class A (NAV) | 6.76% | 19.45% | 10.37% | 14.78% | 8.94% | 3.93% | 2.00% |
| Class A (MOP) | 0.90% | 12.85% | 8.31% | 13.48% | 8.03% | ||
| Class C (NAV) | 6.37% | 18.60% | 9.60% | 13.99% | 8.20% | 4.53% | 2.60% |
| Class C (CDSC) | 5.37% | 17.60% | 9.60% | 13.99% | 8.20% | ||
| Class I | 6.90% | 19.68% | 10.73% | 15.15% | 9.29% | 3.54% | 1.60% |
| Nifty 500 Index1 | 11.68% | 23.04% | 9.22% | 12.13% | 6.97% | ||
| MSCI India Index Total Return2 | 11.59% | 23.16% | 5.61% | 8.93% | 4.45% |
Performance data quoted represents past performance. Past performance does not guarantee future results. Investment return and principal value of an investment will fluctuate so that an investor’s shares, when sold or redeemed, may be worth more or less than the original cost. Current performance data may be higher or lower than actual data quoted. For the most current month-end performance data, please call 1-866-759-5679.
Maximum Offering Price (MOP) for Class A shares includes the Fund’s maximum sales charge of 5.50%. Performance shown at NAV does not include these sales charges and would have been lower had it been taken into account. If you invest $1 million or more, either as a lump sum or through the Fund’s accumulation or letter of intent programs, you can purchase Class A shares without an initial sales charge (load). A Contingent Deferred Sales Charge (“CDSC”) of 1.00% may apply to Class C shares redeemed within the first 12 months after a purchase, and on Class A shares redeemed within the first 18 months after a purchase in excess of $1 million. The Fund imposes a 2.00% redemption fee on shares held for less than 30 days.
Performance less than 1 year is cumulative.
38 | October 31, 2017
ALPS | Kotak India Growth Fund
| Performance Update | October 31, 2017 (Unaudited) |
| 1 | Nifty 500 Index (formerly the CNX 500 Index) - India’s first broad based benchmark of the Indian capital market. The Nifty 500 companies are disaggregated into 72 industry indices. Industry weightages in the index reflect the industry weightages in the market. The index is not actively managed and does not reflect any deduction for fees, expenses or taxes. An investor may not invest directly in an index. |
| 2 | MSCI India Index - designed to measure the performance of the large and mid cap segments of the Indian market. With 64 constituents, the index covers approximately 85% of the Indian equity universe. |
| ^ | Fund inception date of February 14, 2011. |
| * | What You Pay reflects the Advisor’s and Sub-Advisor’s decision to contractually limit expenses through February 28, 2018. Please see the prospectus for additional information. |
The Fund is “non-diversified” and will generally be more volatile than diversified funds.
The table does not reflect the deduction of taxes that a shareholder would pay on Fund distributions or the redemption of Fund shares.
This Fund is not suitable for all investors and is subject to investment risks, including possible loss of the principal amount invested.
There is no guarantee that the Fund will continue to hold any one particular security or stay invested in any one particular company. The composition of the Fund’s top holdings is subject to change. Performance figures are historical and reflect the change in share price, reinvested distributions, changes in net asset value, sales charges and capital gains distributions, if any.
Not FDIC Insured – No Bank Guarantee – May Lose Value
Investing in India involves risk and considerations not present when investing in more established securities markets. The Fund may be more susceptible to economic, market, political and local risks of the region than a fund that is more geographically diversified. Investments in India are subject to a number of risks including, but not limited to, risk of losing some or all of the capital invested, high market volatility, variable market liquidity, geopolitical risks (including political instability), exchange rate fluctuations (between the currency of the fund’s share class and the Indian Rupee), changes in tax regime and restrictions on investment activities of foreign investors.
Top Ten Holdings (as a % of Net Assets) †
| HDFC Bank, Ltd. | 7.73% |
| ICICI Bank, Ltd. | 3.79% |
| Infosys, Ltd. | 3.25% |
| Reliance Industries, Ltd. | 3.07% |
| Housing Development Finance Corp., Ltd. | 3.02% |
| ITC, Ltd. | 2.88% |
| Axis Bank, Ltd. | 2.75% |
| IndusInd Bank, Ltd. | 2.69% |
| Hindustan Petroleum Corp., Ltd. | 2.67% |
| Maruti Suzuki India, Ltd. | 2.59% |
| Top Ten Holdings | 34.44% |
| † | Holdings are subject to change, and may not reflect the current or future position of the portfolio. Table presents approximate values only. |
Industry Sector Allocation (as a % of Net Assets)
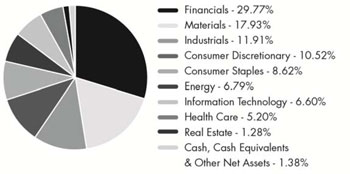
39 | October 31, 2017
ALPS | Kotak India Growth Fund
| Consolidated Statement of Investments | October 31, 2017 |
| Shares | Value (Note 2) | |||||||
| COMMON STOCKS (98.62%) | ||||||||
| Consumer Discretionary (10.52%) | ||||||||
| Auto Components (2.26%) | ||||||||
| Motherson Sumi Systems, Ltd. | 45,697 | $ | 257,891 | |||||
| MRF, Ltd. | 444 | 455,736 | ||||||
| 713,627 | ||||||||
| Automobiles (4.97%) | ||||||||
| Maruti Suzuki India, Ltd. | 6,435 | 816,353 | ||||||
| Tata Motors, Ltd., Class A(a) | 94,907 | 353,224 | ||||||
| TVS Motor Co., Ltd. | 35,700 | 399,051 | ||||||
| 1,568,628 | ||||||||
| Hotels Restaurants & Leisure (1.13%) | ||||||||
| Jubilant Foodworks, Ltd. | 14,111 | 355,803 | ||||||
| Household Durables (1.51%) | ||||||||
| Crompton Greaves Consumer Electricals, Ltd. | 139,769 | 477,830 | ||||||
| Textiles Apparel & Luxury Goods (0.65%) | ||||||||
| Arvind, Ltd. | 33,021 | 204,668 | ||||||
| TOTAL CONSUMER DISCRETIONARY | 3,320,556 | |||||||
| Consumer Staples (8.62%) | ||||||||
| Food Products (2.53%) | ||||||||
| Britannia Industries, Ltd. | 11,150 | 799,153 | ||||||
| Personal Products (3.21%) | ||||||||
| Colgate-Palmolive India, Ltd. | 18,629 | 306,208 | ||||||
| Emami, Ltd. | 19,763 | 384,242 | ||||||
| Godrej Consumer Products, Ltd. | 22,434 | 323,672 | ||||||
| 1,014,122 | ||||||||
| Tobacco (2.88%) | ||||||||
| ITC, Ltd. | 221,300 | 908,614 | ||||||
| TOTAL CONSUMER STAPLES | 2,721,889 | |||||||
| Energy (6.79%) | ||||||||
| Oil Gas & Consumable Fuels (6.79%) | ||||||||
| Hindustan Petroleum Corp., Ltd. | 122,014 | 842,818 | ||||||
| Petronet LNG, Ltd. | 82,582 | 331,612 | ||||||
| Reliance Industries, Ltd. | 66,682 | 969,464 | ||||||
| 2,143,894 | ||||||||
| TOTAL ENERGY | 2,143,894 | |||||||
| Financials (29.77%) | ||||||||
| Banks (22.07%) | ||||||||
| Axis Bank, Ltd. | 107,298 | 867,359 | ||||||
| Federal Bank, Ltd. | 177,468 | 334,166 | ||||||
| HDFC Bank, Ltd. | 87,270 | 2,439,224 | ||||||
| Shares | Value (Note 2) | |||||||
| Banks (continued) | ||||||||
| ICICI Bank, Ltd. | 255,155 | $ | 1,196,123 | |||||
| IndusInd Bank, Ltd. | 33,824 | 850,132 | ||||||
| State Bank of India | 125,341 | 591,959 | ||||||
| Yes Bank, Ltd. | 141,625 | 688,413 | ||||||
| 6,967,376 | ||||||||
| Capital Markets (0.20%) | ||||||||
| BSE, Ltd. | 4,161 | 63,675 | ||||||
| Consumer Finance (2.10%) | ||||||||
| Bajaj Finance, Ltd. | 10,000 | 278,119 | ||||||
| Bharat Financial Inclusion, Ltd.(a) | 25,490 | 384,427 | ||||||
| 662,546 | ||||||||
| Insurance (2.37%) | ||||||||
| ICICI Prudential Life Insurance Co., Ltd.(b)(c) | 54,802 | 343,462 | ||||||
| Max Financial Services, Ltd.(a) | 44,600 | 404,545 | ||||||
| 748,007 | ||||||||
| Thrifts & Mortgage Finance (3.03%) | ||||||||
| Housing Development Finance Corp., Ltd. | 36,203 | 954,775 | ||||||
| TOTAL FINANCIALS | 9,396,379 | |||||||
| Health Care (5.20%) | ||||||||
| Health Care Providers & Services (0.92%) | ||||||||
| HealthCare Global Enterprises, Ltd.(a) | 66,730 | 290,872 | ||||||
| Pharmaceuticals (4.28%) | ||||||||
| Cadila Healthcare, Ltd. | 28,402 | 220,865 | ||||||
| Cipla, Ltd. | 32,290 | 313,066 | ||||||
| Lupin, Ltd. | 23,846 | 378,739 | ||||||
| Sun Pharmaceutical Industries, Ltd. | 51,351 | 438,646 | ||||||
| 1,351,316 | ||||||||
| TOTAL HEALTH CARE | 1,642,188 | |||||||
| Industrials (11.91%) | ||||||||
| Air Freight & Logistics (0.78%) | ||||||||
| Allcargo Logistics, Ltd. | 91,400 | 245,435 | ||||||
| Airlines (0.95%) | ||||||||
| InterGlobe Aviation, Ltd.(b)(c) | 15,501 | 299,002 | ||||||
| Building Products (2.21%) | ||||||||
| Kajaria Ceramics, Ltd. | 33,925 | 356,952 | ||||||
| Somany Ceramics, Ltd. | 25,895 | 339,858 | ||||||
| 696,810 | ||||||||
40 | October 31, 2017
ALPS | Kotak India Growth Fund
| Consolidated Statement of Investments | October 31, 2017 |
| Shares | Value (Note 2) | |||||||
| Construction & Engineering (2.35%) | ||||||||
| Larsen & Toubro, Ltd. | 39,236 | $ | 741,073 | |||||
| Electrical Equipment (3.77%) | ||||||||
| Amara Raja Batteries, Ltd. | 32,069 | 346,712 | ||||||
| Finolex Cables, Ltd. | 38,765 | 368,252 | ||||||
| V-Guard Industries, Ltd. | 143,062 | 474,735 | ||||||
| 1,189,699 | ||||||||
| Machinery (1.85%) | ||||||||
| Thermax, Ltd. | 15,982 | 244,594 | ||||||
| Timken India, Ltd. | 28,485 | 341,449 | ||||||
| 586,043 | ||||||||
| TOTAL INDUSTRIALS | 3,758,062 | |||||||
| Information Technology (6.60%) | ||||||||
| IT Services (6.60%) | ||||||||
| HCL Technologies, Ltd. | 29,467 | 389,416 | ||||||
| Infosys, Ltd. | 72,078 | 1,026,251 | ||||||
| Tata Consultancy Services, Ltd. | 8,212 | 332,873 | ||||||
| Tech Mahindra, Ltd. | 45,097 | 335,543 | ||||||
| 2,084,083 | ||||||||
| TOTAL INFORMATION TECHNOLOGY | 2,084,083 | |||||||
| Materials (17.93%) | ||||||||
| Auto Parts & Equipment (0.75%) | ||||||||
| Gulf Oil Lubricants India, Ltd. | 19,906 | 237,925 | ||||||
| Chemicals (4.33%) | ||||||||
| Akzo Nobel India, Ltd. | 13,736 | 405,551 | ||||||
| Berger Paints India, Ltd. | 99,779 | 410,347 | ||||||
| Bodal Chemicals, Ltd. | 104,652 | 290,898 | ||||||
| SH Kelkar & Co., Ltd.(b)(c) | 62,228 | 260,719 | ||||||
| 1,367,515 | ||||||||
| Construction Materials (10.13%) | ||||||||
| ACC, Ltd. | 14,700 | 410,961 | ||||||
| Century Textiles & Industries, Ltd. | 19,625 | 412,340 | ||||||
| Dalmia Bharat, Ltd. | 8,976 | 415,070 | ||||||
| JK Cement, Ltd. | 27,747 | 429,837 | ||||||
| Orient Cement, Ltd. | 100,000 | 260,609 | ||||||
| Ramco Cements, Ltd. | 48,447 | 539,397 | ||||||
| Shree Cement, Ltd. | 1,226 | 358,593 | ||||||
| UltraTech Cement, Ltd. | 5,450 | 370,699 | ||||||
| 3,197,506 | ||||||||
| Metals & Mining (2.72%) | ||||||||
| Jindal Steel & Power, Ltd.(a) | 140,000 | 352,723 | ||||||
| Shares | Value (Note 2) | |||||||
| Metals & Mining (continued) | ||||||||
| Vedanta, Ltd. | 98,517 | $ | 505,757 | |||||
| 858,480 | ||||||||
| TOTAL MATERIALS | 5,661,426 | |||||||
| Real Estate (1.28%) | ||||||||
| Real Estate Management & Development (1.28%) | ||||||||
| Brigade Enterprises, Ltd. | 98,900 | 403,373 | ||||||
| TOTAL REAL ESTATE | 403,373 | |||||||
| TOTAL COMMON STOCKS | ||||||||
| (Cost $24,843,529) | 31,131,850 | |||||||
| TOTAL INVESTMENTS (98.62%) | ||||||||
| (Cost $24,843,529) | $ | 31,131,850 | ||||||
| Other Assets In Excess Of Liabilities (1.38%) | 437,071 | |||||||
| NET ASSETS (100.00%) | $ | 31,568,921 | ||||||
| (a) | Non-Income Producing Security. |
| (b) | Security exempt from registration under Rule 144A of the Securities Act of 1933. This security may be resold in transactions exempt from registration, normally to qualified institutional buyers. As of October 31, 2017, the aggregate market value of those securities was $903,183, representing 2.86% of net assets. |
| (c) | Securities were purchased pursuant to Regulation S under the Securities Act of 1933, which exempts securities offered and sold outside of the United States from registration. Such securities cannot be sold in the United States without either an effective registration statement filed pursuant to the Securities Act of 1933, or pursuant to an exemption from registration. These securities have been deemed liquid under guidelines approved by the Fund’s Board of Trustees. As of October 31, 2017 the aggregate market value of those securities was $903,183 representing 2.86% of net assets. |
For Fund compliance purposes, the Fund’s industry classifications refer to any one or more of the industry sub-classifications used by one or more widely recognized market indexes or ratings group indexes, and/or as defined by Fund management. This definition may not apply for purposes of this report, which may combine industry sub-classifications for reporting ease. Industries are shown as a percent of net assets.
See Notes to Financial Statements.
41 | October 31, 2017
ALPS | Kotak India Growth Fund
| Consolidated Statement of Assets and Liabilities | October 31, 2017 |
| ASSETS | ||||
| Investments, at value | $ | 31,131,850 | ||
| Cash | 83,349 | |||
| Foreign currency, at value (Cost $535,302) | 535,567 | |||
| Receivable for investments sold | 53,155 | |||
| Receivable for shares sold | 68,268 | |||
| Dividends receivable | 16,641 | |||
| Income tax receivable | 4,072 | |||
| Prepaid expenses and other assets | 6,887 | |||
| Total Assets | 31,899,789 | |||
| LIABILITIES | ||||
| Payable for investments purchased | 39,913 | |||
| Payable for shares redeemed | 55,066 | |||
| Payable for foreign capital gains tax | 139,702 | |||
| Investment advisory fees payable | 4,048 | |||
| Administration and transfer agency fees payable | 30,478 | |||
| Distribution and services fees payable | 6,686 | |||
| Trustees’ fees and expenses payable | 2,000 | |||
| Professional fees payable | 34,573 | |||
| Accrued expenses and other liabilities | 18,402 | |||
| Total Liabilities | 330,868 | |||
| NET ASSETS | $ | 31,568,921 | ||
| NET ASSETS CONSIST OF | ||||
| Paid-in capital | $ | 24,837,155 | ||
| Accumulated net investment loss | (212,659 | ) | ||
| Accumulated net realized gain | 795,530 | |||
| Net unrealized appreciation | 6,148,895 | |||
| NET ASSETS | $ | 31,568,921 | ||
| INVESTMENTS, AT COST | $ | 24,843,529 | ||
| PRICING OF SHARES | ||||
| Class A: | ||||
| Net Asset Value, offering and redemption price per share | $ | 14.53 | ||
| Net Assets | $ | 9,538,089 | ||
| Shares of beneficial interest outstanding (unlimited number of shares, no par value common stock authorized) | 656,602 | |||
| Maximum offering price per share ((NAV/0.9450), based on maximum sales charge of 5.50% of the offering price) | $ | 15.37 | ||
| Class C: | ||||
| Net Asset Value, offering and redemption price per share(a) | $ | 13.87 | ||
| Net Assets | $ | 2,139,634 | ||
| Shares of beneficial interest outstanding (unlimited number of shares, no par value common stock authorized) | 154,312 | |||
| Class I: | ||||
| Net Asset Value, offering and redemption price per share | $ | 14.87 | ||
| Net Assets | $ | 19,891,198 | ||
| Shares of beneficial interest outstanding (unlimited number of shares, no par value common stock authorized) | 1,337,709 | |||
| (a) | Redemption price per share may be reduced for any applicable contingent deferred sales charge. For a description of a possible sales charge, please see the Fund’s Prospectus. |
See Notes to Financial Statements.
42 | October 31, 2017
ALPS | Kotak India Growth Fund
| Consolidated Statement of Operations | For the Year Ended October 31, 2017 |
| INVESTMENT INCOME | ||||
| Dividends | $ | 289,764 | ||
| Total Investment Income | 289,764 | |||
| EXPENSES | ||||
| Investment advisory fees | 314,575 | |||
| Administrative fees | 143,830 | |||
| Transfer agency fees | 3,449 | |||
| Distribution and service fees | ||||
| Class A | 22,847 | |||
| Class C | 20,224 | |||
| Professional fees | 44,740 | |||
| Reports to shareholders and printing fees | 7,061 | |||
| State registration fees | 44,241 | |||
| Insurance fees | 138 | |||
| Custody fees | 76,258 | |||
| Trustees’ fees and expenses | 4,507 | |||
| Miscellaneous expenses | 29,001 | |||
| Total Expenses | 710,871 | |||
| Less fees waived/reimbursed by investment advisor (Note 8) | ||||
| Class A | (80,686 | ) | ||
| Class C | (22,009 | ) | ||
| Class I | (162,405 | ) | ||
| Net Expenses | 445,771 | |||
| Net Investment Loss | (156,007 | ) | ||
| Net realized gain on investments | 964,676 | |||
| Net realized loss on foreign currency transactions | (5,499 | ) | ||
| Net Realized Gain | 959,177 | |||
| Net change in unrealized appreciation on investments | 4,163,224 | |||
| Net change in unrealized appreciation on translation of assets and liabilities denominated in foreign currencies | 276 | |||
| Net change in unrealized foreign capital gains tax | (139,702 | ) | ||
| Net Change in Unrealized Appreciation | 4,023,798 | |||
| NET REALIZED AND UNREALIZED GAIN ON INVESTMENTS | 4,982,975 | |||
| NET INCREASE IN NET ASSETS RESULTING FROM OPERATIONS | $ | 4,826,968 | ||
See Notes to Financial Statements.
43 | October 31, 2017
ALPS | Kotak India Growth Fund
Consolidated Statements of Changes in Net Assets
| For the Year Ended October 31, 2017 | For the Year Ended October 31, 2016 | |||||||
| OPERATIONS | ||||||||
| Net investment loss | $ | (156,007 | ) | $ | (118,384 | ) | ||
| Net realized gain | 959,177 | 275,520 | ||||||
| Net change in unrealized appreciation | 4,023,798 | 1,653,421 | ||||||
| Net Increase in Net Assets Resulting from Operations | 4,826,968 | 1,810,557 | ||||||
| DISTRIBUTIONS | ||||||||
| Dividends to shareholders from net realized gains | ||||||||
| Class A | (64,593 | ) | (736,575 | ) | ||||
| Class C | (23,697 | ) | (259,740 | ) | ||||
| Class I | (115,109 | ) | (1,091,978 | ) | ||||
| Net Decrease in Net Assets from Distributions | (203,399 | ) | (2,088,293 | ) | ||||
| BENEFICIAL INTEREST TRANSACTIONS (NOTE 6) | ||||||||
| Shares sold | ||||||||
| Class A | 5,923,581 | 1,091,860 | ||||||
| Class C | 216,603 | 61,021 | ||||||
| Class I | 10,516,245 | 2,297,591 | ||||||
| Dividends reinvested | ||||||||
| Class A | 51,962 | 680,347 | ||||||
| Class C | 23,372 | 254,983 | ||||||
| Class I | 103,156 | 1,079,849 | ||||||
| Shares redeemed, net of redemption fees | ||||||||
| Class A | (3,510,751 | ) | (1,751,257 | ) | ||||
| Class C | (350,672 | ) | (325,582 | ) | ||||
| Class I | (3,497,829 | ) | (2,079,111 | ) | ||||
| Net Increase in Net Assets Derived from Beneficial Interest Transactions | 9,475,667 | 1,309,701 | ||||||
| Net increase in net assets | 14,099,236 | 1,031,965 | ||||||
| NET ASSETS | ||||||||
| Beginning of year | 17,469,685 | 16,437,720 | ||||||
| End of year * | $ | 31,568,921 | $ | 17,469,685 | ||||
| *Including accumulated net investment loss of: | $ | (212,659 | ) | $ | (149,793 | ) | ||
See Notes to Financial Statements.
44 | October 31, 2017
ALPS | Kotak India Growth Fund – Class A
Consolidated Financial Highlights
Selected data for a share of beneficial interest outstanding throughout the periods indicated:
| For the Year Ended October 31, 2017 | For the Year Ended October 31, 2016 | For the Year Ended October 31, 2015 | For the Fiscal Period Ended October 31, 2014(a) | For the Year Ended April 30, 2014 | For the Year Ended April 30, 2013 | |||||||||||||||||||
| Net asset value, beginning of period(b) | $ | 12.32 | $ | 12.57 | $ | 13.20 | $ | 9.99 | $ | 9.47 | $ | 8.22 | ||||||||||||
| INCOME/(LOSS) FROM INVESTMENT OPERATIONS: | ||||||||||||||||||||||||
| Net investment income/(loss)(c) | (0.10 | ) | (0.09 | ) | (0.14 | ) | 0.01 | (0.02 | ) | (0.07 | ) | |||||||||||||
| Net realized and unrealized gain | 2.45 | 1.45 | 0.06 | 3.20 | 0.54 | 1.32 | ||||||||||||||||||
| Total from investment operations | 2.35 | 1.36 | (0.08 | ) | 3.21 | 0.52 | 1.25 | |||||||||||||||||
| DISTRIBUTIONS: | ||||||||||||||||||||||||
| From net investment income | – | – | (0.17 | ) | – | – | – | |||||||||||||||||
| From net realized gains | (0.14 | ) | (1.61 | ) | (0.38 | ) | – | – | – | |||||||||||||||
| Total distributions | (0.14 | ) | (1.61 | ) | (0.55 | ) | – | – | – | |||||||||||||||
| REDEMPTION FEES ADDED TO PAID-IN CAPITAL (NOTE 6) | 0.00 | (d) | 0.00 | (d) | 0.00 | (d) | 0.00 | (d) | 0.00 | (d) | 0.00 | (d) | ||||||||||||
| Net increase/(decrease) in net asset value | 2.21 | (0.25 | ) | (0.63 | ) | 3.21 | 0.52 | 1.25 | ||||||||||||||||
| Net asset value, end of year | $ | 14.53 | $ | 12.32 | $ | 12.57 | $ | 13.20 | $ | 9.99 | $ | 9.47 | ||||||||||||
| TOTAL RETURN(e) | 19.45 | % | 13.31 | % | (0.65 | )% | 32.13 | % | 5.49 | % | 15.21 | % | ||||||||||||
| RATIOS/SUPPLEMENTAL DATA: | ||||||||||||||||||||||||
| Net assets, end of year (000s) | $ | 9,538 | $ | 5,772 | $ | 5,906 | $ | 5,536 | $ | 5,211 | $ | 4,681 | ||||||||||||
| Ratio of expenses to average net assets excluding fee waivers and reimbursements | 2.95 | % | 3.83 | % | 3.51 | % | 4.92 | %(f) | 6.51 | % | 7.99 | % | ||||||||||||
| Ratio of expenses to average net assets including fee waivers and reimbursements | 1.90 | % | 1.90 | % | 1.96 | % | 1.90 | %(f) | 1.88 | % | 2.00 | % | ||||||||||||
| Ratio of net investment income/(loss) to average net assets | (0.74 | )% | (0.86 | )% | (1.03 | )% | 0.19 | %(f) | (0.27 | )% | (0.82 | )% | ||||||||||||
| Portfolio turnover rate(g) | 30 | % | 23 | % | 58 | % | 28 | % | 65 | % | 93 | % | ||||||||||||
| (a) | Effective May 1, 2014, the Board approved changing the fiscal year-end of the Funds from April 30 to October 31. |
| (b) | Per share amounts and ratios to average net assets include income and expenses of the Kotak Mauritius Portfolio (wholly-owned subsidiary). |
| (c) | Calculated using the average shares method. |
| (d) | Less than $0.005 or ($0.005) per share. |
| (e) | Total returns are for the period indicated and have not been annualized. Total returns would have been lower had certain expenses not been waived during the period. Returns shown do not reflect the deduction of taxes that a shareholder would pay on Fund distributions or the redemption of Fund shares. Returns shown exclude any applicable sales charges. |
| (f) | Annualized. |
| (g) | Portfolio turnover rate for periods less than one full year have not been annualized. |
See Notes to Financial Statements.
45 | October 31, 2017
ALPS | Kotak India Growth Fund – Class C
Consolidated Financial Highlights
Selected data for a share of beneficial interest outstanding throughout the periods indicated:
| For the Year Ended October 31, 2017 | For the Year Ended October 31, 2016 | For the Year Ended October 31, 2015 | For the Fiscal Period Ended October 31, 2014(a) | For the Year Ended April 30, 2014 | For the Year Ended April 30, 2013 | |||||||||||||||||||
| Net asset value, beginning of period(b) | $ | 11.85 | $ | 12.23 | $ | 12.88 | $ | 9.77 | $ | 9.34 | $ | 8.15 | ||||||||||||
| INCOME/(LOSS) FROM INVESTMENT OPERATIONS: | ||||||||||||||||||||||||
| Net investment loss(c) | (0.18 | ) | (0.16 | ) | (0.21 | ) | (0.03 | ) | (0.09 | ) | (0.12 | ) | ||||||||||||
| Net realized and unrealized gain | 2.34 | 1.39 | 0.05 | 3.14 | 0.52 | 1.31 | ||||||||||||||||||
| Total from investment operations | 2.16 | 1.23 | (0.16 | ) | 3.11 | 0.43 | 1.19 | |||||||||||||||||
| DISTRIBUTIONS: | ||||||||||||||||||||||||
| From net investment income | – | – | (0.11 | ) | – | – | – | |||||||||||||||||
| From net realized gains | (0.14 | ) | (1.61 | ) | (0.38 | ) | – | – | – | |||||||||||||||
| Total distributions | (0.14 | ) | (1.61 | ) | (0.49 | ) | – | – | – | |||||||||||||||
| REDEMPTION FEES ADDED TO PAID-IN CAPITAL (NOTE 6) | – | 0.00 | (d) | – | 0.00 | (d) | – | – | ||||||||||||||||
| Net increase/(decrease) in net asset value | 2.02 | (0.38 | ) | (0.65 | ) | 3.11 | 0.43 | 1.19 | ||||||||||||||||
| Net asset value, end of year | $ | 13.87 | $ | 11.85 | $ | 12.23 | $ | 12.88 | $ | 9.77 | $ | 9.34 | ||||||||||||
| TOTAL RETURN(e) | 18.60 | % | 12.51 | % | (1.34 | )% | 31.83 | % | 4.60 | % | 14.60 | % | ||||||||||||
| RATIOS/SUPPLEMENTAL DATA: | ||||||||||||||||||||||||
| Net assets, end of year (000s) | $ | 2,140 | $ | 1,925 | $ | 1,965 | $ | 1,497 | $ | 875 | $ | 924 | ||||||||||||
| Ratio of expenses to average net assets excluding fee waivers and reimbursements | 3.69 | % | 4.54 | % | 4.11 | % | 5.57 | %(f) | 7.26 | % | 8.54 | % | ||||||||||||
| Ratio of expenses to average net assets including fee waivers and reimbursements | 2.60 | % | 2.60 | % | 2.60 | % | 2.60 | %(f) | 2.60 | % | 2.60 | % | ||||||||||||
| Ratio of net investment loss to average net assets | (1.48 | )% | (1.56 | )% | (1.67 | )% | (0.50 | )%(f) | (1.00 | )% | (1.42 | )% | ||||||||||||
| Portfolio turnover rate(g) | 30 | % | 23 | % | 58 | % | 28 | % | 65 | % | 93 | % | ||||||||||||
| (a) | Effective May 1, 2014, the Board approved changing the fiscal year-end of the Funds from April 30 to October 31. |
| (b) | Per share amounts and ratios to average net assets include income and expenses of the Kotak Mauritius Portfolio (wholly-owned subsidiary). |
| (c) | Calculated using the average shares method. |
| (d) | Less than $0.005 or ($0.005) per share. |
| (e) | Total returns are for the period indicated and have not been annualized. Total returns would have been lower had certain expenses not been waived during the period. Returns shown do not reflect the deduction of taxes that a shareholder would pay on Fund distributions or the redemption of Fund shares. Returns shown exclude any applicable sales charges. |
| (f) | Annualized. |
| (g) | Portfolio turnover rate for periods less than one full year have not been annualized. |
See Notes to Financial Statements.
46 | October 31, 2017
ALPS | Kotak India Growth Fund – Class I
Consolidated Financial Highlights
Selected data for a share of beneficial interest outstanding throughout the periods indicated:
| For the Year Ended October 31, 2017 | For the Year Ended October 31, 2016 | For the Year Ended October 31, 2015 | For the Fiscal Period Ended October 31, 2014(a) | For the Year Ended April 30, 2014 | For the Year Ended April 30, 2013 | |||||||||||||||||||
| Net asset value, beginning of period(b) | $ | 12.58 | $ | 12.76 | $ | 13.29 | $ | 10.04 | $ | 9.55 | $ | 8.25 | ||||||||||||
| INCOME/(LOSS) FROM INVESTMENT OPERATIONS: | ||||||||||||||||||||||||
| Net investment income/(loss)(c) | (0.06 | ) | (0.06 | ) | (0.09 | ) | 0.03 | 0.00 | (d) | (0.04 | ) | |||||||||||||
| Net realized and unrealized gain | 2.48 | 1.49 | 0.06 | 3.22 | 0.54 | 1.34 | ||||||||||||||||||
| Total from investment operations | 2.42 | 1.43 | (0.03 | ) | 3.25 | 0.54 | 1.30 | |||||||||||||||||
| DISTRIBUTIONS: | ||||||||||||||||||||||||
| From net investment income | – | – | (0.13 | ) | – | (0.05 | ) | – | ||||||||||||||||
| From net realized gains | (0.14 | ) | (1.61 | ) | (0.38 | ) | – | – | – | |||||||||||||||
| Total distributions | (0.14 | ) | (1.61 | ) | (0.51 | ) | – | (0.05 | ) | – | ||||||||||||||
| REDEMPTION FEES ADDED TO PAID-IN CAPITAL (NOTE 6) | 0.01 | 0.00 | (d) | 0.01 | 0.00 | (d) | – | 0.00 | (d) | |||||||||||||||
| Net increase/(decrease) in net asset value | 2.29 | (0.18 | ) | (0.53 | ) | 3.25 | 0.49 | 1.30 | ||||||||||||||||
| Net asset value, end of year | $ | 14.87 | $ | 12.58 | $ | 12.76 | $ | 13.29 | $ | 10.04 | $ | 9.55 | ||||||||||||
| TOTAL RETURN(e) | 19.68 | % | 13.70 | % | (0.23 | )% | 32.37 | % | 5.70 | % | 15.76 | % | ||||||||||||
| RATIOS/SUPPLEMENTAL DATA: | ||||||||||||||||||||||||
| Net assets, end of year (000s) | $ | 19,891 | $ | 9,772 | $ | 8,567 | $ | 8,955 | $ | 1,945 | $ | 2,149 | ||||||||||||
| Ratio of expenses to average net assets excluding fee waivers and reimbursements | 2.65 | % | 3.54 | % | 3.10 | % | 4.49 | %(f) | 6.28 | % | 7.65 | % | ||||||||||||
| Ratio of expenses to average net assets including fee waivers and reimbursements | 1.60 | % | 1.60 | % | 1.60 | % | 1.60 | %(f) | 1.60 | % | 1.60 | % | ||||||||||||
| Ratio of net investment income/(loss) to average net assets | (0.45 | )% | (0.56 | )% | (0.67 | )% | 0.50 | %(f) | 0.00 | %(g) | (0.42 | )% | ||||||||||||
| Portfolio turnover rate(h) | 30 | % | 23 | % | 58 | % | 28 | % | 65 | % | 93 | % | ||||||||||||
| (a) | Effective May 1, 2014, the Board approved changing the fiscal year-end of the Funds from April 30 to October 31. |
| (b) | Per share amounts and ratios to average net assets include income and expenses of the Kotak Mauritius Portfolio (wholly-owned subsidiary). |
| (c) | Calculated using the average shares method. |
| (d) | Less than $0.005 or ($0.005) per share. |
| (e) | Total returns are for the period indicated and have not been annualized. Total returns would have been lower had certain expenses not been waived during the period. Returns shown do not reflect the deduction of taxes that a shareholder would pay on Fund distributions or the redemption of Fund shares. |
| (f) | Annualized. |
| (g) | Less than 0.005% |
| (h) | Portfolio turnover rate for periods less than one full year have not been annualized. |
See Notes to Financial Statements.
47 | October 31, 2017
ALPS | Metis Global Micro Cap Value Fund
| Management Commentary | October 31, 2017 (Unaudited) |
Market Commentary
The S&P Global Broad Market Index of companies with less than $500 million of market capitalization (the S&P Global BMI < $500m) increased +23.4% over the past twelve months ending 10/31/17.
The impressive returns reflect a continuation of the robust economic trends that developed in late 2016 as the US emerged from a dollar and oil driven revenue recession that mired corporate results. The first major catalyst of the period was Donald Trump winning the presidential election, and a hope that his tax-friendly and fiscally expansionary agenda would provide a boost to corporate earnings. The surprise results launched US markets into an essentially uninterrupted yearlong risk-on rally, with global micro-cap markets following suit: US-micro cap equities are up +29.9%, the Eurozone is up +32.2%, Japan is up +33%, while Asia / Pacific remained flat at +0.2% (all returns denominated in USD). The positive performance belies the scope of structural policy volatility in the period. In the US, the Federal Reserve raised rates twice and began to reduce its balance sheet; In Japan, the Bank of Japan opted to keep monetary policy loose coincident with a surge in domestic demand; In China, GDP growth continued to slow (although credit reaccelerated); while in Europe, GDP growth slowed coincident to the ECB reducing its pace of asset purchases. Jumping to UK micro caps (up +42.3%), although investors remain troubled by BREXIT and slow growth, economic data has troughed relative to other G7 nations. Shares advanced sharply as a result. Despite these policy shifts, many positive global developments came to light, including real 2017 GDP growth expected in all regions, along with strong global manufacturing trends.
Elsewhere, Emerging Markets continued a rebound which began in 2016. Credit quality in Brazil is improving, Asia / Pac countries like South Korea and Taiwan both had solid export growth and consumption, and China’s A-Shares earnings accelerated on the back of tech and industrial growth.
Fund Review
The ALPS/Metis Global Micro Cap Fund returned +17.4% over the twelve months ending 10/31/17, below the benchmark S&P Global BMI < $500 million return of +23.4%.
The largest driver of the Fund’s performance in the period was upside mean reversion in two classic value/cyclical sectors, Industrials and Consumer Discretionary, which were coming off low valuations in 2015 and 2016. The low valuations coincident with a global growth spurt offered an opportunity for shares to reprice upwards toward intrinsic values.
Within Industrials, the Machinery industry (up +55.5%) provided the strongest contribution to portfolio return, followed by Road & Rails (up +93.2%). In the Consumer Discretionary sector, Consumer Services (up +39.9%) and Auto Components up (+38.1%) performed well, besting their respective benchmarks. The outperformance in these industries overlapped nicely with a geographic overweight to Japan (+42.7% portfolio return), where Industrials and Consumer Discretionary are the highest weighted sectors. Japanese positions
were diverse across a range of industries, with greater than a third of these holdings returning 40% or more. Some notable portfolio wins were semiconductor Sansha Electric (+150.9%), chemical producer JCU (+118%), rubber producer Sanyo Trading (+109.2%) and auto parts maker Nichirin (+104.1%).
The primary regional detractor from portfolio performance in the period was North America, specifically the US. Despite the US market having historically rich valuation multiples, many of the Fund’s portfolio companies are attractively priced and fared well. Underperformance was limited to a handful of Oil, Gas & Energy plays and in several tech companies which had surprise, exogenous events in the period. On a sector basis, the biggest negative impact came from Information Technology, where the portfolio was challenged by having both a lower total return and a lower portfolio weighting relative to the benchmark. The portfolio remains underweight Tech primarily on valuation concerns as investors continue to award a substantial growth premium to shares. In some Tech industries, such as Tech Hardware (+25.6% portfolio return vs. 14.4% benchmark) and Semiconductors (+79.9% portfolio return vs. +56.6% benchmark), security selection was beneficial. These positive results were not enough to offset the benchmark’s outsized Tech performance.
Strategy and Outlook
The Fund is managed using a bottom-up investment approach with valuation being the key criteria. Once an investable opportunity set is assembled, securities are valued along two successive valuation approaches: i) valuation based on the company’s specific global industry, and ii) valuation based on the overall embedded business value of the company. Portfolio construction at Metis is a purely systematic process directly related to the security’s score – only those securities with the highest scores are considered for the portfolio. Metis optimizes the portfolio on value to maximize opportunity, resulting in the highest scoring stocks receiving the greatest weight. Country and industry exposures are a residual of this process.
On a regional basis, the largest portfolio overweight by region is Japan (33.7% weight), of which one third of the exposure is in Japanese Industrials. Valuations in Japan remain favorable due to investor skepticism about the efficacy of Prime Minister Abe’s economic plan and broader concerns about macroeconomic and demographic growth. Despite the disconnect in sentiment and valuation, recent measures show robust economic activity fueled by a “disinflation boom” (higher income leads to higher spending, without the attendant increase in inflation) – this dynamic should benefit portfolio companies. Looking at hard data, Japanese machinery orders are in a strong uptrend, and manufacturing surveys show businesses plan on expanding at the highest rate in years. These dynamics bode well for Industrial holdings, and overall, Japanese portfolio positions are often cash-rich, with attractive dividend yields.
Brazil is the largest overweight among the Fund’s Emerging Market exposure (15% of weight). Brazilian holdings are concentrated in
48 | October 31, 2017
ALPS | Metis Global Micro Cap Value Fund
| Management Commentary | October 31, 2017 (Unaudited) |
Industrials and Financials. Brazilian Industrials are primarily levered to economic data, which has been surprising to the upside (GDP growth, and the Brazilian unemployment rate) – any improvement here will drive returns ahead. Elsewhere, Brazilian Banks stand to benefit as the credit profile of banks improve, which in turn should improve loan volumes. Portfolio banks have an average ROE of 12.75%, higher than the global bank average. Conversely, the Fund is underweight shares in Europe, as operating metrics and regional growth trail global peers. Being underweight Europe is also a function of regional valuations having high dispersion. For example, while France is attractive, certain Nordic countries like Switzerland and Sweden have higher than average valuations, and accordingly, the portfolio is underweight those areas. The cumulative effect is an underweight to the whole region. Additionally, the Fund is underweight the Asia / Pacific ex-Japan region, namely Hong Kong and South Korea. Hong Kong has improving growth characteristics but is expensive and at risk of a market correction. South Korea has a similar issue – its index composition is 30% technology, which is at the upper end of its multi-year valuation range. As always, the portfolio continues to seek the most attractive regions and opportunities to allocate funds to.
Thank you for your continued support and investment in the ALPS|Metis Global Micro Cap Fund.
Machel Allen, CFA
President and Chief Investment Officer
Daniel Jassy, CFA
Research Analyst
The views of the authors and information discussed in this commentary are as of the date of publication, are subject to change, and may not reflect the writers’ current views. The views expressed are those of the authors only, and represent an assessment of market conditions at a specific point in time, are opinions only and should not be relied upon as investment advice regarding a particular investment or markets in general. Such information does not constitute a recommendation to buy or sell specific securities or investment vehicles. It should not be assumed that any investment will be profitable or will equal the performance of the fund(s) or any securities or any sectors mentioned in this letter. The subject matter contained in this letter has been derived from several sources believed to be reliable and accurate at the time of compilation. Neither ALPS Advisors, Inc., Metis Global Partners, LLC, nor the Fund accepts any liability for losses either direct or consequential caused by the use of this information.
Diversification cannot guarantee gain or prevent losses.
49 | October 31, 2017
ALPS | Metis Global Micro Cap Value Fund
| Performance Update | October 31, 2017 (Unaudited) |
Performance of $10,000 Initial Investment (as of October 31, 2017)
Comparison of change in value of a $10,000 investment (includes maximum sales charges of 5.50%)

The chart above represents historical performance of a hypothetical investment of $10,000 in the Fund since inception. Past performance does not guarantee future results. This chart does not reflect the deduction of taxes that a shareholder would pay on Fund distributions or the redemption of Fund shares.
Average Annual Total Returns (as of October 31, 2017)
| 6 Month | 1 Year | Since Inception^ | Total Expense Ratio | What You Pay* | |
| ALPS | Metis Global Micro Cap Value Fund - A - NAV | 6.31% | 16.93% | 17.18% | 4.48% | 2.11% |
| ALPS | Metis Global Micro Cap Value Fund - A - MOP | 0.43% | 10.48% | 13.67% | ||
| ALPS | Metis Global Micro Cap Value Fund - C - NAV | 6.04% | 16.32% | 16.41% | 4.92% | 2.71% |
| ALPS | Metis Global Micro Cap Value Fund - C - CDSC | 5.04% | 15.32% | 16.41% | ||
| ALPS | Metis Global Micro Cap Value Fund - I - NAV | 6.49% | 17.38% | 17.53% | 3.41% | 1.71% |
| S&P Global BMI Under $500 Million Index1 | 11.17% | 22.77% | 16.33% |
Performance data quoted represents past performance. Past performance does not guarantee future results. Investment return and principal value of an investment will fluctuate so that an investor’s shares, when sold or redeemed, may be worth more or less than the original cost. Current performance data may be higher or lower than actual data quoted. For the most current month-end performance data, please call 1-866-759-5679.
Maximum Offering Price (MOP) for Class A shares includes the Fund’s maximum sales charge of 5.50%. Performance shown at NAV does not include these sales charges and would have been lower had it been taken into account. If you invest $1 million or more, either as a lump sum or through the Fund’s accumulation or letter of intent programs, you can purchase Class A shares without an initial sales charge (load). A Contingent Deferred Sales Charge (“CDSC”) of 1.00% may apply to Class C shares redeemed within the first 12 months after a purchase, and on Class A shares redeemed within the first 18 months after a purchase in excess of $1 million. The Fund imposes a 2.00% redemption fee on shares held for less than 60 days.
Performance less than 1 year is cumulative.
50 | October 31, 2017
ALPS | Metis Global Micro Cap Value Fund
| Performance Update | October 31, 2017 (Unaudited) |
| 1 | The S&P Global BMI Under $500 Million Index with net dividends is a comprehensive, rules-based index measuring global stock market performance of micro- and small- capitalization companies. It represents all issues in the S&P Global BMI (Broad Market Index (BMI) whose market capitalization at time of index constitution is less than $500 million. The S&P Global <$500M Index includes companies from both developed and emerging nations. An investor may not invest directly in an index. |
| ^ | Fund inception date of December 23, 2015. |
| * | What You Pay reflects the Advisor’s decision to contractually limit expenses through February 28, 2018. Please see the prospectus for additional information. |
The table does not reflect the deduction of taxes that a shareholder would pay on Fund distributions or the redemption of Fund shares.
This Fund is not suitable for all investors and is subject to investment risks, including possible loss of the principal amount invested.
There is no guarantee that the Fund will continue to hold any one particular security or stay invested in any one particular company. The composition of the Fund’s top holdings is subject to change. Performance figures are historical and reflect the change in share price, reinvested distributions, changes in net asset value, sales charges and capital gains distributions, if any.
Effective February 28, 2017 the Fund changed its name from the ALPS | Metis Global Micro Cap Fund to the ALPS | Metis Global Micro Cap Value Fund
Not FDIC Insured – No Bank Guarantee – May Lose Value
| Top Ten Holdings (as a % of Net Assets) † | |
| Sansha Electric Manufacturing Co., Ltd. | 0.71% |
| Covenant Transportation Group, Inc. | 0.59% |
| Yachiyo Industry Co., Ltd. | 0.56% |
| Nichirin Co., Ltd. | 0.56% |
| Nittetsu Mining Co., Ltd. | 0.55% |
| Somboon Advance Technology PCL | 0.55% |
| PAM Transportation Services, Inc. | 0.53% |
| Matrix Service Co. | 0.51% |
| Land & General Bhd | 0.51% |
| Arealink Co., Ltd. | 0.50% |
| Top Ten Holdings | 5.57% |
| Top Ten Country Allocation (as a % of Net Assets) † | |
| Japan | 32.35% |
| United States | 19.09% |
| South Korea | 9.57% |
| Taiwan | 5.23% |
| Australia | 3.50% |
| Canada | 3.45% |
| Great Britain | 3.30% |
| Brazil | 2.36% |
| India | 1.63% |
| Malaysia | 1.60% |
| Top Ten Country Allocation | 82.08% |
Industry Sector Allocation (as a % of Net Assets)

| † | Holdings are subject to change, and may not reflect the current or future position of the portfolio. Tables present indicative values only. Excludes cash & cash equivalents. |
51 | October 31, 2017
ALPS | Metis Global Micro Cap Value Fund
| Statement of Investments | October 31, 2017 |
| Shares | Value (Note 2) | |||||||
| COMMON STOCKS (95.54%) | ||||||||
| Australia (3.50%) | ||||||||
| Beadell Resources, Ltd.(a) | 621,741 | $ | 85,048 | |||||
| Cabcharge Australia, Ltd. | 40,034 | 50,862 | ||||||
| Medusa Mining, Ltd.(a) | 349,571 | 105,362 | ||||||
| Metals X, Ltd. | 183,356 | 140,333 | ||||||
| Monadelphous Group, Ltd. | 8,950 | 116,363 | ||||||
| Prime Media Group, Ltd. | 480,870 | 136,173 | ||||||
| Reckon, Ltd. | 64,133 | 61,110 | ||||||
| Sandfire Resources NL | 23,161 | 101,979 | ||||||
| Senex Energy, Ltd.(a) | 421,541 | 111,663 | ||||||
| Seven West Media, Ltd. | 132,860 | 68,782 | ||||||
| Tox Free Solutions, Ltd. | 53,666 | 100,765 | ||||||
| 1,078,440 | ||||||||
| Brazil (1.31%) | ||||||||
| Mills Estruturas E Servicos De Engenharia SA(a) | 61,277 | 80,546 | ||||||
| Paranapanema SA(a) | 205,100 | 93,418 | ||||||
| Tegma Gestao Logistica SA | 22,500 | 124,905 | ||||||
| Valid Solucoes e Servicos de Seguranca em Meios de Pagamento e Identificacao SA | 18,500 | 103,548 | ||||||
| 402,417 | ||||||||
| Canada (3.45%) | ||||||||
| Bird Construction, Inc. | 15,291 | 115,918 | ||||||
| Clarke, Inc. | 10,602 | 82,180 | ||||||
| Granite Oil Corp. | 20,905 | 55,742 | ||||||
| Horizon North Logistics, Inc. | 74,986 | 101,717 | ||||||
| Mandalay Resources Corp. | 355,688 | 81,333 | ||||||
| Nevsun Resources, Ltd. | 42,130 | 99,275 | ||||||
| Pizza Pizza Royalty Corp. | 7,648 | 101,728 | ||||||
| Resolute Forest Products, Inc.(a) | 23,222 | 138,172 | ||||||
| Torstar Corp., Class B | 72,844 | 76,226 | ||||||
| Western Energy Services Corp.(a) | 93,496 | 89,140 | ||||||
| Yellow Pages, Ltd.(a) | 19,163 | 122,991 | ||||||
| 1,064,422 | ||||||||
| Cayman Islands (0.32%) | ||||||||
| Consolidated Water Co., Ltd. | 7,988 | 98,252 | ||||||
| Chile (0.48%) | ||||||||
| PAZ Corp. SA | 85,230 | 147,306 | ||||||
| China (1.34%) | ||||||||
| Boer Power Holdings, Ltd.(a) | 285,000 | 73,464 | ||||||
| Jiangnan Group, Ltd. | 1,360,000 | 113,365 | ||||||
| Kangda International Environmental Co., Ltd.(b) | 500,000 | 126,323 | ||||||
| Leoch International Technology, Ltd. | 501,000 | 98,340 | ||||||
| 411,492 | ||||||||
| Cyprus (0.00%)(c) | ||||||||
| Ocean Rig UDW, Inc.(a) | 55 | 1,473 | ||||||
| France (0.81%) | ||||||||
| Neopost SA | 2,230 | 82,199 | ||||||
| Shares | Value (Note 2) | |||||||
| France (continued) | ||||||||
| Sequana SA(a) | 84,570 | $ | 78,809 | |||||
| Solocal Group(a) | 81,271 | 89,920 | ||||||
| 250,928 | ||||||||
| Germany (0.33%) | ||||||||
| PNE Wind AG | 34,202 | 102,389 | ||||||
| Great Britain (3.30%) | ||||||||
| Ensco PLC, Class A | 16,337 | 88,056 | ||||||
| Foxtons Group PLC | 87,878 | 92,497 | ||||||
| Gem Diamonds, Ltd.(a) | 69,808 | 74,172 | ||||||
| GetBusy PLC(a) | 21,377 | 11,783 | ||||||
| Inland Homes PLC | 143,249 | 114,154 | ||||||
| LSL Property Services PLC | 32,125 | 99,627 | ||||||
| Norcros PLC | 46,494 | 109,299 | ||||||
| Numis Corp. PLC | 29,605 | 120,811 | ||||||
| Trinity Mirror PLC | 82,300 | 92,364 | ||||||
| Utilitywise PLC | 114,926 | 109,900 | ||||||
| Wincanton PLC | 31,221 | 103,666 | ||||||
| 1,016,329 | ||||||||
| Greece (0.30%) | ||||||||
| Aegean Marine Petroleum Network, Inc. | 20,291 | 91,310 | ||||||
| Hong Kong (1.14%) | ||||||||
| APT Satellite Holdings, Ltd. | 209,500 | 99,360 | ||||||
| Playmates Holdings, Ltd. | 780,000 | 103,981 | ||||||
| Playmates Toys, Ltd. | 524,000 | 82,616 | ||||||
| REXLot Holdings, Ltd.(a) | 8,075,000 | 64,214 | ||||||
| 350,171 | ||||||||
| India (1.63%) | ||||||||
| Ashapura Minechem, Ltd.(a) | 112,446 | 102,314 | ||||||
| Eros International Media, Ltd.(a) | 26,830 | 86,660 | ||||||
| The Karnataka Bank, Ltd. | 42,831 | 107,589 | ||||||
| Oriental Bank of Commerce(a) | 44,845 | 97,602 | ||||||
| PTC India, Ltd. | 57,112 | 108,631 | ||||||
| 502,796 | ||||||||
| Indonesia (0.78%) | ||||||||
| Elnusa Tbk PT | 4,968,700 | 112,981 | ||||||
| Energi Mega Persada Tbk PT(a) | 2,316,863 | 16,912 | ||||||
| Kawasan Industri Jababeka Tbk PT | 4,905,529 | 109,956 | ||||||
| 239,849 | ||||||||
| Ireland (0.33%) | ||||||||
| Independent News & Media PLC(a) | 794,791 | 101,097 | ||||||
| Isle Of Man (0.42%) | ||||||||
| Manx Telecom PLC | 49,936 | 128,003 | ||||||
| Israel (0.86%) | ||||||||
| Magic Software Enterprises, Ltd. | 15,378 | 136,095 | ||||||
| magicJack VocalTec, Ltd.(a) | 13,386 | 84,332 | ||||||
52 | October 31, 2017
ALPS | Metis Global Micro Cap Value Fund
| Statement of Investments | October 31, 2017 |
| Shares | Value (Note 2) | |||||||
| Israel (continued) | ||||||||
| Perion Network, Ltd.(a) | 45,207 | $ | 46,111 | |||||
| 266,538 | ||||||||
| Italy (0.35%) | ||||||||
| Banca Carige Spa(a) | 440,867 | 107,354 | ||||||
| Japan (32.35%) | ||||||||
| Aizawa Securities Co., Ltd. | 15,800 | 113,587 | ||||||
| Amiyaki Tei Co., Ltd. | 2,400 | 112,418 | ||||||
| Arealink Co., Ltd. | 7,400 | 154,982 | ||||||
| Asanuma Corp. | 34,000 | 126,182 | ||||||
| Asmo Corp. | 13,900 | 85,549 | ||||||
| Computer Institute of Japan, Ltd. | 16,600 | 107,263 | ||||||
| CROOZ, Inc. | 4,000 | 90,322 | ||||||
| Dai Nippon Toryo Co., Ltd. | 7,400 | 113,274 | ||||||
| Daiichi Jitsugyo Co., Ltd. | 3,800 | 111,682 | ||||||
| Dainichiseika Color & Chemicals Manufacturing Co., Ltd. | 2,400 | 109,903 | ||||||
| The Daisan Bank, Ltd. | 7,200 | 121,280 | ||||||
| Ebara Jitsugyo Co., Ltd. | 9,900 | 152,531 | ||||||
| Eidai Co., Ltd. | 22,000 | 108,360 | ||||||
| ESPEC Corp. | 6,400 | 145,702 | ||||||
| Fuji Kiko Co., Ltd. | 15,800 | 103,170 | ||||||
| Fujibo Holdings, Inc. | 3,400 | 107,342 | ||||||
| Fujisash Co., Ltd. | 99,300 | 94,369 | ||||||
| Fujitec Co., Ltd. | 7,500 | 111,645 | ||||||
| Fujitsu Frontech, Ltd. | 6,100 | 106,852 | ||||||
| Future Corp. | 12,400 | 125,256 | ||||||
| G-7 Holdings, Inc. | 5,200 | 110,840 | ||||||
| GCA Corp. | 10,300 | 94,280 | ||||||
| Gun-Ei Chemical Industry Co., Ltd. | 3,300 | 114,686 | ||||||
| Hochiki Corp. | 5,900 | 122,059 | ||||||
| Honda Tsushin Kogyo Co., Ltd. | 6,400 | 129,550 | ||||||
| Ichiyoshi Securities Co., Ltd. | 10,300 | 118,222 | ||||||
| Ines Corp. | 10,200 | 95,513 | ||||||
| I-O Data Device, Inc. | 9,800 | 98,345 | ||||||
| Itoki Corp. | 12,500 | 96,011 | ||||||
| Iwaicosmo Holdings, Inc. | 8,200 | 105,311 | ||||||
| Iwasaki Electric Co., Ltd. | 5,000 | 81,184 | ||||||
| Janome Sewing Machine Co., Ltd. | 11,600 | 80,151 | ||||||
| JCU Corp. | 2,400 | 103,847 | ||||||
| Kato Works Co., Ltd. | 3,300 | 103,110 | ||||||
| Kawai Musical Instruments Manufacturing | ||||||||
| Co., Ltd. | 5,700 | 120,347 | ||||||
| Koatsu Gas Kogyo Co., Ltd. | 12,700 | 95,989 | ||||||
| Kyowa Leather Cloth Co., Ltd. | 11,900 | 101,950 | ||||||
| Mamezou Holdings Co., Ltd. | 11,400 | 131,148 | ||||||
| Mars Engineering Corp. | 4,100 | 83,517 | ||||||
| Meiwa Estate Co., Ltd. | 14,300 | 116,104 | ||||||
| The Michinoku Bank, Ltd. | 4,800 | 81,244 | ||||||
| The Mie Bank, Ltd. | 4,600 | 110,089 | ||||||
| MIMAKI ENGINEERING Co., Ltd. | 12,700 | 105,527 | ||||||
| Mory Industries, Inc. | 3,800 | 117,917 | ||||||
| MTI, Ltd. | 16,800 | 101,040 | ||||||
| Nichireki Co., Ltd. | 8,500 | 107,455 | ||||||
| Nichirin Co., Ltd. | 4,700 | 171,510 | ||||||
| Shares | Value (Note 2) | |||||||
| Japan (continued) | ||||||||
| Nihon Dengi Co., Ltd. | 3,900 | $ | 104,450 | |||||
| Nihon House Holdings Co., Ltd. | 17,200 | 94,560 | ||||||
| Nihon Nohyaku Co., Ltd. | 17,600 | 101,914 | ||||||
| Nippon Hume Corp. | 16,000 | 110,673 | ||||||
| Nippon Seisen Co., Ltd. | 2,800 | 135,449 | ||||||
| Nissei Plastic Industrial Co., Ltd. | 11,200 | 149,374 | ||||||
| Nittetsu Mining Co., Ltd. | 2,300 | 170,562 | ||||||
| Noritsu Koki Co., Ltd. | 9,000 | 139,334 | ||||||
| Ohashi Technica, Inc. | 7,600 | 112,678 | ||||||
| Osaka Soda Co., Ltd. | 3,600 | 94,513 | ||||||
| Oyo Corp. | 5,800 | 88,539 | ||||||
| Rheon Automatic Machinery Co., Ltd. | 9,500 | 143,583 | ||||||
| Rion Co., Ltd. | 6,000 | 117,680 | ||||||
| Roland DG Corp. | 3,500 | 96,837 | ||||||
| Ryoden Corp. | 9,500 | 147,415 | ||||||
| Sakai Heavy Industries, Ltd. | 2,800 | 91,087 | ||||||
| San-Ai Oil Co., Ltd. | 9,800 | 117,046 | ||||||
| Sansha Electric Manufacturing Co., Ltd. | 19,700 | 217,393 | ||||||
| Sanyo Trading Co., Ltd. | 4,400 | 114,002 | ||||||
| Seika Corp. | 5,000 | 132,587 | ||||||
| Shinko Plantech Co., Ltd. | 10,300 | 88,933 | ||||||
| Studio Alice Co., Ltd. | 4,500 | 104,109 | ||||||
| Sun Frontier Fudousan Co., Ltd. | 9,000 | 108,357 | ||||||
| Tabuchi Electric Co., Ltd.(a) | 27,600 | 73,433 | ||||||
| Tatsuta Electric Wire and Cable Co., Ltd. | 17,100 | 125,425 | ||||||
| Tayca Corp. | 5,500 | 129,464 | ||||||
| Teikoku Electric Manufacturing Co., Ltd. | 9,100 | 96,438 | ||||||
| Tochigi Bank, Ltd. | 19,600 | 89,333 | ||||||
| Togami Electric Manufacturing Co., Ltd. | 5,400 | 110,541 | ||||||
| Tokyo Keiki, Inc. | 7,400 | 99,621 | ||||||
| Toli Corp. | 26,100 | 94,883 | ||||||
| Tosho Printing Co., Ltd. | 13,000 | 125,167 | ||||||
| Toyo Kanetsu KK | 3,700 | 140,158 | ||||||
| Toyo Kohan Co., Ltd. | 20,700 | 88,508 | ||||||
| Toyo Machinery & Metal Co., Ltd. | 14,100 | 108,459 | ||||||
| Uchida Yoko Co., Ltd. | 4,000 | 126,892 | ||||||
| Weathernews, Inc. | 3,400 | 109,898 | ||||||
| West Holdings Corp. | 10,200 | 66,992 | ||||||
| Yachiyo Industry Co., Ltd. | 12,800 | 171,549 | ||||||
| YAMABIKO Corp. | 7,400 | 100,696 | ||||||
| Yuasa Trading Co., Ltd. | 3,700 | 136,412 | ||||||
| 9,973,559 | ||||||||
| Malaysia (1.60%) | ||||||||
| Chin Well Holdings Bhd | 313,000 | 127,157 | ||||||
| KSL Holdings Bhd(a) | 391,800 | 116,557 | ||||||
| Land & General Bhd | 3,003,780 | 156,095 | ||||||
| Media Prima Bhd | 465,500 | 91,819 | ||||||
| 491,628 | ||||||||
| Norway (0.38%) | ||||||||
| BW Offshore, Ltd.(a) | 35,326 | 116,066 | ||||||
| Pakistan (0.28%) | ||||||||
| The Bank of Punjab(a) | 1,129,000 | 86,496 | ||||||
53 | October 31, 2017
ALPS | Metis Global Micro Cap Value Fund
| Statement of Investments | October 31, 2017 |
| Shares | Value (Note 2) | |||||||
| Poland (0.96%) | ||||||||
| Amica SA | 1,708 | $ | 66,175 | |||||
| Getin Holding SA(a) | 273,326 | 120,896 | ||||||
| Getin Noble Bank SA(a) | 248,513 | 109,921 | ||||||
| 296,992 | ||||||||
| Portugal (0.50%) | ||||||||
| Pharol SGPS SA(a) | 311,947 | 154,750 | ||||||
| Qatar (0.31%) | ||||||||
| Qatar Islamic Insurance Co. QSC | 6,926 | 95,105 | ||||||
| Singapore (1.12%) | ||||||||
| CW Group Holdings, Ltd. | 554,000 | 100,128 | ||||||
| SHS Holdings, Ltd. | 749,500 | 120,967 | ||||||
| UMS Holdings, Ltd. | 159,500 | 123,445 | ||||||
| 344,540 | ||||||||
| South Africa (0.36%) | ||||||||
| PPC, Ltd.(a) | 210,651 | 109,804 | ||||||
| South Korea (9.57%) | ||||||||
| Bluecom Co., Ltd. | 13,906 | 92,821 | ||||||
| Byucksan Corp. | 29,661 | 90,250 | ||||||
| Crownhaitai Holdings Co., Ltd. | 4,889 | 77,997 | ||||||
| Daeyang Electric Co., Ltd.(a) | 6,943 | 76,225 | ||||||
| Dongwha Enterprise Co., Ltd. | 3,075 | 97,570 | ||||||
| Dongyang E&P, Inc. | 9,616 | 103,855 | ||||||
| EcoBio Holdings Co., Ltd.(a) | 10,433 | 85,691 | ||||||
| Hansol Holdings Co., Ltd.(a) | 18,316 | 101,252 | ||||||
| Harim Holdings Co., Ltd. | 28,641 | 97,060 | ||||||
| Hy-Lok Corp. | 4,440 | 97,980 | ||||||
| Hyundai Engineering Plastics Co., Ltd. | 14,084 | 91,161 | ||||||
| Imarketkorea, Inc. | 7,444 | 63,689 | ||||||
| Interpark Holdings Corp. | 16,229 | 60,645 | ||||||
| Kangnam Jevisco Co., Ltd. | 2,649 | 86,302 | ||||||
| KISCO Corp. | 2,543 | 85,986 | ||||||
| KONA I Co., Ltd.(a) | 8,374 | 79,350 | ||||||
| Kortek Corp. | 6,535 | 84,654 | ||||||
| Kukbo Design Co., Ltd. | 5,993 | 109,392 | ||||||
| Kukdo Chemical Co., Ltd. | 1,793 | 94,341 | ||||||
| Kwang Myung Electric Co., Ltd.(a) | 39,321 | 92,935 | ||||||
| Maeil Holdings Co., Ltd. | 4,610 | 79,210 | ||||||
| NEOWIZ HOLDINGS Corp.(a) | 5,659 | 66,698 | ||||||
| SAMHWA Paints Industrial Co., Ltd. | 10,281 | 70,845 | ||||||
| Sammok S-Form Co., Ltd. | 7,880 | 91,798 | ||||||
| SBS Contents Hub Co., Ltd. | 11,460 | 85,839 | ||||||
| SeAH Special Steel Co., Ltd. | 5,570 | 106,104 | ||||||
| Sejoong Co., Ltd. | 31,833 | 97,316 | ||||||
| SH Energy & Chemical Co., Ltd. | 62,298 | 83,173 | ||||||
| SundayToz Corp.(a) | 6,039 | 114,828 | ||||||
| Texcell-NetCom Co., Ltd.(a) | 12,458 | 111,368 | ||||||
| Woongjin Thinkbig Co., Ltd.(a) | 15,685 | 96,903 | ||||||
| YeaRimDang Publishing Co., Ltd.(a) | 10,349 | 91,808 | ||||||
| Yoosung Enterprise Co., Ltd. | 26,710 | 88,568 | ||||||
| 2,953,614 | ||||||||
| Shares | Value (Note 2) | |||||||
| Spain (0.33%) | ||||||||
| Promotora de Informaciones SA, Class A(a) | 28,834 | $ | 102,077 | |||||
| Sweden (0.60%) | ||||||||
| Bergman & Beving AB | 7,835 | 89,144 | ||||||
| Tethys Oil AB | 13,086 | 96,524 | ||||||
| 185,668 | ||||||||
| Taiwan (5.23%) | ||||||||
| Ability Enterprise Co., Ltd. | 154,000 | 107,211 | ||||||
| Apacer Technology, Inc. | 70,880 | 92,747 | ||||||
| Asia Vital Components Co., Ltd. | 122,000 | 115,785 | ||||||
| Bothhand Enterprise, Inc. | 51,000 | 115,698 | ||||||
| China General Plastics Corp. | 124,506 | 116,718 | ||||||
| Chlitina Holding, Ltd. | 25,000 | 90,389 | ||||||
| Cyberlink Corp. | 51,000 | 112,807 | ||||||
| Formosan Rubber Group, Inc. | 139,320 | 68,622 | ||||||
| Hong Pu Real Estate Development Co., Ltd. | 131,000 | 87,957 | ||||||
| Innodisk Corp. | 31,455 | 116,389 | ||||||
| KEE TAI Properties Co., Ltd. | 261,000 | 90,914 | ||||||
| LEE CHI Enterprises Co., Ltd. | 252,000 | 102,397 | ||||||
| Lion Travel Service Co., Ltd. | 30,000 | 92,480 | ||||||
| Sagittarius Life Science Corp. | 32,000 | 73,509 | ||||||
| We&Win Diversification Co., Ltd. | 371,000 | 127,877 | ||||||
| Yungshin Construction & Development Co., Ltd. | 94,000 | 99,522 | ||||||
| 1,611,022 | ||||||||
| Thailand (1.30%) | ||||||||
| Hwa Fong Rubber Thailand PCL | 819,884 | 133,274 | ||||||
| Raimon Land PCL | 2,885,500 | 98,152 | ||||||
| Somboon Advance Technology PCL | 272,600 | 168,282 | ||||||
| 399,708 | ||||||||
| Turkey (0.91%) | ||||||||
| Albaraka Turk Katilim Bankasi AS | 250,683 | 86,042 | ||||||
| EGE Seramik Sanayi ve Ticaret AS | 69,111 | 83,741 | ||||||
| Sekerbank TAS(a) | 273,898 | 110,735 | ||||||
| 280,518 | ||||||||
| United States (19.09%) | ||||||||
| American Public Education, Inc.(a) | 4,179 | 83,580 | ||||||
| ARC Document Solutions, Inc.(a) | 21,883 | 96,723 | ||||||
| AutoWeb, Inc.(a) | 7,349 | 50,855 | ||||||
| Avid Technology, Inc.(a) | 19,811 | 87,961 | ||||||
| Aware, Inc.(a) | 17,932 | 83,384 | ||||||
| Baldwin & Lyons, Inc., Class B | 3,221 | 73,922 | ||||||
| Bravo Brio Restaurant Group, Inc.(a) | 24,990 | 49,980 | ||||||
| Bridgepoint Education, Inc.(a) | 7,735 | 74,875 | ||||||
| C&F Financial Corp. | 1,924 | 111,592 | ||||||
| Computer Programs & Systems, Inc. | 4,064 | 122,530 | ||||||
| Computer Task Group, Inc.(a) | 23,147 | 116,661 | ||||||
| Core Molding Technologies, Inc. | 4,610 | 106,998 | ||||||
| Covenant Transportation Group, Inc., Class A(a) | 6,165 | 183,100 | ||||||
| Crawford & Co., Class B | 9,902 | 116,646 | ||||||
| CSS Industries, Inc. | 3,150 | 94,437 | ||||||
54 | October 31, 2017
ALPS | Metis Global Micro Cap Value Fund
| Statement of Investments | October 31, 2017 |
| Shares | Value (Note 2) | |||||||
| United States (continued) | ||||||||
| DHI Group, Inc.(a) | 39,433 | $ | 86,753 | |||||
| DXP Enterprises, Inc.(a) | 2,680 | 85,948 | ||||||
| Federated National Holding Co. | 5,426 | 83,235 | ||||||
| First BanCorp.(a) | 13,515 | 69,602 | ||||||
| Franklin Covey Co.(a) | 4,928 | 95,603 | ||||||
| Gold Resource Corp. | 24,058 | 87,331 | ||||||
| Hallador Energy Co. | 10,907 | 56,498 | ||||||
| HCI Group, Inc. | 1,692 | 63,382 | ||||||
| Hornbeck Offshore Services, Inc.(a) | 40,503 | 151,076 | ||||||
| Hovnanian Enterprises, Inc., Class A(a) | 33,167 | 80,264 | ||||||
| Hurco Cos, Inc. | 2,628 | 117,603 | ||||||
| Huttig Building Products, Inc.(a) | 15,550 | 104,496 | ||||||
| Hyster-Yale Materials Handling, Inc. | 1,355 | 106,354 | ||||||
| Iconix Brand Group, Inc.(a) | 15,367 | 25,202 | ||||||
| IDT Corp., Class B | 5,294 | 69,775 | ||||||
| JAKKS Pacific, Inc.(a) | 28,243 | 77,668 | ||||||
| LB Foster Co., Class A(a) | 5,387 | 134,136 | ||||||
| Liberty Tax, Inc. | 8,192 | 106,906 | ||||||
| Manning & Napier, Inc. | 26,125 | 95,356 | ||||||
| Matrix Service Co.(a) | 11,236 | 158,428 | ||||||
| Midstates Petroleum Co., Inc.(a) | 7,822 | 119,286 | ||||||
| Natural Grocers by Vitamin Cottage, Inc.(a) | 12,759 | 62,647 | ||||||
| Natural Health Trends Corp. | 3,965 | 76,366 | ||||||
| OFG Bancorp | 7,808 | 69,491 | ||||||
| Orrstown Financial Services, Inc. | 4,581 | 116,816 | ||||||
| PAM Transportation Services, Inc.(a) | 5,546 | 162,331 | ||||||
| Park-Ohio Holdings Corp. | 2,423 | 114,244 | ||||||
| PDL BioPharma, Inc.(a) | 48,650 | 144,004 | ||||||
| PennyMac Financial Services, Inc., Class A(a) | 5,988 | 113,772 | ||||||
| PHI, Inc.(a) | 10,663 | 124,650 | ||||||
| Powell Industries, Inc. | 3,128 | 90,649 | ||||||
| Resources Connection, Inc. | 7,684 | 121,023 | ||||||
| REX American Resources Corp.(a) | 902 | 79,538 | ||||||
| Roadrunner Transportation Systems, Inc.(a) | 15,640 | 137,632 | ||||||
| Saga Communications, Inc., Class A | 2,253 | 98,569 | ||||||
| Sequential Brands Group, Inc.(a) | 26,304 | 68,390 | ||||||
| Shore Bancshares, Inc. | 6,333 | 104,241 | ||||||
| Strattec Security Corp. | 2,711 | 125,113 | ||||||
| TravelCenters of America LLC(a) | 27,142 | 132,996 | ||||||
| Travelzoo, Inc.(a) | 9,500 | 63,650 | ||||||
| Ultra Petroleum Corp.(a) | 9,676 | 76,827 | ||||||
| United Insurance Holdings Corp. | 4,926 | 77,535 | ||||||
| Urban One, Inc.(a) | 37,055 | 64,846 | ||||||
| VSE Corp. | 2,192 | 107,627 | ||||||
| Weight Watchers International, Inc.(a) | 2,773 | 124,563 | ||||||
| 5,885,666 | ||||||||
| TOTAL COMMON STOCKS | ||||||||
| (Cost $27,097,892) | 29,447,779 | |||||||
| PREFERRED STOCKS (1.05%) | ||||||||
| Brazil (1.05%) | ||||||||
| Banco ABC Brasil SA | 20,083 | 109,522 | ||||||
| Banco do Estado do Rio Grande do Sul SA, Class B | 18,400 | 84,989 | ||||||
| Shares | Value (Note 2) | |||||||||||
| Brazil (continued) | ||||||||||||
| Centrais Eletricas Santa Catarina(a) | 21,000 | $ | 128,390 | |||||||||
| 322,901 | ||||||||||||
| TOTAL PREFERRED STOCKS | ||||||||||||
| (Cost $190,433) | 322,901 | |||||||||||
| 7-Day Yield | Shares | Value (Note 2) | ||||||||||
| SHORT TERM INVESTMENTS (3.38%) | ||||||||||||
| Money Market Fund (3.38%) | ||||||||||||
| State Street Institutional Treasury Plus Money Market Fund | 0.930 | % | 1,042,046 | 1,042,046 | ||||||||
| TOTAL SHORT TERM INVESTMENTS | ||||||||||||
| (Cost $1,042,046) | 1,042,046 | |||||||||||
| TOTAL INVESTMENTS (99.97%) | ||||||||||||
| (Cost $28,330,371) | $ | 30,812,726 | ||||||||||
| Other Assets In Excess Of Liabilities (0.03%) | 7,786 | |||||||||||
| NET ASSETS -100.00% | $ | 30,820,512 | ||||||||||
| (a) | Non-Income Producing Security. |
| (b) | Security exempt from registration under rule 144A of the securities act of 1933. This Security may be resold in transactions exempt from registration, normally to qualified institutional buyers. As of October 31, 2017, the market value of those securities was $126,323 representing 0.41% of the Fund’s net assets. |
| (c) | Less than 0.005%. |
For Fund compliance purposes, the Fund’s industry classifications refer to any one or more of the industry sub-classifications used by one or more widely recognized market indexes or ratings group indexes, and/or as defined by Fund management. This definition may not apply for purposes of this report, which may combine industry sub-classifications for reporting ease. Industries are shown as a percent of net assets.
See Notes to Financial Statements.
55 | October 31, 2017
ALPS | Metis Global Micro Cap Value Fund
| Statement of Assets and Liabilities | October 31, 2017 |
| ASSETS | ||||
| Investments, at value | $ | 30,812,726 | ||
| Foreign currency, at value (Cost $27,141) | 27,273 | |||
| Receivable for shares sold | 1,000 | |||
| Dividends receivable | 63,847 | |||
| Receivable due from advisor | 1,214 | |||
| Prepaid expenses and other assets | 3,495 | |||
| Total Assets | 30,909,555 | |||
| LIABILITIES | ||||
| Payable for foreign capital gains tax | 11,461 | |||
| Administration and transfer agency fees payable | 30,581 | |||
| Distribution and services fees payable | 2,258 | |||
| Trustees’ fees and expenses payable | 170 | |||
| Professional fees payable | 16,890 | |||
| Accrued expenses and other liabilities | 27,683 | |||
| Total Liabilities | 89,043 | |||
| NET ASSETS | $ | 30,820,512 | ||
| NET ASSETS CONSIST OF | ||||
| Paid-in capital | $ | 26,155,366 | ||
| Accumulated net investment income | 10,139 | |||
| Accumulated net realized gain | 2,184,424 | |||
| Net unrealized appreciation | 2,470,583 | |||
| NET ASSETS | $ | 30,820,512 | ||
| INVESTMENTS, AT COST | $ | 28,330,371 | ||
| PRICING OF SHARES | ||||
| Class A: | ||||
| Net Asset Value, offering and redemption price per share | $ | 12.69 | ||
| Net Assets | $ | 4,354,927 | ||
| Shares of beneficial interest outstanding (unlimited number of shares, no par value common stock authorized) | 343,106 | |||
| Maximum offering price per share ((NAV/0.9450), based on maximum sales charge of 5.50% of the offering price) | $ | 13.43 | ||
| Class C: | ||||
| Net Asset Value, offering and redemption price per share(a) | $ | 12.57 | ||
| Net Assets | $ | 599,666 | ||
| Shares of beneficial interest outstanding (unlimited number of shares, no par value common stock authorized) | 47,723 | |||
| Class I: | ||||
| Net Asset Value, offering and redemption price per share | $ | 12.70 | ||
| Net Assets | $ | 25,865,919 | ||
| Shares of beneficial interest outstanding (unlimited number of shares, no par value common stock authorized) | 2,036,376 | |||
(a) | Redemption price per share may be reduced for any applicable contingent deferred sales charge. For a description of a possible sales charge, please see the Fund’s Prospectus. |
See Notes to Financial Statements.
56 | October 31, 2017
ALPS | Metis Global Micro Cap Value Fund
| Statement of Operations | For the Year Ended October 31, 2017(a) |
| INVESTMENT INCOME | ||||
| Dividends | $ | 639,280 | ||
| Foreign taxes withheld on dividends | (58,252 | ) | ||
| Total Investment Income | 581,028 | |||
| EXPENSES | ||||
| Investment advisory fees | 332,753 | |||
| Administrative fees | 83,117 | |||
| Transfer agency fees | 7,277 | |||
| Distribution and service fees | ||||
| Class A | 12,700 | |||
| Class C | 3,966 | |||
| Professional fees | 25,845 | |||
| Reports to shareholders and printing fees | 4,240 | |||
| State registration fees | 43,515 | |||
| Insurance fees | 140 | |||
| Custody fees | 106,850 | |||
| Trustees’ fees and expenses | 538 | |||
| Offering costs | 11,610 | |||
| Miscellaneous expenses | 38,665 | |||
| Total Expenses | 671,216 | |||
| Less fees waived/reimbursed by investment advisor (Note 8) | ||||
| Class A | (24,598 | ) | ||
| Class C | (3,010 | ) | ||
| Class I | (174,029 | ) | ||
| Net Expenses | 469,579 | |||
| Net Investment Income | 111,449 | |||
| Net realized gain on investments | 2,291,017 | |||
| Net realized loss on foreign currency transactions | (3,422 | ) | ||
| Net realized loss on foreign capital gains tax | (18,321 | ) | ||
| Net Realized Gain | 2,269,274 | |||
| Net change in unrealized appreciation on investments | 1,451,928 | |||
| Net change in unrealized appreciation on translation of assets and liabilities denominated in foreign currencies | 1,121 | |||
| Net change in unrealized foreign capital gains tax | (9,043 | ) | ||
| Net Change in Unrealized Appreciation | 1,444,006 | |||
| NET REALIZED AND UNREALIZED GAIN ON INVESTMENTS | 3,713,280 | |||
| NET INCREASE IN NET ASSETS RESULTING FROM OPERATIONS | $ | 3,824,729 | ||
| (a) | Prior to February 28, 2017 the fund was known as ALPS | Metis Global Micro Cap Fund. |
See Notes to Financial Statements.
57 | October 31, 2017
ALPS | Metis Global Micro Cap Value Fund
Statement of Changes in Net Assets
| For the Year Ended October 31, 2017(a) | For the Period December 24, 2015 (Commencement) to October 31, 2016 | |||||||
| OPERATIONS | ||||||||
| Net investment income | $ | 111,449 | $ | 107,559 | ||||
| Net realized gain | 2,269,274 | 790,920 | ||||||
| Net change in unrealized appreciation | 1,444,006 | 1,026,577 | ||||||
| Net Increase in Net Assets Resulting from Operations | 3,824,729 | 1,925,056 | ||||||
| DISTRIBUTIONS | ||||||||
| Dividends to shareholders from net investment income | ||||||||
| Class A | (29,173 | ) | – | |||||
| Class C | (3,353 | ) | – | |||||
| Class I | (328,746 | ) | – | |||||
| Dividends to shareholders from net realized gains | ||||||||
| Class A | (77,685 | ) | – | |||||
| Class C | (14,930 | ) | – | |||||
| Class I | (694,622 | ) | – | |||||
| Net Decrease in Net Assets from Distributions | (1,148,509 | ) | – | |||||
| BENEFICIAL INTEREST TRANSACTIONS (NOTE 6) | ||||||||
| Shares sold | ||||||||
| Class A | 3,489,628 | 821,225 | ||||||
| Class C | 330,960 | 250,590 | ||||||
| Class I | 8,309,659 | 13,303,600 | ||||||
| Dividends reinvested | ||||||||
| Class A | 99,556 | – | ||||||
| Class C | 12,443 | – | ||||||
| Class I | 1,005,246 | – | ||||||
| Shares redeemed, net of redemption fees | ||||||||
| Class A | (370,093 | ) | (10,255 | ) | ||||
| Class C | (38,267 | ) | – | |||||
| Class I | (957,624 | ) | (27,432 | ) | ||||
| Net Increase in Net Assets Derived from Beneficial Interest Transactions | 11,881,508 | 14,337,728 | ||||||
| Net increase in net assets | 14,557,728 | 16,262,784 | ||||||
| NET ASSETS | ||||||||
| Beginning of year | 16,262,784 | – | ||||||
| End of year * | $ | 30,820,512 | $ | 16,262,784 | ||||
| *Including accumulated net investment income of: | $ | 10,139 | $ | 164,129 | ||||
| (a) | Prior to February 28, 2017 the fund was known as ALPS | Metis Global Micro Cap Fund. |
See Notes to Financial Statements.
58 | October 31, 2017
ALPS | Metis Global Micro Cap Value Fund – Class A
Financial Highlights
Selected data for a share of beneficial interest outstanding throughout the periods indicated:
| For the Year Ended October 31, 2017(a) | For the Period December 24, 2015 (Commencement) to October 31, 2016 | |||||||
| Net asset value, beginning of period | $ | 11.48 | $ | 10.00 | ||||
| INCOME FROM INVESTMENT OPERATIONS: | ||||||||
| Net investment income(b) | 0.03 | 0.11 | ||||||
| Net realized and unrealized gain | 1.84 | 1.36 | ||||||
| Total from investment operations | 1.87 | 1.47 | ||||||
| DISTRIBUTIONS: | ||||||||
| From net investment income | (0.15 | ) | – | |||||
| From net realized gains | (0.51 | ) | – | |||||
| Total distributions | (0.66 | ) | – | |||||
| REDEMPTION FEES ADDED TO PAID-IN CAPITAL (NOTE 6) | 0.00 | (c) | 0.01 | |||||
| Net increase in net asset value | 1.21 | 1.48 | ||||||
| Net asset value, end of year | $ | 12.69 | $ | 11.48 | ||||
| TOTAL RETURN(d) | 16.93 | % | 14.80 | % | ||||
| RATIOS/SUPPLEMENTAL DATA: | ||||||||
| Net assets, end of year (000s) | $ | 4,355 | $ | 820 | ||||
| Ratio of expenses to average net assets excluding fee waivers and reimbursements | 2.82 | % | 4.47 | %(e) | ||||
| Ratio of expenses to average net assets including fee waivers and reimbursements | 2.08 | % | 2.10 | %(e) | ||||
| Ratio of net investment income to average net assets | 0.22 | % | 1.12 | %(e) | ||||
| Portfolio turnover rate(f) | 61 | % | 77 | % | ||||
| (a) | Prior to February 28, 2017 the fund was known as ALPS | Metis Global Micro Cap Fund. |
| (b) | Calculated using the average shares method. |
| (c) | Less than $0.005 or ($0.005) per share. |
| (d) | Total returns are for the period indicated and have not been annualized. Total returns would have been lower had certain expenses not been waived during the period. Returns shown do not reflect the deduction of taxes that a shareholder would pay on Fund distributions or the redemption of Fund shares. Returns shown exclude any applicable sales charges. |
| (e) | Annualized. |
| (f) | Portfolio turnover rate for periods less than one full year have not been annualized. |
See Notes to Financial Statements.
59 | October 31, 2017
ALPS | Metis Global Micro Cap Value Fund – Class C
Financial Highlights
Selected data for a share of beneficial interest outstanding throughout the periods indicated:
| For the Year Ended October 31, 2017(a) | For the Period December 24, 2015 (Commencement) to October 31, 2016 | |||||||
| Net asset value, beginning of period | $ | 11.40 | $ | 10.00 | ||||
| INCOME FROM INVESTMENT OPERATIONS: | ||||||||
| Net investment income/(loss)(b) | (0.07 | )(c) | 0.02 | |||||
| Net realized and unrealized gain | 1.86 | 1.38 | ||||||
| Total from investment operations | 1.79 | 1.40 | ||||||
| DISTRIBUTIONS: | ||||||||
| From net investment income | (0.11 | ) | – | |||||
| From net realized gains | (0.51 | ) | – | |||||
| Total distributions | (0.62 | ) | – | |||||
| Net increase in net asset value | 1.17 | 1.40 | ||||||
| Net asset value, end of year | $ | 12.57 | $ | 11.40 | ||||
| TOTAL RETURN(d) | 16.32 | % | 14.00 | % | ||||
| RATIOS/SUPPLEMENTAL DATA: | ||||||||
| Net assets, end of year (000s) | $ | 600 | $ | 255 | ||||
| Ratio of expenses to average net assets excluding fee waivers and reimbursements | 3.46 | % | 4.91 | %(e) | ||||
| Ratio of expenses to average net assets including fee waivers and reimbursements | 2.70 | % | 2.70 | %(e) | ||||
| Ratio of net investment income/(loss) to average net assets | (0.59 | %) | 0.18 | %(e) | ||||
| Portfolio turnover rate(f) | 61 | % | 77 | % | ||||
| (a) | Prior to February 28, 2017 the fund was known as ALPS | Metis Global Micro Cap Fund. |
| (b) | Calculated using the average shares method. |
| (c) | The per share amount does not correspond to activity reflected in the Statement of Operations due to class specific expenses during the period. |
| (d) | Total returns are for the period indicated and have not been annualized. Total returns would have been lower had certain expenses not been waived during the period. Returns shown do not reflect the deduction of taxes that a shareholder would pay on Fund distributions or the redemption of Fund shares. Returns shown exclude any applicable sales charges. |
| (e) | Annualized. |
| (f) | Portfolio turnover rate for periods less than one full year have not been annualized. |
See Notes to Financial Statements.
60 | October 31, 2017
ALPS | Metis Global Micro Cap Value Fund – Class I
Financial Highlights
Selected data for a share of beneficial interest outstanding throughout the periods indicated:
| For the Year Ended October 31, 2017(a) | For the Period December 24, 2015 (Commencement) to October 31, 2016 | |||||||
| Net asset value, beginning of period | $ | 11.50 | $ | 10.00 | ||||
| INCOME FROM INVESTMENT OPERATIONS: | ||||||||
| Net investment income(b) | 0.06 | 0.09 | ||||||
| Net realized and unrealized gain | 1.86 | 1.41 | ||||||
| Total from investment operations | 1.92 | 1.50 | ||||||
| DISTRIBUTIONS: | ||||||||
| From net investment income | (0.21 | ) | – | |||||
| From net realized gains | (0.51 | ) | – | |||||
| Total distributions | (0.72 | ) | – | |||||
| REDEMPTION FEES ADDED TO PAID-IN CAPITAL (NOTE 6) | 0.00 | (c) | – | |||||
| Net increase in net asset value | 1.20 | 1.50 | ||||||
| Net asset value, end of year | $ | 12.70 | $ | 11.50 | ||||
| TOTAL RETURN(d) | 17.38 | % | 15.00 | % | ||||
| RATIOS/SUPPLEMENTAL DATA: | ||||||||
| Net assets, end of year (000s) | $ | 25,866 | $ | 15,187 | ||||
| Ratio of expenses to average net assets excluding fee waivers and reimbursements | 2.46 | % | 3.40 | %(e) | ||||
| Ratio of expenses to average net assets including fee waivers and reimbursements | 1.70 | % | 1.70 | %(e) | ||||
| Ratio of net investment income to average net assets | 0.46 | % | 1.04 | %(e) | ||||
| Portfolio turnover rate(f) | 61 | % | 77 | % | ||||
| (a) | Prior to February 28, 2017 the fund was known as ALPS | Metis Global Micro Cap Fund. |
| (b) | Calculated using the average shares method. |
| (c) | Less than $0.005 or ($0.005) per share. |
| (d) | Total returns are for the period indicated and have not been annualized. Total returns would have been lower had certain expenses not been waived during the period. Returns shown do not reflect the deduction of taxes that a shareholder would pay on Fund distributions or the redemption of Fund shares. |
| (e) | Annualized. |
| (f) | Portfolio turnover rate for periods less than one full year have not been annualized. |
See Notes to Financial Statements.
61 | October 31, 2017
ALPS | Red Rocks Listed Private Equity Fund
| Management Commentary | October 31, 2017 (Unaudited) |
Portfolio Review
For the twelve months ending October 31, 2017 the ALPS | Red Rocks Listed Private Equity Fund A shares (LPEFX) returned 29.97% compared with 23.50% and 31.99% for the MSCI World Index (the fund’s primary benchmark) and the Global Listed Private Equity Index, respectively.
As of fiscal year end, the fund’s longer term returns continue to outperform its primary benchmark, with five year annualized returns of 14.97% compared to 12.23% for the MSCI World Index. Both the fund’s A-shares and I-shares were awarded a 4-star overall rating (a measure of risk adjusted returns relative to peers) in the Morningstar World Small-Mid Category.
During the past year, we made substantive changes to reflect new investment opportunities and ended the fiscal year with 45 companies in the portfolio.
Net contributors to performance for the fiscal year included:
| ● | IAC/Interactive Corp | |
| ● | 3I Group PLC | |
| ● | Schouw & CO |
Net detractors to performance for the fiscal year included:
| ● | Mutares AG | |
| ● | Macquarie Infrastructure Corporation | |
| ● | Brait SE |
Currency Impacts
The fund, being global in nature, holds assets denominated in currencies other than the US dollar. Changes in the relative value of the US dollar vs. other global currencies can both enhance and detract from investment performance of the fund.
For the past fiscal year, the currency impact to the fund contributed 4 percentage points to the fund’s performance.
In contrast, over the past five years through the most recent fiscal year end, the total currency impact on the fund has been a significant detractor to performance of approximately -3.0 percentage points per year or a total of approximately -15 percentage points over the period.
2017 Review and Outlook
Overall, global growth has been positive, with continued low inflation. The global low interest rate environment continues, with only moderate increases anticipated in the coming 12-18 months. Manufacturing and consumer confidence measures continue to improve, providing some indication that the global economy is healthy and improving.
Global M&A activity appears to have normalized to lower levels of longer term averages. Debt as a percent of private equity deals is around 50%, which is in line with 5-year averages and significantly
less leveraged than 2007 peaks. PE valuations continue to increase moderately and are now at post-crisis highs.
Enterprise Value to EBITDA (a measure of the purchase price for M&A activity) for large deals (larger than $500 million) ended the year at about 10X, which is up from the longer term trend of 8X-9X. However, the valuations for smaller deals ($100 million to $500 million) and the focus of the companies in the fund, continue to be in the long-term normal range of 8X-9X.
With the focus on M&A valuations, investors can lose sight of the significant value-creation efforts of the PE business model – the buying, building/enhancing, and selling private companies. In our conversations with portfolio companies, many are reporting the acceleration of organic EBITDA growth that they were forecasting earlier this year. This growth is the value-add of the PE manager, and a fundamental valuation metric of listed private equity (LPE) companies, and a key driver in their stock prices.
The valuations of LPE companies continue to look reasonable, as Datastream reports that the average discount (net asset value per share divided by share price) for listed private equity companies at the end of fiscal year was about 12%, which is up slightly from the prior year.
There are several key catalysts that have contributed to the continued strong performance of the fund:
| 1. | Exits for PE owners continue to be strong with high prices and historically high demand from trade buyers - mainly global corporations that have interest enhancing their product or geographic offerings via buying a private company. |
| 2. | After years of tepid results, we are seeing much stronger growth in both GDP and corporate earnings in Europe for the first time since the financial crises. |
| 3. | The rise of the US dollar appears to have subsided, which has helped the valuations of non-US dollar denominated assets. |
| 4. | There were two sizeable LPE company takeovers during the past year, which has heightened the awareness of the public discounts to private values for LPE companies and provided catalysts for large buyers to reevaluate the embedded value of the private companies owned by LPE firms. |
We believe that these trends should continue into 2018 and that there are opportunities for significant growth in our portfolio companies.
62 | October 31, 2017
ALPS | Red Rocks Listed Private Equity Fund
| Management Commentary | October 31, 2017 (Unaudited) |
In closing, we believe it is important for investors to allocate to PE as part of a long-term strategic asset allocation. PE managers make investment commitments over multiple years, in varying macroeconomic conditions, and employ a wide array of investment strategies. Investors should consider the following when considering an allocation to PE:
| 1. | Use multiple PE strategies including buyouts, venture, distressed, private debt, and infrastructure, as each PE strategy provides unique economic exposure and risk/return profiles; |
| 2. | Invest over time in different economic cycles and valuations periods; and |
| 3. | Invest with PE managers that have a proven and consistent track record of creating value though different stages of economic cycles. |
We believe that this approach is one that can provide superior risk-adjusted returns – and this approach is what we offer to investors in the fund.
We continue to enjoy the immense opportunities we have to research and invest with what we believe are some of the best private equity managers in the world and appreciate your continued interest and trust as investors in the fund.
| Andrew Drummond | Kirk McCown, CFA | Wyck Brown, CFA |
| Co-Portfolio Manager | Co-Portfolio Manager | Co-Portfolio Manager |
63 | October 31, 2017
ALPS | Red Rocks Listed Private Equity Fund
| Performance Update | October 31, 2017 (Unaudited) |
Performance of $10,000 Initial Investment (as of October 31, 2017)
Comparison of change in value of a $10,000 investment (includes maximum sales charges of 5.50%)
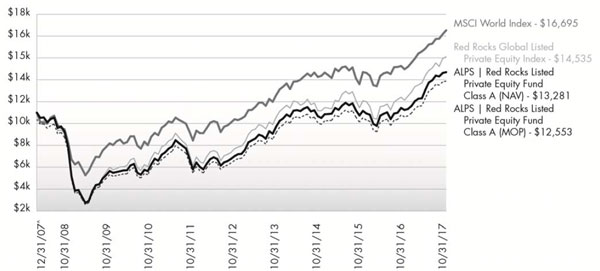
The chart above represents historical performance of a hypothetical investment of $10,000 in the Fund since inception. Past performance does not guarantee future results. This chart does not reflect the deduction of taxes that a shareholder would pay on Fund distributions or the redemption of Fund shares.
Average Annual Total Returns (as of October 31, 2017)
| 6 Month | 1 Year | 3 Year | 5 Year | Since Inception^ | Total Expense Ratio | What You Pay* | |
| Class A (NAV) | 12.12% | 29.97% | 11.56% | 14.97% | 2.93% | 2.21% | 2.21% |
| Class A (MOP) | 5.92% | 22.75% | 9.50% | 13.68% | 2.34% | ||
| Class C (NAV) | 11.66% | 28.79% | 10.75% | 14.21% | 2.14% | 2.87% | 2.87% |
| Class C (CDSC) | 10.66% | 27.79% | 10.75% | 14.21% | 2.14% | ||
| Class I | 12.21% | 30.09% | 11.88% | 15.35% | 3.22% | 1.89% | 1.89% |
| Class R | 12.06% | 29.51% | 11.34% | 14.95% | 2.69% | 2.34% | 2.34% |
| MSCI World Index1 | 9.80% | 23.46% | 8.75% | 12.19% | 5.35% | ||
| Red Rocks Global Listed Private Equity Index2 | 11.69% | 31.99% | 12.71% | 15.11% | 3.88% |
Performance data quoted represents past performance. Past performance does not guarantee future results. Investment return and principal value of an investment will fluctuate so that an investor’s shares, when sold or redeemed, may be worth more or less than the original cost. Current performance data may be higher or lower than actual data quoted. For the most current month-end performance data, please call 1-866-759-5679.
Maximum Offering Price (MOP) for Class A shares includes the Fund’s maximum sales charge of 5.50%. Performance shown at NAV does not include these sales charges and would have been lower had it been taken into account. If you invest $1 million or more, either as a lump sum or through the Fund’s accumulation or letter of intent programs, you can purchase Class A shares without an initial sales charge (load). A Contingent Deferred Sales Charge (“CDSC”) of 1.00% may apply to Class C shares redeemed within the first 12 months after a purchase, and on Class A shares redeemed within the first 18 months after a purchase in excess of $1 million. The Fund imposes a 2.00% redemption fee on shares held for less than 90 days.
Performance less than 1 year is cumulative.
64 | October 31, 2017
ALPS | Red Rocks Listed Private Equity Fund
| Performance Update | October 31, 2017 (Unaudited) |
Performance shown for Class C shares prior to June 30, 2010 reflects the historical performance of the Fund’s Class A shares, calculated using the fees and expenses of Class C shares.
| 1 | MSCI World Index: Morgan Stanley Capital International’s market capitalization weighted index is composed of companies representative of the market structure of 22 developed market countries in North America, Europe and the Asia/Pacific Region. The index is not actively managed and does not reflect any deduction for fees, expenses or taxes. An investor may not invest directly in an index. |
| 2 | The Red Rocks Global Listed Private Equity Index includes securities, ADRs and GDRs of 40 to 75 private equity companies, including business development companies, master limited partnerships and other vehicles whose principal business is to invest in, lend capital to or provide services to privately held companies. The Red Rocks Global Listed Private Equity Index is managed by the Fund’s Sub-Advisor. An investor may not invest directly in an index. |
| ^ | Fund inception date of December 31, 2007 for Classes A, I, and R; Fund inception date June 30, 2010 for Class C. |
| * | What You Pay reflects the Advisor’s and Sub-Advisor’s decision to contractually limit expenses through February 28, 2018 and Acquired Fund Fees and Expenses of 0.71%. Please see the current prospectus for additional information. |
The table does not reflect the deduction of taxes that a shareholder would pay on Fund distributions or the redemption of Fund shares.
This Fund is not suitable for all investors and is subject to investment risks, including possible loss of the principal amount invested.
Listed Private Equity Companies are subject to various risks depending on their underlying investments, which could include, but are not limited to, additional liquidity risk, industry risk, non-U.S. security risk, currency risk, credit risk, managed portfolio risk and derivatives risk (derivatives risk is the risk that the value of the Listed Private Equity Companies’ derivative investments will fall because of pricing difficulties or lack of correlation with the underlying investment).
There are inherent risks in investing in private equity companies, which encompass financial institutions or vehicles whose principal business is to invest in and lend capital to privately held companies. Generally, little public information exists for private and thinly traded companies, and there is a risk that investors may not be able to make a fully informed investment decision.
Listed Private Equity Companies may have relatively concentrated investment portfolios, consisting of a relatively small number of holdings. A consequence of this limited number of investments is that the aggregate returns realized may be adversely impacted by the poor performance of a small number of investments, or even a single investment, particularly if a company experiences the need to write down the value of an investment.
Certain of the Fund’s investments may be exposed to liquidity risk due to low trading volume, lack of a market maker or legal restrictions limiting the ability of the Fund to sell particular securities at an advantageous price and/or time. As a result, these securities may be more difficult to value. Foreign investing involves special risks, such as currency fluctuations and political uncertainty. The Fund invests in derivatives and is subject to the risk that the value of those derivative investments will fall because of pricing difficulties or lack of correlation with the underlying investment.
There is no guarantee that the Fund will continue to hold any one particular security or stay invested in any one particular company. The composition of the Fund’s top holdings is subject to change. Performance figures are historical and reflect the change in share price, reinvested distributions, changes in net asset value, sales charges and capital gains distributions, if any.
Not FDIC Insured – No Bank Guarantee – May Lose Value
65 | October 31, 2017
ALPS | Red Rocks Listed Private Equity Fund
| Performance Update | October 31, 2017 (Unaudited) |
Top Ten Holdings (as a % of Net Assets) †
| HarbourVest Global Private Equity, Ltd. | 4.85% |
| Aurelius Equity Opportunities SE & Co. KGaA | 4.83% |
| IAC/InterActiveCorp | 4.65% |
| 3i Group PLC | 4.36% |
| Brookfield Asset Management, Inc. | 4.18% |
| The Blackstone Group LP | 4.00% |
| Schouw & Co. AB | 3.79% |
| Onex Corp. | 3.71% |
| Ares Capital Corp. | 3.58% |
| Ackermans & van Haaren N.V. | 3.28% |
| Top Ten Holdings | 41.23% |
| † | Holdings are subject to change and my not reflect the current or future position of the portfolio. Table presents indicative values only. |
Industry Sector Allocation (as a % of Net Assets)
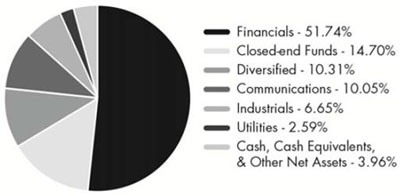
66 | October 31, 2017
ALPS | Red Rocks Listed Private Equity Fund
| Statement of Investments | October 31, 2017 |
| Shares | Value (Note 2) | |||||||
| CLOSED-END FUNDS (14.70%) | ||||||||
| Apax Global Alpha, Ltd. | 1,010,000 | $ | 1,965,198 | |||||
| HarbourVest Global Private Equity, Ltd.(a) | 613,000 | 10,543,327 | ||||||
| HBM Healthcare Investments AG, Class A | 39,800 | 5,018,634 | ||||||
| HgCapital Trust PLC | 281,639 | 6,516,109 | ||||||
| NB Private Equity Partners, Ltd. | 188,000 | 2,509,408 | ||||||
| The Pantheon International PLC Fund(a) | 64,000 | 1,615,032 | ||||||
| 28,167,708 | ||||||||
| Riverstone Energy, Ltd.(a) | 225,875 | 3,776,950 | ||||||
| TOTAL CLOSED-END FUNDS | ||||||||
| (Cost $26,462,976) | 31,944,658 | |||||||
| COMMON STOCKS (81.34%) | ||||||||
| Communications (10.05%) | ||||||||
| Internet (7.17%) | ||||||||
| IAC/InterActiveCorp(a) | 78,330 | 10,108,487 | ||||||
| Liberty Ventures, Series A(a) | 96,000 | 5,468,160 | ||||||
| 15,576,647 | ||||||||
| Media (2.88%) | ||||||||
| Liberty Media Corp.-Liberty Formula One, Class A(a) | 70,000 | 2,548,000 | ||||||
| Liberty Media Corp.-Liberty SiriusXM, Class A(a) | 61,500 | 2,565,165 | ||||||
| Naspers, Ltd., Class N | 4,700 | 1,145,186 | ||||||
| 6,258,351 | ||||||||
| TOTAL COMMUNICATIONS | 21,834,998 | |||||||
| Diversified (10.31%) | ||||||||
| Holding Companies-Diversified Operations (10.31%) | ||||||||
| Ackermans & van Haaren N.V. | 41,600 | 7,125,715 | ||||||
| Schouw & Co. AB | 79,100 | 8,227,910 | ||||||
| Wendel SA | 41,900 | 7,067,286 | ||||||
| 22,420,911 | ||||||||
| TOTAL DIVERSIFIED | 22,420,911 | |||||||
| Financials (51.74%) | ||||||||
| Diversified Financial Services (20.82%) | ||||||||
| The Blackstone Group LP | 261,000 | 8,688,690 | ||||||
| Brait SE(a) | 380,000 | 1,421,766 | ||||||
| The Carlyle Group LP | 201,400 | 4,440,870 | ||||||
| Compass Diversified Holdings | 156,500 | 2,683,975 | ||||||
| FNFV Group(a) | 259,000 | 4,467,750 | ||||||
| Intermediate Capital Group PLC | 511,500 | 6,610,068 | ||||||
| KKR & Co. LP | 283,500 | 5,684,175 | ||||||
| Pargesa Holding SA | 52,500 | 4,396,707 | ||||||
| Shares | Value (Note 2) | |||||||
| Diversified Financial Services (continued) | ||||||||
| Partners Group Holding AG | 9,000 | $ | 6,053,225 | |||||
| Transaction Capital, Ltd. | 749,960 | 795,113 | ||||||
| 45,242,339 | ||||||||
| Insurance (1.24%) | ||||||||
| Alleghany Corp.(a) | 4,775 | 2,703,701 | ||||||
| Investment Companies (18.57%) | ||||||||
| 3i Group PLC | 743,000 | 9,483,303 | ||||||
| Ares Capital Corp. | 484,400 | 7,789,152 | ||||||
| Aurelius Equity Opportunities SE & Co. KGaA | 171,400 | 10,487,894 | ||||||
| Eurazeo SA | 62,898 | 5,847,419 | ||||||
| Investor AB, B Shares | 123,100 | 6,100,851 | ||||||
| mutares AG | 43,000 | 650,901 | ||||||
| 40,359,520 | ||||||||
| Private Equity (6.93%) | ||||||||
| Altamir | 46,000 | 829,467 | ||||||
| Brederode SA | 15,300 | 876,318 | ||||||
| Onex Corp. | 106,000 | 8,056,197 | ||||||
| Princess Private Equity Holding, Ltd. | 70,000 | 843,526 | ||||||
| Standard Life Private Equity | 965,000 | 4,460,196 | ||||||
| 15,065,704 | ||||||||
| Real Estate (4.18%) | ||||||||
| Brookfield Asset Management, Inc., Class A | 216,600 | 9,084,204 | ||||||
| TOTAL FINANCIALS | 112,455,468 | |||||||
| Industrials (6.65%) | ||||||||
| Commercial Services (2.90%) | ||||||||
| Brookfield Business Partners LP | 27,800 | 813,464 | ||||||
| Fortress Transportation & Infrastructure Investors LLC | 93,000 | 1,695,390 | ||||||
| Macquarie Infrastructure Corp. | 54,600 | 3,797,430 | ||||||
| 6,306,284 | ||||||||
| Miscellaneous Manufacturers (3.75%) | ||||||||
| Danaher Corp. | 38,400 | 3,543,168 | ||||||
| Gesco AG | 19,700 | 699,785 | ||||||
| Indus Holding AG | 55,672 | 3,899,403 | ||||||
| 8,142,356 | ||||||||
| TOTAL INDUSTRIALS | 14,448,640 | |||||||
67 | October 31, 2017
ALPS | Red Rocks Listed Private Equity Fund
| Statement of Investments | October 31, 2017 |
| Shares | Value (Note 2) | |||||||
| Utilities (2.59%) | ||||||||
| Electric (2.59%) | ||||||||
| Brookfield Infrastructure Partners LP | 132,800 | $ | 5,626,736 | |||||
| TOTAL UTILITIES | 5,626,736 | |||||||
| TOTAL COMMON STOCKS | ||||||||
| (Cost $136,281,107) | 176,786,753 | |||||||
| 7-Day Yield | Shares | Value (Note 2) | ||||||||||
| SHORT TERM INVESTMENTS (3.70%) | ||||||||||||
| Money Market Fund (3.70%) | ||||||||||||
| State Street Institutional Treasury Plus Money Market Fund | 0.930 | % | 8,033,398 | 8,033,398 | ||||||||
| TOTAL SHORT TERM INVESTMENTS | ||||||||||||
| (Cost $8,033,398) | 8,033,398 | |||||||||||
| TOTAL INVESTMENTS (99.74%) | ||||||||||||
| (Cost $170,777,481) | $ | 216,764,809 | ||||||||||
| Other Assets In Excess Of Liabilities (0.26%) | 562,824 | |||||||||||
| NET ASSETS (100.00%) | $ | 217,327,633 | ||||||||||
| (a) | Non-Income Producing Security. |
For Fund compliance purposes, the Fund’s industry classifications refer to any one or more of the industry sub-classifications used by one or more widely recognized market indexes or ratings group indexes, and/or as defined by Fund management. This definition may not apply for purposes of this report, which may combine industry sub-classifications for reporting ease. Industries are shown as a percent of net assets.
See Notes to Financial Statements.
68 | October 31, 2017
ALPS | Red Rocks Listed Private Equity Fund
| Statement of Assets and Liabilities | October 31, 2017 |
| ASSETS | ||||
| Investments, at value | $ | 216,764,809 | ||
| Foreign currency, at value (Cost $5,075) | 5,075 | |||
| Receivable for investments sold | 485 | |||
| Receivable for shares sold | 194,072 | |||
| Dividends receivable | 963,683 | |||
| Prepaid expenses and other assets | 14,613 | |||
| Total Assets | 217,942,737 | |||
| LIABILITIES | ||||
| Payable for investments purchased | 90,973 | |||
| Payable for shares redeemed | 199,509 | |||
| Investment advisory fees payable | 155,469 | |||
| Administration and transfer agency fees payable | 60,965 | |||
| Distribution and services fees payable | 50,577 | |||
| Trustees’ fees and expenses payable | 740 | |||
| Professional fees payable | 31,758 | |||
| Custody fees payable | 6,768 | |||
| Accrued expenses and other liabilities | 18,345 | |||
| Total Liabilities | 615,104 | |||
| NET ASSETS | $ | 217,327,633 | ||
| NET ASSETS CONSIST OF | ||||
| Paid-in capital | $ | 157,715,143 | ||
| Accumulated net investment income | 5,420,898 | |||
| Accumulated net realized gain | 8,206,050 | |||
| Net unrealized appreciation | 45,985,542 | |||
| NET ASSETS | $ | 217,327,633 | ||
| INVESTMENTS, AT COST | $ | 170,777,481 | ||
| PRICING OF SHARES | ||||
| Class A: | ||||
| Net Asset Value, offering and redemption price per share | $ | 8.05 | ||
| Net Assets | $ | 55,538,457 | ||
| Shares of beneficial interest outstanding (unlimited number of shares, no par value common stock authorized) | 6,899,861 | |||
| Maximum offering price per share ((NAV/0.9450), based on maximum sales charge of 5.50% of the offering price) | $ | 8.52 | ||
| Class C: | ||||
| Net Asset Value, offering and redemption price per share(a) | $ | 7.66 | ||
| Net Assets | $ | 18,981,082 | ||
| Shares of beneficial interest outstanding (unlimited number of shares, no par value common stock authorized) | 2,478,355 | |||
| Class I: | ||||
| Net Asset Value, offering and redemption price per share | $ | 8.18 | ||
| Net Assets | $ | 138,571,788 | ||
| Shares of beneficial interest outstanding (unlimited number of shares, no par value common stock authorized) | 16,936,544 | |||
| Class R: | ||||
| Net Asset Value, offering and redemption price per share | $ | 6.97 | ||
| Net Assets | $ | 4,236,306 | ||
| Shares of beneficial interest outstanding (unlimited number of shares, no par value common stock authorized) | 607,816 |
| (a) | Redemption price per share may be reduced for any applicable contingent deferred sales charge. For a description of a possible sales charge, please see the Fund’s Prospectus. |
See Notes to Financial Statements.
69 | October 31, 2017
ALPS | Red Rocks Listed Private Equity Fund
| Statement of Operations | For the Year Ended October 31, 2017 |
| INVESTMENT INCOME | ||||
| Dividends | $ | 7,040,329 | ||
| Foreign taxes withheld on dividends | (302,248 | ) | ||
| Total Investment Income | 6,738,081 | |||
| EXPENSES | ||||
| Investment advisory fees | 1,909,124 | |||
| Administrative fees | 182,579 | |||
| Transfer agency fees | 234,272 | |||
| Distribution and service fees | ||||
| Class A | 188,261 | |||
| Class C | 160,312 | |||
| Class R | 17,033 | |||
| Professional fees | 37,996 | |||
| Reports to shareholders and printing fees | 42,159 | |||
| State registration fees | 59,682 | |||
| Insurance fees | 2,866 | |||
| Custody fees | 48,240 | |||
| Trustees’ fees and expenses | 5,498 | |||
| Miscellaneous expenses | 13,959 | |||
| Total Expenses | 2,901,981 | |||
| Net Expenses | 2,901,981 | |||
| Net Investment Income | 3,836,100 | |||
| Net realized gain on investments | 30,824,660 | |||
| Net realized loss on foreign currency transactions | (53,643 | ) | ||
| Net Realized Gain | 30,771,017 | |||
| Net change in unrealized appreciation on investments | 23,453,506 | |||
| Net change in unrealized appreciation on translation of assets and liabilities denominated in foreign currencies | 74,432 | |||
| Net Change in Unrealized Appreciation | 23,527,938 | |||
| NET REALIZED AND UNREALIZED GAIN ON INVESTMENTS | 54,298,955 | |||
| NET INCREASE IN NET ASSETS RESULTING FROM OPERATIONS | $ | 58,135,055 | ||
See Notes to Financial Statements.
70 | October 31, 2017
ALPS | Red Rocks Listed Private Equity Fund
Statements of Changes in Net Assets
| For the Year Ended October 31, 2017 | For the Year Ended October 31, 2016 | |||||||
| OPERATIONS | ||||||||
| Net investment income | $ | 3,836,100 | $ | 5,079,394 | ||||
| Net realized gain | 30,771,017 | 5,138,826 | ||||||
| Net change in unrealized appreciation/(depreciation) | 23,527,938 | (18,147,567 | ) | |||||
| Net Increase/(Decrease) in Net Assets Resulting from Operations | 58,135,055 | (7,929,347 | ) | |||||
| DISTRIBUTIONS | ||||||||
| Dividends to shareholders from net investment income | ||||||||
| Class A | (809,606 | ) | (6,248,174 | ) | ||||
| Class C | (225,242 | ) | (630,713 | ) | ||||
| Class I | (2,414,838 | ) | (10,024,183 | ) | ||||
| Class R | (50,266 | ) | (128,992 | ) | ||||
| Dividends to shareholders from net realized gains | ||||||||
| Class A | – | (7,618,574 | ) | |||||
| Class C | – | (793,436 | ) | |||||
| Class I | – | (12,028,227 | ) | |||||
| Class R | – | (157,523 | ) | |||||
| Net Decrease in Net Assets from Distributions | (3,499,952 | ) | (37,629,822 | ) | ||||
| BENEFICIAL INTEREST TRANSACTIONS (NOTE 6) | ||||||||
| Shares sold | ||||||||
| Class A | 21,768,592 | 31,102,997 | ||||||
| Class C | 4,263,157 | 2,197,631 | ||||||
| Class I | 50,050,247 | 84,505,922 | ||||||
| Class R | 1,313,352 | 1,259,547 | ||||||
| Dividends reinvested | ||||||||
| Class A | 650,227 | 12,476,384 | ||||||
| Class C | 145,779 | 933,873 | ||||||
| Class I | 2,078,633 | 14,054,048 | ||||||
| Class R | 49,633 | 251,373 | ||||||
| Shares redeemed, net of redemption fees | ||||||||
| Class A | (109,952,100 | ) | (90,898,383 | ) | ||||
| Class C | (3,954,133 | ) | (5,935,877 | ) | ||||
| Class I | (130,375,992 | ) | (179,180,972 | ) | ||||
| Class R | (792,847 | ) | (1,428,484 | ) | ||||
| Net Decrease in Net Assets Derived from Beneficial Interest Transactions | (164,755,452 | ) | (130,661,941 | ) | ||||
| Net decrease in net assets | (110,120,349 | ) | (176,221,110 | ) | ||||
| NET ASSETS | ||||||||
| Beginning of year | 327,447,982 | 503,669,092 | ||||||
| End of year * | $ | 217,327,633 | $ | 327,447,982 | ||||
| *Including accumulated net investment income/(loss) of: | $ | 5,420,898 | $ | (7,312,477 | ) | |||
See Notes to Financial Statements.
71 | October 31, 2017
ALPS | Red Rocks Listed Private Equity Fund – Class A
Financial Highlights
Selected data for a share of beneficial interest outstanding throughout the periods indicated:
| For the Year Ended October 31, 2017 | For the Year Ended October 31, 2016 | For the Year Ended October 31, 2015 | For the Fiscal Period Ended October 31, 2014(a) | For the Year Ended April 30, 2014 | For the Year Ended April 30, 2013 | |||||||||||||||||||
| Net asset value, beginning of period | $ | 6.29 | $ | 6.76 | $ | 6.61 | $ | 7.00 | $ | 6.05 | $ | 4.67 | ||||||||||||
| INCOME/(LOSS) FROM INVESTMENT OPERATIONS: | ||||||||||||||||||||||||
| Net investment income(b) | 0.12 | 0.06 | 0.05 | 0.02 | 0.03 | 0.08 | ||||||||||||||||||
| Net realized and unrealized gain/(loss) | 1.74 | (0.04 | ) | 0.34 | (0.41 | ) | 1.37 | 1.39 | ||||||||||||||||
| Total from investment operations | 1.86 | 0.02 | 0.39 | (0.39 | ) | 1.40 | 1.47 | |||||||||||||||||
| DISTRIBUTIONS: | ||||||||||||||||||||||||
| From net investment income | (0.10 | ) | (0.22 | ) | (0.22 | ) | – | (0.45 | ) | (0.09 | ) | |||||||||||||
| From net realized gains | – | (0.27 | ) | (0.02 | ) | – | – | – | ||||||||||||||||
| Total distributions | (0.10 | ) | (0.49 | ) | (0.24 | ) | – | (0.45 | ) | (0.09 | ) | |||||||||||||
| REDEMPTION FEES ADDED TO PAID-IN CAPITAL (NOTE 6) | 0.00 | (c) | 0.00 | (c) | 0.00 | (c) | 0.00 | (c) | 0.00 | (c) | 0.00 | (c) | ||||||||||||
| Net increase/(decrease) in net asset value | 1.76 | (0.47 | ) | 0.15 | (0.39 | ) | 0.95 | 1.38 | ||||||||||||||||
| Net asset value, end of year | $ | 8.05 | $ | 6.29 | $ | 6.76 | $ | 6.61 | $ | 7.00 | $ | 6.05 | ||||||||||||
| TOTAL RETURN(d) | 29.97 | % | 0.76 | % | 6.01 | % | (5.57 | )% | 23.54 | % | 31.75 | % | ||||||||||||
| RATIOS/SUPPLEMENTAL DATA: | ||||||||||||||||||||||||
| Net assets, end of year (000s) | $ | 55,538 | $ | 128,920 | $ | 193,561 | $ | 203,996 | $ | 205,727 | $ | 105,488 | ||||||||||||
| Ratio of expenses to average net assets excluding fee waivers and reimbursements(e) | 1.38 | % | 1.47 | % | 1.47 | % | 1.59 | %(f) | 1.64 | % | 1.53 | % | ||||||||||||
| Ratio of expenses to average net assets including fee waivers and reimbursements(e) | 1.38 | % | 1.47 | % | 1.47 | % | 1.59 | %(f) | 1.64 | % | 1.51 | % | ||||||||||||
| Ratio of net investment income to average net assets(e) | 1.63 | % | 1.07 | % | 0.72 | % | 0.71 | %(f) | 0.46 | % | 1.54 | % | ||||||||||||
| Portfolio turnover rate(g) | 31 | % | 30 | % | 37 | % | 11 | % | 40 | % | 32 | % | ||||||||||||
| (a) | Effective May 1, 2014, the Board approved changing the fiscal year-end of the Funds from April 30 to October 31. |
| (b) | Calculated using the average shares method. |
| (c) | Less than $0.005 or ($0.005) per share. |
| (d) | Total returns are for the period indicated and have not been annualized. Total returns would have been lower had certain expenses not been waived during the period. Returns shown do not reflect the deduction of taxes that a shareholder would pay on Fund distributions or the redemption of Fund shares. Returns shown exclude any applicable sales charges. |
| (e) | The ratios exclude the impact of expenses of the underlying funds in which the Fund invests as represented in the Statement of Investments. |
| (f) | Annualized. |
| (g) | Portfolio turnover rate for periods less than one full year have not been annualized. |
See Notes to Financial Statements.
72 | October 31, 2017
ALPS | Red Rocks Listed Private Equity Fund – Class C
Financial Highlights
Selected data for a share of beneficial interest outstanding throughout the periods indicated:
| For the Year Ended October 31, 2017 | For the Year Ended October 31, 2016 | For the Year Ended October 31, 2015 | For the Fiscal Period Ended October 31, 2014(a) | For the Year Ended April 30, 2014 | For the Year Ended April 30, 2013 | |||||||||||||||||||
| Net asset value, beginning of period | $ | 6.04 | $ | 6.53 | $ | 6.43 | $ | 6.83 | $ | 5.92 | $ | 4.59 | ||||||||||||
| INCOME/(LOSS) FROM INVESTMENT OPERATIONS: | ||||||||||||||||||||||||
| Net investment income/(loss)(b) | 0.06 | 0.03 | 0.00 | (c) | (0.00 | )(c) | (0.00 | )(c) | 0.04 | |||||||||||||||
| Net realized and unrealized gain/(loss) | 1.65 | (0.03 | ) | 0.32 | (0.40 | ) | 1.33 | 1.35 | ||||||||||||||||
| Total from investment operations | 1.71 | – | 0.32 | (0.40 | ) | 1.33 | 1.39 | |||||||||||||||||
| DISTRIBUTIONS: | ||||||||||||||||||||||||
| From net investment income | (0.09 | ) | (0.22 | ) | (0.20 | ) | – | (0.42 | ) | (0.06 | ) | |||||||||||||
| From net realized gains | – | (0.27 | ) | (0.02 | ) | – | – | – | ||||||||||||||||
| Total distributions | (0.09 | ) | (0.49 | ) | (0.22 | ) | – | (0.42 | ) | (0.06 | ) | |||||||||||||
| REDEMPTION FEES ADDED TO PAID-IN CAPITAL (NOTE 6) | 0.00 | (c) | 0.00 | (c) | 0.00 | (c) | 0.00 | (c) | 0.00 | (c) | 0.00 | (c) | ||||||||||||
| Net increase/(decrease) in net asset value | 1.62 | (0.49 | ) | 0.10 | (0.40 | ) | 0.91 | 1.33 | ||||||||||||||||
| Net asset value, end of year | $ | 7.66 | $ | 6.04 | $ | 6.53 | $ | 6.43 | $ | 6.83 | $ | 5.92 | ||||||||||||
| TOTAL RETURN(d) | 28.79 | % | 0.34 | % | 5.14 | % | (5.86 | )% | 22.97 | % | 30.55 | % | ||||||||||||
| RATIOS/SUPPLEMENTAL DATA: | ||||||||||||||||||||||||
| Net assets, end of year (000s) | $ | 18,981 | $ | 14,784 | $ | 19,300 | $ | 17,193 | $ | 12,200 | $ | 4,417 | ||||||||||||
| Ratio of expenses to average net assets excluding fee waivers and reimbursements(e) | 2.13 | % | 2.16 | % | 2.12 | % | 2.15 | %(f) | 2.20 | % | 2.25 | % | ||||||||||||
| Ratio of expenses to average net assets including fee waivers and reimbursements(e) | 2.13 | % | 2.16 | % | 2.12 | % | 2.15 | %(f) | 2.20 | % | 2.25 | % | ||||||||||||
| Ratio of net investment income/(loss) to average net assets(e) | 0.83 | % | 0.49 | % | 0.06 | % | (0.13 | )%(f) | (0.04 | )% | 0.79 | % | ||||||||||||
| Portfolio turnover rate(g) | 31 | % | 30 | % | 37 | % | 11 | % | 40 | % | 32 | % | ||||||||||||
| (a) | Effective May 1, 2014, the Board approved changing the fiscal year-end of the Funds from April 30 to October 31. |
| (b) | Calculated using the average shares method. |
| (c) | Less than $0.005 or ($0.005) per share. |
| (d) | Total returns are for the period indicated and have not been annualized. Total returns would have been lower had certain expenses not been waived during the period. Returns shown do not reflect the deduction of taxes that a shareholder would pay on Fund distributions or the redemption of Fund shares. Returns shown exclude any applicable sales charges. |
| (e) | The ratios exclude the impact of expenses of the underlying funds in which the Fund invests as represented in the Statement of Investments. |
| (f) | Annualized. |
| (g) | Portfolio turnover rate for periods less than one full year have not been annualized. |
See Notes to Financial Statements.
73 | October 31, 2017
ALPS | Red Rocks Listed Private Equity Fund – Class I
Financial Highlights
Selected data for a share of beneficial interest outstanding throughout the periods indicated:
| For the Year Ended October 31, 2017 | For the Year Ended October 31, 2016 | For the Year Ended October 31, 2015 | For the Fiscal Period Ended October 31, 2014(a) | For the Year Ended April 30, 2014 | For the Year Ended April 30, 2013 | |||||||||||||||||||
| Net asset value, beginning of period | $ | 6.39 | $ | 6.83 | $ | 6.67 | $ | 7.05 | $ | 6.08 | $ | 4.69 | ||||||||||||
| INCOME/(LOSS) FROM INVESTMENT OPERATIONS: | ||||||||||||||||||||||||
| Net investment income(b) | 0.13 | 0.09 | 0.07 | 0.03 | 0.06 | 0.12 | ||||||||||||||||||
| Net realized and unrealized gain/(loss) | 1.76 | (0.03 | ) | 0.34 | (0.41 | ) | 1.37 | 1.36 | ||||||||||||||||
| Total from investment operations | 1.89 | 0.06 | 0.41 | (0.38 | ) | 1.43 | 1.48 | |||||||||||||||||
| DISTRIBUTIONS: | ||||||||||||||||||||||||
| From net investment income | (0.10 | ) | (0.23 | ) | (0.23 | ) | – | (0.46 | ) | (0.09 | ) | |||||||||||||
| From net realized gains | – | (0.27 | ) | (0.02 | ) | – | – | – | ||||||||||||||||
| Total distributions | (0.10 | ) | (0.50 | ) | (0.25 | ) | – | (0.46 | ) | (0.09 | ) | |||||||||||||
| REDEMPTION FEES ADDED TO PAID-IN CAPITAL (NOTE 6) | 0.00 | (c) | 0.00 | (c) | 0.00 | (c) | 0.00 | (c) | 0.00 | (c) | 0.00 | (c) | ||||||||||||
| Net increase/(decrease) in net asset value | 1.79 | (0.44 | ) | 0.16 | (0.38 | ) | 0.97 | 1.39 | ||||||||||||||||
| Net asset value, end of year | $ | 8.18 | $ | 6.39 | $ | 6.83 | $ | 6.67 | $ | 7.05 | $ | 6.08 | ||||||||||||
| TOTAL RETURN(d) | 30.09 | % | 1.27 | % | 6.30 | % | (5.39 | )% | 24.02 | % | 31.99 | % | ||||||||||||
| RATIOS/SUPPLEMENTAL DATA: | ||||||||||||||||||||||||
| Net assets, end of year (000s) | $ | 138,572 | $ | 180,892 | $ | 287,741 | $ | 249,375 | $ | 202,076 | $ | 137,856 | ||||||||||||
| Ratio of expenses to average net assets excluding fee waivers and reimbursements(e) | 1.16 | % | 1.18 | % | 1.16 | % | 1.25 | %(f) | 1.25 | % | 1.27 | % | ||||||||||||
| Ratio of expenses to average net assets including fee waivers and reimbursements(e) | 1.16 | % | 1.18 | % | 1.16 | % | 1.25 | %(f) | 1.25 | % | 1.25 | % | ||||||||||||
| Ratio of net investment income to average net assets(e) | 1.85 | % | 1.48 | % | 1.02 | % | 0.85 | %(f) | 0.91 | % | 2.27 | % | ||||||||||||
| Portfolio turnover rate(g) | 31 | % | 30 | % | 37 | % | 11 | % | 40 | % | 32 | % | ||||||||||||
| (a) | Effective May 1, 2014, the Board approved changing the fiscal year-end of the Funds from April 30 to October 31. |
| (b) | Calculated using the average shares method. |
| (c) | Less than $0.005 or ($0.005) per share. |
| (d) | Total returns are for the period indicated and have not been annualized. Total returns would have been lower had certain expenses not been waived during the period. Returns shown do not reflect the deduction of taxes that a shareholder would pay on Fund distributions or the redemption of Fund shares. |
| (e) | The ratios exclude the impact of expenses of the underlying funds in which the Fund invests as represented in the Statement of Investments. |
| (f) | Annualized. |
| (g) | Portfolio turnover rate for periods less than one full year have not been annualized. |
See Notes to Financial Statements.
74 | October 31, 2017
ALPS | Red Rocks Listed Private Equity Fund – Class R
Financial Highlights
Selected data for a share of beneficial interest outstanding throughout the periods indicated:
| For the Year Ended October 31, 2017 | For the Year Ended October 31, 2016 | For the Year Ended October 31, 2015 | For the Fiscal Period Ended October 31, 2014(a) | For the Year Ended April 30, 2014 | For the Year Ended April 30, 2013 | |||||||||||||||||||
| Net asset value, beginning of period | $ | 5.48 | $ | 5.96 | $ | 5.87 | $ | 6.21 | $ | 5.41 | $ | 4.17 | ||||||||||||
| INCOME/(LOSS) FROM INVESTMENT OPERATIONS: | ||||||||||||||||||||||||
| Net investment income(b) | 0.09 | 0.06 | 0.03 | 0.01 | 0.02 | 0.08 | ||||||||||||||||||
| Net realized and unrealized gain/(loss) | 1.50 | (0.05 | ) | 0.31 | (0.36 | ) | 1.22 | 1.24 | ||||||||||||||||
| Total from investment operations | 1.59 | 0.01 | 0.34 | (0.35 | ) | 1.24 | 1.32 | |||||||||||||||||
| DISTRIBUTIONS: | ||||||||||||||||||||||||
| From net investment income | (0.10 | ) | (0.22 | ) | (0.23 | ) | – | (0.44 | ) | (0.08 | ) | |||||||||||||
| From net realized gains | – | (0.27 | ) | (0.02 | ) | – | – | – | ||||||||||||||||
| Total distributions | (0.10 | ) | (0.49 | ) | (0.25 | ) | – | (0.44 | ) | (0.08 | ) | |||||||||||||
| REDEMPTION FEES ADDED TO PAID-IN CAPITAL (NOTE 6) | – | – | 0.00 | (c) | 0.01 | – | – | |||||||||||||||||
| Net increase/(decrease) in net asset value | 1.49 | (0.48 | ) | 0.09 | (0.34 | ) | 0.80 | 1.24 | ||||||||||||||||
| Net asset value, end of year | $ | 6.97 | $ | 5.48 | $ | 5.96 | $ | 5.87 | $ | 6.21 | $ | 5.41 | ||||||||||||
| TOTAL RETURN(d) | 29.51 | % | 0.67 | % | 5.87 | % | (5.48 | )% | 23.50 | % | 32.05 | % | ||||||||||||
| RATIOS/SUPPLEMENTAL DATA: | ||||||||||||||||||||||||
| Net assets, end of year (000s) | $ | 4,236 | $ | 2,852 | $ | 3,068 | $ | 872 | $ | 540 | $ | 191 | ||||||||||||
| Ratio of expenses to average net assets excluding fee waivers and reimbursements(e) | 1.56 | % | 1.63 | % | 1.60 | % | 1.63 | %(f) | 1.72 | % | 1.85 | % | ||||||||||||
| Ratio of expenses to average net assets including fee waivers and reimbursements(e) | 1.56 | % | 1.63 | % | 1.60 | % | 1.63 | %(f) | 1.72 | % | 1.75 | % | ||||||||||||
| Ratio of net investment income to average net assets(e) | 1.43 | % | 1.05 | % | 0.52 | % | 0.46 | %(f) | 0.36 | % | 1.80 | % | ||||||||||||
| Portfolio turnover rate(g) | 31 | % | 30 | % | 37 | % | 11 | % | 40 | % | 32 | % | ||||||||||||
| (a) | Effective May 1, 2014, the Board approved changing the fiscal year-end of the Funds from April 30 to October 31. |
| (b) | Calculated using the average shares method. |
| (c) | Less than $0.005 or ($0.005) per share. |
| (d) | Total returns are for the period indicated and have not been annualized. Total returns would have been lower had certain expenses not been waived during the period. Returns shown do not reflect the deduction of taxes that a shareholder would pay on Fund distributions or the redemption of Fund shares. |
| (e) | The ratios exclude the impact of expenses of the underlying funds in which the Fund invests as represented in the Statement of Investments. |
| (f) | Annualized. |
| (g) | Portfolio turnover rate for periods less than one full year have not been annualized. |
See Notes to Financial Statements.
75 | October 31, 2017
ALPS | WMC Research Value Fund
| Management Commentary | October 31, 2017 (Unaudited) |
Market Commentary
US equities rose 23.6% over the 12-month period ending 31 October 2017, as measured by the S&P 500 Index. The period began with stocks soaring following Trump’s victory in November 2016 on hopes of increased fiscal stimulus, reduced regulatory restrictions, and lower corporate taxes. The US Federal Reserve (Fed) took center stage in December after giving the US economy a vote of confidence by deciding to increase the policy rate for the first time since the previous December.
The “Trump rally” continued during the beginning of 2017 with confidence in the “big three”: tax reform, deregulation, and infrastructure spending. Despite many investors voicing concerns about stretched valuations and overly optimistic policy expectations, the market hit a series of record-highs during the quarter. The Fed hiked rates for the third time in a decade, but the market did not flinch. Risk-on sentiment ground to a halt in March after the Republicans’ failure to repeal and replace the Affordable Care Act cast a cloud over the Trump administration’s pro-growth agenda. The bullish camp’s spin on the defeat at the time was that the administration could then pivot to tax reform, which many investors viewed as the more important victory to maintain the rally.
The S&P 500 Index closed at a series of record-highs during the second quarter of 2017. In a well-telegraphed move, the Fed hiked policy rates by 25 basis points in June and laid out a plan for balance sheet normalization later this year, provided the economy evolves broadly as anticipated. Volatility ticked up near the end of the quarter as investors gravitated back to the reflation trade, triggering rotations out of momentum and growth plays and into cyclical and value pockets of the market.
Despite continued White House turmoil and heightened US tensions with Russia and North Korea, strong employment data and corporate earnings helped propel the S&P 500 to a series of new highs during the third quarter of 2017. The persistently low rate of inflation growth has been a concern for the Fed even though the economic landscape has remained largely positive. In a widely anticipated move, the Fed announced that its balance sheet normalization program would begin in October, reiterating that the process would be gradual and predictable.
Within the Russell 1000 Value Index, ten of the eleven sectors posted positive absolute returns during the period, with the financials and materials sectors gaining the most.
Fund Review
Though up strongly on an absolute basis (17.1%, gross of fees), the Fund underperformed its benchmark, the Russell 1000 Value Index, for the period.
Stock selection detracted from relative returns, as decisions in the energy, consumer staples, and financials sectors more than offset positive stock selection in the real estate, telecommunication services, and information technology sectors.
Top detractors from relative performance for the period included Newfield Exploration (energy), JPMorgan Chase (financials), and Coty (consumer staples). Newfield Exploration, an exploration and production company, was the top relative detractor during the period. The stock underperformed in Q1 and Q2 due to pressure on oil prices, though the stock has begun to recover since September. We have reduced our exposure to the name, but continue to hold Newfield Exploration as of the end of the period as the company is well-capitalized, financially disciplined, and in our opinion stands to benefit from an uplift in productivity. Our zero-exposure to JPMorgan Chase, a global financial services and retail banking provider, has hurt relative performance as banks generally performed well following the election of Donald Trump on hopes for decreased regulation and higher interest rates. We have preferred banking exposure through positions in Bank of America and PNC Financial, which also performed well during the period. Shares of Coty, a cosmetics and personal care company, detracted from performance as the company has struggled with the integration of Procter & Gamble’s Specialty Beauty Brands. We continue to hold Coty as of the end of the period.
Top contributors to relative performance included Bank of America (financials), PNC Financial (financials), and AT&T (telecommunication services). Our overweight to Bank of America, a multinational banking and financial services provider, was the top relative contributor during the period. The company has made improvements to its business model and has impressed investors with solid results. Expectations of rising interest rates, lower taxes, and relief from regulatory pressures have also increased investor sentiment towards banks. Our overweight to PNC Financial, a diversified financial services firm focusing mainly on retail and business banking, has benefitted performance with earnings beat and solid upside revenue in the past quarters. PNC’s leading loan growth, interest leverage, and commitment to positive operating leverage should drive continued earnings upside going forward. We maintained positions in both stocks as of the end of the period. Our zero-exposure to AT&T, a telecommunications and digital entertainment services provider, aided relative performance as the stock dropped following poor results. AT&T is also facing tougher competition from its smaller rivals (T-Mobile & Sprint), who have been aggressively marketing unlimited calling, texting and data plans.
Strategy and Outlook
Looking ahead, our Global Industry Analysts remain focused on fundamental, bottom-up stock selection with an eye on how the macro-economic outlook will affect the companies in which they invest. We continue to identify themes and opportunities that will shape future investment decisions.
Within information technology, one of our major themes continues to be companies that stand to benefit from the exploding growth in cloud computing and the move off-premise. Advancements in cloud computing have led to flexible, cheaper, and more efficient IT networks and we are focused on finding the best positioned players. We continue to hold our position in memory semiconductor
76 | October 31, 2017
ALPS | WMC Research Value Fund
| Management Commentary | October 31, 2017 (Unaudited) |
company Micron Technology, which raised its guidance during the third quarter.
Global brands also continue to be a key theme in our Research Value portfolio. We established a new position in McDonald’s over the course of the third quarter. The new CEO is a little over 2 years into his tenure and he and his team have done a remarkable job restructuring McDonald’s into a leaner, more agile company. Over the past 2 years, they have sold thousands of stores to shift to their long-term goal of 95% franchised, cut significant expenses, added leverage, and returned more than $30 billion of capital to shareholders. Management now has plans for a national value platform, which will allow different menu items to float in/out at different prices based on the prevailing competitive/macro environment. This latest initiative gives us confidence that the company will continue to enjoy solid same-store sales growth.
77 | October 31, 2017
ALPS | WMC Research Value Fund
| Performance Update | October 31, 2017 (Unaudited) |
Performance of $10,000 Initial Investment (as of October 31, 2017)
Comparison of change in value of a $10,000 investment (includes maximum sales charges of 5.50%)
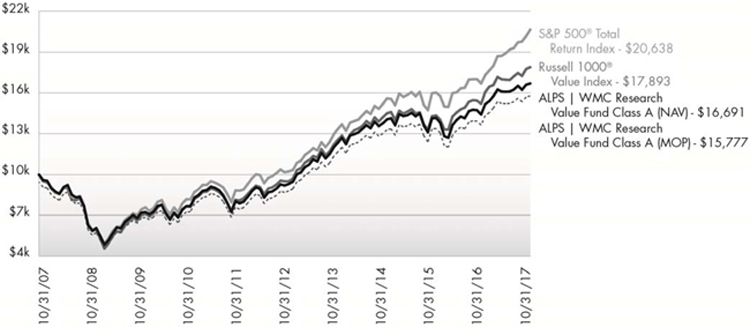
The chart above represents historical performance of a hypothetical investment of $10,000 in the Fund since inception. Past performance does not guarantee future results. This chart does not reflect the deduction of taxes that a shareholder would pay on Fund distributions or the redemption of Fund shares.
Average Annual Total Returns (as of October 31, 2017)
| 6 Month | 1 Year | 3 Year | 5 Year | 10 Year | Since Inception | Total Expense Ratio | What You Pay* | |
| Class A (NAV) | 3.75% | 15.81% | 6.64% | 12.65% | 5.26% | 9.70% | 1.53% | 1.15% |
| Class A (MOP) | -1.98% | 9.41% | 4.65% | 11.39% | 4.67% | 9.56% | ||
| Class C (NAV) | 3.33% | 15.02% | 5.87% | 11.83% | 4.48% | 8.88% | 2.27% | 1.90% |
| Class C (CDSC) | 2.33% | 14.02% | 5.87% | 11.83% | 4.48% | 8.88% | ||
| Class I | 3.88% | 16.10% | 6.88% | 12.90% | 5.51% | 9.94% | 1.28% | 0.90% |
| Russell 1000® Value Index1 | 5.46% | 17.78% | 7.99% | 13.48% | 5.99% | – | ||
| S&P 500® Total Return Index2 | 9.10% | 23.63% | 10.77% | 15.18% | 7.51% | – |
Performance data quoted represents past performance. Past performance does not guarantee future results. Investment return and principal value of an investment will fluctuate so that an investor’s shares, when sold or redeemed, may be worth more or less than the original cost. Current performance data may be higher or lower than actual data quoted. For the most current month-end performance data, please call 1-866-759-5679.
Maximum Offering Price (MOP) for Class A shares includes the Fund’s maximum sales charge of 5.50%. Performance shown at NAV does not include these sales charges and would have been lower had it been taken into account. If you invest $1 million or more, either as a lump sum or through the Fund’s accumulation or letter of intent programs, you can purchase Class A shares without an initial sales charge (load). A Contingent Deferred Sales Charge (“CDSC”) of 1.00% may apply to Class C shares redeemed within the first 12 months after a purchase, and on Class A shares redeemed within the first 18 months after a purchase in excess of $1 million. Performance less than 1 year is cumulative.
78 | October 31, 2017
ALPS | WMC Research Value Fund
| Performance Update | October 31, 2017 (Unaudited) |
Performance shown for Class C shares prior to June 30, 2010 reflects the historical performance of the Fund’s Class A shares, calculated using the fees and expenses of Class C shares.
Effective February 28, 2015 the Fund changed its name from the ALPS | WMC Disciplined Value Fund to the ALPS | WMC Research Value Fund.
The performance shown for the ALPS | WMC Research Value Fund (the “Fund”) for periods prior to August 29, 2009, reflects the performance of the Activa Mutual Funds Trust – Activa Value Fund (as result of a prior reorganization of Activa Mutual Funds Trust – Activa Value Fund into the Fund).
| 1 | The Russell 1000® Value Index measures the performance of those Russell 1000® companies with lower price-to-book ratios and lower forecasted growth values. The index is not actively managed and does not reflect any deduction for fees, expenses or taxes. An investor may not invest directly in an index. |
| 2 | The S&P 500® Index is the Standard & Poor’s composite index of 500 stocks, a widely recognized, unmanaged index of common stock prices. The index is not actively managed and does not reflect any deduction for fees, expenses or taxes. An investor may not invest directly in an index. |
| * | What You Pay reflects the Advisor’s decision to contractually limit expenses through February 28, 2018. Please see the prospectus for additional information. |
The table does not reflect the deduction of taxes that a shareholder would pay on Fund distributions or the redemption of Fund shares.
This Fund is not suitable for all investors and is subject to investment risks, including possible loss of the principal amount invested.
There is no guarantee that the Fund will continue to hold any one particular security or stay invested in any one particular company. The composition of the Fund’s top holdings is subject to change. Performance figures are historical and reflect the change in share price, reinvested distributions, changes in net asset value, sales charges and capital gains distributions, if any.
Not FDIC Insured – No Bank Guarantee – May Lose Value
Top Ten Holdings (as a % of Net Assets) †
| Bank of America Corp. | 4.88% |
| Chevron Corp. | 2.87% |
| Verizon Communications, Inc. | 2.83% |
| Citigroup, Inc. | 2.59% |
| PNC Financial Services Group, Inc. | 2.56% |
| NextEra Energy, Inc. | 2.03% |
| Medtronic PLC | 1.94% |
| Assured Guaranty, Ltd. | 1.55% |
| American International Group, Inc. | 1.44% |
| Marsh & McLennan Companies, Inc. | 1.42% |
| Top Ten Holdings | 24.11% |
| † | Holdings are subject to change, and may not reflect the current or future position of the portfolio. Table presents indicative values only. |
Industry Sector Allocation (as a % of Net Assets)

79 | October 31, 2017
ALPS | WMC Research Value Fund
| Statement of Investments | October 31, 2017 |
| Shares | Value (Note 2) | |||||||
| COMMON STOCKS (99.60%) | ||||||||
| Consumer Discretionary (5.54%) | ||||||||
| Consumer Durables & Apparel (1.53%) | ||||||||
| Mohawk Industries, Inc.(a) | 1,803 | $ | 471,953 | |||||
| NIKE, Inc., Class B | 12,909 | 709,866 | ||||||
| Tapestry, Inc. | 5,731 | 234,685 | ||||||
| 1,416,504 | ||||||||
| Consumer Services (1.15%) | ||||||||
| Hilton Worldwide Holdings, Inc. | 1,543 | 111,528 | ||||||
| McDonald’s Corp. | 2,926 | 488,379 | ||||||
| Vail Resorts, Inc. | 465 | 106,494 | ||||||
| Wynn Resorts, Ltd. | 2,482 | 366,070 | ||||||
| 1,072,471 | ||||||||
| Media (2.54%) | ||||||||
| Charter Communications, Inc., Class A(a) | 1,348 | 450,461 | ||||||
| Cinemark Holdings, Inc. | 5,230 | 190,058 | ||||||
| Comcast Corp., Class A | 12,027 | 433,333 | ||||||
| Liberty Media Corp.-Liberty Formula One, Class C(a) | 5,277 | 201,265 | ||||||
| New York Times Co., Class A | 7,283 | 139,105 | ||||||
| Scripps Networks Interactive, Inc., Class A | 1,200 | 99,936 | ||||||
| Twenty-First Century Fox, Inc., Class A | 16,511 | 431,763 | ||||||
| Viacom, Inc., Class B | 17,039 | 409,447 | ||||||
| 2,355,368 | ||||||||
| Retailing (0.32%) | ||||||||
| Expedia, Inc. | 1,174 | 146,351 | ||||||
| L Brands, Inc. | 3,518 | 151,414 | ||||||
| 297,765 | ||||||||
| TOTAL CONSUMER DISCRETIONARY | 5,142,108 | |||||||
| Consumer Staples (9.01%) | ||||||||
| Food & Staples Retailing (1.18%) | ||||||||
| Costco Wholesale Corp. | 2,033 | 327,476 | ||||||
| Sysco Corp. | 5,419 | 301,405 | ||||||
| Walgreens Boots Alliance, Inc. | 7,071 | 468,595 | ||||||
| 1,097,476 | ||||||||
| Food Beverage & Tobacco (6.43%) | ||||||||
| Altria Group, Inc. | 11,374 | 730,438 | ||||||
| Anheuser-Busch InBev N.V., Sponsored ADR | 4,694 | 576,329 | ||||||
| British American Tobacco PLC, Sponsored ADR | 15,449 | 994,916 | ||||||
| Campbell Soup Co. | 6,992 | 331,211 | ||||||
| Constellation Brands, Inc., Class A | 3,128 | 685,313 | ||||||
| Fresh Del Monte Produce, Inc. | 3,858 | 171,720 | ||||||
| Shares | Value (Note 2) | |||||||
| Food Beverage & Tobacco (continued) | ||||||||
| Hostess Brands, Inc.(a) | 67,202 | $ | 774,839 | |||||
| PepsiCo, Inc. | 6,956 | 766,760 | ||||||
| Post Holdings, Inc.(a) | 11,218 | 930,309 | ||||||
| 5,961,835 | ||||||||
| Household & Personal Products (1.40%) | ||||||||
| Coty, Inc., Class A | 68,375 | 1,052,975 | ||||||
| Herbalife, Ltd.(a) | 3,334 | 242,115 | ||||||
| 1,295,090 | ||||||||
| TOTAL CONSUMER STAPLES | 8,354,401 | |||||||
| Energy (9.92%) | ||||||||
| Energy (9.92%) | ||||||||
| Andeavor | 2,276 | 241,802 | ||||||
| Antero Resources Corp.(a) | 9,130 | 177,122 | ||||||
| Baker Hughes a GE Co. | 4,986 | 156,710 | ||||||
| BP PLC, Sponsored ADR | 15,535 | 631,808 | ||||||
| Chevron Corp. | 22,961 | 2,660,950 | ||||||
| Diamondback Energy, Inc.(a) | 4,967 | 532,264 | ||||||
| Encana Corp. | 15,073 | 176,354 | ||||||
| Hess Corp. | 7,936 | 350,454 | ||||||
| Kinder Morgan, Inc. | 42,780 | 774,746 | ||||||
| Marathon Petroleum Corp. | 7,921 | 473,200 | ||||||
| Newfield Exploration Co.(a) | 25,501 | 785,176 | ||||||
| Oceaneering International, Inc. | 5,300 | 107,166 | ||||||
| ONEOK, Inc. | 3,291 | 178,603 | ||||||
| Patterson-UTI Energy, Inc. | 6,900 | 136,482 | ||||||
| PDC Energy, Inc.(a) | 1,610 | 81,997 | ||||||
| Pioneer Natural Resources Co. | 1,288 | 192,775 | ||||||
| QEP Resources, Inc.(a) | 16,524 | 147,890 | ||||||
| Suncor Energy, Inc. | 11,023 | 374,341 | ||||||
| Targa Resources Corp. | 4,463 | 185,214 | ||||||
| Tesco Corp.(a) | 27,100 | 104,335 | ||||||
| TransCanada Corp. | 11,039 | 524,132 | ||||||
| WPX Energy, Inc.(a) | 18,820 | 212,290 | ||||||
| TOTAL ENERGY | 9,205,811 | |||||||
| Financials (25.56%) | ||||||||
| Banks (10.94%) | ||||||||
| Bank of America Corp. | 165,202 | 4,524,883 | ||||||
| Citigroup, Inc. | 32,662 | 2,400,657 | ||||||
| Huntington Bancshares, Inc. | 61,082 | 842,932 | ||||||
| PNC Financial Services Group, Inc. | 17,398 | 2,379,872 | ||||||
| 10,148,344 | ||||||||
| Diversified Financials (5.26%) | ||||||||
| American Express Co. | 12,200 | 1,165,344 | ||||||
| Capital One Financial Corp. | 12,108 | 1,116,116 | ||||||
| FactSet Research Systems, Inc. | 1,036 | 196,705 | ||||||
| Goldman Sachs Group, Inc. | 1,996 | 483,990 | ||||||
80 | October 31, 2017
| ALPS | WMC Research Value Fund |
| Statement of Investments | October 31, 2017 |
| Shares | Value (Note 2) | |||||||
| Diversified Financials (continued) | ||||||||
| Intercontinental Exchange, Inc. | 5,234 | $ | 345,968 | |||||
| Northern Trust Corp. | 5,506 | 514,921 | ||||||
| OneMain Holdings, Inc.(a) | 9,570 | 304,039 | ||||||
| TD Ameritrade Holding Corp. | 8,778 | 438,812 | ||||||
| Voya Financial, Inc. | 5,015 | 201,402 | ||||||
| WisdomTree Investments, Inc. | 10,300 | 114,227 | ||||||
| 4,881,524 | ||||||||
| Insurance (9.36%) | ||||||||
| Alleghany Corp.(a) | 952 | 539,041 | ||||||
| Allstate Corp. | 4,123 | 386,985 | ||||||
| American International Group, Inc. | 20,675 | 1,335,812 | ||||||
| Assurant, Inc. | 3,513 | 353,583 | ||||||
| Assured Guaranty, Ltd. | 38,659 | 1,434,249 | ||||||
| Athene Holding, Ltd., Class A(a) | 4,010 | 209,041 | ||||||
| Marsh & McLennan Companies, Inc. | 16,304 | 1,319,483 | ||||||
| MetLife, Inc. | 14,889 | 797,753 | ||||||
| Prudential Financial, Inc. | 5,251 | 580,025 | ||||||
| Reinsurance Group of America, Inc. | 2,942 | 439,476 | ||||||
| XL Group, Ltd. | 31,919 | 1,291,762 | ||||||
| 8,687,210 | ||||||||
| TOTAL FINANCIALS | 23,717,078 | |||||||
| Health Care (13.72%) | ||||||||
| Health Care Equipment & Services (8.26%) | ||||||||
| Abbott Laboratories | 20,102 | 1,090,131 | ||||||
| Baxter International, Inc. | 6,739 | 434,463 | ||||||
| Becton Dickinson & Co. | 188 | 39,230 | ||||||
| Boston Scientific Corp.(a) | 20,389 | 573,746 | ||||||
| Brookdale Senior Living, Inc.(a) | 21,960 | 220,259 | ||||||
| Cardinal Health, Inc. | 9,173 | 567,809 | ||||||
| Cigna Corp. | 2,408 | 474,906 | ||||||
| Danaher Corp. | 4,404 | 406,357 | ||||||
| HCA Healthcare, Inc.(a) | 3,634 | 274,912 | ||||||
| McKesson Corp. | 4,964 | 684,436 | ||||||
| Medtronic PLC | 22,384 | 1,802,360 | ||||||
| Stryker Corp. | 2,847 | 440,915 | ||||||
| UnitedHealth Group, Inc. | 3,127 | 657,358 | ||||||
| 7,666,882 | ||||||||
| Pharmaceuticals, Biotechnology & Life Sciences (5.46%) | ||||||||
| Alder Biopharmaceuticals, Inc.(a) | 10,134 | 114,008 | ||||||
| Alkermes PLC(a) | 1,730 | 84,355 | ||||||
| Allergan PLC | 6,226 | 1,103,434 | ||||||
| Alnylam Pharmaceuticals, Inc.(a) | 930 | 113,311 | ||||||
| AstraZeneca PLC, Sponsored ADR | 11,052 | 381,294 | ||||||
| Bristol-Myers Squibb Co. | 17,778 | 1,096,191 | ||||||
| Dermira, Inc.(a) | 3,545 | 94,900 | ||||||
| Eli Lilly & Co. | 5,551 | 454,849 | ||||||
| Merck & Co., Inc. | 4,853 | 267,352 | ||||||
| Mylan N.V.(a) | 14,709 | 525,258 | ||||||
| Shares | Value (Note 2) | |||||||
| Pharmaceuticals, Biotechnology & Life Sciences (continued) | ||||||||
| Teva Pharmaceutical Industries, Ltd., Sponsored ADR | 17,651 | $ | 243,584 | |||||
| Thermo Fisher Scientific, Inc. | 3,022 | 585,754 | ||||||
| 5,064,290 | ||||||||
| TOTAL HEALTH CARE | 12,731,172 | |||||||
| Industrials (9.09%) | ||||||||
| Capital Goods (7.40%) | ||||||||
| AGCO Corp. | 1,794 | 123,015 | ||||||
| AMETEK, Inc. | 7,198 | 485,793 | ||||||
| Boeing Co. | 1,963 | 506,415 | ||||||
| Caterpillar, Inc. | 1,736 | 235,749 | ||||||
| Deere & Co. | 2,190 | 291,007 | ||||||
| Eaton Corp. PLC | 6,627 | 530,293 | ||||||
| Fastenal Co. | 4,720 | 221,698 | ||||||
| Fortive Corp. | 5,965 | 431,031 | ||||||
| General Dynamics Corp. | 3,112 | 631,674 | ||||||
| General Electric Co. | 54,908 | 1,106,945 | ||||||
| Illinois Tool Works, Inc. | 2,883 | 451,247 | ||||||
| Lockheed Martin Corp. | 1,737 | 535,274 | ||||||
| Northrop Grumman Corp. | 1,590 | 469,893 | ||||||
| PACCAR, Inc. | 2,813 | 201,776 | ||||||
| Pentair PLC | 6,198 | 436,711 | ||||||
| WESCO International, Inc.(a) | 3,240 | 204,606 | ||||||
| 6,863,127 | ||||||||
| Commercial & Professional Services (0.51%) | ||||||||
| Dun & Bradstreet Corp. | 1,000 | 116,830 | ||||||
| Equifax, Inc. | 1,068 | 115,910 | ||||||
| IHS Markit, Ltd.(a) | 5,767 | 245,732 | ||||||
| 478,472 | ||||||||
| Transportation (1.18%) | ||||||||
| FedEx Corp. | 1,111 | 250,875 | ||||||
| JB Hunt Transport Services, Inc. | 1,981 | 210,758 | ||||||
| Kirby Corp.(a) | 900 | 63,765 | ||||||
| Norfolk Southern Corp. | 4,338 | 570,100 | ||||||
| 1,095,498 | ||||||||
| TOTAL INDUSTRIALS | 8,437,097 | |||||||
| Information Technology (7.24%) | ||||||||
| Semiconductors & Semiconductor Equipment (3.43%) | ||||||||
| Intel Corp. | 15,544 | 707,096 | ||||||
| KLA-Tencor Corp. | 941 | 102,465 | ||||||
| Marvell Technology Group, Ltd. | 8,828 | 163,053 | ||||||
| Microchip Technology, Inc. | 4,391 | 416,267 | ||||||
| Micron Technology, Inc.(a) | 3,670 | 162,618 | ||||||
| NVIDIA Corp. | 965 | 199,572 | ||||||
| QUALCOMM, Inc. | 23,880 | 1,218,119 | ||||||
81 | October 31, 2017
| ALPS | WMC Research Value Fund |
| Statement of Investments | October 31, 2017 |
| Shares | Value (Note 2) | |||||||
| Semiconductors & Semiconductor Equipment (continued) | ||||||||
| Texas Instruments, Inc. | 2,200 | $ | 212,718 | |||||
| 3,181,908 | ||||||||
| Software & Services (3.34%) | ||||||||
| Alliance Data Systems Corp. | 1,110 | 248,340 | ||||||
| Autodesk, Inc.(a) | 1,528 | 190,939 | ||||||
| CACI International, Inc., Class A(a) | 1,794 | 257,888 | ||||||
| eBay, Inc.(a) | 27,436 | 1,032,691 | ||||||
| Facebook, Inc., Class A(a) | 1,311 | 236,059 | ||||||
| FleetCor Technologies, Inc.(a) | 1,153 | 190,556 | ||||||
| Genpact, Ltd. | 4,503 | 137,116 | ||||||
| Global Payments, Inc. | 2,107 | 219,023 | ||||||
| Total System Services, Inc. | 2,458 | 177,099 | ||||||
| Visa, Inc., Class A | 2,729 | 300,135 | ||||||
| WEX, Inc.(a) | 905 | 111,849 | ||||||
| 3,101,695 | ||||||||
| Technology Hardware & Equipment (0.47%) | ||||||||
| Flex, Ltd.(a) | 6,938 | 123,496 | ||||||
| NetApp, Inc. | 7,037 | 312,584 | ||||||
| 436,080 | ||||||||
| TOTAL INFORMATION TECHNOLOGY | 6,719,683 | |||||||
| Materials (4.22%) | ||||||||
| Materials (4.22%) | ||||||||
| Alcoa Corp.(a) | 2,588 | 123,655 | ||||||
| Ardagh Group SA | 5,300 | 113,632 | ||||||
| Ball Corp. | 8,688 | 372,976 | ||||||
| Cabot Corp. | 3,223 | 196,474 | ||||||
| Celanese Corp., Series A | 2,817 | 293,841 | ||||||
| Crown Holdings, Inc.(a) | 2,143 | 128,944 | ||||||
| DowDuPont, Inc. | 13,534 | 978,644 | ||||||
| International Paper Co. | 8,322 | 476,601 | ||||||
| Martin Marietta Materials, Inc. | 377 | 81,753 | ||||||
| Owens-Illinois, Inc.(a) | 4,387 | 104,805 | ||||||
| PPG Industries, Inc. | 3,367 | 391,380 | ||||||
| Praxair, Inc. | 1,042 | 152,257 | ||||||
| Southern Copper Corp. | 2,212 | 95,005 | ||||||
| Steel Dynamics, Inc. | 4,636 | 172,506 | ||||||
| Vulcan Materials Co. | 771 | 93,869 | ||||||
| Westlake Chemical Corp. | 1,675 | 142,224 | ||||||
| TOTAL MATERIALS | 3,918,566 | |||||||
| Real Estate (4.70%) | ||||||||
| Real Estate (4.70%) | ||||||||
| Alexandria Real Estate Equities, Inc. | 4,118 | 510,467 | ||||||
| American Tower Corp. | 4,163 | 598,098 | ||||||
| Apartment Investment & Management Co., Class A | 11,709 | 514,962 | ||||||
| Douglas Emmett, Inc. | 19,240 | 765,560 | ||||||
| Shares | Value (Note 2) | |||||||
| Real Estate (continued) | ||||||||
| Equinix, Inc. | 499 | $ | 231,287 | |||||
| Forest City Realty Trust, Inc., Class A | 10,563 | 260,167 | ||||||
| Invitation Homes, Inc. | 15,679 | 353,875 | ||||||
| Outfront Media, Inc. | 5,734 | 134,462 | ||||||
| Prologis, Inc. | 9,483 | 612,412 | ||||||
| Simon Property Group, Inc. | 1,429 | 221,967 | ||||||
| Sun Communities, Inc. | 1,717 | 154,976 | ||||||
| TOTAL REAL ESTATE | 4,358,233 | |||||||
| Telecommunication Services (2.83%) | ||||||||
| Telecommunication Services (2.83%) | ||||||||
| Verizon Communications, Inc. | 54,869 | 2,626,579 | ||||||
| TOTAL TELECOMMUNICATION SERVICES | 2,626,579 | |||||||
| Utilities (7.77%) | ||||||||
| Utilities (7.77%) | ||||||||
| Avangrid, Inc. | 17,408 | 900,516 | ||||||
| Edison International | 12,525 | 1,001,374 | ||||||
| Exelon Corp. | 15,710 | 631,699 | ||||||
| NextEra Energy, Inc. | 12,122 | 1,879,759 | ||||||
| NRG Energy, Inc. | 15,313 | 382,825 | ||||||
| PG&E Corp. | 13,112 | 757,480 | ||||||
| Sempra Energy | 6,759 | 794,182 | ||||||
| UGI Corp. | 18,007 | 861,815 | ||||||
| TOTAL UTILITIES | 7,209,650 | |||||||
| TOTAL COMMON STOCKS | ||||||||
| (Cost $81,702,581) | 92,420,378 | |||||||
| EXCHANGE TRADED FUNDS (0.13%) | ||||||||
| Vanguard® High Dividend Yield ETF | 1,532 | 126,360 | ||||||
| TOTAL EXCHANGE TRADED FUNDS | ||||||||
| (Cost $127,462) | 126,360 | |||||||
| 7-Day Yield | Shares | Value (Note 2) | ||||||||||
| SHORT TERM INVESTMENTS (0.48%) | ||||||||||||
| Short-Term Cash Equivalents (0.48%) | ||||||||||||
| State Street Institutional Treasury Plus Money Market Fund | 0.936 | % | 444,650 | 444,650 | ||||||||
| TOTAL SHORT TERM INVESTMENTS | ||||||||||||
| (Cost $444,650) | 444,650 | |||||||||||
82 | October 31, 2017
| ALPS | WMC Research Value Fund |
| Statement of Investments | October 31, 2017 |
| Value (Note 2) | ||||
| TOTAL INVESTMENTS (100.21%) | ||||
| (Cost $82,274,693) | $ | 92,991,388 | ||
| Liabilities In Excess Of Other Assets (-0.21%) | (197,560 | ) | ||
| NET ASSETS (100.00%) | $ | 92,793,828 | ||
| (a) | Non-Income Producing Security. |
For Fund compliance purposes, the Fund’s industry classifications refer to any one or more of the industry sub-classifications used by one or more widely recognized market indexes or ratings group indexes, and/or as defined by Fund management. This definition may not apply for purposes of this report, which may combine industry sub-classifications for reporting ease. Industries are shown as a percent of net assets.
See Notes to Financial Statements.
83 | October 31, 2017
ALPS | WMC Research Value Fund
| Statement of Assets and Liabilities | October 31, 2017 |
| ASSETS | ||||
| Investments, at value | $ | 92,991,388 | ||
| Cash | 4,703 | |||
| Receivable for investments sold | 322,964 | |||
| Receivable for shares sold | 185 | |||
| Dividends receivable | 90,002 | |||
| Prepaid expenses and other assets | 13,776 | |||
| Total Assets | 93,423,018 | |||
| LIABILITIES | ||||
| Payable for investments purchased | 206,805 | |||
| Payable for shares redeemed | 317,267 | |||
| Investment advisory fees payable | 38,376 | |||
| Administration and transfer agency fees payable | 21,542 | |||
| Distribution and services fees payable | 11,220 | |||
| Trustees’ fees and expenses payable | 300 | |||
| Professional fees payable | 21,659 | |||
| Accrued expenses and other liabilities | 12,021 | |||
| Total Liabilities | 629,190 | |||
| NET ASSETS | $ | 92,793,828 | ||
| NET ASSETS CONSIST OF | ||||
| Paid-in capital | $ | 75,001,470 | ||
| Accumulated net investment income | 546,758 | |||
| Accumulated net realized gain | 6,528,903 | |||
| Net unrealized appreciation | 10,716,697 | |||
| NET ASSETS | $ | 92,793,828 | ||
| INVESTMENTS, AT COST | $ | 82,274,693 | ||
| PRICING OF SHARES | ||||
| Class A: | ||||
| Net Asset Value, offering and redemption price per share | $ | 9.40 | ||
| Net Assets | $ | 49,637,480 | ||
| Shares of beneficial interest outstanding (unlimited number of shares, no par value common stock authorized) | 5,282,018 | |||
| Maximum offering price per share ((NAV/0.9450), based on maximum sales charge of 5.50% of the offering price) | $ | 9.95 | ||
| Class C: | ||||
| Net Asset Value, offering and redemption price per share(a) | $ | 8.99 | ||
| Net Assets | $ | 734,230 | ||
| Shares of beneficial interest outstanding (unlimited number of shares, no par value common stock authorized) | 81,712 | |||
| Class I: | ||||
| Net Asset Value, offering and redemption price per share | $ | 9.64 | ||
| Net Assets | $ | 42,422,118 | ||
| Shares of beneficial interest outstanding (unlimited number of shares, no par value common stock authorized) | 4,398,941 | |||
| (a) | Redemption price per share may be reduced for any applicable contingent deferred sales charge. For a description of a possible sales charge, please see the Fund’s Prospectus. |
See Notes to Financial Statements.
84 | October 31, 2017
ALPS | WMC Research Value Fund
| Statement of Operations | For the Year Ended October 31, 2017 |
| INVESTMENT INCOME | ||||
| Dividends | $ | 1,708,396 | ||
| Foreign taxes withheld on dividends | (6,293 | ) | ||
| Total Investment Income | 1,702,103 | |||
| EXPENSES | ||||
| Investment advisory fees | 914,594 | |||
| Administrative fees | 152,561 | |||
| Transfer agency fees | 31,657 | |||
| Distribution and service fees | ||||
| Class A | 128,995 | |||
| Class C | 6,544 | |||
| Professional fees | 26,556 | |||
| Reports to shareholders and printing fees | 16,532 | |||
| State registration fees | 43,030 | |||
| Insurance fees | 847 | |||
| Custody fees | 15,900 | |||
| Trustees’ fees and expenses | 2,203 | |||
| Miscellaneous expenses | 12,290 | |||
| Total Expenses | 1,351,709 | |||
| Less fees waived/reimbursed by investment advisor (Note 8) | ||||
| Class A | (187,414 | ) | ||
| Class C | (2,406 | ) | ||
| Class I | (160,027 | ) | ||
| Net Expenses | 1,001,862 | |||
| Net Investment Income | 700,241 | |||
| Net realized gain on investments | 6,688,289 | |||
| Net realized gain on futures contracts | 100,052 | |||
| Net Realized Gain | 6,788,341 | |||
| Net change in unrealized appreciation on investments | 6,698,714 | |||
| Net change in unrealized appreciation on futures contracts | 13,220 | |||
| Net change in unrealized appreciation on translation of assets and liabilities denominated in foreign currencies | 2 | |||
| Net Change in Unrealized Appreciation | 6,711,936 | |||
| NET REALIZED AND UNREALIZED GAIN ON INVESTMENTS | 13,500,277 | |||
| NET INCREASE IN NET ASSETS RESULTING FROM OPERATIONS | $ | 14,200,518 | ||
See Notes to Financial Statements.
85 | October 31, 2017
ALPS | WMC Research Value Fund
Statements of Changes in Net Assets
| For the Year Ended October 31, 2017 | For the Year Ended October 31, 2016 | |||||||
| OPERATIONS | ||||||||
| Net investment income | $ | 700,241 | $ | 699,777 | ||||
| Net realized gain | 6,788,341 | 4,078,302 | ||||||
| Net change in unrealized appreciation/(depreciation) | 6,711,936 | (2,849,667 | ) | |||||
| Net Increase in Net Assets Resulting from Operations | 14,200,518 | 1,928,412 | ||||||
| DISTRIBUTIONS | �� | |||||||
| Dividends to shareholders from net investment income | ||||||||
| Class A | (80,213 | ) | (102,727 | ) | ||||
| Class C | (168 | ) | (484 | ) | ||||
| Class I | (83,183 | ) | (91,773 | ) | ||||
| Dividends to shareholders from net realized gains | ||||||||
| Class A | (1,513,166 | ) | (15,829,298 | ) | ||||
| Class C | (14,169 | ) | (227,520 | ) | ||||
| Class I | (1,215,454 | ) | (11,519,557 | ) | ||||
| Net Decrease in Net Assets from Distributions | (2,906,353 | ) | (27,771,359 | ) | ||||
| BENEFICIAL INTEREST TRANSACTIONS (NOTE 6) | ||||||||
| Shares sold | ||||||||
| Class A | 622,292 | 303,903 | ||||||
| Class C | 265,702 | 341,007 | ||||||
| Class I | 3,710,822 | 5,568,845 | ||||||
| Dividends reinvested | ||||||||
| Class A | 1,521,329 | 15,117,811 | ||||||
| Class C | 6,826 | 164,039 | ||||||
| Class I | 1,297,538 | 11,601,856 | ||||||
| Shares redeemed | ||||||||
| Class A | (8,287,816 | ) | (6,155,607 | ) | ||||
| Class C | (52,206 | ) | (671,989 | ) | ||||
| Class I | (10,342,427 | ) | (5,062,113 | ) | ||||
| Net Increase/(Decrease) in Net Assets Derived from Beneficial Interest Transactions | (11,257,940 | ) | 21,207,752 | |||||
| Net increase/(decrease) in net assets | 36,225 | (4,635,195 | ) | |||||
| NET ASSETS | ||||||||
| Beginning of year | 92,757,603 | 97,392,798 | ||||||
| End of year * | $ | 92,793,828 | $ | 92,757,603 | ||||
| *Including accumulated net investment income of: | $ | 546,758 | $ | (0 | ) | |||
See Notes to Financial Statements.
86 | October 31, 2017
ALPS | WMC Research Value Fund – Class A
Financial Highlights
Selected data for a share of beneficial interest outstanding throughout the periods indicated:
| For the Year Ended October 31, 2017 | For the Year Ended October 31, 2016 | For the Year Ended October 31, 2015(a) | For the Fiscal Period Ended October 31, 2014(b) | For the Year Ended April 30, 2014 | For the Year Ended April 30, 2013(c) | |||||||||||||||||||
| Net asset value, beginning of period | $ | 8.37 | $ | 11.57 | $ | 12.54 | $ | 11.92 | $ | 10.01 | $ | 8.42 | ||||||||||||
| INCOME/(LOSS) FROM INVESTMENT OPERATIONS: | ||||||||||||||||||||||||
| Net investment income(d) | 0.06 | 0.06 | 0.06 | 0.03 | 0.06 | 0.08 | ||||||||||||||||||
| Net realized and unrealized gain | 1.24 | 0.08 | 0.23 | 0.59 | 2.09 | 1.61 | ||||||||||||||||||
| Total from investment operations | 1.30 | 0.14 | 0.29 | 0.62 | 2.15 | 1.69 | ||||||||||||||||||
| DISTRIBUTIONS: | ||||||||||||||||||||||||
| From net investment income | (0.01 | ) | (0.02 | ) | (0.06 | ) | – | (0.11 | ) | (0.10 | ) | |||||||||||||
| From net realized gains | (0.26 | ) | (3.32 | ) | (1.20 | ) | – | (0.13 | ) | – | ||||||||||||||
| Total distributions | (0.27 | ) | (3.34 | ) | (1.26 | ) | – | (0.24 | ) | (0.10 | ) | |||||||||||||
| Net increase/(decrease) in net asset value | 1.03 | (3.20 | ) | (0.97 | ) | 0.62 | 1.91 | 1.59 | ||||||||||||||||
| Net asset value, end of year | $ | 9.40 | $ | 8.37 | $ | 11.57 | $ | 12.54 | $ | 11.92 | $ | 10.01 | ||||||||||||
| TOTAL RETURN(e) | 15.81 | % | 2.09 | % | 2.57 | % | 5.20 | % | 21.70 | % | 20.17 | % | ||||||||||||
| RATIOS/SUPPLEMENTAL DATA: | ||||||||||||||||||||||||
| Net assets, end of year (000s) | $ | 49,637 | $ | 49,814 | $ | 55,608 | $ | 59,628 | $ | 59,069 | $ | 50,142 | ||||||||||||
| Ratio of expenses to average net assets excluding fee waivers and reimbursements | 1.51 | % | 1.53 | % | 1.49 | % | 1.48 | %(f) | 1.47 | % | 1.51 | % | ||||||||||||
| Ratio of expenses to average net assets including fee waivers and reimbursements | 1.15 | % | 1.15 | %(g) | 1.40 | % | 1.40 | %(f) | 1.40 | % | 1.40 | % | ||||||||||||
| Ratio of net investment income to average net assets | 0.62 | % | 0.66 | % | 0.53 | % | 0.48 | %(f) | 0.52 | % | 0.95 | % | ||||||||||||
| Portfolio turnover rate(h) | 70 | % | 78 | % | 114 | % | 13 | % | 19 | % | 34 | % | ||||||||||||
| (a) | Effective February 28, 2015 the Fund changed its name from the ALPS | WMC Disciplined Value Fund to the ALPS | WMC Research Value Fund. |
| (b) | Effective May 1, 2014, the Board approved changing the fiscal year-end of the Funds from April 30 to October 31. |
| (c) | Prior to August 31, 2012, the ALPS | WMC Disciplined Value Fund was known as the ALPS | WMC Value Intersection Fund. |
| (d) | Calculated using the average shares method. |
| (e) | Total returns are for the period indicated and have not been annualized. Total returns would have been lower had certain expenses not been waived during the period. Returns shown do not reflect the deduction of taxes that a shareholder would pay on Fund distributions or the redemption of Fund shares. Returns shown exclude any applicable sales charges. |
| (f) | Annualized. |
| (g) | Effective November 1, 2015 the contractual expense limitation changed from 1.40% to 1.15%. |
| (h) | Portfolio turnover rate for periods less than one full year have not been annualized. |
See Notes to Financial Statements.
87 | October 31, 2017
ALPS | WMC Research Value Fund – Class C
Financial Highlights
Selected data for a share of beneficial interest outstanding throughout the periods indicated:
| For the Year Ended October 31, 2017 | For the Year Ended October 31, 2016 | For the Year Ended October 31, 2015(a) | For the Fiscal Period Ended October 31, 2014(b) | For the Year Ended April 30, 2014 | For the Year Ended April 30, 2013(c) | |||||||||||||||||||
| Net asset value, beginning of period | $ | 8.06 | $ | 11.32 | $ | 12.36 | $ | 11.80 | $ | 9.93 | $ | 8.39 | ||||||||||||
| INCOME/(LOSS) FROM INVESTMENT OPERATIONS: | ||||||||||||||||||||||||
| Net investment income/(loss)(d) | (0.01 | ) | (0.01 | ) | (0.03 | ) | (0.02 | ) | (0.02 | ) | 0.02 | |||||||||||||
| Net realized and unrealized gain | 1.20 | 0.08 | 0.24 | 0.58 | 2.08 | 1.57 | ||||||||||||||||||
| Total from investment operations | 1.19 | 0.07 | 0.21 | 0.56 | 2.06 | 1.59 | ||||||||||||||||||
| DISTRIBUTIONS: | ||||||||||||||||||||||||
| From net investment income | (0.00 | )(e) | (0.01 | ) | (0.05 | ) | – | (0.06 | ) | (0.05 | ) | |||||||||||||
| From net realized gains | (0.26 | ) | (3.32 | ) | (1.20 | ) | – | (0.13 | ) | – | ||||||||||||||
| Total distributions | (0.26 | ) | (3.33 | ) | (1.25 | ) | – | (0.19 | ) | (0.05 | ) | |||||||||||||
| Net increase/(decrease) in net asset value | 0.93 | (3.26 | ) | (1.04 | ) | 0.56 | 1.87 | 1.54 | ||||||||||||||||
| Net asset value, end of year | $ | 8.99 | $ | 8.06 | $ | 11.32 | $ | 12.36 | $ | 11.80 | $ | 9.93 | ||||||||||||
| TOTAL RETURN(f) | 15.02 | % | 1.28 | % | 1.87 | % | 4.75 | % | 20.97 | % | 19.07 | % | ||||||||||||
| RATIOS/SUPPLEMENTAL DATA: | ||||||||||||||||||||||||
| Net assets, end of year (000s) | $ | 734 | $ | 449 | $ | 870 | $ | 257 | $ | 133 | $ | 100 | ||||||||||||
| Ratio of expenses to average net assets excluding fee waivers and reimbursements | 2.27 | % | 2.27 | % | 2.24 | % | 2.24 | %(g) | 2.22 | % | 2.26 | % | ||||||||||||
| Ratio of expenses to average net assets including fee waivers and reimbursements | 1.90 | % | 1.90 | %(h) | 2.15 | % | 2.15 | %(g) | 2.15 | % | 2.15 | % | ||||||||||||
| Ratio of net investment income/(loss) to average net assets | (0.15 | )% | (0.07 | )% | (0.22 | )% | (0.30 | )%(g) | (0.23 | )% | 0.19 | % | ||||||||||||
| Portfolio turnover rate(i) | 70 | % | 78 | % | 114 | % | 13 | % | 19 | % | 34 | % | ||||||||||||
| (a) | Effective February 28, 2015 the Fund changed its name from the ALPS | WMC Disciplined Value Fund to the ALPS | WMC Research Value Fund. |
| (b) | Effective May 1, 2014, the Board approved changing the fiscal year-end of the Funds from April 30 to October 31. |
| (c) | Prior to August 31, 2012, the ALPS | WMC Disciplined Value Fund was known as the ALPS | WMC Value Intersection Fund. |
| (d) | Calculated using the average shares method. |
| (e) | Less than $0.005 or ($0.005) per share. |
| (f) | Total returns are for the period indicated and have not been annualized. Total returns would have been lower had certain expenses not been waived during the period. Returns shown do not reflect the deduction of taxes that a shareholder would pay on Fund distributions or the redemption of Fund shares. Returns shown exclude any applicable sales charges. |
| (g) | Annualized. |
| (h) | Effective November 1, 2015 the contractual expense limitation changed from 2.15% to 1.90%. |
| (i) | Portfolio turnover rate for periods less than one full year have not been annualized. |
See Notes to Financial Statements.
88 | October 31, 2017
ALPS | WMC Research Value Fund – Class I
Financial Highlights
Selected data for a share of beneficial interest outstanding throughout the periods indicated:
| For the Year Ended October 31, 2017 | For the Year Ended October 31, 2016 | For the Year Ended October 31, 2015(a) | For the Fiscal Period Ended October 31, 2014(b) | For the Year Ended April 30, 2014 | For the Year Ended April 30, 2013(c) | |||||||||||||||||||
| Net asset value, beginning of period | $ | 8.56 | $ | 11.75 | $ | 12.69 | $ | 12.05 | $ | 10.10 | $ | 8.49 | ||||||||||||
| INCOME/(LOSS) FROM INVESTMENT OPERATIONS: | ||||||||||||||||||||||||
| Net investment income(d) | 0.08 | 0.08 | 0.09 | 0.05 | 0.09 | 0.11 | ||||||||||||||||||
| Net realized and unrealized gain | 1.28 | 0.08 | 0.23 | 0.59 | 2.12 | 1.61 | ||||||||||||||||||
| Total from investment operations | 1.36 | 0.16 | 0.32 | 0.64 | 2.21 | 1.72 | ||||||||||||||||||
| DISTRIBUTIONS: | ||||||||||||||||||||||||
| From net investment income | (0.02 | ) | (0.03 | ) | (0.06 | ) | – | (0.13 | ) | (0.11 | ) | |||||||||||||
| From net realized gains | (0.26 | ) | (3.32 | ) | (1.20 | ) | – | (0.13 | ) | – | ||||||||||||||
| Total distributions | (0.28 | ) | (3.35 | ) | (1.27 | ) | – | (0.26 | ) | (0.11 | ) | |||||||||||||
| Net increase/(decrease) in net asset value | 1.08 | (3.19 | ) | (0.94 | ) | 0.64 | 1.95 | 1.61 | ||||||||||||||||
| Net asset value, end of year | $ | 9.64 | $ | 8.56 | $ | 11.75 | $ | 12.69 | $ | 12.05 | $ | 10.10 | ||||||||||||
| TOTAL RETURN(e) | 16.10 | % | 2.24 | % | 2.86 | % | 5.31 | % | 22.11 | % | 20.43 | % | ||||||||||||
| RATIOS/SUPPLEMENTAL DATA: | ||||||||||||||||||||||||
| Net assets, end of year (000s) | $ | 42,422 | $ | 42,495 | $ | 40,915 | $ | 43,502 | $ | 44,729 | $ | 39,417 | ||||||||||||
| Ratio of expenses to average net assets excluding fee waivers and reimbursements | 1.26 | % | 1.28 | % | 1.24 | % | 1.23 | %(f) | 1.22 | % | 1.26 | % | ||||||||||||
| Ratio of expenses to average net assets including fee waivers and reimbursements | 0.90 | % | 0.90 | %(g) | 1.15 | % | 1.15 | %(f) | 1.15 | % | 1.15 | % | ||||||||||||
| Ratio of net investment income to average net assets | 0.87 | % | 0.90 | % | 0.78 | % | 0.74 | %(f) | 0.77 | % | 1.20 | % | ||||||||||||
| Portfolio turnover rate(h) | 70 | % | 78 | % | 114 | % | 13 | % | 19 | % | 34 | % | ||||||||||||
| (a) | Effective February 28, 2015 the Fund changed its name from the ALPS | WMC Disciplined Value Fund to the ALPS | WMC Research Value Fund. |
| (b) | Effective May 1, 2014, the Board approved changing the fiscal year-end of the Funds from April 30 to October 31. |
| (c) | Prior to August 31, 2012, the ALPS | WMC Disciplined Value Fund was known as the ALPS | WMC Value Intersection Fund. |
| (d) | Calculated using the average shares method. |
| (e) | Total returns are for the period indicated and have not been annualized. Total returns would have been lower had certain expenses not been waived during the period. Returns shown do not reflect the deduction of taxes that a shareholder would pay on Fund distributions or the redemption of Fund shares. |
| (f) | Annualized. |
| (g) | Effective November 1, 2015 the contractual expense limitation changed from 1.15% to 0.90%. |
| (h) | Portfolio turnover rate for periods less than one full year have not been annualized. |
See Notes to Financial Statements.
89 | October 31, 2017
| Management Commentary | October 31, 2017 (Unaudited) |
For the 12-month period spanning November 1, 2016 to October 31, 2017 (the “Period), the Clough China Fund (the “Fund”) rose 29.64% versus the MSCI China Index (“Index”) which rose 41.29%. Individual shareholder returns may vary.
China’s economy continued to expand steadily throughout the year, with the third quarter gross domestic product (GDP) growing at a 6.8% rate1. Market fears that dominated 2016 which believed the Chinese Central Bank had lost control of the currency and an imminent devaluation would occur proved to be unfounded, as the renminbi (RMB) strengthened nearly 5% year-to-date (YTD), and the economy has seen 8 consecutive months of foreign currency inflows. From a debt- to-GDP perspective, debt creation continues to be an issue, but we are encouraged by a number of factors. From a road-map perspective, President Xi, who was reappointed to another 5-year term as leader of China, highlighted the need for debt reduction and the reform of state-owned- enterprises (SOE) in his landmark speech to the National Party Congress. We have come to learn over the past five years that President Xi has a history of being very clear about his plans and successfully executing them. We got a preview of SOE reform, as the country has shut nearly 150mm tons of steel capacity to date and after shutting nearly 1,000 coal mines in 2016, a further 500 are slated for 20172. Reform is only beginning.
Best Performers/Worst Performers
The Fund underperformed the index for its fiscal year for a number of reasons. First of all, overall cash balances were too high. The average cash weighting stood at 5.23% and with a market up over 40%, any dollar not invested negatively impacted relative performance. Going forward, we anticipate being more fully invested and at the end of the Fund’s fiscal year, cash balances stood at just 5 basis points. Secondly, the breadth of the market was actually quite narrow so, if you were underweight a few names it would be difficult to keep up with the benchmark. To illustrate this, two index heavy-weights, Tencent which comprise over 19% of the benchmark and Alibaba, which is 14.5% of the benchmark, were up 69% and 83% respectively. Due to mutual fund industry weight restrictions, the Fund was not able to invest fully in Alibaba and thus carried on average a 200 basis point underweight in the stock. We have since addressed this issue which was discussed in the half year commentary, and currently hold a 200 basis point active weight in company, which we believe is one of the most exciting investment opportunities in China. Another example of narrow market breadth, one China property developer called China Evergrande was up 482% and this relatively small index weighting stock was responsible for over 100 basis points of underperformance for the fund. We did not hold a position in the stock as we did not believe in the quality of the management nor the long-term prospects for the company.
From an individual stock perspective, Tencent and Alibaba were the biggest contributors to the Fund’s performance. Both of these stocks are in our top 5 of current active positions in the Fund and they continue to deliver extremely strong earnings growth that we anticipate should continue for the foreseeable future.
Tencent is China’s dominant social networking and gaming platform with 980 million monthly active users. The company just released its Q3 2017 results, and they continue to impress with revenue growth of 61% year-on-year and net income growth in excess of 45%. We believe that these types of growth rates can continue, as they increasingly monetize their huge gaming and social network user base. To put the opportunity into perspective, currently, the company generates 1RMB/daily active user/day on its gaming platform. One of Tencent’s competitors generates 6RMB per daily active user per day. The company’s market capitalization just surpassed that of Facebook at over $550bn. Unlike some internet stories that have large market capitalizations, Tencent has earnings to back up its share price rise. The company’s stock has quadrupled over the last 7 years but earnings have gone up over 6X. Currently, the stock trades at 1.3X growth, which, in our view is reasonable, given the company’s dominance in its gaming, social media, and payment platforms.
Alibaba is the world’s largest online shopping mall. The company just recently announced their Q3 2017 earnings, and they continue to impress with top line growing at 61% year-over-year and profits growing 66%. The company continues to consolidate its dominance in the e-commerce vertical. This will be driven, not only by a broader array of products offered, particularly groceries, but also bringing the fight to offline retailers as reflected by the company’s just announced purchase of a stake in Walmart’s largest competitor in China. Another factor that makes Alibaba such a compelling investment, in our view, is their other businesses. Alibaba owns a 33% stake in China’s largest financial technology company called Ant Financial. They also own China’s largest cloud services provider that has over 60% market share which last quarter reported a 99% increase in revenue!
A couple of names detracted from performance for the year – one of which we highlighted above. Another, VIPshop Holdings, is China’s dominant online discount site. The offline discount channel such as Marshalls or outlet malls that are prevalent across the US is almost non-existent in China. Thus, VIPshop acts as branded products channel to off-load excess inventory. Given these unique offline dynamics, we believed that a company such as VIPshop should thrive; however, we underestimated the competitive dynamics, and the company has had to spend a substantial amount of revenues to entice users onto their platform. It became clear to us that China’s e-commerce segment was becoming a two player market – Alibaba and JD, and there was likely not room for a third. We have since exited the position.
Outlook
We point to a number of reasons to continue to be positive on the Market. From a top down perspective, we think conditions remain ripe for continued robust profit growth. First of all, China’s Producer Price Index (PPI) continues to remain in positive territory standing at 6.9% in October. This number not only helps nominal GDP, but improves a company’s ability to raise prices and therefore improve margins and profitability. This is reflected in the numbers with China’s industrial profit growth accelerating from 16.5% in July 2017
90 | October 31, 2017
Clough China Fund
| Management Commentary | October 31, 2017 (Unaudited) |
to 27.7% in September 2017. This compares to only 8.5% in 20163. Given the heavy presence of SOE’s in the industrial sector of China, this provides some breathing room in terms of debt and corporate restructuring. The Fund, though, focuses its investments in China’s robust private sector – or China’s “New Economy”. According to Merrill Lynch, listed New Economy stocks now comprise over 50% of China’s overall market capitalization as well as profits.
Many of the existential concerns regarding the country’s currency and capital account have been allayed. President Xi’s focus on SOE and restructuring along with productivity improvement gives us optimism that the market will don a set of more rose colored glasses and see that China’s economic development is still at the early stages, with many years of growth and opportunity ahead. This is being driven by China’s innovation boom and its huge investment in research and development (R&D). China’s R&D spend has increased fivefold since 2005 and UBS believes that it could exceed the US Spend by 2018 in purchasing parity terms. Chinese students who used to study and stay abroad are now returning to China in droves. This investment in research has paid off and will continue in the future as reflected by the fact over one quarter of the world’s unicorns (unlisted start-ups valued over $1bn) are in China. The country leads the world in electric vehicle demand (40% of global share), has more than 23% of artificial intelligence start-ups, second only to the US, and has nearly 80% global market share in solar manufacturing4. China is not the smokestack economy that it once was.
In addition, the country’s stock market valuations remain attractive in our opinion. China’s Hang Seng China Enterprise Index trades at only 8.3X earnings and China’s A-share index, Shanghai Stock Exchange Composite Index, trades at only 14X estimated earnings.
Finally, we believe that liquidity inflows will continue, particularly from Chinese investors that are utilizing the relatively new Hong Kong-Shanghai/Hong Kong-Shenzhen Connect system. The Hong Kong market had at one time been extremely difficult to access for the Chinese. The connect system has changed this. The system now comprises nearly 14% of the Hong Kong market turnover from 0% in 20145. We believe that flows will continue from China into Hong Kong as H-share listed companies are on average trading at a 30% discount to their A-share counterparts. Taking advantage of this arbitrage as well as the Chinese investors’ desire to diversify their financial holdings should drive these flows.
Looking forward, the Fund’s portfolio will focus on those companies that we believe have substantial profit drivers and sustainable competitive advantages. One new name to the portfolio is Taiwan Semiconductor Manufacturing Company (TSMC), the world’s largest foundry. As the industry continues to try to meet Moore’s law6, each new technology node requires a huge investment. TSMC late last year announced as $16bn foundry to build chips at the 5 nanometer and 3 nanometer nodes. Given the magnitude of investment, the company will be the only independent foundry in the world that can afford such a large expenditure, and as a result will have the ability to drive the market from a supply perspective. This is an incredibly
well-managed company, with sustained returns on equity above 25% and very stable earnings before interest, taxes, depreciation, and amortization (EBITDA) margins.
Brian just returned from China, and continues to believe that some of the best opportunities lie in companies that have exposure to improving China’s environment. As the populace has attained substantial wealth in the last decade, having clean water and air are of growing importance. Investing in this sector can be tricky, though, as the Chinese government has required that any infrastructure/environmental improvement project come in the form of a public/private partnership. As a result, companies are now required to invest more capital in projects reducing asset turns and as a result returns. We will be talking to you more about these investments in future letters.
Finally, the Fund will begin making additional investments in factory automation/artificial intelligence segments. China is quickly moving up the value-add chain as reflective of their huge investment in research and development. You will be seeing an increased focus of our exposure to these exciting sectors.
In addition to the normal fund commentary, we also wanted to highlight some changes in the management of the Fund.
We are very pleased to announce that on November 1st, Anupam Bose and Chuck Clough were added as co-portfolio managers. All funds at Clough Capital are team managed, and the addition of Anupam and Chuck as portfolio managers is consistent with this philosophy. Anupam has worked as Clough Capital’s Global Technology analyst, and given that MSCI China’s index has 40% weighting in information technology, we felt it important to have his expertise reflected in the portfolio. Anupam worked at McKinsey & Company for 7 years and has over 5 years of technology investment experience. Chuck Clough is the founding partner of the Firm and brings his wealth of experience in Asia to bear in the Fund.
We thank you for your support.
Brian Chen, Portfolio Manager
Anupam Bose, Portfolio Manager
Chuck Clough, Portfolio Manager
| 1 | Source Bloomberg |
| 2 | Source China Daily – February 18, 2016 |
| 3 | Source CLSA November 2017 |
| 4 | Source UBS October 2017 |
| 5 | Source UBS September 2017 |
| 6 | Moore’s Law refers to an observation by Intel co-founder Gordon Moore that the number of transistors per square inch on integrated circuits had doubled every year since their invention. |
Investments in international and emerging markets securities include exposure to risks such as currency fluctuations, foreign taxes and regulations, and the potential for illiquid markets and political instability.
91 | October 31, 2017
Clough China Fund
| Management Commentary | October 31, 2017 (Unaudited) |
The views of the author and information discussed in this commentary are as of the date of publication, are subject to change, and may not reflect the writer’s current views. The views expressed are those of the author only, and represent an assessment of market conditions at a specific point in time, are opinions only and should not be relied upon as investment advice regarding a particular investment or markets in general. Such information does not constitute a recommendation to buy or sell specific securities or investment vehicles. It should not be assumed that any investment will be profitable or will equal the performance of the fund(s) or any securities or any sectors mentioned in this letter. The subject matter contained in this letter has been derived from several sources believed to be reliable and accurate at the time of compilation. Neither ALPS, Advisors, Inc., Clough Capital Partners, LP, nor the Fund accepts any liability for losses either direct or consequential caused by the use of this information.
92 | October 31, 2017
Clough China Fund
| Performance Update | October 31, 2017 (Unaudited) |
Performance of $10,000 Initial Investment (as of October 31, 2017)
Comparison of change in value of a $10,000 investment (includes maximum sales charges of 5.50%)

The chart above represents historical performance of a hypothetical investment of $10,000 in the Fund since inception. Past performance does not guarantee future results. This chart does not reflect the deduction of taxes that a shareholder would pay on Fund distributions or the redemption of Fund shares.
Average Annual Total Returns (as of October 31, 2017)
| 6 Month | 1 Year | 3 Year | 5 Year | 10 Year | Since Inception^ | Total Expense Ratio | What You Pay* | |
| Class A (NAV) | 20.82% | 29.32% | 7.08% | 9.29% | 1.73% | 11.78% | 2.04% | 1.95% |
| Class A (MOP) | 14.18% | 22.18% | 5.08% | 8.05% | 1.16% | 11.25% | ||
| Class C (NAV) | 20.39% | 28.36% | 6.28% | 8.46% | 0.96% | 10.95% | 2.83% | 2.70% |
| Class C (CDSC) | 19.39% | 27.36% | 6.28% | 8.46% | 0.96% | 10.95% | ||
| Class I 1 | 21.02% | 29.64% | 7.47% | 9.66% | 2.11% | 12.24% | 1.82% | 1.70% |
| MSCI China Index2 | 28.39% | 41.06% | 12.46% | 10.59% | 0.68% | 12.28% |
Performance data quoted represents past performance. Past performance does not guarantee future results. Investment return and principal value of an investment will fluctuate so that an investor’s shares, when sold or redeemed, may be worth more or less than the original cost. Current performance data may be higher or lower than actual data quoted. For the most current month-end performance data, please call 1-866-759-5679.
Maximum Offering Price (MOP) for Class A shares includes the Fund’s maximum sales charge of 5.50%. Performance shown at NAV does not include these sales charges and would have been lower had it been taken into account. If you invest $1 million or more, either as a lump sum or through the Fund’s accumulation or letter of intent programs, you can purchase Class A shares without an initial sales charge (load). A Contingent Deferred Sales Charge (“CDSC”) of 1.00% may apply to Class C shares redeemed within the first 12 months after a purchase, and on Class A shares redeemed within the first 18 months after a purchase in excess of $1 million. The Fund imposes a 2.00% redemption fee on shares held for less than 30 days.
Performance less than 1 year is cumulative.
The performance shown for the Clough China Fund for periods prior to January 15, 2010, reflects the performance of the Old Mutual China Fund, a series of Old Mutual Funds I (as a result of a prior reorganization of the Old Mutual China Fund into the Clough China Fund).
| 1 | Prior to close of business on January 15, 2010, Class I was known as Institutional Class of the Old Mutual China Fund. |
93 | October 31, 2017
Clough China Fund
| Performance Update | October 31, 2017 (Unaudited) |
| 2 | The Morgan Stanley Capital International (“MSCI”) China Index is constructed according to the MSCI Global Investable Market Index (GIMI) family. The MSCI China Index is part of the MSCI Emerging Markets Index. The index is not actively managed and does not reflect any deduction for fees, expenses or taxes. An investor may not invest directly in an index. |
| ^ | Fund Inception date of December 30, 2005. |
| * | What You Pay reflects the Advisor’s decision to contractually limit expenses through February 28, 2018. Please see the prospectus for additional information. |
The Fund is “non-diversified” and will generally be more volatile than diversified funds.
The table does not reflect the deduction of taxes that a shareholder would pay on Fund distributions or the redemption of Fund shares.
This Fund is not suitable for all investors and is subject to investment risks, including possible loss of the principal amount invested.
There is no guarantee that the Fund will continue to hold any one particular security or stay invested in any one particular company. The composition of the Fund’s top holdings is subject to change. Performance figures are historical and reflect the change in share price, reinvested distributions, changes in net asset value, sales charges and capital gains distributions, if any.
Not FDIC Insured – No Bank Guarantee – May Lose Value
Investing in China, Hong Kong and Taiwan involves risk and considerations not present when investing in more established securities markets. The Fund may be more susceptible to the economic, market, political and local risks of these regions than a fund that is more geographically diversified.
Top Ten Holdings (as a % of Net Assets) †
| Tencent Holdings, Ltd. | 18.72% |
| Alibaba Group Holding, Ltd. | 13.15% |
| China Construction Bank Corp. | 6.95% |
| Ping An Insurance Group Co. of China, Ltd. | 5.95% |
| Industrial & Commercial Bank of China, Ltd. | 4.89% |
| Baidu, Inc. | 4.28% |
| Bank of China, Ltd. | 3.59% |
| China Mobile, Ltd. | 3.27% |
| Altaba, Inc. | 2.68% |
| Taiwan Semiconductor Manufacturing Co., Ltd. | 2.30% |
| Top Ten Holdings | 65.78% |
| † | Holdings are subject to change, and may not reflect the current or future position of the portfolio. Table presents indicative values only. Excludes cash & cash equivalents. |
Industry Sector Allocation (as a % of Net Assets)

94 | October 31, 2017
Clough China Fund
| Statement of Investments | October 31, 2017 |
| Shares | Value (Note 2) | |||||||
| COMMON STOCKS (93.15%) | ||||||||
| Communications (9.40%) | ||||||||
| Media (6.13%) | ||||||||
| Baidu, Inc., Sponsored ADR(a) | 10,400 | $ | 2,536,976 | |||||
| Ctrip.com International, Ltd., ADR(a) | 22,875 | 1,095,484 | ||||||
| 3,632,460 | ||||||||
| Telecommunication (3.27%) | ||||||||
| China Mobile, Ltd. | 193,000 | 1,941,265 | ||||||
| TOTAL COMMUNICATIONS | 5,573,725 | |||||||
| Consumer Discretionary (24.80%) | ||||||||
| Automotive (3.18%) | ||||||||
| BYD Co., Ltd., Class H | 121,000 | 1,057,992 | ||||||
| Guangzhou Automobile Group Co., Ltd., Class H | 334,000 | 830,598 | ||||||
| 1,888,590 | ||||||||
| Gaming, Lodging & Restaurants (2.77%) | ||||||||
| Galaxy Entertainment Group, Ltd., Class L | 109,000 | 743,312 | ||||||
| Sands China, Ltd. | 190,800 | 900,126 | ||||||
| 1,643,438 | ||||||||
| Home & Office Products (0.52%) | ||||||||
| Man Wah Holdings, Ltd. | 342,000 | 308,980 | ||||||
| Retail - Discretionary (18.33%) | ||||||||
| Alibaba Group Holding, Ltd., Sponsored ADR(a) | 42,200 | 7,802,358 | ||||||
| Altaba, Inc.(a) | 22,700 | 1,591,724 | ||||||
| Anta Sports Products, Ltd. | 44,000 | 196,806 | ||||||
| JD.com, Inc., ADR(a) | 34,200 | 1,283,184 | ||||||
| 10,874,072 | ||||||||
| TOTAL CONSUMER DISCRETIONARY | 14,715,080 | |||||||
| Energy (0.98%) | ||||||||
| Oil, Gas & Coal (0.98%) | ||||||||
| China Shenhua Energy Co., Ltd., Class H | 243,000 | 581,322 | ||||||
| TOTAL ENERGY | 581,322 | |||||||
| Financials (27.14%) | ||||||||
| Banking (16.90%) | ||||||||
| Agricultural Bank of China, Ltd., Class H | 1,849,000 | 870,867 | ||||||
| Bank of China, Ltd., Class H | 4,258,437 | 2,128,209 | ||||||
| China Construction Bank Corp., Class H | 4,614,080 | 4,123,676 | ||||||
| Shares | Value (Note 2) | |||||||
| Banking (continued) | ||||||||
| Industrial & Commercial Bank of China, Ltd., Class H | 3,643,967 | $ | 2,899,378 | |||||
| 10,022,130 | ||||||||
| Insurance (8.03%) | ||||||||
| China Life Insurance Co., Ltd., Class H | 371,000 | 1,229,977 | ||||||
| Ping An Insurance Group Co. of China, Ltd., Class H | 402,000 | 3,532,754 | ||||||
| 4,762,731 | ||||||||
| Real Estate (2.21%) | ||||||||
| China Resources Land, Ltd. | 440,000 | 1,313,174 | ||||||
| TOTAL FINANCIALS | 16,098,035 | |||||||
| Health Care (0.79%) | ||||||||
| Health Care Facilities & Services (0.79%) | ||||||||
| Sinopharm Group Co., Ltd., Class H | 105,200 | 471,034 | ||||||
| TOTAL HEALTH CARE | 471,034 | |||||||
| Industrials (0.78%) | ||||||||
| Engineering & Construction Services (0.78%) | ||||||||
| China Communications Construction Co., Ltd., Class H | 381,000 | 462,762 | ||||||
| TOTAL INDUSTRIALS | 462,762 | |||||||
| Materials (0.65%) | ||||||||
| Construction Materials (0.36%) | ||||||||
| Anhui Conch Cement Co., Ltd., Class H | 50,000 | 214,185 | ||||||
| Metals & Mining (0.29%) | ||||||||
| Zijin Mining Group Co., Ltd., Class H | 490,000 | 169,569 | ||||||
| TOTAL MATERIALS | 383,754 | |||||||
| Technology (28.61%) | ||||||||
| Design, Manufacturing & Distribution (2.70%) | ||||||||
| Foxconn Technology Co., Ltd. | 181,000 | 577,292 | ||||||
| Hon Hai Precision Industry Co., Ltd. | 276,000 | 1,025,877 | ||||||
| 1,603,169 | ||||||||
| Hardware (2.45%) | ||||||||
| AAC Technologies Holdings, Inc. | 31,000 | 568,451 | ||||||
| Silergy Corp. | 20,000 | 431,975 | ||||||
| Sunny Optical Technology Group Co., Ltd. | 31,000 | 454,690 | ||||||
| 1,455,116 | ||||||||
95 | October 31, 2017
Clough China Fund
| Statement of Investments | October 31, 2017 |
| Shares | Value (Note 2) | |||||||
| Semiconductors (3.05%) | ||||||||
| Taiwan Semiconductor Manufacturing Co., Ltd., Sponsored ADR | 32,300 | $ | 1,367,259 | |||||
| Win Semiconductors Corp. | 54,000 | 442,404 | ||||||
| 1,809,663 | ||||||||
| Software (19.48%) | ||||||||
| NetEase, Inc., ADR | 1,600 | 451,072 | ||||||
| Tencent Holdings, Ltd. | 247,100 | 11,105,936 | ||||||
| 11,557,008 | ||||||||
| Technology Services (0.93%) | ||||||||
| Baozun, Inc., Sponsored ADR(a) | 17,500 | 549,325 | ||||||
| TOTAL TECHNOLOGY | 16,974,281 | |||||||
| TOTAL COMMON STOCKS | ||||||||
(Cost $33,745,549) | 55,259,993 | |||||||
| PARTICIPATION NOTES (5.27%) | ||||||||
| Consumer Discretionary (2.70%) | ||||||||
| Automotive (0.62%) | ||||||||
| SAIC Motor Corp., Ltd., Class A (Loan Participation Notes issued by Morgan Stanley Asia Products), expiring 02/23/18(b) | 77,200 | 366,887 | ||||||
| Home & Office Products (2.08%) | ||||||||
| Midea Group Co., Ltd., Class A (Loan Participation Notes issued by Morgan Stanley Asia Products), expiring 5/13/19(b) | 160,300 | 1,233,829 | ||||||
| TOTAL CONSUMER DISCRETIONARY | 1,600,716 | |||||||
| Consumer Staples (1.04%) | ||||||||
| Consumer Products (1.04%) | ||||||||
| Kweichow Moutai Co., Ltd., Class A (Loan Participation Notes issued by Morgan Stanley Asia Products), expiring 11/09/17(b) | 6,600 | 615,782 | ||||||
| TOTAL CONSUMER STAPLES | 615,782 | |||||||
| Shares | Value (Note 2) | |||||||
| Industrials (1.53%) | ||||||||
| Electrical Equipment (1.53%) | ||||||||
| Gree Electric Appliances, Inc., Class A (Loan Participation Notes issued by Morgan Stanley Asia Products), expiring 02/16/18(b) | 141,400 | $ | 908,744 | |||||
| TOTAL INDUSTRIALS | 908,744 | |||||||
| TOTAL PARTICIPATION NOTES | ||||||||
| (Cost $1,970,469) | 3,125,242 | |||||||
| TOTAL INVESTMENTS (98.42%) | ||||||||
| (Cost $35,716,018) | $ | 58,385,235 | ||||||
| Other Assets In Excess Of Liabilities (1.58%) | 939,184 | |||||||
| NET ASSETS (100.00%) | $ | 59,324,419 | ||||||
| (a) | Non-Income Producing Security. |
| (b) | Security exempt from registration under Rule 144A of the Securities Act of 1933. This security may be resold in transactions exempt from registration, normally to qualified institutional buyers. As of October 31, 2017, the aggregate market value of those securities was $3,125,242, representing 5.27% of net assets. |
For Fund compliance purposes, the Fund’s industry classifications refer to any one or more of the industry sub-classifications used by one or more widely recognized market indexes or ratings group indexes, and/or as defined by Fund management. This definition may not apply for purposes of this report, which may combine industry sub-classifications for reporting ease. Industries are shown as a percent of net assets.
See Notes to Financial Statements.
96 | October 31, 2017
Clough China Fund
| Statement of Assets and Liabilities | October 31, 2017 |
| ASSETS | ||||
| Investments, at value | $ | 58,385,235 | ||
| Foreign currency, at value (Cost $1,320,810) | 1,317,648 | |||
| Receivable for investments sold | 2,659,875 | |||
| Receivable for shares sold | 537 | |||
| Prepaid expenses and other assets | 7,132 | |||
| Total Assets | 62,370,427 | |||
| LIABILITIES | ||||
| Payable for investments purchased | 1,053,594 | |||
| Payable for shares redeemed | 3,565 | |||
| Payable due to custodian - overdraft | 1,864,013 | |||
| Investment advisory fees payable | 56,732 | |||
| Administration and transfer agency fees payable | 19,074 | |||
| Distribution and services fees payable | 9,444 | |||
| Trustees’ fees and expenses payable | 10 | |||
| Professional fees payable | 27,404 | |||
| Accrued expenses and other liabilities | 12,172 | |||
| Total Liabilities | 3,046,008 | |||
| NET ASSETS | $ | 59,324,419 | ||
| NET ASSETS CONSIST OF | ||||
| Paid-in capital | $ | 42,255,129 | ||
| Accumulated net investment income | 204,393 | |||
| Accumulated net realized loss | (5,800,381 | ) | ||
| Net unrealized appreciation | 22,665,278 | |||
| NET ASSETS | $ | 59,324,419 | ||
| INVESTMENTS, AT COST | $ | 35,716,018 | ||
| PRICING OF SHARES | ||||
| Class A: | ||||
| Net Asset Value, offering and redemption price per share | $ | 27.22 | ||
| Net Assets | $ | 17,523,234 | ||
| Shares of beneficial interest outstanding (unlimited number of shares, no par value common stock authorized) | 643,670 | |||
| Maximum offering price per share ((NAV/0.9450), based on maximum sales charge of 5.50% of the offering price) | $ | 28.80 | ||
| Class C: | ||||
| Net Asset Value, offering and redemption price per share(a) | $ | 25.80 | ||
| Net Assets | $ | 6,610,193 | ||
| Shares of beneficial interest outstanding (unlimited number of shares, no par value common stock authorized) | 256,190 | |||
| Class I: | ||||
| Net Asset Value, offering and redemption price per share | $ | 27.92 | ||
| Net Assets | $ | 35,190,992 | ||
| Shares of beneficial interest outstanding (unlimited number of shares, no par value common stock authorized) | 1,260,589 | |||
| (a) | Redemption price per share may be reduced for any applicable contingent deferred sales charge. For a description of a possible sales charge, please see the Fund’s Prospectus. |
See Notes to Financial Statements.
97 | October 31, 2017
Clough China Fund
| Statement of Operations | For the Year Ended October 31, 2017 |
| INVESTMENT INCOME | ||||
| Dividends | $ | 1,376,860 | ||
| Foreign taxes withheld on dividends | (118,186 | ) | ||
| Total Investment Income | 1,258,674 | |||
| EXPENSES | ||||
| Investment advisory fees | 742,537 | |||
| Administrative fees | 97,062 | |||
| Transfer agency fees | 41,159 | |||
| Distribution and service fees | ||||
| Class A | 42,042 | |||
| Class C | 67,096 | |||
| Professional fees | 28,854 | |||
| Reports to shareholders and printing fees | 13,743 | |||
| State registration fees | 41,046 | |||
| Insurance fees | 527 | |||
| Custody fees | 23,875 | |||
| Trustees’ fees and expenses | 1,276 | |||
| Miscellaneous expenses | 11,996 | |||
| Total Expenses | 1,111,213 | |||
| Less fees waived/reimbursed by investment advisor (Note 8) | ||||
| Class A | (17,364 | ) | ||
| Class C | (9,896 | ) | ||
| Class I | (39,485 | ) | ||
| Net Expenses | 1,044,468 | |||
| Net Investment Income | 214,206 | |||
| Net realized gain on investments | 3,300,704 | |||
| Net realized loss on foreign currency transactions | (10,436 | ) | ||
| Net Realized Gain | 3,290,268 | |||
| Net change in unrealized appreciation on investments | 10,379,688 | |||
| Net change in unrealized depreciation on translation of assets and liabilities denominated in foreign currencies | (18,347 | ) | ||
| Net Change in Unrealized Appreciation | 10,361,341 | |||
| NET REALIZED AND UNREALIZED GAIN ON INVESTMENTS | 13,651,609 | |||
| NET INCREASE IN NET ASSETS RESULTING FROM OPERATIONS | $ | 13,865,815 | ||
See Notes to Financial Statements.
98 | October 31, 2017
Clough China Fund
Statements of Changes in Net Assets
| For the Year Ended October 31, 2017 | For the Year Ended October 31, 2016 | |||||||
| OPERATIONS | ||||||||
| Net investment income | $ | 214,206 | $ | 138,734 | ||||
| Net realized gain/(loss) | 3,290,268 | (5,173,658 | ) | |||||
| Net change in unrealized appreciation | 10,361,341 | 2,922,683 | ||||||
| Net Increase/(Decrease) in Net Assets Resulting from Operations | 13,865,815 | (2,112,241 | ) | |||||
| DISTRIBUTIONS | ||||||||
| Dividends to shareholders from net investment income | ||||||||
| Class A | (16,170 | ) | (356,689 | ) | ||||
| Class C | – | (65,110 | ) | |||||
| Class I | (86,942 | ) | (620,111 | ) | ||||
| Net Decrease in Net Assets from Distributions | (103,112 | ) | (1,041,910 | ) | ||||
| BENEFICIAL INTEREST TRANSACTIONS (NOTE 6) | ||||||||
| Shares sold | ||||||||
| Class A | 1,280,383 | 1,548,407 | ||||||
| Class C | 139,824 | 662,919 | ||||||
| Class I | 2,433,441 | 6,343,930 | ||||||
| Dividends reinvested | ||||||||
| Class A | 10,603 | 245,993 | ||||||
| Class C | – | 30,159 | ||||||
| Class I | 58,387 | 378,863 | ||||||
| Shares redeemed, net of redemption fees | ||||||||
| Class A | (6,308,325 | ) | (7,478,273 | ) | ||||
| Class C | (3,463,943 | ) | (2,289,444 | ) | ||||
| Class I | (8,903,595 | ) | (9,416,949 | ) | ||||
| Net Decrease in Net Assets Derived from Beneficial Interest Transactions | (14,753,225 | ) | (9,974,395 | ) | ||||
| Net decrease in net assets | (990,522 | ) | (13,128,546 | ) | ||||
| NET ASSETS | ||||||||
| Beginning of year | 60,314,941 | 73,443,487 | ||||||
| End of year * | $ | 59,324,419 | $ | 60,314,941 | ||||
| *Including accumulated net investment income of: | $ | 204,393 | $ | 103,102 | ||||
See Notes to Financial Statements.
99 | October 31, 2017
Clough China Fund – Class A
Financial Highlights
Selected data for a share of beneficial interest outstanding throughout the periods indicated:
| For the Year Ended October 31, 2017 | For the Year Ended October 31, 2016 | For the Year Ended October 31, 2015 | For the Fiscal Period Ended October 31, 2014(a) | For the Year Ended April 30, 2014 | For the Year Ended April 30, 2013 | |||||||||||||||||||
| Net asset value, beginning of period | $ | 21.07 | $ | 21.74 | $ | 23.50 | $ | 20.72 | $ | 21.45 | $ | 18.43 | ||||||||||||
| INCOME/(LOSS) FROM INVESTMENT OPERATIONS: | ||||||||||||||||||||||||
| Net investment income(b) | 0.08 | 0.04 | 0.12 | 0.45 | 0.12 | 0.15 | ||||||||||||||||||
| Net realized and unrealized gain/(loss) | 6.09 | (0.40 | ) | (0.92 | ) | 2.33 | (0.69 | ) | 2.90 | |||||||||||||||
| Total from investment operations | 6.17 | (0.36 | ) | (0.80 | ) | 2.78 | (0.57 | ) | 3.05 | |||||||||||||||
| DISTRIBUTIONS: | ||||||||||||||||||||||||
| From net investment income | (0.02 | ) | (0.31 | ) | (0.50 | ) | – | (0.17 | ) | (0.03 | ) | |||||||||||||
| From net realized gains | – | – | (0.46 | ) | – | – | – | |||||||||||||||||
| Total distributions | (0.02 | ) | (0.31 | ) | (0.96 | ) | – | (0.17 | ) | (0.03 | ) | |||||||||||||
| REDEMPTION FEES ADDED TO PAID-IN CAPITAL (NOTE 6) | – | 0.00 | (c) | 0.00 | (c) | 0.00 | (c) | 0.01 | 0.00 | (c) | ||||||||||||||
| Net increase/(decrease) in net asset value | 6.15 | (0.67 | ) | (1.76 | ) | 2.78 | (0.73 | ) | 3.02 | |||||||||||||||
| Net asset value, end of year | $ | 27.22 | $ | 21.07 | $ | 21.74 | $ | 23.50 | $ | 20.72 | $ | 21.45 | ||||||||||||
| TOTAL RETURN(d) | 29.32 | % | (1.61 | )% | (3.49 | )% | 13.42 | % | (2.69 | )% | 16.54 | % | ||||||||||||
| RATIOS/SUPPLEMENTAL DATA: | ||||||||||||||||||||||||
| Net assets, end of year (000s) | $ | 17,523 | $ | 18,358 | $ | 25,276 | $ | 30,526 | $ | 31,164 | $ | 32,709 | ||||||||||||
| Ratio of expenses to average net assets excluding fee waivers and reimbursements | 2.05 | % | 2.04 | % | 1.98 | % | 2.06 | %(e) | 2.06 | % | 2.14 | % | ||||||||||||
| Ratio of expenses to average net assets including fee waivers and reimbursements | 1.95 | % | 1.95 | % | 1.95 | % | 1.95 | %(e) | 1.95 | % | 1.95 | % | ||||||||||||
| Ratio of net investment income to average net assets | 0.34 | % | 0.18 | % | 0.50 | % | 3.96 | %(e) | 0.55 | % | 0.78 | % | ||||||||||||
| Portfolio turnover rate(f) | 71 | % | 126 | % | 193 | % | 76 | % | 232 | % | 221 | % | ||||||||||||
| (a) | Effective May 1, 2014, the Board approved changing the fiscal year-end of the Funds from April 30 to October 31. |
| (b) | Calculated using the average shares method. |
| (c) | Less than $0.005 or ($0.005) per share. |
| (d) | Total returns are for the period indicated and have not been annualized. Total returns would have been lower had certain expenses not been waived during the period. Returns shown do not reflect the deduction of taxes that a shareholder would pay on Fund distributions or the redemption of Fund shares. Returns shown exclude any applicable sales charges. |
| (e) | Annualized. |
| (f) | Portfolio turnover rate for periods less than one full year have not been annualized. |
See Notes to Financial Statements.
100 | October 31, 2017
Clough China Fund – Class C
Financial Highlights
Selected data for a share of beneficial interest outstanding throughout the periods indicated:
| For the Year Ended October 31, 2017 | For the Year Ended October 31, 2016 | For the Year Ended October 31, 2015 | For the Fiscal Period Ended October 31, 2014(a) | For the Year Ended April 30, 2014 | For the Year Ended April 30, 2013 | |||||||||||||||||||
| Net asset value, beginning of period | $ | 20.10 | $ | 20.72 | $ | 22.53 | $ | 19.94 | $ | 20.71 | $ | 17.90 | ||||||||||||
| INCOME/(LOSS) FROM INVESTMENT OPERATIONS: | ||||||||||||||||||||||||
| Net investment income/(loss)(b) | (0.12 | )(c) | (0.10 | ) | (0.04 | ) | 0.33 | (0.02 | ) | 0.01 | ||||||||||||||
| Net realized and unrealized gain/(loss) | 5.82 | (0.39 | ) | (0.89 | ) | 2.26 | (0.68 | ) | 2.80 | |||||||||||||||
| Total from investment operations | 5.70 | (0.49 | ) | (0.93 | ) | 2.59 | (0.70 | ) | 2.81 | |||||||||||||||
| DISTRIBUTIONS: | ||||||||||||||||||||||||
| From net investment income | – | (0.13 | ) | (0.42 | ) | – | (0.07 | ) | – | |||||||||||||||
| From net realized gains | – | – | (0.46 | ) | – | – | – | |||||||||||||||||
| Total distributions | – | (0.13 | ) | (0.88 | ) | – | (0.07 | ) | – | |||||||||||||||
| REDEMPTION FEES ADDED TO PAID-IN CAPITAL (NOTE 6) | 0.00 | (d) | 0.00 | (d) | 0.00 | (d) | 0.00 | (d) | 0.00 | (d) | 0.00 | (d) | ||||||||||||
| Net increase/(decrease) in net asset value | 5.70 | (0.62 | ) | (1.81 | ) | 2.59 | (0.77 | ) | 2.81 | |||||||||||||||
| Net asset value, end of year | $ | 25.80 | $ | 20.10 | $ | 20.72 | $ | 22.53 | $ | 19.94 | $ | 20.71 | ||||||||||||
| TOTAL RETURN(e) | 28.36 | % | (2.34 | )% | (4.25 | )% | 12.99 | % | (3.43 | )% | 15.70 | % | ||||||||||||
| RATIOS/SUPPLEMENTAL DATA: | ||||||||||||||||||||||||
| Net assets, end of year (000s) | $ | 6,610 | $ | 8,352 | $ | 10,395 | $ | 11,575 | $ | 10,866 | $ | 12,251 | ||||||||||||
| Ratio of expenses to average net assets excluding fee waivers and reimbursements | 2.85 | % | 2.83 | % | 2.78 | % | 2.87 | %(f) | 2.86 | % | 2.94 | % | ||||||||||||
| Ratio of expenses to average net assets including fee waivers and reimbursements | 2.70 | % | 2.70 | % | 2.70 | % | 2.70 | %(f) | 2.70 | % | 2.70 | % | ||||||||||||
| Ratio of net investment income/(loss) to average net assets | (0.54 | )% | (0.52 | )% | (0.18 | )% | 3.08 | %(f) | (0.09 | )% | 0.07 | % | ||||||||||||
| Portfolio turnover rate(g) | 71 | % | 126 | % | 193 | % | 76 | % | 232 | % | 221 | % | ||||||||||||
| (a) | Effective May 1, 2014, the Board approved changing the fiscal year-end of the Funds from April 30 to October 31. |
| (b) | Calculated using the average shares method. |
| (c) | The per share amount does not correspond to activity reflected in the Statement of Operations due to class specific expenses during the period. |
| (d) | Less than $0.005 or ($0.005) per share. |
| (e) | Total returns are for the period indicated and have not been annualized. Total returns would have been lower had certain expenses not been waived during the period. Returns shown do not reflect the deduction of taxes that a shareholder would pay on Fund distributions or the redemption of Fund shares. Returns shown exclude any applicable sales charges. |
| (f) | Annualized. |
| (g) | Portfolio turnover rate for periods less than one full year have not been annualized. |
See Notes to Financial Statements.
101 | October 31, 2017
Clough China Fund – Class I
Financial Highlights
Selected data for a share of beneficial interest outstanding throughout the periods indicated:
| For the Year Ended October 31, 2017 | For the Year Ended October 31, 2016 | For the Year Ended October 31, 2015 | For the Fiscal Period Ended October 31, 2014(a) | For the Year Ended April 30, 2014 | For the Year Ended April 30, 2013 | |||||||||||||||||||
| Net asset value, beginning of period | $ | 21.60 | $ | 22.28 | $ | 23.97 | $ | 21.11 | $ | 21.82 | $ | 18.71 | ||||||||||||
| INCOME/(LOSS) FROM INVESTMENT OPERATIONS: | ||||||||||||||||||||||||
| Net investment income(b) | 0.15 | 0.09 | 0.23 | 0.45 | 0.19 | 0.13 | ||||||||||||||||||
| Net realized and unrealized gain/(loss) | 6.23 | (0.39 | ) | (1.00 | ) | 2.41 | (0.69 | ) | 3.02 | |||||||||||||||
| Total from investment operations | 6.38 | (0.30 | ) | (0.77 | ) | 2.86 | (0.50 | ) | 3.15 | |||||||||||||||
| DISTRIBUTIONS: | ||||||||||||||||||||||||
| From net investment income | (0.06 | ) | (0.38 | ) | (0.53 | ) | – | (0.21 | ) | (0.06 | ) | |||||||||||||
| From net realized gains | – | – | (0.46 | ) | – | – | – | |||||||||||||||||
| Total distributions | (0.06 | ) | (0.38 | ) | (0.99 | ) | – | (0.21 | ) | (0.06 | ) | |||||||||||||
| REDEMPTION FEES ADDED TO PAID-IN CAPITAL (NOTE 6) | 0.00 | (c) | 0.00 | (c) | 0.07 | 0.00 | (c) | 0.00 | (c) | 0.02 | ||||||||||||||
| Net increase/(decrease) in net asset value | 6.32 | (0.68 | ) | (1.69 | ) | 2.86 | (0.71 | ) | 3.11 | |||||||||||||||
| Net asset value, end of year | $ | 27.92 | $ | 21.60 | $ | 22.28 | $ | 23.97 | $ | 21.11 | $ | 21.82 | ||||||||||||
| TOTAL RETURN(d) | 29.64 | % | (1.31 | )% | (2.99 | )% | 13.55 | % | (2.41 | )% | 16.95 | % | ||||||||||||
| RATIOS/SUPPLEMENTAL DATA: | ||||||||||||||||||||||||
| Net assets, end of year (000s) | $ | 35,191 | $ | 33,605 | $ | 37,772 | $ | 39,917 | $ | 33,435 | $ | 25,972 | ||||||||||||
| Ratio of expenses to average net assets excluding fee waivers and reimbursements | 1.83 | % | 1.82 | % | 1.77 | % | 1.82 | %(e) | 1.81 | % | 1.94 | % | ||||||||||||
| Ratio of expenses to average net assets including fee waivers and reimbursements | 1.70 | % | 1.70 | % | 1.70 | % | 1.70 | %(e) | 1.70 | % | 1.70 | % | ||||||||||||
| Ratio of net investment income to average net assets | 0.61 | % | 0.46 | % | 0.95 | % | 3.89 | %(e) | 0.83 | % | 0.69 | % | ||||||||||||
| Portfolio turnover rate(f) | 71 | % | 126 | % | 193 | % | 76 | % | 232 | % | 221 | % | ||||||||||||
| (a) | Effective May 1, 2014, the Board approved changing the fiscal year-end of the Funds from April 30 to October 31. |
| (b) | Calculated using the average shares method. |
| (c) | Less than $0.005 or ($0.005) per share. |
| (d) | Total returns are for the period indicated and have not been annualized. Total returns would have been lower had certain expenses not been waived during the period. Returns shown do not reflect the deduction of taxes that a shareholder would pay on Fund distributions or the redemption of Fund shares. |
| (e) | Annualized. |
| (f) | Portfolio turnover rate for periods less than one full year have not been annualized. |
See Notes to Financial Statements.
102 | October 31, 2017
RiverFront Global Allocation Series
| Management Commentary | October 31, 2017 (Unaudited) |
Overview:
The past twelve months may have been marked by different headlines than those of the previous year, but the underlying macro themes have felt somewhat like watching television re-runs. Over the time period, we have experienced a US presidential election, escalating tensions with North Korea, and natural disasters domestically. None of these events, as concerning as they have been, have managed to overshadow investor focus on themes such as the global economic recovery, the path of interest rates and potential central bank activity. Nor have they been able to derail the upward trajectory of the global markets.
From the perspective of portfolio positioning, we have made few changes at the broad asset class level over the past year. We continue to favor equities over fixed income. Within our equity allocation, our Price Matters® framework continues to point to international equities as being more attractively valued than US based equities. As such, throughout the year, we have reduced exposures to US large cap equities and redirected those funds to developed international. Additionally, we have increased exposure to emerging market equities in most of our strategies. Finally, we repositioned our fixed income holdings to include less high yield and have increased overall duration, somewhat, relative to the benchmark.
While non-US stock markets have outperformed the US markets for much of the past year, we believe the outperformance of international markets relative to the US may be only in the early stages. Part of our opinion is underpinned by the belief that we are in the midst of a very positive economic landscape with accelerating global growth and stable low inflation. We believe that we are seeing signs of sustained improved earnings and economic growth outside of the US. While investors have become accustomed to a growing trend of US corporate earnings through the 8-plus year bull market, consistent growth in developed and emerging markets has been much more fleeting. However, that appears to be changing, in our view. In all major regions of the world (Japan, Europe, US and emerging markets), year-over-year earnings growth in calendar 2017 is shaping up to be meaningfully positive. We believe this is a milestone. Our believe in the sustainability of this positive earnings trend in international markets is strengthened in part because the ‘top line’ (revenue growth) in most areas is improving as well, suggesting that the positive bottom line trends we are seeing are being driven by actual improving business trends and not just ‘financial engineering’ (moves like share reduction, cost cutting, and/or aggressive accounting treatment). This is consistent with an economy in secular rebound mode, with business and consumer confidence continuing to improve.
With the rally in the markets to date, we continue to get questions as to our belief in the sustainability of this year-long relative rally in international markets relative to the US – i.e., has the international rally come too far, too fast? We think not. While some of the US Dollar weakness may have slowed the ascent of FX-driven earnings boosts for international companies, the strengthening of Eurozone and emerging market currencies represents a lowering of the political and economic risks associated with them… an overall positive for the equity markets. We also believe that European and Asian central banks will remain generally accommodative; a stance
that seems confirmed as economic data such as inflation rates flows out of these regions.
Performance Discussion for the Conservative Income Builder and Moderate Growth & Income Funds:
The RiverFront Conservative Income Builder and Moderate Growth & Income Funds are managed using the same overarching process which is based on our Price Matters® framework. This framework allows the investment managers to develop investment themes that span across the various asset classes in which the funds are invested. As a result, these funds hold substantially the same securities, but the target asset class allocations differ depending on the investment time horizon for each. This results in the performance drivers being the same. In the case of the Conservative Income Builder Fund, the allocation is 30% equities and 70% fixed income. The Moderate Growth & Income Fund is managed to a targeted allocation of 50% equities and 50% fixed income. The RiverFront investment managers have the flexibility to make allocations that differ from the benchmark.
In discussing the performance for the RiverFront Funds, it’s important to keep in mind their target global allocation mandate. All of the RiverFront offerings have exposure to multi-cap, global equities; our balanced funds have the addition of fixed income. The table below illustrates the disparity of returns across the major indices during the most recent quarter, which resulted in varying degrees of relative performance when compared to the traditional single index, mutual fund benchmark.
| Benchmark Indexes | 1 Year Returns (11/1/2016-10/31/2017) |
| S&P 500 Total Return | 23.63% |
| S&P 1000 Total Return | 24.82% |
| MSCI EAFE (Net) | 23.44% |
| MSCI Emerging Markets (Net) | 26.45% |
| MSCI All Country World Index (Net) | 23.20% |
| Barclays US Aggregate | 0.90% |
| BofAML US HY Master II Total Return | 9.14% |
| Barclays US Treasury Index | -0.69% |
| Barclays US Short Treasury Index (1-3M) | 0.69% |
Data as of 10/31/2017
| * | For index definitions see footnotes at the end of the Management Commentary and below the performance data on the following pages. |
| ** | For a complete presentation of RiverFront Mutual Fund and relevant benchmark performance, please refer to the Performance Update on the following pages. |
Conservative Income Builder:
Contributors:
| ● | The preference for equities over fixed income impacted fund performance positively. |
| ● | The allocation to developed international equities had a positive allocation impact on fund performance. |
103 | October 31, 2017
RiverFront Global Allocation Series
| Management Commentary | October 31, 2017 (Unaudited) |
Detractors:
| ● | While the underweight allocation to fixed income, relative to the composite benchmark, impacted performance positively there was some offset from negative security selection. Specifically, our preference for shorter duration securities had a negative impact on performance. |
| ● | The allocation to MLPs impacted performance negatively. Contrary to our expectations, as oil prices have come under pressure, MLPs underperformed our expectations. |
| ● | The underweights to technology impacted fund performance negatively. |
Moderate Growth & Income:
Contributors:
| ● | The preference for equities over fixed income impacted portfolio performance positively. |
| ● | The allocation to international equities had a positive allocation impact on fund performance. |
Detractors:
| ● | While the underweight allocation to fixed income, relative to the composite benchmark, impacted performance positively there was some offset from negative security selection. Specifically, our preference for shorter duration securities had a negative impact on performance. |
| ● | The allocation to MLPs impacted performance negatively. Contrary to our expectations, as oil prices have come under pressure, MLPs underperformed our expectations. |
| ● | The fund was negatively impacted by security selection within the telecommunications and technology sectors. |
Performance Discussion for the Global Growth, Global Allocation and Dynamic Equity Income Funds:
The RiverFront Global Growth, Global Allocation and Dynamic Equity Income Funds are managed using the same overarching process which is based on our Price Matters® framework. This framework allows the investment managers to develop investment themes that span across the various asset classes in which the funds are invested. As a result, these funds hold substantially the same securities, but the asset class allocations differ depending on the investment time horizon for each. This results in the performance drivers being the same. In the case of the Dynamic Equity Income Fund, the allocation is 70% equities and 30% fixed income. The Global Allocation fund is managed to a targeted allocation of 80% equities and 20% fixed income. The Global Growth fund is 100% equity. The RiverFront investment managers have the flexibility to make allocations that differ from the benchmark.
In discussing the performance for the RiverFront Funds, it’s important to keep in mind their target global allocation mandate. All of the RiverFront offerings have exposure to multi-cap, global equities; our balanced funds have the addition of fixed income. The table below illustrates the disparity of returns across the major indices during the most recent quarter, which resulted in varying degrees of relative performance when compared to the traditional single index, mutual fund benchmark.
| Benchmark Indexes | 1 Year Returns (11/1/2016-10/31/2017) |
| S&P 500 Total Return | 23.63% |
| S&P 1000 Total Return | 24.82% |
| MSCI EAFE (Net) | 23.44% |
| MSCI Emerging Markets (Net) | 26.45% |
| MSCI All Country World Index (Net) | 23.20% |
| Barclays US Aggregate | 0.90% |
| BofAML US HY Master II Total Return | 9.14% |
| Barclays US Treasury Index | -0.69% |
| Barclays US Short Treasury Index (1-3M) | 0.69% |
Data as of 10/31/2017
| * | For index definitions see footnotes at the end of the Management Commentary and below the performance data on the following pages. |
| ** | For a complete presentation of RiverFront Mutual Fund and relevant benchmark performance, please refer to the Performance Update on the following pages. |
Dynamic Equity Income:
Contributors:
| ● | The preference for equities over fixed income impacted performance positively. |
| ● | The overweight to international equities, both developed international and emerging markets, relative to the benchmark led to a positive allocation impact. |
| ● | Performance was impacted by positive security selection within technology. |
Detractors:
| ● | While the underweight allocation to fixed income, relative to the composite benchmark, impacted performance positively there was some offset from negative security selection. Specifically, our preference for shorter duration securities had a negative impact on performance. |
| ● | The allocation to MLPs impacted performance negatively as this group continued to underperform the broad market as well as the energy sector. |
| ● | Cash, at a slightly above average level, impacted performance negatively. |
Global Allocation:
Contributors:
| ● | The preference for equities over fixed income impacted performance positively. |
| ● | The preference for international equities, both developed international and emerging markets, over US equities led to a positive allocation impact. |
| ● | Performance was impacted by positive security selection within technology. |
104 | October 31, 2017
RiverFront Global Allocation Series
| Management Commentary | October 31, 2017 (Unaudited) |
Detractors:
| ● | Within fixed income, our preference for shorter duration securities had a negative impact on performance. |
| ● | The allocation to MLPs impacted performance negatively as this group continued to underperform the broad market as well as the energy sector. |
| ● | The fund was negatively impacted by security selection within the telecommunications sector. |
Global Growth:
Contributors:
| ● | The preference for international equities over US equities led to a positive allocation impact. |
| ● | Performance was impacted by positive security selection within technology as we benefitted by having exposure to internet retailing and having less exposure to media. |
Detractors:
| ● | The allocation to MLPs impacted performance negatively as this group continued to underperform the broad market as well as the energy sector. |
| ● | The fund was negatively impacted by security selection within the telecommunications sector. |
| ● | While at minimal levels, cash proved to be somewhat of a drag on performance when measured against a positive equity market environment. |
Michael Jones, CFA
Co-Portfolio Manager
Doug Sandler, CFA
Co-Portfolio Manager
Adam Grossman, CFA
Co-Portfolio Manager
Kevin Nicholson, CFA
Co-Portfolio Manager
Tim Anderson, CFA
Co-Portfolio Manager
Past performance is no guarantee of future results. Dividends are not guaranteed and are subject to change or elimination. Investments in international and emerging markets securities include exposure to risks such as currency fluctuations, foreign taxes and regulations, and the potential for illiquid markets and political instability.
The views of the author and information discussed in this commentary are as of the date of publication, are subject to change, and may not reflect the writer’s current views. The views expressed are those of the author only, and represent an assessment of market conditions at a specific point in time, are opinions only and should not be relied upon as investment advice regarding a particular investment or markets in general. Such information does not constitute a recommendation to buy or sell specific securities or investment vehicles. It should not be assumed that any investment will be profitable or will equal the performance of the fund(s) or any securities or any sectors mentioned in this letter. The subject matter contained in this letter has been derived from several sources believed to be reliable and accurate at the time of compilation. Neither ALPS Advisors, Inc., RiverFront Investment Group, LLC, nor the Funds accepts any liability for losses either direct or consequential caused by the use of this information.
The S&P 1000® Index combines the S&P MidCap 400® and the S&P SmallCap 600® to form an investable benchmark for the mid- to small-cap segment of the U.S. equity market.
The MSCI EAFE Index is recognized as the pre-eminent benchmark in the United States to measure international equity performance. It comprises the MSCI country indices that represent developed markets outside of North America: Europe, Australasia and the Far East.
The MSCI Emerging Markets Index is a free float-adjusted market capitalization index that is designed to measure equity market performance in the global emerging markets.
The BofAML US HY Master II Total Return Index tracks the performance of US dollar denominated below investment grade corporate debt publicly issued in the US domestic market.
The Barclays U.S. Treasury Index includes public obligations of the U.S. Treasury, excluding Treasury bills and certain special issues, such as state and local government series bonds (SLGs) and U.S. Treasury TIPS.
The Barclays U.S. Short Treasury Index is composed of bonds of investment grade with a maturity between one and three years.
Indices do not reflect deductions for fees, expenses, or taxes.
An investor may not invest directly in an index.
Diversification cannot guarantee gain or prevent losses.
105 | October 31, 2017
RiverFront Conservative Income Builder Fund
| Performance Update | October 31, 2017 (Unaudited) |
Performance of $10,000 Initial Investment (as of October 31, 2017)
Comparison of change in value of a $10,000 investment (includes maximum sales charges of 5.50%)
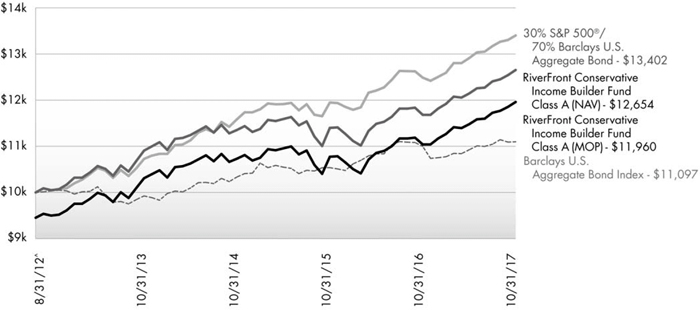
The chart above represents historical performance of a hypothetical investment of $10,000 in the Fund since inception. Past performance does not guarantee future results. This chart does not reflect the deduction of taxes that a shareholder would pay on Fund distributions or the redemption of Fund shares.
Average Annual Total Returns (as of October 31, 2017)
| 6 Month | 1 Year | 3 Years | 5 Years | Since Inception^ | Total Expense Ratio | What You Pay* | |
| Class A (NAV) | 4.19% | 8.33% | 3.68% | 4.72% | 4.66% | 2.07% | 1.38% |
| Class A (MOP) | -1.53% | 2.40% | 1.75% | 3.55% | 3.52% | ||
| Class C (NAV) | 3.83% | 7.42% | 2.87% | 3.93% | 3.88% | 2.83% | 2.13% |
| Class C (CDSC) | 2.83% | 6.42% | 2.87% | 3.93% | 3.88% | ||
| Class I | 4.41% | 8.60% | 3.90% | 4.95% | 4.91% | 1.83% | 1.13% |
| Barclays U.S. Aggregate Bond Index1 | 1.58% | 0.90% | 2.40% | 2.04% | 2.04% | ||
| 30% S&P 500® and 70% Barclays U.S. Aggregate Bond1,2 | 3.80% | 7.32% | 4.97% | 5.94% | 5.83% |
Performance data quoted represents past performance. Past performance does not guarantee future results. Investment return and principal value of an investment will fluctuate so that an investor’s shares, when sold or redeemed, may be worth more or less than the original cost. Current performance data may be higher or lower than actual data quoted. For the most current month-end performance data, please call 1-866-759-5679.
Maximum Offering Price (MOP) for Class A shares includes the Fund’s maximum sales charge of 5.50%. Performance shown at NAV does not include these sales charges and would have been lower had it been taken into account. If you invest $1 million or more, either as a lump sum or through the Fund’s accumulation or letter of intent programs, you can purchase Class A shares without an initial sales charge (load). A Contingent Deferred Sales Charge (“CDSC”) of 1.00% may apply to Class C shares redeemed within the first 12 months after a purchase, and on Class A shares redeemed within the first 18 months after a purchase in excess of $1 million.
Performance less than 1 year is cumulative.
106 | October 31, 2017
RiverFront Conservative Income Builder Fund
| Performance Update | October 31, 2017 (Unaudited) |
| 1 | The Barclays U.S. Aggregate Bond Index is a broad-based benchmark that measures the investment grade, U.S. dollar-denominated, fixed-rate taxable bond market, including Treasuries, government-related and corporate securities, MBS (agency fixed-rate and hybrid ARM passthroughs), ABS, and CMBS. The index is not actively managed and does not reflect any deductions for fees, expenses or taxes. An investor may not invest directly in an index. |
| 2 | The S&P 500® Index is the Standard & Poor’s composite index of 500 stocks, a widely recognized, unmanaged index of common stock prices. |
| ^ | Fund inception date of August 31, 2012. |
| * | What You Pay reflects the Advisor’s and Sub-Advisor’s decision to contractually limit expenses through February 28, 2018 and Acquired Fund Fees and Expenses of 0.23%. Please see the prospectus for additional information. |
The table does not reflect the deduction of taxes that a shareholder would pay on Fund distributions or the redemption of Fund shares.
This Fund is not suitable for all investors and is subject to investment risks, including possible loss of the principal amount invested.
There is no guarantee that the Fund will continue to hold any one particular security or stay invested in any one particular company. The composition of the Fund’s top holdings is subject to change. Performance figures are historical and reflect the change in share price, reinvested distributions, changes in net asset value, sales charges and capital gains distributions, if any.
Not FDIC Insured – No Bank Guarantee – May Lose Value
Top Ten Holdings (as a % of Net Assets) †
| Vanguard® Short-Term Corporate Bond ETF | 14.96% |
| iShares® Core MSCI EAFE ETF | 14.29% |
| Vanguard® Intermediate-Term Corporate Bond ETF | 12.67% |
| PIMCO Investment Grade Corporate Bond Index ETF | 12.27% |
| PIMCO Enhanced Short Maturity Active ETF | 5.80% |
| Riverfront Strategic Income Fund | 5.05% |
| Goldman Sachs ActiveBeta® U.S. Large Cap Equity ETF | 4.65% |
| iShares® Barclays 1-3 Year Credit Bond ETF | 3.39% |
| WisdomTree® LargeCap Dividend Fund | 3.22% |
| SPDR NYSE Technology ETF | 2.73% |
| Top Ten Holdings | 79.03% |
| † | Holdings are subject to change, and may not reflect the current or future position of the portfolio. Table presents indicative values only. Excludes cash & cash equivalents. |
Portfolio Composition (as a % of Net Assets)
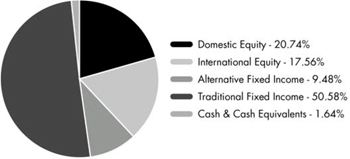
107 | October 31, 2017
RiverFront Dynamic Equity Income Fund
| Performance Update | October 31, 2017 (Unaudited) |
Performance of $10,000 Initial Investment (as of October 31, 2017)
Comparison of change in value of a $10,000 investment (includes maximum sales charges of 5.50%)
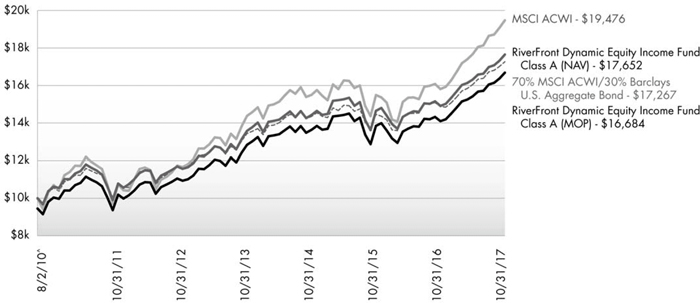
The chart above represents historical performance of a hypothetical investment of $10,000 in the Fund since inception. Past performance does not guarantee future results. This chart does not reflect the deduction of taxes that a shareholder would pay on Fund distributions or the redemption of Fund shares.
Average Annual Total Returns (as of October 31, 2017)
| 6 Month | 1 Year | 3 Years | 5 Years | Since Inception^ | Total Expense Ratio | What You Pay* | |
| Class A (NAV) | 8.20% | 18.37% | 6.96% | 8.82% | 8.16% | 1.65% | 1.45% |
| Class A (MOP) | 2.28% | 11.87% | 4.97% | 7.60% | 7.32% | ||
| Class C (NAV) | 7.77% | 17.53% | 6.17% | 7.99% | 7.34% | 2.40% | 2.20% |
| Class C (CDSC) | 6.77% | 16.53% | 6.17% | 7.99% | 7.34% | ||
| Class I | 8.39% | 18.75% | 7.25% | 9.09% | 8.42% | 1.40% | 1.20% |
| MSCI All Country World Index1 | 10.24% | 23.20% | 7.92% | 10.80% | 9.63% | ||
| 70% MSCI ACWI and 30% Barclays U.S. Aggregate Bond1,2 | 7.58% | 16.09% | 6.37% | 8.21% | 7.83% |
Performance data quoted represents past performance. Past performance does not guarantee future results. Investment return and principal value of an investment will fluctuate so that an investor’s shares, when sold or redeemed, may be worth more or less than the original cost. Current performance data may be higher or lower than actual data quoted. For the most current month-end performance data, please call 1-866-759-5679.
Maximum Offering Price (MOP) for Class A shares includes the Fund’s maximum sales charge of 5.50%. Performance shown at NAV does not include these sales charges and would have been lower had it been taken into account. If you invest $1 million or more, either as a lump sum or through the Fund’s accumulation or letter of intent programs, you can purchase Class A shares without an initial sales charge (load). A Contingent Deferred Sales Charge (“CDSC”) of 1.00% may apply to Class C shares redeemed within the first 12 months after a purchase, and on Class A shares redeemed within the first 18 months after a purchase in excess of $1 million.
Performance less than 1 year is cumulative.
108 | October 31, 2017
RiverFront Dynamic Equity Income Fund
| Performance Update | October 31, 2017 (Unaudited) |
| 1 | The MSCI ACWI (All Country World Index) is a free float-adjusted market capitalization weighted index that is designed to measure the equity market performance of developed and emerging markets. The MSCI ACWI consists of 45 country indices comprising 24 developed and 21 emerging market country indices. The index includes reinvestment of dividends, net of foreign withholding taxes. The index is not actively managed and does not reflect any deductions for fees, expenses or taxes. An investor may not invest directly in an index. |
| 2 | The Barclays U.S. Aggregate Bond Index is a broad-based benchmark that measures the investment grade, U.S. dollar-denominated, fixed-rate taxable bond market, including Treasuries, government-related and corporate securities, MBS (agency fixed-rate and hybrid ARM passthroughs), ABS, and CMBS. The index is not actively managed and does not reflect any deductions for fees, expenses or taxes. An investor may not invest directly in an index. |
| ^ | Fund inception date of August 2, 2010. |
| * | What You Pay reflects the Advisor’s and Sub-Advisor’s decision to contractually limit expenses through February 28, 2018 and Acquired Fund Fees and Expenses of 0.30%. Please see the prospectus for additional information. |
The table does not reflect the deduction of taxes that a shareholder would pay on Fund distributions or the redemption of Fund shares.
This Fund is not suitable for all investors and is subject to investment risks, including possible loss of the principal amount invested.
There is no guarantee that the Fund will continue to hold any one particular security or stay invested in any one particular company. The composition of the Fund’s top holdings is subject to change. Performance figures are historical and reflect the change in share price, reinvested distributions, changes in net asset value, sales charges and capital gains distributions, if any.
Not FDIC Insured – No Bank Guarantee – May Lose Value
Top Ten Holdings (as a % of Net Assets) †
| iShares® Core MSCI EAFE ETF | 10.25% |
| iShares® MSCI EAFE Growth ETF | 8.11% |
| iShares® Core MSCI Emerging Markets ETF | 7.97% |
| SPDR NYSE Technology ETF | 6.60% |
| iShares® MSCI EAFE Value ETF | 5.74% |
| PIMCO Investment Grade Corporate Bond Index ETF | 5.51% |
| Goldman Sachs ActiveBeta® U.S. Large Cap Equity ETF | 4.77% |
| Riverfront Strategic Income Fund | 3.39% |
| iShares® Dow Jones U.S. Financial Services Index Fund | 3.27% |
| WisdomTree® International Hedged Quality Dividend Growth Fund | 3.05% |
| Top Ten Holdings | 58.66% |
| † | Holdings are subject to change, and may not reflect the current or future position of the portfolio. Table presents indicative values only. Excludes cash & cash equivalents. |
Portfolio Composition (as a % of Net Assets)
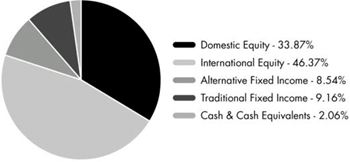
109 | October 31, 2017
RiverFront Global Allocation Fund
| Performance Update | October 31, 2017 (Unaudited) |
Performance of $10,000 Initial Investment (as of October 31, 2017)
Comparison of change in value of a $10,000 investment (includes maximum sales charges of 5.50%)

The chart above represents historical performance of a hypothetical investment of $10,000 in the Fund since inception. Past performance does not guarantee future results. This chart does not reflect the deduction of taxes that a shareholder would pay on Fund distributions or the redemption of Fund shares.
Average Annual Total Returns (as of October 31, 2017)
| 6 Month | 1 Year | 3 Years | 5 Years | Since Inception^ | Total Expense Ratio | What You Pay* | |
| Class A (NAV) | 8.95% | 20.22% | 6.45% | 8.70% | 7.43% | 1.76% | 1.46% |
| Class A (MOP) | 2.99% | 13.64% | 4.47% | 7.47% | 6.60% | ||
| Class C (NAV) | 8.56% | 19.36% | 5.66% | 7.90% | 6.64% | 2.51% | 2.21% |
| Class C (CDSC) | 7.56% | 18.36% | 5.66% | 7.90% | 6.64% | ||
| Class I | 9.16% | 20.58% | 6.75% | 8.99% | 7.70% | 1.51% | 1.21% |
| MSCI All Country World Index1 | 10.24% | 23.20% | 7.92% | 10.80% | 9.63% | ||
| 80% MSCI ACWI and 20% Barclays U.S. Aggregate Bond1,2 | 8.46% | 18.42% | 6.90% | 9.08% | 8.45% |
Performance data quoted represents past performance. Past performance does not guarantee future results. Investment return and principal value of an investment will fluctuate so that an investor’s shares, when sold or redeemed, may be worth more or less than the original cost. Current performance data may be higher or lower than actual data quoted. For the most current month-end performance data, please call 1-866-759-5679.
Maximum Offering Price (MOP) for Class A shares includes the Fund’s maximum sales charge of 5.50%. Performance shown at NAV does not include these sales charges and would have been lower had it been taken into account. If you invest $1 million or more, either as a lump sum or through the Fund’s accumulation or letter of intent programs, you can purchase Class A shares without an initial sales charge (load). A Contingent Deferred Sales Charge (“CDSC”) of 1.00% may apply to Class C shares redeemed within the first 12 months after a purchase, and on Class A shares redeemed within the first 18 months after a purchase in excess of $1 million.
Performance less than 1 year is cumulative.
110 | October 31, 2017
RiverFront Global Allocation Fund
| Performance Update | October 31, 2017 (Unaudited) |
| 1 | The MSCI ACWI (All Country World Index) is a free float-adjusted market capitalization weighted index that is designed to measure the equity market performance of developed and emerging markets. The MSCI ACWI consists of 45 country indices comprising 24 developed and 21 emerging market country indices. The index includes reinvestment of dividends, net of foreign withholding taxes. The index is not actively managed and does not reflect any deductions for fees, expenses or taxes. An investor may not invest directly in an index. |
| 2 | The Barclays U.S. Aggregate Bond Index is a broad-based benchmark that measures the investment grade, U.S. dollar-denominated, fixed-rate taxable bond market, including Treasuries, government-related and corporate securities, MBS (agency fixed-rate and hybrid ARM passthroughs), ABS, and CMBS. The index is not actively managed and does not reflect any deductions for fees, expenses or taxes. An investor may not invest directly in an index. |
| ^ | Fund inception date of August 2, 2010. |
| * | What You Pay reflects the Advisor’s and Sub-Advisor’s decision to contractually limit expenses through February 28, 2018 and Acquired Fund Fees and Expenses of 0.31%. Please see the prospectus for additional information. |
The table does not reflect the deduction of taxes that a shareholder would pay on Fund distributions or the redemption of Fund shares.
This Fund is not suitable for all investors and is subject to investment risks, including possible loss of the principal amount invested.
There is no guarantee that the Fund will continue to hold any one particular security or stay invested in any one particular company. The composition of the Fund’s top holdings is subject to change. Performance figures are historical and reflect the change in share price, reinvested distributions, changes in net asset value, sales charges and capital gains distributions, if any.
Not FDIC Insured – No Bank Guarantee – May Lose Value
Top Ten Holdings (as a % of Net Assets) †
| iShares® MSCI EAFE Growth ETF | 12.72% |
| iShares® Core MSCI EAFE ETF | 9.68% |
| iShares® Core MSCI Emerging Markets ETF | 7.81% |
| iShares® MSCI EAFE Value ETF | 7.64% |
| SPDR NYSE Technology ETF | 7.29% |
| Goldman Sachs ActiveBeta® U.S. Large Cap Equity ETF | 4.83% |
| PIMCO Investment Grade Corporate Bond Index ETF | 3.58% |
| iShares® Core S&P 500® ETF | 3.49% |
| WisdomTree® Europe Hedged Equity Fund | 2.85% |
| WisdomTree® International Hedged Quality Dividend Growth Fund | 2.47% |
| Top Ten Holdings | 62.36% |
| † | Holdings are subject to change, and may not reflect the current or future position of the portfolio. Table presents indicative values only. Excludes cash & cash equivalents. |
Portfolio Composition (as a % of Net Assets)

111 | October 31, 2017
RiverFront Global Growth Fund
| Performance Update | October 31, 2017 (Unaudited) |
Performance of $10,000 Initial Investment (as of October 31, 2017)
Comparison of change in value of a $10,000 investment (includes maximum sales charges of 5.50%)

The chart above represents historical performance of a hypothetical investment of $10,000 in the Fund since inception. Past performance does not guarantee future results. This chart does not reflect the deduction of taxes that a shareholder would pay on Fund distributions or the redemption of Fund shares.
Average Annual Total Returns (as of October 31, 2017)
| 6 Month | 1 Year | 3 Years | 5 Years | Since Inception^ | Total Expense Ratio | What You Pay* | |
| Class A (NAV) | 9.78% | 21.81% | 7.07% | 9.65% | 10.11% | 1.71% | 1.46% |
| Class A (MOP) | 3.76% | 15.09% | 5.06% | 8.42% | 9.42% | ||
| Class C (NAV) | 9.31% | 20.87% | 6.27% | 8.82% | 9.29% | 2.47% | 2.21% |
| Class C (CDSC) | 8.31% | 19.87% | 6.27% | 8.82% | 9.29% | ||
| Class I | 9.83% | 22.05% | 7.29% | 9.89% | 10.37% | 1.46% | 1.21% |
| Class L1 | 9.91% | 22.08% | 7.33% | 9.93% | 10.37% | 1.47% | 1.21% |
| Investor Class | 9.77% | 21.77% | 7.06% | 9.64% | 10.09% | 1.71% | 1.46% |
| MSCI All Country World Index2 | 10.24% | 23.20% | 7.92% | 10.80% | 11.91% | ||
| S&P 500® Total Return Index3 | 9.10% | 23.63% | 10.77% | 15.18% | 14.28% |
Performance data quoted represents past performance. Past performance does not guarantee future results. Investment return and principal value of an investment will fluctuate so that an investor’s shares, when sold or redeemed, may be worth more or less than the original cost. Current performance data may be higher or lower than actual data quoted. For the most current month-end performance data, please call 1-866-759-5679.
Maximum Offering Price (MOP) for Class A shares includes the Fund’s maximum sales charge of 5.50%. Performance shown at NAV does not include these sales charges and would have been lower had it been taken into account. If you invest $1 million or more, either as a lump sum or through the Fund’s accumulation or letter of intent programs, you can purchase Class A shares without an initial sales charge (load). A Contingent Deferred Sales Charge (“CDSC”) of 1.00% may apply to Class C shares redeemed within the first 12 months after a purchase, and on Class A shares redeemed within the first 18 months after a purchase in excess of $1 million.
Performance less than 1 year is cumulative.
112 | October 31, 2017
RiverFront Global Growth Fund
| Performance Update | October 31, 2017 (Unaudited) |
| 1 | Prior to close of business on September 24, 2010, Class L was known as Institutional Class of the Baird Funds, Inc. - RiverFront Long-Term Growth Fund. |
| 2 | The MSCI ACWI (All Country World Index) is a free float-adjusted market capitalization weighted index that is designed to measure the equity market performance of developed and emerging markets. The MSCI ACWI consists of 45 country indices comprising 24 developed and 21 emerging market country indices. The index includes reinvestment of dividends, net of foreign withholding taxes. The index is not actively managed and does not reflect any deductions for fees, expenses or taxes. An investor may not invest directly in an index. |
| 3 | S&P 500® Total Return Index is the Standard & Poor’s composite index of 500 stocks, a widely recognized, unmanaged index of common stock prices. The index is not actively managed and does not reflect any deduction for fees, expenses or taxes. An investor may not invest directly in an index. |
| ^ | Fund inception date of October 28, 2008. |
| * | What You Pay reflects the Advisor’s and Sub-Advisor’s decision to contractually limit expenses through February 28, 2018 and Acquired Fund Fees and Expenses of 0.31%. Please see the prospectus for additional information. |
The Class A, C, I and L shares performance shown for periods prior to September 27, 2010 reflects the performance of the Baird Funds, Inc. – RiverFront Long-Term Growth Fund’s Institutional Class shares (as result of the reorganization of the Baird Funds, Inc. – RiverFront Long-Term Growth Fund into the Fund).
The Investor Class performance shown for periods prior to September 27, 2010 reflects the performance of the Baird Funds, Inc. – RiverFront Long-Term Growth Fund’s Investor Class shares (as result of the reorganization of the Baird Funds, Inc. – RiverFront Long-Term Growth Fund into the Fund).
The table does not reflect the deduction of taxes that a shareholder would pay on Fund distributions or the redemption of Fund shares.
This Fund is not suitable for all investors and is subject to investment risks, including possible loss of the principal amount invested.
There is no guarantee that the Fund will continue to hold any one particular security or stay invested in any one particular company. The composition of the Fund’s top holdings is subject to change. Performance figures are historical and reflect the change in share price, reinvested distributions, changes in net asset value, sales charges and capital gains distributions, if any.
Not FDIC Insured – No Bank Guarantee – May Lose Value
Top Ten Holdings (as a % of Net Assets) †
| iShares® MSCI EAFE Growth ETF | 11.71% |
| iShares® MSCI EAFE Value ETF | 11.70% |
| iShares® Core MSCI EAFE ETF | 10.92% |
| iShares® Core MSCI Emerging Markets ETF | 9.33% |
| SPDR NYSE Technology ETF | 7.16% |
| Goldman Sachs ActiveBeta® U.S. Large Cap Equity ETF | 6.17% |
| iShares® Core S&P 500® ETF | 3.92% |
| WisdomTree® Europe Hedged Equity Fund | 3.78% |
| FlexShares® Quality Dividend Index Fund | 2.89% |
| iShares® Dow Jones U.S. Financial Services Index Fund | 2.68% |
| Top Ten Holdings | 70.26% |
| † | Holdings are subject to change, and may not reflect the current or future position of the portfolio. Table presents indicative values only. Excludes cash & cash equivalents. |
Portfolio Composition (as a % of Net Assets)

113 | October 31, 2017
RiverFront Moderate Growth & Income Fund
| Performance Update | October 31, 2017 (Unaudited) |
Performance of $10,000 Initial Investment (as of October 31, 2017)
Comparison of change in value of a $10,000 investment (includes maximum sales charges of 5.50%)

The chart above represents historical performance of a hypothetical investment of $10,000 in the Fund since inception. Past performance does not guarantee future results. This chart does not reflect the deduction of taxes that a shareholder would pay on Fund distributions or the redemption of Fund shares.
Average Annual Total Returns (as of October 31, 2017)
| 6 Month | 1 Year | 3 Years | 5 Years | Since Inception^ | Total Expense Ratio | What You Pay* | |
| Class A (NAV) | 5.71% | 12.67% | 5.14% | 6.94% | 6.52% | 1.57% | 1.41% |
| Class A (MOP) | -0.10% | 6.50% | 3.17% | 5.73% | 5.69% | ||
| Class C (NAV) | 5.29% | 11.94% | 4.37% | 6.14% | 5.73% | 2.32% | 2.16% |
| Class C (CDSC) | 4.29% | 10.94% | 4.37% | 6.14% | 5.73% | ||
| Class I | 5.86% | 13.05% | 5.40% | 7.19% | 6.78% | 1.32% | 1.16% |
| S&P 500® Total Return Index1 | 9.10% | 23.63% | 10.77% | 15.18% | 14.49% | ||
| 50% S&P 500® and 50% Barclays U.S. Aggregate Bond1,2 | 5.29% | 11.79% | 6.66% | 8.56% | 8.85% |
Performance data quoted represents past performance. Past performance does not guarantee future results. Investment return and principal value of an investment will fluctuate so that an investor’s shares, when sold or redeemed, may be worth more or less than the original cost. Current performance data may be higher or lower than actual data quoted. For the most current month-end performance data, please call 1-866-759-5679.
Maximum Offering Price (MOP) for Class A shares includes the Fund’s maximum sales charge of 5.50%. Performance shown at NAV does not include these sales charges and would have been lower had it been taken into account. If you invest $1 million or more, either as a lump sum or through the Fund’s accumulation or letter of intent programs, you can purchase Class A shares without an initial sales charge (load). A Contingent Deferred Sales Charge (“CDSC”) of 1.00% may apply to Class C shares redeemed within the first 12 months after a purchase, and on Class A shares redeemed within the first 18 months after a purchase in excess of $1 million.
Performance less than 1 year is cumulative.
114 | October 31, 2017
RiverFront Moderate Growth & Income Fund
| Performance Update | October 31, 2017 (Unaudited) |
| 1 | S&P 500® Total Return Index is the Standard & Poor’s composite index of 500 stocks, a widely recognized, unmanaged index of common stock prices. The index is not actively managed and does not reflect any deduction for fees, expenses or taxes. An investor may not invest directly in an index. |
| 2 | The Barclays U.S. Aggregate Bond Index is a broad-based benchmark that measures the investment grade, U.S. dollar-denominated, fixed-rate taxable bond market, including Treasuries, government-related and corporate securities, MBS (agency fixed-rate and hybrid ARM passthroughs), ABS, and CMBS. The index is not actively managed and does not reflect any deductions for fees, expenses or taxes. An investor may not invest directly in an index. |
| ^ | Fund inception date of August 2, 2010. |
| * | What You Pay reflects the Advisor’s and Sub-Advisor’s decision to contractually limit expenses through February 28, 2018 and Acquired Fund Fees and Expenses of 0.26%. Please see the prospectus for additional information. |
The table does not reflect the deduction of taxes that a shareholder would pay on Fund distributions or the redemption of Fund shares.
This Fund is not suitable for all investors and is subject to investment risks, including possible loss of the principal amount invested.
There is no guarantee that the Fund will continue to hold any one particular security or stay invested in any one particular company. The composition of the Fund’s top holdings is subject to change. Performance figures are historical and reflect the change in share price, reinvested distributions, changes in net asset value, sales charges and capital gains distributions, if any.
Not FDIC Insured – No Bank Guarantee – May Lose Value
Top Ten Holdings (as a % of Net Assets) †
| iShares® Core MSCI EAFE ETF | 12.64% |
| Vanguard® Short-Term Corporate Bond ETF | 11.13% |
| Vanguard® Intermediate-Term Corporate Bond ETF | 8.11% |
| PIMCO Investment Grade Corporate Bond Index ETF | 6.17% |
| Goldman Sachs ActiveBeta® U.S. Large Cap Equity ETF | 6.11% |
| SPDR NYSE Technology ETF | 5.37% |
| Riverfront Strategic Income Fund | 4.73% |
| FlexShares® Quality Dividend Index Fund | 4.14% |
| iShares® MSCI EAFE Value ETF | 3.77% |
| iShares® Dow Jones U.S. Financial Services Index Fund | 3.34% |
| Top Ten Holdings | 65.51% |
| † | Holdings are subject to change, and may not reflect the current or future position of the portfolio. Table presents indicative values only. Excludes cash & cash equivalents. |
Portfolio Composition (as a % of Net Assets)

115 | October 31, 2017
RiverFront Conservative Income Builder Fund
| Statement of Investments | October 31, 2017 |
| Shares | Value (Note 2) | |||||||
| EXCHANGE TRADED FUNDS (103.27%) | ||||||||
| Debt (63.06%) | ||||||||
| First Trust Senior Loan ETF | 5,642 | $ | 272,678 | |||||
| Guggenheim BulletShares® 2021 Corporate Bond ETF | 9,897 | 211,301 | ||||||
| iShares® Barclays 1-3 Year Credit Bond ETF | 3,592 | 378,058 | ||||||
| PIMCO 15+ Year U.S. TIPS Index ETF | 3,536 | 235,780 | ||||||
| PIMCO Enhanced Short Maturity Active ETF | 6,352 | 646,951 | ||||||
| PIMCO Investment Grade Corporate Bond Index ETF | 12,943 | 1,368,205 | ||||||
| Riverfront Strategic Income Fund(a) | 22,212 | 563,074 | ||||||
| SPDR® Blackstone / GSO Senior Loan ETF | 5,766 | 274,058 | ||||||
| Vanguard® Intermediate-Term Corporate Bond ETF | 16,060 | 1,412,477 | ||||||
| Vanguard® Short-Term Corporate Bond ETF | 20,839 | 1,667,954 | ||||||
| 7,030,536 | ||||||||
| Equity (40.21%) | ||||||||
| Consumer Discretionary Select Sector SPDR® Fund | 530 | 48,755 | ||||||
| Global X MSCI Norway ETF | 6,162 | 83,249 | ||||||
| Goldman Sachs ActiveBeta® U.S. Large Cap Equity ETF | 10,124 | 518,349 | ||||||
| Health Care Select Sector SPDR® Fund | 1,443 | 117,042 | ||||||
| iShares® Core MSCI EAFE ETF | 24,418 | 1,593,274 | ||||||
| iShares® Core S&P 500® ETF | 814 | 210,671 | ||||||
| iShares® Core S&P® SmallCap ETF | 1,963 | 146,950 | ||||||
| iShares® Dow Jones U.S. Financial Services Index Fund | 1,674 | 206,890 | ||||||
| iShares® International Select Dividend ETF | 3,525 | 118,052 | ||||||
| iShares® U.S. Consumer Goods ETF | 1,343 | 162,087 | ||||||
| PowerShares® Aerospace & Defense Portfolio | 2,084 | 109,410 | ||||||
| Powershares® QQQ Trust Series 1 | 1,130 | 171,929 | ||||||
| SPDR® NYSE Technology ETF | 3,638 | 304,828 | ||||||
| SPDR® S&P® Capital Markets ETF | 1,352 | 72,156 | ||||||
| WisdomTree® International Hedged Quality Dividend Growth Fund | 8,274 | 261,458 | ||||||
| WisdomTree® LargeCap Dividend Fund | 4,068 | 358,676 | ||||||
| 4,483,776 | ||||||||
| TOTAL EXCHANGE TRADED FUNDS | ||||||||
(Cost $10,691,978) | 11,514,312 | |||||||
| 7-Day Yield | Shares | Value (Note 2) | ||||||||||
| SHORT TERM INVESTMENTS (1.54%) | ||||||||||||
| Money Market Fund (1.54%) | ||||||||||||
| State Street Institutional Treasury Plus Money Market Fund | 0.930 | % | 171,380 | $ | 171,380 | |||||||
| TOTAL SHORT TERM INVESTMENTS | ||||||||||||
(Cost $171,380) | 171,380 | |||||||||||
| TOTAL INVESTMENTS (104.81%) | ||||||||||||
(Cost $10,863,358) | $ | 11,685,692 | ||||||||||
| Liabilities In Excess Of Other Assets (-4.81%) | (536,566 | ) | ||||||||||
| NET ASSETS (100.00%) | $ | 11,149,126 | ||||||||||
| (a) | Affiliated Company. See Note 7 in Notes to Financial Statements. |
For Fund compliance purposes, the Fund’s industry classifications refer to any one or more of the industry sub-classifications used by one or more widely recognized market indexes or ratings group indexes, and/or as defined by Fund management. This definition may not apply for purposes of this report, which may combine industry sub-classifications for reporting ease. Industries are shown as a percent of net assets.
See Notes to Financial Statements.
116 | October 31, 2017
RiverFront Dynamic Equity Income Fund
| Statement of Investments | October 31, 2017 |
| Shares | Value (Note 2) | |||||||
| COMMON STOCKS (0.94%) | ||||||||
| Consumer, Non-Cyclical (0.44%) | ||||||||
| Beverages (0.44%) | ||||||||
| PepsiCo, Inc. | 3,184 | $ | 350,972 | |||||
| TOTAL CONSUMER, NON-CYCLICAL | 350,972 | |||||||
| Technology (0.50%) | ||||||||
| Software (0.50%) | ||||||||
| Paychex, Inc. | 6,171 | 393,648 | ||||||
| TOTAL TECHNOLOGY | 393,648 | |||||||
| TOTAL COMMON STOCKS | ||||||||
| (Cost $642,554) | 744,620 | |||||||
| EXCHANGE TRADED FUNDS (96.67%) | ||||||||
| Debt (17.79%) | ||||||||
| First Trust Senior Loan ETF | 42,415 | 2,049,917 | ||||||
| PIMCO 15+ Year U.S. TIPS Index ETF | 14,582 | 972,328 | ||||||
| PIMCO Enhanced Short Maturity Active ETF | 19,122 | 1,947,576 | ||||||
| PIMCO Investment Grade Corporate Bond Index ETF | 41,265 | 4,362,123 | ||||||
| Riverfront Strategic Income Fund(a) | 105,827 | 2,682,714 | ||||||
| SPDR® Blackstone / GSO Senior Loan ETF | 43,351 | 2,060,473 | ||||||
| 14,075,131 | ||||||||
| Equity (78.88%) | ||||||||
| Consumer Discretionary Select Sector SPDR® Fund | 4,970 | 457,190 | ||||||
| Consumer Staples Select Sector SPDR® Fund | 19,633 | 1,042,316 | ||||||
| First Trust Utilities AlphaDEX® Fund | 26,060 | 714,305 | ||||||
| FlexShares® Quality Dividend Index Fund | 49,767 | 2,118,084 | ||||||
| Global X MSCI Norway ETF | 63,016 | 851,346 | ||||||
| Goldman Sachs ActiveBeta® U.S. Large Cap Equity ETF | 73,645 | 3,770,624 | ||||||
| Health Care Select Sector SPDR® Fund | 6,720 | 545,059 | ||||||
| iShares® Core MSCI EAFE ETF | 124,330 | 8,112,533 | ||||||
| iShares® Core MSCI Emerging Markets ETF | 113,085 | 6,307,881 | ||||||
| iShares® Core S&P 500® ETF | 9,144 | 2,366,559 | ||||||
| iShares® Dow Jones U.S. Financial Services Index Fund | 20,949 | 2,589,087 | ||||||
| iShares® International Select Dividend ETF | 32,349 | 1,083,368 | ||||||
| iShares® MSCI All Country Asia ex Japan ETF | 11,395 | 858,157 | ||||||
| Shares | Value (Note 2) | |||||||
| Equity (continued) | ||||||||
| iShares® MSCI Australia ETF | 31,652 | $ | 718,500 | |||||
| iShares® MSCI Canada Index Fund | 25,984 | 748,079 | ||||||
| iShares® MSCI EAFE Growth ETF | 81,023 | 6,419,452 | ||||||
| iShares® MSCI EAFE Value ETF | 82,564 | 4,540,194 | ||||||
| iShares® U.S. Healthcare Providers ETF | 8,335 | 1,244,749 | ||||||
| PowerShares® Aerospace & Defense Portfolio | 18,552 | 973,980 | ||||||
| PowerShares® FTSE RAFI Emerging Markets Portfolio | 34,934 | 754,924 | ||||||
| Powershares® QQQ Trust Series 1 | 13,915 | 2,117,167 | ||||||
| SPDR® NYSE Technology ETF | 62,354 | 5,224,642 | ||||||
| SPDR® S&P® Capital Markets ETF | 21,589 | 1,152,205 | ||||||
| Vanguard® Information Technology ETF | 3,094 | 505,034 | ||||||
| WisdomTree® Europe Hedged Equity Fund | 34,801 | 2,311,134 | ||||||
| WisdomTree® International Hedged Quality Dividend Growth Fund | 76,403 | 2,414,335 | ||||||
| WisdomTree® Japan SmallCap Dividend Fund | 22,604 | 1,756,105 | ||||||
| WisdomTree® LargeCap Dividend Fund | 8,143 | 717,968 | ||||||
| 62,414,977 | ||||||||
| TOTAL EXCHANGE TRADED FUNDS | ||||||||
(Cost $63,731,369) | 76,490,108 | |||||||
| EXCHANGE TRADED NOTES (0.83%) | ||||||||
| Equity (0.83%) | ||||||||
| ETRACS Alerian MLP Infrastructure Index ETN | 27,907 | 655,536 | ||||||
| TOTAL EXCHANGE TRADED NOTES | ||||||||
(Cost $591,070) | 655,536 | |||||||
| 7-Day Yield | Shares | Value (Note 2) | ||||||||||
| SHORT TERM INVESTMENTS (1.79%) | ||||||||||||
| Money Market Fund (1.79%) | ||||||||||||
| State Street Institutional Treasury Plus Money Market Fund | 0.930 | % | 1,413,376 | 1,413,376 | ||||||||
| TOTAL SHORT TERM INVESTMENTS | ||||||||||||
(Cost $1,413,376) | 1,413,376 | |||||||||||
117 | October 31, 2017
RiverFront Dynamic Equity Income Fund
| Statement of Investments | October 31, 2017 |
| Value (Note 2) | ||||
| TOTAL INVESTMENTS (100.23%) | ||||
(Cost $66,378,369) | $ | 79,303,640 | ||
| Liabilities In Excess Of Other Assets (-0.23%) | (182,676 | ) | ||
| NET ASSETS (100.00%) | $ | 79,120,964 | ||
| (a) | Affiliated Company. See Note 7 in Notes to Financial Statements. |
For Fund compliance purposes, the Fund’s industry classifications refer to any one or more of the industry sub-classifications used by one or more widely recognized market indexes or ratings group indexes, and/or as defined by Fund management. This definition may not apply for purposes of this report, which may combine industry sub-classifications for reporting ease. Industries are shown as a percent of net assets.
See Notes to Financial Statements.
118 | October 31, 2017
RiverFront Global Allocation Fund
| Statement of Investments | October 31, 2017 |
| Shares | Value (Note 2) | |||||||
| COMMON STOCKS (0.94%) | ||||||||
| Consumer, Non-Cyclical (0.44%) | ||||||||
| Beverages (0.44%) | ||||||||
| PepsiCo, Inc. | 1,350 | $ | 148,810 | |||||
| TOTAL CONSUMER, NON-CYCLICAL | 148,810 | |||||||
| Technology (0.50%) | ||||||||
| Software (0.50%) | ||||||||
| Paychex, Inc. | 2,657 | 169,490 | ||||||
| TOTAL TECHNOLOGY | 169,490 | |||||||
| TOTAL COMMON STOCKS | ||||||||
| (Cost $276,252) | 318,300 | |||||||
| EXCHANGE TRADED FUNDS (95.07%) | ||||||||
| Debt (7.76%) | ||||||||
| First Trust Senior Loan ETF | 8,814 | 425,981 | ||||||
| PIMCO Investment Grade Corporate Bond Index ETF | 11,491 | 1,214,713 | ||||||
| Riverfront Strategic Income Fund(a) | 22,165 | 561,883 | ||||||
| SPDR® Blackstone / GSO Senior Loan ETF | 9,037 | 429,529 | ||||||
| 2,632,106 | ||||||||
| Equity (87.31%) | ||||||||
| Consumer Discretionary Select Sector SPDR® Fund | 2,390 | 219,856 | ||||||
| Financial Select Sector SPDR® Fund | 27,021 | 718,759 | ||||||
| First Trust Utilities AlphaDEX® Fund | 16,594 | 454,841 | ||||||
| FlexShares® Quality Dividend Index Fund | 12,980 | 552,429 | ||||||
| Global X MSCI Norway ETF | 26,371 | 356,272 | ||||||
| Goldman Sachs ActiveBeta® U.S. Large Cap Equity ETF | 31,988 | 1,637,786 | ||||||
| Health Care Select Sector SPDR® Fund | 2,823 | 228,973 | ||||||
| iShares® Core MSCI EAFE ETF | 50,326 | 3,283,771 | ||||||
| iShares® Core MSCI Emerging Markets ETF | 47,478 | 2,648,323 | ||||||
| iShares® Core S&P 500® ETF | 4,575 | 1,184,056 | ||||||
| iShares® Core S&P® SmallCap ETF | 7,673 | 574,401 | ||||||
| iShares® Dow Jones U.S. Financial Services Index Fund | 5,617 | 694,205 | ||||||
| iShares® International Select Dividend ETF | 13,529 | 453,086 | ||||||
| iShares® MSCI All Country Asia ex Japan ETF | 8,333 | 627,558 | ||||||
| iShares® MSCI Australia ETF | 9,748 | 221,280 | ||||||
| iShares® MSCI Canada Index Fund | 10,857 | 312,573 | ||||||
| iShares® MSCI EAFE ETF | 5,785 | 402,809 | ||||||
| iShares® MSCI EAFE Growth ETF | 54,463 | 4,315,103 | ||||||
| Shares | Value (Note 2) | |||||||
| Equity (continued) | ||||||||
| iShares® MSCI EAFE Value ETF | 47,130 | $ | 2,591,679 | |||||
| iShares® U.S. Consumer Goods ETF | 5,098 | 615,278 | ||||||
| iShares® U.S. Healthcare Providers ETF | 3,380 | 504,769 | ||||||
| PowerShares® Aerospace & Defense Portfolio | 7,004 | 367,710 | ||||||
| PowerShares® FTSE RAFI Emerging Markets Portfolio | 14,583 | 315,139 | ||||||
| Powershares® QQQ Trust Series 1 | 4,901 | 745,687 | ||||||
| SPDR® NYSE Technology ETF | 29,513 | 2,472,894 | ||||||
| SPDR® S&P® Capital Markets ETF | 4,415 | 235,629 | ||||||
| WisdomTree® Europe Hedged Equity Fund | 14,566 | 967,328 | ||||||
| WisdomTree® International Hedged Quality Dividend Growth Fund | 26,553 | 839,075 | ||||||
| WisdomTree® Japan SmallCap Dividend Fund | 6,895 | 535,673 | ||||||
| WisdomTree® LargeCap Dividend Fund | 6,119 | 539,512 | ||||||
| 29,616,454 | ||||||||
| TOTAL EXCHANGE TRADED FUNDS | ||||||||
| (Cost $26,197,250) | 32,248,560 | |||||||
| EXCHANGE TRADED NOTES (1.22%) | ||||||||
| Equity (1.22%) | ||||||||
| ETRACS Alerian MLP Infrastructure Index ETN | 17,562 | 412,531 | ||||||
| TOTAL EXCHANGE TRADED NOTES | ||||||||
| (Cost $371,978) | 412,531 | |||||||
| 7-Day Yield | Shares | Value (Note 2) | ||||||||||
| SHORT TERM INVESTMENTS (2.98%) Money Market Fund (2.98%) | ||||||||||||
| State Street Institutional Treasury Plus Money Market Fund | 0.930 | % | 1,010,833 | 1,010,833 | ||||||||
| TOTAL SHORT TERM INVESTMENTS | ||||||||||||
| (Cost $1,010,833) | 1,010,833 | |||||||||||
| TOTAL INVESTMENTS (100.21%) | ||||||||||||
| (Cost $27,856,313) | $ | 33,990,224 | ||||||||||
| Liabilities In Excess Of Other Assets (-0.21%) | (71,316 | ) | ||||||||||
| NET ASSETS (100.00%) | $ | 33,918,908 | ||||||||||
119 | October 31, 2017
RiverFront Global Allocation Fund
| Statement of Investments | October 31, 2017 |
| (a) | Affiliated Company. See Note 7 in Notes to Financial Statements. |
For Fund compliance purposes, the Fund’s industry classifications refer to any one or more of the industry sub-classifications used by one or more widely recognized market indexes or ratings group indexes, and/or as defined by Fund management. This definition may not apply for purposes of this report, which may combine industry sub-classifications for reporting ease. Industries are shown as a percent of net assets.
See Notes to Financial Statements.
120 | October 31, 2017
RiverFront Global Growth Fund
| Statement of Investments | October 31, 2017 |
| Shares | Value (Note 2) | |||||||
| COMMON STOCKS (0.93%) | ||||||||
| Consumer, Non-Cyclical (0.44%) | ||||||||
| Beverages (0.44%) | ||||||||
| PepsiCo, Inc. | 2,473 | $ | 272,599 | |||||
| TOTAL CONSUMER, NON-CYCLICAL | 272,599 | |||||||
| Technology (0.49%) | ||||||||
| Software (0.49%) | ||||||||
| Paychex, Inc. | 4,773 | 304,469 | ||||||
| TOTAL TECHNOLOGY | 304,469 | |||||||
| TOTAL COMMON STOCKS | ||||||||
| (Cost $501,185) | 577,068 | |||||||
| EXCHANGE TRADED FUNDS (94.99%) | ||||||||
| Equity (94.99%) | ||||||||
| Consumer Discretionary Select Sector SPDR® Fund | 4,966 | 456,822 | ||||||
| Consumer Staples Select Sector SPDR® Fund | 7,289 | 386,973 | ||||||
| Financial Select Sector SPDR® Fund | 38,066 | 1,012,556 | ||||||
| First Trust Utilities AlphaDEX® Fund | 29,396 | 805,744 | ||||||
| FlexShares® Quality Dividend Index Fund | 42,151 | 1,793,947 | ||||||
| Global X MSCI Norway ETF | 46,855 | 633,011 | ||||||
| Goldman Sachs ActiveBeta® U.S. Large Cap Equity ETF | 74,658 | 3,822,490 | ||||||
| Health Care Select Sector SPDR® Fund | 4,407 | 357,452 | ||||||
| iShares® Core MSCI EAFE ETF | 103,689 | 6,765,707 | ||||||
| iShares® Core MSCI Emerging Markets ETF | 103,715 | 5,785,223 | ||||||
| iShares® Core S&P 500® ETF | 9,395 | 2,431,520 | ||||||
| iShares® Dow Jones U.S. Financial Services Index Fund | 13,462 | 1,663,769 | ||||||
| iShares® International Select Dividend ETF | 24,049 | 805,401 | ||||||
| iShares® MSCI All Country Asia ex Japan ETF | 15,213 | 1,145,691 | ||||||
| iShares® MSCI Australia ETF | 29,469 | 668,946 | ||||||
| iShares® MSCI Canada Index Fund | 39,028 | 1,123,616 | ||||||
| iShares® MSCI EAFE Growth ETF | 91,622 | 7,259,211 | ||||||
| iShares® MSCI EAFE Value ETF | 131,876 | 7,251,861 | ||||||
| iShares® U.S. Healthcare Providers ETF | 7,272 | 1,086,000 | ||||||
| PowerShares® Aerospace & Defense Portfolio | 16,882 | 886,305 | ||||||
| PowerShares® FTSE RAFI Emerging Markets Portfolio | 53,119 | 1,147,902 | ||||||
| Powershares® QQQ Trust Series 1 | 6,768 | 1,029,751 | ||||||
| SPDR® NYSE Technology ETF | 52,929 | 4,434,921 | ||||||
| Shares | Value (Note 2) | |||||||
| Equity (continued) | ||||||||
| SPDR® S&P® Capital Markets ETF | 12,432 | $ | 663,496 | |||||
| Vanguard® Information Technology ETF | 3,924 | 640,514 | ||||||
| WisdomTree® Europe Hedged Equity Fund | 35,282 | 2,343,078 | ||||||
| WisdomTree® International Hedged Quality Dividend Growth Fund | 48,262 | 1,525,079 | ||||||
| WisdomTree® Japan SmallCap Dividend Fund | 12,102 | 940,204 | ||||||
| 58,867,190 | ||||||||
| TOTAL EXCHANGE TRADED FUNDS | ||||||||
| (Cost $47,336,491) | 58,867,190 | |||||||
| EXCHANGE TRADED NOTES (1.21%) | ||||||||
| Equity (1.21%) | ||||||||
| ETRACS Alerian MLP Infrastructure Index ETN | 31,845 | 748,039 | ||||||
| TOTAL EXCHANGE TRADED NOTES | ||||||||
| (Cost $674,477) | 748,039 | |||||||
| 7-Day Yield | Shares | Value (Note 2) | ||||||||||
| SHORT TERM INVESTMENTS (2.98%) | ||||||||||||
| Money Market Fund (2.98%) | ||||||||||||
| State Street Institutional Treasury Plus Money Market Fund | 0.930 | % | 1,849,012 | 1,849,012 | ||||||||
| TOTAL SHORT TERM INVESTMENTS | ||||||||||||
| (Cost $1,849,012) | 1,849,012 | |||||||||||
| TOTAL INVESTMENTS (100.11%) | ||||||||||||
| (Cost $50,361,165) | $ | 62,041,309 | ||||||||||
| Liabilities In Excess Of Other Assets (-0.11%) | (65,360 | ) | ||||||||||
| NET ASSETS (100.00%) | $ | 61,975,949 | ||||||||||
For Fund compliance purposes, the Fund’s industry classifications refer to any one or more of the industry sub-classifications used by one or more widely recognized market indexes or ratings group indexes, and/or as defined by Fund management. This definition may not apply for purposes of this report, which may combine industry sub-classifications for reporting ease. Industries are shown as a percent of net assets.
See Notes to Financial Statements.
121 | October 31, 2017
RiverFront Moderate Growth & Income Fund
| Statement of Investments | October 31, 2017 |
| Shares | Value (Note 2) | |||||||
| COMMON STOCKS (1.00%) | ||||||||
| Consumer, Non-Cyclical (0.47%) | ||||||||
| Beverages (0.47%) | ||||||||
| PepsiCo, Inc. | 4,075 | $ | 449,187 | |||||
| TOTAL CONSUMER, NON-CYCLICAL | 449,187 | |||||||
| Technology (0.53%) | ||||||||
| Software (0.53%) | ||||||||
| Paychex, Inc. | 7,839 | 500,050 | ||||||
| TOTAL TECHNOLOGY | 500,050 | |||||||
| TOTAL COMMON STOCKS | ||||||||
| (Cost $823,502) | 949,237 | |||||||
| EXCHANGE TRADED FUNDS (96.26%) | ||||||||
| Debt (37.77%) | ||||||||
| First Trust Senior Loan ETF | 55,179 | 2,666,801 | ||||||
| iShares® Barclays 1-3 Year Credit Bond ETF | 16,098 | 1,694,315 | ||||||
| PIMCO 15+ Year U.S. TIPS Index ETF | 17,793 | 1,186,437 | ||||||
| PIMCO Investment Grade Corporate Bond Index ETF | 55,731 | 5,891,324 | ||||||
| Riverfront Strategic Income Fund(a) | 178,038 | 4,513,263 | ||||||
| SPDR® Blackstone / GSO Senior Loan ETF | 36,495 | 1,734,607 | ||||||
| Vanguard® Intermediate-Term Corporate Bond ETF | 88,054 | 7,744,349 | ||||||
| Vanguard® Short-Term Corporate Bond ETF | 132,685 | 10,620,108 | ||||||
| 36,051,204 | ||||||||
| Equity (58.49%) | ||||||||
| Consumer Discretionary Select Sector SPDR® Fund | 9,279 | 853,575 | ||||||
| Consumer Staples Select Sector SPDR® Fund | 20,545 | 1,090,734 | ||||||
| First Trust Utilities AlphaDEX® Fund | 33,038 | 905,572 | ||||||
| FlexShares® Quality Dividend Index Fund | 92,956 | 3,956,207 | ||||||
| Global X MSCI Norway ETF | 48,072 | 649,453 | ||||||
| Goldman Sachs ActiveBeta® U.S. Large Cap Equity ETF | 113,876 | 5,830,451 | ||||||
| Health Care Select Sector SPDR® Fund | 11,607 | 941,444 | ||||||
| iShares® Core MSCI EAFE ETF | 184,944 | 12,067,596 | ||||||
| iShares® Core MSCI Emerging Markets ETF | 37,099 | 2,069,382 | ||||||
| iShares® Core S&P 500® ETF | 12,211 | 3,160,329 | ||||||
| iShares® Dow Jones U.S. Financial Services Index Fund | 25,776 | 3,185,656 | ||||||
| Shares | Value (Note 2) | |||||||
| Equity (continued) | ||||||||
| iShares® International Select Dividend ETF | 27,515 | $ | 921,477 | |||||
| iShares® MSCI EAFE Growth ETF | 22,706 | 1,798,996 | ||||||
| iShares® MSCI EAFE Value ETF | 65,472 | 3,600,305 | ||||||
| iShares® U.S. Healthcare Providers ETF | 8,378 | 1,251,171 | ||||||
| PowerShares® Aerospace & Defense Portfolio | 19,161 | 1,005,953 | ||||||
| Powershares® QQQ Trust Series 1 | 19,257 | 2,929,953 | ||||||
| SPDR® NYSE Technology ETF | 61,143 | 5,123,172 | ||||||
| SPDR® S&P® Capital Markets ETF | 15,532 | 828,943 | ||||||
| WisdomTree® International | ||||||||
| Hedged Quality Dividend Growth Fund | 32,294 | 1,020,490 | ||||||
| WisdomTree® LargeCap Dividend Fund | 30,011 | 2,646,070 | ||||||
| 55,836,929 | ||||||||
| TOTAL EXCHANGE TRADED FUNDS | ||||||||
| (Cost $80,566,277) | 91,888,133 | |||||||
| EXCHANGE TRADED NOTES (0.83%) | ||||||||
| Equity (0.83%) | ||||||||
| ETRACS Alerian MLP Infrastructure Index ETN | 33,880 | 795,841 | ||||||
| TOTAL EXCHANGE TRADED NOTES | ||||||||
| (Cost $717,579) | 795,841 | |||||||
| 7-Day Yield | Shares | Value (Note 2) | ||||||||||
| SHORT TERM INVESTMENTS (2.30%) | ||||||||||||
| Money Market Fund (2.30%) | ||||||||||||
| State Street Institutional Treasury Plus Money Market Fund | 0.930 | % | 2,195,757 | 2,195,757 | ||||||||
| TOTAL SHORT TERM INVESTMENTS | ||||||||||||
| (Cost $2,195,757) | 2,195,757 | |||||||||||
| TOTAL INVESTMENTS (100.39%) | ||||||||||||
| (Cost $84,303,115) | $ | 95,828,968 | ||||||||||
| Liabilities In Excess Of Other Assets (-0.39%) | (373,827 | ) | ||||||||||
| NET ASSETS (100.00%) | $ | 95,455,141 | ||||||||||
| (a) | Affiliated Company. See Note 7 in Notes to Financial Statements. |
122 | October 31, 2017
RiverFront Moderate Growth & Income Fund
| Statement of Investments | October 31, 2017 |
For Fund compliance purposes, the Fund’s industry classifications refer to any one or more of the industry sub-classifications used by one or more widely recognized market indexes or ratings group indexes, and/or as defined by Fund management. This definition may not apply for purposes of this report, which may combine industry sub-classifications for reporting ease. Industries are shown as a percent of net assets.
See Notes to Financial Statements.
123 | October 31, 2017
RiverFront Global Allocation Series
| Statements of Assets and Liabilities | October 31, 2017 |
| RiverFront Conservative Income Builder Fund | RiverFront Dynamic Equity Income Fund | RiverFront Global Allocation Fund | RiverFront Global Growth Fund | RiverFront Moderate Growth & Income Fund | ||||||||||||||||
| ASSETS | ||||||||||||||||||||
| Investments, at value | $ | 11,122,618 | $ | 76,620,926 | $ | 33,428,341 | $ | 62,041,309 | $ | 91,315,705 | ||||||||||
| Investments in affiliates, at value | 563,074 | 2,682,714 | 561,883 | – | 4,513,263 | |||||||||||||||
| Receivable for shares sold | – | 111,393 | – | 120 | 9,994 | |||||||||||||||
| Dividends and interest receivable | 238 | 4,362 | 1,912 | 3,354 | 5,066 | |||||||||||||||
| Receivable due from advisor | 8,860 | – | – | – | – | |||||||||||||||
| Prepaid expenses and other assets | 19,240 | 18,212 | 17,073 | 27,079 | 18,086 | |||||||||||||||
| Total Assets | 11,714,030 | 79,437,607 | 34,009,209 | 62,071,862 | 95,862,114 | |||||||||||||||
| LIABILITIES | ||||||||||||||||||||
| Payable for shares redeemed | 527,182 | 211,793 | 34,593 | 22,692 | 263,535 | |||||||||||||||
| Investment advisory fees payable | – | 29,121 | 7,772 | 18,395 | 39,014 | |||||||||||||||
| Administration and transfer agency fees payable | 2,989 | 11,151 | 6,124 | 8,753 | 14,286 | |||||||||||||||
| Distribution and services fees payable | 7,018 | 26,793 | 11,170 | 11,311 | 47,026 | |||||||||||||||
| Trustees’ fees and expenses payable | 117 | 771 | 328 | 604 | 1,111 | |||||||||||||||
| Professional fees payable | 23,358 | 24,368 | 23,685 | 24,083 | 24,993 | |||||||||||||||
| Custody fees payable | 1,562 | 2,308 | 1,377 | 1,912 | 2,252 | |||||||||||||||
| Printing fees payable | 1,264 | 7,995 | 3,547 | 6,026 | 11,797 | |||||||||||||||
| Accrued expenses and other liabilities | 1,414 | 2,343 | 1,705 | 2,137 | 2,959 | |||||||||||||||
| Total Liabilities | 564,904 | 316,643 | 90,301 | 95,913 | 406,973 | |||||||||||||||
| NET ASSETS | $ | 11,149,126 | $ | 79,120,964 | $ | 33,918,908 | $ | 61,975,949 | $ | 95,455,141 | ||||||||||
| NET ASSETS CONSIST OF | ||||||||||||||||||||
| Paid-in capital | $ | 10,143,833 | $ | 64,720,797 | $ | 27,526,129 | $ | 48,352,999 | $ | 79,664,060 | ||||||||||
| Accumulated net investment income | 14,179 | 15,982 | 168,257 | 366,067 | 151,684 | |||||||||||||||
| Accumulated net realized gain | 168,780 | 1,458,914 | 90,611 | 1,576,739 | 4,113,544 | |||||||||||||||
| Net unrealized appreciation | 822,334 | 12,925,271 | 6,133,911 | 11,680,144 | 11,525,853 | |||||||||||||||
| NET ASSETS | $ | 11,149,126 | $ | 79,120,964 | $ | 33,918,908 | $ | 61,975,949 | $ | 95,455,141 | ||||||||||
| INVESTMENTS, AT COST | $ | 10,326,544 | $ | 63,828,263 | $ | 27,319,477 | $ | 50,361,165 | $ | 80,016,521 | ||||||||||
| INVESTMENTS IN AFFILIATES, AT COST | $ | 536,814 | $ | 2,550,106 | $ | 536,836 | $ | – | $ | 4,286,594 | ||||||||||
See Notes to Financial Statements.
124 | October 31, 2017
RiverFront Global Allocation Series
| Statements of Assets and Liabilities (continued) | October 31, 2017 |
| RiverFront Conservative Income Builder Fund | RiverFront Dynamic Equity Income Fund | RiverFront Global Allocation Fund | RiverFront Global Growth Fund | RiverFront Moderate Growth & Income Fund | ||||||||||||||||
| PRICING OF SHARES | ||||||||||||||||||||
| Class A: | ||||||||||||||||||||
| Net Asset Value, offering and redemption price per share | $ | 11.25 | $ | 14.48 | $ | 14.12 | $ | 16.27 | $ | 12.47 | ||||||||||
| Net Assets | $ | 1,132,897 | $ | 19,122,929 | $ | 7,451,543 | $ | 8,934,843 | $ | 13,311,018 | ||||||||||
| Shares of beneficial interest outstanding (unlimited number of shares, no par value common stock authorized) | 100,717 | 1,320,894 | 527,577 | 549,282 | 1,067,038 | |||||||||||||||
| Maximum offering price per share ((NAV/0.9450), based on maximum sales charge of 5.50% of the offering price) | $ | 11.90 | $ | 15.32 | $ | 14.94 | $ | 17.22 | $ | 13.20 | ||||||||||
| Class C: | ||||||||||||||||||||
| Net Asset Value, offering and redemption price per share(a) | $ | 11.12 | $ | 14.16 | $ | 13.69 | $ | 15.73 | $ | 12.34 | ||||||||||
| Net Assets | $ | 7,233,517 | $ | 26,513,629 | $ | 11,341,420 | $ | 10,408,309 | $ | 51,230,804 | ||||||||||
| Shares of beneficial interest outstanding (unlimited number of shares, no par value common stock authorized) | 650,657 | 1,872,427 | 828,167 | 661,512 | 4,150,844 | |||||||||||||||
| Class I: | ||||||||||||||||||||
| Net Asset Value, offering and redemption price per share | $ | 11.08 | $ | 14.42 | $ | 13.94 | $ | 16.43 | $ | 12.48 | ||||||||||
| Net Assets | $ | 2,782,712 | $ | 33,484,406 | $ | 15,125,945 | $ | 13,872,674 | $ | 30,913,319 | ||||||||||
| Shares of beneficial interest outstanding (unlimited number of shares, no par value common stock authorized) | 251,260 | 2,322,837 | 1,085,253 | 844,133 | 2,476,428 | |||||||||||||||
| Investor Class: | ||||||||||||||||||||
| Net Asset Value, offering and redemption price per share | N/A | N/A | N/A | $ | 16.18 | N/A | ||||||||||||||
| Net Assets | N/A | N/A | N/A | $ | 3,451,410 | N/A | ||||||||||||||
| Shares of beneficial interest outstanding (unlimited number of shares, no par value common stock authorized) | N/A | N/A | N/A | 213,360 | N/A | |||||||||||||||
| Class L: | ||||||||||||||||||||
| Net Asset Value, offering and redemption price per share | N/A | N/A | N/A | $ | 16.41 | N/A | ||||||||||||||
| Net Assets | N/A | N/A | N/A | $ | 25,308,713 | N/A | ||||||||||||||
| Shares of beneficial interest outstanding (unlimited number of shares, no par value common stock authorized) | N/A | N/A | N/A | 1,542,237 | N/A |
| (a) | Redemption price per share may be reduced for any applicable contingent deferred sales charge. For a description of a possible sales charge, please see the Fund’s Prospectus. |
See Notes to Financial Statements.
125 | October 31, 2017
RiverFront Global Allocation Series
| Statements of Operations | For the Year Ended October 31, 2017 |
| RiverFront Conservative Income Builder Fund | RiverFront Dynamic Equity Income Fund | RiverFront Global Allocation Fund | RiverFront Global Growth Fund | RiverFront Moderate Growth & Income Fund | ||||||||||||||||
| INVESTMENT INCOME | ||||||||||||||||||||
| Dividends | $ | 301,716 | $ | 1,757,684 | $ | 750,399 | $ | 1,304,497 | $ | 2,803,716 | ||||||||||
| Dividends from affiliated securities | 30,350 | 127,210 | 27,421 | – | 284,536 | |||||||||||||||
| Total Investment Income | 332,066 | 1,884,894 | 777,820 | 1,304,497 | 3,088,252 | |||||||||||||||
| EXPENSES | ||||||||||||||||||||
| Investment advisory fees | 106,587 | 665,975 | 286,814 | 505,543 | 1,005,004 | |||||||||||||||
| Administrative fees | 14,501 | 82,139 | 36,504 | 62,713 | 123,061 | |||||||||||||||
| Transfer agency fees | 2,247 | 11,862 | 7,315 | 8,321 | 17,172 | |||||||||||||||
| Distribution and service fees | ||||||||||||||||||||
| Class A | 1,946 | 47,388 | 17,130 | 23,524 | 47,127 | |||||||||||||||
| Class C | 95,011 | 290,937 | 127,143 | 107,836 | 569,138 | |||||||||||||||
| Investor Class | – | – | – | 9,510 | – | |||||||||||||||
| Professional fees | 26,011 | 33,146 | 28,216 | 31,070 | 37,144 | |||||||||||||||
| Reports to shareholders and printing fees | 3,315 | 16,408 | 7,836 | 14,565 | 21,679 | |||||||||||||||
| State registration fees | 44,681 | 45,136 | 41,863 | 70,162 | 45,408 | |||||||||||||||
| Insurance fees | 142 | 765 | 335 | 554 | 1,210 | |||||||||||||||
| Custody fees | 5,142 | 8,261 | 6,697 | 6,930 | 10,119 | |||||||||||||||
| Trustees’ fees and expenses | 294 | 1,794 | 781 | 1,353 | 2,743 | |||||||||||||||
| Miscellaneous expenses | 8,854 | 14,442 | 10,611 | 14,037 | 17,891 | |||||||||||||||
| Total Expenses | 308,731 | 1,218,253 | 571,245 | 856,118 | 1,897,696 | |||||||||||||||
| Less fees waived/reimbursed by investment advisor (Note 8) | ||||||||||||||||||||
| Class A | (6,450 | ) | (42,515 | ) | (25,280 | ) | (28,197 | ) | (34,261 | ) | ||||||||||
| Class C | (73,998 | ) | (64,094 | ) | (45,950 | ) | (32,454 | ) | (105,924 | ) | ||||||||||
| Class I | (18,636 | ) | (68,279 | ) | (52,138 | ) | (37,405 | ) | (78,157 | ) | ||||||||||
| Class L | – | – | – | (70,415 | ) | – | ||||||||||||||
| Investor Class | – | – | – | (11,385 | ) | – | ||||||||||||||
| Net Expenses | 209,647 | 1,043,365 | 447,877 | 676,262 | 1,679,354 | |||||||||||||||
| Net Investment Income | 122,419 | 841,529 | 329,943 | 628,235 | 1,408,898 | |||||||||||||||
| Net realized gain on investments | 450,188 | 3,851,867 | 1,675,628 | 2,808,836 | 6,944,003 | |||||||||||||||
| Net realized gain on investments - affiliated securities | 6,006 | 15,160 | 6,008 | – | 35,789 | |||||||||||||||
| Net realized gain | 456,194 | 3,867,027 | 1,681,636 | 2,808,836 | 6,979,792 | |||||||||||||||
| Net change in unrealized appreciation on investments | 347,948 | 8,385,109 | 4,210,425 | 8,317,596 | 5,631,326 | |||||||||||||||
| Net change in unrealized appreciation/(depreciation) on investments - affiliated securities | (3,162 | ) | 6,459 | (1,514 | ) | – | 1,372 | |||||||||||||
| Net change in unrealized appreciation | 344,786 | 8,391,568 | 4,208,911 | 8,317,596 | 5,632,698 | |||||||||||||||
| NET REALIZED AND UNREALIZED GAIN ON INVESTMENTS | 800,980 | 12,258,595 | 5,890,547 | 11,126,432 | 12,612,490 | |||||||||||||||
| NET INCREASE IN NET ASSETS RESULTING FROM OPERATIONS | $ | 923,399 | $ | 13,100,124 | $ | 6,220,490 | $ | 11,754,667 | $ | 14,021,388 | ||||||||||
See Notes to Financial Statements.
126 | October 31, 2017
RiverFront Conservative Income Builder Fund
Statements of Changes in Net Assets
| For the Year Ended October 31, 2017 | For the Year Ended October 31, 2016 | |||||||
| OPERATIONS | ||||||||
| Net investment income | $ | 122,419 | $ | 156,626 | ||||
| Net realized gain/(loss) | 456,194 | (251,842 | ) | |||||
| Net realized gain distributions from other investment companies | – | 14,171 | ||||||
| Net change in unrealized appreciation | 344,786 | 386,699 | ||||||
| Net Increase in Net Assets Resulting from Operations | 923,399 | 305,654 | ||||||
| DISTRIBUTIONS | ||||||||
| Dividends to shareholders from net investment income | ||||||||
| Class A | (8,438 | ) | (17,509 | ) | ||||
| Class C | (85,999 | ) | (89,502 | ) | ||||
| Class I | (32,538 | ) | (38,954 | ) | ||||
| Dividends to shareholders from net realized gains | ||||||||
| Class A | – | (2,507 | ) | |||||
| Class C | – | (22,903 | ) | |||||
| Class I | – | (4,731 | ) | |||||
| Net Decrease in Net Assets from Distributions | (126,975 | ) | (176,106 | ) | ||||
| BENEFICIAL INTEREST TRANSACTIONS (NOTE 6) | ||||||||
| Shares sold | ||||||||
| Class A | 665,209 | 420,705 | ||||||
| Class C | 1,197,684 | 4,689,259 | ||||||
| Class I | 936,031 | 924,264 | ||||||
| Dividends reinvested | ||||||||
| Class A | 7,848 | 15,336 | ||||||
| Class C | 68,273 | 88,919 | ||||||
| Class I | 29,171 | 39,098 | ||||||
| Shares redeemed | ||||||||
| Class A | (629,479 | ) | (449,844 | ) | ||||
| Class C | (6,175,398 | ) | (1,941,132 | ) | ||||
| Class I | (597,368 | ) | (885,514 | ) | ||||
| Net Increase/(Decrease) in Net Assets Derived from Beneficial Interest Transactions | (4,498,029 | ) | 2,901,091 | |||||
| Net increase/(decrease) in net assets | (3,701,605 | ) | 3,030,639 | |||||
| NET ASSETS | ||||||||
| Beginning of year | 14,850,731 | 11,820,092 | ||||||
| End of year * | $ | 11,149,126 | $ | 14,850,731 | ||||
| *Including accumulated net investment income of: | $ | 14,179 | $ | 18,735 | ||||
See Notes to Financial Statements.
127 | October 31, 2017
RiverFront Dynamic Equity Income Fund
Statements of Changes in Net Assets
| For the Year Ended October 31, 2017 | For the Year Ended October 31, 2016 | |||||||
| OPERATIONS | ||||||||
| Net investment income | $ | 841,529 | $ | 1,286,287 | ||||
| Net realized gain/(loss) | 3,867,027 | (2,793,901 | ) | |||||
| Net realized gain distributions from other investment companies | – | 425,575 | ||||||
| Net change in unrealized appreciation | 8,391,568 | 2,635,236 | ||||||
| Net Increase in Net Assets Resulting from Operations | 13,100,124 | 1,553,197 | ||||||
| DISTRIBUTIONS | ||||||||
| Dividends to shareholders from net investment income | ||||||||
| Class A | (226,123 | ) | (363,076 | ) | ||||
| Class C | (246,391 | ) | (435,892 | ) | ||||
| Class I | (416,860 | ) | (522,969 | ) | ||||
| Dividends to shareholders from net realized gains | ||||||||
| Class A | – | (404,558 | ) | |||||
| Class C | – | (716,376 | ) | |||||
| Class I | – | (508,283 | ) | |||||
| Net Decrease in Net Assets from Distributions | (889,374 | ) | (2,951,154 | ) | ||||
| BENEFICIAL INTEREST TRANSACTIONS (NOTE 6) | ||||||||
| Shares sold | ||||||||
| Class A | 2,098,660 | 6,764,353 | ||||||
| Class C | 2,376,050 | 6,073,884 | ||||||
| Class I | 7,915,259 | 12,082,276 | ||||||
| Dividends reinvested | ||||||||
| Class A | 214,625 | 733,284 | ||||||
| Class C | 225,203 | 1,063,615 | ||||||
| Class I | 377,119 | 898,243 | ||||||
| Shares redeemed | ||||||||
| Class A | (6,388,976 | ) | (6,714,335 | ) | ||||
| Class C | (12,784,214 | ) | (8,957,633 | ) | ||||
| Class I | (8,400,004 | ) | (6,584,758 | ) | ||||
| Net Increase/(Decrease) in Net Assets Derived from Beneficial Interest Transactions | (14,366,278 | ) | 5,358,929 | |||||
| Net increase/(decrease) in net assets | (2,155,528 | ) | 3,960,972 | |||||
| NET ASSETS | ||||||||
| Beginning of year | 81,276,492 | 77,315,520 | ||||||
| End of year * | $ | 79,120,964 | $ | 81,276,492 | ||||
| *Including accumulated net investment income of: | $ | 15,982 | $ | 63,827 | ||||
See Notes to Financial Statements.
128 | October 31, 2017
RiverFront Global Allocation Fund
Statements of Changes in Net Assets
| For the Year Ended October 31, 2017 | For the Year Ended October 31, 2016 | |||||||
| OPERATIONS | ||||||||
| Net investment income | $ | 329,943 | $ | 613,776 | ||||
| Net realized gain/(loss) | 1,681,636 | (1,835,751 | ) | |||||
| Net realized gain distributions from other investment companies | – | 250,884 | ||||||
| Net change in unrealized appreciation | 4,208,911 | 469,761 | ||||||
| Net Increase/(Decrease) in Net Assets Resulting from Operations | 6,220,490 | (501,330 | ) | |||||
| DISTRIBUTIONS | ||||||||
| Dividends to shareholders from net investment income | ||||||||
| Class A | (90,298 | ) | (91,282 | ) | ||||
| Class C | (183,505 | ) | (177,794 | ) | ||||
| Class I | (208,594 | ) | (226,575 | ) | ||||
| Dividends to shareholders from net realized gains | ||||||||
| Class A | – | (29,356 | ) | |||||
| Class C | – | (64,014 | ) | |||||
| Class I | – | (70,328 | ) | |||||
| Net Decrease in Net Assets from Distributions | (482,397 | ) | (659,349 | ) | ||||
| BENEFICIAL INTEREST TRANSACTIONS (NOTE 6) | ||||||||
| Shares sold | ||||||||
| Class A | 1,515,630 | 790,391 | ||||||
| Class C | 820,360 | 1,972,956 | ||||||
| Class I | 2,726,015 | 3,069,742 | ||||||
| Dividends reinvested | ||||||||
| Class A | 86,952 | 115,782 | ||||||
| Class C | 168,018 | 227,935 | ||||||
| Class I | 203,096 | 291,586 | ||||||
| Shares redeemed | ||||||||
| Class A | (1,801,890 | ) | (2,671,573 | ) | ||||
| Class C | (6,423,546 | ) | (4,064,780 | ) | ||||
| Class I | (4,514,866 | ) | (7,454,283 | ) | ||||
| Net Decrease in Net Assets Derived from Beneficial Interest Transactions | (7,220,231 | ) | (7,722,244 | ) | ||||
| Net decrease in net assets | (1,482,138 | ) | (8,882,923 | ) | ||||
| NET ASSETS | ||||||||
| Beginning of year | 35,401,046 | 44,283,969 | ||||||
| End of year * | $ | 33,918,908 | $ | 35,401,046 | ||||
| *Including accumulated net investment income of: | $ | 168,257 | $ | 320,711 | ||||
See Notes to Financial Statements.
129 | October 31, 2017
RiverFront Global Growth Fund
Statements of Changes in Net Assets
| For the Year Ended October 31, 2017 | For the Year Ended October 31, 2016 | |||||||
| OPERATIONS | ||||||||
| Net investment income | $ | 628,235 | $ | 1,188,564 | ||||
| Net realized gain/(loss) | 2,808,836 | (1,815,279 | ) | |||||
| Net realized gain distributions from other investment companies | – | 611,067 | ||||||
| Net change in unrealized appreciation/(depreciation) | 8,317,596 | (790,043 | ) | |||||
| Net Increase/(Decrease) in Net Assets Resulting from Operations | 11,754,667 | (805,691 | ) | |||||
| DISTRIBUTIONS | ||||||||
| Dividends to shareholders from net investment income | ||||||||
| Class A | (128,429 | ) | (262,359 | ) | ||||
| Class C | (142,083 | ) | (176,912 | ) | ||||
| Class I | (138,482 | ) | (232,251 | ) | ||||
| Class L | (307,313 | ) | (374,673 | ) | ||||
| Investor | (59,987 | ) | (97,169 | ) | ||||
| Dividends to shareholders from net realized gains | ||||||||
| Class A | – | (169,282 | ) | |||||
| Class C | – | (124,670 | ) | |||||
| Class I | – | (145,504 | ) | |||||
| Class L | – | (234,855 | ) | |||||
| Investor | – | (62,700 | ) | |||||
| Net Decrease in Net Assets from Distributions | (776,294 | ) | (1,880,375 | ) | ||||
| BENEFICIAL INTEREST TRANSACTIONS (NOTE 6) | ||||||||
| Shares sold | ||||||||
| Class A | 2,063,170 | 2,821,511 | ||||||
| Class C | 1,240,140 | 1,881,292 | ||||||
| Class I | 5,495,281 | 2,341,286 | ||||||
| Class L | 3,049,507 | 2,416,186 | ||||||
| Investor | 153,063 | 32,290 | ||||||
| Dividends reinvested | ||||||||
| Class A | 124,903 | 422,479 | ||||||
| Class C | 134,666 | 286,641 | ||||||
| Class I | 127,093 | 361,066 | ||||||
| Class L | 302,845 | 600,974 | ||||||
| Investor | 51,574 | 139,454 | ||||||
| Shares redeemed | ||||||||
| Class A | (4,592,296 | ) | (11,263,708 | ) | ||||
| Class C | (4,327,525 | ) | (3,147,775 | ) | ||||
| Class I | (4,213,503 | ) | (8,405,283 | ) | ||||
| Class L | (4,915,621 | ) | (5,853,893 | ) | ||||
| Investor | (2,120,267 | ) | (2,182,792 | ) | ||||
| Net Decrease in Net Assets Derived from Beneficial Interest Transactions | (7,426,970 | ) | (19,550,272 | ) | ||||
| Net increase/(decrease) in net assets | 3,551,403 | (22,236,338 | ) | |||||
| NET ASSETS | ||||||||
| Beginning of year | 58,424,546 | 80,660,884 | ||||||
| End of year * | $ | 61,975,949 | $ | 58,424,546 | ||||
| *Including accumulated net investment income of: | $ | 366,067 | $ | 514,126 | ||||
See Notes to Financial Statements.
130 | October 31, 2017
RiverFront Moderate Growth & Income Fund
Statements of Changes in Net Assets
| For the Year Ended October 31, 2017 | For the Year Ended October 31, 2016 | |||||||
| OPERATIONS | ||||||||
| Net investment income | $ | 1,408,898 | $ | 2,250,493 | ||||
| Net realized gain/(loss) | 6,979,792 | (3,323,874 | ) | |||||
| Net realized gain distributions from other investment companies | – | 468,489 | ||||||
| Net change in unrealized appreciation | 5,632,698 | 2,857,457 | ||||||
| Net Increase in Net Assets Resulting from Operations | 14,021,388 | 2,252,565 | ||||||
| DISTRIBUTIONS | ||||||||
| Dividends to shareholders from net investment income | ||||||||
| Class A | (272,881 | ) | (441,450 | ) | ||||
| Class C | (509,175 | ) | (831,009 | ) | ||||
| Class I | (667,961 | ) | (1,002,825 | ) | ||||
| Dividends to shareholders from net realized gains | ||||||||
| Class A | – | (503,888 | ) | |||||
| Class C | – | (1,550,040 | ) | |||||
| Class I | – | (1,081,829 | ) | |||||
| Net Decrease in Net Assets from Distributions | (1,450,017 | ) | (5,411,041 | ) | ||||
| BENEFICIAL INTEREST TRANSACTIONS (NOTE 6) | ||||||||
| Shares sold | ||||||||
| Class A | 1,502,648 | 4,421,568 | ||||||
| Class C | 2,821,593 | 10,166,181 | ||||||
| Class I | 8,441,309 | 17,234,510 | ||||||
| Dividends reinvested | ||||||||
| Class A | 237,474 | 827,954 | ||||||
| Class C | 425,136 | 2,077,127 | ||||||
| Class I | 549,599 | 1,889,684 | ||||||
| Shares redeemed | ||||||||
| Class A | (13,140,898 | ) | (6,554,572 | ) | ||||
| Class C | (21,454,023 | ) | (17,958,734 | ) | ||||
| Class I | (25,714,569 | ) | (21,252,975 | ) | ||||
| Net Decrease in Net Assets Derived from Beneficial Interest Transactions | (46,331,731 | ) | (9,149,257 | ) | ||||
| Net decrease in net assets | (33,760,360 | ) | (12,307,733 | ) | ||||
| NET ASSETS | ||||||||
| Beginning of year | 129,215,501 | 141,523,234 | ||||||
| End of year * | $ | 95,455,141 | $ | 129,215,501 | ||||
| *Including accumulated net investment income of: | $ | 151,684 | $ | 192,803 | ||||
See Notes to Financial Statements.
131 | October 31, 2017
RiverFront Conservative Income Builder Fund – Class A
Financial Highlights
Selected data for a share of beneficial interest outstanding throughout the periods indicated:
| For the Year Ended October 31, 2017 | For the Year Ended October 31, 2016 | For the Year Ended October 31, 2015 | For the Fiscal Period Ended October 31, 2014(a) | For the Year Ended April 30, 2014 | For the Period September 4, 2012 (Commencement) to April 30, 2013 | |||||||||||||||||||
| Net asset value, beginning of period | $ | 10.53 | $ | 10.46 | $ | 10.86 | $ | 10.83 | $ | 10.48 | $ | 10.00 | ||||||||||||
| INCOME FROM INVESTMENT OPERATIONS: | ||||||||||||||||||||||||
| Net investment income(b) | 0.16 | 0.18 | 0.18 | 0.07 | 0.13 | 0.09 | ||||||||||||||||||
| Net realized and unrealized gain/(loss) | 0.71 | 0.07 | (0.14 | ) | 0.04 | 0.53 | 0.48 | |||||||||||||||||
| Total from investment operations | 0.87 | 0.25 | 0.04 | 0.11 | 0.66 | 0.57 | ||||||||||||||||||
| DISTRIBUTIONS: | ||||||||||||||||||||||||
| From net investment income | (0.15 | ) | (0.16 | ) | (0.15 | ) | (0.08 | ) | (0.12 | ) | (0.09 | ) | ||||||||||||
| From net realized gains | – | (0.02 | ) | (0.29 | ) | – | (0.19 | ) | – | |||||||||||||||
| Total distributions | (0.15 | ) | (0.18 | ) | (0.44 | ) | (0.08 | ) | (0.31 | ) | (0.09 | ) | ||||||||||||
| Net increase/(decrease) in net asset value | 0.72 | 0.07 | (0.40 | ) | 0.03 | 0.35 | 0.48 | |||||||||||||||||
| Net asset value, end of year | $ | 11.25 | $ | 10.53 | $ | 10.46 | $ | 10.86 | $ | 10.83 | $ | 10.48 | ||||||||||||
| TOTAL RETURN(c) | 8.33 | % | 2.47 | % | 0.40 | % | 0.98 | % | 6.35 | % | 5.72 | % | ||||||||||||
| RATIOS/SUPPLEMENTAL DATA: | ||||||||||||||||||||||||
| Net assets, end of year (000s) | $ | 1,133 | $ | 1,037 | $ | 1,038 | $ | 1,089 | $ | 1,101 | $ | 607 | ||||||||||||
| Ratio of expenses to average net assets excluding fee waivers and reimbursements | 1.98 | % | 1.84 | % | 2.06 | % | 2.39 | %(d) | 2.94 | % | 5.65 | %(d)(e) | ||||||||||||
| Ratio of expenses to average net assets including fee waivers and reimbursements | 1.15 | % | 1.15 | % | 1.15 | % | 1.15 | %(d) | 1.15 | % | 1.15 | %(d)(e) | ||||||||||||
| Ratio of net investment income to average net assets | 1.44 | % | 1.68 | % | 1.74 | % | 1.22 | %(d) | 1.27 | % | 1.37 | %(d)(e) | ||||||||||||
| Portfolio turnover rate(f) | 63 | % | 137 | % | 186 | % | 34 | % | 125 | % | 73 | % | ||||||||||||
| (a) | Effective May 1, 2014, the Board approved changing the fiscal year-end of the Funds from April 30 to October 31. |
| (b) | Calculated using the average shares method. |
| (c) | Total returns are for the period indicated and have not been annualized. Total returns would have been lower had certain expenses not been waived during the period. Returns shown do not reflect the deduction of taxes that a shareholder would pay on Fund distributions or the redemption of Fund shares. Returns shown exclude any applicable sales charges. |
| (d) | Annualized. |
| (e) | Expense ratios before reductions for startup periods may not be representative of longer term operating periods. |
| (f) | Portfolio turnover rate for periods less than one full year have not been annualized. |
See Notes to Financial Statements.
132 | October 31, 2017
RiverFront Conservative Income Builder Fund – Class C
Financial Highlights
Selected data for a share of beneficial interest outstanding throughout the periods indicated:
| For the Year Ended October 31, 2017 | For the Year Ended October 31, 2016 | For the Year Ended October 31, 2015 | For the Fiscal Period Ended October 31, 2014(a) | For the Year Ended April 30, 2014 | For the Period September 4, 2012 (Commencement) to April 30, 2013 | |||||||||||||||||||
| Net asset value, beginning of period | $ | 10.44 | $ | 10.37 | $ | 10.81 | $ | 10.77 | $ | 10.51 | $ | 10.00 | ||||||||||||
| INCOME FROM INVESTMENT OPERATIONS: | ||||||||||||||||||||||||
| Net investment income(b) | 0.08 | 0.10 | 0.09 | 0.03 | 0.06 | 0.06 | ||||||||||||||||||
| Net realized and unrealized gain/(loss) | 0.69 | 0.08 | (0.13 | ) | 0.04 | 0.51 | 0.47 | |||||||||||||||||
| Total from investment operations | 0.77 | 0.18 | (0.04 | ) | 0.07 | 0.57 | 0.53 | |||||||||||||||||
| DISTRIBUTIONS: | ||||||||||||||||||||||||
| From net investment income | (0.09 | ) | (0.09 | ) | (0.11 | ) | (0.03 | ) | (0.12 | ) | (0.02 | ) | ||||||||||||
| From net realized gains | – | (0.02 | ) | (0.29 | ) | – | (0.19 | ) | – | |||||||||||||||
| Total distributions | (0.09 | ) | (0.11 | ) | (0.40 | ) | (0.03 | ) | (0.31 | ) | (0.02 | ) | ||||||||||||
| Net increase/(decrease) in net asset value | 0.68 | 0.07 | (0.44 | ) | 0.04 | 0.26 | 0.51 | |||||||||||||||||
| Net asset value, end of year | $ | 11.12 | $ | 10.44 | $ | 10.37 | $ | 10.81 | $ | 10.77 | $ | 10.51 | ||||||||||||
| TOTAL RETURN(c) | 7.42 | % | 1.74 | % | (0.39 | )% | 0.68 | % | 5.49 | % | 5.29 | % | ||||||||||||
| RATIOS/SUPPLEMENTAL DATA: | ||||||||||||||||||||||||
| Net assets, end of year (000s) | $ | 7,234 | $ | 11,550 | $ | 8,610 | $ | 5,021 | $ | 4,106 | $ | 2,264 | ||||||||||||
| Ratio of expenses to average net assets excluding fee waivers and reimbursements | 2.68 | % | 2.60 | % | 2.81 | % | 3.14 | %(d) | 3.73 | % | 6.53 | %(d)(e) | ||||||||||||
| Ratio of expenses to average net assets including fee waivers and reimbursements | 1.90 | % | 1.90 | % | 1.90 | % | 1.90 | %(d) | 1.90 | % | 1.90 | %(d)(e) | ||||||||||||
| Ratio of net investment income to average net assets | 0.77 | % | 0.92 | % | 0.88 | % | 0.47 | %(d) | 0.53 | % | 0.90 | %(d)(e) | ||||||||||||
| Portfolio turnover rate(f) | 63 | % | 137 | % | 186 | % | 34 | % | 125 | % | 73 | % | ||||||||||||
| (a) | Effective May 1, 2014, the Board approved changing the fiscal year-end of the Funds from April 30 to October 31. |
| (b) | Calculated using the average shares method. |
| (c) | Total returns are for the period indicated and have not been annualized. Total returns would have been lower had certain expenses not been waived during the period. Returns shown do not reflect the deduction of taxes that a shareholder would pay on Fund distributions or the redemption of Fund shares. Returns shown exclude any applicable sales charges. |
| (d) | Annualized. |
| (e) | Expense ratios before reductions for startup periods may not be representative of longer term operating periods. |
| (f) | Portfolio turnover rate for periods less than one full year have not been annualized. |
See Notes to Financial Statements.
133 | October 31, 2017
RiverFront Conservative Income Builder Fund – Class I
Financial Highlights
Selected data for a share of beneficial interest outstanding throughout the periods indicated:
| For the Year Ended October 31, 2017 | For the Year Ended October 31, 2016 | For the Year Ended October 31, 2015 | For the Fiscal Period Ended October 31, 2014(a) | For the Year Ended April 30, 2014 | For the Period September 4, 2012 (Commencement) to April 30, 2013 | |||||||||||||||||||
| Net asset value, beginning of period | $ | 10.36 | $ | 10.30 | $ | 10.70 | $ | 10.66 | $ | 10.29 | $ | 10.00 | ||||||||||||
| INCOME FROM INVESTMENT OPERATIONS: | ||||||||||||||||||||||||
| Net investment income(b) | 0.18 | 0.19 | 0.19 | 0.07 | 0.15 | 0.12 | ||||||||||||||||||
| Net realized and unrealized gain/(loss) | 0.70 | 0.08 | (0.13 | ) | 0.06 | 0.51 | 0.46 | |||||||||||||||||
| Total from investment operations | 0.88 | 0.27 | 0.06 | 0.13 | 0.66 | 0.58 | ||||||||||||||||||
| DISTRIBUTIONS: | ||||||||||||||||||||||||
| From net investment income | (0.16 | ) | (0.19 | ) | (0.17 | ) | (0.09 | ) | (0.10 | ) | (0.29 | ) | ||||||||||||
| From net realized gains | – | (0.02 | ) | (0.29 | ) | – | (0.19 | ) | – | |||||||||||||||
| Total distributions | (0.16 | ) | (0.21 | ) | (0.46 | ) | (0.09 | ) | (0.29 | ) | (0.29 | ) | ||||||||||||
| Net increase/(decrease) in net asset value | 0.72 | 0.06 | (0.40 | ) | 0.04 | 0.37 | 0.29 | |||||||||||||||||
| Net asset value, end of year | $ | 11.08 | $ | 10.36 | $ | 10.30 | $ | 10.70 | $ | 10.66 | $ | 10.29 | ||||||||||||
| TOTAL RETURN(c) | 8.60 | % | 2.66 | % | 0.60 | % | 1.19 | % | 6.53 | % | 5.95 | % | ||||||||||||
| RATIOS/SUPPLEMENTAL DATA: | ||||||||||||||||||||||||
| Net assets, end of year (000s) | $ | 2,783 | $ | 2,264 | $ | 2,171 | $ | 2,830 | $ | 1,381 | $ | 715 | ||||||||||||
| Ratio of expenses to average net assets excluding fee waivers and reimbursements | 1.71 | % | 1.60 | % | 1.80 | % | 2.12 | %(d) | 2.66 | % | 7.74 | %(d)(e) | ||||||||||||
| Ratio of expenses to average net assets including fee waivers and reimbursements | 0.90 | % | 0.90 | % | 0.90 | % | 0.90 | %(d) | 0.90 | % | 0.90 | %(d)(e) | ||||||||||||
| Ratio of net investment income to average net assets | 1.68 | % | 1.90 | % | 1.84 | % | 1.34 | %(d) | 1.49 | % | 1.84 | %(d)(e) | ||||||||||||
| Portfolio turnover rate(f) | 63 | % | 137 | % | 186 | % | 34 | % | 125 | % | 73 | % | ||||||||||||
| (a) | Effective May 1, 2014, the Board approved changing the fiscal year-end of the Funds from April 30 to October 31. |
| (b) | Calculated using the average shares method. |
| (c) | Total returns are for the period indicated and have not been annualized. Total returns would have been lower had certain expenses not been waived during the period. Returns shown do not reflect the deduction of taxes that a shareholder would pay on Fund distributions or the redemption of Fund shares. |
| (d) | Annualized. |
| (e) | Expense ratios before reductions for startup periods may not be representative of longer term operating periods. |
| (f) | Portfolio turnover rate for periods less than one full year have not been annualized. |
See Notes to Financial Statements.
134 | October 31, 2017
RiverFront Dynamic Equity Income Fund – Class A
Financial Highlights
Selected data for a share of beneficial interest outstanding throughout the periods indicated:
| For the Year Ended October 31, 2017 | For the Year Ended October 31, 2016 | For the Year Ended October 31, 2015 | For the Fiscal Period Ended October 31, 2014(a) | For the Year Ended April 30, 2014 | For the Year Ended April 30, 2013 | |||||||||||||||||||
| Net asset value, beginning of period | $ | 12.38 | $ | 12.63 | $ | 13.10 | $ | 12.97 | $ | 12.24 | $ | 11.24 | ||||||||||||
| INCOME/(LOSS) FROM INVESTMENT OPERATIONS: | ||||||||||||||||||||||||
| Net investment income(b) | 0.17 | 0.21 | 0.25 | 0.09 | 0.17 | 0.25 | ||||||||||||||||||
| Net realized and unrealized gain/(loss) | 2.09 | (0.00 | )(c) | (0.04 | ) | 0.13 | 1.17 | 0.99 | ||||||||||||||||
| Total from investment operations | 2.26 | 0.21 | 0.21 | 0.22 | 1.34 | 1.24 | ||||||||||||||||||
| DISTRIBUTIONS: | ||||||||||||||||||||||||
| From net investment income | (0.16 | ) | (0.21 | ) | (0.22 | ) | (0.09 | ) | (0.17 | ) | (0.24 | ) | ||||||||||||
| From net realized gains | – | (0.25 | ) | (0.46 | ) | – | (0.44 | ) | – | |||||||||||||||
| Total distributions | (0.16 | ) | (0.46 | ) | (0.68 | ) | (0.09 | ) | (0.61 | ) | (0.24 | ) | ||||||||||||
| Net increase/(decrease) in net asset value | 2.10 | (0.25 | ) | (0.47 | ) | 0.13 | 0.73 | 1.00 | ||||||||||||||||
| Net asset value, end of year | $ | 14.48 | $ | 12.38 | $ | 12.63 | $ | 13.10 | $ | 12.97 | $ | 12.24 | ||||||||||||
| TOTAL RETURN(d) | 18.37 | % | 1.80 | % | 1.64 | % | 1.66 | % | 11.15 | % | 11.22 | % | ||||||||||||
| RATIOS/SUPPLEMENTAL DATA: | ||||||||||||||||||||||||
| Net assets, end of year (000s) | $ | 19,123 | $ | 20,227 | $ | 19,769 | $ | 17,275 | $ | 15,374 | $ | 8,087 | ||||||||||||
| Ratio of expenses to average net assets excluding fee waivers and reimbursements | 1.37 | % | 1.35 | % | 1.35 | % | 1.39 | %(e) | 1.42 | % | 1.58 | % | ||||||||||||
| Ratio of expenses to average net assets including fee waivers and reimbursements | 1.15 | % | 1.15 | % | 1.15 | % | 1.15 | %(e) | 1.15 | % | 1.20 | %(f) | ||||||||||||
| Ratio of net investment income to average net assets | 1.24 | % | 1.74 | % | 1.98 | % | 1.33 | %(e) | 1.38 | % | 2.17 | % | ||||||||||||
| Portfolio turnover rate(g) | 63 | % | 129 | % | 75 | % | 45 | % | 99 | % | 136 | % | ||||||||||||
| (a) | Effective May 1, 2014, the Board approved changing the fiscal year-end of the Funds from April 30 to October 31. |
| (b) | Calculated using the average shares method. |
| (c) | Less than $0.005 or ($0.005) per share. |
| (d) | Total returns are for the period indicated and have not been annualized. Total returns would have been lower had certain expenses not been waived during the period. Returns shown do not reflect the deduction of taxes that a shareholder would pay on Fund distributions or the redemption of Fund shares. Returns shown exclude any applicable sales charges. |
| (e) | Annualized. |
| (f) | Contractual expense limitation change from 1.05% to 0.90% effective September 1, 2012. |
| (g) | Portfolio turnover rate for periods less than one full year have not been annualized. |
See Notes to Financial Statements.
135 | October 31, 2017
RiverFront Dynamic Equity Income Fund – Class C
Financial Highlights
Selected data for a share of beneficial interest outstanding throughout the periods indicated:
| For the Year Ended October 31, 2017 | For the Year Ended October 31, 2016 | For the Year Ended October 31, 2015 | For the Fiscal Period Ended October 31, 2014(a) | For the Year Ended April 30, 2014 | For the Year Ended April 30, 2013 | |||||||||||||||||||
| Net asset value, beginning of period | $ | 12.15 | $ | 12.44 | $ | 12.97 | $ | 12.84 | $ | 12.13 | $ | 11.14 | ||||||||||||
| INCOME/(LOSS) FROM INVESTMENT OPERATIONS: | ||||||||||||||||||||||||
| Net investment income(b) | 0.07 | 0.13 | 0.15 | 0.04 | 0.08 | 0.16 | ||||||||||||||||||
| Net realized and unrealized gain/(loss) | 2.05 | (0.02 | ) | (0.04 | ) | 0.13 | 1.15 | 0.98 | ||||||||||||||||
| Total from investment operations | 2.12 | 0.11 | 0.11 | 0.17 | 1.23 | 1.14 | ||||||||||||||||||
| DISTRIBUTIONS: | ||||||||||||||||||||||||
| From net investment income | (0.11 | ) | (0.15 | ) | (0.18 | ) | (0.04 | ) | (0.08 | ) | (0.15 | ) | ||||||||||||
| From net realized gains | – | (0.25 | ) | (0.46 | ) | – | (0.44 | ) | – | |||||||||||||||
| Total distributions | (0.11 | ) | (0.40 | ) | (0.64 | ) | (0.04 | ) | (0.52 | ) | (0.15 | ) | ||||||||||||
| Net increase/(decrease) in net asset value | 2.01 | (0.29 | ) | (0.53 | ) | 0.13 | 0.71 | 0.99 | ||||||||||||||||
| Net asset value, end of year | $ | 14.16 | $ | 12.15 | $ | 12.44 | $ | 12.97 | $ | 12.84 | $ | 12.13 | ||||||||||||
| TOTAL RETURN(c) | 17.53 | % | 0.97 | % | 0.86 | % | 1.30 | % | 10.34 | % | 10.41 | % | ||||||||||||
| RATIOS/SUPPLEMENTAL DATA: | ||||||||||||||||||||||||
| Net assets, end of year (000s) | $ | 26,514 | $ | 32,217 | $ | 34,766 | $ | 30,170 | $ | 25,787 | $ | 16,070 | ||||||||||||
| Ratio of expenses to average net assets excluding fee waivers and reimbursements | 2.12 | % | 2.10 | % | 2.10 | % | 2.15 | %(d) | 2.18 | % | 2.33 | % | ||||||||||||
| Ratio of expenses to average net assets including fee waivers and reimbursements | 1.90 | % | 1.90 | % | 1.90 | % | 1.90 | %(d) | 1.90 | % | 1.95 | %(e) | ||||||||||||
| Ratio of net investment income to average net assets | 0.51 | % | 1.08 | % | 1.18 | % | 0.60 | %(d) | 0.61 | % | 1.44 | % | ||||||||||||
| Portfolio turnover rate(f) | 63 | % | 129 | % | 75 | % | 45 | % | 99 | % | 136 | % | ||||||||||||
| (a) | Effective May 1, 2014, the Board approved changing the fiscal year-end of the Funds from April 30 to October 31. |
| (b) | Calculated using the average shares method. |
| (c) | Total returns are for the period indicated and have not been annualized. Total returns would have been lower had certain expenses not been waived during the period. Returns shown do not reflect the deduction of taxes that a shareholder would pay on Fund distributions or the redemption of Fund shares. Returns shown exclude any applicable sales charges. |
| (d) | Annualized. |
| (e) | Contractual expense limitation change from 2.05% to 1.90% effective September 1, 2012. |
| (f) | Portfolio turnover rate for periods less than one full year have not been annualized. |
See Notes to Financial Statements.
136 | October 31, 2017
RiverFront Dynamic Equity Income Fund – Class I
Financial Highlights
Selected data for a share of beneficial interest outstanding throughout the periods indicated:
| For the Year Ended October 31, 2017 | For the Year Ended October 31, 2016 | For the Year Ended October 31, 2015 | For the Fiscal Period Ended October 31, 2014(a) | For the Year Ended April 30, 2014 | For the Year Ended April 30, 2013 | |||||||||||||||||||
| Net asset value, beginning of period | $ | 12.31 | $ | 12.56 | $ | 13.02 | $ | 12.88 | $ | 12.16 | $ | 11.17 | ||||||||||||
| INCOME/(LOSS) FROM INVESTMENT OPERATIONS: | ||||||||||||||||||||||||
| Net investment income(b) | 0.20 | 0.25 | 0.28 | 0.10 | 0.20 | 0.27 | ||||||||||||||||||
| Net realized and unrealized gain/(loss) | 2.09 | (0.01 | ) | (0.05 | ) | 0.14 | 1.16 | 0.99 | ||||||||||||||||
| Total from investment operations | 2.29 | 0.24 | 0.23 | 0.24 | 1.36 | 1.26 | ||||||||||||||||||
| DISTRIBUTIONS: | ||||||||||||||||||||||||
| From net investment income | (0.18 | ) | (0.24 | ) | (0.23 | ) | (0.10 | ) | (0.20 | ) | (0.27 | ) | ||||||||||||
| From net realized gains | – | (0.25 | ) | (0.46 | ) | – | (0.44 | ) | – | |||||||||||||||
| Total distributions | (0.18 | ) | (0.49 | ) | (0.69 | ) | (0.10 | ) | (0.64 | ) | (0.27 | ) | ||||||||||||
| Net increase/(decrease) in net asset value | 2.11 | (0.25 | ) | (0.46 | ) | 0.14 | 0.72 | 0.99 | ||||||||||||||||
| Net asset value, end of year | $ | 14.42 | $ | 12.31 | $ | 12.56 | $ | 13.02 | $ | 12.88 | $ | 12.16 | ||||||||||||
| TOTAL RETURN(c) | 18.75 | % | 2.01 | % | 1.83 | % | 1.88 | % | 11.40 | % | 11.47 | % | ||||||||||||
| RATIOS/SUPPLEMENTAL DATA: | ||||||||||||||||||||||||
| Net assets, end of year (000s) | $ | 33,484 | $ | 28,833 | $ | 22,780 | $ | 20,997 | $ | 18,254 | $ | 10,460 | ||||||||||||
| Ratio of expenses to average net assets excluding fee waivers and reimbursements | 1.12 | % | 1.10 | % | 1.10 | % | 1.15 | %(d) | 1.17 | % | 1.33 | % | ||||||||||||
| Ratio of expenses to average net assets including fee waivers and reimbursements | 0.90 | % | 0.90 | % | 0.90 | % | 0.90 | %(d) | 0.90 | % | 0.95 | %(e) | ||||||||||||
| Ratio of net investment income to average net assets | 1.50 | % | 2.06 | % | 2.21 | % | 1.57 | %(d) | 1.61 | % | 2.36 | % | ||||||||||||
| Portfolio turnover rate(f) | 63 | % | 129 | % | 75 | % | 45 | % | 99 | % | 136 | % | ||||||||||||
| (a) | Effective May 1, 2014, the Board approved changing the fiscal year-end of the Funds from April 30 to October 31. |
| (b) | Calculated using the average shares method. |
| (c) | Total returns are for the period indicated and have not been annualized. Total returns would have been lower had certain expenses not been waived during the period. Returns shown do not reflect the deduction of taxes that a shareholder would pay on Fund distributions or the redemption of Fund shares. |
| (d) | Annualized. |
| (e) | Contractual expense limitation change from 1.05% to 0.90% effective September 1, 2012. |
| (f) | Portfolio turnover rate for periods less than one full year have not been annualized. |
See Notes to Financial Statements.
137 | October 31, 2017
RiverFront Global Allocation Fund – Class A
Financial Highlights
Selected data for a share of beneficial interest outstanding throughout the periods indicated:
| For the Year Ended October 31, 2017 | For the Year Ended October 31, 2016 | For the Year Ended October 31, 2015 | For the Fiscal Period Ended October 31, 2014(a) | For the Year Ended April 30, 2014 | For the Year Ended April 30, 2013 | |||||||||||||||||||
| Net asset value, beginning of period | $ | 11.91 | $ | 12.20 | $ | 13.14 | $ | 12.97 | $ | 11.93 | $ | 10.86 | ||||||||||||
| INCOME/(LOSS) FROM INVESTMENT OPERATIONS: | ||||||||||||||||||||||||
| Net investment income(b) | 0.15 | 0.21 | 0.22 | 0.08 | 0.10 | 0.15 | ||||||||||||||||||
| Net realized and unrealized gain/(loss) | 2.23 | (0.32 | ) | (0.06 | ) | 0.09 | 1.36 | 1.08 | ||||||||||||||||
| Total from investment operations | 2.38 | (0.11 | ) | 0.16 | 0.17 | 1.46 | 1.23 | |||||||||||||||||
| DISTRIBUTIONS: | ||||||||||||||||||||||||
| From net investment income | (0.17 | ) | (0.14 | ) | (0.21 | ) | – | (0.09 | ) | (0.16 | ) | |||||||||||||
| From net realized gains | – | (0.04 | ) | (0.89 | ) | – | (0.33 | ) | – | |||||||||||||||
| Total distributions | (0.17 | ) | (0.18 | ) | (1.10 | ) | – | (0.42 | ) | (0.16 | ) | |||||||||||||
| Net increase/(decrease) in net asset value | 2.21 | (0.29 | ) | (0.94 | ) | 0.17 | 1.04 | 1.07 | ||||||||||||||||
| Net asset value, end of year | $ | 14.12 | $ | 11.91 | $ | 12.20 | $ | 13.14 | $ | 12.97 | $ | 11.93 | ||||||||||||
| TOTAL RETURN(c) | 20.22 | % | (0.88 | )% | 1.23 | % | 1.31 | % | 12.32 | % | 11.47 | % | ||||||||||||
| RATIOS/SUPPLEMENTAL DATA: | ||||||||||||||||||||||||
| Net assets, end of year (000s) | $ | 7,452 | $ | 6,467 | $ | 8,456 | $ | 8,372 | $ | 9,098 | $ | 8,244 | ||||||||||||
| Ratio of expenses to average net assets excluding fee waivers and reimbursements | 1.52 | % | 1.45 | % | 1.43 | % | 1.50 | %(d) | 1.51 | % | 1.68 | % | ||||||||||||
| Ratio of expenses to average net assets including fee waivers and reimbursements | 1.15 | % | 1.15 | % | 1.15 | % | 1.15 | %(d) | 1.15 | % | 1.19 | %(e) | ||||||||||||
| Ratio of net investment income to average net assets | 1.14 | % | 1.78 | % | 1.71 | % | 1.21 | %(d) | 0.83 | % | 1.32 | % | ||||||||||||
| Portfolio turnover rate(f) | 56 | % | 124 | % | 71 | % | 47 | % | 95 | % | 113 | % | ||||||||||||
| (a) | Effective May 1, 2014, the Board approved changing the fiscal year-end of the Funds from April 30 to October 31. |
| (b) | Calculated using the average shares method. |
| (c) | Total returns are for the period indicated and have not been annualized. Total returns would have been lower had certain expenses not been waived during the period. Returns shown do not reflect the deduction of taxes that a shareholder would pay on Fund distributions or the redemption of Fund shares. Returns shown exclude any applicable sales charges. |
| (d) | Annualized. |
| (e) | Contractual expense limitation change from 1.05% to 0.90% effective September 1, 2012. |
| (f) | Portfolio turnover rate for periods less than one full year have not been annualized. |
See Notes to Financial Statements.
138 | October 31, 2017
RiverFront Global Allocation Fund – Class C
Financial Highlights
Selected data for a share of beneficial interest outstanding throughout the periods indicated:
| For the Year Ended October 31, 2017 | For the Year Ended October 31, 2016 | For the Year Ended October 31, 2015 | For the Fiscal Period Ended October 31, 2014(a) | For the Year Ended April 30, 2014 | For the Year Ended April 30, 2013 | |||||||||||||||||||
| Net asset value, beginning of period | $ | 11.62 | $ | 11.98 | $ | 12.95 | $ | 12.83 | $ | 11.84 | $ | 10.81 | ||||||||||||
| INCOME/(LOSS) FROM INVESTMENT OPERATIONS: | ||||||||||||||||||||||||
| Net investment income(b) | 0.05 | 0.11 | 0.12 | 0.03 | 0.01 | 0.07 | ||||||||||||||||||
| Net realized and unrealized gain/(loss) | 2.17 | (0.31 | ) | (0.06 | ) | 0.09 | 1.34 | 1.07 | ||||||||||||||||
| Total from investment operations | 2.22 | (0.20 | ) | 0.06 | 0.12 | 1.35 | 1.14 | |||||||||||||||||
| DISTRIBUTIONS: | ||||||||||||||||||||||||
| From net investment income | (0.15 | ) | (0.12 | ) | (0.14 | ) | – | (0.03 | ) | (0.11 | ) | |||||||||||||
| From net realized gains | – | (0.04 | ) | (0.89 | ) | – | (0.33 | ) | – | |||||||||||||||
| Total distributions | (0.15 | ) | (0.16 | ) | (1.03 | ) | – | (0.36 | ) | (0.11 | ) | |||||||||||||
| Net increase/(decrease) in net asset value | 2.07 | (0.36 | ) | (0.97 | ) | 0.12 | 0.99 | 1.03 | ||||||||||||||||
| Net asset value, end of year | $ | 13.69 | $ | 11.62 | $ | 11.98 | $ | 12.95 | $ | 12.83 | $ | 11.84 | ||||||||||||
| TOTAL RETURN(c) | 19.36 | % | (1.61 | )% | 0.46 | % | 0.94 | % | 11.48 | % | 10.59 | % | ||||||||||||
| RATIOS/SUPPLEMENTAL DATA: | ||||||||||||||||||||||||
| Net assets, end of year (000s) | $ | 11,341 | $ | 14,694 | $ | 17,089 | $ | 14,758 | $ | 14,624 | $ | 9,686 | ||||||||||||
| Ratio of expenses to average net assets excluding fee waivers and reimbursements | 2.26 | % | 2.20 | % | 2.18 | % | 2.25 | %(d) | 2.26 | % | 2.44 | % | ||||||||||||
| Ratio of expenses to average net assets including fee waivers and reimbursements | 1.90 | % | 1.90 | % | 1.90 | % | 1.90 | %(d) | 1.90 | % | 1.95 | %(e) | ||||||||||||
| Ratio of net investment income to average net assets | 0.42 | % | 0.95 | % | 0.94 | % | 0.40 | %(d) | 0.05 | % | 0.66 | % | ||||||||||||
| Portfolio turnover rate(f) | 56 | % | 124 | % | 71 | % | 47 | % | 95 | % | 113 | % | ||||||||||||
| (a) | Effective May 1, 2014, the Board approved changing the fiscal year-end of the Funds from April 30 to October 31. |
| (b) | Calculated using the average shares method. |
| (c) | Total returns are for the period indicated and have not been annualized. Total returns would have been lower had certain expenses not been waived during the period. Returns shown do not reflect the deduction of taxes that a shareholder would pay on Fund distributions or the redemption of Fund shares. Returns shown exclude any applicable sales charges. |
| (d) | Annualized. |
| (e) | Contractual expense limitation change from 2.05% to 1.90% effective September 1, 2012. |
| (f) | Portfolio turnover rate for periods less than one full year have not been annualized. |
See Notes to Financial Statements.
139 | October 31, 2017
RiverFront Global Allocation Fund – Class I
Financial Highlights
Selected data for a share of beneficial interest outstanding throughout the periods indicated:
| For the Year Ended October 31, 2017 | For the Year Ended October 31, 2016 | For the Year Ended October 31, 2015 | For the Fiscal Period Ended October 31, 2014(a) | For the Year Ended April 30, 2014 | For the Year Ended April 30, 2013 | |||||||||||||||||||
| Net asset value, beginning of period | $ | 11.73 | $ | 11.99 | $ | 12.92 | $ | 12.75 | $ | 11.72 | $ | 10.66 | ||||||||||||
| INCOME/(LOSS) FROM INVESTMENT OPERATIONS: | ||||||||||||||||||||||||
| Net investment income(b) | 0.18 | 0.22 | 0.22 | 0.09 | 0.13 | 0.17 | ||||||||||||||||||
| Net realized and unrealized gain/(loss) | 2.20 | (0.30 | ) | (0.04 | ) | 0.08 | 1.34 | 1.07 | ||||||||||||||||
| Total from investment operations | 2.38 | (0.08 | ) | 0.18 | 0.17 | 1.47 | 1.24 | |||||||||||||||||
| DISTRIBUTIONS: | ||||||||||||||||||||||||
| From net investment income | (0.17 | ) | (0.14 | ) | (0.22 | ) | – | (0.11 | ) | (0.18 | ) | |||||||||||||
| From net realized gains | – | (0.04 | ) | (0.89 | ) | – | (0.33 | ) | – | |||||||||||||||
| Total distributions | (0.17 | ) | (0.18 | ) | (1.11 | ) | – | (0.44 | ) | (0.18 | ) | |||||||||||||
| Net increase/(decrease) in net asset value | 2.21 | (0.26 | ) | (0.93 | ) | 0.17 | 1.03 | 1.06 | ||||||||||||||||
| Net asset value, end of year | $ | 13.94 | $ | 11.73 | $ | 11.99 | $ | 12.92 | $ | 12.75 | $ | 11.72 | ||||||||||||
| TOTAL RETURN(c) | 20.58 | % | (0.60 | )% | 1.49 | % | 1.33 | % | 12.61 | % | 11.73 | % | ||||||||||||
| RATIOS/SUPPLEMENTAL DATA: | ||||||||||||||||||||||||
| Net assets, end of year (000s) | $ | 15,126 | $ | 14,240 | $ | 18,739 | $ | 12,895 | $ | 10,521 | $ | 6,675 | ||||||||||||
| Ratio of expenses to average net assets excluding fee waivers and reimbursements | 1.27 | % | 1.20 | % | 1.18 | % | 1.26 | %(d) | 1.26 | % | 1.43 | % | ||||||||||||
| Ratio of expenses to average net assets including fee waivers and reimbursements | 0.90 | % | 0.90 | % | 0.90 | % | 0.90 | %(d) | 0.90 | % | 0.94 | %(e) | ||||||||||||
| Ratio of net investment income to average net assets | 1.39 | % | 1.94 | % | 1.83 | % | 1.41 | %(d) | 1.07 | % | 1.52 | % | ||||||||||||
| Portfolio turnover rate(f) | 56 | % | 124 | % | 71 | % | 47 | % | 95 | % | 113 | % | ||||||||||||
| (a) | Effective May 1, 2014, the Board approved changing the fiscal year-end of the Funds from April 30 to October 31. |
| (b) | Calculated using the average shares method. |
| (c) | Total returns are for the period indicated and have not been annualized. Total returns would have been lower had certain expenses not been waived during the period. Returns shown do not reflect the deduction of taxes that a shareholder would pay on Fund distributions or the redemption of Fund shares. |
| (d) | Annualized. |
| (e) | Contractual expense limitation change from 1.05% to 0.90% effective September 1, 2012. |
| (f) | Portfolio turnover rate for periods less than one full year have not been annualized. |
See Notes to Financial Statements.
140 | October 31, 2017
RiverFront Global Growth Fund – Class A
Financial Highlights
Selected data for a share of beneficial interest outstanding throughout the periods indicated:
| For the Year Ended October 31, 2017 | For the Year Ended October 31, 2016 | For the Year Ended October 31, 2015 | For the Fiscal Period Ended October 31, 2014(a) | For the Year Ended April 30, 2014 | For the Year Ended April 30, 2013 | |||||||||||||||||||
| Net asset value, beginning of period | $ | 13.54 | $ | 13.95 | $ | 15.44 | $ | 15.26 | $ | 14.89 | $ | 13.37 | ||||||||||||
| INCOME/(LOSS) FROM INVESTMENT OPERATIONS: | ||||||||||||||||||||||||
| Net investment income(b) | 0.16 | 0.23 | 0.24 | 0.08 | 0.12 | 0.17 | ||||||||||||||||||
| Net realized and unrealized gain/(loss) | 2.76 | (0.31 | ) | (0.04 | ) | 0.10 | 1.88 | 1.57 | ||||||||||||||||
| Total from investment operations | 2.92 | (0.08 | ) | 0.20 | 0.18 | 2.00 | 1.74 | |||||||||||||||||
| DISTRIBUTIONS: | ||||||||||||||||||||||||
| From net investment income | (0.19 | ) | (0.20 | ) | (0.25 | ) | – | (0.12 | ) | (0.22 | ) | |||||||||||||
| From net realized gains | – | (0.13 | ) | (1.44 | ) | – | (1.51 | ) | – | |||||||||||||||
| Total distributions | (0.19 | ) | (0.33 | ) | (1.69 | ) | – | (1.63 | ) | (0.22 | ) | |||||||||||||
| Net increase/(decrease) in net asset value | 2.73 | (0.41 | ) | (1.49 | ) | 0.18 | 0.37 | 1.52 | ||||||||||||||||
| Net asset value, end of year | $ | 16.27 | $ | 13.54 | $ | 13.95 | $ | 15.44 | $ | 15.26 | $ | 14.89 | ||||||||||||
| TOTAL RETURN(c) | 21.81 | % | (0.57 | )% | 1.34 | % | 1.18 | % | 13.66 | % | 13.14 | % | ||||||||||||
| RATIOS/SUPPLEMENTAL DATA: | ||||||||||||||||||||||||
| Net assets, end of year (000s) | $ | 8,935 | $ | 9,618 | $ | 18,308 | $ | 16,694 | $ | 16,440 | $ | 8,525 | ||||||||||||
| Ratio of expenses to average net assets excluding fee waivers and reimbursements | 1.45 | % | 1.40 | % | 1.38 | % | 1.38 | %(d) | 1.40 | % | 1.49 | % | ||||||||||||
| Ratio of expenses to average net assets including fee waivers and reimbursements(e) | 1.15 | % | 1.15 | % | 1.15 | % | 1.15 | %(d) | 1.15 | % | 0.98 | % | ||||||||||||
| Ratio of net investment income to average net assets | 1.09 | % | 1.77 | % | 1.67 | % | 1.08 | %(d) | 0.76 | % | 1.23 | % | ||||||||||||
| Portfolio turnover rate(f) | 60 | % | 113 | % | 71 | % | 48 | % | 85 | % | 113 | % | ||||||||||||
| (a) | Effective May 1, 2014, the Board approved changing the fiscal year-end of the Funds from April 30 to October 31. |
| (b) | Calculated using the average shares method. |
| (c) | Total returns are for the period indicated and have not been annualized. Total returns would have been lower had certain expenses not been waived during the period. Returns shown do not reflect the deduction of taxes that a shareholder would pay on Fund distributions or the redemption of Fund shares. Returns shown exclude any applicable sales charges. |
| (d) | Annualized. |
| (e) | Prior to January 1, 2013, all acquired fund fees were reimbursed. |
| (f) | Portfolio turnover rate for periods less than one full year have not been annualized. |
See Notes to Financial Statements.
141 | October 31, 2017
RiverFront Global Growth Fund – Class C
Financial Highlights
Selected data for a share of beneficial interest outstanding throughout the periods indicated:
| For the Year Ended October 31, 2017 | For the Year Ended October 31, 2016 | For the Year Ended October 31, 2015 | For the Fiscal Period Ended October 31, 2014(a) | For the Year Ended April 30, 2014 | For the Year Ended April 30, 2013 | |||||||||||||||||||
| Net asset value, beginning of period | $ | 13.18 | $ | 13.67 | $ | 15.19 | $ | 15.07 | $ | 14.76 | $ | 13.29 | ||||||||||||
| INCOME/(LOSS) FROM INVESTMENT OPERATIONS: | ||||||||||||||||||||||||
| Net investment income(b) | 0.04 | 0.12 | 0.13 | 0.03 | 0.01 | 0.08 | ||||||||||||||||||
| Net realized and unrealized gain/(loss) | 2.68 | (0.30 | ) | (0.04 | ) | 0.09 | 1.86 | 1.54 | ||||||||||||||||
| Total from investment operations | 2.72 | (0.18 | ) | 0.09 | 0.12 | 1.87 | 1.62 | |||||||||||||||||
| DISTRIBUTIONS: | ||||||||||||||||||||||||
| From net investment income | (0.17 | ) | (0.18 | ) | (0.17 | ) | – | (0.05 | ) | (0.15 | ) | |||||||||||||
| From net realized gains | – | (0.13 | ) | (1.44 | ) | – | (1.51 | ) | – | |||||||||||||||
| Total distributions | (0.17 | ) | (0.31 | ) | (1.61 | ) | – | (1.56 | ) | (0.15 | ) | |||||||||||||
| Net increase/(decrease) in net asset value | 2.55 | (0.49 | ) | (1.52 | ) | 0.12 | 0.31 | 1.47 | ||||||||||||||||
| Net asset value, end of year | $ | 15.73 | $ | 13.18 | $ | 13.67 | $ | 15.19 | $ | 15.07 | $ | 14.76 | ||||||||||||
| TOTAL RETURN(c) | 20.87 | % | (1.31 | )% | 0.59 | % | 0.80 | % | 12.84 | % | 12.31 | % | ||||||||||||
| RATIOS/SUPPLEMENTAL DATA: | ||||||||||||||||||||||||
| Net assets, end of year (000s) | $ | 10,408 | $ | 11,447 | $ | 12,908 | $ | 11,420 | $ | 11,511 | $ | 7,182 | ||||||||||||
| Ratio of expenses to average net assets excluding fee waivers and reimbursements | 2.20 | % | 2.16 | % | 2.13 | % | 2.13 | %(d) | 2.15 | % | 2.25 | % | ||||||||||||
| Ratio of expenses to average net assets including fee waivers and reimbursements(e) | 1.90 | % | 1.90 | % | 1.90 | % | 1.90 | %(d) | 1.90 | % | 1.73 | % | ||||||||||||
| Ratio of net investment income to average net assets | 0.29 | % | 0.92 | % | 0.88 | % | 0.38 | %(d) | 0.07 | % | 0.57 | % | ||||||||||||
| Portfolio turnover rate(f) | 60 | % | 113 | % | 71 | % | 48 | % | 85 | % | 113 | % | ||||||||||||
| (a) | Effective May 1, 2014, the Board approved changing the fiscal year-end of the Funds from April 30 to October 31. |
| (b) | Calculated using the average shares method. |
| (c) | Total returns are for the period indicated and have not been annualized. Total returns would have been lower had certain expenses not been waived during the period. Returns shown do not reflect the deduction of taxes that a shareholder would pay on Fund distributions or the redemption of Fund shares. Returns shown exclude any applicable sales charges. |
| (d) | Annualized. |
| (e) | Prior to January 1, 2013, all acquired fund fees were reimbursed. |
| (f) | Portfolio turnover rate for periods less than one full year have not been annualized. |
See Notes to Financial Statements.
142 | October 31, 2017
RiverFront Global Growth Fund – Class I
Financial Highlights
Selected data for a share of beneficial interest outstanding throughout the periods indicated:
| For the Year Ended October 31, 2017 | For the Year Ended October 31, 2016 | For the Year Ended October 31, 2015 | For the Fiscal Period Ended October 31, 2014(a) | For the Year Ended April 30, 2014 | For the Year Ended April 30, 2013 | |||||||||||||||||||
| Net asset value, beginning of period | $ | 13.65 | $ | 14.03 | $ | 15.52 | $ | 15.32 | $ | 14.92 | $ | 13.40 | ||||||||||||
| INCOME/(LOSS) FROM INVESTMENT OPERATIONS: | ||||||||||||||||||||||||
| Net investment income(b) | 0.19 | 0.26 | 0.26 | 0.10 | 0.17 | 0.20 | ||||||||||||||||||
| Net realized and unrealized gain/(loss) | 2.78 | (0.30 | ) | (0.03 | ) | 0.10 | 1.89 | 1.57 | ||||||||||||||||
| Total from investment operations | 2.97 | (0.04 | ) | 0.23 | 0.20 | 2.06 | 1.77 | |||||||||||||||||
| DISTRIBUTIONS: | ||||||||||||||||||||||||
| From net investment income | (0.19 | ) | (0.21 | ) | (0.28 | ) | – | (0.15 | ) | (0.25 | ) | |||||||||||||
| From net realized gains | – | (0.13 | ) | (1.44 | ) | – | (1.51 | ) | – | |||||||||||||||
| Total distributions | (0.19 | ) | (0.34 | ) | (1.72 | ) | – | (1.66 | ) | (0.25 | ) | |||||||||||||
| Net increase/(decrease) in net asset value | 2.78 | (0.38 | ) | (1.49 | ) | 0.20 | 0.40 | 1.52 | ||||||||||||||||
| Net asset value, end of year | $ | 16.43 | $ | 13.65 | $ | 14.03 | $ | 15.52 | $ | 15.32 | $ | 14.92 | ||||||||||||
| TOTAL RETURN(c) | 22.05 | % | (0.31 | )% | 1.51 | % | 1.31 | % | 14.01 | % | 13.36 | % | ||||||||||||
| RATIOS/SUPPLEMENTAL DATA: | ||||||||||||||||||||||||
| Net assets, end of year (000s) | $ | 13,873 | $ | 10,140 | $ | 16,412 | $ | 13,343 | $ | 11,845 | $ | 7,769 | ||||||||||||
| Ratio of expenses to average net assets excluding fee waivers and reimbursements | 1.20 | % | 1.15 | % | 1.29 | % | 1.36 | %(d) | 1.16 | % | 1.25 | % | ||||||||||||
| Ratio of expenses to average net assets including fee waivers and reimbursements(e) | 0.90 | % | 0.90 | % | 0.90 | % | 0.90 | %(d) | 0.90 | % | 0.73 | % | ||||||||||||
| Ratio of net investment income to average net assets | 1.29 | % | 1.98 | % | 1.77 | % | 1.32 | %(d) | 1.13 | % | 1.45 | % | ||||||||||||
| Portfolio turnover rate(f) | 60 | % | 113 | % | 71 | % | 48 | % | 85 | % | 113 | % | ||||||||||||
| (a) | Effective May 1, 2014, the Board approved changing the fiscal year-end of the Funds from April 30 to October 31. |
| (b) | Calculated using the average shares method. |
| (c) | Total returns are for the period indicated and have not been annualized. Total returns would have been lower had certain expenses not been waived during the period. Returns shown do not reflect the deduction of taxes that a shareholder would pay on Fund distributions or the redemption of Fund shares. |
| (d) | Annualized. |
| (e) | Prior to January 1, 2013, all acquired fund fees were reimbursed. |
| (f) | Portfolio turnover rate for periods less than one full year have not been annualized. |
See Notes to Financial Statements.
143 | October 31, 2017
RiverFront Global Growth Fund – Class L
Financial Highlights
Selected data for a share of beneficial interest outstanding throughout the periods indicated:
| For the Year Ended October 31, 2017 | For the Year Ended October 31, 2016 | For the Year Ended October 31, 2015 | For the Fiscal Period Ended October 31, 2014(a) | For the Year Ended April 30, 2014 | For the Year Ended April 30, 2013 | |||||||||||||||||||
| Net asset value, beginning of period | $ | 13.63 | $ | 14.01 | $ | 15.49 | $ | 15.29 | $ | 14.90 | $ | 13.37 | ||||||||||||
| INCOME/(LOSS) FROM INVESTMENT OPERATIONS: | ||||||||||||||||||||||||
| Net investment income(b) | 0.19 | 0.25 | 0.27 | 0.11 | 0.17 | 0.22 | ||||||||||||||||||
| Net realized and unrealized gain/(loss) | 2.78 | (0.29 | ) | (0.03 | ) | 0.09 | 1.88 | 1.56 | ||||||||||||||||
| Total from investment operations | 2.97 | (0.04 | ) | 0.24 | 0.20 | 2.05 | 1.78 | |||||||||||||||||
| DISTRIBUTIONS: | ||||||||||||||||||||||||
| From net investment income | (0.19 | ) | (0.21 | ) | (0.28 | ) | – | (0.15 | ) | (0.25 | ) | |||||||||||||
| From net realized gains | – | (0.13 | ) | (1.44 | ) | – | (1.51 | ) | – | |||||||||||||||
| Total distributions | (0.19 | ) | (0.34 | ) | (1.72 | ) | – | (1.66 | ) | (0.25 | ) | |||||||||||||
| Net increase/(decrease) in net asset value | 2.78 | (0.38 | ) | (1.48 | ) | 0.20 | 0.39 | 1.53 | ||||||||||||||||
| Net asset value, end of year | $ | 16.41 | $ | 13.63 | $ | 14.01 | $ | 15.49 | $ | 15.29 | $ | 14.90 | ||||||||||||
| TOTAL RETURN(c) | 22.08 | % | (0.31 | )% | 1.59 | % | 1.31 | % | 13.98 | % | 13.43 | % | ||||||||||||
| RATIOS/SUPPLEMENTAL DATA: | ||||||||||||||||||||||||
| Net assets, end of year (000s) | $ | 25,309 | $ | 22,552 | $ | 26,109 | $ | 24,400 | $ | 25,092 | $ | 23,454 | ||||||||||||
| Ratio of expenses to average net assets excluding fee waivers and reimbursements | 1.20 | % | 1.16 | % | 1.04 | % | 1.02 | %(d) | 1.15 | % | 1.25 | % | ||||||||||||
| Ratio of expenses to average net assets including fee waivers and reimbursements (includes acquired fund fee reimbursements)(e) | 0.90 | % | 0.90 | % | 0.90 | % | 0.90 | %(d) | 0.90 | % | 0.73 | % | ||||||||||||
| Ratio of expenses to average net assets including fee waivers and reimbursements (excludes acquired fund fee reimbursements) | 0.90 | % | 0.90 | % | 0.90 | % | 0.90 | %(d) | 0.90 | % | 0.90 | % | ||||||||||||
| Ratio of net investment income to average net assets | 1.27 | % | 1.90 | % | 1.86 | % | 1.37 | %(d) | 1.11 | % | 1.59 | % | ||||||||||||
| Portfolio turnover rate(f) | 60 | % | 113 | % | 71 | % | 48 | % | 85 | % | 113 | % | ||||||||||||
| (a) | Effective May 1, 2014, the Board approved changing the fiscal year-end of the Funds from April 30 to October 31. |
| (b) | Calculated using the average shares method. |
| (c) | Total returns are for the period indicated and have not been annualized. Total returns would have been lower had certain expenses not been waived during the period. Returns shown do not reflect the deduction of taxes that a shareholder would pay on Fund distributions or the redemption of Fund shares. |
| (d) | Annualized. |
| (e) | Prior to January 1, 2013, all acquired fund fees were reimbursed. |
| (f) | Portfolio turnover rate for periods less than one full year have not been annualized. |
See Notes to Financial Statements.
144 | October 31, 2017
RiverFront Global Growth Fund – Investor Class
Financial Highlights
Selected data for a share of beneficial interest outstanding throughout the periods indicated:
For the Year Ended October 31, 2017 | For the Year Ended October 31, 2016 | For the Year Ended October 31, 2015 | For the Fiscal Period Ended October 31, 2014(a) | For the Year Ended April 30, 2014 | For the Year Ended April 30, 2013 | |||||||||||||||||||
| Net asset value, beginning of period | $ | 13.47 | $ | 13.87 | $ | 15.37 | $ | 15.19 | $ | 14.82 | $ | 13.32 | ||||||||||||
| INCOME/(LOSS) FROM INVESTMENT OPERATIONS: | ||||||||||||||||||||||||
| Net investment income(b) | 0.15 | 0.23 | 0.26 | 0.09 | 0.13 | 0.18 | ||||||||||||||||||
| Net realized and unrealized gain/(loss) | 2.75 | (0.30 | ) | (0.07 | ) | 0.09 | 1.87 | 1.54 | ||||||||||||||||
| Total from investment operations | 2.90 | (0.07 | ) | 0.19 | 0.18 | 2.00 | 1.72 | |||||||||||||||||
| DISTRIBUTIONS: | ||||||||||||||||||||||||
| From net investment income | (0.19 | ) | (0.20 | ) | (0.25 | ) | – | (0.12 | ) | (0.22 | ) | |||||||||||||
| From net realized gains | – | (0.13 | ) | (1.44 | ) | – | (1.51 | ) | – | |||||||||||||||
| Total distributions | (0.19 | ) | (0.33 | ) | (1.69 | ) | – | (1.63 | ) | (0.22 | ) | |||||||||||||
| Net increase/(decrease) in net asset value | 2.71 | (0.40 | ) | (1.50 | ) | 0.18 | 0.37 | 1.50 | ||||||||||||||||
| Net asset value, end of year | $ | 16.18 | $ | 13.47 | $ | 13.87 | $ | 15.37 | $ | 15.19 | $ | 14.82 | ||||||||||||
| TOTAL RETURN(c) | 21.77 | % | (0.51 | )% | 1.28 | % | 1.18 | % | 13.73 | % | 13.07 | % | ||||||||||||
| RATIOS/SUPPLEMENTAL DATA: | ||||||||||||||||||||||||
| Net assets, end of year (000s) | $ | 3,451 | $ | 4,667 | $ | 6,924 | $ | 7,762 | $ | 8,361 | $ | 9,174 | ||||||||||||
| Ratio of expenses to average net assets excluding fee waivers and reimbursements | 1.45 | % | 1.40 | % | 1.38 | % | 1.38 | %(d) | 1.41 | % | 1.50 | % | ||||||||||||
| Ratio of expenses to average net assets including fee waivers and reimbursements(e) | 1.15 | % | 1.15 | % | 1.15 | % | 1.15 | %(d) | 1.15 | % | 0.98 | % | ||||||||||||
| Ratio of net investment income to average net assets | 1.04 | % | 1.75 | % | 1.78 | % | 1.14 | %(d) | 0.85 | % | 1.36 | % | ||||||||||||
| Portfolio turnover rate(f) | 60 | % | 113 | % | 71 | % | 48 | % | 85 | % | 113 | % | ||||||||||||
| (a) | Effective May 1, 2014, the Board approved changing the fiscal year-end of the Funds from April 30 to October 31. |
| (b) | Calculated using the average shares method. |
| (c) | Total returns are for the period indicated and have not been annualized. Total returns would have been lower had certain expenses not been waived during the period. Returns shown do not reflect the deduction of taxes that a shareholder would pay on Fund distributions or the redemption of Fund shares. |
| (d) | Annualized. |
| (e) | Prior to January 1, 2013, all acquired fund fees were reimbursed. |
| (f) | Portfolio turnover rate for periods less than one full year have not been annualized. |
See Notes to Financial Statements.
145 | October 31, 2017
RiverFront Moderate Growth & Income Fund – Class A
Financial Highlights
Selected data for a share of beneficial interest outstanding throughout the periods indicated:
For the Year Ended October 31, 2017 | For the Year Ended October 31, 2016 | For the Year Ended October 31, 2015 | For the Fiscal Period Ended October 31, 2014(a) | For the Year Ended April 30, 2014 | For the Year Ended April 30, 2013 | |||||||||||||||||||
| Net asset value, beginning of period | $ | 11.22 | $ | 11.48 | $ | 12.15 | $ | 11.99 | $ | 11.66 | $ | 10.96 | ||||||||||||
| INCOME/(LOSS) FROM INVESTMENT OPERATIONS: | ||||||||||||||||||||||||
| Net investment income(b) | 0.18 | 0.21 | 0.23 | 0.09 | 0.16 | 0.24 | ||||||||||||||||||
| Net realized and unrealized gain/(loss) | 1.23 | (0.01 | ) | (0.06 | ) | 0.16 | 0.89 | 0.69 | ||||||||||||||||
| Total from investment operations | 1.41 | 0.20 | 0.17 | 0.25 | 1.05 | 0.93 | ||||||||||||||||||
| DISTRIBUTIONS: | ||||||||||||||||||||||||
| From net investment income | (0.16 | ) | (0.21 | ) | (0.20 | ) | (0.09 | ) | (0.16 | ) | (0.23 | ) | ||||||||||||
| From net realized gains | – | (0.25 | ) | (0.64 | ) | – | (0.56 | ) | – | |||||||||||||||
| Total distributions | (0.16 | ) | (0.46 | ) | (0.84 | ) | (0.09 | ) | (0.72 | ) | (0.23 | ) | ||||||||||||
| Net increase/(decrease) in net asset value | 1.25 | (0.26 | ) | (0.67 | ) | 0.16 | 0.33 | 0.70 | ||||||||||||||||
| Net asset value, end of year | $ | 12.47 | $ | 11.22 | $ | 11.48 | $ | 12.15 | $ | 11.99 | $ | 11.66 | ||||||||||||
| TOTAL RETURN(c) | 12.67 | % | 1.81 | % | 1.33 | % | 2.12 | % | 9.16 | % | 8.59 | % | ||||||||||||
| RATIOS/SUPPLEMENTAL DATA: | ||||||||||||||||||||||||
| Net assets, end of year (000s) | $ | 13,311 | $ | 22,679 | $ | 24,402 | $ | 27,598 | $ | 31,033 | $ | 29,066 | ||||||||||||
| Ratio of expenses to average net assets excluding fee waivers and reimbursements | 1.33 | % | 1.31 | % | 1.30 | % | 1.31 | %(d) | 1.32 | % | 1.40 | % | ||||||||||||
| Ratio of expenses to average net assets including fee waivers and reimbursements | 1.15 | % | 1.15 | % | 1.15 | % | 1.15 | %(d) | 1.15 | % | 1.19 | %(e) | ||||||||||||
| Ratio of net investment income to average net assets | 1.49 | % | 1.87 | % | 1.97 | % | 1.54 | %(d) | 1.35 | % | 2.17 | % | ||||||||||||
| Portfolio turnover rate(f) | 56 | % | 132 | % | 110 | % | 42 | % | 98 | % | 108 | % | ||||||||||||
| (a) | Effective May 1, 2014, the Board approved changing the fiscal year-end of the Funds from April 30 to October 31. |
| (b) | Calculated using the average shares method. |
| (c) | Total returns are for the period indicated and have not been annualized. Total returns would have been lower had certain expenses not been waived during the period. Returns shown do not reflect the deduction of taxes that a shareholder would pay on Fund distributions or the redemption of Fund shares. Returns shown exclude any applicable sales charges. |
| (d) | Annualized. |
| (e) | Contractual expense limitation change from 1.05% to 0.90% effective September 1, 2012. |
| (f) | Portfolio turnover rate for periods less than one full year have not been annualized. |
See Notes to Financial Statements.
146 | October 31, 2017
RiverFront Moderate Growth & Income Fund – Class C
Financial Highlights
Selected data for a share of beneficial interest outstanding throughout the periods indicated:
For the Year Ended October 31, 2017 | For the Year Ended October 31, 2016 | For the Year Ended October 31, 2015 | For the Fiscal Period Ended October 31, 2014(a) | For the Year Ended April 30, 2014 | For the Year Ended April 30, 2013 | |||||||||||||||||||
| Net asset value, beginning of period | $ | 11.12 | $ | 11.39 | $ | 12.10 | $ | 11.94 | $ | 11.62 | $ | 10.92 | ||||||||||||
| INCOME/(LOSS) FROM INVESTMENT OPERATIONS: | ||||||||||||||||||||||||
| Net investment income after reimbursements(b) | 0.08 | 0.13 | 0.13 | 0.05 | 0.07 | 0.16 | ||||||||||||||||||
| Net realized and unrealized gain/(loss) | 1.24 | (0.02 | ) | (0.06 | ) | 0.16 | 0.89 | 0.68 | ||||||||||||||||
| Total from investment operations | 1.32 | 0.11 | 0.07 | 0.21 | 0.96 | 0.84 | ||||||||||||||||||
| DISTRIBUTIONS: | ||||||||||||||||||||||||
| From net investment income | (0.10 | ) | (0.13 | ) | (0.14 | ) | (0.05 | ) | (0.08 | ) | (0.14 | ) | ||||||||||||
| From net realized gains | – | (0.25 | ) | (0.64 | ) | – | (0.56 | ) | – | |||||||||||||||
| Total distributions | (0.10 | ) | (0.38 | ) | (0.78 | ) | (0.05 | ) | (0.64 | ) | (0.14 | ) | ||||||||||||
| Net increase/(decrease) in net asset value | 1.22 | (0.27 | ) | (0.71 | ) | 0.16 | 0.32 | 0.70 | ||||||||||||||||
| Net asset value, end of year | $ | 12.34 | $ | 11.12 | $ | 11.39 | $ | 12.10 | $ | 11.94 | $ | 11.62 | ||||||||||||
| TOTAL RETURN(c) | 11.94 | % | 1.03 | % | 0.52 | % | 1.75 | % | 8.33 | % | 7.83 | % | ||||||||||||
| RATIOS/SUPPLEMENTAL DATA: | ||||||||||||||||||||||||
| Net assets, end of year (000s) | $ | 51,231 | $ | 63,480 | $ | 70,771 | $ | 66,445 | $ | 63,031 | $ | 52,579 | ||||||||||||
| Ratio of expenses to average net assets excluding fee waivers and reimbursements | 2.08 | % | 2.06 | % | 2.05 | % | 2.07 | %(d) | 2.07 | % | 2.15 | % | ||||||||||||
| Ratio of expenses to average net assets including fee waivers and reimbursements | 1.90 | % | 1.90 | % | 1.90 | % | 1.90 | %(d) | 1.90 | % | 1.95 | %(e) | ||||||||||||
| Ratio of net investment income to average net assets | 0.70 | % | 1.14 | % | 1.14 | % | 0.77 | %(d) | 0.59 | % | 1.43 | % | ||||||||||||
| Portfolio turnover rate(f) | 56 | % | 132 | % | 110 | % | 42 | % | 98 | % | 108 | % | ||||||||||||
| (a) | Effective May 1, 2014, the Board approved changing the fiscal year-end of the Funds from April 30 to October 31. |
| (b) | Calculated using the average shares method. |
| (c) | Total returns are for the period indicated and have not been annualized. Total returns would have been lower had certain expenses not been waived during the period. Returns shown do not reflect the deduction of taxes that a shareholder would pay on Fund distributions or the redemption of Fund shares. Returns shown exclude any applicable sales charges. |
| (d) | Annualized. |
| (e) | Contractual expense limitation change from 2.05% to 1.90% effective September 1, 2012. |
| (f) | Portfolio turnover rate for periods less than one full year have not been annualized. |
See Notes to Financial Statements.
147 | October 31, 2017
RiverFront Moderate Growth & Income Fund – Class I
Financial Highlights
Selected data for a share of beneficial interest outstanding throughout the periods indicated:
| For the Year Ended October 31, 2017 | For the Year Ended October 31, 2016 | For the Year Ended October 31, 2015 | For the Fiscal Period Ended October 31, 2014(a) | For the Year Ended April 30, 2014 | For the Year Ended April 30, 2013 | |||||||||||||||||||
| Net asset value, beginning of period | $ | 11.21 | $ | 11.47 | $ | 12.14 | $ | 11.98 | $ | 11.65 | $ | 10.94 | ||||||||||||
| INCOME/(LOSS) FROM INVESTMENT OPERATIONS: | ||||||||||||||||||||||||
| Net investment income(b) | 0.20 | 0.24 | 0.25 | 0.11 | 0.19 | 0.26 | ||||||||||||||||||
| Net realized and unrealized gain/(loss) | 1.25 | (0.01 | ) | (0.06 | ) | 0.16 | 0.89 | 0.70 | ||||||||||||||||
| Total from investment operations | 1.45 | 0.23 | 0.19 | 0.27 | 1.08 | 0.96 | ||||||||||||||||||
| DISTRIBUTIONS: | ||||||||||||||||||||||||
| From net investment income | (0.18 | ) | (0.24 | ) | (0.22 | ) | (0.11 | ) | (0.19 | ) | (0.25 | ) | ||||||||||||
| From net realized gains | – | (0.25 | ) | (0.64 | ) | – | (0.56 | ) | – | |||||||||||||||
| Total distributions | (0.18 | ) | (0.49 | ) | (0.86 | ) | (0.11 | ) | (0.75 | ) | (0.25 | ) | ||||||||||||
| Net increase/(decrease) in net asset value | 1.27 | (0.26 | ) | (0.67 | ) | 0.16 | 0.33 | 0.71 | ||||||||||||||||
| Net asset value, end of year | $ | 12.48 | $ | 11.21 | $ | 11.47 | $ | 12.14 | $ | 11.98 | $ | 11.65 | ||||||||||||
| TOTAL RETURN(c) | 13.05 | % | 2.05 | % | 1.50 | % | 2.25 | % | 9.43 | % | 8.94 | % | ||||||||||||
| RATIOS/SUPPLEMENTAL DATA: | ||||||||||||||||||||||||
| Net assets, end of year (000s) | $ | 30,913 | $ | 43,056 | $ | 46,350 | $ | 42,081 | $ | 37,832 | $ | 25,898 | ||||||||||||
| Ratio of expenses to average net assets excluding fee waivers and reimbursements | 1.08 | % | 1.06 | % | 1.05 | % | 1.07 | %(d) | 1.07 | % | 1.15 | % | ||||||||||||
| Ratio of expenses to average net assets including fee waivers and reimbursements | 0.90 | % | 0.90 | % | 0.90 | % | 0.90 | %(d) | 0.90 | % | 0.94 | %(e) | ||||||||||||
| Ratio of net investment income to average net assets | 1.71 | % | 2.16 | % | 2.16 | % | 1.77 | %(d) | 1.59 | % | 2.39 | % | ||||||||||||
| Portfolio turnover rate(f) | 56 | % | 132 | % | 110 | % | 42 | % | 98 | % | 108 | % | ||||||||||||
| (a) | Effective May 1, 2014, the Board approved changing the fiscal year-end of the Funds from April 30 to October 31. |
| (b) | Calculated using the average shares method. |
| (c) | Total returns are for the period indicated and have not been annualized. Total returns would have been lower had certain expenses not been waived during the period. Returns shown do not reflect the deduction of taxes that a shareholder would pay on Fund distributions or the redemption of Fund shares. |
| (d) | Annualized. |
| (e) | Contractual expense limitation change from 1.05% to 0.90% effective September 1, 2012. |
| (f) | Portfolio turnover rate for periods less than one full year have not been annualized. |
See Notes to Financial Statements.
148 | October 31, 2017
October 31, 2017
1. ORGANIZATION
Financial Investors Trust (the “Trust”), a Delaware statutory trust, is an open-end management investment company registered under the Investment Company Act of 1940, as amended (“1940 Act”). The Trust consists of multiple separate portfolios or series. This annual report includes the financial statements and financial highlights of the following 12 funds: ALPS | Alerian MLP Infrastructure Index Fund, ALPS | CoreCommodity Management CompleteCommodities® Strategy Fund, ALPS | Kotak India Growth Fund, ALPS | Metis Global Micro Cap Value Fund (Formerly ALPS | Metis Global Micro Cap Fund), ALPS | Red Rocks Listed Private Equity Fund, ALPS | WMC Research Value Fund, Clough China Fund, RiverFront Conservative Income Builder Fund, RiverFront Dynamic Equity Income Fund, RiverFront Global Allocation Fund, RiverFront Global Growth Fund and RiverFront Moderate Growth & Income Fund (each, a “Fund” and collectively, the “Funds”). The Funds are considered investment companies under U.S. GAAP and follows the accounting and reporting guidance applicable to investment companies in the Financial Accounting Standards Board Accounting Standards Codification Topic 946.
ALPS | Alerian MLP Infrastructure Index Fund seeks investment results that correspond (before fees and expenses) generally to the price and yield performance of its underlying index, the Alerian MLP Infrastructure Index. The ALPS | CoreCommodity Management CompleteCommodities® Strategy Fund seeks to maximize real returns (returns after inflation), consistent with prudent investment management. ALPS | Kotak India Growth Fund’s investment goal is long-term capital appreciation. ALPS | Metis Global Micro Cap Value Fund seeks long-term growth of capital. ALPS | Red Rocks Listed Private Equity Fund seeks to maximize total return, which consists of appreciation on its investments and a variable income stream. ALPS | WMC Research Value Fund seeks long-term capital appreciation: dividend income may be a factor in portfolio selection but is secondary to the Fund’s principal objective. The Clough China Fund seeks to provide investors with long-term capital appreciation. The RiverFront Conservative Income Builder Fund seeks to provide current income and potential for that income to grow over time. The RiverFront Dynamic Equity Income Fund seeks to achieve long-term growth and income through a combination of capital appreciation and rising dividend payments that exceed the average yield on global stocks generally. The RiverFront Global Allocation Fund seeks to provide high total investment return through a fully managed investment policy utilizing United States and foreign equity securities, debt and money market securities, the combination of which will be varied from time to time both with respect to types of securities and markets in response to changing market and economic trends. Total investment return means the combination of capital appreciation and investment income. The RiverFront Global Growth Fund seeks to achieve long-term capital appreciation through a fully managed investment policy utilizing United States and foreign equity securities, debt and money market securities, the combination of which will be varied from time to time both with respect to types of securities and markets in response to changing market and economic trends. The RiverFront Moderate Growth & Income Fund has two primary investment objectives. It seeks (1) to provide a level of current income that exceeds the average yield on U.S. stocks in general while providing a growing stream of income over the years and (2) growth of capital.
The classes of each Fund differ principally in the applicable distribution and shareholder service fees. Shareholders of each class also bear certain expenses that pertain to that particular class. All shareholders bear the common expenses of the Fund and earn income and realized gains/losses from the Fund pro rata based on the average daily net assets of each class, without distinction between share classes. Dividends to shareholders are determined separately for each class based on income and expenses allocable to each class. Realized gain distributions to shareholders are allocated to each class pro rata based on the shares outstanding of each class on the date of distribution. Differences in per share dividend rates generally result from differences in separate class expenses, including distribution and shareholder service fees, if applicable.
Basis of Consolidation for the ALPS | CoreCommodity Management CompleteCommodities® Strategy Fund
CoreCommodity Management Cayman Commodity Fund Ltd. (the “Subsidiary”), a Cayman Islands exempted company, was incorporated on April 23, 2010 and is a wholly owned subsidiary of the ALPS | CoreCommodity Management CompleteCommodities® Strategy Fund (the “CoreCommodity Fund”). The Subsidiary acts as an investment vehicle for the CoreCommodity Fund in order to effect certain commodity-related investments on behalf of the CoreCommodity Fund. CoreCommodity Fund is the sole shareholder of the Subsidiary pursuant to a subscription agreement dated as of June 14, 2010, and it is intended that the CoreCommodity Fund will remain the sole shareholder and will continue to wholly own and control the Subsidiary. Under the Articles of Association of the Subsidiary, shares issued by the Subsidiary confer upon a shareholder the right to vote at general meetings of the Subsidiary and certain rights in connection with any winding-up or repayment of capital, as well as the right to participate in the profits or assets of the Subsidiary. The CoreCommodity Fund may invest up to 25% of its total assets in shares of the Subsidiary. As a wholly owned subsidiary of the CoreCommodity Fund, the financial statements of the Subsidiary are included in the consolidated financial statements and financial highlights of the CoreCommodity Fund. All investments held by the Subsidiary are disclosed in the accounts of the CoreCommodity Fund. As of October 31, 2017, net assets of the CoreCommodity Fund were $538,196,298 of which $101,693,154 or 18.90%, represented the CoreCommodity Fund’s ownership of all issued shares and voting rights of the Subsidiary.
Basis of Consolidation for the ALPS | Kotak India Growth Fund
ALPS | Kotak India Growth Fund, (the “Kotak Fund”) invests in the equity securities of Indian companies through its wholly owned, collective investment vehicle, the India Premier Equity Portfolio (the “Portfolio”). The Portfolio is registered with and regulated by the Mauritius Financial Services Commission. The Portfolio was formed for the purpose of facilitating the Kotak Fund’s purchase of securities of a wide selection of Indian companies, consistent with the Kotak Fund’s investment strategies. The Portfolio is a private company limited by shares incorporated under the
149 | October 31, 2017
Notes to Financial Statements
October 31, 2017
Mauritius Companies Act 2001. As a wholly owned subsidiary of the Kotak Fund, financial statements of the Portfolio are included in the consolidated financial statements and financial highlights of the Kotak Fund. All investments held by the Portfolio are disclosed in the accounts of the Kotak Fund.
The Portfolio established residency in Mauritius allowing the Kotak Fund to receive the beneficial tax treatment under the Treaty between India and Mauritius. However, due to recently enacted legislation the benefits of the Treaty have been reduced and some gains derived by the Portfolio due to the sale of securities will be subject to taxation in India. On April 1, 2017, the General Anti-Avoidance Rules (“GAAR”) which contain treaty override provisions were enacted. Capital gains on sale of shares acquired on or after April 1, 2017, are taxable in India as per the amended India – Mauritius treaty. The benefit of a lower rate of taxation (50% of the applicable tax rate in India) is provided for the gains on shares arising during the period from April 1, 2017 to March 31, 2019 subject to compliance with the Limitation of Benefit clause.
2. SIGNIFICANT ACCOUNTING POLICIES
The following is a summary of significant accounting policies consistently followed by each Fund in the preparation of its financial statements. Each Fund is considered an investment company for financial reporting purposes, and follows accounting policies in conformity with accounting principles generally accepted in the United States of America (“U.S. GAAP”), including policies specific to investment companies. The preparation of financial statements in conformity with U.S. GAAP requires management to make certain estimates and assumptions that affect the reported amounts of assets and liabilities and disclosures of contingent assets and liabilities at the date of the financial statements and the reported amounts of revenue and expenses during the period. Actual results could differ from those estimates. The following is a summary of significant accounting policies consistently followed by the Funds and subsidiaries, as applicable, in preparation of their financial statements.
Investment Valuation: The Funds generally value their securities based on market prices determined at the close of regular trading on the New York Stock Exchange (“NYSE”), normally 4:00 p.m. Eastern Time, on each day the NYSE is open for trading. For equity securities and mutual funds that are traded on an exchange, the market price is usually the closing sale or official closing price on that exchange.
The market price for debt obligations is generally the price supplied by an independent third-party pricing service approved by the Board, which may use a matrix, formula or other objective method that takes into consideration quotations from dealers, market transactions in comparable investments, market indices and yield curves. If vendors are unable to supply a price, or if the price supplied is deemed to be unreliable, the market price may be determined using quotations received from one or more brokers-dealers that make a market in the security. Investments in non-exchange traded funds are fair valued at their respective net asset values.
Futures contracts that are listed or traded on a national securities exchange, commodities exchange, contract market or comparable over the counter market, and that are freely transferable, are valued at their closing settlement price on the exchange on which they are primarily traded or based upon the current settlement price for a like instrument acquired on the day on which the instrument is being valued. A settlement price may not be used if the market makes a limit move with respect to a particular commodity. Over-the-counter swap contracts are valued based on quotes received from independent pricing services or one or more dealers that make markets in such investments.
Option contracts are valued using the National Best Bid and Offer price (“NBBO”). In the event there is no NBBO price available, option contracts are valued at the mean between the last bid and ask.
Equity securities that are primarily traded on foreign securities exchanges are valued at the closing values of such securities on their respective foreign exchanges, except when an event occurs subsequent to the close of the foreign exchange and the close of the NYSE that was likely to have changed such value. In such an event, the fair value of those securities are determined in good faith through consideration of other factors in accordance with procedures established by and under the general supervision of the Board. The Funds will use a fair valuation model provided by an independent pricing service, which is intended to reflect fair value when a security’s value or a meaningful portion of the Fund’s portfolio is believed to have been materially affected by an valuation event that has occurred between the close of the exchange or market on which the security is traded and the close of the regular trading day on the NYSE.
Forward currency exchange contracts have a value determined by the current foreign currency exchange forward rates. The foreign currency exchange forward rates are calculated using an automated system that estimates rates on the basis of the current day foreign currency exchange rates and forward foreign currency exchange rates supplied by a pricing service. Foreign exchange rates and forward foreign currency exchange rates may generally be obtained at the close of the NYSE, normally 4:00 p.m. Eastern Time.
When such prices or quotations are not available, or when the Fair Value Committee appointed by the Board believes that they are unreliable, securities may be priced using fair value procedures approved by the Board. The fair valuation policies and procedures (“FV Procedures”) have been adopted by the Board for the fair valuation of portfolio assets held by the Fund(s) in the event that (1) market quotations for the current price of a portfolio security or asset are not readily available, or (2) available market quotations that would otherwise be used to value a portfolio security or
150 | October 31, 2017
Notes to Financial Statements
October 31, 2017
asset in accordance with the Fund’s Pricing Procedures appear to be unreliable. The Pricing Procedures reflect certain pricing methodologies (or “logics”) that are not “readily available market quotations” and thus are viewed and treated as fair valuations. The Fair Value Committee routinely meets to discuss fair valuations of portfolio securities and other instruments held by the Fund(s).
Fair Value Measurements: The Funds disclose the classification of their fair value measurements following a three-tier hierarchy based on the inputs used to measure fair value. Inputs refer broadly to the assumptions that market participants would use in pricing the asset or liability, including assumptions about risk. Inputs may be observable or unobservable. Observable inputs reflect the assumptions market participants would use in pricing the asset or liability that are developed based on market data obtained from sources independent of the reporting entity. Unobservable inputs reflect the reporting entity’s own assumptions about the assumptions market participants would use in pricing the asset or liability that are developed based on the best information available.
Various inputs are used in determining the value of each Fund’s investments as of the end of the reporting period. When inputs used fall into different levels of the fair value hierarchy, the level in the hierarchy within which the fair value measurement falls is determined based on the lowest level input that is significant to the fair value measurement in its entirety. The designated input levels are not necessarily an indication of the risk or liquidity associated with these investments. These inputs are categorized in the following hierarchy under applicable financial accounting standards:
| Level 1 – | Unadjusted quoted prices in active markets for identical investments, unrestricted assets or liabilities that a Fund has the ability to access at the measurement date; |
| Level 2 – | Quoted prices which are not active, quoted prices for similar assets or liabilities in active markets or inputs other than quoted prices that are observable (either directly or indirectly) for substantially the full term of the asset or liability; and |
| Level 3 – | Significant unobservable prices or inputs (including the Fund’s own assumptions in determining the fair value of investments) where there is little or no market activity for the asset or liability at the measurement date. |
151 | October 31, 2017
Notes to Financial Statements
October 31, 2017
The following is a summary of each Fund’s investments/financial instruments in the fair value hierarchy as of October 31, 2017:
| Investments in Securities at Value | Level 1 - Unadjusted Quoted Prices | Level 2 - Other Significant Observable Inputs | Level 3 - Significant Unobservable Inputs | Total | ||||||||||||
| ALPS | Alerian MLP Infrastructure Index Fund | ||||||||||||||||
| Master Limited Partnerships(a) | $ | 44,823,366 | $ | – | $ | – | $ | 44,823,366 | ||||||||
| Short Term Investments | 104,487 | – | – | 104,487 | ||||||||||||
| Total | $ | 44,927,853 | $ | – | $ | – | $ | 44,927,853 | ||||||||
| Investments in Securities at Value | Level 1 - Unadjusted Quoted Prices | Level 2 - Other Significant Observable Inputs | Level 3 - Significant Unobservable Inputs | Total | ||||||||||||
| ALPS | CoreCommodity Management CompleteCommodities® Strategy Fund | ||||||||||||||||
| Common Stocks(a) | 146,207,455 | – | – | 146,207,455 | ||||||||||||
| Master Limited Partnerships(a) | 1,494,879 | – | – | 1,494,879 | ||||||||||||
| Government Bonds | – | 315,269,843 | – | 315,269,843 | ||||||||||||
| Rights | 27,674 | – | – | 27,674 | ||||||||||||
| Short Term Investments | 36,869,166 | – | – | 36,869,166 | ||||||||||||
| U.S. Treasury Bills | – | 29,875,645 | – | 29,875,645 | ||||||||||||
| Total | $ | 184,599,174 | $ | 345,145,488 | $ | – | $ | 529,744,662 | ||||||||
| Other Financial Instruments | ||||||||||||||||
| Assets | ||||||||||||||||
| Futures Contracts | $ | 3,751,619 | $ | – | $ | – | $ | 3,751,619 | ||||||||
| Total Return Swap Contracts | – | 876 | – | 876 | ||||||||||||
| Liabilities | ||||||||||||||||
| Futures Contracts | (1,480,284 | ) | – | – | (1,480,284 | ) | ||||||||||
| Total Return Swap Contracts | – | (996 | ) | – | (996 | ) | ||||||||||
| Total | $ | 2,271,335 | $ | (120 | ) | $ | – | $ | 2,271,215 | |||||||
| Investments in Securities at Value | Level 1 - Unadjusted Quoted Prices | Level 2 - Other Significant Observable Inputs | Level 3 - Significant Unobservable Inputs | Total | ||||||||||||
| ALPS | Kotak India Growth Fund | ||||||||||||||||
| Common Stocks | ||||||||||||||||
| Consumer Discretionary | $ | – | $ | 3,320,556 | $ | – | $ | 3,320,556 | ||||||||
| Consumer Staples | – | 2,721,889 | – | 2,721,889 | ||||||||||||
| Energy | – | 2,143,894 | – | 2,143,894 | ||||||||||||
| Financials | – | 9,396,379 | – | 9,396,379 | ||||||||||||
| Health Care | – | 1,642,188 | – | 1,642,188 | ||||||||||||
| Industrials | – | 3,758,062 | – | 3,758,062 | ||||||||||||
| Information Technology | – | 2,084,083 | – | 2,084,083 | ||||||||||||
| Materials | – | 5,661,426 | – | 5,661,426 | ||||||||||||
| Real Estate | – | 403,373 | – | 403,373 | ||||||||||||
| Total | $ | – | $ | 31,131,850 | $ | – | $ | 31,131,850 | ||||||||
152 | October 31, 2017
Notes to Financial Statements
October 31, 2017
| Investments in Securities at Value | Level 1 - Unadjusted Quoted Prices | Level 2 - Other Significant Observable Inputs | Level 3 - Significant Unobservable Inputs | Total | ||||||||||||
| ALPS | Metis Global Micro Cap Value Fund | ||||||||||||||||
| Common Stocks | ||||||||||||||||
| Australia | $ | 388,478 | $ | 689,962 | $ | – | $ | 1,078,440 | ||||||||
| Brazil | 402,417 | – | – | 402,417 | ||||||||||||
| Canada | 1,064,422 | – | – | 1,064,422 | ||||||||||||
| Cayman Islands | 98,252 | – | – | 98,252 | ||||||||||||
| Chile | 147,306 | – | – | 147,306 | ||||||||||||
| China | – | 411,492 | – | 411,492 | ||||||||||||
| Cyprus | 1,473 | – | – | 1,473 | ||||||||||||
| France | 78,809 | 172,119 | – | 250,928 | ||||||||||||
| Germany | 102,389 | – | – | 102,389 | ||||||||||||
| Great Britain | 1,016,329 | – | – | 1,016,329 | ||||||||||||
| Greece | 91,310 | – | – | 91,310 | ||||||||||||
| Hong Kong | 285,957 | 64,214 | – | 350,171 | ||||||||||||
| India | – | 502,796 | – | 502,796 | ||||||||||||
| Indonesia | 126,868 | 112,981 | – | 239,849 | ||||||||||||
| Ireland | – | 101,097 | – | 101,097 | ||||||||||||
| Isle Of Man | 128,003 | – | – | 128,003 | ||||||||||||
| Israel | 266,538 | – | – | 266,538 | ||||||||||||
| Italy | – | 107,354 | – | 107,354 | ||||||||||||
| Japan | – | 9,973,559 | – | 9,973,559 | ||||||||||||
| Malaysia | 156,095 | 335,533 | – | 491,628 | ||||||||||||
| Norway | – | 116,066 | – | 116,066 | ||||||||||||
| Pakistan | 86,496 | – | – | 86,496 | ||||||||||||
| Poland | 230,817 | 66,175 | – | 296,992 | ||||||||||||
| Portugal | – | 154,750 | – | 154,750 | ||||||||||||
| Qatar | 95,105 | – | – | 95,105 | ||||||||||||
| Singapore | 221,095 | 123,445 | – | 344,540 | ||||||||||||
| South Africa | 109,804 | – | – | 109,804 | ||||||||||||
| South Korea | 640,868 | 2,312,746 | – | 2,953,614 | ||||||||||||
| Spain | – | 102,077 | – | 102,077 | ||||||||||||
| Sweden | 185,668 | – | – | 185,668 | ||||||||||||
| Taiwan | 87,957 | 1,523,065 | – | 1,611,022 | ||||||||||||
| Thailand | 231,426 | 168,282 | – | 399,708 | ||||||||||||
| Turkey | – | 280,518 | – | 280,518 | ||||||||||||
| United States | 5,885,666 | – | – | 5,885,666 | ||||||||||||
| Preferred Stocks(a) | 322,901 | – | – | 322,901 | ||||||||||||
| Short Term Investments | 1,042,046 | – | – | 1,042,046 | ||||||||||||
| Total | $ | 13,494,495 | $ | 17,318,231 | $ | – | $ | 30,812,726 | ||||||||
| Investments in Securities at Value | Level 1 - Unadjusted Quoted Prices | Level 2 - Other Significant Observable Inputs | Level 3 - Significant Unobservable Inputs | Total | ||||||||||||
| ALPS | Red Rocks Listed Private Equity Fund | ||||||||||||||||
| Closed-End Funds | $ | 31,944,658 | $ | – | $ | – | $ | 31,944,658 | ||||||||
| Common Stocks(a) | 176,786,753 | – | – | 176,786,753 | ||||||||||||
| Short Term Investments | 8,033,398 | – | – | 8,033,398 | ||||||||||||
| Total | $ | 216,764,809 | $ | – | $ | – | $ | 216,764,809 | ||||||||
153 | October 31, 2017
Notes to Financial Statements
October 31, 2017
| Investments in Securities at Value | Level 1 - Unadjusted Quoted Prices | Level 2 - Other Significant Observable Inputs | Level 3 - Significant Unobservable Inputs | Total | ||||||||||||
| ALPS | WMC Research Value Fund | ||||||||||||||||
| Common Stocks(a) | $ | 92,420,378 | $ | – | $ | – | $ | 92,420,378 | ||||||||
| Exchange Traded Funds | 126,360 | – | – | 126,360 | ||||||||||||
| Short Term Investments | 444,650 | – | – | 444,650 | ||||||||||||
| Total | $ | 92,991,388 | $ | – | $ | – | $ | 92,991,388 | ||||||||
| Investments in Securities at Value | Level 1 - Unadjusted Quoted Prices | Level 2 - Other Significant Observable Inputs | Level 3 - Significant Unobservable Inputs | Total | ||||||||||||
| Clough China Fund | ||||||||||||||||
| Common Stocks | ||||||||||||||||
| Communications | $ | 3,632,460 | $ | 1,941,265 | $ | – | $ | 5,573,725 | ||||||||
| Consumer Discretionary | 10,677,266 | 4,037,814 | – | 14,715,080 | ||||||||||||
| Energy | – | 581,322 | – | 581,322 | ||||||||||||
| Financials | – | 16,098,035 | – | 16,098,035 | ||||||||||||
| Health Care | – | 471,034 | – | 471,034 | ||||||||||||
| Industrials | – | 462,762 | – | 462,762 | ||||||||||||
| Materials | – | 383,754 | – | 383,754 | ||||||||||||
| Technology | 2,367,656 | 14,606,625 | – | 16,974,281 | ||||||||||||
| Participation Notes(a) | – | 3,125,242 | – | 3,125,242 | ||||||||||||
| Total | $ | 16,677,382 | $ | 41,707,853 | $ | – | $ | 58,385,235 | ||||||||
| Investments in Securities at Value | Level 1 - Unadjusted Quoted Prices | Level 2 - Other Significant Observable Inputs | Level 3 - Significant Unobservable Inputs | Total | ||||||||||||
| RiverFront Conservative Income Builder Fund | ||||||||||||||||
| Exchange Traded Funds(a) | $ | 11,514,312 | $ | – | $ | – | $ | 11,514,312 | ||||||||
| Short Term Investments | 171,380 | – | – | 171,380 | ||||||||||||
| Total | $ | 11,685,692 | $ | – | $ | – | $ | 11,685,692 | ||||||||
| Investments in Securities at Value | Level 1 - Unadjusted Quoted Prices | Level 2 - Other Significant Observable Inputs | Level 3 - Significant Unobservable Inputs | Total | ||||||||||||
| RiverFront Dynamic Equity Income Fund | ||||||||||||||||
| Common Stocks(a) | $ | 744,620 | $ | – | $ | – | $ | 744,620 | ||||||||
| Exchange Traded Funds(a) | 76,490,108 | – | – | 76,490,108 | ||||||||||||
| Exchange Traded Notes(a) | 655,536 | – | – | 655,536 | ||||||||||||
| Short Term Investments | 1,413,376 | – | – | 1,413,376 | ||||||||||||
| Total | $ | 79,303,640 | $ | – | $ | – | $ | 79,303,640 | ||||||||
| Investments in Securities at Value | Level 1 - Unadjusted Quoted Prices | Level 2 - Other Significant Observable Inputs | Level 3 - Significant Unobservable Inputs | Total | ||||||||||||
| RiverFront Global Allocation Fund | ||||||||||||||||
| Common Stocks(a) | $ | 318,300 | $ | – | $ | – | $ | 318,300 | ||||||||
| Exchange Traded Funds(a) | 32,248,560 | – | – | 32,248,560 | ||||||||||||
| Exchange Traded Notes(a) | 412,531 | – | – | 412,531 | ||||||||||||
| Short Term Investments | 1,010,833 | – | – | 1,010,833 | ||||||||||||
| Total | $ | 33,990,224 | $ | – | $ | – | $ | 33,990,224 | ||||||||
154 | October 31, 2017
Notes to Financial Statements
October 31, 2017
| Investments in Securities at Value | Level 1 - Unadjusted Quoted Prices | Level 2 - Other Significant Observable Inputs | Level 3 - Significant Unobservable Inputs | Total | ||||||||||||
| RiverFront Global Growth Fund | ||||||||||||||||
| Common Stocks(a) | $ | 577,068 | $ | – | $ | – | $ | 577,068 | ||||||||
| Exchange Traded Funds(a) | 58,867,190 | – | – | 58,867,190 | ||||||||||||
| Exchange Traded Notes(a) | 748,039 | – | – | 748,039 | ||||||||||||
| Short Term Investments | 1,849,012 | – | – | 1,849,012 | ||||||||||||
| Total | $ | 62,041,309 | $ | – | $ | – | $ | 62,041,309 | ||||||||
| Investments in Securities at Value | Level 1 - Unadjusted Quoted Prices | Level 2 - Other Significant Observable Inputs | Level 3 - Significant Unobservable Inputs | Total | ||||||||||||
| RiverFront Moderate Growth & Income Fund | ||||||||||||||||
| Common Stocks(a) | $ | 949,237 | $ | – | $ | – | $ | 949,237 | ||||||||
| Exchange Traded Funds(a) | 91,888,133 | – | – | 91,888,133 | ||||||||||||
| Exchange Traded Notes(a) | 795,841 | – | – | 795,841 | ||||||||||||
| Short Term Investments | 2,195,757 | – | – | 2,195,757 | ||||||||||||
| Total | $ | 95,828,968 | $ | – | $ | – | $ | 95,828,968 | ||||||||
| (a) | For detailed descriptions of country, sector and/or industry, see the accompanying Statement of Investments or Consolidated Statement of Investments. |
For liabilities arising from overdrafts in the custody account, the carrying amount approximates fair value due to the relatively short-term maturity of these financial instruments. As of October 31, 2017, the liabilities related to custody overdrafts used level 2 inputs.
The Funds recognize transfers between levels as of the end of the period. For the Fiscal Year Ended October 31, 2017, the Funds did not have any transfers between Level 1 and Level 2 securities, except the ALPS | Kotak India Growth Fund and the ALPS | Metis Global Micro Cap Value Fund. The ALPS | Kotak India Growth Fund and the ALPS | Metis Global Micro Cap Value Fund utilize a fair value evaluation service with respect to international securities with an earlier market closing than the Fund’s net asset value computation cutoff. When events trigger the use of the fair value evaluation service on a reporting period date, it results in certain securities transferring from a Level 1 to a Level 2 classification. The transfer amounts disclosed in the table below represents the value of the securities as of October 31, 2017 transferred in/(out) of Level 1 and Level 2 during the reporting period that were also held at October 31, 2016.
The ALPS | Kotak India Growth Fund had the following transfers between Levels 1 and 2 at October 31, 2017:
| Level 1 - Quoted and Unadjusted Prices |
| Level 2 - Other Significant Observable Inputs | |||||||||||||
Transfers In | Transfers (Out) | Transfers In | Transfers (Out) | |||||||||||||
| Common Stock | $ | – | $ | (1,029,311 | ) | $ | 1,029,311 | $ | – | |||||||
| Total | $ | – | $ | (1,029,311 | ) | $ | 1,029,311 | $ | – | |||||||
The ALPS | Metis Global Micro Cap Value Fund had the following transfers between Levels 1 and 2 at October 31, 2017:
Level 1 - Quoted and Unadjusted Prices |
| Level 2 - Other Significant Observable Inputs | ||||||||||||||
Transfers In | Transfers (Out) | Transfers In | Transfers (Out) | |||||||||||||
| Common Stock | $ | 1,208,780 | $ | (405,313 | ) | $ | 405,313 | $ | (1,208,780 | ) | ||||||
| Total | $ | 1,208,780 | $ | (405,313 | ) | $ | 405,313 | $ | (1,208,780 | ) | ||||||
Offering Costs: The ALPS | Metis Global Micro Cap Value Fund incurred offering costs during the Fiscal Year Ended October 31, 2017. These offering costs, including fees for printing initial prospectuses, legal, and registration fees, are being amortized over the first twelve months from the inception date of the Fund. Amounts amortized through October 31, 2017 are shown on the Fund’s Statement of Operations.
Fund and Class Expenses: Some expenses of the Trust can be directly attributed to a Fund or a specific share class of a Fund. Expenses which cannot be directly attributed are apportioned among all Funds in the Trust based on average net assets of each share class within a Fund.
155 | October 31, 2017
Notes to Financial Statements
October 31, 2017
Federal Income Taxes: The Funds, except for ALPS | Alerian MLP Infrastructure Index Fund, comply with the requirements under Subchapter M of the Internal Revenue Code of 1986, as amended (the “Code”) applicable to regulated investment companies and intend to distribute substantially all of their net taxable income and net capital gains, if any, each year. Those Funds are not subject to income taxes to the extent such distributions are made.
The ALPS | Alerian MLP Infrastructure Index Fund is taxed as a regular corporation (or so-called subchapter “C” corporation) for federal income tax purposes, and will be subject to tax on its taxable income at rates applicable to corporations. As of October 31, 2017, the maximum marginal regular federal income tax rate for a corporation is 35 percent, but the Fund expects to pay federal income tax at a rate of 34 percent. The ALPS | Alerian MLP Infrastructure Index Fund may be subject to a 20 percent federal alternative minimum tax on its federal alternative taxable income to the extent that its alternative minimum tax exceeds its regular federal income tax. This differs from most investment companies, which elect to be treated as “regulated investment companies” under the Code in order to avoid paying entity level income taxes. Under current law, the ALPS | Alerian MLP Infrastructure Index Fund is not eligible to elect treatment as a regulated investment company due to its investments, primarily in Master Limited Partnerships (“MLPs”) invested in energy assets. As a result, the ALPS | Alerian MLP Infrastructure Index Fund will be obligated to pay applicable federal and state corporate income taxes on its taxable income as opposed to most other investment companies which are not so obligated. As discussed below, the ALPS | Alerian MLP Infrastructure Index Fund expects that a portion of the distributions it receives from MLPs may be treated as a tax-deferred return of capital, thus reducing the Fund’s current tax liability. However, the amount of taxes currently paid by the ALPS | Alerian MLP Infrastructure Index Fund will vary depending on the amount of income and gains derived from investments and/or sales of MLP interests and such taxes will reduce the return from an investment in the Fund. See further disclosure regarding MLPs below and in the subsequent event note (Note 10).
The Funds file U.S. federal, state, and local tax returns as required. The Funds’ tax returns are subject to examination by the relevant tax authorities until expiration of the applicable statute of limitations which is generally three years after the filing of the tax return, but may extend to four years in certain jurisdictions. Tax returns for open years have incorporated no uncertain tax positions that require a provision for income taxes.
Distributions to Shareholders: Each Fund, except the ALPS | Alerian MLP Infrastructure Index Fund, RiverFront Conservative Income Builder Fund, RiverFront Dynamic Equity Income Fund, and RiverFront Moderate Growth & Income Fund normally pays dividends and distributes capital gains, if any, on an annual basis. The ALPS | Alerian MLP Infrastructure Index Fund, RiverFront Conservative Income Builder Fund, RiverFront Dynamic Equity Income Fund, and RiverFront Moderate Growth & Income Fund normally pay dividends, if any, on a quarterly basis and distribute capital gains annually. Income dividend distributions are derived from interest and other income a Fund receives from its investments, including distributions of short-term capital gains. Capital gain distributions are derived from gains realized when a Fund sells a security it has owned for more than a year or from long-term capital gain distributions from underlying investments. Each Fund may make additional distributions and dividends at other times if its portfolio manager or managers believe doing so may be necessary for the Fund to avoid or reduce taxes.
Distributions received from the ALPS | Alerian MLP Infrastructure Index Fund’s investments in MLPs generally are comprised of income and return of capital. The Fund records investment income and return of capital based on estimates made at the time such distributions are received. Such estimates are based on historical information available from each MLP and other industry sources. These estimates may subsequently be revised based on information received from MLPs after their tax reporting periods are concluded. Return of capital distributions are not taxable income to the shareholder, but reduce the investor’s tax basis in the investor’s Fund shares. Such a reduction in tax basis will result in larger taxable gains and/or lower tax losses on a subsequent sale of Fund shares. Shareholders who periodically receive the payment of dividends or other distributions consisting of a return of capital may be under the impression that they are receiving net profits from the Fund when, in fact, they are not. Shareholders should not assume that the source of the distributions is from the net profits of the Fund.
Commodity-Linked Notes: The ALPS | CoreCommodity Management CompleteCommodities® Strategy Fund may invest in commodity-linked notes which are derivative instruments that have characteristics of a debt security and of a commodity-linked derivative. A commodity-linked note typically provides for interest payments and a principal payment at maturity linked to the price movement of the underlying commodity, commodity index or commodity futures or option contract. Commodity-linked notes may be principal protected, partially protected, or offer no principal protection. The value of these notes will rise and fall in response to changes in the underlying commodity or related index or investment. These notes are often leveraged, increasing the volatility of each note’s value relative to the change in the underlying linked index. Commodity index-linked investments may be more volatile and less liquid than the underlying index and their value may be affected by the performance of the commodities as well as other factors, including liquidity, quality, maturity and other economic variables. Commodity-linked notes are typically issued by a bank or other financial institution and are sometimes referred to as structured notes because the terms of the notes may be structured by the issuer and the purchaser of the notes to accommodate the specific investment requirements of the purchaser.
Exchange Traded Funds (ETFs): Each Fund may invest in shares of ETFs and other similar instruments if the investment manager chooses to adjust a Fund’s exposure to the general market or industry sectors and to manage a Fund’s risk exposure. ETFs differ from traditional index funds in that their shares are listed on a securities exchange and can be traded intraday. ETF shares are shares of exchange traded investment companies
156 | October 31, 2017
Notes to Financial Statements
October 31, 2017
that are registered under the 1940 Act and hold a portfolio of common stocks designed to track the performance of a particular index. Limitations of the 1940 Act may prohibit a Fund from acquiring more than 3% of the outstanding shares of certain ETFs. Instruments that are similar to ETFs represent beneficial ownership interests in specific “baskets” of stocks of companies within a particular industry sector or group. These securities may also be exchange traded, but unlike ETFs, the issuers of these securities are not registered as investment companies.
The portfolio manager may decide to purchase or sell short ETF shares or options on ETF shares for the same reasons it would purchase or sell (and as an alternative to purchasing or selling) futures contracts – to obtain exposure to the stock market or a particular segment of the stock market, or to hedge a Fund’s portfolio against such exposures. Depending on the market, the holding period and other factors, the use of ETF shares and options thereon can be less costly than the use of index options or stock index futures. In addition, ETF shares and options thereon can typically be purchased in smaller amounts than are available for futures contracts and can offer exposure to market sectors and styles for which there is no suitable or liquid futures contract.
Investment Transactions and Investment Income: Investment transactions are accounted for on the date the investments are purchased or sold (trade date basis). Net realized gains and losses from investment transactions are reported on an identified cost basis. Interest income, which includes accretion of discounts and amortization of premiums, is accrued and recorded as earned. Dividend income is recognized on the ex-dividend date or for certain foreign securities, as soon as information is available to each Fund.
Foreign Securities: Each Fund may directly purchase securities of foreign issuers. Investing in securities of foreign issuers involves special risks not typically associated with investing in securities of U.S. issuers. The risks include possible reevaluation of currencies, the inability to repatriate foreign currency, less complete financial information about companies and possible future adverse political and economic developments.
Moreover, securities of many foreign issuers and their markets may be less liquid and their prices more volatile than those of securities of comparable U.S. issuers.
Foreign Currency Translation: The books and records of the Funds are maintained in U.S. dollars. Investment valuations and other assets and liabilities initially expressed in foreign currencies are converted each business day into U.S. dollars based upon current exchange rates. The portion of realized and unrealized gains or losses on investments due to fluctuations in foreign currency exchange rates is not separately disclosed and is included in realized and unrealized gains or losses on investments, when applicable.
Foreign Currency Spot Contracts: The Funds may enter into foreign currency spot contracts to facilitate transactions in foreign securities or to convert foreign currency receipts into U.S. dollars. A foreign currency spot contract is an agreement between two parties to buy and sell currencies at the current market rate, for settlement generally within two business days. The U.S. dollar value of the contracts is determined using current currency exchange rates supplied by a pricing service. The contract is marked-to-market daily for settlements beyond one day and any change in market value is recorded as an unrealized gain or loss. When the contract is closed, the Fund records a realized gain or loss equal to the difference between the value on the open and close date. Losses may arise from changes in the value of the foreign currency, or if the counterparties do not perform under the contract’s terms. The maximum potential loss from such contracts is the aggregate face value in U.S. dollars at the time the contract was opened.
Real Estate Investment Trusts (“REITs”): The Funds may invest a portion of their assets in REITs and are subject to certain risks associated with direct investment in REITs. REITs may be affected by changes in the value of their underlying properties and by defaults by borrowers or tenants. REITs depend generally on their ability to generate cash flow to make distributions to shareowners, and certain REITs have self-liquidation provisions by which mortgages held may be paid in full and distributions of capital returns may be made at any time. In addition, the performance of a REIT may be affected by its failure to qualify for tax-free pass-through of income under the Internal Revenue Code of 1986, as amended (the “Code”), or its failure to maintain exemption from registration under the 1940 Act. Distributions that the Fund receives from REITs can be classified as ordinary income, capital gain income or return of capital by the REITs that make these distributions to the Fund. However, it is not possible for the Fund to characterize distributions received from REITs during interim periods because the REIT issuers do not report their tax characterizations until subsequent to year end. During interim periods, the REIT distributions are accounted for as ordinary income until the re characterizations are made subsequent to year end.
Treasury Inflation Protected-Securities (“TIPS”): The Funds may invest in TIPS, including structured bonds in which the principal amount is adjusted daily to keep pace with inflation, as measured by the U.S. Consumer Pricing Index for Urban Consumers. The adjustments to principal due to inflation/deflation are reflected as increases/decreases to interest income with a corresponding adjustment to cost. Such adjustments may have a significant impact on a Fund’s distributions and may result in a return of capital to shareholders. The repayment of the original bond principal upon maturity is guaranteed by the full faith and credit of the U.S. Government.
157 | October 31, 2017
Notes to Financial Statements
October 31, 2017
Loan Participations and Assignments: Certain Funds may invest in loan participations and assignments. The Fund considers loan participations and assignments to be investments in debt securities. Loan participations typically will result in the Fund having a contractual relationship only with the lender, not with the borrower. The Fund will have the right to receive payments of principal, interest and any fees to which it is entitled only from the lender selling the participation and only upon receipt by the lender of the payments from the borrower. Under a loan participation, the Fund generally will have no right to enforce compliance by the borrower with the terms of the loan agreement relating to the loan, nor any rights of set-off against the borrower, and the Fund may not benefit directly from any collateral supporting the loan in which it has purchased the participation. As a result, the Fund will assume the credit risk of both the borrower and the lender that is selling the participation. In the event of the insolvency of the lender selling a participation, the Fund may be treated as a general creditor of the lender and may not benefit from any set-off between the lender and the borrower. When the Fund purchases assignments of loans from lenders, the Fund will acquire direct rights against the borrower on the loan, except that under certain circumstances such rights may be more limited than those held by the assigning lender.
Master Limited Partnerships: Certain Funds may invest in MLPs, which are publicly traded partnerships engaged in the transportation, storage and processing of minerals and natural resources. By confining their operations to these specific activities, their interests, or units, are able to trade on public securities exchanges exactly like the shares of a corporation, without entity level taxation. To qualify as a MLP and to not be taxed as a corporation, a partnership must receive at least 90% of its income from qualifying sources as set forth in Section 7704(d) of the Code. These qualifying sources include natural resource based activities such as the processing, transportation and storage of mineral or natural resources. MLPs generally have two classes of owners, the general partner and limited partners. The general partner of an MLP is typically owned by a major energy company, an investment fund, the direct management of the MLP, or is an entity owned by one or more of such parties. The general partner may be structured as a private or publicly traded corporation or other entity. The general partner typically controls the operations and management of the MLP through an up to 2% equity interest in the MLP plus, in many cases, ownership of common units and subordinated units. Limited partners typically own the remainder of the partnership, through ownership of common units, and have a limited role in the partnership’s operations and management. MLPs are typically structured such that common units and general partner interests have first priority to receive quarterly cash distributions up to an established minimum amount (“minimum quarterly distributions” or “MQD”). Common and general partner interests also accrue arrearages in distributions to the extent the MQD is not paid. Once common and general partner interests have been paid, subordinated units receive distributions of up to the MQD; however, subordinated units do not accrue arrearages. Distributable cash in excess of the MQD is paid to both common and subordinated units and is distributed to both common and subordinated units generally on a pro rata basis. The general partner is also eligible to receive incentive distributions if the general partner operates the business in a manner which results in distributions paid per common unit surpassing specified target levels. As the general partner increases cash distributions to the limited partners, the general partner receives an increasingly higher percentage of the incremental cash distributions.
3. DERIVATIVE INSTRUMENTS
As a part of their investment strategy, the Funds are permitted to enter in various types of derivatives contracts. In doing so, the Funds employ strategies in differing combinations to permit them to increase, decrease, or change the level or types of exposure to market factors. Central to those strategies are features inherent in derivatives that make them more attractive for this purpose than equity or debt securities; they require little or no initial cash investment, they focus exposure on only certain selected risk factors, and they may not require the ultimate receipt or delivery of the underlying security (or securities) to the contract. This may allow the Funds to pursue their objectives more quickly and efficiently than if they were to make direct purchases or sales of securities capable of affecting a similar response to market factors.
Cash collateral is being pledged to cover derivative obligations of the Funds and cash collateral received from the counterparty, if any, is reported separately on the Statements of Assets and Liabilities as cash pledged as collateral and cash received as collateral, respectively. Non-cash collateral pledged by the Funds, if any, is noted in the Statements of Investments.
Risk of Investing in Derivatives: The Funds’ use of derivatives can result in losses due to unanticipated changes in the market risk factors and the overall market. In instances where the Funds are using derivatives to decrease, or hedge, exposures to market risk factors for securities held by the Funds, there are also risks that those derivatives may not perform as expected resulting in losses for the combined or hedged positions.
Derivatives may have little or no initial cash investment relative to their market value exposure and therefore can produce significant gains or losses in excess of their cost. This use of embedded leverage allows the Fund to increase its market value exposure relative to its net assets and can substantially increase the volatility of the Funds’ performance.
Additional associated risks from investing in derivatives also exist and potentially could have significant effects on the valuation of the derivative and the Funds. Typically, the associated risks are not the risks that the Funds are attempting to increase or decrease exposure to, per their investment objectives, but are the additional risks from investing in derivatives.
158 | October 31, 2017
Notes to Financial Statements
October 31, 2017
Examples of these associated risks are liquidity risk, which is the risk that the Funds will not be able to sell or close out the derivative in a timely manner, and counterparty credit risk, which is the risk that the counterparty will not fulfill its obligation to the Funds. In addition, use of derivatives may increase or decrease exposure to the following risk factors:
Equity Risk: Equity risk relates to the change in value of equity securities as they relate to increases or decreases in the general market. Associated risks can be different for each type of derivative and are discussed by each derivative type in the notes that follow.
Commodity Risk: Exposure to the commodities markets may subject the Funds to greater volatility than investments in traditional securities. Prices of various commodities may also be affected by factors, such as drought, floods, weather, livestock disease, embargoes, tariffs and other regulatory developments, which are unpredictable. The prices of commodities can also fluctuate widely due to supply and demand disruptions in major producing or consuming regions.
Foreign Currency Risk: Currency trading involves significant risks, including market risk, interest rate risk, country risk, counterparty credit risk and short sale risk. Market risk results from the price movement of foreign currency values in response to shifting market supply and demand. Interest rate risk arises whenever a country changes its stated interest rate target associated with its currency. Country risk arises because virtually every country has interfered with international transactions in its currency.
Interest Rate Risk: Interest rate risk is the risk that fixed income securities will decline in value because of changes in interest rates. As nominal interest rates rise, the value of fixed income securities held by the Funds are likely to decrease. Securities with longer durations tend to be more sensitive to changes in interest rates, and are usually more volatile than securities.
Swap Contracts: Each Fund may enter into swap transactions for hedging purposes or to seek to increase total return. At the present time, the CoreCommodity Fund primarily enters into swap transactions for the purpose of increasing total return. Swap agreements may be executed in a multilateral or other trade facility program, such as a registered exchange (“centrally cleared swaps”) or may be privately negotiated in the over-the counter market. The duration of a swap agreement typically ranges from a few weeks to more than one year. In a centrally cleared swap, immediately following execution of the swap agreement, the swap agreement is novated to a central counterparty (the “CCP”) and the Fund’s counterparty on the swap agreement becomes the CCP. Risks may arise as a result of the failure of the counterparty to the swap contract to comply with the terms of the swap contract. The loss incurred by the failure of a counterparty is generally limited to the net payment to be received by the Funds and/or the termination value at the end of the contract. Therefore, the Funds consider the creditworthiness of each counterparty to a contract in evaluating potential credit risk. Although centrally cleared swaps typically present less counterparty risk than non-centrally cleared swaps, a Fund that has entered into centrally cleared swaps is subject to the risk of the failure of the CCP.
Additionally, risks may arise from unanticipated movements in interest rates or in the value of the underlying reference asset or index. Entering into these agreements involves, to varying degrees, market risk, liquidity risk and elements of credit, legal and documentation risk that are not directly reflected in the amounts recognized in the Statements of Assets and Liabilities.
The Funds may pay or receive cash as collateral on these contracts which may be recorded as an asset and/or liability. The Funds must set aside liquid assets, or engage in other appropriate measures, to cover its obligations under these contracts. Swaps are marked to market daily using either pricing vendor quotations, counterparty prices or model prices and the change in value, if any, is recorded as an unrealized gain or loss. Upfront payments made and/or received by the Funds are recorded as an asset and/or liability and realized gains or losses are recognized ratably over the contract’s term/event, with the exception of forward starting interest rate swaps, whose realized gains or losses are recognized ratably from the effective start date. Periodic payments received or made on swap contracts are recorded as realized gains or losses. Gains or losses are realized upon termination of a swap contract and are recorded on the Statement of Operations.
Total return swaps are agreements in which there is an exchange of cash flows whereby one party commits to make payments based on the total return (coupons plus capital gains/losses) of an underlying instrument in exchange for fixed or floating rate interest payments. To the extent the total return of the instrument or index underlying the transaction exceeds or falls short of the offsetting interest rate obligation, the Fund will receive a payment from or make a payment to the counterparty. Credit default swaps are a type of swap agreement in which the protection “buyer” is generally obligated to pay the protection “seller” an upfront and/ or a periodic stream of payments over the term of the contract provided that no credit event, such as a default, on a reference obligation has occurred. Credit default swaps (“CDS”) are typically two-party financial contracts that transfer credit exposure between the two parties. Under a typical CDS, one party (the “seller”) receives pre-determined periodic payments from the other party (the “buyer”). The seller agrees to make compensating specific payments to the buyer if a negative credit event occurs, such as the bankruptcy or default by the issuer of the underlying debt instrument. Swap agreements held at October 31, 2017 are disclosed after the Statement of Investments.
159 | October 31, 2017
Notes to Financial Statements
October 31, 2017
The average notional amount of the swap positions held in the ALPS | CoreCommodity Management CompleteCommodities® Strategy Fund for the Fiscal Year Ended October 31, 2017 was $350,120,837.
Futures: Each Fund may invest in futures contracts in accordance with their investment objectives. Each Fund does so for a variety of reasons including for cash management, hedging or non-hedging purposes in an attempt to achieve the Fund’s investment objective. A futures contract provides for the future sale by one party and purchase by another party of a specified quantity of the security or other financial instrument at a specified price and time. A futures contract on an index is an agreement pursuant to which two parties agree to take or make delivery of an amount of cash equal to the difference between the value of the index at the close of the last trading day of the contract and the price at which the index contract was originally written. Futures transactions may result in losses in excess of the amount invested in the futures contract. There can be no guarantee that there will be a correlation between price movements in the hedging vehicle and in the portfolio securities being hedged. An incorrect correlation could result in a loss on both the hedged securities in a Fund and the hedging vehicle so that the portfolio return might have been greater had hedging not been attempted. There can be no assurance that a liquid market will exist at a time when a Fund seeks to close out a futures contract or a futures option position. Lack of a liquid market for any reason may prevent a Fund from liquidating an unfavorable position, and the Fund would remain obligated to meet margin requirements until the position is closed. In addition, a Fund could be exposed to risk if the counterparties to the contracts are unable to meet the terms of their contracts. With exchange traded futures, there is minimal counterparty credit risk to the Funds since futures are exchange traded and the exchange’s clearinghouse, as counterparty to all exchange traded futures, guarantees the futures against default.
When a purchase or sale of a futures contract is made by a Fund, the Fund is required to deposit with its custodian (or broker, if legally permitted) a specified amount of liquid assets (“initial margin”). The margin required for a futures contract is set by the exchange on which the contract is traded and may be modified during the term of the contract. The initial margin is in the nature of a performance bond or good faith deposit on the futures contract that is returned to a Fund upon termination of the contract, assuming all contractual obligations have been satisfied. These amounts are included in Deposit with broker for futures contracts on the Statement of Assets and Liabilities. Each day a Fund may pay or receive cash, called “variation margin,” equal to the daily change in value of the futures contract. Such payments or receipts are recorded for financial statement purposes as unrealized gains or losses by a Fund. Variation margin does not represent a borrowing or loan by a Fund but is instead a settlement between a Fund and the broker of the amount one would owe the other if the futures contract expired. When the contract is closed, a Fund records a realized gain or loss equal to the difference between the value of the contract at the time it was opened and the value at the time it was closed.
The average value of futures contracts held in the ALPS | CoreCommodity Management CompleteCommodities® Strategy Fund and the ALPS | WMC Research Value Fund for the Fiscal Year Ended October 31, 2017 were $45,202,922 and $803,013 respectively.
Option Contracts: Each Fund may enter into options transactions for hedging purposes and for non-hedging purposes such as seeking to enhance return. Each Fund may write covered put and call options on any stocks or stock indices, currencies traded on domestic and foreign securities exchanges, or futures contracts on stock indices, interest rates and currencies traded on domestic and, to the extent permitted by the CFTC, foreign exchanges. A call option on an asset written by a Fund obligates the Fund to sell the specified asset to the holder (purchaser) at a stated price (the exercise price) if the option is exercised before a specified date (the expiration date). A put option on an asset written by a Fund obligates the Fund to buy the specified asset from the purchaser at the exercise price if the option is exercised before the expiration date. Premiums received when writing options are recorded as liabilities and are subsequently adjusted to the current value of the options written. Premiums received from writing options that expire are treated as realized gains. Premiums received from writing options, which are either exercised or closed, are offset against the proceeds received or amount paid on the transaction to determine realized gains or losses which are recorded on the Statement of Operations.
The average value of written options held in the ALPS | CoreCommodity Management CompleteCommodities® Strategy Fund for the Fiscal Year Ended October 31, 2017 was $7,207.
160 | October 31, 2017
Notes to Financial Statements
October 31, 2017
Derivatives Instruments: The following tables disclose the amounts related to each Fund’s use of derivative instruments.
The effect of derivatives instruments on the Statement of Assets and Liabilities for the Fiscal Year Ended October 31, 2017:
| Risk Exposure | Asset Location | Fair Value | Liability Location | Fair Value | ||||||||
| ALPS | CoreCommodity Management CompleteCommodities® Strategy Fund(a) | ||||||||||||
| Commodity Contracts (Futures Contracts) | Unrealized appreciation on futures contracts(b) | 3,751,619 | Unrealized depreciation on futures contracts(b) | (1,480,284 | ) | |||||||
| Commodity Contracts (Total Return Swap Contracts) | Unrealized appreciation on total return swap contracts | 876 | Unrealized depreciation on total return swap contracts | (996 | ) | |||||||
| Total | $ | 3,752,495 | $ | (1,481,280 | ) | |||||||
| (a) | The ALPS | CoreCommodity Management CompleteCommodities® Strategy Fund consolidates the statements of assets and liabilities. |
| (b) | Represents cumulative appreciation (depreciation) of futures contracts as reported in the Consolidated Statement of Investments. Only the current day’s net variation margin is reported within the Consolidated Statement of Assets and Liabilities. |
The effect of derivatives instruments on the Statement of Operations for the Fiscal Year Ended October 31, 2017:
| Risk Exposure | Statement of Operations Location | Realized Gain/(Loss) on Derivatives Recognized in Income | Change in Unrealized Appreciation/ (Depreciation) on Derivatives Recognized in Income | |||||||
| ALPS | CoreCommodity Management CompleteCommodities® Strategy Fund(a) | ||||||||||
| Equity Contracts (Written Options) | Net realized gain on written options/Net change in unrealized appreciation on written options | $ | 113,811 | $ | – | |||||
| Equity and Commodity Contracts (Futures Contracts) | Net realized loss on futures contracts/Net change in unrealized appreciation on futures contracts | 4,433,484 | 3,601,793 | |||||||
| Commodity Contracts (Total Return Swap Contracts) | Net realized gain on total return swap contracts/Net change in unrealized appreciation on total return swap contracts | 4,288,933 | 185,143 | |||||||
| Total | $ | 8,836,228 | $ | 3,786,936 | ||||||
| ALPS | WMC Research Value Fund | ||||||||||
| Equity Contracts (Futures Contracts) | Net realized gain on futures contracts/Net change in unrealized appreciation on futures contracts | 100,052 | 13,220 | |||||||
| Total | $ | 100,052 | $ | 13,220 | ||||||
| (a) | The ALPS | CoreCommodity Management CompleteCommodities® Strategy Fund consolidates the statements of operations. |
161 | October 31, 2017
Notes to Financial Statements
October 31, 2017
Certain derivative contracts are executed under either standardized netting agreements or, for exchange-traded derivatives, the relevant contracts for a particular exchange which contain enforceable netting provisions. A derivative netting arrangement creates an enforceable right of set-off that becomes effective, and affects the realization of settlement on individual assets, liabilities and collateral amounts, only following a specified event of default or early termination. Default events may include the failure to make payments or deliver securities timely, material adverse changes in financial condition or insolvency, the breach of minimum regulatory capital requirements, or loss of license, charter or other legal authorization necessary to perform under the contract.
The following table presents financial instruments that are subject to enforceable netting arrangements or other similar agreements as of October 31, 2017:
| Offsetting of Derivatives Asset | ||||||||||||||||||||||||
| October 31, 2017 | ||||||||||||||||||||||||
| Gross Amounts Not Offset in the Statement of Financial Position | ||||||||||||||||||||||||
| Gross Amounts of Recognized Assets | Gross Amounts Offset in the Statement of Assets and Liabilities | Net Amounts Presented in the Statement of Assets and Liabilities | Financial Instruments(a) | Cash Collateral Received(a) | Net Amount | |||||||||||||||||||
| ALPS | CoreCommodity Management CompleteCommodities® Strategy Fund | ||||||||||||||||||||||||
| Total Return Swap Contracts | $ | 876 | $ | – | $ | 876 | $ | (876 | ) | $ | – | $ | – | |||||||||||
| Total | $ | 876 | $ | – | $ | 876 | $ | (876 | ) | $ | – | $ | – | |||||||||||
| Offsetting of Derivatives Liability | ||||||||||||||||||||||||
| October 31, 2017 | ||||||||||||||||||||||||
| Gross Amounts Not Offset in the Statement of Financial Position | ||||||||||||||||||||||||
| Gross Amounts of Recognized Liabilities | Gross Amounts Offset in the Statement of Assets and Liabilities | Net Amounts Presented in the Statement of Assets and Liabilities | Financial Instruments(a) | Cash Collateral Pledged(a) | Net Amount | |||||||||||||||||||
| ALPS | CoreCommodity Management CompleteCommodities® Strategy Fund | ||||||||||||||||||||||||
| Total Return Swap Contracts | $ | 996 | $ | – | $ | 996 | $ | (996 | ) | $ | – | $ | – | |||||||||||
| Total | $ | 996 | $ | – | $ | 996 | $ | (996 | ) | $ | – | $ | – | |||||||||||
| (a) | These amounts are limited to the derivative asset/liability balance and, accordingly, do not include excess collateral received/pledged. |
4. TAX BASIS INFORMATION
Tax Basis of Distributions to Shareholders: The character of distributions made during the year from net investment income or net realized gains may differ from its ultimate characterization for federal income tax purposes. Also, due to the timing of dividend distributions, the fiscal year in which amounts are distributed may differ from the fiscal year in which the income or realized gain were recorded by a Fund. The amounts and characteristics of tax basis distributions and composition of distributable earnings/(accumulated losses) are finalized at fiscal year-end.
162 | October 31, 2017
Notes to Financial Statements
October 31, 2017
The tax character of distributions paid by the Funds for the Fiscal Year Ended October 31, 2017 were as follows:
| Fund | Ordinary Income | Long-Term Capital Gain | Return of Capital | |||||||||
| ALPS | Alerian MLP Infrastructure Index Fund | $ | – | $ | – | $ | 3,317,806 | ||||||
| ALPS | CoreCommodity Management CompleteCommodities® Strategy Fund | 507,017 | – | – | |||||||||
| ALPS | Kotak India Growth Fund | – | 203,399 | – | |||||||||
| ALPS | Red Rocks Listed Private Equity Fund | 3,499,952 | – | – | |||||||||
| ALPS | WMC Research Value Fund | 153,642 | 2,752,711 | – | |||||||||
| Clough China Fund | 103,112 | – | – | |||||||||
| RiverFront Conservative Income Builder Fund | 126,975 | – | – | |||||||||
| RiverFront Dynamic Equity Income Fund | 889,374 | – | – | |||||||||
| RiverFront Global Allocation Fund | 482,397 | – | – | |||||||||
| RiverFront Global Growth Fund | 776,294 | – | – | |||||||||
| RiverFront Moderate Growth & Income Fund | 1,450,017 | – | – | |||||||||
| ALPS | Metis Global Micro Cap Value Fund | 1,148,509 | – | – | |||||||||
The tax character of distributions paid by the Funds for the Fiscal Year Ended October 31, 2016 were as follows:
| Fund | Ordinary Income | Long-Term Capital Gain | Return of Capital | |||||||||
| ALPS | Alerian MLP Infrastructure Index Fund | $ | 129,381 | $ | – | $ | 3,011,546 | ||||||
| ALPS | Kotak India Growth Fund | 431,005 | 1,657,288 | – | |||||||||
| ALPS | Red Rocks Listed Private Equity Fund | 17,431,894 | 20,197,928 | – | |||||||||
| ALPS | WMC Research Value Fund | 703,783 | 27,067,576 | – | |||||||||
| Clough China Fund | 1,041,910 | – | – | |||||||||
| RiverFront Conservative Income Builder Fund | 145,507 | 30,599 | – | |||||||||
| RiverFront Dynamic Equity Income Fund | 1,315,134 | 1,636,020 | – | |||||||||
| RiverFront Global Allocation Fund | 493,350 | 165,999 | – | |||||||||
| RiverFront Global Growth Fund | 1,138,129 | 742,246 | – | |||||||||
| RiverFront Moderate Growth & Income Fund | 2,445,173 | 2,965,868 | – | |||||||||
Components of Distributable Earnings on a Tax Basis: At October 31, 2017, permanent differences in book and tax accounting were reclassified. These differences had no effect on net assets and were primarily attributed to differences in the treatment of commodity related controlled foreign corporations, securities redeemed in kind, the differing tax treatment of foreign currency, investments in partnerships, Passive Foreign Investment Companies (“PFICs”) and certain other investments.
For the fiscal year ended October 31, 2017, the following reclassifications, which had no impact on results of operations or net assets, were recorded to reflect tax character:
| Fund | Paid-in Capital | Accumulated Net Investment Income/(Loss) | Accumulated Net Realized Gain/(Loss) on Investments | |||||||||
| ALPS | CoreCommodity Management CompleteCommodities® Strategy Fund | $ | (3,264,557 | ) | $ | 12,004,255 | $ | (8,739,698 | ) | ||||
| ALPS | Kotak India Growth Fund | (23,472 | ) | 93,141 | (69,669 | ) | |||||||
| ALPS | Metis Global Micro Cap Value Fund(a) | (10,994 | ) | 95,833 | (84,839 | ) | |||||||
| ALPS | Red Rocks Listed Private Equity Fund | 4,316,742 | 12,397,227 | (16,713,969 | ) | ||||||||
| ALPS | WMC Research Value Fund | – | 10,081 | (10,081 | ) | ||||||||
| Clough China Fund | (1 | ) | (9,803 | ) | 9,804 | |||||||
| RiverFront Moderate Growth & Income Fund | (1 | ) | – | 1 | ||||||||
163 | October 31, 2017
Notes to Financial Statements
October 31, 2017
Included in the amounts reclassified was a net operating loss offset to Paid-in Capital as follows:
| Fund | Amount | |||
| ALPS | Kotak India Growth Fund | $ | 23,472 | ||
As of October 31, 2017, the components of distributable earnings on a tax basis were as follows:
| Undistributed net investment income | Accumulated net realized gain/(loss) on investments | Other cumulative effect of timing differences | Net unrealized appreciation/ (depreciation) on investments | Total | ||||||||||||||||
| ALPS | CoreCommodity Management CompleteCommodities® Strategy Fund | $ | 12,117,676 | $ | (48,942,477 | ) | $ | (237,000 | ) | $ | 8,660,674 | $ | (28,401,127 | ) | |||||||
| ALPS | Kotak India Growth Fund | – | 883,870 | (112,097 | ) | 5,959,993 | 6,731,766 | ||||||||||||||
| ALPS | Metis Global Micro Cap Value Fund | 1,713,379 | 888,245 | – | 2,063,522 | 4,665,146 | |||||||||||||||
| ALPS | Red Rocks Listed Private Equity Fund | 19,368,973 | 6,665,358 | (315,208 | ) | 33,893,367 | 59,612,490 | ||||||||||||||
| ALPS | WMC Research Value Fund | 2,576,644 | 4,591,674 | – | 10,624,040 | 17,792,358 | |||||||||||||||
| Clough China Fund | 225,382 | (4,908,264 | ) | – | 21,752,172 | 17,069,290 | ||||||||||||||
| RiverFront Conservative Income Builder Fund | 14,179 | 184,557 | – | 806,557 | 1,005,293 | |||||||||||||||
| RiverFront Dynamic Equity Income Fund | 15,982 | 1,757,863 | – | 12,626,322 | 14,400,167 | |||||||||||||||
| RiverFront Global Allocation Fund | 168,257 | 195,316 | – | 6,029,206 | 6,392,779 | |||||||||||||||
| RiverFront Global Growth Fund | 366,067 | 1,660,448 | – | 11,596,435 | 13,622,950 | |||||||||||||||
| RiverFront Moderate Growth & Income Fund | 151,684 | 4,261,898 | – | 11,377,499 | 15,791,081 | |||||||||||||||
Capital Losses: As of October 31, 2017 the following Funds had capital loss carryforwards which may reduce the Funds’ taxable income arising from future net realized gains on investments, if any, to the extent permitted by the Code and thus may reduce the amount of the distributions to shareholders which would otherwise be necessary to relieve the Funds of any liability for federal tax.
Post-Enactment Capital Losses*:
Capital losses deferred to next tax year were as follows:
| Fund | Short-Term | Long-Term | ||||||
| ALPS | CoreCommodity Management CompleteCommodities® Strategy Fund | $ | 23,471,178 | $ | 25,471,299 | ||||
| Clough China Fund | 4,908,264 | – | ||||||
| * | Post-Enactment Capital Losses arise in fiscal years beginning after December 22, 2010, and exclude any election for late year capital loss (during the period November 1st to December 31st) deferred for the current fiscal year. As a result of the enactment of the Regulated Investment Company Act of 2010, pre-enactment capital loss carryforwards may be more likely to expire unused. Additionally, post-enactment capital losses that are carried forward will retain their character as either short-term or long-term losses rather than being considered all short-term as under previous law. |
Capital loss carryovers used during the period ended October 31, 2017 were:
| Fund | Amount | |||
| ALPS | Red Rocks Listed Private Equity Fund | $ | 7,172,573 | ||
| Clough China Fund | 2,990,016 | |||
| RiverFront Conservative Income Builder Fund | 265,772 | |||
| RiverFront Dynamic Equity Income Fund | 1,876,307 | |||
| RiverFront Global Allocation Fund | 1,501,113 | |||
| RiverFront Global Growth Fund | 1,203,607 | |||
| RiverFront Moderate Growth & Income Fund | 2,468,558 | |||
164 | October 31, 2017
Notes to Financial Statements
October 31, 2017
The following funds elected to defer to the period ending October 31, 2018, late year ordinary losses:
| Fund | Amount | |||
| ALPS | Kotak India Growth Fund | $ | 112,097 | ||
Unrealized Appreciation and Depreciation on Investments: As of October 31, 2017, the costs of investments for federal income tax purposes and accumulated net unrealized appreciation/(depreciation) on investments were as follows:
| Fund | Gross Appreciation (excess of value over tax cost) | Gross Depreciation (excess of tax cost over value) | Net Appreciation of Foreign Currency | Net Unrealized Appreciation/ (Depreciation) | Cost of Investments for Income Tax Purposes | |||||||||||||||
| ALPS | Alerian MLP Infrastructure Index Fund | $ | 944,936 | $ | (4,823,025 | ) | – | $ | (3,878,089 | ) | $ | 48,805,942 | |||||||||
| ALPS | CoreCommodity Management Complete Commodities® Strategy Fund | 412,673,638 | (404,011,603 | ) | $ | (1,361 | ) | 8,660,674 | 523,353,843 | ||||||||||||
| ALPS | Kotak India Growth Fund | 6,998,157 | (1,038,440 | ) | 276 | 5,959,993 | 25,032,431 | ||||||||||||||
| ALPS | Metis Global Micro Cap Value Fund | 4,749,247 | (2,685,414 | ) | (311 | ) | 2,063,522 | 28,737,432 | |||||||||||||
| ALPS | Red Rocks Listed Private Equity Fund | 35,765,581 | (1,870,428 | ) | (1,786 | ) | 33,893,367 | 182,869,656 | |||||||||||||
| ALPS | WMC Research Value Fund | 14,491,504 | (3,867,466 | ) | 2 | 10,624,040 | 82,367,350 | ||||||||||||||
| Clough China Fund | 22,173,214 | (417,103 | ) | (3,939 | ) | 21,752,172 | 36,629,124 | |||||||||||||
| RiverFront Conservative Income Builder Fund | 815,615 | (9,058 | ) | – | 806,557 | 10,879,135 | ||||||||||||||
| RiverFront Dynamic Equity Income Fund | 12,635,653 | (9,331 | ) | – | 12,626,322 | 66,677,318 | ||||||||||||||
| RiverFront Global Allocation Fund | 6,031,181 | (1,975 | ) | – | 6,029,206 | 27,961,018 | ||||||||||||||
| RiverFront Global Growth Fund | 11,596,435 | – | – | 11,596,435 | 50,444,874 | |||||||||||||||
| RiverFront Moderate Growth & Income Fund | 11,412,399 | (34,900 | ) | – | 11,377,499 | 84,451,469 | ||||||||||||||
Deferred Tax Asset/Liability for ALPS | Alerian MLP Infrastructure Index Fund
Since the ALPS | Alerian MLP Infrastructure Index Fund (the “Fund” for purposes of this section) will be subject to taxation on its taxable income, the NAV of Fund shares will also be reduced by the accrual of any deferred tax liabilities. The Index however is calculated without any adjustments for taxes. As a result, the Fund’s after tax performance could differ significantly from the Index even if the pretax performance of the Fund and the performance of the Index are closely correlated.
Cash distributions from MLPs to the ALPS | Alerian MLP Infrastructure Index Fund that exceed such Fund’s allocable share of such MLP’s net taxable income are considered a tax-deferred return of capital that will reduce the Fund’s adjusted tax basis in the equity securities of the MLP. These reductions in such Fund’s adjusted tax basis in the MLP equity securities will increase the amount of gain (or decrease the amount of loss) recognized by the Fund on a subsequent sale of the securities. The Fund will accrue deferred income taxes for any future tax liability associated with (i) that portion of MLP distributions considered to be a tax-deferred return of capital as well as (ii) capital appreciation of its investments. Upon the sale of an MLP security, the Fund may be liable for previously deferred taxes. The Fund will rely to some extent on information provided by the MLPs, which is not necessarily timely, to estimate deferred tax liability for purposes of financial statement reporting and determining the NAV. From time to time, ALPS Advisors, Inc. will modify the estimates or assumptions related to the Fund’s deferred tax liability as new information becomes available. The Fund will generally compute deferred income taxes based on the marginal regular federal income tax rate applicable to corporations and an assumed rate attributable to state taxes.
165 | October 31, 2017
Notes to Financial Statements
October 31, 2017
The Fund’s income tax expense/(benefit) consists of the following:
| October 31, 2017 | Current | Deferred | Total | |||||||||
| Federal | $ | – | $ | (1,135,621 | ) | $ | (1,135,621 | ) | ||||
| State | – | (75,289 | ) | (75,289 | ) | |||||||
| Valuation Allowance | – | 1,210,910 | 1,210,910 | |||||||||
| Total tax expense | $ | – | $ | – | $ | – |
| October 31, 2016 | Current | Deferred | Total | |||||||||
| Federal | $ | – | $ | 102,043 | $ | 102,043 | ||||||
| State | – | 6,003 | 6,003 | |||||||||
| Valuation Allowance | – | (108,046 | ) | (108,046 | ) | |||||||
| Total tax expense | $ | – | $ | – | $ | – |
Deferred income taxes reflect the net tax effect of temporary differences between the carrying amounts of assets and liabilities for financial reporting and tax purposes.
Components of the Fund’s deferred tax assets and liabilities are as follows:
| As of October 31, 2017 | ||||
| Non-current Deferred tax assets/(liabilities): | ||||
| Net unrealized loss on investment securities | $ | 1,399,215 | ||
| Net Operating Loss Carryforward | 1,364,226 | |||
| Capital Loss Carryforward | 1,063,038 | |||
| Other | 1,273 | |||
| Less Valuation Allowance | (3,827,752 | ) | ||
| Net Deferred tax asset | $ | – | ||
| As of October 31, 2016 | ||||
| Non-current Deferred tax assets/(liabilities): | ||||
| Net unrealized loss on investment securities | $ | 1,278,651 | ||
| Net Operating Loss Carryforward | 651,767 | |||
| Capital Loss Carryforward | 684,232 | |||
| Other | 2,192 | |||
| Less Valuation Allowance | (2,616,842 | ) | ||
| Net Deferred tax asset | $ | – | ||
The net operating loss carryforward is available to offset future taxable income. The net operating loss can be carried forward for 20 years and, accordingly, would begin to expire as of October 31, 2035. The Fund has net operating loss carryforwards for federal income tax purposes as follows:
| Year-Ended | Amount | Expiration | |||||||
| 10/31/2015 | $ | 321,960 | 10/31/2035 | ||||||
| 10/31/2016 | $ | 1,227,957 | 10/31/2036 | ||||||
| 10/31/2017 | $ | 2,231,199 | 10/31/2037 | ||||||
The capital loss carryforward is available to offset future capital gains. The capital loss can be carried forward for 5 years and, accordingly, would begin to expire as of October 31, 2021. The Fund has capital loss carryforwards for federal income tax purposes as follows:
| Year-Ended | Amount | Expiration | |||||||
| 10/31/2016 | $ | 2,946,337 | 10/31/2021 | ||||||
166 | October 31, 2017
Notes to Financial Statements
October 31, 2017
The Fund reviews the recoverability of its deferred tax assets based upon the weight of available evidence. When assessing the recoverability of its deferred tax assets, significant weight was given to the effects of potential future realized and unrealized gains on investments and the period over which these deferred tax assets can be realized. Any capital losses that may be generated by the Fund are eligible to be carried back up to three years and can be carried forward for five years to offset capital gains recognized by the fund in those years. Net operating losses that may be generated by the Fund are eligible to be carried back up to two years and can be carried forward for 20 years to offset income generated by the Fund in those years.
To the extent the Fund has a deferred tax asset, consideration is given to whether or not a valuation allowance, which would offset the value of some or all of the deferred tax asset balance, is required. A valuation allowance is required if based on the evaluation criterion provided by Accounting Standards Codification (“ASC”) 740, Income Taxes (ASC 740) it is more likely than not that some portion, or all, of the deferred tax asset will not be realized. The factors considered in assessing the Fund’s valuation allowance include: the nature, frequency and severity of current and cumulative losses, the duration of the statutory carryforward periods and the associated risks that operating and capital loss carryforwards may expire unutilized. From time to time, as new information becomes available, the Fund will modify its estimates or assumptions regarding the deferred tax liability or asset.
As of the balance sheet date, Fund Management has assessed that it is not more likely than not that the deferred tax assets will be realized through future taxable income of the appropriate character. Accordingly, a valuation allowance has been established for the Fund’s deferred tax assets. The Fund will continue to assess the need for a valuation allowance in the future. Significant increases in the fair value of its portfolio of investments or other factors may change the Fund’s assessment of the recoverability of these assets and may result in the removal of the valuation allowance against all or a portion of the Fund’s gross deferred tax assets.
Total income tax expense (current and deferred) differs from the amount computed by applying the federal statutory income tax rate of 34% to net investment and realized and unrealized gain/(losses) on investment before taxes as follows:
| For the Year Ended October 31, 2017 | ||||
| Income tax expense at statutory rate | $ | (1,132,793 | ) | |
| State income taxes (net of federal benefit) | (69,300 | ) | ||
| Permanent differences, net | (3,002 | ) | ||
| Change in estimated state deferred rate | (5,815 | ) | ||
| Valuation Allowance | 1,210,910 | |||
| Net income tax expense/(benefit) | $ | – | ||
167 | October 31, 2017
Notes to Financial Statements
October 31, 2017
| For the Year Ended October 31, 2016 | ||||
| Income tax expense at statutory rate | $ | 107,230 | ||
| State income taxes (net of federal benefit) | 6,308 | |||
| Permanent differences, net | (5,596 | ) | ||
| Change in estimated state deferred rate | – | |||
| Other | 104 | |||
| Valuation Allowance | (108,046 | ) | ||
| Net income tax expense/(benefit) | $ | – | ||
The following is a tabular reconciliation of the total amounts of unrecognized tax benefits:
| October 31, 2017 | ||||
| Unrecognized tax benefit - Beginning | $ | – | ||
| Gross increases - tax positions in prior period | – | |||
| Gross decreases - tax positions in prior period | – | |||
| Gross increases - tax positions in current period | – | |||
| Settlement | – | |||
| Lapse of statute of limitations | – | |||
| Net income tax expense | $ | – |
| October 31, 2016 | ||||
| Unrecognized tax benefit - Beginning | $ | – | ||
| Gross increases - tax positions in prior period | – | |||
| Gross decreases - tax positions in prior period | – | |||
| Gross increases - tax positions in current period | – | |||
| Settlement | – | |||
| Lapse of statute of limitations | – | |||
| Net income tax expense | $ | – |
The Fund recognizes interest accrued related to unrecognized tax benefits and penalties as income tax expense. The Fund had no accrued penalties or interest for the Fiscal Year Ended October 31, 2017.
The Fund recognizes the tax benefits of uncertain tax positions only where the position is “more likely than not” to be sustained assuming examination by tax authorities. Management has analyzed the Fund’s tax positions, and has concluded that no liability for unrecognized tax benefits should be recorded related to uncertain tax positions taken on U.S. tax returns and state tax returns filed since inception of the fund. No U.S. federal or state income tax returns are currently under examination. Due to the nature of the Fund’s investments, the Fund may be required to file income tax returns in several states. The Fund is not aware of any tax positions for which it is reasonably possible that the total amounts of unrecognized tax benefits will change materially in the next 12 months.
168 | October 31, 2017
Notes to Financial Statements
October 31, 2017
5. SECURITIES TRANSACTIONS
Purchases and sales of securities, excluding short-term securities and U.S. Government Obligations during the Fiscal Year Ended October 31, 2017 were as follows:
| Fund | Purchases of Securities | Proceeds from Sales of Securities | ||||||
| ALPS | Alerian MLP Infrastructure Index Fund | $ | 26,479,005 | $ | 16,751,535 | ||||
| ALPS | CoreCommodity Management CompleteCommodities® Strategy Fund(a) | 114,764,959 | 115,202,817 | ||||||
| ALPS | Kotak India Growth Fund(b) | 16,405,259 | 7,096,048 | ||||||
| ALPS | Metis Global Micro Cap Value Fund | 26,648,991 | 15,428,705 | ||||||
| ALPS | Red Rocks Listed Private Equity Fund(c) | 68,222,488 | 213,900,439 | ||||||
| ALPS | WMC Research Value Fund | 66,227,689 | 78,384,985 | ||||||
| Clough China Fund | 36,867,208 | 44,753,277 | ||||||
| RiverFront Conservative Income Builder Fund | 7,679,632 | 11,499,595 | ||||||
| RiverFront Dynamic Equity Income Fund | 47,601,720 | 59,429,232 | ||||||
| RiverFront Global Allocation Fund | 18,535,429 | 25,750,742 | ||||||
| RiverFront Global Growth Fund | 34,585,019 | 42,577,851 | ||||||
| RiverFront Moderate Growth & Income Fund | 64,367,131 | 107,357,239 | ||||||
Purchases and sales of U.S. Government Obligations during the Fiscal Year Ended October 31, 2017 were as follows:
| Fund | Purchases of Securities | Proceeds from Sales of Securities | ||||||
| ALPS | CoreCommodity Management CompleteCommodities® Strategy Fund(a) | $ | 189,711,971 | $ | 189,369,875 | ||||
| (a) | Purchases and sales for ALPS | CoreCommodity Management CompleteCommodities® Strategy Fund are consolidated and include the balances of CoreCommodity Management Cayman Commodity Fund, Ltd. (wholly owned subsidiary). |
| (b) | Purchases and sales for ALPS | Kotak India Growth Fund are consolidated and include the balances of Kotak Mauritius Portfolio (wholly owned subsidiary). |
| (c) | Sales amount does not include redemption in-kind. |
During the year ended October 31, 2017, the ALPS | Red Rocks Listed Private Equity Fund made in-kind redemptions of securities. The market value of securities relating to the in-kind redemption transactions was in the amount of $19,895,557, with a realized gain of $4,464,818.
6. BENEFICIAL INTEREST TRANSACTIONS
Shares redeemed within 90 days of purchase for ALPS | Red Rocks Listed Private Equity Fund, 60 days of purchase for ALPS | Metis Global Micro Cap Value Fund and 30 days of purchase for ALPS | CoreCommodity Management CompleteCommodities® Strategy Fund, ALPS | Kotak India Growth Fund, and Clough China Fund, may incur a 2% short-term redemption fee deducted from the redemption amount. The ALPS | Alerian MLP Infrastructure Index Fund, ALPS | WMC Research Value Fund, RiverFront Conservative Income Builder Fund, RiverFront Dynamic Equity Income Fund, RiverFront Global Allocation Fund, RiverFront Global Growth Fund, and RiverFront Moderate Growth & Income Fund shares do not incur redemption fees.
For the Fiscal Year Ended October 31, 2017, the amounts listed below were retained by the Funds. These amounts are reflected in “Shares redeemed” in the Statements of Changes in Net Assets.
169 | October 31, 2017
Notes to Financial Statements
October 31, 2017
| Redemption Fee Retained | ||||||||
| Fund | For the Year Ended October 31, 2017 | For the Year Ended October 31, 2016 | ||||||
| ALPS | Alerian MLP Infrastructure Index Fund - Investor | $ | – | $ | 2,343 | ||||
| ALPS | CoreCommodity Management CompleteCommodities® Strategy Fund - Class I | 21,419 | 37,944 | ||||||
| ALPS | CoreCommodity Management CompleteCommodities® Strategy Fund - Investor | 4,451 | 952 | ||||||
| ALPS | Kotak India Growth Fund - Class C | – | 102 | ||||||
| ALPS | Kotak India Growth Fund - Class I | 5,965 | 7 | ||||||
| ALPS | Kotak India Growth Fund - Investor | 1,637 | 10 | ||||||
| ALPS | Metis Global Micro Cap Value Fund - Class I(a) | 423 | – | ||||||
| ALPS | Metis Global Micro Cap Value Fund - Investor(a) | 98 | 198 | ||||||
| ALPS | Red Rocks Listed Private Equity Fund - Class C | 476 | 272 | ||||||
| ALPS | Red Rocks Listed Private Equity Fund - Class I | 35,027 | 58,375 | ||||||
| ALPS | Red Rocks Listed Private Equity Fund - Investor | 4,962 | 16,347 | ||||||
| Clough China Fund - Class C | 2 | 101 | ||||||
| Clough China Fund - Class I | 260 | 2,551 | ||||||
| Clough China Fund - Investor | – | 650 | ||||||
| (a) | The Fund commenced operations on December 24, 2015. |
Transactions in shares of capital stock were as follows:
| ALPS | Alerian MLP Infrastructure Index Fund | ||||||||
| For the Year Ended October 31, 2017 | For the Year Ended October 31, 2016 | |||||||
| Class A | ||||||||
| Shares sold | 1,659,056 | 1,353,490 | ||||||
| Dividends reinvested | 131,209 | 119,284 | ||||||
| Shares redeemed | (771,957 | ) | (1,755,246 | ) | ||||
| Net increase/(decrease) in shares outstanding | 1,018,308 | (282,472 | ) | |||||
| Class C | ||||||||
| Shares sold | 337,669 | 678,733 | ||||||
| Dividends reinvested | 101,214 | 107,988 | ||||||
| Shares redeemed | (360,746 | ) | (553,699 | ) | ||||
| Net increase in shares outstanding | 78,137 | 233,022 | ||||||
| Class I | ||||||||
| Shares sold | 1,100,411 | 2,801,399 | ||||||
| Dividends reinvested | 237,532 | 221,667 | ||||||
| Shares redeemed | (817,089 | ) | (667,182 | ) | ||||
| Net increase in shares outstanding | 520,854 | 2,355,884 | ||||||
170 | October 31, 2017
Notes to Financial Statements
October 31, 2017
| ALPS | CoreCommodity Management CompleteCommodities® Strategy Fund | ||||||||
| For the Year Ended October 31, 2017 | For the Year Ended October 31, 2016 | |||||||
| Class A | ||||||||
| Shares sold | 3,889,576 | 2,078,071 | ||||||
| Dividends reinvested | 1,656 | – | ||||||
| Shares redeemed | (1,668,511 | ) | (2,244,116 | ) | ||||
| Net increase/(decrease) in shares outstanding | 2,222,721 | (166,045 | ) | |||||
| Class C | ||||||||
| Shares sold | 518,522 | 301,619 | ||||||
| Dividends reinvested | – | – | ||||||
| Shares redeemed | (507,012 | ) | (469,230 | ) | ||||
| Net increase/(decrease) in shares outstanding | 11,510 | (167,611 | ) | |||||
| Class I | ||||||||
| Shares sold | 28,571,916 | 38,694,156 | ||||||
| Dividends reinvested | 58,580 | – | ||||||
| Shares redeemed | (29,134,584 | ) | (25,932,814 | ) | ||||
| Net increase/(decrease) in shares outstanding | (504,088 | ) | 12,761,342 | |||||
| ALPS | Kotak India Growth Fund | ||||||||
| For the Year Ended October 31, 2017 | For the Year Ended October 31, 2016 | |||||||
| Class A | ||||||||
| Shares sold | 451,420 | 95,245 | ||||||
| Dividends reinvested | 4,607 | 65,989 | ||||||
| Shares redeemed | (267,927 | ) | (162,724 | ) | ||||
| Net increase/(decrease) in shares outstanding | 188,100 | (1,490 | ) | |||||
| Class C | ||||||||
| Shares sold | 17,209 | 5,570 | ||||||
| Dividends reinvested | 2,156 | 25,549 | ||||||
| Shares redeemed | (27,512 | ) | (29,391 | ) | ||||
| Net increase/(decrease) in shares outstanding | (8,147 | ) | 1,728 | |||||
| Class I | ||||||||
| Shares sold | 810,244 | 192,239 | ||||||
| Dividends reinvested | 8,955 | 102,843 | ||||||
| Shares redeemed | (258,515 | ) | (189,585 | ) | ||||
| Net increase in shares outstanding | 560,684 | 105,497 | ||||||
171 | October 31, 2017
Notes to Financial Statements
October 31, 2017
| ALPS | Metis Global Micro Cap Value Fund | ||||||||
| For the Year Ended October 31, 2017 | For the Period December 24, 2015 (Commencement) to October 31, 2016 | |||||||
| Class A | ||||||||
| Shares sold | 293,492 | 72,442 | ||||||
| Dividends reinvested | 8,687 | – | ||||||
| Shares redeemed | (30,569 | ) | (946 | ) | ||||
| Net increase in shares outstanding | 271,610 | 71,496 | ||||||
| Class C | ||||||||
| Shares sold | 27,472 | 22,381 | ||||||
| Dividends reinvested | 1,101 | – | ||||||
| Shares redeemed | (3,231 | ) | – | |||||
| Net increase in shares outstanding | 25,342 | 22,381 | ||||||
| Class I | ||||||||
| Shares sold | 707,127 | 1,323,269 | ||||||
| Dividends reinvested | 87,697 | – | ||||||
| Shares redeemed | (79,308 | ) | (2,409 | ) | ||||
| Net increase in shares outstanding | 715,516 | 1,320,860 | ||||||
| ALPS | Red Rocks Listed Private Equity Fund | ||||||||
| For the Year Ended October 31, 2017 | For the Year Ended October 31, 2016 | |||||||
| Class A | ||||||||
| Shares sold | 3,003,290 | 5,175,428 | ||||||
| Dividends reinvested | 102,237 | 2,082,869 | ||||||
| Shares redeemed | (16,688,308 | ) | (15,426,234 | ) | ||||
| Net decrease in shares outstanding | (13,582,781 | ) | (8,167,937 | ) | ||||
| Class C | ||||||||
| Shares sold | 597,701 | 372,093 | ||||||
| Dividends reinvested | 23,898 | 161,570 | ||||||
| Shares redeemed | (592,966 | ) | (1,037,361 | ) | ||||
| Net increase/(decrease) in shares outstanding | 28,633 | (503,698 | ) | |||||
| Class I | ||||||||
| Shares sold | 6,802,383 | 13,689,387 | ||||||
| Dividends reinvested | 321,770 | 2,315,329 | ||||||
| Shares redeemed | (18,513,141 | ) | (29,797,754 | ) | ||||
| Net decrease in shares outstanding | (11,388,988 | ) | (13,793,038 | ) | ||||
| Class R | ||||||||
| Shares sold | 208,338 | 233,544 | ||||||
| Dividends reinvested | 8,991 | 48,064 | ||||||
| Shares redeemed | (130,252 | ) | (275,974 | ) | ||||
| Net increase in shares outstanding | 87,077 | 5,634 | ||||||
172 | October 31, 2017
Notes to Financial Statements
October 31, 2017
| ALPS | WMC Research Value Fund | ||||||||
| For the Year Ended October 31, 2017 | For the Year Ended October 31, 2016 | |||||||
| Class A | ||||||||
| Shares sold | 68,781 | 36,897 | ||||||
| Dividends reinvested | 174,464 | 1,861,799 | ||||||
| Shares redeemed | (915,327 | ) | (749,507 | ) | ||||
| Net increase/(decrease) in shares outstanding | (672,082 | ) | 1,149,189 | |||||
| Class C | ||||||||
| Shares sold | 31,430 | 40,514 | ||||||
| Dividends reinvested | 814 | 20,844 | ||||||
| Shares redeemed | (6,219 | ) | (82,540 | ) | ||||
| Net increase/(decrease) in shares outstanding | 26,025 | (21,182 | ) | |||||
| Class I | ||||||||
| Shares sold | 400,927 | 674,466 | ||||||
| Dividends reinvested | 145,301 | 1,399,500 | ||||||
| Shares redeemed | (1,110,893 | ) | (593,532 | ) | ||||
| Net increase/(decrease) in shares outstanding | (564,665 | ) | 1,480,434 | |||||
| Clough China Fund | ||||||||
| For the Year Ended October 31, 2017 | For the Year Ended October 31, 2016 | |||||||
| Class A | ||||||||
| Shares sold | 55,498 | 77,224 | ||||||
| Dividends reinvested | 537 | 11,930 | ||||||
| Shares redeemed | (283,590 | ) | (380,746 | ) | ||||
| Net decrease in shares outstanding | (227,555 | ) | (291,592 | ) | ||||
| Class C | ||||||||
| Shares sold | 6,134 | 34,861 | ||||||
| Dividends reinvested | – | 1,522 | ||||||
| Shares redeemed | (165,403 | ) | (122,615 | ) | ||||
| Net decrease in shares outstanding | (159,269 | ) | (86,232 | ) | ||||
| Class I | ||||||||
| Shares sold | 103,059 | 312,441 | ||||||
| Dividends reinvested | 2,890 | 17,964 | ||||||
| Shares redeemed | (401,464 | ) | (469,529 | ) | ||||
| Net decrease in shares outstanding | (295,515 | ) | (139,124 | ) | ||||
173 | October 31, 2017
Notes to Financial Statements
October 31, 2017
| RiverFront Conservative Income Builder Fund | ||||||||
| For the Year Ended October 31, 2017 | For the Year Ended October 31, 2016 | |||||||
| Class A | ||||||||
| Shares sold | 60,353 | 40,524 | ||||||
| Dividends reinvested | 731 | 1,467 | ||||||
| Shares redeemed | (58,800 | ) | (42,823 | ) | ||||
| Net increase/(decrease) in shares outstanding | 2,284 | (832 | ) | |||||
| Class C | ||||||||
| Shares sold | 110,766 | 457,023 | ||||||
| Dividends reinvested | 6,450 | 8,597 | ||||||
| Shares redeemed | (573,252 | ) | (189,391 | ) | ||||
| Net increase/(decrease) in shares outstanding | (456,036 | ) | 276,229 | |||||
| Class I | ||||||||
| Shares sold | 86,411 | 90,395 | ||||||
| Dividends reinvested | 2,763 | 3,804 | ||||||
| Shares redeemed | (56,358 | ) | (86,636 | ) | ||||
| Net increase in shares outstanding | 32,816 | 7,563 | ||||||
| RiverFront Dynamic Equity Income Fund | ||||||||
| For the Year Ended October 31, 2017 | For the Year Ended October 31, 2016 | |||||||
| Class A | ||||||||
| Shares sold | 157,001 | 561,317 | ||||||
| Dividends reinvested | 16,322 | 60,340 | ||||||
| Shares redeemed | (486,851 | ) | (552,664 | ) | ||||
| Net increase/(decrease) in shares outstanding | (313,528 | ) | 68,993 | |||||
| Class C | ||||||||
| Shares sold | 180,831 | 510,382 | ||||||
| Dividends reinvested | 17,535 | 88,886 | ||||||
| Shares redeemed | (977,253 | ) | (743,582 | ) | ||||
| Net decrease in shares outstanding | (778,887 | ) | (144,314 | ) | ||||
| Class I | ||||||||
| Shares sold | 596,156 | 998,443 | ||||||
| Dividends reinvested | 28,707 | 74,325 | ||||||
| Shares redeemed | (643,862 | ) | (544,834 | ) | ||||
| Net increase/(decrease) in shares outstanding | (18,999 | ) | 527,934 | |||||
174 | October 31, 2017
Notes to Financial Statements
October 31, 2017
| RiverFront Global Allocation Fund | ||||||||
| For the Year Ended October 31, 2017 | For the Year Ended October 31, 2016 | |||||||
| Class A | ||||||||
| Shares sold | 115,445 | 68,762 | ||||||
| Dividends reinvested | 7,192 | 9,681 | ||||||
| Shares redeemed | (138,100 | ) | (228,709 | ) | ||||
| Net decrease in shares outstanding | (15,463 | ) | (150,266 | ) | ||||
| Class C | ||||||||
| Shares sold | 64,487 | 173,583 | ||||||
| Dividends reinvested | 14,239 | 19,399 | ||||||
| Shares redeemed | (514,635 | ) | (355,357 | ) | ||||
| Net decrease in shares outstanding | (435,909 | ) | (162,375 | ) | ||||
| Class I | ||||||||
| Shares sold | 215,017 | 270,958 | ||||||
| Dividends reinvested | 17,053 | 24,795 | ||||||
| Shares redeemed | (360,729 | ) | (644,674 | ) | ||||
| Net decrease in shares outstanding | (128,659 | ) | (348,921 | ) | ||||
| RiverFront Global Growth Fund | ||||||||
| For the Year Ended October 31, 2017 | For the Year Ended October 31, 2016 | |||||||
| Class A | ||||||||
| Shares sold | 136,919 | 213,667 | ||||||
| Dividends reinvested | 9,084 | 31,179 | ||||||
| Shares redeemed | (307,093 | ) | (847,250 | ) | ||||
| Net decrease in shares outstanding | (161,090 | ) | (602,404 | ) | ||||
| Class C | ||||||||
| Shares sold | 86,083 | 145,830 | ||||||
| Dividends reinvested | 10,065 | 21,584 | ||||||
| Shares redeemed | (302,889 | ) | (243,333 | ) | ||||
| Net decrease in shares outstanding | (206,741 | ) | (75,919 | ) | ||||
| Class I | ||||||||
| Shares sold | 369,904 | 174,701 | ||||||
| Dividends reinvested | 9,170 | 26,491 | ||||||
| Shares redeemed | (277,778 | ) | (628,217 | ) | ||||
| Net increase/(decrease) in shares outstanding | 101,296 | (427,025 | ) | |||||
| Class L | ||||||||
| Shares sold | 210,187 | 193,055 | ||||||
| Dividends reinvested | 21,882 | 44,157 | ||||||
| Shares redeemed | (344,426 | ) | (446,291 | ) | ||||
| Net decrease in shares outstanding | (112,357 | ) | (209,079 | ) | ||||
| Investor Class | ||||||||
| Shares sold | 10,915 | 2,428 | ||||||
| Dividends reinvested | 3,773 | 10,345 | ||||||
| Shares redeemed | (147,896 | ) | (165,289 | ) | ||||
| Net decrease in shares outstanding | (133,208 | ) | (152,516 | ) | ||||
175 | October 31, 2017
Notes to Financial Statements
October 31, 2017
| RiverFront Moderate Growth & Income Fund | ||||||||
| For the Year Ended October 31, 2017 | For the Year Ended October 31, 2016 | |||||||
| Class A | ||||||||
| Shares sold | 126,709 | 408,231 | ||||||
| Dividends reinvested | 20,379 | 74,720 | ||||||
| Shares redeemed | (1,102,129 | ) | (587,432 | ) | ||||
| Net decrease in shares outstanding | (955,041 | ) | (104,481 | ) | ||||
| Class C | ||||||||
| Shares sold | 242,966 | 927,265 | ||||||
| Dividends reinvested | 36,880 | 189,021 | ||||||
| Shares redeemed | (1,835,084 | ) | (1,622,269 | ) | ||||
| Net decrease in shares outstanding | (1,555,238 | ) | (505,983 | ) | ||||
| Class I | ||||||||
| Shares sold | 707,650 | 1,559,584 | ||||||
| Dividends reinvested | 47,006 | 170,570 | ||||||
| Shares redeemed | (2,117,519 | ) | (1,930,466 | ) | ||||
| Net decrease in shares outstanding | (1,362,863 | ) | (200,312 | ) | ||||
7. AFFILIATED COMPANIES
Funds may invest in certain securities that are considered securities issued by affiliated companies. As defined by the Investment Company Act of 1940, an affiliated person, including an affiliated company, is one in which a Fund owns 5% or more of the outstanding voting securities, or a company which is under common ownership or control with the Fund. The purchases, sales, dividend income, realized gains or losses, change in unrealized gains or losses, shares and value of investments in affiliated companies for the year ended October 31, 2017 were as follows:
| Fund* | Share Balance November 1, 2016 | Purchases | Sales | Share Balance October, 31 2017 | Dividend Income | Change in Unrealized Gain/Loss | Realized Gain/Loss | Market Value October 31, 2017 | ||||||||||||||||||||||||
| RiverFront Conservative Income Builder Fund | 38,857 | 2,147 | 18,792 | 22,212 | $ | 30,350 | $ | (3,162 | ) | $ | 6,006 | $ | 563,074 | |||||||||||||||||||
| RiverFront Dynamic Equity Income Fund | 129,408 | 1,052 | 24,633 | 105,827 | $ | 127,210 | $ | 6,459 | $ | 15,160 | $ | 2,682,714 | ||||||||||||||||||||
| RiverFront Global Allocation Fund | 28,560 | 749 | 7,144 | 22,165 | $ | 27,421 | $ | (1,514 | ) | $ | 6,008 | $ | 561,883 | |||||||||||||||||||
| RiverFront Moderate Growth & Income Fund | 336,873 | – | 158,835 | 178,038 | $ | 284,536 | $ | 1,372 | $ | 35,789 | $ | 4,513,263 | ||||||||||||||||||||
| * | The Funds hold an affiliated investment in the Riverfront Strategic Income Fund. Refer to the Statement of Investments. |
176 | October 31, 2017
Notes to Financial Statements
October 31, 2017
8. MANAGEMENT AND RELATED-PARTY TRANSACTIONS
ALPS Advisors, Inc. (“AAI”), subject to the authority of the Board, is responsible for the overall management of the Funds listed below. AAI has delegated daily management of the Funds listed below to the corresponding Sub-Advisor(s) listed in the table below. Each Sub-Advisor manages the investments of the Fund in accordance with its investment objective, policies and limitations and investment guidelines established jointly by AAI and the Board.
| Fund | Sub-Advisor(s) |
| ALPS | CoreCommodity Management CompleteCommodities® Strategy Fund | CoreCommodity Management, LLC |
| ALPS | Kotak India Growth Fund | Kotak Mahindra (UK) Limited |
| ALPS | Metis Global Micro Cap Value Fund | Metis Global Partners, LLC |
| ALPS | Red Rocks Listed Private Equity Fund | Red Rocks Capital, LLC(a) |
| ALPS | WMC Research Value Fund | Wellington Management Company, LLP |
| Clough China Fund | Clough Capital Partners, LP |
| RiverFront Conservative Income Builder Fund | RiverFront Investment Group, LLC |
| RiverFront Dynamic Equity Income Fund | RiverFront Investment Group, LLC |
| RiverFront Global Allocation Fund | RiverFront Investment Group, LLC |
| RiverFront Global Growth Fund | RiverFront Investment Group, LLC |
| RiverFront Moderate Growth & Income Fund | RiverFront Investment Group, LLC |
| (a) | Red Rocks Capital LLC is a subsidiary of ALPS Advisors, Inc. |
Pursuant to the Investment Advisory Agreement (the “Advisory Agreement”), the Funds listed below pay AAI an annual management fee which is based on each Fund’s average daily net assets. The management fee is paid on a monthly basis. The following table reflects the Funds’ contractual management fee rates (expressed as an annual rate).
| Fund | Contractual Management Fee |
| ALPS | Alerian MLP Infrastructure Index Fund | 0.70% |
| ALPS | CoreCommodity Management CompleteCommodities® Strategy Fund | 0.85% |
| ALPS | Kotak India Growth Fund | 1.25% |
| ALPS | Metis Global Micro Cap Value Fund | 1.25% |
| ALPS | Red Rocks Listed Private Equity Fund | 0.85% |
| ALPS | WMC Research Value Fund | 0.95%(a) |
| Clough China Fund | 1.35% |
| RiverFront Conservative Income Builder Fund | 0.85% |
| RiverFront Dynamic Equity Income Fund | 0.85% |
| RiverFront Global Allocation Fund | 0.85% |
| RiverFront Global Growth Fund | 0.85% |
| RiverFront Moderate Growth & Income Fund | 0.85% |
| (a) | The contractual management fee is 0.95% for the first $250 million of net assets, 0.85% for the next $250 million of net assets, and 0.75% for net assets in excess of $500 million. |
177 | October 31, 2017
Notes to Financial Statements
October 31, 2017
Pursuant to an Investment Sub-advisory Agreement, AAI pays the Sub-Advisors of the Funds listed below an annual sub-advisory management fee which is based on each Fund’s average daily assets. AAI is required to pay all fees due to each Sub-Advisor out of the management fee AAI receives from each Fund listed below. The following table reflects the Funds’ contractual sub-advisory fee rates.
| Fund | Average Daily Net Assets of the Fund | Contractual Sub-Advisory Fee |
| ALPS | CoreCommodity Management CompleteCommodities® Strategy Fund | All Asset Levels | 0.75% |
| ALPS | Kotak India Growth Fund | First $50 Million | 1.15% |
| Over $50 Million | 1.05% | |
| ALPS | Metis Global Micro Cap Value Fund | All Asset Levels | 1.00% |
| ALPS | Red Rocks Listed Private Equity Fund | All Asset Levels | 0.57% |
| ALPS | WMC Research Value Fund | First $250 Million | 0.50% |
| $250 Million - $500 Million | 0.40% | |
| Over $500 Million | 0.30% | |
| Clough China Fund | All Asset Levels | 0.90% |
| RiverFront Conservative Income Builder Fund | All Asset Levels | 0.60% |
| RiverFront Dynamic Equity Income Fund | All Asset Levels | 0.60% |
| RiverFront Global Allocation Fund | All Asset Levels | 0.60% |
| RiverFront Global Growth Fund | All Asset Levels | 0.60% |
| RiverFront Moderate Growth & Income Fund | All Asset Levels | 0.60% |
Effective January 1, 2017, Wellington Management Company, LLP temporarily and voluntarily reduced the sub-advisory fee rate on the Fund’s daily net assets of $0 to $250 million by ten basis points. This reduction will remain in effect for 12 months unless terminated earlier by Wellington Management Company, LLP. The other tiers have remained unchanged.
ALPS | Alerian MLP Infrastructure Index Fund
AAI has contractually agreed to limit the amount of the Fund’s total annual expenses, exclusive of distribution and service (12b-1) fees, shareholder services fees, acquired fund fees and expenses, brokerage commissions, taxes and extraordinary expenses that exceed the following annual rates below.
ALPS | CoreCommodity Management CompleteCommodities® Strategy Fund
AAI and CoreCommodity Management LLC have contractually agreed to limit the amount of the Fund’s total annual expenses, exclusive of distribution and service (12b-1) fees, shareholder services fees, acquired fund fees and expenses, brokerage commissions, interest expense, taxes and extraordinary expenses that exceed the following annual rates below.
ALPS | Kotak India Growth Fund
Prior to April 1, 2017, AAI and Kotak Mahindra (UK) Limited have contractually agreed to limit the amount of the Fund’s total annual expenses, exclusive of distribution and service (12b-1) fees, shareholder services fees, acquired fund fees and expenses, brokerage expenses, interest expenses, taxes and extraordinary expenses that exceed the following annual rates below. Effective April 1, 2017, Kotak entered into a Novation Agreement with the Fund, AAI and Kotak Mahindra Asset Management (Singapore) Pte. Ltd. (“KMAMS”), another wholly owned subsidiary of Kotak Mahindra Bank Limited, whereby KMAMS will assume all of Kotak’s rights and obligations under the current Sub-Advisory Agreement.
ALPS | Metis Global Micro Cap Value Fund
AAI and Metis Global Partners, LLC have contractually agreed to limit the amount of the Fund’s total annual expenses, exclusive of distribution and service (12b-1) fees, shareholder services fees, acquired fund fees and expenses, brokerage expenses, interest expense, taxes and extraordinary expenses that exceed the following annual rates below.
178 | October 31, 2017
Notes to Financial Statements
October 31, 2017
ALPS | Red Rocks Listed Private Equity Fund
AAI and Red Rocks Capital LLC have contractually agreed to limit the amount of the Fund’s total annual expenses, exclusive of distribution and service (12b-1) fees, shareholder service fees, brokerage expenses, interest expense, taxes and extraordinary expenses that exceed the following annual rates below.
ALPS | WMC Research Value Fund
AAI has contractually agreed to limit the amount of the Fund’s total annual expenses, exclusive of distribution and service (12b-1) fees, shareholder service fees, acquired fund fees and expenses, brokerage expenses, interest expense, taxes and extraordinary expenses that exceed the following annual rates below.
Clough China Fund
AAI has contractually agreed to limit the amount of the Fund’s total annual expenses, exclusive of underlying fund fees and expenses, interest, taxes, brokerage costs and commissions, dividend and interest expense on short sales, litigation, indemnification and extraordinary expenses as determined under generally accepted accounting principles that exceed the following annual rates below.
RiverFront Funds
AAI and RiverFront Investment Group, LLC have contractually agreed to limit the amount of each Fund’s total annual expenses, exclusive of distribution and service (12b-1) fees, shareholder services fees, acquired fund fees and expenses, brokerage commissions, taxes and extraordinary expenses that exceed the following annual rates below.
These agreements are reevaluated on an annual basis. The current agreement runs through February 28, 2018. Fees waived or reimbursed for the Fiscal Year Ended October 31, 2017 are disclosed on the Statement of Operations or Consolidated Statement of Operations.
| Fund | Class A | Class C | Class I | Class Inv | Class L | Class R |
| ALPS | Alerian MLP Infrastructure Index Fund | 0.85% | 0.85% | 0.85% | N/A | N/A | N/A |
| ALPS | CoreCommodity Management CompleteCommodities® Strategy Fund | 1.05% | 1.05% | 1.15% | N/A | N/A | N/A |
| ALPS | Kotak India Growth Fund | 1.60% | 1.60% | 1.60% | N/A | N/A | N/A |
| ALPS | Metis Global Micro Cap Value Fund | 1.70% | 1.70% | 1.70% | N/A | N/A | N/A |
| ALPS | Red Rocks Listed Private Equity Fund | 1.25% | 1.25% | 1.25% | N/A | N/A | 1.25% |
| ALPS | WMC Research Value Fund | 0.90% | 0.90% | 0.90% | N/A | N/A | N/A |
| Clough China Fund | 1.95% | 2.70% | 1.70% | N/A | N/A | N/A |
| RiverFront Conservative Income Builder Fund | 0.90% | 0.90% | 0.90% | N/A | N/A | N/A |
| RiverFront Dynamic Equity Income Fund | 0.90% | 0.90% | 0.90% | N/A | N/A | N/A |
| RiverFront Global Allocation Fund | 0.90% | 0.90% | 0.90% | N/A | N/A | N/A |
| RiverFront Global Growth Fund | 0.90% | 0.90% | 0.90% | 0.90% | 0.90% | N/A |
| RiverFront Moderate Growth & Income Fund | 0.90% | 0.90% | 0.90% | N/A | N/A | N/A |
The Advisor(s) and each Sub-Advisor are permitted to recover expenses they have waived or reimbursed, on a class-by-class basis, through the agreements described above to the extent that expenses in later periods fall below the annual limits set forth in these agreements. Clough China Fund is not obligated to pay any such waived or reimbursed fees and expenses more than one year after the end of the fiscal year in which the fees or expenses were waived or reimbursed. The ALPS | Alerian MLP Infrastructure Index Fund, ALPS | CoreCommodity Management CompleteCommodities® Strategy Fund, ALPS | Kotak India Growth Fund, ALPS | Metis Global Micro Cap Value Fund, ALPS | Red Rocks Listed Private Equity Fund, ALPS | WMC Research Value Fund, RiverFront Conservative Income Builder Fund, RiverFront Global Growth Fund, RiverFront Dynamic Equity Income Fund, RiverFront Global Allocation Fund and RiverFront Moderate Growth & Income Fund are not obligated to pay any such
179 | October 31, 2017
Notes to Financial Statements
October 31, 2017
waived or reimbursed fees and expenses more than three years after the end of the fiscal year in which the fees or expenses were waived or reimbursed. As of the Fiscal Year Ended October 31, 2017, the Advisor and Sub-Advisor(s) may seek reimbursement of previously waived and reimbursed fees as follows:
| Fund | Expires 10/31/18 | Expires 10/31/19 | Expires 10/31/20 | Total | ||||||||||||
| ALPS | Alerian MLP Infrastructure Index Fund - Class A | $ | 74,027 | $ | 46,940 | $ | 44,452 | $ | 165,419 | ||||||||
| ALPS | Alerian MLP Infrastructure Index Fund - Class C | 48,448 | 39,470 | 32,605 | 120,523 | ||||||||||||
| ALPS | Alerian MLP Infrastructure Index Fund - Class I | 34,028 | 82,786 | 84,344 | 201,158 | ||||||||||||
| ALPS | CoreCommodity Management CompleteCommodities® Strategy Fund - Class A | 6,800 | N/A | N/A | 6,800 | ||||||||||||
| ALPS | CoreCommodity Management CompleteCommodities® Strategy Fund - Class C | 1,838 | N/A | N/A | 1,838 | ||||||||||||
| ALPS | CoreCommodity Management CompleteCommodities® Strategy Fund - Class I | 46,891 | N/A | N/A | 46,891 | ||||||||||||
| ALPS | Kotak India Growth Fund - Class A | 95,360 | 99,781 | 80,686 | 275,827 | ||||||||||||
| ALPS | Kotak India Growth Fund - Class C | 29,402 | 36,083 | 22,009 | 87,494 | ||||||||||||
| ALPS | Kotak India Growth Fund - Class I | 150,329 | 155,959 | 162,405 | 468,693 | ||||||||||||
| ALPS | Metis Global Micro Cap Value Fund - Class A | N/A | 3,182 | 24,598 | 27,780 | ||||||||||||
| ALPS | Metis Global Micro Cap Value Fund - Class C | N/A | 1,243 | 3,010 | 4,253 | ||||||||||||
| ALPS | Metis Global Micro Cap Value Fund - Class I | N/A | 172,314 | 174,029 | 346,343 | ||||||||||||
| ALPS | Red Rocks Listed Private Equity Fund - Class A | N/A | N/A | N/A | N/A | ||||||||||||
| ALPS | Red Rocks Listed Private Equity Fund - Class C | N/A | N/A | N/A | N/A | ||||||||||||
| ALPS | Red Rocks Listed Private Equity Fund - Class I | N/A | N/A | N/A | N/A | ||||||||||||
| ALPS | Red Rocks Listed Private Equity Fund - Class R | N/A | N/A | N/A | N/A | ||||||||||||
| ALPS | WMC Research Value Fund - Class A | 51,771 | 190,057 | 187,414 | 429,242 | ||||||||||||
| ALPS | WMC Research Value Fund - Class C | 1,084 | 2,075 | 2,406 | 5,565 | ||||||||||||
| ALPS | WMC Research Value Fund - Class I | 38,056 | 155,578 | 160,027 | 353,661 | ||||||||||||
| Clough China Fund - Class A | 17,364 | N/A | N/A | 17,364 | ||||||||||||
| Clough China Fund - Class C | 9,896 | N/A | N/A | 9,896 | ||||||||||||
| Clough China Fund - Class I | 39,485 | N/A | N/A | 39,485 | ||||||||||||
| RiverFront Conservative Income Builder Fund - Class A | 10,172 | 7,737 | 6,450 | 24,359 | ||||||||||||
| RiverFront Conservative Income Builder Fund - Class C | 44,843 | 74,216 | 73,998 | 193,057 | ||||||||||||
| RiverFront Conservative Income Builder Fund - Class I | 19,129 | 15,087 | 18,636 | 52,852 | ||||||||||||
| RiverFront Dynamic Equity Income Fund - Class A | 36,445 | 43,635 | 42,515 | 122,595 | ||||||||||||
| RiverFront Dynamic Equity Income Fund - Class C | 65,254 | 69,414 | 64,094 | 198,762 | ||||||||||||
| RiverFront Dynamic Equity Income Fund - Class I | 43,549 | 53,711 | 68,279 | 165,539 | ||||||||||||
| RiverFront Global Allocation Fund - Class A | 24,491 | 21,853 | 25,280 | 71,624 | ||||||||||||
| RiverFront Global Allocation Fund - Class C | 44,562 | 48,665 | 45,950 | 139,177 | ||||||||||||
| RiverFront Global Allocation Fund - Class I | 43,041 | 51,640 | 52,138 | 146,819 | ||||||||||||
| RiverFront Global Growth Fund - Class A | 40,534 | 37,416 | 28,197 | 106,147 | ||||||||||||
| RiverFront Global Growth Fund - Class C | 29,002 | 31,550 | 32,454 | 93,006 | ||||||||||||
| RiverFront Global Growth Fund - Class I | 36,381 | 32,793 | 37,405 | 106,579 | ||||||||||||
| RiverFront Global Growth Fund - Class L | 60,547 | 60,762 | 70,415 | 191,724 | ||||||||||||
| RiverFront Global Growth Fund - Investor Class | 17,309 | 14,660 | 11,385 | 43,354 | ||||||||||||
| RiverFront Moderate Growth & Income Fund- Class A | 39,744 | 37,280 | 34,261 | 111,285 | ||||||||||||
| RiverFront Moderate Growth & Income Fund- Class C | 102,129 | 107,193 | 105,924 | 315,246 | ||||||||||||
| RiverFront Moderate Growth & Income Fund - Class I | 67,898 | 73,653 | 78,157 | 219,708 | ||||||||||||
180 | October 31, 2017
Notes to Financial Statements
October 31, 2017
ALPS | CoreCommodity recovered $77,359 of reimbursed expense during the Fiscal Year Ended October 31, 2017.
ALPS Portfolio Solutions Distributor, Inc. (the “Distributor”) acts as the distributor of the Funds’ shares pursuant to a Distribution Agreement with the Trust. Shares are sold on a continuous basis by the Distributor, as agent for the Funds, and the Distributor has agreed to use its best efforts to solicit orders for the sale of Funds’ shares, although it is not obliged to sell any particular amount of shares. The Distributor is not entitled to any compensation for its services. The Distributor is registered as a broker -dealer with the Securities and Exchange Commission. The Funds’ Distributor is also the distributor of the Select Sector SPDR exchange traded funds (the “Underlying Sector ETFs”). As required by exemptive relief obtained by the Underlying Sector ETFs, the Advisor(s) will reimburse any applicable Fund an amount equal to the distribution fee received by the Distributor from the Underlying Sector ETFs attributable to such Fund’s investment in the Underlying Sector ETFs, for so long as the Distributor acts as distributor to such Fund and the Underlying Sector ETFs. There were no amounts reimbursed during the Funds’ Fiscal Year Ended October 31, 2017.
Payment from Affiliate: For the year ended October 31, 2017, Alps | CoreCommodity Management Complete Commodities Strategy Fund was reimbursed $56,374 from the Sub-Advisor as a result of a trading error.
Distribution and Services (12b-1) Plans
Each Fund has adopted Distribution and Services Plans (the “Plans”) pursuant to Rule 12b-1 of the 1940 Act for its Class A, Class C, Class R (ALPS | Red Rocks Listed Private Equity Fund only) and Investor Class (RiverFront Global Growth Fund only) shares. A description of the Distribution and Services Plan for the Class C shares of the ALPS | Metis Global Micro Cap Value Fund is provided below. The Plans allows a Fund to use Class A, Class C, Class R and Investor Class assets to pay fees in connection with the distribution and marketing of Class A, Class C, Class R and Investor Class shares and/or the provision of shareholder services to Class A, Class C, Class R and Investor Class shareholders. The Plans permit payment for services in connection with the administration of plans or programs that use Class A, Class C, Class R and Investor Class shares of a Fund, if any, as their funding medium and for related expenses. The Plans permit a Fund to make total payments at an annual rate of up to 0.25% of a Fund’s average daily net assets attributable to its Class A and Investor Class shares, 0.75% of a Fund’s average daily net assets attributable to its Class C shares and 0.50% of the ALPS | Red Rocks Listed Private Equity Fund’s average daily net assets attributable to its Class R shares.
Under the terms of the Plans, the Trust is authorized to make payments to the Distributor for remittance to financial intermediaries, as compensation for distribution and/or shareholder ongoing services performed by such entities for beneficial shareholders of the Fund. The Distributor is entitled to retain some or all fees payable under the Plans in certain circumstances, including when there is no broker of record or when certain qualification standards have not been met by the broker of record.
The ALPS | Metis Global Micro Cap Value Fund has adopted a Distribution and Services Plan (the “Metis Plan”) pursuant to Rule 12b-1 of the 1940 Act for its Class C shares. The Metis Plan permits the Fund to make total payments at an aggregate amount not to exceed 1.00% per annum of the average daily net assets of the Fund’s Class C Shares as follows: (a) an amount equal to the daily equivalent of 0.75% per annum of the net asset value of a Fund’s Class C Shares outstanding on each day, which shall accrue daily and is payable no more frequently than monthly in arrears, as a distribution and marketing fee (the “Distribution Fee”). The Distribution Fee may be used by the Distributor to compensate intermediaries for distribution and sales-related expenses or activities in respect of Class C shares of the Fund; and (b) an amount equal to the daily equivalent of 0.25% per annum of the net asset value of the Fund’s Class C shares outstanding on each day, which shall accrue daily and is payable no more frequently than monthly in arrears, as a service fee (the “Service Fee”). The Service Fee may be used by the Distributor to compensate intermediaries for service-related expenses or activities in respect of Class C shares of the Fund.
Under the terms of the Metis Plan, the Distribution Fee may be retained by the Distributor or used to compensate intermediaries for any activities or expenses primarily intended to finance, directly or indirectly, any activity which is anticipated to result in the sale of Class C shares issued by the Fund. The Service Fee may be used by the Distributor in part for the implementation of shareholder service arrangements or to compensate intermediaries for personal services rendered to Class C shareholders of the Fund and/or maintenance of Class C shareholder accounts (but will generally not be spent on record keeping charges, accounting expenses, transfer agent costs or custodian fees).
The expenses of the Plans and the Metis Plan are reflected as distribution and service fees on the Statement of Operations or Consolidated Statement of Operations. Because these fees are paid out of a Fund’s Class A, Class C, Class R and Investor Class assets, if any, on an ongoing basis, over time they will increase the cost of an investment in Class A, Class C, Class R and Investor Class shares, if any, and Plan fees may cost an investor more than other types of sales charges.
Shareholder Services Plans
Each Fund has adopted a shareholder services plan with respect to their Class A shares (the “Class A Shareholder Services Plan”). Under the Class A Shareholder Services Plan, the Funds are authorized to compensate certain financial intermediaries, including broker-dealers and Fund affiliates (“Participating Organizations”), an aggregate fee in an amount not to exceed on an annual basis 0.15% for Class A shares of the average daily net
181 | October 31, 2017
Notes to Financial Statements
October 31, 2017
asset value of Class A shares of the Funds attributable to or held in the name of a Participating Organization pursuant to an agreement with a such Participating Organizations (“Agreement”). Each Agreement will set forth the non-distribution related shareholder services to be performed by the Participating Organization for the benefit of a Fund’s shareholders who have elected to have such Participating Organization service their accounts. Any amount of such payment not paid to Participating Organizations during the Fund’s fiscal year for such service activities shall be reimbursed to the Fund as soon as practicable after the end of the fiscal year. Class A Shareholder Services Plan fees recaptured pursuant to the Services Plan for year ended October 31, 2017 are included as an offset to distribution and service fees as disclosed in the Statements of Operations.
Each Fund has adopted a shareholder services plan with respect to its Class C shares (the “Class C Shareholder Services Plan”). Under the Class C Shareholder Services Plan, the Funds are authorized to pay banks and their affiliates and other institutions, including broker-dealers and Fund affiliates (“Participating Organizations”), an aggregate fee in an amount not to exceed on an annual basis 0.25% for Class C shares of the average daily net asset value of the Class C shares attributable to or held in the name of a Participating Organization for its clients as compensation for providing shareholder service activities, which do not include distribution services, pursuant to an agreement with a Participating Organization. Any amount of such payment not paid to Participating Organizations during a Fund’s fiscal year for such service activities shall be reimbursed to the Fund as soon as practicable after the end of the fiscal year. Class C Shareholder Services Plan fees are included with distribution and service fees on the Statements of Operations.
Certain intermediaries may charge networking, omnibus account or other administrative fees with respect to transactions in shares of each Fund. Transactions may be processed through the National Securities Clearing Corporation or similar systems or processed on a manual basis. These fees generally are paid by the Fund to the Distributor, which uses such fees to reimburse intermediaries. In the event an intermediary receiving payments from the Distributor on behalf of the Fund converts from a networking structure to an omnibus account structure or otherwise experiences increased costs, fees borne by the Fund may increase. Networking fees are shown in the Statements of Operations, if applicable to the Fund.
ALPS Fund Services, Inc. (“ALPS”) serves as administrator to the Funds and the Funds have agreed to pay expenses incurred in connection with their administrative activities. Pursuant to an Administrative Agreement, ALPS provides operational services to the Funds including, but not limited to, fund accounting and fund administration and generally assists in the Funds’ operations. Officers of the Trust are employees of ALPS. The Funds’ administration fee is accrued on a daily basis and paid monthly. Administration fees paid by the Funds for the Fiscal Year Ended October 31, 2017 are disclosed in the Statement of Operations.
ALPS is reimbursed by the Funds for certain out-of-pocket expenses.
Trustees
The fees and expenses of the independent trustees of the Board are presented in the Statements of Operations
9. INDEMNIFICATIONS
Under the Trust’s organizational documents, its officers and Trustees are indemnified against certain liability arising out of the performance of their duties to the Trust. Additionally, in the normal course of business, the Trust enters into contracts with service providers that may contain general indemnification clauses which may permit indemnification to the extent permissible under applicable law. The Trust’s maximum exposure under these arrangements is unknown, as this would involve future claims that may be made against the Trust that have not yet occurred.
10. SUBSEQUENT EVENT
Effective December 1, 2017, the Funds removed the Class A Shares front-end sales load as well as the contingent deferred (back-end) sales load (“CDSC”). Please refer to the Prospectus Supplement dated November 1, 2017 for additional information.
Effective December 12, 2017, the Fund’s Adviser has contractually agreed to extend their fee waiver agreements through February 28, 2019 for ALPS | Alerian MLP Infrastructure Index Fund, ALPS | CoreCommodity Management CompleteCommodities® Strategy Fund, ALPS | Kotak India Growth Fund, ALPS | Metis Global Micro Cap Value Fund, ALPS | Red Rocks Listed Private Equity Fund, ALPS | WMC Research Value Fund and Clough China Fund.
On December 22, 2017, President Trump signed the Tax Cut and Jobs Act into law. Management is evaluating the impact this tax reform will have on the Funds, including any impact to the financial statements and accompanying notes to financial statements. As the law was enacted subsequent to the year ended October 31, 2017, the law will not impact the amounts recorded in these financial statements. It is expected that the new law will have an impact on the deferred tax position of ALPS | Alerian MLP Infrastructure Index Fund during the period immediately following enactment; however, management continues to believe that any revised amounts to deferred tax assets will be offset by a valuation allowance.
182 | October 31, 2017
Report of Independent Registered Public Accounting Firm
To the Shareholders and Board of Trustees of Financial Investors Trust:
We have audited the accompanying statements of assets and liabilities, including the statements of investments, of ALPS | Alerian MLP Infrastructure Index Fund, ALPS | Metis Global Micro Cap Value Fund (formerly known as ALPS | Metis Global Micro Cap Fund), ALPS | Red Rocks Listed Private Equity Fund, ALPS | WMC Research Value Fund, Clough China Fund, RiverFront Conservative Income Builder Fund, RiverFront Dynamic Equity Income Fund, RiverFront Global Allocation Fund, RiverFront Global Growth Fund, and RiverFront Moderate Growth & Income Fund, ten of the funds of Financial Investors Trust (the “Trust”), as of October 31, 2017, and the related statements of operations for the year then ended, the statements of changes in net assets for each of the two years in the period then ended (as to the ALPS | Metis Global Micro Cap Value Fund, for year then ended and for the period from December 24, 2015 (commencement date) to October 31, 2016), and the financial highlights for each of the periods presented. We have also audited the accompanying consolidated statements of assets and liabilities, including the consolidated statements of investments, of ALPS | Kotak India Growth Fund and ALPS | CoreCommodity Management CompleteCommodities® Strategy Fund, two of the funds of the Trust, as of October 31, 2017, and the related consolidated statements of operations for the year then ended, the consolidated statements of changes in net assets for each of the two years in the period then ended, and the consolidated financial highlights for each of the periods presented. These financial statements and financial highlights for these twelve funds are the responsibility of the Trust’s management. Our responsibility is to express an opinion on these financial statements and financial highlights based on our audits.
We conducted our audits in accordance with the standards of the Public Company Accounting Oversight Board (United States). Those standards require that we plan and perform the audit to obtain reasonable assurance about whether the financial statements and financial highlights are free of material misstatement. The Trust is not required to have, nor were we engaged to perform, an audit of its internal control over financial reporting. Our audits included consideration of internal control over financial reporting as a basis for designing audit procedures that are appropriate in the circumstances, but not for the purpose of expressing an opinion on the effectiveness of the Trust’s internal control over financial reporting. Accordingly, we express no such opinion. An audit also includes examining, on a test basis, evidence supporting the amounts and disclosures in the financial statements, assessing the accounting principles used and significant estimates made by management, as well as evaluating the overall financial statement presentation. Our procedures included confirmation of securities owned as of October 31, 2017, by correspondence with the custodian and brokers; when replies were not received from brokers, we performed other auditing procedures. We believe that our audits provide a reasonable basis for our opinion.
In our opinion, the financial statements and financial highlights referred to above present fairly, in all material respects, the financial position of each of the twelve funds constituting Financial Investors Trust as of October 31, 2017, the results of their operations for the year then ended, and the changes in their net assets and financial highlights for each of the periods presented, in conformity with accounting principles generally accepted in the United States of America.
DELOITTE & TOUCHE LLP
Denver, Colorado
December 27, 2017
183 | October 31, 2017
October 31, 2017 (Unaudited)
1. FUND HOLDINGS
The Funds file their complete schedule of portfolio holdings with the Securities and Exchange Commission (the “SEC”) for the first and third quarters of each fiscal year on Form N-Q within 60 days after the end of the period. Copies of the Funds’ Form N-Q are available without charge on the SEC website at http:// www.sec.gov. You may also review and copy the Form N-Q at the SEC’s Public Reference Room in Washington, D.C. For more information about the operation of the Public Reference Room, please call the SEC at 1-800-SEC-0330.
2. FUND PROXY VOTING POLICIES, PROCEDURES AND SUMMARIES
Fund policies and procedures used in determining how to vote proxies and information regarding how each of the Funds voted proxies relating to portfolio securities during the most recent prior 12-month period ending June 30 are available without charge, (1) upon request, by calling (toll-free) (866) 759-5679 and (2) on the SEC’s website at http://www.sec.gov.
3. TAX DESIGNATIONS
Of the distributions paid by the Funds from ordinary income for the calendar year ended December 31, 2016, the following percentages met the requirements to be treated as qualifying for qualified dividend income and the corporate dividends received deduction:
| QDI | DRD | |
| ALPS | CoreCommodity Management CompleteCommodities® Strategy Fund | 100% | 100% |
| ALPS | Kotak India Growth Fund | 0% | 0% |
| ALPS | Metis Global Micro Cap Fund | 19.43% | 2.83% |
| ALPS | Red Rocks Listed Private Equity Fund | 100% | 4.18% |
| ALPS | WMC Research Value Fund | 100% | 100% |
| Clough China Fund | 100% | 0% |
| RiverFront Conservative Income Builder Fund | 41.92% | 27.77% |
| RiverFront Dynamic Equity Income Fund | 100% | 53.56% |
| RiverFront Global Allocation Fund | 100% | 46.75% |
| RiverFront Global Growth Fund | 100% | 47.64% |
| RiverFront Moderate Growth & Income Fund | 64.66% | 40.71% |
In early 2017, if applicable, shareholders of record received this information for the distribution paid to them by the Funds during the calendar year 2016 via Form 1099. The Funds will notify shareholders in early 2018 of amounts paid to them by the Funds, if any, during the calendar year 2017.
Pursuant to Section 852(b)(3) of the Internal Revenue Code the Funds designate the following amounts as long-term capital gain dividends:
| ALPS | CoreCommodity Management CompleteCommodities® Strategy Fund | $ | – | ||
| ALPS | Kotak India Growth Fund | $ | 203,399 | ||
| ALPS | Metis Global Micro Cap Fund | $ | – | ||
| ALPS | Red Rocks Listed Private Equity Fund | $ | – | ||
| ALPS | WMC Research Value Fund | $ | 2,752,711 | ||
| Clough China Fund | $ | – | ||
| RiverFront Conservative Income Builder Fund | $ | – | ||
| RiverFront Dynamic Equity Income Fund | $ | – | ||
| RiverFront Global Allocation Fund | $ | – | ||
| RiverFront Global Growth Fund | $ | – | ||
| RiverFront Moderate Growth & Income Fund | $ | – |
Pursuant to Section 853(c) of the Internal Revenue Code, the following Funds designate the amounts listed below as foreign taxes paid and foreign source income during the current fiscal year:
| Foreign Taxes Paid | Foreign Source Income | |||||||
| ALPS | Metis Global Micro Cap Fund | $ | 75,295 | $ | 563,200 | ||||
| Clough China Fund | $ | 95,858 | $ | 1,194,602 | ||||
184 | October 31, 2017
Additional Information
October 31, 2017 (Unaudited)
4. DISCLOSURE REGARDING APPROVAL OF FUND ADVISORY AND SUB-ADVISORY AGREEMENTS
ALPS | Alerian MLP Infrastructure Index Fund
On June 6-7, 2017, the Trustees met in person to discuss, among other things, the approval of the investment advisory agreement between Financial Investors Trust (the “Trust”), with respect to the ALPS | Alerian MLP Infrastructure Index Fund (the “Alerian Fund”), and ALPS Advisors, Inc. (“ALPS Advisors”) (the “Investment Advisory Agreement”), in accordance with Section 15(c) of the 1940 Act. The Independent Trustees met with independent legal counsel during executive session and discussed the Investment Advisory Agreement and other related materials.
In renewing and approving the Investment Advisory Agreement, the Trustees, including the Independent Trustees, considered the following factors:
Investment Advisory Fee Rate: The Trustees reviewed and considered the contractual annual advisory fee to be paid by the Trust, on behalf of the Alerian Fund, to ALPS Advisors of 0.70% of the Alerian Fund’s daily average net assets, in light of the extent and quality of the advisory services provided by ALPS Advisors to the Alerian Fund. The Trustees also considered information regarding compensation to be paid to affiliates of ALPS Advisors under other agreements, such as the Fund Accounting and Administration Agreement with ALPS Fund Services, Inc.
The Board received and considered information including a comparison of the Alerian Fund’s contractual and actual management fees (after waivers) with those of funds in the relevant peer expense group and universe of funds provided by an independent provider of investment company data (the “Data Provider”). The Trustees noted that the contractual and actual management fee rates for each class of the Alerian Fund were below their respective Data Provider expense group average and median.
Total Expense Ratios: The Trustees further reviewed and considered the total expense ratios (after waivers) of 1.216%, 1.853% and 0.856% for the Class A, Class C and Class I shares, respectively, of the Alerian Fund. The Trustees noted that the total expense ratio (after waivers) of each class of the Alerian Fund was below its respective Data provider expense group average and median.
Nature, Extent and Quality of the Services under the Investment Advisory Agreement: The Trustees received and considered information regarding the nature, extent and quality of services to be provided to the Alerian Fund under the Investment Advisory Agreement. The Trustees reviewed certain background materials supplied by ALPS Advisors in its presentation, including its Form ADV.
The Trustees reviewed and considered ALPS Advisors’ investment advisory personnel, its history as an asset manager and its performance and the amount of assets currently under management by ALPS Advisors and its affiliated entities. The Trustees also reviewed the research and decision-making processes utilized by ALPS Advisors, including the methods adopted to seek to achieve compliance with the investment objectives, policies and restrictions of the Alerian Fund.
The Trustees considered the background and experience of ALPS Advisors’ management in connection with the Alerian Fund, including reviewing the qualifications, backgrounds and responsibilities of the management team primarily responsible for the day-to-day portfolio management of the Alerian Fund and the extent of the resources devoted to research and analysis of actual and potential investments.
The Trustees also reviewed, among other things, ALPS Advisors’ insider trading policies and procedures and its Code of Ethics.
Performance: The Trustees reviewed performance information for the Alerian Fund. That review included a comparison of the Alerian Fund’s performance to the net total return performance of a group of comparable funds selected by the Data Provider. The Trustees noted that the net total return performance of each class of the Alerian Fund lagged, but was within an acceptable range of, the respective Data Provider performance universe average for the one-year period ended March 31, 2017, above the respective Data Provider performance universe average for the two-year and three-year periods ended March 31, 2017, and generally the same as the respective Data Provider performance universe average for the four-year period ended March 31, 2017. The Trustees also considered ALPS Advisors’ performance and reputation generally and its investment techniques, risk management controls and decision-making processes.
Comparable Accounts: The Trustees noted certain information provided by ALPS Advisors regarding fees charged to its other clients utilizing a strategy similar to that employed by the Alerian Fund.
Profitability: The Trustees received and considered a retrospective and projected profitability analysis prepared by ALPS Advisors based on the fees payable under the Investment Advisory Agreement with ALPS Advisors with respect to the Alerian Fund. The Trustees considered the profits, if any, anticipated to be realized by ALPS Advisors in connection with the operation of the Alerian Fund. The Board then reviewed ALPS Advisors’ financial statements in order to analyze the financial condition and stability and profitability of ALPS Advisors.
185 | October 31, 2017
Additional Information
October 31, 2017 (Unaudited)
Economies of Scale: The Trustees considered whether economies of scale in the provision of services to the Alerian Fund will be passed along to the shareholders under the agreements.
Other Benefits to the Adviser: The Trustees reviewed and considered any other incidental benefits derived or to be derived by ALPS Advisors from its relationship with the Alerian Fund, including whether soft dollar arrangements were used.
In renewing ALPS Advisors as the Alerian Fund’s investment adviser and renewing the Investment Advisory Agreement and the fees charged under the Investment Advisory Agreement, the Trustees concluded that no single factor reviewed by the Trustees was identified by the Trustees to be determinative as the principal factor in whether to renew the Investment Advisory Agreement. Further, the Independent Trustees were advised by separate independent legal counsel throughout the process. The Trustees, including all of the Independent Trustees, concluded that:
| ● | the contractual and actual management fee rates (after waivers) for each class of the Alerian Fund were below their respective Data Provider expense group average and median; |
| ● | the total expense ratio (after waivers) of each class of the Alerian Fund was below its respective Data Provider expense group average and median; |
| ● | the nature, extent and quality of services rendered by ALPS Advisors under the Investment Advisory Agreement with respect to the Alerian Fund were adequate; |
| ● | the net total return performance of each class of the Alerian Fund lagged, but was within an acceptable range of, the respective Data Provider performance universe average for the one-year period ended March 31, 2017, above the respective Data Provider performance universe average for the two-year and three-year periods ended March 31, 2017, and generally the same as the respective Data Provider performance universe average for the four-year period ended March 31, 2017; |
| ● | bearing in mind the limitations of comparing different types of managed accounts and the different levels of service typically associated with such accounts, the fee structures applicable to ALPS Advisors’ other clients employing a comparable strategy to the Alerian Fund was not indicative of any unreasonableness with respect to the advisory fees proposed to be payable by the Alerian Fund; |
| ● | the profit, if any, realized or anticipated to be realized by ALPS Advisors in connection with the operation of the Alerian Fund is not unreasonable to the Alerian Fund; and |
| ● | there were no material economies of scale or other incidental benefits accruing to ALPS Advisors in connection with its relationship with the Alerian Fund. |
Based on the Trustees’ deliberations and their evaluation of the information described above, the Trustees, including all of the Independent Trustees, concluded that ALPS Advisors’ compensation for investment advisory services is consistent with the best interests of the Alerian Fund and its shareholders.
ALPS | Red Rocks Listed Private Equity Fund
On June 6-7, 2017, the Trustees met in person to discuss, among other things, the approval of the investment advisory agreement between the Trust, with respect to the ALPS | Red Rocks Listed Private Equity Fund (the “LPE Fund”), and ALPS Advisors, Inc. (“ALPS Advisors”) (the “Investment Advisory Agreement”), and the investment sub-advisory agreement among the Trust, Red Rocks Capital LLC (“Red Rocks”) and ALPS Advisors, with respect to the LPE Fund, in accordance with Section 15(c) of the 1940 Act. The Independent Trustees met with independent legal counsel during executive session and discussed the Investment Advisory Agreement and the Investment Sub-Advisory Agreement and other related materials.
In renewing and approving the Investment Advisory Agreement and the Investment Sub-Advisory Agreement, the Trustees, including the Independent Trustees, considered the following factors:
Investment Advisory and Sub-Advisory Fee Rate: The Trustees reviewed and considered the contractual annual advisory fee to be paid by the Trust, on behalf of the LPE Fund, to ALPS Advisors of 0.85% of the LPE Fund’s daily average net assets, in light of the extent and quality of the advisory services to be provided by ALPS Advisors to the LPE Fund. The Trustees also reviewed and considered the contractual annual sub-advisory fee to be paid by ALPS Advisors to Red Rocks of 2/3 of the contractual annual advisory fee paid by the Trust to ALPS Advisors, in light of the extent and quality of the advisory services provided by Red Rocks to the LPE Fund. The Trustees also considered information regarding compensation to be paid to affiliates of ALPS Advisors under other agreements, such as the Fund Accounting and Administration Agreement with ALPS Fund Services, Inc.
The Board received and considered information including a comparison of the LPE Fund’s contractual and actual management fees (after waivers) with those of funds in the relevant peer expense group and universe of funds provided by an independent provider of investment company data (the “Data Provider”). The Trustees noted that the contractual and actual management fee rates for each class of the LPE Fund were above their respective Data Provider expense group average and median.
186 | October 31, 2017
Additional Information
October 31, 2017 (Unaudited)
Total Expense Ratios: The Trustees further reviewed and considered the total expense ratios of 1.470%, 2.160%, 1.181% and 1.630% for the Class A, Class C, Class I, and Class R shares, respectively, of the LPE Fund. The Trustees noted that the total expense ratio (after waivers) of each class of the LPE Fund was above its respective Data Provider expense group average and median.
Nature, Extent and Quality of the Services under the Investment Advisory Agreement and the Investment Sub-Advisory Agreement: The Trustees received and considered information regarding the nature, extent and quality of services to be provided to the LPE Fund under the Investment Advisory and Sub-Advisory Agreements. The Trustees reviewed certain background materials supplied by ALPS Advisors and Red Rocks in their presentations, including their Forms ADV.
The Trustees reviewed and considered ALPS Advisors’ and Red Rocks’ investment advisory personnel, their history as asset managers and their performance and the amount of assets currently under management by ALPS Advisors and Red Rocks and their affiliated entities. The Trustees also reviewed the research and decision-making processes utilized by ALPS Advisors and Red Rocks, including the methods adopted to seek to achieve compliance with the investment objectives, policies and restrictions of the LPE Fund.
The Trustees considered the background and experience of ALPS Advisors’ and Red Rock’s management in connection with the LPE Fund, including reviewing the qualifications, backgrounds and responsibilities of the management team primarily responsible for the day-to-day portfolio management of the LPE Fund and the extent of the resources devoted to research and analysis of actual and potential investments.
The Trustees also reviewed, among other things, ALPS Advisors’ and Red Rocks’ insider trading policies and procedures and their Codes of Ethics.
Performance: The Trustees reviewed performance information for the LPE Fund. That review included a comparison of the LPE Fund’s performance to the performance of a group of comparable funds selected by the Data Provider. The Trustees noted the net total return performance of each class of the LPE Fund was below the respective Data Provider performance universe average for the one-year period ended March 31, 2017 and was generally above the respective Data Provider performance universe average for the two-year, three-year, four-year and five-year periods ended March 31, 2017. The Trustees also considered Red Rocks’ performance and reputation generally and its investment techniques, risk management controls and decision-making processes.
Comparable Accounts: The Trustees noted certain information provided by ALPS Advisors regarding fees charged to its other clients utilizing a strategy similar to that employed by the LPE Fund.
Profitability: The Trustees received and considered a retrospective and projected profitability analysis prepared by ALPS Advisors and Red Rocks based on the fees payable under the Investment Advisory Agreement with ALPS Advisors and the Sub-Advisory Agreement with Red Rocks, with respect to the LPE Fund. The Trustees considered the profits, if any, anticipated to be realized by ALPS Advisors and Red Rocks in connection with the operation of the LPE Fund. The Board then reviewed ALPS Advisors’ and Red Rocks’ financial statements in order to analyze the financial condition and stability and profitability of ALPS Advisors and Red Rocks.
Economies of Scale: The Trustees considered whether economies of scale in the provision of services to the LPE Fund will be passed along to the shareholders under the agreements.
Other Benefits to the Adviser: The Trustees reviewed and considered any other incidental benefits derived or to be derived by ALPS Advisors from its relationship with the LPE Fund, including whether soft dollar arrangements were used.
In renewing ALPS Advisors as the LPE Fund’s investment adviser and Red Rocks as the LPE Fund’s sub-adviser and the fees charged under the Investment Advisory and Sub-Advisory Agreements, the Trustees concluded that no single factor reviewed by the Trustees was identified by the Trustees to be determinative as the principal factor in whether to renew the Investment Advisory and Sub-Advisory Agreements. Further, the Independent Trustees were advised by separate independent legal counsel throughout the process. The Trustees, including all of the Independent Trustees, concluded that:
| ● | the contractual and actual management fee rate (after waivers) for each class of the LPE Fund was above its respective Data Provider expense group average and median; |
| ● | Red Rocks’ fees under its sub-advisory agreement are paid directly by ALPS Advisors; |
| ● | the total expense ratio (after waivers) of each class of the LPE Fund was above its respective Data Provider expense group average and median; |
| ● | the nature, extent and quality of services rendered by ALPS Advisors and Red Rocks under the Investment Advisory and Sub-Advisory Agreements, respectively, with respect to the LPE Fund were adequate; |
187 | October 31, 2017
Additional Information
October 31, 2017 (Unaudited)
| ● | the net total return performance of each class of the LPE Fund was below the respective Data Provider performance universe average for the one-year period ended March 31, 2017 and generally above the respective Data Provider performance universe average for the two-year, three-year, four-year and five-year periods ended March 31, 2017; |
| ● | bearing in mind the limitations of comparing different types of managed accounts and the different levels of service typically associated with such accounts, the fee structures applicable to ALPS Advisors’ and Red Rocks’ other clients employing a comparable strategy to the LPE Fund was not indicative of any unreasonableness with respect to the advisory and sub-advisory fees proposed to be payable by the LPE Fund; |
| ● | the profit, if any, realized or anticipated to be realized by ALPS Advisors and Red Rocks in connection with the operation of the LPE Fund is not unreasonable to the LPE Fund; and |
| ● | there were no material economies of scale or other incidental benefits accruing to ALPS Advisors and Red Rocks in connection with their relationship with the LPE Fund. |
Based on the Trustees’ deliberations and their evaluation of the information described above, the Trustees, including all of the Independent Trustees, concluded that ALPS Advisors’ and Red Rocks’ compensation for investment advisory and sub-advisory services is consistent with the best interests of the LPE Fund and its shareholders.
ALPS | WMC Research Value Fund
On June 6-7, 2017, the Trustees met in person to discuss, among other things, the approval of the investment advisory agreement between the Trust, with respect to the ALPS | WMC Research Value Fund (the “WMC Fund”), and ALPS Advisors, Inc. (“ALPS Advisors”) (the “Investment Advisory Agreement”), and the investment sub-advisory agreement among the Trust, ALPS Advisors, with respect to the WMC Fund, and Wellington Management Company, LLP (“Wellington”) (the “Investment Sub-Advisory Agreement”), in accordance with Section 15(c) of the 1940 Act. The Independent Trustees met with independent legal counsel during executive session and discussed the Investment Advisory Agreement and the Investment Sub-Advisory Agreement and other related materials.
In renewing and approving the Investment Advisory Agreement and the Investment Sub-Advisory Agreement, the Trustees, including the Independent Trustees, considered the following factors:
Investment Advisory and Sub-Advisory Fee Rate: The Trustees reviewed and considered the contractual annual advisory fee to be paid by the Trust, on behalf of the WMC Fund, to ALPS Advisors of (i) 0.95% of the WMC Fund’s daily average net assets of $0-$250M; (ii) 0.85% of the WMC Fund’s daily average net assets between $250M-$500M; and (iii) 0.75% of the WMC Fund’s daily average net assets over $500M in light of the extent and quality of the advisory services to be provided by ALPS Advisors to the WMC Fund. The Trustees also reviewed and considered the contractual annual sub-advisory fee to be paid by ALPS Advisors to Wellington of (i) 0.50% of the WMC Fund’s daily average net assets of $0-$250M; (ii) 0.40% of the WMC Fund’s daily average net assets between $250M-$500M; and (iii) 0.30% of the WMC Fund’s daily average net assets over $500M, in light of the extent and quality of the advisory services provided by Wellington to the WMC Fund. The Trustees also considered information regarding compensation to be paid to affiliates of ALPS Advisors under other agreements, such as the Fund Accounting and Administration Agreement with ALPS Fund Services, Inc.
The Board received and considered information including a comparison of the WMC Fund’s contractual and actual management fees (after waivers) with those of funds in the relevant peer expense group and universe of funds provided by an independent provider of investment company data (the “Data Provider”). The Trustees noted that the contractual and actual management fee rates (after waivers) for each class of the WMC Fund were above their respective Data Provider expense group average and median.
Total Expense Ratios: The Trustees further reviewed and considered the total expense ratios (after waivers) of 1.150%, 1.900% and 0.900% for the Class A, Class C, and Class I shares, respectively, of the WMC Fund. The Trustees noted that the total expense ratio (after waivers) for Class A shares of the WMC Fund was below its respective Data Provider expense group average and median, the total expense ratio (after waivers) for Class C shares of the WMC Fund was below its respective Data Provider expense group average and the same as its respective Data Provider expense group median, and the total expense ratio (after waivers) for Class I shares of the WMC Fund was above its respective Data Provider expense group average and median.
Nature, Extent and Quality of the Services under the Investment Advisory Agreement and Investment Sub-Advisory Agreement: The Trustees received and considered information regarding the nature, extent and quality of services to be provided to the WMC Fund under the Investment Advisory Agreement and the Investment Sub-Advisory Agreement. The Trustees reviewed certain background materials supplied by ALPS Advisors and Wellington in their presentations, including their Forms ADV.
The Trustees reviewed and considered ALPS Advisors’ and Wellington’s investment advisory personnel, their history as asset managers and their performance and the amount of assets currently under management by ALPS Advisors and Wellington and their affiliated entities. The Trustees
188 | October 31, 2017
Additional Information
October 31, 2017 (Unaudited)
also reviewed the research and decision-making processes utilized by ALPS Advisors and Wellington, including the methods adopted to seek to achieve compliance with the investment objectives, policies and restrictions of the WMC Fund.
The Trustees considered the background and experience of ALPS Advisors’ and Wellington’s management in connection with the WMC Fund, including reviewing the qualifications, backgrounds and responsibilities of the management team primarily responsible for the day-to-day portfolio management of the WMC Fund and the extent of the resources devoted to research and analysis of actual and potential investments.
The Trustees also reviewed, among other things, ALPS Advisors’ and Wellington’s insider trading policies and procedures and their Codes of Ethics.
Performance: The Trustees reviewed performance information for the WMC Fund. That review included a comparison of the WMC Fund’s performance to the performance of a group of comparable funds selected by the Data Provider. The Trustees noted the net total return performance of each class of the WMC Fund was generally above the respective Data Provider performance universe average for the one-year and five-year periods ended March 31, 2017 and generally below the respective Data Provider performance universe average for the two-year, three-year, and four-year periods ended March 31, 2017. The Trustees also considered Wellington’s performance and reputation generally and its investment techniques, risk management controls and decision-making processes.
Comparable Accounts: The Trustees noted certain information provided by Wellington regarding fees charged to its other clients utilizing a strategy similar to that employed by the WMC Fund.
Profitability: The Trustees received and considered a retrospective and projected profitability analysis prepared by ALPS Advisors and Wellington based on the fees payable under the Investment Advisory Agreement with ALPS Advisors and the Investment Sub-Advisory Agreement with Wellington, with respect to the WMC Fund. The Trustees considered the profits, if any, anticipated to be realized by ALPS Advisors and Wellington in connection with the operation of the WMC Fund. The Board then reviewed ALPS Advisors’ and Wellington’s financial statements in order to analyze the financial condition and stability and profitability of ALPS Advisors and Wellington.
Economies of Scale: The Trustees considered whether economies of scale in the provision of services to the WMC Fund will be passed along to the shareholders under the agreements.
Other Benefits to the Adviser: The Trustees reviewed and considered any other incidental benefits derived or to be derived by ALPS Advisors from its relationship with the WMC Fund, including whether soft dollar arrangements were used.
In renewing ALPS Advisors as the WMC Fund’s investment adviser and Wellington as the WMC Fund’s sub-adviser and the fees charged under the Investment Advisory and Sub-Advisory Agreements, the Trustees concluded that no single factor reviewed by the Trustees was identified by the Trustees to be determinative as the principal factor in whether to renew the Investment Advisory Agreement and the Investment Sub-Advisory Agreement. Further, the Independent Trustees were advised by separate independent legal counsel throughout the process. The Trustees, including all of the Independent Trustees, concluded that:
| ● | the contractual and actual management fee rate (after waivers) for each class of the WMC Fund was above its respective Data Provider expense group average and median; |
| ● | Wellington’s fees under its sub-advisory agreement are paid directly by ALPS Advisors; the total expense ratio (after waivers) for Class A shares of the WMC Fund was below its respective Data Provider expense group average and median, |
| ● | the total expense ratio (after waivers) for Class C shares of the WMC Fund was below its respective Data Provider expense group average and the same as its respective Data Provider expense group median, and the total expense ratio (after waivers) for Class I shares of the WMC Fund was above its respective Data Provider expense group average and median |
| ● | the nature, extent and quality of services rendered by ALPS Advisors and Wellington under the Investment Advisory and Sub-Advisory Agreements, respectively, with respect to the WMC Fund were adequate; |
| ● | the net total return performance of each class of the WMC Fund was generally above the respective Data Provider performance universe average for the one-year and five-year periods ended March 31, 2017 and generally below the respective Data Provider performance universe average for the two-year, three-year, and four-year periods ended March 31, 2017; |
| ● | bearing in mind the limitations of comparing different types of managed accounts and the different levels of service typically associated with such accounts, the fee structures applicable to ALPS Advisors’ and Wellington’s other clients employing a comparable strategy to the WMC Fund was not indicative of any unreasonableness with respect to the advisory and sub-advisory fees proposed to be payable by the WMC Fund; |
| ● | the profit, if any, realized or anticipated to be realized by ALPS Advisors and Wellington in connection with the operation of the WMC Fund is not unreasonable to the WMC Fund; and |
189 | October 31, 2017
Additional Information
October 31, 2017 (Unaudited)
| ● | there were no material economies of scale or other incidental benefits accruing to ALPS Advisors and Wellington in connection with their relationship with the WMC Fund. |
During the review process, the Trustees noted certain instances where clarification or follow-up was requested and others where the Trustees determined that further clarification or follow-up was not necessary. In those instances where clarification or follow-up was requested, the Board determined that in each case either information responsive to its requests had been provided, or where any response varied in part from the format requested, given the totality of the information provided, the Board had received sufficient information to proceed with its review.
Based on the Trustees’ deliberations and their evaluation of the information described above, the Trustees, including all of the Independent Trustees, concluded that ALPS Advisors’ and Wellington’s compensation for investment advisory and sub-advisory services is consistent with the best interests of the WMC Fund and its shareholders.
Clough China Fund
On June 6-7, 2017, the Trustees met in person to discuss, among other things, the approval of the investment advisory agreement between the Trust, with respect to the Clough China Fund (the “China Fund”), and ALPS Advisors, Inc. (“ALPS Advisors”) (the “Investment Advisory Agreement”), and the investment sub-advisory agreement among the Trust, ALPS Advisors and Clough Capital Partners LP (“Clough Capital”) with respect to the China Fund (the “Investment Sub-Advisory Agreement”), in accordance with Section 15(c) of the 1940 Act. The Independent Trustees met with independent legal counsel during executive session and discussed the Investment Advisory Agreement and the Investment Sub-Advisory Agreement and other related materials.
In renewing and approving the Investment Advisory Agreement and the Investment Sub-Advisory Agreement, the Trustees, including the Independent Trustees, considered the following factors:
Investment Advisory and Sub-Advisory Fee Rate: The Trustees reviewed and considered the contractual annual advisory fee paid by the Trust, on behalf of the China Fund, to ALPS Advisors of 1.35% of the China Fund’s daily average net assets, in light of the extent and quality of the advisory services provided by ALPS Advisors to the China Fund. The Trustees also reviewed and considered the contractual annual sub-advisory fee paid by ALPS Advisors to Clough Capital of 0.90% of the China Fund’s daily average net assets, in light of the extent and quality of the advisory services provided by Clough Capital to the China Fund. The Trustees also considered information regarding compensation to be paid to affiliates of ALPS Advisors under other agreements, such as the Fund Accounting and Administration Agreement with ALPS Fund Services, Inc.
The Board received and considered information including a comparison of the China Fund’s contractual and actual management fees (after waivers) with those of funds in the peer expense group and universe of funds provided by an independent provider of investment company data (the “Data Provider”). The Trustees noted that the contractual and actual management fee rate for each class of the China Fund was above its respective Data Provider expense group average and median.
Total Expense Ratios: The Trustees further reviewed and considered the total expense ratios (after waivers) of 1.954%, 2.703% and 1.702% for the Class A, Class C and Class I shares, respectively, of the China Fund. The Trustees noted that the total expense ratio (after waivers) of each class of the China Fund was above its respective Data Provider expense group average and median.
Nature, Extent and Quality of the Services under the Investment Advisory Agreement and the Investment Sub-Advisory Agreement: The Trustees received and considered information regarding the nature, extent and quality of services to be provided to the China Fund under the Investment Advisory Agreement and the Investment Sub-Advisory Agreement. The Trustees reviewed certain background materials supplied by ALPS Advisors and Clough Capital in their presentations, including their Forms ADV.
The Trustees reviewed and considered ALPS Advisors’ and Clough Capital’s investment advisory personnel, their history as asset managers and their performance and the amount of assets currently under management by ALPS Advisors and Clough Capital and their affiliated entities. The Trustees also reviewed the research and decision-making processes utilized by ALPS Advisors and Clough Capital, including the methods adopted to seek to achieve compliance with the investment objectives, policies and restrictions of the China Fund.
The Trustees considered the background and experience of ALPS Advisors’ and Clough Capital’s management in connection with the China Fund, including reviewing the qualifications, backgrounds and responsibilities of the management team primarily responsible for the day-to-day portfolio management of the China Fund and the extent of the resources devoted to research and analysis of actual and potential investments.
The Trustees also reviewed, among other things, ALPS Advisors’ and Clough Capital’s insider trading policies and procedures and their Codes of Ethics.
190 | October 31, 2017
Additional Information
October 31, 2017 (Unaudited)
Performance: The Trustees reviewed performance information for the China Fund. That review included a comparison of the China Fund’s performance to the performance of a group of comparable funds selected by the Data Provider. The Trustees noted the net total return performance of each class of the China Fund was below the respective Data Provider performance universe average for the one-year, two-year, three-year, four-year and five-year periods ended March 31, 2017 and generally above the respective Data Provider performance universe average for the 10-year period ended March 31, 2017. In considering the recent performance of the China Fund, the Trustees considered Clough Capital’s statements regarding its expectations for performance in the near term and regarding recent personnel changes at the firm. The Trustees also considered Clough Capital’s performance and reputation generally and its investment techniques, risk management controls and decision-making processes.
Comparable Accounts: The Trustees noted certain information provided by Clough Capital regarding fees charged to its other clients utilizing a strategy similar to that employed by the China Fund.
Profitability: The Trustees received and considered a retrospective and projected profitability analysis prepared by ALPS Advisors and Clough Capital based on the fees payable under the Investment Advisory Agreement with ALPS Advisors and the Investment Sub-Advisory Agreement with Clough Capital with respect to the China Fund. The Trustees considered the profits, if any, anticipated to be realized by ALPS Advisors and Clough Capital in connection with the operation of the China Fund. The Board then reviewed ALPS Advisors’ and Clough Capital’s financial statements in order to analyze the financial condition and stability and profitability of ALPS Advisors and Clough Capital.
Economies of Scale: The Trustees considered whether economies of scale in the provision of services to the China Fund will be passed along to the shareholders under the agreements.
Other Benefits to the Adviser: The Trustees reviewed and considered any other incidental benefits derived or to be derived by ALPS Advisors from its relationship with the China Fund, including whether soft dollar arrangements were used.
In renewing ALPS Advisors as the China Fund’s investment adviser and Clough Capital as the China Fund’s sub-adviser and the fees charged under the Investment Advisory Agreement and the Investment Sub-Advisory Agreement, the Trustees concluded that no single factor reviewed by the Trustees was identified by the Trustees to be determinative as the principal factor in whether to renew the Investment Advisory Agreement and the Investment Sub-Advisory Agreement. Further, the Independent Trustees were advised by separate independent legal counsel throughout the process. The Trustees, including all of the Independent Trustees, concluded that:
| ● | the contractual and actual management fee rate for each class of the China Fund was above its respective Data Provider expense group average and median; |
| ● | Clough Capital’s fees under its sub-advisory agreement are paid directly by ALPS Advisors; |
| ● | the total expense ratio (after waivers) of each class of the China Fund was above its respective Data Provider expense group average and median; |
| ● | the nature, extent and quality of services rendered by ALPS Advisors and Clough Capital under the Investment Advisory Agreement and the Investment Sub-Advisory Agreement, respectively, with respect to the China Fund were adequate; |
| ● | the net total return performance of each class of the China Fund was below the respective Data Provider performance universe average for the one-year, two-year, three-year, four-year and five-year periods ended March 31, 2017 and generally above the respective Data Provider performance universe average for the 10-year period ended March 31, 2017; |
| ● | bearing in mind the limitations of comparing different types of managed accounts and the different levels of service typically associated with such accounts, the fee structures applicable to ALPS Advisors’ and Clough Capital’s other clients employing a comparable strategy to the China Fund was not indicative of any unreasonableness with respect to the advisory and sub-advisory fees proposed to be payable by the China Fund; |
| ● | the profit, if any, realized or anticipated to be realized by ALPS Advisors and Clough Capital in connection with the operation of the China Fund is not unreasonable to the China Fund; and |
| ● | there were no material economies of scale or other incidental benefits accruing to ALPS Advisors and Clough Capital in connection with their relationship with the China Fund. |
Based on the Trustees’ deliberations and their evaluation of the information described above, the Trustees, including all of the Independent Trustees, concluded that ALPS Advisors’ and Clough Capital’s compensation for investment advisory and sub-advisory services is consistent with the best interests of the China Fund and its shareholders.
191 | October 31, 2017
Additional Information
October 31, 2017 (Unaudited)
ALPS | CoreCommodity Management CompleteCommodites® Strategy Fund
On June 6-7, 2017, the Trustees met in person to discuss, among other things, the approval of the investment advisory agreement between the Trust, with respect to the ALPS | CoreCommodity Management CompleteCommodites® Strategy Fund (the “CoreCommodity Fund”) and ALPS Advisors, Inc. (“ALPS Advisors”) (the “Investment Advisory Agreement”), and the investment sub-advisory agreement among the Trust, ALPS Advisors and CoreCommodity Management LLC (“CoreCommodity”) with respect to the CoreCommodity Fund (the “Investment Sub-Advisory Agreement”), in accordance with Section 15(c) of the 1940 Act. The Independent Trustees met with independent legal counsel during executive session and discussed the Investment Advisory Agreement and the Investment Sub-Advisory Agreement and other related materials.
In renewing and approving the Investment Advisory Agreement and the Investment Sub-Advisory Agreement, the Trustees, including the Independent Trustees, considered the following factors:
Investment Advisory and Sub-Advisory Fee Rate: The Trustees reviewed and considered the contractual annual advisory fee paid by the Trust, on behalf of the CoreCommodity Fund, to ALPS Advisors of 0.85% of the CoreCommodity Fund’s daily average net assets, in light of the extent and quality of the advisory services to be provided by ALPS Advisors to the CoreCommodity Fund. The Trustees also reviewed and considered the contractual annual sub-advisory fee paid by ALPS Advisors to CoreCommodity of 0.75% of the CoreCommodity Fund’s daily average net assets, in light of the extent and quality of the advisory services provided by CoreCommodity to the CoreCommodity Fund. The Trustees also considered information regarding compensation to be paid to affiliates of ALPS Advisors under other agreements, such as the Fund Accounting and Administration Agreement with ALPS Fund Services, Inc.
The Board received and considered information including a comparison of the CoreCommodity Fund’s contractual and actual management fees (after waivers) with those of funds in the relevant peer expense group and universe of funds provided by an independent provider of investment company data (the “Data Provider”). The Trustees noted that the contractual and actual management fee rate for each class of the CoreCommodity Fund was above its respective Data Provider expense group average and median.
Total Expense Ratios: The Trustees further reviewed and considered the total expense ratios (after waivers) of 1.410%, 2.052% and 1.154% for the Class A, Class C and Class I shares, respectively, of the CoreCommodity Fund. The Trustees noted that the total expense ratio (after waivers) of each class of the CoreCommodity Fund was slightly above, but within an acceptable range of, its respective Data Provider average expense group total expense ratio (after waivers) and that the total expense ratio (after waivers) of each class of the CoreCommodity Fund was above its respective Data Provider expense group average and below its respective Data Provider expense group median, except for Class C.
Nature, Extent and Quality of the Services under the Investment Advisory Agreement and the Investment Sub-Advisory Agreement: The Trustees received and considered information regarding the nature, extent and quality of services to be provided to the CoreCommodity Fund under the Investment Advisory Agreement and the Investment Sub-Advisory Agreement. The Trustees reviewed certain background materials supplied by ALPS Advisors and CoreCommodity in their presentations, including their Forms ADV.
The Trustees reviewed and considered ALPS Advisors’ and CoreCommodity’s investment advisory personnel, their history as asset managers and their performance and the amount of assets currently under management by ALPS Advisors and CoreCommodity and their affiliated entities. The Trustees also reviewed the research and decision-making processes utilized by ALPS Advisors and CoreCommodity, including the methods adopted to seek to achieve compliance with the investment objectives, policies and restrictions of the CoreCommodity Fund.
The Trustees considered the background and experience of ALPS Advisors’ and CoreCommodity’s management in connection with the CoreCommodity Fund, including reviewing the qualifications, backgrounds and responsibilities of the management team primarily responsible for the day-to-day portfolio management of the CoreCommodity Fund and the extent of the resources devoted to research and analysis of actual and potential investments.
The Trustees also reviewed, among other things, ALPS Advisors’ and CoreCommodity’s insider trading policies and procedures and their Codes of Ethics.
Performance: The Trustees reviewed performance information for the CoreCommodity Fund. That review included a comparison of the CoreCommodity Fund’s performance to the performance of a group of comparable funds selected by the Data Provider. The Trustees noted the net total return performance of each class of the CoreCommodity Fund was above the respective Data Provider performance universe average for the one-year, two-year, three-year, four-year and five-year periods ended March 31, 2017. The Trustees also considered CoreCommodity’s performance and reputation generally and its investment techniques, risk management controls and decision-making processes.
192 | October 31, 2017
Additional Information
October 31, 2017 (Unaudited)
Comparable Accounts: The Trustees noted certain information provided by CoreCommodity regarding fees charged to its other clients utilizing a strategy similar to that employed by the CoreCommodity Fund.
Profitability: The Trustees received and considered a retrospective and projected profitability analysis prepared by ALPS Advisors and CoreCommodity based on the fees payable under the Investment Advisory Agreement with ALPS Advisors and the Investment Sub-Advisory Agreement with CoreCommodity with respect to the CoreCommodity FundThe Trustees considered the profits, if any, anticipated to be realized by ALPS Advisors and CoreCommodity in connection with the operation of the CoreCommodity Fund. The Board then reviewed ALPS Advisors’ and CoreCommodity’s financial statements in order to analyze the financial condition and stability and profitability of ALPS Advisors and CoreCommodity.
Economies of Scale: The Trustees considered whether economies of scale in the provision of services to the CoreCommodity Fund will be passed along to the shareholders under the agreements.
Other Benefits to the Adviser: The Trustees reviewed and considered any other incidental benefits derived or to be derived by ALPS Advisors from its relationship with the CoreCommodity Fund, including whether soft dollar arrangements were used.
In renewing ALPS Advisors as the CoreCommodity Fund’s investment adviser and CoreCommodity as the CoreCommodity Fund’s sub-adviser and the fees charged under the Investment Advisory Agreement and the Investment Sub-Advisory Agreement, the Trustees concluded that no single factor reviewed by the Trustees was identified by the Trustees to be determinative as the principal factor in whether to renew the Investment Advisory Agreement and the Investment Sub-Advisory Agreement. Further, the Independent Trustees were advised by separate independent legal counsel throughout the process. The Trustees, including all of the Independent Trustees, concluded that:
| ● | the contractual and actual management fee rate (after waivers) for each class of the CoreCommodity Fund was above its respective Data Provider expense group average and median; |
| ● | CoreCommodity’s fees under its sub-advisory agreement are paid directly by ALPS Advisors; the total expense ratio (after waivers) of each class of the CoreCommodity Fund was slightly above, but within an acceptable range of, its respective Data Provider average expense group total expense ratio (after waivers) and that |
| ● | the total expense ratio (after waivers) of each class of the CoreCommodity Fund was above its respective Data Provider expense group average and below its respective Data Provider expense group median, except for Class C; |
| ● | the nature, extent and quality of services rendered by ALPS Advisors and CoreCommodity under the Investment Advisory Agreement and the Investment Sub-Advisory Agreement, respectively, with respect to the CoreCommodity Fund were adequate; |
| ● | the net total return performance of each class of the CoreCommodity Fund was above the respective Data Provider performance universe average the one-year, two-year, three-year, four-year and five-year periods ended March 31, 2017; |
| ● | bearing in mind the limitations of comparing different types of managed accounts and the different levels of service typically associated with such accounts, the fee structures applicable to ALPS Advisors’ and CoreCommodity’s other clients employing a comparable strategy to the CoreCommodity Fund was not indicative of any unreasonableness with respect to the advisory and sub-advisory fees proposed to be payable by the CoreCommodity Fund; |
| ● | the profit, if any, realized or anticipated to be realized by ALPS Advisors and CoreCommodity in connection with the operation of the CoreCommodity Fund is not unreasonable to the CoreCommodity Fund; and |
| ● | there were no material economies of scale or other incidental benefits accruing to ALPS Advisors and CoreCommodity in connection with their relationship with the CoreCommodity Fund. |
Based on the Trustees’ deliberations and their evaluation of the information described above, the Trustees, including all of the Independent Trustees, concluded that ALPS Advisors’ and CoreCommodity’s compensation for investment advisory and sub-advisory services is consistent with the best interests of the CoreCommodity Fund and its shareholders.
RiverFront Global Allocation Series
On June 6-7, 2017, the Trustees met in person to discuss, among other things, the approval of the investment advisory agreement between the Trust, with respect to the RiverFront Conservative Income Builder Fund, the RiverFront Dynamic Equity Income Fund, the RiverFront Global Allocation Fund, the RiverFront Global Growth Fund, and the RiverFront Moderate Growth Fund (collectively, the “RiverFront Funds”), and ALPS Advisors, Inc. (“ALPS Advisors”) (the “Investment Advisory Agreement”), and the investment sub-advisory agreement among the Trust, ALPS Advisors and RiverFront Investment Group, LLC (“RiverFront”) with respect to the RiverFront Funds (the “Investment Sub-Advisory Agreement”), in accordance with Section 15(c) of the 1940 Act. The Independent Trustees met with independent legal counsel during executive session and discussed the Investment Advisory Agreement and the Investment Sub-Advisory Agreement and other related materials.
193 | October 31, 2017
Additional Information
October 31, 2017 (Unaudited)
In renewing and approving the Investment Advisory Agreement and the Investment Sub-Advisory Agreement, the Trustees, including the Independent Trustees, considered the following factors:
Investment Advisory and Sub-Advisory Fee Rate: The Trustees reviewed and considered the contractual annual advisory fee to be paid by the Trust, on behalf of the RiverFront Funds, to ALPS Advisors of 0.85% of each RiverFront Fund’s daily average net assets, in light of the extent and quality of the advisory services provided by ALPS Advisors to the RiverFront Funds. The Trustees also reviewed and considered the contractual annual sub-advisory fee to be paid by ALPS Advisors to RiverFront of 0.60% of each of the RiverFront Fund’s daily average net assets, in light of the extent and quality of the advisory services provided by RiverFront to the RiverFront Funds. The Trustees also considered information regarding compensation to be paid to affiliates of ALPS Advisors under other agreements, such as the Fund Accounting and Administration Agreement with ALPS Fund Services, Inc.
The Board received and considered information including a comparison of the RiverFront Funds’ contractual and actual management fees (after waivers) with those of funds in the peer expense group and universe of funds provided by an independent provider of investment company data (the “Data Provider”). The Trustees noted that the contractual management fee rate for each class of shares of each RiverFront Fund was above the Data Provider expense group average and median and the actual management fee rate (after waivers) for each class of shares of each RiverFront Fund was generally above the Data Provider expense group average and median.
Total Expense Ratios: The Trustees further reviewed and considered the total expense ratios (after waivers) of 1.150%, 1.900%, 0.900%, 1.150% and 0.900% for the Class A, Class C, Class I, Investors Class and Class L shares, respectively, of the RiverFront Funds. The Trustees noted that the total expense ratio (after waivers) of each class of each of the RiverFront Funds were below its respective Data Provider expense group average and median.
Nature, Extent and Quality of the Services under the Investment Advisory Agreement and the Investment Sub-Advisory Agreement: The Trustees received and considered information regarding the nature, extent and quality of services to be provided to the RiverFront Funds under the Investment Advisory Agreement and the Investment Sub-Advisory Agreement. The Trustees reviewed certain background materials supplied by ALPS Advisors and RiverFront in their presentations, including their Forms ADV.
The Trustees reviewed and considered ALPS Advisors’ and RiverFront’s investment advisory personnel, their history as asset managers and their performance and the amount of assets currently under management by ALPS Advisors and RiverFront and their affiliated entities. The Trustees also reviewed the research and decision-making processes utilized by ALPS Advisors and RiverFront, including the methods adopted to seek to achieve compliance with the investment objectives, policies and restrictions of the RiverFront Funds.
The Trustees considered the background and experience of ALPS Advisors’ and RiverFront’s management in connection with the RiverFront Funds, including reviewing the qualifications, backgrounds and responsibilities of the management team primarily responsible for the day-to-day portfolio management of the RiverFront Funds and the extent of the resources devoted to research and analysis of actual and potential investments.
The Trustees also reviewed, among other things, ALPS Advisors’ and RiverFront’s insider trading policies and procedures and their Codes of Ethics.
Performance: The Trustees reviewed performance information for the RiverFront Funds for the one-year, two-year, three-year, four-year and five-year periods, as applicable, ended March 31, 2017. That review included a comparison of the RiverFront Funds’ performance to the performance of a group of comparable funds selected by the Data Provider. The Trustees noted the net total return performance of each class of each of the RiverFront Funds, except the RiverFront Moderate Growth & Income Fund and RiverFront Conservative Income Builder Fund, was generally below its respective performance universe average. The Trustees also considered RiverFront’s performance and reputation generally and its investment techniques, risk management controls and decision-making processes.
Comparable Accounts: The Trustees noted certain information provided by RiverFront regarding fees charged to its other clients utilizing a strategy similar to that employed by the RiverFront Funds.
Profitability: The Trustees received and considered a retrospective and projected profitability analysis prepared by ALPS Advisors and RiverFront based on the fees payable under the Investment Advisory Agreement with ALPS Advisors and the Investment Sub-Advisory Agreement with RiverFront with respect to the RiverFront Funds. The Trustees considered the profits, if any, anticipated to be realized by ALPS Advisors and RiverFront in connection with the operation of each RiverFront Fund. The Board then reviewed ALPS Advisors’ and RiverFront’s financial statements in order to analyze the financial condition and stability and profitability of ALPS Advisors and RiverFront.
194 | October 31, 2017
Additional Information
October 31, 2017 (Unaudited)
Economies of Scale: The Trustees considered whether economies of scale in the provision of services to the RiverFront Funds will be passed along to the shareholders under the agreements.
Other Benefits to the Adviser: The Trustees reviewed and considered any other incidental benefits derived or to be derived by ALPS Advisors from its relationship with the RiverFront Funds, including whether soft dollar arrangements were used.
In renewing ALPS Advisors as the RiverFront Funds’ investment adviser and RiverFront as the RiverFront Funds’ sub-adviser and the fees charged under the Investment Advisory Agreement and the Investment Sub-Advisory Agreement, the Trustees concluded that no single factor reviewed by the Trustees was identified by the Trustees to be determinative as the principal factor in whether to renew the Investment Advisory Agreement and the Investment Sub-Advisory Agreement. Further, the Independent Trustees were advised by separate independent legal counsel throughout the process. The Trustees, including all of the Independent Trustees, concluded that:
| ● | the contractual management fee rate for each class of shares of each RiverFront Fund was above the Data Provider expense group average and median and the actual management fee rate (after waivers) for each class of shares of each RiverFront Fund was generally above the Data Provider expense group average and median; |
| ● | RiverFront’s fees under its sub-advisory agreements are paid directly by ALPS Advisors; |
| ● | the total expense ratio (after waivers) of each class of each RiverFront Fund was below its respective Data Provider expense group average and median; |
| ● | the nature, extent and quality of services rendered by ALPS Advisors and RiverFront under the Investment Advisory Agreement and the Investment Sub-Advisory Agreement, respectively, with respect to the RiverFront Funds, as applicable, were adequate; |
| ● | the net total return performance of each class of each of the RiverFront Funds, except the RiverFront Moderate Growth & Income Fund and the RiverFront Conservative Income Builder Fund, was generally below its respective performance universe average; |
| ● | bearing in mind the limitations of comparing different types of managed accounts and the different levels of service typically associated with such accounts, the fee structures applicable to ALPS Advisors’ and RiverFront’s other clients employing a comparable strategy to one or more of the RiverFront Funds were not indicative of any unreasonableness with respect to the advisory and sub-advisory fees proposed to be payable by the RiverFront Funds; |
| ● | the profit, if any, realized or anticipated to be realized by ALPS Advisors and RiverFront in connection with the operation of the RiverFront Funds, as applicable, is not unreasonable to the RiverFront Funds; and |
| ● | there were no material economies of scale or other incidental benefits accruing to ALPS Advisors and RiverFront in connection with their relationship with the RiverFront Funds. |
Based on the Trustees’ deliberations and their evaluation of the information described above, the Trustees, including all of the Independent Trustees, concluded that ALPS Advisors’ and RiverFront’s compensation for investment advisory and sub-advisory services is consistent with the best interests of the RiverFront Funds and their shareholders.
ALPS | Kotak India Growth Fund
On June 6-7, 2017, the Trustees met in person to discuss, among other things, the approval of the investment advisory agreement between the Trust, with respect to the ALPS | Kotak India Growth Fund (the “India Fund”), and ALPS Advisors, Inc. (“ALPS Advisors”) (the “Investment Advisory Agreement”), and the investment sub-advisory agreement among the Trust, ALPS Advisors and Kotak Mahindra Asset Management (Singapore) Pte. Ltd. (“Kotak”) (the “Investment Sub-Advisory Agreement”) with respect to the India Fund, in accordance with Section 15(c) of the 1940 Act. The Independent Trustees met with independent legal counsel during executive session and discussed the Investment Advisory Agreement and the Investment Sub-Advisory Agreement and other related materials.
In renewing and approving the Investment Advisory Agreement and the Investment Sub-Advisory Agreement, the Trustees, including the Independent Trustees, considered the following factors:
Investment Advisory and Sub-Advisory Fee Rate: The Trustees reviewed and considered the contractual annual advisory fee to be paid by the Trust, on behalf of the India Fund, to ALPS Advisors of 1.25% of the India Fund’s daily average net assets, in light of the extent and quality of the advisory services provided by ALPS Advisors to the India Fund. The Trustees also reviewed and considered the contractual annual sub-advisory fee rates to be paid by ALPS Advisors to Kotak of 1.15% of the India Fund’s daily average net assets on the first $50 million and 1.05% based on the India Fund’s daily average net assets over $50 million, in light of the extent and quality of the advisory services provided by Kotak to the India Fund. The Trustees also considered information regarding compensation to be paid to affiliates of ALPS Advisors under other agreements, such as the Fund Accounting and Administration Agreement with ALPS Fund Services, Inc.
195 | October 31, 2017
Additional Information
October 31, 2017 (Unaudited)
The Board received and considered information including a comparison of the India Fund’s contractual and actual management fees (after waivers) with those of funds in the peer expense group and universe of funds provided by an independent provider of investment company data (the “Data Provider”). The Trustees noted that the contractual management fee rate for each class of the India Fund was above its respective Data Provider expense group average and median and the actual management fee rate (after waivers) for each class of the India Fund was below its respective Data Provider expense group average and median.
Total Expense Ratios: The Trustees further reviewed and considered the total expense ratios (after waivers) of 1.900%, 2.601% and 1.597% for the Class A, Class C and Class I shares, respectively, of the India Fund. The Trustees noted that the total expense ratio (after waivers) of each class of the India Fund was above its respective Data Provider expense group average and median.
Nature, Extent and Quality of the Services under the Investment Advisory Agreement and the Investment Sub-Advisory Agreement: The Trustees received and considered information regarding the nature, extent and quality of services to be provided to the India Fund under the Investment Advisory Agreement and the Investment Sub-Advisory Agreement. The Trustees reviewed certain background materials supplied by ALPS Advisors and Kotak in their presentations, including their Forms ADV.
The Trustees reviewed and considered ALPS Advisors’ and Kotak’s investment advisory personnel, their history as asset managers and their performance and the amount of assets currently under management by ALPS Advisors and Kotak and their affiliated entities. The Trustees also reviewed the research and decision-making processes utilized by ALPS Advisors and Kotak, including the methods adopted to seek to achieve compliance with the investment objectives, policies and restrictions of the India Fund.
The Trustees considered the background and experience of ALPS Advisors’ and Kotak’s management in connection with the India Fund, including reviewing the qualifications, backgrounds and responsibilities of the management team primarily responsible for the day-to-day portfolio management of the India Fund and the extent of the resources devoted to research and analysis of actual and potential investments.
The Trustees also reviewed, among other things, ALPS Advisors’ and Kotak’s insider trading policies and procedures and their Codes of Ethics.
Performance: The Trustees reviewed performance information for the India Fund. That review included a comparison of the India Fund’s performance to the performance of a group of comparable funds selected by the Data Provider. The Trustees noted the net total return performance of each class of the India Fund was above the respective Data Provider performance universe average for the one-year, two-year, three-year, four-year and five-year periods ended March 31, 2017. The Trustees also considered Kotak’s performance and reputation generally and its investment techniques, risk management controls and decision-making processes.
Comparable Accounts: The Trustees noted certain information provided by Kotak regarding fees charged to its other clients utilizing a strategy similar to that employed by the India Fund.
Profitability: The Trustees received and considered a retrospective and projected profitability analysis prepared by ALPS Advisors and Kotak based on the fees payable under the Investment Advisory Agreement with ALPS Advisors and the Investment Sub-Advisory Agreement with Kotak, with respect to the India Fund. The Trustees considered the profits, if any, anticipated to be realized by ALPS Advisors and Kotak in connection with the operation of the India Fund. The Board then reviewed ALPS Advisors’ and Kotak’s financial statements in order to analyze the financial condition and stability and profitability of ALPS Advisors and Kotak.
Economies of Scale: The Trustees considered whether economies of scale in the provision of services to the India Fund will be passed along to the shareholders under the agreements.
Other Benefits to the Adviser: The Trustees reviewed and considered any other incidental benefits derived or to be derived by ALPS Advisors from its relationship with the India Fund, including whether soft dollar arrangements were used.
In renewing ALPS Advisors as the India Fund’s investment adviser and Kotak as the India Fund’s sub-adviser and the fees charged under the Investment Advisory Agreement and the Investment Sub-Advisory Agreement, the Trustees concluded that no single factor reviewed by the Trustees was identified by the Trustees to be determinative as the principal factor in whether to renew the Investment Advisory Agreement and the Investment Sub-Advisory Agreement. Further, the Independent Trustees were advised by separate independent legal counsel throughout the process. The Trustees, including all of the Independent Trustees, concluded that:
196 | October 31, 2017
Additional Information
October 31, 2017 (Unaudited)
| ● | the contractual management fee rate for each class of the India Fund was above its respective Data Provider expense group average and median and the actual management fee rate (after waivers) for each class of the India Fund was below its respective Data Provider expense group average and median; |
| ● | Kotak’s fees under its sub-advisory agreement are paid directly by ALPS Advisors; |
| ● | the total expense ratio (after waivers) of each class of the India Fund was above its respective Data Provider expense group average and median; |
| ● | the nature, extent and quality of services rendered by ALPS Advisors and Kotak under the Investment Advisory Agreement and the Investment Sub-Advisory Agreement, respectively, with respect to the India Fund were adequate; |
| ● | the net total return performance of each class of the India Fund was above the respective Data Provider performance universe average for the one-year, two-year, three-year, four-year and five-year periods ended March 31, 2017; |
| ● | bearing in mind the limitations of comparing different types of managed accounts and the different levels of service typically associated with such accounts, the fee structures applicable to ALPS Advisors’ and Kotak’s other clients employing a comparable strategy to the India Fund was not indicative of any unreasonableness with respect to the advisory and sub-advisory fees proposed to be payable by the India Fund; |
| ● | the profit, if any, realized or anticipated to be realized by ALPS Advisors and Kotak in connection with the operation of the India Fund is not unreasonable to the India Fund; and |
| ● | there were no material economies of scale or other incidental benefits accruing to ALPS Advisors and Kotak in connection with their relationship with the India Fund. |
Based on the Trustees’ deliberations and their evaluation of the information described above, the Trustees, including all of the Independent Trustees, concluded that ALPS Advisors’ and Kotak’s compensation for investment advisory and sub-advisory services is consistent with the best interests of the India Fund and its shareholders.
ALPS | Metis Global Micro Cap Value Fund
On June 6-7, 2017, the Trustees met in person to discuss, among other things, the approval of the investment advisory agreement between the Trust, with respect to the ALPS | Metis Global Micro Cap Value Fund (the “Metis Fund”), and ALPS Advisors, Inc. (“ALPS Advisors”) (the “Investment Advisory Agreement”), and the investment sub-advisory agreement among the Trust, ALPS Advisors and Metis Global Partners (“Metis”) (the “Investment Sub-Advisory Agreement”) with respect to the Metis Fund, in accordance with Section 15(c) of the 1940 Act. The Independent Trustees met with independent legal counsel during executive session and discussed the Investment Advisory Agreement and the Investment Sub-Advisory Agreement and other related materials.
In renewing and approving the Investment Advisory Agreement and the Investment Sub-Advisory Agreement, the Trustees, including the Independent Trustees, considered the following factors:
Investment Advisory and Sub-Advisory Fee Rate: The Trustees reviewed and considered the contractual annual advisory fee to be paid by the Trust, on behalf of the Metis Fund, to ALPS Advisors of 1.25% of the Metis Fund’s daily average net assets, in light of the extent and quality of the advisory services provided by ALPS Advisors to the Metis Fund. The Trustees also reviewed and considered the contractual annual sub-advisory fee rates to be paid by ALPS Advisors to Metis of 1.00% of the Metis Fund’s daily average net assets, in light of the extent and quality of the advisory services provided by Metis to the Metis Fund. The Trustees also considered information regarding compensation to be paid to affiliates of ALPS Advisors under other agreements, such as the Fund Accounting and Administration Agreement with ALPS Fund Services, Inc.
The Board received and considered information including a comparison of the Metis Fund’s contractual and actual management fees (after waivers) with those of funds in the peer expense group and universe of funds provided by an independent provider of investment company data (the “Data Provider”). The Trustees noted that the contractual management fee rate for each class of the Metis Fund was above its respective Data Provider expense group average and median and the actual management fee rate (after waivers) of each class of the Metis Fund was below its respective Data Provider expense group average and median.
Total Expense Ratios: The Trustees further reviewed and considered the total expense ratios (after waivers) of 2.100%, 2.700% and 1.700% for Class A, Class C and Class I, respectively, for the Metis Fund. The Trustees noted that the total expense ratio (after waivers) of each class of the Metis Fund was above its respective Data Provider expense group average and median.
Nature, Extent and Quality of the Services under the Investment Advisory Agreement and the Investment Sub-Advisory Agreement: The Trustees received and considered information regarding the nature, extent and quality of services to be provided to the Metis Fund under the Investment Advisory Agreement and the Investment Sub-Advisory Agreement. The Trustees reviewed certain background materials supplied by ALPS Advisors and Metis in their presentations, including their Forms ADV.
197 | October 31, 2017
Additional Information
October 31, 2017 (Unaudited)
The Trustees reviewed and considered ALPS Advisors’ and Metis’ investment advisory personnel, their history as asset managers and their performance and the amount of assets currently under management by ALPS Advisors and Metis and their affiliated entities. The Trustees also reviewed the research and decision-making processes utilized by ALPS Advisors and Metis, including the methods adopted to seek to achieve compliance with the investment objectives, policies and restrictions of the Metis Fund.
The Trustees considered the background and experience of ALPS Advisors’ and Metis’ management in connection with the Metis Fund, including reviewing the qualifications, backgrounds and responsibilities of the management team primarily responsible for the day-to-day portfolio management of the Metis Fund and the extent of the resources devoted to research and analysis of actual and potential investments.
The Trustees also reviewed, among other things, ALPS Advisors’ and Metis’ insider trading policies and procedures and their Codes of Ethics.
Performance: The Trustees reviewed performance information for the Metis Fund. That review included a comparison of the Metis Fund’s performance to the performance of a group of comparable funds selected by the Data Provider. The Trustees noted the net total return performance of each class of the Metis Fund was above the respective Data Provider performance universe average for the one-year period ended March 31, 2017. The Trustees also considered Metis’ performance and reputation generally and its investment techniques, risk management controls and decision-making processes.
Comparable Accounts: The Trustees noted certain information provided by Metis regarding fees charged to its other clients utilizing a strategy similar to that employed by the Metis Fund.
Profitability: The Trustees received and considered a retrospective and projected profitability analysis prepared by ALPS Advisors and Metis based on the fees payable under the Investment Advisory Agreement with ALPS Advisors and the Investment Sub-Advisory Agreement with Metis, with respect to the Metis Fund. The Trustees considered the profits, if any, anticipated to be realized by ALPS Advisors and Metis in connection with the operation of the Metis Fund. The Board then reviewed ALPS Advisors’ and Metis’ financial statements in order to analyze the financial condition and stability and profitability of ALPS Advisors and Metis.
Economies of Scale: The Trustees considered whether economies of scale in the provision of services to the Metis Fund will be passed along to the shareholders under the agreements.
Other Benefits to the Adviser: The Trustees reviewed and considered any other incidental benefits derived or to be derived by ALPS Advisors from its relationship with the Metis Fund, including whether soft dollar arrangements were used.
In renewing ALPS Advisors as the Metis Fund’s investment adviser and Metis as the Metis Fund’s sub-adviser and the fees charged under the Investment Advisory Agreement and the Investment Sub-Advisory Agreement, the Trustees concluded that no single factor reviewed by the Trustees was identified by the Trustees to be determinative as the principal factor in whether to renew the Investment Advisory Agreement and the Investment Sub-Advisory Agreement. Further, the Independent Trustees were advised by separate independent legal counsel throughout the process. The Trustees, including all of the Independent Trustees, concluded that:
| ● | the contractual management fee rate for each class of the Metis Fund was above its respective Data Provider expense group average and median and the actual management fee rate (after waivers) of each class of the Metis Fund was below its respective Data Provider expense group average and median; |
| ● | Metis’ fees under its sub-advisory agreement are paid directly by ALPS Advisors; |
| ● | total expense ratio (after waivers) of each class of the Metis Fund was above its respective Data Provider expense group average and median; |
| ● | the nature, extent and quality of services rendered by ALPS Advisors and Metis under the Investment Advisory and Sub-Advisory Agreements, respectively, with respect to the Metis Fund were adequate; |
| ● | the net total return performance of each class of the Metis Fund was above the respective Data Provider performance universe average for the one-year period ended March 31, 2017; |
| ● | bearing in mind the limitations of comparing different types of managed accounts and the different levels of service typically associated with such accounts, the fee structures applicable to ALPS Advisors’ and Metis’ other clients employing a comparable strategy to the Metis Fund was not indicative of any unreasonableness with respect to the advisory and sub-advisory fees proposed to be payable by the Metis Fund; |
| ● | the profit, if any, realized or anticipated to be realized by ALPS Advisors and Metis in connection with the operation of the Metis Fund is not unreasonable to the Metis Fund; and |
198 | October 31, 2017
Additional Information
October 31, 2017 (Unaudited)
| ● | there were no material economies of scale or other incidental benefits accruing to ALPS Advisors and Metis in connection with their relationship with the Metis Fund. |
Based on the Trustees’ deliberations and their evaluation of the information described above, the Trustees, including all of the Independent Trustees, concluded that ALPS Advisors’ and Metis’ compensation for investment advisory and sub-advisory services is consistent with the best interests of the Metis Fund and its shareholders.
199 | October 31, 2017
Trustees and Officers
October 31, 2017 (Unaudited)
Additional information regarding the Funds’ trustees is included in the Statement of Additional Information, which can be obtained without charge by calling (toll-free) (866) 759-5679.
INDEPENDENT TRUSTEES
| Name, Address* & Year of Birth | Position(s) Held with Fund | Term of Office** and Length of Time Served | Principal Occupation(s) During Past 5 Years*** | Number of Funds in Fund Complex Overseen by Trustee**** | Other Directorships Held by Trustee During Past 5 Years*** | |||||
| Mary K. Anstine, 1940 | Trustee and Chairman | Ms. Anstine was elected at a special meeting of shareholders held on March 21, 1997 and re-elected at a special meeting of shareholders held on August 7, 2009. Ms. Anstine was appointed Chairman of the Board at the June 6, 2017 meeting of the Board of Trustees. | Ms. Anstine was formerly an Executive Vice President of First Interstate Bank of Denver until 1994, President/Chief Executive Officer of HealthONE Alliance, Denver, Colorado, from 1994 to 2004, and has been retired since 2004. Ms. Anstine is also Trustee/Director of AV Hunter Trust and Colorado Uplift Board. Ms. Anstine was formerly a Director of the Trust Bank of Colorado (later purchased and now known as Northern Trust Bank), HealthONE and Denver Area Council of the Boy Scouts of America, and a member of the American Bankers Association Trust Executive Committee. | 62 | Ms. Anstine is a Trustee of ALPS ETF Trust (19 funds); ALPS Variable Investment Trust (10 funds); Reaves Utility Income Fund (1 fund); and Westcore Trust (14 funds). | |||||
| Jeremy W. Deems, 1976 | Trustee | Mr. Deems was appointed as a Trustee at the March 11, 2008 meeting of the Board of Trustees and elected at a special meeting of shareholders held on August 7, 2009. | Mr. Deems is the Co-Founder, Chief Operations Officer and Chief Financial Officer of Green Alpha Advisors, LLC, a registered investment advisor, and Co-Portfolio Manager of the Shelton Green Alpha Fund. Prior to joining Green Alpha Advisors, Mr. Deems was CFO and Treasurer of Forward Management, LLC, ReFlow Management Co., LLC, ReFlow Fund, LLC, a private investment fund, and Sutton Place Management, LLC, an administrative services company, from 1998 to June 2007. From 2004 to 2005, Mr Deems also served as Treasurer of the Forward Funds and the Sierra Club Funds. | 63 | Mr. Deems is a Trustee of ALPS ETF Trust (19 funds); ALPS Variable Investment Trust (10 funds); Clough Funds Trust (1 fund); Elevation ETF Trust (1 fund); and Reaves Utility Income Fund (1 fund). |
| * | All communications to Trustees and Officers may be directed to Financial Investors Trust c/o 1290 Broadway, Suite 1100, Denver, CO 80203. |
| ** | This is the period for which the Trustee or Officer began serving the Trust. Each Trustee serves an indefinite term, until such Trustees successor is elected and appointed, or such Trustee resigns or is deceased. Officers are elected on an annual basis. |
| *** | Except as otherwise indicated, each individual has held the office shown or other offices in the same company for the last five years. |
| **** | The Fund Complex includes all series of the Trust (currently 33) and any other investment companies for which any Trustee serves as Trustee for and which ALPS Advisors, Red Rocks, Wellington Management, Clough Capital, RiverFront, Kotak, or Metis provides investment advisory services (currently 46 funds, 1 fund, 0 funds, 4 funds, 10 funds, 0 funds, and 0 funds, respectively). |
200 | October 31, 2017
Trustees and Officers
October 31, 2017 (Unaudited)
INDEPENDENT TRUSTEES (continued)
| Name, Address* & Year of Birth | Position(s) Held with Fund | Term of Office** and Length of Time Served | Principal Occupation(s) During Past 5 Years*** | Number of Funds in Fund Complex Overseen by Trustee**** | Other Directorships Held by Trustee During Past 5 Years*** | |||||
| Jerry G. Rutledge, 1944 | Trustee | Mr. Rutledge was elected at a special meeting of shareholders held on August 7, 2009. | Mr. Rutledge is the President and owner of Rutledge’s Inc., a retail clothing business. Mr. Rutledge is currently Director of the American National Bank. He was from 1994 to 2007 a Regent of the University of Colorado. | 34 | Mr. Rutledge is a Trustee of Principal Real Estate Income Fund (1 fund) Clough Global Dividend and Income Fund (1 fund), Clough Global Equity Fund (1 fund) and Clough Global Opportunities Fund (1 fund). | |||||
| Michael “Ross” Shell, 1970 | Trustee | Mr. Shell was elected at a special meeting of shareholders held on August 7, 2009. | Mr. Shell is Founder and CEO of Red Idea, LLC, a strategic consulting/early stage venture firm (since June 2008). From 1999 to 2009, he was a part-owner and Director of Tesser, Inc., a brand agency. From December 2005 to May 2008, he was Director, Marketing and Investor Relations, of Woodbourne, a REIT/real estate hedge fund and private equity firm. Prior to this, from May 2004 to November 2005, he worked as a business strategy consultant; from June 2003 to April 2004, he was on the Global Client Services team of IDEO, a product design/innovation firm; and from 1999 to 2003, he was President of Tesser, Inc. Mr. Shell graduated with honors from Stanford University with a degree in Political Science. | 33 | None. |
| * | All communications to Trustees and Officers may be directed to Financial Investors Trust c/o 1290 Broadway, Suite 1100, Denver, CO 80203. |
| ** | This is the period for which the Trustee or Officer began serving the Trust. Each Trustee serves an indefinite term, until such Trustees successor is elected and appointed, or such Trustee resigns or is deceased. Officers are elected on an annual basis. |
| *** | Except as otherwise indicated, each individual has held the office shown or other offices in the same company for the last five years. |
| **** | The Fund Complex includes all series of the Trust (currently 33) and any other investment companies for which any Trustee serves as Trustee for and which ALPS Advisors, Red Rocks, Wellington Management, Clough Capital, RiverFront, Kotak, or Metis provides investment advisory services (currently 46 funds, 1 fund, 0 funds, 4 funds, 10 funds, 0 funds, and 0 funds, respectively). |
201 | October 31, 2017
Trustees and Officers
October 31, 2017 (Unaudited)
INTERESTED TRUSTEE
| Name, Address* & Year of Birth | Position(s) Held with Fund | Term of Office** and Length of Time Served | Principal Occupation(s) During Past 5 Years*** | Number of Funds in Fund Complex Overseen by Trustee**** | Other Directorships Held by Trustee During Past 5 Years*** | |||||
| Edmund J. Burke, 1961 | Trustee and President | Mr. Burke was elected as Trustee at a special meeting of shareholders held on August 7, 2009. Mr. Burke was elected President of the Trust at the December 17, 2002 meeting of the Board of Trustees. | Mr. Burke is President and a Director of ALPS Holdings, Inc. (“AHI”) (since 2005) and Director of Boston Financial Data Services, Inc. (“BFDS”), ALPS Advisors, Inc. (“AAI”), ALPS Distributors, Inc. (“ADI”), ALPS Fund Services, Inc. (“AFS”) and ALPS Portfolio Solutions Distributor, Inc. (“APSD”) and from 2001-2008, was President of AAI, ADI, AFS and APSD. Because of his positions with AHI, BFDS, AAI, ADI, AFS and APSD, Mr. Burke is deemed an affiliate of the Trust as defined under the 1940 Act. Mr. Burke is Trustee and President of the Clough Global Allocation Fund (Trustee since 2006; President since 2004); Trustee and President of the Clough Global Equity Fund (Trustee since 2006; President since 2005); Trustee and President of the Clough Global Opportunities Fund (since 2006); Trustee of the Liberty All-Star Equity Fund; and Director of the Liberty All- Star Growth Fund, Inc. | 35 | Mr. Burke is a Trustee of Clough Global Dividend and Income Fund (1 fund); Clough Global Equity Fund (1 fund); Clough Global Opportunities Fund (1 fund); Clough Funds Trust (1 fund); Liberty All-Star Equity Fund (1 fund); and Director of the Liberty All-Star Growth Fund, Inc. (1 fund). |
| * | All communications to Trustees and Officers may be directed to Financial Investors Trust c/o 1290 Broadway, Suite 1100, Denver, CO 80203. |
| ** | This is the period for which the Trustee or Officer began serving the Trust. Each Trustee serves an indefinite term, until such Trustees successor is elected and appointed, or such Trustee resigns or is deceased. Officers are elected on an annual basis. |
| *** | Except as otherwise indicated, each individual has held the office shown or other offices in the same company for the last five years. |
| **** | The Fund Complex includes all series of the Trust (currently 33) and any other investment companies for which any Trustee serves as Trustee for and which ALPS Advisors, Red Rocks, Wellington Management, Clough Capital, RiverFront, Kotak, or Metis provides investment advisory services (currently 46 funds, 1 fund, 0 funds, 4 funds, 10 funds, 0 funds, and 0 funds, respectively). |
202 | October 31, 2017
Trustees and Officers
October 31, 2017 (Unaudited)
OFFICERS
| Name, Address* & Year of Birth | Position(s) Held with Fund | Term of Office** and Length of Time Served | Principal Occupation(s) During Past 5 Years*** | |||
| Kimberly R. Storms, 1972 | Treasurer | Ms. Storms was elected Treasurer of the Trust at the March 12, 2013 meeting of the Board of Trustees. | Ms. Storms is Senior Vice President - Director of Fund Administration of ALPS. Because of her position with ALPS, Ms. Storms is deemed an affiliate of the Trust as defined under the 1940 Act. Ms. Storms is also Treasurer of Liberty All-Star Equity Fund, Liberty All-Star Growth Fund, Inc., ALPS Series Trust and Elevation ETF Trust. Ms. Storms also serves as a Board member and Treasurer of The Center for Trauma & Resilience, a nonprofit agency. | |||
| Karen S. Gilomen, 1970 | Secretary | Ms. Gilomen was elected Secretary of the Trust at the December 13, 2016 meeting of the Board of Trustees. | Ms. Gilomen joined ALPS in August 2016 as Vice President and Senior Counsel. Prior to joining ALPS, Ms. Gilomen was Vice President - General Counsel & CCO of Monticello Associates, Inc. from 2010 to 2016. Because of her position with ALPS, Ms. Gilomen is deemed an affiliate of the Trust, as defined under the 1940 Act. Ms. Gilomen is also the Secretary of Reaves Utility Income Fund, and the Assistant Secretary of the WesMark Funds, and Clerk of the Goehring & Rozencwajg Investments Funds. | |||
| Ted Uhl, 1974 | Chief Compliance Officer (“CCO”) | Mr. Uhl was appointed CCO of the Trust at the June 8, 2010 meeting of the Board of Trustees. | Mr. Uhl joined ALPS in October 2006, and is currently Deputy Compliance Officer of ALPS. Prior to his current role, Mr. Uhl served as Senior Risk Manager for ALPS from October 2006 until June 2010. Before joining ALPS, Mr. Uhl served a Sr. Analyst with Enenbach and Associates (RIA), and a Sr. Financial Analyst at Sprint. Because of his position with ALPS, Mr. Uhl is deemed an affiliate of the Trust as defined under the 1940 Act. Mr. Uhl is also CCO of the Boulder Growth & Income Fund, Inc., Centre Funds, Elevation ETF Trust, Index Funds, Reality Shares ETF Trust and Reaves Utility Income Fund. | |||
| Jennell Panella, 1974 | Assistant Treasurer | Ms. Panella was elected Assistant Treasurer of the Trust at the September 15, 2015 meeting of the Board of Trustees. | Ms. Panella joined ALPS in June 2012 and is currently Fund Controller of ALPS Fund Services, Inc. Prior to joining ALPS, Ms. Panella served as Financial Reporting Manager for Parker Global Strategies, LLC (2009-2012). Because of her position with ALPS, Ms. Panella is deemed an affiliate of the Trust as defined under the 1940 Act. Ms. Panella also serves as Assistant Treasurer of James Advantage Funds. |
| * | All communications to Trustees and Officers may be directed to Financial Investors Trust c/o 1290 Broadway, Suite 1100, Denver, CO 80203. |
| ** | This is the period for which the Trustee or Officer began serving the Trust. Each Trustee serves an indefinite term, until such Trustees successor is elected and appointed, or such Trustee resigns or is deceased. Officers are elected on an annual basis. |
| *** | Except as otherwise indicated, each individual has held the office shown or other offices in the same company for the last five years. |
203 | October 31, 2017
Trustees and Officers
October 31, 2017 (Unaudited)
OFFICERS (continued)
| Name, Address* & Year of Birth | Position(s) Held with Fund | Term of Office** and Length of Time Served | Principal Occupation(s) During Past 5 Years*** | |||
| Alan Gattis, 1980 | Assistant Treasurer | Mr. Gattis was elected Assistant Treasurer of the Trust at the September 13, 2016 meeting of the Board of Trustees. | Mr. Gattis joined ALPS in 2011 and is currently Vice President and Fund Controller of ALPS. Prior to joining ALPS, Mr. Gattis was an Auditor at Spicer Jeffries LLP (2009 through 2011) and an Auditor at PricewaterhouseCoopers LLP (2004 - 2009). Because of his position with ALPS, Mr. Gattis is deemed an affiliate of the Trust as defined under the 1940 Act. Mr. Gattis is also Assistant Treasurer of ALPS Series Trust and Elevation ETF Trust. | |||
| Sharon Akselrod, 1974 | Assistant Secretary | Ms. Akselrod was elected Assistant Secretary of the Trust at the September 15, 2015 meeting of the Board of Trustees. | Ms. Akselrod joined ALPS in August 2014 and is currently Senior Investment Company Act Paralegal of ALPS Fund Services, Inc. Prior to joining ALPS, Ms. Akselrod served as Corporate Governance and Regulatory Associate for Nordstrom fsb (2013- 2014) and Senior Legal Assistant – Legal Manager for AXA Equitable Life Insurance Company (2008-2013). Because of her position with ALPS, Ms. Akselrod is deemed an affiliate of the Trust as defined under the 1940 Act. Ms. Akselrod is also Assistant Secretary of ALPS ETF Trust. | |||
| Jennifer Craig, 1973 | Assistant Secretary | Ms. Craig was elected Assistant Secretary of the Trust at the June 8, 2016 meeting of the Board of Trustees. | Ms. Craig joined ALPS in 2007 and is currently Assistant Vice President and Paralegal Manager of ALPS. Prior to joining ALPS, Ms. Craig was Legal Manager at Janus Capital Management LLC and served as Assistant Secretary of Janus Investment Fund, Janus Adviser Series and Janus Aspen Series. Because of her position with ALPS, Ms. Craig is deemed an affiliate of the Trust as defined under the 1940 Act. Ms. Craig is also Assistant Secretary of Clough Global Dividend and Income Fund, Clough Global Equity Fund, Clough Global Opportunities Fund, Clough Funds Trust and ALPS Series Trust. |
| * | All communications to Trustees and Officers may be directed to Financial Investors Trust c/o 1290 Broadway, Suite 1100, Denver, CO 80203. |
| ** | This is the period for which the Trustee or Officer began serving the Trust. Each Trustee serves an indefinite term, until such Trustees successor is elected and appointed, or such Trustee resigns or is deceased. Officers are elected on an annual basis. |
| *** | Except as otherwise indicated, each individual has held the office shown or other offices in the same company for the last five years. |
204 | October 31, 2017
Item 2. Code of Ethics.
| (a) | The Registrant, as of the end of the period covered by this report, has adopted a code of ethics that applies to the Registrant’s principal executive officer, principal financial officer, principal accounting officer or controller or any persons performing similar functions on behalf of the Registrant. |
| (b) | Not applicable. |
| (c) | During the period covered by this report, no amendments to the provisions of the code of ethics described in Item 2(a) above were made. |
| (d) | During the period covered by this report, no implicit or explicit waivers to the provisions of the code of ethics described in Item 2(a) above were granted. |
| (e) | Not applicable. |
| (f) | The Registrant’s Code of Ethics is attached as an Exhibit to this report. |
Item 3. Audit Committee Financial Expert.
The Board of Trustees of the Registrant has determined that the Registrant has at least one Audit Committee Financial Expert serving on its audit committee. The Board of Trustees of the Registrant has designated Jeremy W. Deems as the Registrant’s “Audit Committee Financial Expert.” Mr. Deems is “independent” as defined in paragraph (a)(2) of Item 3 to Form N-CSR.
Item 4. Principal Accountant Fees and Services.
| (a) | Audit Fees: For the Registrant’s fiscal years ended October 31, 2017 and October 31, 2016, the aggregate fees billed for professional services rendered by the principal accountant for the audit of the Registrant’s annual financial statements were $239,940 and $240,080, respectively. |
| (b) | Audit-Related Fees: For the Registrant’s fiscal years ended October 31, 2017 and October 31, 2016, the aggregate fees billed for assurance and related services by the principal accountant that were reasonably related to the performance of the audit of the Registrant’s financial statements and are not reported under paragraph (a) of this Item were $0 and $0, respectively. |
| (c) | Tax Fees: For the Registrant’s fiscal years ended October 31, 2017 and October 31, 2016, the aggregate fees billed for professional services rendered by the principal accountant for tax compliance, tax advice and tax planning were $59,440 and $61,380, respectively. The fiscal year 2017 and 2016 tax fees were for services for dividend calculation, excise tax preparation and tax return preparation. |
| (d) | All Other Fees: For the Registrant’s fiscal years ended October 31, 2017 and October 31, 2016, no fees were billed to Registrant by the principal accountant for services other than the services reported in paragraphs (a) through (c) of this Item. |
| (e)(1) | Audit Committee Pre-Approval Policies and Procedures: All services to be performed by the Registrant’s principal accountant must be pre-approved by the Registrant’s audit committee. The Chairman of the Audit Committee may pre-approve non-audit services to be performed by the Registrant’s principal accountant on an interim basis, subject to ratification by the Audit Committee at its next regularly scheduled meeting. |
| (e)(2) | No services described in paragraphs (b) through (d) of this Item were approved by the Registrant’s audit committee pursuant to paragraph (c)(7)(i)(C) of Rule 2-01 of Regulation S-X. |
| (f) | Not applicable. |
| (g) | The aggregate non-audit fees billed by the Registrant’s accountant for services rendered to the Registrant, and rendered to the Registrant’s investment adviser (not including any sub-adviser whose role is primarily portfolio management and is subcontracted with or overseen by another investment adviser), and any entity controlling, controlled by, or under common control with the adviser that provides ongoing services to the Registrant, were $79,272 in the fiscal year ended October 31, 2017 and $85,777 in the fiscal year ended October 31, 2016. These fees consisted of non-audit fees billed to (i) the Registrant of $59,440 in the fiscal year ended October 31, 2017 and $61,380 in the fiscal year ended October 31, 2016 as described in response to paragraph (c) above and (ii) to ALPS Fund Services, Inc. (“AFS”), an entity under common control with ALPS Advisors, Inc., the Registrant’s investment adviser, of $19,832 in the fiscal year ended October 31, 2017 and $24,397 in the fiscal year ended October 31, 2016. The non-audit fees billed to AFS related to SSAE 16 services and other compliance-related matters. |
| (h) | The Registrant’s audit committee has considered whether the provision of non-audit services that were rendered to the Registrant’s investment adviser (not including any sub-adviser whose role is primarily portfolio management and is subcontracted with or overseen by another investment adviser), and any entity controlling, controlled by, or under common control with the investment adviser that provides ongoing services to the Registrant that were not pre-approved pursuant to paragraph (c)(7)(ii) of Rule 2-01 of Regulation S-X, is compatible with maintaining the principal accountant’s independence. The Registrant’s audit committee determined that the provision of such non-audit services is compatible with maintaining the principal accountant’s independence. |
Item 5. Audit Committee of Listed Registrants.
Not applicable.
Item 6. Investments.
| (a) | Schedule of Investments is included as part of the Reports to Stockholders filed under Item 1 of this Form N-CSR. |
| (b) | Not applicable. |
Item 7. Disclosure of Proxy Voting Policies and Procedures for Closed-End Management Investment Companies.
Not applicable to the Registrant.
Item 8. Portfolio Managers of Closed-End Management Investment Companies.
Not applicable to the Registrant.
Item 9. Purchases of Equity Securities by Closed-End Management Investment Company and Affiliated Purchasers.
Not applicable to the Registrant.
Item 10. Submission of Matters to a Vote of Security Holders.
There have been no material changes to the procedures by which shareholders may recommend nominees to the Registrant’s Board of Trustees, where those changes were implemented after the Registrant last provided disclosure in response to the requirements of Item 407(c)(2)(iv) of Regulation S-K, or this Item.
Item 11. Controls and Procedures.
| (a) | The Registrant’s principal executive officer and principal financial officer have concluded that the Registrant’s disclosure controls and procedures (as defined in Rule 30a-3(c) under the Investment Company Act of 1940, as amended) are effective based on their evaluation of these controls and procedures as of a date within 90 days of the filing date of this report. |
| (b) | There was no change in the Registrant’s internal control over financial reporting (as defined in Rule 30a-3(d) under the Investment Company Act of 1940, as amended) during the period covered by this report that has materially affected, or is reasonably likely to materially affect, the Registrant’s internal control over financial reporting. |
Item 12. Disclosure of Securities Lending Activities for Closed-End Management Investment Companies.
Not applicable to the Registrant.
Item 13. Exhibits.
| (a)(1) | Registrant’s Code of Ethics for Principal Executive and Senior Financial Officers, which is the subject of the disclosure required by Item 2 of Form N-CSR, is incorporated by reference to Exhibit 12(a)(1) to the Registrant’s Certified Shareholder Report on Form N-CSR, File No. 811-8194, filed on January 9, 2017. |
| (a)(2) | The certifications required by Rule 30a-2(a) of the Investment Company Act of 1940, as amended, and Section 302 of the Sarbanes-Oxley Act of 2002 are attached hereto as Exhibit 99.Cert. |
| (a)(3) | Not applicable. |
| (a)(4) | Not applicable to the Registrant. |
| (b) | The certifications by the Registrant’s principal executive officer and principal financial officer, as required by Rule 30a-2(b) of the Investment Company Act of 1940, as amended, and Section 906 of the Sarbanes-Oxley Act of 2002 are attached hereto as Exhibit 99.906Cert. |
SIGNATURES
Pursuant to the requirements of the Securities Exchange Act of 1934 and the Investment Company Act of 1940, the Registrant has duly caused this report to be signed on its behalf by the undersigned, thereunto duly authorized.
FINANCIAL INVESTORS TRUST
| By: | /s/ Edmund J. Burke | |
| Edmund J. Burke (Principal Executive Officer) | ||
| President | ||
| Date: | January 8, 2018 |
Pursuant to the requirements of the Securities Exchange Act of 1934 and the Investment Company Act of 1940, this report has been signed below by the following persons on behalf of the Registrant and in the capacities and on the dates indicated.
FINANCIAL INVESTORS TRUST
| By: | /s/ Edmund J. Burke | |
| Edmund J. Burke (Principal Executive Officer) | ||
| President | ||
| Date: | January 8, 2018 | |
| By: | /s/ Kimberly R. Storms | |
| Kimberly R. Storms (Principal Financial Officer) | ||
| Treasurer | ||
| Date: | January 8, 2018 |