UNITED STATES
SECURITIES AND EXCHANGE COMMISSION
Washington, D.C. 20549
FORM N-CSR
CERTIFIED SHAREHOLDER REPORT OF REGISTERED
MANAGEMENT INVESTMENT COMPANIES
Investment Company Act file number: 811-08194
FINANCIAL INVESTORS TRUST
(Exact name of registrant as specified in charter)
1290 Broadway, Suite 1100, Denver, Colorado 80203
(Address of principal executive offices) (Zip code)
Karen Gilomen, Esq., Secretary
Financial Investors Trust
1290 Broadway, Suite 1100
Denver, Colorado 80203
(Name and address of agent for service)
Registrant’s telephone number, including area code: 303-623-2577
Date of fiscal year end: October 31
Date of reporting period: October 31, 2018
Item 1. Reports to Stockholders.
TABLE OF
CONTENTS
| Disclosure of Fund Expenses | 1 |
| ALPS | CoreCommodity Management CompleteCommodities® Strategy Fund |
| Management Commentary | 6 |
| Performance Update | 8 |
| Consolidated Statement of Investments | 10 |
| Consolidated Statement of Assets and Liabilities | 15 |
| Consolidated Statement of Operations | 16 |
| Consolidated Statements of Changes in Net Assets | 17 |
| Consolidated Financial Highlights | 18 |
| ALPS | Kotak India Growth Fund | |
| Management Commentary | 22 |
| Performance Update | 24 |
| Consolidated Statement of Investments | 26 |
| Consolidated Statement of Assets and Liabilities | 28 |
| Consolidated Statement of Operations | 29 |
| Consolidated Statements of Changes in Net Assets | 30 |
| Consolidated Financial Highlights | 31 |
| ALPS | Smith Funds | |
| Management Commentary | 35 |
| Performance Update | 36 |
| Statements of Investments | 40 |
| Statements of Assets and Liabilities | 46 |
| Statements of Operations | 47 |
| Statements of Changes in Net Assets | 48 |
| Financial Highlights | 50 |
| ALPS | Red Rocks Listed Private Equity Fund | |
| Management Commentary | 58 |
| Performance Update | 60 |
| Statement of Investments | 63 |
| Statement of Assets and Liabilities | 65 |
| Statement of Operations | 66 |
| Statements of Changes in Net Assets | 67 |
| Financial Highlights | 68 |
| ALPS | WMC Research Value Fund | |
| Management Commentary | 73 |
| Performance Update | 74 |
| Statement of Investments | 76 |
| Statement of Assets and Liabilities | 80 |
| Statement of Operations | 81 |
| Statements of Changes in Net Assets | 82 |
| Financial Highlights | 83 |
| Clough China Fund | |
| Management Commentary | 87 |
| Performance Update | 89 |
| Statement of Investments | 91 |
| Statement of Assets and Liabilities | 93 |
| Statement of Operations | 94 |
| Statements of Changes in Net Assets | 95 |
| Financial Highlights | 96 |
| RiverFront Global Allocation Series | |
| Management Commentary | 100 |
| Performance Update | 103 |
| Statements of Investments | 113 |
| Statements of Assets and Liabilities | 118 |
| Statements of Operations | 120 |
| Statements of Changes in Net Assets | 121 |
| Financial Highlights | 126 |
| Notes to Financial Statements | 148 |
| Report of Independent Registered Public Accounting Firm | 178 |
| Additional Information | 179 |
| Trustees and Officers | 188 |
alpsfunds.com
Disclosure of Fund Expenses
October 31, 2018 (Unaudited)
Examples. As a shareholder of the Funds, you incur two types of costs: (1) transaction costs, including applicable sales charges (loads) and redemption fees; and (2) ongoing costs, including management fees, distribution and service (12b-1) fees, shareholder service fees and other Fund expenses. The following examples are intended to help you understand your ongoing costs (in dollars) of investing in the Funds and to compare these costs with the ongoing costs of investing in other mutual funds. The examples are based on an investment of $1,000 invested on May 1, 2018 and held until October 31, 2018.
Actual Expenses. The first line under each class in the table below provides information about actual account values and actual expenses. You may use the information in this line, together with the amount you invested, to estimate the expenses that you paid over the period. Simply divide your account value by $1,000 (for example, an $8,600 account value divided by $1,000 = 8.6), then multiply the result by the number in the first line under the heading “Expenses Paid During Period May 1, 2018 – October 31, 2018” to estimate the expenses you paid on your account during this period.
Hypothetical Example for Comparison Purposes. The second line under each class in the table below provides information about hypothetical account values and hypothetical expenses based on the Fund’s actual expense ratio and an assumed rate of return of 5% per year before expenses, which is not the Fund’s actual return. The hypothetical account values and expenses may not be used to estimate the actual ending account balance or expenses you paid for the period. You may use this information to compare the ongoing costs of investing in the Funds and other mutual funds. To do so, compare these 5% hypothetical examples with the 5% hypothetical examples that appear in the shareholder reports of the other funds.
Please note that the expenses shown in the table are meant to highlight your ongoing costs only and do not reflect any transactional costs, such as sales charges or redemption fees. Therefore, the second line under each class in the table below is useful in comparing ongoing costs only, and will not help you determine the relative total costs of owning different funds. In addition, if these transactional costs were included, your costs would have been higher.
Disclosure of Fund Expenses
October 31, 2018 (Unaudited)
| | Beginning Account Value May 1, 2018 | Ending Account Value October 31, 2018 | Expense Ratio(a) | Expenses Paid During Period May 1, 2018 - October 31, 2018(b) |
| ALPS | CoreCommodity Management CompleteCommodities® Strategy Fund(c) | | | | |
| Investor Class | | | | |
| Actual | $1,000.00 | $932.00 | 1.39% | $6.77 |
| Hypothetical (5% return before expenses) | $1,000.00 | $1,018.20 | 1.39% | $7.07 |
| Class A(d) | | | | |
| Actual | $1,000.00 | $924.00 | 1.45% | $5.39 |
| Hypothetical (5% return before expenses) | $1,000.00 | $1,017.90 | 1.45% | $7.38 |
| Class C | | | | |
| Actual | $1,000.00 | $929.20 | 2.05% | $9.97 |
| Hypothetical (5% return before expenses) | $1,000.00 | $1,014.87 | 2.05% | $10.41 |
| Class I | | | | |
| Actual | $1,000.00 | $933.50 | 1.13% | $5.51 |
| Hypothetical (5% return before expenses) | $1,000.00 | $1,019.51 | 1.13% | $5.75 |
| ALPS | Kotak India Growth Fund(e) | | | | |
| Investor Class | | | | |
| Actual | $1,000.00 | $829.00 | 1.92% | $8.85 |
| Hypothetical (5% return before expenses) | $1,000.00 | $1,015.53 | 1.92% | $9.75 |
| Class A(d) | | | | |
| Actual | $1,000.00 | $843.20 | 2.00% | $7.12 |
| Hypothetical (5% return before expenses) | $1,000.00 | $1,015.12 | 2.00% | $10.16 |
| Class C | | | | |
| Actual | $1,000.00 | $825.90 | 2.60% | $11.97 |
| Hypothetical (5% return before expenses) | $1,000.00 | $1,012.10 | 2.60% | $13.19 |
| Class I | | | | |
| Actual | $1,000.00 | $829.90 | 1.60% | $7.38 |
| Hypothetical (5% return before expenses) | $1,000.00 | $1,017.14 | 1.60% | $8.13 |
| ALPS | Smith Short Duration Bond Fund(f) | | | | |
| Investor Class | | | | |
| Actual | $1,000.00 | $1,002.50 | 0.89% | $2.98 |
| Hypothetical (5% return before expenses) | $1,000.00 | $1,020.72 | 0.89% | $4.53 |
| Class A | | | | |
| Actual | $1,000.00 | $1,002.70 | 0.89% | $2.98 |
| Hypothetical (5% return before expenses) | $1,000.00 | $1,020.72 | 0.89% | $4.53 |
| Class C | | | | |
| Actual | $1,000.00 | $1,000.90 | 1.48% | $4.95 |
| Hypothetical (5% return before expenses) | $1,000.00 | $1,017.74 | 1.48% | $7.53 |
| Class I | | | | |
| Actual | $1,000.00 | $1,005.00 | 0.49% | $1.64 |
| Hypothetical (5% return before expenses) | $1,000.00 | $1,022.74 | 0.49% | $2.50 |
| ALPS | Smith Total Return Bond Fund(g) | | | | |
| Investor Class | | | | |
| Actual | $1,000.00 | $1,010.00 | 1.07% | $3.59 |
| Hypothetical (5% return before expenses) | $1,000.00 | $1,019.81 | 1.07% | $5.45 |
| Class A | | | | |
| Actual | $1,000.00 | $1,010.40 | 1.07% | $3.60 |
| Hypothetical (5% return before expenses) | $1,000.00 | $1,019.81 | 1.07% | $5.45 |
| Class C | | | | |
| Actual | $1,000.00 | $1,007.90 | 1.67% | $5.60 |
| Hypothetical (5% return before expenses) | $1,000.00 | $1,016.79 | 1.67% | $8.49 |
| Class I | | | | |
| Actual | $1,000.00 | $1,010.90 | 0.67% | $2.25 |
| Hypothetical (5% return before expenses) | $1,000.00 | $1,021.83 | 0.67% | $3.41 |
Disclosure of Fund Expenses
October 31, 2018 (Unaudited)
| | Beginning Account Value May 1, 2018 | Ending Account Value October 31, 2018 | Expense Ratio(a) | Expenses Paid During Period May 1, 2018 - October 31, 2018(b) |
| ALPS | Red Rocks Listed Private Equity Fund | | | | |
| Investor Class | | | | |
| Actual | $1,000.00 | $939.10 | 1.42% | $6.94 |
| Hypothetical (5% return before expenses) | $1,000.00 | $1,018.05 | 1.42% | $7.22 |
| Class A(d) | | | | |
| Actual | $1,000.00 | $939.10 | 1.48% | $5.54 |
| Hypothetical (5% return before expenses) | $1,000.00 | $1,017.74 | 1.48% | $7.53 |
| Class C | | | | |
| Actual | $1,000.00 | $935.80 | 2.14% | $10.44 |
| Hypothetical (5% return before expenses) | $1,000.00 | $1,014.42 | 2.14% | $10.87 |
| Class I | | | | |
| Actual | $1,000.00 | $941.50 | 1.17% | $5.73 |
| Hypothetical (5% return before expenses) | $1,000.00 | $1,019.31 | 1.17% | $5.96 |
| Class R | | | | |
| Actual | $1,000.00 | $939.50 | 1.59% | $7.77 |
| Hypothetical (5% return before expenses) | $1,000.00 | $1,017.19 | 1.59% | $8.08 |
| ALPS | WMC Research Value Fund | | | | |
| Investor Class | | | | |
| Actual | $1,000.00 | $983.10 | 1.15% | $5.75 |
| Hypothetical (5% return before expenses) | $1,000.00 | $1,019.41 | 1.15% | $5.85 |
| Class A(d) | | | | |
| Actual | $1,000.00 | $956.10 | 1.15% | $4.34 |
| Hypothetical (5% return before expenses) | $1,000.00 | $1,019.41 | 1.15% | $5.85 |
| Class C | | | | |
| Actual | $1,000.00 | $979.80 | 1.90% | $9.48 |
| Hypothetical (5% return before expenses) | $1,000.00 | $1,015.63 | 1.90% | $9.65 |
| Class I | | | | |
| Actual | $1,000.00 | $984.60 | 0.90% | $4.50 |
| Hypothetical (5% return before expenses) | $1,000.00 | $1,020.67 | 0.90% | $4.58 |
| Clough China Fund | | | | |
| Investor Class | | | | |
| Actual | $1,000.00 | $763.40 | 1.95% | $8.67 |
| Hypothetical (5% return before expenses) | $1,000.00 | $1,015.38 | 1.95% | $9.91 |
| Class A(d) | | | | |
| Actual | $1,000.00 | $1,000.00 | 1.95% | $7.53 |
| Hypothetical (5% return before expenses) | $1,000.00 | $1,015.38 | 1.95% | $9.91 |
| Class C | | | | |
| Actual | $1,000.00 | $760.30 | 2.70% | $11.98 |
| Hypothetical (5% return before expenses) | $1,000.00 | $1,011.59 | 2.70% | $13.69 |
| Class I | | | | |
| Actual | $1,000.00 | $764.10 | 1.70% | $7.56 |
| Hypothetical (5% return before expenses) | $1,000.00 | $1,016.64 | 1.70% | $8.64 |
Disclosure of Fund Expenses
October 31, 2018 (Unaudited)
| | Beginning Account Value May 1, 2018 | Ending Account Value October 31, 2018 | Expense Ratio(a) | Expenses Paid During Period May 1, 2018 - October 31, 2018(b) |
| RiverFront Asset Allocation Aggressive | | | | |
| Investor Class | | | | |
| Actual | $1,000.00 | $911.30 | 0.50% | $2.41 |
| Hypothetical (5% return before expenses) | $1,000.00 | $1,022.68 | 0.50% | $2.55 |
| Class A(d) | | | | |
| Actual | $1,000.00 | $887.50 | 0.50% | $1.82 |
| Hypothetical (5% return before expenses) | $1,000.00 | $1,022.68 | 0.50% | $2.55 |
| Class C | | | | |
| Actual | $1,000.00 | $908.00 | 1.25% | $6.01 |
| Hypothetical (5% return before expenses) | $1,000.00 | $1,018.90 | 1.25% | $6.36 |
| Class I | | | | |
| Actual | $1,000.00 | $912.30 | 0.25% | $1.21 |
| Hypothetical (5% return before expenses) | $1,000.00 | $1,023.95 | 0.25% | $1.28 |
| Investor Class II | | | | |
| Actual | $1,000.00 | $910.80 | 0.50% | $2.41 |
| Hypothetical (5% return before expenses) | $1,000.00 | $1,022.68 | 0.50% | $2.55 |
| Class L | | | | |
| Actual | $1,000.00 | $912.80 | 0.25% | $1.21 |
| Hypothetical (5% return before expenses) | $1,000.00 | $1,023.95 | 0.25% | $1.28 |
| RiverFront Asset Allocation Growth | | | | |
| Investor Class | | | | |
| Actual | $1,000.00 | $930.90 | 0.50% | $2.43 |
| Hypothetical (5% return before expenses) | $1,000.00 | $1,022.68 | 0.50% | $2.55 |
| Class A(d) | | | | |
| Actual | $1,000.00 | $906.00 | 0.50% | $1.84 |
| Hypothetical (5% return before expenses) | $1,000.00 | $1,022.68 | 0.50% | $2.55 |
| Class C | | | | |
| Actual | $1,000.00 | $927.70 | 1.25% | $6.07 |
| Hypothetical (5% return before expenses) | $1,000.00 | $1,018.90 | 1.25% | $6.36 |
| Class I | | | | |
| Actual | $1,000.00 | $932.10 | 0.25% | $1.22 |
| Hypothetical (5% return before expenses) | $1,000.00 | $1,023.95 | 0.25% | $1.28 |
| RiverFront Asset Allocation Growth & Income | | | | |
| Investor Class | | | | |
| Actual | $1,000.00 | $943.60 | 0.50% | $2.45 |
| Hypothetical (5% return before expenses) | $1,000.00 | $1,022.68 | 0.50% | $2.55 |
| Class A(d) | | | | |
| Actual | $1,000.00 | $918.70 | 0.50% | $1.85 |
| Hypothetical (5% return before expenses) | $1,000.00 | $1,022.68 | 0.50% | $2.55 |
| Class C | | | | |
| Actual | $1,000.00 | $939.40 | 1.25% | $6.11 |
| Hypothetical (5% return before expenses) | $1,000.00 | $1,018.90 | 1.25% | $6.36 |
| Class I | | | | |
| Actual | $1,000.00 | $943.90 | 0.25% | $1.22 |
| Hypothetical (5% return before expenses) | $1,000.00 | $1,023.95 | 0.25% | $1.28 |
Disclosure of Fund Expenses
October 31, 2018 (Unaudited)
| | Beginning Account Value May 1, 2018 | Ending Account Value October 31, 2018 | Expense Ratio(a) | Expenses Paid During Period May 1, 2018 - October 31, 2018(b) |
| RiverFront Asset Allocation Moderate | | | | |
| Investor Class | | | | |
| Actual | $1,000.00 | $975.50 | 0.50% | $2.49 |
| Hypothetical (5% return before expenses) | $1,000.00 | $1,022.68 | 0.50% | $2.55 |
| Class A(d) | | | | |
| Actual | $1,000.00 | $948.50 | 0.50% | $1.88 |
| Hypothetical (5% return before expenses) | $1,000.00 | $1,022.68 | 0.50% | $2.55 |
| Class C | | | | |
| Actual | $1,000.00 | $970.70 | 1.25% | $6.21 |
| Hypothetical (5% return before expenses) | $1,000.00 | $1,018.90 | 1.25% | $6.36 |
| Class I | | | | |
| Actual | $1,000.00 | $976.00 | 0.25% | $1.25 |
| Hypothetical (5% return before expenses) | $1,000.00 | $1,023.95 | 0.25% | $1.28 |
| RiverFront Asset Allocation Income & Growth | | | | |
| Investor Class | | | | |
| Actual | $1,000.00 | $983.10 | 0.50% | $2.50 |
| Hypothetical (5% return before expenses) | $1,000.00 | $1,022.68 | 0.50% | $2.55 |
| Class A(d) | | | | |
| Actual | $1,000.00 | $969.00 | 0.50% | $1.90 |
| Hypothetical (5% return before expenses) | $1,000.00 | $1,022.68 | 0.50% | $2.55 |
| Class C | | | | |
| Actual | $1,000.00 | $980.20 | 1.25% | $6.24 |
| Hypothetical (5% return before expenses) | $1,000.00 | $1,018.90 | 1.25% | $6.36 |
| Class I | | | | |
| Actual | $1,000.00 | $985.10 | 0.25% | $1.25 |
| Hypothetical (5% return before expenses) | $1,000.00 | $1,023.95 | 0.25% | $1.28 |
| (a) | Annualized, based on the Fund's most recent fiscal half year expenses. |
| (b) | Expenses are equal to the Fund's annualized expense ratio multiplied by the average account value over the period, multiplied by the number of days in the most recent fiscal half year (184), divided by 365. |
| (c) | Includes expenses of the CoreCommodity Management Cayman Commodity Fund Ltd. (wholly-owned subsidiary), exclusive of the subsidiary's management fee. |
| (d) | Class A commenced operations on June 12, 2018. For purposes of calculating the “Actual” figures, actual number of days from commencement of operations through October 31, 2018 were used (141 days). |
| (e) | Includes expenses of the Kotak Mauritius Portfolio (wholly-owned subsidiary). |
| (f) | ALPS | Smith Short Duration Bond Fund commenced operations on July 2, 2018. For purposes of calculating the “Actual” figures, actual number of days from commencement of operations through October 31, 2018 were used (122 days). |
| (g) | ALPS | Smith Total Return Bond Fund commenced operations on July 2, 2018. For purposes of calculating the “Actual” figures, actual number of days from commencement of operations through October 31, 2018 were used (122 days). |
ALPS | CoreCommodity Management CompleteCommodities® Strategy Fund
| Management Commentary | October 31, 2018 (Unaudited) |
The twelve month period ending on October 31, 2018 produced modestly negative returns for commodities, as measured by the diversified Bloomberg Commodities Total Return Index, down -1.73%. The ALPS | CoreCommodity CompleteCommodities® Strategy Fund (“I” Shares—“JCRIX” or the “Fund”) delivered a net positive return of +1.42% (JCRAX was -4.52% at MOP, JCRCX was down -0.50% with CDSC and JCCSX was up 1.10%).
The Fund outperformed its benchmark, the Bloomberg Commodity Index Total Return (“BCOM”), by 315 basis points during this period (measured against the performance of the “I” shares). The Fund employs a strategy that combines an actively managed portfolio of commodity futures related exposure (collateralized by U.S. Treasury Inflation Protected Securities – “TIPS”), commodity equities, and physical commodity ETF’s. At the end of October, the Fund allocated approximately 80% of its assets toward commodity futures related investments and approximately 20% of its assets in commodity equities. The Fund was more than 99% invested at the end of the period.
During the twelve-month period ending in October 2018, the Fund held sector weights which averaged approximately 41% energy, 34% agriculture, 15% industrial metals, and 10% precious metals. Within each sector, the Fund allocated differing quantities of individual commodities compared to BCOM weightings while maintaining an unleveraged, diversified portfolio.
In terms of overall weighting, the Fund's agricultural sector was relatively similar to the BCOM –34% for the Fund and 36% for BCOM. Interestingly, the Fund's greatest outperformance by sector, gross and net, occurred within agriculture. On a gross basis, the Fund’s agricultural sector outperformed the BCOM’s agricultural allocation by about 210 basis points. The Fund’s futures-related investments lost 4.6% for the year while BCOM’s agriculture sub-index total return recorded a 10.1% decline. The Fund’s allocation to agricultural producers (equities) was down -5.4% for the period, but also outperformed the BCOM agricultural sub-index. The primary driver of the outperformance on the futures side was individual weighting and selection. The Fund held a greater percentage of cotton futures relative to BCOM. Cotton prices were near the top in performance, up 15.41% for the year. We included an allocation of about 4% in cocoa futures in our agricultural sleeve. BCOM doesn’t have any cocoa futures. Cocoa prices rose by +2.86% year over year (ending in October 2018), contributing to the Fund’s outperformance. On the flip side, the Fund held less percentage weighting in both soybeans and lean hog futures than BCOM. These two components fell -19.90% and -12.43% respectively for the period. The negative performance had less impact in the Fund due to lighter weighting.
Energy prices were the best performers in the BCOM for the period. Brent North Sea crude led the way, posting a +31.59% year over year performance while West Texas Intermediate added +26.78%.The Fund held a significant overweight in this sector relative to BCOM, an average of 41% compared to 32% for BCOM. The Fund concentrated most of its overweight in petroleum and products. The Fund benefitted on a comparative basis to its benchmark, BCOM. Energy related producers (equities) did not fare as well as the futures, falling just about -100 basis
points for the year. However the combined performance of the Fund’s energy sector produced a total return of +16.8% vs. BCOM’s +18.2%. After adjusting for weighting in the total portfolio, the Fund outperformed BCOM by about 160 basis points in the energy sector.
Industrial metals provided the largest sector decline within the BCOM for the year. BCOM industrial sub-index total return moved significantly lower, down 12.8% for the twelve-month period ending in October 2018. All of the major industrial metals were down for the period. Zinc prices fell the most, down -20.03% while copper prices slipped by -15.49%. Aluminum prices traded lower, -11.18% for the year. Nickel registered a -8.40% loss. Some worries about potential slowing of global GDP growth rates kept industrial metals prices down. Also, the much anticipated infrastructure stimulus in the United States did not move forward as of the October close. The Fund held an underweight relative to BCOM in industrial metals, 15% vs. 17% for BCOM. The combined portfolio of futures and producers (equities) provided a total return of - 10.6%, about 60 basis points above BCOM industrial sub-index performance after adjusting for allocation differences.
Precious metals prices struggled during the year, declining by approximately -7.5% within the BCOM, as measured by the BCOM precious metals sub-index total return. The Fund held an underweight in this sector relative to BCOM, 10% vs 15% for the period. Gold prices went down modestly, -5.05%, while silver prices declined by -15.13%. The Fund’s combined portfolio of futures-related and commodity producer investments in precious metals declined by -11.2% compared to BCOM’s -7.5%. Adjusting for weightings in the Fund’s overall portfolio and for the whole BCOM, the difference in contribution to returns was negligible. The Fund’s precious metals allocation essentially performed in line with BCOM precious metals sub index for the period.
The US Dollar strengthened marginally during the year ending in October, +2.73% as measured by the US Dollar Index (“DXY”). Interest rates rose from about 1.60% on the US two-year Note to 2.87% by the end of October 2018. Since most commodities are priced in Dollars, commodity prices tend to be inversely related to Dollar moves. Additionally, rising interest rates may at times present headwinds to commodity price appreciation. That did not happen this time. We believe that stronger supply/demand fundamentals for many commodities overcame these potential detractors.
{The Fund’s top equity holdings at the end of October 2018 included Yara International (YAR NO) -4.82% YTD, Pilgrim’s Pride Corp (PPC US) - 43.14% YTD, Tyson Foods Inc (TSN US) -25.10% YTD, Marathon Petroleum Corporation (MPC US) +8.80% YTD, Marine Harvest NO (MHG NO) +49.06 % YTD, Holly Frontier Corp (HFC US) +33.86% YTD, Valero Energy Corp. (VLO US) +1.40% YTD, Ingredion Incorporated (INGR US) - 26.40% YTD, Kubota Corp (6326 JP) -19.00% YTD, Bunge Ltd (BG US) - 5.98% YTD }
TIPS and nominal US Treasuries are held by the fund to invest excess cash and as collateral for commodity futures related investments held in our Cayman Island subsidiary. The stated desire by the Federal Reserve to “normalize” rates and the Fed’s balance sheet has been a factor helping to move rates higher. We still believe that there may be
ALPS | CoreCommodity Management CompleteCommodities® Strategy Fund
| Management Commentary | October 31, 2018 (Unaudited) |
considerable resistance to raising rates from here. Certainly the pace of the interest rate hikes will likely be determined by the economic data, including readings on inflation. Nonetheless, we believe we may be nearing the end of what has been a significant multi-year rally in US treasury prices. As a result, we continue to invest in TIPS and nominal US Treasuries with limited duration exposure. At the end of October, our weighted average maturity was approximately 0.7 years in our TIPS and nominal US Treasury portfolio.
We strongly believe that the long term fundamental drivers of commodity demand and ultimately higher prices are still in place. Population growth is likely to remain unabated regardless of the economic environment in the US and Europe. A billion more people are likely to be added to the world population over the next decade or so. The trend of wealth distribution is tipping toward the developing world as those economies grow at faster rates relative to the slow or negative growth occurring in the developed countries. The improving global quality of life is contributing to ever increasing demand for raw materials and food. Incremental gains in disposable income in the developing nations have led to competition for the commodities needed for more complex and costly lifestyles.
While it is true that commodity prices have rallied significantly in percentage terms from the lows established in the first quarter of 2016, the absolute price levels of many commodities, including crude oil, have not gone high enough to stimulate the necessary capital expenditures to assure future supply growth to satisfy future demand. Producers need profit margins to operate, to explore for new sources, and to secure financing. Without robust capital investment, the world may essentially operate from “hand to mouth” for many key commodities. Ultimately that could lead to higher, more volatile prices if problems erupt or demand grows more than current expectations. The price cycle for many commodities seems to be shifting from favoring consumers to rewarding the producers. Commodities may become much more interesting from an investment point of view as sentiment for the asset class ascends with these potential price increases.
Bob Hyman
Portfolio Manager
CoreCommodity Management, LLC
Past performance if not indicative of future results. “Bloomberg®,” “Bloomberg Commodity IndexSM” and the names of the other indexes and sub-indexes that are part of the Bloomberg Commodity Index family are service marks of Bloomberg Finance L.P. and its affiliates. Source for all Index data: Bloomberg L.P. Commodity Sectors are represented by the applicable Bloomberg Commodity Sector Sub-Indices. This document does not constitute an offer of any commodities, securities or investment advisory services. Any such offer may be made only by means of a disclosure document or similar materials which contain a description of material terms and risks. The attribution of performance results presented above is based on gross profit and loss and does not include, among other things, investment expenses, advisory fees or other expenses incurred by the Fund. All expressions of opinion are subject to change without notice in reaction to shifting market conditions. Data contained herein from third-party providers is obtained from what are
considered reliable sources. However, its accuracy, completeness or reliability cannot be guaranteed. The economic statistics presented herein are subject to revision by the agencies that issue them. Any indices and other financial benchmarks shown are provided for illustrative purposes only, are unmanaged, reflect reinvestment of income and do not reflect the impact of advisory fees. Investors cannot invest directly in an index. All investments are subject to risk.
ALPS | CoreCommodity Management CompleteCommodities® Strategy Fund
| Performance Update | October 31, 2018 (Unaudited) |
Performance of $10,000 Initial Investment (as of October 31, 2018)
Comparison of change in value of a $10,000 investment
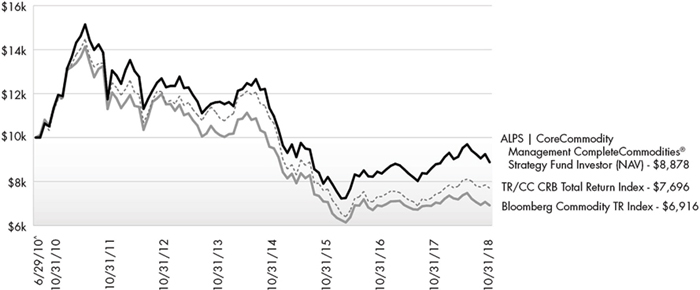
The chart above represents historical performance of a hypothetical investment of $10,000 in the Fund since inception. Past performance does not guarantee future results. This chart does not reflect the deduction of taxes that a shareholder would pay on Fund distributions or the redemption of Fund shares.
Average Annual Total Returns (as of October 31, 2018)
| | 6 Month | 1 Year | 3 Year | 5 Year | Since Inception^ | Total Expense Ratio | What You Pay* |
| Investor# (NAV) | -6.80% | 1.23% | 2.67% | -5.24% | -1.42% | 1.47% | 1.47% |
| Class A (NAV) | -6.80% | 1.23% | 2.67% | -5.24% | -1.42% | 1.47% | 1.47% |
| Class A (MOP) | -11.92% | -4.39% | 0.73% | -6.31% | -2.08% |
| Class C (NAV) | -7.08% | 0.62% | 1.99% | -5.85% | -2.02% | 2.07% | 2.07% |
| Class C (CDSC) | -8.01% | -0.36% | 1.99% | -5.85% | -2.02% |
| Class I | -6.65% | 1.42% | 2.88% | -4.99% | -1.14% | 1.17% | 1.17% |
| TR/CC CRB Total Return Index 1 | -4.47% | 3.66% | 0.16% | -6.68% | -3.09% | | |
| Bloomberg Commodity TR Index1 | -6.18% | -1.73% | -0.69% | -7.31% | -4.32% | | |
Performance data quoted represents past performance. Past performance does not guarantee future results. Investment return and principal value of an investment will fluctuate so that an investor's shares, when sold or redeemed, may be worth more or less than the original cost. Current performance data may be higher or lower than actual data quoted. For the most current month-end performance data, please call 1-866-759-5679.
Maximum Offering Price (MOP) for Class A shares includes the Fund’s maximum sales charge of 5.50%. Performance shown at NAV does not include these sales charges and would have been lower had it been taken into account. If you invest $1 million or more, either as a lump sum or through the Fund’s accumulation or letter of intent programs, you can purchase Class A shares without an initial sales charge (load). A Contingent Deferred Sales Charge (“CDSC”) of 1.00% may apply to Class C shares redeemed within the first 12 months after a purchase, and on Class A shares redeemed within the first 18 months after a purchase in excess of $1 million. The Fund imposes a 2.00% redemption fee on shares held for less than 30 days.
Performance less than 1 year is cumulative.
ALPS | CoreCommodity Management CompleteCommodities® Strategy Fund
| Performance Update | October 31, 2018 (Unaudited) |
Performance shown for Class A shares prior to June 12, 2018 reflects the historical performance of the Fund’s Investor shares, calculated using the fees and expenses of Class A shares.
| 1 | Thomson Reuters/CC CRB Total Return Index and the Bloomberg Commodity TR Index (formerly the Dow Jones-UBS Commodity Index) are unmanaged indices used as a measurement of change in commodity market conditions based on the performance of a basket of different commodities. Each index is composed of a different basket of commodities, a different weighting of the commodities in the basket, and a different re-balancing schedule. The indices are not actively managed and do not reflect any deduction for fees, expenses or taxes. An investor may not invest directly in an index. |
| ^ | Fund Inception date of June 29, 2010 for Investor Class and Classes C and I; Fund Inception date of June 12, 2018 for Class A. |
| * | What You Pay reflects the Advisor’s decision to contractually limit expenses through February 28, 2020 for Class A and February 28, 2019 for all other classes. Please see the prospectus for additional information. |
| # | Prior to December 1, 2017, Investor Class was known as Class A. |
Investments in securities of MLPs involve risks that differ from an investment in common stock. MLPs are controlled by their general partners, which generally have conflicts of interest and limited fiduciary duties to the MLP, which may permit the general partner to favor its own interests over the MLPs. The benefit you are expected to derive from the Fund’s investment in MLPs depends largely on the MLPs being treated as partnerships for federal income tax purposes. As a partnership, an MLP has no federal income tax liability at the entity level. Therefore, treatment of one or more MLPs as a corporation for federal income tax purposes could affect the Fund’s ability to meet its investment objective and would reduce the amount of cash available to pay or distribute to you. Legislative, judicial, or administrative changes and differing interpretations, possibly on a retroactive basis, could negatively impact the value of an investment in MLPs and therefore the value of your investment in the Fund.
Investing in commodity-related securities involves risk and considerations not present when investing in more conventional securities. The Fund may be more susceptible to high volatility of commodity markets.
Derivatives generally are more sensitive to changes in economic or market conditions than other types of investments; this could result in losses that significantly exceed the Fund's original investment.
The table does not reflect the deduction of taxes that a shareholder would pay on Fund distributions or the redemption of Fund shares.
This Fund is not suitable for all investors, and is subject to investment risks, including possible loss of the principal amount invested.
There is no guarantee that the Fund will continue to hold any one particular security or stay invested in any one particular company. The composition of the Fund's top holdings is subject to change. Performance figures are historical and reflect the change in share price, reinvested distributions, changes in net asset value, sales charges and capital gains distributions, if any.
Not FDIC Insured – No Bank Guarantee – May Lose Value
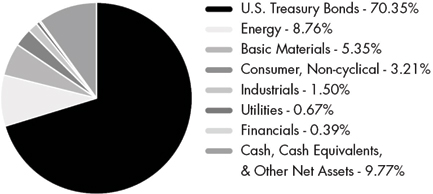
Asset Type Allocation (as a % of Net Assets)†
| Common Stock | | | 19.71 | % |
| Government Bonds | | | 70.35 | % |
| Master Limited Partnerships | | | 0.17 | % |
| Cash, Cash Equivalents and Other Net Assets | | | 9.77 | % |
| Total | | | 100.00 | % |
| † | Holdings are subject to change, and may not reflect the current or future position of the portfolio. Table presents approximate values only. |
Industry Sector Allocation (as a % of Net Assets)
ALPS | CoreCommodity Management CompleteCommodities® Strategy Fund
| Consolidated Statement of Investments | October 31, 2018 |
| | | Shares | | | Value
(Note 2) | |
| COMMON STOCKS (19.71%) | | | | | | | | |
| Argentina (0.11%) | | | | | | | | |
| Adecoagro SA(a) | | | 50,405 | | | $ | 403,240 | |
| YPF SA, Sponsored ADR(a) | | | 23,632 | | | | 354,480 | |
| | | | | | | | 757,720 | |
| | | | | | | | | |
| Australia (1.30%) | | | | | | | | |
| Beach Energy, Ltd. | | | 278,659 | | | | 347,305 | |
| BHP Billiton, Ltd. | | | 5,330 | | | | 121,575 | |
| BlueScope Steel, Ltd. | | | 5,591 | | | | 56,895 | |
| Costa Group Holdings, Ltd. | | | 27,028 | | | | 116,753 | |
| Fortescue Metals Group, Ltd. | | | 516,187 | | | | 1,462,152 | |
| GrainCorp, Ltd., Class A | | | 85,256 | | | | 497,482 | |
| Iluka Resources, Ltd. | | | 72,613 | | | | 414,452 | |
| Incitec Pivot, Ltd. | | | 328,759 | | | | 907,962 | |
| Independence Group NL | | | 176,712 | | | | 505,560 | |
| Mineral Resources, Ltd. | | | 8,685 | | | | 87,642 | |
| Nufarm, Ltd. | | | 95,715 | | | | 386,349 | |
| Oil Search, Ltd. | | | 64,472 | | | | 354,746 | |
| OZ Minerals, Ltd. | | | 133,936 | | | | 856,467 | |
| Santos, Ltd. | | | 7,201 | | | | 33,860 | |
| South32, Ltd. | | | 667,525 | | | | 1,711,202 | |
| Syrah Resources, Ltd.(a) | | | 25,375 | | | | 28,751 | |
| Washington H Soul Pattinson & Co., Ltd. | | | 1,740 | | | | 35,585 | |
| Western Areas, Ltd. | | | 156,235 | | | | 248,935 | |
| Whitehaven Coal, Ltd. | | | 165,006 | | | | 566,718 | |
| Woodside Petroleum, Ltd. | | | 18,740 | | | | 462,485 | |
| | | | | | | | 9,202,876 | |
| | | | | | | | | |
| Austria (0.05%) | | | | | | | | |
| OMV AG | | | 2,563 | | | | 142,624 | |
| voestalpine AG | | | 6,748 | | | | 239,917 | |
| | | | | | | | 382,541 | |
| | | | | | | | | |
| Brazil (0.61%) | | | | | | | | |
| BRF SA, ADR(a) | | | 131,597 | | | | 779,054 | |
| Cia de Saneamento Basico do Estado de Sao Paulo, ADR | | | 112,065 | | | | 831,522 | |
| Gerdau SA, Sponsored ADR | | | 144,950 | | | | 630,533 | |
| Petroleo Brasileiro SA, Sponsored ADR | | | 40,370 | | | | 656,013 | |
| Vale SA, Sponsored ADR | | | 91,554 | | | | 1,382,465 | |
| | | | | | | | 4,279,587 | |
| | | | | | | | | |
| Canada (0.65%) | | | | | | | | |
| Cameco Corp. | | | 45,059 | | | | 483,032 | |
| Canadian Solar, Inc.(a) | | | 19,387 | | | | 277,234 | |
| CES Energy Solutions Corp. | | | 32,100 | | | | 85,099 | |
| Enerflex, Ltd. | | | 14,300 | | | | 172,497 | |
| First Quantum Minerals, Ltd. | | | 4,500 | | | | 44,916 | |
| Hudbay Minerals, Inc. | | | 239,100 | | | | 939,001 | |
| Ivanhoe Mines, Ltd., Class A(a) | | | 113,800 | | | | 214,383 | |
| Nutrien, Ltd. | | | 17,598 | | | | 931,463 | |
| Parex Resources, Inc.(a) | | | 43,000 | | | | 626,161 | |
| Precision Drilling Corp.(a) | | | 89,606 | | | | 215,950 | |
| Secure Energy Services, Inc. | | | 42,200 | | | | 275,040 | |
| Trican Well Service, Ltd.(a) | | | 96,300 | | | | 131,672 | |
| | | Shares | | | Value (Note 2) | |
| Canada (continued) | | | | | | | | |
| Turquoise Hill Resources, Ltd.(a) | | | 121,860 | | | $ | 208,381 | |
| | | | | | | | 4,604,829 | |
| | | | | | | | | |
| Chile (0.26%) | | | | | | | | |
| Antofagasta PLC | | | 16,474 | | | | 165,256 | |
| Sociedad Quimica y Minera de Chile SA, Sponsored ADR | | | 38,571 | | | | 1,689,796 | |
| | | | | | | | 1,855,052 | |
| | | | | | | | | |
| China (0.30%) | | | | | | | | |
| CNOOC, Ltd., Sponsored ADR | | | 9,771 | | | | 1,653,743 | |
| JinkoSolar Holding Co., Ltd., ADR(a) | | | 5,556 | | | | 44,781 | |
| PetroChina Co., Ltd., ADR | | | 5,807 | | | | 421,820 | |
| | | | | | | | 2,120,344 | |
| | | | | | | | | |
| Colombia (0.02%) | | | | | | | | |
| Ecopetrol SA, Sponsored ADR | | | 5,846 | | | | 135,978 | |
| | | | | | | | | |
| Denmark (0.12%) | | | | | | | | |
| FLSmidth & Co. A/S | | | 7,311 | | | | 383,925 | |
| Vestas Wind Systems A/S | | | 7,588 | | | | 475,884 | |
| | | | | | | | 859,809 | |
| | | | | | | | | |
| Faroe Islands (0.13%) | | | | | | | | |
| Bakkafrost P/F | | | 15,902 | | | | 893,023 | |
| | | | | | | | | |
| Finland (0.10%) | | | | | | | | |
| Outokumpu OYJ | | | 122,451 | | | | 514,556 | |
| Outotec OYJ(a) | | | 43,438 | | | | 168,264 | |
| | | | | | | | 682,820 | |
| | | | | | | | | |
| France (0.13%) | | | | | | | | |
| TOTAL SA, Sponsored ADR | | | 15,485 | | | | 907,421 | |
| | | | | | | | | |
| Germany (0.19%) | | | | | | | | |
| K+S AG | | | 47,872 | | | | 893,040 | |
| Salzgitter AG | | | 10,429 | | | | 417,923 | |
| | | | | | | | 1,310,963 | |
| | | | | | | | | |
| Great Britain (1.24%) | | | | | | | | |
| Anglo American PLC | | | 18,446 | | | | 394,974 | |
| BP PLC, Sponsored ADR | | | 43,315 | | | | 1,878,571 | |
| Ensco PLC, Class A | | | 14,961 | | | | 106,822 | |
| John Wood Group PLC | | | 37,393 | | | | 341,357 | |
| Kazakhmys PLC | | | 31,933 | | | | 211,758 | |
| Noble Corp. PLC(a) | | | 74,500 | | | | 373,990 | |
| Petrofac, Ltd. | | | 12,709 | | | | 93,927 | |
| Rio Tinto PLC, Sponsored ADR | | | 30,241 | | | | 1,490,578 | |
| Severn Trent PLC | | | 21,898 | | | | 521,455 | |
| Subsea 7 SA | | | 102,954 | | | | 1,300,085 | |
| TechnipFMC PLC | | | 28,201 | | | | 741,686 | |
| Tullow Oil PLC(a) | | | 35,921 | | | | 103,674 | |
| United Utilities Group PLC | | | 129,470 | | | | 1,202,441 | |
| | | | | | | | 8,761,318 | |
ALPS | CoreCommodity Management CompleteCommodities® Strategy Fund
| Consolidated Statement of Investments | October 31, 2018 |
| | | Shares | | | Value (Note 2) | |
| India (0.02%) | | | | | | |
| Vedanta, Ltd., ADR | | | 15,717 | | | $ | 175,087 | |
| | | | | | | | | |
| Israel (0.02%) | | | | | | | | |
| SolarEdge Technologies, Inc.(a) | | | 3,393 | | | | 131,411 | |
| Tower Semiconductor, Ltd.(a) | | | 1 | | | | 9 | |
| | | | | | | | 131,420 | |
| | | | | | | | | |
| Italy (0.04%) | | | | | | | | |
| Eni SpA, Sponsored ADR | | | 8,929 | | | | 315,551 | |
| | | | | | | | | |
| Japan (1.67%) | | | | | | | | |
| Daido Steel Co., Ltd. | | | 6,200 | | | | 255,506 | |
| GS Yuasa Corp. | | | 21,600 | | | | 444,118 | |
| Hitachi Metals, Ltd. | | | 48,800 | | | | 576,077 | |
| Inpex Corp. | | | 143,333 | | | | 1,650,741 | |
| Japan Petroleum Exploration Co., Ltd. | | | 19,200 | | | | 406,852 | |
| JFE Holdings, Inc. | | | 29,300 | | | | 553,359 | |
| Kobe Steel, Ltd. | | | 60,200 | | | | 484,438 | |
| Kubota Corp. | | | 112,400 | | | | 1,775,131 | |
| Kurita Water Industries, Ltd. | | | 18,016 | | | | 444,353 | |
| Maruichi Steel Tube, Ltd. | | | 16,300 | | | | 470,935 | |
| Megmilk Snow Brand Co., Ltd. | | | 6,000 | | | | 140,488 | |
| Mitsubishi Materials Corp. | | | 17,600 | | | | 488,217 | |
| Nippon Light Metal Holdings Co., Ltd. | | | 39,000 | | | | 82,262 | |
| Nippon Suisan Kaisha, Ltd. | | | 129,600 | | | | 828,126 | |
| Nisshin Steel Co., Ltd. | | | 29,000 | | | | 379,350 | |
| OSAKA Titanium Technologies Co., Ltd. | | | 3,700 | | | | 58,008 | |
| Pacific Metals Co., Ltd. | | | 2,900 | | | | 81,344 | |
| Sakata Seed Corp. | | | 15,600 | | | | 493,570 | |
| Sumitomo Forestry Co., Ltd. | | | 20,659 | | | | 307,409 | |
| Sumitomo Metal Mining Co., Ltd. | | | 3,200 | | | | 100,962 | |
| Toho Titanium Co., Ltd. | | | 12,700 | | | | 129,549 | |
| Toho Zinc Co., Ltd. | | | 13,600 | | | | 435,113 | |
| Tokyo Steel Manufacturing Co., Ltd. | | | 73,400 | | | | 578,301 | |
| UACJ Corp. | | | 11,100 | | | | 243,278 | |
| Yamato Kogyo Co., Ltd. | | | 14,400 | | | | 379,031 | |
| | | | | | | | 11,786,518 | |
| | | | | | | | | |
| Luxembourg (0.13%) | | | | | | | | |
| APERAM SA | | | 9,087 | | | | 309,801 | |
| ArcelorMittal | | | 5,056 | | | | 126,216 | |
| Tenaris SA, ADR | | | 1,915 | | | | 55,975 | |
| Ternium SA, Sponsored ADR | | | 12,748 | | | | 405,897 | |
| | | | | | | | 897,889 | |
| | | | | | | | | |
| Netherlands (0.35%) | | | | | | | | |
| Core Laboratories N.V. | | | 5,076 | | | | 432,678 | |
| Frank's International N.V.(a) | | | 41,457 | | | | 294,345 | |
| Fugro N.V.(a) | | | 27,192 | | | | 351,109 | |
| OCI N.V.(a) | | | 15,679 | | | | 446,457 | |
| Royal Dutch Shell PLC, Class A, Sponsored ADR | | | 3,991 | | | | 252,191 | |
| Royal Dutch Shell PLC, Class B | | | 6,862 | | | | 224,977 | |
| SBM Offshore N.V. | | | 27,872 | | | | 482,377 | |
| | | | | | | | 2,484,134 | |
| | | Shares | | | Value (Note 2) | |
| Norway (1.65%) | | | | | | |
| Aker BP ASA | | | 25,870 | | | $ | 853,147 | |
| Aker Solutions ASA(a)(b) | | | 35,369 | | | | 233,282 | |
| DNO ASA | | | 266,580 | | | | 513,250 | |
| Equinor ASA | | | 48,264 | | | | 1,255,581 | |
| Leroy Seafood Group ASA | | | 124,475 | | | | 1,147,028 | |
| Marine Harvest ASA | | | 90,371 | | | | 2,186,966 | |
| Norsk Hydro ASA | | | 96,822 | | | | 502,613 | |
| Petroleum Geo-Services ASA(a) | | | 83,795 | | | | 261,828 | |
| Salmar ASA | | | 16,124 | | | | 851,168 | |
| TGS NOPEC Geophysical Co. ASA | | | 21,048 | | | | 706,361 | |
| Yara International ASA | | | 72,477 | | | | 3,118,391 | |
| | | | | | | | 11,629,615 | |
| | | | | | | | | |
| Peru (0.11%) | | | | | | | | |
| Southern Copper Corp. | | | 19,506 | | | | 747,860 | |
| | | | | | | | | |
| Singapore (0.15%) | | | | | | | | |
| Sembcorp Marine, Ltd. | | | 61,200 | | | | 70,693 | |
| Wilmar International, Ltd. | | | 445,761 | | | | 1,016,933 | |
| | | | | | | | 1,087,626 | |
| | | | | | | | | |
| South Africa (0.23%) | | | | | | | | |
| Exxaro Resources, Ltd. | | | 59,833 | | | | 612,018 | |
| Kumba Iron Ore, Ltd. | | | 15,133 | | | | 296,454 | |
| Sasol, Ltd. | | | 21,246 | | | | 697,039 | |
| | | | | | | | 1,605,511 | |
| | | | | | | | | |
| South Korea (0.03%) | | | | | | | | |
| POSCO, Sponsored ADR | | | 3,761 | | | | 216,709 | |
| | | | | | | | | |
| Spain (0.04%) | | | | | | | | |
| Acerinox SA | | | 27,354 | | | | 305,735 | |
| | | | | | | | | |
| Sweden (0.36%) | | | | | | | | |
| Boliden AB | | | 61,249 | | | | 1,399,849 | |
| Holmen AB, B Shares | | | 19,366 | | | | 443,775 | |
| Lundin Petroleum AB | | | 12,829 | | | | 391,691 | |
| SSAB AB, A Shares | | | 72,672 | | | | 290,254 | |
| | | | | | | | 2,525,569 | |
| | | | | | | | | |
| Switzerland (0.11%) | | | | | | | | |
| Bucher Industries AG | | | 594 | | | | 163,960 | |
| Ferrexpo PLC | | | 135,944 | | | | 362,992 | |
| Glencore PLC | | | 46,220 | | | | 188,372 | |
| Weatherford International PLC(a) | | | 20,498 | | | | 27,672 | |
| | | | | | | | 742,996 | |
| | | | | | | | | |
| United Kindom (0.11%) | | | | | | | | |
| CNH Industrial N.V. | | | 76,926 | | | | 799,261 | |
| | | | | | | | | |
| United States (9.48%) | | | | | | | | |
| AGCO Corp. | | | 27,270 | | | | 1,528,211 | |
| AK Steel Holding Corp.(a) | | | 135,146 | | | | 500,040 | |
| Alcoa Corp.(a) | | | 10,361 | | | | 362,531 | |
| Allegheny Technologies, Inc.(a) | | | 2,903 | | | | 75,159 | |
| American States Water Co. | | | 6,377 | | | | 390,400 | |
ALPS | CoreCommodity Management CompleteCommodities® Strategy Fund
| Consolidated Statement of Investments | October 31, 2018 |
| | | Shares | | | Value (Note 2) | |
| United States (continued) | | | | | | | | |
| American Water Works Co., Inc. | | | 1,372 | | | $ | 121,463 | |
| Anadarko Petroleum Corp. | | | 9,595 | | | | 510,454 | |
| Andersons, Inc. | | | 11,781 | | | | 424,116 | |
| Antero Resources Corp.(a) | | | 34,762 | | | | 552,368 | |
| Apache Corp. | | | 25,949 | | | | 981,651 | |
| Aqua America, Inc. | | | 27,724 | | | | 901,862 | |
| Archer-Daniels-Midland Co. | | | 23,653 | | | | 1,117,604 | |
| Baker Hughes a GE Co. | | | 13,729 | | | | 366,427 | |
| Bonanza Creek Energy, Inc.(a) | | | 9,572 | | | | 246,479 | |
| Bristow Group, Inc.(a) | | | 13,094 | | | | 144,165 | |
| Bunge, Ltd. | | | 28,517 | | | | 1,762,351 | |
| C&J Energy Services, Inc.(a) | | | 15,972 | | | | 299,954 | |
| Cabot Oil & Gas Corp. | | | 18,573 | | | | 450,024 | |
| California Resources Corp.(a) | | | 12,276 | | | | 384,730 | |
| California Water Service Group | | | 7,330 | | | | 307,860 | |
| Cal-Maine Foods, Inc. | | | 29,240 | | | | 1,423,111 | |
| Carpenter Technology Corp. | | | 11,547 | | | | 503,565 | |
| Carrizo Oil & Gas, Inc.(a) | | | 35,614 | | | | 648,531 | |
| Century Aluminum Co.(a) | | | 18,820 | | | | 149,431 | |
| CF Industries Holdings, Inc. | | | 9,620 | | | | 462,049 | |
| Chesapeake Energy Corp.(a) | | | 11,489 | | | | 40,326 | |
| Chevron Corp. | | | 9,188 | | | | 1,025,840 | |
| Cliffs Natural Resources, Inc.(a) | | | 42,406 | | | | 456,289 | |
| CNX Resources Corp.(a) | | | 13,252 | | | | 207,394 | |
| Compass Minerals International, Inc. | | | 13,897 | | | | 674,143 | |
| ConocoPhillips | | | 6,841 | | | | 478,186 | |
| Continental Resources, Inc.(a) | | | 25,931 | | | | 1,366,045 | |
| Darling Ingredients, Inc.(a) | | | 39,609 | | | | 818,322 | |
| Deere & Co. | | | 10,428 | | | | 1,412,368 | |
| Denbury Resources, Inc.(a) | | | 66,558 | | | | 229,625 | |
| Devon Energy Corp. | | | 23,480 | | | | 760,752 | |
| Diamond Offshore Drilling, Inc.(a) | | | 31,745 | | | | 450,144 | |
| Dril-Quip, Inc.(a) | | | 13,034 | | | | 554,727 | |
| Energy Recovery, Inc.(a) | | | 41,392 | | | | 310,440 | |
| EOG Resources, Inc. | | | 10,750 | | | | 1,132,405 | |
| EQT Corp. | | | 7,871 | | | | 267,378 | |
| Exterran Corp.(a) | | | 4,841 | | | | 101,128 | |
| Extraction Oil & Gas, Inc.(a) | | | 27,255 | | | | 217,767 | |
| Exxon Mobil Corp. | | | 7,125 | | | | 567,720 | |
| First Solar, Inc.(a) | | | 6,824 | | | | 285,243 | |
| FMC Corp. | | | 10,214 | | | | 797,509 | |
| Forum Energy Technologies, Inc.(a) | | | 14,276 | | | | 127,913 | |
| Freeport-McMoRan, Inc. | | | 64,970 | | | | 756,901 | |
| Fresh Del Monte Produce, Inc. | | | 9,031 | | | | 298,294 | |
| Gulfport Energy Corp.(a) | | | 35,874 | | | | 326,812 | |
| Halcon Resources Corp.(a) | | | 103,746 | | | | 344,437 | |
| Halliburton Co. | | | 13,093 | | | | 454,065 | |
| Harsco Corp.(a) | | | 20,191 | | | | 554,647 | |
| Helix Energy Solutions Group, Inc.(a) | | | 35,512 | | | | 302,562 | |
| Helmerich & Payne, Inc. | | | 4,326 | | | | 269,467 | |
| Hess Corp. | | | 1,505 | | | | 86,387 | |
| HollyFrontier Corp. | | | 28,340 | | | | 1,911,249 | |
| Ingredion, Inc. | | | 17,790 | | | | 1,799,992 | |
| Kinder Morgan, Inc. | | | 5,763 | | | | 98,086 | |
| Kosmos Energy, Ltd.(a) | | | 71,459 | | | | 463,769 | |
| Marathon Oil Corp. | | | 8,340 | | | | 158,377 | |
| Marathon Petroleum Corp. | | | 31,343 | | | | 2,208,113 | |
| | | Shares | | | Value (Note 2) | |
| United States (continued) | | | | | | | | |
| Matador Resources Co.(a) | | | 18,081 | | | $ | 521,456 | |
| McDermott International, Inc.(a) | | | 25,657 | | | | 198,329 | |
| Mosaic Co. | | | 12,802 | | | | 396,094 | |
| Murphy Oil Corp. | | | 45,632 | | | | 1,453,836 | |
| Nabors Industries, Ltd. | | | 176,847 | | | | 878,930 | |
| National Oilwell Varco, Inc. | | | 3,499 | | | | 128,763 | |
| Newfield Exploration Co.(a) | | | 30,453 | | | | 615,151 | |
| Noble Energy, Inc. | | | 28,251 | | | | 702,037 | |
| Oceaneering International, Inc.(a) | | | 47,381 | | | | 897,396 | |
| Oil States International, Inc.(a) | | | 23,227 | | | | 517,265 | |
| Patterson-UTI Energy, Inc. | | | 43,886 | | | | 730,263 | |
| PDC Energy, Inc.(a) | | | 20,568 | | | | 873,112 | |
| Phillips 66 | | | 10,779 | | | | 1,108,297 | |
| Pilgrim's Pride Corp.(a) | | | 143,550 | | | | 2,535,092 | |
| PotlatchDeltic Corp. REIT | | | 19,499 | | | | 706,839 | |
| ProPetro Holding Corp.(a) | | | 19,678 | | | | 347,317 | |
| QEP Resources, Inc.(a) | | | 56,900 | | | | 506,979 | |
| Range Resources Corp. | | | 26,273 | | | | 416,427 | |
| Rayonier, Inc. REIT | | | 30,244 | | | | 913,369 | |
| Rexnord Corp.(a) | | | 48,783 | | | | 1,307,872 | |
| Rowan Cos. PLC, Class A(a) | | | 104,809 | | | | 1,667,511 | |
| RPC, Inc. | | | 62,124 | | | | 924,405 | |
| Sanderson Farms, Inc. | | | 6,358 | | | | 625,564 | |
| Schlumberger, Ltd. | | | 8,909 | | | | 457,121 | |
| Schnitzer Steel Industries, Inc., Class A | | | 18,302 | | | | 492,324 | |
| SJW Group | | | 6,870 | | | | 417,215 | |
| Southwestern Energy Co.(a) | | | 26,093 | | | | 139,337 | |
| SRC Energy, Inc.(a) | | | 97,972 | | | | 693,642 | |
| SunCoke Energy, Inc.(a) | | | 10,819 | | | | 121,173 | |
| Superior Energy Services, Inc.(a) | | | 76,267 | | | | 597,171 | |
| TimkenSteel Corp.(a) | | | 6,351 | | | | 73,862 | |
| TPI Composites, Inc.(a) | | | 976 | | | | 24,654 | |
| Transocean, Ltd.(a) | | | 31,936 | | | | 351,615 | |
| Tyson Foods, Inc., Class A | | | 41,839 | | | | 2,506,992 | |
| United States Steel Corp. | | | 18,276 | | | | 484,862 | |
| US Silica Holdings, Inc. | | | 14,303 | | | | 200,242 | |
| Valero Energy Corp. | | | 20,330 | | | | 1,851,859 | |
| W&T Offshore, Inc.(a) | | | 98,879 | | | | 666,444 | |
| Walter Energy, Inc.(a) | | | 68,768 | | | | 76 | |
| Weyerhaeuser Co. REIT | | | 42,390 | | | | 1,128,846 | |
| WildHorse Resource Development Corp.(a) | | | 32,810 | | | | 695,900 | |
| Williams Cos., Inc. | | | 1,855 | | | | 45,132 | |
| | | | | | | | 66,850,129 | |
| | | | | | | | | |
| TOTAL COMMON STOCKS | | | | | | | | |
| (Cost $146,217,158) | | | | | | | 139,055,891 | |
| | | | | | | | | |
| MASTER LIMITED PARTNERSHIPS (0.17%) |
| United States (0.17%) | | | | | | | | |
| Alliance Resource Partners LP | | | 29,972 | | | | 575,163 | |
| Buckeye Partners LP | | | 977 | | | | 32,055 | |
| Energy Transfer LP | | | 4,974 | | | | 77,296 | |
| Enterprise Products Partners LP | | | 10,676 | | | | 286,330 | |
| Magellan Midstream Partners LP | | | 2,054 | | | | 126,691 | |
ALPS | CoreCommodity Management CompleteCommodities® Strategy Fund
| Consolidated Statement of Investments | October 31, 2018 |
| | | Shares | | | Value (Note 2) | |
| United States (continued) | | | | | | | | |
| MPLX LP | | | 1,555 | | | $ | 52,264 | |
| Plains All American Pipeline LP | | | 3,090 | | | | 67,269 | |
| | | | | | | | 1,217,068 | |
| | | | | | | | | |
| TOTAL MASTER LIMITED PARTNERSHIPS |
| (Cost $1,628,286) | | | | | | | 1,217,068 | |
| | | | | | | | | |
| | | Principal Amount | | | | Value (Note 2) | |
| GOVERNMENT BONDS (70.35%) | | | | | | | | |
| U.S. Treasury Bonds (70.35%) | | | | | | | | |
| United States Treasury Inflation Indexed Bonds | | | | | | | | |
| 0.125%, 4/15/19(c) | | $ | 245,384,722 | | | $ | 243,261,570 | |
| 0.125%, 4/15/20(c) | | | 25,302,450 | | | | 24,869,870 | |
| United States Treasury Notes | | | | | | | | |
| 1.625%, 3/31/19 | | | 23,250,000 | | | | 23,172,803 | |
| 1.500%, 3/31/19 | | | 56,500,000 | | | | 56,288,125 | |
| 0.875%, 5/15/19 | | | 31,500,000 | | | | 31,228,682 | |
| 1.625%, 7/31/19 | | | 88,400,000 | | | | 87,762,898 | |
| 2.375%, 4/30/20 | | | 30,000,000 | | | | 29,803,125 | |
| | | | | | | | 496,387,073 | |
| TOTAL GOVERNMENT BONDS | | | | | |
| (Cost $499,589,371) | | | | 496,387,073 | |
| | | Value (Note 2) | |
| TOTAL INVESTMENTS (90.23%) | | | | |
| (Cost $647,434,815) | | $ | 636,660,032 | |
| | | | | |
| Other Assets In Excess Of Liabilities (9.77%) | | | 68,963,207 | |
| NET ASSETS - 100.00% | | $ | 705,623,239 | |
| (a) | Non-Income Producing Security. |
| (b) | Securities were purchased pursuant to Regulation S under the Securities Act of 1933, which exempts securities offered and sold outside of the United States from registration. Such securities cannot be sold in the United States without either an effective registration statement filed pursuant to the Securities Act of 1933, or pursuant to an exemption from registration. These securities have been deemed liquid under guidelines approved by the Fund's Board of Trustees. As of October 31, 2018 the aggregate market value of those securities was $233,282 representing 0.033% of net assets. |
| (c) | Security, or portion of security, is being held as collateral for total return swap contracts and futures contracts aggregating a total market value of $48,109,179. |
For Fund compliance purposes, the Fund's industry and geographical classifications refer to any one or more of the industry sub-classifications used by one or more widely recognized market indexes or ratings group indexes, and/or as defined by Fund management. This definition may not apply for purposes of this report, which may combine sub-classifications for reporting ease. Industries and regions are shown as a percent of net assets.
See Notes to Financial Statements.
ALPS | CoreCommodity Management CompleteCommodities® Strategy Fund
| Consolidated Statement of Investments | October 31, 2018 |
FUTURES CONTRACTS
| Description | | Counterparty | | Position | | | Contracts | | | Expiration Date | | Notional Amount/Fair Value (Note 2) | | | Unrealized Appreciation | |
| Coffee 'C' Future | | Morgan Stanley & Co., LLC | | Long | | | 171 | | | 11/30/18 | | $ | 7,226,888 | | | $ | 948,965 | |
| Copper Future | | Morgan Stanley & Co., LLC | | Short | | | (401) | | | 03/27/19 | | | (26,846,950 | ) | | | 1,206,658 | |
| LME Zinc Future | | Morgan Stanley & Co., LLC | | Long | | | 12 | | | 11/30/18 | | | 754,425 | | | | 29,234 | |
| Natural Gas Future | | Morgan Stanley & Co., LLC | | Long | | | 658 | | | 11/28/18 | | | 21,457,380 | | | | 1,186,361 | |
| Platinum Future | | Morgan Stanley & Co., LLC | | Long | | | 173 | | | 01/29/19 | | | 7,291,950 | | | | 110,292 | |
| Sugar #11 Future | | Morgan Stanley & Co., LLC | | Long | | | 240 | | | 02/28/19 | | | 3,545,472 | | | | 528,856 | |
| WTI Crude Future | | Morgan Stanley & Co., LLC | | Short | | | (746) | | | 11/19/18 | | | (48,721,260 | ) | | | 4,847,615 | |
| | | | | | | | | | | | | $ | (35,292,095 | ) | | $ | 8,857,981 | |
| Description | | Counterparty | | Position | | | Contracts | | | Expiration Date | | Notional Amount/Fair Value (Note 2) | | | Unrealized Depreciation | |
| Brent Crude Future | | Morgan Stanley & Co., LLC | | Long | | | 902 | | | 11/30/18 | | $ | 67,686,080 | | | $ | (3,629,884 | ) |
| Coffee Robusta Future | | Morgan Stanley & Co., LLC | | Short | | | (319) | | | 01/25/19 | | | (5,343,250 | ) | | | (592,275 | ) |
| Gold 100 Oz Future | | Morgan Stanley & Co., LLC | | Long | | | 86 | | | 12/27/18 | | | 10,449,000 | | | | (16,396 | ) |
| LME Copper Future | | Morgan Stanley & Co., LLC | | Long | | | 191 | | | 11/30/18 | | | 28,654,775 | | | | (772,092 | ) |
| LME Nickel Future | | Morgan Stanley & Co., LLC | | Long | | | 52 | | | 11/30/18 | | | 3,577,548 | | | | (309,013 | ) |
| Silver Future | | Morgan Stanley & Co., LLC | | Long | | | 217 | | | 12/27/18 | | | 15,495,970 | | | | (586,718 | ) |
| Soybean Future | | Morgan Stanley & Co., LLC | | Long | | | 258 | | | 01/14/19 | | | 10,987,575 | | | | (273,425 | ) |
| Soybean Meal Future | | Morgan Stanley & Co., LLC | | Long | | | 97 | | | 12/14/18 | | | 2,972,080 | | | | (146,307 | ) |
| | | | | | | | | | | | | $ | 134,479,778 | | | $ | (6,326,110 | ) |
TOTAL RETURN SWAP CONTRACTS(a)
| Swap Counterparty | | Reference Obligation | | Notional Amount | | | Floating Rate Paid by Fund | | Termination Date | | Value | | | Unrealized Appreciation | |
| Citigroup | | CRB 3m Fwd TR Index ** | | $ | 133,940,149 | | | USB3MTA + 24 bps* | | 9/30/19 | | $ | 133,940,657 | | | $ | 508 | |
| UBS | | CRB 3m Fwd TR Index ** | | | 73,680,577 | | | USB3MTA + 32 bps* | | 11/30/18 | | | 73,680,860 | | | | 283 | |
| Societe Generale | | CRB 3m Fwd TR Index ** | | | 72,763,784 | | | USB3MTA + 35 bps* | | 11/30/18 | | | 72,764,061 | | | | 277 | |
| Bank of America - Merrill Lynch | | CRB 3m Fwd TR Index ** | | | 168,432,685 | | | USB3MTA + 30 bps* | | 6/28/19 | | | 168,432,687 | | | | 2 | |
| | | | | $ | 448,817,195 | | | | | | | $ | 448,818,265 | | | $ | 1,070 | |
| (a) | For long positions in the total return swap, the Fund receives payments based on any positive return of the Reference Obligation less the rate paid by the Fund. The Fund makes payments on any negative return of such Reference Obligations plus the rate paid by the fund. For short positions in the total return swap, the Fund makes payments based on any positive return of the Reference Obligation less the rate paid by the Fund. The Fund receives payments on any negative return of such Reference Obligations plus the rate paid by the Fund. |
| * | United States Auction Results 3 Month Treasury Bill High Discount. Total return swap resets monthly. |
| ** | CRB - Commodity Research Bureau |
See Notes to Financial Statements.
ALPS | CoreCommodity Management CompleteCommodities® Strategy Fund
| Consolidated Statement of Assets and Liabilities | October 31, 2018 |
| ASSETS | | | |
| Investments, at value | | $ | 636,660,032 | |
| Cash | | | 64,157,735 | |
| Foreign currency, at value (Cost $294,399) | | | 292,885 | |
| Unrealized appreciation on total return swap contracts | | | 1,070 | |
| Receivable for shares sold | | | 15,538,048 | |
| Receivable for investments sold | | | 438,113 | |
| Receivable for variation margin on futures contracts | | | 187,359 | |
| Dividends and interest receivable | | | 860,699 | |
| Prepaid expenses and other assets | | | 37,482 | |
| Total Assets | | | 718,173,423 | |
| LIABILITIES | | | | |
| Payable due to broker for total return swap contracts | | | 9,133,091 | |
| Payable due to broker for futures contracts | | | 1,043,076 | |
| Payable for shares redeemed | | | 1,499,680 | |
| Investment advisory fees payable | | | 515,781 | |
| Administration and transfer agency fees payable | | | 208,149 | |
| Distribution and services fees payable | | | 36,814 | |
| Trustees' fees and expenses payable | | | 2,236 | |
| Professional fees payable | | | 42,512 | |
| Accrued expenses and other liabilities | | | 68,845 | |
| Total Liabilities | | | 12,550,184 | |
| NET ASSETS | | $ | 705,623,239 | |
| NET ASSETS CONSIST OF | | | | |
| Paid-in capital | | $ | 747,116,593 | |
| Total distributable earnings | | | (41,493,354 | ) |
| NET ASSETS | | $ | 705,623,239 | |
| INVESTMENTS, AT COST | | $ | 647,434,815 | |
| | | | | |
| PRICING OF SHARES | | | | |
| Investor Class: | | | | |
| Net Asset Value, offering and redemption price per share | | $ | 7.54 | |
| Net Assets | | $ | 48,727,793 | |
| Shares of beneficial interest outstanding (unlimited number of shares, no par value common stock authorized) | | | 6,462,445 | |
| Class A: | | | | |
| Net Asset Value, offering and redemption price per share | | $ | 7.54 | |
| Net Assets | | $ | 190,704 | |
| Shares of beneficial interest outstanding (unlimited number of shares, no par value common stock authorized) | | | 25,286 | |
| Maximum offering price per share ((NAV/0.9450), based on maximum sales charge of 5.50% of the offering price) | | $ | 7.98 | |
| Class C: | | | | |
| Net Asset Value, offering and redemption price per share(a) | | $ | 7.22 | |
| Net Assets | | $ | 9,510,027 | |
| Shares of beneficial interest outstanding (unlimited number of shares, no par value common stock authorized) | | | 1,317,054 | |
| Class I: | | | | |
| Net Asset Value, offering and redemption price per share | | $ | 7.58 | |
| Net Assets | | $ | 647,194,715 | |
| Shares of beneficial interest outstanding (unlimited number of shares, no par value common stock authorized) | | | 85,353,809 | |
| (a) | Redemption price per share may be reduced for any applicable contingent deferred sales charge. For a description of a possible sales charge, please see the Fund's Prospectus. |
See Notes to Financial Statements.
ALPS | CoreCommodity Management CompleteCommodities® Strategy Fund
| Consolidated Statement of Operations | For the Year Ended October 31, 2018 |
| INVESTMENT INCOME | | | |
| Dividends | | $ | 3,940,484 | |
| Foreign taxes withheld on dividends | | | (290,927 | ) |
| Interest and other income, net of premium amortization and accretion of discount | | | 9,179,892 | |
| Total Investment Income | | | 12,829,449 | |
| | | | | |
| EXPENSES | | | | |
| Investment advisory fees | | | 5,365,034 | |
| Investment advisory fees - subsidiary (Note 8) | | | 999,885 | |
| Administrative fees | | | 716,649 | |
| Transfer agency fees | | | 607,468 | |
| Distribution and service fees | | | | |
| Investor Class(a) | | | 185,454 | |
| Class A(b) | | | 126 | |
| Class C | | | 87,935 | |
| Professional fees | | | 49,072 | |
| Reports to shareholders and printing fees | | | 116,912 | |
| State registration fees | | | 64,248 | |
| Insurance fees | | | 4,018 | |
| Custody fees | | | 65,572 | |
| Trustees' fees and expenses | | | 19,525 | |
| Repayment of previously waived fees | | | | |
| Investor Class(a) | | | 6,800 | |
| Class C | | | 1,645 | |
| Class I | | | 46,891 | |
| Miscellaneous expenses | | | 24,188 | |
| Total Expenses | | | 8,361,422 | |
| Less fees waived/reimbursed by investment advisor (Note 8) | | | | |
| Waiver of investment advisory fees - subsidiary | | | (999,885 | ) |
| Class A(b) | | | (10 | ) |
| Net Expenses | | | 7,361,527 | |
| Net Investment Income | | | 5,467,922 | |
| Net realized gain on investments | | | 269,103 | |
| Net realized gain on futures contracts | | | 5,493,863 | |
| Net realized gain on total return swap contracts | | | 7,759,107 | |
| Net realized loss on foreign currency transactions | | | (29,234 | ) |
| Net Realized Gain | | | 13,492,839 | |
| Net change in unrealized depreciation on investments | | | (19,867,950 | ) |
| Net change in unrealized appreciation on futures contracts | | | 260,536 | |
| Net change in unrealized appreciation on total return swap contracts | | | 1,190 | |
| Net change in unrealized depreciation on translation of assets and liabilities denominated in foreign currencies | | | (10,426 | ) |
| Net Change in Unrealized Depreciation | | | (19,616,650 | ) |
| NET REALIZED AND UNREALIZED LOSS ON INVESTMENTS | | | (6,123,811 | ) |
| NET DECREASE IN NET ASSETS RESULTING FROM OPERATIONS | | $ | (655,889 | ) |
| (a) | Prior to December 1, 2017, Investor Class was known as Class A. |
| (b) | Class A commenced operations on June 12, 2018. |
See Notes to Financial Statements.
ALPS | CoreCommodity Management CompleteCommodities® Strategy Fund
Consolidated Statements of Changes in Net Assets
| | | For the Year Ended October 31, 2018 | | | For the Year Ended October 31, 2017 | |
| OPERATIONS | | | | | | |
| Net investment income | | $ | 5,467,922 | | | $ | 287,848 | |
| Net realized gain | | | 13,492,839 | | | | 6,803,365 | |
| Net change in unrealized appreciation/(depreciation) | | | (19,616,650 | ) | | | 14,722,728 | |
| Net Increase/(Decrease) in Net Assets Resulting from Operations | | | (655,889 | ) | | | 21,813,941 | |
| | | | | | | | | |
| TOTAL DISTRIBUTIONS(a) | | | | | | | | |
| From distributable earnings | | | | | | | | |
| Investor Class(b) | | | (1,159,806 | ) | | | (15,061 | ) |
| Class C | | | (187,271 | ) | | | – | |
| Class I | | | (11,870,472 | ) | | | (491,956 | ) |
| Net Decrease in Net Assets from Distributions | | | (13,217,549 | ) | | | (507,017 | ) |
| | | | | | | | | |
| BENEFICIAL INTEREST TRANSACTIONS (NOTE 6) | | | | | | | | |
| Shares sold | | | | | | | | |
| Investor Class(b) | | | 18,832,619 | | | | 29,389,655 | |
| Class A(c) | | | 195,323 | | | | – | |
| Class C | | | 4,136,291 | | | | 3,802,844 | |
| Class I | | | 322,824,182 | | | | 213,799,975 | |
| Dividends reinvested | | | | | | | | |
| Investor Class(b) | | | 1,099,833 | | | | 12,719 | |
| Class C | | | 111,922 | | | | – | |
| Class I | | | 10,390,433 | | | | 450,481 | |
| Shares redeemed, net of redemption fees | | | | | | | | |
| Investor Class(b) | | | (18,297,033 | ) | | | (12,292,578 | ) |
| Class C | | | (2,104,665 | ) | | | (3,621,065 | ) |
| Class I | | | (155,888,526 | ) | | | (215,121,025 | ) |
| Net Increase in Net Assets Derived from Beneficial Interest Transactions | | | 181,300,379 | | | | 16,421,006 | |
| | | | | | | | | |
| Net increase in net assets | | | 167,426,941 | | | | 37,727,930 | |
| | | | | | | | | |
| NET ASSETS | | | | | | | | |
| Beginning of year | | | 538,196,298 | | | | 500,468,368 | |
| End of year | | $ | 705,623,239 | | | $ | 538,196,298 | (d) |
| (a) | For the prior year ended October 31, 2017, Total Distributions consisted of Net Investment Income $507,017, and Net Realized Gains $–. |
| (b) | Prior to December 1, 2017, Investor Class was known as Class A. |
| (c) | Class A commenced operations on June 12, 2018. |
| (d) | For the prior year ended October 31, 2017, included accumulated net investment income of $11,459,725. |
See Notes to Financial Statements.
ALPS | CoreCommodity Management CompleteCommodities® Strategy Fund – Investor Class
Consolidated Financial Highlights
Selected data for a share of beneficial interest outstanding throughout the periods indicated:
| | | For the Year Ended October 31, 2018(a) | | | For the Year Ended October 31, 2017 | | | For the Year Ended October 31, 2016 | | | For the Year Ended October 31, 2015 | | | For the Fiscal Period Ended October 31, 2014(b) | | | For the Year Ended April 30, 2014 | |
| Net asset value, beginning of period(c) | | $ | 7.64 | | | $ | 7.29 | | | $ | 7.15 | | | $ | 9.56 | | | $ | 10.87 | | | $ | 10.40 | |
| INCOME/(LOSS) FROM INVESTMENT OPERATIONS: | | | | | | | | | | | | | | | | | | | | | | | | |
| Net investment income/(loss)(d) | | | 0.05 | | | | (0.01 | )(e) | | | (0.03 | )(e) | | | (0.09 | )(e) | | | 0.00 | (e)(f) | | | (0.06 | )(e) |
| Net realized and unrealized gain/(loss) | | | 0.04 | | | | 0.36 | | | | 0.17 | | | | (2.32 | ) | | | (1.31 | ) | | | 0.53 | |
| Total from investment operations | | | 0.09 | | | | 0.35 | | | | 0.14 | | | | (2.41 | ) | | | (1.31 | ) | | | 0.47 | |
| DISTRIBUTIONS: | | | | | | | | | | | | | | | | | | | | | | | | |
| From net investment income | | | (0.19 | ) | | | (0.00 | )(f) | | | – | | | | – | | | | – | | | | – | |
| Total distributions | | | (0.19 | ) | | | (0.00 | )(f) | | | – | | | | – | | | | – | | | | – | |
| REDEMPTION FEES ADDED TO PAID-IN CAPITAL (NOTE 6) | | | 0.00 | (f) | | | 0.00 | (f) | | | 0.00 | (f) | | | 0.00 | (f) | | | 0.00 | (f) | | | 0.00 | (f) |
| Net increase/(decrease) in net asset value | | | (0.10 | ) | | | 0.35 | | | | 0.14 | | | | (2.41 | ) | | | (1.31 | ) | | | 0.47 | |
| Net asset value, end of year | | $ | 7.54 | | | $ | 7.64 | | | $ | 7.29 | | | $ | 7.15 | | | $ | 9.56 | | | $ | 10.87 | |
| TOTAL RETURN(g) | | | 1.23 | % | | | 4.85 | % | | | 1.96 | % | | | (25.21 | )% | | | (12.05 | )% | | | 4.52 | % |
| RATIOS/SUPPLEMENTAL DATA: | | | | | | | | | | | | | | | | | | | | | | | | |
| Net assets, end of year (000s) | | $ | 48,728 | | | $ | 47,845 | | | $ | 29,468 | | | $ | 30,085 | | | $ | 39,971 | | | $ | 112,562 | |
| Ratio of expenses to average net assets excluding fee waivers and reimbursements | | | 1.40 | %(h) | | | 1.38 | % | | | 1.41 | % | | | 1.47 | % | | | 1.46 | %(i) | | | 1.50 | % |
| Ratio of expenses to average net assets including fee waivers and reimbursements | | | 1.40 | % | | | 1.38 | % | | | 1.41 | % | | | 1.45 | % | | | 1.45 | %(i) | | | 1.45 | % |
| Ratio of net investment income/(loss) to average net assets | | | 0.66 | % | | | (0.10 | )% | | | (0.48 | )% | | | (1.12 | )% | | | 0.09 | %(i) | | | (0.60 | )% |
| Portfolio turnover rate(j) | | | 42 | % | | | 66 | % | | | 50 | % | | | 52 | % | | | 12 | % | | | 28 | % |
| (a) | Prior to December 1, 2017, Investor Class was known as Class A. |
| (b) | Effective May 1, 2014, the Board approved changing the fiscal year-end of the Funds from April 30 to October 31. |
| (c) | Per share amounts and ratios to average net assets include income and expenses of the CoreCommodity Management Cayman Commodity Fund Ltd. (wholly-owned subsidiary). |
| (d) | Calculated using the average shares method. |
| (e) | The per share amount does not correspond to activity reflected in the Statement of Operations due to class specific expenses during the period. |
| (f) | Less than $0.005 or ($0.005) per share. |
| (g) | Total returns are for the period indicated and have not been annualized. Total returns would have been lower had certain expenses not been waived during the period. Returns shown do not reflect the deduction of taxes that a shareholder would pay on Fund distributions or the redemption of Fund shares. Returns shown exclude any applicable sales charges. |
| (h) | The ratio of operating expenses excluding fee waiver/reimbursements to average net assets is calculated excluding the waived Subsidiary management fee (see Note 8 for additional detail). The ratio inclusive of that fee would be 1.56%. |
| (j) | Portfolio turnover rate for periods less than one full year have not been annualized. |
See Notes to Financial Statements.
ALPS | CoreCommodity Management CompleteCommodities® Strategy Fund – Class A
Consolidated Financial Highlights
Selected data for a share of beneficial interest outstanding throughout the periods indicated:
| | | For the Period June 12, 2018 (Commencement of Operations) to October 31, 2018 | |
| Net asset value, beginning of period(a) | | $ | 8.16 | |
| | | | | |
| INCOME FROM INVESTMENT OPERATIONS: | | | | |
| Net investment income(b) | | | (0.00 | )(c) |
| Net realized and unrealized loss | | | (0.62 | ) |
| Total from investment operations | | | (0.62 | ) |
| | | | | |
| Net (decrease) in net asset value | | | (0.62 | ) |
| Net asset value, end of year | | $ | 7.54 | |
| TOTAL RETURN(d) | | | (7.60 | )% |
| | | | | |
| RATIOS/SUPPLEMENTAL DATA: | | | | |
| Net assets, end of year (000s) | | $ | 191 | |
| Ratio of expenses to average net assets excluding fee waivers and reimbursements | | | 1.48 | %(e)(f) |
| Ratio of expenses to average net assets including fee waivers and reimbursements | | | 1.45 | %(e) |
| Ratio of net investment loss to average net assets | | | (0.10 | %)(e) |
| Portfolio turnover rate(g) | | | 42 | % |
| (a) | Per share amounts and ratios to average net assets include income and expenses of the CoreCommodity Management Cayman Commodity Fund Ltd. (wholly-owned subsidiary). |
| (b) | Calculated using the average shares method. |
| (c) | Less than $0.005 or ($0.005) per share. |
| (d) | Total returns are for the period indicated and have not been annualized. Total returns would have been lower had certain expenses not been waived during the period. Returns shown do not reflect the deduction of taxes that a shareholder would pay on Fund distributions or the redemption of Fund shares. |
| (f) | The ratio of operating expenses excluding fee waiver/reimbursements to average net assets is calculated excluding the waived Subsidiary management fee (see Note 8 for additional detail). The ratio inclusive of that fee would be 1.64%. |
| (g) | Portfolio turnover rate for periods less than one full year have not been annualized. |
See Notes to Financial Statements.
ALPS | CoreCommodity Management CompleteCommodities® Strategy Fund – Class C
Consolidated Financial Highlights
Selected data for a share of beneficial interest outstanding throughout the periods indicated:
| | | For the Year Ended October 31, 2018 | | | For the Year Ended October 31, 2017 | | | For the Year Ended October 31, 2016 | | | For the Year Ended October 31, 2015 | | | For the Fiscal Period Ended October 31, 2014(a) | | | For the Year Ended April 30, 2014 | |
| Net asset value, beginning of period(b) | | $ | 7.36 | | | $ | 7.07 | | | $ | 6.98 | | | $ | 9.39 | | | $ | 10.71 | | | $ | 10.31 | |
| INCOME/(LOSS) FROM INVESTMENT OPERATIONS: | | | | | | | | | | | | | | | | | | | | | | | | |
| Net investment loss(c) | | | (0.00 | )(d)(e) | | | (0.06 | )(e) | | | (0.08 | )(e) | | | (0.14 | )(e) | | | (0.04 | )(e) | | | (0.12 | )(e) |
| Net realized and unrealized gain/(loss) | | | 0.04 | | | | 0.35 | | | | 0.17 | | | | (2.27 | ) | | | (1.28 | ) | | | 0.52 | |
| Total from investment operations | | | 0.04 | | | | 0.29 | | | | 0.09 | | | | (2.41 | ) | | | (1.32 | ) | | | 0.40 | |
| DISTRIBUTIONS: | | | | | | | | | | | | | | | | | | | | | | | | |
| From net investment income | | | (0.18 | ) | | | – | | | | – | | | | – | | | | – | | | | – | |
| Total distributions | | | (0.18 | ) | | | – | | | | – | | | | – | | | | – | | | | – | |
| REDEMPTION FEES ADDED TO PAID-IN CAPITAL (NOTE 6) | | | – | | | | – | | | | – | | | | 0.00 | (d) | | | 0.00 | (d) | | | 0.00 | (d) |
| Net increase/(decrease) in net asset value | | | (0.14 | ) | | | 0.29 | | | | 0.09 | | | | (2.41 | ) | | | (1.32 | ) | | | 0.40 | |
| Net asset value, end of year | | $ | 7.22 | | | $ | 7.36 | | | $ | 7.07 | | | $ | 6.98 | | | $ | 9.39 | | | $ | 10.71 | |
| TOTAL RETURN(f) | | | 0.62 | % | | | 4.10 | % | | | 1.29 | % | | | (25.67 | )% | | | (12.32 | )% | | | 3.88 | % |
| RATIOS/SUPPLEMENTAL DATA: | | | | | | | | | | | | | | | | | | | | | | | | |
| Net assets, end of year (000s) | | $ | 9,510 | | | $ | 7,642 | | | $ | 7,260 | | | $ | 8,335 | | | $ | 12,534 | | | $ | 13,996 | |
| Ratio of expenses to average net assets excluding fee waivers and reimbursements | | | 2.05 | %(g) | | | 2.05 | % | | | 2.05 | % | | | 2.07 | % | | | 2.07 | %(h) | | | 2.10 | % |
| Ratio of expenses to average net assets including fee waivers and reimbursements | | | 2.05 | % | | | 2.05 | % | | | 2.05 | % | | | 2.05 | % | | | 2.05 | %(h) | | | 2.05 | % |
| Ratio of net investment loss to average net assets | | | (0.04 | )% | | | (0.81 | )% | | | (1.13 | )% | | | (1.74 | )% | | | (0.82 | )%(h) | | | (1.16 | )% |
| Portfolio turnover rate(i) | | | 42 | % | | | 66 | % | | | 50 | % | | | 52 | % | | | 12 | % | | | 28 | % |
| (a) | Effective May 1, 2014, the Board approved changing the fiscal year-end of the Funds from April 30 to October 31. |
| (b) | Per share amounts and ratios to average net assets include income and expenses of the CoreCommodity Management Cayman Commodity Fund Ltd. (wholly-owned subsidiary). |
| (c) | Calculated using the average shares method. |
| (d) | Less than $0.005 or ($0.005) per share. |
| (e) | The per share amount does not correspond to activity reflected in the Statement of Operations due to class specific expenses during the period. |
| (f) | Total returns are for the period indicated and have not been annualized. Total returns would have been lower had certain expenses not been waived during the period. Returns shown do not reflect the deduction of taxes that a shareholder would pay on Fund distributions or the redemption of Fund shares. Returns shown exclude any applicable sales charges. |
| (g) | The ratio of operating expenses excluding fee waiver/reimbursements to average net assets is calculated excluding the waived Subsidiary management fee (see Note 8 for additional detail). The ratio inclusive of that fee would be 2.21%. |
| (i) | Portfolio turnover rate for periods less than one full year have not been annualized. |
See Notes to Financial Statements.
ALPS | CoreCommodity Management CompleteCommodities® Strategy Fund – Class I
Consolidated Financial Highlights
Selected data for a share of beneficial interest outstanding throughout the periods indicated:
| | | For the Year Ended October 31, 2018 | | | For the Year Ended October 31, 2017 | | | For the Year Ended October 31, 2016 | | | For the Year Ended October 31, 2015 | | | For the Fiscal Period Ended October 31, 2014(a) | | | For the Year Ended April 30, 2014 | |
| Net asset value, beginning of period(b) | | $ | 7.67 | | | $ | 7.31 | | | $ | 7.15 | | | $ | 9.57 | | | $ | 10.87 | | | $ | 10.37 | |
| INCOME/(LOSS) FROM INVESTMENT OPERATIONS: | | | | | | | | | | | | | | | | | | | | | | | | |
| Net investment income/(loss)(c) | | | 0.07 | | | | 0.01 | | | | (0.02 | ) | | | (0.06 | ) | | | (0.01 | ) | | | (0.03 | ) |
| Net realized and unrealized gain/(loss) | | | 0.03 | | | | 0.36 | | | | 0.18 | | | | (2.31 | ) | | | (1.29 | ) | | | 0.53 | |
| Total from investment operations | | | 0.10 | | | | 0.37 | | | | 0.16 | | | | (2.37 | ) | | | (1.30 | ) | | | 0.50 | |
| DISTRIBUTIONS: | | | | | | | | | | | | | | | | | | | | | | | | |
| From net investment income | | | (0.19 | ) | | | (0.01 | ) | | | – | | | | (0.05 | ) | | | – | | | | – | |
| Total distributions | | | (0.19 | ) | | | (0.01 | ) | | | – | | | | (0.05 | ) | | | – | | | | – | |
| REDEMPTION FEES ADDED TO PAID-IN CAPITAL (NOTE 6) | | | 0.00 | (d) | | | 0.00 | (d) | | | 0.00 | (d) | | | 0.00 | (d) | | | 0.00 | (d) | | | 0.00 | (d) |
| Net increase/(decrease) in net asset value | | | (0.09 | ) | | | 0.36 | | | | 0.16 | | | | (2.42 | ) | | | (1.30 | ) | | | 0.50 | |
| Net asset value, end of year | | $ | 7.58 | | | $ | 7.67 | | | $ | 7.31 | | | $ | 7.15 | | | $ | 9.57 | | | $ | 10.87 | |
| TOTAL RETURN(e) | | | 1.42 | % | | | 5.03 | % | | | 2.24 | % | | | (24.88 | )% | | | (11.96 | )% | | | 4.82 | % |
| RATIOS/SUPPLEMENTAL DATA: | | | | | | | | | | | | | | | | | | | | | | | | |
| Net assets, end of year (000s) | | $ | 647,195 | | | $ | 482,710 | | | $ | 463,741 | | | $ | 362,389 | | | $ | 393,618 | | | $ | 266,293 | |
| Ratio of expenses to average net assets excluding fee waivers and reimbursements | | | 1.13 | %(f) | | | 1.15 | % | | | 1.15 | % | | | 1.17 | % | | | 1.16 | %(g) | | | 1.16 | % |
| Ratio of expenses to average net assets including fee waivers and reimbursements | | | 1.13 | % | | | 1.15 | % | | | 1.15 | % | | | 1.15 | % | | | 1.15 | %(g) | | | 1.15 | % |
| Ratio of net investment income/(loss) to average net assets | | | 0.90 | % | | | 0.08 | % | | | (0.22 | )% | | | (0.73 | )% | | �� | (0.12 | )%(g) | | | (0.26 | )% |
| Portfolio turnover rate(h) | | | 42 | % | | | 66 | % | | | 50 | % | | | 52 | % | | | 12 | % | | | 28 | % |
| (a) | Effective May 1, 2014, the Board approved changing the fiscal year-end of the Funds from April 30 to October 31. |
| (b) | Per share amounts and ratios to average net assets include income and expenses of the CoreCommodity Management Cayman Commodity Fund Ltd. (wholly-owned subsidiary). |
| (c) | Calculated using the average shares method. |
| (d) | Less than $0.005 or ($0.005) per share. |
| (e) | Total returns are for the period indicated and have not been annualized. Total returns would have been lower had certain expenses not been waived during the period. Returns shown do not reflect the deduction of taxes that a shareholder would pay on Fund distributions or the redemption of Fund shares. |
| (f) | The ratio of operating expenses excluding fee waiver/reimbursements to average net assets is calculated excluding the waived Subsidiary management fee (see Note 8 for additional detail). The ratio inclusive of that fee would be 1.29%. |
| (h) | Portfolio turnover rate for periods less than one full year have not been annualized. |
See Notes to Financial Statements.
ALPS | Kotak India Growth Fund
| Management Commentary | October 31, 2018 (Unaudited) |
Performance
ALPS | Kotak India Growth Fund (the “Fund”) was launched on February 14, 2011. During the 12-month period ended 31st Oct 2018 (hereinafter also referred to as “the period”), the Fund’s Class A Shares, INDAX, delivered a total return of -16.98% at Net Asset Value, Class C, INFCX, delivered -18.32% with CDSC, and Class I, INDIX, delivered -16.66%. The Fund underperformed the benchmark Nifty 500 Index (“NSE500”) which returned -16.51% during the period without taking into account sales charges for Class A and C Shares.
The period between November 2017 and October 2018 saw periods of high volatility both in foreign as well as domestic equities mainly led by US-China conflicts over trade which deteriorated to tariff wars, sudden spurt in crude prices on concerns of supply limitations post Iran sanctions and liquidity squeeze in Indian markets after the default of IL&FS.
Global commodity prices especially crude rallied in this period by 22% which put pressure on India’s Current Account Deficit (CAD) and consequently on the currency, which depreciated by 15% over this period. Global yields continued to rise and in particular for India, the spread between the Indian and the US 10yr yields saw marginal expansion of 20 bps. The US Federal Reserve increased the Fed funds rate four times in this period (December 2017, March 2018, June 2018 and September 2018), as expected by markets.
The RBI had raised its repo rate by 50 bps in this period. The minutes of the October MPC meeting reaffirmed the wait-and-watch mode of the members. Even as there was an acknowledgement of the upside risks to inflation over the foreseeable horizon, the volatile global macro conditions, more-than-expected benign inflation trajectory and the lagged impact of the last two rate hikes essentially put most of the members on the vigilant mode with the stance being changed to ‘calibrated tightening’ while staying off any policy rate hike in the October policy. The RBI Governor made clear that in the current rate cycle, a cut in the policy repo rate is off the table.
The Indian union budget for FY2019 was announced on Feb 1, 2018 and the budget offered a modest fiscal stimulus to infrastructure and rural economy. The government has budgeted (1) a 17% increase in taxation revenues, 10% increase in expenditure (10% increase in revenue expenditure and 10% increase in capital expenditure) and (3) Rs800 bn of divestment revenues versus FY2018RE figure of Rs1.0 tn. The government has introduced 10% long-term capital gains (LTCG) on shares from April 1, 2018 versus nil earlier. However, it will grandfather capital gains up to January 1, 2018. The government budgeted Rs1.6 tn (0.8% of GDP) towards the rural development through allocations in key sectors such as employment guarantee scheme, housing, irrigation, rural roads and connectivity and social welfare schemes targeted towards women and children.
Real GDP growth accelerated to 8.2% in 1QFY19 compared to 7.7% in 4QFY18 led by a strong favorable base effect and also pickup in a
sequential momentum. Nominal GDP growth improved sharply to 13.8% from 10.9% in 4QFY18. Real GVA growth picked up to 8% from 7.6% in 4QFY18 largely led by pickup in agriculture (5.3% from 4.5% in 4QFY18) and industrial growth (10.2% from 8.8% in 4QFY18). Within industry, manufacturing (13.5% from 9.1% in 4QFY18) and construction (8.7% from 11.5% in 4QFY18) were the key contributors. The sharp pickup in agriculture sector output was largely led by 8.1% growth in livestock products, forestry and fisheries (accounts for 44.9% of agriculture sector GVA). Meanwhile, the service sector growth moderated to 7.3% from 7.7% in 4QFY19.
Portfolio Composition
As of 31st Oct 2018, Financials remains the largest sector (31.05% wt.), followed by information Technology (13.58%) and Materials (10.38%). The top 5 holdings in the portfolio are HDFC Bank, Infosys Ltd, ICICI Bank, Reliance Industries and ITC. Large active deviations in the portfolio are in Information Technology (+2.72% deviation from benchmark), Industrials (+1.92% deviation), Utilities (-2.96% deviation) and Energy (-2.39%). In terms of market capitalization focus, as of 31st Oct, the fund is invested 70.51% in large caps, 20.48% in midcaps and 5.29% in small-caps.
During the period, some of the names within our favored sectors where we initiated new positions and continue to hold as of this report are Astral Polytechnik, AU Small Finance Bank, Aurobindo Pharma, Team Lease and Titan Industries. Some of the stocks where we booked profit and exited completely include ACC, Akzo India, Arvind Lts, Bombay Stock Exchange, Federal Bank and Orient Cement.
Outlook
Tax revenues (GST) in India have been trailing estimates. However for the month of October, as per finance ministry the GST tax collection has crossed Rs1 tn. mark and the government is hopeful that the momentum will sustain in November and December on account of festive demand and anti-evasion measure initiated by revenue department. Brent oil has cooled off nearly 13% from a peak of USD 85/bl at the end of September to about USD 74.5/bl as of the end of the Oct 2018. At the same time the INR has remained flat at about 73.4/USD during the month. India being a large net importer of oil, the sharp rise in price of oil and depreciation in INR in recent months has a direct negative bearing on India’s trade balance; stabilization on both fronts this month is positive for India’s macro. Inflation also has been in a moderate at 3.77% for September. All in all, while the stress in macro remains elevated, we have seen some moderation in recent weeks.
Large cap stocks have been large outperformers vs. mid and small cap stocks for much of 2018 and the valuation gap between large and mid-caps has narrowed meaningfully. Inflows in the domestic mutual fund have continued, albeit at lower levels, in recent months, despite subdued returns over last 8-10 months. In the near term market participants will keenly evaluate the impact of Iran sanctions on oil prices & US midterm election outcome along with trade policies. In India the progress of the earnings seasons and state elections are two important events which will have bearing on
ALPS | Kotak India Growth Fund
| Management Commentary | October 31, 2018 (Unaudited) |
Indian equity markets. Nifty presently trades at a fair valuation of 15.2x FY20E and 13.1x FY21E earnings (year ending March - Kotak Securities estimates), and stocks in general have seen fair amount of correction lately. Though it’s likely that that the in the near term the markets can remain volatile, the current levels of the market offers attractive levels for investors to take exposure to Indian markets from a medium to long term perspective.
Mr. Nitin Tejpal Jain
Fund Manager
NSE500 is an Index of India comprised of the top 500 companies listed on the NSE.
The views of the author and information discussed in this commentary are as of the date of publication, are subject to change, and may not reflect the writer's current views. The views expressed are those of the author only, and represent an assessment of market conditions at a specific point in time, are opinions only and should not be relied upon as investment advice regarding a particular investment or markets in general. Such information does not constitute a recommendation to buy or sell specific securities or investment vehicles. It should not be assumed that any investment will be profitable or will equal the performance of the fund or any securities or any sectors mentioned in this letter. The subject matter contained in this letter has been derived from several sources believed to be reliable and accurate at the time of compilation. Neither ALPS Advisors, Inc., Kotak Mahindra (UK) Limited, nor the Fund accepts any liability for losses either direct or consequential caused by the use of this information.
Diversification cannot guarantee gain or prevent losses.
ALPS | Kotak India Growth Fund
| Performance Update | October 31, 2018 (Unaudited) |
Performance of $10, 000 Initial Investment (as of October 31, 2018)
Comparison of change in value of a $10,000 investment
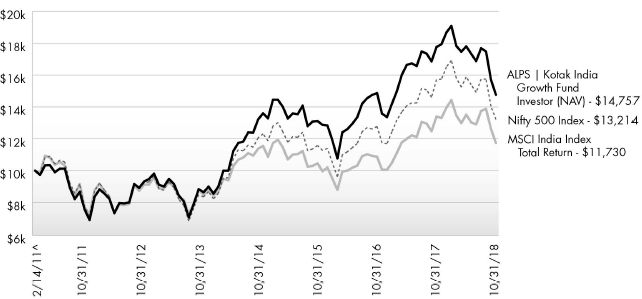
The chart above represents historical performance of a hypothetical investment of $10,000 in the Fund since inception. Past performance does not guarantee future results. This chart does not reflect the deduction of taxes that a shareholder would pay on Fund distributions or the redemption of Fund shares.
Average Annual Total Returns (as of October 31, 2018)
| | 6 Month | 1 Year | 3 Year | 5 Year | Since Inception^ | Total Expense Ratio | What You Pay* |
| Investor# (NAV) | -17.10% | -16.91% | 4.02% | 10.80% | 5.18% | 3.05% | 2.00% |
| Class A (NAV) | -17.17% | -16.98% | 3.99% | 10.78% | 5.17% | 3.05% | 2.00% |
| Class A (MOP) | -21.71% | -21.57% | 2.05% | 9.55% | 4.40% |
| Class C (NAV) | -17.41% | -17.52% | 3.25% | 10.01% | 4.46% | 3.69% | 2.60% |
| Class C (CDSC) | -18.24% | -18.32% | 3.25% | 10.01% | 4.46% |
| Class I | -17.01% | -16.66% | 4.28% | 11.16% | 5.52% | 2.65% | 1.60% |
| Nifty 500 Index1 | -16.78% | -15.91% | 4.50% | 9.28% | 3.68% | | |
| MSCI India Index Total Return2 | -13.19% | -12.42% | 3.90% | 5.94% | 2.09% | | |
Performance data quoted represents past performance. Past performance does not guarantee future results. Investment return and principal value of an investment will fluctuate so that an investor’s shares, when sold or redeemed, may be worth more or less than the original cost. Current performance data may be higher or lower than actual data quoted. For the most current month-end performance data, please call 1-866-759-5679.
Maximum Offering Price (MOP) for Class A shares includes the Fund’s maximum sales charge of 5.50%. Performance shown at NAV does not include these sales charges and would have been lower had it been taken into account. If you invest $1 million or more, either as a lump sum or through the Fund’s accumulation or letter of intent programs, you can purchase Class A shares without an initial sales charge (load). A Contingent Deferred Sales Charge (“CDSC”) of 1.00% may apply to Class C shares redeemed within the first 12 months after a purchase, and on Class A shares redeemed within the first 18 months after a purchase in excess of $1 million. The Fund imposes a 2.00% redemption fee on shares held for less than 30 days.
Performance less than 1 year is cumulative.
ALPS | Kotak India Growth Fund
| Performance Update | October 31, 2018 (Unaudited) |
Performance shown for Class A shares prior to June 12, 2018 reflects the historical performance of the Fund’s Investor shares, calculated using the fees and expenses of Class A shares.
| 1 | Nifty 500 Index (formerly the CNX 500 Index) - India’s first broad based benchmark of the Indian capital market. The Nifty 500 companies are disaggregated into 72 industry indices. Industry weightages in the index reflect the industry weightages in the market. The index is not actively managed and does not reflect any deduction for fees, expenses or taxes. An investor may not invest directly in an index. |
| 2 | MSCI India Index - designed to measure the performance of the large and mid cap segments of the Indian market. With 64 constituents, the index covers approximately 85% of the Indian equity universe. |
| ^ | Fund Inception date of February 14, 2011 for Investor Class and Classes C and I; Fund Inception date of June 12, 2018 for Class A. |
| * | What You Pay reflects the Advisor’s and Sub-Advisor’s decision to contractually limit expenses through February 28, 2020 for Class A and February 28, 2019 for all other Classes. Please see the prospectus for additional information. |
| # | Prior to December 1, 2017, Investor Class was known as Class A. |
The Fund is “non-diversified” and will generally be more volatile than diversified funds.
The table does not reflect the deduction of taxes that a shareholder would pay on Fund distributions or the redemption of Fund shares.
This Fund is not suitable for all investors and is subject to investment risks, including possible loss of the principal amount invested.
There is no guarantee that the Fund will continue to hold any one particular security or stay invested in any one particular company. The composition of the Fund’s top holdings is subject to change. Performance figures are historical and reflect the change in share price, reinvested distributions, changes in net asset value, sales charges and capital gains distributions, if any.
Not FDIC Insured – No Bank Guarantee – May Lose Value
Investing in India involves risk and considerations not present when investing in more established securities markets. The Fund may be more susceptible to economic, market, political and local risks of the region than a fund that is more geographically diversified. Investments in India are subject to a number of risks including, but not limited to, risk of losing some or all of the capital invested, high market volatility, variable market liquidity, geopolitical risks (including political instability), exchange rate fluctuations (between the currency of the fund’s share class and the Indian Rupee), changes in tax regime and restrictions on investment activities of foreign investors.
| Top Ten Holdings (as a% of Net Assets) † | | |
| | | |
| HDFC Bank, Ltd. | | 8.95% |
| Infosys, Ltd. | | 5.95% |
| ICICI Bank, Ltd. | | 4.74% |
| Reliance Industries, Ltd. | | 4.22% |
| ITC, Ltd. | | 3.97% |
| Housing Development Finance Corp., Ltd. | | 3.57% |
| Tata Consultancy Services, Ltd. | | 3.09% |
| Axis Bank, Ltd. | | 2.70% |
| Larsen & Toubro, Ltd. | | 2.55% |
| Maruti Suzuki India, Ltd. | | 2.48% |
| Top Ten Holdings | | 42.22% |
| † | Holdings are subject to change, and may not reflect the current or future position of the portfolio. Table presents approximate values only. |
Industry Sector Allocation (as a % of Net Assets)
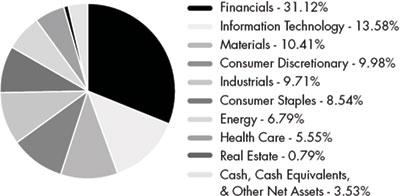
ALPS | Kotak India Growth Fund
| Consolidated Statement of Investments | October 31, 2018 |
| | | Shares | | | Value (Note 2) | |
| COMMON STOCKS (96.47%) | | | | | | | | |
| Consumer Discretionary (9.98%) | | | | | | | | |
| Auto Components (2.07%) | | | | | | | | |
| Motherson Sumi Systems, Ltd. | | | 57,555 | | | $ | 127,120 | |
| MRF, Ltd. | | | 368 | | | | 321,106 | |
| | | | | | | | 448,226 | |
| | | | | | | | | |
| Automobiles (4.87%) | | | | | | | | |
| Mahindra & Mahindra, Ltd. | | | 20,107 | | | | 208,453 | |
| Maruti Suzuki India, Ltd. | | | 5,992 | | | | 536,158 | |
| Tata Motors, Ltd., Class A(a) | | | 84,130 | | | | 111,071 | |
| TVS Motor Co., Ltd. | | | 26,617 | | | | 196,020 | |
| | | | | | | | 1,051,702 | |
| | | | | | | | | |
| Hotels, Restaurants & Leisure (0.78%) | | | | | | | | |
| Jubilant Foodworks, Ltd. | | | 11,429 | | | | 167,777 | |
| | | | | | | | | |
| Household Durables (1.41%) | | | | | | | | |
| Crompton Greaves Consumer Electricals, Ltd. | | | 105,546 | | | | 304,751 | |
| | | | | | | | | |
| Textiles, Apparel & Luxury Goods (0.85%) | | | | | | | | |
| Titan Co., Ltd. | | | 16,099 | | | | 184,190 | |
| | | | | | | | | |
| TOTAL CONSUMER DISCRETIONARY | | | | | | | 2,156,646 | |
| | | | | | | | | |
| Consumer Staples (8.54%) | | | | | | | | |
| Food Products (1.43%) | | | | | | | | |
| Britannia Industries, Ltd. | | | 4,064 | | | | 309,821 | |
| | | | | | | | | |
| Personal Products (3.14%) | | | | | | | | |
| Colgate-Palmolive India, Ltd. | | | 13,186 | | | | 199,392 | |
| Emami, Ltd. | | | 36,680 | | | | 196,327 | |
| Godrej Consumer Products, Ltd. | | | 28,681 | | | | 281,750 | |
| | | | | | | | 677,469 | |
| | | | | | | | | |
| Tobacco (3.97%) | | | | | | | | |
| ITC, Ltd. | | | 226,029 | | | | 856,546 | |
| | | | | | | | | |
| TOTAL CONSUMER STAPLES | | | | | | | 1,843,836 | |
| | | | | | | | | |
| Energy (6.79%) | | | | | | | | |
| Oil, Gas & Consumable Fuels (6.79%) | | | | | | | | |
| Hindustan Petroleum Corp., Ltd. | | | 92,362 | | | | 281,071 | |
| Petronet LNG, Ltd. | | | 89,814 | | | | 273,947 | |
| Reliance Industries, Ltd. | | | 63,476 | | | | 911,279 | |
| | | | | | | | 1,466,297 | |
| | | | | | | | | |
| TOTAL ENERGY | | | | | | | 1,466,297 | |
| | | | | | | | | |
| Financials (31.12%) | | | | | | | | |
| Banks (23.71%) | | | | | | | | |
| AU Small Finance Bank, Ltd.(b)(c) | | | 36,111 | | | | 271,071 | |
| Axis Bank, Ltd.(a) | | | 74,167 | | | | 583,882 | |
| | | Shares | | | Value (Note 2) | |
| Banks (continued) | | | | | | | | |
| HDFC Bank, Ltd. | | | 74,420 | | | $ | 1,932,355 | |
| ICICI Bank, Ltd. | | | 213,375 | | | | 1,023,415 | |
| IndusInd Bank, Ltd. | | | 26,880 | | | | 518,207 | |
| RBL Bank, Ltd.(b)(c) | | | 36,255 | | | | 257,306 | |
| State Bank of India(a) | | | 102,609 | | | | 390,491 | |
| Yes Bank, Ltd. | | | 56,886 | | | | 144,674 | |
| | | | | | | | 5,121,401 | |
| | | | | | | | | |
| Consumer Finance (2.54%) | | | | | | | | |
| Bajaj Finance, Ltd. | | | 6,281 | | | | 202,097 | |
| Bharat Financial Inclusion, Ltd.(a) | | | 29,233 | | | | 347,344 | |
| | | | | | | | 549,441 | |
| | | | | | | | | |
| Insurance (1.30%) | | | | | | | | |
| ICICI Prudential Life Insurance Co., Ltd.(b)(c) | | | 62,381 | | | | 280,524 | |
| | | | | | | | | |
| Thrifts & Mortgage Finance (3.57%) | | | | | | | | |
| Housing Development Finance Corp., Ltd. | | | 32,241 | | | | 771,319 | |
| | | | | | | | | |
| TOTAL FINANCIALS | | | | | | | 6,722,685 | |
| | | | | | | | | |
| Health Care (5.55%) | | | | | | | | |
| Health Care Providers & Services (0.85%) | | | | | | | | |
| HealthCare Global Enterprises, Ltd.(a) | | | 59,062 | | | | 182,509 | |
| Pharmaceuticals (4.70%) | | | | | | | | |
| Aurobindo Pharma, Ltd. | | | 15,976 | | | | 171,211 | |
| Cadila Healthcare, Ltd. | | | 29,802 | | | | 145,209 | |
| Cipla, Ltd. | | | 25,723 | | | | 219,288 | |
| Lupin, Ltd. | | | 13,507 | | | | 161,882 | |
| Sun Pharmaceutical Industries, Ltd. | | | 40,504 | | | | 317,980 | |
| | | | | | | | 1,015,570 | |
| | | | | | | | | |
| TOTAL HEALTH CARE | | | | | | | 1,198,079 | |
| | | | | | | | | |
| Industrials (9.71%) | | | | | | | | |
| Airlines (0.81%) | | | | | | | | |
| InterGlobe Aviation, Ltd.(b)(c) | | | 14,514 | | | | 174,282 | |
| Building Products (1.87%) | | | | | | | | |
| Astral Poly Technik, Ltd. | | | 11,218 | | | | 149,137 | |
| Kajaria Ceramics, Ltd. | | | 27,167 | | | | 144,865 | |
| Somany Ceramics, Ltd. | | | 23,892 | | | | 109,932 | |
| | | | | | | | 403,934 | |
| | | | | | | | | |
| Construction & Engineering (2.55%) | | | | | | | | |
| Larsen & Toubro, Ltd. | | | 31,400 | | | | 551,797 | |
| | | | | | | | | |
| Electrical Equipment (2.56%) | | | | | | | | |
| Amara Raja Batteries, Ltd. | | | 25,249 | | | | 254,884 | |
| Finolex Cables, Ltd. | | | 2,028 | | | | 13,729 | |
ALPS | Kotak India Growth Fund
| Consolidated Statement of Investments | October 31, 2018 |
| | | Shares | | | Value (Note 2) | |
| Electrical Equipment (continued) | | | | | | | | |
| V-Guard Industries, Ltd. | | | 111,694 | | | $ | 284,079 | |
| | | | | | | | 552,692 | |
| | | | | | | | | |
| Machinery (1.41%) | | | | | | | | |
| Thermax, Ltd. | | | 9,229 | | | | 124,895 | |
| Timken India, Ltd. | | | 25,290 | | | | 179,077 | |
| | | | | | | | 303,972 | |
| | | | | | | | | |
| Professional Services (0.51%) | | | | | | | | |
| TeamLease Services, Ltd.(a) | | | 3,181 | | | | 110,699 | |
| | | | | | | | | |
| TOTAL INDUSTRIALS | | | | | | | 2,097,376 | |
| | | | | | | | | |
| Information Technology (13.58%) | | | | | | | | |
| IT Services (13.58%) | | | | | | | | |
| HCL Technologies, Ltd. | | | 36,202 | | | | 517,546 | |
| Infosys, Ltd. | | | 138,964 | | | | 1,284,174 | |
| Tata Consultancy Services, Ltd. | | | 25,429 | | | | 666,633 | |
| Tech Mahindra, Ltd. | | | 46,163 | | | | 464,966 | |
| | | | | | | | 2,933,319 | |
| | | | | | | | | |
| TOTAL INFORMATION TECHNOLOGY | | | | | | | 2,933,319 | |
| | | | | | | | | |
| Materials (10.41%) | | | | | | | | |
| Chemicals (3.26%) | | | | | | | | |
| Berger Paints India, Ltd. | | | 65,249 | | | | 246,960 | |
| Bodal Chemicals, Ltd. | | | 90,149 | | | | 141,921 | |
| Gulf Oil Lubricants India, Ltd. | | | 12,781 | | | | 122,856 | |
| SH Kelkar & Co., Ltd.(b)(c) | | | 55,673 | | | | 126,853 | |
| Supreme Industries, Ltd. | | | 4,938 | | | | 65,844 | |
| | | | | | | | 704,434 | |
| | | | | | | | | |
| Construction Materials (5.11%) | | | | | | | | |
| Century Textiles & Industries, Ltd. | | | 13,545 | | | | 150,995 | |
| Dalmia Bharat, Ltd.(a) | | | 7,762 | | | | 220,685 | |
| JK Cement, Ltd. | | | 22,679 | | | | 206,573 | |
| Ramco Cements, Ltd. | | | 39,685 | | | | 322,394 | |
| Shree Cement, Ltd. | | | 1,075 | | | | 202,882 | |
| | | | | | | | 1,103,529 | |
| | | | | | | | | |
| Metals & Mining (2.04%) | | | | | | | | |
| Jindal Steel & Power, Ltd.(a) | | | 80,850 | | | | 187,462 | |
| Vedanta, Ltd. | | | 88,611 | | | | 253,531 | |
| | | | | | | | 440,993 | |
| TOTAL MATERIALS | | | | | | | 2,248,956 | |
| | | Shares | | | Value (Note 2) | |
| Real Estate (0.79%) | | | | | | | | |
| Real Estate Management & Development (0.79%) | | | | | | | | |
| Brigade Enterprises, Ltd. | | | 78,882 | | | $ | 170,566 | |
| | | | | | | | | |
| TOTAL REAL ESTATE | | | | | | | 170,566 | |
| | | | | | | | | |
| TOTAL COMMON STOCKS | | | | | | | | |
| (Cost $20,590,756) | | | | | | | 20,837,760 | |
| | | | | | | | | |
| TOTAL INVESTMENTS (96.47%) | | | | | | | | |
| (Cost $20,590,756) | | | | | | $ | 20,837,760 | |
| | | | | | | | | |
| Other Assets In Excess Of Liabilities (3.53%) | | | | | | �� | 762,228 | |
| | | | | | | | | |
| NET ASSETS (100.00%) | | | | | | $ | 21,599,988 | |
| (a) | Non-Income Producing Security. |
| (b) | Security exempt from registration under Rule 144A of the Securities Act of 1933. This security may be resold in transactions exempt from registration, normally to qualified institutional buyers. As of October 31, 2018, the aggregate market value of those securities was $1,110,036, representing 5.14% of net assets. |
| (c) | Securities were purchased pursuant to Regulation S under the Securities Act of 1933, which exempts securities offered and sold outside of the United States from registration. Such securities cannot be sold in the United States without either an effective registration statement filed pursuant to the Securities Act of 1933, or pursuant to an exemption from registration. These securities have been deemed liquid under guidelines approved by the Fund’s Board of Trustees. As of October 31, 2018 the aggregate market value of those securities was $1,110,036 representing 5.14% of net assets. |
For Fund compliance purposes, the Fund’s industry classifications refer to any one or more of the industry sub-classifications used by one or more widely recognized market indexes or ratings group indexes, and/or as defined by Fund management. This definition may not apply for purposes of this report, which may combine industry sub-classifications for reporting ease. Industries are shown as a percent of net assets.
See Notes to Financial Statements.
ALPS | Kotak India Growth Fund
| Consolidated Statement of Assets and Liabilities | October 31, 2018 |
| ASSETS | | | |
| Investments, at value | | $ | 20,837,760 | |
| Cash | | | 449,672 | |
| Foreign currency, at value (Cost $306,948) | | | 305,206 | |
| Receivable for investments sold | | | 34,049 | |
| Receivable for shares sold | | | 11,669 | |
| Dividends receivable | | | 1,735 | |
| Receivable due from advisor | | | 12,212 | |
| Income tax receivable | | | 4,072 | |
| Prepaid expenses and other assets | | | 14,338 | |
| Total Assets | | | 21,670,713 | |
| LIABILITIES | | | | |
| Payable for investments purchased | | | 11,629 | |
| Payable for shares redeemed | | | 774 | |
| Administration and transfer agency fees payable | | | 27,822 | |
| Distribution and services fees payable | | | 5,650 | |
| Trustees' fees and expenses payable | | | 2,000 | |
| Professional fees payable | | | 10,929 | |
| Accrued expenses and other liabilities | | | 11,921 | |
| Total Liabilities | | | 70,725 | |
| NET ASSETS | | $ | 21,599,988 | |
| NET ASSETS CONSIST OF | | | | |
| Paid-in capital | | $ | 20,407,432 | |
| Total distributable earnings | | | 1,192,556 | |
| NET ASSETS | | $ | 21,599,988 | |
| INVESTMENTS, AT COST | | $ | 20,590,756 | |
| PRICING OF SHARES | | | | |
| Investor Class: | | | | |
| Net Asset Value, offering and redemption price per share | | $ | 11.73 | |
| Net Assets | | $ | 5,821,129 | |
| Shares of beneficial interest outstanding (unlimited number of shares, no par value common stock authorized) | | | 496,259 | |
| Class A: | | | | |
| Net Asset Value, offering and redemption price per share | | $ | 11.72 | |
| Net Assets | | $ | 8,432 | |
| Shares of beneficial interest outstanding (unlimited number of shares, no par value common stock authorized) | | | 720 | |
| Maximum offering price per share ((NAV/0.9450), based on maximum sales charge of 5.50% of the offering price) | | $ | 12.40 | |
| Class C: | | | | |
| Net Asset Value, offering and redemption price per share(a) | | $ | 11.10 | |
| Net Assets | | $ | 2,023,991 | |
| Shares of beneficial interest outstanding (unlimited number of shares, no par value common stock authorized) | | | 182,268 | |
| Class I: | | | | |
| Net Asset Value, offering and redemption price per share | | $ | 12.05 | |
| Net Assets | | $ | 13,746,436 | |
| Shares of beneficial interest outstanding (unlimited number of shares, no par value common stock authorized) | | | 1,140,414 | |
| (a) | Redemption price per share may be reduced for any applicable contingent deferred sales charge. For a description of a possible sales charge, please see the Fund's Prospectus. |
See Notes to Financial Statements.
ALPS | Kotak India Growth Fund
| Consolidated Statement of Operations | For the Year Ended October 31, 2018 |
| INVESTMENT INCOME | | | |
| Dividends | | $ | 313,380 | |
| Total Investment Income | | | 313,380 | |
| | | | | |
| EXPENSES | | | | |
| Investment advisory fees | | | 381,109 | |
| Administrative fees | | | 144,835 | |
| Transfer agency fees | | | 4,217 | |
| Distribution and service fees | | | | |
| Investor Class(a) | | | 28,488 | |
| Class A(b) | | | 15 | |
| Class C | | | 22,650 | |
| Professional fees | | | 45,268 | |
| Reports to shareholders and printing fees | | | 8,863 | |
| State registration fees | | | 51,518 | |
| Insurance fees | | | 241 | |
| Franchise tax expenses | | | 7,371 | |
| Custody fees | | | 76,264 | |
| Trustees' fees and expenses | | | 4,737 | |
| Miscellaneous expenses | | | 30,415 | |
| Total Expenses | | | 805,991 | |
| Less fees waived/reimbursed by investment advisor (Note 8) | | | | |
| Investor Class(a) | | | (75,758 | ) |
| Class A(b) | | | (42 | ) |
| Class C | | | (20,620 | ) |
| Class I | | | (171,092 | ) |
| Net Expenses | | | 538,479 | |
| Net Investment Loss | | | (225,099 | ) |
| Net realized gain on investments | | | 1,510,941 | |
| Net realized loss on foreign currency transactions | | | (93,791 | ) |
| Net Realized Gain | | | 1,417,150 | |
| Net change in unrealized depreciation on investments | | | (6,041,317 | ) |
| Net change in unrealized depreciation on translation of assets and liabilities denominated in foreign currencies | | | (2,018 | ) |
| Net change in unrealized foreign capital gains tax | | | 139,702 | |
| Net Change in Unrealized Depreciation | | | (5,903,633 | ) |
| NET REALIZED AND UNREALIZED LOSS ON INVESTMENTS | | | (4,486,483 | ) |
| NET DECREASE IN NET ASSETS RESULTING FROM OPERATIONS | | $ | (4,711,582 | ) |
| (a) | Prior to December 1, 2017, Investor Class was known as Class A. |
| (b) | Class A commenced operations on June 12, 2018. |
See Notes to Financial Statements.
ALPS | Kotak India Growth Fund
Consolidated Statements of Changes in Net Assets
| | | For the Year Ended October 31, 2018 | | | For the Year Ended October 31, 2017 | |
| OPERATIONS | | | | | | |
| Net investment loss | | $ | (225,099 | ) | | $ | (156,007 | ) |
| Net realized gain | | | 1,417,150 | | | | 959,177 | |
| Net change in unrealized appreciation/(depreciation) | | | (5,903,633 | ) | | | 4,023,798 | |
| Net Increase/(Decrease) in Net Assets Resulting from Operations | | | (4,711,582 | ) | | | 4,826,968 | |
| | | | | | | | | |
| TOTAL DISTRIBUTIONS(a) | | | | | | | | |
| From distributable earnings | | | | | | | | |
| Investor Class(b) | | | (271,374 | ) | | | (64,593 | ) |
| Class C | | | (64,292 | ) | | | (23,697 | ) |
| Class I | | | (548,207 | ) | | | (115,109 | ) |
| Net Decrease in Net Assets from Distributions | | | (883,873 | ) | | | (203,399 | ) |
| | | | | | | | | |
| BENEFICIAL INTEREST TRANSACTIONS (NOTE 6) | | | | | | | | |
| Shares sold | | | | | | | | |
| Investor Class(b) | | | 1,570,314 | | | | 5,923,581 | |
| Class A(c) | | | 10,000 | | | | – | |
| Class C | | | 488,963 | | | | 216,603 | |
| Class I | | | 6,764,498 | | | | 10,516,245 | |
| Dividends reinvested | | | | | | | | |
| Investor Class(b) | | | 241,801 | | | | 51,962 | |
| Class C | | | 63,360 | | | | 23,372 | |
| Class I | | | 486,210 | | | | 103,156 | |
| Shares redeemed, net of redemption fees | | | | | | | | |
| Investor Class(b) | | | (3,961,693 | ) | | | (3,510,751 | ) |
| Class C | | | (170,932 | ) | | | (350,672 | ) |
| Class I | | | (9,865,999 | ) | | | (3,497,829 | ) |
| Net Increase/(Decrease) in Net Assets Derived from Beneficial Interest Transactions | | | (4,373,478 | ) | | | 9,475,667 | |
| | | | | | | | | |
| Net increase/(decrease) in net assets | | | (9,968,933 | ) | | | 14,099,236 | |
| | | | | | | | | |
| NET ASSETS | | | | | | | | |
| Beginning of year | | | 31,568,921 | | | | 17,469,685 | |
| End of year | | $ | 21,599,988 | | | $ | 31,568,921 | (d) |
| (a) | For the prior year ended October 31, 2017, Total Distributions consisted of Net Investment Income $–, and Net Realized Gains $203,399. |
| (b) | Prior to December 1, 2017, Investor Class was known as Class A. |
| (c) | Class A commenced operations on June 12, 2018. |
| (d) | For the year ended October 31, 2017, including accumulated net investment loss of $(212,659). |
See Notes to Financial Statements.
ALPS | Kotak India Growth Fund – Investor Class
Consolidated Financial Highlights
Selected data for a share of beneficial interest outstanding throughout the periods indicated:
| | | For the Year Ended October 31, 2018(a) | | For the Year Ended October 31, 2017 | | For the Year Ended October 31, 2016 | | For the Year Ended October 31, 2015 | | For the Fiscal Period Ended October 31, 2014(b) | | For the Year Ended April 30, 2014 | |
| Net asset value, beginning of period(c) | | $ | 14.53 | | $ | 12.32 | | $ | 12.57 | | $ | 13.20 | | $ | 9.99 | | $ | 9.47 | |
| INCOME/(LOSS) FROM INVESTMENT OPERATIONS: | | | | | | | | | | | | | |
| Net investment income/(loss)(d) | | | (0.13 | ) | | (0.10 | ) | | (0.09 | ) | | (0.14 | ) | | 0.01 | | | (0.02 | ) |
| Net realized and unrealized gain/(loss) | | | (2.26 | ) | | 2.45 | | | 1.45 | | | 0.06 | | | 3.20 | | | 0.54 | |
| Total from investment operations | | | (2.39 | ) | | 2.35 | | | 1.36 | | | (0.08 | ) | | 3.21 | | | 0.52 | |
| DISTRIBUTIONS: | | | | | | | | | | | | | | | | | | | |
| From net investment income | | | – | | | – | | | – | | | (0.17 | ) | | – | | | – | |
| From net realized gains | | | (0.41 | ) | | (0.14 | ) | | (1.61 | ) | | (0.38 | ) | | – | | | – | |
| Total distributions | | | (0.41 | ) | | (0.14 | ) | | (1.61 | ) | | (0.55 | ) | | – | | | – | |
| REDEMPTION FEES ADDED TO PAID-IN CAPITAL (NOTE 6) | | | 0.00 | (e) | | 0.00 | (e) | | 0.00 | (e) | | 0.00 | (e) | | 0.00 | (e) | | 0.00 | (e) |
| Net increase/(decrease) in net asset value | | | (2.80 | ) | | 2.21 | | | (0.25 | ) | | (0.63 | ) | | 3.21 | | | 0.52 | |
| Net asset value, end of year | | $ | 11.73 | | $ | 14.53 | | $ | 12.32 | | $ | 12.57 | | $ | 13.20 | | $ | 9.99 | |
| TOTAL RETURN(f) | | | (16.91 | )% | | 19.45 | % | | 13.31 | % | | (0.65 | )% | | 32.13 | % | | 5.49 | % |
| RATIOS/SUPPLEMENTAL DATA: | | | | | | | | | | | | | | | | | | | |
| Net assets, end of year (000s) | | $ | 5,821 | | $ | 9,538 | | $ | 5,772 | | $ | 5,906 | | $ | 5,536 | | $ | 5,211 | |
| Ratio of expenses to average net assets excluding fee waivers and reimbursements | | | 2.80 | % | | 2.95 | % | | 3.83 | % | | 3.51 | % | | 4.92 | %(g) | | 6.51 | % |
| Ratio of expenses to average net assets including fee waivers and reimbursements | | | 1.93 | % | | 1.90 | % | | 1.90 | % | | 1.96 | % | | 1.90 | %(g) | | 1.88 | % |
| Ratio of net investment income/(loss) to average net assets | | | (0.91 | )% | | (0.74 | )% | | (0.86 | )% | | (1.03 | )% | | 0.19 | %(g) | | (0.27 | )% |
| Portfolio turnover rate(h) | | | 24 | % | | 30 | % | | 23 | % | | 58 | % | | 28 | % | | 65 | % |
| (a) | Prior to December 1, 2017, Investor Class was known as Class A. |
| (b) | Effective May 1, 2014, the Board approved changing the fiscal year-end of the Funds from April 30 to October 31. |
| (c) | Per share amounts and ratios to average net assets include income and expenses of the Kotak Mauritius Portfolio (wholly-owned subsidiary). |
| (d) | Calculated using the average shares method. |
| (e) | Less than $0.005 or ($0.005) per share. |
| (f) | Total returns are for the period indicated and have not been annualized. Total returns would have been lower had certain expenses not been waived during the period. Returns shown do not reflect the deduction of taxes that a shareholder would pay on Fund distributions or the redemption of Fund shares. Returns shown exclude any applicable sales charges. |
| (h) | Portfolio turnover rate for periods less than one full year have not been annualized. |
See Notes to Financial Statements.
ALPS | Kotak India Growth Fund – Class A
Consolidated Financial Highlights
Selected data for a share of beneficial interest outstanding throughout the periods indicated:
| | | For the Period June 12, 2018 (Commencement) to October 31, 2018 | |
| Net asset value, beginning of period | | $ | 13.90 | |
| | | | | |
| INCOME FROM INVESTMENT OPERATIONS: | | | | |
| Net investment loss(a) | | | (0.04 | ) |
| Net realized and unrealized loss | | | (2.14 | ) |
| Total from investment operations | | | (2.18 | ) |
| | | | | |
| Net (decrease) in net asset value | | | (2.18 | ) |
| Net asset value, end of year | | $ | 11.72 | |
| TOTAL RETURN(b) | | | (15.68 | )% |
| | | | | |
| RATIOS/SUPPLEMENTAL DATA: | | | | |
| Net assets, end of year (000s) | | $ | 8 | |
| Ratio of expenses to average net assets excluding fee waivers and reimbursements | | | 3.16 | %(c) |
| Ratio of expenses to average net assets including fee waivers and reimbursements | | | 2.00 | %(c) |
| Ratio of net investment loss to average net assets | | | (0.79 | %)(c) |
| Portfolio turnover rate(d) | | | 24 | % |
| (a) | Calculated using the average shares method. |
| (b) | Total returns are for the period indicated and have not been annualized. Total returns would have been lower had certain expenses not been waived during the period. Returns shown do not reflect the deduction of taxes that a shareholder would pay on Fund distributions or the redemption of Fund shares. |
| (d) | Portfolio turnover rate for periods less than one full year have not been annualized. |
See Notes to Financial Statements.
ALPS | Kotak India Growth Fund – Class C
Consolidated Financial Highlights
Selected data for a share of beneficial interest outstanding throughout the periods indicated:
| | | For the Year Ended October 31, 2018 | | For the Year Ended October 31, 2017 | | For the Year Ended October 31, 2016 | | For the Year Ended October 31, 2015 | | For the Fiscal Period Ended October 31, 2014(a) | | For the Year Ended April 30, 2014 | |
| Net asset value, beginning of��period(b) | | $ | 13.87 | | $ | 11.85 | | $ | 12.23 | | $ | 12.88 | | $ | 9.77 | | $ | 9.34 | |
| INCOME/(LOSS) FROM INVESTMENT OPERATIONS: | | | | | | | | | | | | | |
| Net investment loss(c) | | | (0.21 | ) | | (0.18 | ) | | (0.16 | ) | | (0.21 | ) | | (0.03 | ) | | (0.09 | ) |
| Net realized and unrealized gain/(loss) | | | (2.15 | ) | | 2.34 | | | 1.39 | | | 0.05 | | | 3.14 | | | 0.52 | |
| Total from investment operations | | | (2.36 | ) | | 2.16 | | | 1.23 | | | (0.16 | ) | | 3.11 | | | 0.43 | |
| DISTRIBUTIONS: | | | | | | | | | | | | | | | | | | | |
| From net investment income | | | – | | | – | | | – | | | (0.11 | ) | | – | | | – | |
| From net realized gains | | | (0.41 | ) | | (0.14 | ) | | (1.61 | ) | | (0.38 | ) | | – | | | – | |
| Total distributions | | | (0.41 | ) | | (0.14 | ) | | (1.61 | ) | | (0.49 | ) | | – | | | – | |
| REDEMPTION FEES ADDED TO PAID-IN CAPITAL (NOTE 6) | | | – | | | – | | | 0.00 | (d) | | – | | | 0.00 | (d) | | – | |
| Net increase/(decrease) in net asset value | | | (2.77 | ) | | 2.02 | | | (0.38 | ) | | (0.65 | ) | | 3.11 | | | 0.43 | |
| Net asset value, end of year | | $ | 11.10 | | $ | 13.87 | | $ | 11.85 | | $ | 12.23 | | $ | 12.88 | | $ | 9.77 | |
| TOTAL RETURN(e) | | | (17.52 | )% | | 18.60 | % | | 12.51 | % | | (1.34 | )% | | 31.83 | % | | 4.60 | % |
| RATIOS/SUPPLEMENTAL DATA: | | | | | | | | | | | | | | | | | | | |
| Net assets, end of year (000s) | | $ | 2,024 | | $ | 2,140 | | $ | 1,925 | | $ | 1,965 | | $ | 1,497 | | $ | 875 | |
| Ratio of expenses to average net assets excluding fee waivers and reimbursements | | | 3.51 | % | | 3.69 | % | | 4.54 | % | | 4.11 | % | | 5.57 | %(f) | | 7.26 | % |
| Ratio of expenses to average net assets including fee waivers and reimbursements | | | 2.60 | % | | 2.60 | % | | 2.60 | % | | 2.60 | % | | 2.60 | %(f) | | 2.60 | % |
| Ratio of net investment loss to average net assets | | | (1.57 | )% | | (1.48 | )% | | (1.56 | )% | | (1.67 | )% | | (0.50 | )%(f) | | (1.00 | )% |
| Portfolio turnover rate(g) | | | 24 | % | | 30 | % | | 23 | % | | 58 | % | | 28 | % | | 65 | % |
| (a) | Effective May 1, 2014, the Board approved changing the fiscal year-end of the Funds from April 30 to October 31. |
| (b) | Per share amounts and ratios to average net assets include income and expenses of the Kotak Mauritius Portfolio (wholly-owned subsidiary). |
| (c) | Calculated using the average shares method. |
| (d) | Less than $0.005 or ($0.005) per share. |
| (e) | Total returns are for the period indicated and have not been annualized. Total returns would have been lower had certain expenses not been waived during the period. Returns shown do not reflect the deduction of taxes that a shareholder would pay on Fund distributions or the redemption of Fund shares. Returns shown exclude any applicable sales charges. |
| (g) | Portfolio turnover rate for periods less than one full year have not been annualized. |
See Notes to Financial Statements.
ALPS | Kotak India Growth Fund – Class I
Consolidated Financial Highlights
Selected data for a share of beneficial interest outstanding throughout the periods indicated:
| | | For the Year Ended October 31, 2018 | | For the Year Ended October 31, 2017 | | For the Year Ended October 31, 2016 | | For the Year Ended October 31, 2015 | | For the Fiscal Period Ended October 31, 2014(a) | | For the Year Ended April 30, 2014 | |
| Net asset value, beginning of period(b) | | $ | 14.87 | | $ | 12.58 | | $ | 12.76 | | $ | 13.29 | | $ | 10.04 | | $ | 9.55 | |
| INCOME/(LOSS) FROM INVESTMENT OPERATIONS: | | | | | | | | | | | | | | | | | | | |
| Net investment income/(loss)(c) | | | (0.08 | ) | | (0.06 | ) | | (0.06 | ) | | (0.09 | ) | | 0.03 | | | 0.00 | (d) |
| Net realized and unrealized gain/(loss) | | | (2.33 | ) | | 2.48 | | | 1.49 | | | 0.06 | | | 3.22 | | | 0.54 | |
| Total from investment operations | | | (2.41 | ) | | 2.42 | | | 1.43 | | | (0.03 | ) | | 3.25 | | | 0.54 | |
| DISTRIBUTIONS: | | | | | | | | | | | | | | | | | | | |
| From net investment income | | | – | | | – | | | – | | | (0.13 | ) | | – | | | (0.05 | ) |
| From net realized gains | | | (0.41 | ) | | (0.14 | ) | | (1.61 | ) | | (0.38 | ) | | – | | | – | |
| Total distributions | | | (0.41 | ) | | (0.14 | ) | | (1.61 | ) | | (0.51 | ) | | – | | | (0.05 | ) |
| REDEMPTION FEES ADDED TO PAID-IN CAPITAL (NOTE 6) | | | 0.00 | (d) | | 0.01 | | | 0.00 | (d) | | 0.01 | | | 0.00 | (d) | | – | |
| Net increase/(decrease) in net asset value | | | (2.82 | ) | | 2.29 | | | (0.18 | ) | | (0.53 | ) | | 3.25 | | | 0.49 | |
| Net asset value, end of year | | $ | 12.05 | | $ | 14.87 | | $ | 12.58 | | $ | 12.76 | | $ | 13.29 | | $ | 10.04 | |
| TOTAL RETURN(e) | | | (16.66 | )% | | 19.68 | % | | 13.70 | % | | (0.23 | )% | | 32.37 | % | | 5.70 | % |
| RATIOS/SUPPLEMENTAL DATA: | | | | | | | | | | | | | | | | | | | |
| Net assets, end of year (000s) | | $ | 13,746 | | $ | 19,891 | | $ | 9,772 | | $ | 8,567 | | $ | 8,955 | | $ | 1,945 | |
| Ratio of expenses to average net assets excluding fee waivers and reimbursements | | | 2.48 | % | | 2.65 | % | | 3.54 | % | | 3.10 | % | | 4.49 | %(f) | | 6.28 | % |
| Ratio of expenses to average net assets including fee waivers and reimbursements | | | 1.60 | % | | 1.60 | % | | 1.60 | % | | 1.60 | % | | 1.60 | %(f) | | 1.60 | % |
| Ratio of net investment income/(loss) to average net assets | | | (0.57 | )% | | (0.45 | )% | | (0.56 | )% | | (0.67 | )% | | 0.50 | %(f) | | 0.00 | %(g) |
| Portfolio turnover rate(h) | | | 24 | % | | 30 | % | | 23 | % | | 58 | % | | 28 | % | | 65 | % |
| (a) | Effective May 1, 2014, the Board approved changing the fiscal year-end of the Funds from April 30 to October 31. |
| (b) | Per share amounts and ratios to average net assets include income and expenses of the Kotak Mauritius Portfolio (wholly-owned subsidiary). |
| (c) | Calculated using the average shares method. |
| (d) | Less than $0.005 or ($0.005) per share. |
| (e) | Total returns are for the period indicated and have not been annualized. Total returns would have been lower had certain expenses not been waived during the period. Returns shown do not reflect the deduction of taxes that a shareholder would pay on Fund distributions or the redemption of Fund shares. |
| (g) | Less than 0.005% or (0.005)% |
| (h) | Portfolio turnover rate for periods less than one full year have not been annualized. |
See Notes to Financial Statements.
ALPS | Smith Funds
| Management Commentary | October 31, 2018 (Unaudited) |
Dear Shareholder,
The ALPS l Smith Capital Investors Funds were launched on June 29, 2018, and this is the first annual report for the Funds. We welcome you as a shareholder to the Funds and thank you for your trust. Our process is centered around performance, relationships and investing excellence. Our ultimate goal is to provide shareholders with a consistent, risk-adjusted return with a keen focus on capital preservation.
Performance Commentary as of 10/31/18
Since June 29, 2018, the Fund’s inception, the ALPS l Smith Capital Investors Total Return Bond Fund Class I outperformed the Bloomberg Barclays US Aggregate Index by 1.86%, despite a modest increase in US Treasury rates including 34 basis points (“bps”) for the 2-year US Treasury, 24 bps for the 5-year US Treasury, 27 bps for the 10-year US Treasury, and 40 bps for 30-year US Treasury. This was offset by only a slight 5 bps tightening in credit spreads in the Investment Grade Corporate Index. The Bloomberg Barclays US Aggregate Index performance during the period was -0.77% versus the Fund’s return of 1.09%. The Fund’s outperformance was driven by a defensive duration positioning and reduced exposure to long credit.
Since June 29, 2018, the Fund’s inception, the ALPS l Smith Capital Investors Short Duration Fund Class I outperformed the Bloomberg Barclays 1-3-year US Government/Credit Index by 0.06%. During the period, short-term interest rates continued to move higher as the Federal Reserve hiked the Fed Funds rate 25 bps in September. The Bloomberg Barclays 1-3-Year US Government Credit Index performance during the period was 0.44% versus the Fund’s return of 0.50%. The Fund’s outperformance was driven by increased yield from the new interest rate environment and relative stability of short duration credit. The Fund’s performance was also bolstered by a shorter duration position, an allocation to very short duration high yield, and select structured product exposure.
Portfolio Positioning
Going forward we are defensive in regard to credit valuation and allocations relying on our bottom-up, fundamental credit analysis to drive security selection. Within the securitized allocations in the portfolio, we continue to focus on efficient positioning, including issues that have less extension risk and better convexity. We foresee continued volatility in interest rates and will actively manage the duration risk in the funds with a keen focus on key rate durations.
Macro Commentary:
The US macro landscape remains strong with 3Q 2018 GDP beating estimates at 3.5% vs. 3.3% consensus and on the heels of a 4.5% gain in 2Q 2018. Additionally, the consumer continued to show strength, marking a 3.6% gain in 3Q vs. a 3.8% gain in 2Q. The employment situation also remains foundationally strong with the unemployment rate at 3.7% (as of October 2018) and wages registering 3.1% year over year. Inflation is right at the Federal Reserve’s 2% target via a wide array of measures. Inflation expectations remain extremely stable though we are starting to see inflation, especially wages, edge higher. Housing is weakening due to
a combination of higher mortgage rates and a decrease in affordability. Regional manufacturing surveys are mixed and registering volatility from global trade negotiations and global headlines. Though global headlines continue to emerge, leading economic indicators, the health of the consumer, and consumer confidence all remain at elevated levels. The fundamentals of the economy are strong and the foundations of inflation are building. The removal of liquidity from the system as the Federal Reserve continues the process of unwinding its unconventional policy position could have dramatic effects on the long-term trajectory of growth and inflation. The policy unwind could also spill into other segments of the markets.
Thank you for the confidence you have placed with us as shareholders of the Funds. We look forward to continuing to build our relationship with you and serving as an investment manager to meet your income needs.
Sincerely,

R. Gibson Smith
Founder, Smith Capital Investors, LLC
Past performance is no guarantee of future results. Dividends are not guaranteed and are subject to change or elimination. Investments in international and emerging markets securities include exposure to risks such as currency fluctuations, foreign taxes and regulations, and the potential for illiquid markets and political instability.
The views of the author and information discussed in this commentary are as of the date of publication, are subject to change, and may not reflect the writer's current views. The views expressed are those of the author only, and represent an assessment of market conditions at a specific point in time, are opinions only and should not be relied upon as investment advice regarding a particular investment or markets in general. Such information does not constitute a recommendation to buy or sell specific securities or investment vehicles. It should not be assumed that any investment will be profitable or will equal the performance of the fund(s) or any securities or any sectors mentioned in this letter. The subject matter contained in this letter has been derived from several sources believed to be reliable and accurate at the time of compilation. Neither ALPS Advisors, Inc., Smith Capital Investors, LLC, nor the Funds accepts any liability for losses either direct or consequential caused by the use of this information.
Indices do not reflect deductions for fees, expenses, or taxes.
An investor may not invest directly in an index.
Diversification cannot guarantee gain or prevent losses.
ALPS | Smith Short Duration Bond Fund
| Performance Update | October 31, 2018 (Unaudited) |
Performance of $10,000 Initial Investment (as of October 31, 2018)
Comparison of change in value of a $10,000 investment
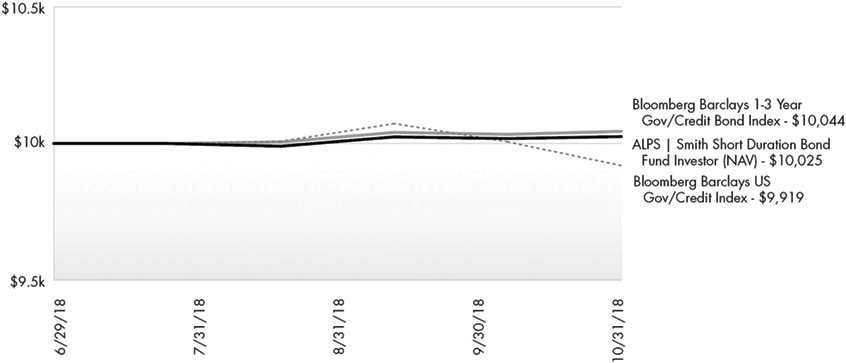
The chart above represents historical performance of a hypothetical investment of $10,000 in the Fund since inception. Past performance does not guarantee future results. This chart does not reflect the deduction of taxes that a shareholder would pay on Fund distributions or the redemption of Fund shares.
Average Annual Total Returns (as of October 31, 2018)
| | 3 Month | Since Inception^ | Total Expense Ratio | What You Pay* |
| Investor (NAV) | 0.35% | 0.25% | 1.02% | 0.89% |
| Class A (NAV) | 0.27% | 0.27% | 1.02% | 0.89% |
| Class A (MOP) | -5.22% | -5.22% |
| Class C (NAV) | 0.19% | 0.09% | 1.62% | 1.49% |
| Class C (CDSC) | -0.81% | -0.91% |
| Class I | 0.50% | 0.50% | 0.62% | 0.49% |
| Bloomberg Barclays U.S. Government/Credit Bond Index¹ | -0.89% | -0.81% | | |
| Bloomberg Barclays 1-3 Year Government/Credit Bond Index² | 0.39% | 0.44% | | |
Performance data quoted represents past performance. Past performance does not guarantee future results. Investment return and principal value of an investment will fluctuate so that an investor's shares, when sold or redeemed, may be worth more or less than the original cost. Current performance data may be higher or lower than actual data quoted. For the most current month-end performance data, please call 1-866-759-5679.
Maximum Offering Price (MOP) for Class A shares includes the Fund’s maximum sales charge of 5.50%. Performance shown at NAV does not include these sales charges and would have been lower had it been taken into account. If you invest $1 million or more, either as a lump sum or through the Fund’s accumulation or letter of intent programs, you can purchase Class A shares without an initial sales charge (load). A Contingent Deferred Sales Charge (“CDSC”) of 1.00% may apply to Class C shares redeemed within the first 12 months after a purchase, and on Class A shares redeemed within the first 18 months after a purchase in excess of $1 million. The Fund imposes a 2.00% redemption fee on shares held for less than 90 days.
Performance less than 1 year is cumulative.
ALPS | Smith Short Duration Bond Fund
| Performance Update | October 31, 2018 (Unaudited) |
| 1 | The Barclays U.S. Government/Credit Bond Index is a Unmanaged Index that tracks the performance of US Government and corporate bonds rated investment grade or better, with maturities of at least one year |
| 2 | Bloomberg Barclays 1-3 Year Gov/Credit Bond Index is a unmanaged index which is a component of the US Government/Credit Bond Index, which includes Treasury and agency securities (US Government Bond Index) and publicly issued US corporate and foreign debentures and secured notes (US Credit Bond Index). The bonds in the index are investment grade with a maturity between one and three years. |
| ^ | Fund Inception date of June 29, 2018. |
| * | What You Pay reflects the Advisor’s decision to contractually limit expenses through February 28, 2020. Please see the prospectus for additional information. |
The table does not reflect the deduction of taxes that a shareholder would pay on Fund distributions or the redemption of Fund shares.
This Fund is not suitable for all investors, and is subject to investment risks, including possible loss of the principal amount invested.
There is no guarantee that the Fund will continue to hold any one particular security or stay invested in any one particular company. The composition of the Fund's top holdings is subject to change. Performance figures are historical and reflect the change in share price, reinvested distributions, changes in net asset value, sales charges and capital gains distributions, if any.
Not FDIC Insured – No Bank Guarantee – May Lose Value
Asset Type Allocation (as a % of Net Assets) †
| Government Bond | 52.90% |
| Corporate Bond | 42.38% |
| Collateralized Mortgage Obligations | 1.47% |
| Mortgage-Backed Securities | 0.34% |
| Municipal Bond | 0.24% |
| Cash, Cash Equivalents and Other Net Assets | 2.67% |
| Total | 100.00% |
| † | Holdings are subject to change, and may not reflect the current or future position of the portfolio. Table presents approximate values only. |
Industry Sector Allocation (as a % of Net Assets)
| Soveriegn | 52.90% |
| Banks | 10.45% |
| Diversified Financial Services | 4.32% |
| Pharmaceuticals | 3.76% |
| Media | 3.43% |
| Auto Manufacturers | 3.19% |
| Pipelines | 3.09% |
| Oil & Gas | 2.14% |
| Healththcare- Services | 2.09% |
| Aerospace/Defense | 2.02% |
| Food | 1.83% |
| Mortgage Securities | 1.81% |
| Telecommunications | 1.27% |
| Computers | 1.05% |
| Electric | 1.04% |
| Lodging | 1.01% |
| Chemicals | 0.69% |
| Semiconducters | 0.68% |
| Auto Parts & Equipment | 0.32% |
| States & Territories | 0.24% |
| Cash, Cash Equivalents and Other Nets Assets | 2.67% |
| Total | 100.00% |
ALPS | Smith Total Return Bond Fund
| Performance Update | October 31, 2018 (Unaudited) |
Performance of $10,000 Initial Investment (as of October 31, 2018)
Comparison of change in value of a $10,000 investment
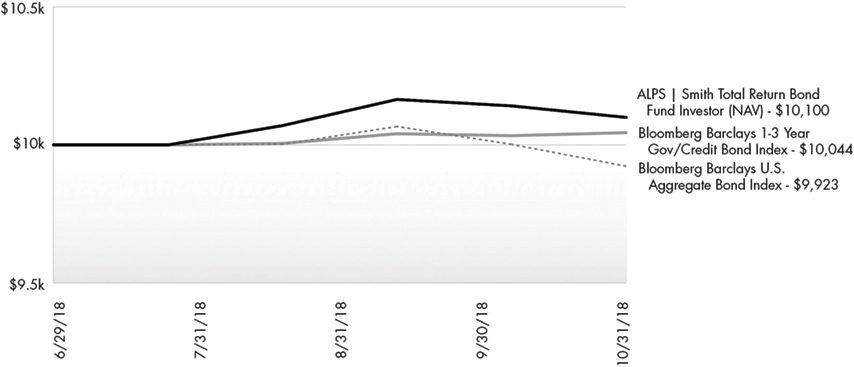
The chart above represents historical performance of a hypothetical investment of $10,000 in the Fund since inception. Past performance does not guarantee future results. This chart does not reflect the deduction of taxes that a shareholder would pay on Fund distributions or the redemption of Fund shares.
Average Annual Total Returns (as of October 31, 2018)
| | 3 Month | Since Inception^ | Total Expense Ratio | What You Pay* |
| Investor (NAV) | 0.29% | 1.00% | 1.20% | 1.07% |
| Class A (NAV) | 0.33% | 1.04% | 1.20% | 1.07% |
| Class A (MOP) | -5.22% | -4.50% |
| Class C (NAV) | 0.19% | 0.79% | 1.80% | 1.67% |
| Class C (CDSC) | -0.81% | -0.21% |
| Class I | 0.39% | 1.09% | 0.80% | 0.67% |
| Bloomberg Barclays U.S. Aggregate Bond Index¹ | -0.79% | -0.77% | | |
| Bloomberg Barclays 1-3 Year Government/Credit Bond Index² | 0.39% | 0.44% | | |
Performance data quoted represents past performance. Past performance does not guarantee future results. Investment return and principal value of an investment will fluctuate so that an investor's shares, when sold or redeemed, may be worth more or less than the original cost. Current performance data may be higher or lower than actual data quoted. For the most current month-end performance data, please call 1-866-759-5679.
Maximum Offering Price (MOP) for Class A shares includes the Fund’s maximum sales charge of 5.50%. Performance shown at NAV does not include these sales charges and would have been lower had it been taken into account. If you invest $1 million or more, either as a lump sum or through the Fund’s accumulation or letter of intent programs, you can purchase Class A shares without an initial sales charge (load). A Contingent Deferred Sales Charge (“CDSC”) of 1.00% may apply to Class C shares redeemed within the first 12 months after a purchase, and on Class A shares redeemed within the first 18 months after a purchase in excess of $1 million. The Fund imposes a 2.00% redemption fee on shares held for less than 90 days.
Performance less than 1 year is cumulative.
ALPS | Smith Total Return Bond Fund
| Performance Update | October 31, 2018 (Unaudited) |
| 1 | The Barclays U.S. Aggregate Bond Index is a broad-based benchmark that measures the investment grade, U.S. dollar-denominated, fixed-rate taxable bond market, including Treasuries, government-related and corporate securities, MBS (agency fixed-rate and hybrid ARM passthroughs), ABS, and CMBS. The index is not actively managed and does not reflect any deductions for fees, expenses or taxes. An investor may not invest directly in an index. |
| 2 | Bloomberg Barclays 1-3 Year Gov/Credit Bond Index is a unmanaged index which is a component of the US Government/Credit Bond Index, which includes Treasury and agency securities (US Government Bond Index) and publicly issued US corporate and foreign debentures and secured notes (US Credit Bond Index). The bonds in the index are investment grade with a maturity between one and three years. |
| ^ | Fund Inception date of June 29, 2018. |
| * | What You Pay reflects the Advisor’s decision to contractually limit expenses through February 28, 2020. Please see the prospectus for additional information. |
The table does not reflect the deduction of taxes that a shareholder would pay on Fund distributions or the redemption of Fund shares.
This Fund is not suitable for all investors, and is subject to investment risks, including possible loss of the principal amount invested.
There is no guarantee that the Fund will continue to hold any one particular security or stay invested in any one particular company. The composition of the Fund's top holdings is subject to change. Performance figures are historical and reflect the change in share price, reinvested distributions, changes in net asset value, sales charges and capital gains distributions, if any.
Not FDIC Insured – No Bank Guarantee - May Lose Value
Asset Type Allocation (as a % of Net Assets) †
| Government Bond | 40.65% |
| Corporate Bond | 36.21% |
| Collateralized Mortgage Obligations | 19.24% |
| Cash, Cash Equivalents and Other Net Assets | 3.90% |
| Total | 100.00% |
| † | Holdings are subject to change, and may not reflect the current or future position of the portfolio. Table presents approximate values only. |
Industry Sector Allocation (as a % of Net Assets)
| Sovereign | 40.65% |
| Mortgage Securities | 19.24% |
| Banks | 10.57% |
| Diversified Financial Services | 3.47% |
| Healthcare-Services | 2.68% |
| Pharmaceuticals | 2.65% |
| Telecommunications | 2.14% |
| Pipelines | 1.59% |
| Oil&Gas | 1.58% |
| Miscellaneous Manufacturing | 1.49% |
| Media | 1.39% |
| Water | 1.33% |
| Electric | 1.32% |
| Semiconductors | 0.90% |
| Chemicals | 0.90% |
| Retail | 0.83% |
| Auto Manufacturers | 0.82% |
| Food | 0.55% |
| Auto Parts & Equipment | 0.51% |
| Aerospace/Defense | 0.50% |
| Lodging | 0.50% |
| Biotechnology | 0.49% |
| Cash, Cash Equivalents, and Other Net Assets | 3.90% |
| Total | 100.00% |
ALPS | Smith Short Duration Bond Fund
| Statement of Investments | October 31, 2018 |
| | | Principal Amount | | | Value (Note 2) | |
| COLLATERALIZED MORTGAGE OBLIGATIONS (1.47%) | | | | | | | | |
| Fannie Mae | | | | | | | | |
Series 1992-8, Class FA,
1M US L + 0.83%, 01/25/2022(a) | | $ | 3,171 | | | $ | 3,194 | |
Series 1992-73, Class FC,
1M US L + 0.75%, 05/25/2022(a) | | | 5,424 | | | | 5,488 | |
Series 1992-89, Class FB,
1M US L + 0.50%, 06/25/2022(a) | | | 4,099 | | | | 4,110 | |
Series 1993-97, Class FA,
1M US L + 1.25%, 05/25/2023(a) | | | 8,566 | | | | 8,742 | |
Series 1993-189, Class FB,
10Y US TI + -0.65%, 10/25/2023(a) | | | 20,466 | | | | 20,338 | |
Series 1990-8, Class G,
6.000%, 01/25/2020 | | | 8,170 | | | | 8,225 | |
Series 2004-95, Class AK,
5.500%, 01/25/2025 | | | 56,406 | | | | 58,841 | |
Series 2011-66, Class QE,
2.000%, 07/25/2021 | | | 2,225 | | | | 2,198 | |
Series 2010-112, Class GA,
2.000%, 06/25/2021 | | | 39,515 | | | | 39,245 | |
Series 2010-145, Class MA,
2.000%, 12/25/2020 | | | 2,583 | | | | 2,559 | |
| | | | | | | | | |
| Freddie Mac | | | | | | | | |
| Series 1991-1069, Class J, 6.950%, 04/15/2021 | | | 17,713 | | | | 18,270 | |
| Series 1991-1155, Class KZ, 7.000%, 10/15/2021 | | | 25,296 | | | | 26,044 | |
| Series 1993-1584, Class L, 6.500%, 09/15/2023 | | | 11,817 | | | | 12,423 | |
| Series 1989-40, Class F, 10.000%, 05/15/2020 | | | 647 | | | | 650 | |
| Series 2007-3288, Class HB, 4.500%, 03/15/2022 | | | 771 | | | | 772 | |
| | | | | | | | | |
| Ginnie Mae | | | | | | | | |
| Series 2008-46, Class AE, 4.250%, 05/16/2023 | | | 2,842 | | | | 2,844 | |
| | | | | | | | | |
| TOTAL COLLATERALIZED MORTGAGE OBLIGATIONS | |
| (Cost $213,004) | | | | | | | 213,943 | |
| | | | | | | | | |
| MORTGAGE-BACKED SECURITIES (0.34%) | |
| Fannie Mae | | | | | | | | |
Series 2012
2.030%, 08/01/2019 | | | 49,424 | | | | 49,235 | |
| | | | | | | | | |
| TOTAL MORTGAGE-BACKED SECURITIES | |
| (Cost $49,040) | | | | | | | 49,235 | |
| | | Principal Amount | | | Value (Note 2) | |
| CORPORATE BONDS (42.38%) | | | | | | | | |
| Aerospace & Defense (2.02%) | | | | | | | | |
| TransDigm, Inc. | | | | | | | | |
| 5.500%, 10/15/2020 | | $ | 45,000 | | | $ | 45,056 | |
| United Technologies Corp. | | | | | | | | |
| 3.350%, 08/16/2021 | | | 250,000 | | | | 249,095 | |
| Total Aerospace & Defense | | | | | | | 294,151 | |
| Auto Parts Manufacturing (0.32%) | | | | | | | | |
| American Axle & Manufacturing, Inc. | | | | | | | | |
| 7.750%, 11/15/2019 | | | 45,000 | | | | 46,378 | |
| | | | | | | | | |
| Automobiles Manufacturing (3.19%) | | | | | | | | |
| Ford Motor Credit Co. LLC | | | | | | | | |
| 3.813%, 10/12/2021 | | | 200,000 | | | | 195,940 | |
| 3M US L + 1.58%, 01/08/2019(a) | | | 70,000 | | | | 70,141 | |
| Jaguar Land Rover Automotive PLC | | | | | | | | |
| 4.125%, 12/15/2018(b) | | | 200,000 | | | | 199,925 | |
| Total Automobiles Manufacturing | | | | | | | 466,006 | |
| Banks (8.92%) | | | | | | | | |
| Associated Bank NA/Green Bay WI | | | | | | | | |
| 3.500%, 08/13/2021 | | | 350,000 | | | | 347,201 | |
| CIT Group, Inc. | | | | | | | | |
| 5.375%, 05/15/2020 | | | 45,000 | | | | 46,323 | |
| Cooperatieve Rabobank UA | | | | | | | | |
| 3.950%, 11/09/2022 | | | 250,000 | | | | 247,902 | |
| Credit Suisse AG | | | | | | | | |
| 5.400%, 01/14/2020 | | | 100,000 | | | | 102,186 | |
| Discover Bank | | | | | | | | |
| 7.000%, 04/15/2020 | | | 250,000 | | | | 261,237 | |
| SVB Financial Group | | | | | | | | |
| 5.375%, 09/15/2020 | | | 100,000 | | | | 103,300 | |
| Wells Fargo & Co. | | | | | | | | |
| 2.625%, 07/22/2022 | | | 200,000 | | | | 192,160 | |
| Total Banks | | | | | | | 1,300,309 | |
| Cable & Satellite (3.43%) | | | | | | | | |
| Comcast Corp. | | | | | | | | |
| 3M US L + 0.33%, 10/01/2020(a) | | | 200,000 | | | | 200,090 | |
| Sky PLC | | | | | | | | |
| 2.625%, 09/16/2019(b) | | | 200,000 | | | | 198,929 | |
| Time Warner Cable LLC | | | | | | | | |
| 8.750%, 02/14/2019 | | | 100,000 | | | | 101,550 | |
| Total Cable & Satellite | | | | | | | 500,569 | |
| Casinos & Gaming (1.01%) | | | | | | | | |
| MGM Resorts International | | | | | | | | |
| 5.250%, 03/31/2020 | | | 45,000 | | | | 45,675 | |
| 8.625%, 02/01/2019 | | | 100,000 | | | | 101,250 | |
| Total Casinos & Gaming | | | | | | | 146,925 | |
| Chemicals (0.69%) | | | | | | | | |
| International Flavors & Fragrances, Inc. | | | | | | | | |
| 3.400%, 09/25/2020 | | | 100,000 | | | | 99,996 | |
| ALPS | Smith Short Duration Bond Fund | |
| Statement of Investments | October 31, 2018 |
| | | Principal Amount | | | Value (Note 2) | |
| Commercial Finance (0.69%) | | | | | | | | |
| International Lease Finance Corp. | | | | | | | | |
| 5.875%, 04/01/2019 | | $ | 100,000 | | | $ | 101,014 | |
| | | | | | | | | |
| Consumer Finance (0.50%) | | | | | | | | |
| Capital One Bank USA NA | | | | | | | | |
| 8.800%, 07/15/2019 | | | 70,000 | | | | 72,688 | |
| | | | | | | | | |
| Diversified Banks (1.53%) | | | | | | | | |
| Bank of America Corp. Series GMTN | | | | | | | | |
| 3M US L + 0.96%, 07/23/2024(a) | | | 40,000 | | | | 40,027 | |
| JPMorgan Chase & Co. | | | | | | | | |
| 4.950%, 03/25/2020 | | | 179,000 | | | | 183,157 | |
| Total Diversified Banks | | | | | | | 223,184 | |
| Exploration & Production (1.87%) | | | | | | | | |
| Antero Resources Corp. | | | | | | | | |
| 5.375%, 11/01/2021 | | | 100,000 | | | | 100,250 | |
| Encana Corp. | | | | | | | | |
| 6.500%, 05/15/2019 | | | 170,000 | | | | 172,916 | |
| Total Exploration & Production | | | | | | | 273,166 | |
| Financial Services (3.13%) | | | | | | | | |
| Goldman Sachs Group, Inc. Series GMTN | | | | | | | | |
| 5.375%, 03/15/2020 | | | 150,000 | | | | 154,050 | |
| Morgan Stanley Series GMTN | | | | | | | | |
| 5.500%, 01/26/2020 | | | 100,000 | | | | 102,665 | |
| TD Ameritrade Holding Corp. | | | | | | | | |
| 3M US L + 0.43%, 11/01/2021(a) | | | 200,000 | | | | 200,120 | |
| Total Financial Services | | | | | | | 456,835 | |
| Food & Beverage (1.83%) | | | | | | | | |
| Conagra Brands, Inc. | | | | | | | | |
| 3M US L + 0.75%, 10/22/2020(a) | | | 100,000 | | | | 100,084 | |
| Wm Wrigley Jr Co. | | | | | | | | |
| 2.900%, 10/21/2019(b) | | | 167,000 | | | | 166,616 | |
| Total Food & Beverage | | | | | | | 266,700 | |
| Hardware (1.05%) | | | | | | | | |
| Dell, Inc. | | | | | | | | |
| 5.875%, 06/15/2019 | | | 150,000 | | | | 152,063 | |
| | | | | | | | | |
| Health Care Facilities & Services (0.71%) | | | | | | | | |
| HCA Healthcare, Inc. | | | | | | | | |
| 6.250%, 02/15/2021 | | | 100,000 | | | | 104,125 | |
| | | | | | | | | |
| Integrated Oils (0.27%) | | | | | | | | |
| Cenovus Energy, Inc. | | | | | | | | |
| 5.700%, 10/15/2019 | | | 38,462 | | | | 39,285 | |
| | | | | | | | | |
| Managed Care (1.38%) | | | | | | | | |
| Halfmoon Parent, Inc. | | | | | | | | |
| 3M US L + 0.65%, 09/17/2021(a)(b) | | | 200,000 | | | | 200,022 | |
| | | | | | | | | |
| Pharmaceuticals (3.76%) | | | | | | | | |
| AbbVie, Inc. | | | | | | | | |
| 2.500%, 05/14/2020 | | | 150,000 | | | | 148,095 | |
| | | Principal Amount | | | Value (Note 2) | |
| Allergan Funding SCS | | | | | | | | |
| 2.450%, 06/15/2019 | | $ | 200,000 | | | $ | 199,644 | |
| Elanco Animal Health, Inc. | | | | | | | | |
| 3.912%, 08/27/2021(b) | | | 200,000 | | | | 200,139 | |
| Total Pharmaceuticals | | | | | | | 547,878 | |
| Pipeline (3.09%) | | | | | | | | |
| Enable Midstream Partners LP | | | | | | | | |
| 2.400%, 05/15/2019 | | | 70,000 | | | | 69,637 | |
| Energy Transfer LP | | | | | | | | |
| 7.500%, 10/15/2020 | | | 100,000 | | | | 106,125 | |
| Kinder Morgan Energy Partners LP | | | | | | | | |
| 9.000%, 02/01/2019 | | | 70,000 | | | | 71,014 | |
| ONEOK Partners LP | | | | | | | | |
| 8.625%, 03/01/2019 | | | 100,000 | | | | 101,792 | |
| Rockies Express Pipeline LLC | | | | | | | | |
| 6.000%, 01/15/2019(b) | | | 100,000 | | | | 100,500 | |
| Total Pipeline | | | | | | | 449,068 | |
| Semiconductors (0.68%) | | | | | | | | |
| NXP BV / NXP Funding LLC | | | | | | | | |
| 4.625%, 06/15/2022(b) | | | 100,000 | | | | 99,625 | |
| | | | | | | | | |
| Utilities (1.04%) | | | | | | | | |
| Entergy Texas, Inc. | | | | | | | | |
| 7.125%, 02/01/2019 | | | 150,000 | | | | 151,508 | |
| | | | | | | | | |
| Wireless Telecommunications Services (0.89%) | | | | | | | | |
| AT&T, Inc. | | | | | | | | |
| 5.875%, 10/01/2019 | | | 70,000 | | | | 71,704 | |
| Sprint Communications, Inc. | | | | | | | | |
| 7.000%, 08/15/2020 | | | 55,000 | | | | 57,063 | |
| Total Wireless Telecommunications Services | | | | | | | 128,767 | |
| Wireline Telecommunications Services (0.38%) | | | | | | | | |
| CenturyLink, Inc. Series V | | | | | | | | |
| 5.625%, 04/01/2020 | | | 55,000 | | | | 55,894 | |
| | | | | | | | | |
| TOTAL CORPORATE BONDS | | | | | | | | |
| (Cost $6,193,406) | | | | | | | 6,176,156 | |
| | | | | | | | | |
| GOVERNMENT BONDS (52.90%) | | | | | | | | |
| Sovereigns (52.90%) | | | | | | | | |
| U.S. Treasury Note | | | | | | | | |
| 1.625%, 07/31/2019 | | | 570,000 | | | | 565,892 | |
| 2.625%, 07/31/2020 | | | 5,582,000 | | | | 5,560,304 | |
| 2.625%, 07/15/2021 | | | 1,595,000 | | | | 1,582,882 | |
| Total Sovereigns | | | | | | | 7,709,078 | |
| TOTAL GOVERNMENT BONDS | | | | | | | | |
| (Cost $7,728,361) | | | | | | | 7,709,078 | |
| ALPS | Smith Short Duration Bond Fund | |
| Statement of Investments | October 31, 2018 |
| | | Principal Amount | | | Value (Note 2) | |
| MUNICIPAL BONDS (0.24%) | | | | | | | | |
| General Government (0.24%) | | | | | | | | |
| State of Illinois | | | | | | | | |
| 5.363%, 02/01/2019 | | $ | 35,000 | | | $ | 35,184 | |
| | | | | | | | | |
| TOTAL MUNICIPAL BONDS | | | | | | | | |
| (Cost $35,043) | | | | | | | 35,184 | |
| | | 7-Day Yield | | | Shares | | | Value (Note 2) | |
| SHORT TERM INVESTMENTS (1.02%) | |
| Money Market Fund (1.02%) | |
| Morgan Stanley Institutional | | | | | | | | | | | | |
| Liquidity Funds -Government Portfolio | | | 2.044 | % | | | 148,288 | | | | 148,288 | |
| | | | | | | | | | | | | |
| | | | | | | | | | | | | |
| TOTAL SHORT TERM INVESTMENTS | |
| (Cost $148,288) | | | | | | | | | | | 148,288 | |
| | | | | | | | | | | | | |
| TOTAL INVESTMENTS (98.35%) | |
| (Cost $14,367,142) | | | | | | | | | | $ | 14,331,884 | |
| | | | | | | | | | | | | |
| Other Assets In Excess Of Liabilities (1.65%) | | | | | | | | | | | 240,722 | |
| | | | | | | | | | | | | |
| NET ASSETS (100.00%) | | | | | | | | | | $ | 14,572,606 | |
Investment Abbreviations:
LIBOR - London Interbank Offered Rate
Libor Rates:
1M US L - 1 Month LIBOR as of October 31, 2018 was 2.31%
3M US L - 3 Month LIBOR as of October 31, 2018 was 2.56%
10Y US TI - 10 Year Treasury Yield as of October 31, 2018 was 3.15%
| (a) | Floating or variable rate security. The reference rate is described above. The rate in effect as of October 31, 2018 is based on the reference rate plus the displayed spread as of the security's last reset date. |
| (b) | Security exempt from registration under Rule 144A of the Securities Act of 1933. This security may be resold in transactions exempt from registration, normally to qualified institutional buyers. As of October 31, 2018, the aggregate market value of those securities was $1,165,756, representing 8.00% of net assets. |
See Notes to Financial Statements.
| ALPS | Smith Total Return Bond Fund | |
| Statement of Investments | October 31, 2018 |
| | | Principal Amount | | | Value (Note 2) | |
| COLLATERALIZED MORTGAGE OBLIGATIONS (19.24%) | | | | | | | | |
| Fannie Mae | | | | | | | | |
| Series 1999-18, Class Z, 5.500%, 04/18/2029 | | $ | 49,864 | | | $ | 50,822 | |
| Series 2012-128, Class NP, 2.500%, 11/25/2042 | | | 24,999 | | | | 22,110 | |
| Series 2012-129, Class HT, 2.000%, 12/25/2032 | | | 73,505 | | | | 63,559 | |
| Series 2012-144, Class JT, 2.500%, 06/25/2042 | | | 27,410 | | | | 24,992 | |
| Series 2013-13, Class WA, 2.500%, 07/25/2042 | | | 29,472 | | | | 26,107 | |
| Series 2013-40, Class KD, 1.750%, 04/25/2042 | | | 143,914 | | | | 133,125 | |
| Series 2013-56, Class HB, 2.500%, 06/25/2043 | | | 40,000 | | | | 37,517 | |
| Series 2013-72, Class YA, 3.000%, 06/25/2033 | | | 55,022 | | | | 52,215 | |
| Series 2014-26, Class YW, 3.500%, 04/25/2044 | | | 50,538 | | | | 48,811 | |
| Series 2016-33, Class LE, 2.500%, 11/25/2033 | | | 114,633 | | | | 109,925 | |
| Series 2016-85, Class BA, 2.500%, 11/25/2046 | | | 66,397 | | | | 55,126 | |
| Series 2001-52, Class XZ, 6.500%, 10/25/2031 | | | 74,811 | | | | 82,272 | |
| Series 2002-63, Class EZ, 6.000%, 10/25/2032 | | | 25,697 | | | | 27,999 | |
| Series 2003-42, Class JH, 5.500%, 05/25/2033 | | | 43,094 | | | | 46,240 | |
| Series 2003-64, Class ZC, 5.000%, 07/25/2033 | | | 30,546 | | | | 32,909 | |
| Series 2003-64, Class JK, 3.500%, 07/25/2033 | | | 57,576 | | | | 57,259 | |
| Series 2003-94, Class CE, 5.000%, 10/25/2033 | | | 34,752 | | | | 36,000 | |
| Series 2003-131, Class CH, 5.500%, 01/25/2034 | | | 28,383 | | | | 30,953 | |
| Series 2004-92, Class TB, 5.500%, 12/25/2034 | | | 70,000 | | | | 76,922 | |
| Series 2005-3, Class CP, 5.500%, 10/25/2034 | | | 1,747 | | | | 1,797 | |
| Series 2005-17, Class EX, 5.250%, 03/25/2035 | | | 25,000 | | | | 27,311 | |
| Series 2005-68, Class BC, 5.250%, 06/25/2035 | | | 10,751 | | | | 10,846 | |
| Series 2005-68, Class PG, 5.500%, 08/25/2035 | | | 69,439 | | | | 73,655 | |
| Series 2005-62, Class JE, 5.000%, 06/25/2035 | | | 17,257 | | | | 17,707 | |
| Series 2005-59, Class DF, 1M US L + 0.20%, 05/25/2035(a) | | | 14,806 | | | | 14,808 | |
| Series 2005-110, Class MP, 5.500%, 12/25/2035 | | | 23,000 | | | | 24,333 | |
| Series 2005-122, Class PY, 6.000%, 01/25/2036 | | | 26,000 | | | | 30,355 | |
| | | Principal Amount | | | Value (Note 2) | |
| Series 2006-46, Class UD, 5.500%, 06/25/2036 | | $ | 28,000 | | | $ | 31,185 | |
| Series 2006-71, Class ZH, 6.000%, 07/25/2036 | | | 12,826 | | | | 13,910 | |
| Series 2008-46, Class LA, 5.500%, 06/25/2038 | | | 27,667 | | | | 29,227 | |
| Series 2010-68, Class WB, 4.500%, 07/25/2040 | | | 35,000 | | | | 39,054 | |
| | | | | | | | | |
| Freddie Mac | | | | | | | | |
| Series 1990-165, Class K, 6.500%, 09/15/2021 | | | 283 | | | | 286 | |
| Series 2002-2430, Class WF, 6.500%, 03/15/2032 | | | 20,366 | | | | 22,454 | |
| Series 1998-2060, Class Z, 6.500%, 05/15/2028 | | | 27,693 | | | | 29,906 | |
| Series 1999-2137, Class TH, 6.500%, 03/15/2029 | | | 15,314 | | | | 16,528 | |
| Series 1999-2154, Class PL, 6.500%, 05/15/2029 | | | 19,169 | | | | 20,803 | |
| Series 2000-2224, Class CB, 8.000%, 03/15/2030 | | | 11,726 | | | | 13,364 | |
| Series 2001-2279, Class Z, 6.000%, 01/15/2031 | | | 32,880 | | | | 35,389 | |
| Series 2001-2274, Class ZM, 6.500%, 01/15/2031 | | | 24,258 | | | | 26,686 | |
| Series 2011-3799, Class GK, 2.750%, 01/15/2021 | | | 1,680 | | | | 1,674 | |
| Series 2012-3997, Class EC, 3.500%, 02/15/2042 | | | 89,000 | | | | 86,770 | |
| Series 2012-4116, Class UA, 2.500%, 01/15/2042 | | | 49,297 | | | | 43,853 | |
| Series 2016-4594, Class JD, 3.000%, 12/15/2042 | | | 31,000 | | | | 28,976 | |
| Series 2010-3735, Class AL, 1.500%, 10/15/2020 | | | 23,662 | | | | 23,352 | |
| Series 2002-2535, Class AW, 5.500%, 12/15/2032 | | | 27,786 | | | | 29,836 | |
| Series 2003-2557, Class HL, 5.300%, 01/15/2033 | | | 68,558 | | | | 73,199 | |
| Series 2005-3059, Class ZM, 5.000%, 02/15/2035 | | | 17,208 | | | | 18,062 | |
| Series 2006-3148, Class CY, 6.000%, 04/15/2036 | | | 48,053 | | | | 52,479 | |
| Series 2006-3237, Class CD, 5.500%, 09/15/2036 | | | 46,000 | | | | 50,215 | |
| Series 2006-3249, Class CB, 4.250%, 12/15/2036 | | | 74,002 | | | | 76,268 | |
| | | | | | | | | |
| Ginnie Mae | | | | | | | | |
| Series 2004-87, Class BC, 4.500%, 10/20/2034 | | | 18,320 | | | | 19,066 | |
| Series 2005-13, Class BE, 5.000%, 09/20/2034 | | | 36,225 | | | | 37,145 | |
| Series 2008-58, Class PE, 5.500%, 07/16/2038 | | | 29,000 | | | | 31,902 | |
| ALPS | Smith Total Return Bond Fund | |
| Statement of Investments | October 31, 2018 |
| | | Principal Amount | | | Value (Note 2) | |
| Series 2008-47, Class ML, 5.250%, 06/16/2038 | | $ | 16,000 | | | $ | 17,521 | |
| Series 2010-24, Class MQ, 4.250%, 12/20/2038 | | | 1,159 | | | | 1,174 | |
| Series 2010-101, Class PG, 2.500%, 04/20/2038 | | | 3,234 | | | | 3,230 | |
| Series 2012-17, Class KX, 3.500%, 07/20/2039 | | | 22,000 | | | | 21,820 | |
| Series 2012-68, Class GE, 3.000%, 05/20/2042 | | | 25,000 | | | | 23,999 | |
| | | | | | | | | |
| TOTAL COLLATERALIZED MORTGAGE OBLIGATIONS (Cost $2,091,536) | | | | | | | 2,135,008 | |
| | | | | | | | | |
| CORPORATE BONDS (36.21%) | | | | | | | | |
| Aerospace & Defense (0.50%) | | | | | | | | |
| TransDigm, Inc. | | | | | | | | |
| 5.500%, 10/15/2020 | | | 55,000 | | | | 55,069 | |
| | | | | | | | | |
| Auto Parts Manufacturing (0.51%) | | | | | | | | |
| American Axle & Manufacturing, Inc. | | | | | | | | |
| 7.750%, 11/15/2019 | | | 55,000 | | | | 56,684 | |
| | | | | | | | | |
| Automobiles Manufacturing (0.82%) | | | | | | | | |
| Ford Motor Credit Co. LLC | | | | | | | | |
| 3M US L + 1.58%, 01/08/2019(a) | | | 35,000 | | | | 35,070 | |
| General Motors Co. | | | | | | | | |
| 4.875%, 10/02/2023 | | | 55,000 | | | | 55,729 | |
| Total Automobiles Manufacturing | | | | | | | 90,799 | |
| Banks (9.85%) | | | | | | | | |
| CIT Group, Inc. | | | | | | | | |
| 5.375%, 05/15/2020 | | | 55,000 | | | | 56,617 | |
| Cooperatieve Rabobank UA | | | | | | | | |
| 3.950%, 11/09/2022 | | | 250,000 | | | | 247,902 | |
| Discover Bank | | | | | | | | |
| 5Y US S + 1.73%, 08/09/2028(a) | | | 500,000 | | | | 494,665 | |
| SVB Financial Group | | | | | | | | |
| 5.375%, 09/15/2020 | | | 100,000 | | | | 103,300 | |
| Wells Fargo & Co. | | | | | | | | |
| 2.625%, 07/22/2022 | | | 200,000 | | | | 192,160 | |
| Total Banks | | | | | | | 1,094,644 | |
| Biotechnology (0.49%) | | | | | | | | |
| Celgene Corp. | | | | | | | | |
| 3.250%, 08/15/2022 | | | 55,000 | | | | 53,845 | |
| | | | | | | | | |
| Cable & Satellite (1.39%) | | | | | | | | |
| Charter Communications Operating LLC | | | | | | | | |
| / Charter Communications Operating Capital 4.908%, 07/23/2025 | | | 55,000 | | | | 55,466 | |
| Comcast Corp. | | | | | | | | |
| 4.250%, 10/15/2030 | | | 100,000 | | | | 98,919 | |
| Total Cable & Satellite | | | | | | | 154,385 | |
| | | Principal Amount | | | Value (Note 2) | |
| Casinos & Gaming (0.50%) | | | | | | | | |
| MGM Resorts International | | | | | | | | |
| 5.250%, 03/31/2020 | | $ | 55,000 | | | $ | 55,825 | |
| | | | | | | | | |
| Chemicals (0.90%) | | | | | | | | |
| International Flavors & Fragrances, Inc. | | | | | | | | |
| 4.450%, 09/26/2028 | | | 100,000 | | | | 100,192 | |
| | | | | | | | | |
| Consumer Finance (0.33%) | | | | | | | | |
| Capital One Bank USA NA | | | | | | | | |
| 8.800%, 07/15/2019 | | | 35,000 | | | | 36,344 | |
| | | | | | | | | |
| Diversified Banks (0.72%) | | | | | | | | |
| Bank of America Corp. | | | | | | | | |
| 3M US L + 1.31%, 07/23/2029(a) | | | 40,000 | | | | 39,497 | |
| JPMorgan Chase & Co. | | | | | | | | |
| 3M US L + 1.26%, 07/23/2029(a) | | | 40,000 | | | | 39,446 | |
| Total Diversified Banks | | | | | | | 78,943 | |
| Electrical Equipment Manufacturing (1.49%) | | | | | | | | |
| General Electric Co. Series D | | | | | | | | |
| 3M US L + 3.33%, (a)(b) | | | 180,000 | | | | 166,275 | |
| | | | | | | | | |
| Exploration & Production (1.23%) | | | | | | | | |
| Antero Resources Corp. | | | | | | | | |
| 5.375%, 11/01/2021 | | | 100,000 | | | | 100,250 | |
| Encana Corp. | | | | | | | | |
| 6.500%, 05/15/2019 | | | 35,000 | | | | 35,600 | |
| Total Exploration & Production | | | | | | | 135,850 | |
| Financial Services (3.14%) | | | | | | | | |
| E*TRADE Financial Corp. | | | | | | | | |
| 4.500%, 06/20/2028 | | | 50,000 | | | | 49,242 | |
| Goldman Sachs Group, Inc. | | | | | | | | |
| 3M US L + 0.99%, 07/24/2023(a) | | | 100,000 | | | | 96,260 | |
| Morgan Stanley Series GMTN | | | | | | | | |
| 5.500%, 01/26/2020 | | | 100,000 | | | | 102,665 | |
| TD Ameritrade Holding Corp. | | | | | | | | |
| 3M US L + 0.43%, 11/01/2021(a) | | | 100,000 | | | | 100,060 | |
| Total Financial Services | | | | | | | 348,227 | |
| Food & Beverage (0.12%) | | | | | | | | |
| Wm Wrigley Jr Co. | | | | | | | | |
| 2.900%, 10/21/2019(c) | | | 13,000 | | | | 12,970 | |
| | | | | | | | | |
| Health Care Facilities & Services (0.93%) | | | | | | | | |
| HCA Healthcare, Inc. | | | | | | | | |
| 6.250%, 02/15/2021 | | | 100,000 | | | | 104,125 | |
| | | | | | | | | |
| Integrated Oils (0.35%) | | | | | | | | |
| Cenovus Energy, Inc. | | | | | | | | |
| 5.700%, 10/15/2019 | | | 38,462 | | | | 39,285 | |
| ALPS | Smith Total Return Bond Fund | |
| Statement of Investments | October 31, 2018 |
| | | Principal Amount | | | Value (Note 2) | |
| Managed Care (1.75%) | | | | | | | | |
| Halfmoon Parent, Inc. | | | | | | | | |
| 4.125%, 11/15/2025(c) | | $ | 100,000 | | | $ | 99,004 | |
| 4.900%, 12/15/2048(c) | | | 100,000 | | | | 95,028 | |
| Total Managed Care | | | | | | | 194,032 | |
| Mass Merchants (0.83%) | | | | | | | | |
| Target Corp. | | | | | | | | |
| 2.500%, 04/15/2026 | | | 100,000 | | | | 91,545 | |
| | | | | | | | | |
| Pharmaceuticals (2.65%) | | | | | | | | |
| AbbVie, Inc. | | | | | | | | |
| 3.600%, 05/14/2025 | | | 100,000 | | | | 95,554 | |
| Elanco Animal Health, Inc. | | | | | | | | |
| 4.900%, 08/28/2028(c) | | | 200,000 | | | | 197,972 | |
| Total Pharmaceuticals | | | | | | | 293,526 | |
| Pipeline (1.59%) | | | | | | | | |
| Enable Midstream Partners LP | | | | | | | | |
| 2.400%, 05/15/2019 | | | 35,000 | | | | 34,819 | |
| Energy Transfer LP | | | | | | | | |
| 4.250%, 03/15/2023 | | | 50,000 | | | | 49,625 | |
| Kinder Morgan Energy Partners LP | | | | | | | | |
| 9.000%, 02/01/2019 | | | 35,000 | | | | 35,507 | |
| ONEOK Partners LP | | | | | | | | |
| 5.000%, 09/15/2023 | | | 55,000 | | | | 56,694 | |
| Total Pipeline | | | | | | | 176,645 | |
| Semiconductors (0.90%) | | | | | | | | |
| NXP BV / NXP Funding LLC | | | | | | | | |
| 4.625%, 06/15/2022(c) | | | 100,000 | | | | 99,625 | |
| | | | | | | | | |
| Supermarkets & Pharmacies (0.43%) | | | | | | | | |
| Kroger Co. | | | | | | | | |
| 2.650%, 10/15/2026 | | | 55,000 | | | | 48,225 | |
| | | | | | | | | |
| Utilities (2.65%) | | | | | | | | |
| American Water Capital Corp. | | | | | | | | |
| 3.750%, 09/01/2028 | | | 150,000 | | | | 147,234 | |
| Oklahoma Gas & Electric Co. | | | | | | | | |
| 3.800%, 08/15/2028 | | | 150,000 | | | | 146,294 | |
| Total Utilities | | | | | | | 293,528 | |
| Wireless Telecommunications Services (1.64%) | | | | | | | | |
| AT&T, Inc. | | | | | | | | |
| 4.800%, 06/15/2044 | | | 40,000 | | | | 35,126 | |
| 5.875%, 10/01/2019 | | | 35,000 | | | | 35,852 | |
| Sprint Communications, Inc. | | | | | | | | |
| 7.000%, 08/15/2020 | | | 55,000 | | | | 57,062 | |
| Verizon Communications, Inc. | | | | | | | | |
| 3.500%, 11/01/2024 | | | 55,000 | | | | 53,867 | |
| Total Wireless Telecommunications Services | | | | | | | 181,907 | |
| Wireline Telecommunications Services (0.50%) | | | | | | | | |
| CenturyLink, Inc. Series V | | | | | | | | |
| 5.625%, 04/01/2020 | | | 55,000 | | | | 55,894 | |
| | | | | | | | | |
| TOTAL CORPORATE BONDS | | | | | | | | |
| (Cost $4,068,967) | | | | | | | 4,018,389 | |
| | | Principal Amount | | | Value (Note 2) | |
| GOVERNMENT BONDS (40.65%) | | | | | | | | |
| Sovereigns (40.65%) | | | | | | | | |
| U.S. Treasury Bond | | | | | | | | |
| 2.875%, 05/15/2028 | | $ | 223,000 | | | $ | 218,083 | |
| 3.125%, 05/15/2048 | | | 927,000 | | | | 881,501 | |
| U.S. Treasury Note | | | | | | | | |
| 2.625%, 07/31/2020 | | | 545,000 | | | | 542,882 | |
| 2.625%, 07/15/2021 | | | 111,000 | | | | 110,157 | |
| 2.750%, 07/31/2023 | | | 532,000 | | | | 526,680 | |
| 2.875%, 10/15/2021 | | | 1,717,000 | | | | 1,714,484 | |
| 2.875%, 07/31/2025 | | | 523,000 | | | | 517,024 | |
| Total Sovereigns | | | | | | | 4,510,811 | |
| TOTAL GOVERNMENT BONDS | | | | | | | | |
| (Cost $4,533,572) | | | | | | | 4,510,811 | |
| | | 7-Day Yield | | | Shares | | | Value (Note 2) | |
| SHORT TERM INVESTMENTS (2.70%) | |
| Money Market Fund (2.70%) | |
| Morgan Stanley Institutional | | | | | | | | | | | | |
| Liquidity Funds -Government Portfolio | | | 2.044 | % | | | 299,517 | | | | 299,517 | |
| | | | | | | | | | | | | |
| TOTAL SHORT TERM INVESTMENTS | | | | | | | | | | | | |
| (Cost $299,517) | | | | | | | | | | | 299,517 | |
| | | | | | | | | | | | | |
| TOTAL INVESTMENTS (98.80%) | | | | | | | | | | | | |
| (Cost $10,993,592) | | | | | | | | | | $ | 10,963,725 | |
| | | | | | | | | | | | | |
| Other Assets In Excess Of Liabilities (1.20%) | | | | | | | | | | | 133,270 | |
| | | | | | | | | | | | | |
| NET ASSETS (100.00%) | | | | | | | | | | $ | 11,096,995 | |
Investment Abbreviations:
LIBOR - London Interbank Offered Rate
Libor Rates:
3M US L - 3 Month LIBOR as of October 31, 2018 was 2.56%
| (a) | Floating or variable rate security. The reference rate is described above. The rate in effect as of October 31, 2018 is based on the reference rate plus the displayed spread as of the security's last reset date. |
| (c) | Security exempt from registration under Rule 144A of the Securities Act of 1933. This security may be resold in transactions exempt from registration, normally to qualified institutional buyers. As of October 31, 2018, the aggregate market value of those securities was $504,599, representing 4.55% of net assets. |
See Notes to Financial Statements.
ALPS | Smith Funds
| Statements of Assets and Liabilities | October 31, 2018 |
| | | ALPS | Smith Short Duration Bond Fund | | | ALPS | Smith Total Return Bond Fund | |
| ASSETS | | | | | | |
| Investments, at value | | $ | 14,331,884 | | | $ | 10,963,725 | |
| Receivable for investments sold | | | 753,307 | | | | 702,106 | |
| Receivable for shares sold | | | – | | | | 5,000 | |
| Interest receivable | | | 114,946 | | | | 82,463 | |
| Prepaid expenses and other assets | | | 260 | | | | 245 | |
| Total Assets | | | 15,200,397 | | | | 11,753,539 | |
| LIABILITIES | | | | | | | | |
| Payable for investments purchased | | | 580,243 | | | | 608,647 | |
| Investment advisory fees payable | | | 11,556 | | | | 9,614 | |
| Administration and transfer agency fees payable | | | 4,819 | | | | 7,576 | |
| Distribution and services fees payable | | | 528 | | | | 332 | |
| Professional fees payable | | | 26,993 | | | | 26,754 | |
| Custody fees payable | | | 598 | | | | 648 | |
| Accrued expenses and other liabilities | | | 3,054 | | | | 2,973 | |
| Total Liabilities | | | 627,791 | | | | 656,544 | |
| NET ASSETS | | $ | 14,572,606 | | | $ | 11,096,995 | |
| NET ASSETS CONSIST OF | | | | | | | | |
| Paid-in capital | | $ | 14,596,174 | | | $ | 11,123,913 | |
| Total distributable earnings | | | (23,568 | ) | | | (26,918 | ) |
| NET ASSETS | | $ | 14,572,606 | | | $ | 11,096,995 | |
| INVESTMENTS, AT COST | | $ | 14,367,142 | | | $ | 10,993,592 | |
| | | | | | | | | |
| PRICING OF SHARES | | | | | | | | |
| Investor Class: | | | | | | | | |
| Net Asset Value, offering and redemption price per share | | $ | 9.98 | | | $ | 10.05 | |
| Net Assets | | $ | 491,275 | | | $ | 344,899 | |
| Shares of beneficial interest outstanding (unlimited number of shares, no par value common stock authorized) | | | 49,207 | | | | 34,313 | |
| Class A: | | | | | | | | |
| Net Asset Value, offering and redemption price per share | | $ | 9.98 | | | $ | 10.05 | |
| Net Assets | | $ | 110,345 | | | $ | 136,035 | |
| Shares of beneficial interest outstanding (unlimited number of shares, no par value common stock authorized) | | | 11,052 | | | | 13,540 | |
| Maximum offering price per share ((NAV/0.9450), based on maximum sales charge of 5.50% of the offering price) | | $ | 10.56 | | | $ | 10.63 | |
| Class C: | | | | | | | | |
| Net Asset Value, offering and redemption price per share(a) | | $ | 9.98 | | | $ | 10.04 | |
| Net Assets | | $ | 370,414 | | | $ | 120,871 | |
| Shares of beneficial interest outstanding (unlimited number of shares, no par value common stock authorized) | | | 37,110 | | | | 12,037 | |
| Class I: | | | | | | | | |
| Net Asset Value, offering and redemption price per share | | $ | 9.99 | | | $ | 10.04 | |
| Net Assets | | $ | 13,600,572 | | | $ | 10,495,190 | |
| Shares of beneficial interest outstanding (unlimited number of shares, no par value common stock authorized) | | | 1,361,931 | | | | 1,045,191 | |
| (a) | Redemption price per share may be reduced for any applicable contingent deferred sales charge. For a description of a possible sales charge, please see the Fund's Prospectus. |
See Notes to Financial Statements.
ALPS | Smith Funds
| Statements of Operations | For the Period Ended October 31, 2018 |
| | | ALPS | Smith Short Duration Bond Fund(a) | | | ALPS | Smith Total Return Bond Fund(a) | |
| INVESTMENT INCOME | | | | | | |
| Interest | | $ | 82,744 | | | $ | 85,552 | |
| Total Investment Income | | | 82,744 | | | | 85,552 | |
| | | | | | | | | |
| EXPENSES | | | | | | | | |
| Investment advisory fees | | | 10,669 | | | | 14,171 | |
| Administrative fees | | | 5,491 | | | | 8,223 | |
| Transfer agency fees | | | 624 | | | | 629 | |
| Distribution and service fees | | | | | | | | |
| Investor Class | | | 447 | | | | 221 | |
| Class A | | | 143 | | | | 166 | |
| Class C | | | 590 | | | | 393 | |
| Professional fees | | | 28,539 | | | | 28,385 | |
| Reports to shareholders and printing fees | | | 390 | | | | 374 | |
| State registration fees | | | 61 | | | | 61 | |
| Insurance fees | | | 2 | | | | 2 | |
| Custody fees | | | 1,606 | | | | 1,894 | |
| Trustees' fees and expenses | | | 15 | | | | 15 | |
| Miscellaneous expenses | | | 5,111 | | | | 4,962 | |
| Total Expenses | | | 53,688 | | | | 59,496 | |
| Less fees waived/reimbursed by investment advisor (Note 8) | | | | | | | | |
| Investor Class | | | (2,130 | ) | | | (1,061 | ) |
| Class A | | | (1,214 | ) | | | (1,197 | ) |
| Class C | | | (1,236 | ) | | | (1,187 | ) |
| Class I | | | (33,418 | ) | | | (37,658 | ) |
| Net Expenses | | | 15,690 | | | | 18,393 | |
| Net Investment Income | | | 67,054 | | | | 67,159 | |
| Net realized gain on investments | | | 13,253 | | | | 5,213 | |
| Net Realized Gain | | | 13,253 | | | | 5,213 | |
| Net change in unrealized depreciation on investments | | | (35,258 | ) | | | (29,867 | ) |
| Net Change in Unrealized Depreciation | | | (35,258 | ) | | | (29,867 | ) |
| NET REALIZED AND UNREALIZED LOSS ON INVESTMENTS | | | (22,005 | ) | | | (24,654 | ) |
| NET INCREASE IN NET ASSETS RESULTING FROM OPERATIONS | | $ | 45,049 | | | $ | 42,505 | |
| (a) | The Fund commenced operations on July 2, 2018. |
See Notes to Financial Statements.
ALPS | Smith Short Duration Bond Fund
Statement of Changes in Net Assets
| | | For the Period July 2, 2018 (Commencement of Operations) to October 31, 2018 | |
| OPERATIONS | | | | |
| Net investment income | | $ | 67,054 | |
| Net realized gain | | | 13,253 | |
| Net change in unrealized depreciation | | | (35,258 | ) |
| Net Increase in Net Assets Resulting from Operations | | | 45,049 | |
| | | | | |
| DISTRIBUTIONS | | | | |
| From distributable earnings | | | | |
| Investor Class | | | (1,963 | ) |
| Class A | | | (522 | ) |
| Class C | | | (756 | ) |
| Class I | | | (65,377 | ) |
| Net Decrease in Net Assets from Distributions | | | (68,617 | ) |
| | | | | |
| BENEFICIAL INTEREST TRANSACTIONS (NOTE 6) | | | | |
| Shares sold | | | | |
| Investor Class | | | 489,983 | |
| Class A | | | 110,000 | |
| Class C | | | 370,324 | |
| Class I | | | 13,575,852 | |
| Dividends reinvested | | | | |
| Investor Class | | | 1,963 | |
| Class A | | | 522 | |
| Class C | | | 612 | |
| Class I | | | 57,800 | |
| Shares redeemed | | | | |
| Investor Class | | | (106 | ) |
| Class I | | | (10,776 | ) |
| Net Increase in Net Assets Derived from Beneficial Interest Transactions | | | 14,596,174 | |
| | | | | |
| Net increase in net assets | | | 14,572,606 | |
| | | | | |
| NET ASSETS | | | | |
| Beginning of period | | | – | |
| End of period | | $ | 14,572,606 | |
See Notes to Financial Statements.
ALPS | Smith Total Return Bond Fund
Statement of Changes in Net Assets
| | | For the Period July 2, 2018 (Commencement of Operations) to October 31, 2018 | |
| OPERATIONS | | | | |
| Net investment income | | $ | 67,159 | |
| Net realized gain | | | 5,213 | |
| Net change in unrealized depreciation | | | (29,867 | ) |
| Net Increase in Net Assets Resulting from Operations | | | 42,505 | |
| | | | | |
| DISTRIBUTIONS | | | | |
| From distributable earnings | | | | |
| Investor Class | | | (1,152 | ) |
| Class A | | | (709 | ) |
| Class C | | | (471 | ) |
| Class I | | | (67,091 | ) |
| Net Decrease in Net Assets from Distributions | | | (69,423 | ) |
| | | | | |
| BENEFICIAL INTEREST TRANSACTIONS (NOTE 6) | | | | |
| Shares sold | | | | |
| Investor Class | | | 344,001 | |
| Class A | | | 135,000 | |
| Class C | | | 120,000 | |
| Class I | | | 10,469,043 | |
| Dividends reinvested | | | | |
| Investor Class | | | 1,152 | |
| Class A | | | 709 | |
| Class C | | | 471 | |
| Class I | | | 65,897 | |
| Shares redeemed | | | | |
| Class I | | | (12,360 | ) |
| Net Increase in Net Assets Derived from Beneficial Interest Transactions | | | 11,123,913 | |
| | | | | |
| Net increase in net assets | | | 11,096,995 | |
| | | | | |
| NET ASSETS | | | | |
| Beginning of period | | | – | |
| End of period | | $ | 11,096,995 | |
See Notes to Financial Statements.
ALPS | Smith Short Duration Bond Fund - Investor Class
Financial Highlights
Selected data for a share of beneficial interest outstanding throughout the periods indicated:
| | | For the Period July 2, 2018 (Commencement of Operations) to October 31, 2018 | |
| Net asset value, beginning of period | | $ | 10.00 | |
| | | | | |
| INCOME FROM INVESTMENT OPERATIONS: | | | | |
| Net investment income(a) | | | 0.07 | |
| Net realized and unrealized loss | | | (0.04 | ) |
| Total from investment operations | | | 0.03 | |
| | | | | |
| DISTRIBUTIONS: | | | | |
| From net investment income | | | (0.05 | ) |
| Total distributions | | | (0.05 | ) |
| | | | | |
| Net (decrease) in net asset value | | | (0.02 | ) |
| Net asset value, end of year | | $ | 9.98 | |
| TOTAL RETURN(b) | | | 0.25 | % |
| | | | | |
| RATIOS/SUPPLEMENTAL DATA: | | | | |
| Net assets, end of year (000s) | | $ | 491 | |
| Ratio of expenses to average net assets excluding fee waivers and reimbursements | | | 2.79 | %(c) |
| Ratio of expenses to average net assets including fee waivers and reimbursements | | | 0.89 | %(c) |
| Ratio of net investment income to average net assets | | | 1.93 | %(c) |
| Portfolio turnover rate(d) | | | 266 | % |
| (a) | Calculated using the average shares method. |
| (b) | Total returns are for the period indicated and have not been annualized. Total returns would have been lower had certain expenses not been waived during the period. Returns shown do not reflect the deduction of taxes that a shareholder would pay on Fund distributions or the redemption of Fund shares. Returns shown exclude any applicable sales charges. |
| (d) | Portfolio turnover rate for periods less than one full year have not been annualized. |
See Notes to Financial Statements.
ALPS | Smith Short Duration Bond Fund – Class A
Financial Highlights
Selected data for a share of beneficial interest outstanding throughout the periods indicated:
| | | For the Period July 2, 2018 (Commencement of Operations) to October 31, 2018 | |
| Net asset value, beginning of period | | $ | 10.00 | |
| | | | | |
| INCOME FROM INVESTMENT OPERATIONS: | | | | |
| Net investment income(a) | | | 0.06 | |
| Net realized and unrealized loss | | | (0.03 | ) |
| Total from investment operations | | | 0.03 | |
| | | | | |
| DISTRIBUTIONS: | | | | |
| From net investment income | | | (0.05 | ) |
| Total distributions | | | (0.05 | ) |
| | | | | |
| Net (decrease) in net asset value | | | (0.02 | ) |
| Net asset value, end of year | | $ | 9.98 | |
| TOTAL RETURN(b) | | | 0.27 | % |
| | | | | |
| | | | | |
| RATIOS/SUPPLEMENTAL DATA: | | | | |
| Net assets, end of year (000s) | | $ | 110 | |
| Ratio of expenses to average net assets excluding fee waivers and reimbursements | | | 4.28 | %(c) |
| Ratio of expenses to average net assets including fee waivers and reimbursements | | | 0.89 | %(c) |
| Ratio of net investment income to average net assets | | | 1.86 | %(c) |
| Portfolio turnover rate(d) | | | 266 | % |
| (a) | Calculated using the average shares method. |
| (b) | Total returns are for the period indicated and have not been annualized. Total returns would have been lower had certain expenses not been waived during the period. Returns shown do not reflect the deduction of taxes that a shareholder would pay on Fund distributions or the redemption of Fund shares. |
| (d) | Portfolio turnover rate for periods less than one full year have not been annualized. |
See Notes to Financial Statements.
ALPS | Smith Short Duration Bond Fund – Class C
Financial Highlights
Selected data for a share of beneficial interest outstanding throughout the periods indicated:
| | | For the Period July 2, 2018 (Commencement of Operations) to October 31, 2018 | |
| Net asset value, beginning of period | | $ | 10.00 | |
| | | | | |
| INCOME FROM INVESTMENT OPERATIONS: | | | | |
| Net investment income(a) | | | 0.05 | |
| Net realized and unrealized loss | | | (0.04 | ) |
| Total from investment operations | | | 0.01 | |
| | | | | |
| DISTRIBUTIONS: | | | | |
| From net investment income | | | (0.03 | ) |
| Total distributions | | | (0.03 | ) |
| | | | | |
| Net (decrease) in net asset value | | | (0.02 | ) |
| Net asset value, end of year | | $ | 9.98 | |
| TOTAL RETURN(b) | | | 0.09 | % |
| | | | | |
| RATIOS/SUPPLEMENTAL DATA: | | | | |
| Net assets, end of year (000s) | | $ | 370 | |
| Ratio of expenses to average net assets excluding fee waivers and reimbursements | | | 3.54 | %(c) |
| Ratio of expenses to average net assets including fee waivers and reimbursements | | | 1.48 | %(c) |
| Ratio of net investment income to average net assets | | | 1.35 | %(c) |
| Portfolio turnover rate(d) | | | 266 | % |
| (a) | Calculated using the average shares method. |
| (b) | Total returns are for the period indicated and have not been annualized. Total returns would have been lower had certain expenses not been waived during the period. Returns shown do not reflect the deduction of taxes that a shareholder would pay on Fund distributions or the redemption of Fund shares. Returns shown exclude any applicable sales charges. |
| (d) | Portfolio turnover rate for periods less than one full year have not been annualized. |
See Notes to Financial Statements.
ALPS | Smith Short Duration Bond Fund – Class I
Financial Highlights
Selected data for a share of beneficial interest outstanding throughout the periods indicated:
| | | For the Period July 2, 2018 (Commencement of Operations) to October 31, 2018 | |
| Net asset value, beginning of period | | $ | 10.00 | |
| | | | | |
| INCOME FROM INVESTMENT OPERATIONS: | | | | |
| Net investment income(a) | | | 0.08 | |
| Net realized and unrealized loss | | | (0.03 | ) |
| Total from investment operations | | | 0.05 | |
| | | | | |
| DISTRIBUTIONS: | | | | |
| From net investment income | | | (0.06 | ) |
| Total distributions | | | (0.06 | ) |
| | | | | |
| REDEMPTION FEES ADDED TO PAID-IN CAPITAL (NOTE 6) | | | 0.00 | (b) |
| Net (decrease) in net asset value | | | (0.01 | ) |
| Net asset value, end of year | | $ | 9.99 | |
| TOTAL RETURN(c) | | | 0.50 | % |
| | | | | |
| RATIOS/SUPPLEMENTAL DATA: | | | | |
| Net assets, end of year (000s) | | $ | 13,601 | |
| Ratio of expenses to average net assets excluding fee waivers and reimbursements | | | 1.70 | %(d) |
| Ratio of expenses to average net assets including fee waivers and reimbursements | | | 0.49 | %(d) |
| Ratio of net investment income to average net assets | | | 2.36 | %(d) |
| Portfolio turnover rate(e) | | | 266 | % |
| (a) | Calculated using the average shares method. |
| (b) | Less than $0.005 or ($0.005) per share. |
| (c) | Total returns are for the period indicated and have not been annualized. Total returns would have been lower had certain expenses not been waived during the period. Returns shown do not reflect the deduction of taxes that a shareholder would pay on Fund distributions or the redemption of Fund shares. |
| (e) | Portfolio turnover rate for periods less than one full year have not been annualized. |
See Notes to Financial Statements.
ALPS | Smith Total Return Bond Fund – Investor Class
Financial Highlights
Selected data for a share of beneficial interest outstanding throughout the periods indicated:
| | | For the Period July 2, 2018 (Commencement of Operations) to October 31, 2018 | |
| Net asset value, beginning of period | | $ | 10.00 | |
| | | | | |
| INCOME FROM INVESTMENT OPERATIONS: | | | | |
| Net investment income(a) | | | 0.07 | |
| Net realized and unrealized gain | | | 0.03 | |
| Total from investment operations | | | 0.10 | |
| | | | | |
| DISTRIBUTIONS: | | | | |
| From net investment income | | | (0.05 | ) |
| Total distributions | | | (0.05 | ) |
| | | | | |
| Net increase in net asset value | | | 0.05 | |
| Net asset value, end of year | | $ | 10.05 | |
| TOTAL RETURN(b) | | | 1.00 | % |
| | | | | |
| RATIOS/SUPPLEMENTAL DATA: | | | | |
| Net assets, end of year (000s) | | $ | 345 | |
| Ratio of expenses to average net assets excluding fee waivers and reimbursements | | | 2.97 | %(c) |
| Ratio of expenses to average net assets including fee waivers and reimbursements | | | 1.07 | %(c) |
| Ratio of net investment income to average net assets | | | 2.20 | %(c) |
| Portfolio turnover rate(d) | | | 345 | % |
| (a) | Calculated using the average shares method. |
| (b) | Total returns are for the period indicated and have not been annualized. Total returns would have been lower had certain expenses not been waived during the period. Returns shown do not reflect the deduction of taxes that a shareholder would pay on Fund distributions or the redemption of Fund shares. Returns shown exclude any applicable sales charges. |
| (d) | Portfolio turnover rate for periods less than one full year have not been annualized. |
See Notes to Financial Statements.
ALPS | Smith Total Return Bond Fund – Class A
Financial Highlights
Selected data for a share of beneficial interest outstanding throughout the periods indicated:
| | | For the Period July 2, 2018 (Commencement of Operations) to October 31, 2018 | |
| Net asset value, beginning of period | | $ | 10.00 | |
| | | | | |
| INCOME FROM INVESTMENT OPERATIONS: | | | | |
| Net investment income(a) | | | 0.07 | |
| Net realized and unrealized gain | | | 0.03 | |
| Total from investment operations | | | 0.10 | |
| | | | | |
| DISTRIBUTIONS: | | | | |
| From net investment income | | | (0.05 | ) |
| Total distributions | | | (0.05 | ) |
| | | | | |
| Net increase in net asset value | | | 0.05 | |
| Net asset value, end of year | | $ | 10.05 | |
| TOTAL RETURN(b) | | | 1.04 | % |
| | | | | |
| RATIOS/SUPPLEMENTAL DATA: | | | | |
| Net assets, end of year (000s) | | $ | 136 | |
| Ratio of expenses to average net assets excluding fee waivers and reimbursements | | | 3.96 | %(c) |
| Ratio of expenses to average net assets including fee waivers and reimbursements | | | 1.07 | %(c) |
| Ratio of net investment income to average net assets | | | 2.10 | %(c) |
| Portfolio turnover rate(d) | | | 345 | % |
| (a) | Calculated using the average shares method. |
| (b) | Total returns are for the period indicated and have not been annualized. Total returns would have been lower had certain expenses not been waived during the period. Returns shown do not reflect the deduction of taxes that a shareholder would pay on Fund distributions or the redemption of Fund shares. |
| (d) | Portfolio turnover rate for periods less than one full year have not been annualized. |
See Notes to Financial Statements.
ALPS | Smith Total Return Bond Fund – Class C
Financial Highlights
Selected data for a share of beneficial interest outstanding throughout the periods indicated:
| | | For the Period July 2, 2018 (Commencement of Operations) to October 31, 2018 | |
| Net asset value, beginning of period | | $ | 10.00 | |
| | | | | |
| INCOME FROM INVESTMENT OPERATIONS: | | | | |
| Net investment income(a) | | | 0.05 | |
| Net realized and unrealized gain | | | 0.03 | |
| Total from investment operations | | | 0.08 | |
| | | | | |
| DISTRIBUTIONS: | | | | |
| From net investment income | | | (0.04 | ) |
| Total distributions | | | (0.04 | ) |
| | | | | |
| Net increase in net asset value | | | 0.04 | |
| Net asset value, end of year | | $ | 10.04 | |
| TOTAL RETURN(b) | | | 0.79 | % |
| | | | | |
| RATIOS/SUPPLEMENTAL DATA: | | | | |
| Net assets, end of year (000s) | | $ | 121 | |
| Ratio of expenses to average net assets excluding fee waivers and reimbursements | | | 4.69 | %(c) |
| Ratio of expenses to average net assets including fee waivers and reimbursements | | | 1.67 | %(c) |
| Ratio of net investment income to average net assets | | | 1.49 | %(c) |
| Portfolio turnover rate(d) | | | 345 | % |
| (a) | Calculated using the average shares method. |
| (b) | Total returns are for the period indicated and have not been annualized. Total returns would have been lower had certain expenses not been waived during the period. Returns shown do not reflect the deduction of taxes that a shareholder would pay on Fund distributions or the redemption of Fund shares. Returns shown exclude any applicable sales charges. |
| (d) | Portfolio turnover rate for periods less than one full year have not been annualized. |
See Notes to Financial Statements.
��
ALPS | Smith Total Return Bond Fund – Class I
Financial Highlights
Selected data for a share of beneficial interest outstanding throughout the periods indicated:
| | | For the Period July 2, 2018 (Commencement of Operations) to October 31, 2018 | |
| Net asset value, beginning of period | | $ | 10.00 | |
| | | | | |
| INCOME FROM INVESTMENT OPERATIONS: | | | | |
| Net investment income(a) | | | 0.09 | |
| Net realized and unrealized gain | | | 0.02 | |
| Total from investment operations | | | 0.11 | |
| | | | | |
| DISTRIBUTIONS: | | | | |
| From net investment income | | | (0.07 | ) |
| Total distributions | | | (0.07 | ) |
| | | | | |
| Net increase in net asset value | | | 0.04 | |
| Net asset value, end of year | | $ | 10.04 | |
| TOTAL RETURN(b) | | | 1.09 | % |
| | | | | |
| RATIOS/SUPPLEMENTAL DATA: | | | | |
| Net assets, end of year (000s) | | $ | 10,495 | |
| Ratio of expenses to average net assets excluding fee waivers and reimbursements | | | 2.18 | %(c) |
| Ratio of expenses to average net assets including fee waivers and reimbursements | | | 0.67 | %(c) |
| Ratio of net investment income to average net assets | | | 2.64 | %(c) |
| Portfolio turnover rate(d) | | | 345 | % |
| (a) | Calculated using the average shares method. |
| (b) | Total returns are for the period indicated and have not been annualized. Total returns would have been lower had certain expenses not been waived during the period. Returns shown do not reflect the deduction of taxes that a shareholder would pay on Fund distributions or the redemption of Fund shares. |
| (d) | Portfolio turnover rate for periods less than one full year have not been annualized. |
See Notes to Financial Statements.
ALPS | Red Rocks Listed Private Equity Fund
| Management Commentary | October 31, 2018 (Unaudited) |
Listed Private Equity Fund Fiscal Year 2018 Review
Global Markets Review
This past year has been one of historic turmoil, dislocation, and transition for global markets as major economic regions faced significant economic and political events with potentially far- reaching impacts.
A few of the major themes in Asia included: a slowing Chinese economy, growing issues in the Chinese banking system, slow growth and demographic challenges in Japan, military buildup of North Korea, and the economic and political impacts of US tariffs.
Themes in the Eurozone included: BREXIT (British exit from the Eurozone) with uncertainties around timing and impact, growing nationalism with significant disagreements on immigration policy among member nations, slowing economic growth, issues and risks in the European banking system, and concerns regarding the fiscal health of several member states.
Themes in the US included: corporate tax cuts implemented at the end of 2017, an unpopular president fighting numerous political battles, a shrinking Federal Reserve balance sheet, interest rate hikes, a stronger US dollar, new trade pacts to replace NAFTA, and growing concerns of how to fund the country’s systemic fiscal deficits.
These themes, along with many others, have rekindled fear and uncertainty in market participants – and uncertainty can lead to increases in price volatility. After almost a decade of historically low market volatility, we saw significant increases during the past fiscal year, with several corrections of 5% or more in the past 12 months.
Global Private Equity
In contrast to the growing uncertainty and volatility in global public markets, private markets continued their strong growth. Although not a record year, global private equity (“PE”) fundraising was robust, with over $400 billion of new capital and a new high-water mark of dry powder (committed capital that has yet to be invested) at $1.14 trillion.
Private investable assets are now around $5.7 trillion globally, or 6% of the $91.2 trillion in global investable assets (public and private) as of March 31, 2018 and the opportunity in private companies continues to be vastly larger than publicly listed companies.
For example, in North America there are 8,714 companies listed on public exchanges as of September 30, 2018. In contrast, there are 37,551 (a 4X multiple) private companies according to Bloomberg that meet potential size and other characteristics for investors.
Although both public and private valuations have increased over the past decade, valuations of private companies continue to be favorable relative to public companies. As of fiscal year end, US private companies are valued at 10.6 times EV/EBITDA (Enterprise value to earnings before interest, taxes, depreciation, and amortization) compared to 13.9 times EV/EBITDA of the Russell 2000 index. Debt levels in PE deals were flat with four year average at around 50%, which are sharply lower than pre-financial crisis levels.
Despite ongoing political uncertainties and trade issues, global IPO activity levels were significantly above 10-year median in both volume and proceeds. Global M&A (mergers and acquisitions) activity was in line with five year averages in both volume and proceeds.
Portfolio Review
The core of our investment process has been consistent over the past decade. We manage the fund conservatively and seek to build a portfolio that provides attractive risk-adjusted returns for investors by investing in listed PE companies. We work very deliberately, getting to know the financials and operations of companies and their management teams, a process which often can take years before we take a position.
For the twelve months ending October 31, 2018 the ALPS|Red Rocks Listed Private Equity Fund A shares (LPEFX) returned -4.23% compared with 1.71% and -4.90% for the MSCI World Index (the fund’s primary benchmark) and the Global Listed Private Equity Index, respectively.
As of fiscal year end, the fund’s longer term returns continue to perform in line with its primary benchmark, with 10 year annualized returns of 10.24% compared to 10.65% for MSCI World Index.
The fund achieved this performance despite zero exposure to FAANG (Facebook, Amazon, Apple, Netflix, and Google) and other tech stocks, which as a group have provided a bulk of the returns for broad global market indices over the past decade.
During the past year, we continued to update the portfolio, adding 10 companies and exiting 10 companies, ending the quarter with 45 holdings.
Net contributors to performance for the period included:
| | ● | IAC/Interactive Corp |
| | ● | HBM Healthcare Investments |
| | ● | KKR & Co Inc |
Net detractors to performance included:
| | ● | Macquarie Infrastructure Corporation |
| | ● | AURELIUS Equity Opportunities SE & Co |
| | ● | Schouw & Co |
Currency Impacts
The Red Rocks Listed Private Equity Fund (the “Fund”), being global in nature, holds assets denominated in currencies other than the US dollar. Changes in the relative value of the US dollar can both enhance and detract from investment performance of the fund.
For the past fiscal year, currency was a detractor, contributing -2.65% to the fund’s performance.
Outlook for Private Equity and Portfolio
Despite growing investor uncertainty, we believe that the environment is favorable for M&A and believe it can persist for the foreseeable future. Although interest rates have increased, which
ALPS | Red Rocks Listed Private Equity Fund
| Management Commentary | October 31, 2018 (Unaudited) |
increased the cost of capital for PE firms, we believe that rates will stabilize in the next year or so and believe that the more capable PE firms have the ability to navigate these environments. With heightened global economic uncertainty, the US continues to attract capital as a relatively safe haven, and we expect to favor US assets for the foreseeable future.
With continued rapid growth of private capital available to invest globally, we believe that PE will continue to become an increasingly important component of investor portfolios. We believe that the investment model of buying companies, improving them, and selling them or taking them public, has inherent advantages to investing in traditional public companies including tight alignment of interests, patient investment outlook with long-term value creation focus, and active management and accountability in the operations of portfolio companies.
There are a number of potential risks that may affect the portfolio including the uncertainty and timing of BREXIT, the toxicity of political environment in the US and Europe, ongoing changes in tariff and trade relations, a continued strong dollar, growing public deficits, and the growing issuance of lower-rated debt by public companies, to name a few.
In closing, we continue to believe that the fund can provide attractive risk-adjusted returns for investors over longer investment horizons.
We appreciate your continued interest in the fund and listed PE.
| Andrew Drummond | Kirk McCown, CFA | Wyck Brown, CFA |
| Portfolio Manager | Portfolio Manager | Portfolio Manager |
The views of the authors and information discussed in this commentary are as of the date of publication, are subject to change, and may not reflect the writer's current views. The views expressed are those of the authors only, and represent an assessment of market conditions at a specific point in time, are opinions only and should not be relied upon as investment advice regarding a particular investment or markets in general. Such information does not constitute a recommendation to buy or sell specific securities or investment vehicles. It should not be assumed that any investment will be profitable or will equal the performance of the fund(s) or any securities or any sectors mentioned in this letter. The subject matter contained in this letter has been derived from several sources believed to be reliable and accurate at the time of compilation. Neither ALPS, Advisors, Inc., Red Rocks Capital, LLC, nor the Fund accepts any liability for losses either direct or consequential caused by the use of this information.
Diversification cannot guarantee gain or prevent losses.
ALPS | Red Rocks Listed Private Equity Fund
| Performance Update | October 31, 2018 (Unaudited) |
Performance of $10,000 Initial Investment (as of October 31, 2018)
Comparison of change in value of a $10,000 investment
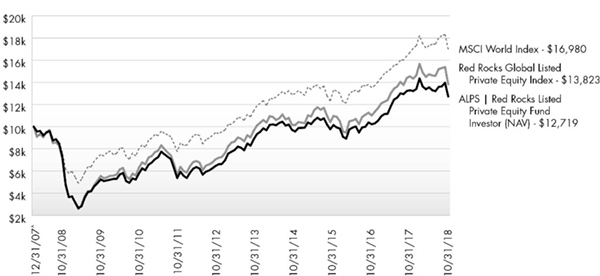
The chart above represents historical performance of a hypothetical investment of $10,000 in the Fund since inception. Past performance does not guarantee future results. This chart does not reflect the deduction of taxes that a shareholder would pay on Fund distributions or the redemption of Fund shares.
Average Annual Total Returns (as of October 31, 2018)
| | 6 Month | 1 Year | 3 Year | 5 Year | 10 Year | Since Inception^ | Total Expense Ratio | What You Pay* |
| Investor# (NAV) | -6.09% | -4.23% | 7.84% | 6.41% | 10.24% | 2.24% | 1.99% | 1.99% |
| Class A (NAV) | -6.09% | -4.23% | 7.84% | 6.41% | 10.24% | 2.24% | 1.99% | 1.99% |
| Class A (MOP) | -11.24% | -9.51% | 5.85% | 5.21% | 9.61% | 1.71% |
| Class C (NAV) | -6.42% | -4.88% | 7.12% | 5.71% | 9.40% | 1.47% | 2.65% | 2.65% |
| Class C (CDSC) | -7.36% | -5.72% | 7.12% | 5.71% | 9.40% | 1.47% |
| Class I | -5.85% | -3.87% | 8.19% | 6.74% | 10.54% | 2.55% | 1.68% | 1.68% |
| Class R | -6.05% | -4.31% | 7.66% | 6.29% | 10.00% | 2.02% | 2.08% | 2.08% |
| MSCI World Index1 | -1.90% | 1.71% | 8.52% | 7.40% | 10.65% | 5.01% | | |
| Red Rocks Global Listed Private Equity Index2 | -6.12% | -4.90% | 8.05% | 6.47% | 11.30% | 3.03% | | |
Performance data quoted represents past performance. Past performance does not guarantee future results. Investment return and principal value of an investment will fluctuate so that an investor’s shares, when sold or redeemed, may be worth more or less than the original cost. Current performance data may be higher or lower than actual data quoted. For the most current month-end performance data, please call 1-866-759-5679.
Maximum Offering Price (MOP) for Class A shares includes the Fund’s maximum sales charge of 5.50%. Performance shown at NAV does not include these sales charges and would have been lower had it been taken into account. If you invest $1 million or more, either as a lump sum or through the Fund’s accumulation or letter of intent programs, you can purchase Class A shares without an initial sales charge (load). A Contingent Deferred Sales Charge (“CDSC”) of 1.00% may apply to Class C shares redeemed within the first 12 months after a purchase, and on Class A shares redeemed within the first 18 months after a purchase in excess of $1 million. The Fund imposes a 2.00% redemption fee on shares held for less than 90 days.
Performance less than 1 year is cumulative.
ALPS | Red Rocks Listed Private Equity Fund
| Performance Update | October 31, 2018 (Unaudited) |
Performance shown for Class A shares prior to June 12, 2018 reflects the historical performance of the Fund’s Investor shares, calculated using the fees and expenses of Class A shares.
Performance shown for Class C shares prior to June 30, 2010 reflects the historical performance of the Fund’s Investor shares, calculated using the fees and expenses of Class C shares.
| 1 | MSCI World Index: Morgan Stanley Capital International’s market capitalization weighted index is composed of companies representative of the market structure of 22 developed market countries in North America, Europe and the Asia/Pacific Region. The index is not actively managed and does not reflect any deduction for fees, expenses or taxes. An investor may not invest directly in an index. |
| 2 | The Red Rocks Global Listed Private Equity Index includes securities, ADRs and GDRs of 40 to 75 private equity companies, including business development companies, master limited partnerships and other vehicles whose principal business is to invest in, lend capital to or provide services to privately held companies. The Red Rocks Global Listed Private Equity Index is managed by the Fund’s Sub-Advisor. An investor may not invest directly in an index. |
| ^ | Fund Inception date of December 31, 2007 for Investor Class, Class I, and Class R; Fund Inception date June 30, 2010 for Class C; Fund Inception date June 12, 2018 for Class A. |
| * | What You Pay reflects the Advisor's and Sub-Advisor’s decision to contractually limit expenses through February 28, 2020 for Class A and February 28, 2019 for all other classes, and Acquired Fund Fees and Expenses of 0.52%. Please see the current prospectus for additional information. |
| # | Prior to December 1, 2017, Investor Class was known as Class A. |
The table does not reflect the deduction of taxes that a shareholder would pay on Fund distributions or the redemption of Fund shares.
This Fund is not suitable for all investors and is subject to investment risks, including possible loss of the principal amount invested.
Listed Private Equity Companies are subject to various risks depending on their underlying investments, which could include, but are not limited to, additional liquidity risk, industry risk, non-U.S. security risk, currency risk, credit risk, managed portfolio risk and derivatives risk (derivatives risk is the risk that the value of the Listed Private Equity Companies’ derivative investments will fall because of pricing difficulties or lack of correlation with the underlying investment).
There are inherent risks in investing in private equity companies, which encompass financial institutions or vehicles whose principal business is to invest in and lend capital to privately held companies. Generally, little public information exists for private and thinly traded companies, and there is a risk that investors may not be able to make a fully informed investment decision.
Listed Private Equity Companies may have relatively concentrated investment portfolios, consisting of a relatively small number of holdings. A consequence of this limited number of investments is that the aggregate returns realized may be adversely impacted by the poor performance of a small number of investments, or even a single investment, particularly if a company experiences the need to write down the value of an investment.
Certain of the Fund’s investments may be exposed to liquidity risk due to low trading volume, lack of a market maker or legal restrictions limiting the ability of the Fund to sell particular securities at an advantageous price and/or time. As a result, these securities may be more difficult to value. Foreign investing involves special risks, such as currency fluctuations and political uncertainty. The Fund invests in derivatives and is subject to the risk that the value of those derivative investments will fall because of pricing difficulties or lack of correlation with the underlying investment.
There is no guarantee that the Fund will continue to hold any one particular security or stay invested in any one particular company. The composition of the Fund's top holdings is subject to change. Performance figures are historical and reflect the change in share price, reinvested distributions, changes in net asset value, sales charges and capital gains distributions, if any.
Not FDIC Insured – No Bank Guarantee – May Lose Value
ALPS | Red Rocks Listed Private Equity Fund
| Performance Update | October 31, 2018 (Unaudited) |
| Top Ten Holdings (as a % of Net Assets) † | |
| | |
| IAC/InterActiveCorp | 5.59% |
| KKR & Co. LP | 4.44% |
| HarbourVest Global Private Equity, Ltd. | 4.09% |
| Blackstone Group LP | 4.00% |
| Berkshire Hathaway, Inc. | 4.00% |
| 3i Group PLC | 3.89% |
| AURELIUS Equity Opportunities SE & Co. KGaA | 3.84% |
| Brookfield Asset Management, Inc. | 3.34% |
| Ares Capital Corp. | 3.22% |
| Intermediate Capital Group PLC | 3.21% |
| Top Ten Holdings | 39.62% |
| † | Holdings are subject to change and my not reflect the current or future position of the portfolio. Table presents indicative values only. |
Industry Sector Allocation (as a % of Net Assets)

ALPS | Red Rocks Listed Private Equity Fund
| Statement of Investments | October 31, 2018 |
| | | Shares | | | Value (Note 2) | |
| CLOSED-END FUNDS (16.08%) | | | | | | | | |
| HarbourVest Global Private Equity, Ltd.(a) | | | 544,100 | | | $ | 9,536,726 | |
| HBM Healthcare Investments AG, Class A | | | 39,088 | | | | 6,438,912 | |
| HgCapital Trust PLC | | | 243,800 | | | | 6,136,376 | |
| ICG Enterprise Trust PLC | | | 112,513 | | | | 1,190,782 | |
| NB Private Equity Partners, Ltd. | | | 188,000 | | | | 2,604,806 | |
| Pantheon International PLC Fund(a) | | | 175,371 | | | | 4,684,932 | |
| Riverstone Energy, Ltd.(a) | | | 292,884 | | | | 4,597,198 | |
| 3i Infrastructure PLC | | | 750,000 | | | | 2,322,811 | |
| | | | | | | | | |
| TOTAL CLOSED-END FUNDS | | | | | | | | |
| (Cost $31,282,359) | | | | | | | 37,512,543 | |
| | | | | | | | | |
| COMMON STOCKS (81.58%) | | | | | | | | |
| Communications (14.25%) | | | | | | | | |
| Internet (6.78%) | | | | | | | | |
| IAC/InterActiveCorp(a) | | | 66,300 | | | | 13,033,917 | |
| Rocket Internet SE(a)(b)(c) | | | 96,400 | | | | 2,783,394 | |
| | | | | | | | 15,817,311 | |
| | | | | | | | | |
| Media (6.99%) | | | | | | | | |
| GCI Liberty, Inc., Class A(a) | | | 117,500 | | | | 5,561,275 | |
| Liberty Media Corp.-Liberty Formula One, Class A(a) | | | 101,000 | | | | 3,200,690 | |
| Liberty Media Corp.-Liberty SiriusXM, Class A(a) | | | 134,500 | | | | 5,546,780 | |
| Naspers, Ltd., Class N | | | 11,400 | | | | 1,999,570 | |
| | | | | | | | 16,308,315 | |
| | | | | | | | | |
| Telecommunications (0.48%) | | | | | | | | |
| SoftBank Group Corp. | | | 14,250 | | | | 1,127,728 | |
| | | | | | | | | |
| TOTAL COMMUNICATIONS | | | | | | | 33,253,354 | |
| | | | | | | | | |
| Diversified (3.15%) | | | | | | | | |
| Holding Companies-Diversified Operations (3.15%) |
| Schouw & Co. AB | | | 90,000 | | | | 7,349,179 | |
| | | | | | | | | |
| TOTAL DIVERSIFIED | | | | | | | 7,349,179 | |
| | | | | | | | | |
| Financials (54.68%) | | | | | | | | |
| Diversified Financial Services (25.45%) | | | | | |
| Berkshire Hathaway, Inc., Class B(a) | | | 45,500 | | | | 9,340,240 | |
| Blackstone Group LP | | | 288,800 | | | | 9,345,568 | |
| Cannae Holdings, Inc.(a) | | | 250,600 | | | | 4,628,582 | |
| Carlyle Group LP | | | 177,000 | | | | 3,587,790 | |
| EXOR N.V. | | | 68,300 | | | | 3,862,710 | |
| Intermediate Capital Group PLC | | | 616,000 | | | | 7,481,707 | |
| KKR & Co. LP, Class A | | | 437,700 | | | | 10,351,605 | |
| Pargesa Holding SA | | | 46,200 | | | | 3,391,544 | |
| Partners Group Holding AG | | | 10,400 | | | | 7,404,332 | |
| | | | | | | | 59,394,078 | |
| | | Shares | | | Value (Note 2) | |
| Holding Companies-Diversified Operations (4.36%) |
| Ackermans & van Haaren NV | | | 33,000 | | | $ | 5,195,436 | |
| Wendel SA | | | 38,400 | | | | 4,975,726 | |
| | | | | | | | 10,171,162 | |
| | | | | | | | | |
| Investment Companies (15.87%) | | | | | | | | |
| 3i Group PLC | | | 810,000 | | | | 9,069,831 | |
| Ares Capital Corp. | | | 438,000 | | | | 7,516,080 | |
| AURELIUS Equity Opportunities SE & Co. KGaA | | | 192,568 | | | | 8,956,498 | |
| Eurazeo SE | | | 75,001 | | | | 5,477,137 | |
| Investor AB, B Shares | | | 125,400 | | | | 5,433,126 | |
| mutares AG | | | 57,000 | | | | 585,559 | |
| | | | | | | | 37,038,231 | |
| | | | | | | | | |
| Private Equity (5.66%) | | | | | | | | |
| Brederode SA | | | 28,717 | | | | 1,735,237 | |
| Onex Corp. | | | 77,000 | | | | 5,062,364 | |
| Princess Private Equity Holding, Ltd. | | | 145,400 | | | | 1,640,286 | |
| Standard Life Private Equity | | | 1,094,601 | | | | 4,757,009 | |
| | | | | | | | 13,194,896 | |
| | | | | | | | | |
| Real Estate (3.34%) | | | | | | | | |
| Brookfield Asset Management, Inc., Class A | | | 191,200 | | | | 7,791,400 | |
| | | | | | | | | |
| TOTAL FINANCIALS | | | | | | | 127,589,767 | |
| | | | | | | | | |
| Industrials (7.81%) | | | | | | | | |
| Commercial Services (1.36%) | | | | | | | | |
| Brookfield Business Partners LP | | | 79,000 | | | | 3,181,123 | |
| | | | | | | | | |
| Electrical Equipment (1.18%) | | | | | | | | |
| Melrose Industries PLC | | | 1,275,313 | | | | 2,745,240 | |
| | | | | | | | | |
| Miscellaneous Manufacturers (5.27%) | | | | | | | | |
| Aalberts Industries NV | | | 94,000 | | | | 3,445,861 | |
| Danaher Corp. | | | 56,500 | | | | 5,616,100 | |
| Gesco AG | | | 13,967 | | | | 436,380 | |
| Indus Holding AG | | | 51, 500 | | | | 2,811,858 | |
| | | | | | | | 12,310,199 | |
| | | | | | | | | |
| TOTAL INDUSTRIALS | | | | | | | 18,236,562 | |
ALPS | Red Rocks Listed Private Equity Fund
| Statement of Investments | October 31, 2018 |
| | | Shares | | | Value (Note 2) | |
| Utilities (1.69%) | | | | | | |
| Electric (1.69%) | | | | | | |
| Brookfield Infrastructure Partners LP | | | 105,500 | | | $ | 3,937,260 | |
| | | | | | | | | |
| TOTAL UTILITIES | | | | | | | 3,937,260 | |
| | | | | | | | | |
| TOTAL COMMON STOCKS | | | | | | | | |
| (Cost $174,637,980) | | | | | | | 190,366,122 | |
| | | 7-Day Yield | | | Shares | | | Value (Note 2) | |
| SHORT-TERM INVESTMENTS (1.55%) | |
| Money Market Fund (1.55%) | |
| State Street Institutional Treasury Plus Money Market Fund | | | 2.109 | % | | | 3,629,019 | | | | 3,629,019 | |
| | | | | | | | | | | | | |
| TOTAL MONEY MARKET FUND | | | | | | | | | | | 3,629,019 | |
| | | | | | | | | | | | | |
| TOTAL SHORT-TERM INVESTMENTS | | | | | | | | | | | | |
| (Cost $3,629,019) | | | | | | | | | | | 3,629,019 | |
| | | | | | | | | | | | | |
| TOTAL INVESTMENTS (99.21%) | | | | | | | | | | | | |
| (Cost $209,549,358) | | | | | | | | | | $ | 231,507,684 | |
| | | | | | | | | | | | | |
| Other Assets In Excess Of Liabilities (0.79%) | | | | | | | | | | | 1,842,047 | |
| | | | | | | | | | | | | |
| NET ASSETS (100.00%) | | | | | | | | | | $ | 233,349,731 | |
| (a) | Non-Income Producing Security. |
| (b) | Security exempt from registration under Rule 144A of the Securities Act of 1933. This security may be resold in transactions exempt from registration, normally to qualified institutional buyers. As of October 31, 2018, the aggregate market value of those securities was $2,783,394, representing 1.19% of net assets. |
| (c) | Securities were purchased pursuant to Regulation S under the Securities Act of 1933, which exempts securities offered and sold outside of the United States from registration. Such securities cannot be sold in the United States without either an effective registration statement filed pursuant to the Securities Act of 1933, or pursuant to an exemption from registration. These securities have been deemed liquid under guidelines approved by the Fund's Board of Trustees. As of October 31, 2018 the aggregate market value of those securities was $2,783,394 representing 1.19% of net assets. |
For Fund compliance purposes, the Fund's industry classifications refer to any one or more of the industry sub-classifications used by one or more widely recognized market indexes or ratings group indexes, and/or as defined by Fund management. This definition may not apply for purposes of this report, which may combine industry sub-classifications for reporting ease. Industries are shown as a percent of net assets.
See Notes to Financial Statements.
ALPS | Red Rocks Listed Private Equity Fund
| Statement of Assets and Liabilities | October 31, 2018 |
| ASSETS | | | |
| Investments, at value | | $ | 231,507,684 | |
| Foreign currency, at value (Cost $4,497) | | | 4,497 | |
| Receivable for investments sold | | | 1,159,220 | |
| Receivable for shares sold | | | 282,868 | |
| Dividends receivable | | | 911,890 | |
| Prepaid expenses and other assets | | | 22,271 | |
| Total Assets | | | 233,888,430 | |
| LIABILITIES | | | | |
| Payable for investments purchased | | | 126,143 | |
| Payable for shares redeemed | | | 84,484 | |
| Investment advisory fees payable | | | 176,681 | |
| Administration and transfer agency fees payable | | | 59,350 | |
| Distribution and services fees payable | | | 48,108 | |
| Professional fees payable | | | 21,789 | |
| Custody fees payable | | | 5,530 | |
| Accrued expenses and other liabilities | | | 16,614 | |
| Total Liabilities | | | 538,699 | |
| NET ASSETS | | $ | 233,349,731 | |
| NET ASSETS CONSIST OF | | | | |
| Paid-in capital | | $ | 211,241,132 | |
| Total distributable earnings | | | 22,108,599 | |
| NET ASSETS | | $ | 233,349,731 | |
| INVESTMENTS, AT COST | | $ | 209,549,358 | |
| PRICING OF SHARES | | | | |
| Investor Class: | | | | |
| Net Asset Value, offering and redemption price per share | | $ | 6.79 | |
| Net Assets | | $ | 35,775,102 | |
| Shares of beneficial interest outstanding (unlimited number of shares, no par value common stock authorized) | | | 5,267,562 | |
| Class A: | | | | |
| Net Asset Value, offering and redemption price per share | | $ | 6.79 | |
| Net Assets | | $ | 9,392 | |
| Shares of beneficial interest outstanding (unlimited number of shares, no par value common stock authorized) | | | 1,383 | |
| Maximum offering price per share ((NAV/0.9450), based on maximum sales charge of 5.50% of the offering price) | | $ | 7.19 | |
| Class C: | | | | |
| Net Asset Value, offering and redemption price per share(a) | | $ | 6.41 | |
| Net Assets | | $ | 18,847,408 | |
| Shares of beneficial interest outstanding (unlimited number of shares, no par value common stock authorized) | | | 2,941,087 | |
| Class I: | | | | |
| Net Asset Value, offering and redemption price per share | | $ | 6.92 | |
| Net Assets | | $ | 174,033,618 | |
| Shares of beneficial interest outstanding (unlimited number of shares, no par value common stock authorized) | | | 25,165,314 | |
| Class R: | | | | |
| Net Asset Value, offering and redemption price per share | | $ | 5.75 | |
| Net Assets | | $ | 4,684,211 | |
| Shares of beneficial interest outstanding (unlimited number of shares, no par value common stock authorized) | | | 815,290 | |
| (a) | Redemption price per share may be reduced for any applicable contingent deferred sales charge. For a description of a possible sales charge, please see the Fund's Prospectus. |
See Notes to Financial Statements.
ALPS | Red Rocks Listed Private Equity Fund
| Statement of Operations | For the Year Ended October 31, 2018 |
| INVESTMENT INCOME | | | |
| Dividends | | $ | 5,967,874 | |
| Foreign taxes withheld on dividends | | | (391,580 | ) |
| Total Investment Income | | | 5,576,294 | |
| | | | | |
| EXPENSES | | | | |
| Investment advisory fees | | | 2,073,011 | |
| Administrative fees | | | 204,894 | |
| Transfer agency fees | | | 215,017 | |
| Distribution and service fees | | | | |
| Investor Class(a) | | | 172,160 | |
| Class A(b) | | | 15 | |
| Class C | | | 203,344 | |
| Class R | | | 23,910 | |
| Professional fees | | | 36,529 | |
| Reports to shareholders and printing fees | | | 62,255 | |
| State registration fees | | | 86,363 | |
| Insurance fees | | | 1,473 | |
| Custody fees | | | 43,612 | |
| Trustees' fees and expenses | | | 5,719 | |
| Miscellaneous expenses | | | 16,827 | |
| Total Expenses | | | 3,145,129 | |
| Net Investment Income | | | 2,431,165 | |
| Net realized gain on investments | | | 10,137,858 | |
| Net realized loss on foreign currency transactions | | | (26,004 | ) |
| Net Realized Gain | | | 10,111,854 | |
| Net change in unrealized depreciation on investments | | | (24,045,071 | ) |
| Net change in unrealized depreciation on translation of assets and liabilities denominated in foreign currencies | | | (48,517 | ) |
| Net Change in Unrealized Depreciation | | | (24,093,588 | ) |
| NET REALIZED AND UNREALIZED LOSS ON INVESTMENTS | | | (13,981,734 | ) |
| NET DECREASE IN NET ASSETS RESULTING FROM OPERATIONS | | $ | (11,550,569 | ) |
| (a) | Prior to December 1, 2017, Investor Class was known as Class A. |
| (b) | Class A commenced operations on June 12, 2018. |
See Notes to Financial Statements.
ALPS | Red Rocks Listed Private Equity Fund
Statements of Changes in Net Assets
| | | For the Year Ended October 31, 2018 | | | For the Year Ended October 31, 2017 | |
| OPERATIONS | | | | | | |
| Net investment income | | $ | 2,431,165 | | | $ | 3,836,100 | |
| Net realized gain | | | 10,111,854 | | | | 30,771,017 | |
| Net change in unrealized appreciation/(depreciation) | | | (24,093,588 | ) | | | 23,527,938 | |
| Net Increase/(Decrease) in Net Assets Resulting from Operations | | | (11,550,569 | ) | | | 58,135,055 | |
| | | | | | | | | |
| TOTAL DISTRIBUTIONS(a) | | | | | | | | |
| From distributable earnings | | | | | | | | |
| Investor Class(b) | | | (6,193,061 | ) | | | (809,606 | ) |
| Class C | | | (2,314,637 | ) | | | (225,242 | ) |
| Class I | | | (16,927,864 | ) | | | (2,414,838 | ) |
| Class R | | | (598,880 | ) | | | (50,266 | ) |
| Net Decrease in Net Assets from Distributions | | | (26,034,442 | ) | | | (3,499,952 | ) |
| | | | | | | | | |
| BENEFICIAL INTEREST TRANSACTIONS (NOTE 6) | | | | | | | | |
| Shares sold | | | | | | | | |
| Investor Class(b) | | | 12,212,424 | | | | 21,768,592 | |
| Class A(c) | | | 10,000 | | | | – | |
| Class C | | | 4,958,534 | | | | 4,263,157 | |
| Class I | | | 92,888,080 | | | | 50,050,247 | |
| Class R | | | 1,900,543 | | | | 1,313,352 | |
| Dividends reinvested | | | | | | | | |
| Investor Class(b) | | | 5,142,819 | | | | 650,227 | |
| Class C | | | 1,683,239 | | | | 145,779 | |
| Class I | | | 13,931,101 | | | | 2,078,633 | |
| Class R | | | 590,986 | | | | 49,633 | |
| Shares redeemed, net of redemption fees | | | | | | | | |
| Investor Class(b) | | | (29,194,838 | ) | | | (109,952,100 | ) |
| Class C | | | (3,446,709 | ) | | | (3,954,133 | ) |
| Class I | | | (45,851,923 | ) | | | (130,375,992 | ) |
| Class R | | | (1,217,147 | ) | | | (792,847 | ) |
| Net Increase/(Decrease) in Net Assets Derived from Beneficial Interest Transactions | | | 53,607,109 | | | | (164,755,452 | ) |
| | | | | | | | | |
| Net increase/(decrease) in net assets | | | 16,022,098 | | | | (110,120,349 | ) |
| | | | | | | | | |
| NET ASSETS | | | | | | | | |
| Beginning of year | | | 217,327,633 | | | | 327,447,982 | |
| End of year | | $ | 233,349,731 | | | $ | 217,327,633 | (d) |
| (a) | For the prior year ended October 31, 2017, Total Distributions consisted of Net Investment Income $3,499,952, and Net Realized Gains $–. |
| (b) | Prior to December 1, 2017, Investor Class was known as Class A. |
| (c) | Class A commenced operations on June 12, 2018. |
| (d) | For the prior year ended October 31, 2017, included accumulated net investment income of $5,420,898. |
See Notes to Financial Statements.
ALPS | Red Rocks Listed Private Equity Fund – Investor Class
Financial Highlights
Selected data for a share of beneficial interest outstanding throughout the periods indicated:
| | | For the Year Ended October 31, 2018(a) | | | For the Year Ended October 31, 2017 | | | For the Year Ended October 31, 2016 | | | For the Year Ended October 31, 2015 | | | For the Fiscal Period Ended October 31, 2014(b) | | | For the Year Ended April 30, 2014 | |
| Net asset value, beginning of period | | $ | 8.05 | | | $ | 6.29 | | | $ | 6.76 | | | $ | 6.61 | | | $ | 7.00 | | | $ | 6.05 | |
| INCOME/(LOSS) FROM INVESTMENT OPERATIONS: | | | | | | | | | | | | | | | |
| Net investment income(c) | | | 0.06 | | | | 0.12 | | | | 0.06 | | | | 0.05 | | | | 0.02 | | | | 0.03 | |
| Net realized and unrealized gain/(loss) | | | (0.37 | ) | | | 1.74 | | | | (0.04 | ) | | | 0.34 | | | | (0.41 | ) | | | 1.37 | |
| Total from investment operations | | | (0.31 | ) | | | 1.86 | | | | 0.02 | | | | 0.39 | | | | (0.39 | ) | | | 1.40 | |
| DISTRIBUTIONS: | | | | | | | | | | | | | | | | | | | | | | | | |
| From net investment income | | | (0.70 | ) | | | (0.10 | ) | | | (0.22 | ) | | | (0.22 | ) | | | – | | | | (0.45 | ) |
| From net realized gains | | | (0.25 | ) | | | – | | | | (0.27 | ) | | | (0.02 | ) | | | – | | | | – | |
| Total distributions | | | (0.95 | ) | | | (0.10 | ) | | | (0.49 | ) | | | (0.24 | ) | | | – | | | | (0.45 | ) |
| REDEMPTION FEES ADDED TO PAID-IN CAPITAL (NOTE 6) | | | 0.00 | (d) | | | 0.00 | (d) | | | 0.00 | (d) | | | 0.00 | (d) | | | 0.00 | (d) | | | 0.00 | (d) |
| Net increase/(decrease) in net asset value | | | (1.26 | ) | | | 1.76 | | | | (0.47 | ) | | | 0.15 | | | | (0.39 | ) | | | 0.95 | |
| Net asset value, end of year | | $ | 6.79 | | | $ | 8.05 | | | $ | 6.29 | | | $ | 6.76 | | | $ | 6.61 | | | $ | 7.00 | |
| TOTAL RETURN(e) | | | (4.23 | )% | | | 29.97 | % | | | 0.76 | % | | | 6.01 | % | | | (5.57 | )% | | | 23.54 | % |
| RATIOS/SUPPLEMENTAL DATA: | | | | | | | | | | | | | | | | | | | | | | | | |
| Net assets, end of year (000s) | | $ | 35,775 | | | $ | 55,538 | | | $ | 128,920 | | | $ | 193,561 | | | $ | 203,996 | | | $ | 205,727 | |
| Ratio of expenses to average net assets excluding fee waivers and reimbursements(f) | | | 1.40 | % | | | 1.38 | % | | | 1.47 | % | | | 1.47 | % | | | 1.59 | %(g) | | | 1.64 | % |
| Ratio of expenses to average net assets including fee waivers and reimbursements(f) | | | 1.40 | % | | | 1.38 | % | | | 1.47 | % | | | 1.47 | % | | | 1.59 | %(g) | | | 1.64 | % |
| Ratio of net investment income to average net assets(f) | | | 0.86 | % | | | 1.63 | % | | | 1.07 | % | | | 0.72 | % | | | 0.71 | %(g) | | | 0.46 | % |
| Portfolio turnover rate(h) | | | 29 | % | | | 31 | % | | | 30 | % | | | 37 | % | | | 11 | % | | | 40 | % |
| (a) | Prior to December 1, 2017, Investor Class was known as Class A. |
| (b) | Effective May 1, 2014, the Board approved changing the fiscal year-end of the Funds from April 30 to October 31. |
| (c) | Calculated using the average shares method. |
| (d) | Less than $0.005 or ($0.005) per share. |
| (e) | Total returns are for the period indicated and have not been annualized. Total returns would have been lower had certain expenses not been waived during the period. Returns shown do not reflect the deduction of taxes that a shareholder would pay on Fund distributions or the redemption of Fund shares. Returns shown exclude any applicable sales charges. |
| (f) | The ratios exclude the impact of expenses of the underlying funds in which the Fund invests as represented in the Statement of Investments. |
| (h) | Portfolio turnover rate for periods less than one full year have not been annualized. |
See Notes to Financial Statements.
ALPS | Red Rocks Listed Private Equity Fund – Class A
Financial Highlights
Selected data for a share of beneficial interest outstanding throughout the periods indicated:
| | | For the Period June 12, 2018 (Commencement of Operations) to October 31, 2018 | |
| Net asset value, beginning of period | | $ | 7.23 | |
| | | | | |
| INCOME FROM INVESTMENT OPERATIONS: | | | | |
| Net investment income(a) | | | 0.01 | |
| Net realized and unrealized loss | | | (0.45 | ) |
| Total from investment operations | | | (0.44 | ) |
| | | | | |
| Net (decrease) in net asset value | | | (0.44 | ) |
| Net asset value, end of year | | $ | 6.79 | |
| TOTAL RETURN(b) | | | (6.09 | )% |
| | | | | |
| RATIOS/SUPPLEMENTAL DATA: | | | | |
| Net assets, end of year (000s) | | $ | 9 | |
| Ratio of expenses to average net assets excluding fee waivers and reimbursements(c) | | | 1.48 | %(d) |
| Ratio of expenses to average net assets including fee waivers and reimbursements(c) | | | 1.48 | %(d) |
| Ratio of net investment income to average net assets | | | 0.37 | %(d) |
| Portfolio turnover rate(e) | | | 29 | % |
| (a) | Calculated using the average shares method. |
| (b) | Total returns are for the period indicated and have not been annualized. Total returns would have been lower had certain expenses not been waived during the period. Returns shown do not reflect the deduction of taxes that a shareholder would pay on Fund distributions or the redemption of Fund shares. |
| (c) | The ratios exclude the impact of expenses of the underlying funds in which the Fund invests as represented in the Statement of Investments. |
| (e) | Portfolio turnover rate for periods less than one full year have not been annualized. |
See Notes to Financial Statements.
ALPS | Red Rocks Listed Private Equity Fund – Class C
Financial Highlights
Selected data for a share of beneficial interest outstanding throughout the periods indicated:
| | | For the Year Ended October 31, 2018 | | | For the Year Ended October 31, 2017 | | | For the Year Ended October 31, 2016 | | | For the Year Ended October 31, 2015 | | | For the Fiscal Period Ended October 31, 2014(a) | | | For the Year Ended April 30, 2014 | |
| Net asset value, beginning of period | | $ | 7.66 | | | $ | 6.04 | | | $ | 6.53 | | | $ | 6.43 | | | $ | 6.83 | | | $ | 5.92 | |
| INCOME/(LOSS) FROM INVESTMENT OPERATIONS: | | | | | | | | | |
| Net investment income/(loss)(b) | | | 0.01 | | | | 0.06 | | | | 0.03 | | | | 0.00 | (c) | | | (0.00 | )(c) | | | (0.00 | )(c) |
| Net realized and unrealized gain/(loss) | | | (0.34 | ) | | | 1.65 | | | | (0.03 | ) | | | 0.32 | | | | (0.40 | ) | | | 1.33 | |
| Total from investment operations | | | (0.33 | ) | | | 1.71 | | | | – | | | | 0.32 | | | | (0.40 | ) | | | 1.33 | |
| DISTRIBUTIONS: | | | | | | | | | | | | | | | | | | | | | | | | |
| From net investment income | | | (0.67 | ) | | | (0.09 | ) | | | (0.22 | ) | | | (0.20 | ) | | | – | | | | (0.42 | ) |
| From net realized gains | | | (0.25 | ) | | | – | | | | (0.27 | ) | | | (0.02 | ) | | | – | | | | – | |
| Total distributions | | | (0.92 | ) | | | (0.09 | ) | | | (0.49 | ) | | | (0.22 | ) | | | – | | | | (0.42 | ) |
| REDEMPTION FEES ADDED TO PAID-IN CAPITAL (NOTE 6) | | | – | | | | 0.00 | (c) | | | 0.00 | (c) | | | 0.00 | (c) | | | 0.00 | (c) | | | 0.00 | (c) |
| Net increase/(decrease) in net asset value | | | (1.25 | ) | | | 1.62 | | | | (0.49 | ) | | | 0.10 | | | | (0.40 | ) | | | 0.91 | |
| Net asset value, end of year | | $ | 6.41 | | | $ | 7.66 | | | $ | 6.04 | | | $ | 6.53 | | | $ | 6.43 | | | $ | 6.83 | |
| TOTAL RETURN(d) | | | (4.88 | )% | | | 28.79 | % | | | 0.34 | % | | | 5.14 | % | | | (5.86 | )% | | | 22.97 | % |
| RATIOS/SUPPLEMENTAL DATA: | | | | | | | | | | | | | | | | | | | | | | | | |
| Net assets, end of year (000s) | | $ | 18,847 | | | $ | 18,981 | | | $ | 14,784 | | | $ | 19,300 | | | $ | 17,193 | | | $ | 12,200 | |
| Ratio of expenses to average net assets excluding fee waivers and reimbursements(e) | | | 2.12 | % | | | 2.13 | % | | | 2.16 | % | | | 2.12 | % | | | 2.15 | %(f) | | | 2.20 | % |
| Ratio of expenses to average net assets including fee waivers and reimbursements(e) | | | 2.12 | % | | | 2.13 | % | | | 2.16 | % | | | 2.12 | % | | | 2.15 | %(f) | | | 2.20 | % |
| Ratio of net investment income/(loss) to average net assets(e) | | | 0.15 | % | | | 0.83 | % | | | 0.49 | % | | | 0.06 | % | | | (0.13 | )%(f) | | | (0.04 | )% |
| Portfolio turnover rate(g) | | | 29 | % | | | 31 | % | | | 30 | % | | | 37 | % | | | 11 | % | | | 40 | % |
| (a) | Effective May 1, 2014, the Board approved changing the fiscal year-end of the Funds from April 30 to October 31. |
| (b) | Calculated using the average shares method. |
| (c) | Less than $0.005 or ($0.005) per share. |
| (d) | Total returns are for the period indicated and have not been annualized. Total returns would have been lower had certain expenses not been waived during the period. Returns shown do not reflect the deduction of taxes that a shareholder would pay on Fund distributions or the redemption of Fund shares. Returns shown exclude any applicable sales charges. |
| (e) | The ratios exclude the impact of expenses of the underlying funds in which the Fund invests as represented in the Statement of Investments. |
| (g) | Portfolio turnover rate for periods less than one full year have not been annualized. |
See Notes to Financial Statements.
ALPS | Red Rocks Listed Private Equity Fund – Class I
Financial Highlights
Selected data for a share of beneficial interest outstanding throughout the periods indicated:
| | | For the Year Ended October 31, 2018 | | | For the Year Ended October 31, 2017 | | | For the Year Ended October 31, 2016 | | | For the Year Ended October 31, 2015 | | | For the Fiscal Period Ended October 31, 2014(a) | | | For the Year Ended April 30, 2014 | |
| Net asset value, beginning of period | | $ | 8.18 | | | $ | 6.39 | | | $ | 6.83 | | | $ | 6.67 | | | $ | 7.05 | | | $ | 6.08 | |
| INCOME/(LOSS) FROM INVESTMENT OPERATIONS: | | | | | | | | | |
| Net investment income(b) | | | 0.09 | | | | 0.13 | | | | 0.09 | | | | 0.07 | | | | 0.03 | | | | 0.06 | |
| Net realized and unrealized gain/(loss) | | | (0.37 | ) | | | 1.76 | | | | (0.03 | ) | | | 0.34 | | | | (0.41 | ) | | | 1.37 | |
| Total from investment operations | | | (0.28 | ) | | | 1.89 | | | | 0.06 | | | | 0.41 | | | | (0.38 | ) | | | 1.43 | |
| DISTRIBUTIONS: | | | | | | | | | | | | | | | | | | | | | | | | |
| From net investment income | | | (0.73 | ) | | | (0.10 | ) | | | (0.23 | ) | | | (0.23 | ) | | | – | | | | (0.46 | ) |
| From net realized gains | | | (0.25 | ) | | | – | | | | (0.27 | ) | | | (0.02 | ) | | | – | | | | – | |
| Total distributions | | | (0.98 | ) | | | (0.10 | ) | | | (0.50 | ) | | | (0.25 | ) | | | – | | | | (0.46 | ) |
| REDEMPTION FEES ADDED TO PAID-IN CAPITAL (NOTE 6) | | | 0.00 | (c) | | | 0.00 | (c) | | | 0.00 | (c) | | | 0.00 | (c) | | | 0.00 | (c) | | | 0.00 | (c) |
| Net increase/(decrease) in net asset value | | | (1.26 | ) | | | 1.79 | | | | (0.44 | ) | | | 0.16 | | | | (0.38 | ) | | | 0.97 | |
| Net asset value, end of year | | $ | 6.92 | | | $ | 8.18 | | | $ | 6.39 | | | $ | 6.83 | | | $ | 6.67 | | | $ | 7.05 | |
| TOTAL RETURN(d) | | | (3.87 | )% | | | 30.09 | % | | | 1.27 | % | | | 6.30 | % | | | (5.39 | )% | | | 24.02 | % |
| RATIOS/SUPPLEMENTAL DATA: | | | | | | | | | | | | | | | | | | | | | | | | |
| Net assets, end of year (000s) | | $ | 174,034 | | | $ | 138,572 | | | $ | 180,892 | | | $ | 287,741 | | | $ | 249,375 | | | $ | 202,076 | |
| Ratio of expenses to average net assets excluding fee waivers and reimbursements(e) | | | 1.15 | % | | | 1.16 | % | | | 1.18 | % | | | 1.16 | % | | | 1.25 | %(f) | | | 1.25 | % |
| Ratio of expenses to average net assets including fee waivers and reimbursements(e) | | | 1.15 | % | | | 1.16 | % | | | 1.18 | % | | | 1.16 | % | | | 1.25 | %(f) | | | 1.25 | % |
| Ratio of net investment income to average net assets(e) | | | 1.15 | % | | | 1.85 | % | | | 1.48 | % | | | 1.02 | % | | | 0.85 | %(f) | | | 0.91 | % |
| Portfolio turnover rate(g) | | | 29 | % | | | 31 | % | | | 30 | % | | | 37 | % | | | 11 | % | | | 40 | % |
| (a) | Effective May 1, 2014, the Board approved changing the fiscal year-end of the Funds from April 30 to October 31. |
| (b) | Calculated using the average shares method. |
| (c) | Less than $0.005 or ($0.005) per share. |
| (d) | Total returns are for the period indicated and have not been annualized. Total returns would have been lower had certain expenses not been waived during the period. Returns shown do not reflect the deduction of taxes that a shareholder would pay on Fund distributions or the redemption of Fund shares. |
| (e) | The ratios exclude the impact of expenses of the underlying funds in which the Fund invests as represented in the Statement of Investments. |
| (g) | Portfolio turnover rate for periods less than one full year have not been annualized. |
See Notes to Financial Statements.
ALPS | Red Rocks Listed Private Equity Fund – Class R
Financial Highlights
Selected data for a share of beneficial interest outstanding throughout the periods indicated:
| | | For the Year Ended October 31, 2018 | | For the Year Ended October 31, 2017 | | For the Year Ended October 31, 2016 | | For the Year Ended October 31, 2015 | | For the Fiscal Period Ended October 31, 2014(a) | | For the Year Ended April 30, 2014 |
| Net asset value, beginning of period | | $ | 6.97 | | | $ | 5.48 | | | $ | 5.96 | | | $ | 5.87 | | | $ | 6.21 | | | $ | 5.41 | |
| INCOME/(LOSS) FROM INVESTMENT OPERATIONS: | | | | | | | | | | | | |
| Net investment income(b) | | | 0.04 | | | | 0.09 | | | | 0.06 | | | | 0.03 | | | | 0.01 | | | | 0.02 | |
| Net realized and unrealized gain/(loss) | | | (0.30 | ) | | | 1.50 | | | | (0.05 | ) | | | 0.31 | | | | (0.36 | ) | | | 1.22 | |
| Total from investment operations | | | (0.26 | ) | | | 1.59 | | | | 0.01 | | | | 0.34 | | | | (0.35 | ) | | | 1.24 | |
| DISTRIBUTIONS: | | | | | | | | | | | | | | | | | | | | | | | | |
| From net investment income | | | (0.71 | ) | | | (0.10 | ) | | | (0.22 | ) | | | (0.23 | ) | | | – | | | | (0.44 | ) |
| From net realized gains | | | (0.25 | ) | | | – | | | | (0.27 | ) | | | (0.02 | ) | | | – | | | | – | |
| Total distributions | | | (0.96 | ) | | | (0.10 | ) | | | (0.49 | ) | | | (0.25 | ) | | | – | | | | (0.44 | ) |
| REDEMPTION FEES ADDED TO PAID-IN CAPITAL (NOTE 6) | | | – | | | | – | | | | – | | | | 0.00 | (c) | | | 0.01 | | | | – | |
| Net increase/(decrease) in net asset value | | | (1.22 | ) | | | 1.49 | | | | (0.48 | ) | | | 0.09 | | | | (0.34 | ) | | | 0.80 | |
| Net asset value, end of year | | $ | 5.75 | | | $ | 6.97 | | | $ | 5.48 | | | $ | 5.96 | | | $ | 5.87 | | | $ | 6.21 | |
| TOTAL RETURN(d) | | | (4.31 | )% | | | 29.51 | % | | | 0.67 | % | | | 5.87 | % | | | (5.48 | )% | | | 23.50 | % |
| RATIOS/SUPPLEMENTAL DATA: | | | | | | | | | | | | | | | | | | | | | | | | |
| Net assets, end of year (000s) | | $ | 4,684 | | | $ | 4,236 | | | $ | 2,852 | | | $ | 3,068 | | | $ | 872 | | | $ | 540 | |
| Ratio of expenses to average net assets excluding fee waivers and reimbursements(e) | | | 1.57 | % | | | 1.56 | % | | | 1.63 | % | | | 1.60 | % | | | 1.63 | %(f) | | | 1.72 | % |
| Ratio of expenses to average net assets including fee waivers and reimbursements(e) | | | 1.57 | % | | | 1.56 | % | | | 1.63 | % | | | 1.60 | % | | | 1.63 | %(f) | | | 1.72 | % |
| Ratio of net investment income to average net assets(e) | | | 0.70 | % | | | 1.43 | % | | | 1.05 | % | | | 0.52 | % | | | 0.46 | %(f) | | | 0.36 | % |
| Portfolio turnover rate(g) | | | 29 | % | | | 31 | % | | | 30 | % | | | 37 | % | | | 11 | % | | | 40 | % |
| (a) | Effective May 1, 2014, the Board approved changing the fiscal year-end of the Funds from April 30 to October 31. |
| (b) | Calculated using the average shares method. |
| (c) | Less than $0.005 or ($0.005) per share. |
| (d) | Total returns are for the period indicated and have not been annualized. Total returns would have been lower had certain expenses not been waived during the period. Returns shown do not reflect the deduction of taxes that a shareholder would pay on Fund distributions or the redemption of Fund shares. |
| (e) | The ratios exclude the impact of expenses of the underlying funds in which the Fund invests as represented in the Statement of Investments. |
| (g) | Portfolio turnover rate for periods less than one full year have not been annualized. |
See Notes to Financial Statements.
ALPS | WMC Research Value Fund
| Management Commentary | October 31, 2018 (Unaudited) |
Market Commentary
US equities posted positive results over the twelve month period ending 31 October 2018. The US Federal Reserve raised its benchmark interest rate by 25 basis points four times during the year, in line with expectations. Despite continued White House turmoil and heightened US tensions with Russia and North Korea, strong employment data and corporate earnings helped propel the market to a series of new highs during the first half of the period. In December, tax reform was a key area of focus, culminating with a $1.5 trillion tax reform bill signed into law by US President Donald Trump. Entering 2018, bullish sentiment was exceptionally strong as better-than-expected corporate profits helped drive US equities higher. Signs of inflation entered the market in February and led to heightened levels of volatility. By the summer of 2018, talk of tariffs and trade wars had progressed to implementation, raising concerns in an otherwise strong economy. Nonetheless, positive sentiment persisted for much of the summer, fueled by robust earnings growth, fiscal stimulus, the announcement of a preliminary trade deal between the US and Mexico, and expectations for stronger US economic growth relative to other regions of the world. This all changed in the final month of the period, as US equities saw their worst performance in recent years in October. Concerns surrounding slowing global growth, rich valuations, and volatile US and China trade relations weighed heavily on sentiment into the end of the period.
Within the Russell 1000 Value Index, eight of the eleven sectors posted positive absolute returns during the period, with the health care and communication services sectors gaining the most.
Fund Review
The Fund underperformed its benchmark, the Russell 1000 Value Index, for the twelve month period.
Stock selection detracted from relative returns, as weak selection in the health care, information technology, and consumer staples sectors more than offset positive stock selection in the consumer discretionary, communication services, and industrials sectors.
Top detractors from relative performance during the period included British American Tobacco (consumer staples) and American International Group (financials). Our decision not to hold Cisco Systems, a US-based networking systems and communication products provider, also detracted during the period, as the company reported favorable earnings and announced dividend increases and a $25 billion share repurchase program. Our overweight to British American Tobacco, the world’s second largest cigarette maker, hurt relative performance. The company underperformed as a challenging regulatory environment weighed on tobacco stocks during the period. Our overweight to American International Group, a US-based insurance company, also detracted from performance. The share price fell after the company reported 3Q18 losses from multiple disaster events in Japan, including Typhoons Jebi and Trami, as well as Hurricane Florence and revisions to loss estimates from the California mudslides.
Top contributors to relative performance included Verizon Communications (communication services), XL Group (financials), and TJX Companies (consumer discretionary). Our overweight to Verizon Communications, a US-based wireless communication services provider, was the top relative contributor during the period. The wireless business benefited from an increase in postpaid phone
subscribers and customer step-ups to higher priced plans, and the company reported solid 3Q18 results. Our overweight to XL Group, a property and casualty insurance company, benefitted performance as the stock price surged after AXA announced in early March that it would acquire XL Group for a substantial premium. We eliminated our position in XL Group on strength. TJX Companies, the largest global off-price apparel and home goods retailer, advanced in 3Q18 on strong adjusted earnings per share. Results were strong across the board as sales, gross profit, and operating profit all increased year over year.
Strategy and Outlook
Looking ahead, our Global Industry Analysts remain focused on fundamental, bottom-up stock selection with an eye on how the macro-economic outlook will affect the companies in which they invest. We continue to identify themes and opportunities that will shape future investment decisions.
Within energy, we established a position in Exxon Mobil. Given recent underperformance, we believe it is an opportune time to invest in Exxon as the company plans to significantly expand its capex in the coming years, suggesting the long-term growth potential for the company outweighs that of its peers. We also like Exxon's attractive business mix and integration of downstream and upstream activities. A history of thoughtful capital deployment with strong return on common equity and fewer impairments is also supportive of the stock. We chose to trim our position in Chevron, which had recently executed well, and moved those funds to expand the position in Exxon.
Within health care, we continue to seek companies dedicated to ground-breaking innovation or the provision of value, i.e., high- quality health care at a lower cost. It’s our view that while some companies will clearly thrive in this environment, others will struggle to meet ever-increasing standards of performance. We continue to be excited about the potential for further advancements in innovation, and we do expect the market to ultimately pay for the life-saving new drugs that are being developed. We are also focused on companies that should benefit from demographic trends. The aging population in the developed world and increasing global wealth should lead to more demand for health care treatment (drugs, devices, services, etc.). Our top active positions in the health care sector include UnitedHealth Group and Medtronic.
The views of the authors and information discussed in this commentary are as of the date of publication, are subject to change, and may not reflect the writer's current views. The views expressed are those of the authors only, and represent an assessment of market conditions at a specific point in time, are opinions only and should not be relied upon as investment advice regarding a particular investment or markets in general. Such information does not constitute a recommendation to buy or sell specific securities or investment vehicles. It should not be assumed that any investment will be profitable or will equal the performance of the fund(s) or any securities or any sectors mentioned in this letter. The subject matter contained in this letter has been derived from several sources believed to be reliable and accurate at the time of compilation. Neither ALPS, Advisors, Inc., Wellington Management Company, LLP, nor the Fund accepts any liability for losses either direct or consequential caused by the use of this information.
Diversification cannot guarantee gain or prevent losses.
ALPS | WMC Research Value Fund
| Performance Update | October 31, 2018 (Unaudited) |
Performance of $10,000 Initial Investment (as of October 31, 2018)
Comparison of change in value of a $10,000 investment

The chart above represents historical performance of a hypothetical investment of $10,000 in the Fund since inception. Past performance does not guarantee future results. This chart does not reflect the deduction of taxes that a shareholder would pay on Fund distributions or the redemption of Fund shares.
Average Annual Total Returns (as of October 31, 2018)
| | 6 Month | 1 Year | 3 Year | 5 Year | 10 Year | Since Inception | Total Expense Ratio | What You Pay* |
| Investor# (NAV) | -1.69% | 0.62% | 5.96% | 6.98% | 10.33% | 9.50% | 1.51% | 1.15% |
| Class A (NAV) | -1.69% | 0.62% | 5.96% | 6.98% | 10.33% | 9.50% | 1.51% | 1.15% |
| Class A (MOP) | -7.14% | -4.94% | 3.99% | 5.78% | 9.70% | 9.36% |
| Class C (NAV) | -2.02% | -0.19% | 5.15% | 6.19% | 9.51% | 8.68% | 2.27% | 1.90% |
| Class C (CDSC) | -3.00% | -1.11% | 5.15% | 6.19% | 9.51% | 8.68% |
| Class I | -1.54% | 0.99% | 6.23% | 7.26% | 10.62% | 9.74% | 1.26% | 0.90% |
| Russell 1000® Value Index1 | 1.07% | 3.03% | 8.88% | 8.61% | 11.30% | – | | |
| S&P 500® Total Return Index2 | 3.40% | 7.35% | 11.52% | 11.34% | 13.24% | – | | |
Performance data quoted represents past performance. Past performance does not guarantee future results. Investment return and principal value of an investment will fluctuate so that an investor’s shares, when sold or redeemed, may be worth more or less than the original cost. Current performance data may be higher or lower than actual data quoted. For the most current month-end performance data, please call 1-866-759-5679.
Maximum Offering Price (MOP) for Class A shares includes the Fund’s maximum sales charge of 5.50%. Performance shown at NAV does not include these sales charges and would have been lower had it been taken into account. If you invest $1 million or more, either as a lump sum or through the Fund’s accumulation or letter of intent programs, you can purchase Class A shares without an initial sales charge (load). A Contingent Deferred Sales Charge (“CDSC”) of 1.00% may apply to Class C shares redeemed within the first 12 months after a purchase, and on Class A shares redeemed within the first 18 months after a purchase in excess of $1 million.
Performance less than 1 year is cumulative.
ALPS | WMC Research Value Fund
| Performance Update | October 31, 2018 (Unaudited) |
Performance shown for Class A shares prior to June 12, 2018 reflects the historical performance of the Fund’s Investor shares, calculated using the fees and expenses of Class A shares.
Performance shown for Class C shares prior to June 30, 2010 reflects the historical performance of the Fund’s Investor Class shares, calculated using the fees and expenses of Class C shares.
Effective February 28, 2015 the Fund changed its name from the ALPS | WMC Disciplined Value Fund to the ALPS | WMC Research Value Fund.
The performance shown for the ALPS | WMC Research Value Fund (the “Fund”) for periods prior to August 29, 2009, reflects the performance of the Activa Mutual Funds Trust – Activa Value Fund (as result of a prior reorganization of Activa Mutual Funds Trust – Activa Value Fund into the Fund).
| 1 | The Russell 1000® Value Index measures the performance of those Russell 1000® companies with lower price-to-book ratios and lower forecasted growth values. The index is not actively managed and does not reflect any deduction for fees, expenses or taxes. An investor may not invest directly in an index. |
| 2 | The S&P 500® Index is the Standard & Poor’s composite index of 500 stocks, a widely recognized, unmanaged index of common stock prices. The index is not actively managed and does not reflect any deduction for fees, expenses or taxes. An investor may not invest directly in an index. |
| ^ | Fund Inception date August 10, 1971 for Investor Class, November 2, 1998 for Class I, June 30, 2010 for Class C and June 12, 2018 for Class A. |
| * | What You Pay reflects the Advisor’s decision to contractually limit expenses through February 28, 2020 for Class A and February 28, 2019 for all other classes. Please see the prospectus for additional information. |
| # | Prior to December 1, 2017, Investor Class was known as Class A. |
The table does not reflect the deduction of taxes that a shareholder would pay on Fund distributions or the redemption of Fund shares.
This Fund is not suitable for all investors and is subject to investment risks, including possible loss of the principal amount invested.
There is no guarantee that the Fund will continue to hold any one particular security or stay invested in any one particular company. The composition of the Fund's top holdings is subject to change. Performance figures are historical and reflect the change in share price, reinvested distributions, changes in net asset value, sales charges and capital gains distributions, if any.
Not FDIC Insured – No Bank Guarantee – May Lose Value
Top Ten Holdings (as a % of Net Assets) †
| Bank of America Corp. | 4.42% |
| Verizon Communications, Inc. | 3.92% |
| JPMorgan Chase & Co. | 3.59% |
| Exxon Mobil Corp. | 3.31% |
| Comcast Corp. | 2.37% |
| Medtronic PLC | 2.07% |
| Chevron Corp. | 1.62% |
| McDonald's Corp. | 1.56% |
| NextEra Energy, Inc. | 1.56% |
| Vanguard® High Dividend Yield ETF | 1.41% |
| Top Ten Holdings | 25.83% |
| † | Holdings are subject to change, and may not reflect the current or future position of the portfolio. Table presents indicative values only. |
Industry Sector Allocation (as a % of Net Assets)
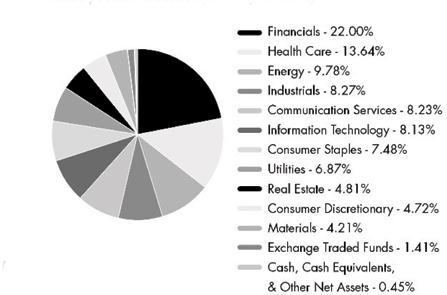
ALPS | WMC Research Value Fund
| Statement of Investments | October 31, 2018 |
| | | Shares | | Value
(Note 2) |
| COMMON STOCKS (98.14%) | | | | | | | | |
| Basic Materials (0.29%) | | | | | | | | |
| Chemicals (0.29%) | | | | | | | | |
| Linde PLC | | | 1,473 | | | $ | 243,737 | |
| | | | | | | | | |
| TOTAL BASIC MATERIALS | | | | | | | 243,737 | |
| | | | | | | | | |
| Communication Services (8.23%) | | | | | | | | |
| Media & Entertainment (4.31%) | | |
| Charter Communications, Inc., Class A(a) | | | 755 | | | | 241,879 | |
| Cinemark Holdings, Inc. | | | 3,871 | | | | 160,917 | |
| Comcast Corp., Class A | | | 52,218 | | | | 1,991,595 | |
| Interpublic Group of Cos., Inc. | | | 10,576 | | | | 244,940 | |
| Liberty Media Corp.-Liberty Formula One, Class C(a) | | | 5,391 | | | | 178,334 | |
| New York Times Co., Class A | | | 6,207 | | | | 163,865 | |
| Twenty-First Century Fox, Inc., Class A | | | 7,415 | | | | 337,531 | |
| Viacom, Inc., Class B | | | 9,759 | | | | 312,093 | |
| | | | | | | | 3,631,154 | |
| Telecommunication Services (3.92%) | | | | | | | | |
| Verizon Communications, Inc. | | | 57,798 | | | | 3,299,688 | |
| | | | | | | | | |
| TOTAL COMMUNICATION SERVICES | | | | | | | 6,930,842 | |
| | | | | | | | | |
| Consumer Discretionary (4.72%) | | | | | | | | |
| Consumer Durables & Apparel (1.07%) | | |
| NIKE, Inc., Class B | | | 4,194 | | | | 314,718 | |
| Tapestry, Inc. | | | 7,074 | | | | 299,301 | |
| Under Armour, Inc., Class A(a) | | | 13,136 | | | | 290,437 | |
| | | | | | | | 904,456 | |
| | | | | | | | | |
| Consumer Services (2.39%) | | | | | | | | |
| Hyatt Hotels Corp., Class A | | | 6,341 | | | | 438,797 | |
| McDonald's Corp. | | | 7,449 | | | | 1,317,728 | |
| MGM Resorts International | | | 6,820 | | | | 181,958 | |
| Vail Resorts, Inc. | | | 285 | | | | 71,626 | |
| | | | | | | | 2,010,109 | |
| | | | | | | | | |
| Retailing (1.26%) | | | | | | | | |
| Expedia Group, Inc. | | | 2,148 | | | | 269,424 | |
| Lowe's Cos., Inc. | | | 1,597 | | | | 152,066 | |
| TJX Cos., Inc. | | | 5,830 | | | | 640,600 | |
| | | | | | | | 1,062,090 | |
| | | | | | | | | |
| TOTAL CONSUMER DISCRETIONARY | | | | | | | 3,976,655 | |
| | | | | | | | | |
| Consumer Staples (7.48%) | | | | | | | | |
| Food & Staples Retailing (1.08%) | | | | | | | | |
| Costco Wholesale Corp. | | | 1,315 | | | | 300,648 | |
| Sysco Corp. | | | 5,009 | | | | 357,292 | |
| | | Shares | | Value
(Note 2) |
| Food & Staples Retailing (continued) | | | | | | | | |
| US Foods Holding Corp.(a) | | | 8,622 | | | $ | 251,504 | |
| | | | | | | | 909,444 | |
| | | | | | | | | |
| Food, Beverage & Tobacco (5.26%) | | | | | | | | |
| Altria Group, Inc. | | | 13,586 | | | | 883,634 | |
| Archer-Daniels-Midland Co. | | | 7,313 | | | | 345,539 | |
| British American Tobacco PLC, Sponsored ADR | | | 21,552 | | | | 935,357 | |
| Coca-Cola Co. | | | 19,989 | | | | 957,073 | |
| Hormel Foods Corp. | | | 6,975 | | | | 304,389 | |
| Hostess Brands, Inc.(a) | | | 18,791 | | | | 195,426 | |
| McCormick & Co., Inc. | | | 1,988 | | | | 286,272 | |
| Philip Morris International, Inc. | | | 2,763 | | | | 243,337 | |
| Post Holdings, Inc.(a) | | | 3,144 | | | | 277,993 | |
| | | | | | | | 4,429,020 | |
| | | | | | | | | |
| Household & Personal Products (1.14%) | | |
| Coty, Inc., Class A | | | 31,814 | | | | 335,638 | |
| Unilever NV | | | 11,616 | | | | 624,708 | |
| | | | | | | | 960,346 | |
| | | | | | | | | |
| TOTAL CONSUMER STAPLES | | | | | | | 6,298,810 | |
| | | | | | | | | |
| Energy (9.78%) | | | | | | | | |
| Energy (9.78%) | | | | | | | | |
| Antero Resources Corp.(a) | | | 6,205 | | | | 98,598 | |
| Baker Hughes a GE Co. | | | 10,034 | | | | 267,808 | |
| Chevron Corp. | | | 12,202 | | | | 1,362,353 | |
| Concho Resources, Inc.(a) | | | 2,601 | | | | 361,773 | |
| Diamondback Energy, Inc. | | | 1,520 | | | | 170,787 | |
| Encana Corp. | | | 19,935 | | | | 204,134 | |
| EOG Resources, Inc. | | | 3,271 | | | | 344,567 | |
| Exxon Mobil Corp. | | | 35,017 | | | | 2,790,155 | |
| Halliburton Co. | | | 9,049 | | | | 313,819 | |
| Kinder Morgan, Inc. | | | 14,523 | | | | 247,182 | |
| Kosmos Energy, Ltd.(a) | | | 15,629 | | | | 101,432 | |
| Marathon Petroleum Corp. | | | 10,361 | | | | 729,932 | |
| Newfield Exploration Co.(a) | | | 7,491 | | | | 151,318 | |
| Noble Energy, Inc. | | | 10,142 | | | | 252,029 | |
| ONEOK, Inc. | | | 3,743 | | | | 245,541 | |
| Targa Resources Corp. | | | 4,499 | | | | 232,463 | |
| TransCanada Corp. | | | 9,625 | | | | 363,055 | |
| | | | | | | | 8,236,946 | |
| | | | | | | | | |
| TOTAL ENERGY | | | | | | | 8,236,946 | |
| | | | | | | | | |
| Financials (22.00%) | | | | | | | | |
| Banks (10.83%) | | | | | | | | |
| Bank of America Corp. | | | 135,306 | | | | 3,720,915 | |
| JPMorgan Chase & Co. | | | 27,755 | | | | 3,025,850 | |
| KeyCorp | | | 24,627 | | | | 447,226 | |
| MGIC Investment Corp.(a) | | | 17,351 | | | | 211,856 | |
ALPS | WMC Research Value Fund
| Statement of Investments | October 31, 2018 |
| | | Shares | | Value
(Note 2) |
| Banks (continued) | | | | | | | | |
| PNC Financial Services Group, Inc. | | | 7,772 | | | $ | 998,624 | |
| Sterling Bancorp | | | 14,459 | | | | 259,973 | |
| Zions Bancorp NA | | | 9,655 | | | | 454,268 | |
| | | | | | | | 9,118,712 | |
| | | | | | | | | |
| Diversified Financials (4.74%) | | | | | | | | |
| American Express Co. | | | 3,944 | | | | 405,167 | |
| AXA Equitable Holdings, Inc. | | | 5,470 | | | | 110,986 | |
| Blucora, Inc.(a) | | | 4,204 | | | | 121,580 | |
| Capital One Financial Corp. | | | 5,764 | | | | 514,725 | |
| Cohen & Steers, Inc. | | | 4,249 | | | | 163,119 | |
| Northern Trust Corp. | | | 7,391 | | | | 695,271 | |
| OneMain Holdings, Inc.(a) | | | 8,239 | | | | 234,976 | |
| Raymond James Financial, Inc. | | | 9,163 | | | | 702,711 | |
| TD Ameritrade Holding Corp. | | | 13,222 | | | | 683,842 | |
| Voya Financial, Inc. | | | 8,196 | | | | 358,657 | |
| | | | | | | | 3,991,034 | |
| | | | | | | | | |
| Insurance (6.43%) | | | | | | | | |
| Alleghany Corp. | | | 576 | | | | 345,992 | |
| Allstate Corp. | | | 4,607 | | | | 440,982 | |
| American International Group, Inc. | | | 19,330 | | | | 798,136 | |
| Assurant, Inc. | | | 5,431 | | | | 527,948 | |
| Assured Guaranty, Ltd. | | | 18,551 | | | | 741,669 | |
| Athene Holding, Ltd., Class A(a) | | | 11,049 | | | | 505,160 | |
| Hartford Financial Services Group, Inc. | | | 11,686 | | | | 530,778 | |
| Marsh & McLennan Cos., Inc. | | | 7,072 | | | | 599,352 | |
| MetLife, Inc. | | | 11,310 | | | | 465,859 | |
| Prudential Financial, Inc. | | | 4,903 | | | | 459,803 | |
| | | | | | | | 5,415,679 | |
| | | | | | | | | |
| TOTAL FINANCIALS | | | | | | | 18,525,425 | |
| | | | | | | | | |
| Health Care (13.64%) | | | | | | | | |
| Health Care Equipment & Services (7.41%) |
| Abbott Laboratories | | | 17,236 | | | | 1,188,250 | |
| Baxter International, Inc. | | | 7,901 | | | | 493,892 | |
| Boston Scientific Corp.(a) | | | 11,896 | | | | 429,921 | |
| Danaher Corp. | | | 8,224 | | | | 817,466 | |
| HCA Healthcare, Inc. | | | 3,104 | | | | 414,477 | |
| Medtronic PLC | | | 19,425 | | | | 1,744,753 | |
| UnitedHealth Group, Inc. | | | 4,394 | | | | 1,148,372 | |
| | | | | | | | 6,237,131 | |
| | | | | | | | | |
| Pharmaceuticals, Biotechnology & Life Sciences (6.23%) |
| Aduro Biotech, Inc.(a) | | | 5,757 | | | | 24,410 | |
| Allergan PLC | | | 6,521 | | | | 1,030,383 | |
| Alnylam Pharmaceuticals, Inc.(a) | | | 930 | | | | 74,800 | |
| Amneal Pharmaceuticals, Inc.(a) | | | 2,707 | | | | 49,944 | |
| AstraZeneca PLC, Sponsored ADR | | | 24,004 | | | | 930,875 | |
| Bluebird Bio, Inc.(a) | | | 1,219 | | | | 139,819 | |
| Bristol-Myers Squibb Co. | | | 18,221 | | | | 920,889 | |
| | | Shares | | Value
(Note 2) |
| Pharmaceuticals, Biotechnology & Life Sciences (continued) |
| Dermira, Inc.(a) | | | 3,545 | | | $ | 44,490 | |
| Elanco Animal Health, Inc.(a) | | | 2,680 | | | | 81,686 | |
| Five Prime Therapeutics, Inc.(a) | | | 1,774 | | | | 21,536 | |
| GlycoMimetics, Inc.(a) | | | 2,843 | | | | 35,765 | |
| Mylan NV(a) | | | 12,628 | | | | 394,625 | |
| Teva Pharmaceutical Industries, Ltd., Sponsored ADR | | | 20,178 | | | | 403,157 | |
| Thermo Fisher Scientific, Inc. | | | 4,698 | | | | 1,097,688 | |
| | | | | | | | 5,250,067 | |
| | | | | | | | | |
| TOTAL HEALTH CARE | | | | | | | 11,487,198 | |
| | | | | | | | | |
| Industrials (8.27%) | | | | | | | | |
| Capital Goods (6.16%) | | | | | | | | |
| AGCO Corp. | | | 2,868 | | | | 160,723 | |
| Air Lease Corp. | | | 2,068 | | | | 78,791 | |
| AMETEK, Inc. | | | 3,446 | | | | 231,158 | |
| Boeing Co. | | | 1,539 | | | | 546,130 | |
| Caterpillar, Inc. | | | 1,263 | | | | 153,227 | |
| Deere & Co. | | | 1,419 | | | | 192,189 | |
| Eaton Corp. PLC | | | 5,841 | | | | 418,624 | |
| Fortive Corp. | | | 2,658 | | | | 197,356 | |
| General Dynamics Corp. | | | 4,091 | | | | 706,025 | |
| General Electric Co. | | | 47,780 | | | | 482,578 | |
| Greenbrier Cos., Inc. | | | 1,835 | | | | 87,071 | |
| Harris Corp. | | | 1,454 | | | | 216,224 | |
| Illinois Tool Works, Inc. | | | 1,475 | | | | 188,166 | |
| Jacobs Engineering Group, Inc. | | | 2,034 | | | | 152,733 | |
| Lockheed Martin Corp. | | | 3,340 | | | | 981,459 | |
| Moog, Inc., Class A | | | 2,467 | | | | 176,514 | |
| Pentair PLC | | | 5,468 | | | | 219,540 | |
| | | | | | | | 5,188,508 | |
| | | | | | | | | |
| Commercial & Professional Services (1.08%) |
| Equifax, Inc. | | | 892 | | | | 90,484 | |
| | | | | | | | | |
| IHS Markit, Ltd.(a) | | | 4,271 | | | | 224,356 | |
| TransUnion | | | 1,391 | | | | 91,458 | |
| Waste Management, Inc. | | | 5,599 | | | | 500,943 | |
| | | | | | | | 907,241 | |
| | | | | | | | | |
| Transportation (1.03%) | | | | | | | | |
| JetBlue Airways Corp.(a) | | | 7,367 | | | | 123,250 | |
| Kirby Corp.(a) | | | 1,532 | | | | 110,212 | |
| Norfolk Southern Corp. | | | 3,759 | | | | 630,873 | |
| | | | | | | | 864,335 | |
| | | | | | | | | |
| TOTAL INDUSTRIALS | | | | | | | 6,960,084 | |
| | | | | | | | | |
| Information Technology (8.13%) | | | | | | | | |
| Semiconductors & Semiconductor Equipment (4.12%) |
| Broadcom, Inc. | | | 2,444 | | | | 546,210 | |
| Intel Corp. | | | 16,352 | | | | 766,582 | |
ALPS | WMC Research Value Fund
| Statement of Investments | October 31, 2018 |
| | | Shares | | Value
(Note 2) |
| Semiconductors & Semiconductor Equipment (continued) |
| KLA-Tencor Corp. | | | 2,435 | | | $ | 222,900 | |
| Marvell Technology Group, Ltd. | | | 21,128 | | | | 346,710 | |
| Micron Technology, Inc.(a) | | | 6,100 | | | | 230,092 | |
| NVIDIA Corp. | | | 855 | | | | 180,260 | |
| QUALCOMM, Inc. | | | 5,415 | | | | 340,549 | |
| Teradyne, Inc. | | | 13,660 | | | | 470,587 | |
| Texas Instruments, Inc. | | | 3,918 | | | | 363,708 | |
| | | | | | | | 3,467,598 | |
| | | | | | | | | |
| Software & Services (3.77%) | | | | | | | | |
| Alliance Data Systems Corp. | | | 1,037 | | | | 213,809 | |
| Autodesk, Inc.(a) | | | 1,566 | | | | 202,406 | |
| CACI International, Inc., Class A(a) | | | 1,083 | | | | 193,272 | |
| FleetCor Technologies, Inc.(a) | | | 1,102 | | | | 220,433 | |
| Genpact, Ltd. | | | 8,149 | | | | 223,364 | |
| Global Payments, Inc. | | | 1,987 | | | | 226,975 | |
| Guidewire Software, Inc.(a) | | | 1,665 | | | | 148,135 | |
| Leidos Holdings, Inc. | | | 4,216 | | | | 273,112 | |
| Microsoft Corp. | | | 5,582 | | | | 596,213 | |
| SS&C Technologies Holdings, Inc. | | | 1,909 | | | | 97,664 | |
| Total System Services, Inc. | | | 1,877 | | | | 171,089 | |
| VeriSign, Inc.(a) | | | 600 | | | | 85,524 | |
| Visa, Inc., Class A | | | 2,621 | | | | 361,305 | |
| WEX, Inc.(a) | | | 905 | | | | 159,244 | |
| | | | | | | | 3,172,545 | |
| | | | | | | | | |
| Technology Hardware & Equipment (0.24%) |
| Flex, Ltd.(a) | | | 26,323 | | | | 206,899 | |
| | | | | | | | | |
| TOTAL INFORMATION TECHNOLOGY | | | | 6,847,042 | |
| | | | | | | | | |
| Materials (3.92%) | | | | | | | | |
| Materials (3.92%) | | | | | | | | |
| Alcoa Corp.(a) | | | 3,595 | | | | 125,789 | |
| ArcelorMittal | | | 1,335 | | | | 33,228 | |
| Ardagh Group SA | | | 6,398 | | | | 84,326 | |
| Ball Corp. | | | 8,186 | | | | 366,733 | |
| Cabot Corp. | | | 2,852 | | | | 138,835 | |
| Celanese Corp., Series A | | | 2,438 | | | | 236,340 | |
| Crown Holdings, Inc.(a) | | | 2,143 | | | | 90,627 | |
| DowDuPont, Inc. | | | 13,601 | | | | 733,366 | |
| FMC Corp. | | | 2,036 | | | | 158,971 | |
| Freeport-McMoRan, Inc. | | | 12,880 | | | | 150,052 | |
| International Paper Co. | | | 6,862 | | | | 311,260 | |
| PPG Industries, Inc. | | | 4,687 | | | | 492,557 | |
| Southern Copper Corp. | | | 2,212 | | | | 84,808 | |
| Steel Dynamics, Inc. | | | 3,668 | | | | 145,253 | |
| Vulcan Materials Co. | | | 394 | | | | 39,849 | |
| | | Shares | | Value
(Note 2) |
| Materials (continued) | | | | | | | | |
| Westlake Chemical Corp. | | | 1,504 | | | $ | 107,235 | |
| | | | | | | | 3,299,229 | |
| | | | | | | | | |
| TOTAL MATERIALS | | | | | | | 3,299,229 | |
| | | | | | | | | |
| Real Estate (4.81%) | | | | | | | | |
| Real Estate (4.81%) | | | | | | | | |
| Alexandria Real Estate Equities, Inc. | | | 4,687 | | | | 572,892 | |
| American Tower Corp. | | | 4,815 | | | | 750,225 | |
| Camden Property Trust | | | 5,414 | | | | 488,722 | |
| Douglas Emmett, Inc. | | | 16,528 | | | | 598,148 | |
| Equinix, Inc. | | | 679 | | | | 257,165 | |
| Host Hotels & Resorts, Inc. | | | 14,242 | | | | 272,165 | |
| Outfront Media, Inc. | | | 12,349 | | | | 218,824 | |
| Prologis, Inc. | | | 4,042 | | | | 260,588 | |
| Public Storage | | | 1,473 | | | | 302,657 | |
| Simon Property Group, Inc. | | | 1,787 | | | | 327,950 | |
| | | | | | | | 4,049,336 | |
| | | | | | | | | |
| TOTAL REAL ESTATE | | | | | | | 4,049,336 | |
| | | | | | | | | |
| Utilities (6.87%) | | | | | | | | |
| Utilities (6.87%) | | | | | | | | |
| Avangrid, Inc. | | | 12,821 | | | | 602,715 | |
| Edison International | | | 16,580 | | | | 1,150,486 | |
| Exelon Corp. | | | 17,006 | | | | 745,033 | |
| NextEra Energy, Inc. | | | 7,591 | | | | 1,309,448 | |
| NRG Energy, Inc. | | | 9,414 | | | | 340,693 | |
| PG&E Corp.(a) | | | 7,740 | | | | 362,309 | |
| Sempra Energy | | | 8,786 | | | | 967,514 | |
| UGI Corp. | | | 5,758 | | | | 305,520 | |
| | | | | | | | 5,783,718 | |
| | | | | | | | | |
| TOTAL UTILITIES | | | | | | | 5,783,718 | |
| | | | | | | | | |
| | | | | | | | | |
| TOTAL COMMON STOCKS | | | | | | | | |
| (Cost $78,519,322) | | | | | | | 82,639,022 | |
| | | | | | | | | |
| EXCHANGE TRADED FUNDS (1.41%) |
| Vanguard® High Dividend Yield ETF | | | 14,288 | | | | 1,189,619 | |
| | | | | | | | | |
| TOTAL EXCHANGE TRADED FUNDS |
| (Cost $1,205,486) | | | | | | | 1,189,619 | |
ALPS | WMC Research Value Fund
| Statement of Investments | October 31, 2018 |
| | | 7-Day
Yield | | Shares | | Value
(Note 2) |
| SHORT-TERM INVESTMENTS (0.05%) |
| SHORT-TERM CASH EQUIVALENTS (0.05%) |
| State Street Institutional | | | | | | | | | | | | |
| Treasury Plus Money | | | | | | | | | | | | |
| Market Fund | | | 2.109 | % | | | 41,054 | | | $ | 41,054 | |
| | | | | | | | | | | | | |
| | | | | | | | | | | | | |
| TOTAL SHORT-TERM INVESTMENTS |
| (Cost $41,054) | | | | | 41,054 | |
| | | | | | | | | | | | | |
| TOTAL INVESTMENTS (99.60%) |
| (Cost $79,765,862) | | | | $ | 83,869,695 | |
| | | | | | | | | | | | | |
| Other Assets In Excess Of Liabilities (0.40%) | | 338,808 | |
| | | | | | | | | | | | | |
| NET ASSETS (100.00%) | | | | | | | | | | $ | 84,208,503 | |
| (a) | Non-Income Producing Security. |
For Fund compliance purposes, the Fund's industry classifications refer to any one or more of the industry sub-classifications used by one or more widely recognized market indexes or ratings group indexes, and/or as defined by Fund management. This definition may not apply for purposes of this report, which may combine industry sub-classifications for reporting ease. Industries are shown as a percent of net assets.
See Notes to Financial Statements.
ALPS | WMC Research Value Fund
| Statement of Assets and Liabilities | October 31, 2018 |
| ASSETS | | | |
| Investments, at value | | $ | 83,869,695 | |
| Cash | | | 4,555 | |
| Receivable for investments sold | | | 1,301,623 | |
| Receivable for shares sold | | | 774 | |
| Dividends receivable | | | 101,097 | |
| Prepaid expenses and other assets | | | 20,584 | |
| Total Assets | | | 85,298,328 | |
| LIABILITIES | | | | |
| Payable for investments purchased | | | 966,121 | |
| Payable for shares redeemed | | | 6,000 | |
| Investment advisory fees payable | | | 35,928 | |
| Administration and transfer agency fees payable | | | 38,302 | |
| Distribution and services fees payable | | | 10,889 | |
| Professional fees payable | | | 22,480 | |
| Accrued expenses and other liabilities | | | 10,105 | |
| Total Liabilities | | | 1,089,825 | |
| NET ASSETS | | $ | 84,208,503 | |
| NET ASSETS CONSIST OF | | | | |
| Paid-in capital | | $ | 72,845,170 | |
| Total distributable earnings | | | 11,363,333 | |
| NET ASSETS | | $ | 84,208,503 | |
| INVESTMENTS, AT COST | | $ | 79,765,862 | |
| PRICING OF SHARES | | | | |
| Investor Class: | | | | |
| Net Asset Value, offering and redemption price per share | | $ | 8.71 | |
| Net Assets | | $ | 46,635,120 | |
| Shares of beneficial interest outstanding (unlimited number of shares, no par value common stock authorized) | | | 5,354,373 | |
| Class A: | | | | |
| Net Asset Value, offering and redemption price per share | | $ | 8.71 | |
| Net Assets | | $ | 9,560 | |
| Shares of beneficial interest outstanding (unlimited number of shares, no par value common stock authorized) | | | 1,098 | |
| Maximum offering price per share ((NAV/0.9450), based on maximum sales charge of 5.50% of the offering price) | | $ | 9.22 | |
| Class C: | | | | |
| Net Asset Value, offering and redemption price per share(a) | | $ | 8.24 | |
| Net Assets | | $ | 710,663 | |
| Shares of beneficial interest outstanding (unlimited number of shares, no par value common stock authorized) | | | 86,211 | |
| Class I: | | | | |
| Net Asset Value, offering and redemption price per share | | $ | 8.98 | |
| Net Assets | | $ | 36,853,160 | |
| Shares of beneficial interest outstanding (unlimited number of shares, no par value common stock authorized) | | | 4,105,915 | |
| (a) | Redemption price per share may be reduced for any applicable contingent deferred sales charge. For a description of a possible sales charge, please see the Fund's Prospectus. |
See Notes to Financial Statements.
ALPS | WMC Research Value Fund
| Statement of Operations | For the Year Ended October 31, 2018 |
| INVESTMENT INCOME | | | |
| Dividends | | $ | 1,846,710 | |
| Foreign taxes withheld on dividends | | | (10,904 | ) |
| Total Investment Income | | | 1,835,806 | |
| | | | | |
| EXPENSES | | | | |
| Investment advisory fees | | | 867,220 | |
| Administrative fees | | | 146,668 | |
| Transfer agency fees | | | 28,982 | |
| Distribution and service fees | | | | |
| Investor Class(a) | | | 125,713 | |
| Class A(b) | | | 10 | |
| Class C | | | 7,427 | |
| Professional fees | | | 27,381 | |
| Reports to shareholders and printing fees | | | 15,567 | |
| State registration fees | | | 52,227 | |
| Insurance fees | | | 690 | |
| Custody fees | | | 13,363 | |
| Trustees' fees and expenses | | | 2,141 | |
| Miscellaneous expenses | | | 13,373 | |
| Total Expenses | | | 1,300,762 | |
| Less fees waived/reimbursed by investment advisor (Note 8) | | | | |
| Investor Class(a) | | | (190,912 | ) |
| Class A(b) | | | (16 | ) |
| Class C | | | (2,821 | ) |
| Class I | | | (152,537 | ) |
| Net Expenses | | | 954,476 | |
| Net Investment Income | | | 881,330 | |
| Net realized gain on investments | | | 6,662,388 | |
| Net realized gain on foreign currency transactions | | | 205 | |
| Net Realized Gain | | | 6,662,593 | |
| Net change in unrealized depreciation on investments | | | (6,612,862 | ) |
| Net change in unrealized depreciation on translation of assets and liabilities denominated in foreign currencies | | | (2 | ) |
| Net Change in Unrealized Depreciation | | | (6,612,864 | ) |
| NET REALIZED AND UNREALIZED GAIN ON INVESTMENTS | | | 49,729 | |
| NET INCREASE IN NET ASSETS RESULTING FROM OPERATIONS | | $ | 931,059 | |
| (a) | Prior to December 1, 2017, Investor Class was known as Class A. |
| (b) | Class A commenced operations on June 12, 2018. |
See Notes to Financial Statements.
ALPS | WMC Research Value Fund
Statements of Changes in Net Assets
| | | For the Year Ended October 31, 2018 | | | For the Year Ended October 31, 2017 | |
| OPERATIONS | | | | | | |
| Net investment income | | $ | 881,330 | | | $ | 700,241 | |
| Net realized gain | | | 6,662,593 | | | | 6,788,341 | |
| Net change in unrealized appreciation/(depreciation) | | | (6,612,864 | ) | | | 6,711,936 | |
| Net Increase in Net Assets Resulting from Operations | | | 931,059 | | | | 14,200,518 | |
| | | | | | | | | |
| TOTAL DISTRIBUTIONS(a) | | | | | | | | |
| From distributable earnings | | | | | | | | |
| Investor Class(b) | | | (4,057,605 | ) | | | (1,593,379 | ) |
| Class C | | | (62,055 | ) | | | (14,337 | ) |
| Class I | | | (3,240,424 | ) | | | 1,298,637 | |
| Net Decrease in Net Assets from Distributions | | | (7,360,084 | ) | | | (2,906,353 | ) |
| | | | | | | | | |
| BENEFICIAL INTEREST TRANSACTIONS (NOTE 6) | | | | | | | | |
| Shares sold | | | | | | | | |
| Investor Class(b) | | | 385,082 | | | | 622,292 | |
| Class A(c) | | | 10,000 | | | | – | |
| Class C | | | 17,226 | | | | 265,702 | |
| Class I | | | 3,480,703 | | | | 3,710,822 | |
| Dividends reinvested | | | | | | | | |
| Investor Class(b) | | | 3,894,647 | | | | 1,521,329 | |
| Class C | | | 43,320 | | | | 6,826 | |
| Class I | | | 3,239,582 | | | | 1,297,538 | |
| Shares redeemed | | | | | | | | |
| Investor Class(b) | | | (3,667,989 | ) | | | (8,287,816 | ) |
| Class C | | | (22,249 | ) | | | (52,206 | ) |
| Class I | | | (9,536,622 | ) | | | (10,342,427 | ) |
| Net Decrease in Net Assets Derived from Beneficial Interest Transactions | | | (2,156,300 | ) | | | (11,257,940 | ) |
| | | | | | | | | |
| Net increase/(decrease) in net assets | | | (8,585,325 | ) | | | 36,225 | |
| | | | | | | | | |
| NET ASSETS | | | | | | | | |
| Beginning of year | | | 92,793,828 | | | | 92,757,603 | |
| End of year | | $ | 84,208,503 | | | $ | 92,793,828 | (d) |
| (a) | For the prior year ended October 31, 2017, Total Distributions consisted of Net Investment Income $163,564, and Net Realized Gains $2,742,789. |
| (b) | Prior to December 1, 2017, Investor Class was known as Class A. |
| (c) | Class A commenced operations on June 12, 2018. |
| (d) | For the prior year ended October 31, 2017, included accumulated net investment income of $546,758. |
See Notes to Financial Statements.
ALPS | WMC Research Value Fund – Investor Class
Financial Highlights
Selected data for a share of beneficial interest outstanding throughout the periods indicated:
| | | For the Year Ended October 31, 2018(a) | | | For the Year Ended October 31, 2017 | | | For the Year Ended October 31, 2016 | | | For the Year Ended October 31, 2015(b) | | | For the Fiscal Period Ended October 31, 2014(c) | | | For the Year Ended April 30, 2014 | |
| Net asset value, beginning of period | | $ | 9.40 | | | $ | 8.37 | | | $ | 11.57 | | | $ | 12.54 | | | $ | 11.92 | | | $ | 10.01 | |
| INCOME/(LOSS) FROM INVESTMENT OPERATIONS: | | | | | | | | | | | | | | | | | |
| Net investment income(d) | | | 0.08 | | | | 0.06 | | | | 0.06 | | | | 0.06 | | | | 0.03 | | | | 0.06 | |
| Net realized and unrealized gain | | | 0.01 | | | | 1.24 | | | | 0.08 | | | | 0.23 | | | | 0.59 | | | | 2.09 | |
| Total from investment operations | | | 0.09 | | | | 1.30 | | | | 0.14 | | | | 0.29 | | | | 0.62 | | | | 2.15 | |
| DISTRIBUTIONS: | | | | | | | | | | | | | | | | | | | | | | | | |
| From net investment income | | | (0.08 | ) | | | (0.01 | ) | | | (0.02 | ) | | | (0.06 | ) | | | – | | | | (0.11 | ) |
| From net realized gains | | | (0.70 | ) | | | (0.26 | ) | | | (3.32 | ) | | | (1.20 | ) | | | – | | | | (0.13 | ) |
| Total distributions | | | (0.78 | ) | | | (0.27 | ) | | | (3.34 | ) | | | (1.26 | ) | | | – | | | | (0.24 | ) |
| Net increase/(decrease) in net asset value | | | (0.69 | ) | | | 1.03 | | | | (3.20 | ) | | | (0.97 | ) | | | 0.62 | | | | 1.91 | |
| Net asset value, end of year | | $ | 8.71 | | | $ | 9.40 | | | $ | 8.37 | | | $ | 11.57 | | | $ | 12.54 | | | $ | 11.92 | |
| TOTAL RETURN(e) | | | 0.62 | % | | | 15.81 | % | | | 2.09 | % | | | 2.57 | % | | | 5.20 | % | | | 21.70 | % |
| RATIOS/SUPPLEMENTAL DATA: | | | | | | | | | | | | | | | | | | | | | | | | |
| Net assets, end of year (000s) | | $ | 46,635 | | | $ | 49,637 | | | $ | 49,814 | | | $ | 55,608 | | | $ | 59,628 | | | $ | 59,069 | |
| Ratio of expenses to average net assets excluding fee waivers and reimbursements | | | 1.53 | % | | | 1.51 | % | | | 1.53 | % | | | 1.49 | % | | | 1.48 | %(f) | | | 1.47 | % |
| Ratio of expenses to average net assets including fee waivers and reimbursements | | | 1.15 | % | | | 1.15 | % | | | 1.15 | %(g) | | | 1.40 | % | | | 1.40 | %(f) | | | 1.40 | % |
| Ratio of net investment income to average net assets | | | 0.86 | % | | | 0.62 | % | | | 0.66 | % | | | 0.53 | % | | | 0.48 | %(f) | | | 0.52 | % |
| Portfolio turnover rate(h) | | | 74 | % | | | 70 | % | | | 78 | % | | | 114 | % | | | 13 | % | | | 19 | % |
| (a) | Prior to December 1, 2017, Investor Class was known as Class A. |
| (b) | Effective February 28, 2015 the Fund changed its name from the ALPS | WMC Disciplined Value Fund to the ALPS | WMC Research Value Fund. |
| (c) | Effective May 1, 2014, the Board approved changing the fiscal year-end of the Funds from April 30 to October 31. |
| (d) | Calculated using the average shares method. |
| (e) | Total returns are for the period indicated and have not been annualized. Total returns would have been lower had certain expenses not been waived during the period. Returns shown do not reflect the deduction of taxes that a shareholder would pay on Fund distributions or the redemption of Fund shares. Returns shown exclude any applicable sales charges. |
| (f) | Annualized. |
| (g) | Effective November 1, 2015 the contractual expense limitation changed from 1.40% to 1.15%. |
| (h) | Portfolio turnover rate for periods less than one full year have not been annualized. |
See Notes to Financial Statements.
ALPS | WMC Research Value Fund – Class A
Financial Highlights
Selected data for a share of beneficial interest outstanding throughout the periods indicated:
| | | For the Period June 12, 2018 (Commencement of Operations) to October 31, 2018 | |
| Net asset value, beginning of period | | $ | 9.11 | |
| | | | | |
| INCOME FROM INVESTMENT OPERATIONS: | | | | |
| Net investment income(a) | | | 0.03 | |
| Net realized and unrealized loss | | | (0.43 | ) |
| Total from investment operations | | | (0.40 | ) |
| | | | | |
| Net (decrease) in net asset value | | | (0.40 | ) |
| Net asset value, end of year | | $ | 8.71 | |
| TOTAL RETURN(b) | | | (4.39 | )% |
| | | | | |
| RATIOS/SUPPLEMENTAL DATA: | | | | |
| Net assets, end of year (000s) | | $ | 10 | |
| Ratio of expenses to average net assets excluding fee waivers and reimbursements | | | 1.57 | %(c) |
| Ratio of expenses to average net assets including fee waivers and reimbursements | | | 1.15 | %(c) |
| Ratio of net investment income to average net assets | | | 0.87 | %(c) |
| Portfolio turnover rate(d) | | | 74 | % |
| (a) | Calculated using the average shares method. |
| (b) | Total returns are for the period indicated and have not been annualized. Total returns would have been lower had certain expenses not been waived during the period. Returns shown do not reflect the deduction of taxes that a shareholder would pay on Fund distributions or the redemption of Fund shares. |
| (d) | Portfolio turnover rate for periods less than one full year have not been annualized. |
See Notes to Financial Statements.
ALPS | WMC Research Value Fund – Class C
Financial Highlights
Selected data for a share of beneficial interest outstanding throughout the periods indicated:
| | | For the Year Ended October 31, 2018 | | | For the Year Ended October 31, 2017 | | | For the Year Ended October 31, 2016 | | | For the Year Ended October 31, 2015(a) | | | For the Fiscal Period Ended October 31, 2014(b) | | | For the Year Ended April 30, 2014 | |
| Net asset value, beginning of period | | $ | 8.99 | | | $ | 8.06 | | | $ | 11.32 | | | $ | 12.36 | | | $ | 11.80 | | | $ | 9.93 | |
| INCOME/(LOSS) FROM INVESTMENT OPERATIONS: | | | | | | | | | | | | | | | | | |
| Net investment income/(loss)(c) | | | 0.01 | | | | (0.01 | ) | | | (0.01 | ) | | | (0.03 | ) | | | (0.02 | ) | | | (0.02 | ) |
| Net realized and unrealized gain | | | (0.00 | )(d) | | | 1.20 | | | | 0.08 | | | | 0.24 | | | | 0.58 | | | | 2.08 | |
| Total from investment operations | | | 0.01 | | | | 1.19 | | | | 0.07 | | | | 0.21 | | | | 0.56 | | | | 2.06 | |
| DISTRIBUTIONS: | | | | | | | | | | | | | | | | | | | | | | | | |
| From net investment income | | | (0.06 | ) | | | (0.00 | )(d) | | | (0.01 | ) | | | (0.05 | ) | | | – | | | | (0.06 | ) |
| From net realized gains | | | (0.70 | ) | | | (0.26 | ) | | | (3.32 | ) | | | (1.20 | ) | | | – | | | | (0.13 | ) |
| Total distributions | | | (0.76 | ) | | | (0.26 | ) | | | (3.33 | ) | | | (1.25 | ) | | | – | | | | (0.19 | ) |
| Net increase/(decrease) in net asset value | | | (0.75 | ) | | | 0.93 | | | | (3.26 | ) | | | (1.04 | ) | | | 0.56 | | | | 1.87 | |
| Net asset value, end of year | | $ | 8.24 | | | $ | 8.99 | | | $ | 8.06 | | | $ | 11.32 | | | $ | 12.36 | | | $ | 11.80 | |
| TOTAL RETURN(e) | | | (0.19 | )% | | | 15.02 | % | | | 1.28 | % | | | 1.87 | % | | | 4.75 | % | | | 20.97 | % |
| RATIOS/SUPPLEMENTAL DATA: | | | | | | | | | | | | | | | | | | | | | | | | |
| Net assets, end of year (000s) | | $ | 711 | | | $ | 734 | | | $ | 449 | | | $ | 870 | | | $ | 257 | | | $ | 133 | |
| Ratio of expenses to average net assets excluding fee waivers and reimbursements | | | 2.28 | % | | | 2.27 | % | | | 2.27 | % | | | 2.24 | % | | | 2.24 | %(f) | | | 2.22 | % |
| Ratio of expenses to average net assets including fee waivers and reimbursements | | | 1.90 | % | | | 1.90 | % | | | 1.90 | %(g) | | | 2.15 | % | | | 2.15 | %(f) | | | 2.15 | % |
| Ratio of net investment income/(loss) to average net assets | | | 0.11 | % | | | (0.15 | )% | | | (0.07 | )% | | | (0.22 | )% | | | (0.30 | )%(f) | | | (0.23 | )% |
| Portfolio turnover rate(h) | | | 74 | % | | | 70 | % | | | 78 | % | | | 114 | % | | | 13 | % | | | 19 | % |
| (a) | Effective February 28, 2015 the Fund changed its name from the ALPS | WMC Disciplined Value Fund to the ALPS | WMC Research Value Fund. |
| (b) | Effective May 1, 2014, the Board approved changing the fiscal year-end of the Funds from April 30 to October 31. |
| (c) | Calculated using the average shares method. |
| (d) | Less than $0.005 or ($0.005) per share. |
| (e) | Total returns are for the period indicated and have not been annualized. Total returns would have been lower had certain expenses not been waived during the period. Returns shown do not reflect the deduction of taxes that a shareholder would pay on Fund distributions or the redemption of Fund shares. Returns shown exclude any applicable sales charges. |
| (g) | Effective November 1, 2015 the contractual expense limitation changed from 2.15% to 1.90%. |
| (h) | Portfolio turnover rate for periods less than one full year have not been annualized. |
See Notes to Financial Statements.
ALPS | WMC Research Value Fund – Class I
Financial Highlights
Selected data for a share of beneficial interest outstanding throughout the periods indicated:
| | | For the Year Ended October 31, 2018 | | | For the Year Ended October 31, 2017 | | | For the Year Ended October 31, 2016 | | | For the Year Ended October 31, 2015(a) | | | For the Fiscal Period Ended October 31, 2014(b) | | | For the Year Ended April 30, 2014 | |
| Net asset value, beginning of period | | $ | 9.64 | | | $ | 8.56 | | | $ | 11.75 | | | $ | 12.69 | | | $ | 12.05 | | | $ | 10.10 | |
| INCOME/(LOSS) FROM INVESTMENT OPERATIONS: | | | | | | | | | | | | | | | | | |
| Net investment income(c) | | | 0.10 | | | | 0.08 | | | | 0.08 | | | | 0.09 | | | | 0.05 | | | | 0.09 | |
| Net realized and unrealized gain | | | 0.02 | | | | 1.28 | | | | 0.08 | | | | 0.23 | | | | 0.59 | | | | 2.12 | |
| Total from investment operations | | | 0.12 | | | | 1.36 | | | | 0.16 | | | | 0.32 | | | | 0.64 | | | | 2.21 | |
| DISTRIBUTIONS: | | | | | | | | | | | | | | | | | | | | | | | | |
| From net investment income | | | (0.08 | ) | | | (0.02 | ) | | | (0.03 | ) | | | (0.06 | ) | | | – | | | | (0.13 | ) |
| From net realized gains | | | (0.70 | ) | | | (0.26 | ) | | | (3.32 | ) | | | (1.20 | ) | | | – | | | | (0.13 | ) |
| Total distributions | | | (0.78 | ) | | | (0.28 | ) | | | (3.35 | ) | | | (1.27 | ) | | | – | | | | (0.26 | ) |
| Net increase/(decrease) in net asset value | | | (0.66 | ) | | | 1.08 | | | | (3.19 | ) | | | (0.94 | ) | | | 0.64 | | | | 1.95 | |
| Net asset value, end of year | | $ | 8.98 | | | $ | 9.64 | | | $ | 8.56 | | | $ | 11.75 | | | $ | 12.69 | | | $ | 12.05 | |
| TOTAL RETURN(d) | | | 0.99 | % | | | 16.10 | % | | | 2.24 | % | | | 2.86 | % | | | 5.31 | % | | | 22.11 | % |
| RATIOS/SUPPLEMENTAL DATA: | | | | | | | | | | | | | | | | | | | | | | | | |
| Net assets, end of year (000s) | | $ | 36,853 | | | $ | 42,422 | | | $ | 42,495 | | | $ | 40,915 | | | $ | 43,502 | | | $ | 44,729 | |
| Ratio of expenses to average net assets excluding fee waivers and reimbursements | | | 1.28 | % | | | 1.26 | % | | | 1.28 | % | | | 1.24 | % | | | 1.23 | %(e) | | | 1.22 | % |
| Ratio of expenses to average net assets including fee waivers and reimbursements | | | 0.90 | % | | | 0.90 | % | | | 0.90 | %(f) | | | 1.15 | % | | | 1.15 | %(e) | | | 1.15 | % |
| Ratio of net investment income to average net assets | | | 1.11 | % | | | 0.87 | % | | | 0.90 | % | | | 0.78 | % | | | 0.74 | %(e) | | | 0.77 | % |
| Portfolio turnover rate(g) | | | 74 | % | | | 70 | % | | | 78 | % | | | 114 | % | | | 13 | % | | | 19 | % |
| (a) | Effective February 28, 2015 the Fund changed its name from the ALPS | WMC Disciplined Value Fund to the ALPS | WMC Research Value Fund. |
| (b) | Effective May 1, 2014, the Board approved changing the fiscal year-end of the Funds from April 30 to October 31. |
| (c) | Calculated using the average shares method. |
| (d) | Total returns are for the period indicated and have not been annualized. Total returns would have been lower had certain expenses not been waived during the period. Returns shown do not reflect the deduction of taxes that a shareholder would pay on Fund distributions or the redemption of Fund shares. |
| (f) | Effective November 1, 2015 the contractual expense limitation changed from 1.15% to 0.90%. |
| (g) | Portfolio turnover rate for periods less than one full year have not been annualized. |
See Notes to Financial Statements.
Clough China Fund
| Management Commentary | October 31, 2018 (Unaudited) |
The Clough China Fund (the “Fund”) was down 21.17% for the year ended October 31, 2018. This compares to a decline of 16.73% for the broad based MSCI China Index. From a sector perspective, our investments in Healthcare contributed to performance, whilst Technology and Consumer Discretionary detracted. From an individual stock perspective, over the fiscal year Sunny Optical, Jiangsu Yanghe Brewery, JD.Com, Alibaba and Tencent detracted the most from performance while Ping An, Naspers, Sands China, China Resources Land, and Sinopharm contributed the most to performance.
The China market started the fiscal year ending October 31, 2018 very strong. For the first three months of the fiscal year, the MSCI China Index rose over 16.4%. The drawdown, though, was even more powerful with the market declining by over 33% from its peak to its October 2018 trough. This sell-off was driven by U.S. and China trade tensions in addition to a slowing of the Chinese economy on the back of tighter liquidity conditions. Very few stocks provided shelter in this type of environment.
Our top contributors for the year:
| 1. | Ping An contributed the most to performance for the year. This is a diversified financial conglomerate that generates over 60% of its operating profit from its insurance business. To understand the scope of this company’s businesses across insurance, banking and credit cards, the company has amassed over 179 MM retail customers. We are big believers in Ping An for a number of reasons. From a top-down perspective, insurance penetration is still very low as a percentage of gross domestic product (“GDP”). According to Lexology, premiums account for 2.4%, whereas in more developed markets, it is closer to 7.5%, and in neighboring Hong Kong it is 13.4%. In addition, regulators are moving Chinese insurers to underwrite more protection products as opposed to short-term savings products. This structural shift will provide a much more stable source of income for Ping An. Finally, we believe that Ping An has proven that it is the best run insurance company in China, and arguably the region, as reflected by its superior return profile as measured by return on equity (“ROE”). |
| 2. | We held Naspers in the Fund for a short period of time to gain additional exposure to Tencent. Naspers is a South African listed media conglomerate with a large holding in Tencent. We saw an opportunity to buy this stock as the implied value of Tencent was at a very large discount to fair value, in our view. We no longer hold the position. |
| 3. | Sands China is one of the largest gaming operators in Macau. We liked the company given that it catered primarily to the mass and premium mass gamblers, which we believed will be far more stable a cohort of customers than the VIP segment. We exited the position as we were concerned about the potential impact of slowing credit growth in China on gambling activity in Macau. |
| 4. | China Resources Land is one of China’s premier developers. In our view, the company’s strategy of developing malls surrounded by housing developments in some of the best locations creates tremendous value for shareholders. In one project, the shareholders benefit from recurring revenue generated by the retail podium, and development profits from housing. The company has a track record of executing and is well positioned to potentially be one of the beneficiaries of a consolidating property development sector, given its strong financial position. |
| 5. | Sinopharm has been a core holding of the Fund as we believe that healthcare spending will continue to grow, driven by a virtuous circle of an aging and increasingly wealthy population. As China’s largest drug distributor, the company is likely to benefit from both these trends. China is in the process of moving the profit pools of drug distribution from hospitals and into traditional offsite drug stores. The company is very well positioned to capture this trend as it operates one of China’s largest drugstore chains. The company’s strategy was validated at the end of 2017 with Walgreens Boots Alliance taking a 40% stake in the company’s drugstore chain subsidiary. |
Top detractors for the year:
| 1. | Tencent negatively impacted our performance the most this past fiscal year. Tencent is China’s largest gaming and social networking platform. This has historically been our largest position in the Fund, as the company continued to deliver consistent growth on the back of its dominant position as a gaming and social media giant. This year, however, the company faced a number of regulatory challenges which will likely diminish the company’s growth trajectory. It appears that the Chinese government is tightening the restrictions on gaming play for children. Tencent announced that it would only allow children under 12 to play for one hour per day, and children between 13 and 18, two hours per day. Additionally, China has stated that it would limit the number of new games that can be launched and monetized. Tencent launched PlayerUnknown’s Battlegrounds (“PUBG”) in China in February 2018, and Chinese gamers flocked to the game, and played on average 16 hours per week versus 7 hours for U.S. gamers. Unfortunately, Tencent was not able to obtain approval to monetize any aspect of this game, and may potentially not obtain approval at all, which highlighted to the market the newfound risks to the sector. We still believe in the investment over the medium-to-longer-term but took our exposure down to reflect the short-term risks to the business. |
Clough China Fund
| Management Commentary | October 31, 2018 (Unaudited) |
| 2. | Alibaba has historically been one of the Fund’s larger overall positions given our belief in the Chinese consumer and the company’s dominant position in e-commerce. China now is the largest e-commerce market in the world as it accounts for 42% of global retail e-commerce transactions compared to the U.S.’s 24% share, according to a McKinsey Global Institute study. Structurally, we are bullish on the name, but we became concerned after the company announced substantial sales growth, but muted bottom-line performance on the back of increased investment in brick-and-mortar retail. In addition, Jack Ma, the visionary founder, stepped down in the beginning of September. These concerns weighed on the stock. |
| 3. | Sunny Optical is one of China’s largest camera module manufacturers that supplies the likes of Samsung and China’s largest handset makers. With the proliferation of dual and triple camera phones we believed that the company’s earnings and margins would be assured. However, the company announced weaker than expected top-line and bottom-line performance in the first half, driven by lower than expected gross margins on their camera modules due to lower average selling prices as well as a weak renminbi (“RMB”). We have since exited the position given the headwinds the company faces, including a more moderate growth profile for handset camera modules and new entrants in Sunny’s segment. |
| 4. | We held a position in JD.com for similar reasons to our holding in Alibaba given our belief in the Chinese consumer and the country’s e-commerce sector. We also appreciated the strength of JD.com’s self-owned and well-developed distribution network, which we believe gave it a competitive edge versus its competitors. Trading at a huge discount to its peers as well as big-box retailers in the U.S., we thought it was attractively valued. Unfortunately, the company announced disappointing results on the back of lower-than-expected margins with competitive intensity increasing. Additionally, the founder and CEO of the company was arrested for assault in the U.S., but returned to China uncharged. This combination of factors resulted in us exiting the position. |
| 5. | Jiangsu Yanghe Brewery was a new position in the Fund but was hit very hard in October on the back of a surprisingly weak set of results from one of Yanghe’s competitors, Kweichow Moutai. Yanghe had reported its numbers before Moutai with both the top- and bottom- line growing over 20%. That being said, Moutai is the industry and market leader and brought the whole sector down. We think that Moutai’s performance was company specific, and still believe that Yanghe is a compelling investment. First of all, this is one of the few Chinese white liquor companies that is run like a private company. Management owns 24% of the company and the government 23%. Thus, management and minority |
| | shareholders’ interests are aligned. Secondly, Yanghe’s growth strategy appears sound, with the company expanding judiciously outside of its core territory of Jiangsu Province. Finally, the company has a wide range of product offerings, and thus does not depend solely on premium priced products which we believe is a more defensive business model during economic uncertainty. |
China's difficulties over the past fiscal year of the Fund overshadowed the fact that over the last two years, the market has performed quite well- up 16.6%. We are hopeful that the factors that contributed to the Fund’s decline in performance are likely to wane over the coming months as the US/China trade relationship becomes clearer. Should it take a more antagonistic track, we still find comfort that China's 1.4bn in population is a large enough market to sustain itself, and geopolitical realignment will allow China to continue to thrive in spite of a more difficult relationship with the United States.
Brian Chen, Portfolio Manager
Anupam Bose, Portfolio Manager
Chuck Clough, Portfolio Manager
Investments in international and emerging markets securities include exposure to risks such as currency fluctuations, foreign taxes and regulations, and the potential for illiquid markets and political instability.
The views of the authors and information discussed in this commentary are as of the date of publication, are subject to change, and may not reflect the writer's current views. The views expressed are those of the authors only, and represent an assessment of market conditions at a specific point in time, are opinions only and should not be relied upon as investment advice regarding a particular investment or markets in general. Such information does not constitute a recommendation to buy or sell specific securities or investment vehicles. It should not be assumed that any investment will be profitable or will equal the performance of the fund(s) or any securities or any sectors mentioned in this letter. The subject matter contained in this letter has been derived from several sources believed to be reliable and accurate at the time of compilation. Neither ALPS, Advisors, Inc., Clough Capital Partners, LP, nor the Fund accepts any liability for losses either direct or consequential caused by the use of this information.
Clough China Fund
| Performance Update | October 31, 2018 (Unaudited) |
Performance of $10,000 Initial Investment (as of October 31, 2018)
Comparison of change in value of a $10,000 investment
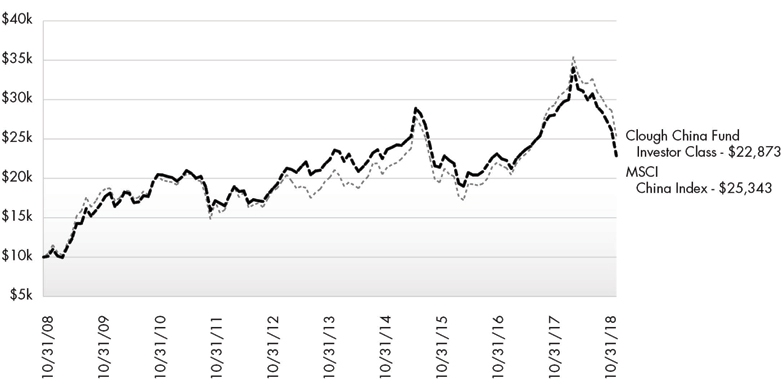
The chart above represents historical performance of a hypothetical investment of $10,000 in the Fund since inception. Past performance does not guarantee future results. This chart does not reflect the deduction of taxes that a shareholder would pay on Fund distributions or the redemption of Fund shares.
Average Annual Total Returns (as of October 31, 2018)
| | 6 Month | 1 Year | 3 Year | 5 Year | 10 Year | Since Inception^ | Total Expense Ratio | What You Pay* |
| Investor# (NAV) | -23.66% | -21.32% | 0.04% | 0.43% | 8.63% | 8.77% | 2.06% | 1.95% |
| Class A (NAV) | -23.69% | -21.34% | 0.03% | 0.42% | 8.62% | 8.77% | 2.06% | 1.95% |
| Class A (MOP) | -27.89% | -25.66% | -1.85% | -0.71% | 8.01% | 8.29% |
| Class C (NAV) | -23.97% | -21.94% | -0.74% | -0.34% | 7.79% | 7.95% | 2.85% | 2.70% |
| Class C (CDSC) | -24.73% | -22.72% | -0.74% | -0.34% | 7.79% | 7.95% |
| Class I1 (NAV) | -23.59% | -21.17% | 0.27% | 0.72% | 8.99% | 9.19% | 1.83% | 1.70% |
| MSCI China Index2 | -20.97% | -16.73% | 6.05% | 4.74% | 9.75% | 9.69% | | |
Performance data quoted represents past performance. Past performance does not guarantee future results. Investment return and principal value of an investment will fluctuate so that an investor’s shares, when sold or redeemed, may be worth more or less than the original cost. Current performance data may be higher or lower than actual data quoted. For the most current month-end performance data, please call 1-866-759-5679.
Maximum Offering Price (MOP) for Class A shares includes the Fund’s maximum sales charge of 5.50%. Performance shown at NAV does not include these sales charges and would have been lower had it been taken into account. If you invest $1 million or more, either as a lump sum or through the Fund’s accumulation or letter of intent programs, you can purchase Class A shares without an initial sales charge (load). A Contingent Deferred Sales Charge (“CDSC”) of 1.00% may apply to Class C shares redeemed within the first 12 months after a purchase, and on Class A shares redeemed within the first 18 months after a purchase in excess of $1 million. The Fund imposes a 2.00% redemption fee on shares held for less than 30 days.
Performance less than 1 year is cumulative.
The performance shown for the Clough China Fund for periods prior to January 15, 2010, reflects the performance of the Old Mutual China Fund, a series of Old Mutual Funds I (as a result of a prior reorganization of the Old Mutual China Fund into the Clough China Fund).
Clough China Fund
| Performance Update | October 31, 2018 (Unaudited) |
Performance shown for Class A shares prior to June 12, 2018 reflects the historical performance of the Fund’s Investor shares, calculated using the fees and expenses of Class A shares.
| 1 | Prior to close of business on January 15, 2010, Class I was known as Institutional Class of the Old Mutual China Fund. |
| 2 | The Morgan Stanley Capital International (“MSCI”) China Index is constructed according to the MSCI Global Investable Market Index (GIMI) family. The MSCI China Index is part of the MSCI Emerging Markets Index. The index is not actively managed and does not reflect any deduction for fees, expenses or taxes. An investor may not invest directly in an index. |
| ^ | Fund Inception date of December 30, 2005 for Investor Class and Classes C and I; Fund Inception date of June 12, 2018 for Class A. |
| * | What You Pay reflects the Advisor’s decision to contractually limit expenses through February 28, 2020 for Class A and February 28, 2019 for all other classes. Please see the prospectus for additional information. |
| # | Prior to December 1, 2017, Investor Class was known as Class A. |
The Fund is “non-diversified” and will generally be more volatile than diversified funds.
The table does not reflect the deduction of taxes that a shareholder would pay on Fund distributions or the redemption of Fund shares.
This Fund is not suitable for all investors and is subject to investment risks, including possible loss of the principal amount invested. There is no guarantee that the Fund will continue to hold any one particular security or stay invested in any one particular company. The composition of the Fund's top holdings is subject to change. Performance figures are historical and reflect the change in share price, reinvested distributions, changes in net asset value, sales charges and capital gains distributions, if any.
Not FDIC Insured – No Bank Guarantee – May Lose Value
Investing in China, Hong Kong and Taiwan involves risk and considerations not present when investing in more established securities markets. The Fund may be more susceptible to the economic, market, political and local risks of these regions than a fund that is more geographically diversified.
| Top Ten Holdings (as a % of Net Assets) † | |
| | |
| Alibaba Group Holding, Ltd. | 8.96% |
| Ping An Insurance Group Co. of China, Ltd. | 8.59% |
| China Construction Bank Corp. | 8.20% |
| Tencent Holdings, Ltd. | 7.74% |
| China Mobile, Ltd. | 7.37% |
| Anhui Conch Cement Co., Ltd. | 4.66% |
| Bank of China, Ltd. | 4.15% |
| Industrial & Commercial Bank of China, Ltd. | 4.11% |
| Postal Savings Bank of China, Ltd. | 3.37% |
| China Resources Land, Ltd. | 2.90% |
| Top Ten Holdings | 60.05% |
| † | Holdings are subject to change, and may not reflect the current or future position of the portfolio. Table presents indicative values only. Excludes cash & cash equivalents. |
Industry Sector Allocation (as a % of Net Assets)
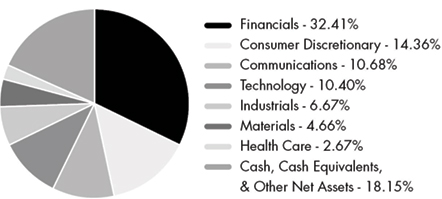
Clough China Fund
| Statement of Investments | October 31, 2018 |
| | | Shares | | | Value (Note 2) | |
| COMMON STOCKS (81.85%) | | | | | | | | |
| Communications (10.68%) | | | | | | | | |
| Media (1.29%) | | | | | | | | |
| iQIYI, Inc., ADR(a) | | | 24,800 | | | $ | 487,072 | |
| | | | | | | | | |
| Telecommunications (9.39%) | | | | | | | | |
| China Mobile, Ltd., Sponsored ADR | | | 59,800 | | | | 2,783,690 | |
| China Telecom Corp., Ltd. | | | 1,618,000 | | | | 765,528 | |
| | | | | | | | 3,549,218 | |
| | | | | | | | | |
| TOTAL COMMUNICATIONS | | | | | | | 4,036,290 | |
| | | | | | | | | |
| Consumer Discretionary (14.36%) | | | | | | | | |
| Consumer Services (0.92%) | | | | | | | | |
| TAL Education Group, ADR(a) | | | 11,900 | | | | 344,862 | |
| | | | | | | | | |
| Gaming, Lodging & Restaurants (4.48%) | | | | | | | | |
| China Lodging Group, Ltd., ADR | | | 28,200 | | | | 737,712 | |
| Galaxy Entertainment Group, Ltd. | | | 176,000 | | | | 955,528 | |
| | | | | | | | 1,693,240 | |
| | | | | | | | | |
| Retail - Discretionary (8.96%) | | | | | | | | |
| Alibaba Group Holding, Ltd., Sponsored ADR(a) | | | 23,800 | | | | 3,386,264 | |
| | | | | | | | | |
| TOTAL CONSUMER DISCRETIONARY | | | | | | | 5,424,366 | |
| | | | | | | | | |
| Financials (32.41%) | | | | | | | | |
| Banking (19.83%) | | | | | | | | |
| Bank of China, Ltd., Class H | | | 3,681,437 | | | | 1,568,445 | |
| China Construction Bank Corp., Class H | | | 3,903,080 | | | | 3,097,278 | |
| Industrial & Commercial Bank of China, Ltd., Class H | | | 2,290,967 | | | | 1,554,359 | |
| Postal Savings Bank of China, Ltd., Class H | | | 2,129,958 | | | | 1,274,374 | |
| | | | | | | | 7,494,456 | |
| | | | | | | | | |
| Insurance (8.59%) | | | | | | | | |
| Ping An Insurance Group Co. of China, Ltd., Class H | | | 343,500 | | | | 3,247,460 | |
| | | | | | | | | |
| Real Estate (3.99%) | | | | | | | | |
| China Resources Land, Ltd. | | | 322,000 | | | | 1,095,186 | |
| Longfor Group Holdings, Ltd. | | | 169,020 | | | | 410,750 | |
| | | | | | | | 1,505,936 | |
| | | | | | | | | |
| TOTAL FINANCIALS | | | | | | | 12,247,852 | |
| | | | | | | | | |
| Health Care (2.67%) | | | | | | | | |
| Health Care Facilities & Services (2.67%) | | | | | | | | |
| Sinopharm Group Co., Ltd., Class H | | | 208,000 | | | $ | 1,007,625 | |
| | | | | | | | | |
| TOTAL HEALTH CARE | | | | | | | 1,007,625 | |
| | | Shares | | | Value (Note 2) | |
| Industrials (6.67%) | | | | | | |
| Engineering & Construction Services (6.67%) | | | | | | | | |
| China Railway Construction Corp., Ltd., Class H | | | 789,355 | | | | 1,002,487 | |
| China Railway Group, Ltd., Class H | | | 851,000 | | | | 760,549 | |
| China Tower Corp., Ltd.(a) | | | 5,000,000 | | | | 758,740 | |
| | | | | | | | 2,521,776 | |
| | | | | | | | | |
| TOTAL INDUSTRIALS | | | | | | | 2,521,776 | |
| | | | | | | | | |
| Materials (4.66%) | | | | | | | | |
| Construction Materials (4.66%) | | | | | | | | |
| Anhui Conch Cement Co., Ltd., Class H | | | 339,500 | | | | 1,759,676 | |
| | | | | | | | | |
| TOTAL MATERIALS | | | | | | | 1,759,676 | |
| | | | | | | | | |
| Technology (10.40%) | | | | | | | | |
| Software (7.74%) | | | | | | | | |
| Tencent Holdings, Ltd. | | | 85,400 | | | | 2,925,741 | |
| | | | | | | | | |
| Technology Services (2.66%) | | | | | | | | |
| Baozun, Inc., Sponsored ADR(a) | | | 25,200 | | | | 1,003,212 | |
| | | | | | | | | |
| TOTAL TECHNOLOGY | | | | | | | 3,928,953 | |
| | | | | | | | | |
| TOTAL COMMON STOCKS | | | | | | | | |
| (Cost $25,145,576) | | | | | | | 30,926,538 | |
| | | | | | | | | |
| SHORT TERM SECURITY (7.22%) | | | | | | | | |
| Money Market Fund (7.22%) | | | | | | | | |
| Blackrock Liquidity Funds, T-Fund | 2.061% | | | 2,727,948 | | | | 2,727,948 | |
| | | | | | | | | |
| TOTAL SHORT TERM SECURITY | | | | | | | | |
| (Cost $2,727,948) | | | | | | | 2,727,948 | |
| | | | | | | | | |
| TOTAL INVESTMENTS (89.07%) | | | | | | | | |
| (Cost $27,873,524) | | | | | | $ | 33,654,486 | |
| | | | | | | | | |
| Other Assets In Excess Of Liabilities (10.93%)(b) | | | | | | | 4,131,574 | |
| | | | | | | | | |
| NET ASSETS (100.00%) | | | | | | $ | 37,786,060 | |
| (a) | Non-Income Producing Security. |
| (b) | Includes cash which is being held as collateral for total return swap contracts in the amount of $2,670,000. |
Clough China Fund
| Statement of Investments | October 31, 2018 |
TOTAL RETURN SWAP CONTRACTS(a)
Swap Counterparty | | Reference Obligation | | Notional Amount | | | Floating Rate Paid by Fund* | | Termination Date | | Value | | | Unrealized Depreciation | |
| Morgan Stanley | | Jiangsu Yanghe Brewery | | $ | 510,837 | | | 1D FEDEF + 255 BPS | | 09/28/2020 | | $ | 380,221 | | | $ | (130,616 | ) |
| | | | | $ | 510,837 | | | | | | | $ | 380,221 | | | $ | (130,616 | ) |
| (a) | For long positions in the total return swap, the Fund receives payments based on any positive return of the Reference Obligation less the rate paid by the Fund. The Fund makes payments on any negative return of such Reference Obligations plus the rate paid by the Fund. For the short positions in the total return swap, the Fund makes payments based on any positive return of the Reference Obligation less the rate paid by the Fund. The Fund receives payments on any negative return of such Reference Obligations plus the rate paid by the Fund. |
| * | Payments are made weekly. |
Investment Abbreviations:
1D FEDEF - Federal Funds Effective Rate (Daily)
For Fund compliance purposes, the Fund's industry classifications refer to any one or more of the industry sub-classifications used by one or more widely recognized market indexes or ratings group indexes, and/or as defined by Fund management. This definition may not apply for purposes of this report, which may combine industry sub-classifications for reporting ease. Industries are shown as a percent of net assets.
See Notes to Financial Statements.
Clough China Fund
| Statement of Assets and Liabilities | October 31, 2018 |
| ASSETS | | | |
| Investments, at value | | $ | 33,654,486 | |
| Foreign currency, at value (Cost $1,976,299) | | | 1,976,299 | |
| Receivable for investments sold | | | 1,530,655 | |
| Receivable for shares sold | | | 214 | |
| Cash collateral pledged for total return swap contracts (Note 3) | | | 2,670,000 | |
| Dividends receivable | | | 20,561 | |
| Prepaid expenses and other assets | | | 14,798 | |
| Total Assets | | | 39,867,013 | |
| LIABILITIES | | | | |
| Payable for investments purchased | | | 1,139,815 | |
| Payable for interest expense on total return swap contracts | | | 1,103 | |
| Payable for shares redeemed | | | 149,250 | |
| Unrealized depreciation on total return swap contracts | | | 130,616 | |
| Investment advisory fees payable | | | 20,005 | |
| Administration and transfer agency fees payable | | | 24,087 | |
| Distribution and services fees payable | | | 6,522 | |
| Professional fees payable | | | 24,691 | |
| Accrued expenses and other liabilities | | | 584,864 | |
| Total Liabilities | | | 2,080,953 | |
| NET ASSETS | | $ | 37,786,060 | |
| NET ASSETS CONSIST OF | | | | |
| Paid-in capital | | $ | 30,433,298 | |
| Total distributable earnings | | | 7,352,762 | |
| NET ASSETS | | $ | 37,786,060 | |
| INVESTMENTS, AT COST | | $ | 27,873,524 | |
| PRICING OF SHARES | | | | |
| Investor Class: | | | | |
| Net Asset Value, offering and redemption price per share | | $ | 21.36 | |
| Net Assets | | $ | 11,879,404 | |
| Shares of beneficial interest outstanding (unlimited number of shares, no par value common stock authorized) | | | 556,250 | |
| Class A: | | | | |
| Net Asset Value, offering and redemption price per share | | $ | 21.36 | |
| Net Assets | | $ | 7,132 | |
| Shares of beneficial interest outstanding (unlimited number of shares, no par value common stock authorized) | | | 334 | |
| Maximum offering price per share ((NAV/0.9450), based on maximum sales charge of 5.50% of the offering price) | | $ | 22.60 | |
| Class C: | | | | |
| Net Asset Value, offering and redemption price per share(a) | | $ | 20.14 | |
| Net Assets | | $ | 4,244,631 | |
| Shares of beneficial interest outstanding (unlimited number of shares, no par value common stock authorized) | | | 210,725 | |
| Class I: | | | | |
| Net Asset Value, offering and redemption price per share | | $ | 21.90 | |
| Net Assets | | $ | 21,654,893 | |
| Shares of beneficial interest outstanding (unlimited number of shares, no par value common stock authorized) | | | 988,630 | |
| (a) | Redemption price per share may be reduced for any applicable contingent deferred sales charge. For a description of a possible sales charge, please see the Fund's Prospectus. |
See Notes to Financial Statements.
Clough China Fund
| Statement of Operations | For the Year Ended October 31, 2018 |
| INVESTMENT INCOME | | | |
| Dividends | | $ | 950,144 | |
| Foreign taxes withheld on dividends | | | (77,009 | ) |
| Total Investment Income | | | 873,135 | |
| | | | | |
| EXPENSES | | | | |
| Investment advisory fees | | | 746,505 | |
| Administrative fees | | | 95,218 | |
| Transfer agency fees | | | 36,491 | |
| Distribution and service fees | | | | |
| Investor Class(a) | | | 42,690 | |
| Class A(b) | | | 8 | |
| Class C | | | 63,665 | |
| Professional fees | | | 38,845 | |
| Reports to shareholders and printing fees | | | 10,744 | |
| State registration fees | | | 51,558 | |
| Insurance fees | | | 425 | |
| Custody fees | | | 32,899 | |
| Trustees' fees and expenses | | | 1,326 | |
| Miscellaneous expenses | | | 12,397 | |
| Total Expenses | | | 1,132,771 | |
| Less fees waived/reimbursed by investment advisor (Note 8) | | | | |
| Investor Class(a) | | | (25,566 | ) |
| Class A(b) | | | (9 | ) |
| Class C | | | (9,843 | ) |
| Class I | | | (52,087 | ) |
| Net Expenses | | | 1,045,266 | |
| Net Investment Loss | | | (172,131 | ) |
| Net realized gain on investments | | | 8,141,740 | |
| Net realized loss on total return swap contracts | | | (774,756 | ) |
| Net realized loss on foreign currency transactions | | | (17,040 | ) |
| Net Realized Gain | | | 7,349,944 | |
| Net change in unrealized depreciation on investments | | | (16,888,255 | ) |
| Net change in unrealized depreciation on total return swap contracts | | | (130,616 | ) |
| Net change in unrealized appreciation on translation of assets and liabilities denominated in foreign currencies | | | 3,706 | |
| Net Change in Unrealized Depreciation | | | (17,015,165 | ) |
| NET REALIZED AND UNREALIZED LOSS ON INVESTMENTS | | | (9,665,221 | ) |
| NET DECREASE IN NET ASSETS RESULTING FROM OPERATIONS | | $ | (9,837,352 | ) |
| (a) | Prior to December 1, 2017, Investor Class was known as Class A. |
See Notes to Financial Statements.
Clough China Fund
Statements of Changes in Net Assets
| | | For the Year Ended October 31, 2018 | | | For the Year Ended October 31, 2017 | |
| OPERATIONS | | | | | | |
| Net investment income/(loss) | | $ | (172,131 | ) | | $ | 214,206 | |
| Net realized gain | | | 7,349,944 | | | | 3,290,268 | |
| Net change in unrealized appreciation/(depreciation) | | | (17,015,165 | ) | | | 10,361,341 | |
| Net Increase/(Decrease) in Net Assets Resulting from Operations | | | (9,837,352 | ) | | | 13,865,815 | |
| | | | | | | | | |
| TOTAL DISTRIBUTIONS(a) | | | | | | | | |
| From distributable earnings | | | | | | | | |
| Investor Class(b) | | | (47,964 | ) | | | (16,170 | ) |
| Class I | | | (177,434 | ) | | | (86,942 | ) |
| Net Decrease in Net Assets from Distributions | | | (225,398 | ) | | | (103,112 | ) |
| | | | | | | | | |
| BENEFICIAL INTEREST TRANSACTIONS (NOTE 6) | | | | | | | | |
| Shares sold | | | | | | | | |
| Investor Class(b) | | | 797,648 | | | | 1,280,383 | |
| Class A(c) | | | 10,000 | | | | – | |
| Class C | | | 195,240 | | | | 139,824 | |
| Class I | | | 2,041,850 | | | | 2,433,441 | |
| Dividends reinvested | | | | | | | | |
| Investor Class(b) | | | 28,723 | | | | 10,603 | |
| Class I | | | 133,061 | | | | 58,387 | |
| Shares redeemed, net of redemption fees | | | | | | | | |
| Investor Class(b) | | | (3,138,078 | ) | | | (6,308,325 | ) |
| Class C | | | (1,338,866 | ) | | | (3,463,943 | ) |
| Class I | | | (10,205,187 | ) | | | (8,903,595 | ) |
| Net Decrease in Net Assets Derived from Beneficial Interest Transactions | | | (11,475,609 | ) | | | (14,753,225 | ) |
| | | | | | | | | |
| Net decrease in net assets | | | (21,538,359 | ) | | | (990,522 | ) |
| | | | | | | | | |
| NET ASSETS | | | | | | | | |
| Beginning of year | | | 59,324,419 | | | | 60,314,941 | |
| End of year | | $ | 37,786,060 | | | $ | 59,324,419 | (d) |
| (a) | For the prior year ended October 31, 2017, Total Distributions consisted of Net Investment Income $103,112, and Net Realized Gains $–. |
| (b) | Prior to December 1, 2017, Investor Class was known as Class A. |
| (c) | Class A commenced operations on June 12, 2018. |
| (d) | For the prior year ended October 31, 2017, included accumulated net investment income of $204,393. |
See Notes to Financial Statements.
Clough China Fund – Investor Class
Financial Highlights
Selected data for a share of beneficial interest outstanding throughout the periods indicated:
| | | For the Year Ended October 31, 2018(a) | | | For the Year Ended October 31, 2017 | | | For the Year Ended October 31, 2016 | | | For the Year Ended October 31, 2015 | | | For the Fiscal Period Ended October 31, 2014(b) | | | For the Year Ended April 30, 2014 | |
| Net asset value, beginning of period | | $ | 27.22 | | | $ | 21.07 | | | $ | 21.74 | | | $ | 23.50 | | | $ | 20.72 | | | $ | 21.45 | |
| INCOME/(LOSS) FROM INVESTMENT OPERATIONS: | | | | | | | | | | | | | | | | | | | | | | | | |
| Net investment income/(loss)(c) | | | (0.08 | ) | | | 0.08 | | | | 0.04 | | | | 0.12 | | | | 0.45 | | | | 0.12 | |
| Net realized and unrealized gain/(loss) | | | (5.71 | ) | | | 6.09 | | | | (0.40 | ) | | | (0.92 | ) | | | 2.33 | | | | (0.69 | ) |
| Total from investment operations | | | (5.79 | ) | | | 6.17 | | | | (0.36 | ) | | | (0.80 | ) | | | 2.78 | | | | (0.57 | ) |
| DISTRIBUTIONS: | | | | | | | | | | | | | | | | | | | | | | | | |
| From net investment income | | | (0.07 | ) | | | (0.02 | ) | | | (0.31 | ) | | | (0.50 | ) | | | – | | | | (0.17 | ) |
| From net realized gains | | | – | | | | – | | | | – | | | | (0.46 | ) | | | – | | | | – | |
| Total distributions | | | (0.07 | ) | | | (0.02 | ) | | | (0.31 | ) | | | (0.96 | ) | | | – | | | | (0.17 | ) |
| REDEMPTION FEES ADDED TO PAID-IN CAPITAL (NOTE 6) | | | 0.00 | (d) | | | – | | | | 0.00 | (d) | | | 0.00 | (d) | | | 0.00 | (d) | | | 0.01 | |
| Net increase/(decrease) in net asset value | | | (5.86 | ) | | | 6.15 | | | | (0.67 | ) | | | (1.76 | ) | | | 2.78 | | | | (0.73 | ) |
| Net asset value, end of year | | $ | 21.36 | | | $ | 27.22 | | | $ | 21.07 | | | $ | 21.74 | | | $ | 23.50 | | | $ | 20.72 | |
| TOTAL RETURN(e) | | | (21.32 | )% | | | 29.32 | % | | | (1.61 | )% | | | (3.49 | )% | | | 13.42 | % | | | (2.69 | )% |
| RATIOS/SUPPLEMENTAL DATA: | | | | | | | | | | | | | | | | | | | | | | | | |
| Net assets, end of year (000s) | | $ | 11,879 | | | $ | 17,523 | | | $ | 18,358 | | | $ | 25,276 | | | $ | 30,526 | | | $ | 31,164 | |
| Ratio of expenses to average net assets excluding fee waivers and reimbursements | | | 2.10 | % | | | 2.05 | % | | | 2.04 | % | | | 1.98 | % | | | 2.06 | %(f) | | | 2.06 | % |
| Ratio of expenses to average net assets including fee waivers and reimbursements | | | 1.95 | % | | | 1.95 | % | | | 1.95 | % | | | 1.95 | % | | | 1.95 | %(f) | | | 1.95 | % |
| Ratio of net investment income/(loss) to average net assets | | | (0.30 | )% | | | 0.34 | % | | | 0.18 | % | | | 0.50 | % | | | 3.96 | %(f) | | | 0.55 | % |
| Portfolio turnover rate(g) | | | 131 | % | | | 71 | % | | | 126 | % | | | 193 | % | | | 76 | % | | | 232 | % |
| (a) | Prior to December 1, 2017, Investor Class was known as Class A. |
| (b) | Effective May 1, 2014, the Board approved changing the fiscal year-end of the Funds from April 30 to October 31. |
| (c) | Calculated using the average shares method. |
| (d) | Less than $0.005 or ($0.005) per share. |
| (e) | Total returns are for the period indicated and have not been annualized. Total returns would have been lower had certain expenses not been waived during the period. Returns shown do not reflect the deduction of taxes that a shareholder would pay on Fund distributions or the redemption of Fund shares. Returns shown exclude any applicable sales charges. |
| (g) | Portfolio turnover rate for periods less than one full year have not been annualized. |
See Notes to Financial Statements.
Clough China Fund – Class A
Financial Highlights
Selected data for a share of beneficial interest outstanding throughout the periods indicated:
| | | For the Period June 12, 2018 (Commencement of Operations) to October 31, 2018 | |
| Net asset value, beginning of period | | $ | 29.95 | |
| | | | | |
| INCOME FROM INVESTMENT OPERATIONS: | | | | |
| Net investment income(a) | | | 0.14 | |
| Net realized and unrealized loss | | | (8.73 | ) |
| Total from investment operations | | | (8.59 | ) |
| | | | | |
| Net (decrease) in net asset value | | | (8.59 | ) |
| Net asset value, end of year | | $ | 21.36 | |
| TOTAL RETURN(b) | | | (28.68 | )% |
| | | | | |
| RATIOS/SUPPLEMENTAL DATA: | | | | |
| Net assets, end of year (000s) | | $ | 7 | |
| Ratio of expenses to average net assets excluding fee waivers and reimbursements | | | 2.22 | %(c) |
| Ratio of expenses to average net assets including fee waivers and reimbursements | | | 1.95 | %(c) |
| Ratio of net investment income to average net assets | | | 1.47 | %(c) |
| Portfolio turnover rate(d) | | | 131 | % |
| (a) | Calculated using the average shares method. |
Total returns are for the period indicated and have not been annualized. Total returns would have been lower had certain expenses not been waived during the period. Returns shown do not reflect the deduction of taxes that a shareholder would pay on Fund distributions or the
| (b) | redemption of Fund shares. |
| (d) | Portfolio turnover rate for periods less than one full year have not been annualized. |
See Notes to Financial Statements.
Clough China Fund – Class C
Financial Highlights
Selected data for a share of beneficial interest outstanding throughout the periods indicated:
| | | For the Year Ended October 31, 2018 | | | For the Year Ended October 31, 2017 | | | For the Year Ended October 31, 2016 | | | For the Year Ended October 31, 2015 | | | For the Fiscal Period Ended October 31, 2014(a) | | | For the Year Ended April 30, 2014 | |
| Net asset value, beginning of period | | $ | 25.80 | | | $ | 20.10 | | | $ | 20.72 | | | $ | 22.53 | | | $ | 19.94 | | | $ | 20.71 | |
| INCOME/(LOSS) FROM INVESTMENT OPERATIONS: | | | | | | | | | | | | | | | | | | | | | | | | |
| Net investment income/(loss)(b) | | | (0.28 | ) | | | (0.12 | )(c) | | | (0.10 | ) | | | (0.04 | ) | | | 0.33 | | | | (0.02 | ) |
| Net realized and unrealized gain/(loss) | | | (5.38 | ) | | | 5.82 | | | | (0.39 | ) | | | (0.89 | ) | | | 2.26 | | | | (0.68 | ) |
| Total from investment operations | | | (5.66 | ) | | | 5.70 | | | | (0.49 | ) | | | (0.93 | ) | | | 2.59 | | | | (0.70 | ) |
| DISTRIBUTIONS: | | | | | | | | | | | | | | | | | | | | | | | | |
| From net investment income | | | – | | | | – | | | | (0.13 | ) | | | (0.42 | ) | | | – | | | | (0.07 | ) |
| From net realized gains | | | – | | | | – | | | | – | | | | (0.46 | ) | | | – | | | | – | |
| Total distributions | | | – | | | | – | | | | (0.13 | ) | | | (0.88 | ) | | | – | | | | (0.07 | ) |
| REDEMPTION FEES ADDED TO PAID-IN CAPITAL (NOTE 6) | | | – | | | | 0.00 | (d) | | | 0.00 | (d) | | | 0.00 | (d) | | | 0.00 | (d) | | | 0.00 | (d) |
| Net increase/(decrease) in net asset value | | | (5.66 | ) | | | 5.70 | | | | (0.62 | ) | | | (1.81 | ) | | | 2.59 | | | | (0.77 | ) |
| Net asset value, end of year | | $ | 20.14 | | | $ | 25.80 | | | $ | 20.10 | | | $ | 20.72 | | | $ | 22.53 | | | $ | 19.94 | |
| TOTAL RETURN(e) | | | (21.94 | )% | | | 28.36 | % | | | (2.34 | )% | | | (4.25 | )% | | | 12.99 | % | | | (3.43 | )% |
| RATIOS/SUPPLEMENTAL DATA: | | | | | | | | | | | | | | | | | | | | | | | | |
| Net assets, end of year (000s) | | $ | 4,245 | | | $ | 6,610 | | | $ | 8,352 | | | $ | 10,395 | | | $ | 11,575 | | | $ | 10,866 | |
| Ratio of expenses to average net assets excluding fee waivers and reimbursements | | | 2.85 | % | | | 2.85 | % | | | 2.83 | % | | | 2.78 | % | | | 2.87 | %(f) | | | 2.86 | % |
| Ratio of expenses to average net assets including fee waivers and reimbursements | | | 2.70 | % | | | 2.70 | % | | | 2.70 | % | | | 2.70 | % | | | 2.70 | %(f) | | | 2.70 | % |
| Ratio of net investment income/(loss) to average net assets | | | (1.07 | )% | | | (0.54 | )% | | | (0.52 | )% | | | (0.18 | )% | | | 3.08 | %(f) | | | (0.09 | )% |
| Portfolio turnover rate(g) | | | 131 | % | | | 71 | % | | | 126 | % | | | 193 | % | | | 76 | % | | | 232 | % |
| (a) | Effective May 1, 2014, the Board approved changing the fiscal year-end of the Funds from April 30 to October 31. |
| (b) | Calculated using the average shares method. |
| (c) | The per share amount does not correspond to activity reflected in the Statement of Operations due to class specific expenses during the period. |
| (d) | Less than $0.005 or ($0.005) per share. |
| (e) | Total returns are for the period indicated and have not been annualized. Total returns would have been lower had certain expenses not been waived during the period. Returns shown do not reflect the deduction of taxes that a shareholder would pay on Fund distributions or the redemption of Fund shares. Returns shown exclude any applicable sales charges. |
| (g) | Portfolio turnover rate for periods less than one full year have not been annualized. |
See Notes to Financial Statements.
Clough China Fund – Class I
Financial Highlights
Selected data for a share of beneficial interest outstanding throughout the periods indicated:
| | | For the Year Ended October 31, 2018 | | | For the Year Ended October 31, 2017 | | | For the Year Ended October 31, 2016 | | | For the Year Ended October 31, 2015 | | | For the Fiscal Period Ended October 31, 2014(a) | | | For the Year Ended April 30, 2014 | |
| Net asset value, beginning of period | | $ | 27.92 | | | $ | 21.60 | | | $ | 22.28 | | | $ | 23.97 | | | $ | 21.11 | | | $ | 21.82 | |
| INCOME/(LOSS) FROM INVESTMENT OPERATIONS: | | | | | | | | | | | | | | | | | | | | | | | | |
| Net investment income/(loss)(b) | | | (0.05 | ) | | | 0.15 | | | | 0.09 | | | | 0.23 | | | | 0.45 | | | | 0.19 | |
| Net realized and unrealized gain/(loss) | | | (5.83 | ) | | | 6.23 | | | | (0.39 | ) | | | (1.00 | ) | | | 2.41 | | | | (0.69 | ) |
| Total from investment operations | | | (5.88 | ) | | | 6.38 | | | | (0.30 | ) | | | (0.77 | ) | | | 2.86 | | | | (0.50 | ) |
| DISTRIBUTIONS: | | | | | | | | | | | | | | | | | | | | | | | | |
| From net investment income | | | (0.14 | ) | | | (0.06 | ) | | | (0.38 | ) | | | (0.53 | ) | | | – | | | | (0.21 | ) |
| From net realized gains | | | – | | | | – | | | | – | | | | (0.46 | ) | | | – | | | | – | |
| Total distributions | | | (0.14 | ) | | | (0.06 | ) | | | (0.38 | ) | | | (0.99 | ) | | | – | | | | (0.21 | ) |
| REDEMPTION FEES ADDED TO PAID-IN CAPITAL (NOTE 6) | | | – | | | | 0.00 | (c) | | | 0.00 | (c) | | | 0.07 | | | | 0.00 | (c) | | | 0.00 | (c) |
| Net increase/(decrease) in net asset value | | | (6.02 | ) | | | 6.32 | | | | (0.68 | ) | | | (1.69 | ) | | | 2.86 | | | | (0.71 | ) |
| Net asset value, end of year | | $ | 21.90 | | | $ | 27.92 | | | $ | 21.60 | | | $ | 22.28 | | | $ | 23.97 | | | $ | 21.11 | |
| TOTAL RETURN(d) | | | (21.17 | )% | | | 29.64 | % | | | (1.31 | )% | | | (2.99 | )% | | | 13.55 | % | | | (2.41 | )% |
| RATIOS/SUPPLEMENTAL DATA: | | | | | | | | | | | | | | | | | | | | | | | | |
| Net assets, end of year (000s) | | $ | 21,655 | | | $ | 35,191 | | | $ | 33,605 | | | $ | 37,772 | | | $ | 39,917 | | | $ | 33,435 | |
| Ratio of expenses to average net assets excluding fee waivers and reimbursements | | | 1.86 | % | | | 1.83 | % | | | 1.82 | % | | | 1.77 | % | | | 1.82 | %(e) | | | 1.81 | % |
| Ratio of expenses to average net assets including fee waivers and reimbursements | | | 1.70 | % | | | 1.70 | % | | | 1.70 | % | | | 1.70 | % | | | 1.70 | %(e) | | | 1.70 | % |
| Ratio of net investment income/(loss) to average net assets | | | (0.17 | )% | | | 0.61 | % | | | 0.46 | % | | | 0.95 | % | | | 3.89 | %(e) | | | 0.83 | % |
| Portfolio turnover rate(f) | | | 131 | % | | | 71 | % | | | 126 | % | | | 193 | % | | | 76 | % | | | 232 | % |
| (a) | Effective May 1, 2014, the Board approved changing the fiscal year-end of the Funds from April 30 to October 31. |
| (b) | Calculated using the average shares method. |
| (c) | Less than $0.005 or ($0.005) per share. |
| (d) | Total returns are for the period indicated and have not been annualized. Total returns would have been lower had certain expenses not been waived during the period. Returns shown do not reflect the deduction of taxes that a shareholder would pay on Fund distributions or the redemption of Fund shares. |
| (f) | Portfolio turnover rate for periods less than one full year have not been annualized. |
See Notes to Financial Statements.
RiverFront Global Allocation Series
| Management Commentary | October 31, 2018 (Unaudited) |
Annual Overview
As annual reports arrive, investors with international equity allocations may be disappointed to find that their accounts only returned a fraction of the S&P 500’s return. This is because over the past twelve months the S&P 500 significantly outperformed most other asset classes, continuing a theme that has persisted since the Financial Crisis. We anticipate that the disappointing performance from international equities will once again raise questions about whether diversification outside the US still makes sense and recognize that the allure to un-diversify can be overwhelming when it is not working, and an investor’s home base is performing well.
Since 1973 the overall yearly “win” percentage of international stocks versus those in the US is nearly identical in US dollar terms. We recognize that it often does not feel that way since there were two long-term mega-streaks for each side over that time-period, including the now decade-long hot streak the US is currently riding. Accordingly, even though international equity markets were notable Fiscal Year laggards versus US peers, we remain constructive.
Market Outlook
We see several primary reasons for International outperformance potential. First, valuations remain attractive. Riverfront’s asset allocation framework, based on the potential of long-term mean reversion, suggests to us that international equities are priced to return significantly more over the next 5-10 years than US equities.
Second, monetary policy remains accommodative. Inflation trends in Europe, Japan and most major emerging markets are tepid compared to history and economic trends globally are still positive. We believe this is a 'Goldilocks' scenario because spare capacity in these economies give international central banks cover to maintain their accommodative policies. Historically, this has provided a positive underpinning for global stock markets.
Third, the US Dollar may halt its secular rise. In addition to the ‘Goldilocks’ economic environment, we believe that the US dollar is in the later-stages of its bull market that began in mid-2011. If the USD can stop its ascension, emerging markets could stabilize and developed international stocks could deliver stronger USD- denominated returns.
Fourth, economic and earnings growth remain positive. We believe we are in the early-to-mid stages of a positive corporate earnings cycle in Europe, Japan, and many major emerging markets as evidenced by their strong performance in 2017. We expect this positive growth is expected to continue in 2019 and beyond. Over the long-run, it is unusual for stocks to perform poorly in times when earnings growth is positive.
Lastly, trade tensions seem now largely priced into the markets. On a trailing P/E basis, the valuation gap between US and non-US stocks remains close to the widest levels in 45 years. We see negative market sentiment related to protectionist trade policy as the primary contributor to this valuation gap this year. While trade uncertainty relating to China is likely to stay with us for a while, we believe it is possible that we get positive resolution to trade issues between the US, NAFTA and the EU in 2018. Eventually, we believe that in the longer-term, the structural imbalances in China’s
economy and the unequal amount of trade leverage that the US exercises over China will lead to a resolution, no matter how ugly the negotiations appear in the meantime.
Performance Discussions
Asset Allocation Income & Growth
Broadly, the portfolio under-performed its benchmark in the year, due to allocation decisions. A few of the top themes that most contributed to and detracted from performance in the year are listed below:
Contributors:
| ● | Allocation and Selection – Fixed Income: Our underweight to fixed-income, particularly in core traditional domestic fixed-income was additive in the year, given equity out-performance. |
| ● | Allocation to Cash: Cash instruments, although largely frictional, generated modest relative gains. |
Detractors:
| ● | Underweighted Allocation to US Equities: The decision to underweight US equities relative to the benchmark in favor of overweighting Developed International equities was a detractor in the year. |
| ● | Selection in Domestic Equities: Selection in the cyclicals and financial sectors truncated gains. |
| ● | Overweight to International Equities: Exposure to Developed and Emerging Markets negatively impacted returns. |
Asset Allocation Moderate
Broadly, the portfolio under-performed its benchmark over the year, due to both selection and allocation decisions. A few of the top themes that most contributed to and detracted from performance in the year are listed below:
Contributors:
| ● | Allocation and Selection in Fixed Income: Our underweight to and selection within fixed-income were additive in the year. |
| ● | Allocation to Cash: Cash instruments, although largely frictional, generated modest relative gains. |
Detractors:
| ● | Allocation and Selection Domestic Equities: The decision to underweight US equities relative to the benchmark in favor of overweighting lagging Developed and Emerging International equities was a detractor in the quarter. Selection in the financial and technology sectors truncated gains. |
| ● | Overweight to International Equities: Exposure to Developed and Emerging Markets negatively impacted returns. |
RiverFront Global Allocation Series
| Management Commentary | October 31, 2018 (Unaudited) |
Asset Allocation Growth & Income
Broadly, the portfolio under-performed its benchmark over the year, due to both allocation and selection decisions. A few of the top themes that most contributed to and detracted from performance in the year are listed below:
Contributors:
| ● | Allocation and Selection – Fixed Income: Our underweight to and selection within fixed-income were additive to relative returns. |
| ● | Allocation in Developed International: Our overweight in energy and selection in the telecommunication sectors added value in the year. |
Detractors:
| ● | Allocation and Selection – International: Over-weights in Developed International and Emerging Markets, as well as selections in respective finance industrials and technology sectors negatively impacted returns. |
| ● | Allocation and Selection in US Equities: An underweight to U.S. Equities and selection decisions in the financial, consumer cyclicals and technology sectors dampened relative gains. |
Asset Allocation Growth
Broadly, the portfolio under-performed its benchmark over the year, due to both allocation and selection decisions. A few of the top themes that most contributed to and detracted from performance in the year are listed below:
Contributors:
| ● | Allocation and Selection – Fixed Income: Our underweight to core traditional domestic fixed-income was additive in the year. |
| ● | Allocation to Cash: Cash instruments, although largely frictional, generated modest relative gains. |
Detractors:
| ● | Allocation and Selection International: The decision to overweight Developed and Emerging market International relative to the benchmark and selection in the financial and technology sectors proved difficult. |
| ● | Allocation to Domestic Equities: The decision to underweight US equities relative to the benchmark in favor of overweighting Developed and Emerging International equities was a detractor in the year. |
Asset Allocation Aggressive
Broadly, the portfolio under-performed its benchmark over the year, due to both allocation and selection decisions. A few of the top themes that most contributed to and detracted from performance in the year are listed below:
Contributors:
| ● | Selection within Developed International: Our selections within the Developed energy and telecommunications sectors benefitted returns. |
| ● | Selection in Emerging Markets International: The portfolio’s selection in Utilities and Consumer Cyclicals sectors fostered positive relative returns. |
Detractors:
| ● | Allocation and Selection – Domestic Equities: The decision to underweight US equities relative to the benchmark in favor of overweighting Developed and Emerging International equities was a detractor in the year. Selection in technology and consumer cyclicals dampened relative returns. |
| ● | Allocation in Developed International: Over-weighted exposure to Developed Markets, and selection in the technology, finance and industrials sectors negatively impacted returns. |
Michael Jones, CFA
Portfolio Manager
Kevin Nicholson, CFA
Portfolio Manager
Deva Meenakshisundaram, FRM
Portfolio Manager
Bill Ryder, CFA, CMT
Portfolio Manager
RiverFront Global Allocation Series
| Management Commentary | October 31, 2018 (Unaudited) |
Past performance is no guarantee of future results. Dividends are not guaranteed and are subject to change or elimination. Investments in international and emerging markets securities include exposure to risks such as currency fluctuations, foreign taxes and regulations, and the potential for illiquid markets and political instability.
The views of the author and information discussed in this commentary are as of the date of publication, are subject to change, and may not reflect the writer's current views. The views expressed are those of the author only, and represent an assessment of market conditions at a specific point in time, are opinions only and should not be relied upon as investment advice regarding a particular investment or markets in general. Such information does not constitute a recommendation to buy or sell specific securities or investment vehicles. It should not be assumed that any investment will be profitable or will equal the performance of the fund(s) or any securities or any sectors mentioned in this letter. The subject matter contained in this letter has been derived from several sources believed to be reliable and accurate at the time of compilation. Neither ALPS Advisors, Inc., RiverFront Investment Group, LLC, nor the Funds accepts any liability for losses either direct or consequential caused by the use of this information.
The S&P 1000® Index combines the S&P MidCap 400® and the S&P SmallCap 600® to form an investable benchmark for the mid- to small-cap segment of the U.S. equity market.
The MSCI EAFE Index is recognized as the pre-eminent benchmark in the United States to measure international equity performance. It comprises the MSCI country indices that represent developed markets outside of North America: Europe, Australasia and the Far East.
The MSCI Emerging Markets Index is a free float-adjusted market capitalization index that is designed to measure equity market performance in the global emerging markets.
The BofAML US HY Master II Total Return Index tracks the performance of US dollar denominated below investment grade corporate debt publicly issued in the US domestic market.
The Barclays U.S. Treasury Index includes public obligations of the U.S. Treasury, excluding Treasury bills and certain special issues, such as state and local government series bonds (SLGs) and U.S. Treasury TIPS.
The Barclays U.S. Short Treasury Index is composed of bonds of investment grade with a maturity between one and three years.
Indices do not reflect deductions for fees, expenses, or taxes.
An investor may not invest directly in an index.
Diversification cannot guarantee gain or prevent losses.
RiverFront Asset Allocation Aggressive
| Performance Update | October 31, 2018 (Unaudited) |
Performance of $10,000 Initial Investment (as of October 31, 2018)
Comparison of change in value of a $10,000 investment
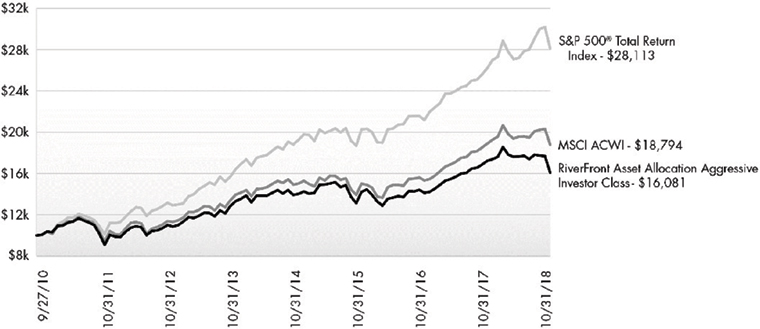
The chart above represents historical performance of a hypothetical investment of $10,000 in the Fund since inception. Past performance does not guarantee future results. This chart does not reflect the deduction of taxes that a shareholder would pay on Fund distributions or the redemption of Fund shares.
Average Annual Total Returns (as of October 31, 2018)
| | 6 Month | 1 Year | 3 Years | 5 Years | 10 Years | Since Inception^ | Total Expense Ratio | What You Pay* |
| Investor# (NAV) | -8.87% | -6.62% | 4.18% | 3.85% | 7.45% | 8.31% | 1.20% | 1.20% |
| Class A (NAV) | -8.86% | -6.60% | 4.21% | 3.85% | 7.43% | 8.30% | 1.20% | 1.20% |
| Class A (MOP) | -13.89% | -11.73% | 2.26% | 2.69% | 6.83% | 7.69% |
| Class C (NAV) | -9.20% | -7.24% | 3.43% | 3.08% | 6.66% | 7.52% | 1.95% | 1.95% |
| Class C (CDSC) | -10.11% | -8.13% | 3.43% | 3.08% | 6.66% | 7.52% |
| Class I (NAV) | -8.77% | -6.33% | 4.46% | 4.10% | 7.71% | 8.57% | 0.95% | 0.95% |
| Investor II (NAV) | -8.92% | -6.66% | 4.18% | 3.84% | 7.43% | 8.29% | 1.20% | 1.20% |
| Class L1 (NAV) | -8.72% | -6.34% | 4.46% | 4.11% | 7.71% | 8.58% | 0.95% | 0.95% |
| S&P 500® Total Return Index3 | 3.40% | 7.35% | 11.52% | 11.34% | 13.24% | 13.57% | | |
| MSCI All Country World Index2 | -3.94% | -0.52% | 7.74% | 6.15% | 9.75% | 10.60% | | |
Performance data quoted represents past performance. Past performance does not guarantee future results. Investment return and principal value of an investment will fluctuate so that an investor's shares, when sold or redeemed, may be worth more or less than the original cost. Current performance data may be higher or lower than actual data quoted. For the most current month-end performance data, please call 1-866-759-5679.
Maximum Offering Price (MOP) for Class A shares includes the Fund’s maximum sales charge of 5.50%. Performance shown at NAV does not include these sales charges and would have been lower had it been taken into account. If you invest $1 million or more, either as a lump sum or through the Fund’s accumulation or letter of intent programs, you can purchase Class A shares without an initial sales charge (load). A Contingent Deferred Sales Charge (“CDSC”) of 1.00% may apply to Class C shares redeemed within the first 12 months after a purchase, and on Class A shares redeemed within the first 18 months after a purchase in excess of $1 million.
Performance less than 1 year is cumulative.
RiverFront Asset Allocation Aggressive
| Performance Update | October 31, 2018 (Unaudited) |
Performance shown for Class A shares prior to June 12, 2018 reflects the historical performance of the Fund’s Investor shares, calculated using the fees and expenses of Class A shares.
The Investor Class, Class A, Class C, I and L shares performance shown for periods prior to September 27, 2010 reflects the performance of the Baird Funds, Inc. – RiverFront Long-Term Growth Fund’s Institutional Class shares (as result of the reorganization of the Baird Funds, Inc. – RiverFront Long-Term Growth Fund into the Fund).
The Investor II Class performance shown for periods prior to September 27, 2010 reflects the performance of the Baird Funds, Inc. – RiverFront Long-Term Growth Fund’s Investor Class shares (as result of the reorganization of the Baird Funds, Inc. – RiverFront Long-Term Growth Fund into the Fund).
| 1 | Prior to close of business on September 24, 2010, Class L was known as Institutional Class of the Baird Funds, Inc. - RiverFront Long-Term Growth Fund. |
| 2 | The MSCI ACWI (All Country World Index) is a free float-adjusted market capitalization weighted index that is designed to measure the equity market performance of developed and emerging markets. The MSCI ACWI consists of 45 country indices comprising 24 developed and 21 emerging market country indices. The index includes reinvestment of dividends, net of foreign withholding taxes. The index is not actively managed and does not reflect any deductions for fees, expenses or taxes. An investor may not invest directly in an index. |
| 3 | S&P 500® Total Return Index is the Standard & Poor's composite index of 500 stocks, a widely recognized, unmanaged index of common stock prices. The index is not actively managed and does not reflect any deduction for fees, expenses or taxes. An investor may not invest directly in an index. |
| ^ | Fund Inception date of October 28, 2008 for Investor Class II and Class L; Fund Inception date September 27, 2010 for Investor Class and Classes C and I; Fund Inception date June 12, 2018 for Class A. |
| * | What You Pay reflects Acquired Fund Fees and Expenses of 0.70%. Please see the prospectus for additional information. |
| # | Prior to December 1, 2017, Investor Class was known as Class A. |
Prior to February 28, 2018, the RiverFront Asset Allocation Aggressive was known as the RiverFront Global Growth Fund.
The table does not reflect the deduction of taxes that a shareholder would pay on Fund distributions or the redemption of Fund shares.
This Fund is not suitable for all investors and is subject to investment risks, including possible loss of the principal amount invested.
There is no guarantee that the Fund will continue to hold any one particular security or stay invested in any one particular company. The composition of the Fund's top holdings is subject to change. Performance figures are historical and reflect the change in share price, reinvested distributions, changes in net asset value, sales charges and capital gains distributions, if any.
Not FDIC Insured – No Bank Guarantee – May Lose Value
Top Ten Holdings (as a % of Net Assets) †
| RiverFront Dynamic US Flex-Cap ETF | 36.71% |
| First Trust RiverFront Dynamic Developed International ETF | 25.10% |
| RiverFront Dynamic US Dividend Advantage ETF | 10.71% |
| First Trust RiverFront Dynamic Europe ETF | 10.62% |
| First Trust RiverFront Dynamic Emerging Markets ETF | 10.19% |
| First Trust RiverFront Dynamic Asia Pacific ETF | 5.35% |
| Top Ten Holdings | 98.68% |
| † | Holdings are subject to change, and may not reflect the current or future position of the portfolio. Table presents indicative values only. Excludes cash & cash equivalents. |
Portfolio Composition (as a % of Net Assets)
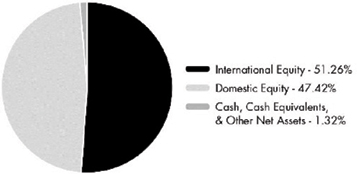
RiverFront Asset Allocation Growth
| Performance Update | October 31, 2018 (Unaudited) |
Performance of $10,000 Initial Investment (as of October 31, 2018)
Comparison of change in value of a $10,000 investment
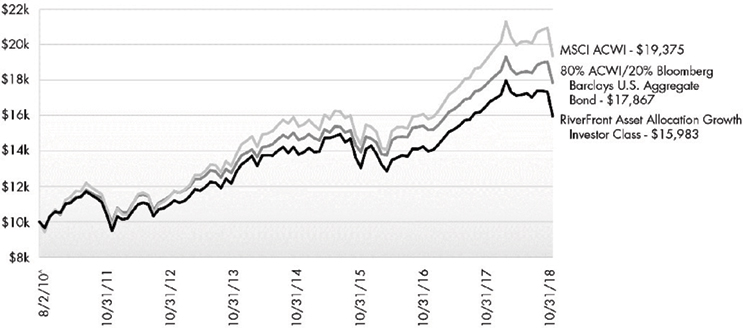
The chart above represents historical performance of a hypothetical investment of $10,000 in the Fund since inception. Past performance does not guarantee future results. This chart does not reflect the deduction of taxes that a shareholder would pay on Fund distributions or the redemption of Fund shares.
Average Annual Total Returns (as of October 31, 2018)
| | 6 Month | 1 Year | 3 Years | 5 Years | Since Inception^ | Total Expense Ratio | What You Pay* |
| Investor# (NAV) | -6.91% | -4.93% | 4.24% | 3.83% | 5.85% | 1.18% | 1.18% |
| Class A (NAV) | -6.91% | -4.93% | 4.24% | 3.83% | 5.85% | 1.18% | 1.18% |
| Class A (MOP) | -12.06% | -10.15% | 2.30% | 2.66% | 5.13% |
| Class C (NAV) | -7.23% | -5.66% | 3.47% | 3.05% | 5.07% | 1.93% | 1.93% |
| Class C (CDSC) | -8.15% | -6.58% | 3.47% | 3.05% | 5.07% |
| Class I (NAV) | -6.79% | -4.74% | 4.52% | 4.08% | 6.10% | 0.93% | 0.93% |
| MSCI All Country World Index1 | -3.94% | -0.52% | 7.74% | 6.15% | 8.35% | | |
| 80% ACWI and 20% Bloomberg Barclays U.S. Aggregate Bond1,2 | -3.15% | -0.72% | 6.45% | 5.37% | 7.29% | | |
Performance data quoted represents past performance. Past performance does not guarantee future results. Investment return and principal value of an investment will fluctuate so that an investor's shares, when sold or redeemed, may be worth more or less than the original cost. Current performance data may be higher or lower than actual data quoted. For the most current month-end performance data, please call 1-866-759-5679.
Maximum Offering Price (MOP) for Class A shares includes the Fund’s maximum sales charge of 5.50%. Performance shown at NAV does not include these sales charges and would have been lower had it been taken into account. If you invest $1 million or more, either as a lump sum or through the Fund’s accumulation or letter of intent programs, you can purchase Class A shares without an initial sales charge (load). A Contingent Deferred Sales Charge (“CDSC”) of 1.00% may apply to Class C shares redeemed within the first 12 months after a purchase, and on Class A shares redeemed within the first 18 months after a purchase in excess of $1 million.
Performance less than 1 year is cumulative.
RiverFront Asset Allocation Growth
| Performance Update | October 31, 2018 (Unaudited) |
Performance shown for Class A shares prior to June 12, 2018 reflects the historical performance of the Fund’s Investor shares, calculated using the fees and expenses of Class A shares.
| 1 | The MSCI ACWI (All Country World Index) is a free float-adjusted market capitalization weighted index that is designed to measure the equity market performance of developed and emerging markets. The MSCI ACWI consists of 45 country indices comprising 24 developed and 21 emerging market country indices. The index includes reinvestment of dividends, net of foreign withholding taxes. The index is not actively managed and does not reflect any deductions for fees, expenses or taxes. An investor may not invest directly in an index. |
| 2 | The Barclays U.S. Aggregate Bond Index is a broad-based benchmark that measures the investment grade, U.S. dollar-denominated, fixed-rate taxable bond market, including Treasuries, government-related and corporate securities, MBS (agency fixed-rate and hybrid ARM passthroughs), ABS, and CMBS. The index is not actively managed and does not reflect any deductions for fees, expenses or taxes. An investor may not invest directly in an index. |
| ^ | Fund Inception date of August 2, 2010 for Investor Class and Classes C and I; Fund Inception date of June 12, 2018 for Class A. |
| * | What You Pay reflects Acquired Fund Fees and Expenses of 0.68%. Please see the prospectus for additional information. |
| # | Prior to December 1, 2017, Investor Class was known as Class A. |
Prior to February 28, 2018, the RiverFront Asset Allocation Growth was known as the RiverFront Global Allocation Fund.
The table does not reflect the deduction of taxes that a shareholder would pay on Fund distributions or the redemption of Fund shares.
This Fund is not suitable for all investors and is subject to investment risks, including possible loss of the principal amount invested.
There is no guarantee that the Fund will continue to hold any one particular security or stay invested in any one particular company. The composition of the Fund's top holdings is subject to change. Performance figures are historical and reflect the change in share price, reinvested distributions, changes in net asset value, sales charges and capital gains distributions, if any.
Not FDIC Insured – No Bank Guarantee – May Lose Value
Top Ten Holdings (as a % of Net Assets) †
| RiverFront Dynamic US Flex-Cap ETF | 35.19% |
| First Trust RiverFront Dynamic Developed International ETF | 18.65% |
| RiverFront Dynamic US Dividend Advantage ETF | 12.22% |
| RiverFront Dynamic Unconstrained Income ETF | 8.40% |
| First Trust RiverFront Dynamic Emerging Markets ETF | 7.61% |
| RiverFront Dynamic Core Income ETF | 6.33% |
| First Trust RiverFront Dynamic Europe ETF | 5.30% |
| First Trust RiverFront Dynamic Asia Pacific ETF | 3.21% |
| Top Ten Holdings | 96.91% |
| † | Holdings are subject to change, and may not reflect the current or future position of the portfolio. Table presents indicative values only. Excludes cash & cash equivalents. |
Portfolio Composition (as a % of Net Assets)
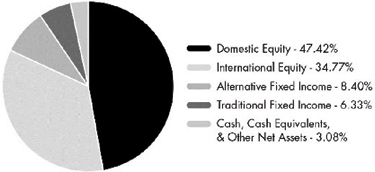
RiverFront Asset Allocation Growth & Income
| Performance Update | October 31, 2018 (Unaudited) |
Performance of $10,000 Initial Investment (as of October 31, 2018)
Comparison of change in value of a $10,000 investment
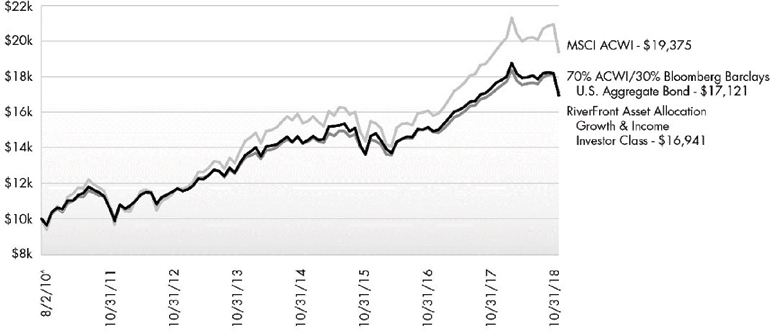
The chart above represents historical performance of a hypothetical investment of $10,000 in the Fund since inception. Past performance does not guarantee future results. This chart does not reflect the deduction of taxes that a shareholder would pay on Fund distributions or the redemption of Fund shares.
Average Annual Total Returns (as of October 31, 2018)
| | 6 Month | 1 Year | 3 Years | 5 Years | Since Inception^ | Total Expense Ratio | What You Pay* |
| Investor# (NAV) | -5.64% | -4.03% | 4.96% | 4.52% | 6.60% | 1.16% | 1.16% |
| Class A (NAV) | -5.70% | -4.08% | 4.94% | 4.51% | 6.59% | 1.16% | 1.16% |
| Class A (MOP) | -10.86% | -9.34% | 2.97% | 3.34% | 5.87% |
| Class C (NAV) | -6.06% | -4.74% | 4.17% | 3.74% | 5.80% | 1.91% | 1.91% |
| Class C (CDSC) | -6.99% | -5.66% | 4.17% | 3.74% | 5.80% |
| Class I (NAV) | -5.61% | -3.88% | 5.20% | 4.77% | 6.85% | 0.91% | 0.91% |
| MSCI All Country World Index1 | -3.94% | -0.52% | 7.74% | 6.15% | 8.35% | | |
| 70% ACWI and 30% Bloomberg Barclays U.S. Aggregate Bond1,2 | -2.77% | -0.84% | 5.80% | 4.96% | 6.74% | | |
Performance data quoted represents past performance. Past performance does not guarantee future results. Investment return and principal value of an investment will fluctuate so that an investor's shares, when sold or redeemed, may be worth more or less than the original cost. Current performance data may be higher or lower than actual data quoted. For the most current month-end performance data, please call 1-866-759-5679.
Maximum Offering Price (MOP) for Class A shares includes the Fund’s maximum sales charge of 5.50%. Performance shown at NAV does not include these sales charges and would have been lower had it been taken into account. If you invest $1 million or more, either as a lump sum or through the Fund’s accumulation or letter of intent programs, you can purchase Class A shares without an initial sales charge (load). A Contingent Deferred Sales Charge (“CDSC”) of 1.00% may apply to Class C shares redeemed within the first 12 months after a purchase, and on Class A shares redeemed within the first 18 months after a purchase in excess of $1 million.
Performance less than 1 year is cumulative.
RiverFront Asset Allocation Growth & Income
| Performance Update | October 31, 2018 (Unaudited) |
Performance shown for Class A shares prior to June 12, 2018 reflects the historical performance of the Fund’s Investor shares, calculated using the fees and expenses of Class A shares.
| 1 | The MSCI ACWI (All Country World Index) is a free float-adjusted market capitalization weighted index that is designed to measure the equity market performance of developed and emerging markets. The MSCI ACWI consists of 45 country indices comprising 24 developed and 21 emerging market country indices. The index includes reinvestment of dividends, net of foreign withholding taxes. The index is not actively managed and does not reflect any deductions for fees, expenses or taxes. An investor may not invest directly in an index. |
| 2 | The Barclays U.S. Aggregate Bond Index is a broad-based benchmark that measures the investment grade, U.S. dollar-denominated, fixed-rate taxable bond market, including Treasuries, government-related and corporate securities, MBS (agency fixed-rate and hybrid ARM passthroughs), ABS, and CMBS. The index is not actively managed and does not reflect any deductions for fees, expenses or taxes. An investor may not invest directly in an index. |
| ^ | Fund Inception date of August 2, 2010 for Investor Class and Classes C and I; Fund Inception date of June 12, 2018 for Class A. |
| * | What You Pay reflects Acquired Fund Fees and Expenses of 0.66%. Please see the prospectus for additional information. |
| # | Prior to December 1, 2017, Investor Class was known as Class A. |
Prior to February 28, 2018, the RiverFront Asset Allocation Growth & Income was known as the RiverFront Dynamic Equity Income Fund.
The table does not reflect the deduction of taxes that a shareholder would pay on Fund distributions or the redemption of Fund shares.
This Fund is not suitable for all investors and is subject to investment risks, including possible loss of the principal amount invested.
There is no guarantee that the Fund will continue to hold any one particular security or stay invested in any one particular company. The composition of the Fund's top holdings is subject to change. Performance figures are historical and reflect the change in share price, reinvested distributions, changes in net asset value, sales charges and capital gains distributions, if any.
Not FDIC Insured – No Bank Guarantee – May Lose Value
Top Ten Holdings (as a % of Net Assets) †
| RiverFront Dynamic US Dividend Advantage ETF | 22.09% |
| RiverFront Dynamic US Flex-Cap ETF | 19.74% |
| First Trust RiverFront Dynamic Developed International ETF | 17.38% |
| RiverFront Dynamic Core Income ETF | 14.96% |
| RiverFront Dynamic Unconstrained Income ETF | 10.67% |
| First Trust RiverFront Dynamic Europe ETF | 5.92% |
| First Trust RiverFront Dynamic Emerging Markets ETF | 4.86% |
| First Trust RiverFront Dynamic Asia Pacific ETF | 2.76% |
| Top Ten Holdings | 98.38% |
| † | Holdings are subject to change, and may not reflect the current or future position of the portfolio. Table presents indicative values only. Excludes cash & cash equivalents. |
Portfolio Composition (as a % of Net Assets)

RiverFront Asset Allocation Moderate
| Performance Update | October 31, 2018 (Unaudited) |
Performance of $10,000 Initial Investment (as of October 31, 2018)
Comparison of change in value of a $10,000 investment
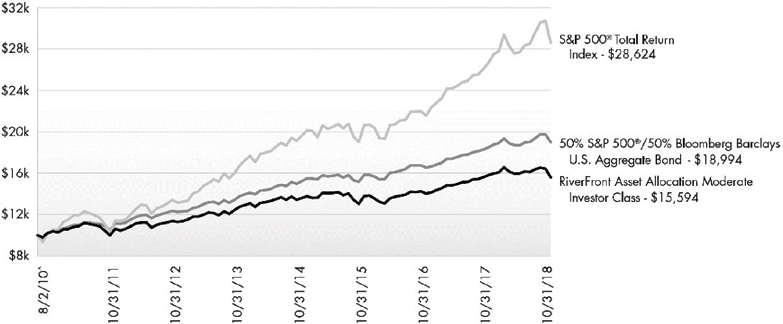
The chart above represents historical performance of a hypothetical investment of $10,000 in the Fund since inception. Past performance does not guarantee future results. This chart does not reflect the deduction of taxes that a shareholder would pay on Fund distributions or the redemption of Fund shares.
Average Annual Total Returns (as of October 31, 2018)
| | 6 Month | 1 Year | 3 Years | 5 Years | Since Inception^ | Total Expense Ratio | What You Pay* |
| Investor# (NAV) | -2.45% | -1.32% | 4.22% | 4.09% | 5.54% | 1.06% | 1.06% |
| Class A (NAV) | -2.53% | -1.40% | 4.19% | 4.08% | 5.53% | 1.06% | 1.06% |
| Class A (MOP) | -7.90% | -6.86% | 2.24% | 2.90% | 4.81% |
| Class C (NAV) | -2.93% | -2.16% | 3.43% | 3.30% | 4.74% | 1.81% | 1.81% |
| Class C (CDSC) | -3.89% | -3.08% | 3.43% | 3.30% | 4.74% |
| Class I (NAV) | -2.40% | -1.16% | 4.47% | 4.34% | 5.79% | 0.81% | 0.81% |
| S&P 500® Total Return Index1 | 3.40% | 7.35% | 11.52% | 11.34% | 13.60% | | |
| 50% S&P 500® and 50% Bloomberg Barclays U.S. Aggregate Bond2 | 1.67% | 2.72% | 6.28% | 6.63% | 8.09% | | |
Performance data quoted represents past performance. Past performance does not guarantee future results. Investment return and principal value of an investment will fluctuate so that an investor's shares, when sold or redeemed, may be worth more or less than the original cost. Current performance data may be higher or lower than actual data quoted. For the most current month-end performance data, please call 1-866-759-5679.
Maximum Offering Price (MOP) for Class A shares includes the Fund’s maximum sales charge of 5.50%. Performance shown at NAV does not include these sales charges and would have been lower had it been taken into account. If you invest $1 million or more, either as a lump sum or through the Fund’s accumulation or letter of intent programs, you can purchase Class A shares without an initial sales charge (load). A Contingent Deferred Sales Charge (“CDSC”) of 1.00% may apply to Class C shares redeemed within the first 12 months after a purchase, and on Class A shares redeemed within the first 18 months after a purchase in excess of $1 million.
Performance less than 1 year is cumulative.
RiverFront Asset Allocation Moderate
| Performance Update | October 31, 2018 (Unaudited) |
Performance shown for Class A shares prior to June 12, 2018 reflects the historical performance of the Fund’s Investor shares, calculated using the fees and expenses of Class A shares.
| 1 | S&P 500® Total Return Index is the Standard & Poor's composite index of 500 stocks, a widely recognized, unmanaged index of common stock prices. The index is not actively managed and does not reflect any deduction for fees, expenses or taxes. An investor may not invest directly in an index. |
| 2 | The Barclays U.S. Aggregate Bond Index is a broad-based benchmark that measures the investment grade, U.S. dollar-denominated, fixed-rate taxable bond market, including Treasuries, government-related and corporate securities, MBS (agency fixed-rate and hybrid ARM passthroughs), ABS, and CMBS. The index is not actively managed and does not reflect any deductions for fees, expenses or taxes. An investor may not invest directly in an index. |
| ^ | Fund Inception date of August 2, 2010 for Investor Class and Classes C and I; Fund Inception date of June 12, 2018 for Class A. |
| * | What You Pay reflects Acquired Fund Fees and Expenses of 0.56%. Please see the prospectus for additional information. |
| # | Prior to December 1, 2017, Investor Class was known as Class A. |
Prior to February 28, 2018, the RiverFront Asset Allocation Moderate was known as the RiverFront Moderate Growth & Income Fund.
The table does not reflect the deduction of taxes that a shareholder would pay on Fund distributions or the redemption of Fund shares.
This Fund is not suitable for all investors and is subject to investment risks, including possible loss of the principal amount invested.
There is no guarantee that the Fund will continue to hold any one particular security or stay invested in any one particular company. The composition of the Fund's top holdings is subject to change. Performance figures are historical and reflect the change in share price, reinvested distributions, changes in net asset value, sales charges and capital gains distributions, if any.
Not FDIC Insured – No Bank Guarantee – May Lose Value
Top Ten Holdings (as a % of Net Assets) †
| RiverFront Dynamic Core Income ETF | 36.03% |
| RiverFront Dynamic US Dividend Advantage ETF | 27.43% |
| RiverFront Dynamic US Flex-Cap ETF | 19.36% |
| RiverFront Dynamic Unconstrained Income ETF | 8.46% |
| First Trust RiverFront Dynamic Developed International ETF | 6.17% |
| First Trust RiverFront Dynamic Asia Pacific ETF | 0.90% |
| First Trust RiverFront Dynamic Europe ETF | 0.45% |
| Top Ten Holdings | 98.80% |
| † | Holdings are subject to change, and may not reflect the current or future position of the portfolio. Table presents indicative values only. Excludes cash & cash equivalents. |
Portfolio Composition (as a % of Net Assets)
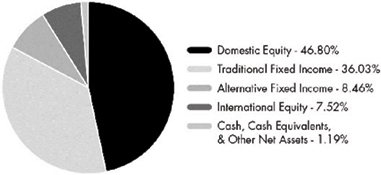
RiverFront Asset Allocation Income & Growth
| Performance Update | October 31, 2018 (Unaudited) |
Performance of $10,000 Initial Investment (as of October 31, 2018)
Comparison of change in value of a $10,000 investment

The chart above represents historical performance of a hypothetical investment of $10,000 in the Fund since inception. Past performance does not guarantee future results. This chart does not reflect the deduction of taxes that a shareholder would pay on Fund distributions or the redemption of Fund shares.
Average Annual Total Returns (as of October 31, 2018)
| | 6 Month | 1 Year | 3 Years | 5 Years | Since Inception^ | Total Expense Ratio | What You Pay* |
| Investor# (NAV) | -1.69% | -1.79% | 2.92% | 2.64% | 3.59% | 1.04% | 1.04% |
| Class A (NAV) | -1.68% | -1.79% | 2.92% | 2.65% | 3.59% | 1.04% | 1.04% |
| Class A (MOP) | -7.11% | -7.15% | 1.00% | 1.49% | 2.64% |
| Class C (NAV) | -1.98% | -2.48% | 2.15% | 1.89% | 2.82% | 1.79% | 1.79% |
| Class C (CDSC) | -2.95% | -3.43% | 2.15% | 1.89% | 2.82% |
| Class I (NAV) | -1.49% | -1.50% | 3.17% | 2.91% | 3.84% | 0.79% | 0.79% |
| Bloomberg Barclays U.S. Aggregate Bond Index1 | -0.19% | -2.05% | 1.04% | 1.83% | 1.36% | | |
| 30% S&P 500® and 70% Bloomberg Barclays U.S. Aggregate Bond1,2 | 0.94% | 0.82% | 4.18% | 4.72% | 5.00% | | |
Performance data quoted represents past performance. Past performance does not guarantee future results. Investment return and principal value of an investment will fluctuate so that an investor's shares, when sold or redeemed, may be worth more or less than the original cost. Current performance data may be higher or lower than actual data quoted. For the most current month-end performance data, please call 1-866-759-5679.
Maximum Offering Price (MOP) for Class A shares includes the Fund’s maximum sales charge of 5.50%. Performance shown at NAV does not include these sales charges and would have been lower had it been taken into account. If you invest $1 million or more, either as a lump sum or through the Fund’s accumulation or letter of intent programs, you can purchase Class A shares without an initial sales charge (load). A Contingent Deferred Sales Charge (“CDSC”) of 1.00% may apply to Class C shares redeemed within the first 12 months after a purchase, and on Class A shares redeemed within the first 18 months after a purchase in excess of $1 million.
Performance less than 1 year is cumulative.
RiverFront Asset Allocation Income & Growth
| Performance Update | October 31, 2018 (Unaudited) |
Performance shown for Class A shares prior to June 12, 2018 reflects the historical performance of the Fund’s Investor shares, calculated using the fees and expenses of Class A shares.
| 1 | The Barclays U.S. Aggregate Bond Index is a broad-based benchmark that measures the investment grade, U.S. dollar-denominated, fixed-rate taxable bond market, including Treasuries, government-related and corporate securities, MBS (agency fixed-rate and hybrid ARM passthroughs), ABS, and CMBS. The index is not actively managed and does not reflect any deductions for fees, expenses or taxes. An investor may not invest directly in an index. |
| 2 | The S&P 500® Index is the Standard & Poor's composite index of 500 stocks, a widely recognized, unmanaged index of common stock prices. |
| ^ | Fund Inception date of August 31, 2012 for Investor Class and Classes C and I; Fund Inception date of June 12, 2018 for Class A. |
| * | What You Pay reflects Acquired Fund Fees and Expenses of 0.54%. Please see the prospectus for additional information. |
| # | Prior to December 1, 2017, Investor Class was known as Class A. |
Prior to February 28, 2018, the RiverFront Asset Allocation Income & Growth was known as the RiverFront Conservative Income Builder Fund.
The table does not reflect the deduction of taxes that a shareholder would pay on Fund distributions or the redemption of Fund shares.
This Fund is not suitable for all investors and is subject to investment risks, including possible loss of the principal amount invested.
There is no guarantee that the Fund will continue to hold any one particular security or stay invested in any one particular company. The composition of the Fund's top holdings is subject to change. Performance figures are historical and reflect the change in share price, reinvested distributions, changes in net asset value, sales charges and capital gains distributions, if any.
Not FDIC Insured – No Bank Guarantee – May Lose Value
Top Ten Holdings (as a % of Net Assets) †
| RiverFront Dynamic Core Income ETF | 59.32% |
| RiverFront Dynamic US Dividend Advantage ETF | 18.51% |
| RiverFront Dynamic US Flex-Cap ETF | 8.60% |
| RiverFront Dynamic Unconstrained Income ETF | 8.56% |
| First Trust RiverFront Dynamic Developed International ETF | 2.61% |
| First Trust RiverFront Dynamic Asia Pacific ETF | 0.89% |
| First Trust RiverFront Dynamic Europe ETF | 0.38% |
| Top Ten Holdings | 98.87% |
| † | Holdings are subject to change, and may not reflect the current or future position of the portfolio. Table presents indicative values only. Excludes cash & cash equivalents. |
Portfolio Composition (as a % of Net Assets)
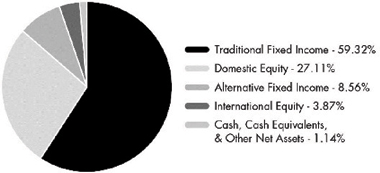
RiverFront Asset Allocation Aggressive
| Statement of Investments | October 31, 2018 |
| | | Shares | | | Value (Note 2) | |
| EXCHANGE TRADED FUNDS (98.68%) | | | | | | | | |
| Equity (98.68%) | | | | | | | | |
| First Trust RiverFront Dynamic Asia Pacific ETF(a) | | | 49,049 | | | $ | 2,531,909 | |
| First Trust RiverFront Dynamic Developed International ETF(a) | | | 213,608 | | | | 11,868,061 | |
| First Trust RiverFront Dynamic Emerging Markets ETF(a) | | | 85,829 | | | | 4,816,724 | |
| First Trust RiverFront Dynamic Europe ETF(a) | | | 88,128 | | | | 5,023,296 | |
| RiverFront Dynamic US Dividend Advantage ETF(a) | | | 164,840 | | | | 5,063,258 | |
| RiverFront Dynamic US Flex-Cap ETF(a) | | | 527,182 | | | | 17,360,103 | |
| | | | | | | | | |
| TOTAL EXCHANGE TRADED FUNDS | | | | | | | | |
| (Cost $49,891,126) | | | | | | | 46,663,351 | |
| | | 7-Day Yield | Shares | | | Value (Note 2) | |
| SHORT-TERM INVESTMENTS (1.44%) | | | | | | | | |
| Money Market Fund (1.44%) | | | | | | | | |
| State Street Institutional Treasury Plus Money Market Fund | | 2.109% | 682,600 | | | | 682,600 | |
| | | | | | | | | |
| TOTAL MONEY MARKET FUND | | | | | | | 682,600 | |
| | | | | | | | | |
| TOTAL SHORT-TERM INVESTMENTS | | | | | | | | |
| (Cost $682,600) | | | | | | | 682,600 | |
| | | | | | | | | |
| TOTAL INVESTMENTS (100.12%) | | | | | | | | |
| (Cost $50,573,726) | | | | | | $ | 47,345,951 | |
| | | | | | | | | |
| Liabilities In Excess Of Other Assets (-0.12%) | | | | | | | (56,686 | ) |
| | | | | | | | | |
| NET ASSETS (100.00%) | | | | | | $ | 47,289,265 | |
| (a) | Affiliated Company. See Note 7 in Notes to Financial Statements. |
For Fund compliance purposes, the Fund's industry classifications refer to any one or more of the industry sub-classifications used by one or more widely recognized market indexes or ratings group indexes, and/or as defined by Fund management. This definition may not apply for purposes of this report, which may combine industry sub-classifications for reporting ease. Industries are shown as a percent of net assets.
See Notes to Financial Statements.
RiverFront Asset Allocation Growth
| Statement of Investments | October 31, 2018 |
| | | Shares | | | Value (Note 2) | |
| EXCHANGE TRADED FUNDS (96.92%) | | | | | | | | |
| Debt (14.73%) | | | | | | | | |
| RiverFront Dynamic Core Income ETF(a) | | | 78,326 | | | $ | 1,844,969 | |
| RiverFront Dynamic Unconstrained Income ETF(a) | | | 98,864 | | | | 2,450,285 | |
| | | | | | | | 4,295,254 | |
| | | | | | | | | |
| Equity (82.19%) | | | | | | | | |
| First Trust RiverFront Dynamic Asia Pacific ETF(a) | | | 18,145 | | | | 936,645 | |
| First Trust RiverFront Dynamic Developed International ETF(a) | | | 97,892 | | | | 5,438,879 | |
| First Trust RiverFront Dynamic Emerging Markets ETF(a) | | | 39,545 | | | | 2,219,265 | |
| First Trust RiverFront Dynamic Europe ETF(a) | | | 27,124 | | | | 1,546,068 | |
| RiverFront Dynamic US Dividend Advantage ETF(a) | | | 116,065 | | | | 3,565,076 | |
| RiverFront Dynamic US Flex-Cap ETF(a) | | | 311,684 | | | | 10,263,754 | |
| | | | | | | | 23,969,687 | |
| | | | | | | | | |
| TOTAL EXCHANGE TRADED FUNDS | | | | | | | | |
| (Cost $29,836,350) | | | | | | | 28,264,941 | |
| | | 7-Day Yield | Shares | | | Value (Note 2) | |
| SHORT-TERM INVESTMENTS (2.83%) | | | | | | | | |
| Money Market Fund (2.83%) | | | | | | | | |
| State Street Institutional Treasury Plus Money Market Fund | | 2.109% | 826,653 | | | | 826,653 | |
| | | | | | | | | |
| TOTAL MONEY MARKET FUND | | | | | | | 826,653 | |
| | | | | | | | | |
| TOTAL SHORT-TERM INVESTMENTS | | | | | | | | |
| (Cost $826,653) | | | | | | | 826,653 | |
| | | | | | | | | |
| TOTAL INVESTMENTS (99.75%) | | | | | | | | |
| (Cost $30,663,003) | | | | | | $ | 29,091,594 | |
| | | | | | | | | |
| Other Assets In Excess Of Liabilities (0.25%) | | | | | | | 71,873 | |
| | | | | | | | | |
| NET ASSETS (100.00%) | | | | | | $ | 29,163,467 | |
| (a) | Affiliated Company. See Note 7 in Notes to Financial Statements. |
For Fund compliance purposes, the Fund's industry classifications refer to any one or more of the industry sub-classifications used by one or more widely recognized market indexes or ratings group indexes, and/or as defined by Fund management. This definition may not apply for purposes of this report, which may combine industry sub-classifications for reporting ease. Industries are shown as a percent of net assets.
See Notes to Financial Statements.
RiverFront Asset Allocation Growth & Income
| Statement of Investments | October 31, 2018 |
| | | Shares | | | Value (Note 2) | |
| EXCHANGE TRADED FUNDS (98.37%) | | | | | | | | |
| Debt (25.62%) | | | | | | | | |
| RiverFront Dynamic Core Income ETF(a) | | | 532,911 | | | $ | 12,552,719 | |
| RiverFront Dynamic Unconstrained Income ETF(a) | | | 361,253 | | | | 8,953,439 | |
| | | | | | | | 21,506,158 | |
| | | | | | | | | |
| Equity (72.75%) | | | | | | | | |
| First Trust RiverFront Dynamic Asia Pacific ETF(a) | | | 44,878 | | | | 2,316,602 | |
| First Trust RiverFront Dynamic Developed International ETF(a) | | | 262,527 | | | | 14,586,000 | |
| First Trust RiverFront Dynamic Emerging Markets ETF(a) | | | 72,759 | | | | 4,083,235 | |
| First Trust RiverFront Dynamic Europe ETF(a) | | | 87,167 | | | | 4,968,519 | |
| RiverFront Dynamic US Dividend Advantage ETF(a) | | | 603,647 | | | | 18,541,742 | |
| RiverFront Dynamic US Flex-Cap ETF(a) | | | 503,078 | | | | 16,566,359 | |
| | | | | | | | 61,062,457 | |
| | | | | | | | | |
| TOTAL EXCHANGE TRADED FUNDS | | | | | | | | |
| (Cost $86,893,542) | | | | | | | 82,568,615 | |
| | | 7-Day Yield | Shares | | | Value (Note 2) | |
| SHORT-TERM INVESTMENTS (1.75%) | | | | | | | | |
| Money Market Fund (1.75%) | | | | | | | | |
| State Street Institutional Treasury Plus Money Market Fund | | 2.109% | 1,464,145 | | | | 1,464,145 | |
| | | | | | | | | |
| TOTAL MONEY MARKET FUND | | | | | | | 1,464,145 | |
| | | | | | | | | |
| TOTAL SHORT-TERM INVESTMENTS | | | | | | | | |
| (Cost $1,464,145) | | | | | | | 1,464,145 | |
| | | | | | | | | |
| TOTAL INVESTMENTS (100.12%) | | | | | | | | |
| (Cost $88,357,687) | | | | | | $ | 84,032,760 | |
| | | | | | | | | |
| Liabilities In Excess Of Other Assets (-0.12%) | | | | | | | (98,187 | ) |
| | | | | | | | | |
| NET ASSETS (100.00%) | | | | | | $ | 83,934,573 | |
| (a) | Affiliated Company. See Note 7 in Notes to Financial Statements. |
For Fund compliance purposes, the Fund's industry classifications refer to any one or more of the industry sub-classifications used by one or more widely recognized market indexes or ratings group indexes, and/or as defined by Fund management. This definition may not apply for purposes of this report, which may combine industry sub-classifications for reporting ease. Industries are shown as a percent of net assets.
See Notes to Financial Statements.
RiverFront Asset Allocation Moderate
| Statement of Investments | October 31, 2018 |
| | | Shares | | | Value (Note 2) | |
| EXCHANGE TRADED FUNDS (98.81%) | | | | | | | | |
| Debt (44.50%) | | | | | | | | |
| RiverFront Dynamic Core Income ETF(a) | | | 1,182,155 | | | $ | 27,845,661 | |
| RiverFront Dynamic Unconstrained Income ETF(a) | | | 263,876 | | | | 6,540,008 | |
| | | | | | | | 34,385,669 | |
| | | | | | | | | |
| Equity (54.31%) | | | | | | | | |
| First Trust RiverFront Dynamic Asia Pacific ETF(a) | | | 13,443 | | | | 693,928 | |
| First Trust RiverFront Dynamic Developed International ETF(a) | | | 85,826 | | | | 4,768,492 | |
| First Trust RiverFront Dynamic Europe ETF(a) | | | 6,116 | | | | 348,612 | |
| RiverFront Dynamic US Dividend Advantage ETF(a) | | | 690,191 | | | | 21,200,045 | |
| RiverFront Dynamic US Flex-Cap ETF(a) | | | 454,234 | | | | 14,957,926 | |
| | | | | | | | 41,969,003 | |
| | | | | | | | | |
| TOTAL EXCHANGE TRADED FUNDS | | | | | | | | |
| (Cost $78,914,152) | | | | | | | 76,354,672 | |
| | | 7-Day Yield | Shares | | | Value (Note 2) | |
| SHORT-TERM INVESTMENTS (1.52%) | | | | | | | | |
| Money Market Fund (1.52%) | | | | | | | | |
| State Street Institutional Treasury Plus Money Market Fund | | 2.109% | 1,175,734 | | | | 1,175,734 | |
| | | | | | | | | |
| TOTAL MONEY MARKET FUND | | | | | | | 1,175,734 | |
| | | | | | | | | |
| TOTAL SHORT-TERM INVESTMENTS | | | | | | | | |
| (Cost $1,175,734) | | | | | | | 1,175,734 | |
| | | | | | | | | |
| TOTAL INVESTMENTS (100.33%) | | | | | | | | |
| (Cost $80,089,886) | | | | | | $ | 77,530,406 | |
| | | | | | | | | |
| Liabilities In Excess Of Other Assets (-0.33%) | | | | | | | (256,356 | ) |
| | | | | | | | | |
| NET ASSETS (100.00%) | | | | | | $ | 77,274,050 | |
| (a) | Affiliated Company. See Note 7 in Notes to Financial Statements. |
For Fund compliance purposes, the Fund's industry classifications refer to any one or more of the industry sub-classifications used by one or more widely recognized market indexes or ratings group indexes, and/or as defined by Fund management. This definition may not apply for purposes of this report, which may combine industry sub-classifications for reporting ease. Industries are shown as a percent of net assets.
See Notes to Financial Statements.
RiverFront Asset Allocation Income & Growth
| Statement of Investments | October 31, 2018 |
| | | Shares | | | Value (Note 2) | |
| EXCHANGE TRADED FUNDS (98.86%) | | | | | | | | |
| Debt (67.88%) | | | | | | | | |
| RiverFront Dynamic Core Income ETF(a) | | | 244,739 | | | $ | 5,764,827 | |
| RiverFront Dynamic Unconstrained Income ETF(a) | | | 33,553 | | | | 831,591 | |
| | | | | | | | 6,596,418 | |
| | | | | | | | | |
| Equity (30.98%) | | | | | | | | |
| First Trust RiverFront Dynamic Asia Pacific ETF(a) | | | 1,670 | | | | 86,205 | |
| First Trust RiverFront Dynamic Developed International ETF(a) | | | 4,561 | | | | 253,409 | |
| First Trust RiverFront Dynamic Europe ETF(a) | | | 647 | | | | 36,879 | |
| RiverFront Dynamic US Dividend Advantage ETF(a) | | | 58,571 | | | | 1,799,079 | |
| RiverFront Dynamic US Flex-Cap ETF(a) | | | 25,365 | | | | 835,270 | |
| | | | | | | | 3,010,842 | |
| | | | | | | | | |
| TOTAL EXCHANGE TRADED FUNDS | | | | | | | | |
| (Cost $9,892,542) | | | | | | | 9,607,260 | |
| | 7-Day Yield | Shares | | | Value (Note 2) | |
| SHORT-TERM INVESTMENTS (1.78%) | | | | | | | |
| Money Market Fund (1.78%) | | | | | | | |
| State Street Institutional Treasury Plus Money Market Fund | | 2.109% | 172,559 | | | | 172,559 | |
| | | | | | | | | |
| TOTAL MONEY MARKET FUND | | | | | | | 172,559 | |
| | | | | | | | | |
| TOTAL SHORT-TERM INVESTMENTS | | | | | | | | |
| (Cost $172,559) | | | | | | | 172,559 | |
| | | | | | | | | |
| TOTAL INVESTMENTS (100.64%) | | | | | | | | |
| (Cost $10,065,101) | | | | | | $ | 9,779,819 | |
| | | | | | | | | |
| Liabilities In Excess Of Other Assets (-0.64%) | | | | | | | (61,927 | ) |
| | | | | | | | | |
| NET ASSETS (100.00%) | | | | | | $ | 9,717,892 | |
| (a) | Affiliated Company. See Note 7 in Notes to Financial Statements. |
For Fund compliance purposes, the Fund's industry classifications refer to any one or more of the industry sub-classifications used by one or more widely recognized market indexes or ratings group indexes, and/or as defined by Fund management. This definition may not apply for purposes of this report, which may combine industry sub-classifications for reporting ease. Industries are shown as a percent of net assets.
See Notes to Financial Statements.
RiverFront Global Allocation Series
| Statements of Assets and Liabilities | October 31, 2018 |
| | | RiverFront Asset Allocation Aggressive | | | RiverFront Asset Allocation Growth | | | RiverFront Asset Allocation Growth & Income | | | RiverFront Asset Allocation Moderate | | | RiverFront Asset Allocation Income & Growth | |
| ASSETS | | | | | | | | | | | | | | | |
| Investments, at value | | $ | 682,600 | | | $ | 826,653 | | | $ | 1,464,145 | | | $ | 1,175,734 | | | $ | 172,559 | |
| Investments in affiliates, at value | | | 46,663,351 | | | | 28,264,941 | | | | 82,568,615 | | | | 76,354,672 | | | | 9,607,260 | |
| Receivable for investments sold | | | – | | | | – | | | | 613 | | | | – | | | | – | |
| Receivable for shares sold | | | 7,020 | | | | 95,871 | | | | 79,228 | | | | – | | | | – | |
| Dividends and interest receivable | | | 1,293 | | | | 984 | | | | 4,340 | | | | 2,192 | | | | 378 | |
| Total Assets | | | 47,354,264 | | | | 29,188,449 | | | | 84,116,941 | | | | 77,532,598 | | | | 9,780,197 | |
| LIABILITIES | | | | | | | | | | | | | | | | | | | | |
| Payable for shares redeemed | | | 34,380 | | | | 2,300 | | | | 123,782 | | | | 186,454 | | | | 53,068 | |
| Unitary administrative fees payable | | | 21,559 | | | | 12,889 | | | | 36,287 | | | | 34,261 | | | | 4,215 | |
| Distribution and services fees payable | | | 9,060 | | | | 9,793 | | | | 22,299 | | | | 37,833 | | | | 5,022 | |
| Total Liabilities | | | 64,999 | | | | 24,982 | | | | 182,368 | | | | 258,548 | | | | 62,305 | |
| NET ASSETS | | $ | 47,289,265 | | | $ | 29,163,467 | | | $ | 83,934,573 | | | $ | 77,274,050 | | | $ | 9,717,892 | |
| NET ASSETS CONSIST OF | | | | | | | | | | | | | | | | | | | | |
| Paid-in capital | | $ | 40,967,130 | | | $ | 25,712,632 | | | $ | 77,973,225 | | | $ | 69,946,687 | | | $ | 9,374,110 | |
| Total distributable earnings | | | 6,322,135 | | | | 3,450,835 | | | | 5,961,348 | | | | 7,327,363 | | | | 343,782 | |
| NET ASSETS | | $ | 47,289,265 | | | $ | 29,163,467 | | | $ | 83,934,573 | | | $ | 77,274,050 | | | $ | 9,717,892 | |
| INVESTMENTS, AT COST | | $ | 682,600 | | | $ | 826,653 | | | $ | 1,464,145 | | | $ | 1,175,734 | | | $ | 172,559 | |
| INVESTMENTS IN AFFILIATES, AT COST | | $ | 49,891,126 | | | $ | 29,836,350 | | | $ | 86,893,542 | | | $ | 78,914,152 | | | $ | 9,892,542 | |
See Notes to Financial Statements.
RiverFront Global Allocation Series
| Statements of Assets and Liabilities (continued) | October 31, 2018 |
| | | RiverFront Asset Allocation Aggressive | | | RiverFront Asset Allocation Growth | | | RiverFront Asset Allocation Growth & Income | | | RiverFront Asset Allocation Moderate | | | RiverFront Asset Allocation Income & Growth | |
| PRICING OF SHARES | | | | | | | | | | | | | | | |
| Investor Class: | | | | | | | | | | | | | | | | | | | | |
| Net Asset Value, offering and redemption price per share | | $ | 14.59 | | | $ | 13.20 | | | $ | 13.37 | | | $ | 11.54 | | | $ | 10.67 | |
| Net Assets | | $ | 4,490,700 | | | $ | 6,077,218 | | | $ | 9,062,475 | | | $ | 8,244,483 | | | $ | 169,568 | |
| Shares of beneficial interest outstanding (unlimited number of shares, no par value common stock authorized) | | | 307,761 | | | | 460,525 | | | | 678,059 | | | | 714,626 | | | | 15,887 | |
| Class A: | | | | | | | | | | | | | | | | | | | | |
| Net Asset Value, offering and redemption price per share | | $ | 14.51 | | | $ | 13.20 | | | $ | 13.36 | | | $ | 11.53 | | | $ | 10.66 | |
| Net Assets | | $ | 8,873 | | | $ | 9,058 | | | $ | 12,520 | | | $ | 9,489 | | | $ | 9,692 | |
| Shares of beneficial interest outstanding (unlimited number of shares, no par value common stock authorized) | | | 612 | | | | 686 | | | | 937 | | | | 823 | | | | 909 | |
| Maximum offering price per share ((NAV/0.9450), based on maximum sales charge of 5.50% of the offering price) | | $ | 15.35 | | | $ | 13.97 | | | $ | 14.14 | | | $ | 12.20 | | | $ | 11.28 | |
| Class C: | | | | | | | | | | | | | | | | | | | | |
| Net Asset Value, offering and redemption price per share(a) | | $ | 14.01 | | | $ | 12.71 | | | $ | 13.03 | | | $ | 11.39 | | | $ | 10.53 | |
| Net Assets | | $ | 8,596,509 | | | $ | 9,738,383 | | | $ | 23,110,764 | | | $ | 40,791,670 | | | $ | 5,689,047 | |
| Shares of beneficial interest outstanding (unlimited number of shares, no par value common stock authorized) | | | 613,677 | | | | 766,099 | | | | 1,774,105 | | | | 3,580,607 | | | | 540,307 | |
| Class I: | | | | | | | | | | | | | | | | | | | | |
| Net Asset Value, offering and redemption price per share | | $ | 14.78 | | | $ | 13.05 | | | $ | 13.31 | | | $ | 11.54 | | | $ | 10.50 | |
| Net Assets | | $ | 12,700,860 | | | $ | 13,338,808 | | | $ | 51,748,814 | | | $ | 28,228,408 | | | $ | 3,849,585 | |
| Shares of beneficial interest outstanding (unlimited number of shares, no par value common stock authorized) | | | 859,388 | | | | 1,022,062 | | | | 3,886,627 | | | | 2,446,037 | | | | 366,700 | |
| Investor Class II: | | | | | | | | | | | | | | | | | | | | |
| Net Asset Value, offering and redemption price per share | | $ | 14.50 | | | | N/A | | | | N/A | | | | N/A | | | | N/A | |
| Net Assets | | $ | 2,042,829 | | | | N/A | | | | N/A | | | | N/A | | | | N/A | |
| Shares of beneficial interest outstanding (unlimited number of shares, no par value common stock authorized) | | | 140,897 | | | | N/A | | | | N/A | | | | N/A | | | | N/A | |
| Class L: | | | | | | | | | | | | | | | | | | | | |
| Net Asset Value, offering and redemption price per share | | $ | 14.76 | | | | N/A | | | | N/A | | | | N/A | | | | N/A | |
| Net Assets | | $ | 19,449,494 | | | | N/A | | | | N/A | | | | N/A | | | | N/A | |
| Shares of beneficial interest outstanding (unlimited number of shares, no par value common stock authorized) | | | 1,318,108 | | | | N/A | | | | N/A | | | | N/A | | | | N/A | |
| (a) | Redemption price per share may be reduced for any applicable contingent deferred sales charge. For a description of a possible sales charge, please see the Fund's Prospectus. |
See Notes to Financial Statements.
RiverFront Global Allocation Series
| Statements of Operations | For the Year Ended October 31, 2018 |
| | | RiverFront Asset Allocation Aggressive | | | RiverFront Asset Allocation Growth | | | RiverFront Asset Allocation Growth & Income | | | RiverFront Asset Allocation Moderate | | | RiverFront Asset Allocation Income & Growth | |
| INVESTMENT INCOME | | | | | | | | | | | | | | | |
| Dividends | | $ | 526,015 | | | $ | 284,632 | | | $ | 723,993 | | | $ | 869,401 | | | $ | 115,952 | |
| Dividends from affiliated securities | | | 791,033 | | | | 482,612 | | | | 1,281,643 | | | | 1,346,122 | | | | 176,559 | |
| Total Investment Income | | | 1,317,048 | | | | 767,244 | | | | 2,005,636 | | | | 2,215,523 | | | | 292,511 | |
| | | | | | | | | | | | | | | | | | | | | |
| EXPENSES | | | | | | | | | | | | | | | | | | | | |
| Investment advisory fees | | | 169,822 | | | | 93,008 | | | | 221,717 | | | | 260,937 | | | | 31,046 | |
| Administrative fees | | | 20,690 | | | | 11,546 | | | | 26,948 | | | | 31,596 | | | | 4,018 | |
| Unitary administrative fees | | | 94,140 | | | | 54,560 | | | | 136,917 | | | | 144,369 | | | | 17,569 | |
| Transfer agency fees | | | 2,163 | | | | 1,845 | | | | 3,036 | | | | 4,348 | | | | 526 | |
| Distribution and service fees | | | | | | | | | | | | | | | | | | | | |
| Investor Class(a) | | | 17,934 | | | | 18,177 | | | | 31,999 | | | | 27,857 | | | | 2,131 | |
| Class A(b) | | | 10 | | | | 10 | | | | 11 | | | | 10 | | | | 10 | |
| Class C | | | 100,846 | | | | 111,633 | | | | 258,628 | | | | 473,914 | | | | 64,158 | |
| Investor Class II(c) | | | 7,558 | | | | – | | | | – | | | | – | | | | – | |
| Professional fees | | | 6,806 | | | | 3,680 | | | | 8,709 | | | | 10,970 | | | | 1,286 | |
| Reports to shareholders and printing fees | | | 6,971 | | | | 3,299 | | | | 5,347 | | | | 3,485 | | | | 6,386 | |
| State registration fees | | | 57,196 | | | | 30,828 | | | | 37,675 | | | | 31,319 | | | | 34,737 | |
| Insurance fees | | | 411 | | | | 220 | | | | 521 | | | | 742 | | | | 77 | |
| Custody fees | | | 1,634 | | | | 1,541 | | | | 2,395 | | | | 5,689 | | | | 1,157 | |
| Trustees' fees and expenses | | | 1,036 | | | | 566 | | | | 1,352 | | | | 1,529 | | | | 190 | |
| Miscellaneous expenses | | | 5,573 | | | | 3,760 | | | | 4,964 | | | | 5,061 | | | | 3,163 | |
| Total Expenses | | | 492,790 | | | | 334,673 | | | | 740,219 | | | | 1,001,826 | | | | 166,454 | |
| Less fees waived/reimbursed by investment advisor (Note 8) | | | | | | | | | | | | | | | | | | | | |
| Investor Class(a) | | | (12,756 | ) | | | (11,537 | ) | | | (14,101 | ) | | | (10,646 | ) | | | (4,920 | ) |
| Class C | | | (15,886 | ) | | | (17,819 | ) | | | (25,725 | ) | | | (42,421 | ) | | | (30,176 | ) |
| Class I | | | (21,586 | ) | | | (22,435 | ) | | | (38,044 | ) | | | (26,408 | ) | | | (14,656 | ) |
| Investor Class II(c) | | | (5,132 | ) | | | – | | | | – | | | | – | | | | – | |
| Class L | | | (37,117 | ) | | | – | | | | – | | | | – | | | | – | |
| Net Expenses | | | 400,313 | | | | 282,882 | | | | 662,349 | | | | 922,351 | | | | 116,702 | |
| Net Investment Income | | | 916,735 | | | | 484,362 | | | | 1,343,287 | | | | 1,293,172 | | | | 175,809 | |
| Net realized gain on investments | | | 12,646,135 | | | | 6,547,709 | | | | 13,840,131 | | | | 12,741,420 | | | | 814,332 | |
| Net realized loss on investments - affiliated securities | | | (1,711,658 | ) | | | (822,925 | ) | | | (1,790,862 | ) | | | (1,000,813 | ) | | | (87,233 | ) |
| Net realized gain | | | 10,934,477 | | | | 5,724,784 | | | | 12,049,269 | | | | 11,740,607 | | | | 727,099 | |
| Net change in unrealized depreciation on investments | | | (11,680,144 | ) | | | (6,108,864 | ) | | | (12,792,663 | ) | | | (11,299,184 | ) | | | (796,074 | ) |
| Net change in unrealized depreciation on investments - affiliated securities | | | (3,227,775 | ) | | | (1,596,456 | ) | | | (4,457,535 | ) | | | (2,786,149 | ) | | | (311,542 | ) |
| Net change in unrealized depreciation | | | (14,907,919 | ) | | | (7,705,320 | ) | | | (17,250,198 | ) | | | (14,085,333 | ) | | | (1,107,616 | ) |
| NET REALIZED AND UNREALIZED LOSS ON INVESTMENTS | | | (3,973,442 | ) | | | (1,980,536 | ) | | | (5,200,929 | ) | | | (2,344,726 | ) | | | (380,517 | ) |
| NET DECREASE IN NET ASSETS RESULTING FROM OPERATIONS | | $ | (3,056,707 | ) | | $ | (1,496,174 | ) | | $ | (3,857,642 | ) | | $ | (1,051,554 | ) | | $ | (204,708 | ) |
| (a) | Prior to December 1, 2017, Investor Class was known as Class A. |
| (b) | Class A commenced operations on June 12, 2018. |
| (c) | Prior to December 1, 2017, Investor Class II was known as Investor Class. |
See Notes to Financial Statements.
RiverFront Asset Allocation Aggressive
Statements of Changes in Net Assets
| | | For the Year Ended October 31, 2018(a) | | | For the Year Ended October 31, 2017 | |
| OPERATIONS | | | | | | |
| Net investment income | | $ | 916,735 | | | $ | 628,235 | |
| Net realized gain | | | 10,934,477 | | | | 2,808,836 | |
| Net change in unrealized appreciation/(depreciation) | | | (14,907,919 | ) | | | 8,317,596 | |
| Net Increase/(Decrease) in Net Assets Resulting from Operations | | | (3,056,707 | ) | | | 11,754,667 | |
| TOTAL DISTRIBUTIONS(b) | | | | | | | | |
| From distributable earnings | | | | | | | | |
| Investor Class(c) | | | (337,109 | ) | | | (128,429 | ) |
| Class C | | | (422,163 | ) | | | (142,083 | ) |
| Class I | | | (552,595 | ) | | | (138,482 | ) |
| Investor Class II(d) | | | (134,600 | ) | | | (307,313 | ) |
| Class L | | | (999,039 | ) | | | (59,987 | ) |
| Net Decrease in Net Assets from Distributions | | | (2,445,506 | ) | | | (776,294 | ) |
| BENEFICIAL INTEREST TRANSACTIONS (NOTE 6) | | | | | | | | |
| Shares sold | | | | | | | | |
| Investor Class(c) | | | 316,046 | | | | 2,063,170 | |
| Class A(e) | | | 10,000 | | | | – | |
| Class C | | | 1,137,491 | | | | 1,240,140 | |
| Class I | | | 4,319,752 | | | | 5,495,281 | |
| Investor Class II(d) | | | 35,666 | | | | 153,063 | |
| Class L | | | 2,000,911 | | | | 3,049,507 | |
| Dividends reinvested | | | | | | | | |
| Investor Class(c) | | | 332,210 | | | | 124,903 | |
| Class C | | | 403,730 | | | | 134,666 | |
| Class I | | | 513,505 | | | | 127,093 | |
| Investor Class II(d) | | | 115,441 | | | | 51,574 | |
| Class L | | | 994,742 | | | | 302,845 | |
| Shares redeemed | | | | | | | | |
| Investor Class(c) | | | (4,556,621 | ) | | | (4,592,296 | ) |
| Class C | | | (2,272,781 | ) | | | (4,327,525 | ) |
| Class I | | | (4,539,710 | ) | | | (4,213,503 | ) |
| Investor Class II(d) | | | (1,316,015 | ) | | | (2,120,267 | ) |
| Class L | | | (6,678,837 | ) | | | (4,915,621 | ) |
| Net Decrease in Net Assets Derived from Beneficial Interest Transactions | | | (9,184,470 | ) | | | (7,426,970 | ) |
| Net increase/(decrease) in net assets | | | (14,686,684 | ) | | | 3,551,403 | |
| NET ASSETS | | | | | | | | |
| Beginning of year | | | 61,975,949 | | | | 58,424,546 | |
| End of year | | $ | 47,289,265 | | | $ | 61,975,949 | (f) |
| (a) | Prior to February 28, 2018, the RiverFront Asset Allocation Aggressive was known as the RiverFront Global Growth Fund. |
| (b) | For the prior year ended October 31, 2017, Total Distributions consisted of Net Investment Income $776,294, and Net Realized Gains $–. |
| (c) | Prior to December 1, 2017, Investor Class was known as Class A. |
| (d) | Prior to December 1, 2017, Investor Class II was known as Investor Class. |
| (e) | Class A commenced operations on June 12, 2018. |
| (f) | For the prior year ended October 31, 2017, included accumulated net investment income of $366,067. |
See Notes to Financial Statements.
RiverFront Asset Allocation Growth
Statements of Changes in Net Assets
| | | For the Year Ended October 31, 2018(a) | | | For the Year Ended October 31, 2017 | |
| OPERATIONS | | | | | | |
| Net investment income | | $ | 484,362 | | | $ | 329,943 | |
| Net realized gain | | | 5,724,784 | | | | 1,681,636 | |
| Net change in unrealized appreciation/(depreciation) | | | (7,705,320 | ) | | | 4,208,911 | |
| Net Increase/(Decrease) in Net Assets Resulting from Operations | | | (1,496,174 | ) | | | 6,220,490 | |
| TOTAL DISTRIBUTIONS(b) | | | | | | | | |
| From distributable earnings | | | | | | | | |
| Investor Class(c) | | | (119,251 | ) | | | (90,298 | ) |
| Class C | | | (182,204 | ) | | | (183,505 | ) |
| Class I | | | (253,902 | ) | | | (208,594 | ) |
| Net Decrease in Net Assets from Distributions | | | (555,357 | ) | | | (482,397 | ) |
| BENEFICIAL INTEREST TRANSACTIONS (NOTE 6) | | | | | | | | |
| Shares sold | | | | | | | | |
| Investor Class(c) | | | 1,400,966 | | | | 1,515,630 | |
| Class A(d) | | | 10,000 | | | | – | |
| Class C | | | 1,468,934 | | | | 820,360 | |
| Class I | | | 3,059,739 | | | | 2,726,015 | |
| Dividends reinvested | | | | | | | | |
| Investor Class(c) | | | 116,807 | | | | 86,952 | |
| Class C | | | 170,811 | | | | 168,018 | |
| Class I | | | 249,708 | | | | 203,096 | |
| Shares redeemed | | | | | | | | |
| Investor Class(c) | | | (2,495,195 | ) | | | (1,801,890 | ) |
| Class C | | | (2,497,171 | ) | | | (6,423,546 | ) |
| Class I | | | (4,188,509 | ) | | | (4,514,866 | ) |
| Net Decrease in Net Assets Derived from Beneficial Interest Transactions | | | (2,703,910 | ) | | | (7,220,231 | ) |
| Net decrease in net assets | | | (4,755,441 | ) | | | (1,482,138 | ) |
| NET ASSETS | | | | | | | | |
| Beginning of year | | | 33,918,908 | | | | 35,401,046 | |
| End of year | | $ | 29,163,467 | | | $ | 33,918,908 | (e) |
| (a) | Prior to February 28, 2018, the RiverFront Asset Allocation Growth was known as the RiverFront Global Allocation Fund. |
| (b) | For the prior year ended October 31, 2017, Total Distributions consisted of Net Investment Income $482,397, and Net Realized Gains $–. |
| (c) | Prior to December 1, 2017, Investor Class was known as Class A. |
| (d) | Class A commenced operations on June 12, 2018. |
| (e) | For the prior year ended October 31, 2017, included accumulated net investment income of $168,257. |
See Notes to Financial Statements.
RiverFront Asset Allocation Growth & Income
Statements of Changes in Net Assets
| | | For the Year Ended October 31, 2018(a) | | | For the Year Ended October 31, 2017 | |
| OPERATIONS | | | | | | |
| Net investment income | | $ | 1,343,287 | | | $ | 841,529 | |
| Net realized gain | | | 12,049,269 | | | | 3,867,027 | |
| Net change in unrealized appreciation/(depreciation) | | | (17,250,198 | ) | | | 8,391,568 | |
| Net Increase/(Decrease) in Net Assets Resulting from Operations | | | (3,857,642 | ) | | | 13,100,124 | |
| TOTAL DISTRIBUTIONS(b) | | | | | | | | |
| From distributable earnings | | | | | | | | |
| Investor Class(c) | | | (498,424 | ) | | | (226,123 | ) |
| Class A(d) | | | (117 | ) | | | – | |
| Class C | | | (898,485 | ) | | | (246,391 | ) |
| Class I | | | (1,659,656 | ) | | | (416,860 | ) |
| Net Decrease in Net Assets from Distributions | | | (3,056,682 | ) | | | (889,374 | ) |
| BENEFICIAL INTEREST TRANSACTIONS (NOTE 6) | | | | | | | | |
| Shares sold | | | | | | | | |
| Investor Class(c) | | | 1,153,407 | | | | 2,098,660 | |
| Class A(d) | | | 13,540 | | | | – | |
| Class C | | | 3,149,024 | | | | 2,376,050 | |
| Class I | | | 30,676,562 | | | | 7,915,259 | |
| Dividends reinvested | | | | | | | | |
| Investor Class(c) | | | 473,791 | | | | 214,625 | |
| Class A(d) | | | 117 | | | | – | |
| Class C | | | 853,722 | | | | 225,203 | |
| Class I | | | 1,565,562 | | | | 377,119 | |
| Shares redeemed | | | | | | | | |
| Investor Class(c) | | | (10,902,547 | ) | | | (6,388,976 | ) |
| Class C | | | (5,371,606 | ) | | | (12,784,214 | ) |
| Class I | | | (9,883,640 | ) | | | (8,400,004 | ) |
| Net Increase/(Decrease) in Net Assets Derived from Beneficial Interest Transactions | | | 11,727,932 | | | | (14,366,278 | ) |
| Net increase/(decrease) in net assets | | | 4,813,609 | | | | (2,155,528 | ) |
| NET ASSETS | | | | | | | | |
| Beginning of year | | | 79,120,964 | | | | 81,276,492 | |
| End of year | | $ | 83,934,573 | | | $ | 79,120,964 | (e) |
| (a) | Prior to February 28, 2018, the RiverFront Asset Allocation Growth & Income was known as the RiverFront Dynamic Equity Income Fund. |
| (b) | For the prior year ended October 31, 2017, Total Distributions consisted of Net Investment Income $889,374, and Net Realized Gains $–. |
| (c) | Prior to December 1, 2017, Investor Class was known as Class A. |
| (d) | Class A commenced operations on June 12, 2018. |
| (e) | For the prior year ended October 31, 2017, included accumulated net investment income of $15,982. |
See Notes to Financial Statements.
RiverFront Asset Allocation Moderate
Statements of Changes in Net Assets
| | | For the Year Ended October 31, 2018(a) | | | For the Year Ended October 31, 2017 | |
| OPERATIONS | | | | | | |
| Net investment income | | $ | 1,293,172 | | | $ | 1,408,898 | |
| Net realized gain | | | 11,740,607 | | | | 6,979,792 | |
| Net change in unrealized appreciation/(depreciation) | | | (14,085,333 | ) | | | 5,632,698 | |
| Net Increase/(Decrease) in Net Assets Resulting from Operations | | | (1,051,554 | ) | | | 14,021,388 | |
| TOTAL DISTRIBUTIONS(b) | | | | | | | | |
| From distributable earnings | | | | | | | | |
| Investor Class(c) | | | (777,381 | ) | | | (272,881 | ) |
| Class A(d) | | | (101 | ) | | | – | |
| Class C | | | (2,844,467 | ) | | | (509,175 | ) |
| Class I | | | (2,005,140 | ) | | | (667,961 | ) |
| Net Decrease in Net Assets from Distributions | | | (5,627,089 | ) | | | (1,450,017 | ) |
| BENEFICIAL INTEREST TRANSACTIONS (NOTE 6) | | | | | | | | |
| Shares sold | | | | | | | | |
| Investor Class(c) | | | 319,224 | | | | 1,502,648 | |
| Class A(d) | | | 10,000 | | | | – | |
| Class C | | | 1,962,397 | | | | 2,821,593 | |
| Class I | | | 7,717,359 | | | | 8,441,309 | |
| Dividends reinvested | | | | | | | | |
| Investor Class(c) | | | 716,488 | | | | 237,474 | |
| Class A(d) | | | 101 | | | | – | |
| Class C | | | 2,501,493 | | | | 425,136 | |
| Class I | | | 1,872,861 | | | | 549,599 | |
| Shares redeemed | | | | | | | | |
| Investor Class(c) | | | (5,355,419 | ) | | | (13,140,898 | ) |
| Class C | | | (11,310,667 | ) | | | (21,454,023 | ) |
| Class I | | | (9,936,285 | ) | | | (25,714,569 | ) |
| Net Decrease in Net Assets Derived from Beneficial Interest Transactions | | | (11,502,448 | ) | | | (46,331,731 | ) |
| Net decrease in net assets | | | (18,181,091 | ) | | | (33,760,360 | ) |
| NET ASSETS | | | | | | | | |
| Beginning of year | | | 95,455,141 | | | | 129,215,501 | |
| End of year | | $ | 77,274,050 | | | $ | 95,455,141 | (e) |
| (a) | Prior to February 28, 2018, the RiverFront Asset Allocation Moderate was known as the RiverFront Moderate Growth & Income Fund. |
| (b) | For the prior year ended October 31, 2017, Total Distributions consisted of Net Investment Income $1,450,017, and Net Realized Gains $–. |
| (c) | Prior to December 1, 2017, Investor Class was known as Class A. |
| (d) | Class A commenced operations on June 12, 2018. |
| (e) | For the prior year ended October 31, 2017, included accumulated net investment income of $151,684. |
See Notes to Financial Statements.
RiverFront Asset Allocation Income & Growth
Statements of Changes in Net Assets
| | | For the Year Ended October 31, 2018(a) | | | For the Year Ended October 31, 2017 | |
| OPERATIONS | | | | | | |
| Net investment income | | $ | 175,809 | | | $ | 122,419 | |
| Net realized gain | | | 727,099 | | | | 456,194 | |
| Net change in unrealized appreciation/(depreciation) | | | (1,107,616 | ) | | | 344,786 | |
| Net Increase/(Decrease) in Net Assets Resulting from Operations | | | (204,708 | ) | | | 923,399 | |
| TOTAL DISTRIBUTIONS(b) | | | | | | | | |
| From distributable earnings | | | | | | | | |
| Investor Class(c) | | | (33,467 | ) | | | (8,438 | ) |
| Class A(d) | | | (107 | ) | | | – | |
| Class C | | | (195,462 | ) | | | (85,999 | ) |
| Class I | | | (129,870 | ) | | | (32,538 | ) |
| Net Decrease in Net Assets from Distributions | | | (358,906 | ) | | | (126,975 | ) |
| BENEFICIAL INTEREST TRANSACTIONS (NOTE 6) | | | | | | | | |
| Shares sold | | | | | | | | |
| Investor Class(c) | | | 85,248 | | | | 665,209 | |
| Class A(d) | | | 10,000 | | | | – | |
| Class C | | | 546,309 | | | | 1,197,684 | |
| Class I | | | 1,943,290 | | | | 936,031 | |
| Dividends reinvested | | | | | | | | |
| Investor Class(c) | | | 33,226 | | | | 7,848 | |
| Class A(d) | | | 107 | | | | – | |
| Class C | | | 166,582 | | | | 68,273 | |
| Class I | | | 121,619 | | | | 29,171 | |
| Shares redeemed | | | | | | | | |
| Investor Class(c) | | | (1,057,036 | ) | | | (629,479 | ) |
| Class C | | | (1,922,324 | ) | | | (6,175,398 | ) |
| Class I | | | (794,641 | ) | | | (597,368 | ) |
| Net Decrease in Net Assets Derived from Beneficial Interest Transactions | | | (867,620 | ) | | | (4,498,029 | ) |
| Net decrease in net assets | | | (1,431,234 | ) | | | (3,701,605 | ) |
| NET ASSETS | | | | | | | | |
| Beginning of year | | | 11,149,126 | | | | 14,850,731 | |
| End of year | | $ | 9,717,892 | | | $ | 11,149,126 | (e) |
| (a) | Prior to February 28, 2018, the RiverFront Asset Allocation Income & Growth was known as the RiverFront Conservative Income Builder Fund. |
| (b) | For the prior year ended October 31, 2017, Total Distributions consisted of Net Investment Income $126,975, and Net Realized Gains $–. |
| (c) | Prior to December 1, 2017, Investor Class was known as Class A. |
| (d) | Class A commenced operations on June 12, 2018. |
| (e) | For the prior year ended October 31, 2017, included accumulated net investment income of $14,179. |
See Notes to Financial Statements.
RiverFront Asset Allocation Aggressive – Investor Class
Financial Highlights
Selected data for a share of beneficial interest outstanding throughout the periods indicated:
| | | For the Year Ended October 31, 2018(a)(b) | | | For the Year Ended October 31, 2017 | | | For the Year Ended October 31, 2016 | | | For the Year Ended October 31, 2015 | | | For the Fiscal Period Ended October 31, 2014(c) | | | For the Year Ended April 30, 2014 | |
| Net asset value, beginning of period | | $ | 16.27 | | | $ | 13.54 | | | $ | 13.95 | | | $ | 15.44 | | | $ | 15.26 | | | $ | 14.89 | |
| INCOME/(LOSS) FROM INVESTMENT OPERATIONS: | | | | | | | | | | | | |
| Net investment income after reimbursements(d) | | | 0.25 | | | | 0.16 | | | | 0.23 | | | | 0.24 | | | | 0.08 | | | | 0.12 | |
| Net realized and unrealized gain/(loss) | | | (1.27 | ) | | | 2.76 | | | | (0.31 | ) | | | (0.04 | ) | | | 0.10 | | | | 1.88 | |
| Total from investment operations | | | (1.02 | ) | | | 2.92 | | | | (0.08 | ) | | | 0.20 | | | | 0.18 | | | | 2.00 | |
| DISTRIBUTIONS: | | | | | | | | | | | | | | | | | | | | | | | | |
| From net investment income | | | (0.21 | ) | | | (0.19 | ) | | | (0.20 | ) | | | (0.25 | ) | | | – | | | | (0.12 | ) |
| From net realized gains | | | (0.45 | ) | | | – | | | | (0.13 | ) | | | (1.44 | ) | | | – | | | | (1.51 | ) |
| Total distributions | | | (0.66 | ) | | | (0.19 | ) | | | (0.33 | ) | | | (1.69 | ) | | | – | | | | (1.63 | ) |
| Net increase/(decrease) in net asset value | | | (1.68 | ) | | | 2.73 | | | | (0.41 | ) | | | (1.49 | ) | | | 0.18 | | | | 0.37 | |
| Net asset value, end of year | | $ | 14.59 | | | $ | 16.27 | | | $ | 13.54 | | | $ | 13.95 | | | $ | 15.44 | | | $ | 15.26 | |
| TOTAL RETURN(e) | | | (6.62 | )% | | | 21.81 | % | | | (0.57 | )% | | | 1.34 | % | | | 1.18 | % | | | 13.66 | % |
| RATIOS/SUPPLEMENTAL DATA: | | | | | | | | | | | | | | | | | | | | | | | | |
| Net assets, end of year (000s) | | $ | 4,491 | | | $ | 8,935 | | | $ | 9,618 | | | $ | 18,308 | | | $ | 16,694 | | | $ | 16,440 | |
| Ratio of expenses to average net assets excluding fee waivers and reimbursements | | | 0.93 | % | | | 1.45 | % | | | 1.40 | % | | | 1.38 | % | | | 1.38 | %(f) | | | 1.40 | % |
| Ratio of expenses to average net assets including fee waivers and reimbursements | | | 0.75 | %(g) | | | 1.15 | % | | | 1.15 | % | | | 1.15 | % | | | 1.15 | %(f) | | | 1.15 | % |
| Ratio of net investment income to average net assets | | | 1.56 | % | | | 1.09 | % | | | 1.77 | % | | | 1.67 | % | | | 1.08 | %(f) | | | 0.76 | % |
| Portfolio turnover rate(h) | | | 200 | % | | | 60 | % | | | 113 | % | | | 71 | % | | | 48 | % | | | 85 | % |
| (a) | Prior to December 1, 2017, Investor Class was known as Class A. |
| (b) | Prior to February 28, 2018, the RiverFront Asset Allocation Aggressive was known as the RiverFront Global Growth Fund. |
| (c) | Effective May 1, 2014, the Board approved changing the fiscal year-end of the Funds from April 30 to October 31. |
| (d) | Calculated using the average shares method. |
| (e) | Total returns are for the period indicated and have not been annualized. Total returns would have been lower had certain expenses not been waived during the period. Returns shown do not reflect the deduction of taxes that a shareholder would pay on Fund distributions or the redemption of Fund shares. Returns shown exclude any applicable sales charges. |
| (g) | Effective February 28, 2018, pursuant to the Administrative Services Agreement, the Fund pays an annual unitary administrative fee, which is based on the Fund’s average daily net assets, and will no longer pay a management fee or contractually limit the Fund’s total annual expenses. Refer to Note 8. |
| (h) | Portfolio turnover rate for periods less than one full year have not been annualized. |
See Notes to Financial Statements.
RiverFront Asset Allocation Aggressive – Class A
Financial Highlights
Selected data for a share of beneficial interest outstanding throughout the periods indicated:
| | | For the Period June 12, 2018 (Commencement of Operations) to October 31, 2018 | |
| Net asset value, beginning of period | | $ | 16.35 | |
| | | | | |
| INCOME FROM INVESTMENT OPERATIONS: | | | | |
| Net investment income(a) | | | 0.16 | |
| Net realized and unrealized loss | | | (2.00 | ) |
| Total from investment operations | | | (1.84 | ) |
| | | | | |
| Net (decrease) in net asset value | | | (1.84 | ) |
| Net asset value, end of year | | $ | 14.51 | |
| TOTAL RETURN(b) | | | (11.25 | )% |
| | | | | |
| RATIOS/SUPPLEMENTAL DATA: | | | | |
| Net assets, end of year (000s) | | $ | 9 | |
| Ratio of expenses to average net assets excluding fee waivers and reimbursements | | | 0.50 | %(c) |
| Ratio of expenses to average net assets including fee waivers and reimbursements | | | 0.50 | %(c) |
| Ratio of net investment income to average net assets | | | 2.66 | %(c) |
| Portfolio turnover rate(d) | | | 200 | % |
| (a) | Calculated using the average shares method. |
| (b) | Total returns are for the period indicated and have not been annualized. Total returns would have been lower had certain expenses not been waived during the period. Returns shown do not reflect the deduction of taxes that a shareholder would pay on Fund distributions or the redemption of Fund shares. |
| (d) | Portfolio turnover rate for periods less than one full year have not been annualized. |
See Notes to Financial Statements.
RiverFront Asset Allocation Aggressive – Class C
Financial Highlights
Selected data for a share of beneficial interest outstanding throughout the periods indicated:
| | | For the Year Ended October 31, 2018(a) | | | For the Year Ended October 31, 2017 | | | For the Year Ended October 31, 2016 | | | For the Year Ended October 31, 2015 | | | For the Fiscal Period Ended October 31, 2014(b) | | | For the Year Ended April 30, 2014 | |
| Net asset value, beginning of period | | $ | 15.73 | | | $ | 13.18 | | | $ | 13.67 | | | $ | 15.19 | | | $ | 15.07 | | | $ | 14.76 | |
| INCOME/(LOSS) FROM INVESTMENT OPERATIONS: | | | | | | |
| Net investment income after reimbursements(c) | | | 0.12 | | | | 0.04 | | | | 0.12 | | | | 0.13 | | | | 0.03 | | | | 0.01 | |
| Net realized and unrealized gain/(loss) | | | (1.20 | ) | | | 2.68 | | | | (0.30 | ) | | | (0.04 | ) | | | 0.09 | | | | 1.86 | |
| Total from investment operations | | | (1.08 | ) | | | 2.72 | | | | (0.18 | ) | | | 0.09 | | | | 0.12 | | | | 1.87 | |
| DISTRIBUTIONS: | | | | | | | | | | | | | | | | | | | | | | | | |
| From net investment income | | | (0.19 | ) | | | (0.17 | ) | | | (0.18 | ) | | | (0.17 | ) | | | – | | | | (0.05 | ) |
| From net realized gains | | | (0.45 | ) | | | – | | | | (0.13 | ) | | | (1.44 | ) | | | – | | | | (1.51 | ) |
| Total distributions | | | (0.64 | ) | | | (0.17 | ) | | | (0.31 | ) | | | (1.61 | ) | | | – | | | | (1.56 | ) |
| Net increase/(decrease) in net asset value | | | (1.72 | ) | | | 2.55 | | | | (0.49 | ) | | | (1.52 | ) | | | 0.12 | | | | 0.31 | |
| Net asset value, end of year | | $ | 14.01 | | | $ | 15.73 | | | $ | 13.18 | | | $ | 13.67 | | | $ | 15.19 | | | $ | 15.07 | |
| TOTAL RETURN(d) | | | (7.24 | )% | | | 20.87 | % | | | (1.31 | )% | | | 0.59 | % | | | 0.80 | % | | | 12.84 | % |
| RATIOS/SUPPLEMENTAL DATA: | | | | | | | | | | | | | | | | | | | | | | | | |
| Net assets, end of year (000s) | | $ | 8,597 | | | $ | 10,408 | | | $ | 11,447 | | | $ | 12,908 | | | $ | 11,420 | | | $ | 11,511 | |
| Ratio of expenses to average net assets excluding fee waivers and reimbursements | | | 1.63 | % | | | 2.20 | % | | | 2.16 | % | | | 2.13 | % | | | 2.13 | %(e) | | | 2.15 | % |
| Ratio of expenses to average net assets including fee waivers and reimbursements | | | 1.47 | %(f) | | | 1.90 | % | | | 1.90 | % | | | 1.90 | % | | | 1.90 | %(e) | | | 1.90 | % |
| Ratio of net investment income to average net assets | | | 0.80 | % | | | 0.29 | % | | | 0.92 | % | | | 0.88 | % | | | 0.38 | %(e) | | | 0.07 | % |
| Portfolio turnover rate(g) | | | 200 | % | | | 60 | % | | | 113 | % | | | 71 | % | | | 48 | % | | | 85 | % |
| (a) | Prior to February 28, 2018, the RiverFront Asset Allocation Aggressive was known as the RiverFront Global Growth Fund. |
| (b) | Effective May 1, 2014, the Board approved changing the fiscal year-end of the Funds from April 30 to October 31. |
| (c) | Calculated using the average shares method. |
| (d) | Total returns are for the period indicated and have not been annualized. Total returns would have been lower had certain expenses not been waived during the period. Returns shown do not reflect the deduction of taxes that a shareholder would pay on Fund distributions or the redemption of Fund shares. Returns shown exclude any applicable sales charges. |
| (f) | Effective February 28, 2018, pursuant to the Administrative Services Agreement, the Fund pays an annual unitary administrative fee, which is based on the Fund’s average daily net assets, and will no longer pay a management fee or contractually limit the Fund’s total annual expenses. Refer to Note 8. |
| (g) | Portfolio turnover rate for periods less than one full year have not been annualized. |
See Notes to Financial Statements.
RiverFront Asset Allocation Aggressive – Class I
Financial Highlights
Selected data for a share of beneficial interest outstanding throughout the periods indicated:
| | | For the Year Ended October 31, 2018(a) | | | For the Year Ended October 31, 2017 | | | For the Year Ended October 31, 2016 | | | For the Year Ended October 31, 2015 | | | For the Fiscal Period Ended October 31, 2014(b) | | | For the Year Ended April 30, 2014 | |
| Net asset value, beginning of period | | $ | 16.43 | | | $ | 13.65 | | | $ | 14.03 | | | $ | 15.52 | | | $ | 15.32 | | | $ | 14.92 | |
| INCOME/(LOSS) FROM INVESTMENT OPERATIONS: | | | | | | |
| Net investment income after reimbursements(c) | | | 0.29 | | | | 0.19 | | | | 0.26 | | | | 0.26 | | | | 0.10 | | | | 0.17 | |
| Net realized and unrealized gain/(loss) | | | (1.27 | ) | | | 2.78 | | | | (0.30 | ) | | | (0.03 | ) | | | 0.10 | | | | 1.89 | |
| Total from investment operations | | | (0.98 | ) | | | 2.97 | | | | (0.04 | ) | | | 0.23 | | | | 0.20 | | | | 2.06 | |
| DISTRIBUTIONS: | | | | | | | | | | | | | | | | | | | | | | | | |
| From net investment income | | | (0.22 | ) | | | (0.19 | ) | | | (0.21 | ) | | | (0.28 | ) | | | – | | | | (0.15 | ) |
| From net realized gains | | | (0.45 | ) | | | – | | | | (0.13 | ) | | | (1.44 | ) | | | – | | | | (1.51 | ) |
| Total distributions | | | (0.67 | ) | | | (0.19 | ) | | | (0.34 | ) | | | (1.72 | ) | | | – | | | | (1.66 | ) |
| Net increase/(decrease) in net asset value | | | (1.65 | ) | | | 2.78 | | | | (0.38 | ) | | | (1.49 | ) | | | 0.20 | | | | 0.40 | |
| Net asset value, end of year | | $ | 14.78 | | | $ | 16.43 | | | $ | 13.65 | | | $ | 14.03 | | | $ | 15.52 | | | $ | 15.32 | |
| TOTAL RETURN(d) | | | (6.33 | )% | | | 22.05 | % | | | (0.31 | )% | | | 1.51 | % | | | 1.31 | % | | | 14.01 | % |
| RATIOS/SUPPLEMENTAL DATA: | | | | | | | | | | | | | | | | | | | | | | | | |
| Net assets, end of year (000s) | | $ | 12,701 | | | $ | 13,873 | | | $ | 10,140 | | | $ | 16,412 | | | $ | 13,343 | | | $ | 11,845 | |
| Ratio of expenses to average net assets excluding fee waivers and reimbursements | | | 0.62 | % | | | 1.20 | % | | | 1.15 | % | | | 1.29 | % | | | 1.36 | %(e) | | | 1.16 | % |
| Ratio of expenses to average net assets including fee waivers and reimbursements | | | 0.46 | %(f) | | | 0.90 | % | | | 0.90 | % | | | 0.90 | % | | | 0.90 | %(e) | | | 0.90 | % |
| Ratio of net investment income to average net assets | | | 1.79 | % | | | 1.29 | % | | | 1.98 | % | | | 1.77 | % | | | 1.32 | %(e) | | | 1.13 | % |
| Portfolio turnover rate(g) | | | 200 | % | | | 60 | % | | | 113 | % | | | 71 | % | | | 48 | % | | | 85 | % |
| (a) | Prior to February 28, 2018, the RiverFront Asset Allocation Aggressive was known as the RiverFront Global Growth Fund. |
| (b) | Effective May 1, 2014, the Board approved changing the fiscal year-end of the Funds from April 30 to October 31. |
| (c) | Calculated using the average shares method. |
| (d) | Total returns are for the period indicated and have not been annualized. Total returns would have been lower had certain expenses not been waived during the period. Returns shown do not reflect the deduction of taxes that a shareholder would pay on Fund distributions or the redemption of Fund shares. |
| (f) | Effective February 28, 2018, pursuant to the Administrative Services Agreement, the Fund pays an annual unitary administrative fee, which is based on the Fund’s average daily net assets, and will no longer pay a management fee or contractually limit the Fund’s total annual expenses. Refer to Note 8. |
| (g) | Portfolio turnover rate for periods less than one full year have not been annualized. |
See Notes to Financial Statements.
RiverFront Asset Allocation Aggressive – Investor Class II
Financial Highlights
Selected data for a share of beneficial interest outstanding throughout the periods indicated:
| | | For the Year Ended October 31, 2018(a)(b) | | | For the Year Ended October 31, 2017 | | | For the Year Ended October 31, 2016 | | | For the Year Ended October 31, 2015 | | | For the Fiscal Period Ended October 31, 2014(c) | | | For the Year Ended April 30, 2014 | |
| Net asset value, beginning of period | | $ | 16.18 | | | $ | 13.47 | | | $ | 13.87 | | | $ | 15.37 | | | $ | 15.19 | | | $ | 14.82 | |
| INCOME/(LOSS) FROM INVESTMENT OPERATIONS: | | | | | | |
| Net investment income after reimbursements(d) | | | 0.25 | | | | 0.15 | | | | 0.23 | | | | 0.26 | | | | 0.09 | | | | 0.13 | |
| Net realized and unrealized gain/(loss) | | | (1.27 | ) | | | 2.75 | | | | (0.30 | ) | | | (0.07 | ) | | | 0.09 | | | | 1.87 | |
| Total from investment operations | | | (1.02 | ) | | | 2.90 | | | | (0.07 | ) | | | 0.19 | | | | 0.18 | | | | 2.00 | |
| DISTRIBUTIONS: | | | | | | | | | | | | | | | | | | | | | | | | |
| From net investment income | | | (0.21 | ) | | | (0.19 | ) | | | (0.20 | ) | | | (0.25 | ) | | | – | | | | (0.12 | ) |
| From net realized gains | | | (0.45 | ) | | | – | | | | (0.13 | ) | | | (1.44 | ) | | | – | | | | (1.51 | ) |
| Total distributions | | | (0.66 | ) | | | (0.19 | ) | | | (0.33 | ) | | | (1.69 | ) | | | – | | | | (1.63 | ) |
| Net increase/(decrease) in net asset value | | | (1.68 | ) | | | 2.71 | | | | (0.40 | ) | | | (1.50 | ) | | | 0.18 | | | | 0.37 | |
| Net asset value, end of year | | $ | 14.50 | | | $ | 16.18 | | | $ | 13.47 | | | $ | 13.87 | | | $ | 15.37 | | | $ | 15.19 | |
| TOTAL RETURN(e) | | | (6.66 | )% | | | 21.77 | % | | | (0.51 | )% | | | 1.28 | % | | | 1.18 | % | | | 13.73 | % |
| RATIOS/SUPPLEMENTAL DATA: | | | | | | | | | | | | | | | | | | | | | | | | |
| Net assets, end of year (000s) | | $ | 2,043 | | | $ | 3,451 | | | $ | 4,667 | | | $ | 6,924 | | | $ | 7,762 | | | $ | 8,361 | |
| Ratio of expenses to average net assets excluding fee waivers and reimbursements | | | 0.91 | % | | | 1.45 | % | | | 1.40 | % | | | 1.38 | % | | | 1.38 | %(f) | | | 1.41 | % |
| Ratio of expenses to average net assets including fee waivers and reimbursements | | | 0.74 | %(g) | | | 1.15 | % | | | 1.15 | % | | | 1.15 | % | | | 1.15 | %(f) | | | 1.15 | % |
| Ratio of net investment income to average net assets | | | 1.58 | % | | | 1.04 | % | | | 1.75 | % | | | 1.78 | % | | | 1.14 | %(f) | | | 0.85 | % |
| Portfolio turnover rate(h) | | | 200 | % | | | 60 | % | | | 113 | % | | | 71 | % | | | 48 | % | | | 85 | % |
| (a) | Prior to February 28, 2018, the RiverFront Asset Allocation Aggressive was known as the RiverFront Global Growth Fund. |
| (b) | Prior to December 1, 2017, Investor Class II was known as Investor Class. |
| (c) | Effective May 1, 2014, the Board approved changing the fiscal year-end of the Funds from April 30 to October 31. |
| (d) | Calculated using the average shares method. |
| (e) | Total returns are for the period indicated and have not been annualized. Total returns would have been lower had certain expenses not been waived during the period. Returns shown do not reflect the deduction of taxes that a shareholder would pay on Fund distributions or the redemption of Fund shares. |
| (g) | Effective February 28, 2018, pursuant to the Administrative Services Agreement, the Fund pays an annual unitary administrative fee, which is based on the Fund’s average daily net assets, and will no longer pay a management fee or contractually limit the Fund’s total annual expenses. Refer to Note 8. |
| (h) | Portfolio turnover rate for periods less than one full year have not been annualized. |
See Notes to Financial Statements.
RiverFront Asset Allocation Aggressive – Class L
Financial Highlights
Selected data for a share of beneficial interest outstanding throughout the periods indicated:
| | | For the Year Ended October 31, 2018(a) | | | For the Year Ended October 31, 2017 | | | For the Year Ended October 31, 2016 | | | For the Year Ended October 31, 2015 | | | For the Fiscal Period Ended October 31, 2014(b) | | | For the Year Ended April 30, 2014 | |
| Net asset value, beginning of period | | $ | 16.41 | | | $ | 13.63 | | | $ | 14.01 | | | $ | 15.49 | | | $ | 15.29 | | | $ | 14.90 | |
| INCOME/(LOSS) FROM INVESTMENT OPERATIONS: | | | | | | | | | | | | |
| Net investment income after reimbursements(c) | | | 0.30 | | | | 0.19 | | | | 0.25 | | | | 0.27 | | | | 0.11 | | | | 0.17 | |
| Net realized and unrealized gain/(loss) | | | (1.28 | ) | | | 2.78 | | | | (0.29 | ) | | | (0.03 | ) | | | 0.09 | | | | 1.88 | |
| Total from investment operations | | | (0.98 | ) | | | 2.97 | | | | (0.04 | ) | | | 0.24 | | | | 0.20 | | | | 2.05 | |
| DISTRIBUTIONS: | | | | | | | | | | | | | | | | | | | | | | | | |
| From net investment income | | | (0.22 | ) | | | (0.19 | ) | | | (0.21 | ) | | | (0.28 | ) | | | – | | | | (0.15 | ) |
| From net realized gains | | | (0.45 | ) | | | – | | | | (0.13 | ) | | | (1.44 | ) | | | – | | | | (1.51 | ) |
| Total distributions | | | (0.67 | ) | | | (0.19 | ) | | | (0.34 | ) | | | (1.72 | ) | | | – | | | | (1.66 | ) |
| Net increase/(decrease) in net asset value | | | (1.65 | ) | | | 2.78 | | | | (0.38 | ) | | | (1.48 | ) | | | 0.20 | | | | 0.39 | |
| Net asset value, end of year | | $ | 14.76 | | | $ | 16.41 | | | $ | 13.63 | | | $ | 14.01 | | | $ | 15.49 | | | $ | 15.29 | |
| TOTAL RETURN(d) | | | (6.34 | )% | | | 22.08 | % | | | (0.31 | )% | | | 1.59 | % | | | 1.31 | % | | | 13.98 | % |
| RATIOS/SUPPLEMENTAL DATA: | | | | | | | | | | | | | | | | | | | | | | | | |
| Net assets, end of year (000s) | | $ | 19,449 | | | $ | 25,309 | | | $ | 22,552 | | | $ | 26,109 | | | $ | 24,400 | | | $ | 25,092 | |
| Ratio of expenses to average net assets excluding fee waivers and reimbursements | | | 0.63 | % | | | 1.20 | % | | | 1.16 | % | | | 1.04 | % | | | 1.02 | %(e) | | | 1.15 | % |
| Ratio of expenses to average net assets including fee waivers and reimbursements | | | 0.47 | %(f) | | | 0.90 | % | | | 0.90 | % | | | 0.90 | % | | | 0.90 | %(e) | | | 0.90 | % |
| Ratio of net investment income to average net assets | | | 1.82 | % | | | 1.27 | % | | | 1.90 | % | | | 1.86 | % | | | 1.37 | %(e) | | | 1.11 | % |
| Portfolio turnover rate(g) | | | 200 | % | | | 60 | % | | | 113 | % | | | 71 | % | | | 48 | % | | | 85 | % |
| (a) | Prior to February 28, 2018, the RiverFront Asset Allocation Aggressive was known as the RiverFront Global Growth Fund. |
| (b) | Effective May 1, 2014, the Board approved changing the fiscal year-end of the Funds from April 30 to October 31. |
| (c) | Calculated using the average shares method. |
| (d) | Total returns are for the period indicated and have not been annualized. Total returns would have been lower had certain expenses not been waived during the period. Returns shown do not reflect the deduction of taxes that a shareholder would pay on Fund distributions or the redemption of Fund shares. |
| (f) | Effective February 28, 2018, pursuant to the Administrative Services Agreement, the Fund pays an annual unitary administrative fee, which is based on the Fund’s average daily net assets, and will no longer pay a management fee or contractually limit the Fund’s total annual expenses. Refer to Note 8. |
| (g) | Portfolio turnover rate for periods less than one full year have not been annualized. |
See Notes to Financial Statements.
RiverFront Asset Allocation Growth – Investor Class
Financial Highlights
Selected data for a share of beneficial interest outstanding throughout the periods indicated:
| | | For the Year Ended October 31, 2018(a)(b) | | | For the Year Ended October 31, 2017 | | | For the Year Ended October 31, 2016 | | | For the Year Ended October 31, 2015 | | | For the Fiscal Period Ended October 31, 2014(c) | | | For the Year Ended April 30, 2014 | |
| Net asset value, beginning of period | | $ | 14.12 | | | $ | 11.91 | | | $ | 12.20 | | | $ | 13.14 | | | $ | 12.97 | | | $ | 11.93 | |
| INCOME/(LOSS) FROM INVESTMENT OPERATIONS: | | | | | | | | | |
| Net investment income after reimbursements(d) | | | 0.23 | | | | 0.15 | | | | 0.21 | | | | 0.22 | | | | 0.08 | | | | 0.10 | |
| Net realized and unrealized gain/(loss) | | | (0.91 | ) | | | 2.23 | | | | (0.32 | ) | | | (0.06 | ) | | | 0.09 | | | | 1.36 | |
| Total from investment operations | | | (0.68 | ) | | | 2.38 | | | | (0.11 | ) | | | 0.16 | | | | 0.17 | | | | 1.46 | |
| DISTRIBUTIONS: | | | | | | | | | | | | | | | | | | | | | | | | |
| From net investment income | | | (0.16 | ) | | | (0.17 | ) | | | (0.14 | ) | | | (0.21 | ) | | | – | | | | (0.09 | ) |
| From net realized gains | | | (0.08 | ) | | | – | | | | (0.04 | ) | | | (0.89 | ) | | | – | | | | (0.33 | ) |
| Total distributions | | | (0.24 | ) | | | (0.17 | ) | | | (0.18 | ) | | | (1.10 | ) | | | – | | | | (0.42 | ) |
| Net increase/(decrease) in net asset value | | | (0.92 | ) | | | 2.21 | | | | (0.29 | ) | | | (0.94 | ) | | | 0.17 | | | | 1.04 | |
| Net asset value, end of year | | $ | 13.20 | | | $ | 14.12 | | | $ | 11.91 | | | $ | 12.20 | | | $ | 13.14 | | | $ | 12.97 | |
| TOTAL RETURN(e) | | | (4.93 | )% | | | 20.22 | % | | | (0.88 | )% | | | 1.23 | % | | | 1.31 | % | | | 12.32 | % |
| RATIOS/SUPPLEMENTAL DATA: | | | | | | | | | | | | | | | | | | | | | | | | |
| Net assets, end of year (000s) | | $ | 6,077 | | | $ | 7,452 | | | $ | 6,467 | | | $ | 8,456 | | | $ | 8,372 | | | $ | 9,098 | |
| Ratio of expenses to average net assets excluding fee waivers and reimbursements | | | 0.87 | % | | | 1.52 | % | | | 1.45 | % | | | 1.43 | % | | | 1.50 | %(f) | | | 1.51 | % |
| Ratio of expenses to average net assets including fee waivers and reimbursements | | | 0.72 | %(g) | | | 1.15 | % | | | 1.15 | % | | | 1.15 | % | | | 1.15 | %(f) | | | 1.15 | % |
| Ratio of net investment income to average net assets | | | 1.62 | % | | | 1.14 | % | | | 1.78 | % | | | 1.71 | % | | | 1.21 | %(f) | | | 0.83 | % |
| Portfolio turnover rate(h) | | | 210 | % | | | 56 | % | | | 124 | % | | | 71 | % | | | 47 | % | | | 95 | % |
| (a) | Prior to December 1, 2017, Investor Class was known as Class A. |
| (b) | Prior to February 28, 2018, the RiverFront Asset Allocation Growth was known as the RiverFront Global Allocation Fund. |
| (c) | Effective May 1, 2014, the Board approved changing the fiscal year-end of the Funds from April 30 to October 31. |
| (d) | Calculated using the average shares method. |
| (e) | Total returns are for the period indicated and have not been annualized. Total returns would have been lower had certain expenses not been waived during the period. Returns shown do not reflect the deduction of taxes that a shareholder would pay on Fund distributions or the redemption of Fund shares. Returns shown exclude any applicable sales charges. |
| (g) | Effective February 28, 2018, pursuant to the Administrative Services Agreement, the Fund pays an annual unitary administrative fee, which is based on the Fund’s average daily net assets, and will no longer pay a management fee or contractually limit the Fund’s total annual expenses. Refer to Note 8. |
| (h) | Portfolio turnover rate for periods less than one full year have not been annualized. |
See Notes to Financial Statements.
RiverFront Asset Allocation Growth – Class A
Financial Highlights
Selected data for a share of beneficial interest outstanding throughout the periods indicated:
| | | For the Period June 12, 2018 (Commencement of Operations) to October 31, 2018 | |
| Net asset value, beginning of period | | $ | 14.57 | |
| | | | | |
| INCOME FROM INVESTMENT OPERATIONS: | | | | |
| Net investment income(a) | | | 0.15 | |
| Net realized and unrealized loss | | | (1.52 | ) |
| Total from investment operations | | | (1.37 | ) |
| | | | | |
| Net (decrease) in net asset value | | | (1.37 | ) |
| Net asset value, end of year | | $ | 13.20 | |
| TOTAL RETURN(b) | | | (9.40 | )% |
| | | | | |
| RATIOS/SUPPLEMENTAL DATA: | | | | |
| Net assets, end of year (000s) | | $ | 9 | |
| Ratio of expenses to average net assets excluding fee waivers and reimbursements | | | 0.50 | %(c) |
| Ratio of expenses to average net assets including fee waivers and reimbursements | | | 0.50 | %(c) |
| Ratio of net investment income to average net assets | | | 2.68 | %(c) |
| Portfolio turnover rate(d) | | | 210 | % |
| (a) | Calculated using the average shares method. |
| (b) | Total returns are for the period indicated and have not been annualized. Total returns would have been lower had certain expenses not been waived during the period. Returns shown do not reflect the deduction of taxes that a shareholder would pay on Fund distributions or the redemption of Fund shares. |
| (d) | Portfolio turnover rate for periods less than one full year have not been annualized. |
See Notes to Financial Statements.
RiverFront Asset Allocation Growth – Class C
Financial Highlights
Selected data for a share of beneficial interest outstanding throughout the periods indicated:
| | | For the Year Ended October 31, 2018(a) | | | For the Year Ended October 31, 2017 | | | For the Year Ended October 31, 2016 | | | For the Year Ended October 31, 2015 | | | For the Fiscal Period Ended October 31, 2014(b) | | | For the Year Ended April 30, 2014 | |
| Net asset value, beginning of period | | $ | 13.69 | | | $ | 11.62 | | | $ | 11.98 | | | $ | 12.95 | | | $ | 12.83 | | | $ | 11.84 | |
| INCOME/(LOSS) FROM INVESTMENT OPERATIONS: | | | | | | | | | |
| Net investment income after reimbursements(c) | | | 0.12 | | | | 0.05 | | | | 0.11 | | | | 0.12 | | | | 0.03 | | | | 0.01 | |
| Net realized and unrealized gain/(loss) | | | (0.88 | ) | | | 2.17 | | | | (0.31 | ) | | | (0.06 | ) | | | 0.09 | | | | 1.34 | |
| Total from investment operations | | | (0.76 | ) | | | 2.22 | | | | (0.20 | ) | | | 0.06 | | | | 0.12 | | | | 1.35 | |
| DISTRIBUTIONS: | | | | | | | | | | | | | | | | | | | | | | | | |
| From net investment income | | | (0.14 | ) | | | (0.15 | ) | | | (0.12 | ) | | | (0.14 | ) | | | – | | | | (0.03 | ) |
| From net realized gains | | | (0.08 | ) | | | – | | | | (0.04 | ) | | | (0.89 | ) | | | – | | | | (0.33 | ) |
| Total distributions | | | (0.22 | ) | | | (0.15 | ) | | | (0.16 | ) | | | (1.03 | ) | | | – | | | | (0.36 | ) |
| Net increase/(decrease) in net asset value | | | (0.98 | ) | | | 2.07 | | | | (0.36 | ) | | | (0.97 | ) | | | 0.12 | | | | 0.99 | |
| Net asset value, end of year | | $ | 12.71 | | | $ | 13.69 | | | $ | 11.62 | | | $ | 11.98 | | | $ | 12.95 | | | $ | 12.83 | |
| TOTAL RETURN(d) | | | (5.66 | )% | | | 19.36 | % | | | (1.61 | )% | | | 0.46 | % | | | 0.94 | % | | | 11.48 | % |
| RATIOS/SUPPLEMENTAL DATA: | | | | | | | | | | | | | | | | | | | | | | | | |
| Net assets, end of year (000s) | | $ | 9,738 | | | $ | 11,341 | | | $ | 14,694 | | | $ | 17,089 | | | $ | 14,758 | | | $ | 14,624 | |
| Ratio of expenses to average net assets excluding fee waivers and reimbursements | | | 1.63 | % | | | 2.26 | % | | | 2.20 | % | | | 2.18 | % | | | 2.25 | %(e) | | | 2.26 | % |
| Ratio of expenses to average net assets including fee waivers and reimbursements | | | 1.47 | %(f) | | | 1.90 | % | | | 1.90 | % | | | 1.90 | % | | | 1.90 | %(e) | | | 1.90 | % |
| Ratio of net investment income to average net assets | | | 0.88 | % | | | 0.42 | % | | | 0.95 | % | | | 0.94 | % | | | 0.40 | %(e) | | | 0.05 | % |
| Portfolio turnover rate(g) | | | 210 | % | | | 56 | % | | | 124 | % | | | 71 | % | | | 47 | % | | | 95 | % |
| (a) | Prior to February 28, 2018, the RiverFront Asset Allocation Growth was known as the RiverFront Global Allocation Fund. |
| (b) | Effective May 1, 2014, the Board approved changing the fiscal year-end of the Funds from April 30 to October 31. |
| (c) | Calculated using the average shares method. |
| (d) | Total returns are for the period indicated and have not been annualized. Total returns would have been lower had certain expenses not been waived during the period. Returns shown do not reflect the deduction of taxes that a shareholder would pay on Fund distributions or the redemption of Fund shares. Returns shown exclude any applicable sales charges. |
| (f) | Effective February 28, 2018, pursuant to the Administrative Services Agreement, the Fund pays an annual unitary administrative fee, which is based on the Fund’s average daily net assets, and will no longer pay a management fee or contractually limit the Fund’s total annual expenses. Refer to Note 8. |
| (g) | Portfolio turnover rate for periods less than one full year have not been annualized. |
See Notes to Financial Statements.
RiverFront Asset Allocation Growth – Class I
Financial Highlights
Selected data for a share of beneficial interest outstanding throughout the periods indicated:
| | | For the Year Ended October 31, 2018(a) | | | For the Year Ended October 31, 2017 | | | For the Year Ended October 31, 2016 | | | For the Year Ended October 31, 2015 | | | For the Fiscal Period Ended October 31, 2014(b) | | | For the Year Ended April 30, 2014 | |
| Net asset value, beginning of period | | $ | 13.94 | | | $ | 11.73 | | | $ | 11.99 | | | $ | 12.92 | | | $ | 12.75 | | | $ | 11.72 | |
| INCOME/(LOSS) FROM INVESTMENT OPERATIONS: | | | |
| Net investment income after reimbursements(c) | | | 0.26 | | | | 0.18 | | | | 0.22 | | | | 0.22 | | | | 0.09 | | | | 0.13 | |
| Net realized and unrealized gain/(loss) | | | (0.91 | ) | | | 2.20 | | | | (0.30 | ) | | | (0.04 | ) | | | 0.08 | | | | 1.34 | |
| Total from investment operations | | | (0.65 | ) | | | 2.38 | | | | (0.08 | ) | | | 0.18 | | | | 0.17 | | | | 1.47 | |
| DISTRIBUTIONS: | | | | | | | | | | | | | | | | | | | | | | | | |
| From net investment income | | | (0.16 | ) | | | (0.17 | ) | | | (0.14 | ) | | | (0.22 | ) | | | – | | | | (0.11 | ) |
| From net realized gains | | | (0.08 | ) | | | – | | | | (0.04 | ) | | | (0.89 | ) | | | – | | | | (0.33 | ) |
| Total distributions | | | (0.24 | ) | | | (0.17 | ) | | | (0.18 | ) | | | (1.11 | ) | | | – | | | | (0.44 | ) |
| Net increase/(decrease) in net asset value | | | (0.89 | ) | | | 2.21 | | | | (0.26 | ) | | | (0.93 | ) | | | 0.17 | | | | 1.03 | |
| Net asset value, end of year | | $ | 13.05 | | | $ | 13.94 | | | $ | 11.73 | | | $ | 11.99 | | | $ | 12.92 | | | $ | 12.75 | |
| TOTAL RETURN(d) | | | (4.74 | )% | | | 20.58 | % | | | (0.60 | )% | | | 1.49 | % | | | 1.33 | % | | | 12.61 | % |
| RATIOS/SUPPLEMENTAL DATA: | | | | | | | | | | | | | | | | | | | | | | | | |
| Net assets, end of year (000s) | | $ | 13,339 | | | $ | 15,126 | | | $ | 14,240 | | | $ | 18,739 | | | $ | 12,895 | | | $ | 10,521 | |
| Ratio of expenses to average net assets excluding fee waivers and reimbursements | | | 0.62 | % | | | 1.27 | % | | | 1.20 | % | | | 1.18 | % | | | 1.26 | %(e) | | | 1.26 | % |
| Ratio of expenses to average net assets including fee waivers and reimbursements | | | 0.47 | %(f) | | | 0.90 | % | | | 0.90 | % | | | 0.90 | % | | | 0.90 | %(e) | | | 0.90 | % |
| Ratio of net investment income to average net assets | | | 1.87 | % | | | 1.39 | % | | | 1.94 | % | | | 1.83 | % | | | 1.41 | %(e) | | | 1.07 | % |
| Portfolio turnover rate(g) | | | 210 | % | | | 56 | % | | | 124 | % | | | 71 | % | | | 47 | % | | | 95 | % |
| (a) | Prior to February 28, 2018, the RiverFront Asset Allocation Growth was known as the RiverFront Global Allocation Fund. |
| (b) | Effective May 1, 2014, the Board approved changing the fiscal year-end of the Funds from April 30 to October 31. |
| (c) | Calculated using the average shares method. |
| (d) | Total returns are for the period indicated and have not been annualized. Total returns would have been lower had certain expenses not been waived during the period. Returns shown do not reflect the deduction of taxes that a shareholder would pay on Fund distributions or the redemption of Fund shares. |
| (f) | Effective February 28, 2018, pursuant to the Administrative Services Agreement, the Fund pays an annual unitary administrative fee, which is based on the Fund’s average daily net assets, and will no longer pay a management fee or contractually limit the Fund’s total annual expenses. Refer to Note 8. |
| (g) | Portfolio turnover rate for periods less than one full year have not been annualized. |
See Notes to Financial Statements.
RiverFront Asset Allocation Growth & Income – Investor Class
Financial Highlights
Selected data for a share of beneficial interest outstanding throughout the periods indicated:
| | | For the Year Ended October 31, 2018(a)(b) | | | For the Year Ended October 31, 2017 | | | For the Year Ended October 31, 2016 | | | For the Year Ended October 31, 2015 | | | For the Fiscal Period Ended October 31, 2014(c) | | | For the Year Ended April 30, 2014 | |
| Net asset value, beginning of period | | $ | 14.48 | | | $ | 12.38 | | | $ | 12.63 | | | $ | 13.10 | | | $ | 12.97 | | | $ | 12.24 | |
| INCOME/(LOSS) FROM INVESTMENT OPERATIONS: | | | | | | | | | | | | | | | | | | | | | | | | |
| Net investment income after reimbursements(d) | | | 0.25 | | | | 0.17 | | | | 0.21 | | | | 0.25 | | | | 0.09 | | | | 0.17 | |
| Net realized and unrealized gain/(loss) | | | (0.80 | ) | | | 2.09 | | | | (0.00 | )(e) | | | (0.04 | ) | | | 0.13 | | | | 1.17 | |
| Total from investment operations | | | (0.55 | ) | | | 2.26 | | | | 0.21 | | | | 0.21 | | | | 0.22 | | | | 1.34 | |
| DISTRIBUTIONS: | | | | | | | | | | | | | | | | | | | | | | | | |
| From net investment income | | | (0.24 | ) | | | (0.16 | ) | | | (0.21 | ) | | | (0.22 | ) | | | (0.09 | ) | | | (0.17 | ) |
| From net realized gains | | | (0.32 | ) | | | – | | | | (0.25 | ) | | | (0.46 | ) | | | – | | | | (0.44 | ) |
| Total distributions | | | (0.56 | ) | | | (0.16 | ) | | | (0.46 | ) | | | (0.68 | ) | | | (0.09 | ) | | | (0.61 | ) |
| Net increase/(decrease) in net asset value | | | (1.11 | ) | | | 2.10 | | | | (0.25 | ) | | | (0.47 | ) | | | 0.13 | | | | 0.73 | |
| Net asset value, end of year | | $ | 13.37 | | | $ | 14.48 | | | $ | 12.38 | | | $ | 12.63 | | | $ | 13.10 | | | $ | 12.97 | |
| TOTAL RETURN(f) | | | (4.03 | )% | | | 18.37 | % | | | 1.80 | % | | | 1.64 | % | | | 1.66 | % | | | 11.15 | % |
| RATIOS/SUPPLEMENTAL DATA: | | | | | | | | | | | | | | | | | | | | | | | | |
| Net assets, end of year (000s) | | $ | 9,062 | | | $ | 19,123 | | | $ | 20,227 | | | $ | 19,769 | | | $ | 17,275 | | | $ | 15,374 | |
| Ratio of expenses to average net assets excluding fee waivers and reimbursements | | | 0.85 | % | | | 1.37 | % | | | 1.35 | % | | | 1.35 | % | | | 1.39 | %(g) | | | 1.42 | % |
| Ratio of expenses to average net assets including fee waivers and reimbursements | | | 0.74 | %(h) | | | 1.15 | % | | | 1.15 | % | | | 1.15 | % | | | 1.15 | %(g) | | | 1.15 | % |
| Ratio of net investment income to average net assets | | | 1.70 | % | | | 1.24 | % | | | 1.74 | % | | | 1.98 | % | | | 1.33 | %(g) | | | 1.38 | % |
| Portfolio turnover rate(i) | | | 224 | % | | | 63 | % | | | 129 | % | | | 75 | % | | | 45 | % | | | 99 | % |
| (a) | Prior to December 1, 2017, Investor Class was known as Class A. |
| (b) | Prior to February 28, 2018, the RiverFront Asset Allocation Growth & Income was known as the RiverFront Dynamic Equity Income Fund. |
| (c) | Effective May 1, 2014, the Board approved changing the fiscal year-end of the Funds from April 30 to October 31. |
| (d) | Calculated using the average shares method. |
| (e) | Less than $0.005 or ($0.005) per share. |
| (f) | Total returns are for the period indicated and have not been annualized. Total returns would have been lower had certain expenses not been waived during the period. Returns shown do not reflect the deduction of taxes that a shareholder would pay on Fund distributions or the redemption of Fund shares. Returns shown exclude any applicable sales charges. |
| (h) | Effective February 28, 2018, pursuant to the Administrative Services Agreement, the Fund pays an annual unitary administrative fee, which is based on the Fund’s average daily net assets, and will no longer pay a management fee or contractually limit the Fund’s total annual expenses. Refer to Note 8. |
| (i) | Portfolio turnover rate for periods less than one full year have not been annualized. |
See Notes to Financial Statements.
RiverFront Asset Allocation Growth & Income – Class A
Financial Highlights
Selected data for a share of beneficial interest outstanding throughout the periods indicated:
| | | For the Period June 12, 2018 (Commencement of Operations) to October 31, 2018 | |
| Net asset value, beginning of period | | $ | 14.70 | |
| | | | | |
| INCOME FROM INVESTMENT OPERATIONS: | | | | |
| Net investment income(a) | | | 0.15 | |
| Net realized and unrealized loss | | | (1.34 | ) |
| Total from investment operations | | | (1.19 | ) |
| | | | | |
| DISTRIBUTIONS: | | | | |
| From net investment income | | | (0.15 | ) |
| Total distributions | | | (0.15 | ) |
| | | | | |
| Net (decrease) in net asset value | | | (1.34 | ) |
| Net asset value, end of year | | $ | 13.36 | |
| TOTAL RETURN(b) | | | (8.13 | )% |
| | | | | |
| RATIOS/SUPPLEMENTAL DATA: | | | | |
| Net assets, end of year (000s) | | $ | 13 | |
| Ratio of expenses to average net assets excluding fee waivers and reimbursements | | | 0.50 | %(c) |
| Ratio of expenses to average net assets including fee waivers and reimbursements | | | 0.50 | %(c) |
| Ratio of net investment income to average net assets | | | 2.65 | %(c) |
| Portfolio turnover rate(d) | | | 224 | % |
| (a) | Calculated using the average shares method. |
| (b) | Total returns are for the period indicated and have not been annualized. Total returns would have been lower had certain expenses not been waived during the period. Returns shown do not reflect the deduction of taxes that a shareholder would pay on Fund distributions or the redemption of Fund shares. |
| (d) | Portfolio turnover rate for periods less than one full year have not been annualized. |
See Notes to Financial Statements.
RiverFront Asset Allocation Growth & Income – Class C
Financial Highlights
Selected data for a share of beneficial interest outstanding throughout the periods indicated:
| | | For the Year Ended October 31, 2018(a) | | | For the Year Ended October 31, 2017 | | | For the Year Ended October 31, 2016 | | | For the Year Ended October 31, 2015 | | | For the Fiscal Period Ended October 31, 2014(b) | | | For the Year Ended April 30, 2014 | |
| Net asset value, beginning of period | | $ | 14.16 | | | $ | 12.15 | | | $ | 12.44 | | | $ | 12.97 | | | $ | 12.84 | | | $ | 12.13 | |
| INCOME/(LOSS) FROM INVESTMENT OPERATIONS: | | | | | | | | | | | | | | | | | | | | | | | | |
| Net investment income after reimbursements(c) | | | 0.14 | | | | 0.07 | | | | 0.13 | | | | 0.15 | | | | 0.04 | | | | 0.08 | |
| Net realized and unrealized gain/(loss) | | | (0.78 | ) | | | 2.05 | | | | (0.02 | ) | | | (0.04 | ) | | | 0.13 | | | | 1.15 | |
| Total from investment operations | | | (0.64 | ) | | | 2.12 | | | | 0.11 | | | | 0.11 | | | | 0.17 | | | | 1.23 | |
| DISTRIBUTIONS: | | | | | | | | | | | | | | | | | | | | | | | | |
| From net investment income | | | (0.17 | ) | | | (0.11 | ) | | | (0.15 | ) | | | (0.18 | ) | | | (0.04 | ) | | | (0.08 | ) |
| From net realized gains | | | (0.32 | ) | | | – | | | | (0.25 | ) | | | (0.46 | ) | | | – | | | | (0.44 | ) |
| Total distributions | | | (0.49 | ) | | | (0.11 | ) | | | (0.40 | ) | | | (0.64 | ) | | | (0.04 | ) | | | (0.52 | ) |
| Net increase/(decrease) in net asset value | | | (1.13 | ) | | | 2.01 | | | | (0.29 | ) | | | (0.53 | ) | | | 0.13 | | | | 0.71 | |
| Net asset value, end of year | | $ | 13.03 | | | $ | 14.16 | | | $ | 12.15 | | | $ | 12.44 | | | $ | 12.97 | | | $ | 12.84 | |
| TOTAL RETURN(d) | | | (4.74 | )% | | | 17.53 | % | | | 0.97 | % | | | 0.86 | % | | | 1.30 | % | | | 10.34 | % |
| RATIOS/SUPPLEMENTAL DATA: | | | | | | | | | | | | | | | | | | | | | | | | |
| Net assets, end of year (000s) | | $ | 23,111 | | | $ | 26,514 | | | $ | 32,217 | | | $ | 34,766 | | | $ | 30,170 | | | $ | 25,787 | |
| Ratio of expenses to average net assets excluding fee waivers and reimbursements | | | 1.57 | % | | | 2.12 | % | | | 2.10 | % | | | 2.10 | % | | | 2.15 | %(e) | | | 2.18 | % |
| Ratio of expenses to average net assets including fee waivers and reimbursements | | | 1.47 | %(f) | | | 1.90 | % | | | 1.90 | % | | | 1.90 | % | | | 1.90 | %(e) | | | 1.90 | % |
| Ratio of net investment income to average net assets | | | 1.01 | % | | | 0.51 | % | | | 1.08 | % | | | 1.18 | % | | | 0.60 | %(e) | | | 0.61 | % |
| Portfolio turnover rate(g) | | | 224 | % | | | 63 | % | | | 129 | % | | | 75 | % | | | 45 | % | | | 99 | % |
| (a) | Prior to February 28, 2018, the RiverFront Asset Allocation Growth & Income was known as the RiverFront Dynamic Equity Income Fund. |
| (b) | Effective May 1, 2014, the Board approved changing the fiscal year-end of the Funds from April 30 to October 31. |
| (c) | Calculated using the average shares method. |
| (d) | Total returns are for the period indicated and have not been annualized. Total returns would have been lower had certain expenses not been waived during the period. Returns shown do not reflect the deduction of taxes that a shareholder would pay on Fund distributions or the redemption of Fund shares. Returns shown exclude any applicable sales charges. |
| (f) | Effective February 28, 2018, pursuant to the Administrative Services Agreement, the Fund pays an annual unitary administrative fee, which is based on the Fund’s average daily net assets, and will no longer pay a management fee or contractually limit the Fund’s total annual expenses. Refer to Note 8. |
| (g) | Portfolio turnover rate for periods less than one full year have not been annualized. |
See Notes to Financial Statements.
RiverFront Asset Allocation Growth & Income – Class I
Financial Highlights
Selected data for a share of beneficial interest outstanding throughout the periods indicated:
| | | For the Year Ended October 31, 2018(a) | | | For the Year Ended October 31, 2017 | | | For the Year Ended October 31, 2016 | | | For the Year Ended October 31, 2015 | | | For the Fiscal Period Ended October 31, 2014(b) | | | For the Year Ended April 30, 2014 | |
| Net asset value, beginning of period | | $ | 14.42 | | | $ | 12.31 | | | $ | 12.56 | | | $ | 13.02 | | | $ | 12.88 | | | $ | 12.16 | |
| INCOME/(LOSS) FROM INVESTMENT OPERATIONS: | | | | | | | | | | | | | | | | | | | | | | | | |
| Net investment income after reimbursements(c) | | | 0.29 | | | | 0.20 | | | | 0.25 | | | | 0.28 | | | | 0.10 | | | | 0.20 | |
| Net realized and unrealized gain/(loss) | | | (0.82 | ) | | | 2.09 | | | | (0.01 | ) | | | (0.05 | ) | | | 0.14 | | | | 1.16 | |
| Total from investment operations | | | (0.53 | ) | | | 2.29 | | | | 0.24 | | | | 0.23 | | | | 0.24 | | | | 1.36 | |
| DISTRIBUTIONS: | | | | | | | | | | | | | | | | | | | | | | | | |
| From net investment income | | | (0.26 | ) | | | (0.18 | ) | | | (0.24 | ) | | | (0.23 | ) | | | (0.10 | ) | | | (0.20 | ) |
| From net realized gains | | | (0.32 | ) | | | – | | | | (0.25 | ) | | | (0.46 | ) | | | – | | | | (0.44 | ) |
| Total distributions | | | (0.58 | ) | | | (0.18 | ) | | | (0.49 | ) | | | (0.69 | ) | | | (0.10 | ) | | | (0.64 | ) |
| Net increase/(decrease) in net asset value | | | (1.11 | ) | | | 2.11 | | | | (0.25 | ) | | | (0.46 | ) | | | 0.14 | | | | 0.72 | |
| Net asset value, end of year | | $ | 13.31 | | | $ | 14.42 | | | $ | 12.31 | | | $ | 12.56 | | | $ | 13.02 | | | $ | 12.88 | |
| TOTAL RETURN(d) | | | (3.88 | )% | | | 18.75 | % | | | 2.01 | % | | | 1.83 | % | | | 1.88 | % | | | 11.40 | % |
| RATIOS/SUPPLEMENTAL DATA: | | | | | | | | | | | | | | | | | | | | | | | | |
| Net assets, end of year (000s) | | $ | 51,749 | | | $ | 33,484 | | | $ | 28,833 | | | $ | 22,780 | | | $ | 20,997 | | | $ | 18,254 | |
| Ratio of expenses to average net assets excluding fee waivers and reimbursements | | | 0.53 | % | | | 1.12 | % | | | 1.10 | % | | | 1.10 | % | | | 1.15 | %(e) | | | 1.17 | % |
| Ratio of expenses to average net assets including fee waivers and reimbursements | | | 0.44 | %(f) | | | 0.90 | % | | | 0.90 | % | | | 0.90 | % | | | 0.90 | %(e) | | | 0.90 | % |
| Ratio of net investment income to average net assets | | | 2.04 | % | | | 1.50 | % | | | 2.06 | % | | | 2.21 | % | | | 1.57 | %(e) | | | 1.61 | % |
| Portfolio turnover rate(g) | | | 224 | % | | | 63 | % | | | 129 | % | | | 75 | % | | | 45 | % | | | 99 | % |
| (a) | Prior to February 28, 2018, the RiverFront Asset Allocation Growth & Income was known as the RiverFront Dynamic Equity Income Fund. |
| (b) | Effective May 1, 2014, the Board approved changing the fiscal year-end of the Funds from April 30 to October 31. |
| (c) | Calculated using the average shares method. |
| (d) | Total returns are for the period indicated and have not been annualized. Total returns would have been lower had certain expenses not been waived during the period. Returns shown do not reflect the deduction of taxes that a shareholder would pay on Fund distributions or the redemption of Fund shares. |
| (f) | Effective February 28, 2018, pursuant to the Administrative Services Agreement, the Fund pays an annual unitary administrative fee, which is based on the Fund’s average daily net assets, and will no longer pay a management fee or contractually limit the Fund’s total annual expenses. Refer to Note 8. |
| (g) | Portfolio turnover rate for periods less than one full year have not been annualized. |
See Notes to Financial Statements.
RiverFront Asset Allocation Moderate – Investor Class
Financial Highlights
Selected data for a share of beneficial interest outstanding throughout the periods indicated:
| | | For the Year Ended October 31, 2018(a)(b) | | | For the Year Ended October 31, 2017 | | | For the Year Ended October 31, 2016 | | | For the Year Ended October 31, 2015 | | | For the Fiscal Period Ended October 31, 2014(c) | | | For the Year Ended April 30, 2014 | |
| Net asset value, beginning of period | | $ | 12.47 | | | $ | 11.22 | | | $ | 11.48 | | | $ | 12.15 | | | $ | 11.99 | | | $ | 11.66 | |
| INCOME/(LOSS) FROM INVESTMENT OPERATIONS: | | | | | | | | | | | | | | | | | | | | | | | | |
| Net investment income after reimbursements(d) | | | 0.22 | | | | 0.18 | | | | 0.21 | | | | 0.23 | | | | 0.09 | | | | 0.16 | |
| Net realized and unrealized gain/(loss) | | | (0.36 | ) | | | 1.23 | | | | (0.01 | ) | | | (0.06 | ) | | | 0.16 | | | | 0.89 | |
| Total from investment operations | | | (0.14 | ) | | | 1.41 | | | | 0.20 | | | | 0.17 | | | | 0.25 | | | | 1.05 | |
| DISTRIBUTIONS: | | | | | | | | | | | | | | | | | | | | | | | | |
| From net investment income | | | (0.22 | ) | | | (0.16 | ) | | | (0.21 | ) | | | (0.20 | ) | | | (0.09 | ) | | | (0.16 | ) |
| From net realized gains | | | (0.57 | ) | | | – | | | | (0.25 | ) | | | (0.64 | ) | | | – | | | | (0.56 | ) |
| Total distributions | | | (0.79 | ) | | | (0.16 | ) | | | (0.46 | ) | | | (0.84 | ) | | | (0.09 | ) | | | (0.72 | ) |
| Net increase/(decrease) in net asset value | | | (0.93 | ) | | | 1.25 | | | | (0.26 | ) | | | (0.67 | ) | | | 0.16 | | | | 0.33 | |
| Net asset value, end of year | | $ | 11.54 | | | $ | 12.47 | | | $ | 11.22 | | | $ | 11.48 | | | $ | 12.15 | | | $ | 11.99 | |
| TOTAL RETURN(e) | | | (1.32 | )% | | | 12.67 | % | | | 1.81 | % | | | 1.33 | % | | | 2.12 | % | | | 9.16 | % |
| RATIOS/SUPPLEMENTAL DATA: | | | | | | | | | | | | | | | | | | | | | | | | |
| Net assets, end of year (000s) | | $ | 8,244 | | | $ | 13,311 | | | $ | 22,679 | | | $ | 24,402 | | | $ | 27,598 | | | $ | 31,033 | |
| Ratio of expenses to average net assets excluding fee waivers and reimbursements | | | 0.84 | % | | | 1.33 | % | | | 1.31 | % | | | 1.30 | % | | | 1.31 | %(f) | | | 1.32 | % |
| Ratio of expenses to average net assets including fee waivers and reimbursements | | | 0.74 | %(g) | | | 1.15 | % | | | 1.15 | % | | | 1.15 | % | | | 1.15 | %(f) | | | 1.15 | % |
| Ratio of net investment income to average net assets | | | 1.78 | % | | | 1.49 | % | | | 1.87 | % | | | 1.97 | % | | | 1.54 | %(f) | | | 1.35 | % |
| Portfolio turnover rate(h) | | | 209 | % | | | 56 | % | | | 132 | % | | | 110 | % | | | 42 | % | | | 98 | % |
| (a) | Prior to December 1, 2017, Investor Class was known as Class A. |
| (b) | Prior to February 28, 2018, the RiverFront Asset Allocation Moderate was known as the RiverFront Moderate Growth & Income Fund. |
| (c) | Effective May 1, 2014, the Board approved changing the fiscal year-end of the Funds from April 30 to October 31. |
| (d) | Calculated using the average shares method. |
| (e) | Total returns are for the period indicated and have not been annualized. Total returns would have been lower had certain expenses not been waived during the period. Returns shown do not reflect the deduction of taxes that a shareholder would pay on Fund distributions or the redemption of Fund shares. Returns shown exclude any applicable sales charges. |
| (g) | Effective February 28, 2018, pursuant to the Administrative Services Agreement, the Fund pays an annual unitary administrative fee, which is based on the Fund’s average daily net assets, and will no longer pay a management fee or contractually limit the Fund’s total annual expenses. Refer to Note 8. |
| (h) | Portfolio turnover rate for periods less than one full year have not been annualized. |
See Notes to Financial Statements.
RiverFront Asset Allocation Moderate – Class A
Financial Highlights
Selected data for a share of beneficial interest outstanding throughout the periods indicated:
| | | For the Period June 12, 2018 (Commencement of Operations) to October 31, 2018 | |
| Net asset value, beginning of period | | $ | 12.28 | |
| | | | | |
| INCOME FROM INVESTMENT OPERATIONS: | | | | |
| Net investment income(a) | | | 0.11 | |
| Net realized and unrealized loss | | | (0.74 | ) |
| Total from investment operations | | | (0.63 | ) |
| | | | | |
| DISTRIBUTIONS: | | | | |
| From net investment income | | | (0.12 | ) |
| Total distributions | | | (0.12 | ) |
| | | | | |
| Net (decrease) in net asset value | | | (0.75 | ) |
| Net asset value, end of year | | $ | 11.53 | |
| TOTAL RETURN(b) | | | (5.15 | )% |
| | | | | |
| RATIOS/SUPPLEMENTAL DATA: | | | | |
| Net assets, end of year (000s) | | $ | 9 | |
| Ratio of expenses to average net assets excluding fee waivers and reimbursements | | | 0.50 | %(c) |
| Ratio of expenses to average net assets including fee waivers and reimbursements | | | 0.50 | %(c) |
| Ratio of net investment income to average net assets | | | 2.44 | %(c) |
| Portfolio turnover rate(d) | | | 209 | % |
| (a) | Calculated using the average shares method. |
| (b) | Total returns are for the period indicated and have not been annualized. Total returns would have been lower had certain expenses not been waived during the period. Returns shown do not reflect the deduction of taxes that a shareholder would pay on Fund distributions or the redemption of Fund shares. |
| (d) | Portfolio turnover rate for periods less than one full year have not been annualized. |
See Notes to Financial Statements.
RiverFront Asset Allocation Moderate – Class C
Financial Highlights
Selected data for a share of beneficial interest outstanding throughout the periods indicated:
| | | For the Year Ended October 31, 2018(a) | | | For the Year Ended October 31, 2017 | | | For the Year Ended October 31, 2016 | | | For the Year Ended October 31, 2015 | | | For the Fiscal Period Ended October 31, 2014(b) | | | For the Year Ended April 30, 2014 | |
| Net asset value, beginning of period | | $ | 12.34 | | | $ | 11.12 | | | $ | 11.39 | | | $ | 12.10 | | | $ | 11.94 | | | $ | 11.62 | |
| INCOME/(LOSS) FROM INVESTMENT OPERATIONS: | | | | | | | | | | | | | | | | | | | | | | | | |
| Net investment income after reimbursements(c) | | | 0.12 | | | | 0.08 | | | | 0.13 | | | | 0.13 | | | | 0.05 | | | | 0.07 | |
| Net realized and unrealized gain/(loss) | | | (0.36 | ) | | | 1.24 | | | | (0.02 | ) | | | (0.06 | ) | | | 0.16 | | | | 0.89 | |
| Total from investment operations | | | (0.24 | ) | | | 1.32 | | | | 0.11 | | | | 0.07 | | | | 0.21 | | | | 0.96 | |
| DISTRIBUTIONS: | | | | | | | | | | | | | | | | | | | | | | | | |
| From net investment income | | | (0.14 | ) | | | (0.10 | ) | | | (0.13 | ) | | | (0.14 | ) | | | (0.05 | ) | | | (0.08 | ) |
| From net realized gains | | | (0.57 | ) | | | – | | | | (0.25 | ) | | | (0.64 | ) | | | – | | | | (0.56 | ) |
| Total distributions | | | (0.71 | ) | | | (0.10 | ) | | | (0.38 | ) | | | (0.78 | ) | | | (0.05 | ) | | | (0.64 | ) |
| Net increase/(decrease) in net asset value | | | (0.95 | ) | | | 1.22 | | | | (0.27 | ) | | | (0.71 | ) | | | 0.16 | | | | 0.32 | |
| Net asset value, end of year | | $ | 11.39 | | | $ | 12.34 | | | $ | 11.12 | | | $ | 11.39 | | | $ | 12.10 | | | $ | 11.94 | |
| TOTAL RETURN(d) | | | (2.16 | )% | | | 11.94 | % | | | 1.03 | % | | | 0.52 | % | | | 1.75 | % | | | 8.33 | % |
| RATIOS/SUPPLEMENTAL DATA: | | | | | | | | | | | | | | | | | | | | | | | | |
| Net assets, end of year (000s) | | $ | 40,792 | | | $ | 51,231 | | | $ | 63,480 | | | $ | 70,771 | | | $ | 66,445 | | | $ | 63,031 | |
| Ratio of expenses to average net assets excluding fee waivers and reimbursements | | | 1.56 | % | | | 2.08 | % | | | 2.06 | % | | | 2.05 | % | | | 2.07 | %(e) | | | 2.07 | % |
| Ratio of expenses to average net assets including fee waivers and reimbursements | | | 1.47 | %(f) | | | 1.90 | % | | | 1.90 | % | | | 1.90 | % | | | 1.90 | %(e) | | | 1.90 | % |
| Ratio of net investment income to average net assets | | | 1.03 | % | | | 0.70 | % | | | 1.14 | % | | | 1.14 | % | | | 0.77 | %(e) | | | 0.59 | % |
| Portfolio turnover rate(g) | | | 209 | % | | | 56 | % | | | 132 | % | | | 110 | % | | | 42 | % | | | 98 | % |
| (a) | Prior to February 28, 2018, the RiverFront Asset Allocation Moderate was known as the RiverFront Moderate Growth & Income Fund. |
| (b) | Effective May 1, 2014, the Board approved changing the fiscal year-end of the Funds from April 30 to October 31. |
| (c) | Calculated using the average shares method. |
| (d) | Total returns are for the period indicated and have not been annualized. Total returns would have been lower had certain expenses not been waived during the period. Returns shown do not reflect the deduction of taxes that a shareholder would pay on Fund distributions or the redemption of Fund shares. Returns shown exclude any applicable sales charges. |
| (f) | Effective February 28, 2018, pursuant to the Administrative Services Agreement, the Fund pays an annual unitary administrative fee, which is based on the Fund’s average daily net assets, and will no longer pay a management fee or contractually limit the Fund’s total annual expenses. Refer to Note 8. |
| (g) | Portfolio turnover rate for periods less than one full year have not been annualized. |
See Notes to Financial Statements.
RiverFront Asset Allocation Moderate – Class I
Financial Highlights
Selected data for a share of beneficial interest outstanding throughout the periods indicated:
| | | For the Year Ended October 31, 2018(a) | | | For the Year Ended October 31, 2017 | | | For the Year Ended October 31, 2016 | | | For the Year Ended October 31, 2015 | | | For the Fiscal Period Ended October 31, 2014(b) | | | For the Year Ended April 30, 2014 | |
| Net asset value, beginning of period | | $ | 12.48 | | | $ | 11.21 | | | $ | 11.47 | | | $ | 12.14 | | | $ | 11.98 | | | $ | 11.65 | |
| INCOME/(LOSS) FROM INVESTMENT OPERATIONS: | | | | | | | | | | | | | | | | | | | | | | | | |
| Net investment income after reimbursements(c) | | | 0.25 | | | | 0.20 | | | | 0.24 | | | | 0.25 | | | | 0.11 | | | | 0.19 | |
| Net realized and unrealized gain/(loss) | | | (0.37 | ) | | | 1.25 | | | | (0.01 | ) | | | (0.06 | ) | | | 0.16 | | | | 0.89 | |
| Total from investment operations | | | (0.12 | ) | | | 1.45 | | | | 0.23 | | | | 0.19 | | | | 0.27 | | | | 1.08 | |
| DISTRIBUTIONS: | | | | | | | | | | | | | | | | | | | | | | | | |
| From net investment income | | | (0.25 | ) | | | (0.18 | ) | | | (0.24 | ) | | | (0.22 | ) | | | (0.11 | ) | | | (0.19 | ) |
| From net realized gains | | | (0.57 | ) | | | – | | | | (0.25 | ) | | | (0.64 | ) | | | – | | | | (0.56 | ) |
| Total distributions | | | (0.82 | ) | | | (0.18 | ) | | | (0.49 | ) | | | (0.86 | ) | | | (0.11 | ) | | | (0.75 | ) |
| Net increase/(decrease) in net asset value | | | (0.94 | ) | | | 1.27 | | | | (0.26 | ) | | | (0.67 | ) | | | 0.16 | | | | 0.33 | |
| Net asset value, end of year | | $ | 11.54 | | | $ | 12.48 | | | $ | 11.21 | | | $ | 11.47 | | | $ | 12.14 | | | $ | 11.98 | |
| TOTAL RETURN(d) | | | (1.16 | )% | | | 13.05 | % | | | 2.05 | % | | | 1.50 | % | | | 2.25 | % | | | 9.43 | % |
| RATIOS/SUPPLEMENTAL DATA: | | | | | | | | | | | | | | | | | | | | | | | | |
| Net assets, end of year (000s) | | $ | 28,228 | | | $ | 30,913 | | | $ | 43,056 | | | $ | 46,350 | | | $ | 42,081 | | | $ | 37,832 | |
| Ratio of expenses to average net assets excluding fee waivers and reimbursements | | | 0.56 | % | | | 1.08 | % | | | 1.06 | % | | | 1.05 | % | | | 1.07 | %(e) | | | 1.07 | % |
| Ratio of expenses to average net assets including fee waivers and reimbursements | | | 0.47 | %(f) | | | 0.90 | % | | | 0.90 | % | | | 0.90 | % | | | 0.90 | %(e) | | | 0.90 | % |
| Ratio of net investment income to average net assets | | | 2.02 | % | | | 1.71 | % | | | 2.16 | % | | | 2.16 | % | | | 1.77 | %(e) | | | 1.59 | % |
| Portfolio turnover rate(g) | | | 209 | % | | | 56 | % | | | 132 | % | | | 110 | % | | | 42 | % | | | 98 | % |
| (a) | Prior to February 28, 2018, the RiverFront Asset Allocation Moderate was known as the RiverFront Moderate Growth & Income Fund. |
| (b) | Effective May 1, 2014, the Board approved changing the fiscal year-end of the Funds from April 30 to October 31. |
| (c) | Calculated using the average shares method. |
| (d) | Total returns are for the period indicated and have not been annualized. Total returns would have been lower had certain expenses not been waived during the period. Returns shown do not reflect the deduction of taxes that a shareholder would pay on Fund distributions or the redemption of Fund shares. |
| (f) | Effective February 28, 2018, pursuant to the Administrative Services Agreement, the Fund pays an annual unitary administrative fee, which is based on the Fund’s average daily net assets, and will no longer pay a management fee or contractually limit the Fund’s total annual expenses. Refer to Note 8. |
| (g) | Portfolio turnover rate for periods less than one full year have not been annualized. |
See Notes to Financial Statements.
RiverFront Asset Allocation Income & Growth – Investor Class
Financial Highlights
Selected data for a share of beneficial interest outstanding throughout the periods indicated:
| | | For the Year Ended October 31, 2018 (a)(b) | | | For the Year Ended October 31, 2017 | | | For the Year Ended October 31, 2016 | | | For the Year Ended October 31, 2015 | | | For the Fiscal Period Ended October 31, 2014 (c) | | | For the Year Ended April 30, 2014 | |
| Net asset value, beginning of period | | $ | 11.25 | | | $ | 10.53 | | | $ | 10.46 | | | $ | 10.86 | | | $ | 10.83 | | | $ | 10.48 | |
| | | | | | | | | | | | | | | | | | | | | | | | | |
| INCOME FROM INVESTMENT OPERATIONS: | | | | | | | | | | | | | | | | | | | | | | | | |
| Net investment income(d) | | | 0.22 | | | | 0.16 | | | | 0.18 | | | | 0.18 | | | | 0.07 | | | | 0.13 | |
| Net realized and unrealized gain/(loss) | | | (0.41 | ) | | | 0.71 | | | | 0.07 | | | | (0.14 | ) | | | 0.04 | | | | 0.53 | |
| Total from investment operations | | | (0.19 | ) | | | 0.87 | | | | 0.25 | | | | 0.04 | | | | 0.11 | | | | 0.66 | |
| | | | | | | | | | | | | | | | | | | | | | | | | |
| DISTRIBUTIONS: | | | | | | | | | | | | | | | | | | | | | | | | |
| From net investment income | | | (0.21 | ) | | | (0.15 | ) | | | (0.16 | ) | | | (0.15 | ) | | | (0.08 | ) | | | (0.12 | ) |
| From net realized gains | | | (0.18 | ) | | | – | | | | (0.02 | ) | | | (0.29 | ) | | | – | | | | (0.19 | ) |
| Total distributions | | | (0.39 | ) | | | (0.15 | ) | | | (0.18 | ) | | | (0.44 | ) | | | (0.08 | ) | | | (0.31 | ) |
| | | | | | | | | | | | | | | | | | | | | | | | | |
| Net increase/(decrease) in net asset value | | | (0.58 | ) | | | 0.72 | | | | 0.07 | | | | (0.40 | ) | | | 0.03 | | | | 0.35 | |
| Net asset value, end of year | | $ | 10.67 | | | $ | 11.25 | | | $ | 10.53 | | | $ | 10.46 | | | $ | 10.86 | | | $ | 10.83 | |
| TOTAL RETURN(e) | | | (1.79 | )% | | | 8.33 | % | | | 2.47 | % | | | 0.40 | % | | | 0.98 | % | | | 6.35 | % |
| | | | | | | | | | | | | | | | | | | | | | | | | |
| RATIOS/SUPPLEMENTAL DATA: | | | | | | | | | | | | | | | | | | | | | | | | |
| Net assets, end of year (000s) | | $ | 170 | | | $ | 1,133 | | | $ | 1,037 | | | $ | 1,038 | | | $ | 1,089 | | | $ | 1,101 | |
| Ratio of expenses to average net assets excluding fee waivers and reimbursements | | | 1.36 | % | | | 1.98 | % | | | 1.84 | % | | | 2.06 | % | | | 2.39 | %(f) | | | 2.94 | % |
| Ratio of expenses to average net assets including fee waivers and reimbursements | | | 0.78 | %(g) | | | 1.15 | % | | | 1.15 | % | | | 1.15 | % | | | 1.15 | %(f) | | | 1.15 | % |
| Ratio of net investment income to average net assets | | | 1.98 | % | | | 1.44 | % | | | 1.68 | % | | | 1.74 | % | | | 1.22 | %(f) | | | 1.27 | % |
| Portfolio turnover rate(h) | | | 219 | % | | | 63 | % | | | 137 | % | | | 186 | % | | | 34 | % | | | 125 | % |
| (a) | Prior to December 1, 2017, Investor Class was known as Class A. |
| (b) | Prior to February 28, 2018, the RiverFront Asset Allocation Income & Growth was known as the RiverFront Conservative Income Builder Fund. |
| (c) | Effective May 1, 2014, the Board approved changing the fiscal year-end of the Funds from April 30 to October 31. |
| (d) | Calculated using the average shares method. |
| (e) | Total returns are for the period indicated and have not been annualized. Total returns would have been lower had certain expenses not been waived during the period. Returns shown do not reflect the deduction of taxes that a shareholder would pay on Fund distributions or the redemption of Fund shares. Returns shown exclude any applicable sales charges. |
| (g) | Effective February 28, 2018, pursuant to the Administrative Services Agreement, the Fund pays an annual unitary administrative fee, which is based on the Fund’s average daily net assets, and will no longer pay a management fee or contractually limit the Fund’s total annual expenses. Refer to Note 8. |
| (h) | Portfolio turnover rate for periods less than one full year have not been annualized. |
See Notes to Financial Statements.
RiverFront Asset Allocation Income & Growth – Class A
Financial Highlights
Selected data for a share of beneficial interest outstanding throughout the periods indicated:
| | | For the Period June 12,2018 (Commencement of Operations) to October 31, 2018 | |
| Net asset value, beginning of period | | $ | 11.12 | |
| | | | | |
| INCOME FROM INVESTMENT OPERATIONS: | | | | |
| Net investment income(a) | | | 0.11 | |
| Net realized and unrealized loss | | | (0.45 | ) |
| Total from investment operations | | | (0.34 | ) |
| | | | | |
| DISTRIBUTIONS: | | | | |
| From net investment income | | | (0.12 | ) |
| Total distributions | | | (0.12 | ) |
| | | | | |
| Net (decrease) in net asset value | | | (0.46 | ) |
| Net asset value, end of year | | $ | 10.66 | |
| TOTAL RETURN(b) | | | (3.10 | )% |
| | | | | |
| RATIOS/SUPPLEMENTAL DATA: | | | | |
| Net assets, end of year (000s) | | $ | 10 | |
| Ratio of expenses to average net assets excluding fee waivers and reimbursements | | | 0.50 | %(c) |
| Ratio of expenses to average net assets including fee waivers and reimbursements | | | 0.50 | %(c) |
| Ratio of net investment income to average net assets | | | 2.64 | %(c) |
| Portfolio turnover rate(d) | | | 219 | % |
| (a) | Calculated using the average shares method. |
| (b) | Total returns are for the period indicated and have not been annualized. Total returns would have been lower had certain expenses not been waived during the period. Returns shown do not reflect the deduction of taxes that a shareholder would pay on Fund distributions or the redemption of Fund shares. |
| (d) | Portfolio turnover rate for periods less than one full year have not been annualized. |
See Notes to Financial Statements.
RiverFront Asset Allocation Income & Growth – Class C
Financial Highlights
Selected data for a share of beneficial interest outstanding throughout the periods indicated:
| | | For the Year Ended October 31, 2018 (a) | | | For the Year Ended October 31, 2017 | | | For the Year Ended October 31, 2016 | | | For the Year Ended October 31, 2015 | | | For the Fiscal Period Ended October 31, 2014 (b) | | | For the Year Ended April 30, 2014 | |
| Net asset value, beginning of period | | $ | 11.12 | | | $ | 10.44 | | | $ | 10.37 | | | $ | 10.81 | | | $ | 10.77 | | | $ | 10.51 | |
| | | | | | | | | | | | | | | | | | | | | | | | | |
| INCOME FROM INVESTMENT OPERATIONS: | | | | | | | | | | | | | | | | | | | | | | | | |
| Net investment income(c) | | | 0.14 | | | | 0.08 | | | | 0.10 | | | | 0.09 | | | | 0.03 | | | | 0.06 | |
| Net realized and unrealized gain/(loss) | | | (0.41 | ) | | | 0.69 | | | | 0.08 | | | | (0.13 | ) | | | 0.04 | | | | 0.51 | |
| Total from investment operations | | | (0.27 | ) | | | 0.77 | | | | 0.18 | | | | (0.04 | ) | | | 0.07 | | | | 0.57 | |
| | | | | | | | | | | | | | | | | | | | | | | | | |
| DISTRIBUTIONS: | | | | | | | | | | | | | | | | | | | | | | | | |
| From net investment income | | | (0.14 | ) | | | (0.09 | ) | | | (0.09 | ) | | | (0.11 | ) | | | (0.03 | ) | | | (0.12 | ) |
| From net realized gains | | | (0.18 | ) | | | – | | | | (0.02 | ) | | | (0.29 | ) | | | – | | | | (0.19 | ) |
| Total distributions | | | (0.32 | ) | | | (0.09 | ) | | | (0.11 | ) | | | (0.40 | ) | | | (0.03 | ) | | | (0.31 | ) |
| | | | | | | | | | | | | | | | | | | | | | | | | |
| Net increase/(decrease) in net asset value | | | (0.59 | ) | | | 0.68 | | | | 0.07 | | | | (0.44 | ) | | | 0.04 | | | | 0.26 | |
| Net asset value, end of year | | $ | 10.53 | | | $ | 11.12 | | | $ | 10.44 | | | $ | 10.37 | | | $ | 10.81 | | | $ | 10.77 | |
| TOTAL RETURN(d) | | | (2.48 | )% | | | 7.42 | % | | | 1.74 | % | | | (0.39 | )% | | | 0.68 | % | | | 5.49 | % |
| | | | | | | | | | | | | | | | | | | | | | | | | |
| RATIOS/SUPPLEMENTAL DATA: | | | | | | | | | | | | | | | | | | | | | | | | |
| Net assets, end of year (000s) | | $ | 5,689 | | | $ | 7,234 | | | $ | 11,550 | | | $ | 8,610 | | | $ | 5,021 | | | $ | 4,106 | |
| Ratio of expenses to average net assets excluding fee waivers and reimbursements | | | 1.95 | % | | | 2.68 | % | | | 2.60 | % | | | 2.81 | % | | | 3.14 | %(e) | | | 3.73 | % |
| Ratio of expenses to average net assets including fee waivers and reimbursements | | | 1.48 | %(f) | | | 1.90 | % | | | 1.90 | % | | | 1.90 | % | | | 1.90 | %(e) | | | 1.90 | % |
| Ratio of net investment income to average net assets | | | 1.27 | % | | | 0.77 | % | | | 0.92 | % | | | 0.88 | % | | | 0.47 | %(e) | | | 0.53 | % |
| Portfolio turnover rate(g) | | | 219 | % | | | 63 | % | | | 137 | % | | | 186 | % | | | 34 | % | | | 125 | % |
| (a) | Prior to February 28, 2018, the RiverFront Asset Allocation Income & Growth was known as the RiverFront Conservative Income Builder Fund. |
| (b) | Effective May 1, 2014, the Board approved changing the fiscal year-end of the Funds from April 30 to October 31. |
| (c) | Calculated using the average shares method. |
| (d) | Total returns are for the period indicated and have not been annualized. Total returns would have been lower had certain expenses not been waived during the period. Returns shown do not reflect the deduction of taxes that a shareholder would pay on Fund distributions or the redemption of Fund shares. Returns shown exclude any applicable sales charges. |
| (f) | Effective February 28, 2018, pursuant to the Administrative Services Agreement, the Fund pays an annual unitary administrative fee, which is based on the Fund’s average daily net assets, and will no longer pay a management fee or contractually limit the Fund’s total annual expenses. Refer to Note 8. |
| (g) | Portfolio turnover rate for periods less than one full year have not been annualized. |
See Notes to Financial Statements.
RiverFront Asset Allocation Income & Growth – Class I
Financial Highlights
Selected data for a share of beneficial interest outstanding throughout the periods indicated:
| | | For the Year Ended October 31, 2018 (a) | | | For the Year Ended October 31, 2017 | | | For the Year Ended October 31, 2016 | | | For the Year Ended October 31, 2015 | | | For the Fiscal Period Ended October 31, 2014 (b) | | | For the Year Ended April 30, 2014 | |
| Net asset value, beginning of period | | $ | 11.08 | | | $ | 10.36 | | | $ | 10.30 | | | $ | 10.70 | | | $ | 10.66 | | | $ | 10.29 | |
| | | | | | | | | | | | | | | | | | | | | | | | | |
| INCOME FROM INVESTMENT OPERATIONS: | | | | | | | | | | | | | | | | | | | | | | | | |
| Net investment income(c) | | | 0.25 | | | | 0.18 | | | | 0.19 | | | | 0.19 | | | | 0.07 | | | | 0.15 | |
| Net realized and unrealized gain/(loss) | | | (0.41 | ) | | | 0.70 | | | | 0.08 | | | | (0.13 | ) | | | 0.06 | | | | 0.51 | |
| Total from investment operations | | | (0.16 | ) | | | 0.88 | | | | 0.27 | | | | 0.06 | | | | 0.13 | | | | 0.66 | |
| | | | | | | | | | | | | | | | | | | | | | | | | |
| DISTRIBUTIONS: | | | | | | | | | | | | | | | | | | | | | | | | |
| From net investment income | | | (0.24 | ) | | | (0.16 | ) | | | (0.19 | ) | | | (0.17 | ) | | | (0.09 | ) | | | (0.10 | ) |
| From net realized gains | | | (0.18 | ) | | | – | | | | (0.02 | ) | | | (0.29 | ) | | | – | | | | (0.19 | ) |
| Total distributions | | | (0.42 | ) | | | (0.16 | ) | | | (0.21 | ) | | | (0.46 | ) | | | (0.09 | ) | | | (0.29 | ) |
| | | | | | | | | | | | | | | | | | | | | | | | | |
| Net increase/(decrease) in net asset value | | | (0.58 | ) | | | 0.72 | | | | 0.06 | | | | (0.40 | ) | | | 0.04 | | | | 0.37 | |
| Net asset value, end of year | | $ | 10.50 | | | $ | 11.08 | | | $ | 10.36 | | | $ | 10.30 | | | $ | 10.70 | | | $ | 10.66 | |
| TOTAL RETURN(d) | | | (1.50 | )% | | | 8.60 | % | | | 2.66 | % | | | 0.60 | % | | | 1.19 | % | | | 6.53 | % |
| | | | | | | | | | | | | | | | | | | | | | | | | |
| RATIOS/SUPPLEMENTAL DATA: | | | | | | | | | | | | | | | | | | | | | | | | |
| Net assets, end of year (000s) | | $ | 3,850 | | | $ | 2,783 | | | $ | 2,264 | | | $ | 2,171 | | | $ | 2,830 | | | $ | 1,381 | |
| Ratio of expenses to average net assets excluding fee waivers and reimbursements | | | 0.88 | % | | | 1.71 | % | | | 1.60 | % | | | 1.80 | % | | | 2.12 | %(e) | | | 2.66 | % |
| Ratio of expenses to average net assets including fee waivers and reimbursements | | | 0.45 | %(f) | | | 0.90 | % | | | 0.90 | % | | | 0.90 | % | | | 0.90 | %(e) | | | 0.90 | % |
| Ratio of net investment income to average net assets | | | 2.27 | % | | | 1.68 | % | | | 1.90 | % | | | 1.84 | % | | | 1.34 | %(e) | | | 1.49 | % |
| Portfolio turnover rate(g) | | | 219 | % | | | 63 | % | | | 137 | % | | | 186 | % | | | 34 | % | | | 125 | % |
| (a) | Prior to February 28, 2018, the RiverFront Asset Allocation Income & Growth was known as the RiverFront Conservative Income Builder Fund. |
| (b) | Effective May 1, 2014, the Board approved changing the fiscal year-end of the Funds from April 30 to October 31. |
| (c) | Calculated using the average shares method. |
| (d) | Total returns are for the period indicated and have not been annualized. Total returns would have been lower had certain expenses not been waived during the period. Returns shown do not reflect the deduction of taxes that a shareholder would pay on Fund distributions or the redemption of Fund shares. |
| (f) | Effective February 28, 2018, pursuant to the Administrative Services Agreement, the Fund pays an annual unitary administrative fee, which is based on the Fund’s average daily net assets, and will no longer pay a management fee or contractually limit the Fund’s total annual expenses. Refer to Note 8. |
| (g) | Portfolio turnover rate for periods less than one full year have not been annualized. |
See Notes to Financial Statements.
Notes to Financial Statements
October 31, 2018
1. ORGANIZATION
Financial Investors Trust (the “Trust”), a Delaware statutory trust, is an open-end management investment company registered under the Investment Company Act of 1940, as amended (“1940 Act”). The Trust consists of multiple separate portfolios or series. This annual report includes the financial statements and financial highlights of the following 12 funds: ALPS | CoreCommodity Management CompleteCommodities® Strategy Fund, ALPS | Kotak India Growth Fund, ALPS | Red Rocks Listed Private Equity Fund, ALPS | WMC Research Value Fund, Clough China Fund, RiverFront Asset Allocation Aggressive (Formerly RiverFront Global Growth Fund), RiverFront Asset Allocation Growth (Formerly RiverFront Global Allocation Fund), RiverFront Asset Allocation Growth & Income (Formerly RiverFront Dynamic Equity Income Fund), RiverFront Asset Allocation Moderate (Formerly RiverFront Moderate Growth & Income Fund), RiverFront Asset Allocation Income & Growth (Formerly RiverFront Conservative Income Builder Fund), ALPS | Smith Total Return Bond Fund and ALPS | Smith Short Duration Bond Fund (each, a “Fund” and collectively, the “Funds”).
The ALPS | CoreCommodity Management CompleteCommodities® Strategy Fund seeks to maximize real returns (returns after inflation), consistent with prudent investment management. ALPS | Kotak India Growth Fund’s investment goal is long-term capital appreciation. ALPS | Red Rocks Listed Private Equity Fund seeks to maximize total return, which consists of appreciation on its investments and a variable income stream. ALPS | WMC Research Value Fund seeks long-term capital appreciation: dividend income may be a factor in portfolio selection but is secondary to the Fund’s principal objective. The Clough China Fund seeks to provide investors with long-term capital appreciation. Effective February 28, 2018, the RiverFront Asset Allocation Aggressive seeks to achieve long-term capital appreciation, the RiverFront Asset Allocation Growth seeks to provide high total investment return, the RiverFront Asset Allocation Growth & Income seeks to achieve long-term growth and income, the RiverFront Asset Allocation Moderate has two primary investment objectives- it seeks (1) to provide a level of current income that exceeds the average yield on U.S. stocks, and (2) growth of capital, and the RiverFront Asset Allocation Income & Growth seeks to provide current income and potential for that income to grow over time. Prior to February 28, 2018, the RiverFront Asset Allocation Aggressive sought to achieve long-term capital appreciation through a fully managed investment policy utilizing United States and foreign equity securities, debt and money market securities, the combination of which will be varied from time to time both with respect to types of securities and markets in response to changing market and economic trends.The RiverFront Asset Allocation Growth sought to provide high total investment return through a fully managed investment policy utilizing United States and foreign equity securities, debt and money market securities, the combination of which will be varied from time to time both with respect to types of securities and markets in response to changing market and economic trends. Total investment return means the combination of capital appreciation and investment income. The RiverFront Asset Allocation Growth & Income sought to achieve long-term growth and income through a combination of capital appreciation and rising dividend payments that exceed the average yield on global stocks generally. The RiverFront Asset Allocation Moderate had two primary investment objectives. It sought (1) to provide a level of current income that exceeds the average yield on U.S. stocks in general while providing a growing stream of income over the years and (2) growth of capital. The RiverFront Asset Allocation Income & Growth sought to provide current income and potential for that income to grow over time. The ALPS | Smith Total Return Bond Fund capital seeks to obtain maximum total return, consistent with preservation of capital. The ALPS | Smith Short Duration Bond Fund seeks as high a level of current income as is consistent with preservation of capital.
The classes of each Fund differ principally in the applicable distribution and shareholder service fees. Shareholders of each class also bear certain expenses that pertain to that particular class. All shareholders bear the common expenses of the Fund and earn income and realized gains/losses from the Fund pro rata based on the average daily net assets of each class, without distinction between share classes. Dividends to shareholders are determined separately for each class based on income and expenses allocable to each class. Realized gain distributions to shareholders are allocated to each class pro rata based on the shares outstanding of each class on the date of distribution. Differences in per share dividend rates generally result from differences in separate class expenses, including distribution and shareholder service fees, if applicable.
Basis of Consolidation for the ALPS | CoreCommodity Management CompleteCommodities® Strategy Fund
CoreCommodity Management Cayman Commodity Fund Ltd. (the “Subsidiary”), a Cayman Islands exempted company, was incorporated on April 23, 2010 and is a wholly owned subsidiary of the ALPS | CoreCommodity Management CompleteCommodities® Strategy Fund (the “CoreCommodity Fund”). The Subsidiary acts as an investment vehicle for the CoreCommodity Fund in order to effect certain commodity-related investments on behalf of the CoreCommodity Fund. CoreCommodity Fund is the sole shareholder of the Subsidiary pursuant to a subscription agreement dated as of June 14, 2010, and it is intended that the CoreCommodity Fund will remain the sole shareholder and will continue to wholly own and control the Subsidiary. Under the Articles of Association of the Subsidiary, shares issued by the Subsidiary confer upon a shareholder the right to vote at general meetings of the Subsidiary and certain rights in connection with any winding-up or repayment of capital, as well as the right to participate in the profits or assets of the Subsidiary. The CoreCommodity Fund may invest up to 25% of its total assets in shares of the Subsidiary. As a wholly owned subsidiary of the CoreCommodity Fund, the financial statements of the Subsidiary are included in the consolidated financial statements and financial highlights of the CoreCommodity Fund. All investments held by the Subsidiary are disclosed in the accounts of the CoreCommodity Fund. As of October 31, 2018, net assets of the CoreCommodity Fund were $705,623,239 of which $124,894,077 or 17.70%, represented the CoreCommodity Fund’s ownership of all issued shares and voting rights of the Subsidiary.
Notes to Financial Statements
October 31, 2018
Basis of Consolidation for the ALPS | Kotak India Growth Fund
ALPS | Kotak India Growth Fund, (the “Kotak Fund”) invests in the equity securities of Indian companies through its wholly owned, collective investment vehicle, the India Premier Equity Portfolio (the “Portfolio”). The Portfolio is registered with and regulated by the Mauritius Financial Services Commission. The Portfolio was formed for the purpose of facilitating the Kotak Fund’s purchase of securities of a wide selection of Indian companies, consistent with the Kotak Fund’s investment strategies. The Portfolio is a private company limited by shares incorporated under the Mauritius Companies Act 2001. As a wholly owned subsidiary of the Kotak Fund, financial statements of the Portfolio are included in the consolidated financial statements and financial highlights of the Kotak Fund. All investments held by the Portfolio are disclosed in the accounts of the Kotak Fund. As of October 31, 2018, net assets of the Kotak Fund were $21,599,988 of which $13,964,218 or 64.65%, represented the Kotak Fund’s ownership of all issued shares and voting rights of the Subsidiary.
The Portfolio established residency in Mauritius allowing the Kotak Fund to receive the beneficial tax treatment under the Treaty between India and Mauritius. However, due to recently enacted legislation the benefits of the Treaty have been reduced and some gains derived by the Portfolio due to the sale of securities will be subject to taxation in India. On April 1, 2017, the General Anti-Avoidance Rules (“GAAR”) which contain treaty override provisions were enacted. Capital gains on sale of shares acquired on or after April 1, 2017, are taxable in India as per the amended India - Mauritius treaty. The benefit of a lower rate of taxation (50% of the applicable tax rate in India) is provided for the gains on shares arising during the period from April 1, 2017 to March 31, 2019 subject to compliance with the Limitation of Benefit clause.
2. SIGNIFICANT ACCOUNTING POLICIES
The following is a summary of significant accounting policies consistently followed by each Fund in the preparation of its financial statements. Each Fund is considered an investment company for financial reporting purposes, and follows accounting policies in conformity with accounting principles generally accepted in the United States of America (“U.S. GAAP”), including policies specific to investment companies. The preparation of financial statements in conformity with U.S. GAAP requires management to make certain estimates and assumptions that affect the reported amounts of assets and liabilities and disclosures of contingent assets and liabilities at the date of the financial statements and the reported amounts of revenue and expenses during the period. Actual results could differ from those estimates. The following is a summary of significant accounting policies consistently followed by the Funds and subsidiaries, as applicable, in preparation of their financial statements. The Funds are considered investment companies under U.S. GAAP and follows the accounting and reporting guidance applicable to investment companies in the Financial Accounting Standards Board Accounting Standards Codification Topic 946.
Investment Valuation: The Funds generally value their securities based on market prices determined at the close of regular trading on the New York Stock Exchange (“NYSE”), normally 4:00 p.m. Eastern Time, on each day the NYSE is open for trading. For equity securities and mutual funds that are traded on an exchange, the market price is usually the closing sale or official closing price on that exchange.
The market price for debt obligations is generally the price supplied by an independent third-party pricing service approved by the Board, which may use a matrix, formula or other objective method that takes into consideration quotations from dealers, market transactions in comparable investments, market indices and yield curves. If vendors are unable to supply a price, or if the price supplied is deemed to be unreliable, the market price may be determined using quotations received from one or more brokers-dealers that make a market in the security. Investments in nonexchange traded funds are fair valued at their respective net asset values.
Futures contracts that are listed or traded on a national securities exchange, commodities exchange, contract market or comparable over the counter market, and that are freely transferable, are valued at their closing settlement price on the exchange on which they are primarily traded or based upon the current settlement price for a like instrument acquired on the day on which the instrument is being valued. A settlement price may not be used if the market makes a limit move with respect to a particular commodity. Over-the-counter swap contracts are valued based on quotes received from independent pricing services or one or more dealers that make markets in such investments.
Option contracts are valued using the National Best Bid and Offer price (“NBBO”). In the event there is no NBBO price available, option contracts are valued at the mean between the last bid and ask.
Equity securities that are primarily traded on foreign securities exchanges are valued at the closing values of such securities on their respective foreign exchanges, except when an event occurs subsequent to the close of the foreign exchange and the close of the NYSE that was likely to have changed such value. In such an event, the fair value of those securities are determined in good faith through consideration of other factors in accordance with procedures established by and under the general supervision of the Board. The Funds will use a fair valuation model provided by an independent pricing service, which is intended to reflect fair value when a security’s value or a meaningful portion of the Fund’s portfolio is believed to have been materially affected by an valuation event that has occurred between the close of the exchange or market on which the security is traded and the close of the regular trading day on the NYSE.
Notes to Financial Statements
October 31, 2018
Forward currency exchange contracts have a value determined by the current foreign currency exchange forward rates. The foreign currency exchange forward rates are calculated using an automated system that estimates rates on the basis of the current day foreign currency exchange rates and forward foreign currency exchange rates supplied by a pricing service. Foreign exchange rates and forward foreign currency exchange rates may generally be obtained at the close of the NYSE, normally 4:00 p.m. Eastern Time.
When such prices or quotations are not available, or when the Fair Value Committee appointed by the Board believes that they are unreliable, securities may be priced using fair value procedures approved by the Board. The fair valuation policies and procedures (“FV Procedures”) have been adopted by the Board for the fair valuation of portfolio assets held by the Fund(s) in the event that (1) market quotations for the current price of a portfolio security or asset are not readily available, or (2) available market quotations that would otherwise be used to value a portfolio security or asset in accordance with the Fund’s Pricing Procedures appear to be unreliable. The Pricing Procedures reflect certain pricing methodologies (or “logics”) that are not “readily available market quotations” and thus are viewed and treated as fair valuations. The Fair Value Committee routinely meets to discuss fair valuations of portfolio securities and other instruments held by the Fund(s).
Fair Value Measurements: The Funds disclose the classification of their fair value measurements following a three-tier hierarchy based on the inputs used to measure fair value. Inputs refer broadly to the assumptions that market participants would use in pricing the asset or liability, including assumptions about risk. Inputs may be observable or unobservable. Observable inputs reflect the assumptions market participants would use in pricing the asset or liability that are developed based on market data obtained from sources independent of the reporting entity. Unobservable inputs reflect the reporting entity’s own assumptions about the assumptions market participants would use in pricing the asset or liability that are developed based on the best information available.
Various inputs are used in determining the value of each Fund’s investments as of the end of the reporting period. When inputs used fall into different levels of the fair value hierarchy, the level in the hierarchy within which the fair value measurement falls is determined based on the lowest level input that is significant to the fair value measurement in its entirety. The designated input levels are not necessarily an indication of the risk or liquidity associated with these investments. These inputs are categorized in the following hierarchy under applicable financial accounting standards:
| Level 1 – | Unadjusted quoted prices in active markets for identical investments, unrestricted assets or liabilities that a Fund has the ability to access at the measurement date; |
| Level 2 – | Quoted prices which are not active, quoted prices for similar assets or liabilities in active markets or inputs other than quoted prices that are observable (either directly or indirectly) for substantially the full term of the asset or liability; and |
| Level 3 – | Significant unobservable prices or inputs (including the Fund’s own assumptions in determining the fair value of investments) where there is little or no market activity for the asset or liability at the measurement date. |
The following is a summary of each Fund’s investments/financial instruments in the fair value hierarchy as of October 31, 2018:
| Investments in Securities at Value | | Level 1 - Unadjusted Quoted Prices | | | Level 2 - Other Significant Observable Inputs | | | Level 3 - Significant Unobservable Inputs | | | Total | |
| ALPS | CoreCommodity Management CompleteCommodities® Strategy Fund | | | | | | | | | |
| Common Stocks(a) | | $ | 139,055,891 | | | $ | – | | | $ | – | | | $ | 139,055,891 | |
| Master Limited Partnerships(a) | | | 1,217,068 | | | | – | | | | – | | | | 1,217,068 | |
| Government Bonds | | | – | | | | 496,387,073 | | | | – | | | | 496,387,073 | |
| Total | | $ | 140,272,959 | | | $ | 496,387,073 | | | $ | – | | | $ | 636,660,032 | |
| Other Financial Instruments | | | | | | | | | | | | | | | | |
| Assets | | | | | | | | | | | | | | | | |
| Futures Contracts | | $ | 8,857,981 | | | $ | – | | | $ | – | | | $ | 8,857,981 | |
| Total Return Swap Contracts | | | – | | | | 1,070 | | | | – | | | | 1,070 | |
| Liabilities | | | | | | | | | | | | | | | | |
| Futures Contracts | | | (6,326,110 | ) | | | – | | | | – | | | | (6,326,110 | ) |
| Total | | $ | 2,531,871 | | | $ | 1,070 | | | $ | – | | | $ | 2,532,941 | |
Notes to Financial Statements
October 31, 2018
| Investments in Securities at Value | | Level 1 - Unadjusted Quoted Prices | | | Level 2 - Other Significant Observable Inputs | | | Level 3 - Significant Unobservable Inputs | | | Total | |
| ALPS | Kotak India Growth Fund | | | | | | | | | | | | | | | | |
| Common Stocks | | | | | | | | | | | | | | | | |
| Consumer Discretionary | | $ | – | | | $ | 2,156,646 | | | $ | – | | | $ | 2,156,646 | |
| Consumer Staples | | | – | | | | 1,843,836 | | | | – | | | | 1,843,836 | |
| Energy | | | – | | | | 1,466,297 | | | | – | | | | 1,466,297 | |
| Financials | | | – | | | | 6,722,685 | | | | – | | | | 6,722,685 | |
| Health Care | | | 182,509 | | | | 1,015,570 | | | | – | | | | 1,198,079 | |
| Industrials | | | 179,077 | | | | 1,918,299 | | | | – | | | | 2,097,376 | |
| Information Technology | | | – | | | | 2,933,319 | | | | – | | | | 2,933,319 | |
| Materials | | | – | | | | 2,248,956 | | | | – | | | | 2,248,956 | |
| Real Estate | | | – | | | | 170,566 | | | | – | | | | 170,566 | |
| Total | | $ | 361,586 | | | $ | 20,476,174 | | | $ | – | | | $ | 20,837,760 | |
| Investments in Securities at Value | | Level 1 - Unadjusted Quoted Prices | | | Level 2 - Other Significant Observable Inputs | | | Level 3 - Significant Unobservable Inputs | | | Total | |
| ALPS | Smith Short Duration Bond Fund | | | | | | | | | | | | | | | | |
| Collateralized Mortgage Obligations | | $ | – | | | $ | 213,943 | | | $ | – | | | $ | 213,943 | |
| Corporate Bond | | | – | | | | 6,176,156 | | | | – | | | | 6,176,156 | |
| Government Bond | | | – | | | | 7,709,078 | | | | – | | | | 7,709,078 | |
| Mortgage-Backed Securities | | | – | | | | 49,235 | | | | – | | | | 49,235 | |
| Municipal Bond | | | – | | | | 35,184 | | | | – | | | | 35,184 | |
| Short Term Security | | | 148,288 | | | | – | | | | – | | | | 148,288 | |
| Total | | $ | 148,288 | | | $ | 14,183,596 | | | $ | – | | | $ | 14,331,884 | |
| Investments in Securities at Value | | Level 1 - Unadjusted Quoted Prices | | | Level 2 - Other Significant Observable Inputs | | | Level 3 - Significant Unobservable Inputs | | | Total | |
| ALPS | Smith Total Return Bond Fund | | | | | | | | | | | | | | | | |
| Collateralized Mortgage Obligations | | $ | – | | | $ | 2,135,008 | | | $ | – | | | $ | 2,135,008 | |
| Corporate Bond | | | – | | | | 4,018,389 | | | | – | | | | 4,018,389 | |
| Government Bond | | | – | | | | 4,510,811 | | | | – | | | | 4,510,811 | |
| Short Term Security | | | 299,517 | | | | – | | | | – | | | | 299,517 | |
| Total | | $ | 299,517 | | | $ | 10,664,208 | | | $ | – | | | $ | 10,963,725 | |
| Investments in Securities at Value | | Level 1 - Unadjusted Quoted Prices | | | Level 2 - Other Significant Observable Inputs | | | Level 3 - Significant Unobservable Inputs | | | Total | |
| ALPS | Red Rocks Listed Private Equity Fund | | | | | | | | | | | | | | | | |
| Closed-End Funds | | $ | 12,795,723 | | | $ | 24,716,820 | | | $ | – | | | $ | 37,512,543 | |
| Common Stocks(a) | | | 104,098,069 | | | | 86,268,053 | | | | – | | | | 190,366,122 | |
| Short-Term Investments | | | 3,629,019 | | | | – | | | | – | | | | 3,629,019 | |
| Total | | $ | 120,522,811 | | | $ | 110,984,873 | | | $ | – | | | $ | 231,507,684 | |
| Investments in Securities at Value | | Level 1 - Unadjusted Quoted Prices | | | Level 2 - Other Significant Observable Inputs | | | Level 3 - Significant Unobservable Inputs | | | Total | |
| ALPS | WMC Research Value Fund | | | | | | | | | | | | |
| Common Stocks(a) | | $ | 82,639,022 | | | $ | – | | | $ | – | | | $ | 82,639,022 | |
| Exchange Traded Funds | | | 1,189,619 | | | | – | | | | – | | | | 1,189,619 | |
| Short-Term Investments | | | 41,054 | | | | – | | | | – | | | | 41,054 | |
| Total | | $ | 83,869,695 | | | $ | – | | | $ | – | | | $ | 83,869,695 | |
Notes to Financial Statements
October 31, 2018
| Investments in Securities at Value | | Level 1 - Unadjusted Quoted Prices | | | Level 2 - Other Significant Observable Inputs | | | Level 3 - Significant Unobservable Inputs | | | Total | |
| Clough China Fund | | | | | | | | | | | | |
| Common Stocks | | | | | | | | | | | | | | | | |
| Communications | | $ | 3,270,762 | | | $ | 765,528 | | | $ | – | | | $ | 4,036,290 | |
| Consumer Discretionary | | | 4,468,838 | | | | 955,528 | | | | – | | | | 5,424,366 | |
| Financials | | | – | | | | 12,247,852 | | | | – | | | | 12,247,852 | |
| Health Care | | | – | | | | 1,007,625 | | | | – | | | | 1,007,625 | |
| Industrials | | | 758,740 | | | | 1,763,036 | | | | – | | | | 2,521,776 | |
| Materials | | | – | | | | 1,759,676 | | | | – | | | | 1,759,676 | |
| Technology | | | 1,003,212 | | | | 2,925,741 | | | | – | | | | 3,928,953 | |
| Short Term Security | | | 2,727,948 | | | | – | | | | – | | | | 2,727,948 | |
| Total | | $ | 12,229,500 | | | $ | 21,424,986 | | | $ | – | | | $ | 33,654,486 | |
| Other Financial Instruments Liabilities: | | | | | | | | | | | | | | | | |
| Total Return Swap Contracts | | $ | – | | | $ | (130,616 | ) | | $ | – | | | $ | (130,616 | ) |
| Total | | $ | – | | | $ | (130,616 | ) | | $ | – | | | $ | (130,616 | ) |
| Investments in Securities at Value | | Level 1 - Unadjusted Quoted Prices | | | Level 2 - Other Significant Observable Inputs | | | Level 3 - Significant Unobservable Inputs | | | Total | |
| RiverFront Asset Allocation Aggressive | | | | | | | | | | | | | | | | |
| Exchange Traded Funds | | $ | 46,663,351 | | | $ | – | | | $ | – | | | $ | 46,663,351 | |
| Short-Term Investments | | | 682,600 | | | | – | | | | – | | | | 682,600 | |
| Total | | $ | 47,345,951 | | | $ | – | | | $ | – | | | $ | 47,345,951 | |
| Investments in Securities at Value | | Level 1 - Unadjusted Quoted Prices | | | Level 2 - Other Significant Observable Inputs | | | Level 3 - Significant Unobservable Inputs | | | Total | |
| RiverFront Asset Allocation Growth | | | | | | | | | | | | | | | | |
| Exchange Traded Funds | | $ | 28,264,941 | | | $ | – | | | $ | – | | | $ | 28,264,941 | |
| Short-Term Investments | | | 826,653 | | | | – | | | | – | | | | 826,653 | |
| Total | | $ | 29,091,594 | | | $ | – | | | $ | – | | | $ | 29,091,594 | |
| Investments in Securities at Value | | Level 1 - Unadjusted Quoted Prices | | | Level 2 - Other Significant Observable Inputs | | | Level 3 - Significant Unobservable Inputs | | | Total | |
| RiverFront Asset Allocation Growth & Income | | | | | | | | | | | | | | | | |
| Exchange Traded Funds | | $ | 82,568,615 | | | $ | – | | | $ | – | | | $ | 82,568,615 | |
| Short-Term Investments | | | 1,464,145 | | | | – | | | | – | | | | 1,464,145 | |
| Total | | $ | 84,032,760 | | | $ | – | | | $ | – | | | $ | 84,032,760 | |
| Investments in Securities at Value | | Level 1 - Unadjusted Quoted Prices | | | Level 2 - Other Significant Observable Inputs | | | Level 3 - Significant Unobservable Inputs | | | Total | |
| RiverFront Asset Allocation Moderate | | | | | | | | | | | | | | | | |
| Exchange Traded Funds | | $ | 76,354,672 | | | $ | – | | | $ | – | | | $ | 76,354,672 | |
| Short-Term Investments | | | 1,175,734 | | | | – | | | | – | | | | 1,175,734 | |
| Total | | $ | 77,530,406 | | | $ | – | | | $ | – | | | $ | 77,530,406 | |
| Investments in Securities at Value | | Level 1 - Unadjusted Quoted Prices | | | Level 2 - Other Significant Observable Inputs | | | Level 3 - Significant Unobservable Inputs | | | Total | |
| RiverFront Asset Allocation Income & Growth | | | | | | | | | | | | | | | | |
| Exchange Traded Funds | | $ | 9,607,260 | | | $ | – | | | $ | – | | | $ | 9,607,260 | |
| Short-Term Investments | | | 172,559 | | | | – | | | | – | | | | 172,559 | |
| Total | | $ | 9,779,819 | | | $ | – | | | $ | – | | | $ | 9,779,819 | |
Notes to Financial Statements
October 31, 2018
| (a) | For detailed descriptions of country, sector and/or industry, see the accompanying Statement of Investments or Consolidated Statement of Investments. |
Fund and Class Expenses: Some expenses of the Trust can be directly attributed to a Fund or a specific share class of a Fund. Expenses which cannot be directly attributed are apportioned among all Funds in the Trust based on average net assets of each share class within a Fund.
Federal Income Taxes: The Funds comply with the requirements under Subchapter M of the Internal Revenue Code of 1986, as amended (the “Code”) applicable to regulated investment companies and intend to distribute substantially all of their net taxable income and net capital gains, if any, each year. The Funds are not subject to income taxes to the extent such distributions are made.
The Funds file U.S. federal, state, and local tax returns as required. The Funds’ tax returns are subject to examination by the relevant tax authorities until expiration of the applicable statute of limitations which is generally three years after the filing of the tax return, but may extend to four years in certain jurisdictions. Tax returns for open years have incorporated no uncertain tax positions that require a provision for income taxes.
Distributions to Shareholders: Each Fund, except the RiverFront Asset Allocation Income & Growth, RiverFront Asset Allocation Growth & Income,RiverFront Asset Allocation Moderate, ALPS | Smith Total Return Bond Fund and ALPS | Smith Short Duration Bond Fund, normally pays dividends and distributes capital gains, if any, on an annual basis. RiverFront Asset Allocation Income & Growth, RiverFront Asset Allocation Growth & Income and RiverFront Asset Allocation Moderate normally pay dividends, if any, on a quarterly basis and distribute capital gains annually. ALPS | Smith Total Return Bond Fund and ALPS | Smith Short Duration Bond Fund declare and distribute dividends, if any, on a monthly basis and capital gains, if any, on at least an annual basis. Income dividend distributions are derived from interest and other income a Fund receives from its investments, including distributions of short-term capital gains. Capital gain distributions are derived from gains realized when a Fund sells a security it has owned for more than a year or from long-term capital gain distributions from underlying investments. Each Fund may make additional distributions and dividends at other times if its portfolio manager or managers believe doing so may be necessary for the Fund to avoid or reduce taxes.
Commodity-Linked Notes: The ALPS | CoreCommodity Management CompleteCommodities® Strategy Fund may invest in commodity-linked notes which are derivative instruments that have characteristics of a debt security and of a commodity-linked derivative. A commodity-linked note typically provides for interest payments and a principal payment at maturity linked to the price movement of the underlying commodity, commodity index or commodity futures or option contract. Commodity-linked notes may be principal protected, partially protected, or offer no principal protection. The value of these notes will rise and fall in response to changes in the underlying commodity or related index or investment. These notes are often leveraged, increasing the volatility of each note’s value relative to the change in the underlying linked index. Commodity index-linked investments may be more volatile and less liquid than the underlying index and their value may be affected by the performance of the commodities as well as other factors, including liquidity, quality, maturity and other economic variables. Commodity-linked notes are typically issued by a bank or other financial institution and are sometimes referred to as structured notes because the terms of the notes may be structured by the issuer and the purchaser of the notes to accommodate the specific investment requirements of the purchaser.
Exchange Traded Funds (ETFs): Each Fund may invest in shares of ETFs and other similar instruments if the investment manager chooses to adjust a Fund’s exposure to the general market or industry sectors and to manage a Fund’s risk exposure. ETFs differ from traditional index funds in that their shares are listed on a securities exchange and can be traded intraday. ETF shares are shares of exchange traded investment companies that are registered under the 1940 Act and hold a portfolio of common stocks designed to track the performance of a particular index. Limitations of the 1940 Act may prohibit a Fund from acquiring more than 3% of the outstanding shares of certain ETFs. Instruments that are similar to ETFs represent beneficial ownership interests in specific “baskets” of stocks of companies within a particular industry sector or group. These securities may also be exchange traded, but unlike ETFs, the issuers of these securities are not registered as investment companies.
The portfolio manager may decide to purchase or sell short ETF shares or options on ETF shares for the same reasons it would purchase or sell (and as an alternative to purchasing or selling) futures contracts - to obtain exposure to the stock market or a particular segment of the stock market, or to hedge a Fund’s portfolio against such exposures. Depending on the market, the holding period and other factors, the use of ETF shares and options thereon can be less costly than the use of index options or stock index futures. In addition, ETF shares and options thereon can typically be purchased in smaller amounts than are available for futures contracts and can offer exposure to market sectors and styles for which there is no suitable or liquid futures contract.
Investment Transactions and Investment Income: Investment transactions are accounted for on the date the investments are purchased or sold (trade date basis). Net realized gains and losses from investment transactions are reported on an identified cost basis. Interest income, which includes accretion of discounts and amortization of premiums, is accrued and recorded as earned. Dividend income is recognized on the ex-dividend date or for certain foreign securities, as soon as information is available to each Fund.
Notes to Financial Statements
October 31, 2018
Foreign Securities: Each Fund may directly purchase securities of foreign issuers. Investing in securities of foreign issuers involves special risks not typically associated with investing in securities of U.S. issuers. The risks include possible reevaluation of currencies, the inability to repatriate foreign currency, less complete financial information about companies and possible future adverse political and economic developments.
Moreover, securities of many foreign issuers and their markets may be less liquid and their prices more volatile than those of securities of comparable U.S. issuers.
Foreign Currency Translation: The books and records of the Funds are maintained in U.S. dollars. Investment valuations and other assets and liabilities initially expressed in foreign currencies are converted each business day into U.S. dollars based upon current exchange rates. The portion of realized and unrealized gains or losses on investments due to fluctuations in foreign currency exchange rates is not separately disclosed and is included in realized and unrealized gains or losses on investments, when applicable.
Foreign Currency Spot Contracts: The Funds may enter into foreign currency spot contracts to facilitate transactions in foreign securities or to convert foreign currency receipts into U.S. dollars. A foreign currency spot contract is an agreement between two parties to buy and sell currencies at the current market rate, for settlement generally within two business days. The U.S. dollar value of the contracts is determined using current currency exchange rates supplied by a pricing service. The contract is marked-to-market daily for settlements beyond one day and any change in market value is recorded as an unrealized gain or loss. When the contract is closed, the Fund records a realized gain or loss equal to the difference between the value on the open and close date. Losses may arise from changes in the value of the foreign currency, or if the counterparties do not perform under the contract’s terms. The maximum potential loss from such contracts is the aggregate face value in U.S. dollars at the time the contract was opened.
Real Estate Investment Trusts (“REITs”): The Funds may invest a portion of their assets in REITs and are subject to certain risks associated with direct investment in REITs. REITs may be affected by changes in the value of their underlying properties and by defaults by borrowers or tenants. REITs depend generally on their ability to generate cash flow to make distributions to shareowners, and certain REITs have self-liquidation provisions by which mortgages held may be paid in full and distributions of capital returns may be made at any time. In addition, the performance of a REIT may be affected by its failure to qualify for tax-free pass-through of income under the Internal Revenue Code of 1986, as amended (the “Code”), or its failure to maintain exemption from registration under the 1940 Act. Distributions that the Fund receives from REITs can be classified as ordinary income, capital gain income or return of capital by the REITs that make these distributions to the Fund. However, it is not possible for the Fund to characterize distributions received from REITs during interim periods because the REIT issuers do not report their tax characterizations until subsequent to year end. During interim periods, the REIT distributions are accounted for as ordinary income until the re characterizations are made subsequent to year end.
Treasury Inflation Protected-Securities (“TIPS”): The Funds may invest in TIPS, including structured bonds in which the principal amount is adjusted daily to keep pace with inflation, as measured by the U.S. Consumer Pricing Index for Urban Consumers. The adjustments to principal due to inflation/deflation are reflected as increases/decreases to interest income with a corresponding adjustment to cost. Such adjustments may have a significant impact on a Fund’s distributions and may result in a return of capital to shareholders. The repayment of the original bond principal upon maturity is guaranteed by the full faith and credit of the U.S. Government.
Loan Participations and Assignments: Certain Funds may invest in loan participations and assignments. The Fund considers loan participations and assignments to be investments in debt securities. Loan participations typically will result in the Fund having a contractual relationship only with the lender, not with the borrower. The Fund will have the right to receive payments of principal, interest and any fees to which it is entitled only from the lender selling the participation and only upon receipt by the lender of the payments from the borrower. Under a loan participation, the Fund generally will have no right to enforce compliance by the borrower with the terms of the loan agreement relating to the loan, nor any rights of set-off against the borrower, and the Fund may not benefit directly from any collateral supporting the loan in which it has purchased the participation. As a result, the Fund will assume the credit risk of both the borrower and the lender that is selling the participation. In the event of the insolvency of the lender selling a participation, the Fund may be treated as a general creditor of the lender and may not benefit from any set-off between the lender and the borrower. When the Fund purchases assignments of loans from lenders, the Fund will acquire direct rights against the borrower on the loan, except that under certain circumstances such rights may be more limited than those held by the assigning lender.
Master Limited Partnerships: Certain Funds may invest in MLPs, which are publicly traded partnerships engaged in the transportation, storage and processing of minerals and natural resources. By confining their operations to these specific activities, their interests, or units, are able to trade on public securities exchanges exactly like the shares of a corporation, without entity level taxation. To qualify as a MLP and to not be taxed as a corporation, a partnership must receive at least 90% of its income from qualifying sources as set forth in Section 7704(d) of the Code. These qualifying sources include natural resource based activities such as the processing, transportation and storage of mineral or natural resources. MLPs generally have two classes of owners, the general partner and limited partners. The general partner of an MLP is typically owned by a major
Notes to Financial Statements
October 31, 2018
energy company, an investment fund, the direct management of the MLP, or is an entity owned by one or more of such parties. The general partner may be structured as a private or publicly traded corporation or other entity. The general partner typically controls the operations and management of the MLP through an up to 2% equity interest in the MLP plus, in many cases, ownership of common units and subordinated units. Limited partners typically own the remainder of the partnership, through ownership of common units, and have a limited role in the partnership’s operations and management. MLPs are typically structured such that common units and general partner interests have first priority to receive quarterly cash distributions up to an established minimum amount (“minimum quarterly distributions” or “MQD”). Common and general partner interests also accrue arrearages in distributions to the extent the MQD is not paid. Once common and general partner interests have been paid, subordinated units receive distributions of up to the MQD; however, subordinated units do not accrue arrearages. Distributable cash in excess of the MQD is paid to both common and subordinated units and is distributed to both common and subordinated units generally on a pro rata basis. The general partner is also eligible to receive incentive distributions if the general partner operates the business in a manner which results in distributions paid per common unit surpassing specified target levels. As the general partner increases cash distributions to the limited partners, the general partner receives an increasingly higher percentage of the incremental cash distributions.
3. DERIVATIVE INSTRUMENTS
As a part of their investment strategy, the Funds are permitted to enter in various types of derivatives contracts. In doing so, the Funds employ strategies in differing combinations to permit them to increase, decrease, or change the level or types of exposure to market factors. Central to those strategies are features inherent in derivatives that make them more attractive for this purpose than equity or debt securities; they require little or no initial cash investment, they focus exposure on only certain selected risk factors, and they may not require the ultimate receipt or delivery of the underlying security (or securities) to the contract. This may allow the Funds to pursue their objectives more quickly and efficiently than if they were to make direct purchases or sales of securities capable of affecting a similar response to market factors.
Cash collateral is being pledged to cover derivative obligations of the Funds and cash collateral received from the counterparty, if any, is reported separately on the Statements of Assets and Liabilities as cash pledged as collateral and cash received as collateral, respectively. Non-cash collateral pledged by the Funds, if any, is noted in the Statements of Investments.
Risk of Investing in Derivatives: The Funds’ use of derivatives can result in losses due to unanticipated changes in the market risk factors and the overall market. In instances where the Funds are using derivatives to decrease, or hedge, exposures to market risk factors for securities held by the Funds, there are also risks that those derivatives may not perform as expected resulting in losses for the combined or hedged positions.
Derivatives may have little or no initial cash investment relative to their market value exposure and therefore can produce significant gains or losses in excess of their cost. This use of embedded leverage allows the Fund to increase its market value exposure relative to its net assets and can substantially increase the volatility of the Funds’ performance.
Additional associated risks from investing in derivatives also exist and potentially could have significant effects on the valuation of the derivative and the Funds. Typically, the associated risks are not the risks that the Funds are attempting to increase or decrease exposure to, per their investment objectives, but are the additional risks from investing in derivatives.
Examples of these associated risks are liquidity risk, which is the risk that the Funds will not be able to sell or close out the derivative in a timely manner, and counterparty credit risk, which is the risk that the counterparty will not fulfill its obligation to the Funds. In addition, use of derivatives may increase or decrease exposure to the following risk factors:
Equity Risk: Equity risk relates to the change in value of equity securities as they relate to increases or decreases in the general market. Associated risks can be different for each type of derivative and are discussed by each derivative type in the notes that follow.
Commodity Risk: Exposure to the commodities markets may subject the Funds to greater volatility than investments in traditional securities. Prices of various commodities may also be affected by factors, such as drought, floods, weather, livestock disease, embargoes, tariffs and other regulatory developments, which are unpredictable. The prices of commodities can also fluctuate widely due to supply and demand disruptions in major producing or consuming regions.
Foreign Currency Risk: Currency trading involves significant risks, including market risk, interest rate risk, country risk, counterparty credit risk and short sale risk. Market risk results from the price movement of foreign currency values in response to shifting market supply and demand. Interest rate risk arises whenever a country changes its stated interest rate target associated with its currency. Country risk arises because virtually every country has interfered with international transactions in its currency.
Notes to Financial Statements
October 31, 2018
Interest Rate Risk: Interest rate risk is the risk that fixed income securities will decline in value because of changes in interest rates. As nominal interest rates rise, the value of fixed income securities held by the Funds are likely to decrease. Securities with longer durations tend to be more sensitive to changes in interest rates, and are usually more volatile than securities.
Swap Contracts: Each Fund may enter into swap transactions for hedging purposes or to seek to increase total return. At the present time, the CoreCommodity Fund and Clough China Fund primarily enter into swap transactions for the purpose of increasing total return. Swap agreements may be executed in a multilateral or other trade facility program, such as a registered exchange (“centrally cleared swaps”) or may be privately negotiated in the over-the counter market. The duration of a swap agreement typically ranges from a few weeks to more than one year. In a centrally cleared swap, immediately following execution of the swap agreement, the swap agreement is novated to a central counterparty (the “CCP”) and the Fund’s counterparty on the swap agreement becomes the CCP. Risks may arise as a result of the failure of the counterparty to the swap contract to comply with the terms of the swap contract. The loss incurred by the failure of a counterparty is generally limited to the net payment to be received by the Funds and/or the termination value at the end of the contract. Therefore, the Funds consider the creditworthiness of each counterparty to a contract in evaluating potential credit risk. Although centrally cleared swaps typically present less counterparty risk than non-centrally cleared swaps, a Fund that has entered into centrally cleared swaps is subject to the risk of the failure of the CCP.
Additionally, risks may arise from unanticipated movements in interest rates or in the value of the underlying reference asset or index. Entering into these agreements involves, to varying degrees, market risk, liquidity risk and elements of credit, legal and documentation risk that are not directly reflected in the amounts recognized in the Statements of Assets and Liabilities.
The Funds may pay or receive cash as collateral on these contracts which may be recorded as an asset and/or liability. The Funds must set aside liquid assets, or engage in other appropriate measures, to cover its obligations under these contracts. Swaps are marked to market daily using either pricing vendor quotations, counterparty prices or model prices and the change in value, if any, is recorded as an unrealized gain or loss. Upfront payments made and/or received by the Funds are recorded as an asset and/or liability and realized gains or losses are recognized ratably over the contract’s term/event, with the exception of forward starting interest rate swaps, whose realized gains or losses are recognized ratably from the effective start date. Periodic payments received or made on swap contracts are recorded as realized gains or losses. Gains or losses are realized upon termination of a swap contract and are recorded on the Statement of Operations.
Total return swaps are agreements in which there is an exchange of cash flows whereby one party commits to make payments based on the total return (coupons plus capital gains/losses) of an underlying instrument in exchange for fixed or floating rate interest payments. To the extent the total return of the instrument or index underlying the transaction exceeds or falls short of the offsetting interest rate obligation, the Fund will receive a payment from or make a payment to the counterparty. Credit default swaps are a type of swap agreement in which the protection “buyer” is generally obligated to pay the protection “seller” an upfront and/ or a periodic stream of payments over the term of the contract provided that no credit event, such as a default, on a reference obligation has occurred. Credit default swaps (“CDS”) are typically two-party financial contracts that transfer credit exposure between the two parties. Under a typical CDS, one party (the “seller”) receives pre-determined periodic payments from the other party (the “buyer”). The seller agrees to make compensating specific payments to the buyer if a negative credit event occurs, such as the bankruptcy or default by the issuer of the underlying debt instrument. Swap agreements held at October 31, 2018 are disclosed after the Statement of Investments.
The average notional amount of the swap positions held in the ALPS | CoreCommodity Management CompleteCommodities® Strategy Fund for the Fiscal Year Ended October 31, 2018 was $409,504,788. The average notional amount of the swap positions held in the Clough China Fund for the Fiscal Year Ended October 31, 2018 was $862,910.
Futures: Each Fund may invest in futures contracts in accordance with their investment objectives. Each Fund does so for a variety of reasons including for cash management, hedging or non-hedging purposes in an attempt to achieve the Fund’s investment objective. A futures contract provides for the future sale by one party and purchase by another party of a specified quantity of the security or other financial instrument at a specified price and time. A futures contract on an index is an agreement pursuant to which two parties agree to take or make delivery of an amount of cash equal to the difference between the value of the index at the close of the last trading day of the contract and the price at which the index contract was originally written. Futures transactions may result in losses in excess of the amount invested in the futures contract. There can be no guarantee that there will be a correlation between price movements in the hedging vehicle and in the portfolio securities being hedged. An incorrect correlation could result in a loss on both the hedged securities in a Fund and the hedging vehicle so that the portfolio return might have been greater had hedging not been attempted. There can be no assurance that a liquid market will exist at a time when a Fund seeks to close out a futures contract or a futures option position. Lack of a liquid market for any reason may prevent a Fund from liquidating an unfavorable position, and the Fund would remain obligated to meet margin requirements until the position is closed. In addition, a Fund could be exposed to risk if the counterparties to the contracts are unable to meet the terms of their contracts. With exchange traded futures, there is minimal counterparty credit risk to the Funds since futures are exchange traded and the exchange’s clearinghouse, as counterparty to all exchange traded futures, guarantees the futures against default.
Notes to Financial Statements
October 31, 2018
When a purchase or sale of a futures contract is made by a Fund, the Fund is required to deposit with its custodian (or broker, if legally permitted) a specified amount of liquid assets (“initial margin”). The margin required for a futures contract is set by the exchange on which the contract is traded and may be modified during the term of the contract. The initial margin is in the nature of a performance bond or good faith deposit on the futures contract that is returned to a Fund upon termination of the contract, assuming all contractual obligations have been satisfied. These amounts are included in Deposit with broker for futures contracts on the Statement of Assets and Liabilities. Each day a Fund may pay or receive cash, called “variation margin,” equal to the daily change in value of the futures contract. Such payments or receipts are recorded for financial statement purposes as unrealized gains or losses by a Fund. Variation margin does not represent a borrowing or loan by a Fund but is instead a settlement between a Fund and the broker of the amount one would owe the other if the futures contract expired. When the contract is closed, a Fund records a realized gain or loss equal to the difference between the value of the contract at the time it was opened and the value at the time it was closed.
The average value of futures contracts held in the ALPS | CoreCommodity Management CompleteCommodities® Strategy Fund for the Fiscal Year Ended October 31, 2018 was $54,645,180.
Option Contracts: Each Fund may enter into options transactions for hedging purposes and for non-hedging purposes such as seeking to enhance return. Each Fund may write covered put and call options on any stocks or stock indices, currencies traded on domestic and foreign securities exchanges, or futures contracts on stock indices, interest rates and currencies traded on domestic and, to the extent permitted by the CFTC, foreign exchanges. A call option on an asset written by a Fund obligates the Fund to sell the specified asset to the holder (purchaser) at a stated price (the exercise price) if the option is exercised before a specified date (the expiration date). A put option on an asset written by a Fund obligates the Fund to buy the specified asset from the purchaser at the exercise price if the option is exercised before the expiration date. Premiums received when writing options are recorded as liabilities and are subsequently adjusted to the current value of the options written. Premiums received from writing options that expire are treated as realized gains. Premiums received from writing options, which are either exercised or closed, are offset against the proceeds received or amount paid on the transaction to determine realized gains or losses which are recorded on the Statement of Operations.
Derivatives Instruments: The following tables disclose the amounts related to each Fund’s use of derivative instruments.
The effect of derivatives instruments on the Statement of Assets and Liabilities for the Fiscal Year Ended October 31, 2018:
| Risk Exposure | | Asset Location | | Fair Value | | Liability Location | | Fair Value |
| ALPS | CoreCommodity Management CompleteCommodities® Strategy Fund(a) | | | | | | | |
Commodity Contracts
(Futures Contracts) | | Unrealized appreciation on futures contracts(b) | | $ | 8,857,981 | | | Unrealized depreciation on futures contracts(b) | | $ | (6,326,110 | ) |
Commodity Contracts
(Total Return Swap Contracts) | | Unrealized appreciation on total return swap contracts | | | 1,070 | | | Unrealized depreciation on total return swap contracts | | | N/A | |
| Total | | | | $ | 8,859,051 | | | | | $ | (6,326,110 | ) |
| Risk Exposure | | Asset Location | | Fair Value | | Liability Location | | Fair Value |
| Clough China Fund | | | | | | | | |
Equity Contracts
(Total Return Swap Contracts) | | Unrealized appreciation on total return swap contracts | | | N/A | | | Unrealized depreciation on total return swap contracts | | $ | (130,616 | ) |
| Total | | | | | N/A | | | | | $ | (130,616 | ) |
| (a) | The ALPS | CoreCommodity Management CompleteCommodities® Strategy Fund consolidates the statements of assets and liabilities. |
| (b) | Represents cumulative appreciation (depreciation) of futures contracts as reported in the Consolidated Statement of Investments. Only the current day's net variation margin is reported within the Consolidated Statement of Assets and Liabilities. |
Notes to Financial Statements
October 31, 2018
The effect of derivatives instruments on the Statement of Operations for the Fiscal Year Ended October 31, 2018:
| Risk Exposure | | Statement of Operations Location | | Realized Gain/(Loss) on Derivatives Recognized in Income | | Change in Unrealized Appreciation/ (Depreciation) on Derivatives Recognized in Income |
| ALPS | CoreCommodity Management CompleteCommodities® Strategy Fund(a) | | | | | |
Equity and Commodity Contracts
(Futures Contracts) | | Net realized gain on futures contracts/ Net change in unrealized depreciation on futures contracts | | $ | 5,493,863 | | | $ | 260,536 | |
Commodity Contracts
(Total Return Swap Contracts) | | Net realized gain on total return swap contracts/Net change in unrealized depreciation on total return swap contracts | | | 7,759,107 | | | | 1,190 | |
| Total | | | | $ | 13,252,970 | | | $ | 261,726 | |
| Clough China Fund | | | | | | | | | | |
Equity Contracts
(Total Return Swap Contracts) | | Net realized gain on total return swap contracts/Net change in unrealized depreciation on total return swap contracts | | $ | (774,756 | ) | | $ | (130,616 | ) |
| Total | | | | $ | (774,756 | ) | | $ | (130,616 | ) |
| (a) | The ALPS | CoreCommodity Management CompleteCommodities® Strategy Fund consolidates the statements of operations. |
Certain derivative contracts are executed under either standardized netting agreements or, for exchange-traded derivatives, the relevant contracts for a particular exchange which contain enforceable netting provisions. A derivative netting arrangement creates an enforceable right of set-off that becomes effective, and affects the realization of settlement on individual assets, liabilities and collateral amounts, only following a specified event of default or early termination. Default events may include the failure to make payments or deliver securities timely, material adverse changes in financial condition or insolvency, the breach of minimum regulatory capital requirements, or loss of license, charter or other legal authorization necessary to perform under the contract.
The following table presents financial instruments that are subject to enforceable netting arrangements or other similar agreements as of October 31, 2018:
| Offsetting of Derivatives Asset | | | | | | | | | | | | |
| October 31, 2018 | | | | | | | | | | | | |
| | | | | | | | | Gross Amounts Not Offset in the Statement of Financial Position |
| | | Gross Amounts of Recognized Assets | | Gross Amounts Offset in the Statement of Assets and Liabilities | | Net Amounts Presented in the Statement of Assets and Liabilities | | Financial Instruments(a) | | Cash Collateral Received(a) | | Net Amount |
| ALPS | CoreCommodity Management CompleteCommodities® Strategy Fund | | | | | | | | | | | | | |
| Total Return Swap Contracts | | $ | 1,070 | | | $ | – | | | $ | 1,070 | | | $ | (1,070 | ) | | $ | – | | | $ | – | |
| Total | | $ | 1,070 | | | $ | – | | | $ | 1,070 | | | $ | (1,070 | ) | | $ | – | | | $ | – | |
| (a) | These amounts are limited to the derivative asset/liability balance and, accordingly, do not include excess collateral received/pledged. |
Notes to Financial Statements
October 31, 2018
Offsetting of Derivatives Liability
October 31, 2018
| | | | | | | | | | | | Gross Amounts Not Offset in the Statement of Financial Position | |
| | | Gross Amounts of Recognized Liabilities | | | Gross Amounts Offset in the Statement of Assets and Liabilities | | | Net Amounts Presented in the Statement of Assets and Liabilities | | | Financial Instruments | | | Cash Collateral Pledged | | | Net Amount | |
| Clough China Fund | | | | | | | | | | | | | | | | | | |
| Total Return Swap Contracts | | $ | 130,616 | | | $ | – | | | $ | 130,616 | | | $ | (130,616 | ) | | $ | – | | | $ | – | |
| Total | | $ | 130,616 | | | $ | – | | | $ | 130,616 | | | $ | (130,616 | ) | | $ | – | | | $ | – | |
4. TAX BASIS INFORMATION
Tax Basis of Distributions to Shareholders: The character of distributions made during the year from net investment income or net realized gains may differ from its ultimate characterization for federal income tax purposes. Also, due to the timing of dividend distributions, the fiscal year in which amounts are distributed may differ from the fiscal year in which the income or realized gain were recorded by a Fund. The amounts and characteristics of tax basis distributions and composition of distributable earnings/(accumulated losses) are finalized at fiscal year-end.
The tax character of distributions paid by the Funds for the Fiscal Year Ended October 31, 2018 were as follows:
| Fund | | Ordinary Income | | | Long-Term Capital Gain | | | Return of Capital | |
| ALPS | CoreCommodity Management CompleteCommodities® Strategy Fund | | $ | 13,217,549 | | | $ | – | | | | – | |
| ALPS | Kotak India Growth Fund | | | – | | | | 883,873 | | | | – | |
| ALPS | Smith Short Duration Bond Fund | | | 68,617 | | | | – | | | | – | |
| ALPS | Smith Total Return Bond Fund | | | 69,423 | | | | – | | | | – | |
| ALPS | Red Rocks Listed Private Equity Fund | | | 19,472,820 | | | | 6,561,622 | | | | – | |
| ALPS | WMC Research Value Fund | | | 2,768,412 | | | | 4,591,672 | | | | – | |
| Clough China Fund | | | 225,398 | | | | – | | | | – | |
| RiverFront Asset Allocation Moderate | | | 1,365,082 | | | | 4,262,007 | | | | – | |
| RiverFront Asset Allocation Aggressive | | | 785,002 | | | | 1,660,504 | | | | – | |
| RiverFront Asset Allocation Growth | | | 359,997 | | | | 195,360 | | | | – | |
| RiverFront Asset Allocation Growth & Income | | | 1,298,807 | | | | 1,757,875 | | | | – | |
| RiverFront Asset Allocation Income & Growth | | | 174,303 | | | | 184,603 | | | | – | |
The tax character of distributions paid by the Funds for the Fiscal Year Ended October 31, 2017 were as follows:
| Fund | | Ordinary Income | | | Long-Term Capital Gain | | | Return of Capital | |
| ALPS | CoreCommodity Management CompleteCommodities® Strategy Fund | | $ | 507,017 | | | $ | – | | | | – | |
| ALPS | Kotak India Growth Fund | | | – | | | | 203,399 | | | | – | |
| ALPS | Red Rocks Listed Private Equity Fund | | | 3,499,952 | | | | – | | | | – | |
| ALPS | WMC Research Value Fund | | | 153,642 | | | | 2,752,711 | | | | – | |
| Clough China Fund | | | 103,112 | | | | – | | | | – | |
| RiverFront Asset Allocation Moderate | | | 1,450,017 | | | | – | | | | – | |
| RiverFront Asset Allocation Aggressive | | | 776,294 | | | | – | | | | – | |
| RiverFront Asset Allocation Growth | | | 482,397 | | | | – | | | | – | |
| RiverFront Asset Allocation Growth & Income | | | 889,374 | | | | – | | | | – | |
| RiverFront Asset Allocation Income & Growth | | | 126,975 | | | | – | | | | – | |
Components of Distributable Earnings on a Tax Basis: At October 31, 2018, permanent differences in book and tax accounting were reclassified. These differences had no effect on net assets and were primarily attributed to differences in the treatment of commodity related
Notes to Financial Statements
October 31, 2018
controlled foreign corporations, securities redeemed in kind, the differing tax treatment of foreign currency, investments in partnerships, Passive Foreign Investment Companies (“PFICs”) and certain other investments.
For the fiscal year ended October 31, 2018, the following reclassifications, which had no impact on results of operations or net assets, were recorded to reflect tax character:
| Fund | | Paid-in Capital | | | Distributable earnings | |
| ALPS | CoreCommodity Management CompleteCommodities® Strategy Fund | | $ | (781,211 | ) | | $ | 781,211 | |
| ALPS | Kotak India Growth Fund | | | (56,245 | ) | | | 56,245 | |
| ALPS | Red Rocks Listed Private Equity Fund | | | (81,120 | ) | | | 81,120 | |
| Clough China Fund | | | (346,222 | ) | | | 346,222 | |
| RiverFront Asset Allocation Moderate | | | 1,785,075 | | | | (1,785,075 | ) |
| RiverFront Asset Allocation Aggressive | | | 1,798,601 | | | | (1,798,601 | ) |
| RiverFront Asset Allocation Growth | | | 890,413 | | | | (890,413 | ) |
| RiverFront Asset Allocation Growth & Income | | | 1,524,496 | | | | (1,524,496 | ) |
| RiverFront Asset Allocation Income & Growth | | | 97,897 | | | | (97,897 | ) |
Included in the amounts reclassified was a net operating loss offset to Paid-in Capital as follows:
| Fund | | Amount | |
| ALPS | Kotak India Growth Fund | | $ | 56,245 | |
| Clough China Fund | | | 346,222 | |
As of October 31, 2018, the components of distributable earnings on a tax basis were as follows:
| | | Undistributed net investment income | | | Accumulated net realized gain/(loss) on investments | | | Other cumulative effect of timing differences | | | Net unrealized appreciation/(depreciation) on investments | | | Total | |
| ALPS | CoreCommodity Management CompleteCommodities® Strategy Fund | | $ | 18,125,978 | | | $ | (49,999,981 | ) | | $ | – | | | $ | (9,619,351 | ) | | $ | (41,493,354 | ) |
| ALPS | Kotak India Growth Fund | | | (140,491 | ) | | | 1,429,373 | | | | – | | | | (96,326 | ) | | | 1,192,556 | |
| ALPS | Smith Short Duration Bond Fund | | | 13,400 | | | | – | | | | – | | | | (36,968 | ) | | | (23,568 | ) |
| ALPS | Smith Total Return Bond Fund | | | 41,012 | | | | – | | | | – | | | | (67,930 | ) | | | (26,918 | ) |
| ALPS | Red Rocks Listed Private Equity Fund | | | 2,066,828 | | | | 7,073,196 | | | | – | | | | 12,968,575 | | | | 22,108,599 | |
| ALPS | WMC Research Value Fund | | | 2,080,941 | | | | 5,378,221 | | | | – | | | | 3,904,171 | | | | 11,363,333 | |
| Clough China Fund | | | – | | | | 2,916,094 | | | | (15,604 | ) | | | 4,452,272 | | | | 7,352,762 | |
| RiverFront Asset Allocation Moderate | | | 439,422 | | | | 9,461,768 | | | | – | | | | (2,573,827 | ) | | | 7,327,363 | |
| RiverFront Asset Allocation Aggressive | | | 406,125 | | | | 9,149,641 | | | | – | | | | (3,233,631 | ) | | | 6,322,135 | |
| RiverFront Asset Allocation Growth | | | 244,186 | | | | 4,778,551 | | | | – | | | | (1,571,902 | ) | | | 3,450,835 | |
| RiverFront Asset Allocation Growth & Income | | | – | | | | 10,290,034 | | | | – | | | | (4,328,686 | ) | | | 5,961,348 | |
| RiverFront Asset Allocation Income & Growth | | | 78,597 | | | | 554,936 | | | | – | | | | (289,751 | ) | | | 343,782 | |
Notes to Financial Statements
October 31, 2018
Capital Losses: Under current law, capital losses maintain their character as short-term or long-term and are carried forward to the next tax year without expiration. As of October 31, 2018 the following amounts are available as carry forwards to the next tax year:
Capital losses deferred to next tax year were as follows:
| Fund | | Short-Term | | | Long-Term | |
| ALPS | CoreCommodity Management CompleteCommodities® Strategy Fund | | $ | 25,789,868 | | | $ | 24,210,113 | |
Capital loss carryovers used during the period ended October 31, 2018 were:
| Fund | | Amount | |
| Clough China Fund | | $ | 4,908,264 | |
| | | | | |
The following funds elected to defer to the period ending October 31, 2019, late year ordinary losses:
| Fund | | Amount | |
| ALPS | Kotak India Growth Fund | | $ | 140,491 | |
| Clough China Fund | | | 15,604 | |
Unrealized Appreciation and Depreciation on Investments: As of October 31, 2018, the costs of investments for federal income tax purposes and accumulated net unrealized appreciation/(depreciation) on investments were as follows:
| Fund | | Gross Appreciation (excess of value over tax cost) | | | Gross Depreciation (excess of tax cost over value) | | | Net Appreciation of Foreign Currency | | | Net Unrealized Appreciation/(Depreciation) | | | Cost of Investments for Income Tax Purposes | |
| ALPS | CoreCommodity Management CompleteCommodities® Strategy Fund | | $ | 474,110,676 | | | $ | (483,721,130 | ) | | $ | (8,897 | ) | | $ | (9,619,351 | ) | | $ | 648,800,538 | |
| ALPS | Kotak India Growth Fund | | | 2,579,944 | | | | (2,674,528 | ) | | | (1,742 | ) | | | (96,326 | ) | | | 20,932,344 | |
| ALPS | Smith Short Duration Bond Fund | | | 626 | | | | (37,594 | ) | | | – | | | | (36,968 | ) | | | 14,368,852 | |
| ALPS | Smith Total Return Bond Fund | | | 9,510 | | | | (77,440 | ) | | | – | | | | (67,930 | ) | | | 11,031,655 | |
| ALPS | Red Rocks Listed Private Equity Fund | | | 24,458,089 | | | | (11,423,142 | ) | | | (66,372 | ) | | | 12,968,575 | | | | 218,472,737 | |
| ALPS | WMC Research Value Fund | | | 10,194,574 | | | | (6,290,403 | ) | | | – | | | | 3,904,171 | | | | 79,965,524 | |
| Clough China Fund | | | 5,941,663 | | | | (1,489,158 | ) | | | (233 | ) | | | 4,452,272 | | | | 29,201,981 | |
| RiverFront Asset Allocation Moderate | | | – | | | | (2,573,826 | ) | | | (1 | ) | | | (2,573,827 | ) | | | 80,104,232 | |
| RiverFront Asset Allocation Aggressive | | | – | | | | (3,233,631 | ) | | | – | | | | (3,233,631 | ) | | | 50,579,582 | |
| RiverFront Asset Allocation Growth | | | – | | | | (1,571,902 | ) | | | – | | | | (1,571,902 | ) | | | 30,663,496 | |
| RiverFront Asset Allocation Growth & Income | | | – | | | | (4,328,686 | ) | | | – | | | | (4,328,686 | ) | | | 88,361,446 | |
| RiverFront Asset Allocation Income & Growth | | | – | | | | (289,751 | ) | | | – | | | | (289,751 | ) | | | 10,069,570 | |
Notes to Financial Statements
October 31, 2018
5. SECURITIES TRANSACTIONS
Purchases and sales of securities, excluding short-term securities and U.S. Government Obligations during the Fiscal Year Ended October 31, 2018 were as follows:
| Fund | | Purchases of Securities | | | Proceeds from Sales of Securities | |
| ALPS | CoreCommodity Management CompleteCommodities® Strategy Fund(a) | | $ | 122,933,816 | | | $ | 112,977,014 | |
| ALPS | Kotak India Growth Fund(b) | | | 7,094,141 | | | | 12,860,727 | |
| ALPS | Smith Short Duration Bond Fund | | | 28,386,066 | | | | 21,936,114 | |
| ALPS | Smith Total Return Bond Fund | | | 30,544,486 | | | | 24,428,100 | |
| ALPS | Red Rocks Listed Private Equity Fund | | | 101,922,772 | | | | 68,174,960 | |
| ALPS | WMC Research Value Fund | | | 67,270,747 | | | | 75,917,216 | |
| Clough China Fund | | | 68,266,085 | | | | 86,974,665 | |
| RiverFront Asset Allocation Moderate | | | 179,710,588 | | | | 194,617,484 | |
| RiverFront Asset Allocation Aggressive | | | 112,533,386 | | | | 122,065,332 | |
| RiverFront Asset Allocation Growth | | | 66,974,985 | | | | 69,696,400 | |
| RiverFront Asset Allocation Growth & Income | | | 185,929,056 | | | | 176,022,377 | |
| RiverFront Asset Allocation Income & Growth | | | 22,894,209 | | | | 24,418,922 | |
Purchases and sales of U.S. Government Obligations during the Fiscal Year Ended October 31, 2018 were as follows:
| Fund | | Purchases of Securities | | | Proceeds from Sales of Securities | |
| ALPS | CoreCommodity Management CompleteCommodities® Strategy Fund(a) | | $ | 306,360,838 | | | $ | 129,364,449 | |
| ALPS | Smith Short Duration Bond Fund | | | 13,221,633 | | | | 5,456,128 | |
| ALPS | Smith Total Return Bond Fund | | | 11,829,799 | | | | 7,251,816 | |
| (a) | Purchases and sales for ALPS | CoreCommodity Management CompleteCommodities® Strategy Fund are consolidated and include the balances of CoreCommodity Management Cayman Commodity Fund, Ltd. (wholly owned subsidiary). |
| (b) | Purchases and sales for ALPS | Kotak India Growth Fund are consolidated and include the balances of Kotak Mauritius Portfolio (wholly owned subsidiary). |
6. BENEFICIAL INTEREST TRANSACTIONS
Shares redeemed within 90 days of purchase for ALPS | Red Rocks Listed Private Equity Fund, ALPS | Smith Total Return Bond Fund, and ALPS | Smith Short Duration Bond Fund and 30 days of purchase for ALPS | CoreCommodity Management CompleteCommodities® Strategy Fund, ALPS | Kotak India Growth Fund, and Clough China Fund, may incur a 2% short-term redemption fee deducted from the redemption amount. The ALPS | WMC Research Value Fund, RiverFront Asset Allocation Aggressive, RiverFront Asset Allocation Growth, RiverFront Asset Allocation Growth & Income, RiverFront Asset Allocation Moderate and RiverFront Asset Allocation Income & Growth shares do not incur redemption fees.
Effective December 1, 2017, Class A shares were renamed Investor Class shares for all Funds. Such shares will be offered without an initial sales charge or a contingent deferred sales charge. The RiverFront Asset Allocation Aggressive existing Investor shares were renamed Investor Class II shares.
Notes to Financial Statements
October 31, 2018
For the Fiscal Year Ended October 31, 2018, the amounts listed below were retained by the Funds. These amounts are reflected in “Shares redeemed” in the Statements of Changes in Net Assets.
| | | Redemption Fee Retained | |
| Fund | | For the Year Ended October 31, 2018 | | | For the Year Ended October 31, 2017 | |
| ALPS | CoreCommodity Management CompleteCommodities® Strategy Fund - Investor Class(a) | | $ | 953 | | | $ | 4,451 | |
| ALPS | CoreCommodity Management CompleteCommodities® Strategy Fund - Class I | | | 1,825 | | | | 21,419 | |
| ALPS | Kotak India Growth Fund - Investor Class(a) | | | 780 | | | | 1,637 | |
| ALPS | Kotak India Growth Fund - Class I | | | 1,310 | | | | 5,965 | |
| ALPS | Smith Short Duration Bond Fund - Class I | | | 20 | | | | – | |
| ALPS | Red Rocks Listed Private Equity Fund - Investor Class(a) | | | 2,739 | | | | 4,962 | |
| ALPS | Red Rocks Listed Private Equity Fund - Class C | | | – | | | | 476 | |
| ALPS | Red Rocks Listed Private Equity Fund - Class I | | | 20,134 | | | | 35,027 | |
| Clough China Fund - Investor Class(a) | | | 104 | | | | – | |
| Clough China Fund - Class C | | | – | | | | 2 | |
| Clough China Fund - Class I | | | – | | | | 260 | |
| (a) | Prior to December 1, 2017, Investor Class was known as Class A. |
Transactions in shares of capital stock were as follows:
| | | ALPS | CoreCommodity Management CompleteCommodities® Strategy Fund | |
| | | For the Year Ended October 31, 2018 | | | For the Year Ended October 31, 2017 | |
| Investor Class(a) | | | | | | | | |
| Shares sold | | | 2,404,798 | | | | 3,889,576 | |
| Dividends reinvested | | | 149,637 | | | | 1,656 | |
| Shares redeemed | | | (2,354,591 | ) | | | (1,668,511 | ) |
| Net increase in shares outstanding | | | 199,844 | | | | 2,222,721 | |
| Class A(b) | | | | | | | | |
| Shares sold | | | 25,286 | | | | – | |
| Net increase in shares outstanding | | | 25,286 | | | | – | |
| Class C | | | | | | | | |
| Shares sold | | | 546,396 | | | | 518,522 | |
| Dividends reinvested | | | 15,808 | | | | – | |
| Shares redeemed | | | (282,859 | ) | | | (507,012 | ) |
| Net increase in shares outstanding | | | 279,345 | | | | 11,510 | |
| Class I | | | | | | | | |
| Shares sold | | | 40,931,672 | | | | 28,571,916 | |
| Dividends reinvested | | | 1,409,828 | | | | 58,580 | |
| Shares redeemed | | | (19,960,935 | ) | | | (29,134,584 | ) |
| Net increase/(decrease) in shares outstanding | | | 22,380,565 | | | | (504,088 | ) |
Notes to Financial Statements
October 31, 2018
| | | ALPS | Kotak India Growth Fund | |
| | | For the Year Ended October 31, 2018 | | | For the Year Ended October 31, 2017 | |
| Investor Class(a) | | | | | | | | |
| Shares sold | | | 108,593 | | | | 451,420 | |
| Dividends reinvested | | | 17,076 | | | | 4,607 | |
| Shares redeemed | | | (286,012 | ) | | | (267,927 | ) |
| Net increase/(decrease) in shares outstanding | | | (160,343 | ) | | | 188,100 | |
| Class A(b) | | | | | | | | |
| Shares sold | | | 720 | | | | – | |
| Net increase in shares outstanding | | | 720 | | | | – | |
| Class C | | | | | | | | |
| Shares sold | | | 36,610 | | | | 17,209 | |
| Dividends reinvested | | | 4,697 | | | | 2,156 | |
| Shares redeemed | | | (13,351 | ) | | | (27,512 | ) |
| Net increase/(decrease) in shares outstanding | | | 27,956 | | | | (8,147 | ) |
| Class I | | | | | | | | |
| Shares sold | | | 465,614 | | | | 810,244 | |
| Dividends reinvested | | | 33,509 | | | | 8,955 | |
| Shares redeemed | | | (696,418 | ) | | | (258,515 | ) |
| Net increase/(decrease) in shares outstanding | | | (197,295 | ) | | | 560,684 | |
| | | ALPS | Smith Short Duration Bond Fund | |
| | | For the Period July 2, 2018 (Commencement) to October 31, 2018 | |
| Investor Class | | | |
| Shares sold | | | 49,021 | |
| Dividends reinvested | | | 197 | |
| Shares redeemed | | | (11 | ) |
| Net increase in shares outstanding | | | 49,207 | |
| Class A | | | | |
| Shares sold | | | 11,000 | |
| Dividends reinvested | | | 52 | |
| Net increase in shares outstanding | | | 11,052 | |
| Class C | | | | |
| Shares sold | | | 37,049 | |
| Dividends reinvested | | | 61 | |
| Net increase in shares outstanding | | | 37,110 | |
| Class I | | | | |
| Shares sold | | | 1,357,229 | |
| Dividends reinvested | | | 5,782 | |
| Shares redeemed | | | (1,080 | ) |
| Net increase in shares outstanding | | | 1,361,931 | |
Notes to Financial Statements
October 31, 2018
| | | ALPS | Smith Total Return Bond Fund | |
| | | For the Period July 2, 2018 (Commencement) to October 31, 2018 | |
| Investor Class | | | |
| Shares sold | | | 34,199 | |
| Dividends reinvested | | | 114 | |
| Net increase in shares outstanding | | | 34,313 | |
| Class A | | | | |
| Shares sold | | | 13,470 | |
| Dividends reinvested | | | 70 | |
| Net increase in shares outstanding | | | 13,540 | |
| Class C | | | | |
| Shares sold | | | 11,990 | |
| Dividends reinvested | | | 47 | |
| Net increase in shares outstanding | | | 12,037 | |
| Class I | | | | |
| Shares sold | | | 1,039,889 | |
| Dividends reinvested | | | 6,526 | |
| Shares redeemed | | | (1,224 | ) |
| Net increase in shares outstanding | | | 1,045,191 | |
| | | ALPS | Red Rocks Listed Private Equity Fund | |
| | | For the Year Ended October 31, 2018 | | | For the Year Ended October 31, 2017 | |
| Investor Class(a) | | | | | | | | |
| Shares sold | | | 1,662,283 | | | | 3,003,290 | |
| Dividends reinvested | | | 732,595 | | | | 102,237 | |
| Shares redeemed | | | (4,027,177 | ) | | | (16,688,308 | ) |
| Net decrease in shares outstanding | | | (1,632,299 | ) | | | (13,582,781 | ) |
| Class A(b) | | | | | | | | |
| Shares sold | | | 1,383 | | | | – | |
| Net increase in shares outstanding | | | 1,383 | | | | – | |
| Class C | | | | | | | | |
| Shares sold | | | 711,785 | | | | 597,701 | |
| Dividends reinvested | | | 252,360 | | | | 23,898 | |
| Shares redeemed | | | (501,413 | ) | | | (592,966 | ) |
| Net increase in shares outstanding | | | 462,732 | | | | 28,633 | |
| Class I | | | | | | | | |
| Shares sold | | | 12,482,220 | | | | 6,802,383 | |
| Dividends reinvested | | | 1,953,871 | | | | 321,770 | |
| Shares redeemed | | | (6,207,321 | ) | | | (18,513,141 | ) |
| Net increase/(decrease) in shares outstanding | | | 8,228,770 | | | | (11,388,988 | ) |
| Class R | | | | | | | | |
| Shares sold | | | 304,915 | | | | 208,338 | |
| Dividends reinvested | | | 99,325 | | | | 8,991 | |
| Shares redeemed | | | (196,766 | ) | | | (130,252 | ) |
| Net increase in shares outstanding | | | 207,474 | | | | 87,077 | |
Notes to Financial Statements
October 31, 2018
| | | ALPS | WMC Research Value Fund | |
| | | For the Year Ended October 31, 2018 | | | For the Year Ended October 31, 2017 | |
| Investor Class(a) | | | | | | | | |
| Shares sold | | | 42,650 | | | | 68,781 | |
| Dividends reinvested | | | 434,186 | | | | 174,464 | |
| Shares redeemed | | | (404,481 | ) | | | (915,327 | ) |
| Net increase/(decrease) in shares outstanding | | | 72,355 | | | | (672,082 | ) |
| Class A(b) | | | | | | | | |
| Shares sold | | | 1,098 | | | | – | |
| Net increase in shares outstanding | | | 1,098 | | | | – | |
| Class C | | | | | | | | |
| Shares sold | | | 2,017 | | | | 31,430 | |
| Dividends reinvested | | | 5,073 | | | | 814 | |
| Shares redeemed | | | (2,591 | ) | | | (6,219 | ) |
| Net increase in shares outstanding | | | 4,499 | | | | 26,025 | |
| Class I | | | | | | | | |
| Shares sold | | | 370,387 | | | | 400,927 | |
| Dividends reinvested | | | 351,365 | | | | 145,301 | |
| Shares redeemed | | | (1,014,778 | ) | | | (1,110,893 | ) |
| Net decrease in shares outstanding | | | (293,026 | ) | | | (564,665 | ) |
| | | Clough China Fund | |
| | | For the Year Ended October 31, 2018 | | | For the Year Ended October 31, 2017 | |
| Investor Class(a) | | | | | | | | |
| Shares sold | | | 27,347 | | | | 55,498 | |
| Dividends reinvested | | | 1,040 | | | | 537 | |
| Shares redeemed | | | (115,807 | ) | | | (283,590 | ) |
| Net decrease in shares outstanding | | | (87,420 | ) | | | (227,555 | ) |
| Class A(b) | | | | | | | | |
| Shares sold | | | 334 | | | | – | |
| Net increase in shares outstanding | | | 334 | | | | – | |
| Class C | | | | | | | | |
| Shares sold | | | 7,100 | | | | 6,134 | |
| Shares redeemed | | | (52,565 | ) | | | (165,403 | ) |
| Net decrease in shares outstanding | | | (45,465 | ) | | | (159,269 | ) |
| Class I | | | | | | | | |
| Shares sold | | | 71,945 | | | | 103,059 | |
| Dividends reinvested | | | 4,707 | | | | 2,890 | |
| Shares redeemed | | | (348,611 | ) | | | (401,464 | ) |
| Net decrease in shares outstanding | | | (271,959 | ) | | | (295,515 | ) |
Notes to Financial Statements
October 31, 2018
| | | RiverFront Asset Allocation Aggressive | |
| | | For the Year Ended October 31, 2018 | | | For the Year Ended October 31, 2017 | |
| Investor Class(a) | | | | | | | | |
| Shares sold | | | 19,583 | | | | 136,919 | |
| Dividends reinvested | | | 20,763 | | | | 9,084 | |
| Shares redeemed | | | (281,867 | ) | | | (307,093 | ) |
| Net decrease in shares outstanding | | | (241,521 | ) | | | (161,090 | ) |
| Class A | | | | | | | | |
| Shares sold | | | 612 | | | | – | |
| Net increase in shares outstanding | | | 612 | | | | – | |
| Class C | | | | | | | | |
| Shares sold | | | 72,213 | | | | 86,083 | |
| Dividends reinvested | | | 26,131 | | | | 10,065 | |
| Shares redeemed | | | (146,179 | ) | | | (302,889 | ) |
| Net decrease in shares outstanding | | | (47,835 | ) | | | (206,741 | ) |
| Class I | | | | | | | | |
| Shares sold | | | 265,198 | | | | 369,904 | |
| Dividends reinvested | | | 31,757 | | | | 9,170 | |
| Shares redeemed | | | (281,700 | ) | | | (277,778 | ) |
| Net increase in shares outstanding | | | 15,255 | | | | 101,296 | |
| Investor II(b) | | | | | | | | |
| Shares sold | | | 2,358 | | | | 10,915 | |
| Dividends reinvested | | | 7,256 | | | | 3,773 | |
| Shares redeemed | | | (82,077 | ) | | | (147,896 | ) |
| Net decrease in shares outstanding | | | (72,463 | ) | | | (133,208 | ) |
| Class L | | | | | | | | |
| Shares sold | | | 121,715 | | | | 210,187 | |
| Dividends reinvested | | | 61,594 | | | | 21,882 | |
| Shares redeemed | | | (407,438 | ) | | | (344,426 | ) |
| Net decrease in shares outstanding | | | (224,129 | ) | | | (112,357 | ) |
| | | RiverFront Asset Allocation Growth | |
| | | For the Year Ended October 31, 2018 | | | For the Year Ended October 31, 2017 | |
| Investor Class(a) | | | | | | | | |
| Shares sold | | | 98,940 | | | | 115,445 | |
| Dividends reinvested | | | 8,226 | | | | 7,192 | |
| Shares redeemed | | | (174,218 | ) | | | (138,100 | ) |
| Net decrease in shares outstanding | | | (67,052 | ) | | | (15,463 | ) |
| Class A(b) | | | | | | | | |
| Shares sold | | | 686 | | | | – | |
| Net increase in shares outstanding | | | 686 | | | | – | |
| Class C | | | | | | | | |
| Shares sold | | | 106,471 | | | | 64,487 | |
| Dividends reinvested | | | 12,414 | | | | 14,239 | |
| Shares redeemed | | | (180,953 | ) | | | (514,635 | ) |
| Net decrease in shares outstanding | | | (62,068 | ) | | | (435,909 | ) |
| Class I | | | | | | | | |
| Shares sold | | | 216,234 | | | | 215,017 | |
| Dividends reinvested | | | 17,824 | | | | 17,053 | |
| Shares redeemed | | | (297,249 | ) | | | (360,729 | ) |
| Net decrease in shares outstanding | | | (63,191 | ) | | | (128,659 | ) |
Notes to Financial Statements
October 31, 2018
| | | RiverFront Asset Allocation Growth & Income | |
| | | For the Year Ended October 31, 2018 | | | For the Year Ended October 31, 2017 | |
| Investor Class(a) | | | | | | | | |
| Shares sold | | | 79,468 | | | | 157,001 | |
| Dividends reinvested | | | 33,034 | | | | 16,322 | |
| Shares redeemed | | | (755,337 | ) | | | (486,851 | ) |
| Net decrease in shares outstanding | | | (642,835 | ) | | | (313,528 | ) |
| Class A(b) | | | | | | | | |
| Shares sold | | | 929 | | | | – | |
| Dividends reinvested | | | 8 | | | | – | |
| Net increase in shares outstanding | | | 937 | | | | – | |
| Class C | | | | | | | | |
| Shares sold | | | 222,766 | | | | 180,831 | |
| Dividends reinvested | | | 60,921 | | | | 17,535 | |
| Shares redeemed | | | (382,009 | ) | | | (977,253 | ) |
| Net decrease in shares outstanding | | | (98,322 | ) | | | (778,887 | ) |
| Class I | | | | | | | | |
| Shares sold | | | 2,141,952 | | | | 596,156 | |
| Dividends reinvested | | | 109,646 | | | | 28,707 | |
| Shares redeemed | | | (687,808 | ) | | | (643,862 | ) |
| Net increase/(decrease) in shares outstanding | | | 1,563,790 | | | | (18,999 | ) |
| | | RiverFront Asset Allocation Moderate | |
| | | For the Year Ended October 31, 2018 | | | For the Year Ended October 31, 2017 | |
| Investor Class(a) | | | | | | | | |
| Shares sold | | | 26,370 | | | | 126,709 | |
| Dividends reinvested | | | 59,429 | | | | 20,379 | |
| Shares redeemed | | | (438,211 | ) | | | (1,102,129 | ) |
| Net decrease in shares outstanding | | | (352,412 | ) | | | (955,041 | ) |
| Class A(b) | | | | | | | | |
| Shares sold | | | 815 | | | | – | |
| Dividends reinvested | | | 8 | | | | – | |
| Net increase in shares outstanding | | | 823 | | | | – | |
| Class C | | | | | | | | |
| Shares sold | | | 162,540 | | | | 242,966 | |
| Dividends reinvested | | | 209,832 | | | | 36,880 | |
| Shares redeemed | | | (942,609 | ) | | | (1,835,084 | ) |
| Net decrease in shares outstanding | | | (570,237 | ) | | | (1,555,238 | ) |
| Class I | | | | | | | | |
| Shares sold | | | 629,128 | | | | 707,650 | |
| Dividends reinvested | | | 155,323 | | | | 47,006 | |
| Shares redeemed | | | (814,842 | ) | | | (2,117,519 | ) |
| Net decrease in shares outstanding | | | (30,391 | ) | | | (1,362,863 | ) |
Notes to Financial Statements
October 31, 2018
| | | RiverFront Asset Allocation Income & Growth | |
| | | For the Year Ended October 31, 2018 | | | For the Year Ended October 31, 2017 | |
| Investor Class(a) | | | | | | | | |
| Shares sold | | | 7,500 | | | | 60,353 | |
| Dividends reinvested | | | 2,997 | | | | 731 | |
| Shares redeemed | | | (95,327 | ) | | | (58,800 | ) |
| Net increase/(decrease) in shares outstanding | | | (84,830 | ) | | | 2,284 | |
| Class A(b) | | | | | | | | |
| Shares sold | | | 899 | | | | – | |
| Dividends reinvested | | | 10 | | | | – | |
| Net increase in shares outstanding | | | 909 | | | | – | |
| Class C | | | | | | | | |
| Shares sold | | | 49,920 | | | | 110,766 | |
| Dividends reinvested | | | 15,187 | | | | 6,450 | |
| Shares redeemed | | | (175,457 | ) | | | (573,252 | ) |
| Net decrease in shares outstanding | | | (110,350 | ) | | | (456,036 | ) |
| Class I | | | | | | | | |
| Shares sold | | | 177,209 | | | | 86,411 | |
| Dividends reinvested | | | 11,153 | | | | 2,763 | |
| Shares redeemed | | | (72,922 | ) | | | (56,358 | ) |
| Net increase in shares outstanding | | | 115,440 | | | | 32,816 | |
| (a) | Prior to December 1, 2017, Investor Class was known as Class A. |
| (b) | Prior to December 1, 2017, Investor Class II was known as Investor Class. |
7. AFFILIATED COMPANIES
Funds may invest in certain securities that are considered securities issued by affiliated companies. As defined by the Investment Company Act of 1940, an affiliated person, including an affiliated company, is one in which a Fund owns 5% or more of the outstanding voting securities, or a company which is under common ownership or control with the Fund. The purchases, sales, dividend income, realized gains or losses, change in unrealized gains or losses, shares and value of investments in affiliated companies for the year ended October 31, 2018 were as follows:
| RiverFront Asset Allocation Aggressive | | Share Balance as of October 31, 2017 | | | Purchases | | | Sales | | | Share Balance as of October 31, 2018 | | | Dividends | | | Change in Unrealized Gain (Loss) | | | Realized Gain/Loss | | | Market Value as of October 31, 2018 | |
| First Trust RiverFront Dynamic Asia Pacific ETF | | | – | | | | 55,426 | | | | (6,377 | ) | | | 49,049 | | | $ | 39,111 | | | $ | (459,089 | ) | | $ | (25,292 | ) | | $ | 2,531,909 | |
| RiverFront Dynamic US Dividend Advantage ETF | | | – | | | | 186,787 | | | | (21,947 | ) | | | 164,840 | | | | 73,322 | | | | (274,261 | ) | | | 8,798 | | | | 5,063,258 | |
| First Trust RiverFront Dynamic Developed International ETF | | | – | | | | 523,795 | | | | (310,187 | ) | | | 213,608 | | | | 310,087 | | | | (953,353 | ) | | | (656,211 | ) | | | 11,868,061 | |
| First Trust RiverFront Dynamic Emerging Markets ETF | | | – | | | | 200,486 | | | | (114,657 | ) | | | 85,829 | | | | 98,244 | | | | (391,345 | ) | | | (950,323 | ) | | | 4,816,724 | |
| First Trust RiverFront Dynamic Europe ETF | | | – | | | | 157,982 | | | | (69,854 | ) | | | 88,128 | | | | 165,031 | | | | (785,221 | ) | | | (125,509 | ) | | | 5,023,296 | |
| RiverFront Dynamic US Flex-Cap ETF | | | – | | | | 580,087 | | | | (52,905 | ) | | | 527,182 | | | | 105,238 | | | | (364,506 | ) | | | 36,879 | | | | 17,360,103 | |
| | | | | | | | | | | | | | | | | | | $ | 791,033 | | | $ | (3,227,775 | ) | | $ | (1,711,658 | ) | | $ | 46,663,351 | |
Notes to Financial Statements
October 31, 2018
| RiverFront Asset Allocation Growth | | Share Balance as of October 31, 2017 | | | Purchases | | | Sales | | | Share Balance as of October 31, 2018 | | | Dividends | | | Change in Unrealized Gain (Loss) | | | Realized Gain/Loss | | | Market Value as of October 31, 2018 | |
| First Trust RiverFront Dynamic Asia Pacific ETF | | | – | | | | 19,295 | | | | (1,150 | ) | | | 18,145 | | | $ | 14,063 | | | $ | (169,833 | ) | | $ | (5,322 | ) | | $ | 936,645 | |
| RiverFront Dynamic Core Income ETF | | | – | | | | 232,898 | | | | (154,572 | ) | | | 78,326 | | | | 28,132 | | | | (28,589 | ) | | | (15,468 | ) | | | 1,844,969 | |
| RiverFront Dynamic US Dividend Advantage ETF | | | – | | | | 123,972 | | | | (7,907 | ) | | | 116,065 | | | | 50,063 | | | | (193,109 | ) | | | 3,278 | | | | 3,565,076 | |
| First Trust Riverfront Dynamic Developed International ETF | | | – | | | | 260,540 | | | | (162,648 | ) | | | 97,892 | | | | 146,629 | | | | (436,902 | ) | | | (314,834 | ) | | | 5,438,879 | |
| First Trust RiverFront Dynamic Emerging Markets ETF | | | – | | | | 91,077 | | | | (51,532 | ) | | | 39,545 | | | | 45,087 | | | | (180,310 | ) | | | (438,546 | ) | | | 2,219,265 | |
| First Trust RiverFront Dynamic Europe ETF | | | – | | | | 69,809 | | | | (42,685 | ) | | | 27,124 | | | | 60,455 | | | | (241,675 | ) | | | (64,576 | ) | | | 1,546,068 | |
| RiverFront Dynamic US Flex-Cap ETF | | | – | | | | 324,017 | | | | (12,333 | ) | | | 311,684 | | | | 59,613 | | | | (272,871 | ) | | | 4,104 | | | | 10,263,754 | |
| RiverFront Dynamic Unconstrained Income ETF | | | – | | | | 105,689 | | | | (6,825 | ) | | | 98,864 | | | | 71,023 | | | | (48,120 | ) | | | (1,500 | ) | | | 2,450,285 | |
| Riverfront Strategic Income Fund | | | 22,165 | | | | – | | | | (22,165 | ) | | | – | | | | 7,547 | | | | (25,047 | ) | | | 9,939 | | | | – | |
| | | | | | | | | | | | | | | | | | | $ | 482,612 | | | $ | (1,596,456 | ) | | $ | (822,925 | ) | | $ | 28,264,941 | |
| RiverFront Asset Allocation Growth & Income | | Share Balance as of October 31, 2017 | | | Purchases | | | Sales | | | Share Balance as of October 31, 2018 | | | Dividends | | | Change in Unrealized Gain (Loss) | | | Realized Gain/Loss | | | Market Value as of October 31, 2018 | |
| First Trust Riverfront Dynamic Asia Pacific ETF | | | – | | | | 45,352 | | | | (474 | ) | | | 44,878 | | | $ | 29,153 | | | $ | (384,349 | ) | | $ | (1,748 | ) | | $ | 2,316,602 | |
| Riverfront Dynamic Core Income ETF | | | – | | | | 1,275,501 | | | | (742,590 | ) | | | 532,911 | | | | 150,091 | | | | (192,142 | ) | | | (97,981 | ) | | | 12,552,719 | |
| Riverfront Dynamic US Dividend Advantage ETF | | | – | | | | 615,324 | | | | (11,677 | ) | | | 603,647 | | | | 225,201 | | | | (1,059,824 | ) | | | 5,512 | | | | 18,541,742 | |
| First Trust Riverfront Dynamic Developed International ETF | | | – | | | | 540,203 | | | | (277,676 | ) | | | 262,527 | | | | 299,196 | | | | (1,155,645 | ) | | | (612,822 | ) | | | 14,586,000 | |
| First Trust Riverfront Dynamic Emerging Markets ETF | | | – | | | | 180,755 | | | | (107,996 | ) | | | 72,759 | | | | 84,818 | | | | (326,497 | ) | | | (915,545 | ) | | | 4,083,235 | |
| First Trust Riverfront Dynamic Europe ETF | | | – | | | | 209,947 | | | | (122,780 | ) | | | 87,167 | | | | 128,931 | | | | (547,946 | ) | | | (236,625 | ) | | | 4,968,519 | |
| Riverfront Dynamic US Flex-Cap ETF | | | – | | | | 508,680 | | | | (5,602 | ) | | | 503,078 | | | | 92,907 | | | | (472,934 | ) | | | 11,617 | | | | 16,566,359 | |
| Riverfront Dynamic Unconstrained Income ETF | | | – | | | | 367,444 | | | | (6,191 | ) | | | 361,253 | | | | 234,953 | | | | (185,590 | ) | | | (1,713 | ) | | | 8,953,439 | |
| Riverfront Strategic Income Fund | | | 105,827 | | | | 5,798 | | | | (111,625 | ) | | | – | | | | 36,393 | | | | (132,608 | ) | | | 58,443 | | | | – | |
| | | | | | | | | | | | | | | | | | | $ | 1,281,643 | | | $ | (4,457,535 | ) | | $ | (1,790,862 | ) | | $ | 82,568,615 | |
Notes to Financial Statements
October 31, 2018
| RiverFront Asset Allocation Moderate | | Share Balance as of October 31, 2017 | | | Purchases | | | Sales | | | Share Balance as of October 31, 2018 | | | Dividends | | | Change in Unrealized Gain (Loss) | | | Realized Gain/Loss | | | Market Value as of October 31, 2018 | |
| First Trust RiverFront Dynamic Asia Pacific ETF | | | – | | | | 14,841 | | | | (1,398 | ) | | | 13,443 | | | $ | 10,491 | | | $ | (125,823 | ) | | $ | (4,944 | ) | | $ | 693,928 | |
| RiverFront Dynamic Core Income ETF | | | – | | | | 2,377,673 | | | | (1,195,518 | ) | | | 1,182,155 | | | | 466,832 | | | | (412,253 | ) | | | (260,456 | ) | | | 27,845,661 | |
| RiverFront Dynamic US Dividend Advantage ETF | | | – | | | | 802,728 | | | | (112,537 | ) | | | 690,191 | | | | 228,043 | | | | (1,295,703 | ) | | | (92,220 | ) | | | 21,200,045 | |
| First Trust RiverFront Dynamic Developed International ETF | | | – | | | | 342,285 | | | | (256,459 | ) | | | 85,826 | | | | 182,830 | | | | (383,051 | ) | | | (406,123 | ) | | | 4,768,492 | |
| First Trust RiverFront Dynamic Europe ETF | | | – | | | | 80,076 | | | | (73,960 | ) | | | 6,116 | | | | 61,962 | | | | (54,493 | ) | | | (164,643 | ) | | | 348,612 | |
| RiverFront Dynamic US Flex-Cap ETF | | | – | | | | 497,938 | | | | (43,704 | ) | | | 454,234 | | | | 109,257 | | | | (136,270 | ) | | | 16,164 | | | | 14,957,926 | |
| RiverFront Dynamic Unconstrained Income ETF | | | – | | | | 293,735 | | | | (29,859 | ) | | | 263,876 | | | | 219,365 | | | | (151,887 | ) | | | (6,734 | ) | | | 6,540,008 | |
| First Trust RiverFront Dynamic Emerging Markets ETF | | | – | | | | 24,169 | | | | (24,169 | ) | | | – | | | | 6,933 | | | | – | | | | (188,519 | ) | | | – | |
| Riverfront Strategic Income Fund | | | 178,038 | | | | – | | | | (178,038 | ) | | | – | | | | 60,409 | | | | (226,669 | ) | | | 106,662 | | | | – | |
| | | | | | | | | | | | | | | | | | | $ | 1,346,122 | | | $ | (2,786,149 | ) | | $ | (1,000,813 | ) | | $ | 76,354,672 | |
| RiverFront Asset Allocation Income & Growth | | Share Balance as of October 31, 2017 | | | Purchases | | | Sales | | | Share Balance as of October 31, 2018 | | | Dividends | | | Change in Unrealized Gain (Loss) | | | Realized Gain/Loss | | | Market Value as of October 31, 2018 | |
| First Trust RiverFront Dynamic Asia Pacific ETF | | | – | | | | 1,791 | | | | (121 | ) | | | 1,670 | | | $ | 1,255 | | | $ | (15,631 | ) | | $ | (349 | ) | | $ | 86,205 | |
| RiverFront Dynamic Core Income ETF | | | – | | | | 458,068 | | | | (213,329 | ) | | | 244,739 | | | | 102,071 | | | | (99,563 | ) | | | (51,604 | ) | | | 5,764,827 | |
| RiverFront Dynamic US Dividend Advantage ETF | | | – | | | | 72,751 | | | | (14,180 | ) | | | 58,571 | | | | 18,012 | | | | (114,882 | ) | | | (13,282 | ) | | | 1,799,079 | |
| First Trust RiverFront Dynamic Developed International ETF | | | – | | | | 20,569 | | | | (16,008 | ) | | | 4,561 | | | | 12,131 | | | | (20,356 | ) | | | (26,829 | ) | | | 253,409 | |
| First Trust RiverFront Dynamic Europe ETF | | | – | | | | 4,130 | | | | (3,483 | ) | | | 647 | | | | 2,964 | | | | (5,765 | ) | | | (6,113 | ) | | | 36,879 | |
| RiverFront Dynamic US Flex-Cap ETF | | | – | | | | 27,267 | | | | (1,902 | ) | | | 25,365 | | | | 5,808 | | | | (9,772 | ) | | | (554 | ) | | | 835,270 | |
| RiverFront Dynamic Unconstrained Income ETF | | | – | | | | 36,179 | | | | (2,626 | ) | | | 33,553 | | | | 26,993 | | | | (19,313 | ) | | | (192 | ) | | | 831,591 | |
| Riverfront Strategic Income Fund | | | 22,212 | | | | 427 | | | | (22,639 | ) | | | – | | | | 7,325 | | | | (26,260 | ) | | | 11,690 | | | | – | |
| | | | | | | | | | | | | | | | | | | $ | 176,559 | | | $ | (311,542 | ) | | $ | (87,233 | ) | | $ | 9,607,260 | |
8. MANAGEMENT AND RELATED-PARTY TRANSACTIONS
ALPS Advisors, Inc. (“AAI”), subject to the authority of the Board, is responsible for the overall management of the Funds listed below. AAI is an indirect wholly owned subsidiary of DST Systems, Inc. (“DST”), a publicly traded company listed on the New York Stock Exchange. On January 11, 2018, DST entered into an agreement and plan of merger with SS&C Technologies Holdings, Inc. (“SS&C”), a publicly traded company listed on the NASDAQ Global Select Market, and Diamond Merger Sub, Inc., a Delaware corporation and an indirect wholly owned subsidiary of SS&C (“Merger Sub”), pursuant to which Merger Sub merged with and into DST (the “Transaction”), and as a result DST became an indirect wholly owned subsidiary of SS&C. The Transaction was completed on April 16, 2018, and resulted in a change of control of AAI.
Notes to Financial Statements
October 31, 2018
In order for AAI to continue to serve as the investment adviser and the applicable sub-adviser to serve as investment sub-adviser to the applicable Funds, at an in-person meeting of the Board of Trustees of Financial Investors Trust (the “Trust”) on March 13-14, 2018 (the “Board Meeting”), the Board approved new investment advisory agreements between AAI and the Trust, on behalf of each Fund (together, the “New Advisory Agreements”), and new investment sub-advisory agreements among AAI, the Trust, on behalf of each Fund, and the applicable investment sub- adviser (together, the “New Sub-Advisory Agreements”), subject to shareholder approval (collectively, the “New Agreements”). The 1940 Act requires that investment advisory agreements be approved by a vote of a majority of the outstanding shares of a fund. Therefore, shareholders were asked to approve the New Agreements.
At the Board Meeting, the Board also approved interim investment advisory agreements between AAI and the Trust, on behalf of each Fund, and interim investment sub-advisory agreements among AAI, the Trust, on behalf of each Fund, and the applicable investment sub-adviser (the “Interim Advisory Agreements”). The Interim Advisory Agreements are effective for the earlier of 150 days from the close of the Transaction on April 16, 2018 or the date of shareholder approval of the New Advisory Agreements. Both the New Agreements and the Interim Advisory Agreements are similar in all material respects to the prior advisory agreements. All New Advisory Agreements and New Sub-Advisory Agreements were approved by the shareholders.
AAI has delegated daily management of the Funds listed below to the corresponding Sub-Advisor(s) listed in the table below. Each Sub-Advisor manages the investments of the Fund in accordance with its investment objective, policies and limitations and investment guidelines established jointly by AAI and the Board.
| Fund | Sub-Advisor(s) |
| ALPS | CoreCommodity Management CompleteCommodities® Strategy Fund | CoreCommodity Management, LLC |
| ALPS | Kotak India Growth Fund | Kotak Mahindra (UK) Limited |
| ALPS | Smith Short Duration Bond Fund | Smith Capital Investors, LLC |
| ALPS | Smith Total Return Bond Fund | Smith Capital Investors, LLC |
| ALPS | Red Rocks Listed Private Equity Fund | Red Rocks Capital, LLC(a) |
| ALPS | WMC Research Value Fund | Wellington Management Company, LLP |
| Clough China Fund | Clough Capital Partners, LP |
| RiverFront Asset Allocation Aggressive | RiverFront Investment Group, LLC |
| RiverFront Asset Allocation Growth | RiverFront Investment Group, LLC |
| RiverFront Asset Allocation Growth & Income | RiverFront Investment Group, LLC |
| RiverFront Asset Allocation Moderate | RiverFront Investment Group, LLC |
| RiverFront Asset Allocation Income & Growth | RiverFront Investment Group, LLC |
| (a) | Red Rocks Capital LLC is a subsidiary of ALPS Advisors, Inc. |
Pursuant to the Investment Advisory Agreement (the “Advisory Agreement”), the Funds listed below pay AAI an annual management fee which is based on each Fund’s average daily net assets. The management fee is paid on a monthly basis. The following table reflects the Funds’ contractual management fee rates (expressed as an annual rate).
| Fund | Contractual Management Fee |
| ALPS | CoreCommodity Management CompleteCommodities® Strategy Fund | 0.85% |
| ALPS | Kotak India Growth Fund | 1.25% |
| ALPS | Smith Short Duration Bond Fund | 0.37% |
| ALPS | Smith Total Return Bond Fund | 0.55% |
| ALPS | Red Rocks Listed Private Equity Fund | 0.85% |
| ALPS | WMC Research Value Fund | 0.95%(a) |
| Clough China Fund | 1.35% |
| (a) | The contractual management fee is 0.95% for the first $250 million of net assets, 0.85% for the next $250 million of net assets, and 0.75% for net assets in excess of $500 million. |
Notes to Financial Statements
October 31, 2018
Effective February 28, 2018, pursuant to the Administrative Services Agreement, the Riverfront Funds listed below pay an annual unitary administrative fee which is based on each Fund’s average daily net assets. The unitary administrative fee is paid on a monthly basis. The following table reflects the Funds’ contractual unitary administrative fee rates (expressed as an annual rate).
| Fund | Contractual Unitary Fee |
| RiverFront Asset Allocation Aggressive | 0.25% |
| RiverFront Asset Allocation Growth | 0.25% |
| RiverFront Asset Allocation Growth & Income | 0.25% |
| RiverFront Asset Allocation Moderate | 0.25% |
| RiverFront Asset Allocation Income & Growth | 0.25% |
Prior to February 28, 2018, pursuant to the prior Investment Advisory Agreement, the Riverfront Funds listed below paid AAI an annual management fee which is based on each Fund’s average daily net assets. The management fee was paid on a monthly basis. The following table reflects the Riverfront Funds’ prior contractual management fee rates (expressed as an annual rate).
| Fund | Contractual Management Fee |
| RiverFront Asset Allocation Aggressive | 0.85% |
| RiverFront Asset Allocation Growth | 0.85% |
| RiverFront Asset Allocation Growth & Income | 0.85% |
| RiverFront Asset Allocation Moderate | 0.85% |
| RiverFront Asset Allocation Income & Growth | 0.85% |
Pursuant to an Investment Sub-advisory Agreement, AAI pays the Sub-Advisors of the Funds listed below an annual sub-advisory management fee which is based on each Fund’s average daily assets. AAI is required to pay all fees due to each Sub-Advisor out of the management fee AAI receives from each Fund listed below. The following table reflects the Funds’ contractual sub-advisory fee rates.
| Fund | Average Daily Net Assets of the Fund | Contractual Sub-Advisory Fee |
| ALPS | CoreCommodity Management CompleteCommodities® Strategy Fund | All Asset Levels | 0.75% |
| ALPS | Kotak India Growth Fund | First $50 Million | 1.15% |
| | Over $50 Million | 1.05% |
| ALPS | Smith Short Duration Bond Fund | All Asset Levels | 0.29% |
| ALPS | Smith Total Return Bond Fund | All Asset Levels | 0.42% |
| ALPS | Red Rocks Listed Private Equity Fund | All Asset Levels | 0.57% |
| ALPS | WMC Research Value Fund | First $250 Million | 0.50% |
| | $250 Million - $500 Million | 0.40% |
| | Over $500 Million | 0.30% |
| Clough China Fund | All Asset Levels | 0.90% |
Prior to February 28, 2018 and pursuant to an Investment Sub-advisory Agreement, AAI paid the Sub-Advisor of the Funds listed below an annual sub-advisory management fee which was based on each Fund’s average daily assets. AAI was required to pay all fees due to the Sub-Advisor out of the management fee AAI received from each Fund listed below.
| Fund | Average Daily Net Assets of the Fund | Contractual Sub-Advisory Fee |
| RiverFront Asset Allocation Aggressive | All Asset Levels | 0.60% |
| RiverFront Asset Allocation Growth | All Asset Levels | 0.60% |
| RiverFront Asset Allocation Growth & Income | All Asset Levels | 0.60% |
| RiverFront Asset Allocation Moderate | All Asset Levels | 0.60% |
| RiverFront Asset Allocation Income & Growth | All Asset Levels | 0.60% |
Notes to Financial Statements
October 31, 2018
Effective January 1, 2017, Wellington Management Company, LLP temporarily and voluntarily reduced the sub-advisory fee rate on the Fund’s daily net assets of $0 to $250 million by ten basis points. This reduction will remain in effect for 12 months unless terminated earlier by Wellington Management Company, LLP. The other tiers have remained unchanged.
ALPS | CoreCommodity Management CompleteCommodities® Strategy Fund
AAI and CoreCommodity Management LLC have contractually agreed to limit the amount of the Fund’s total annual expenses, exclusive of distribution and service (12b-1) fees, shareholder services fees, acquired fund fees and expenses, brokerage commissions, interest expense, taxes and extraordinary expenses that exceed the following annual rates below.
ALPS | Kotak India Growth Fund
Prior to April 1, 2017, AAI and Kotak Mahindra (UK) Limited have contractually agreed to limit the amount of the Fund’s total annual expenses, exclusive of distribution and service (12b-1) fees, shareholder services fees, acquired fund fees and expenses, brokerage expenses, interest expenses, taxes and extraordinary expenses that exceed the following annual rates below. Effective April 1, 2017, Kotak entered into a Novation Agreement with the Fund, AAI and Kotak Mahindra Asset Management (Singapore) Pte. Ltd. (“KMAMS”), another wholly owned subsidiary of Kotak Mahindra Bank Limited, whereby KMAMS will assume all of Kotak’s rights and obligations under the current Sub-Advisory Agreement.
ALPS | Smith Short Duration Bond Fund
AAI and Smith Capital Investors, LLC have agreed contractually to limit the amount of the Fund’s total annual expenses, exclusive of distribution and service (12b-1) fees, shareholder service fees, acquired fund fees and expenses, brokerage expenses, interest expenses, taxes and extraordinary expenses that exceed the following annual rates below.
ALPS | Smith Total Return Bond Fund
AAI and Smith Capital Investors, LLC have agreed contractually to limit the amount of the Fund’s total annual expenses, exclusive of distribution and service (12b-1) fees, shareholder service fees, acquired fund fees and expenses, brokerage expenses, interest expenses, taxes and extraordinary expenses that exceed the following annual rates below.
ALPS | Red Rocks Listed Private Equity Fund
AAI and Red Rocks Capital LLC have contractually agreed to limit the amount of the Fund’s total annual expenses, exclusive of distribution and service (12b-1) fees, acquired fund fees and expenses, shareholder service fees, brokerage expenses, interest expense, taxes and extraordinary expenses that exceed the following annual rates below.
ALPS | WMC Research Value Fund
AAI has contractually agreed to limit the amount of the Fund’s total annual expenses, exclusive of distribution and service (12b-1) fees, shareholder service fees, acquired fund fees and expenses, brokerage expenses, interest expense, taxes and extraordinary expenses that exceed the following annual rates below.
Clough China Fund
AAI has contractually agreed to limit the amount of the Fund’s total annual expenses, exclusive of acquired fund fees and expenses, interest, taxes, brokerage costs and commissions, dividend and interest expense on short sales, litigation, indemnification and extraordinary expenses as determined under generally accepted accounting principles that exceed the following annual rates below.
These agreements are reevaluated on an annual basis. Expense limitation ratios from the current agreements are listed below. Fees waived or reimbursed for the Fiscal Year Ended October 31, 2018 are disclosed on the Statement of Operations or Consolidated Statement of Operations.
| Fund* | Investor Class | Class A | Class C | Class I | Class R |
| ALPS | CoreCommodity Management CompleteCommodities® Strategy Fund | 1.05% | 1.05% | 1.05% | 1.15% | N/A |
| ALPS | Kotak India Growth Fund | 1.60% | 1.60% | 1.60% | 1.60% | N/A |
| ALPS | Smith Short Duration Bond Fund | 0.49% | 0.49% | 0.49% | 0.49% | N/A |
| ALPS | Smith Total Return Bond Fund | 0.67% | 0.67% | 0.67% | 0.67% | N/A |
| ALPS | Red Rocks Listed Private Equity Fund | 1.25% | 1.25% | 1.25% | 1.25% | 1.25% |
| ALPS | WMC Research Value Fund | 0.90% | 0.90% | 0.90% | 0.90% | N/A |
| Clough China Fund | 1.95% | 1.95% | 2.70% | 1.70% | N/A |
| * | See each Fund’s Performance Update section for Expense Limitation agreement expiration dates. |
Notes to Financial Statements
October 31, 2018
RiverFront Funds
Prior to February 28, 2018, AAI and Riverfront Investment Group, LLC had contractually agreed to limit the amount of each Fund’s total annual expenses, exclusive of distribution and service (12b-1) fees, shareholder services fees, acquired fund fees and expenses, brokerage commissions, taxes and extraordinary expenses that exceed the following annual rates below.
| Fund | Investor Class | Class C | Class I | Investor Class II | Class L | Class R |
| RiverFront Asset Allocation Aggressive | 0.90% | 0.90% | 0.90% | N/A | N/A | N/A |
| RiverFront Asset Allocation Growth | 0.90% | 0.90% | 0.90% | N/A | N/A | N/A |
| RiverFront Asset Allocation Growth & Income | 0.90% | 0.90% | 0.90% | N/A | N/A | N/A |
| RiverFront Asset Allocation Moderate | 0.90% | 0.90% | 0.90% | 0.90% | 0.90% | N/A |
| RiverFront Asset Allocation Income & Growth | 0.90% | 0.90% | 0.90% | N/A | N/A | N/A |
The Advisor(s) and each Sub-Advisor are permitted to recover expenses they have waived or reimbursed, on a class-by-class basis, through the agreements described above to the extent that expenses in later periods fall below the annual limits set forth in these agreements. The ALPS | CoreCommodity Management CompleteCommodities® Strategy Fund, ALPS | Kotak India Growth Fund, ALPS | Smith Short Duration Bond Fund, ALPS | Smith Total Return Bond Fund, ALPS | Red Rocks Listed Private Equity Fund, ALPS | WMC Research Value Fund and Clough China Fund are not obligated to pay any deferred fees and expenses more than thirty-six months after the date on which the fees was waived or expenses were deferred, as calculated on a monthly basis. As of the Fiscal Year Ended October 31, 2018, the Advisor and Sub-Advisor(s) may seek reimbursement of previously waived and reimbursed fees as follows:
| Fund | | Expires 10/31/19 | | | Expires 10/31/20 | | | Expires 10/31/21 | | | Total | |
| ALPS | CoreCommodity Management CompleteCommodities® Strategy Fund - Investor Class | | | N/A | | | | N/A | | | | N/A | | | | N/A | |
| ALPS | CoreCommodity Management CompleteCommodities® Strategy Fund - Class A | | | N/A | | | | N/A | | | | 10 | | | | 10 | |
| ALPS | CoreCommodity Management CompleteCommodities® Strategy Fund - Class C | | | N/A | | | | N/A | | | | N/A | | | | N/A | |
| ALPS | CoreCommodity Management CompleteCommodities® Strategy Fund - Class I | | | N/A | | | | N/A | | | | N/A | | | | N/A | |
| ALPS | Kotak India Growth Fund - Investor Class | | | 99,781 | | | | 80,686 | | | | 75,758 | | | | 256,225 | |
| ALPS | Kotak India Growth Fund - Class A | | | N/A | | | | N/A | | | | 42 | | | | 42 | |
| ALPS | Kotak India Growth Fund - Class C | | | 36,083 | | | | 22,009 | | | | 20,620 | | | | 78,712 | |
| ALPS | Kotak India Growth Fund - Class I | | | 155,959 | | | | 162,405 | | | | 171,092 | | | | 489,456 | |
| ALPS | Smith Short Duration Bond Fund - Investor Class | | | N/A | | | | N/A | | | | 2,130 | | | | 2,130 | |
| ALPS | Smith Short Duration Bond Fund - Class A | | | N/A | | | | N/A | | | | 1,214 | | | | 1,214 | |
| ALPS | Smith Short Duration Bond Fund - Class C | | | N/A | | | | N/A | | | | 1,236 | | | | 1,236 | |
| ALPS | Smith Short Duration Bond Fund - Class I | | | N/A | | | | N/A | | | | 33,418 | | | | 33,418 | |
| ALPS | Smith Total Return Bond Fund - Investor Class | | | N/A | | | | N/A | | | | 1,061 | | | | 1,061 | |
| ALPS | Smith Total Return Bond Fund - Class A | | | N/A | | | | N/A | | | | 1,197 | | | | 1,197 | |
| ALPS | Smith Total Return Bond Fund - Class C | | | N/A | | | | N/A | | | | 1,187 | | | | 1,187 | |
| ALPS | Smith Total Return Bond Fund - Class I | | | N/A | | | | N/A | | | | 37,658 | | | | 37,658 | |
| ALPS | Red Rocks Listed Private Equity Fund - Class I | | | N/A | | | | N/A | | | | N/A | | | | N/A | |
| ALPS | Red Rocks Listed Private Equity Fund - Class R | | | N/A | | | | N/A | | | | N/A | | | | N/A | |
| ALPS | WMC Research Value Fund - Investor Class | | | 190,057 | | | | 187,414 | | | | 190,912 | | | | 568,383 | |
| ALPS | WMC Research Value Fund - Class A | | | N/A | | | | N/A | | | | 16 | | | | 16 | |
| ALPS | WMC Research Value Fund - Class C | | | 2,075 | | | | 2,406 | | | | 2,821 | | | | 7,302 | |
| ALPS | WMC Research Value Fund - Class I | | | 155,578 | | | | 160,027 | | | | 152,537 | | | | 468,142 | |
| Clough China Fund - Investor Class | | | N/A | | | | N/A | | | | 25,566 | | | | 25,566 | |
| Clough China Fund - Class A | | | N/A | | | | N/A | | | | 9 | | | | 9 | |
| Clough China Fund - Class C | | | N/A | | | | N/A | | | | 9,843 | | | | 9,843 | |
| Clough China Fund - Class I | | | N/A | | | | N/A | | | | 52,087 | | | | 52,087 | |
Notes to Financial Statements
October 31, 2018
The CoreCommodity Management Cayman Commodity Fund Ltd. (the “Subsidiary”) has each entered into a separate advisory agreement (, the “Subsidiary Advisory Agreement”) with CoreCommodity Management, LLC for the management of the Subsidiary’s portfolio pursuant to which the Subsidiary is obligated to pay the CoreCommodity Management, LLC a management fee at the same rate that the Fund pays the Adviser for investment advisory services provided to the Funds. CoreCommodity Management, LLC has agreed to waive the advisory fee it receives from the Fund in an amount equal to the management fee paid by the Subsidiary. This agreement may be terminated based on the terms of the Subsidiary Advisory Agreement. For the year ended October 31, 2018, this amount equaled $999,885 and is disclosed in the Consolidated Statements of Operations. These waivers are not subject to reimbursement/recoupment.
ALPS | CoreCommodity recovered $55,336 of reimbursed expense during the Fiscal Year Ended October 31, 2018.
Effective February 28, 2018, the Riverfront Funds will no longer pay a management fee or contractually limit the amount of each Fund’s total annual expenses.
ALPS Portfolio Solutions Distributor, Inc. (the “Distributor”) acts as the distributor of the Funds’ shares pursuant to a Distribution Agreement with the Trust. Shares are sold on a continuous basis by the Distributor, as agent for the Funds, and the Distributor has agreed to use its best efforts to solicit orders for the sale of Funds’ shares, although it is not obliged to sell any particular amount of shares. The Distributor is not entitled to any compensation for its services. The Distributor is registered as a broker -dealer with the Securities and Exchange Commission. The Funds’ Distributor is also the distributor of the Select Sector SPDR exchange traded funds (the “Underlying Sector ETFs”). As required by exempted relief obtained by the Underlying Sector ETFs, the Advisor(s) will reimburse any applicable Fund an amount equal to the distribution fee received by the Distributor from the Underlying Sector ETFs attributable to such Fund’s investment in the Underlying Sector ETFs, for so long as the Distributor acts as distributor to such Fund and the Underlying Sector ETFs. There were no amounts reimbursed during the Funds’ Fiscal Year Ended October 31, 2018.
Distribution and Services (12b-1) Plans
Each Fund has adopted Distribution and Services Plans (the “Plans”) pursuant to Rule 12b-1 of the 1940 Act for its Investor Class, Class A, Class C and Class R (ALPS | Red Rocks Listed Private Equity Fund only) and Investor Class II (Asset Allocation Moderate only) shares. The Plans allows a Fund to use Investor Class, Class A, Class C, Class R and Investor Class II assets to pay fees in connection with the distribution and marketing of Investor Class, Class A, Class C, Class R and Investor Class II shares and/or the provision of shareholder services to Investor Class, Class A, Class C, Class R and Investor Class II shareholders. The Plans permit payment for services in connection with the administration of plans or programs that use Investor Class, Class A, Class C, Class R and Investor Class II shares of a Fund, if any, as their funding medium and for related expenses. The Plans permit a Fund to make total payments at an annual rate of up to 0.25% of a Fund’s average daily net assets attributable to its Investor Class, Class A and Investor Class II shares, 0.75% of a Fund’s average daily net assets attributable to its Class C shares and 0.50% of the ALPS | Red Rocks Listed Private Equity Fund’s average daily net assets attributable to its Class R shares.
Under the terms of the Plans, the Trust is authorized to make payments to the Distributor for remittance to financial intermediaries, as compensation for distribution and/or shareholder ongoing services performed by such entities for beneficial shareholders of the Fund. The Distributor is entitled to retain some or all fees payable under the Plans in certain circumstances, including when there is no broker of record or when certain qualification standards have not been met by the broker of record.
Shareholder Services Plans
Each Fund has adopted a shareholder services plan with respect to their Investor Class shares (the “Investor Class Shareholder Services Plan”). Under the Investor Class Shareholder Services Plan, the Funds are authorized to compensate certain financial intermediaries, including broker- dealers and Fund affiliates (“Participating Organizations”), an aggregate fee in an amount not to exceed on an annual basis 0.15% for Investor Class shares of the average daily net asset value of Investor Class shares of the Funds attributable to or held in the name of a Participating Organization pursuant to an agreement with a such Participating Organizations (“Agreement”). Each Agreement will set forth the non-distribution related shareholder services to be performed by the Participating Organization for the benefit of a Fund’s shareholders who have elected to have such Participating Organization service their accounts. Any amount of such payment not paid to Participating Organizations during the Fund’s fiscal year for such service activities shall be reimbursed to the Fund as soon as practicable after the end of the fiscal year. Investor Class Shareholder Services Plan fees recaptured pursuant to the Services Plan for year ended October 31, 2018 are included as an offset to distribution and service fees as disclosed in the Statements of Operations.
Each Fund has adopted a shareholder services plan with respect to their Class A shares (the “Class A Shareholder Services Plan”). Under the Class A Shareholder Services Plan, the Funds are authorized to compensate certain financial intermediaries, including broker-dealers and Fund affiliates (“Participating Organizations”), an aggregate fee in an amount not to exceed on an annual basis 0.15% for Class A shares of the average daily net asset value of Class A shares of the Funds attributable to or held in the name of a Participating Organization pursuant to an agreement with a such Participating Organizations (“Agreement”). Each Agreement will set forth the non-distribution related shareholder services to be performed by the Participating Organization for the benefit of a Fund’s shareholders who have elected to have such Participating Organization service their accounts.
Notes to Financial Statements
October 31, 2018
Any amount of such payment not paid to Participating Organizations during the Fund’s fiscal year for such service activities shall be reimbursed to the Fund as soon as practicable after the end of the fiscal year. Class A Shareholder Services Plan fees recaptured pursuant to the Services Plan for period ended October 31, 2018 are included as an offset to distribution and service fees as disclosed in the Statements of Operations.
Each Fund has adopted a shareholder services plan with respect to its Class C shares (the “Class C Shareholder Services Plan”). Under the Class C Shareholder Services Plan, the Funds are authorized to pay banks and their affiliates and other institutions, including broker-dealers and Fund affiliates (“Participating Organizations”), an aggregate fee in an amount not to exceed on an annual basis 0.25% for Class C shares of the average daily net asset value of the Class C shares attributable to or held in the name of a Participating Organization for its clients as compensation for providing shareholder service activities, which do not include distribution services, pursuant to an agreement with a Participating Organization. Any amount of such payment not paid to Participating Organizations during a Fund’s fiscal year for such service activities shall be reimbursed to the Fund as soon as practicable after the end of the fiscal year. Class C Shareholder Services Plan fees are included with distribution and service fees on the Statements of Operations.
Certain intermediaries may charge networking, omnibus account or other administrative fees with respect to transactions in shares of each Fund. Transactions may be processed through the National Securities Clearing Corporation or similar systems or processed on a manual basis. These fees generally are paid by the Fund to the Distributor, which uses such fees to reimburse intermediaries. In the event an intermediary receiving payments from the Distributor on behalf of the Fund converts from a networking structure to an omnibus account structure or otherwise experiences increased costs, fees borne by the Fund may increase. Networking fees are shown in the Statements of Operations, if applicable to the Fund.
ALPS Fund Services, Inc. (“ALPS”) serves as administrator to the Funds and the Funds have agreed to pay expenses incurred in connection with their administrative activities. Pursuant to an Administrative Agreement, ALPS provides operational services to the Funds including, but not limited to, fund accounting and fund administration and generally assists in the Funds’ operations. Officers of the Trust are employees of ALPS. The Funds’ administration fee is accrued on a daily basis and paid monthly. Administration fees paid by the Funds for the Fiscal Year Ended October 31, 2018 are disclosed in the Statement of Operations.
ALPS is reimbursed by the Funds for certain out-of-pocket expenses.
Trustees
The fees and expenses of the independent trustees of the Board are presented in the Statements of Operations
9. INDEMNIFICATIONS
Under the Trust’s organizational documents, its officers and Trustees are indemnified against certain liability arising out of the performance of their duties to the Trust. Additionally, in the normal course of business, the Trust enters into contracts with service providers that may contain general indemnification clauses which may permit indemnification to the extent permissible under applicable law. The Trust’s maximum exposure under these arrangements is unknown, as this would involve future claims that may be made against the Trust that have not yet occurred.
10. RECENT ACCOUNTING PRONOUCEMENTS
On October 4, 2018, the SEC amended Regulation S-X to require certain financial statement disclosure requirements to conform them to U.S. GAAP for investment companies. Effective November 4, 2018, the Funds adopted disclosure requirement changes for Regulation S-X and these changes are reflected throughout this report. The Funds’ adoption of those amendments, effective with the financial statements prepared as of September 30, 2018, had no effect on the Funds’ net assets or results of operations.
In March 2017, the Financial Accounting Standards Board (“FASB”) issued Accounting Standards Update “Premium Amortization on Purchased Callable Debt Securities” which amends the amortization period for a callable debt security held at a premium from the maturity date to the earliest call date. The guidance is effective for annual periods beginning after December 15, 2018, and interim periods within those annual periods. Management is still assessing the financial statement impact of adoption.
Report of Independent Registered Public Accounting Firm
To the shareholders and the Board of Trustees of Financial Investors Trust:
Opinion on the Financial Statements and Financial Highlights
We have audited the accompanying statements of assets and liabilities of ALPS | Red Rocks Listed Private Equity Fund, ALPS | WMC Research Value Fund, Clough China Fund, RiverFront Asset Allocation Aggressive, RiverFront Asset Allocation Growth, RiverFront Asset Allocation Growth & Income, RiverFront Asset Allocation Moderate, RiverFront Asset Allocation Income & Growth, ALPS | Smith Short Duration Bond Fund and ALPS | Smith Total Return Bond Fund, ten of the funds of Financial Investors Trust (the "Trust"), including the statements of investments, as of October 31, 2018; the related statements of operations for the year then ended, the statements of changes in net assets for each of the two years in the period then ended, and the financial highlights for the years ended October 31, 2018, 2017, 2016, 2015, the period May 1, 2014 through October 31, 2014, and the year ended April 30, 2014 for the ten funds in the Trust, except ALPS | Smith Short Duration Bond Fund and ALPS | Smith Total Return Bond Fund; the related statements of operations, changes in net assets, and financial highlights for the period from July 2, 2018 (commencement of operations) through October 31, 2018, for ALPS | Smith Short Duration Bond Fund and ALPS | Smith Total Return Bond Fund; and the related notes. We have also audited the accompanying consolidated statements of assets and liabilities, including the consolidated statements of investments, of ALPS | Kotak India Growth Fund and ALPS | CoreCommodity Management CompleteCommodities® Strategy Fund, two of the funds of the Trust, as of October 31, 2018; the related consolidated statements of operations for the year then ended, the consolidated statements of changes in net assets for each of the two years in the period then ended, and the consolidated financial highlights for the years ended October 31, 2018, 2017, 2016, 2015, the period May 1, 2014 through October 31, 2014, and the year ended April 30, 2014; and the related notes.
In our opinion, the financial statements and financial highlights present fairly, in all material respects, the financial position of each of the twelve funds constituting Financial Investors Trust, except for ALPS | Smith Short Duration Bond Fund and ALPS | Smith Total Return Bond Fund as of October 31, 2018, and the results of their operations for the year then ended, the changes in their net assets for each of the two years in the period then ended, and the financial highlights for the years ended October 31, 2018, 2017, 2016, 2015, the period May 1, 2014 through October 31, 2014, and the year ended April 30, 2014 in conformity with accounting principles generally accepted in the United States of America. Also, in our opinion, the financial statements and financial highlights present fairly, in all material respects, the financial position of ALPS | Smith Short Duration Bond Fund and ALPS | Smith Total Return Bond Fund as of October 31, 2018; the results of their operations, changes in net assets, and financial highlights for the period from July 2, 2018 (commencement of operations) through October 31, 2018 in conformity with accounting principles generally accepted in the United States of America.
Basis for Opinion
These financial statements and financial highlights are the responsibility of the Funds’ management. Our responsibility is to express an opinion on the Funds’ financial statements and financial highlights based on our audits. We are a public accounting firm registered with the Public Company Accounting Oversight Board (United States) (PCAOB) and are required to be independent with respect to the Funds in accordance with the U.S. federal securities laws and the applicable rules and regulations of the Securities and Exchange Commission and the PCAOB. We conducted our audits in accordance with the standards of the PCAOB. Those standards require that we plan and perform the audit to obtain reasonable assurance about whether the financial statements and financial highlights are free of material misstatement, whether due to error or fraud. The Funds are not required to have, nor were we engaged to perform, an audit of their internal control over financial reporting. As part of our audits we are required to obtain an understanding of internal control over financial reporting but not for the purpose of expressing an opinion on the effectiveness of the Funds’ internal control over financial reporting. Accordingly, we express no such opinion.
Our audits included performing procedures to assess the risks of material misstatement of the financial statements and financial highlights, whether due to error or fraud, and performing procedures that respond to those risks. Such procedures included examining, on a test basis, evidence regarding the amounts and disclosures in the financial statements and financial highlights. Our audits also included evaluating the accounting principles used and significant estimates made by management, as well as evaluating the overall presentation of the financial statements and financial highlights. Our procedures included confirmation of securities owned as of October 31, 2018, by correspondence with the custodian and brokers; when replies were not received from brokers, we performed other auditing procedures. We believe that our audits provide a reasonable basis for our opinion.
Deloitte & Touche LLP
Denver, Colorado
December 21, 2018
We have served as the auditor of one or more investment companies advised by ALPS Advisors, Inc. since 2007.
Additional Information
October 31, 2018 (Unaudited)
1. FUND HOLDINGS
The Funds file their complete schedule of portfolio holdings with the Securities and Exchange Commission (the “SEC”) for the first and third quarters of each fiscal year on Form N-Q within 60 days after the end of the period. Copies of the Funds’ Form N-Q are available without charge on the SEC website at http:// www.sec.gov. You may also review and copy the Form N-Q at the SEC’s Public Reference Room in Washington, D.C. For more information about the operation of the Public Reference Room, please call the SEC at 1-800-SEC-0330.
2. FUND PROXY VOTING POLICIES, PROCEDURES AND SUMMARIES
Fund policies and procedures used in determining how to vote proxies and information regarding how each of the Funds voted proxies relating to portfolio securities during the most recent prior 12-month period ending June 30 are available without charge, (1) upon request, by calling (toll-free) (866) 759-5679 and (2) on the SEC’s website at http://www.sec.gov.
3. TAX DESIGNATIONS
Of the distributions paid by the Funds from ordinary income for the calendar year ended December 31, 2017, the following percentages met the requirements to be treated as qualifying for qualified dividend income and the corporate dividends received deduction:
| | QDI | DRD |
| ALPS|CoreCommodity Management CompleteCommodities® Strategy Fund | 18.01% | 5.57% |
| ALPS|Kotak India Growth Fund | 0% | 0% |
| ALPS|Red Rocks Listed Private Equity Fund | 8.34% | .12% |
| ALPS|WMC Research Value Fund | 50.31% | 46% |
| Clough China Fund | 100% | 0% |
| RiverFront Asset Allocation Growth Fund | 100% | 48.14% |
| RiverFront Asset Allocation Growth & Income Fund | 100% | 44.32% |
| RiverFront Asset Allocation Moderate Fund | 100% | 53.19% |
| RiverFront Asset Allocation Aggressive Fund | 100% | 42.24% |
| RiverFront Asset Allocation Income & Growth Fund | 81.23% | 31.70% |
In early 2018, if applicable, shareholders of record received this information for the distribution paid to them by the Funds during the calendar year 2017 via Form 1099. The Funds will notify shareholders in early 2019 of amounts paid to them by the Funds, if any, during the calendar year 2018.
Pursuant to Section 852(b)(3) of the Internal Revenue Code the Funds designate the following amounts as long-term capital gain dividends:
| ALPS|CoreCommodity Management CompleteCommodities® Strategy Fund | | $ | – | |
| ALPS|Kotak India Growth Fund | | $ | 883,873 | |
| ALPS|Red Rocks Listed Private Equity Fund | | $ | 6,561,622 | |
| ALPS|WMC Research Value Fund | | $ | 4,591,672 | |
| Clough China Fund | | $ | 0 | |
| RiverFront Asset Allocation Growth Fund | | $ | 195,360 | |
| RiverFront Asset Allocation Growth & Income Fund | | $ | 1,757,875 | |
| RiverFront Asset Allocation Moderate Fund | | $ | 4,262,007 | |
| RiverFront Asset Allocation Aggressive Fund | | $ | 1,660,504 | |
| RiverFront Asset Allocation Income & Growth Fund | | $ | 184,603 | |
For the fiscal year ended October 31, 2018, the following amounts were utilized as earnings and profits distributed to shareholders on redemptions:
| RiverFront Asset Allocation Growth Fund | | $ | 890,413 | |
| RiverFront Asset Allocation Growth & Income Fund | | $ | 1,524,496 | |
| RiverFront Asset Allocation Moderate Fund | | $ | 1,785,075 | |
| RiverFront Asset Allocation Aggressive Fund | | $ | 1,798,061 | |
| RiverFront Asset Allocation Income & Growth Fund | | $ | 98,027 | |
Additional Information
October 31, 2018 (Unaudited)
4. DISCLOSURE REGARDING APPROVAL OF FUND ADVISORY AND SUB-ADVISORY AGREEMENTS
ALPS | Smith Total Return Bond Fund
ALPS | Smith Short Duration Bond Fund
On March 13-14, 2018, the Trustees met in person to discuss, among other things, the approval of the investment advisory agreement between the Trust, with respect to the ALPS | Smith Total Return Bond Fund and the ALPS | Smith Short Duration Bond Fund (collectively, the “Smith Funds”), and ALPS Advisors, Inc. (“AAI”) (the “Investment Advisory Agreement”), and the investment sub-advisory agreement between AAI, with respect to the Smith Funds, and Smith Capital Investors, LLC (“Smith Capital”) (the “Investment Sub-Advisory Agreement”), in accordance with Section 15(c) of the 1940 Act. The Independent Trustees met with independent legal counsel during executive session and discussed the Investment Advisory Agreement and the Investment Sub-Advisory Agreement and other related materials.
In approving the Investment Advisory Agreement and the Investment Sub-Advisory Agreement, the Trustees, including the Independent Trustees, considered the following factors:
Investment Advisory and Sub-Advisory Fee Rate: The Trustees reviewed and considered the contractual annual advisory fee to be paid by the Trust, on behalf of the ALPS | Smith Total Return Bond Fund, of 0.545% of such Fund’s daily average net assets, and on behalf of the of the ALPS | Smith Short Duration Bond Fund, of 0.365% of such Fund’s daily average net assets, to AAI, in light of the extent and quality of the advisory services provided by AAI to the Smith Funds. The Trustees also reviewed and considered the contractual annual sub-advisory fee to be paid by AAI to Smith Capital of 0.42% of the ALPS | Smith Total Return Bond Fund’s daily average net assets and of 0.29% of the ALPS | Smith Short Duration Bond Fund’s daily average net assets, in light of the extent and quality of the advisory services provided by Smith Capital to the Smith Funds. The Trustees also considered information regarding compensation to be paid to affiliates of AAI under other agreements, such as the Fund Accounting and Administration Agreement with ALPS.
The Board received and considered information including a comparison of the Smith Funds’ contractual and actual management fees (after waivers) with those of funds in the peer expense group and universe of funds provided by an independent provider of investment company data (the “Data Provider”). The Trustees noted that the contractual and actual management fee rates for Class I of the ALPS | Smith Total Return Bond Fund are above its Data Provider expense group median, the contractual management fee rate for Class I of the ALPS | Smith Short Duration Bond Fund was below its Data Provider expense group median, and the actual management fee rate for Class I of the ALPS | Smith Short Duration Bond Fund was above its Data Provider expense group median.
Total Expense Ratios: The Trustees further reviewed and considered the total expense ratios (after waivers) of 0.670% and 0.490% for the Class I shares of the ALPS | Smith Total Return Bond Fund and ALPS | Smith Short Duration Bond Fund, respectively. The Trustees noted that the total expense ratio (after waivers) of Class I of the ALPS | Smith Total Return Bond Fund was above its respective Data Provider expense group median and the total expense ratio (after waivers) of Class I of the ALPS | Smith Short Duration Bond Fund was below its respective Data Provider expense group median.
Nature, Extent and Quality of the Services under the Investment Advisory and Sub-Advisory Agreements: The Trustees received and considered information regarding the nature, extent and quality of services to be provided to the Smith Funds under the Investment Advisory and Sub-Advisory Agreements. The Trustees reviewed certain background materials supplied by AAI and Smith Capital in their presentations, including their Forms ADV.
The Trustees reviewed and considered AAI’s and Smith Capital’s investment advisory personnel, their history as asset managers and their performance and the amount of assets currently under management by AAI and Smith Capital and their affiliated entities. The Trustees also reviewed the research and decision-making processes utilized by AAI and Smith Capital, including the methods adopted to seek to achieve compliance with the investment objectives, policies and restrictions of the Smith Funds.
The Trustees considered the background and experience of AAI’s and Smith Capital’s management in connection with the Smith Funds, including reviewing the qualifications, backgrounds and responsibilities of the management team primarily responsible for the day-to-day portfolio management of the Smith Funds and the extent of the resources devoted to research and analysis of actual and potential investments.
The Trustees also reviewed, among other things, AAI’s and Smith Capital’s insider trading policies and procedures and their Codes of Ethics.
Performance: The Trustees noted that since the Smith Funds have not yet begun operations, there is no performance to be reviewed or analyzed at this time. The Trustees further considered the reputation of Smith Capital’s personnel generally and its investment techniques, risk management controls, and decision-making processes.
Additional Information
October 31, 2018 (Unaudited)
Comparable Accounts: The Trustees noted that Smith Capital has no other clients at this time.
Profitability: The Trustees noted that given the start-up nature of Smith Capital, there were no financial statements to review. The Trustees considered the projected profitability analysis prepared by Smith Capital and AAI based on the fees to be paid under the Investment Advisory Agreement with respect to the Smith Funds.
Economies of Scale: The Trustees considered whether economies of scale in the provision of services to the Smith Funds will be passed along to the shareholders under the agreements.
Other Benefits to the Adviser: The Trustees reviewed and considered any other incidental benefits to be derived by Smith Capital or AAI from their relationship with the Smith Funds, including whether soft dollar arrangements would be used.
In approving AAI as the Smith Funds’ investment adviser and Smith Capital as the Smith Funds’ sub-adviser and the fees to be charged under the Investment Advisory and Sub-Advisory Agreements, the Trustees concluded that no single factor reviewed by the Trustees was identified by the Trustees to be determinative as the principal factor in whether to approve the Investment Advisory and Sub-Advisory Agreements. Further, the Independent Trustees were advised by separate independent legal counsel throughout the process. The Trustees, including all of the Independent Trustees, concluded that:
| | ● | the contractual and actual management fee rates for Class I of the ALPS | Smith Total Return Bond Fund are above its Data Provider expense group median, the contractual management fee rate for Class I of the ALPS | Smith Short Duration Bond Fund was below its Data Provider expense group median, and the actual management fee rate for Class I of the ALPS | Smith Short Duration Bond Fund was above its Data Provider expense group median; |
| | | |
| | ● | Smith Capital’s fees under its sub-advisory agreements are to be paid directly by AAI; |
| | | |
| | ● | the total expense ratio (after waivers) of Class I of the ALPS | Smith Total Return Bond Fund was above its respective Data Provider expense group median and the total expense ratio (after waivers) of Class I of the ALPS | Smith Short Duration Bond Fund was below its respective Data Provider expense group median; |
| | | |
| | ● | the nature, extent and quality of services to be rendered by AAI and Smith Capital under the Investment Advisory and Sub-Advisory Agreements, respectively, with respect to the Smith Funds were adequate; |
| | | |
| | ● | since the Smith Funds had not yet begun operations, there was no performance to be reviewed or analyzed at this time; |
| | | |
| | ● | there were no directly comparable accounts managed by Smith Capital for the Board to consider; |
| | | |
| | ● | the profit, if any, anticipated to be realized by AAI and Smith Capital in connection with the operation of the Smith Funds is not unreasonable to the Smith Funds; and |
| | | |
| | ● | there were no material economies of scale or other incidental benefits accruing to AAI and Smith Capital in connection with their relationship with the Smith Funds. |
Based on the Trustees’ deliberations and their evaluation of the information described above, the Trustees, including all of the Independent Trustees, concluded that AAI’s and Smith Capital’s compensation for investment advisory and sub-advisory services is consistent with the best interests of the Smith Funds and its shareholders.
Additional Information
October 31, 2018 (Unaudited)
5. SHAREHOLDER MEETING RESULTS
ALPS | CoreCommodity Management CompleteCommodities® Strategy Fund
On May 31, 2018 the Fund held a Meeting of Stockholders to consider the proposal set forth below. The following votes were recorded:
Proposal 1: The approval of a new investment advisory agreement between the Fund and ALPS Advisors, Inc.
| | Number of Shares | % of Shares Voted |
| For | 44,994,965.937 | 99.534% |
| Withheld | 73,954.350 | 0.164% |
| Abstain | 136,877.694 | 0.303% |
| Total | 45,205,797.981 | 100.000% |
Proposal 2: The approval of a new investment sub-advisory agreement between the ALPS Advisors, Inc. and CoreCommodity Management, LLC.
| | Number of Shares | % of Shares Voted |
| For | 44,956,153.867 | 99.448% |
| Withheld | 86,938.226 | 0.192% |
| Abstain | 162,705.888 | 0.360% |
| Total | 45,205,797.981 | 100.000% |
Proposal 3: The approval of a proposal that would authorize ALPS Advisors to enter into and materially amend sub-advisory agreements.
| | Number of Shares | % of Shares Voted |
| For | 44,835,892.519 | 99.182% |
| Withheld | 193,884.044 | 0.429% |
| Abstain | 176,021.418 | 0.389% |
| Total | 45,205,797.981 | 100.000% |
ALPS Kotak India Growth Fund
On August 21, 2018, the Fund held a Meeting of Stockholders to consider the proposal set forth below. The following votes were recorded:
Proposal 1: The approval of a new investment advisory agreement between the Fund and ALPS Advisors, Inc.
| | Number of Shares | % of Shares Voted |
| For | 1,123,183.169 | 94.861% |
| Withheld | 30,406.000 | 2.568% |
| Abstain | 30,439.000 | 2.571% |
| Total | 1,184,028.169 | 100.000% |
Proposal 2: The approval of a new investment sub-advisory agreement between the ALPS Advisors, Inc. and Kotak Mahindra Asset Management Ltd.
| | Number of Shares | % of Shares Voted |
| For | 1,117,446.169 | 94.377% |
| Withheld | 30,959.000 | 2.615% |
| Abstain | 35,623.000 | 3.009% |
| Total | 1,184,028.169 | 100.000% |
Additional Information
October 31, 2018 (Unaudited)
Proposal 3: The approval of a proposal that would authorize ALPS Advisors to enter into and materially amend sub-advisory agreements.
| | Number of Shares | % of Shares Voted |
| For | 1,011,627.333 | 85.439% |
| Withheld | 63,635.814 | 5.375% |
| Abstain | 108,765.022 | 9.186% |
| Total | 1,184,028.169 | 100.000% |
ALPS | Red Rocks Listed Private Equity Fund
On June 29, 2018 the Fund held a Meeting of Stockholders to consider the proposal set forth below. The following votes were recorded:
Proposal 1: The approval of a new investment advisory agreement between the Fund and ALPS Advisors, Inc.
| | Number of Shares | % of Shares Voted |
| For | 17,432,203.632 | 97.351% |
| Withheld | 208,204.774 | 1.163% |
| Abstain | 266,117.547 | 1.486% |
| Total | 17,906,525.953 | 100.000% |
Proposal 2: The approval of a new investment sub-advisory agreement between the ALPS Advisors, Inc. and Red Rocks Capital LLC.
| | Number of Shares | % of Shares Voted |
| For | 17,418,666.501 | 97.276% |
| Withheld | 214,011.559 | 1.195% |
| Abstain | 273,847.893 | 1.529% |
| Total | 17,906,525.953 | 100.000% |
Proposal 3: The approval of a proposal that would authorize ALPS Advisors to enter into and materially amend sub-advisory agreements.
| | Number of Shares | % of Shares Voted |
| For | 17,185,832.788 | 95.975% |
| Withheld | 443,326.621 | 2.476% |
| Abstain | 277,366.544 | 1.549% |
| Total | 17,906,525.953 | 100.000% |
ALPS WMC Research Value Fund
On August 3, 2018, the Fund held a Meeting of Stockholders to consider the proposal set forth below. The following votes were recorded:
Proposal 1: The approval of a new investment advisory agreement between the Fund and ALPS Advisors, Inc.
| | Number of Shares | % of Shares Voted |
| For | 7,620,681.972 | 94.371% |
| Withheld | 110,938.494 | 1.374% |
| Abstain | 343,617.806 | 4.255% |
| Total | 8,075,238.272 | 100.000% |
Additional Information
October 31, 2018 (Unaudited)
Proposal 2: The approval of a new investment sub-advisory agreement between the ALPS Advisors, Inc. and Wellington Management Company LLP.
| | Number of Shares | % of Shares Voted |
| For | 7,586,673.220 | 93.950% |
| Withheld | 111,424.957 | 1.380% |
| Abstain | 377,140.095 | 4.670% |
| Total | 8,075,238.272 | 100.000% |
Proposal 3: The approval of a proposal that would authorize ALPS Advisors to enter into and materially amend sub-advisory agreements.
| | Number of Shares | % of Shares Voted |
| For | 7,393,869.449 | 91.562% |
| Withheld | 332,219.317 | 4.114% |
| Abstain | 349,149.506 | 4.324% |
| Total | 8,075,238.272 | 100.000% |
Clough China Fund
On August 3, 2018 the Fund held a Meeting of Stockholders to consider the proposal set forth below. The following votes were recorded:
Proposal 1: The approval of a new investment advisory agreement between the Fund and ALPS Advisors, Inc.
| | Number of Shares | % of Shares Voted |
| For | 987,244.345 | 93.014% |
| Withheld | 13,334.713 | 1.256% |
| Abstain | 60,811.654 | 5.729% |
| Total | 1,061,390.712 | 100.000% |
Proposal 2: The approval of a new investment sub-advisory agreement between the ALPS Advisors, Inc. and Clough Capital Partners LP.
| | Number of Shares | % of Shares Voted |
| For | 984,536.020 | 92.759% |
| Withheld | 16,043.038 | 1.512% |
| Abstain | 60,811.654 | 5.729% |
| Total | 1,061,390.712 | 100.000% |
Proposal 3: The approval of a proposal that would authorize ALPS Advisors to enter into and materially amend sub-advisory agreements.
| | Number of Shares | % of Shares Voted |
| For | 971,215.020 | 91.504% |
| Withheld | 23,117.680 | 2.178% |
| Abstain | 67,058.012 | 6.318% |
| Total | 1,061,390.712 | 100.000% |
Additional Information
October 31, 2018 (Unaudited)
RiverFront Asset Allocation Aggressive
On May 31, 2018 the Fund held a Meeting of Stockholders to consider the proposal set forth below. The following votes were recorded:
Proposal 1: The approval of a new investment advisory agreement between the Fund and ALPS Advisors, Inc.
| | Number of Shares | % of Shares Voted |
| For | 1,887,867.473 | 98.329% |
| Withheld | 8,620.000 | 0.449% |
| Abstain | 23,465.000 | 1.222% |
| Total | 1,919,952.473 | 100.000% |
Proposal 2: The approval of a new investment sub-advisory agreement between the ALPS Advisors, Inc. and RiverFront Investment Group, LLC.
| | Number of Shares | % of Shares Voted |
| For | 1,890,839.473 | 98.484% |
| Withheld | 9,073.000 | 0.473% |
| Abstain | 20,040.000 | 1.043% |
| Total | 1,919,952.473 | 100.000% |
Proposal 3: The approval of a proposal that would authorize ALPS Advisors to enter into and materially amend sub-advisory agreements.
| | Number of Shares | % of Shares Voted |
| For | 1,878,485.473 | 97.840% |
| Withheld | 17,558.000 | 0.915% |
| Abstain | 23,909.000 | 1.245% |
| Total | 1,919,952.473 | 100.000% |
RiverFront Asset Allocation Growth
On August 3, 2018 the Fund held a Meeting of Stockholders to consider the proposal set forth below. The following votes were recorded:
Proposal 1: The approval of a new investment advisory agreement between the Fund and ALPS Advisors, Inc.
| | Number of Shares | % of Shares Voted |
| For | 1,105,605.260 | 92.422% |
| Withheld | 29,550.000 | 2.470% |
| Abstain | 61,107.000 | 5.108% |
| Total | 1,196,262.260 | 100.000% |
Proposal 2: The approval of a new investment sub-advisory agreement between the ALPS Advisors, Inc. and RiverFront Investment Group, LLC.
| | Number of Shares | % of Shares Voted |
| For | 1,107,641.260 | 92.592% |
| Withheld | 27,513.000 | 2.300% |
| Abstain | 61,108.000 | 5.108% |
| Total | 1,196,262.260 | 100.000% |
Proposal 3: The approval of a proposal that would authorize ALPS Advisors to enter into and materially amend sub-advisory agreements.
| | Number of Shares | % of Shares Voted |
| For | 1,086,969.260 | 90.864% |
| Withheld | 52,770.000 | 4.411% |
| Abstain | 56,523.000 | 4.725% |
| Total | 1,196,262.260 | 100.000% |
Additional Information
October 31, 2018 (Unaudited)
RiverFront Asset Allocation Growth & Income
On August 3, 2018 the Fund held a Meeting of Stockholders to consider the proposal set forth below. The following votes were recorded:
Proposal 1: The approval of a new investment advisory agreement between the Fund and ALPS Advisors, Inc.
| | Number of Shares | % of Shares Voted |
| For | 2,690,289.095 | 94.655% |
| Withheld | 42,547.000 | 1.497% |
| Abstain | 109,378.000 | 3.848% |
| Total | 2,842,214.095 | 100.000% |
Proposal 2: The approval of a new investment sub-advisory agreement between the ALPS Advisors, Inc. and RiverFront Investment Group, LLC.
| | Number of Shares | % of Shares Voted |
| For | 2,686,408.095 | 94.518% |
| Withheld | 45,246.000 | 1.592% |
| Abstain | 110,560.000 | 3.890% |
| Total | 2,842,214.095 | 100.000% |
Proposal 3: The approval of a proposal that would authorize ALPS Advisors to enter into and materially amend sub-advisory agreements.
| | Number of Shares | % of Shares Voted |
| For | 2,620,378.095 | 92.195% |
| Withheld | 91,888.000 | 3.233% |
| Abstain | 129,948.000 | 4.572% |
| Total | 2,842,214.095 | 100.000% |
RiverFront Asset Allocation Moderate
On August 3, 2018 the Fund held a Meeting of Stockholders to consider the proposal set forth below. The following votes were recorded:
Proposal 1: The approval of a new investment advisory agreement between the Fund and ALPS Advisors, Inc.
| | Number of Shares | % of Shares Voted |
| For | 3,442,253.393 | 92.288% |
| Withheld | 98,987.800 | 2.654% |
| Abstain | 188,669.299 | 5.058% |
| Total | 3,729,911.038 | 100.000% |
Proposal 2: The approval of a new investment sub-advisory agreement between the ALPS Advisors, Inc. and RiverFront Investment Group, LLC.
| | Number of Shares | % of Shares Voted |
| For | 3,406,059.939 | 91.317% |
| Withheld | 128,214.800 | 3.437% |
| Abstain | 195,636.299 | 5.245% |
| Total | 2,842,214.095 | 100.000% |
Proposal 3: The approval of a proposal that would authorize ALPS Advisors to enter into and materially amend sub-advisory agreements.
| | Number of Shares | % of Shares Voted |
| For | 3,321,468.839 | 89.050% |
| Withheld | 215,645.800 | 5.782% |
| Abstain | 192,796.399 | 5.169% |
| Total | 3,729,911.038 | 100.000% |
Additional Information
October 31, 2018 (Unaudited)
RiverFront Asset Allocation Income & Growth
On August 3, 2018 the Fund held a Meeting of Stockholders to consider the proposal set forth below. The following votes were recorded:
Proposal 1: The approval of a new investment advisory agreement between the Fund and ALPS Advisors, Inc.
| | Number of Shares | % of Shares Voted |
| For | 516,993.940 | 96.127% |
| Withheld | 3,563.000 | 0.662% |
| Abstain | 17,266.000 | 3.210% |
| Total | 2,842,214.095 | 100.000% |
Proposal 2: The approval of a new investment sub-advisory agreement between the ALPS Advisors, Inc. and RiverFront Investment Group, LLC.
| | Number of Shares | % of Shares Voted |
| For | 502,438.940 | 93.420% |
| Withheld | 18,121.000 | 3.369% |
| Abstain | 17,266.000 | 3.210% |
| Total | 2,842,214.095 | 100.000% |
Proposal 3: The approval of a proposal that would authorize ALPS Advisors to enter into and materially amend sub-advisory agreements.
| | Number of Shares | % of Shares Voted |
| For | 499,240.940 | 92.826% |
| Withheld | 15,222.000 | 2.830% |
| Abstain | 23,363.000 | 4.344% |
| Total | 1,196,262.260 | 100.000% |
Trustees and Officers
October 31, 2018 (Unaudited)
Additional information regarding the Funds’ trustees is included in the Statement of Additional Information, which can be obtained without charge by calling (toll-free) (866) 759-5679.
INDEPENDENT TRUSTEES
Name, Address* & Year of Birth | Position(s) Held with Fund | Term of Office** and Length of Time Served | Principal Occupation(s) During Past 5 Years*** | Number of Funds in Fund Complex Overseen by Trustee**** | Other Directorships Held by Trustee |
Mary K.
Anstine,
1940 | Trustee and Chairman | Ms. Anstine was elected at a special meeting of shareholders held on March 21, 1997 and re-elected at a special meeting of shareholders held on August 7, 2009. Ms. Anstine was appointed Chairman of the Board at the June 6, 2017 meeting of the Board of Trustees. | Ms. Anstine was formerly an Executive Vice President of First Interstate Bank of Denver until 1994, President/Chief Executive Officer of HealthONE Alliance, Denver, Colorado, from 1994 to 2004, and has been retired since 2004. Ms. Anstine is also Trustee/Director of AV Hunter Trust and Colorado Uplift Board. Ms. Anstine was formerly a Director of the Trust Bank of Colorado (later purchased and now known as Northern Trust Bank), HealthONE and Denver Area Council of the Boy Scouts of America, and a member of the American Bankers Association Trust Executive Committee. | 61 | Ms. Anstine is a Trustee of ALPS ETF Trust (20 funds); ALPS Variable Investment Trust (9 funds); Reaves Utility Income Fund (1 fund); and Segall Bryant & Hamill Trust (14 funds). |
Jeremy W.
Deems,
1976 | Trustee | Mr. Deems was appointed as a Trustee at the March 11, 2008 meeting of the Board of Trustees and elected at a special meeting of shareholders held on August 7, 2009. | Mr. Deems is the Co-Founder, Chief Operations Officer and Chief Financial Officer of Green Alpha Advisors, LLC, a registered investment advisor, and Co-Portfolio Manager of the Shelton Green Alpha Fund. Prior to joining Green Alpha Advisors, Mr. Deems was CFO and Treasurer of Forward Management, LLC, ReFlow Management Co., LLC, ReFlow Fund, LLC, a private investment fund, and Sutton Place Management, LLC, an administrative services company, from 1998 to June 2007. From 2004 to 2005, Mr Deems also served as Treasurer of the Forward Funds and the Sierra Club Funds. | 62 | Mr. Deems is a Trustee of ALPS ETF Trust (20 funds); ALPS Variable Investment Trust (9 funds); Clough Funds Trust (1 fund); and Reaves Utility Income Fund (1 fund). |
| * | All communications to Trustees and Officers may be directed to Financial Investors Trust c/o 1290 Broadway, Suite 1100, Denver, CO 80203. |
| ** | This is the period for which the Trustee or Officer began serving the Trust. Each Trustee serves an indefinite term, until such Trustees successor is elected and appointed, or such Trustee resigns or is deceased. Officers are elected on an annual basis. |
| *** | Except as otherwise indicated, each individual has held the office shown or other offices in the same company for the last five years. |
| **** | The Fund Complex includes all series of the Trust, currently 32, and any other investment companies for which any Trustee serves as trustee for and for which ALPS Advisors or Red Rocks, Wellington Management, Clough Capital, RiverFront, Kotak, or Smith Capital provides investment advisory services (currently 33 funds, 1 fund, 0 funds, 4 funds, 5 funds, 0 funds, and 0 funds, respectively). |
Trustees and Officers
October 31, 2018 (Unaudited)
INDEPENDENT TRUSTEES (continued)
Name, Address* & Year of Birth | Position(s) Held with Fund | Term of Office** and Length of Time Served | Principal Occupation(s) During Past 5 Years*** | Number of Funds in Fund Complex Overseen by Trustee**** | Other Directorships Held by Trustee |
Jerry G.
Rutledge,
1944 | Trustee | Mr. Rutledge was elected at a special meeting of shareholders held on August 7, 2009. | Mr. Rutledge is the President and owner of Rutledge’s Inc., a retail clothing business. Mr. Rutledge is currently Director of the American National Bank. He was from 1994 to 2007 a Regent of the University of Colorado. | 36 | Mr. Rutledge is a Trustee of Clough Global Dividend and Income Fund (1 fund); Clough Global Equity Fund (1 fund); Clough Global Opportunities Fund (1 fund); and Principal Real Estate Income Fund (1 fund). |
Michael
“Ross” Shell,
1970 | Trustee | Mr. Shell was elected at a special meeting of shareholders held on August 7, 2009. | Mr. Shell is Founder and CEO of Red Idea, LLC, a strategic consulting/early stage venture firm (since June 2008). From 1999 to 2009, he was a part-owner and Director of Tesser, Inc., a brand agency. From December 2005 to May 2008, he was Director, Marketing and Investor Relations, of Woodbourne, a REIT/real estate hedge fund and private equity firm. Prior to this, from May 2004 to November 2005, he worked as a business strategy consultant; from June 2003 to April 2004, he was on the Global Client Services team of IDEO, a product design/innovation firm; and from 1999 to 2003, he was President of Tesser, Inc. Mr. Shell graduated with honors from Stanford University with a degree in Political Science. | 32 | None. |
| * | All communications to Trustees and Officers may be directed to Financial Investors Trust c/o 1290 Broadway, Suite 1100, Denver, CO 80203. |
| ** | This is the period for which the Trustee or Officer began serving the Trust. Each Trustee serves an indefinite term, until such Trustees successor is elected and appointed, or such Trustee resigns or is deceased. Officers are elected on an annual basis. |
| *** | Except as otherwise indicated, each individual has held the office shown or other offices in the same company for the last five years. |
| **** | The Fund Complex includes all series of the Trust, currently 32, and any other investment companies for which any Trustee serves as trustee for and for which ALPS Advisors or Red Rocks, Wellington Management, Clough Capital, RiverFront, Kotak, or Smith Capital provides investment advisory services (currently 33 funds, 1 fund, 0 funds, 4 funds, 5 funds, 0 funds, and 0 funds, respectively). |
Trustees and Officers
October 31, 2018 (Unaudited)
INTERESTED TRUSTEE
Name, Address* & Year of Birth | Position(s) Held with Fund | Term of Office** and Length of Time Served | Principal Occupation(s) During Past 5 Years*** | Number of Funds in Fund Complex Overseen by Trustee**** | Other Directorships Held by Trustee |
Edmund J.
Burke,
1961 | Trustee and President | Mr. Burke was elected as Trustee at a special meeting of shareholders held on August 7, 2009. Mr. Burke was elected President of the Trust at the December 17, 2002 meeting of the Board of Trustees. | Mr. Burke is President and a Director of ALPS Holdings, Inc. (“AHI”) (since 2005) and ALPS Advisors, Inc. (“AAI”), and Director of Boston Financial Data Services, Inc. (“BFDS”), ALPS Distributors, Inc. (“ADI”), ALPS Fund Services, Inc. (“AFS”) and ALPS Portfolio Solutions Distributor, Inc. (“APSD”). Because of his positions with AHI, BFDS, AAI, ADI, AFS and APSD, Mr. Burke is deemed an affiliate of the Trust as defined under the 1940 Act. | 58 | Mr. Burke is a Trustee of ALPS ETF Trust (20 funds); Clough Global Dividend and Income Fund (1 fund); Clough Global Equity Fund (1 fund); Clough Global Opportunities Fund (1 fund); Clough Funds Trust (1 fund); Liberty All-Star Equity Fund (1 fund); and Director of the Liberty All-Star Growth Fund, Inc. (1 fund). |
| * | All communications to Trustees and Officers may be directed to Financial Investors Trust c/o 1290 Broadway, Suite 1100, Denver, CO 80203. |
| ** | This is the period for which the Trustee or Officer began serving the Trust. Each Trustee serves an indefinite term, until such Trustees successor is elected and appointed, or such Trustee resigns or is deceased. Officers are elected on an annual basis. |
| *** | Except as otherwise indicated, each individual has held the office shown or other offices in the same company for the last five years. |
| **** | The Fund Complex includes all series of the Trust, currently 32, and any other investment companies for which any Trustee serves as trustee for and for which ALPS Advisors or Red Rocks, Wellington Management, Clough Capital, RiverFront, Kotak, or Smith Capital provides investment advisory services (currently 33 funds, 1 fund, 0 funds, 4 funds, 5 funds, 0 funds, and 0 funds, respectively). |
Trustees and Officers
October 31, 2018 (Unaudited)
OFFICERS
Name, Address* & Year of Birth | Position(s) Held with Fund | Term of Office** and Length of Time Served | Principal Occupation(s) During Past 5 Years*** |
Kimberly R.
Storms,
1972 | Treasurer | Ms. Storms was elected Treasurer of the Trust at the March 12, 2013 meeting of the Board of Trustees. | Ms. Storms is Senior Vice President - Director of Fund Administration of ALPS. Because of her position with ALPS, Ms. Storms is deemed an affiliate of the Trust as defined under the 1940 Act. Ms. Storms is also Treasurer of Liberty All-Star Equity Fund, Liberty All-Star Growth Fund, Inc., and ALPS Series Trust. Ms. Storms also serves as a Board member and Treasurer of The Center for Trauma & Resilience, a nonprofit agency. |
Karen S. Gilomen,
1970 | Secretary | Ms. Gilomen was elected Secretary of the Trust at the December 13, 2016 meeting of the Board of Trustees. | Ms. Gilomen joined ALPS in August 2016 as Vice President and Senior Counsel. Prior to joining ALPS, Ms. Gilomen was Vice President - General Counsel & CCO of Monticello Associates, Inc. from 2010 to 2016. Because of her position with ALPS, Ms. Gilomen is deemed an affiliate of the Trust, as defined under the 1940 Act. Ms. Gilomen is also the Secretary of Clough Funds Trust, Clough Global Dividend and Income Fund, Clough Global Equity Fund, Clough Global Opportunities Fund, Reaves Utility Income Fund, and the Assistant Secretary of the WesMark Funds. |
Ted Uhl,
1974 | Chief Compliance Officer (“CCO”) | Mr. Uhl was appointed CCO of the Trust at the June 8, 2010 meeting of the Board of Trustees. | Mr. Uhl joined ALPS in October 2006, and is currently Deputy Compliance Officer of ALPS. Prior to his current role, Mr. Uhl served as Senior Risk Manager for ALPS from October 2006 until June 2010. Before joining ALPS, Mr. Uhl served a Sr. Analyst with Enenbach and Associates (RIA), and a Sr. Financial Analyst at Sprint. Because of his position with ALPS, Mr. Uhl is deemed an affiliate of the Trust as defined under the 1940 Act. Mr. Uhl is also CCO of the Boulder Growth & Income Fund, Inc., Centre Funds, Index Funds, Reality Shares ETF Trust, Reaves Utility Income Fund and XAI Octagon Floating Rate & Alternative Income Term Trust. |
Jennell Panella, 1974 | Assistant Treasurer | Ms. Panella was elected Assistant Treasurer of the Trust at the September 15, 2015 meeting of the Board of Trustees. | Ms. Panella joined ALPS in June 2012 and is currently Fund Controller of ALPS Fund Services, Inc. Prior to joining ALPS, Ms. Panella served as Financial Reporting Manager for Parker Global Strategies, LLC (2009-2012). Because of her position with ALPS, Ms. Panella is deemed an affiliate of the Trust as defined under the 1940 Act. Ms. Panella also serves as Assistant Treasurer of James Advantage Funds. |
| * | All communications to Trustees and Officers may be directed to Financial Investors Trust c/o 1290 Broadway, Suite 1100, Denver, CO 80203. |
| ** | This is the period for which the Trustee or Officer began serving the Trust. Each Trustee serves an indefinite term, until such Trustees successor is elected and appointed, or such Trustee resigns or is deceased. Officers are elected on an annual basis. |
| *** | Except as otherwise indicated, each individual has held the office shown or other offices in the same company for the last five years. |
Trustees and Officers
October 31, 2018 (Unaudited)
OFFICERS (continued)
Name, Address* & Year of Birth | Position(s) Held with Fund | Term of Office** and Length of Time Served | Principal Occupation(s) During Past 5 Years*** |
Sharon Akselrod,
1974 | Assistant Secretary | Ms. Akselrod was elected Assistant Secretary of the Trust at the September 15, 2015 meeting of the Board of Trustees. | Ms. Akselrod joined ALPS in August 2014 and is currently Senior Investment Company Act Paralegal of ALPS Fund Services, Inc. Prior to joining ALPS, Ms. Akselrod served as Corporate Governance and Regulatory Associate for Nordstrom fsb (2013- 2014) and Senior Legal Assistant - Legal Manager for AXA Equitable Life Insurance Company (2008-2013). Because of her position with ALPS, Ms. Akselrod is deemed an affiliate of the Trust as defined under the 1940 Act. Ms. Akselrod is also Assistant Secretary of ALPS ETF Trust, Principal Real Estate Income Fund and ALPS Variable Investment Trust. |
Jennifer Craig,
1973 | Assistant Secretary | Ms. Craig was elected Assistant Secretary of the Trust at the June 8, 2016 meeting of the Board of Trustees. | Ms. Craig joined ALPS in 2007 and is currently Assistant Vice President and Paralegal Manager of ALPS. Prior to joining ALPS, Ms. Craig was Legal Manager at Janus Capital Management LLC and served as Assistant Secretary of Janus Investment Fund, Janus Adviser Series and Janus Aspen Series. Because of her position with ALPS, Ms. Craig is deemed an affiliate of the Trust as defined under the 1940 Act. Ms. Craig is also Assistant Secretary of Clough Global Dividend and Income Fund, Clough Global Equity Fund, Clough Global Opportunities Fund, Clough Funds Trust, Liberty All- Star Equity Fund and Liberty All-Star Growth Fund, Inc. |
Sareena Khwaja-
Dixon,
1980 | Assistant Secretary | Ms. Khwaja-Dixon was elected Assistant Secretary of the Trust at the December 12, 2017 meeting of the Board of Trustees. | Ms. Khwaja-Dixon joined ALPS in August 2015 and is currently Senior Counsel and Vice President of ALPS Fund Services, Inc. Prior to joining ALPS, Ms. Khwaja-Dixon served as a Senior Paralegal/Paralegal for Russell Investments (2011 - 2015). Ms. Khwaja-Dixon is also Secretary of Liberty All-Star Equity Fund and Liberty All-Star Growth Fund, Inc., and Assistant Secretary of Clough Funds Trust, Clough Dividend and Income Fund, Clough Global Opportunities Fund, and Clough Global Equity Fund. |
| * | All communications to Trustees and Officers may be directed to Financial Investors Trust c/o 1290 Broadway, Suite 1100, Denver, CO 80203. |
| ** | This is the period for which the Trustee or Officer began serving the Trust. Each Trustee serves an indefinite term, until such Trustees successor is elected and appointed, or such Trustee resigns or is deceased. Officers are elected on an annual basis. |
| *** | Except as otherwise indicated, each individual has held the office shown or other offices in the same company for the last five years |
Item 2. Code of Ethics.
| (a) | The Registrant, as of the end of the period covered by this report, has adopted a code of ethics that applies to the Registrant’s principal executive officer, principal financial officer, principal accounting officer or controller or any persons performing similar functions on behalf of the Registrant. |
| (c) | During the period covered by this report, no amendments to the provisions of the code of ethics described in Item 2(a) above were made. |
| (d) | During the period covered by this report, no implicit or explicit waivers to the provisions of the code of ethics described in Item 2(a) above were granted. |
| (f) | The Registrant’s Code of Ethics is attached as an Exhibit to this report. |
Item 3. Audit Committee Financial Expert.
The Board of Trustees of the Registrant has determined that the Registrant has at least one Audit Committee Financial Expert serving on its audit committee. The Board of Trustees of the Registrant has designated Jeremy W. Deems as the Registrant’s “Audit Committee Financial Expert.” Mr. Deems is “independent” as defined in paragraph (a)(2) of Item 3 to Form N-CSR.
Item 4. Principal Accountant Fees and Services.
| (a) | Audit Fees: For the Registrant’s fiscal years ended October 31, 2018 and October 31, 2017, the aggregate fees billed for professional services rendered by the principal accountant for the audit of the Registrant’s annual financial statements were $225,450 and $239,940, respectively. |
| (b) | Audit-Related Fees: For the Registrant’s fiscal years ended October 31, 2018 and October 31, 2017, the aggregate fees billed for assurance and related services by the principal accountant that were reasonably related to the performance of the audit of the Registrant’s financial statements and are not reported under paragraph (a) of this Item were $0 and $0, respectively. |
| (c) | Tax Fees: For the Registrant’s fiscal years ended October 31, 2018 and October 31, 2017, the aggregate fees billed for professional services rendered by the principal accountant for tax compliance, tax advice and tax planning were $59,390 and $59,440, respectively. The fiscal year 2018 and 2017 tax fees were for services for dividend calculation, excise tax preparation and tax return preparation. |
| (d) | All Other Fees: For the Registrant’s fiscal years ended October 31, 2018 and October 31, 2017, no fees were billed to Registrant by the principal accountant for services other than the services reported in paragraphs (a) through (c) of this Item. |
| (e)(1) | Audit Committee Pre-Approval Policies and Procedures: All services to be performed by the Registrant’s principal accountant must be pre-approved by the Registrant’s audit committee. The Chairman of the Audit Committee may pre-approve non-audit services to be performed by the Registrant’s principal accountant on an interim basis, subject to ratification by the Audit Committee at its next regularly scheduled meeting. |
| (e)(2) | No services described in paragraphs (b) through (d) of this Item were approved by the Registrant’s audit committee pursuant to paragraph (c)(7)(i)(C) of Rule 2-01 of Regulation S-X. |
| (g) | The aggregate non-audit fees billed by the Registrant’s accountant for services rendered to the Registrant, and rendered to the Registrant’s investment adviser (not including any sub-adviser whose role is primarily portfolio management and is subcontracted with or overseen by another investment adviser), and any entity controlling, controlled by, or under common control with the adviser that provides ongoing services to the Registrant, were $80,918 in the fiscal year ended October 31, 2018 and $79,272 in the fiscal year ended October 31, 2017. These fees consisted of non-audit fees billed to (i) the Registrant of $59,390 in the fiscal year ended October 31, 2018 and $59,440 in the fiscal year ended October 31, 2017 as described in response to paragraph (c) above and (ii) to ALPS Fund Services, Inc. (“AFS”), an entity under common control with ALPS Advisors, Inc., the Registrant’s investment adviser, of $21,528 in the fiscal year ended October 31, 2018 and $19,832 in the fiscal year ended October 31, 2017. The non-audit fees billed to AFS related to SSAE 16 services and other compliance-related matters. |
| (h) | The Registrant’s audit committee has considered whether the provision of non-audit services that were rendered to the Registrant’s investment adviser (not including any sub-adviser whose role is primarily portfolio management and is subcontracted with or overseen by another investment adviser), and any entity controlling, controlled by, or under common control with the investment adviser that provides ongoing services to the Registrant that were not pre-approved pursuant to |
| | paragraph (c)(7)(ii) of Rule 2-01 of Regulation S-X, is compatible with maintaining the principal accountant’s independence. The Registrant’s audit committee determined that the provision of such non-audit services is compatible with maintaining the principal accountant’s independence. |
Item 5. Audit Committee of Listed Registrants.
Not applicable.
Item 6. Investments.
| (a) | Schedule of Investments is included as part of the Reports to Stockholders filed under Item 1 of this Form N-CSR. |
Item 7. Disclosure of Proxy Voting Policies and Procedures for Closed-End Management Investment Companies.
Not applicable to the Registrant.
Item 8. Portfolio Managers of Closed-End Management Investment Companies.
Not applicable to the Registrant.
Item 9. Purchases of Equity Securities by Closed-End Management Investment Company and Affiliated Purchasers.
Not applicable to the Registrant.
Item 10. Submission of Matters to a Vote of Security Holders.
There have been no material changes to the procedures by which shareholders may recommend nominees to the Registrant’s Board of Trustees, where those changes were implemented after the Registrant last provided disclosure in response to the requirements of Item 407(c)(2)(iv) of Regulation S-K, or this Item.
Item 11. Controls and Procedures.
| (a) | The Registrant’s principal executive officer and principal financial officer have concluded that the Registrant’s disclosure controls and procedures (as defined in Rule 30a-3(c) under the Investment Company Act of 1940, as amended) are effective based on their evaluation of these controls and procedures as of a date within 90 days of the filing date of this report. |
| (b) | There was no change in the Registrant’s internal control over financial reporting (as defined in Rule 30a-3(d) under the Investment Company Act of 1940, as amended) during the Registrant’s last fiscal quarter that has materially affected, or is reasonably likely to materially affect, the Registrant’s internal control over financial reporting. |
Item 12. Disclosure of Securities Lending Activities for Closed-End Management Investment Companies.
Not applicable to the Registrant.
Item 13. Exhibits.
| (a)(1) | Registrant’s Code of Ethics for Principal Executive and Senior Financial Officers, which is the subject of the disclosure required by Item 2 of Form N-CSR, is incorporated by reference to Exhibit 12(a)(1) to the Registrant’s Certified Shareholder Report on Form N-CSR, File No. 811-8194, filed on January 9, 2017. |
| (a)(2) | The certifications required by Rule 30a-2(a) of the Investment Company Act of 1940, as amended, and Section 302 of the Sarbanes-Oxley Act of 2002 are attached hereto as Exhibit 99.Cert. |
| (a)(4) | Not applicable to the Registrant. |
| (b) | The certifications by the Registrant’s principal executive officer and principal financial officer, as required by Rule 30a-2(b) of the Investment Company Act of 1940, as amended, and Section 906 of the Sarbanes-Oxley Act of 2002 are attached hereto as Exhibit 99.906Cert. |
SIGNATURES
Pursuant to the requirements of the Securities Exchange Act of 1934 and the Investment Company Act of 1940, the Registrant has duly caused this report to be signed on its behalf by the undersigned, thereunto duly authorized.
FINANCIAL INVESTORS TRUST
| By: | /s/ Edmund J. Burke | |
| | Edmund J. Burke (Principal Executive Officer) | |
| | President | |
| | | |
| Date: | January 7, 2019 | |
Pursuant to the requirements of the Securities Exchange Act of 1934 and the Investment Company Act of 1940, this report has been signed below by the following persons on behalf of the Registrant and in the capacities and on the dates indicated.
FINANCIAL INVESTORS TRUST
| By: | /s/ Edmund J. Burke | |
| | Edmund J. Burke (Principal Executive Officer) | |
| | President | |
| | | |
| Date: | January 7, 2019 | |
| | | |
| By: | /s/ Kimberly R. Storms | |
| | Kimberly R. Storms (Principal Financial Officer) | |
| | Treasurer | |
| | | |
| Date: | January 7, 2019 | |