UNITED STATES
SECURITIES AND EXCHANGE COMMISSION
Washington, D.C. 20549
FORM N-CSR
CERTIFIED SHAREHOLDER REPORT OF REGISTERED
MANAGEMENT INVESTMENT COMPANIES
Investment Company Act file number: 811-08194
FINANCIAL INVESTORS TRUST
(Exact name of registrant as specified in charter)
1290 Broadway, Suite 1000, Denver, Colorado 80203
(Address of principal executive offices) (Zip code)
Karen Gilomen, Esq., Secretary
Financial Investors Trust
1290 Broadway, Suite 1000
Denver, Colorado 80203
(Name and address of agent for service)
Registrant’s telephone number, including area code: 303-623-2577
Date of fiscal year end: April 30
Date of reporting period: April 30, 2020
Item 1. Reports to Stockholders.


TABLE OF CONTENTS
ANNUAL REPORT
| SHAREHOLDER LETTER | 1 |
| PERFORMANCE UPDATE | 4 |
| DISCLOSURE OF FUND EXPENSES | 6 |
| PORTFOLIO OF INVESTMENTS | 7 |
| STATEMENT OF ASSETS AND LIABILITIES | 18 |
| STATEMENT OF OPERATIONS | 19 |
| STATEMENTS OF CHANGES IN NET ASSETS | 20 |
| FINANCIAL HIGHLIGHTS | 22 |
| NOTES TO FINANCIAL STATEMENTS | 24 |
| REPORT OF INDEPENDENT REGISTERED PUBLIC ACCOUNTING FIRM | 31 |
| ADDITIONAL INFORMATION | 32 |
| DISCLOSURE REGARDING APPROVAL OF FUND ADVISORY AGREEMENTS | 33 |
| LIQUIDITY RISK MANAGEMENT PROGRAM | 36 |
| TRUSTEES AND OFFICERS | 37 |
| PRIVACY POLICY | 42 |
Beginning on January 1, 2021, as permitted by regulations adopted by the U.S. Securities and Exchange Commission, paper copies of the Fund’s annual and semi-annual shareholder reports will no longer be sent by mail, unless you specifically request paper copies of the reports. Instead, the reports will be made available on the Fund’s website at www.dgifund.com, and you will be notified by mail each time a report is posted and provided with a website link to access the report.
You may, notwithstanding the availability of shareholder reports online, elect to receive all future shareholder reports in paper free of charge. If you invest through a financial intermediary, you can contact your financial intermediary to request that you continue to receive paper copies of your shareholder reports. If you invest directly with the Fund, you can call 1.855.DGI. FUND (1-855-344-3863) to let the Fund know you wish to continue receiving paper copies of your shareholder reports.
If you already elected to receive shareholder reports electronically, you will not be affected by this change and you need not take any action. You may elect to receive shareholder reports and other communications from the Fund electronically anytime by contacting your financial intermediary (such as a broker-dealer or bank) or, if you are a direct investor, by enrolling at www.dgifund.com.
Disciplined Growth Investors’ goal is to communicate clearly and transparently with our clients and mutual fund shareholders. It is mutually beneficial when our shareholders understand how we invest, what we are currently thinking and forecasting, and the specific investment decisions we have made. Our views and opinions regarding the investment prospects of our portfolio holdings and the Fund are “forward looking statements” which may or may not be accurate over the long term. While we believe we have a reasonable basis for these forecasts and have confidence in our investment team’s views, actual results may differ materially from those we anticipate. Information provided in this report should not be considered a recommendation to purchase or sell any particular security.
You can identify forward looking statements as those including words such as “believe”, “expect”, “anticipate”, “forecast”, and similar statement. We cannot assure future performance. These forward-looking statements are made only as-of the date of this report. Following the publication of this report, we will not update any of the forward-looking statements included here.
This material must be preceded or accompanied by a prospectus. Please read the prospectus carefully before investing.
| The Disciplined Growth Investors Fund | Shareholder Letter |
April 30, 2020 (Unaudited)
Fund Performance and Asset Mix:
For the 2019 fiscal year (5/1/19-4/30/20), The Disciplined Growth Investors Fund (“DGI Fund”) returned -4.79%. Stocks in the Fund decreased by 9.71% and bonds increased 7.68%.
Stocks in the DGI Fund underperformed the S&P 500® Index, which increased 0.86%. The DGI Fund held 20 stocks that increased in value and 36 stocks that declined in value. The ten largest equity holdings in the DGI Fund combined to add 0.64% to the Fund’s total performance.
The Fund’s bond portfolio underperformed the Barclays Government & Corporate Credit index, which gained 12.21% during the fiscal year.
This fiscal year had two primary dynamics play out: a continued market increase driven by a “thin” group of stocks and the COVID-19 pandemic-induced market volatility & decline. We have written separately about the impact COVID-19 has had on the markets, and will likely offer more on this in the future.
Even with the COVID-driven changes in the market, the stock market has remained “thin”, by which we mean a select few stocks that performed extremely well and left most others behind. This dynamic has reached an extreme, in our opinion. Our research shows that as of the date of this letter, the five largest companies in the S&P 500® Index make up a near-record weight of that index – meaning their stock prices relative to the rest of the index are significantly inflated. Those five largest companies had an aggregate valuation greater than that of the bottom 354 companies in that index, combined. This is what we mean when we refer to a top-heavy, or “thin” market.
What this means for us in managing your Fund is that despite a select small group of stocks still being significantly overvalued, we are finding attractive investment opportunities. We are paying close attention to valuations of investments held in the DGI Fund as the pandemic plays out and impacts the economy and equity markets. A few DGI Fund stocks have been part of the “thin” selection of the market, increasing significantly in value. Where “valuation risk” (overvaluation of the stock) becomes a concern, we may reduce our investments in some of these holdings. It’s noteworthy that other holdings are adversely affected by this situation, such as JetBlue, Royal Caribbean, TripAdvisor, Nordstrom, and similar. We are closely monitoring these and in regular communication with their management teams as they chart the best path forward. Normally adverse economic conditions reduce demand for oil and gas, yet natural Gas stocks like Cabot and Southwestern Energy have increased in value since the pandemic hit. This is due to extreme oil price declines resulting in reduced US shale oil production. Shale oil producers lift a significant amount of natural gas as a byproduct and sell it at steeply discounted prices since it is not their primary product. With low oil prices and a decline in shale oil production, less cheap natural gas enters the market and natural gas prices can rise as a result.
We are working on an article with a broader forward-looking investment evaluation and will send that to you as soon as it is complete.
Performance data quoted represents past performance. Past performance does not guarantee future results. Investment return and principal value of an investment will fluctuate so that an investor’s shares, when sold or redeemed, may be worth more or less than the original cost. Current performance data may be higher or lower than actual data quoted. For the most current month-end performance data please call 1.855.DGI.FUND.
| Annual Report | April 30, 2020 | 1 |
| The Disciplined Growth Investors Fund | Shareholder Letter |
April 30, 2020 (Unaudited)
You can find additional performance information and a full list of the Fund’s holdings in this Annual report and at www.dgifund.com.
Portfolio Activity:
Since we last wrote to you last (10/31/19), we added three new stocks to the DGI Fund and sold the remaining position in one.
New Stocks:
Alarm.com (ALRM) owns the leading cloud software platform designed to manage interactive security systems (i.e. an app) for home residences and businesses. The company also designs and manufactures select pieces of hardware that connect to its security management system (e.g. cameras). They sell exclusively through a network of service providers who install, maintain, and bill the end-consumer while using the Alarm.com platform to administer their business. Domestic residential security alone is a multibillion-dollar market, while commercial, smart-home, and international are as large or larger. Because Alarm is the leader in this space, they are also well-positioned to become the dominant developer for the smart-home operating system. For these reasons, we initiated a position in the company.
Arista Networks (ANET) provides software-driven networking solutions for large-scale data centers and enterprise campus environments. The company’s cloud network platform consists primarily of routers, switches, and a proprietary operating system. ANET’s modular and scalable cloud solutions have captured meaningful market share by providing performance advantages, reliability, a high-level of automation, and integration with third-party software. The stock price has come under pressure recently due to a slow-down in network infrastructure spending at the large cloud services providers, allowing us to buy the company at an attractive price.
Stitch Fix (SFIX) has been a holding in our small cap portfolio since 2018. They are an online apparel retailer that uses human stylists and algorithms to tailor apparel selections for each individual customer, resulting in clothing recommendations that they are more likely to buy and love. While there are a lot of retailers offering direct-delivered apparel-in-a-box shipments, only Stitch Fix uses a data-driven approach within a profitable business model. Branded clothing companies value Stitch Fix as a partner because they generally sell product at full price and share valuable data on why customers bought their items. Stitch Fix has continued to mature its business model, demonstrated an ability to innovate, and experienced increased customer adoption. As a result, we initiated a position in our balanced portfolio.
Complete Sales:
We sold the remaining position in Ultra Petroleum, Inc (UPLC) due to increased financial risk.
Acquisitions:
None.
Sincerely,

Frederick K. Martin, CFA -- Portfolio Manager
Disciplined Growth Investors, Inc.
| 2 | 1-855-DGI-FUND (344-3863) | www.DGIfund.com |
| The Disciplined Growth Investors Fund | Shareholder Letter |
April 30, 2020 (Unaudited)
The Barclay’s Government & Corporate Credit index includes both corporate (publicly-issued, fixed-rate, nonconvertible, investment grade, dollar-denominated, SEC-registered, corporate dept.) and government (Treasury Bond index, Agency Bond index, 1-3 Year Government index, and the 20+-Year treasury) indexes, including bonds with maturities up to ten years.
The S&P 500® Total Return Index is an unmanaged index of 500 common stocks chosen for market size, liquidity and industry group representation. It is a market-value weighted index. The Index is not actively managed and does not reflect any deductions for fees, expenses or taxes. An investor may not invest directly in the Index.
Asset class-specific performance is before fees. The Fund’s single fee – the management fee – is paid from the Fund’s holding of cash. Total Fund net-of-fees performance is presented in this letter, later in this annual report, and is updated monthly on the Fund’s website, www.dgifund.com.
The views of Disciplined Growth Investors, Inc. and information discussed in this commentary are as of the date of publication, are subject to change, and may not reflect the writers’ current views.
The views expressed are those of the Fund’s adviser only, and represent an assessment of market conditions at a specific point in time, are opinions only and should not be relied upon as investment advice regarding a particular investment or markets in general. Such information does not constitute a recommendation to buy or sell specific securities or investment vehicles. It should not be assumed that any investment will be profitable or will equal the performance of the portfolios or any securities or any sectors mentioned in this letter. The subject matter contained in this letter has been derived from several sources believed to be reliable and accurate at the time of compilation. Neither Disciplined Growth Investors, Inc. nor the Fund accepts any liability for losses either direct or consequential caused by the use of this information.
The Fund is distributed by ALPS Distributors, Inc.
The Fund is subject to investment risks, including possible loss of the principal amount invested and therefore is not suitable for all investors. The Fund may not achieve its objectives.
Diversification does not eliminate the risk of experiencing investment losses.
Fred Martin is a registered representative of ALPS Distributors, Inc. CFA Institute Marks are trademarks owned by the CFA Institute.
| Annual Report | April 30, 2020 | 3 |
| The Disciplined Growth Investors Fund | Performance Update |
April 30, 2020 (Unaudited)
Annualized Total Return Performance (for the period ended April 30, 2020)
| | 6 month | Calendar YTD | 1 Year | 3 Year | 5 Year | Since Inception* |
| The Disciplined Growth Investors Fund | -5.68% | -9.57% | -4.79% | 6.24% | 6.19% | 10.26% |
| S&P 500® Total Return Index(1) | -3.16% | -9.29% | 0.86% | 9.04% | 9.12% | 13.27% |
Performance data quoted represents past performance. Past performance does not guarantee future results. Investment return and principal value of an investment will fluctuate so that an investor’s shares, when sold or redeemed, may be worth more or less than the original cost. Current performance data may be higher or lower than actual data quoted. For the most current month-end performance data please call 1.855.DGI.FUND.
The table does not reflect the deductions of taxes a shareholder would pay on Fund distributions or redemptions of Fund shares.
Subject to investment risks, including possible loss of the principal amount invested.
Returns for periods less than 1 year are cumulative.
| * | Fund Inception date of August 12, 2011. |
| (1) | The S&P 500® Total Return Index is an unmanaged index of 500 common stocks chosen for market size, liquidity and industry group representation. It is a market-value weighted index. The Index is not actively managed and does not reflect any deductions for fees, expenses or taxes. An investor may not invest directly in the Index. |
| 4 | 1-855-DGI-FUND (344-3863) | www.DGIfund.com |
| The Disciplined Growth Investors Fund | Performance Update |
April 30, 2020 (Unaudited)
Growth of $10,000 Investment in the Fund (for the period ended April 30, 2020)
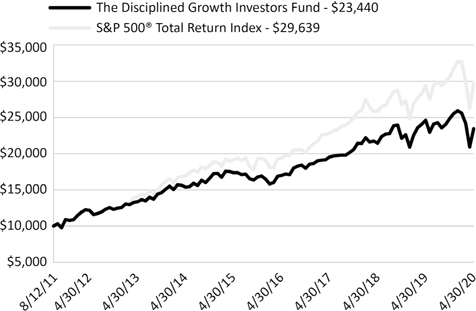
The chart above represents historical performance of a hypothetical investment of $10,000 in the Fund since inception. Past performance does not guarantee future results. This chart does not reflect the deduction of taxes that a shareholder would pay on Fund distributions or the redemption of Fund shares.
Investing in the Fund is subject to investment risks, including possible loss of the principal amount invested.
Industry Sector Allocation
(as a % of Net Assets)*
| Technology | 34.44% |
| Consumer Discretionary | 11.92% |
| Health Care | 7.75% |
| Industrials | 7.42% |
| Energy | 4.09% |
| Communications | 2.73% |
| Financials | 0.80% |
| Consumer Cyclical | 0.54% |
| Corporate Bonds | 23.10% |
| Foreign Corporate Bonds | 0.69% |
| Foreign Government Bonds | 0.33% |
| Government & Agency Obligations | 3.51% |
| Other Assets in Excess of Liabilities | 2.68% |
Top Ten Holdings
(as a % of Net Assets)*
| Cabot Oil & Gas Corp. | 3.08% |
| TJX Cos., Inc. | 2.89% |
| Autodesk, Inc. | 2.78% |
| Ubiquiti, Inc. | 2.71% |
| Intuit, Inc. | 2.70% |
| Align Technology, Inc. | 2.64% |
| Stamps.com, Inc. | 2.58% |
| Akamai Technologies, Inc. | 2.53% |
| Cognex Corp. | 2.49% |
| Gentex Corp. | 2.47% |
| Top Ten Holdings | 26.87% |
| * | Holdings are subject to change, and may not reflect the current or future position of the portfolio. |
| Annual Report | April 30, 2020 | 5 |
| The Disciplined Growth Investors Fund | Disclosure of Fund Expenses |
April 30, 2020 (Unaudited)
As a shareholder of the Fund, you incur two types of costs: (1) transaction costs, including sales charges (loads) on purchase payments, reinvested dividends, or other distributions; redemption fees; and exchange fees; and (2) ongoing costs, including management fees; distribution and/or service (12b-1) fees; and other fund operating expenses. This example is intended to help you understand your ongoing costs (in dollars), of investing in the Fund and to compare these costs with the ongoing costs of investing in other mutual funds.
This example is based on an investment of $1,000 invested at the beginning of the period and held for the entire six-month period of November 1, 2019 through April 30, 2020.
Actual Expenses The first line of the table below provides information about actual account values and actual expenses. You may use the information in this line, together with the amount you invested, to estimate the expenses that you paid over the period. Simply divide your account value by $1,000 (for example, an $8,600 account value divided by $1,000 = 8.6), then multiply the result by the number in the first line under the heading “Expenses Paid During Period” to estimate the expenses you paid on your account during this period.
Hypothetical Example for Comparison Purposes The second line of the table below provides information about hypothetical account values and hypothetical expenses based on the Fund’s actual expense ratio and an assumed rate of return of 5% per year before expenses, which is not the Fund’s actual return. The hypothetical account values and expenses may not be used to estimate the actual ending account balance or expenses you paid for the period. You may use this information to compare the ongoing costs of investing in the Fund and other mutual funds. To do so, compare this 5% hypothetical example with the 5% hypothetical examples that appear in the shareholder reports of the other funds.
Please note that the expenses shown in the table are meant to highlight your ongoing costs only and do not reflect transactional costs, such as sales charges (loads), redemption fees or exchange fees. Therefore, the second line of the table is useful in comparing ongoing costs only and will not help you determine the relative total costs of owning different funds. In addition, if these transactional costs were included, your costs would have been higher.
| | Beginning Account Value 11/1/2019 | Ending Account Value 4/30/2020 | Expense Ratio(a) | Expenses Paid During period 11/1/2019 - 4/30/2020(b) |
| Actual | $1,000.00 | $ 943.20 | 0.78% | $3.77 |
| Hypothetical (5% return before expenses) | $1,000.00 | $1,020.98 | 0.78% | $3.92 |
| (a) | The Fund's expense ratios have been annualized based on the Fund's most recent fiscal half-year expenses. |
| (b) | Expenses are equal to the Fund's annualized expense ratio, multiplied by the average account value over the period, multiplied by the number of days in the most recent fiscal half-year (182)/366 (to reflect the half-year period). |
| 6 | 1-855-DGI-FUND (344-3863) | www.DGIfund.com |
| The Disciplined Growth Investors Fund | Portfolio of Investments |
April 30, 2020
| | | Shares | | | Value (Note 2) | |
| COMMON STOCKS (69.69%) | | | | | | |
| COMMUNICATIONS (2.73%) | | | | | | |
| Media (2.73%) | | | | | | |
| Stamps.com, Inc. (a) | | | 36,943 | | | $ | 5,846,968 | |
| TripAdvisor, Inc. | | | 16,505 | | | | 329,605 | |
| | | | | | | | 6,176,573 | |
| | | | | | | | | |
| TOTAL COMMUNICATIONS | | | | | | | 6,176,573 | |
| | | | | | | | | |
| CONSUMER DISCRETIONARY (11.92%) | | | | | | | | |
| Apparel & Textile Products (0.75%) | | | | | | | | |
| Under Armour, Inc. , Class A(a) | | | 164,619 | | | | 1,715,330 | |
| | | | | | | | | |
| Automotive Manufacturing (3.06%) | | | | | | | | |
| Gentex Corp. | | | 230,669 | | | | 5,591,417 | |
| Gentherm, Inc. (a) | | | 35,826 | | | | 1,341,325 | |
| | | | | | | | 6,932,742 | |
| | | | | | | | | |
| Gaming, Lodging & Restaurants (1.20%) | | | | | | | | |
| Royal Caribbean Cruises, Ltd. | | | 58,077 | | | | 2,716,261 | |
| | | | | | | | | |
| Passenger Transportation (1.66%) | | | | | | | | |
| JetBlue Airways Corp. (a) | | | 385,793 | | | | 3,757,624 | |
| | | | | | | | | |
| Retail - Consumer Discretionary (5.25%) | | | | | | | | |
| Nordstrom, Inc. | | | 71,346 | | | | 1,339,878 | |
| Sleep Number Corp. (a) | | | 72,325 | | | | 2,162,518 | |
| Stitch Fix Inc (a) | | | 57,599 | | | | 924,464 | |
| TJX Cos., Inc. | | | 133,684 | | | | 6,557,200 | |
| Urban Outfitters, Inc. (a) | | | 52,662 | | | | 913,159 | |
| | | | | | | | 11,897,219 | |
| | | | | | | | | |
| TOTAL CONSUMER DISCRETIONARY | | | | | | | 27,019,176 | |
| | | | | | | | | |
| CONSUMER, CYCLICAL (0.54%) | | | | | | | | |
| Retail (0.54%) | | | | | | | | |
| MSC Industrial Direct Co., Inc. , Class A | | | 20,443 | | | | 1,219,221 | |
| | | | | | | | | |
| TOTAL CONSUMER, CYCLICAL | | | | | | | 1,219,221 | |
| Annual Report | April 30, 2020 | 7 |
| The Disciplined Growth Investors Fund | Portfolio of Investments |
April 30, 2020
| | | Shares | | | Value (Note 2) | |
| ENERGY (4.09%) | | | | | | |
| Oil, Gas & Coal (4.09%) | | | | | | |
| Cabot Oil & Gas Corp. | | | 322,602 | | | $ | 6,974,655 | |
| Core Laboratories NV | | | 28,475 | | | | 558,395 | |
| Southwestern Energy Co. (a) | | | 535,154 | | | | 1,728,547 | |
| | | | | | | | 9,261,597 | |
| | | | | | | | | |
| TOTAL ENERGY | | | | | | | 9,261,597 | |
| | | | | | | | | |
| FINANCIALS (0.80%) | | | | | | | | |
| Banking (0.25%) | | | | | | | | |
| TCF Financial Corp. | | | 19,378 | | | | 575,333 | |
| | | | | | | | | |
| Specialty Finance (0.55%) | | | | | | | | |
| Deluxe Corp. | | | 44,206 | | | | 1,245,283 | |
| | | | | | | | | |
| TOTAL FINANCIALS | | | | | | | 1,820,616 | |
| | | | | | | | | |
| HEALTH CARE (7.75%) | | | | | | | | |
| Medical Equipment & Devices Manufacturing (7.75%) | | | | | | | | |
| Align Technology, Inc. (a) | | | 27,882 | | | | 5,990,448 | |
| Edwards Lifesciences Corp. (a) | | | 13,707 | | | | 2,981,272 | |
| Intuitive Surgical, Inc. (a) | | | 8,885 | | | | 4,539,169 | |
| Myriad Genetics, Inc. (a) | | | 102,968 | | | | 1,591,885 | |
| Varian Medical Systems, Inc. (a) | | | 21,554 | | | | 2,465,347 | |
| | | | | | | | 17,568,121 | |
| | | | | | | | | |
| TOTAL HEALTH CARE | | | | | | | 17,568,121 | |
| | | | | | | | | |
| INDUSTRIALS (7.42%) | | | | | | | | |
| Electrical Equipment Manufacturing (2.91%) | | | | | | | | |
| Alarm.com Holdings, Inc. (a) | | | 21,512 | | | | 962,232 | |
| Cognex Corp. | | | 101,947 | | | | 5,631,552 | |
| | | | | | | | 6,593,784 | |
| | | | | | | | | |
| Machinery Manufacturing (1.92%) | | | | | | | | |
| Graco, Inc. | | | 43,386 | | | | 1,937,618 | |
| Middleby Corp. (a) | | | 43,319 | | | | 2,409,836 | |
| | | | | | | | 4,347,454 | |
| | | | | | | | | |
| Manufactured Goods (1.18%) | | | | | | | | |
| Proto Labs, Inc. (a) | | | 26,215 | | | | 2,663,182 | |
| 8 | 1-855-DGI-FUND (344-3863) | www.DGIfund.com |
| The Disciplined Growth Investors Fund | Portfolio of Investments |
April 30, 2020
| | | Shares | | | Value (Note 2) | |
| INDUSTRIALS (continued) | | | | | | |
| Transportation & Logistics (1.41%) | | | | | | |
| Landstar System, Inc. | | | 30,964 | | | $ | 3,198,891 | |
| | | | | | | | | |
| TOTAL INDUSTRIALS | | | | | | | 16,803,311 | |
| | | | | | | | | |
| TECHNOLOGY (34.44%) | | | | | | | | |
| Design, Manufacturing & Distribution (2.27%) | | | | | | | | |
| Plexus Corp. (a) | | | 82,161 | | | | 5,150,673 | |
| | | | | | | | | |
| Hardware (11.83%) | | | | | | | | |
| Arista Networks, Inc. (a) | | | 3,982 | | | | 873,253 | |
| Dolby Laboratories, Inc. , Class A | | | 86,704 | | | | 5,204,841 | |
| Garmin, Ltd. | | | 55,477 | | | | 4,502,513 | |
| Plantronics, Inc. | | | 59,136 | | | | 835,000 | |
| Pure Storage, Inc. , Class A(a) | | | 164,211 | | | | 2,364,639 | |
| Super Micro Computer, Inc. (a) | | | 176,951 | | | | 4,052,178 | |
| Ubiquiti, Inc. | | | 37,927 | | | | 6,145,312 | |
| ViaSat, Inc. (a) | | | 66,591 | | | | 2,823,458 | |
| | | | | | | | 26,801,194 | |
| | | | | | | | | |
| Semiconductors (4.21%) | | | | | | | | |
| IPG Photonics Corp. (a) | | | 12,927 | | | | 1,671,849 | |
| Microchip Technology, Inc. | | | 31,555 | | | | 2,768,320 | |
| Power Integrations, Inc. | | | 49,825 | | | | 5,099,589 | |
| | | | | | | | 9,539,758 | |
| | | | | | | | | |
| Software (13.18%) | | | | | | | | |
| Akamai Technologies, Inc. (a) | | | 58,763 | | | | 5,741,733 | |
| Autodesk, Inc. (a) | | | 33,657 | | | | 6,298,234 | |
| Intuit, Inc. | | | 22,635 | | | | 6,107,149 | |
| Manhattan Associates, Inc. (a) | | | 50,526 | | | | 3,584,315 | |
| Open Text Corp. | | | 112,912 | | | | 4,285,010 | |
| RealPage, Inc. (a) | | | 59,502 | | | | 3,837,284 | |
| | | | | | | | 29,853,725 | |
| Annual Report | April 30, 2020 | 9 |
| The Disciplined Growth Investors Fund | Portfolio of Investments |
April 30, 2020
| | | Shares | | | Value (Note 2) | |
| TECHNOLOGY (continued) | | | | | | |
| Technology Services (2.95%) | | | | | | |
| FactSet Research Systems, Inc. | | | 13,344 | | | $ | 3,669,600 | |
| IHS Markit, Ltd. | | | 27,705 | | | | 1,864,546 | |
| Paychex, Inc. | | | 16,838 | | | | 1,153,740 | |
| | | | | | | | 6,687,886 | |
| | | | | | | | | |
| TOTAL TECHNOLOGY | | | | | | | 78,033,236 | |
| | | | | | | | | |
| TOTAL COMMON STOCKS | | | | | | | | |
| (Cost $121,948,505) | | | | | | $ | 157,901,851 | |
| | | Principal Amount | | | Value (Note 2) | |
| CORPORATE BONDS (23.10%) | | | | | | |
| COMMUNICATIONS (1.34%) | | | | | | |
| Cable & Satellite (0.33%) | | | | | | |
| Comcast Corp. | | | | | | | | |
| 4.150%10/15/2028 | | $ | 640,000 | | | $ | 747,841 | |
| | | | | | | | | |
| Entertainment Content (0.32%) | | | | | | | | |
| ViacomCBS, Inc. | | | | | | | | |
| 3.700%06/01/2028 | | | 720,000 | | | | 719,335 | |
| | | | | | | | | |
| Wireless Telecommunications Services (0.69%) | | | | | | | | |
| AT&T, Inc. | | | | | | | | |
| 4.350%03/01/2029 | | | 677,000 | | | | 761,972 | |
| 4.450%04/01/2024 | | | 4,000 | | | | 4,359 | |
| Verizon Communications, Inc. | | | | | | | | |
| 4.125%03/16/2027 | | | 698,000 | | | | 810,776 | |
| | | | | | | | 1,577,107 | |
| | | | | | | | | |
| TOTAL COMMUNICATIONS | | | | | | | 3,044,283 | |
| | | | | | | | | |
| CONSUMER DISCRETIONARY (2.47%) | | | | | | | | |
| Airlines (0.31%) | | | | | | | | |
| Southwest Airlines Co. | | | | | | | | |
| 3.000%11/15/2026 | | | 756,000 | | | | 692,849 | |
| | | | | | | | | |
| Automobiles Manufacturing (0.29%) | | | | | | | | |
| General Motors Financial Co., Inc. | | | | | | | | |
| 5.250%03/01/2026 | | | 695,000 | | | | 668,167 | |
| 10 | 1-855-DGI-FUND (344-3863) | www.DGIfund.com |
| The Disciplined Growth Investors Fund | Portfolio of Investments |
April 30, 2020
| | | Principal Amount | | | Value (Note 2) | |
| CONSUMER DISCRETIONARY (continued) | | | | | | |
| Consumer Services (0.34%) | | | | | | |
| Cintas Corp. No 2 | | | | | | |
| 3.700%04/01/2027 | | $ | 710,000 | | | $ | 769,662 | |
| | | | | | | | | |
| Restaurants (0.38%) | | | | | | | | |
| McDonald's Corp., Series MTN | | | | | | | | |
| 6.300%03/01/2038 | | | 604,000 | | | | 854,661 | |
| | | | | | | | | |
| Retail - Consumer Discretionary (1.15%) | | | | | | | | |
| Advance Auto Parts, Inc. | | | | | | | | |
| 4.500%12/01/2023 | | | 685,000 | | | | 725,994 | |
| Amazon.com, Inc. | | | | | | | | |
| 5.200%12/03/2025 | | | 885,000 | | | | 1,070,473 | |
| Lowe's Cos., Inc. | | | | | | | | |
| 3.650%04/05/2029 | | | 742,000 | | | | 815,113 | |
| | | | | | | | 2,611,580 | |
| | | | | | | | | |
| TOTAL CONSUMER DISCRETIONARY | | | | | | | 5,596,919 | |
| | | | | | | | | |
| CONSUMER STAPLES (0.69%) | | | | | | | | |
| Food & Beverage (0.33%) | | | | | | | | |
| Anheuser-Busch InBev Worldwide, Inc. | | | | | | | | |
| 4.000%04/13/2028 | | | 670,000 | | | | 742,365 | |
| | | | | | | | | |
| Mass Merchants (0.36%) | | | | | | | | |
| Costco Wholesale Corp. | | | | | | | | |
| 2.750%05/18/2024 | | | 760,000 | | | | 817,871 | |
| | | | | | | | | |
| TOTAL CONSUMER STAPLES | | | | | | | 1,560,236 | |
| | | | | | | | | |
| CONSUMER, NON-CYCLICAL (0.69%) | | | | | | | | |
| Pharmaceuticals (0.69%) | | | | | | | | |
| AbbVie, Inc. | | | | | | | | |
| 4.250%11/14/2028 | | | 695,000 | | | | 800,982 | |
| CVS Health Corp. | | | | | | | | |
| 4.300%03/25/2028 | | | 685,000 | | | | 773,116 | |
| | | | | | | | 1,574,098 | |
| | | | | | | | | |
| TOTAL CONSUMER, NON-CYCLICAL | | | | | | | 1,574,098 | |
| Annual Report | April 30, 2020 | 11 |
| The Disciplined Growth Investors Fund | Portfolio of Investments |
April 30, 2020
| | | Principal Amount | | | Value (Note 2) | |
| ENERGY (2.15%) | | | | | | |
| Exploration & Production (0.32%) | | | | | | |
| Conoco Funding Co. | | | | | | |
| 7.250%10/15/2031 | | $ | 551,000 | | | $ | 728,676 | |
| | | | | | | | | |
| Pipeline (1.83%) | | | | | | | | |
| Boardwalk Pipelines LP | | | | | | | | |
| 5.950%06/01/2026 | | | 670,000 | | | | 611,852 | |
| Enbridge Energy Partners LP | | | | | | | | |
| 4.200%09/15/2021 | | | 4,000 | | | | 4,071 | |
| 5.875%10/15/2025 | | | 643,000 | | | | 700,589 | |
| Enterprise Products Operating LLC | | | | | | | | |
| 3.950%02/15/2027 | | | 710,000 | | | | 744,038 | |
| MPLX LP | | | | | | | | |
| 4.125%03/01/2027 | | | 748,000 | | | | 723,464 | |
| ONEOK, Inc. | | | | | | | | |
| 4.550%07/15/2028 | | | 694,000 | | | | 632,367 | |
| Williams Cos., Inc. | | | | | | | | |
| 3.750%06/15/2027 | | | 718,000 | | | | 717,425 | |
| | | | | | | | 4,133,806 | |
| | | | | | | | | |
| TOTAL ENERGY | | | | | | | 4,862,482 | |
| | | | | | | | | |
| FINANCIALS (4.37%) | | | | | | | | |
| Banks (1.02%) | | | | | | | | |
| Truist Financial Corp., Series MTN | | | | | | | | |
| 3.875%03/19/2029 | | | 695,000 | | | | 738,062 | |
| US Bancorp, Series MTN | | | | | | | | |
| 3.100%04/27/2026 | | | 739,000 | | | | 786,015 | |
| Wells Fargo & Co., Series GMTN | | | | | | | | |
| 4.300%07/22/2027 | | | 710,000 | | | | 778,080 | |
| | | | | | | | 2,302,157 | |
| | | | | | | | | |
| Consumer Finance (0.33%) | | | | | | | | |
| American Express Co. | | | | | | | | |
| 3.625%12/05/2024 | | | 708,000 | | | | 752,494 | |
| | | | | | | | | |
| Diversified Banks (1.03%) | | | | | | | | |
| Bank of America Corp., Series L | | | | | | | | |
| 4.183%11/25/2027 | | | 715,000 | | | | 780,070 | |
| Citigroup, Inc. | | | | | | | | |
| 4.300%11/20/2026 | | | 720,000 | | | | 782,653 | |
| 12 | 1-855-DGI-FUND (344-3863) | www.DGIfund.com |
| The Disciplined Growth Investors Fund | Portfolio of Investments |
April 30, 2020
| | | Principal Amount | | | Value (Note 2) | |
| FINANCIALS (continued) | | | | | | |
| Diversified Banks (continued) | | | | | | |
| JPMorgan Chase & Co. | | | | | | |
| 4.125%12/15/2026 | | $ | 690,000 | | | $ | 763,182 | |
| | | | | | | | 2,325,905 | |
| | | | | | | | | |
| Financial Services (0.67%) | | | | | | | | |
| Morgan Stanley, Series GMTN | | | | | | | | |
| 3.700%10/23/2024 | | | 690,000 | | | | 745,467 | |
| Northern Trust Corp. | | | | | | | | |
| 3.950%10/30/2025 | | | 693,000 | | | | 777,597 | |
| | | | | | | | 1,523,064 | |
| | | | | | | | | |
| Life Insurance (0.34%) | | | | | | | | |
| Principal Financial Group, Inc. | | | | | | | | |
| 3.100%11/15/2026 | | | 726,000 | | | | 770,574 | |
| | | | | | | | | |
| Property & Casualty Insurance (0.34%) | | | | | | | | |
| American International Group, Inc. | | | | | | | | |
| 4.250%03/15/2029 | | | 700,000 | | | | 765,428 | |
| | | | | | | | | |
| Real Estate (0.64%) | | | | | | | | |
| Simon Property Group LP | | | | | | | | |
| 3.250%11/30/2026 | | | 728,000 | | | | 716,939 | |
| Welltower, Inc. | | | | | | | | |
| 4.250%04/01/2026 | | | 712,000 | | | | 743,602 | |
| | | | | | | | 1,460,541 | |
| | | | | | | | | |
| TOTAL FINANCIALS | | | | | | | 9,900,163 | |
| | | | | | | | | |
| HEALTH CARE (0.69%) | | | | | | | | |
| Managed Care (0.69%) | | | | | | | | |
| Anthem, Inc. | | | | | | | | |
| 3.650%12/01/2027 | | | 731,000 | | | | 798,621 | |
| UnitedHealth Group, Inc. | | | | | | | | |
| 3.750%07/15/2025 | | | 691,000 | | | | 773,257 | |
| | | | | | | | 1,571,878 | |
| | | | | | | | | |
| TOTAL HEALTH CARE | | | | | | | 1,571,878 | |
| | | | | | | | | |
| INDUSTRIALS (3.42%) | | | | | | | | |
| Aerospace & Defense (0.65%) | | | | | | | | |
| Lockheed Martin Corp. | | | | | | | | |
| 3.100%01/15/2023 | | | 680,000 | | | | 718,107 | |
| Annual Report | April 30, 2020 | 13 |
| The Disciplined Growth Investors Fund | Portfolio of Investments |
April 30, 2020
| | | Principal Amount | | | Value (Note 2) | |
| INDUSTRIALS (continued) | | | | | | |
| Aerospace & Defense (continued) | | | | | | |
| Raytheon Technologies Corp. | | | | | | |
| 4.125%11/16/2028 | | $ | 640,000 | | | $ | 743,381 | |
| | | | | | | | 1,461,488 | |
| | | | | | | | | |
| Electrical Equipment Manufacturing (0.33%) | | | | | | | | |
| General Electric Co., Series MTN | | | | | | | | |
| 5.875%01/14/2038 | | | 653,000 | | | | 743,731 | |
| | | | | | | | | |
| Engineering & Construction (0.26%) | | | | | | | | |
| Fluor Corp. | | | | | | | | |
| 4.250%09/15/2028 | | | 725,000 | | | | 590,405 | |
| | | | | | | | | |
| Railroad (0.77%) | | | | | | | | |
| Burlington Northern Santa Fe LLC | | | | | | | | |
| 3.000%03/15/2023 | | | 2,000 | | | | 2,116 | |
| 3.400%09/01/2024 | | | 875,000 | | | | 954,651 | |
| Union Pacific Corp. | | | | | | | | |
| 3.250%08/15/2025 | | | 735,000 | | | | 794,304 | |
| | | | | | | | 1,751,071 | |
| | | | | | | | | |
| Transportation & Logistics (0.70%) | | | | | | | | |
| FedEx Corp. | | | | | | | | |
| 3.300%03/15/2027 | | | 756,000 | | | | 772,071 | |
| United Parcel Service, Inc. | | | | | | | | |
| 6.200%01/15/2038 | | | 558,000 | | | | 811,268 | |
| | | | | | | | 1,583,339 | |
| | | | | | | | | |
| Waste & Environment Services & Equipment (0.71%) | | | | | | | | |
| Republic Services, Inc. | | | | | | | | |
| 3.375%11/15/2027 | | | 735,000 | | | | 798,881 | |
| Waste Management, Inc. | | | | | | | | |
| 3.150%11/15/2027 | | | 745,000 | | | | 814,893 | |
| | | | | | | | 1,613,774 | |
| | | | | | | | | |
| TOTAL INDUSTRIALS | | | | | | | 7,743,808 | |
| 14 | 1-855-DGI-FUND (344-3863) | www.DGIfund.com |
| The Disciplined Growth Investors Fund | Portfolio of Investments |
April 30, 2020
| | | Principal Amount | | | Value (Note 2) | |
| MATERIALS (0.34%) | | | | | | |
| Chemicals (0.34%) | | | | | | |
| DuPont de Nemours, Inc. | | | | | | |
| 4.725%11/15/2028 | | $ | 666,000 | | | $ | 758,482 | |
| | | | | | | | | |
| TOTAL MATERIALS | | | | | | | 758,482 | |
| | | | | | | | | |
| TECHNOLOGY (0.34%) | | | | | | | | |
| Semiconductors (0.34%) | | | | | | | | |
| Analog Devices, Inc. | | | | | | | | |
| 3.900%12/15/2025 | | | 711,000 | | | | 775,817 | |
| | | | | | | | | |
| TOTAL TECHNOLOGY | | | | | | | 775,817 | |
| | | | | | | | | |
| UTILITIES (6.60%) | | | | | | | | |
| Utilities (6.60%) | | | | | | | | |
| Ameren Corp. | | | | | | | | |
| 2.500%09/15/2024 | | | 690,000 | | | | 715,178 | |
| American Electric Power Co., Inc. | | | | | | | | |
| 3.200%11/13/2027 | | | 731,000 | | | | 778,641 | |
| Black Hills Corp. | | | | | | | | |
| 3.150%01/15/2027 | | | 700,000 | | | | 707,344 | |
| CenterPoint Energy, Inc. | | | | | | | | |
| 4.250%11/01/2028 | | | 685,000 | | | | 748,786 | |
| CMS Energy Corp. | | | | | | | | |
| 3.000%05/15/2026 | | | 760,000 | | | | 802,386 | |
| Dominion Energy, Inc., Series B | | | | | | | | |
| 2.750%09/15/2022 | | | 695,000 | | | | 708,732 | |
| DTE Energy Co., Series C | | | | | | | | |
| 3.500%06/01/2024 | | | 715,000 | | | | 753,619 | |
| Duke Energy Corp. | | | | | | | | |
| 3.950%10/15/2023 | | | 690,000 | | | | 741,410 | |
| Edison International | | | | | | | | |
| 2.400%09/15/2022 | | | 745,000 | | | | 744,225 | |
| Interstate Power & Light Co. | | | | | | | | |
| 3.400%08/15/2025 | | | 723,000 | | | | 770,282 | |
| ITC Holdings Corp. | | | | | | | | |
| 4.050%07/01/2023 | | | 540,000 | | | | 573,859 | |
| NiSource, Inc. | | | | | | | | |
| 3.850%02/15/2023 | | | 695,000 | | | | 732,469 | |
| PacifiCorp | | | | | | | | |
| 5.250%06/15/2035 | | | 592,000 | | | | 794,186 | |
| Potomac Electric Power Co. | | | | | | | | |
| 3.600%03/15/2024 | | | 698,000 | | | | 748,857 | |
| Annual Report | April 30, 2020 | 15 |
| The Disciplined Growth Investors Fund | Portfolio of Investments |
April 30, 2020
| | | Principal Amount | | | Value (Note 2) | |
| UTILITIES (continued) | | | | | | |
| Utilities (continued) | | | | | | |
| PPL Capital Funding, Inc. | | | | | | |
| 3.100%05/15/2026 | | $ | 820,000 | | | $ | 861,899 | |
| PSEG Power LLC | | | | | | | | |
| 4.300%11/15/2023 | | | 675,000 | | | | 704,144 | |
| Puget Energy, Inc. | | | | | | | | |
| 3.650%05/15/2025 | | | 725,000 | | | | 726,744 | |
| Sempra Energy | | | | | | | | |
| 3.750%11/15/2025 | | | 699,000 | | | | 747,673 | |
| Virginia Electric & Power Co., Series A | | | | | | | | |
| 3.800%04/01/2028 | | | 710,000 | | | | 807,494 | |
| Wisconsin Electric Power Co. | | | | | | | | |
| 3.100%06/01/2025 | | | 735,000 | | | | 786,874 | |
| | | | | | | | 14,954,802 | |
| | | | | | | | | |
| TOTAL UTILITIES | | | | | | | 14,954,802 | |
| | | | | | | | | |
| TOTAL CORPORATE BONDS | | | | | | | | |
| (Cost $50,026,429) | | | | | | $ | 52,342,968 | |
| | | | | | | | | |
| FOREIGN CORPORATE BONDS (0.69%) | | | | | | | | |
| ENERGY (0.35%) | | | | | | | | |
| Pipeline (0.35%) | | | | | | | | |
| TransCanada PipeLines, Ltd. | | | | | | | | |
| 7.250%08/15/2038 | | | 572,000 | | | | 776,883 | |
| | | | | | | | | |
| TOTAL ENERGY | | | | | | | 776,883 | |
| | | | | | | | | |
| FINANCIALS (0.34%) | | | | | | | | |
| Diversified Banks (0.34%) | | | | | | | | |
| Royal Bank of Canada, Series GMTN | | | | | | | | |
| 2.550%07/16/2024 | | | 746,000 | | | | 771,791 | |
| | | | | | | | | |
| TOTAL FINANCIALS | | | | | | | 771,791 | |
| | | | | | | | | |
| TOTAL FOREIGN CORPORATE BONDS | | | | | | | | |
| (Cost $1,485,879) | | | | | | $ | 1,548,674 | |
| 16 | 1-855-DGI-FUND (344-3863) | www.DGIfund.com |
| The Disciplined Growth Investors Fund | Portfolio of Investments |
April 30, 2020
| | | Principal Amount | | | Value (Note 2) | |
| FOREIGN GOVERNMENT BONDS (0.33%) | | | | | | |
| Corp Andina de Fomento | | | | | | |
| 4.375%06/15/2022 | | $ | 712,000 | | | $ | 752,627 | |
| | | | | | | | | |
| TOTAL FOREIGN GOVERNMENT BONDS | | | | | | | | |
| (Cost $737,223) | | | | | | $ | 752,627 | |
| | | | | | | | | |
| GOVERNMENT & AGENCY OBLIGATIONS (3.51%) | | | | | | | | |
| U.S. Treasury Notes | | | | | | | | |
| 1.375%01/31/2021 | | | 3,550,000 | | | | 3,583,004 | |
| 2.500%01/31/2021 | | | 4,300,000 | | | | 4,375,922 | |
| | | | | | | | 7,958,926 | |
| | | | | | | | | |
| TOTAL GOVERNMENT & AGENCY OBLIGATIONS | | | | | | | | |
| (Cost $7,876,922) | | | | | | $ | 7,958,926 | |
| | | Yield | | | Shares | | | Value (Note 2) | |
| SHORT TERM INVESTMENTS (2.48%) | | | | | | | | | |
| MONEY MARKET FUND (2.48%) | | | | | | | | | |
| Fidelity Investments Money Market Government Portfolio - Class I | | | 0.160 | %(b) | | | 5,623,398 | | | | 5,623,398 | |
| | | | | | | | | | | | | |
| TOTAL SHORT TERM INVESTMENTS | | | | | | | | | | | | |
| (Cost $5,623,398) | | | | | | | | | | $ | 5,623,398 | |
| | | | | | | | | | | | | |
| TOTAL INVESTMENTS (99.80%) | | | | | | | | | | | | |
| (Cost $187,698,356) | | | | | | | | | | $ | 226,128,444 | |
| | | | | | | | | | | | | |
| Other Assets In Excess Of Liabilities (0.20%) | | | | | | | | | | | 462,556 | |
| | | | | | | | | | | | | |
| NET ASSETS (100.00%) | | | | | | | | | | $ | 226,591,000 | |
| (a) | Non-Income Producing Security. |
| (b) | Represents the 7-day yield. |
For Fund compliance purposes, the Fund's industry classifications refer to any one or more of the industry sub-classifications used by one or more widely recognized market indexes or ratings group indexes, and/or as defined by Fund management. This definition may not apply for purposes of this report, which may combine industry sub-classifications for reporting ease. Industries are shown as a percent of net assets.
See Notes to Financial Statements.
| Annual Report | April 30, 2020 | 17 |
| The Disciplined Growth Investors Fund | Statement of Assets and Liabilities |
April 30, 2020
| ASSETS | | | |
| Investments, at value | | $ | 226,128,444 | |
| Receivable for shares sold | | | 2,500 | |
| Dividends and interest receivable | | | 599,937 | |
| Total assets | | | 226,730,881 | |
| | | | | |
| LIABILITIES | | | | |
| Payable for shares redeemed | | | 4,100 | |
| Payable to adviser | | | 135,781 | |
| Total liabilities | | | 139,881 | |
| NET ASSETS | | $ | 226,591,000 | |
| | | | | |
| NET ASSETS CONSIST OF | | | | |
| Paid-in capital (Note 5) | | $ | 173,759,875 | |
| Distributable Earnings | | | 52,831,125 | |
| NET ASSETS | | $ | 226,591,000 | |
| | | | | |
| INVESTMENTS, AT COST | | $ | 187,698,356 | |
| | | | | |
| PRICING OF SHARES | | | | |
| Net Asset Value, offering and redemption price per share | | $ | 19.42 | |
| Shares of beneficial interest outstanding | | | 11,668,588 | |
See Notes to Financial Statements.
| 18 | 1-855-DGI-FUND (344-3863) | www.DGIfund.com |
| The Disciplined Growth Investors Fund | Statement of Operations |
| | | For the Year Ended April 30, 2020 | |
| INVESTMENT INCOME | | | |
| Dividends | | $ | 1,627,733 | |
| Foreign taxes withheld | | | (19,487 | ) |
| Interest | | | 2,266,407 | |
| Total investment income | | | 3,874,653 | |
| | | | | |
| EXPENSES | | | | |
| Investment advisory fees (Note 6) | | | 1,838,630 | |
| Total expenses | | | 1,838,630 | |
| NET INVESTMENT INCOME | | | 2,036,023 | |
| | | | | |
| REALIZED AND UNREALIZED GAIN/LOSS ON INVESTMENTS | | | | |
| Net realized gain on investments | | | 18,009,670 | |
| Net change in unrealized depreciation on investments | | | (31,274,719 | ) |
| NET REALIZED AND UNREALIZED LOSS ON INVESTMENTS | | | (13,265,049 | ) |
| NET DECREASE IN NET ASSETS RESULTING FROM OPERATIONS | | $ | (11,229,026 | ) |
See Notes to Financial Statements.
| Annual Report | April 30, 2020 | 19 |
| The Disciplined Growth Investors Fund | Statements of Changes in Net Assets |
| | | For the Year Ended April 30, 2020 | | | For the Year Ended April 30, 2019 | |
| OPERATIONS | | | | | | |
| Net investment income | | $ | 2,036,023 | | | $ | 1,766,931 | |
| Net realized gain | | | 18,009,670 | | | | 7,977,814 | |
| Net change in unrealized appreciation/(depreciation) | | | (31,274,719 | ) | | | 21,055,807 | |
| Net increase/(decrease) in net assets resulting from operations | | | (11,229,026 | ) | | | 30,800,552 | |
| | | | | | | | | |
| DISTRIBUTIONS (Note 3) | | | | | | | | |
| Total distributions to shareholders | | | (8,714,331 | ) | | | (7,508,119 | ) |
| Net decrease in net assets from distributions | | | (8,714,331 | ) | | | (7,508,119 | ) |
| | | | | | | | | |
| CAPITAL SHARE TRANSACTIONS (Note 5) | | | | | | | | |
| Proceeds from sales of shares | | | 16,029,109 | | | | 20,768,296 | |
| Issued to shareholders in reinvestment of distributions | | | 8,634,679 | | | | 7,471,582 | |
| Cost of shares redeemed | | | (18,300,955 | ) | | | (15,429,264 | ) |
| Net increase from capital share transactions | | | 6,362,833 | | | | 12,810,614 | |
| | | | | | | | | |
| Net increase/(decrease) in net assets | | | (13,580,524 | ) | | | 36,103,047 | |
| | | | | | | | | |
| NET ASSETS | | | | | | | | |
| Beginning of period | | | 240,171,524 | | | | 204,068,477 | |
| End of period | | $ | 226,591,000 | | | $ | 240,171,524 | |
| | | | | | | | | |
| OTHER INFORMATION | | | | | | | | |
| Share Transactions | | | | | | | | |
| Issued | | | 786,466 | | | | 1,042,174 | |
| Issued to shareholders in reinvestment of distributions | | | 411,132 | | | | 410,272 | |
| Redeemed | | | (882,364 | ) | | | (770,890 | ) |
| Net increase in share transactions | | | 315,234 | | | | 681,556 | |
See Notes to Financial Statements.
| 20 | 1-855-DGI-FUND (344-3863) | www.DGIfund.com |
Page Intentionally Left Blank
| The Disciplined Growth Investors Fund |
| NET ASSET VALUE, BEGINNING OF PERIOD | |
| | |
| INCOME FROM OPERATIONS | |
| Net investment income(a) | |
| Net realized and unrealized gain/(loss) on investments | |
| Total from investment operations | |
| | |
| DISTRIBUTIONS | |
| From net investment income | |
| From net realized gain on investments | |
| Total distributions | |
| | |
| REDEMPTION FEES ADDED TO PAID-IN CAPITAL | |
| INCREASE/(DECREASE) IN NET ASSET VALUE | |
| NET ASSET VALUE, END OF PERIOD | |
| | |
| TOTAL RETURN | |
| | |
| RATIOS AND SUPPLEMENTAL DATA | |
| Net assets, end of period (000's) | |
| | |
| RATIOS TO AVERAGE NET ASSETS | |
| Expenses | |
| Net investment income | |
| | |
| PORTFOLIO TURNOVER RATE | |
| (a) | Per share numbers have been calculated using the average shares method. |
| (b) | In 2018 the Fund's total return consists of a voluntary reimbursement by the advisor for a realized investment loss. Excluding this item, total return would not have been impacted. |
See Notes to Financial Statements.
| 22 | 1-855-DGI-FUND (344-3863) | www.DGIfund.com |
For a share outstanding during the years presented
| For the Year Ended April 30, 2020 | | | For the Year Ended April 30, 2019 | | | For the Year Ended April 30, 2018 | | | For the Year Ended April 30, 2017 | | | For the Year Ended April 30, 2016 | |
| $ | 21.15 | | | $ | 19.12 | | | $ | 18.20 | | | $ | 15.96 | | | $ | 16.75 | |
| | | | | | | | | | | | | | | | | | | |
| | 0.18 | | | | 0.16 | | | | 0.12 | | | | 0.09 | | | | 0.09 | |
| | (1.14 | ) | | | 2.55 | | | | 1.64 | | | | 2.29 | | | | (0.44 | ) |
| | (0.96 | ) | | | 2.71 | | | | 1.76 | | | | 2.38 | | | | (0.35 | ) |
| | | | | | | | | | | | | | | | | | | |
| | (0.17 | ) | | | (0.12 | ) | | | (0.12 | ) | | | (0.09 | ) | | | (0.10 | ) |
| | (0.60 | ) | | | (0.56 | ) | | | (0.72 | ) | | | (0.05 | ) | | | (0.34 | ) |
| | (0.77 | ) | | | (0.68 | ) | | | (0.84 | ) | | | (0.14 | ) | | | (0.44 | ) |
| | | | | | | | | | | | | | | | | | | |
| | – | | | | – | | | | – | | | | – | | | | – | |
| | (1.73 | ) | | | 2.03 | | | | 0.92 | | | | 2.24 | | | | (0.79 | ) |
| $ | 19.42 | | | $ | 21.15 | | | $ | 19.12 | | | $ | 18.20 | | | $ | 15.96 | |
| | | | | | | | | | | | | | | | | | | |
| | (4.79 | %) | | | 14.74 | % | | | 9.75 | %(b) | | | 14.96 | % | | | (2.05 | %) |
| | | | | | | | | | | | | | | | | | | |
| $ | 226,591 | | | $ | 240,172 | | | $ | 204,068 | | | $ | 159,774 | | | $ | 119,857 | |
| | | | | | | | | | | | | | | | | | | |
| | 0.78 | % | | | 0.78 | % | | | 0.78 | % | | | 0.78 | % | | | 0.78 | % |
| | 0.86 | % | | | 0.80 | % | | | 0.64 | % | | | 0.50 | % | | | 0.59 | % |
| | | | | | | | | | | | | | | | | | | |
| | 29 | % | | | 22 | % | | | 18 | % | | | 16 | % | | | 13 | % |
| Annual Report | April 30, 2020 | 23 |
| The Disciplined Growth Investors Fund | Notes to Financial Statements |
April 30, 2020
1. ORGANIZATION
Financial Investors Trust (the “Trust”), a Delaware statutory trust, is an open-end management investment company registered under the Investment Company Act of 1940, as amended (“1940 Act”). The Trust consists of multiple separate portfolios or series. This annual report describes The Disciplined Growth Investors Fund (the “Fund”). The Fund seeks long-term capital growth and as a secondary objective, modest income with reasonable risk.
2. SIGNIFICANT ACCOUNTING POLICIES
The accompanying financial statements were prepared in accordance with accounting principles generally accepted in the United States of America (“U.S. GAAP”). The preparation of financial statements in conformity with U.S. GAAP requires management to make certain estimates and assumptions that affect the reported amounts of assets and liabilities and disclosures of contingent assets and liabilities at the date of the financial statements and the reported amounts of revenue and expenses during the period. Actual results could differ from those estimates. The Fund is considered an investment company for financial reporting purposes under U.S. GAAP and follows the accounting and reporting guidance applicable to investment companies in the Financial Accounting Standards Board Accounting Standards Codification Topic 946. The following is a summary of significant accounting policies consistently followed by the Fund in preparation of its financial statements.
Investment Valuation: The Fund generally values its securities based on market prices determined at the close of regular trading on the New York Stock Exchange (“NYSE”), normally 4:00 p.m. Eastern Time, on each day the NYSE is open for trading.
For equity securities and mutual funds that are traded on an exchange, the market price is usually the closing sale or official closing price on that exchange. In the case of equity securities not traded on an exchange, or if such closing prices are not otherwise available, the securities are valued at the mean of the most recent bid and ask prices on such day. Redeemable securities issued by open-end registered investment companies are valued at the investment company’s applicable net asset value, with the exception of exchange-traded open-end investment companies, which are priced as equity securities.
The market price for debt obligations is generally the price supplied by an independent third-party pricing service approved by the Board of Trustees of the Trust (the “Board” or the “Trustees”), which may use a matrix, formula or other objective method that takes into consideration quotations from dealers, market transactions in comparable investments, market indices and yield curves. If vendors are unable to supply a price, or if the price supplied is deemed to be unreliable, the market price may be determined using quotations received from one or more broker–dealers that make a market in the security. Fixed-income obligations, excluding municipal securities, having a remaining maturity of greater than 60 days, are typically valued at the mean between the evaluated bid and ask prices formulated by an independent pricing service. Corporate Bonds, U.S. Government & Agency, and U.S. Treasury Bonds & Notes are valued using market models that consider trade data, quotations from dealers and active market makers, relevant yield curve and spread data, creditworthiness, trade data or market information on comparable securities, and other relevant security specific information. Publicly traded Foreign Government Debt securities and Foreign Corporate Bonds are
| 24 | 1-855-DGI-FUND (344-3863) | www.DGIfund.com |
| The Disciplined Growth Investors Fund | Notes to Financial Statements |
April 30, 2020
typically traded internationally in the over-the-counter market and are valued at the mean between the bid and asked prices as of the close of business of that market. Mortgage-related and asset-backed securities are valued based on models that consider trade data, prepayment and default projections, benchmark yield and spread data and estimated cash flows of each tranche of the issuer. Publicly traded foreign government debt securities are typically traded internationally in the over-the-counter market and are valued at the mean between the bid and asked prices as of the close of business of that market.
When such prices or quotations are not available, or when Disciplined Growth Investors, Inc. (the “Adviser”) believes that they are unreliable, securities may be priced using fair value procedures approved by the Board.
Fair Value Measurements: The Fund discloses the classification of its fair value measurements following a three-tier hierarchy based on the inputs used to measure fair value. Inputs refer broadly to the assumptions that market participants would use in pricing the asset or liability, including assumptions about risk. Inputs may be observable or unobservable. Observable inputs reflect the assumptions market participants would use in pricing the asset or liability that are developed based on market data obtained from sources independent of the reporting entity. Unobservable inputs reflect the reporting entity’s own assumptions about the assumptions market participants would use in pricing the asset or liability that are developed based on the best information available.
Various inputs are used in determining the value of the Fund’s investments as of the end of the reporting period. When inputs used fall into different levels of the fair value hierarchy, the level in the hierarchy within which the fair value measurement falls is determined based on the lowest level input that is significant to the fair value measurement in its entirety. The designated input levels are not necessarily an indication of the risk or liquidity associated with these investments. These inputs are categorized in the following hierarchy under applicable financial accounting standards:
| Level 1 – | Unadjusted quoted prices in active markets for identical investments, unrestricted assets or liabilities that the Fund has the ability to access at the measurement date; |
| | |
| Level 2 – | Quoted prices which are not active, quoted prices for similar assets or liabilities in active markets or inputs other than quoted prices that are observable (either directly or indirectly) for substantially the full term of the asset or liability; and |
| | |
| Level 3 – | Significant unobservable prices or inputs (including the Fund’s own assumptions in determining the fair value of investments) where there is little or no market activity for the asset or liability at the measurement date. |
| Annual Report | April 30, 2020 | 25 |
| The Disciplined Growth Investors Fund | Notes to Financial Statements |
April 30, 2020
The following is a summary of each input used to value the Fund as of April 30, 2020:
| Investments in Securities at Value | | Level 1 - Unadjusted Quoted Prices | | | Level 2 - Other Significant Observable Inputs | | | Level 3 - Significant Unobservable Inputs | | | Total | |
| Common Stocks(a) | | $ | 157,901,851 | | | $ | – | | | $ | – | | | $ | 157,901,851 | |
| Corporate Bonds(a) | | | – | | | | 52,342,968 | | | | – | | | | 52,342,968 | |
| Foreign Corporate Bonds(a) | | | – | | | | 1,548,674 | | | | – | | | | 1,548,674 | |
| Foreign Government Bonds | | | – | | | | 752,627 | | | | – | | | | 752,627 | |
| Government & Agency Obligations | | | – | | | | 7,958,926 | | | | – | | | | 7,958,926 | |
| Short Term Investments | | | 5,623,398 | | | | – | | | | – | | | | 5,623,398 | |
| TOTAL | | $ | 163,525,249 | | | $ | 62,603,195 | | | $ | – | | | $ | 226,128,444 | |
| (a) | For detailed descriptions of the underlying industries, see the accompanying Portfolio of Investments. |
For the year ended April 30, 2020 the Fund did not have any securities that used significant unobservable inputs (Level 3) in determining fair value.
Investment Transactions and Investment Income: Investment transactions are accounted for on the date the investments are purchased or sold (trade date). Realized gains and losses from investment transactions are reported on an identified cost basis, which is the same basis the Fund uses for federal income tax purposes. Interest income, which includes accretion of discounts, is accrued and recorded as earned. Dividend income is recognized on the ex-dividend date or for certain foreign securities, as soon as information is available to the Fund.
Trust Expenses: Some expenses of the Trust can be directly attributed to the Fund. Expenses which cannot be directly attributed to the Fund are apportioned among all funds in the Trust based on average net assets of each fund.
Fund Expenses: Expenses that are specific to the Fund are charged directly to the Fund.
Federal Income Taxes: The Fund complies with the requirements under Subchapter M of the Internal Revenue Code of 1986, as amended, applicable to regulated investment companies and intends to distribute substantially all of their net taxable income and net capital gains, if any, each year so that it will not be subject to excise tax on undistributed income and gains. The Fund is not subject to income taxes to the extent such distributions are made.
As of and during the year ended April 30, 2020, the Fund did not have a liability for any unrecognized tax benefits. The Fund files U.S. federal, state, and local tax returns as required. The Fund’s tax returns are subject to examination by the relevant tax authorities until expiration of the applicable statute of limitations, which is generally three years after the filing of the tax return for federal purposes and four years for most state returns. Tax returns for open years have incorporated no uncertain tax positions that require a provision for income taxes.
| 26 | 1-855-DGI-FUND (344-3863) | www.DGIfund.com |
| The Disciplined Growth Investors Fund | Notes to Financial Statements |
April 30, 2020
Distributions to Shareholders: The Fund normally pays dividends, if any, quarterly and distributes capital gains, if any, on an annual basis. Income dividend distributions are derived from dividends and other income the Fund receives from its investments, including short term capital gains. Long term capital gain distributions are derived from gains realized when the Fund sells a security it has owned for more than a year. The Fund may make additional distributions and dividends at other times if the portfolio manager believes doing so may be necessary for the Fund to avoid or reduce taxes.
Epidemic and Pandemic Risk: Certain countries have been susceptible to epidemics, most recently COVID-19, which has been designated as a pandemic by world health authorities. The outbreak of such epidemics, together with any resulting restrictions on travel or quarantines imposed, could have a negative impact on the economy and business activity globally (including in the countries in which we invest), and thereby could adversely affect the performance of our investments. Furthermore, the rapid development of epidemics could preclude prediction as to their ultimate adverse impact on economic and market conditions, and, as a result, present material uncertainty and risk with respect to us and the performance of our investments.
3. TAX BASIS INFORMATION
Reclassifications: As of April 30, 2020, permanent differences in book and tax accounting were reclassified. These differences had no effect on net assets. The reclassifications were as follows:
| Fund | | Paid-in Capital | | | Distributable earnings | |
| The Disciplined Growth Investors Fund | | $ | – | | | $ | – | |
Tax Basis of Investments: As of April 30, 2020, the aggregate cost of investments, gross unrealized appreciation/ (depreciation) and net unrealized appreciation for Federal tax purposes was as follows:
| | | The Disciplined Growth Investors Fund | |
| Gross appreciation (excess of value over tax cost) | | $ | 56,991,128 | |
| Gross depreciation (excess of tax cost over value) | | | (18,561,040 | ) |
| Net unrealized appreciation | | $ | 38,430,088 | |
| Cost of investments for income tax purposes | | $ | 187,698,356 | |
| Annual Report | April 30, 2020 | 27 |
| The Disciplined Growth Investors Fund | Notes to Financial Statements |
April 30, 2020
Components of Earnings: As of April 30, 2020, components of distributable earnings were as follows:
| Undistributed ordinary income | | $ | 181,848 | |
| Accumulated capital gains | | | 14,226,363 | |
| Net unrealized appreciation on investments | | | 38,430,088 | |
| Other cumulative effect of timing differences | | | (7,174 | ) |
| Total | | $ | 52,831,125 | |
Tax Basis of Distributions to Shareholders: The character of distributions made during the year from net investment income or net realized gains may differ from its ultimate characterization for federal income tax purposes. Also, due to the timing of dividend distributions, the fiscal year in which amounts are distributed may differ from the fiscal year in which the income or realized gain was recorded by the Fund.
The tax character of distributions paid during the year ended April 30, 2020, were as follows:
| | | Ordinary Income | | | Long-Term Capital Gain | |
| The Disciplined Growth Investors Fund | | $ | 2,197,979 | | | $ | 6,516,352 | |
The tax character of distributions paid during the year ended April 30, 2019, were as follows:
| | | Ordinary Income | | | Long-Term Capital Gain | |
| The Disciplined Growth Investors Fund | | $ | 1,871,972 | | | $ | 5,636,147 | |
4. SECURITIES TRANSACTIONS
The cost of purchases and proceeds from sales of securities (excluding short-term securities, and U.S. Government Obligations) during the year ended April 30, 2020, were as follows:
| Fund | | Purchases of Securities | | | Proceeds From Sales of Securities | |
| The Disciplined Growth Investors Fund | | $ | 51,003,338 | | | $ | 45,058,276 | |
Investment transactions in U.S. Government Obligations during the year ended April 30, 2020 were as follows:
| Fund | | Purchases of Securities | | | Proceeds From Sales of Securities | |
| The Disciplined Growth Investors Fund | | $ | 14,523,401 | | | $ | 25,274,966 | |
| 28 | 1-855-DGI-FUND (344-3863) | www.DGIfund.com |
| The Disciplined Growth Investors Fund | Notes to Financial Statements |
April 30, 2020
5. SHARES OF BENEFICIAL INTEREST
The capitalization of the Trust consists of an unlimited number of shares of beneficial interest with no par value per share. Holders of the shares of the Fund of the Trust have one vote for each share held and a proportionate fraction of a vote for each fractional share. All shares issued and outstanding are fully paid and are transferable and redeemable at the option of the shareholder. Purchasers of the shares do not have any obligation to make payments to the Trust or its creditors (other than the purchase price for the shares or make contributions to the Trust or its creditors solely by reason of the purchasers’ ownership of the shares. Shares have no pre-emptive rights.
6. MANAGEMENT AND RELATED-PARTY TRANSACTIONS
The Adviser, subject to the authority of the Board, is responsible for the overall management and administration of the Fund’s business affairs. The Adviser manages the investments of the Fund in accordance with the Fund’s investment objective, policies and limitations and investment guidelines established jointly by the Adviser and the Trustees. Pursuant to the Advisory Agreement, the Fund pays the Adviser a unitary management fee for the services and facilities it provides payable on a monthly basis at the annual rate of 0.78% of the Fund’s average daily net assets. The management fee is paid on a monthly basis.
Out of the unitary management fee, the Adviser pays substantially all expenses of the Fund, including the cost of transfer agency, custody, fund administration, bookkeeping and pricing services, legal, audit and other services, except for interest expenses, brokerage expenses, taxes and extraordinary expenses not incurred in the ordinary course of the Fund’s business. Also included are Trustee fees which were $10,273 for the year ended April 30, 2020.
Fund Administrator Fees and Expenses
ALPS Fund Services, Inc. (“ALPS”) serves as administrator to the Fund. Pursuant to an Administration Agreement, ALPS provides operational services to the Fund including, but not limited to, fund accounting and fund administration and generally assists in the Fund’s operations. Officers of the Trust are employees of ALPS. The Fund’s administration fee is accrued on a daily basis and paid monthly. The Administrator is also reimbursed for certain out-of-pocket expenses. The administrative fee and out-of-pocket expenses are included in the unitary management fee paid to the Adviser.
Transfer Agent
ALPS serves as transfer, dividend paying and shareholder servicing agent for the Fund. ALPS receives an annual minimum fee, a fee based upon the number of shareholder accounts, and is also reimbursed for certain out-of-pocket expenses. The fee and out-of-pocket expenses are included in the unitary management fee paid to the Adviser.
Compliance Services
ALPS provides services that assist the Trust’s chief compliance officer in monitoring and testing the policies and procedures of the Trust in conjunction with requirements under Rule 38a-1 under the 1940 Act and receives an annual base fee. ALPS is reimbursed for certain out-of-pocket expenses. The fee and out-of-pocket expenses are included in the unitary management fee paid to the Adviser.
| Annual Report | April 30, 2020 | 29 |
| The Disciplined Growth Investors Fund | Notes to Financial Statements |
April 30, 2020
Principal Financial Officer
ALPS receives an annual fee for providing principal financial officer services to the Fund. The fee is included in the unitary management fee paid to the Adviser.
Distributor
ALPS Distributors, Inc. (“ADI” or the “Distributor”) (an affiliate of ALPS) acts as the distributor of the Fund’s shares pursuant to a Distribution Agreement with the Trust. Shares are sold on a continuous basis by ADI as agent for the Fund, and ADI has agreed to use its best efforts to solicit orders for the sale of the Fund’s shares, although it is not obliged to sell any particular amount of shares. ADI is not entitled to any compensation for its services as Distributor. ADI is registered as a broker-dealer with the Securities and Exchange Commission.
7. INDEMNIFICATIONS
Under the Trust’s organizational documents, its officers and Trustees are indemnified against certain liability arising out of the performance of their duties to the Trust. Additionally, in the normal course of business, the Trust enters into contracts with service providers that may contain general indemnification clauses, which may permit indemnification to the extent permissible under applicable law. The Trust’s maximum exposure under these arrangements is unknown, as this would involve future claims that may be made against the Trust that have not yet occurred.
| 30 | 1-855-DGI-FUND (344-3863) | www.DGIfund.com |
| The Disciplined Growth Investors Fund | Report of Independent Registered
Public Accounting Firm |
To the shareholders and the Board of Trustees of Financial Investors Trust
Opinion on the Financial Statements and Financial Highlights
We have audited the accompanying statement of assets and liabilities, including the portfolio of investments, of The Disciplined Growth Investors Fund (the “Fund”), one of the funds constituting the Financial Investors Trust, as of April 30, 2020, the related statement of operations for the year then ended, the statements of changes in net assets for each of the two years in the period then ended, the financial highlights for each of the five years in the period then ended, and the related notes. In our opinion, the financial statements and financial highlights present fairly, in all material respects, the financial position of The Disciplined Growth Investors Fund of Financial Investors Trust as of April 30, 2020, and the results of its operations for the year then ended, the changes in its net assets for each of the two years in the period then ended, and the financial highlights for each of the five years in the period then ended, in conformity with accounting principles generally accepted in the United States of America.
Basis for Opinion
These financial statements and financial highlights are the responsibility of the Fund’s management. Our responsibility is to express an opinion on the Fund’s financial statements and financial highlights based on our audits. We are a public accounting firm registered with the Public Company Accounting Oversight Board (United States) (PCAOB) and are required to be independent with respect to the Fund in accordance with the U.S. federal securities laws and the applicable rules and regulations of the Securities and Exchange Commission and the PCAOB.
We conducted our audits in accordance with the standards of the PCAOB. Those standards require that we plan and perform the audit to obtain reasonable assurance about whether the financial statements and financial highlights are free of material misstatement, whether due to error or fraud. The Fund is not required to have, nor were we engaged to perform, an audit of its internal control over financial reporting. As part of our audits we are required to obtain an understanding of internal control over financial reporting but not for the purpose of expressing an opinion on the effectiveness of the Fund’s internal control over financial reporting. Accordingly, we express no such opinion.
Our audits included performing procedures to assess the risks of material misstatement of the financial statements and financial highlights, whether due to error or fraud, and performing procedures that respond to those risks. Such procedures included examining, on a test basis, evidence regarding the amounts and disclosures in the financial statements and financial highlights. Our audits also included evaluating the accounting principles used and significant estimates made by management, as well as evaluating the overall presentation of the financial statements and financial highlights. Our procedures included confirmation of securities owned as of April 30, 2020, by correspondence with the custodian and brokers; when replies were not received from brokers, we performed other auditing procedures. We believe that our audits provide a reasonable basis for our opinion.
DELOITTE & TOUCHE LLP
Denver, Colorado
June 29, 2020
We have served as the auditor of one or more investment companies advised by Disciplined Growth Investors, Inc. since 2012.
| Annual Report | April 30, 2020 | 31 |
| The Disciplined Growth Investors Fund | Additional Information |
April 30, 2020 (Unaudited)
1. FUND HOLDINGS
The Fund files its complete schedule of portfolio holdings with the Commission for the first and third quarters of each fiscal year as an exhibit to its reports on Form N-PORT. The Fund’s Form N-PORT report is available on the Commission’s Web site at http://www.sec.gov. The Fund’s Form N-PORT is also available upon request by calling toll-free (855) 344-3863 or www.DGIfund.com.
2. FUND PROXY VOTING POLICIES, PROCEDURES AND SUMMARIES
The Fund’s policies and procedures used in determining how to vote proxies and information regarding how the Fund voted proxies relating to portfolio securities during the most recent prior 12-month period ending June 30 are available without charge, (1) upon request, by calling (toll-free) 855-DGI-Fund and (2) on the SEC’s website at http://www.sec.gov.
3. TAX DESIGNATIONS
The Fund designates the following for federal income tax purposes for distributions made during the calendar year ended December 31, 2019:
| Dividend Received Deduction | | | 50.72 | % |
| Qualified Dividend Income | | | 62.37 | % |
Pursuant to Section 852(b)(3) of the Internal Revenue Code, the Disciplined Growth Investors Fund designated $14,226,363 as long-term capital gain dividends.
In early 2020, if applicable, shareholders of record received this information for the distributions paid to them by the Fund during the calendar year 2019 via Form 1099. The Fund will notify shareholders in early 2021 of amounts paid to them by the Fund, if any, during the calendar year 2020.
| 32 | 1-855-DGI-FUND (344-3863) | www.DGIfund.com |
| The Disciplined Growth Investors Fund | Disclosure Regarding Approval of
Fund Advisory Agreements |
April 30, 2020 (Unaudited)
On December 10, 2019, the Trustees met in person to discuss, among other things, the renewal of the Investment Advisory Agreement between Disciplined Growth Investors, Inc. (“DGI”) and the Trust, with respect to The Disciplined Growth Investors Fund (the “DGI Fund”), in accordance with Section 15(c) of the 1940 Act. In renewing and approving the Investment Advisory Agreement with DGI, the Trustees, including the Independent Trustees, considered the following factors with respect to the DGI Fund:
Investment Advisory Fee Rate: The Trustees reviewed and considered the contractual annual advisory fee paid by the Trust, on behalf of the DGI Fund, to DGI of 0.78% of the DGI Fund’s daily average net assets, in light of the extent and quality of the advisory services provided by DGI to the DGI Fund. The Trustees noted that the advisory fee is a “unitary” fee whereby DGI pays substantially all expenses of the Fund from the advisory fee, including the cost of transfer agency, custody, fund administration, bookkeeping and pricing services, legal, audit and other services, except for interest expenses, brokerage expenses, taxes and extraordinary expenses not incurred in the ordinary course of the Fund’s business.
The Board received and considered information including a comparison of the DGI Fund’s contractual and gross advisory fees and overall expenses with those of funds in the peer group and universe of funds provided by an independent provider of investment company data (the “Data Provider”). The Trustees noted that the contractual and gross advisory fee rates for the DGI Fund were above the Data Provider peer group and universe medians.
Total Expense Ratios: The Trustees noted that the total expense ratio was attributable entirely to the unitary fee payable to DGI. The Trustees further reviewed and considered the total net expense ratio of 0.78% for the DGI Fund. The Trustees noted that the DGI Fund’s total expense ratio was below the Data Provider peer group and universe medians.
Nature, Extent, and Quality of the Services under the Investment Advisory Agreement: The Trustees received and considered information regarding the nature, extent, and quality of services to be provided to the DGI Fund under the Investment Advisory Agreement. The Trustees reviewed certain background materials supplied by DGI in its presentation, including its Form ADV.
The Trustees reviewed and considered DGI’s investment advisory personnel, its history as an asset manager, and its performance and the amount of assets currently under management by DGI. The Trustees also reviewed the research and decision-making processes utilized by DGI, including the methods adopted to seek to achieve compliance with the investment objectives, policies, and restrictions of the DGI Fund.
The Trustees considered the background and experience of DGI’s management in connection with the DGI Fund, including reviewing the qualifications, backgrounds, and responsibilities of the management team primarily responsible for the day-to-day portfolio management of the DGI Fund and the extent of the resources devoted to research and analysis of actual and potential investments.
The Trustees also reviewed, among other things, DGI’s insider trading policies and procedures and its Code of Ethics.
| Annual Report | April 30, 2020 | 33 |
| The Disciplined Growth Investors Fund | Disclosure Regarding Approval of
Fund Advisory Agreements |
April 30, 2020 (Unaudited)
Performance: The Trustees reviewed performance information for the DGI Fund for the 3-month, 1-year, 3-year, 5-year, and since inception periods ended September 30, 2019. That review included a comparison of the DGI Fund’s performance to the performance of the Data Provider universe median. The Trustees noted that the performance of the DGI Fund, as of September 30, 2019, was below its Data Provider universe median for the 3-month and 1-year periods and above its Data Provider universe median for the 3-year, 5-year, and since inception periods. The Trustees also considered DGI’s discussion of the DGI Fund’s top contributors and top detractors, as well as DGI’s performance and reputation generally.
Comparable Accounts: The Trustees noted certain information provided by DGI regarding fees charged to its other clients utilizing a strategy similar to that employed by the DGI Fund.
Profitability: The Trustees received and considered a retrospective and projected profitability analysis prepared by DGI based on the fees payable under the Investment Advisory Agreement with respect to the DGI Fund. The Trustees considered the profits, if any, anticipated to be realized by DGI in connection with the operation of the DGI Fund. The Board then reviewed DGI’s audited financial statements for the years ended December 31, 2018 and 2017, in order to analyze the financial condition and stability and profitability of DGI.
Economies of Scale: The Trustees considered whether economies of scale in the provision of services to the DGI Fund will be passed along to the shareholders under the Investment Advisory Agreement.
Other Benefits to the Adviser: The Trustees reviewed and considered any other incidental benefits derived or to be derived by DGI from its relationship with the DGI Fund, including whether soft dollar arrangements were used.
In renewing DGI as the DGI Fund’s investment adviser and renewing the Investment Advisory Agreement and the fees charged under the Investment Advisory Agreement, the Trustees concluded that no single factor reviewed by the Trustees was identified by the Trustees to be determinative as the principal factor in whether to renew the Investment Advisory Agreement. Further, the Independent Trustees were advised by separate independent legal counsel throughout the process. The Trustees, including all of the Independent Trustees, concluded that:
| • | that the advisory fee is a “unitary fee” whereby DGI pays substantially all expenses of the Fund from the advisory fee, and that the contractual and gross advisory fee rates for the DGI Fund were above the Data Provider peer group and universe medians; |
| • | the DGI Fund’s total expense ratio was attributable entirely to the unitary fee payable to DGI, and was below the Data Provider peer group and universe medians; |
| • | the nature, extent and quality of services rendered by DGI under the Investment Advisory Agreement with respect to the DGI Fund were adequate; |
| • | the performance of the DGI Fund, as of September 30, 2019, was below its Data Provider universe median for the 3-month and 1-year periods and above its Data Provider universe median for the 3-year, 5-year, and since inception periods; |
| 34 | 1-855-DGI-FUND (344-3863) | www.DGIfund.com |
| The Disciplined Growth Investors Fund | Disclosure Regarding Approval of
Fund Advisory Agreements |
April 30, 2020 (Unaudited)
| • | bearing in mind the limitations of comparing different types of managed accounts and the different levels of service typically associated with such accounts, the fee structures applicable to DGI’s other clients employing a comparable strategy to the DGI Fund was not indicative of any unreasonableness with respect to the advisory fees proposed to be payable by the Fund; |
| • | the profit, if any, realized by DGI in connection with the operation of the DGI Fund is not unreasonable; and |
| • | there were no material economies of scale or other incidental benefits accruing to DGI in connection with its relationship with the DGI Fund. |
Based on the Trustees’ deliberations and their evaluation of the information described above, the Trustees, including all of the Independent Trustees, concluded that DGI’s compensation for investment advisory services is consistent with the best interests of the DGI Fund and its shareholders.
| Annual Report | April 30, 2020 | 35 |
| The Disciplined Growth Investors Fund | Liquidity Risk Management Program |
April 30, 2020 (Unaudited)
The Financial Investors Trust (the “Trust”) has established a liquidity risk management program (the “Program”) to govern the Trust’s approach to managing liquidity risk for each fund in the Trust (each a “Fund”). The Program is overseen by the Liquidity Committee (the “Committee”), a committee comprised of representatives of the Trust’s investment advisers, sub-advisers, and Officers of the Trust. The Trust’s Board of Trustees (the “Board”) has approved the designation of the Committee to oversee the Program.
The Program’s principal objectives include supporting each Fund’s compliance with limits on investments in illiquid assets and mitigating the risk that a Fund will be unable to meet its redemption obligations in a timely manner. The Program also includes a number of elements that support the management and assessment of liquidity risk, including a periodic assessment of factors that influence a Fund’s liquidity and the periodic classification and re-classification of the Fund’s investments into groupings that reflect the Committee’s assessment of their relative liquidity under current market conditions.
At a meeting of the Board held on March 10, 2020, the Trustees received a report from the Committee regarding the design and operational effectiveness of the Program since its implementation on December 1, 2018. The Committee determined, and reported to the Board, that the Program is reasonably designed to assess and manage each Fund’s liquidity risk and has operated adequately and effectively to manage each Fund’s liquidity risk since implementation.
The Committee reported that during the period covered by the report, there were no liquidity events that impacted the Funds or their ability to timely meet redemptions without dilution to existing shareholders. Among other things, the Board noted that the Funds are not required to have a highly liquid investment minimum based on their liquidity classifications. The Board further noted that no material changes have been made to the Program since its implementation.
| 36 | 1-855-DGI-FUND (344-3863) | www.DGIfund.com |
| The Disciplined Growth Investors Fund | Trustees and Officers |
April 30, 2020 (Unaudited)
Additional information regarding the Fund’s trustees is included in the Statement of Additional Information, which can be obtained without charge by calling 855-344-3863.
INDEPENDENT TRUSTEES
| Name, Address* & Year of Birth | Position(s) Held with Fund | Term of Office** and Length of Time Served | Principal Occupation(s) During Past 5 Years*** | Number of Funds in Fund Complex Overseen by Trustee**** | Other Directorships Held by Trustee During Past 5 Years*** |
Mary K. Anstine, 1940 | Trustee and Chairman | Ms. Anstine was elected at a special meeting of shareholders held on March 21, 1997 and re-elected at a special meeting of shareholders held on August 7, 2009. Ms. Anstine was appointed Chairman of the Board at the June 6, 2017 meeting of the Board of Trustees. | Ms. Anstine was formerly an Executive Vice President of First Interstate Bank of Denver until 1994, President/Chief Executive Officer of HealthONE Alliance, Denver, Colorado, from 1994 to 2004, and has been retired since 2004. Ms. Anstine is also Trustee/Director of AV Hunter Trust and Colorado Uplift Board. Ms. Anstine was formerly a Director of the Trust Bank of Colorado (later purchased and now known as Northern Trust Bank), HealthONE and Denver Area Council of the Boy Scouts of America, and a member of the American Bankers Association Trust Executive Committee. | 31 | Ms. Anstine is a Trustee of ALPS ETF Trust (16 funds); ALPS Variable Investment Trust (7 funds); Reaves Utility Income Fund (1 fund); and Segall Bryant & Hamill Trust (16 funds). |
Jeremy W. Deems, 1976 | Trustee | Mr. Deems was appointed as a Trustee at the March 11, 2008 meeting of the Board of Trustees and elected at a special meeting of shareholders held on August 7, 2009. | Mr. Deems is the Co-Founder, Chief Operations Officer and Chief Financial Officer of Green Alpha Advisors, LLC, a registered investment advisor, and Co-Portfolio Manager of the Shelton Green Alpha Fund. Prior to joining Green Alpha Advisors, Mr. Deems was CFO and Treasurer of Forward Management, LLC, ReFlow Management Co., LLC, ReFlow Fund, LLC, a private investment fund, and Sutton Place Management, LLC, an administrative services company, from 1998 to June 2007. From 2004 to 2005, Mr. Deems also served as Treasurer of the Forward Funds and the Sierra Club Funds. | 31 | Mr. Deems is a Trustee of ALPS ETF Trust (16 funds); ALPS Variable Investment Trust (7 funds); Clough Funds Trust (1 fund); and Reaves Utility Income Fund (1 fund). |
| Annual Report | April 30, 2020 | 37 |
| The Disciplined Growth Investors Fund | Trustees and Officers |
April 30, 2020 (Unaudited)
INDEPENDENT TRUSTEES (continued)
| Name, Address* & Year of Birth | Position(s) Held with Fund | Term of Office** and Length of Time Served | Principal Occupation(s) During Past 5 Years*** | Number of Funds in Fund Complex Overseen by Trustee**** | Other Directorships Held by Trustee During Past 5 Years*** |
Jerry G. Rutledge, 1944 | Trustee | Mr. Rutledge was elected at a special meeting of shareholders held on August 7, 2009. | Mr. Rutledge is the President and owner of Rutledge’s Inc., a retail clothing business. Mr. Rutledge is currently Director of the American National Bank. He was from 1994 to 2007 a Regent of the University of Colorado. | 31 | Mr. Rutledge is a Trustee of Clough Global Dividend and Income Fund (1 fund); Clough Global Equity Fund (1 fund); Clough Global Opportunities Fund (1 fund); and Principal Real Estate Income Fund (1 fund). |
Michael “Ross” Shell, 1970 | Trustee | Mr. Shell was elected at a special meeting of shareholders held on August 7, 2009. | Mr. Shell is Founder and CEO of Red Idea, LLC, a strategic consulting/early stage venture firm (since June 2008). From 1999 to 2009, he was a part-owner and Director of Tesser, Inc., a brand agency. From December 2005 to May 2008, he was Director, Marketing and Investor Relations, of Woodbourne, a REIT/real estate hedge fund and private equity firm. Prior to this, from May 2004 to November 2005, he worked as a business strategy consultant; from June 2003 to April 2004, he was on the Global Client Services team of IDEO, a product design/innovation firm; and from 1999 to 2003, he was President of Tesser, Inc. Mr. Shell graduated with honors from Stanford University with a degree in Political Science. | 31 | None. |
| 38 | 1-855-DGI-FUND (344-3863) | www.DGIfund.com |
| The Disciplined Growth Investors Fund | Trustees and Officers |
April 30, 2020 (Unaudited)
INTERESTED TRUSTEE
| Name, Address* & Year of Birth | Position(s) Held with Fund | Term of Office** and Length of Time Served | Principal Occupation(s) During Past 5 Years*** | Number of Funds in Fund Complex Overseen by Trustee**** | Other Directorships Held by Trustee During Past 5 Years*** |
Edmund J. Burke, 1961 | Trustee | Mr. Burke was elected as Trustee at a special meeting of shareholders held on August 7, 2009. | Mr. Burke joined ALPS in 1991 and served as the President and Director of ALPS Holdings, Inc., and ALPS Advisors, Inc., and Director of ALPS Distributors, Inc., ALPS Fund Services, Inc. (“ALPS”), and ALPS Portfolio Solutions Distributor, Inc. (collectively, the “ALPS Companies”). Mr. Burke retired from the ALPS Companies in June 2019. Mr. Burke is deemed an interested Trustee by virtue of his prior positions with the ALPS Companies. | 31 | Mr. Burke is a Trustee of ALPS ETF Trust (16 funds); Clough Global Dividend and Income Fund (1 fund); Clough Global Equity Fund (1 fund); Clough Global Opportunities Fund (1 fund); Clough Funds Trust (1 fund); Liberty All-Star Equity Fund (1 fund); and Director of the Liberty All-Star Growth Fund, Inc. (1 fund). |
| Annual Report | April 30, 2020 | 39 |
| The Disciplined Growth Investors Fund | Trustees and Officers |
April 30, 2020 (Unaudited)
OFFICERS
| Name, Address* & Year of Birth | Position(s) Held with Fund | Term of Office** and Length of Time Served | Principal Occupation(s) During Past 5 Years*** |
| Bradley J. Swenson, 1972 | President | Mr. Swenson was elected President of the Trust at the June 11 – 12, 2019 meeting of the Board of Trustees. | Mr. Swenson joined ALPS in 2004 and has served as its President since June 2019. In this role, he serves as an officer to certain other closed-end and open-end investment companies. He previously served as the Chief Operating Officer of ALPS (2015-2019). Mr. Swenson also previously served as Chief Compliance Officer to ALPS, its affiliated entities, and to certain ETF, closed-end and open-end investment companies (2004-2015). Because of his position with ALPS, Mr. Swenson is deemed an affiliate of the Trust as defined under the 1940 Act. |
| Kimberly R. Storms, 1972 | Treasurer | Ms. Storms was elected Treasurer of the Trust at the March 12, 2013 meeting of the Board of Trustees. | Ms. Storms is Senior Vice President - Director of Fund Administration of ALPS. Because of her position with ALPS, Ms. Storms is deemed an affiliate of the Trust as defined under the 1940 Act. Ms. Storms is also Treasurer of ALPS Series Trust. Ms. Storms also serves as a Board member and Treasurer of The Center for Trauma & Resilience, a nonprofit agency. |
Karen S. Gilomen, 1970 | Secretary | Ms. Gilomen was elected Secretary of the Trust at the December 13, 2016 meeting of the Board of Trustees. | Ms. Gilomen joined ALPS in August 2016 as Vice President and Senior Counsel. Prior to joining ALPS, Ms. Gilomen was Vice President - General Counsel & CCO of Monticello Associates, Inc. from 2010 to 2016. Because of her position with ALPS, Ms. Gilomen is deemed an affiliate of the Trust, as defined under the 1940 Act. Ms. Gilomen is also the Secretary of ALPS Variable Investment Trust and Reaves Utility Income Fund, and the Assistant Secretary of the WesMark Funds. |
Ted Uhl, 1974 | Chief Compliance Officer (“CCO”) | Mr. Uhl was appointed CCO of the Trust at the June 8, 2010 meeting of the Board of Trustees. | Mr. Uhl joined ALPS in October 2006, and is currently Deputy Compliance Officer of ALPS. Prior to his current role, Mr. Uhl served as Senior Risk Manager for ALPS from October 2006 until June 2010. Before joining ALPS, Mr. Uhl served a Sr. Analyst with Enenbach and Associates (RIA), and a Sr. Financial Analyst at Sprint. Because of his position with ALPS, Mr. Uhl is deemed an affiliate of the Trust as defined under the 1940 Act. Mr. Uhl is also CCO of the Boulder Growth & Income Fund, Inc., Centre Funds, Index Funds, Reality Shares ETF Trust, Reaves Utility Income Fund and XAI Octagon Floating Rate & Alternative Income Term Trust. |
Jennell Panella, 1974 | Assistant Treasurer | Ms. Panella was elected Assistant Treasurer of the Trust at the September 15, 2015 meeting of the Board of Trustees. | Ms. Panella joined ALPS in June 2012 and is currently Fund Controller of ALPS Fund Services, Inc. Prior to joining ALPS, Ms. Panella served as Financial Reporting Manager for Parker Global Strategies, LLC (2009-2012). Because of her position with ALPS, Ms. Panella is deemed an affiliate of the Trust as defined under the 1940 Act. Ms. Panella also serves as Assistant Treasurer of James Advantage Funds. |
| 40 | 1-855-DGI-FUND (344-3863) | www.DGIfund.com |
| The Disciplined Growth Investors Fund | Trustees and Officers |
April 30, 2020 (Unaudited)
OFFICERS (continued)
| Name, Address* & Year of Birth | Position(s) Held with Fund | Term of Office** and Length of Time Served | Principal Occupation(s) During Past 5 Years*** |
Sharon Akselrod, 1974 | Assistant Secretary | Ms. Akselrod was elected Assistant Secretary of the Trust at the September 15, 2015 meeting of the Board of Trustees. | Ms. Akselrod joined ALPS in August 2014 and is currently Senior Investment Company Act Paralegal of ALPS Fund Services, Inc. Prior to joining ALPS, Ms. Akselrod served as Corporate Governance and Regulatory Associate for Nordstrom fsb (2013-2014) and Senior Legal Assistant – Legal Manager for AXA Equitable Life Insurance Company (2008-2013). Because of her position with ALPS, Ms. Akselrod is deemed an affiliate of the Trust as defined under the 1940 Act. Ms. Akselrod is also Secretary of Principal Real Estate Income Fund and Assistant Secretary of ALPS ETF Trust and Clough Funds Trust. |
Jennifer Craig, 1973 | Assistant Secretary | Ms. Craig was elected Assistant Secretary of the Trust at the June 8, 2016 meeting of the Board of Trustees. | Ms. Craig joined ALPS in 2007 and is currently Assistant Vice President and Paralegal Manager of ALPS. Because of her position with ALPS, Ms. Craig is deemed an affiliate of the Trust as defined under the 1940 Act. Ms. Craig is also Assistant Secretary of Clough Global Dividend and Income Fund, Clough Global Equity Fund, Clough Global Opportunities Fund, Principal Real Estate Income Fund, Liberty All-Star Equity Fund and Liberty All-Star Growth Fund, Inc. |
Sareena Khwaja-Dixon, 1980 | Assistant Secretary | Ms. Khwaja-Dixon was elected Assistant Secretary of the Trust at the December 12, 2017 meeting of the Board of Trustees. | Ms. Khwaja-Dixon joined ALPS in August 2015 and is currently Senior Counsel and Vice President of ALPS Fund Services, Inc. Prior to joining ALPS, Ms. Khwaja-Dixon served as a Senior Paralegal/Paralegal for Russell Investments(2011 – 2015). Because of her position with ALPS, Ms. Khwaja-Dixon is deemed an affiliate of the Trust as defined under the 1940 Act. Ms. Khwaja-Dixon is also Secretary of Liberty All -Star Equity Fund, Liberty All-Star Growth Fund, Inc., Clough Funds Trust, Clough Global Dividend and Income Fund, Clough Global Opportunities Fund, and Clough Global Equity Fund. |
| * | All communications to Trustees and Officers may be directed to Financial Investors Trust c/o 1290 Broadway, Suite 1000, Denver, CO 80203. |
| ** | This is the period for which the Trustee or Officer began serving the Trust. Each Trustee serves an indefinite term, until such Trustees successor is elected and appointed, or such Trustee resigns or is deceased. Officers are elected on an annual basis. |
| *** | Except as otherwise indicated, each individual has held the office shown or other offices in the same company for the last five years. |
| **** | The Fund Complex includes all series of the Trust, currently 31, and any other investment companies for which any Trustee serves as trustee for and for which Disciplined Growth Investors, Inc. provides investment advisory services (currently none). |
| Annual Report | April 30, 2020 | 41 |
| The Disciplined Growth Investors Fund | Privacy Policy |
| WHO WE ARE | |
| Who is providing this notice? | The Disciplined Growth Investors Fund |
| WHAT WE DO | |
| How does the Fund protect my personal information? | To protect your personal information from unauthorized access and use, we use security measures that comply with federal law. These measures include computer safeguards and secured files and buildings. |
How does the Fund collect my personal information? | We collect your personal information, for example, when you • open an account • provide account information or give us your contact information • make a wire transfer or deposit money |
Why can’t I limit all sharing? | Federal law gives you the right to limit only • sharing for affiliates’ everyday business purposes-information about your creditworthiness • affiliates from using your information to market to you • sharing for non-affiliates to market to you State laws and individual companies may give you additional rights to limit sharing. |
| DEFINITIONS | |
| Affiliates | Companies related by common ownership or control. They can be financial and nonfinancial companies. |
Non-affiliates | Companies not related by common ownership or control. They can be financial and nonfinancial companies. • The Fund does not share with non-affiliates so they can market to you. |
| Joint marketing | A formal agreement between non-affiliated financial companies that together market financial products or services to you. • The Fund does not jointly market. |
| 42 | 1-855-DGI-FUND (344-3863) | www.DGIfund.com |
| The Disciplined Growth Investors Fund | Privacy Policy |
| FACTS | WHAT DOES THE FUND DO WITH YOUR PERSONAL INFORMATION? |
| WHY? | Financial companies choose how they share your personal information. Federal law gives consumers the right to limit some but not all sharing. Federal law also requires us to tell you how we collect, share, and protect your personal information. Please read this notice carefully to understand what we do. |
| WHAT? | The types of personal information we collect and share depend on the product or service you have with us. This information can include: |
| | • Social Security number and account transactions • Account balances and transaction history • Wire transfer instructions |
| HOW? | All financial companies need to share customers’ personal information to run their everyday business. In the section below, we list the reasons financial companies can share their customers’ personal information; the reasons the Fund chooses to share; and whether you can limit this sharing. |
| REASONS WE CAN SHARE YOUR PERSONAL INFORMATION | DOES THE FUND SHARE: | CAN YOU LIMIT THIS SHARING? |
For our everyday business purposes –
such as to process your transactions, maintain your account(s), respond to court orders and legal investigations, or report to credit bureaus | Yes | No |
For our marketing purposes –
to offer our products and services to you | No | We do not share. |
| For joint marketing with other financial companies | No | We do not share. |
For our affiliates’ everyday business purposes –
information about your transactions and experiences | Yes | No |
For our affiliates’ everyday business purposes –
information about your creditworthiness | No | We do not share. |
| For non-affiliates to market to you | No | We do not share. |
| Annual Report | April 30, 2020 | 43 |
| The Disciplined Growth Investors Fund | Privacy Policy |
| OTHER IMPORTANT INFORMATION |
| California Residents | If your account has a California home address, your personal information will not be disclosed to nonaffiliated third parties except as permitted by applicable California law, and we will limit sharing such personal information with our affiliates to comply with California privacy laws that apply to us. |
| Vermont Residents | The State of Vermont requires financial institutions to obtain your consent prior to sharing personal information that they collect about you with affiliated companies and nonaffiliated third parties other than in certain limited circumstances. Except as permitted by law, we will not share personal information we collect about you with nonaffiliated third parties or other affiliated companies unless you provide us with your written consent to share such information. |
| 44 | 1-855-DGI-FUND (344-3863) | www.DGIfund.com |

THIS MATERIAL MUST BE PRECEDED OR ACCOMPANIED BY A PROSPECTUS.
THE DISCIPLINED GROWTH INVESTORS FUND IS DISTRIBUTED BY ALPS DISTRIBUTORS, INC.

TABLE OF CONTENTS
| Manager Commentary | |
| Emerald Growth Fund | 1 |
| Emerald Small Cap Value Fund | 6 |
| Emerald Insights Fund | 12 |
| Emerald Banking and Finance Fund | 16 |
| Emerald Select trueLiberty Income Fund | 23 |
| Disclosure of Fund Expenses | 28 |
| Schedule of Investments | |
| Emerald Growth Fund | 30 |
| Emerald Small Cap Value Fund | 32 |
| Emerald Insights Fund | 34 |
| Emerald Banking and Finance Fund | 36 |
| Emerald Select trueLiberty Income Fund | 38 |
| Statements of Assets and Liabilities | 40 |
| Statements of Operations | 42 |
| Statements of Changes in Net Assets | |
| Emerald Growth Fund | 44 |
| Emerald Small Cap Value Fund | 46 |
| Emerald Insights Fund | 48 |
| Emerald Banking and Finance Fund | 50 |
| Emerald Select trueLiberty Income Fund | 52 |
| Financial Highlights | |
| Emerald Growth Fund | 53 |
| Emerald Small Cap Value Fund | 57 |
| Emerald Insights Fund | 61 |
| Emerald Banking and Finance Fund | 65 |
| Emerald Select trueLiberty Income Fund | 69 |
| Notes to Financial Statements | 71 |
| Report of Independent Registered Public Accounting Firm | 82 |
| Additional Information | 83 |
| Disclosure Regarding Approval of Fund Advisory Agreement | 84 |
| Liquidity Risk Management Program | 86 |
| Trustees and Officers | 87 |
| Privacy Policy | 92 |
| Emerald Growth Fund | Manager Commentary |
April 30, 2020 (Unaudited)
April 30, 2020
Dear Shareholder:
Investment Results
The performance of the Emerald Growth Fund Class A shares (without sales load), for the twelve months ended April 30, 2020, declined by -10.00% trailing behind the Russell 2000® Growth Index which declined by -9.22%.
Performance data quoted represents past performance. Past performance does not guarantee future results.
The broad market indices entered 2020 with strong momentum after a robust finish to calendar 2019. The trajectory of market performance was, however, dramatically altered by the aggressive global spread of the COVID-19 virus during the month of March. Specifically the “return to growth” narrative that had been propelling the market through the end of calendar 2019 and the early part of the first quarter of 2020 was turned upside down as public health took precedence over economic growth, virus containment became a top priority and shelter in place and social distancing guidelines were rolled out across the U.S. and abroad. Volatility surged as the market began rapidly repricing both equities and credit to reflect the economic reality of the global demand shock. Virus fears were compounded by OPEC’s reluctance to cut supply in the face of a deteriorating global economic backdrop which triggered a significant weakening in the price of oil (Brent crude fell by -64% in the first quarter). The collapse in crude prices added fuel to the liquidity concerns already building within the credit markets in the face of a dramatically deteriorating economic backdrop. Aggressive actions from the Federal Reserve to add the necessary liquidity to keep the funding markets functioning appropriately, and meaningful fiscal policy response helped reduce the market’s perception of the tail risk from the crisis, alleviating the near-term pressure and allowing the market to rebound from the March panic lows. The market subsequently rebounded aggressively during the month of April to close out the Fund’s fiscal year, despite reported economic data has been abysmal in absolute terms both domestically and abroad, as the worst case scenario for the virus and the credit crisis were taken off the table with optimism from the positive trial update on Gilead’s COVID-19 therapeutic and plans to open several states adding further to momentum.
The market backdrop outlined above proved to be particularly challenging for small capitalization stocks which have lagged meaningfully on both a trailing twelve month and year-to-date basis. For the trailing 12-month period, small capitalization stocks as measured by the Russell 2000® Index, declined by -16.39% meaningfully trailing their large capitalization stocks as measured by the Russell 1000® Index which posted a modest gain of +0.09%. The relative underperformance of small capitalization stocks has been particularly acute for the year-to-date year ended April 30, 2020 with the Russell 2000® declining by -21.08% as compared to the Russell 1000® declining by -9.68% for the same period.
Notably, growth as an investment style has demonstrated impressive relative performance, outperforming across the market capitalization spectrum over both the trailing twelve months and calendar year-to-date periods through April 30, 2020. Within the small capitalization universe, as measured by the Russell 2000® Index, the Russell 2000® Growth Index declined by -9.22% and -14.71% for the trailing twelve month and year-to-date periods, outpacing the Russell 2000® Value Index which declined by -23.84% and -27.72% respectively, for the same periods.
Investment Analysis
On a relative basis the portfolio lagged the Russell 2000®Growth benchmark for the trailing period driven as the positive contribution from stock selection was offset by both allocation and interaction effect. At the sector level, the portfolio experienced relative outperformance within the healthcare, consumer staples and materials sectors. The positive contribution from the aforementioned was offset by relative underperformance within the consumer discretionary, technology, financial services, and producer durables sectors.
The consumer discretionary sector was the largest detractor to return for the trailing period driven by a combination of stock selection and allocation effect. At the industry level, performance within the specialty retail, leisure time, and home building industries were the most challenged from a performance perspective. Emerald has opted to reduce exposure to the consumer discretionary sector in the near-term to reflect significantly diminished earnings as a result of the evolving COVID-19 situation, the lack of visibility to the path of the recovery in consumer spending, as well as to account for what we believe will likely be a reprioritizing of spending as we emerge from the downturn.
Performance within the technology sector was also a meaningful detractor to return as a result of stock selection related weakness in the software, electronic entertainment and telecommunications equipment industries. Holdings within the financial services and producer durables sectors also detracted from return driven by largely by stock selection.
Partially offsetting the aforementioned weakness, was relative outperformance within healthcare, consumer staples and materials sectors. The healthcare sector was the largest positive contributor to return for trailing period driven by stock selection within the pharmaceutical, health care services, biotechnology and medical services industries. Holdings within the consumer staples and materials sectors also contributed positively to performance due largely to the positive contribution from stock selection within the foods and building materials industries.
As of April 30, 2020, the portfolio held the largest active exposures in the consumer staples and technology sectors. Our thoughts on those sectors and other notable areas of exposure as of that date are highlighted below.
| • | The portfolio exited the fiscal year with an overweight position to the consumer staples sector. The overweight consists of select niche opportunities in disruptive category leaders with innovative product offerings and above average growth prospects that are aligned with |
| Annual Report | April 30, 2020 | 1 |
| Emerald Growth Fund | Manager Commentary |
April 30, 2020 (Unaudited)
emerging consumer trends in the food and beverage industries. Specific areas include pet food, nutritional snacking, active nutrition products, and adult beverages. While our portfolio holdings have benefitted from the pantry-loading phase in the early days of the COVID-19 crisis, we believe that the longer term opportunity will be realized through continued category growth and market share gains, along with expanding profit margins.
| • | The technology sector remained an overweight position. Within the sector, the computer software and services industry remained the portfolio’s largest total and active exposure. While secular growth tailwinds like digital transformation continued to be a top of mind priority for most large enterprise customers, we believe that the magnitude of this shift may slow in the near-term as companies are forced to deal with more tactical issues such as workforce relocation, supply chain issues and tightening technology budgets in response to the COVID-19 induced macroeconomic slowdown. As such, prior to April 30, 2020, Emerald reduced its exposure to companies that are more discretionary-centric and increased our exposure in areas such as cybersecurity where spending has the potential to be more resilient. Outside of software, we also continued to be optimistic regarding select opportunities within network infrastructure spending, as demand for bandwidth continued to drive network upgrades, and at that point, multiple segments (datacenter, telecom, and cable companies) were in the early stages of network expansion/evolution. Secular trends such as 5G and industrial IoT (internet of things) continue to build momentum and are expected to see meaningful growth throughout the next several years, with early deployments happening now. We expect further defense spending is expected to continue to grow, with bi-partisan support of an expanded budget to address current threats from peer and near-peer adversaries such as Russia and China and other areas of potential tension including Iran and North Korea. |
| • | The healthcare sector, while underweight relative to the benchmark, also remained an area of meaningful exposure within the portfolio. At the industry level, the biotechnology industry remained the largest aggregate. We continued to look for innovative therapeutics that can command premium pricing. Rounding out the portfolio’s healthcare sector exposure at that time were niche opportunities within the healthcare services, medical equipment, medical & dental instruments and pharmaceutical industries. Political headwinds appeared to have diminished somewhat in the near-term as a result of Joe Biden securing the democratic nomination and the goodwill we believe is being amassed by the healthcare industry in its very public efforts to mitigate the impact from COVID-19. |
Market Outlook:
As we reflect on the unprecedented events of the last few months and hypothesize as to what the future may hold, we are encouraged by the medical progress that is being made in our global war against COVID-19 and heartened by the ingenuity of American business and the tremendous adaptability and resiliency of the American people. That being said, we believe the path to economic recovery is unlikely to be linear given the complexion of the challenges (virus, government regulation, state reopening processes, etc.) facing the U.S. economy. In that regard, Emerald believes that market direction in the near-term will continue to be guided by incoming information on the pattern and rate of COVID-19 infections, the pace of medical progress in dealing with COVID-19 (treatment, vaccine, testing, etc.) and the implications of these factors on the pace at which business activity resumes, the unemployed and furloughed return to work, consumption rebounds and economic and corporate earnings growth recovers.
Here at Emerald we instituted Pandemic Policy protocols on February 27, 2020 (copy available upon request). There is no current impact to the delivery of our investment advisory services to our clients, nor to our ability to manage and support these activities. We have validated full capacity for our staff to work remotely. Key senior staff have conducted comprehensive reviews of the status of the Company’s portfolio management, operations, compliance and client services functions on March 25th, April 3rd and April 22nd to review any potential issues and confirmed the uninterrupted delivery of all functions and services. We are confident of our ongoing ability to function at these high levels of service in the coming months. Most importantly, all of us at Emerald extend our heartfelt thanks to all of our nation’s first responders, healthcare professionals and front-line essential workers, and express our care and concern to everyone effected by both the health- and economic-related devastation of COVID-19.
While near-term visibility continues to remain limited, market dislocations create opportunities and Emerald, as always, remains focused on utilizing our fundamental bottom-up research process to identify the most attractive growth opportunities within the small capitalization universe.
| Top Contributors | Top Detractors | |
| Reata Pharmaceuticals Inc. | Children’s Place Inc. | |
| Freshpet Inc. | Chart Industries Inc. | |
| Teladoc Health Inc. | Insperity Inc. | |
| Applied Therapeutics Inc. | LendingTree Inc. | |
| Karyopharm Therapeutics Inc. | Five Below Inc. | |
| | | |
| Kenneth G. Mertz II, CFA | Stacey L. Sears | Joseph W. Garner |
| Chief Investment Officer | Portfolio Manager | Portfolio Manager |
| Portfolio Manager | | |
| | | |
| Emerald Mutual Fund Advisers Trust | | |
| 2 | www.emeraldmutualfunds.com |
| Emerald Growth Fund | Manager Commentary |
April 30, 2020 (Unaudited)
Past performance does not guarantee future results. Fund prices fluctuate as the underlying assets have exposure to market fluctuations and other risks, as described in the Fund’s prospectus. Please visit www.emeraldmutualfunds.com to obtain current performance information and for the current prospectus and statement of additional information. This material must be preceded or accompanied by a prospectus. Please read the prospectus carefully before investing.
The views of Emerald Mutual Fund Advisers Trust and information discussed in this commentary are as of the date of publication, are subject to change, and may not reflect the writer's current views. The views expressed are those of the author only, and represent an assessment of market conditions at a specific point in time, are opinions only and should not be relied upon as investment advice regarding a particular investment or markets in general. Such information does not constitute a recommendation to buy or sell specific securities or investment vehicles. It should not be assumed that any investment will be profitable or will equal the performance of the Fund or any securities or any sectors mentioned in this letter. The subject matter contained in this letter has been derived from several sources believed to be reliable and accurate at the time of compilation. Neither Emerald Mutual Fund Advisers Trust nor the Fund accepts any liability for losses either direct or consequential caused by the use of this information.
The Emerald Growth Fund is distributed by ALPS Distributors, Inc.
The Fund is subject to investment risks, including possible loss of the principal amount invested and therefore is not suitable for all investors. The Fund may not achieve its objectives.
Diversification does not eliminate the risk of experiencing investment losses.
The Russell 2000® Growth Index measures the performance of the small-cap growth segment of the U.S. equity universe. It includes those Russell 2000® Index companies with higher price-to-value ratios and higher forecasted growth values. The Index is not actively managed and does not reflect any deductions for fees, expenses or taxes. An investor may not invest directly into the Index.
The Russell 2000® Value Index measures the performance of small-cap value segment of the U.S. equity universe. It includes those Russell 2000 companies with lower price-to-book ratios (A ratio used to compare a stock's market value to its book value. It is calculated by dividing the current closing price of the stock by the latest quarter's book value per share.) and lower forecasted growth values. The Index is not actively managed and does not reflect any deductions for fees, expenses or taxes. An investor may not invest directly into the Index.
Basis points refers to a common unit of measure for interest rates and other percentages in finance. One basis point is equal to 1/100th of 1%, or 0.01%, or 0.0001, and is used to denote the percentage change in a financial instrument. The relationship between percentage changes and basis points can be summarized as follows: 1% change = 100 basis points and 0.01% = 1 basis point.
The S&P 500® Total Return Index is an unmanaged index of 500 common stocks chosen for market size, liquidity and industry group representation. It is a market-value weighted index. The Index is not actively managed and does not reflect any deductions for fees, expenses or taxes. An investor may not invest directly in the Index.
| Annual Report | April 30, 2020 | 3 |
| Emerald Growth Fund | Manager Commentary |
April 30, 2020 (Unaudited)
TOP TEN HOLDINGS (as a % of Net Assets)* | | | | |
| | | | | |
| Chegg, Inc. | | | 3.18 | % |
| Freshpet, Inc. | | | 2.98 | % |
| Horizon Therapeutics PLC | | | 2.38 | % |
| Trex Co., Inc. | | | 2.16 | % |
| NeoGenomics, Inc. | | | 1.99 | % |
| Mercury Systems, Inc. | | | 1.99 | % |
| Rapid7, Inc. | | | 1.74 | % |
| Cogent Communications Holdings, Inc. | | | 1.73 | % |
| Simply Good Foods Co. | | | 1.71 | % |
| Kratos Defense & Security Solutions, Inc. | | | 1.68 | % |
| Top Ten Holdings | | | 21.54 | % |
INDUSTRY SECTOR ALLOCATION (as a % of Net Assets) | | | |
| | | | |
| Health Care | | | 31.42 | % |
| Technology | | | 20.89 | % |
| Consumer Discretionary | | | 11.82 | % |
| Financial Services | | | 10.56 | % |
| Producer Durables | | | 9.24 | % |
| Consumer Staples | | | 7.45 | % |
| Utilities | | | 3.12 | % |
| Materials & Processing | | | 2.80 | % |
| Energy | | | 0.84 | % |
| Cash, Cash Equivalents, & Other Net Assets | | | 1.86 | % |
| Total | | | 100.00 | % |
| * | Holdings are subject to change, and may not reflect the current or future position of the portfolio. |
ANNUALIZED TOTAL RETURN (for the period ended April 30, 2020)
| | | | | | | Since | Expense Ratio |
| | 6 Month | 1 Year | 3 Year | 5 Year | 10 Year | Inception(1) | Gross(2) | Net(2) |
| Class A (NAV) | -6.03% | -10.00% | 6.20% | 6.01% | 11.60% | 10.55% | 1.01% | 1.01% |
| Class A (MOP) | -10.48% | -14.29% | 4.49% | 4.98% | 11.05% | 10.35% | 1.01% | 1.01% |
| Russell 2000® Growth Index(3) | -7.62% | -9.22% | 4.21% | 5.19% | 9.96% | 7.73% | | |
| Class C (NAV) | -6.27% | -10.57% | 5.53% | 5.34% | 10.88% | 5.72% | 1.66% | 1.66% |
| Class C (CDSC) | -7.19% | -11.44% | 5.53% | 5.34% | 10.88% | 5.72% | 1.66% | 1.66% |
| Russell 2000® Growth Index(3) | -7.62% | -9.22% | 4.21% | 5.19% | 9.96% | 7.73% | | |
| Investor Class | -6.02% | -10.05% | 6.17% | 5.97% | – | 9.35% | 1.06% | 1.06% |
| Russell 2000® Growth Index(3) | -7.62% | -9.22% | 4.21% | 5.19% | 9.96% | 7.73% | | |
| Institutional Class | -5.87% | -9.72% | 6.54% | 6.35% | 11.94% | 12.97% | 0.71% | 0.71% |
| Russell 2000® Growth Index(3) | -7.62% | -9.22% | 4.21% | 5.19% | 9.96% | 7.73% | | |
Performance quoted represents past performance, does not guarantee future results and current performance may be lower or higher than the data quoted. The investment return and principal value of an investment will fluctuate so that shares, when redeemed, may be worth more or less than their original cost. Performance data current to the most recent month end may be obtained at www.emeraldmutualfunds.com.
Performance shown for periods prior to March 16, 2012, reflects the performance of the Forward Growth Fund, a series of Forward Funds (as a result of a reorganization of the Forward Growth Fund into the Emerald Growth Fund).
Returns for periods less than 1 year are cumulative.
The table does not reflect the deduction of taxes that a shareholder would pay on Fund distributions or the redemption of Fund shares.
Subject to investment risks, including possible loss of the principal amount invested.
Maximum Offering Price (MOP) for Class A shares includes the Fund's maximum sales charge of 4.75%. Performance shown at NAV does not include these sales charges and would have been lower had it been taken into account.
A Contingent Deferred Sales Charge (CDSC) of 1.00% may apply to Class C shares redeemed within the first 12 months after a purchase.
| (1) | Inception Dates - Class A: 10/01/1992, Class C: 07/01/2000, Institutional Class: 10/21/2008, Investor Class: 05/01/2011 |
| (2) | Emerald Mutual Fund Advisers Trust ("Emerald" or the "Adviser") has agreed contractually to waive a portion of its fees and reimburse other expenses until August 31, 2020 in amounts necessary to limit the Fund's operating expenses (exclusive of Acquired Fund Fees and Expenses, brokerage expenses, interest expenses, taxes and extraordinary expense) for Class A, Class C, Institutional Class, and Investor Class shares to an annual rate (as percentage of the Fund's average daily net assets) of 1.29%, 1.94%, 0.99% and 1.34% respectively. The Adviser will be permitted to recover, on a class-by-class basis, expenses it has borne through the agreement described above to the extent that the Fund's expenses in later periods fall below the annual rates set forth in the relevant agreement. The Fund will not be obligated to pay any such deferred fees and expenses more than three years after the year(s) in which the fees and expense were incurred. The Adviser may not discontinue this waiver prior to August 31, 2020, without the approval by the Fund's Board of Trustees. Ratios as of the Prospectus dated August 31, 2019 and may differ from the ratios presented in the Financial Highlights. |
| (3) | The Russell 2000® Growth Index measures the performance of the small-cap growth segment of the U.S. equity universe. It includes those Russell 2000® Index companies with higher price-to-value ratios and higher forecasted growth values. The Index is not actively managed and does not reflect any deduction for fees, expenses or taxes. An investor may not invest directly into the Index. |
| 4 | www.emeraldmutualfunds.com |
| Emerald Growth Fund | Manager Commentary |
April 30, 2020 (Unaudited)
GROWTH OF $10,000 INVESTMENT IN THE FUND (for the period ended April 30, 2020)
Comparison of change in value of a $10,000 investment (includes applicable sales loads)
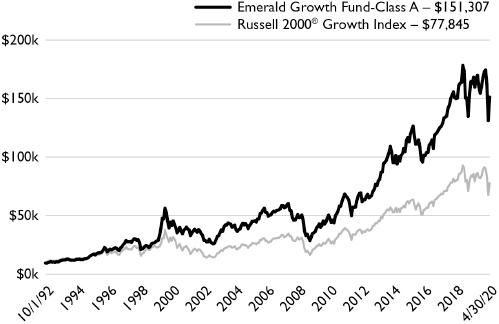
The chart represents historical performance of a hypothetical investment of $10,000 in the Fund since inception. Past performance does not guarantee future results. This chart does not reflect the deduction of taxes that a shareholder would pay on Fund distributions or the redemption of Fund shares.
Investing in the Fund is subject to investment risks, including possible loss of the principal amount invested.
| Annual Report | April 30, 2020 | 5 |
| Emerald Small Cap Value Fund | Manager Commentary |
April 30, 2020 (Unaudited)
April 30, 2020
Dear Shareholder:
Investment Results
As you read this note, we acknowledge the physical and financial pain that many Americans and people around the world are experiencing during this crisis. We truly hope that you and your loved ones are healthy and safe as the world battles to contain and defeat COVID-19.
The performance of the Emerald Small Cap Value Fund Investor Class, for the twelve months ended April 30, 2020, reflected a loss of -27.83% (without sales load) underperforming the Russell 2000® Value Index (or “R2V”) which was down -23.84%.
Performance data quoted represents past performance. Past performance does not guarantee future results.
Equity markets declined precipitously in the 1st calendar quarter of 2020, and in particular the month of March. The R2V was down -30.6%, the worst quarterly performance since the benchmark’s inception in 1984. Small caps lagged large caps by a wide margin in the past year as investors rewarded higher earnings growth and relative safety of bigger firms. At the same time, small cap value struggled vs. small cap growth, trailing by a whopping -1,462 bps over the last twelve months. Frustratingly for us, it was a continuation of the last three years’ market dynamics.
Dark days are still ahead of us. This fight against COVID-19 will be won, but it will take some time before we get back to our normal lives. The U.S. government, the Fed, countless of other Federal, state and local agencies are implementing unprecedented measures to bring relief to us all, support our healthcare providers, and stabilize the economy. We at Emerald believe that we all need to be patient and resilient in the coming months, but as with all past crises, the economy will rebound and markets will reach new highs.
Investment Analysis
The Emerald Small Cap Value Fund (without sales load) underperformed its benchmark for the 12-month year ended April 30, 2020. At the sector level, relative outperformance was driven by stock selection within the materials & processing, healthcare, and energy sectors. Relative underperformance was experienced within the consumer discretionary, technology, and financial services sectors.
The stock market decline in March was rapid and fierce. We entered into a bear market within a matter of days. We also experienced a quick sharp rally toward the end of the month. In this volatile period, which we are still in the midst of, certain industries and factors were particularly punished by investors. For example, oil & gas producers and servicers saw their share price plummet as demand fell off the cliff due to global economic decline and OPEC’s inability to come to an agreement regarding production cuts. Retailers/hotels/travel/leisure companies saw their revenues evaporate as orders of “shelter in place” took hold across the country. Businesses were closed and consumers were forced to stay home and tighten their purse strings, as millions of workers lost their jobs.
At Emerald we tried to be proactive and reposition the portfolio to weather the storm. During calendar 1Q 2020 we lowered our direct exposure to the energy sector to zero, and only recently we initiated a small position in natural gas drillers. We believe that as more oil production will be shut-in due to uneconomical conditions, the price of natural gas, a by-product, will increase in the near future. We also decreased our consumer discretionary weight in the portfolio, selling retailers and companies that derive their revenues from hospitality, travel, and leisure. Meanwhile we increased exposure to REITs and healthcare. The decline in the stock market offered us opportunities to initiate positions in high quality companies that were finally trading at attractive valuations, as well as adding to existing holdings that we believe will outperform in a negative economic growth environment.
What surprised us during this downturn is the fact that low quality companies that are not profitable and are mostly “cash users” did better than stable profitable “cash generators.” Our investment philosophy is focused on companies that have a proven track record of generating prodigious amount of cash, and then using that cash to grow their business. We like to invest in enterprises that use their cash to grow by investing in themselves, or by making accretive acquisitions to expand their product lines, broaden geographic reach, integrate vertically, or add crucial intellectual property. In order to make those acquisitions many value companies finance these deals through debt (which was cheap in the past few years), knowing they can pay it down quickly using their cash flow and synergies extracted from the acquired businesses. As it became clear that the US economy is heading into a recession, these levered companies, while still good businesses, were sold indiscriminately. Investors were concerned that any company with lots of debt on its balance sheet would default on that debt and would need to access more costly capital in order to survive, or face bankruptcy. That dynamic significantly hurt our relative performance. We reviewed all the levered holdings in the portfolio for their liquidity availability, operational obligations and debt covenants, and stressed them under draconian scenarios. We are comfortable with the current portfolio’s holdings ability to meet their obligations without needing to access the financial markets for additional capital. Most of those companies have added liquidity or refinanced their debt recently, which enabled them to lower interest expense, extend maturities further into the future, and improve their debt covenants.
| 6 | www.emeraldmutualfunds.com |
| Emerald Small Cap Value Fund | Manager Commentary |
April 30, 2020 (Unaudited)
Another dynamic that was a headwind for our portfolio was the intraday volatility. As the market swung 100s of bps up or down several times within each trading day in March, it was hard for the portfolio to keep pace and as a result lagged the benchmark (especially on strong upward moves in a short period of time). Our overweight in banks was also a headwind, as they underperformed on both the decline and the subsequent rally in the stock market.
What we know is that community bank valuations on a forward price-to-earnings basis are the lowest we have witnessed in over 25 years (Source: Keefe, Bruyette & Woods as of 03/31/20) and we believe attractive buying opportunities are abundant. We believe “the bottom” in bank valuation is hard to predict but we do know “the bottom” is the day before the recovery begins. During the first calendar quarter of 2020, fears over slower economic growth resulting from the outbreak of COVID-19 prompted two emergency rate cuts by the Federal Reserve and pushed long term rates to new historical lows. Bank stocks were trading below tangible book value (“TBV”) in the first quarter. We believe the market was telling investors that book value could decline, or at least would not be bolstered by earnings growth. In fact, we now expect bank earnings to be down (-10%) as net interest margins contract and credit costs rise. We believe that bank earnings will drop as the flat to inverted yield curve will put pressure on margins, while credit costs will increase due to the notable slowdown in business activity related to “shelter in place” orders.
We believe the first quarter 2020 earnings report will be the best quarter for the year despite Fed rate cuts as a result of strong loan and deposit growth as well as support from “floors” supporting loan yields.
All in, we expect the earnings reports for the first quarter to be a relatively good quarter with some margin compression but that is not important at this point, and we believe that the subject that will be front and center will be the guidance given by banks on their outlook for credit quality, margin compression, their local economic outlook, loan forbearance and the regulatory environment. We anticipate that coming out of this earnings season we will have a market that once again will be bifurcated by banks with a sound plan moving forward, and those being led by “hope”.
We continue to believe that “cash is king”, especially in the current environment. As of the date of this report, we intend to invest in high quality companies in our view generate prodigious amounts of free cash flow, as well as in financial services enterprises that trade significantly below their terminal value. We believe that these companies should outperform their peers and the market, as the economy moves into a recession and then slowly gets back to pre-COVID-19 activity.
Market Outlook
At this point in time, the economic data that is being reported is still backward looking and does not reflect the true depth of the decline in economic activity. It will get much worse, and some of the economic indicators that will be coming out in the next few weeks will probably shock us. The unemployment rate, which was at a multi-decade low recently, is expected to surge. With initial unemployment claims increasing by the millions each week, we expect the unemployment rate to be in the teens, if not higher. Just as a reminder, the US unemployment rate during the last global financial crisis peaked at 10% back in October of 2009 (The Great Recession ended in June that year). In January and February 2020 the domestic industrial economy began to recover from five consecutive months of contraction, including its worst three-month ISM stretch since May – July 2009. The turnaround was in part due to change in sentiment and increased confidence on outlook as a result of phase 1 trade deal agreement between the US and China. However, with the spread of COVID-19, many manufacturers reduced their output as demand was curtailed due to increased uncertainty, laid-off workers, or were deemed non-essential and had to close down. The Manufacturing ISM reporting for the month of March was below 50 (contraction) again, and it will decline much further until businesses re-open their doors and feel confident to spend on growth. The Non-Manufacturing ISM index will probably see even a greater drop as service jobs disappear, and the consumer is reluctant or unable to spend on discretionary items/experiences. Other economic data will be difficult to digest too, it will take a toll on all of us, but the point is not to succumb to fear, but to understand what is coming and be ready to act as the tide turns in our favor.
As mentioned above, the Fed shot several “bazookas” to ensure liquidity in the financial markets, by buying several trillions of dollars of various securities. Federal and State governments are taking unprecedented steps and spending trillions of dollars to support the fight against COVID-19, while taking care of businesses and individuals who are hurt financially due to the extreme measures the population was asked to take in order to reduce the risk of mass infection. “Social Distancing” is equivalent to “Put your life on hold and stay home”. We think it is an important tool in this war, but it can not last for a long period of time. The resolve of the government and the Fed to “do whatever it takes” is unquestionable, though the timing of “when will we get back to normal?” is on every investor’s mind and a source of much research, speculation, and debate.
So, what could be a realistic plan to let the population get outside and for businesses to re-open?
To simplify, we think that there are three phases in getting back to the way things were. Phase one, which we are currently in, is “Blocking”. This means blocking the spread of the virus by social distancing, travel restrictions, mass testing, contact tracing, quarantine, geographical closures, surveillance, etc. Phase two is “Living with the Virus”. This is the most difficult and complicated stage in the road to normalcy and could take
| Annual Report | April 30, 2020 | 7 |
| Emerald Small Cap Value Fund | Manager Commentary |
April 30, 2020 (Unaudited)
months. As it is widely reported that development of an effective vaccine for the virus is probably 12-18 months away, there will be a time period when society will need to function while still being vulnerable to infection. In phase two, younger and healthier segments of the population will be allowed to gradually go back to work and school, under the watchful eyes of law enforcement agencies (maybe with the help of the National Guard and military), and in a manner that minimizes the spread of the virus. If a local spread is detected, authorities will be able to quickly identify the infected population, and then quarantine and treat them. Later on, as rate of infections subside, the rest of the population will gradually be allowed to rejoin the workforce, and there will be less restrictions on travel. The final phase Recovery and Stabilization, will take place after a pharmaceutical solution will be achieved, either by a vaccine or an effective therapeutic medicine.
Many investors, and we here at Emerald, are squarely focused on the shift from phase one to phase two, as we believe the stock market will stabilize and march upwards ahead of that transition, as there will be better clarity and certainty regarding opening up the economy, and expectation for a near term recovery in the labor market. We think the following conditions must be met before we move forward to phase two. First is total containment of “hot spots”, in addition to providing assistance and monitoring to high risk populations. Second is establishing strong command and control centers that are able to identify outbreaks, quickly make efficient decisions, and rapidly deploy logistical assets. Third are effective public communications that disseminate trusted information across all segments of society and inspire confidence and hope. We are not there yet. It could take weeks if not months before non-essential businesses will reopen across the country, travel restrictions will ease, and kids/students will be allowed back to school. Therefore, we think that the recent market rally is premature, as we have not made it to the top of the curve yet nationally (though social distancing is helping to flatten it), and the dust has not settled on all those “bazookas” being fired.
According to Jefferies, small caps tend to beat large caps coming off a market bottom, and coming out of recessions, in nine out of the last ten economic downturns. Value and valuation tend to lead out of bear markets, and value has outperformed in three out of the last four bear markets, beating growth one year after recession ends.(1)
As this human tragedy of COVID-19 unfolds, we are hopeful that out of these big challenges some long lasting positive changes to society, the economy, and healthcare will emerge. As individuals, we are adapting to new technologies, communicating more with our family and friends (remotely), showing greater interest in the welfare of our neighbors and our communities, and reassessing our priorities. We are optimistic, we are resilient.
Here at Emerald we instituted Pandemic Policy protocols on February 27, 2020 (copy available upon request). There is no current impact to the delivery of our investment advisory services to our clients, nor to our ability to manage and support these activities. We have validated full capacity for our staff to work remotely. Key senior staff have conducted comprehensive reviews of the status of the Company’s portfolio management, operations, compliance and client services functions on March 25th, April 3rd and April 22nd to review any potential issues and confirmed the uninterrupted delivery of all functions and services. We are confident of our ongoing ability to function at these high levels of service in the coming months. Most importantly, all of us at Emerald extend our heartfelt thanks to all of our nation’s first responders, healthcare professionals and front-line essential workers, and express our care and concern to everyone affected by both the health- and economic-related devastation of COVID-19.
As always, we will continue to seek attractive investment opportunities for our clients by focusing on high-quality companies identified and evaluated by our fundamental research and active portfolio management.
| Top Contributors | Top Detractors |
| Photronics, Inc. | Gannett Co., Inc. |
| Turtle Beach Corporation | TPG RE Finance Trust, Inc. |
| PennyMac Mortgage Investment Trust | Blucora, Inc. |
| Karyopharm Therapeutics, Inc. | BayCom Corp. |
| Koppers Holdings Inc. | Penske Automotive Group, Inc. |
| | |
| Sincerely, | |
| | |
| Ori Elan | Steven E. Russell, Esq. |
| Vice President | Vice President |
| Portfolio Manager | Portfolio Manager |
| | |
| Emerald Mutual Fund Advisers Trust | |
| 8 | www.emeraldmutualfunds.com |
| Emerald Small Cap Value Fund | Manager Commentary |
April 30, 2020 (Unaudited)
Past performance does not guarantee future results. Fund prices fluctuate as the underlying assets have exposure to market fluctuations and other risks, as described in the Fund’s prospectus. Please visit www.emeraldmutualfunds.com to obtain current performance information and for the current prospectus and statement of additional information. This material must be preceded or accompanied by a prospectus. Please read the prospectus carefully before investing.
The views of Emerald Mutual Fund Advisers Trust and information discussed in this commentary are as of the date of publication, are subject to change, and may not reflect the writer's current views. The views expressed are those of the author only, and represent an assessment of market conditions at a specific point in time, are opinions only and should not be relied upon as investment advice regarding a particular investment or markets in general. Such information does not constitute a recommendation to buy or sell specific securities or investment vehicles. It should not be assumed that any investment will be profitable or will equal the performance of the Fund or any securities or any sectors mentioned in this letter. The subject matter contained in this letter has been derived from several sources believed to be reliable and accurate at the time of compilation. Neither Emerald Mutual Fund Advisers Trust nor the Fund accepts any liability for losses either direct or consequential caused by the use of this information.
The Emerald Small Cap Value Fund is distributed by ALPS Distributors, Inc.
The Fund is subject to investment risks, including possible loss of the principal amount invested and therefore is not suitable for all investors. The Fund may not achieve its objectives.
Diversification does not eliminate the risk of experiencing investment losses.
The term Russell 2000® Value Index refers to a composite of small cap companies located in the United States that also exhibit a value probability. The Russell 2000® Value is published does not reflect any deductions for fees, expenses or taxes. An investor may not invest directly into the Index.
A yield curve is a line that plots the interest rates, at a set point in time, of bonds having equal credit quality but differing maturity dates. The most frequently reported yield curve compares the three-month, two-year, five-year and 30-year U.S. Treasury debt. This yield curve is used as a benchmark for other debt in the market, such as mortgage rates or bank lending rates, and it is also used to predict changes in economic output and growth.
The ISM Report On Business®, popularly known as the ISM Report, is the collective name for two monthly reports, the Manufacturing ISM Report On Business® and the Non-Manufacturing ISM Report On Business®, published by Institute for Supply Management.
Jefferies, JEF's SMID-Cap Strategy - Thoughts & Observations, 08 April, 2020 Tangible book value (TBV) is a valuation ratio expressing the price of a security compared to its hard, or tangible, book value as reported in the company's balance sheet. The tangible book value number is equal to the company's total book value less the value of any intangible assets.
Net interest margin is a metric that examines how successful a firm's investment decisions are compared to its debt situations.
The ISM Manufacturing Index is a widely-watched indicator of recent U.S. economic activity. The index is often referred to as the Purchasing Manager's Index (PMI).
| Annual Report | April 30, 2020 | 9 |
| Emerald Small Cap Value Fund | Manager Commentary |
April 30, 2020 (Unaudited)
TOP TEN HOLDINGS
(as a % of Net Assets)* | | | |
| | | | |
| Innovative Industrial Properties, Inc. | | | 2.86 | % |
| Universal Forest Products, Inc. | | | 2.57 | % |
| Science Applications International Corp. | | | 2.55 | % |
| Meritor, Inc. | | | 2.46 | % |
| Vonage Holdings Corp. | | | 2.45 | % |
| GameStop Corp. | | | 2.43 | % |
| Cannae Holdings, Inc. | | | 2.42 | % |
| Postal Realty Trust, Inc. | | | 2.40 | % |
| INTL. FCStone, Inc. | | | 2.34 | % |
| Luther Burbank Corp. | | | 2.33 | % |
| Top Ten Holdings | | | 24.81 | % |
INDUSTRY SECTOR ALLOCATION
(as a % of Net Assets) | | | |
| | | | |
| Financial Services | | | 42.38 | % |
| Technology | | | 12.29 | % |
| Consumer Discretionary | | | 10.11 | % |
| Producer Durables | | | 9.51 | % |
| Health Care | | | 8.17 | % |
| Materials & Processing | | | 8.17 | % |
| Utilities | | | 3.75 | % |
| Energy | | | 0.98 | % |
| Cash, Cash Equivalents, & Other Net Assets | | | 4.64 | % |
| Total | | | 100.00 | % |
| * | Holdings are subject to change, and may not reflect the current or future position of the portfolio. |
ANNUALIZED TOTAL RETURN (for the period ended April 30, 2020)(1),(2)
| | | | | | Since | Expense Ratio |
| | 6 Month | 1 Year | 3 Years | 5 Years | Inception(2) | Gross(3) | Net(3) |
| Class A (NAV) | -29.53% | -27.98% | -9.13% | -2.06% | 3.76% | 2.89% | 1.35% |
| Class A (MOP) | -32.86% | -31.37% | -10.59% | -3.01% | 3.09% | 2.89% | 1.35% |
| Russell 2000® Value Index(4) | -23.44% | -23.84% | -6.06% | 0.30% | 5.32% | | |
| Class C (NAV) | -29.76% | -28.45% | -9.72% | -2.70% | 3.09% | 3.44% | 2.00% |
| Class C (CDSC) | -30.46% | -29.16% | -9.72% | -2.70% | 3.09% | 3.44% | 2.00% |
| Russell 2000® Value Index(4) | -23.44% | -23.84% | -6.06% | 0.30% | 5.32% | | |
| Investor Class | -29.37% | -27.83% | -8.93% | -1.87% | 3.94% | 2.83% | 1.25% |
| Russell 2000® Value Index(4) | -23.44% | -23.84% | -6.06% | 0.30% | 5.32% | | |
| Institutional Class | -29.45% | -27.75% | -8.80% | -1.72% | 4.12% | 2.44% | 1.00% |
| Russell 2000® Value Index(4) | -23.44% | -23.84% | -6.06% | 0.30% | 5.32% | | |
Performance quoted represents past performance, does not guarantee future results and current performance may be lower or higher than the data quoted. The investment return and principal value of an investment will fluctuate so that shares, when redeemed, may be worth more or less than their original cost. Performance data current to the most recent month end may be obtained at www.emeraldmutualfunds.com.
Returns for periods less than 1 year are cumulative.
The table does not reflect the deduction of taxes that a shareholder would pay on Fund distributions or the redemption of Fund shares.
Subject to investment risks, including possible loss of the principal amount invested.
Maximum Offering Price (MOP) for Class A shares includes the Fund's maximum sales charge of 4.75%. Performance shown at NAV does not include these sales charges and would have been lower had it been taken into account.
A Contingent Deferred Sales Charge (CDSC) of 1.00% may apply to Class C shares redeemed within the first 12 months after a purchase.
| (1) | As of June 26, 2015, the Emerald Small Cap Value Fund was reorganized as a successor to the Elessar Small Cap Value Fund (the Predecessor Fund), a series of Elessar Investment Trust. The performance shown for periods prior to June 26, 2015 reflects the performance of the Predecessor Fund's Institutional Class and Investor Class shares. The Predecessor Fund did not offer Class A or Class C shares. The performance shown for Class A and C shares prior to June 30, 2015 reflect the historical performance of the Predecessor Fund’s Institutional and Investor Shares since inception on October 15, 2012, calculated using the fees and expenses of Class A and C shares, respectively. |
| (2) | Commencement Dates - Class A: 06/30/2015, Class C: 06/30/2015, Institutional Class: 10/15/2012, Investor Class:10/15/2012 |
| (3) | Emerald Mutual Fund Advisers Trust (“Emerald” or the “Adviser”) has agreed contractually to waive a portion of its fees and reimburse other expenses until August 31, 2020 in amounts necessary to limit the Fund’s operating expenses (exclusive of Acquired Fund Fees and Expenses, brokerage expenses, interest expenses, taxes and extraordinary expense) for Class A, Class C, Institutional Class, and Investor Class shares to an annual rate (as percentage of the Fund’s average daily net assets) of 1.35%, 2.00%, 1.00% and 1.25% respectively. The Adviser will be permitted to recover, on a class-by-class basis, expenses it has borne through the agreement described above to the extent that the Fund's expenses in later periods fall below the annual rates set forth in the relevant agreement. The Fund will not be obligated to pay any such deferred fees and expenses more than three years after the year(s) in which the fees and expense were incurred. The Adviser may not discontinue this waiver prior to August 31, 2020, without the approval by the Fund's Board of Trustees. Ratios as of the Prospectus dated August 31, 2019 and may differ from the ratios presented in the Financial Highlights. |
| (4) | The Russell 2000® Value Index measures the performance of small-cap value segment of the U.S. equity universe. It includes those Russell 2000 companies with lower price-to-book ratios and lower forecasted growth values. The Index is not actively managed and does not reflect any deductions for fees, expenses or taxes. An investor may not invest directly into the Index. |
Important Risks
Investing in smaller companies generally will present greater investment risks, including: greater price volatility, greater sensitivity to changing economic conditions and less liquidity than the securities of larger, more mature companies.
| 10 | www.emeraldmutualfunds.com |
| Emerald Small Cap Value Fund | Manager Commentary |
April 30, 2020 (Unaudited)
GROWTH OF $10,000 INVESTMENT IN THE FUND (for the period ended April 30, 2020)
Comparison of change in value of a $10,000 investment (includes applicable sales loads)
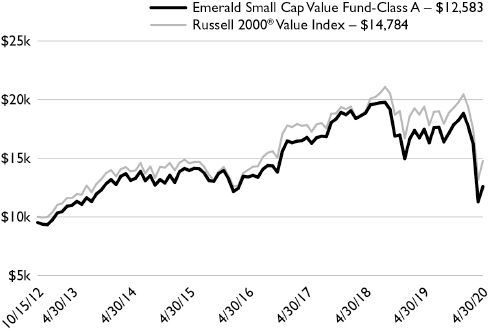
The chart represents historical performance of a hypothetical investment of $10,000 in the Fund since inception. Past performance does not guarantee future results. This chart does not reflect the deduction of taxes that a shareholder would pay on Fund distributions or the redemption of Fund shares.
Investing in the Fund is subject to investment risks, including possible loss of the principal amount invested.
| Annual Report | April 30, 2020 | 11 |
| Emerald Insights Fund | Manager Commentary |
April 30, 2020 (Unaudited)
April 30, 2020
Dear Shareholder:
Investment Results
The performance of the Emerald Insights Fund Class A Shares (without the sales load) for the year ended April 30, 2020 reflected a return of +5.43%, trailing the Russell 3000®Growth Index benchmark return of +9.47%. Strength in Healthcare, Consumer Discretionary, and Materials was offset by weakness in Energy, Financial Services, and Technology. Performance was hampered for the majority of the period due to severe underperformance of small capitalization stocks (an area of overweight for the Fund) vs. large capilzation stocks in the benchmark and the unprecedented market dislocation associated with the COVID-19 global pandemic.
Performance data quoted represents past performance. Past performance does not guarantee future results.
Investment Analysis
The final three months of the Insights Fund performance period bore the brunt of the unprecedented cessation of economic activity associated with the COVID-19 global pandemic, as well as the impact of the unpredictable actions by OPEC+ to start an oil supply war in the midst of the coronavirus related demand shock. The Fund made significant adjustments to the portfolio to reduce risk, upgrade quality, and add positions that may actually benefit from the virus and its effect on daily living.
The Fund’s market capitalization, while very large at $268B, was smaller than the benchmark at $351B and had similar, to discounted valuation metrics vs. the benchmark, with greater expected and historical sales and earnings growth, and lower debt/capital ratios. The Insights Fund ended the performance period overweight Materials, Healthcare and Energy and was underweight Technology, Consumer Discretionary, Financial Services and Producer Durables. In Technology the Fund added a number of “Work from Home” potential beneficiaries during the period.
Market Outlook
The last several months have been the toughest in our long investment careers and our hearts go out to all those fighting on the front lines against the virus and those suffering from its debilitating effects. The impact of the virus and the mandated economic shutdown covering 90% of the US population makes our task of building portfolios that will beat our benchmark exceedingly difficult in the short term. Our challenge since the March 23rd market lows has been trying to determine a proper balance between offense and defense, of caution vs. more aggressive positioning.
At Emerald, we believe earnings drive stock prices, and it is clear that no matter how much fiscal and monetary relief is injected into the economy, S&P earnings will decline dramatically, as will overall GDP. Analysts’ currently estimate a -19.7% 2020 earnings decline (source: Factset) – the reality will likely prove far worse, as some estimates have 2020 earnings falling over -30%. Analysts then expect 2021 earnings to rebound +27% (Factset). As fundamental stock pickers, we look less at macro-market indications, and more towards dislocated names that are incorrectly viewed by the market – an area of success for us in the reporting period. While timing is difficult to ascertain, we believe in the early stages, large healthcare and technology names will better weather the economic storm; and if, as we believe, slow growth will be the “new normal” given economic realities, growth equities – and in particular smaller capitalization growth stocks – will outperform as the economy restarts. Our team of seasoned analysts knows our companies, allowing portfolio managers the flexibility to move quickly to potentially take advantage of inevitable valuation and balance sheet dislocations.
Here at Emerald we instituted Pandemic Policy protocols on February 27, 2020 (copy available upon request). There is no current impact to the delivery of our investment advisory services to our clients, nor to our ability to manage and support these activities. We have validated full capacity for our staff to work remotely. Key senior staff have conducted comprehensive reviews of the status of the Company’s portfolio management, operations, compliance and client services functions on March 25th, April 3rd and April 22nd to review any potential issues and confirmed the uninterrupted delivery of all functions and services. We are confident of our ongoing ability to function at these high levels of service in the coming months. Most importantly, all of us at Emerald extend our heartfelt thanks to all of our nation’s first responders, healthcare professionals and frontline essential workers, and express our care and concern to everyone effected by both the health- and economic-related devastation of COVID-19.
We have been through periods of major market uncertainty in the past and we have built our firm to take advantage of uncertainty. The next few months will not be easy for any of us, be we are certain that our team will work diligently to continue to identify some of the most exciting, dynamic growth companies, with the what we believe are best management teams in the nation.
| Top Contributors | Top Detractors | |
| InMode Ltd. | Diamondback Energy, Inc. | |
| Microsoft Corporation | Harsco Corporation | |
| Amazon.com, Inc. | LendingTree, Inc. | |
| Apple Inc. | Viper Energy Partners LP | |
| NVIDIA Corporation | Chart Industries, Inc. | |
| | | |
| David A. Volpe, CFA | Stephen L. Amsterdam | Joseph Hovorka |
| Deputy Chief Investment Officer | Associate Portfolio Manager | Associate Portfolio Manager |
| Portfolio Manager | | |
| | | |
| Emerald Mutual Fund Advisers Trust | | |
| 12 | www.emeraldmutualfunds.com |
| Emerald Insights Fund | Manager Commentary |
April 30, 2020 (Unaudited)
Past performance does not guarantee future results. Fund prices fluctuate as the underlying assets have exposure to market fluctuations and other risks, as described in the Fund’s prospectus. Please visit www.emeraldmutualfunds.com to obtain current performance information and for the current prospectus and statement of additional information. This material must be preceded or accompanied by a prospectus. Please read the prospectus carefully before investing.
The views of Emerald Mutual Fund Advisers Trust and information discussed in this commentary are as of the date of publication, are subject to change, and may not reflect the writer's current views. The views expressed are those of the author only, and represent an assessment of market conditions at a specific point in time, are opinions only and should not be relied upon as investment advice regarding a particular investment or markets in general. Such information does not constitute a recommendation to buy or sell specific securities or investment vehicles. It should not be assumed that any investment will be profitable or will equal the performance of the Fund or any securities or any sectors mentioned in this letter. The subject matter contained in this letter has been derived from several sources believed to be reliable and accurate at the time of compilation. Neither Emerald Mutual Fund Advisers Trust nor the Fund accepts any liability for losses either direct or consequential caused by the use of this information.
The Emerald Insights Fund is distributed by ALPS Distributors, Inc.
The Fund is subject to investment risks, including possible loss of the principal amount invested and therefore is not suitable for all investors. The Fund may not achieve its objectives.
Diversification does not eliminate the risk of experiencing investment losses.
The Russell 3000® Growth Index is a market capitalization weighted index based on the Russell 3000® index. The Russell 3000® Growth Index includes companies that display signs of above average growth. The index is used to provide a gauge of the performance of growth stocks in the United States. The Index is not actively managed and does not reflect any deductions for fees, expenses or taxes. An investor may not invest directly into the Index.
| Annual Report | April 30, 2020 | 13 |
| Emerald Insights Fund | Manager Commentary |
April 30, 2020 (Unaudited)
TOP TEN HOLDINGS
(as a % of Net Assets)* | | | |
| | | | |
| Amazon.com, Inc. | | | 7.00 | % |
| Microsoft Corp. | | | 6.17 | % |
| Apple, Inc. | | | 5.24 | % |
| Alphabet, Inc. | | | 3.70 | % |
| iShares Expanded Tech-Software Sector ETF | | | 3.33 | % |
| NVIDIA Corp. | | | 2.55 | % |
| Chegg, Inc. | | | 2.55 | % |
| Facebook, Inc. | | | 2.14 | % |
| Horizon Therapeutics PLC | | | 2.06 | % |
| Lockheed Martin Corp. | | | 1.93 | % |
| Top Ten Holdings | | | 36.67 | % |
INDUSTRY SECTOR ALLOCATION
(as a % of Net Assets) | | | |
| | | | |
| Technology | | | 36.84 | % |
| Consumer Discretionary | | | 17.27 | % |
| Health Care | | | 16.38 | % |
| Producer Durables | | | 8.21 | % |
| Financial Services | | | 8.44 | % |
| Consumer Staples | | | 3.62 | % |
| Materials & Processing | | | 2.94 | % |
| Energy | | | 3.06 | % |
| Utilities | | | 0.34 | % |
| Cash, Cash Equivalents, & Other Net Assets | | | 2.90 | % |
| Total | | | 100.00 | % |
| * | Holdings are subject to change, and may not reflect the current or future position of the portfolio. |
ANNUALIZED TOTAL RETURN (for the period ended April 30, 2020)
| | | | | | Since | Expense Ratio |
| | 6 Month | 1 Year | 3 Year | 5 Year | Inception(1) | Gross(2) | Net(2) |
| Class A (NAV) | 5.15% | 5.43% | 10.75% | 6.99% | 7.79% | 2.19% | 1.35% |
| Class A (MOP) | 0.12% | 0.45% | 8.95% | 5.95% | 6.88% | 2.19% | 1.35% |
| Russell MidCap® Growth Index(3) | -1.78% | 0.23% | 11.28% | 8.88% | 10.08% | | |
| Russell 3000® Growth Index(4) | 5.21% | 9.47% | 14.88% | 12.76% | 13.42% | | |
| Class C (NAV) | 4.84% | 4.84% | 10.04% | 6.28% | 7.07% | 2.84% | 2.00% |
| Class C (CDSC) | 3.84% | 3.84% | 10.04% | 6.28% | 7.07% | 2.84% | 2.00% |
| Russell MidCap® Growth Index(3) | -1.78% | 0.23% | 11.28% | 8.88% | 10.08% | | |
| Russell 3000® Growth Index(4) | 5.21% | 9.47% | 14.88% | 12.76% | 13.42% | | |
| Investor Class | 5.09% | 5.45% | 10.74% | 6.94% | 7.72% | 2.24% | 1.40% |
| Russell MidCap® Growth Index(3) | -1.78% | 0.23% | 11.28% | 8.88% | 10.08% | | |
| Russell 3000® Growth Index(4) | 5.21% | 9.47% | 14.88% | 12.76% | 13.42% | | |
| Institutional Class | 5.40% | 5.85% | 11.10% | 7.30% | 8.10% | 1.89% | 1.05% |
| Russell MidCap® Growth Index(3) | -1.78% | 0.23% | 11.28% | 8.88% | 10.08% | | |
| Russell 3000® Growth Index(4) | 5.21% | 9.47% | 14.88% | 12.76% | 13.42% | | |
The performance quoted represents past performance, does not guarantee future results and current performance may be lower or higher than the data quoted. The investment return and principal value of an investment will fluctuate so that shares, when redeemed, may be worth more or less than their original cost. Performance data current to the most recent month end may be obtained at www.emeraldmutualfunds.com.
Returns for periods less than 1 year are cumulative.
The table does not reflect the deduction of taxes that a shareholder would pay on Fund distributions or the redemption of Fund shares.
Subject to investment risks, including possible loss of the principal amount invested.
Maximum Offering Price (MOP) for Class A shares includes the Fund's maximum sales charge of 4.75%. Performance shown at NAV does not include these sales charges and would have been lower had it been taken into account.
A Contingent Deferred Sales Charge (CDSC) of 1.00% may apply to Class C shares redeemed within the first 12 months after a purchase.
| (1) | Inception Date – August 1, 2014. |
| (2) | Emerald Mutual Fund Advisers Trust ("Emerald" or the "Adviser") has agreed contractually to waive a portion of its fees and reimburse other expenses until August 31, 2020 in amounts necessary to limit the Fund's operating expenses (exclusive of Acquired Fund Fees and Expenses, brokerage expenses, interest expenses, taxes and extraordinary expense) for Class A, Class C, Institutional Class, and Investor Class shares to an annual rate (as percentage of the Fund's average daily net assets) of 1.35%, 2.00%, 1.05% and 1.40% respectively. The Adviser will be permitted to recover, on a class-by-class basis, expenses it has borne through the agreement described above to the extent that the Fund's expenses in later periods fall below the annual rates set forth in the relevant agreement. The Fund will not be obligated to pay any such deferred fees and expenses more than three years after the year(s) in which the fees and expense were incurred. The Adviser may not discontinue this waiver prior to August 31, 2020, without the approval by the Fund's Board of Trustees. Ratios as of the Prospectus dated August 31, 2019 and may differ from the ratios presented in the Financial Highlights. |
| (3) | The Russell MidCap® Growth Index measures the performance of the mid-cap growth segment of the U.S. equity universe. It includes those Russell Midcap Index companies with higher price-to-book ratios and higher forecasted growth values. The Index is not actively managed and does not reflect any deductions for fees, expenses or taxes. An investor may not invest directly into the Index. |
| (4) | The Russell 3000® Growth Index is a market capitalization weighted index based on the Russell 3000® index. The Russell 3000® Growth Index includes companies that display signs of above average growth. The index is used to provide a gauge of the performance of growth stocks in the United States. The Index is not actively managed and does not reflect any deductions for fees, expenses or taxes. An investor may not invest directly into the Index. |
Important Risks
Investing in smaller companies generally will present greater investment risks, including: greater price volatility, greater sensitivity to changing economic conditions and less liquidity than the securities of larger, more mature companies.
| 14 | www.emeraldmutualfunds.com |
| Emerald Insights Fund | Manager Commentary |
April 30, 2020 (Unaudited)
GROWTH OF $10,000 INVESTMENT IN THE FUND (for the period ended April 30, 2020)
Comparison of change in value of a $10,000 investment (includes applicable sales loads)
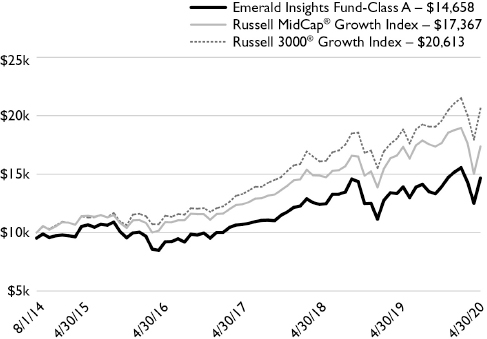
The chart represents historical performance of a hypothetical investment of $10,000 in the Fund since inception. Past performance does not guarantee future results. This chart does not reflect the deduction of taxes that a shareholder would pay on Fund distributions or the redemption of Fund shares.
Investing in the Fund is subject to investment risks, including possible loss of the principal amount invested.
| Annual Report | April 30, 2020 | 15 |
| Emerald Banking and Finance Fund | Manager Commentary |
April 30, 2020 (Unaudited)
April 30, 2020
Dear Shareholders:
Investment Results
The Emerald Bank & Finance Fund Class A shares (without sales load) underperformed the Russell 2000® Index for the twelve months ended April 30, 2020, returning -30.02% vs. -16.39% for the Index. During the twelve months ended April 30, 2020, the Russell 2000®Financial Services Index returned -24.25%.
Performance data quoted represents past performance. Past performance does not guarantee future results.
Investment Analysis and Market Outlook
Based on our economic outlook and our expectation for elevated provision expense that could weigh on bank profitability over at least the next year, driving consensus EPS materially lower from current levels, we are officially cautious on community banks. However, with community banks trading at levels not seen since the Great Financial Crisis of 2008 (GFC), we are favorable on the sector longer-term (1-2 years out), assuming a favorable resolution to the COVID-19 (C19) outbreak which continues to drive the current economic downturn. Uncertainty is in abundance as we analyze the ability of a largely locked down US economy to return to “normalcy.” The ability to return to normal is certainly predicated on our ability to stop the spread of a highly contagious pathogen that has killed over 80K people in the U.S. alone in the short span of two and a half months, with over 1.3 million cases confirmed in the U.S. to date.
We believe we learn from other countries’ successes in reopening the economy as some predictor of the path the U.S. could take. But we note that even in a country like China, that was impacted materially by the pandemic earlier this year but has seemed to have reported the most progress in stamping out C19 in recent months, new cases continue to surface, prompting new restrictions hampering the return to normal life.
We believe banking regulators are taking a more relaxed approach to credit with the C19 crisis than during the GFC and are encouraging banks to head down the path of principal and interest deferrals, forbearance and workout plans. Some have called these “fake TDRs”. The truth is no one really knows how long this is all going to last or if this will be a V-shaped recovery, U-shaped, L-shaped or “swoop” shaped. What we do know is that the deferrals and forbearances have left a “cloud” of uncertainty over the bank sector and abundance of guesses by market pundits about the severity of credit deterioration to come. In general, we think this deferral policy is appropriate, but only up to a point before it starts to become ignorant of real and long lasting borrower problems and starts to mask eventual problems. We believe the current deferral approach is to buy time for banks as the market hopes for a V-shaped recovery or at least a U-shaped recovery. We believe that the six-month moratorium or holding period will allow banks to build proper reserve levels and build capital, if needed, though we believe banks are much better capitalized than they were during the GFC.
We are concerned by the level of deferments at some banks and the lack of reserve building at others and believe that those banks with an approach of reserve now rather than later will outperform their peers. We remain concerned that the end of deferral periods could represent an adverse credit event that could be significant were the economy to fail to exhibit a somewhat healthy recovery in the second half of 2020. We also expect the amount of loans on deferral could increase over time, exacerbating migration trends beyond 4Q20. As a result, we believe there is a high certainty that banks will be required to post another round of elevated provisions in 2Q20 to account for likely continued economic damage, and the outlook suggesting the U.S. is already in a recession, we see greater uncertainty around the depth of the potential credit issues arising today, and the ultimate duration of required elevated provisioning.
The Payroll Protection Program (PPP) has been a positive for community banks as banks with less than $10 billion in assets have received more than 60% of the approvals under the program. In addition to supporting individuals and small businesses in their community the PPP program has resulted in unexpected fees for the banks. The average community bank is receiving an average fee of 3% on the PPP loans. We believe it is prudent for community banks to use these fees to fund loan loss reserves. In the second round of PPP funding there was in fact a “carve out” for community bank lending in addition to access to the general pool. We believe additional relief will benefit community banks in the coming months.
U.S. House of Representatives Speaker Pelosi was expected to release her Phase 4 legislative proposal in May. The multi-trilliondollar package is expected to be a noteworthy mile marker, but we believe there are miles left to go before a viable deal can be brokered. We believe that there will certainly be changes to the House early stage proposals but remain encouraged by the government's focus on providing support to individuals, businesses and at the end of the day community banks.
Community banks will also benefit to a greater degree than previously expected from the Main Street Lending Program than previously believed but additional clarity is required before this program gets the green light to move forward. Under the $600B Main Street Lending Program, U.S. federally-insured depositories originate loans to eligible borrowers and a Fed Special Purpose Vehicle will purchase either 85% or 95% of the loan
| 16 | www.emeraldmutualfunds.com |
| Emerald Banking and Finance Fund | Manager Commentary |
April 30, 2020 (Unaudited)
shortly after origination depending on which of the three subprograms is used. Eligible borrowers are U.S. companies with either (1) 2019 annual revenues of no more than $5B or (2) fewer than 15,000 employees. The loan features (e.g., 4-year term, 1 year of deferred payment, rate of LIBOR+300) and core requirements are generally similar, but there are key differences that are detailed below:
| • | Main Street New Loan Facility (MSNLF). New loans to qualified borrowers with a maximum amount “that is the lesser of (i) $25 million or (ii) an amount that, when added to the Eligible Borrower’s existing outstanding and undrawn available debt, does not exceed four times” adjusted 2019 EBITDA. Lenders must retain 5% of the loan under this subprogram. |
| • | Main Street Priority Loan Facility (MSPLF). This is the new program under the Main Street umbrella. It is effectively the same as the MSNLF, except its maximum loan amount is either $25M or an amount that will not exceed 6x the firm’s 2019 earnings before interest, taxes, depreciation and amortization (EBITDA). As a reminder, the MSNLF sets a 4x EBITDA threshold so this program provides for two additional turns of leverage. For the extra risk that is associated with lending to a company with that level of indebtedness, the Federal Reserve is requiring the lender retain 15% of the loan rather than the 5% retention required for the other two Main Street subprogram. |
| • | MainStreet Expanded Loan Facility (MSELF). This program allows lenders to upsize term loans or revolving credit facilities that were originated prior to April 24, 2020 with at least 18 months left in the term. The maximum loan amount is “the lesser of (i) $200 million, (ii) 35% of the Eligible Borrower’s existing outstanding and undrawn available debt that is pari passu in priority with the Eligible Loan and equivalent in secured status (i.e., secured or unsecured), or (iii) an amount that, when added to the Eligible Borrower’s existing outstanding and undrawn available debt, does not exceed six times” adjusted 2019 EBITDA. Lenders must retain 5% of the loan under this subprogram. |
We believe that first quarter results will likely be the best quarter for community bank earnings growth in 2020. During the first quarter of 2020, Commercial and Industrial (C&I) lending by U.S. banks has continued to surge as corporations seek to build up cash buffers to survive the C19 pandemic. We believe the “hoarding” of cash and liquidity injected into the market by the Federal Reserve will lead to an increase in deposits as well as capital on bank balance sheets, prompting regulators to ease constraints on balance sheet growth.
C&I loans at commercial banks grew 7.4% or $189.95 billion, during the week ended March 25th, according to the Fed’s latest H.8 report on bank assets and liabilities. That was the fastest pace of growth in more than 45 years. The growth in commercial lending drove the 2.5% weekly increase in total bank loans, as consumer credit loans fell 1.4% and overall consumer loans fell 0.6%.
While large U.S. banks drove the bulk of an increase in commercial and industrial lending in March, smaller banks have accelerated their C&I lending more recently, primarily as a result of federally backed coronavirus relief programs. Since March 4, smaller banks have boosted their C&I balances by $208.29 billion, with $171.76 billion of that amount coming in the four weeks ended April 29, according to the Federal Reserve's most recent H.8 report on commercial banks operating in the U.S. On the other hand, the 25 largest banks have added a net $297.34 billion since March 4 and just $16.81 billion in the four weeks ended April 29. Overall, C&I loans at U.S. commercial banks reached $3.019 trillion as of April 29, up 0.6% from the previous week and 28.0% from March 4.
After the close of this report's April 30, 2020 publication date, the Small Business Administration subsequently reported that through May 8, lenders with less than $50 billion in assets received approval for 47% of $188.94 billion of loans guaranteed in round two of the PPP. According to the April Senior Loan Officer Opinion Survey, a significant net percentage of banks, defined in the survey as between 20% and 50% of the respondents, reported tightening standards for C&I loans. Banks have focused on lending to existing clients rather than new borrowers due to concerns about the COVID-19 outbreak, the survey found. We believe there will be an opportunity for community banks to take market share as the larger banks move “upstream” and abandon small to medium size C&I borrowers.
Overall, U.S. banks had more than $2 trillion in unused C&I commitments at year end 2019. According to S&P Global, much of the corporate borrowing has flowed into deposits on U.S. bank balance sheets, which increased 2.6% during the week ended March 25th. Additionally, Bank’s cash assets, including reserves held with the central bank soared 22.6% during the week ended March 25th, according to S&P Global.
We believe that with fed funds rate back near the zero bound, banks will work aggressively lower rates on deposits. However, some of those efforts could be mitigated as banks feel the pressure on their liquidity as corporations draw down committed capital lines. We believe investors are concerned that many U.S. banks could have holes in their balance sheets and may be in need of additional capital. However, we believe that even if some of the most dire outlooks come true, the industry's capital levels should remain quite strong in the face of depressed returns. We believe that credit quality will perform better than it did during the Great Recession due to the unprecedented government stimulus aimed at mitigating the fallout of the COVID-19 pandemic. According to S&P Global Market Intelligence, even if 2020 loss rates match the same levels seen in 2009, the U.S. banking industry would maintain a tangible equity-to-tangible assets ratio well above 9% this year. That is nearly 250 basis points higher than the tangible equity ratio reported by the industry in 2009 after banks received several hundred billion dollars in capital from the TARP bailout.
| Annual Report | April 30, 2020 | 17 |
| Emerald Banking and Finance Fund | Manager Commentary |
April 30, 2020 (Unaudited)
We believe that together, the expected margin pressure and heightened credit costs facing banks will cause earnings growth rates to be down year-over-year. However, we would point out that bank profitability remains far stronger than in the years after the credit crisis when historically low rates, slow loan growth, and heightened regulations hampered the industry’s profitability.
While loan growth is usually viewed as a positive, we must be cautious as we expect the near-term economic environment to lead to some deterioration in credit quality. We believe that the economic shutdown will lead to negative GDP growth in the second quarter of 2020 and possibly for the full year. Such a decline will likely be far larger than any contraction witnessed in the U.S. during the Great Recession.
As a result of the looming recession, we believe there has been a flight to quality in the bond market, which sent the yield on the 10-year Treasury well below 1% for the first time ever. We believe the Fed has responded to the unprecedented business closures with rate cuts and a number of liquidity facilities aimed at shoring up confidence while maintaining orderly functioning of wholesale funding markets.
On another front we must at least mention the potential damage to the economy driven by $20 oil. Certainly there are geographic locations that will see more credit deterioration than others due to low energy prices and a pullback in jobs in the energy patch but pricing at these levels will be yet another negative for GDP growth in 2020.
Here at Emerald we instituted Pandemic Policy protocols on February 27, 2020 (copy available upon request). There is no current impact to the delivery of our investment advisory services to our clients, nor to our ability to manage and support these activities. We have validated full capacity for our staff to work remotely. Key senior staff have conducted comprehensive reviews of the status of the Company’s portfolio management, operations, compliance and client services functions on March 25th, April 3rd and April 22nd to review any potential issues and confirmed the uninterrupted delivery of all functions and services. We are confident of our ongoing ability to function at these high levels of service in the coming months. Most importantly, all of us at Emerald extend our heartfelt thanks to all of our nation’s first responders, healthcare professionals and front-line essential workers, and express our care and concern to everyone affected by both the health- and economic-related devastation of COVID-19.
As we move forward into the remainder of calendar year 2020, we believe there is a market that once again will be bifurcated by banks with a sound plan moving forward and those being led by “hope”. Emerald’s ten step research process will be key to our ability to identify the “winners” from the “losers” and we believe that this environment is where fundamental research and a long-term investment approach will lead to the ability to navigate the equity market during these turbulent times.
| Top Contributors | Top Detractors | |
| Silvergate Capital Corp. Class A | BayCom Corp. | |
| ServisFirst Bancshares Inc | Everi Holdings, Inc. | |
| Stewardship Financial Corporation | Spirit of Texas Bancshares, Inc. | |
| Repay Holdings Corp. Class A | Business First Bancshares, Inc. | |
| Focus Financial Partners, Inc. Class A | Metropolitan Bank Holding Corp. | |
| | | |
| Kenneth G. Mertz II, CFA | Steven E. Russell, Esq. | |
| Chief Investment Officer | Portfolio Manager | |
| Portfolio Manager | | |
| | | |
| Emerald Mutual Fund Advisers Trust | | |
| 18 | www.emeraldmutualfunds.com |
| Emerald Banking and Finance Fund | Manager Commentary |
April 30, 2020 (Unaudited)
Past performance does not guarantee future results. Fund prices fluctuate as the underlying assets have exposure to market fluctuations and other risks, as described in the Fund’s prospectus. Please visit www.emeraldmutualfunds.com to obtain current performance information and for the current prospectus and statement of additional information. This material must be preceded or accompanied by a prospectus. Please read the prospectus carefully before investing.
The views of Emerald Mutual Fund Advisers Trust and information discussed in this commentary are as of the date of publication, are subject to change, and may not reflect the writer's current views. The views expressed are those of the author only, and represent an assessment of market conditions at a specific point in time, are opinions only and should not be relied upon as investment advice regarding a particular investment or markets in general. Such information does not constitute a recommendation to buy or sell specific securities or investment vehicles. It should not be assumed that any investment will be profitable or will equal the performance of the Fund or any securities or any sectors mentioned in this letter. The subject matter contained in this letter has been derived from several sources believed to be reliable and accurate at the time of compilation. Neither Emerald Mutual Fund Advisers Trust nor the Fund accepts any liability for losses either direct or consequential caused by the use of this information.
The Emerald Banking and Finance Fund is distributed by ALPS Distributors, Inc.
The Fund is subject to investment risks, including possible loss of the principal amount invested and therefore is not suitable for all investors. The Fund may not achieve its objectives.
Diversification does not eliminate the risk of experiencing investment losses.
The Russell 2000® Index measures the performance of the small-cap segment of the U.S. equity universe. The Russell 2000® Index is a subset of the Russell 3000® Index representing approximately 10% of the total market capitalization of that index. It includes approximately 2000 of the smallest securities based on a combination of their market cap and current index membership. The Index is not actively managed and does not reflect any deduction of fees, expenses or taxes. An investor may not invest directly into the Index.
The Russell 2000® Financial Services Index – is comprised of the smallest financial services companies in the Russell 3000 Index. The Index is not actively managed and does not reflect any deductions for fees, expense, or taxes. An investor may not invest directly in the Index.
SNL Small Cap Bank & Thrift Index: Includes all publicly traded (NYSE, NYSE Amex, NASDAQ, OTC BB, Pink Sheets) Banks and Thrifts in SNL's coverage universe with $250M to $1B Total Common Market Capitalization as of most recent pricing data. Source: SNL Financial, data as of April 30, 2019.
The Standard & Poor’s 500® Index is an unmanaged index of 500 common stocks chosen for the market size, liquidity and industry group representation. It is a market-value weighted index. The Index is not actively managed and does not reflect any deduction for fees, expenses or taxes. An investor may not invest directly into the Index
The Russell 2000® Value Index measures the performance of small-cap value segment of the U.S. equity universe. It includes those Russell 2000 companies with lower price-to-book ratios (A ratio used to compare a stock's market value to its book value. It is calculated by dividing the current closing price of the stock by the latest quarter's book value per share.) and lower forecasted growth values. The Index is not actively managed and does not reflect any deductions for fees, expenses or taxes. An investor may not invest directly into the Index.
| Annual Report | April 30, 2020 | 19 |
| Emerald Banking and Finance Fund | Manager Commentary |
April 30, 2020 (Unaudited)
TOP TEN HOLDINGS
(as a % of Net Assets)* | | | |
| | | | |
| Esquire Financial Holdings, Inc. | | | 4.19 | % |
| Triumph Bancorp, Inc. | | | 4.17 | % |
| Bancorp, Inc. | | | 3.91 | % |
| Bank7 Corp. | | | 3.60 | % |
| ServisFirst Bancshares, Inc. | | | 3.45 | % |
| Meta Financial Group, Inc. | | | 3.32 | % |
| Cannae Holdings, Inc. | | | 3.28 | % |
| Silvergate Capital Corp. | | | 2.56 | % |
| ECN Capital Corp. | | | 2.53 | % |
| TriState Capital Holdings, Inc. | | | 2.49 | % |
| Top Ten Holdings | | | 33.50 | % |
INDUSTRY SECTOR ALLOCATION (as a % of Net Assets) | | | |
| | | | |
| Banks: Diversified | | | 48.87 | % |
| Consumer Lending | | | 6.13 | % |
| Commercial Finance & Mortgage Companies | | | 5.87 | % |
| Diversified Financial Services | | | 5.68 | % |
| Banks: Savings, Thrift & Mortgage Lending | | | 5.18 | % |
| Insurance: Property-Casualty | | | 5.10 | % |
| Asset Management & Custodian | | | 3.13 | % |
| Mortgage Reit - Diversified | | | 2.43 | % |
| Equity REIT: Industrial | | | 2.26 | % |
| Equity REIT: Residential | | | 1.90 | % |
| Mortgage Reit - Residential | | | 1.96 | % |
| Equity REIT: Office | | | 1.53 | % |
| Computer Services Software & Systems | | | 1.47 | % |
| Insurance: Multi-Line | | | 1.43 | % |
| Securities Brokerage & Services | | | 1.08 | % |
| Equity Reit - Diversified | | | 0.76 | % |
| Back Office Support, Hr, And Consulting | | | 0.64 | % |
| Real Estate Services | | | 0.51 | % |
| Equity Reit - Health Care | | | 0.29 | % |
| Financial Data & Systems | | | 0.28 | % |
| Commercial Banks | | | 0.26 | % |
| Communications Technology | | | 0.24 | % |
| Cash, Cash Equivalents, & Other Net Assets | | | 3.00 | % |
| Total | | | 100.00 | % |
| * | Holdings are subject to change, and may not reflect the current or future position of the portfolio. |
ANNUALIZED TOTAL RETURN (for the period ended April 30, 2020)
| | | | | | | Since | Expense Ratio |
| | 6 Month | 1 Year | 3 Year | 5 Year | 10 Year | Inception(1) | Gross(2) | Net(2) |
| Class A (NAV) | -30.38% | -30.02% | -10.79% | 0.48% | 6.51% | 6.66% | 1.42% | 1.42% |
| Class A (MOP) | -33.69% | -33.34% | -12.22% | -0.49% | 6.00% | 6.44% | 1.42% | 1.42% |
| Russell 2000® Index(3) | -15.47% | -16.39% | -0.82% | 2.88% | 7.69% | 7.02% | | |
| Russell 2000® Financial Services Index(4) | -26.42% | -24.25% | -5.82% | 1.87% | 6.61% | 6.90% | | |
| Class C (NAV) | -30.56% | -30.46% | -11.35% | -0.16% | 5.84% | 6.31% | 2.07% | 2.07% |
| Class C (CDSC) | -31.26% | -31.16% | -11.35% | -0.16% | 5.84% | 6.31% | 2.07% | 2.07% |
| Russell 2000® Index(3) | -15.47% | -16.39% | -0.82% | 2.88% | 7.69% | 7.02% | | |
| Russell 2000® Financial Services Index(4) | -26.42% | -24.25% | -5.82% | 1.87% | 6.61% | 6.90% | | |
| Investor Class | -30.38% | -30.04% | -10.76% | 0.49% | 6.05% | 6.59% | 1.47% | 1.47% |
| Russell 2000® Index(3) | -15.47% | -16.39% | -0.82% | 2.88% | 7.69% | 7.02% | | |
| Russell 2000® Financial Services Index(4) | -26.42% | -24.25% | -5.82% | 1.87% | 6.61% | 6.90% | | |
| Institutional Class | -30.22% | -29.76% | -10.46% | 0.82% | – | 7.53% | 1.12% | 1.12% |
| Russell 2000® Index(3) | -15.47% | -16.39% | -0.82% | 2.88% | 7.69% | 7.02% | | |
| Russell 2000® Financial Services Index(4) | -26.42% | -24.25% | -5.82% | 1.87% | 6.61% | 6.90% | | |
The performance quoted represents past performance, does not guarantee future results and current performance may be lower or higher than the data quoted. The investment return and principal value of an investment will fluctuate so that shares, when redeemed, may be worth more or less than their original cost. Performance data current to the most recent month end may be obtained at www.emeraldmutualfunds.com.
Performance shown for periods prior to March 16, 2012, reflects the performance of the Forward Banking & Finance Fund, a series of Forward Funds (as a result of a reorganization of the Forward Banking & Finance Fund into the Emerald Banking & Finance Fund).
Returns for periods less than 1 year are cumulative.
The table does not reflect the deduction of taxes that a shareholder would pay on Fund distributions or the redemption of Fund shares.
Subject to investment risks, including possible loss of the principal amount invested.
Maximum Offering Price (MOP) for Class A shares includes the Fund's maximum sales charge of 4.75%. Performance shown at NAV does not include these sales charges and would have been lower had it been taken into account.
A Contingent Deferred Sales Charge (CDSC) of 1.00% may apply to Class C shares redeemed within the first 12 months after a purchase.
| (1) | Inception Dates - Class A: 02/18/1997, Class C: 07/01/2000, Institutional Class: 03/19/2012, Investor Class: 03/16/2010 |
| (2) | Emerald Mutual Fund Advisers Trust ("Emerald" or the "Adviser") has agreed contractually to waive a portion of its fees and reimburse other expenses until August 31, 2020 in amounts necessary to limit the Fund's operating expenses (exclusive of Acquired Fund Fees and Expenses, brokerage expenses, interest expenses, taxes and extraordinary expense) for Class A, Class C, Institutional Class, and Investor Class shares to an annual rate (as percentage of the Fund's average daily net assets) of 1.84%, 2.49%, 1.54% and 1.89% respectively. The Adviser will be permitted to recover, on a class-by-class basis, expenses it has borne through the agreement described above to the extent that the Fund's expenses in later periods fall below the annual rates |
| 20 | www.emeraldmutualfunds.com |
| Emerald Banking and Finance Fund | Manager Commentary |
April 30, 2020 (Unaudited)
set forth in the relevant agreement. The Fund will not be obligated to pay any such deferred fees and expenses more than three years after the year(s) in which the fees and expense were incurred. The Adviser may not discontinue this waiver prior to August 31, 2020, without the approval by the Fund's Board of Trustees. Ratios as of the Prospectus dated August 31, 2019 and may differ from the ratios presented in the Financial Highlights.
| (3) | The Russell 2000® Index measures the performance of the small-cap segment of the U.S. equity universe. The Russell 2000® is a subset of the Russell 3000® Index representing approximately 8% of the total market capitalization of that index. It includes approximately 2000 of the smallest securities based on a combination of their market cap and current index membership. The index is not actively managed and does not reflect any deductions for fees, expenses or taxes. An investor may not invest directly into an index. |
| (4) | The Russell 2000® Financial Services Index is an additional index, and is comprised of the smallest financial services companies in the Russell 3000 Index. The Index is not actively managed and does not reflect any deductions for fees, expense, or taxes. An investor may not invest directly in the Index. |
Important Risks
A fund that concentrates in a particular industry will involve a greater degree of risk than a fund with a more diversified portfolio. Investing in smaller companies generally will present greater investment risks, including: greater price volatility, greater sensitivity to changing economic conditions and less liquidity than the securities of larger, more mature companies.
| Annual Report | April 30, 2020 | 21 |
| Emerald Banking and Finance Fund | Manager Commentary |
April 30, 2020 (Unaudited)
GROWTH OF $10,000 INVESTMENT IN THE FUND (for the period ended April 30, 2020)
Comparison of change in value of a $10,000 investment (includes applicable sales loads)
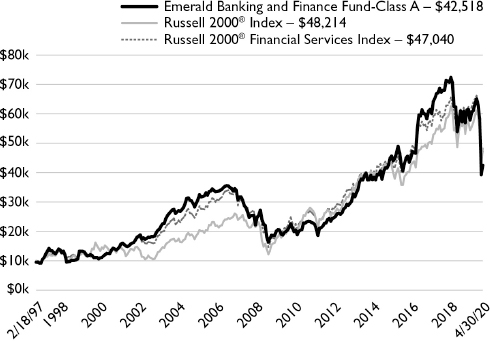
The chart represents historical performance of a hypothetical investment of $10,000 in the Fund since inception. Past performance does not guarantee future results. This chart does not reflect the deduction of taxes that a shareholder would pay on Fund distributions or the redemption of Fund shares.
Investing in the Fund is subject to investment risks, including possible loss of the principal amount invested.
| 22 | www.emeraldmutualfunds.com |
| Emerald Select trueLiberty Income Fund | Manager Commentary |
April 30, 2020 (Unaudited)
April 30, 2020
Dear Shareholder:
Investment Results
During the first four months since inception on January 2, 2020, to April 30, 2020, the Emerald Select trueLiberty Income Fund (the "Fund") delivered a NAV total return of -41.30%. This compares to the Fund’s Index, the Alerian MLP Infrastructure Total Return Index (AMZIX), which was down -38.88% on a total return basis. The difference in performance between the Fund (ESTCX) and the AMZI is primarily attributable to the Fund’s operating expenses, and the timing of large investor cash flows on days when the market experienced significant moves.
During the period, the Fund paid no distributions. The next scheduled distribution has a record date of July 28, 2020.
Investment Analysis
As many of you are aware, gaining meaningful and efficient exposure to MLPs through 1940-Act Funds has been a difficult, longstanding challenge for investors. Many funds are structured as C-corporations, subjecting investors to fund-level corporate tax. Other funds cap their MLP exposure to less than 25% to retain their statuses as Regulated Investment Companies (RIC). The Emerald Select trueLiberty Income Fund began operations on January 2, 2020, with the goal of solving many of these longstanding challenges. Specifically, the Fund employs an innovative strategy that seeks to provide broad exposure to MLP markets, while intending to comply with RIC-related requirements to retain its pass-through tax status.
When we launched the Fund in January, we could not have anticipated the tumultuous and turbulent conditions that the Russia-Saudi price war and COVID-19 coronavirus and associated responses would soon leash on financial markets. However, we are pleased by the degree to which the Fund has thus far executed its mission despite these most challenging of market environments.
From January to April, two MLPs were added to the AMZIX index and the Fund, CNX Midstream Partners LP (CNXM) and Holly Energy Partners LP (HEP), as they met Alerian’s constituent criteria for inclusion. In addition, Tallgrass Energy LP (TGE) was removed from the AMZIX and the Fund, as it was acquired by a consortium led by Blackstone Infrastructure Partners.
The MLP market, represented by AMZIX, experienced a record single day decline in March, and unprecedented daily volatility. By the end of April 2020, the 36-month annualized monthly volatility on the AMZIX index stood at nearly 44%, approximately triple that of the S&P 500 index, and well above its historical range of 10% to 20% observed since the late 1990’s. Dramatic declines in the price of oil partly drove the volatility, with WTI crude trading in the low $60/pb at the end of 2019, to the low-to-mid teens at points during the period, with the near-dated futures contract trading in negative price territory during the second half of April, as in part oil supply significantly outpaced plummeting demand, while storage capacity became scarce. Oil market moves were partly due to the Russian-Saudi Arabia oil price war that began in March, triggered by Russia, an “OPEC+” member, refusing to reduce oil production at the request of OPEC to help maintain market prices. Oil came under additional extreme pressure from the economic contraction resulting from quarantines instituted to address the global COVID-19 pandemic. Additional downward pressure on MLPs in March came from energy sector and income-oriented closed-end funds forced to reduce leverage by selling their liquid holdings, often including MLPs. As selling pressure abated and oil markets began to stabilize through April, the MLP market, as measured by the AMZIX, hit a low for this period on March 18th and rose by over 85% from this low through April month-end.
Throughout the record-breaking market conditions, the Fund’s investment infrastructure operated smoothly and as expected. The Fund maintained a good fit with the daily Index returns, with an r-squared of daily NAV returns with the AMZIX index of over 0.99 over the first 4 months of operation. On a look-through basis, (accounting for the Fund’s total return swap on the AMZIX) the Fund’s portfolio characteristic were likewise generally in line with the AMZIX during this period, in terms of yield, market capitalization and company composition.
Market Outlook
Even with strong performance since the March low, as of the end of April 2020, MLPs presented an intriguing overall picture with relatively and comparatively low valuations (measured on an enterprise value to EBITDA basis), higher yields and stronger expected free-cash flow versus the S&P 500, and other “yield oriented” sectors like Utilities and REITs. The fee and contract nature of their businesses somewhat insulates MLPs from the vicissitudes of energy commodity prices, we recently published work looking at the correlation of MLPs and oil prices over time, but the demand for energy remains a critical driver, along with the health and viability of their customers, primarily oil and gas drilling and production companies. So far the signs are constructive as companies show good capital discipline, energy supply is curtailed and constrained to match or undershoot expected demand, and the economy shows very early signs of recovery.
| Annual Report | April 30, 2020 | 23 |
| Emerald Select trueLiberty Income Fund | Manager Commentary |
April 30, 2020 (Unaudited)
The Emerald Mutual Funds adviser, Emerald Mutual Fund Advisers Trust, instituted its Pandemic Policy protocols on February 27, 2020 (copy available upon request). There is no current impact to the delivery of investment advisory services to our clients, nor to our ability to manage and support these activities. Emerald has validated full capacity for its staff to work remotely. Key senior staff have conducted comprehensive reviews of the status of the Company’s portfolio management, operations, compliance and client services functions on March 25th, April 3rd and April 22nd to review any potential issues and confirmed the uninterrupted delivery of all functions and services. We are confident of our ongoing ability to function at these high levels of service in the coming months. Most importantly, all of us at Emerald and Liberty Cove extend our heartfelt thanks to all of our nation’s first responders, healthcare professionals and front-line essential workers, and express our care and concern to everyone effected by both the health- and economic-related devastation of COVID-19.
| Brian Chen, PhD | Mathew Jensen, CFA |
| Principal and Portfolio Manager, Liberty Cove, LLC | Portfolio Manager, Liberty Cove, LLC |
| 24 | www.emeraldmutualfunds.com |
| Emerald Select trueLiberty Income Fund | Manager Commentary |
April 30, 2020 (Unaudited)
Past performance does not guarantee future results. Fund prices fluctuate as the underlying assets have exposure to market fluctuations and other risks, as described in the Fund’s prospectus. Please visit www.emeraldmutualfunds.com to obtain current performance information and for the current prospectus and statement of additional information. This material must be preceded or accompanied by a prospectus. Please read the prospectus carefully before investing.
The views of Emerald Mutual Fund Advisers Trust and information discussed in this commentary are as of the date of publication, are subject to change, and may not reflect the writer's current views. The views expressed are those of the author only, and represent an assessment of market conditions at a specific point in time, are opinions only and should not be relied upon as investment advice regarding a particular investment or markets in general. Such information does not constitute a recommendation to buy or sell specific securities or investment vehicles. It should not be assumed that any investment will be profitable or will equal the performance of the Fund or any securities or any sectors mentioned in this letter. The subject matter contained in this letter has been derived from several sources believed to be reliable and accurate at the time of compilation. Neither Emerald Mutual Fund Advisers Trust nor the Fund accepts any liability for losses either direct or consequential caused by the use of this information.
The Emerald Select trueLiberty Fund is distributed by ALPS Distributors, Inc.
The Fund is subject to investment risks, including possible loss of the principal amount invested and therefore is not suitable for all investors. The Fund may not achieve its objectives.
Diversification does not eliminate the risk of experiencing investment losses.
| Annual Report | April 30, 2020 | 25 |
| Emerald Select trueLiberty Income Fund | Manager Commentary |
April 30, 2020 (Unaudited)
TOP TEN HOLDINGS
(as a % of Net Assets)* | | | |
| | | | |
| Alerian MLP Infrastructure | | | 73.16 | % |
| MPLX LP | | | 2.13 | % |
| Energy Transfer LP | | | 1.81 | % |
| Magellan Midstream Partners LP | | | 1.80 | % |
| Enterprise Products Partners LP | | | 1.80 | % |
| Plains All American Pipeline LP | | | 1.54 | % |
| Phillips 66 Partners LP | | | 1.54 | % |
| Shell Midstream Partners LP | | | 0.91 | % |
| TC PipeLines LP | | | 0.91 | % |
| Western Midstream Partners LP | | | 0.88 | % |
| Top Ten Holdings | | | 86.48 | % |
INDUSTRY SECTOR ALLOCATION
(as a % of Net Assets) | | | |
| | | | |
| Energy | | | 17.94 | % |
| Cash, Cash Equivalents, & Other Net Assets | | | 82.06 | % |
| Total | | | 100.00 | % |
| * | Holdings are subject to change, and may not reflect the current or future position of the portfolio. |
ANNUALIZED TOTAL RETURN (for the period ended April 30, 2020)
| | | Since | Expense Ratio |
| | 1 Month | Inception(1) | Gross(2) | Net(2) |
| Class A (NAV) | 47.12% | -41.30% | 1.75% | 1.10% |
| Class A (MOP) | 40.10% | -44.10% | 1.75% | 1.10% |
| Alerian MLP Infrastructure Total Return Index(3) | 47.56% | -38.88% | | |
| Institutional Class | 47.12% | -41.30% | 1.45% | 0.80% |
| Alerian MLP Infrastructure Total Return Index(3) | 47.56% | -38.88% | | |
The performance quoted represents past performance, does not guarantee future results and current performance may be lower or higher than the data quoted. The investment return and principal value of an investment will fluctuate so that shares, when redeemed, may be worth more or less than their original cost. Performance data current to the most recent month end may be obtained at www.emeraldmutualfunds.com.
Returns for periods less than 1 year are cumulative.
The table does not reflect the deduction of taxes that a shareholder would pay on Fund distributions or the redemption of Fund shares.
Subject to investment risks, including possible loss of the principal amount invested.
Maximum Offering Price (MOP) for Class A shares includes the Fund's maximum sales charge of 4.75%. Performance shown at NAV does not include these sales charges and would have been lower had it been taken into account.
| (1) | Inception Date - 01/02/2020 |
| (2) | Emerald Mutual Fund Advisers Trust ("Emerald" or the "Adviser") has agreed contractually to waive a portion of its fees and reimburse other expenses until August 31, 2021 in amounts necessary to limit the Fund's operating expenses (exclusive of Acquired Fund Fees and Expenses, brokerage expenses, interest expenses, taxes and extraordinary expense) for Class A and Institutional Class shares to an annual rate (as percentage of the Fund's average daily net assets) of 0.76% and 1.06%, respectively. The Adviser will be permitted to recover, on a class-by-class basis, expenses it has borne through the agreement described above to the extent that the Fund's expenses in later periods fall below the annual rates set forth in the relevant agreement. The Fund will not be obligated to pay any such deferred fees and expenses more than three years after the year(s) in which the fees and expense were incurred. The Adviser may not discontinue this waiver prior to August 31, 2021, without the approval by the Fund's Board of Trustees. |
| (3) | The Alerian MLP Infrastructure Total Return Index is a composite of energy infrastructure Master Limited Partnerships (MLPs). The capped, float-adjusted, capitalization-weighted index, whose constituents earn the majority of their cash flow from midstream activities involving energy commodities, is disseminated real-time on a price-return basis (AMZI) and on a total-return basis (AMZIX). The index is not actively managed and does not reflect any deductions for fees, expenses or taxes. An investor may not invest directly into an index. |
Important Risks
A fund that concentrates in a particular industry will involve a greater degree of risk than a fund with a more diversified portfolio. Investing in smaller companies generally will present greater investment risks, including: greater price volatility, greater sensitivity to changing economic conditions and less liquidity than the securities of larger, more mature companies.
| 26 | www.emeraldmutualfunds.com |
| Emerald Select trueLiberty Income Fund | Manager Commentary |
April 30, 2020 (Unaudited)
GROWTH OF $10,000 INVESTMENT IN THE FUND (for the period ended April 30, 2020)
Comparison of change in value of a $10,000 investment (includes applicable sales loads)
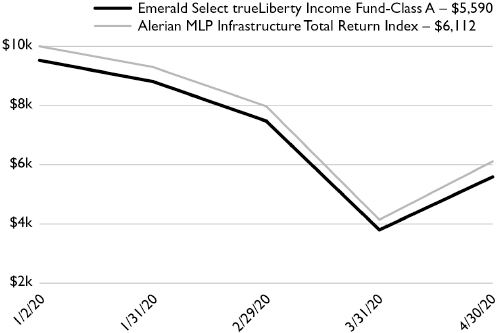
The chart represents historical performance of a hypothetical investment of $10,000 in the Fund since inception. Past performance does not guarantee future results. This chart does not reflect the deduction of taxes that a shareholder would pay on Fund distributions or the redemption of Fund shares.
Investing in the Fund is subject to investment risks, including possible loss of the principal amount invested.
| Annual Report | April 30, 2020 | 27 |
| Emerald Funds | Disclosure of Fund Expenses |
April 30, 2020 (Unaudited)
As a shareholder of the Funds, you incur two types of costs: (1) transaction costs, including applicable sales charges (loads); and (2) ongoing costs, including management fees, distribution and service (12b-1) fees, shareholder services fees and other Fund expenses. This example is intended to help you understand your ongoing costs (in dollars) of investing in the Funds and to compare these costs with the ongoing costs of investing in other mutual funds. The example is based on an investment of $1,000 invested at the beginning of the (six-month) period and held for the entire period November 1, 2019 through April 30, 2020.
Actual Expenses
The first line for each share class of the Fund in the table below provides information about actual account values and actual expenses. You may use this information, together with the amount you invested, to estimate the expenses that you paid over the period. Simply divide your account value by $1,000 (for example, an $8,600 account value divided by $1,000 = 8.6), then multiply the result by the number in the applicable line under the heading titled “Expenses Paid During Period” to estimate the expenses you paid on your account during this period.
Hypothetical Example For Comparison Purposes
The second line for each share class of each Fund in the table below provides information about hypothetical account values and hypothetical expenses based on the Fund’s actual expense ratio and an assumed rate of return of 5% per year before expenses, which is not the Fund’s actual return. The hypothetical account values and expenses may not be used to estimate the actual ending account balance or expenses you paid for the period. You may use this information to compare the ongoing costs of investing in the Funds and other funds. To do so, compare this 5% hypothetical example with the 5% hypothetical examples that appear in the shareholder reports of other mutual funds.
Please note that the expenses shown in the table below are meant to highlight your ongoing costs only and do not reflect any transactional costs, such as sales charges (loads), redemption fees or exchange fees. Therefore, the second line for each share class of the Fund within the table is useful in comparing ongoing costs only, and will not help you determine the relative total costs of owning different funds. If these transactional costs were included, your costs would have been higher.
| | | Beginning Account Value 11/01/19 | | | Ending Account Value 04/30/20 | | | Expense Ratio(a) | | | Expense Paid During Period 11/01/19 - 4/30/20(b) | |
| Emerald Growth Fund | | | | | | | | | | | | |
| Class A | | | | | | | | | | | | | | | | |
| Actual | | $ | 1,000.00 | | | $ | 939.70 | | | | 1.02 | % | | $ | 4.92 | |
| Hypothetical (5% return before expenses) | | $ | 1,000.00 | | | $ | 1,019.79 | | | | 1.02 | % | | $ | 5.12 | |
| Class C | | | | | | | | | | | | | | | | |
| Actual | | $ | 1,000.00 | | | $ | 937.30 | | | | 1.68 | % | | $ | 8.09 | |
| Hypothetical (5% return before expenses) | | $ | 1,000.00 | | | $ | 1,016.51 | | | | 1.68 | % | | $ | 8.42 | |
| Institutional Class | | | | | | | | | | | | | | | | |
| Actual | | $ | 1,000.00 | | | $ | 941.30 | | | | 0.70 | % | | $ | 3.38 | |
| Hypothetical (5% return before expenses) | | $ | 1,000.00 | | | $ | 1,021.38 | | | | 0.70 | % | | $ | 3.52 | |
| Investor Class | | | | | | | | | | | | | | | | |
| Actual | | $ | 1,000.00 | | | $ | 939.80 | | | | 1.06 | % | | $ | 5.11 | |
| Hypothetical (5% return before expenses) | | $ | 1,000.00 | | | $ | 1,019.59 | | | | 1.06 | % | | $ | 5.32 | |
| Emerald Small Cap Value Fund | | | | | | | | | | | | | | | | |
| Class A | | | | | | | | | | | | | | | | |
| Actual | | $ | 1,000.00 | | | $ | 704.70 | | | | 1.35 | % | | $ | 5.72 | |
| Hypothetical (5% return before expenses) | | $ | 1,000.00 | | | $ | 1,018.15 | | | | 1.35 | % | | $ | 6.77 | |
| Class C | | | | | | | | | | | | | | | | |
| Actual | | $ | 1,000.00 | | | $ | 702.40 | | | | 2.00 | % | | $ | 8.47 | |
| Hypothetical (5% return before expenses) | | $ | 1,000.00 | | | $ | 1,014.92 | | | | 2.00 | % | | $ | 10.02 | |
| Institutional Class | | | | | | | | | | | | | | | | |
| Actual | | $ | 1,000.00 | | | $ | 705.50 | | | | 1.00 | % | | $ | 4.24 | |
| Hypothetical (5% return before expenses) | | $ | 1,000.00 | | | $ | 1,019.89 | | | | 1.00 | % | | $ | 5.02 | |
| Investor Class | | | | | | | | | | | | | | | | |
| Actual | | $ | 1,000.00 | | | $ | 706.30 | | | | 1.25 | % | | $ | 5.30 | |
| Hypothetical (5% return before expenses) | | $ | 1,000.00 | | | $ | 1,018.65 | | | | 1.25 | % | | $ | 6.27 | |
| 28 | www.emeraldmutualfunds.com |
| Emerald Funds | Disclosure of Fund Expenses |
April 30, 2020 (Unaudited)
| | | Beginning Account Value 11/01/19 | | | Ending Account Value 04/30/20 | | | Expense Ratio(a) | | | Expense Paid During Period 11/01/19 - 4/30/20(b) | |
| Emerald Insights Fund | | | | | | | | | | | | |
| Class A | | | | | | | | | | | | |
| Actual | | $ | 1,000.00 | | | $ | 1,051.50 | | | | 1.35 | % | | $ | 6.89 | |
| Hypothetical (5% return before expenses) | | $ | 1,000.00 | | | $ | 1,018.15 | | | | 1.35 | % | | $ | 6.77 | |
| Class C | | | | | | | | | | | | | | | | |
| Actual | | $ | 1,000.00 | | | $ | 1,048.40 | | | | 2.00 | % | | $ | 10.19 | |
| Hypothetical (5% return before expenses) | | $ | 1,000.00 | | | $ | 1,014.92 | | | | 2.00 | % | | $ | 10.02 | |
| Institutional Class | | | | | | | | | | | | | | | | |
| Actual | | $ | 1,000.00 | | | $ | 1,054.00 | | | | 1.05 | % | | $ | 5.36 | |
| Hypothetical (5% return before expenses) | | $ | 1,000.00 | | | $ | 1,019.64 | | | | 1.05 | % | | $ | 5.27 | |
| Investor Class | | | | | | | | | | | | | | | | |
| Actual | | $ | 1,000.00 | | | $ | 1,050.90 | | | | 1.40 | % | | $ | 7.14 | |
| Hypothetical (5% return before expenses) | | $ | 1,000.00 | | | $ | 1,017.90 | | | | 1.40 | % | | $ | 7.02 | |
| | | | | | | | | | | | | | | | | |
| Emerald Banking and Finance Fund | | | | | | | | | | | | | | | | |
| Class A | | | | | | | | | | | | | | | | |
| Actual | | $ | 1,000.00 | | | $ | 696.20 | | | | 1.48 | % | | $ | 6.24 | |
| Hypothetical (5% return before expenses) | | $ | 1,000.00 | | | $ | 1,017.50 | | | | 1.48 | % | | $ | 7.42 | |
| Class C | | | | | | | | | | | | | | | | |
| Actual | | $ | 1,000.00 | | | $ | 694.40 | | | | 2.13 | % | | $ | 8.97 | |
| Hypothetical (5% return before expenses) | | $ | 1,000.00 | | | $ | 1,014.27 | | | | 2.13 | % | | $ | 10.67 | |
| Institutional Class | | | | | | | | | | | | | | | | |
| Actual | | $ | 1,000.00 | | | $ | 697.80 | | | | 1.12 | % | | $ | 4.73 | |
| Hypothetical (5% return before expenses) | | $ | 1,000.00 | | | $ | 1,019.29 | | | | 1.12 | % | | $ | 5.62 | |
| Investor Class | | | | | | | | | | | | | | | | |
| Actual | | $ | 1,000.00 | | | $ | 696.20 | | | | 1.51 | % | | $ | 6.37 | |
| Hypothetical (5% return before expenses) | | $ | 1,000.00 | | | $ | 1,017.35 | | | | 1.51 | % | | $ | 7.57 | |
| | | | | | | | | | | | | | | | | |
| Emerald Select trueLiberty Income Fund(c) | | | | | | | | | | | | | | | | |
| Class A | | | | | | | | | | | | | | | | |
| Actual | | $ | 1,000.00 | | | $ | 587.00 | | | | 1.06 | % | | $ | 2.73 | |
| Hypothetical (5% return before expenses) | | $ | 1,000.00 | | | $ | 1,019.59 | | | | 1.06 | % | | $ | 5.32 | |
| Institutional Class | | | | | | | | | | | | | | | | |
| Actual | | $ | 1,000.00 | | | $ | 587.00 | | | | 0.76 | % | | $ | 1.96 | |
| Hypothetical (5% return before expenses) | | $ | 1,000.00 | | | $ | 1,021.08 | | | | 0.76 | % | | $ | 3.82 | |
| (a) | The Fund's expense ratios have been based on the Fund's most recent fiscal half-year expenses. |
| (b) | Expenses are equal to the Fund's annualized expense ratio multiplied by the average account value over the period, multiplied by the number of days in the most recent fiscal half-year (182)/366 (to reflect the half-year period). |
| (c) | For the period from January 2, 2020 (Fund Inception) to April 30, 2020. |
| Annual Report | April 30, 2020 | 29 |
| Emerald Growth Fund | Schedule of Investments |
April 30, 2020
| Shares | | | | | Value (Note 2) | |
| COMMON STOCKS: 98.14% | |
| Consumer Discretionary: 11.82% | |
| | 814,366 | | | Chegg, Inc.(a) | | $ | 34,814,146 | |
| | 90,196 | | | Children's Place, Inc. | | | 2,666,194 | |
| | 179,706 | | | Churchill Downs, Inc. | | | 18,010,135 | |
| | 202,299 | | | Chuy's Holdings, Inc.(a) | | | 3,390,531 | |
| | 108,824 | | | Five Below, Inc.(a) | | | 9,811,572 | |
| | 160,362 | | | Jack in the Box, Inc. | | | 9,669,829 | |
| | 236,647 | | | Meritage Homes Corp.(a) | | | 12,438,166 | |
| | 235,125 | | | National Vision Holdings, Inc.(a) | | | 6,230,813 | |
| | 576,604 | | | Noodles & Co.(a) | | | 3,603,775 | |
| | 254,701 | | | Planet Fitness, Inc., Class A(a) | | | 15,366,111 | |
| | 353,420 | | | Taylor Morrison Home Corp., Class A(a) | | | 5,142,261 | |
| | 380,574 | | | Tilly's, Inc., Class A | | | 2,241,581 | |
| | 224,096 | | | YETI Holdings, Inc.(a) | | | 6,187,291 | |
| | | | | | | | 129,572,405 | |
| | | | | | | | | |
| Consumer Staples: 7.45% | | |
| | 945,701 | | | BellRing Brands, Inc., Class A(a) | | | 16,578,138 | |
| | 29,184 | | | Boston Beer Co., Inc., Class A(a) | | | 13,614,628 | |
| | 433,487 | | | Freshpet, Inc.(a) | | | 32,689,255 | |
| | 994,796 | | | Simply Good Foods Co.(a) | | | 18,751,904 | |
| | | | | | | | 81,633,925 | |
| | | | | | | | | |
| Energy: 0.84% | | |
| | 105,372 | | | Arcosa, Inc. | | | 3,927,214 | |
| | 406,786 | | | New Fortress Energy LLC(a) | | | 5,259,743 | |
| | | | | | | | 9,186,957 | |
| | | | | | | | | |
| Financial Services: 10.56% | | |
| | 57,203 | | | Agree Realty Corp. | | | 3,724,487 | |
| | 81,282 | | | Axos Financial, Inc.(a) | | | 1,873,550 | |
| | 491,961 | | | BRP Group, Inc., Class A(a) | | | 4,929,449 | |
| | 81,892 | | | Bryn Mawr Bank Corp. | | | 2,384,286 | |
| | 70,000 | | | Cannae Holdings, Inc.(a) | | | 2,208,500 | |
| | 55,159 | | | CNB Financial Corp. | | | 978,521 | |
| | 533,252 | | | CrossFirst Bankshares, Inc.(a) | | | 5,156,547 | |
| | 81,622 | | | eHealth, Inc.(a) | | | 8,709,067 | |
| | 1,058,460 | | | Everi Holdings, Inc.(a) | | | 5,239,377 | |
| | 122,502 | | | First Choice Bancorp | | | 1,864,480 | |
| | 34,211 | | | LendingTree, Inc.(a) | | | 8,531,197 | |
| | 331,357 | | | Moelis & Co., Class A | | | 9,897,634 | |
| | 444,500 | | | OceanFirst Financial Corp. | | | 7,489,825 | |
| | 551,871 | | | Pacific Premier Bancorp, Inc. | | | 11,782,446 | |
| | 261,565 | | | Palomar Holdings, Inc.(a) | | | 15,301,552 | |
| | 208,263 | | | Pinnacle Financial Partners, Inc. | | | 8,382,586 | |
| | 216,944 | | | QTS Realty Trust, Inc., REIT, Class A | | | 13,565,508 | |
| | 142,191 | | | STAG Industrial, Inc. | | | 3,732,514 | |
| | | | | | | | 115,751,526 | |
| | | | | | | | | |
| Health Care: 31.42% | | |
| | 358,154 | | | Adamas Pharmaceuticals, Inc.(a) | | | 1,156,837 | |
| | 127,224 | | | Addus HomeCare Corp.(a) | | | 10,307,688 | |
| Shares | | | | | Value (Note 2) | |
| Health Care (continued) | | | |
| | 299,691 | | | Aimmune Therapeutics, Inc.(a) | | $ | 5,130,710 | |
| | 169,094 | | | Applied Therapeutics, Inc.(a) | | | 6,045,111 | |
| | 167,240 | | | Assembly Biosciences, Inc.(a) | | | 2,928,372 | |
| | 269,960 | | | AtriCure, Inc.(a) | | | 11,640,675 | |
| | 448,316 | | | Avrobio, Inc.(a) | | | 5,769,827 | |
| | 1,178,244 | | | BioDelivery Sciences International, Inc.(a) | | | 5,372,793 | |
| | 341,723 | | | Biohaven Pharmaceutical Holding Co., Ltd.(a) | | | 16,095,153 | |
| | 62,997 | | | Black Diamond Therapeutics, Inc.(a) | | | 2,333,409 | |
| | 227,113 | | | Blueprint Medicines Corp.(a) | | | 13,361,058 | |
| | 220,987 | | | ChemoCentryx, Inc.(a) | | | 11,714,521 | |
| | 322,722 | | | Collegium Pharmaceutical, Inc.(a) | | | 6,673,891 | |
| | 101,804 | | | Deciphera Pharmaceuticals, Inc.(a) | | | 5,902,596 | |
| | 264,761 | | | Dicerna Pharmaceuticals, Inc.(a) | | | 5,215,792 | |
| | 925,000 | | | Exicure, Inc.(a) | | | 1,951,750 | |
| | 120,667 | | | Haemonetics Corp.(a) | | | 13,729,491 | |
| | 725,347 | | | Horizon Therapeutics PLC(a) | | | 26,141,506 | |
| | 170,520 | | | Immunomedics, Inc.(a) | | | 5,180,398 | |
| | 216,038 | | | Integer Holdings Corp.(a) | | | 16,086,189 | |
| | 508,178 | | | Karyopharm Therapeutics, Inc.(a) | | | 11,205,325 | |
| | 123,030 | | | LivaNova PLC(a) | | | 6,535,354 | |
| | 103,303 | | | Merit Medical Systems, Inc.(a) | | | 4,216,828 | |
| | 130,748 | | | Mirati Therapeutics, Inc.(a) | | | 11,118,810 | |
| | 70,000 | | | Misonix, Inc.(a) | | | 881,300 | |
| | 799,013 | | | NeoGenomics, Inc.(a) | | | 21,845,015 | |
| | 2,035,891 | | | Oncocyte Corp.(a) | | | 5,496,906 | |
| | 104,308 | | | ORIC Pharmaceuticals, Inc.(a) | | | 2,758,947 | |
| | 69,615 | | | Oyster Point Pharma, Inc.(a) | | | 2,046,681 | |
| | 202,300 | | | Passage Bio, Inc.(a) | | | 3,348,065 | |
| | 427,963 | | | Radius Health, Inc.(a) | | | 6,714,739 | |
| | 62,446 | | | Reata Pharmaceuticals, Inc., Class A(a) | | | 9,876,459 | |
| | 468,203 | | | Replimune Group, Inc.(a) | | | 8,469,792 | |
| | 140,850 | | | SeaSpine Holdings Corp.(a) | | | 1,450,755 | |
| | 222,828 | | | Tabula Rasa HealthCare, Inc.(a) | | | 14,113,926 | |
| | 104,953 | | | Tandem Diabetes Care, Inc.(a) | | | 8,373,150 | |
| | 43,643 | | | Teladoc Health, Inc.(a) | | | 7,183,201 | |
| | 258,345 | | | TransMedics Group, Inc.(a) | | | 4,673,461 | |
| | 75,973 | | | Turning Point Therapeutics, Inc.(a) | | | 3,913,369 | |
| | 278,380 | | | Twist Bioscience Corp.(a) | | | 9,105,810 | |
| | 104,476 | | | United Therapeutics Corp.(a) | | | 11,446,391 | |
| | 210,150 | | | Varex Imaging Corp.(a) | | | 5,491,220 | |
| | 169,419 | | | Vericel Corp.(a) | | | 2,456,576 | |
| | 318,686 | | | Zogenix, Inc.(a) | | | 8,996,506 | |
| | | | | | | | 344,456,353 | |
| | | | | | | | | |
| Materials & Processing: 2.80% | | |
| | 42,688 | | | Installed Building Products, Inc.(a) | | | 2,104,945 | |
| | 427,795 | | | PQ Group Holdings, Inc.(a) | | | 5,013,758 | |
| | 248,169 | | | Trex Co., Inc.(a) | | | 23,630,652 | |
| | | | | | | | 30,749,355 | |
| 30 | www.emeraldmutualfunds.com |
| Emerald Growth Fund | Schedule of Investments |
April 30, 2020
| Shares | | | | | Value (Note 2) | |
| Producer Durables: 9.24% | |
| | 264,926 | | | Aerojet Rocketdyne Holdings, Inc.(a) | | $ | 10,899,056 | |
| | 190,000 | | | Air Transport Services Group, Inc.(a) | | | 3,845,600 | |
| | 24,070 | | | BWX Technologies, Inc. | | | 1,277,154 | |
| | 174,852 | | | Chart Industries, Inc.(a) | | | 6,245,713 | |
| | 89,375 | | | Generac Holdings, Inc.(a) | | | 8,708,700 | |
| | 1,226,616 | | | Kratos Defense & Security Solutions, Inc.(a) | | | 18,423,772 | |
| | 175,290 | | | NV5 Global, Inc.(a) | | | 8,194,808 | |
| | 215,416 | | | Tetra Tech, Inc. | | | 16,216,517 | |
| | 86,811 | | | TopBuild Corp.(a) | | | 8,089,917 | |
| | 210,665 | | | TriNet Group, Inc.(a) | | | 10,316,265 | |
| | 45,330 | | | Vectrus, Inc.(a) | | | 2,357,613 | |
| | 126,487 | | | Vicor Corp.(a) | | | 6,725,314 | |
| | | | | | | | 101,300,429 | |
| | | | | | | | | |
| Technology: 20.89% | | | | | |
| | 87,187 | | | 1Life Healthcare, Inc.(a) | | | 2,150,903 | |
| | 187,500 | | | Alarm.com Holdings, Inc.(a) | | | 8,386,875 | |
| | 251,077 | | | Ciena Corp.(a) | | | 11,612,311 | |
| | 145,044 | | | EverQuote, Inc., Class A(a) | | | 5,652,365 | |
| | 1,827,987 | | | Glu Mobile, Inc.(a) | | | 14,258,298 | |
| | 69,920 | | | Inphi Corp.(a) | | | 6,750,077 | |
| | 21,573 | | | Lumentum Holdings, Inc.(a) | | | 1,745,471 | |
| | 551,483 | | | MACOM Technology Solutions Holdings, Inc.(a) | | | 16,908,469 | |
| | 244,392 | | | Mercury Systems, Inc.(a) | | | 21,789,991 | |
| | 362,060 | | | Model N, Inc.(a) | | | 10,449,052 | |
| | 97,970 | | | New Relic, Inc.(a) | | | 5,260,009 | |
| | 201,044 | | | Onto Innovation, Inc.(a) | | | 6,525,888 | |
| | 168,799 | | | Perficient, Inc.(a) | | | 5,879,269 | |
| | 366,620 | | | PlayAGS, Inc.(a) | | | 1,609,462 | |
| | 779,954 | | | Pluralsight, Inc., Class A(a) | | | 12,822,444 | |
| | 86,567 | | | Proofpoint, Inc.(a) | | | 10,537,801 | |
| | 43,126 | | | Q2 Holdings, Inc.(a) | | | 3,438,005 | |
| | 419,395 | | | Rapid7, Inc.(a) | | | 19,103,442 | |
| | 165,623 | | | Sailpoint Technologies Holdings, Inc.(a) | | | 3,078,931 | |
| | 172,058 | | | Science Applications International Corp. | | | 14,050,256 | |
| | 101,409 | | | Semtech Corp.(a) | | | 4,587,743 | |
| | 656,817 | | | SVMK, Inc.(a) | | | 10,312,027 | |
| | 696,516 | | | USA Technologies, Inc.(a) | | | 5,119,393 | |
| | 229,577 | | | Varonis Systems, Inc.(a) | | | 15,393,138 | |
| | 962,946 | | | Viavi Solutions, Inc.(a) | | | 11,632,388 | |
| | | | | | | | 229,054,008 | |
| | | | | | | | | |
| Utilities: 3.12% | | | | | |
| | 159,162 | | | Boingo Wireless, Inc.(a) | | | 2,218,718 | |
| | 225,926 | | | Cogent Communications Holdings, Inc. | | | 18,939,377 | |
| | 160,697 | | | Shenandoah Telecommunications Co. | | | 8,598,897 | |
| Shares | | | | | Value (Note 2) | |
| Utilities (continued) | |
| | 537,312 | | | Vonage Holdings Corp.(a) | | $ | 4,491,928 | |
| | | | | | | | 34,248,920 | |
| | | | | | | | | |
| | | | | Total Common Stocks | | | | |
| | | | | (Cost $865,523,160) | | | 1,075,953,878 | |
| | | | | | | | | |
| SHORT TERM INVESTMENTS: 2.76% | | |
| | 30,239,703 | | | Dreyfus Government Cash Management Fund - Institutional Class 0.177% (7-Day Yield) | | | 30,239,703 | |
| | | | | | | | | |
| | | | | Total Short Term Investments | | | | |
| | | | | (Cost $30,239,703) | | | 30,239,703 | |
| | | | | | | | | |
| Total Investments: 100.90% | | |
| (Cost $895,762,863) | 1,106,193,581 | |
| | | | | | | | | |
| Liabilities In Excess Of Other Assets: (0.90)% | (9,904,067 | ) |
| Net Assets: 100.00% $ | 1,096,289,514 | |
| (a) | Non-income producing security. |
For Fund compliance purposes, the Fund's industry classifications refer to any one or more of the industry sub-classifications used by one or more widely recognized market indexes or ratings group indexes, and/or as defined by Fund management. This definition may not apply for purposes of this report, which may combine industry sub-classifications for reporting ease. Industries are shown as a percentage of net assets.
See Notes to Financial Statements.
| Annual Report | April 30, 2020 | 31 |
| Emerald Small Cap Value Fund | Schedule of Investments |
April 30, 2020
| Shares | | | | | Value (Note 2) | |
| COMMON STOCKS: 95.36% | |
| Consumer Discretionary: 10.11% | |
| | 1,401 | | | Aaron's, Inc. | | $ | 44,706 | |
| | 8,191 | | | GameStop Corp., Class A(a) | | | 46,934 | |
| | 11,571 | | | Gannett Co., Inc. | | | 13,075 | |
| | 3,699 | | | Gray Television, Inc.(a) | | | 42,945 | |
| | 2,315 | | | Meritor, Inc.(a) | | | 47,458 | |
| | | | | | | | 195,118 | |
| | | | | | | | | |
| Energy: 0.98% |
| | 1,193 | | | Comstock Resources, Inc.(a) | | | 9,138 | |
| | 672 | | | EQT Corp. | | | 9,805 | |
| | | | | | | | 18,943 | |
| | | | | | | | | |
| Financial Services: 42.38% | | |
| | 1,615 | | | Alpine Income Property Trust, Inc. | | | 20,914 | |
| | 2,582 | | | Amalgamated Bank, Class A | | | 27,627 | |
| | 4,384 | | | Bancorp, Inc.(a) | | | 30,556 | |
| | 1,774 | | | Bank OZK | | | 40,129 | |
| | 2,635 | | | Baycom Corp.(a) | | | 32,491 | |
| | 3,294 | | | BRP Group, Inc., Class A(a) | | | 33,006 | |
| | 896 | | | C&F Financial Corp. | | | 31,862 | |
| | 1,477 | | | Cannae Holdings, Inc.(a) | | | 46,599 | |
| | 1,529 | | | CNB Financial Corp. | | | 27,124 | |
| | 1,309 | | | Codorus Valley Bancorp, Inc. | | | 18,391 | |
| | 1,619 | | | Customers Bancorp, Inc.(a) | | | 20,658 | |
| | 1,316 | | | First Internet Bancorp | | | 20,661 | |
| | 503 | | | First Merchants Corp. | | | 14,240 | |
| | 2,945 | | | Flushing Financial Corp. | | | 36,783 | |
| | 1,092 | | | Hancock Whitney Corp. | | | 22,834 | |
| | 2,879 | | | Heritage Insurance Holdings, Inc. | | | 32,648 | |
| | 703 | | | Innovative Industrial Properties, Inc. | | | 55,156 | |
| | 1,128 | | | INTL. FCStone, Inc.(a) | | | 45,075 | |
| | 4,176 | | | Luther Burbank Corp. | | | 44,935 | |
| | 1,178 | | | Meridian Bank(a) | | | 17,434 | |
| | 976 | | | Moelis & Co., Class A | | | 29,153 | |
| | 1,902 | | | Nexpoint Real Estate Finance, Inc. | | | 21,797 | |
| | 946 | | | OneMain Holdings, Inc. | | | 22,903 | |
| | 2,610 | | | PennyMac Mortgage Investment Trust | | | 27,144 | |
| | 2,177 | | | Plymouth Industrial REIT, Inc. | | | 30,500 | |
| | 2,949 | | | Postal Realty Trust, Inc., Class A | | | 46,358 | |
| | 652 | | | Stewart Information Services Corp. | | | 20,773 | |
| | | | | | | | 817,751 | |
| | | | | | | | | |
| Health Care: 8.17% | | |
| | 653 | | | Biohaven Pharmaceutical Holding Co., Ltd.(a) | | | 30,756 | |
| | 1,641 | | | Collegium Pharmaceutical, Inc.(a) | | | 33,936 | |
| | 1,379 | | | MEDNAX, Inc.(a) | | | 20,023 | |
| | 276 | | | United Therapeutics Corp.(a) | | | 30,239 | |
| | 1,631 | | | Varex Imaging Corp.(a) | | | 42,618 | |
| | | | | | | | 157,572 | |
| Shares | | | | | Value (Note 2) | |
| Materials & Processing: 8.17% |
| | 937 | | | Apogee Enterprises, Inc. | | $ | 19,152 | |
| | 991 | | | Belden, Inc. | | | 33,882 | |
| | 5,888 | | | Cleveland-Cliffs, Inc. | | | 25,789 | |
| | 2,001 | | | PH Glatfelter Co. | | | 29,215 | |
| | 1,208 | | | Universal Forest Products, Inc. | | | 49,674 | |
| | | | | | | | 157,712 | |
| | | | | | | | | |
| Producer Durables: 9.51% | | |
| | 1,073 | | | Air Lease Corp. | | | 28,059 | |
| | 834 | | | Atlas Air Worldwide Holdings, Inc.(a) | | | 27,397 | |
| | 1,182 | | | Columbus McKinnon Corp. | | | 32,009 | |
| | 787 | | | Cubic Corp. | | | 30,071 | |
| | 3,118 | | | Harsco Corp.(a) | | | 31,118 | |
| | 474 | | | ICF International, Inc. | | | 34,857 | |
| | | | | | | | 183,511 | |
| | | | | | | | | |
| Technology: 12.29% | | |
| | 1,847 | | | Cerence, Inc.(a) | | | 39,083 | |
| | 1,288 | | | Ebix, Inc. | | | 26,958 | |
| | 1,870 | | | NCR Corp.(a) | | | 38,372 | |
| | 3,689 | | | Photronics, Inc.(a) | | | 44,083 | |
| | 602 | | | Science Applications International Corp. | | | 49,159 | |
| | 4,025 | | | Turtle Beach Corp.(a) | | | 39,566 | |
| | | | | | | | 237,221 | |
| | | | | | | | | |
| Utilities: 3.75% | | |
| | 434 | | | ALLETE, Inc. | | | 24,981 | |
| | 5,659 | | | Vonage Holdings Corp.(a) | | | 47,309 | |
| | | | | | | | 72,290 | |
| | | | | | | | | |
| | | | | Total Common Stocks | | | | |
| | | | | (Cost $2,124,400) | | | 1,840,118 | |
| | | | | | | | | |
| SHORT TERM INVESTMENTS: 2.32% | | |
| | 44,730 | | | Dreyfus Government Cash Management Fund - Institutional Class 0.177% (7-Day Yield) | | | 44,730 | |
| | | | | | | | | |
| | | | | Total Short Term Investments | | | | |
| | | | | (Cost $44,730) | | | 44,730 | |
| | | | | | | | | |
| Total Investments: 97.68% | | |
| (Cost $2,169,130) | 1,884,848 | |
| | | | | | | | | |
| Other Assets In Excess Of Liabilities: 2.32% | 44,727 | |
| Net Assets: 100.00% $ | 1,929,575 | |
| (a) | Non-income producing security. |
| 32 | www.emeraldmutualfunds.com |
| Emerald Small Cap Value Fund | Schedule of Investments |
April 30, 2020
For Fund compliance purposes, the Fund's industry classifications refer to any one or more of the industry sub-classifications used by one or more widely recognized market indexes or ratings group indexes, and/or as defined by Fund management. This definition may not apply for purposes of this report, which may combine industry sub-classifications for reporting ease. Industries are shown as a percentage of net assets.
See Notes to Financial Statements.
| Annual Report | April 30, 2020 | 33 |
| Emerald Insights Fund | Schedule of Investments |
April 30, 2020
| Shares | | | | | Value (Note 2) | |
| COMMON STOCKS: 93.77% |
| Consumer Discretionary: 17.27% |
| | 341 | | | Amazon.com, Inc.(a) | | $ | 843,634 | |
| | 1,076 | | | Best Buy Co., Inc. | | | 82,561 | �� |
| | 19 | | | Booking Holdings, Inc.(a) | | | 28,131 | |
| | 329 | | | Burlington Stores, Inc.(a) | | | 60,105 | |
| | 7,194 | | | Chegg, Inc.(a) | | | 307,544 | |
| | 69 | | | Chipotle Mexican Grill, Inc.(a) | | | 60,620 | |
| | 706 | | | Churchill Downs, Inc. | | | 70,755 | |
| | 2,908 | | | Dick's Sporting Goods, Inc. | | | 85,466 | |
| | 1,880 | | | Dollar Tree, Inc.(a) | | | 149,780 | |
| | 776 | | | Home Depot, Inc. | | | 170,588 | |
| | 2,223 | | | MarineMax, Inc.(a) | | | 32,033 | |
| | 966 | | | Planet Fitness, Inc., Class A(a) | | | 58,279 | |
| | 2,246 | | | SeaWorld Entertainment, Inc.(a) | | | 32,994 | |
| | 625 | | | Winnebago Industries, Inc. | | | 27,731 | |
| | 829 | | | Wynn Resorts, Ltd. | | | 70,904 | |
| | | | | | | | 2,081,125 | |
| | | | | | | | | |
| Consumer Staples: 3.62% | | |
| | 10,766 | | | BellRing Brands, Inc., Class A(a) | | | 188,728 | |
| | 251 | | | Boston Beer Co., Inc., Class A(a) | | | 117,094 | |
| | 1,726 | | | Freshpet, Inc.(a) | | | 130,158 | |
| | | | | | | | 435,980 | |
| | | | | | | | | |
| Energy: 3.06% | | |
| | 2,872 | | | Cheniere Energy, Inc.(a) | | | 134,094 | |
| | 1,794 | | | EQT Corp. | | | 26,174 | |
| | 9,819 | | | New Fortress Energy LLC(a) | | | 126,960 | |
| | 7,805 | | | Parsley Energy, Inc., Class A | | | 73,757 | |
| | 5,121 | | | Tellurian, Inc.(a) | | | 7,272 | |
| | | | | | | | 368,257 | |
| | | | | | | | | |
| Financial Services: 8.44% | | |
| | 1,819 | | | Citizens Financial Group, Inc. | | | 40,727 | |
| | 135 | | | Equinix, Inc., REIT | | | 91,152 | |
| | 1,025 | | | Euronet Worldwide, Inc.(a) | | | 94,054 | |
| | 15,126 | | | Everi Holdings, Inc.(a) | | | 74,874 | |
| | 820 | | | Fiserv, Inc.(a) | | | 84,509 | |
| | 1,001 | | | JPMorgan Chase & Co. | | | 95,856 | |
| | 158 | | | MarketAxess Holdings, Inc. | | | 71,892 | |
| | 528 | | | SBA Communications Corp., REIT | | | 153,078 | |
| | 1,223 | | | Visa, Inc., Class A | | | 218,574 | |
| | 2,583 | | | Western Alliance Bancorp | | | 92,678 | |
| | | | | | | | 1,017,394 | |
| | | | | | | | | |
| Health Care: 16.38% | | |
| | 847 | | | Alnylam Pharmaceuticals, Inc.(a) | | | 111,550 | |
| | 1,475 | | | Applied Therapeutics, Inc.(a) | | | 52,731 | |
| | 5,020 | | | Avrobio, Inc.(a) | | | 64,607 | |
| | 12,748 | | | BioDelivery Sciences International, Inc.(a) | | | 58,131 | |
| | | | | Biohaven Pharmaceutical Holding Co., | | | | |
| | 3,368 | | | Ltd.(a) | | | 158,633 | |
| | 1,230 | | | Blueprint Medicines Corp.(a) | | | 72,361 | |
| Shares | | | | | Value (Note 2) | |
| Health Care (continued) |
| | 1,882 | | | Cantel Medical Corp. | | $ | 69,634 | |
| | 776 | | | ChemoCentryx, Inc.(a) | | | 41,136 | |
| | 576 | | | Deciphera Pharmaceuticals, Inc.(a) | | | 33,396 | |
| | 3,938 | | | Dicerna Pharmaceuticals, Inc.(a) | | | 77,579 | |
| | 6,891 | | | Horizon Therapeutics PLC(a) | | | 248,352 | |
| | 1,810 | | | Immunomedics, Inc.(a) | | | 54,988 | |
| | 1,613 | | | Integer Holdings Corp.(a) | | | 120,104 | |
| | 2,713 | | | Karyopharm Therapeutics, Inc.(a) | | | 59,822 | |
| | 1,712 | | | Sarepta Therapeutics, Inc.(a) | | | 201,811 | |
| | 2,668 | | | SeaSpine Holdings Corp.(a) | | | 27,480 | |
| | 3,627 | | | Tabula Rasa HealthCare, Inc.(a) | | | 229,734 | |
| | 731 | | | United Therapeutics Corp.(a) | | | 80,088 | |
| | 2,067 | | | Varex Imaging Corp.(a) | | | 54,011 | |
| | 828 | | | Veeva Systems, Inc., Class A(a) | | | 157,982 | |
| | | | | | | | 1,974,130 | |
| | | | | | | | | |
| Materials & Processing: 2.94% | | |
| | 257 | | | Royal Gold, Inc. | | | 31,490 | |
| | 1,123 | | | Scotts Miracle-Gro Co. | | | 139,286 | |
| | 118 | | | Sherwin-Williams Co. | | | 63,292 | |
| | 974 | | | Trex Co., Inc.(a) | | | 92,744 | |
| | 240 | | | Vulcan Materials Co. | | | 27,113 | |
| | | | | | | | 353,925 | |
| | | | | | | | | |
| Producer Durables: 8.21% | | |
| | 6,203 | | | Chart Industries, Inc.(a) | | | 221,571 | |
| | 230 | | | CoStar Group, Inc.(a) | | | 149,100 | |
| | 5,640 | | | Harsco Corp.(a) | | | 56,287 | |
| | 8,627 | | | Kratos Defense & Security Solutions, Inc.(a) | | | 129,578 | |
| | 597 | | | Lockheed Martin Corp. | | | 232,269 | |
| | 1,362 | | | NV5 Global, Inc.(a) | | | 63,673 | |
| | 2,091 | | | Scorpio Tankers, Inc. | | | 45,772 | |
| | 971 | | | TopBuild Corp.(a) | | | 90,487 | |
| | | | | | | | 988,737 | |
| | | | | | | | | |
| Technology: 33.51% | | |
| | 62 | | | Adobe, Inc.(a) | | | 21,926 | |
| | 1,129 | | | Akamai Technologies, Inc.(a) | | | 110,315 | |
| | 331 | | | Alphabet, Inc., Class A(a) | | | 445,758 | |
| | 1,756 | | | Anaplan, Inc.(a) | | | 71,750 | |
| | 2,148 | | | Apple, Inc. | | | 631,082 | |
| | 1,401 | | | Crowdstrike Holdings, Inc.(a) | | | 94,792 | |
| | 1,258 | | | Facebook, Inc., Class A(a) | | | 257,525 | |
| | 871 | | | Fortinet, Inc.(a) | | | 93,841 | |
| | 21,156 | | | Glu Mobile, Inc.(a) | | | 165,017 | |
| | 764 | | | L3Harris Technologies, Inc. | | | 147,987 | |
| | 1,436 | | | Lumentum Holdings, Inc.(a) | | | 116,187 | |
| | 880 | | | Mercury Systems, Inc.(a) | | | 78,461 | |
| | 4,150 | | | Microsoft Corp. | | | 743,721 | |
| | 1,053 | | | NVIDIA Corp. | | | 307,771 | |
| | 819 | | | Proofpoint, Inc.(a) | | | 99,697 | |
| | 9,829 | | | Pure Storage, Inc., Class A(a) | | | 141,538 | |
| 34 | www.emeraldmutualfunds.com |
| Emerald Insights Fund | Schedule of Investments |
April 30, 2020
| Shares | | | | | Value (Note 2) | |
| Technology (continued) |
| | 2,422 | | | Rapid7, Inc.(a) | | $ | 110,322 | |
| | 288 | | | ServiceNow, Inc.(a) | | | 101,243 | |
| | 1,063 | | | Smartsheet, Inc., Class A(a) | | | 56,041 | |
| | 932 | | | Take-Two Interactive Software, Inc.(a) | | | 112,819 | |
| | 1,925 | | | Varonis Systems, Inc.(a) | | | 129,071 | |
| | | | | | | | 4,036,864 | |
| | | | | | | | | |
| Utilities: 0.34% | | |
| | 4,918 | | | Vonage Holdings Corp.(a) | | | 41,114 | |
| | | | | | | | | |
| | | | | Total Common Stocks | | | | |
| | | | | (Cost $8,782,154) | | | 11,297,526 | |
| | | | | | | | | |
| EXCHANGE TRADED FUNDS: 3.33% | | |
| Technology: 3.33% | | |
| | 1,664 | | | iShares Expanded Tech-Software Sector ETF | | | 400,824 | |
| | | | | | | | | |
| | | | | Total Exchange Traded Funds | | | | |
| | | | | (Cost $368,715) | | | 400,824 | |
| | | | | | | | | |
| SHORT TERM INVESTMENTS: 4.16% | | |
| | 500,883 | | | Dreyfus Government Cash Management Fund - Institutional Class 0.177% (7-Day Yield) | | | 500,883 | |
| | | | | | | | | |
| | | | | Total Short Term Investments | | | | |
| | | | | (Cost $500,883) | | | 500,883 | |
| | | | | | | | | |
| Total Investments: 101.26% | | |
| (Cost $9,651,752) | 12,199,233 | |
| | | | | | | | | |
| Liabilities In Excess Of Other Assets: (1.26)% | (151,224 | ) |
| Net Assets: 100.00% | $ | 12,048,009 | |
| (a) | Non-income producing security. |
For Fund compliance purposes, the Fund's industry classifications refer to any one or more of the industry sub-classifications used by one or more widely recognized market indexes or ratings group indexes, and/or as defined by Fund management. This definition may not apply for purposes of this report, which may combine industry sub-classifications for reporting ease. Industries are shown as a percentage of net assets.
See Notes to Financial Statements.
| Annual Report | April 30, 2020 | 35 |
| Emerald Banking and Finance Fund | Schedule of Investments |
April 30, 2020
| Shares | | | | | Value (Note 2) | |
| COMMON STOCKS: 97.00% | |
| Financial Services: 94.65% | |
| Asset Management & Custodian: 3.13% | | |
| | 90,940 | | | Focus Financial Partners, Inc., Class A(a) | | $ | 2,169,829 | |
| | 208,477 | | | Nebula Acquisition Corp.(a) | | | 2,136,889 | |
| | | | | | | | 4,306,718 | |
| | | | | | | | | |
| Banks: Diversified: 48.87% | | |
| | 203,810 | | | Amerant Bancorp, Inc., Class A(a) | | | 2,755,511 | |
| | 165,534 | | | Amerant Bancorp, Inc., Class B(a) | | | 1,489,806 | |
| | 772,179 | | | Bancorp, Inc.(a) | | | 5,382,088 | |
| | 495,251 | | | Bank7 Corp. | | | 4,952,510 | |
| | 26,479 | | | Byline Bancorp, Inc. | | | 326,221 | |
| | 152,440 | | | Cadence BanCorp | | | 1,009,153 | |
| | 15,000 | | | Cambridge Bancorp | | | 836,700 | |
| | 107,000 | | | Centric Financial Corp.(a) | | | 762,910 | |
| | 50,790 | | | CIT Group, Inc. | | | 963,994 | |
| | 57,560 | | | Citizens Financial Group, Inc. | | | 1,288,769 | |
| | 10,850 | | | Comerica, Inc. | | | 378,231 | |
| | 26,842 | | | Community Heritage Financial, Inc. | | | 501,274 | |
| | 135,870 | | | CrossFirst Bankshares, Inc.(a) | | | 1,313,863 | |
| | 25,617 | | | Customers Bancorp, Inc.(a) | | | 326,873 | |
| | 351,370 | | | Esquire Financial Holdings, Inc.(a) | | | 5,769,495 | |
| | 70,360 | | | Fifth Third Bancorp | | | 1,315,028 | |
| | 58,710 | | | First BanCorp | | | 342,279 | |
| | 26,750 | | | First Foundation, Inc. | | | 368,080 | |
| | 33,970 | | | Flagstar Bancorp, Inc. | | | 880,163 | |
| | 41,880 | | | Huntington Bancshares, Inc. | | | 386,971 | |
| | 185,900 | | | Investors Bancorp, Inc. | | | 1,730,729 | |
| | 115,147 | | | Live Oak Bancshares, Inc. | | | 1,606,301 | |
| | 32,937 | | | Luther Burbank Corp. | | | 354,402 | |
| | 53 | | | Mechanics Bank/Walnut Creek CA(a) | | | 1,061,325 | |
| | 72,766 | | | Metropolitan Bank Holding Corp.(a) | | | 1,825,699 | |
| | 25,267 | | | MVB Financial Corp. | | | 346,916 | |
| | 17,270 | | | Pacific Premier Bancorp, Inc. | | | 368,715 | |
| | 19,234 | | | Potomac Bancshares, Inc. | | | 189,455 | |
| | 133,618 | | | ServisFirst Bancshares, Inc. | | | 4,746,111 | |
| | 17,452 | | | Signature Bank/New York NY | | | 1,870,505 | |
| | 221,529 | | | Silvergate Capital Corp.(a) | | | 3,522,311 | |
| | 71,032 | | | Southern First Bancshares, Inc.(a) | | | 2,071,293 | |
| | 35,690 | | | Synovus Financial Corp. | | | 749,847 | |
| | 12,640 | | | TCF Financial Corp. | | | 375,282 | |
| | 39,550 | | | Texas Capital Bancshares, Inc.(a) | | | 1,098,699 | |
| | 240,975 | | | TriState Capital Holdings, Inc.(a) | | | 3,426,665 | |
| | 207,206 | | | Triumph Bancorp, Inc.(a) | | | 5,741,678 | |
| | 6,930 | | | UMB Financial Corp. | | | 352,321 | |
| | 26,175 | | | United Bankshares, Inc. | | | 784,203 | |
| | 217,390 | | | Valley National Bancorp | | | 1,817,380 | |
| | 16,140 | | | Webster Financial Corp. | | | 455,955 | |
| | 32,970 | | | Wintrust Financial Corp | | | 1,381,443 | |
| | | | | | | | 67,227,154 | |
| | | | | | | | | |
| Banks: Savings, Thrift & Mortgage Lending: 5.18% | | |
| | 247,953 | | | Meta Financial Group, Inc. | | | 4,567,294 | |
| Shares | | | | | Value (Note 2) | |
| Banks: Savings, Thrift & Mortgage Lending (continued) | |
| | 30,560 | | | Sterling Bancorp | | $ | 376,805 | |
| | 39,429 | | | TFS Financial Corp. | | | 538,206 | |
| | 250,000 | | | University Bancorp, Inc./Ann Arbor MI(a) | | | 1,643,750 | |
| | | | | | | | 7,126,055 | |
| Commercial Banks: 0.26% | | | |
| | 38,730 | | | First Horizon National Corp. | | | 351,668 | |
| | | | | | | | | |
| Commercial Finance & Mortgage Companies: 5.87% | | | |
| | 1,232,440 | | | ECN Capital Corp. | | | 3,474,852 | |
| | 92,100 | | | Ladder Capital Corp., REIT | | | 732,195 | |
| | 95,670 | | | PennyMac Financial Services, Inc., Class A | | | 2,886,364 | |
| | 94,130 | | | PennyMac Mortgage Investment Trust | | | 978,952 | |
| | | | | | | | 8,072,363 | |
| Consumer Lending: 6.13% | | | |
| | 81,700 | | | Ally Financial, Inc. | | | 1,339,063 | |
| | 41,190 | | | Encore Capital Group, Inc.(a) | | | 1,070,116 | |
| | 128,910 | | | MGIC Investment Corp. | | | 942,332 | |
| | 136,610 | | | Navient Corp. | | | 1,040,968 | |
| | 137,090 | | | OneMain Holdings, Inc. | | | 3,318,949 | |
| | 13,540 | | | PRA Group, Inc.(a) | | | 375,600 | |
| | 42,030 | | | SLM Corp. | | | 350,530 | |
| | | | | | | | 8,437,558 | |
| Diversified Financial Services: 5.68% | | | |
| | 143,150 | | | Cannae Holdings, Inc.(a) | | | 4,516,383 | |
| | 184,790 | | | Repay Holdings Corp.(a) | | | 3,302,197 | |
| | | | | | | | 7,818,580 | |
| Equity REIT: Diversified: 0.76% | | | |
| | 17,992 | | | Safehold, Inc. | | | 1,039,218 | |
| | | | | | | | | |
| Equity REIT: Health Care: 0.29% | | | |
| | 10,550 | | | Community Healthcare Trust, Inc., REIT | | | 392,460 | |
| | | | | | | | | |
| Equity REIT: Industrial: 2.26% | | | |
| | 17,700 | | | Americold Realty Trust | | | 541,443 | |
| | 32,800 | | | Innovative Industrial Properties, Inc. | | | 2,573,488 | |
| | | | | | | | 3,114,931 | |
| Equity REIT: Office: 1.53% | | | |
| | 134,007 | | | Postal Realty Trust, Inc., Class A | | | 2,106,590 | |
| | | | | | | | | |
| Equity REIT: Residential: 1.90% | | | |
| | 29,130 | | | ARMOUR Residential REIT, Inc. | | | 257,509 | |
| | 176,443 | | | Nexpoint Real Estate Finance, Inc. | | | 2,022,037 | |
| | 10,973 | | | NexPoint Residential Trust, Inc. | | | 329,958 | |
| | | | | | | | 2,609,504 | |
| | | | | | | | | |
| Financial Data & Systems: 0.28% | | | |
| | 19,450 | | | Synchrony Financial | | | 384,916 | |
| 36 | www.emeraldmutualfunds.com |
| Emerald Banking and Finance Fund | Schedule of Investments |
April 30, 2020
| Shares | | | | | Value (Note 2) | |
| Insurance: Multi-Line: 1.43% | |
| | 18,648 | | | James River Group Holdings, Ltd. | | $ | 661,631 | |
| | 136,720 | | | Mr Cooper Group, Inc.(a) | | | 1,309,778 | |
| | | | | | | | 1,971,409 | |
| | | | | | | | | |
| Insurance: Property-Casualty: 5.10% | | | |
| | 34,350 | | | Essent Group, Ltd. | | | 938,442 | |
| | 13,870 | | | Fidelity National Financial, Inc. | | | 375,183 | |
| | 31,750 | | | First American Financial Corp. | | | 1,464,310 | |
| | 52,105 | | | Hilltop Holdings, Inc. | | | 1,005,627 | |
| | 50,901 | | | Kingstone Cos., Inc. | | | 249,415 | |
| | 10,353 | | | Kinsale Capital Group, Inc. | | | 1,124,543 | |
| | 84,220 | | | NMI Holdings, Inc., Class A(a) | | | 1,138,654 | |
| | 7,430 | | | Palomar Holdings, Inc.(a) | | | 434,655 | |
| | 19,400 | | | Radian Group, Inc. | | | 290,612 | |
| | | | | | | | 7,021,441 | |
| | | | | | | | | |
| Mortgage REIT: Diversified: 2.43% | | | |
| | 53,600 | | | AGNC Investment Corp. | | | 665,712 | |
| | 37,040 | | | Ellington Financial, Inc. | | | 384,846 | |
| | 38,120 | | | Ellington Residential Mortgage REIT | | | 340,031 | |
| | 52,380 | | | Great Ajax Corp. | | | 455,706 | |
| | 20,530 | | | KKR Real Estate Finance Trust, Inc. | | | 323,963 | |
| | 25,410 | | | Newtek Business Services Corp. | | | 381,150 | |
| | 112,560 | | | Redwood Trust, Inc. | | | 461,496 | |
| | 25,460 | | | Starwood Property Trust, Inc. | | | 329,452 | |
| | | | | | | | 3,342,356 | |
| | | | | | | | | |
| Mortgage Reit: Residential: 1.96% | | | |
| | 73,170 | | | Capstead Mortgage Corp. | | | 379,752 | |
| | 46,610 | | | Cherry Hill Mortgage Investment Corp. | | | 324,406 | |
| | 42,260 | | | Chimera Investment Corp. | | | 328,360 | |
| | 68,430 | | | Dynex Capital, Inc. | | | 979,233 | |
| | 60,850 | | | New Residential Investment Corp. | | | 370,576 | |
| | 46,680 | | | Ready Capital Corp. | | | 311,356 | |
| | | | | | | | 2,693,683 | |
| | | | | | | | | |
| Real Estate Services: 0.51% | | | |
| | 112,590 | | | Annaly Capital Management, Inc. | | | 703,687 | |
| | | | | | | | | |
| Securities Brokerage & Services: 1.08% | | | |
| | 37,181 | | | INTL. FCStone, Inc.(a) | | | 1,485,753 | |
| | | | | | | | | |
| Producer Durables: 0.64% | | | |
| Back Office Support, Hr, And Consulting: 0.64% | | | |
| | 1,360 | | | CoStar Group, Inc.(a) | | | 881,634 | |
| | | | | | | | | |
| Technology: 1.71% | | | |
| Communications Technology: 0.24% | | | |
| | 49,021 | | | Kaleyra, Inc.(a) | | | 330,892 | |
| Shares | | | | | Value (Note 2) | |
| Computer Services Software & Systems: 1.47% | | | |
| | 28,630 | | | Black Knight, Inc.(a) | | $ | 2,020,419 | |
| | | | | | | | | |
| | | | | Total Common Stocks | | | | |
| | | | | (Cost $135,925,478) | | | 133,438,989 | |
| SHORT TERM INVESTMENTS: 2.97% | | | |
| | 4,088,197 | | | Dreyfus Government Cash Management Fund - Institutional Class 0.177% (7-Day Yield) | | | 4,088,197 | |
| | | | | | | | | |
| | | | | Total Short Term Investments | | | | |
| | | | | (Cost $4,088,197) | | | 4,088,197 | |
| | | | | | | | | |
| Total Investments: 99.97% | | | |
| (Cost $140,013,675) | | 137,527,186 | |
| | | | | | | | | |
| Other Assets In Excess Of Liabilities: 0.03% | | 40,393 | |
| Net Assets: 100.00% | $ | 137,567,579 | |
| (a) | Non-income producing security. |
For Fund compliance purposes, the Fund's industry classifications refer to any one or more of the industry sub-classifications used by one or more widely recognized market indexes or ratings group indexes, and/or as defined by Fund management. This definition may not apply for purposes of this report, which may combine industry sub-classifications for reporting ease. Industries are shown as a percentage of net assets.
See Notes to Financial Statements.
| Annual Report | April 30, 2020 | 37 |
| Emerald Select trueLiberty Income Fund | Consolidated Schedule of Investments |
April 30, 2020
| Shares | | | | | Value (Note 2) | |
| COMMON STOCKS: 17.94% | |
| Energy: 17.94% | |
| | 275 | | | Cheniere Energy Partners LP | | $ | 9,276 | |
| | 272 | | | CNX Midstream Partners LP | | | 2,054 | |
| | 339 | | | Crestwood Equity Partners LP | | | 3,709 | |
| | 611 | | | DCP Midstream LP | | | 5,560 | |
| | 601 | | | Enable Midstream Partners LP | | | 2,728 | |
| | 2,897 | | | Energy Transfer LP | | | 24,335 | |
| | 1,758 | | | EnLink Midstream LLC | | | 3,903 | |
| | 1,375 | | | Enterprise Products Partners LP | | | 24,145 | |
| | 561 | | | EQM Midstream Partners LP | | | 11,298 | |
| | 737 | | | Genesis Energy LP | | | 4,407 | |
| | 308 | | | Holly Energy Partners LP | | | 4,537 | |
| | 589 | | | Magellan Midstream Partners LP | | | 24,226 | |
| | 1,582 | | | MPLX LP | | | 28,634 | |
| | 802 | | | NGL Energy Partners LP | | | 4,852 | |
| | 227 | | | Noble Midstream Partners LP | | | 1,664 | |
| | 664 | | | NuStar Energy LP | | | 8,087 | |
| | 487 | | | Phillips 66 Partners LP | | | 20,722 | |
| | 2,348 | | | Plains All American Pipeline LP | | | 20,733 | |
| | 835 | | | Shell Midstream Partners LP | | | 12,266 | |
| | 366 | | | TC PipeLines LP | | | 12,261 | |
| | 1,360 | | | Western Midstream Partners LP | | | 11,805 | |
| | | | | | | | 241,202 | |
| | | | | | | | | |
| | | | | Total Common Stocks | | | | |
| | | | | (Cost $274,382) | | | 241,202 | |
| | | | | | | | | |
| Total Investments: 17.94% | | | |
| (Cost $274,382) | | 241,202 | |
| | | | | | | | | |
| Other Assets In Excess Of Liabilities: 82.06%(a) | | 1,103,322 | |
| Net Assets: 100.00% | $ | 1,344,524 | |
| (a) | Includes cash which is being held as collateral for total return swaps. |
For Fund compliance purposes, the Fund's industry classifications refer to any one or more of the industry sub-classifications used by one or more widely recognized market indexes or ratings group indexes, and/or as defined by Fund management. This definition may not apply for purposes of this report, which may combine industry sub-classifications for reporting ease. Industries are shown as a percentage of net assets.
See Notes to Financial Statements.
| 38 | www.emeraldmutualfunds.com |
| Emerald Select trueLiberty Income Fund | Consolidated Schedule of Investments |
April 30, 2020
TOTAL RETURN SWAP CONTRACT(a)
| Swap Counterparty | | Reference Obligation | | Notional Amount | | | Floating Rate/Fixed Amount Paid by the Fund* | | Termination Date | | Value | | | Unrealized Appreciation | |
| J.P. Morgan | | Alerian MLP Infrastructure Index | | $ | 983,603 | | | 1.08% (1-month USD-LIBOR plus a specified spread) | | 03/02/2021 | | $ | (983,603 | ) | | $ | – | |
| (a) | For long positions in the total return swap, the Fund receives payments based on any positive return of the Reference Obligation less the rate paid by the Fund. The Fund makes payments on any negative return of such Reference Obligations plus the rate paid by the Fund. For the short positions in the total return swap, the Fund makes payments based on any positive return of the Reference Obligation less the rate received by the Fund. The Fund receives payments on any negative return of such Reference Obligations plus the rate received by the Fund. |
| * | Payments are made monthly. |
| Annual Report | April 30, 2020 | 39 |
| Emerald Funds | Statements of Assets and Liabilities |
April 30, 2020
| | | Emerald Growth Fund | | | Emerald Small Cap Value Fund | | | Emerald Insights Fund | | | Emerald Banking and Finance Fund | |
| | | | | | | | | | | | | |
| ASSETS: | | | | | | | | | | | | |
| Investments, at value | | $ | 1,106,193,581 | | | $ | 1,884,848 | | | $ | 12,199,233 | | | $ | 137,527,186 | |
| Receivable for investments sold | | | 5,267,479 | | | | 34,471 | | | | 282,386 | | | | 1,454,013 | |
| Receivable for shares sold | | | 1,265,172 | | | | 9,155 | | | | – | | | | 77,434 | |
| Receivable due from advisor | | | – | | | | 9,483 | | | | 2,349 | | | | – | |
| Interest and dividends receivable | | | 67,495 | | | | 209 | | | | 2 | | | | 52,959 | |
| Other assets | | | 28,666 | | | | 12,116 | | | | 12,310 | | | | 23,262 | |
| Total Assets | | | 1,112,822,393 | | | | 1,950,282 | | | | 12,496,280 | | | | 139,134,854 | |
| LIABILITIES: | | | | | | | | | | | | | | | | |
| Payable for investments purchased | | | 14,523,800 | | | | – | | | | 426,983 | | | | 961,822 | |
| Payable for shares redeemed | | | 1,165,342 | | | | 3,644 | | | | – | | | | 364,263 | |
| Investment advisory fees payable | | | 492,690 | | | | – | | | | – | | | | 102,724 | |
| Payable to fund accounting and administration | | | 44,966 | | | | 4,073 | | | | 4,809 | | | | 9,008 | |
| Payable for distribution and service fees | | | 168,450 | | | | 358 | | | | 3,102 | | | | 79,399 | |
| Payable for trustee fees and expenses | | | 16,864 | | | | 31 | | | | 199 | | | | 2,583 | |
| Payable for transfer agency fees | | | 24,597 | | | | 5,186 | | | | 5,453 | | | | 16,412 | |
| Payable for chief compliance officer fee | | | 5,224 | | | | 9 | | | | 58 | | | | 766 | |
| Payable for principal financial officer fee | | | 1,061 | | | | 2 | | | | 11 | | | | 177 | |
| Payable for professional fees | | | 7,665 | | | | 1,891 | | | | 1,944 | | | | 2,654 | |
| Accrued expenses and other liabilities | | | 82,220 | | | | 5,513 | | | | 5,712 | | | | 27,467 | |
| Total Liabilities | | | 16,532,879 | | | | 20,707 | | | | 448,271 | | | | 1,567,275 | |
| NET ASSETS | | $ | 1,096,289,514 | | | $ | 1,929,575 | | | $ | 12,048,009 | | | $ | 137,567,579 | |
| NET ASSETS CONSIST OF: | | | | | | | | | | | | | | | | |
| Paid-in capital (Note 6) | | $ | 839,219,506 | | | $ | 2,549,116 | | | $ | 9,499,946 | | | $ | 177,011,782 | |
| Total distributable earnings | | | 257,070,008 | | | | (619,541 | ) | | | 2,548,063 | | | | (39,444,203 | ) |
| NET ASSETS | | $ | 1,096,289,514 | | | $ | 1,929,575 | | | $ | 12,048,009 | | | $ | 137,567,579 | |
| INVESTMENTS, AT COST | | $ | 895,762,863 | | | $ | 2,169,130 | | | $ | 9,651,752 | | | $ | 140,013,675 | |
| PRICING OF SHARES | | | | | | | | | | | | | | | | |
| Class A: (a) | | | | | | | | | | | | | | | | |
| Net Asset Value, offering and redemption price per share | | $ | 23.06 | | | $ | 5.25 | | | $ | 12.13 | | | $ | 22.89 | |
| Net Assets | | $ | 134,754,644 | | | $ | 1,067,909 | | | $ | 10,174,426 | | | $ | 37,933,194 | |
| Shares of beneficial interest outstanding | | | 5,842,538 | | | | 203,220 | | | | 838,460 | | | | 1,657,021 | |
| Maximum offering price per share (NAV/.9525, based on maximum sales charge of 4.75% of the offering price) | | $ | 24.21 | | | $ | 5.52 | | | $ | 12.74 | | | $ | 24.03 | |
| Class C: (a) | | | | | | | | | | | | | | | | |
| Net Asset Value, offering and redemption price per share | | $ | 18.97 | | | $ | 4.98 | | | $ | 11.57 | | | $ | 19.38 | |
| Net Assets | | $ | 17,434,322 | | | $ | 27,585 | | | $ | 137,801 | | | $ | 16,804,314 | |
| Shares of beneficial interest outstanding | | | 919,196 | | | | 5,536 | | | | 11,907 | | | | 867,296 | |
| Institutional Class: | | | | | | | | | | | | | | | | |
| Net Asset Value, offering and redemption price per share | | $ | 24.18 | | | $ | 5.39 | | | $ | 12.37 | | | $ | 23.67 | |
| Net Assets | | $ | 863,360,254 | | | $ | 500,654 | | | $ | 1,461,935 | | | $ | 67,358,394 | |
| Shares of beneficial interest outstanding | | | 35,700,856 | | | | 92,828 | | | | 118,197 | | | | 2,846,088 | |
| Investor Class: | | | | | | | | | | | | | | | | |
| Net Asset Value, offering and redemption price per share | | $ | 22.94 | | | $ | 5.29 | | | $ | 12.07 | | | $ | 21.66 | |
| Net Assets | | $ | 80,740,294 | | | $ | 333,427 | | | $ | 273,847 | | | $ | 15,471,677 | |
| Shares of beneficial interest outstanding | | | 3,519,088 | | | | 63,080 | | | | 22,680 | | | | 714,364 | |
| (a) | Redemption price per share may be reduced for any applicable contingent deferred sales charge. For a description of a possible sales charge, please see the Funds' Prospectus. |
See Notes to Financial Statements.
| 40 | www.emeraldmutualfunds.com |
| Emerald Select trueLiberty Income Fund | Consolidated Statement of Assets and Liabilities |
April 30, 2020
| ASSETS: | | | |
| Investments, at value | | $ | 241,202 | |
| Cash | | | 851,644 | |
| Deposits with brokers for total return swap contracts | | | 25,000 | |
| Receivable due from broker for total return swap contracts | | | 306,059 | |
| Receivable for shares sold | | | 117,400 | |
| Receivable due from advisor | | | 38,088 | |
| Interest and dividends receivable | | | 3,044 | |
| Prepaid offering costs | | | 65,006 | |
| Other assets | | | 3,468 | |
| Total Assets | | | 1,650,911 | |
| LIABILITIES: | | | | |
| Payable to broker for total return swap contracts | | | 160,000 | |
| Investment advisory fees payable | | | 521 | |
| Payable to fund accounting and administration | | | 17,620 | |
| Payable for distribution and service fees | | | 120 | |
| Payable for trustee fees and expenses | | | 11,385 | |
| Payable for transfer agency fees | | | 6,048 | |
| Payable for chief compliance officer fee | | | 631 | |
| Payable for principal financial officer fee | | | 143 | |
| Payable for professional fees | | | 12,841 | |
| Accrued expenses and other liabilities | | | 97,078 | |
| Total Liabilities | | | 306,387 | |
| NET ASSETS | | $ | 1,344,524 | |
| NET ASSETS CONSIST OF: | | | | |
| Paid-in capital (Note 6) | | $ | 1,478,794 | |
| Total distributable earnings | | | (134,270 | ) |
| NET ASSETS | | $ | 1,344,524 | |
| INVESTMENTS, AT COST | | $ | 274,382 | |
| PRICING OF SHARES | | | | |
| Class A: (a) | | | | |
| Net Asset Value, offering and redemption price per share | | $ | 5.87 | |
| Net Assets | | $ | 65,644 | |
| Shares of beneficial interest outstanding | | | 11,192 | |
| Maximum offering price per share (NAV/.9525, based on maximum sales charge of 4.75% of the offering price) | | $ | 6.16 | |
| Institutional Class: | | | | |
| Net Asset Value, offering and redemption price per share | | $ | 5.87 | |
| Net Assets | | $ | 1,278,880 | |
| Shares of beneficial interest outstanding | | | 217,797 | |
| (a) | Redemption price per share may be reduced for any applicable contingent deferred sales charge. For a description of a possible sales charge, please see the Funds' Prospectus. |
See Notes to Financial Statements.
| Annual Report | April 30, 2020 | 41 |
| Emerald Funds | Statements of Operations |
For the Year Ended April 30, 2020
| | | Emerald Growth Fund | | | Emerald Small Cap Value Fund | | | Emerald Insights Fund | | | Emerald Banking and Finance Fund | |
| INVESTMENT INCOME: | | | | | | | | | | | | |
| Dividends | | $ | 4,814,265 | | | $ | 37,484 | | | $ | 60,090 | | | $ | 3,680,572 | |
| Foreign taxes withheld | | | – | | | | (23 | ) | | | – | | | | (19,026 | ) |
| Total Investment Income | | | 4,814,265 | | | | 37,461 | | | | 60,090 | | | | 3,661,546 | |
| | | | | | | | | | | | | | | | | |
| EXPENSES: | | | | | | | | | | | | | | | | |
| Investment advisory fee (Note 7) | | | 7,147,540 | | | | 22,930 | | | | 86,035 | | | | 2,462,123 | |
| Administration fee | | | 536,251 | | | | 17,527 | | | | 22,042 | | | | 123,856 | |
| Custodian fee | | | 115,154 | | | | 5,253 | | | | 5,032 | | | | 37,618 | |
| Professional fees | | | 51,205 | | | | 18,838 | | | | 19,027 | | | | 28,988 | |
| Transfer agent fee | | | 213,513 | | | | 32,509 | | | | 35,048 | | | | 143,292 | |
| Delegated transfer agent equivalent services fees | | | | | | | | | | | | | | | | |
| Class A | | | 2,185 | | | | – | | | | 5 | | | | 4,753 | |
| Class C | | | 616 | | | | – | | | | – | | | | 1,466 | |
| Institutional Class | | | 970 | | | | 10 | | | | – | | | | 842 | |
| Investor Class | | | 787 | | | | 2 | | | | – | | | | 6 | |
| Trustee fees and expenses | | | 61,001 | | | | 126 | | | | 614 | | | | 11,398 | |
| Registration/filing fees | | | 70,369 | | | | 44,508 | | | | 37,843 | | | | 64,815 | |
| Reports to shareholder and printing fees | | | 121,390 | | | | 1,057 | | | | 1,839 | | | | 41,733 | |
| Distribution and service fees | | | | | | | | | | | | | | | | |
| Class A | | | 568,094 | | | | 6,367 | | | | 34,245 | | | | 226,032 | |
| Class C | | | 233,403 | | | | 372 | | | | 1,428 | | | | 364,274 | |
| Institutional Class | | | 308,678 | | | | – | | | | 394 | | | | 2,594 | |
| Investor Class | | | 341,057 | | | | 1,149 | | | | 387 | | | | 114,198 | |
| Chief compliance officer fee | | | 59,561 | | | | 142 | | | | 550 | | | | 12,325 | |
| Principal financial officer fee | | | 11,839 | | | | 28 | | | | 109 | | | | 2,454 | |
| Other | | | 46,097 | | | | 11,234 | | | | 9,973 | | | | 18,769 | |
| Total expenses before waiver | | | 9,889,710 | | | | 162,052 | | | | 254,571 | | | | 3,661,536 | |
| Less fees waived/reimbursed by investment advisor (Note 7) | | | – | | | | (123,663 | ) | | | (102,876 | ) | | | – | |
| Total Net Expenses | | | 9,889,710 | | | | 38,389 | | | | 151,695 | | | | 3,661,536 | |
| NET INVESTMENT INCOME/(LOSS): | | | (5,075,445 | ) | | | (928 | ) | | | (91,605 | ) | | | 10 | |
| | | | | | | | | | | | | | | | | |
| REALIZED AND UNREALIZED GAIN/(LOSS) | | | | | | | | | | | | | | | | |
| Net realized gain/(loss) | | | 52,160,088 | | | | 68,956 | | | | 364,684 | | | | (28,209,958 | ) |
| Net realized gain on foreign currency transactions | | | – | | | | 1 | | | | – | | | | 359 | |
| Net change in unrealized appreciation/(depreciation) | | | (170,182,635 | ) | | | (829,367 | ) | | | 362,126 | | | | (43,340,341 | ) |
| NET REALIZED AND UNREALIZED GAIN/(LOSS) | | | (118,022,547 | ) | | | (760,410 | ) | | | 726,810 | | | | (71,549,940 | ) |
| NET INCREASE/(DECREASE) IN NET ASSETS RESULTING FROM OPERATIONS | | $ | (123,097,992 | ) | | $ | (761,338 | ) | | $ | 635,205 | | | $ | (71,549,930 | ) |
See Notes to Financial Statements.
| 42 | www.emeraldmutualfunds.com |
| Emerald Select trueLiberty Income Fund | Consolidated Statement of Operations |
For the Period Ended April 30, 2020(a)
| INVESTMENT INCOME: | | | |
| Dividends | | $ | 5,343 | |
| Total Investment Income | | | 5,343 | |
| | | | | |
| EXPENSES: | | | | |
| Investment advisory fee (Note 7) | | | 1,464 | |
| Investment advisory fee-subsidiary | | | 182 | |
| Administration fee | | | 20,782 | |
| Custodian fee | | | 3,252 | |
| Professional fees | | | 29,292 | |
| Transfer agent fee | | | 12,800 | |
| Delegated transfer agent equivalent services fees | | | | |
| Institutional Class | | | 3 | |
| Trustee fees and expenses | | | 11,398 | |
| Reports to shareholder and printing fees | | | 703 | |
| Distribution and service fees | | | | |
| Class A | | | 86 | |
| Institutional Class | | | 109 | |
| Chief compliance officer fee | | | 746 | |
| Principal financial officer fee | | | 144 | |
| Organizational costs | | | 6,332 | |
| Offering costs | | | 31,319 | |
| Other | | | 5,235 | |
| Total expenses before waiver | | | 123,847 | |
| Less fees waived/reimbursed by investment advisor (Note 7) | | | (121,730 | ) |
| Waiver of investment advisory fees - subsidiary (Note 7) | | | (182 | ) |
| Total Net Expenses | | | 1,935 | |
| NET INVESTMENT INCOME: | | | 3,408 | |
| | | | | |
| REALIZED AND UNREALIZED LOSS | | | | |
| Net realized loss | | | (104,640 | ) |
| Net realized loss on total return swap contracts | | | (538,379 | ) |
| Net change in unrealized depreciation | | | (33,180 | ) |
| NET REALIZED AND UNREALIZED LOSS | | | (676,199 | ) |
| NET DECREASE IN NET ASSETS RESULTING FROM OPERATIONS | | $ | (672,791 | ) |
| (a) | For the period from January 2, 2020 (Inception) to April 30, 2020. |
See Notes to Financial Statements.
| Annual Report | April 30, 2020 | 43 |
| Emerald Growth Fund | Statements of Changes in Net Assets |
| | | Year Ended April 30, 2020 | | | Year Ended April 30, 2019 | |
| OPERATIONS: | | | | | | |
| Net investment loss | | $ | (5,075,445 | ) | | $ | (3,687,116 | ) |
| Net realized gain | | | 52,160,088 | | | | 65,609,700 | |
| Net change in unrealized appreciation/(depreciation) | | | (170,182,635 | ) | | | 79,706,677 | |
| Net increase/(decrease) in net assets resulting from operations | | | (123,097,992 | ) | | | 141,629,261 | |
| | | | | | | | | |
| DISTRIBUTIONS TO SHAREHOLDERS (NOTE 4): | | | | | | | | |
| Total amount of distributions | | | | | | | | |
| Class A | | | (2,412,695 | ) | | | (18,783,708 | ) |
| Class C | | | (414,806 | ) | | | (3,291,825 | ) |
| Institutional Class | | | (14,304,031 | ) | | | (85,437,977 | ) |
| Investor Class | | | (1,302,690 | ) | | | (9,170,727 | ) |
| Net decrease in net assets from distributions | | | (18,434,222 | ) | | | (116,684,237 | ) |
| SHARE TRANSACTIONS (NOTE 6): | | | | | | | | |
| Class A | | | | | | | | |
| Proceeds from sale of shares | | | 18,378,097 | | | | 28,831,338 | |
| Issued to shareholders in reinvestment of distributions | | | 2,248,340 | | | | 17,242,400 | |
| Cost of shares redeemed | | | (56,197,235 | ) | | | (100,627,275 | ) |
| Net decrease from share transactions | | | (35,570,798 | ) | | | (54,553,537 | ) |
| Class C | | | | | | | | |
| Proceeds from sale of shares | | | 210,912 | | | | 1,048,239 | |
| Issued to shareholders in reinvestment of distributions | | | 371,070 | | | | 2,913,276 | |
| Cost of shares redeemed | | | (10,036,851 | ) | | | (7,089,084 | ) |
| Net decrease from share transactions | | | (9,454,869 | ) | | | (3,127,569 | ) |
| Institutional Class | | | | | | | | |
| Proceeds from sale of shares | | | 179,007,496 | | | | 294,328,397 | |
| Issued to shareholders in reinvestment of distributions | | | 12,854,869 | | | | 76,474,139 | |
| Cost of shares redeemed | | | (268,196,365 | ) | | | (176,456,213 | ) |
| Net increase/(decrease) from share transactions | | | (76,334,000 | ) | | | 194,346,323 | |
| Investor Class | | | | | | | | |
| Proceeds from sale of shares | | | 32,115,129 | | | | 30,586,078 | |
| Issued to shareholders in reinvestment of distributions | | | 421,168 | | | | 3,282,222 | |
| Cost of shares redeemed | | | (47,153,166 | ) | | | (40,897,792 | ) |
| Net decrease from share transactions | | | (14,616,869 | ) | | | (7,029,492 | ) |
| Net increase/(decrease) in net assets | | $ | (277,508,750 | ) | | $ | 154,580,749 | |
| NET ASSETS: | | | | | | | | |
| Beginning of year | | | 1,373,798,264 | | | | 1,219,217,515 | |
| End of year | | $ | 1,096,289,514 | | | $ | 1,373,798,264 | |
| 44 | www.emeraldmutualfunds.com |
| Emerald Growth Fund | Statements of Changes in Net Assets |
| | | Year Ended April 30, 2020 | | | Year Ended April 30, 2019 | |
| Other Information: | | | | | | |
| SHARE TRANSACTIONS: | | | | | | |
| Class A | | | | | | |
| Sold | | | 759,108 | | | | 1,099,455 | |
| Distributions reinvested | | | 86,708 | | | | 819,116 | |
| Redeemed | | | (2,267,968 | ) | | | (3,863,070 | ) |
| Net decrease in shares outstanding | | | (1,422,152 | ) | | | (1,944,499 | ) |
| Class C | | | | | | | | |
| Sold | | | 10,641 | | | | 52,709 | |
| Distributions reinvested | | | 17,356 | | | | 166,283 | |
| Redeemed | | | (497,436 | ) | | | (327,363 | ) |
| Net decrease in shares outstanding | | | (469,439 | ) | | | (108,371 | ) |
| Institutional Class | | | | | | | | |
| Sold | | | 7,079,612 | | | | 10,623,887 | |
| Distributions reinvested | | | 473,301 | | | | 3,482,429 | |
| Redeemed | | | (10,537,250 | ) | | | (6,569,755 | ) |
| Net increase/(decrease) in shares outstanding | | | (2,984,337 | ) | | | 7,536,561 | |
| Investor Class | | | | | | | | |
| Sold | | | 1,422,635 | | | | 1,272,243 | |
| Distributions reinvested | | | 16,324 | | | | 156,669 | |
| Redeemed | | | (1,954,727 | ) | | | (1,552,305 | ) |
| Net decrease in shares outstanding | | | (515,768 | ) | | | (123,393 | ) |
See Notes to Financial Statements.
| Annual Report | April 30, 2020 | 45 |
| Emerald Small Cap Value Fund | Statements of Changes in Net Assets |
| | | Year Ended April 30, 2020 | | | Year Ended April 30, 2019 | |
| OPERATIONS: | | | | | | |
| Net investment loss | | $ | (928 | ) | | $ | (6,269 | ) |
| Net realized gain/(loss) | | | 68,956 | | | | (289,525 | ) |
| Net realized gain on foreign currency transactions | | | 1 | | | | 3 | |
| Net change in unrealized depreciation | | | (829,367 | ) | | | (513,409 | ) |
| Net decrease in net assets resulting from operations | | | (761,338 | ) | | | (809,200 | ) |
| | | | | | | | | |
| DISTRIBUTIONS TO SHAREHOLDERS (NOTE 4): | | | | | | | | |
| Total amount of distributions | | | | | | | | |
| Class A | | | – | | | | (832,298 | ) |
| Class C | | | – | | | | (2,956 | ) |
| Institutional Class | | | – | | | | (268,960 | ) |
| Investor Class | | | – | | | | (122,718 | ) |
| Net decrease in net assets from distributions | | | – | | | | (1,226,932 | ) |
| SHARE TRANSACTIONS (NOTE 6): | | | | | | | | |
| Class A | | | | | | | | |
| Proceeds from sale of shares | | | 81,565 | | | | 1,888,438 | |
| Issued to shareholders in reinvestment of distributions | | | – | | | | 832,298 | |
| Cost of shares redeemed | | | (1,250,904 | ) | | | (2,655,284 | ) |
| Net increase/(decrease) from share transactions | | | (1,169,339 | ) | | | 65,452 | |
| Class C | | | | | | | | |
| Proceeds from sale of shares | | | 2,800 | | | | 26,343 | |
| Issued to shareholders in reinvestment of distributions | | | – | | | | 2,956 | |
| Cost of shares redeemed | | | (2,426 | ) | | | (88,998 | ) |
| Net increase/(decrease) from share transactions | | | 374 | | | | (59,699 | ) |
| Institutional Class | | | | | | | | |
| Proceeds from sale of shares | | | 28,051 | | | | 340,310 | |
| Issued to shareholders in reinvestment of distributions | | | – | | | | 268,960 | |
| Cost of shares redeemed | | | (206,696 | ) | | | (2,426,213 | ) |
| Net decrease from share transactions | | | (178,645 | ) | | | (1,816,943 | ) |
| Investor Class | | | | | | | | |
| Proceeds from sale of shares | | | 65,473 | | | | 134,280 | |
| Issued to shareholders in reinvestment of distributions | | | – | | | | 122,718 | |
| Cost of shares redeemed | | | (111,875 | ) | | | (125,199 | ) |
| Net increase/(decrease) from share transactions | | | (46,402 | ) | | | 131,799 | |
| Net decrease in net assets | | $ | (2,155,350 | ) | | $ | (3,715,523 | ) |
| NET ASSETS: | | | | | | | | |
| Beginning of year | | | 4,084,925 | | | | 7,800,448 | |
| End of year | | $ | 1,929,575 | | | $ | 4,084,925 | |
| 46 | www.emeraldmutualfunds.com |
| Emerald Small Cap Value Fund | Statements of Changes in Net Assets |
| | | Year Ended April 30, 2020 | | | Year Ended April 30, 2019 | |
| Other Information: | | | | | | |
| SHARE TRANSACTIONS: | | | | | | |
| Class A | | | | | | |
| Sold | | | 12,034 | | | | 193,926 | |
| Distributions reinvested | | | – | | | | 131,485 | |
| Redeemed | | | (174,261 | ) | | | (338,910 | ) |
| Net decrease in shares outstanding | | | (162,227 | ) | | | (13,499 | ) |
| Class C | | | | | | | | |
| Sold | | | 422 | | | | 4,031 | |
| Distributions reinvested | | | – | | | | 488 | |
| Redeemed | | | (331 | ) | | | (9,693 | ) |
| Net increase/(decrease) in shares outstanding | | | 91 | | | | (5,174 | ) |
| Institutional Class | | | | | | | | |
| Sold | | | 4,134 | | | | 31,414 | |
| Distributions reinvested | | | – | | | | 41,570 | |
| Redeemed | | | (28,477 | ) | | | (255,759 | ) |
| Net decrease in shares outstanding | | | (24,343 | ) | | | (182,775 | ) |
| Investor Class | | | | | | | | |
| Sold | | | 9,620 | | | | 12,696 | |
| Distributions reinvested | | | – | | | | 19,295 | |
| Redeemed | | | (16,025 | ) | | | (15,655 | ) |
| Net increase/(decrease) in shares outstanding | | | (6,405 | ) | | | 16,336 | |
See Notes to Financial Statements.
| Annual Report | April 30, 2020 | 47 |
| Emerald Insights Fund | Statements of Changes in Net Assets |
| | | Year Ended April 30, 2020 | | | Year Ended April 30, 2019 | |
| OPERATIONS: | | | | | | |
| Net investment loss | | $ | (91,605 | ) | | $ | (74,164 | ) |
| Net realized gain | | | 364,684 | | | | 165,436 | |
| Net change in unrealized appreciation | | | 362,126 | | | | 1,129,078 | |
| Net increase in net assets resulting from operations | | | 635,205 | | | | 1,220,350 | |
| | | | | | | | | |
| DISTRIBUTIONS TO SHAREHOLDERS (NOTE 4): | | | | | | | | |
| Total amount of distributions | | | | | | | | |
| Class A | | | (3,964 | ) | | | (1,601,857 | ) |
| Class C | | | (58 | ) | | | (21,254 | ) |
| Institutional Class | | | (533 | ) | | | (260,149 | ) |
| Investor Class | | | (23 | ) | | | (27,338 | ) |
| Net decrease in net assets from distributions | | | (4,578 | ) | | | (1,910,598 | ) |
| SHARE TRANSACTIONS (NOTE 6): | | | | | | | | |
| Class A | | | | | | | | |
| Proceeds from sale of shares | | | 1,751,000 | | | | 875,418 | |
| Issued to shareholders in reinvestment of distributions | | | 3,951 | | | | 1,591,552 | |
| Cost of shares redeemed | | | (1,534,181 | ) | | | (1,860,087 | ) |
| Net increase from share transactions | | | 220,770 | | | | 606,883 | |
| Class C | | | | | | | | |
| Proceeds from sale of shares | | | 5,000 | | | | 17,884 | |
| Issued to shareholders in reinvestment of distributions | | | 58 | | | | 21,254 | |
| Cost of shares redeemed | | | (14,558 | ) | | | (22,797 | ) |
| Net increase/(decrease) from share transactions | | | (9,500 | ) | | | 16,341 | |
| Institutional Class | | | | | | | | |
| Proceeds from sale of shares | | | 91,854 | | | | 282,451 | |
| Issued to shareholders in reinvestment of distributions | | | 533 | | | | 260,149 | |
| Cost of shares redeemed | | | (95,563 | ) | | | (242,872 | ) |
| Net increase/(decrease) from share transactions | | | (3,176 | ) | | | 299,728 | |
| Investor Class | | | | | | | | |
| Proceeds from sale of shares | | | 230,200 | | | | 53,100 | |
| Issued to shareholders in reinvestment of distributions | | | 23 | | | | 27,338 | |
| Cost of shares redeemed | | | (117,483 | ) | | | (20,835 | ) |
| Net increase from share transactions | | | 112,740 | | | | 59,603 | |
| Net increase in net assets | | $ | 951,461 | | | $ | 292,307 | |
| NET ASSETS: | | | | | | | | |
| Beginning of year | | | 11,096,548 | | | | 10,804,241 | |
| End of year | | $ | 12,048,009 | | | $ | 11,096,548 | |
| 48 | www.emeraldmutualfunds.com |
| Emerald Insights Fund | Statements of Changes in Net Assets |
| | | Year Ended April 30, 2020 | | | Year Ended April 30, 2019 | |
| Other Information: | | | | | | |
| SHARE TRANSACTIONS: | | | | | | |
| Class A | | | | | | |
| Sold | | | 154,193 | | | | 83,189 | |
| Distributions reinvested | | | 320 | | | | 169,134 | |
| Redeemed | | | (132,867 | ) | | | (147,542 | ) |
| Net increase in shares outstanding | | | 21,646 | | | | 104,781 | |
| Class C | | | | | | | | |
| Sold | | | 457 | | | | 2,031 | |
| Distributions reinvested | | | 5 | | | | 2,349 | |
| Redeemed | | | (1,352 | ) | | | (1,680 | ) |
| Net increase/(decrease) in shares outstanding | | | (890 | ) | | | 2,700 | |
| Institutional Class | | | | | | | | |
| Sold | | | 7,672 | | | | 19,447 | |
| Distributions reinvested | | | 42 | | | | 27,241 | |
| Redeemed | | | (7,842 | ) | | | (21,265 | ) |
| Net increase/(decrease) in shares outstanding | | | (128 | ) | | | 25,423 | |
| Investor Class | | | | | | | | |
| Sold | | | 17,898 | | | | 4,162 | |
| Distributions reinvested | | | 2 | | | | 2,921 | |
| Redeemed | | | (10,453 | ) | | | (1,500 | ) |
| Net increase in shares outstanding | | | 7,447 | | | | 5,583 | |
See Notes to Financial Statements.
| Annual Report | April 30, 2020 | 49 |
| Emerald Banking and Finance Fund | Statements of Changes in Net Assets |
| | | Year Ended April 30, 2020 | | | Year Ended April 30, 2019 | |
| OPERATIONS: | | | | | | |
| Net investment income/(loss) | | $ | 10 | | | $ | (2,526,089 | ) |
| Net realized gain/(loss) | | | (28,209,958 | ) | | | 39,986,242 | |
| Net realized gain on foreign currency transactions | | | 359 | | | | 109 | |
| Net change in unrealized depreciation | | | (43,340,341 | ) | | | (104,241,265 | ) |
| Net decrease in net assets resulting from operations | | | (71,549,930 | ) | | | (66,781,003 | ) |
| | | | | | | | | |
| DISTRIBUTIONS TO SHAREHOLDERS (NOTE 4): | | | | | | | | |
| Total amount of distributions | | | | | | | | |
| Class A | | | – | | | | (24,656,256 | ) |
| Class C | | | – | | | | (13,297,550 | ) |
| Institutional Class | | | – | | | | (37,095,621 | ) |
| Investor Class | | | – | | | | (11,056,960 | ) |
| Net decrease in net assets from distributions | | | – | | | | (86,106,387 | ) |
| SHARE TRANSACTIONS (NOTE 6): | | | | | | | | |
| Class A | | | | | | | | |
| Proceeds from sale of shares | | | 9,924,216 | | | | 42,099,315 | |
| Issued to shareholders in reinvestment of distributions | | | – | | | | 20,425,832 | |
| Cost of shares redeemed | | | (43,496,877 | ) | | | (101,578,106 | ) |
| Net decrease from share transactions | | | (33,572,661 | ) | | | (39,052,959 | ) |
| Class C | | | | | | | | |
| Proceeds from sale of shares | | | 848,614 | | | | 8,581,109 | |
| Issued to shareholders in reinvestment of distributions | | | – | | | | 11,494,938 | |
| Cost of shares redeemed | | | (23,404,122 | ) | | | (26,316,417 | ) |
| Net decrease from share transactions | | | (22,555,508 | ) | | | (6,240,370 | ) |
| Institutional Class | | | | | | | | |
| Proceeds from sale of shares | | | 18,571,845 | | | | 96,435,931 | |
| Issued to shareholders in reinvestment of distributions | | | – | | | | 24,683,933 | |
| Cost of shares redeemed | | | (76,465,031 | ) | | | (115,500,368 | ) |
| Net increase/(decrease) from share transactions | | | (57,893,186 | ) | | | 5,619,496 | |
| Investor Class | | | | | | | | |
| Proceeds from sale of shares | | | 2,109,542 | | | | 16,871,872 | |
| Issued to shareholders in reinvestment of distributions | | | – | | | | 10,138,517 | |
| Cost of shares redeemed | | | (20,635,594 | ) | | | (36,983,304 | ) |
| Net decrease from share transactions | | | (18,526,052 | ) | | | (9,972,915 | ) |
| Net decrease in net assets | | $ | (204,097,337 | ) | | $ | (202,534,138 | ) |
| NET ASSETS: | | | | | | | | |
| Beginning of year | | | 341,664,916 | | | | 544,199,054 | |
| End of year | | $ | 137,567,579 | | | $ | 341,664,916 | |
| 50 | www.emeraldmutualfunds.com |
| Emerald Banking and Finance Fund | Statements of Changes in Net Assets |
| | | Year Ended April 30, 2020 | | | Year Ended April 30, 2019 | |
| Other Information: | | | | | | |
| SHARE TRANSACTIONS: | | | | | | |
| Class A | | | | | | |
| Sold | | | 381,365 | | | | 975,875 | |
| Distributions reinvested | | | – | | | | 679,954 | |
| Redeemed | | | (1,392,033 | ) | | | (2,733,766 | ) |
| Net decrease in shares outstanding | | | (1,010,668 | ) | | | (1,077,937 | ) |
| Class C | | | | | | | | |
| Sold | | | 33,899 | | | | 233,767 | |
| Distributions reinvested | | | – | | | | 448,146 | |
| Redeemed | | | (963,709 | ) | | | (819,451 | ) |
| Net decrease in shares outstanding | | | (929,810 | ) | | | (137,538 | ) |
| Institutional Class | | | | | | | | |
| Sold | | | 578,457 | | | | 2,318,054 | |
| Distributions reinvested | | | – | | | | 798,833 | |
| Redeemed | | | (2,567,059 | ) | | | (3,002,806 | ) |
| Net increase/(decrease) in shares outstanding | | | (1,988,602 | ) | | | 114,081 | |
| Investor Class | | | | | | | | |
| Sold | | | 75,069 | | | | 392,263 | |
| Distributions reinvested | | | – | | | | 356,613 | |
| Redeemed | | | (698,446 | ) | | | (1,028,361 | ) |
| Net decrease in shares outstanding | | | (623,377 | ) | | | (279,485 | ) |
See Notes to Financial Statements.
| Annual Report | April 30, 2020 | 51 |
| Emerald Select trueLiberty Income Fund | Consolidated Statement of Changes in Net Assets |
| | | For the Period January 2, 2020 (Inception) to April 30, 2020 | |
| OPERATIONS: | | | |
| Net investment income | | $ | 3,408 | |
| Net realized loss | | | (104,640 | ) |
| Net realized loss on swap contracts | | | (538,379 | ) |
| Net change in unrealized depreciation | | | (33,180 | ) |
| Net decrease in net assets resulting from operations | | | (672,791 | ) |
| | | | | |
| SHARE TRANSACTIONS (NOTE 6): | | | | |
| Class A | | | | |
| Proceeds from sale of shares | | | 111,000 | |
| Net increase from share transactions | | | 111,000 | |
| Institutional Class | | | | |
| Proceeds from sale of shares | | | 2,018,800 | |
| Cost of shares redeemed | | | (112,485 | ) |
| Net increase from share transactions | | | 1,906,315 | |
| Net increase in net assets | | $ | 1,344,524 | |
| NET ASSETS: | | | | |
| Beginning of period | | | – | |
| End of period | | $ | 1,344,524 | |
| | | | | |
| Other Information: | | | | |
| SHARE TRANSACTIONS: | | | | |
| Class A | | | | |
| Sold | | | 11,192 | |
| Net increase in shares outstanding | | | 11,192 | |
| Institutional Class | | | | |
| Sold | | | 246,814 | |
| Redeemed | | | (29,016 | ) |
| Net increase in shares outstanding | | | 217,798 | |
See Notes to Financial Statements.
| 52 | www.emeraldmutualfunds.com |
| Emerald Growth Fund | Financial Highlights |
For a share outstanding throughout the years presented
| | | CLASS A | |
| | | Year Ended April 30, 2020 | | | Year Ended April 30, 2019 | | | Year Ended April 30, 2018 | | | Year Ended April 30, 2017 | | | Year Ended April 30, 2016 | |
| NET ASSET VALUE, BEGINNING OF PERIOD | | $ | 26.00 | | | $ | 25.99 | | | $ | 21.83 | | | $ | 17.52 | | | $ | 20.02 | |
| INCOME/(LOSS) FROM OPERATIONS: | | | | | | | | | | | | | | | | | | | | |
| Net investment loss(a) | | | (0.16 | ) | | | (0.13 | ) | | | (0.16 | ) | | | (0.11 | ) | | | (0.15 | ) |
| Net realized and unrealized gain/(loss) on investments | | | (2.40 | ) | | | 2.61 | | | | 4.32 | | | | 4.42 | | | | (1.88 | ) |
| Total from Investment Operations | | | (2.56 | ) | | | 2.48 | | | | 4.16 | | | | 4.31 | | | | (2.03 | ) |
| | | | | | | | | | | | | | | | | | | | | |
| LESS DISTRIBUTIONS: | | | | | | | | | | | | | | | | | | | | |
| From capital gains | | | (0.38 | ) | | | (2.47 | ) | | | – | | | | – | | | | (0.47 | ) |
| Total Distributions | | | (0.38 | ) | | | (2.47 | ) | | | – | | | | – | | | | (0.47 | ) |
| NET INCREASE/(DECREASE) IN NET ASSET VALUE | | | (2.94 | ) | | | 0.01 | | | | 4.16 | | | | 4.31 | | | | (2.50 | ) |
| NET ASSET VALUE, END OF PERIOD | | $ | 23.06 | | | $ | 26.00 | | | $ | 25.99 | | | $ | 21.83 | | | $ | 17.52 | |
| | | | | | | | | | | | | | | | | | | | | |
| TOTAL RETURN(b) | | | (10.00 | )% | | | 11.79 | % | | | 19.06 | % | | | 24.60 | % | | | (10.28 | )% |
| RATIOS/SUPPLEMENTAL DATA: | | | | | | | | | | | | | | | | | | | | |
| Net Assets, End of Period (000s) | | $ | 134,755 | | | $ | 188,883 | | | $ | 239,316 | | | $ | 270,389 | | | $ | 323,603 | |
| RATIOS TO AVERAGE NET ASSETS: | | | | | | | | | | | | | | | | | | | | |
| Net Investment loss | | | (0.64 | )% | | | (0.50 | )% | | | (0.64 | )% | | | (0.57 | )% | | | (0.81 | )% |
| Operating expenses excluding reimbursement/waiver | | | 1.02 | % | | | 1.01 | % | | | 1.03 | % | | | 1.08 | % | | | 1.17 | % |
| Operating expenses including reimbursement/waiver | | | 1.02 | % | | | 1.01 | % | | | 1.03 | % | | | 1.08 | % | | | 1.17 | % |
| PORTFOLIO TURNOVER RATE | | | 48 | % | | | 64 | % | | | 66 | % | | | 54 | % | | | 45 | % |
| (a) | Per share amounts are based upon average shares outstanding. |
| (b) | Total return does not reflect the effect of sales charges. |
See Notes to Financial Statements.
| Annual Report | April 30, 2020 | 53 |
| Emerald Growth Fund | Financial Highlights |
For a share outstanding throughout the years presented
| | | CLASS C | |
| | | Year Ended April 30, 2020 | | | Year Ended April 30, 2019 | | | Year Ended April 30, 2018 | | | Year Ended April 30, 2017 | | | Year Ended April 30, 2016 | |
| NET ASSET VALUE, BEGINNING OF PERIOD | | $ | 21.59 | | | $ | 22.18 | | | $ | 18.75 | | | $ | 15.14 | | | $ | 17.48 | |
| INCOME/(LOSS) FROM OPERATIONS: | | | | | | | | | | | | | | | | | | | | |
| Net investment loss(a) | | | (0.27 | ) | | | (0.26 | ) | | | (0.27 | ) | | | (0.21 | ) | | | (0.24 | ) |
| Net realized and unrealized gain/(loss) on investments | | | (1.97 | ) | | | 2.14 | | | | 3.70 | | | | 3.82 | | | | (1.63 | ) |
| Total from Investment Operations | | | (2.24 | ) | | | 1.88 | | | | 3.43 | | | | 3.61 | | | | (1.87 | ) |
| | | | | | | | | | | | | | | | | | | | | |
| LESS DISTRIBUTIONS: | | | | | | | | | | | | | | | | | | | | |
| From capital gains | | | (0.38 | ) | | | (2.47 | ) | | | – | | | | – | | | | (0.47 | ) |
| Total Distributions | | | (0.38 | ) | | | (2.47 | ) | | | – | | | | – | | | | (0.47 | ) |
| NET INCREASE/(DECREASE) IN NET ASSET VALUE | | | (2.62 | ) | | | (0.59 | ) | | | 3.43 | | | | 3.61 | | | | (2.34 | ) |
| NET ASSET VALUE, END OF PERIOD | | $ | 18.97 | | | $ | 21.59 | | | $ | 22.18 | | | $ | 18.75 | | | $ | 15.14 | |
| | | | | | | | | | | | | | | | | | | | | |
| TOTAL RETURN(b) | | | (10.57 | )% | | | 11.08 | % | | | 18.29 | % | | | 23.84 | % | | | (10.87 | )% |
| RATIOS/SUPPLEMENTAL DATA: | | | | | | | | | | | | | | | | | | | | |
| Net Assets, End of Period (000s) | | $ | 17,434 | | | $ | 29,975 | | | $ | 33,197 | | | $ | 34,642 | | | $ | 42,075 | |
| RATIOS TO AVERAGE NET ASSETS: | | | | | | | | | | | | | | | | | | | | |
| Net Investment loss | | | (1.29 | )% | | | (1.15 | )% | | | (1.30 | )% | | | (1.22 | )% | | | (1.46 | )% |
| Operating expenses excluding reimbursement/waiver | | | 1.68 | % | | | 1.66 | % | | | 1.68 | % | | | 1.73 | % | | | 1.81 | % |
| Operating expenses including reimbursement/waiver | | | 1.68 | % | | | 1.66 | % | | | 1.68 | % | | | 1.73 | % | | | 1.81 | % |
| PORTFOLIO TURNOVER RATE | | | 48 | % | | | 64 | % | | | 66 | % | | | 54 | % | | | 45 | % |
| (a) | Per share amounts are based upon average shares outstanding. |
| (b) | Total return does not reflect the effect of sales charges. |
See Notes to Financial Statements.
| 54 | www.emeraldmutualfunds.com |
| Emerald Growth Fund | Financial Highlights |
For a share outstanding throughout the years presented
| | | INSTITUTIONAL CLASS | |
| | | Year Ended April 30, 2020 | | | Year Ended April 30, 2019 | | | Year Ended April 30, 2018 | | | Year Ended April 30, 2017 | | | Year Ended April 30, 2016 | |
| NET ASSET VALUE, BEGINNING OF PERIOD | | $ | 27.16 | | | $ | 26.94 | | | $ | 22.56 | | | $ | 18.04 | | | $ | 20.54 | |
| INCOME/(LOSS) FROM OPERATIONS: | | | | | | | | | | | | | | | | | | | | |
| Net investment loss(a) | | | (0.08 | ) | | | (0.05 | ) | | | (0.09 | ) | | | (0.05 | ) | | | (0.10 | ) |
| Net realized and unrealized gain/(loss) on investments | | | (2.52 | ) | | | 2.74 | | | | 4.47 | | | | 4.57 | | | | (1.93 | ) |
| Total from Investment Operations | | | (2.60 | ) | | | 2.69 | | | | 4.38 | | | | 4.52 | | | | (2.03 | ) |
| | | | | | | | | | | | | | | | | | | | | |
| LESS DISTRIBUTIONS: | | | | | | | | | | | | | | | | | | | | |
| From capital gains | | | (0.38 | ) | | | (2.47 | ) | | | – | | | | – | | | | (0.47 | ) |
| Total Distributions | | | (0.38 | ) | | | (2.47 | ) | | | – | | | | – | | | | (0.47 | ) |
| NET INCREASE/(DECREASE) IN NET ASSET VALUE | | | (2.98 | ) | | | 0.22 | | | | 4.38 | | | | 4.52 | | | | (2.50 | ) |
| NET ASSET VALUE, END OF PERIOD | | $ | 24.18 | | | $ | 27.16 | | | $ | 26.94 | | | $ | 22.56 | | | $ | 18.04 | |
| | | | | | | | | | | | | | | | | | | | | |
| TOTAL RETURN | | | (9.72 | )% | | | 12.17 | % | | | 19.41 | % | | | 25.06 | % | | | (9.97 | )% |
| RATIOS/SUPPLEMENTAL DATA: | | | | | | | | | | | | | | | | | | | | |
| Net Assets, End of Period (000s) | | $ | 863,360 | | | $ | 1,050,538 | | | $ | 839,076 | | | $ | 596,550 | | | $ | 453,190 | |
| RATIOS TO AVERAGE NET ASSETS: | | | | | | | | | | | | | | | | | | | | |
| Net Investment loss | | | (0.32 | )% | | | (0.18 | )% | | | (0.33 | )% | | | (0.26 | )% | | | (0.51 | )% |
| Operating expenses excluding reimbursement/waiver | | | 0.70 | % | | | 0.69 | % | | | 0.72 | % | | | 0.77 | % | | | 0.87 | % |
| Operating expenses including reimbursement/waiver | | | 0.70 | % | | | 0.69 | % | | | 0.72 | % | | | 0.77 | % | | | 0.87 | % |
| PORTFOLIO TURNOVER RATE | | | 48 | % | | | 64 | % | | | 66 | % | | | 54 | % | | | 45 | % |
| (a) | Per share amounts are based upon average shares outstanding. |
See Notes to Financial Statements.
| Annual Report | April 30, 2020 | 55 |
| Emerald Growth Fund | Financial Highlights |
For a share outstanding throughout the years presented
| | | INVESTOR CLASS |
| | | Year Ended April 30, 2020 | | | Year Ended April 30, 2019 | | | Year Ended April 30, 2018 | | | Year Ended April 30, 2017 | | | Year Ended April 30, 2016 | |
| NET ASSET VALUE, BEGINNING OF PERIOD | | $ | 25.88 | | | $ | 25.88 | | | $ | 21.75 | | | $ | 17.46 | | | $ | 19.97 | |
| INCOME/(LOSS) FROM OPERATIONS: | | | | | | | | | | | | | | | | | | | | |
| Net investment loss(a) | | | (0.17 | ) | | | (0.14 | ) | | | (0.17 | ) | | | (0.12 | ) | | | (0.16 | ) |
| Net realized and unrealized gain/(loss) on investments | | | (2.39 | ) | | | 2.61 | | | | 4.30 | | | | 4.41 | | | | (1.88 | ) |
| Total from Investment Operations | | | (2.56 | ) | | | 2.47 | | | | 4.13 | | | | 4.29 | | | | (2.04 | ) |
| | | | | | | | | | | | | | | | | | | | | |
| LESS DISTRIBUTIONS: | | | | | | | | | | | | | | | | | | | | |
| From capital gains | | | (0.38 | ) | | | (2.47 | ) | | | – | | | | – | | | | (0.47 | ) |
| Total Distributions | | | (0.38 | ) | | | (2.47 | ) | | | – | | | | – | | | | (0.47 | ) |
| NET INCREASE/(DECREASE) IN NET ASSET VALUE | | | (2.94 | ) | | | 0.00 | | | | 4.13 | | | | 4.29 | | | | (2.51 | ) |
| NET ASSET VALUE, END OF PERIOD | | $ | 22.94 | | | $ | 25.88 | | | $ | 25.88 | | | $ | 21.75 | | | $ | 17.46 | |
| | | | | | | | | | | | | | | | | | | | | |
| TOTAL RETURN | | | (10.05 | )% | | | 11.81 | % | | | 18.99 | % | | | 24.57 | % | | | (10.36 | )% |
| RATIOS/SUPPLEMENTAL DATA: | | | | | | | | | | | | | | | | | | | | |
| Net Assets, End of Period (000s) | | $ | 80,740 | | | $ | 104,403 | | | $ | 107,629 | | | $ | 114,033 | | | $ | 112,526 | |
| RATIOS TO AVERAGE NET ASSETS: | | | | | | | | | | | | | | | | | | | | |
| Net Investment loss | | | (0.68 | )% | | | (0.53 | )% | | | (0.68 | )% | | | (0.61 | )% | | | (0.84 | )% |
| Operating expenses excluding reimbursement/waiver | | | 1.06 | % | | | 1.04 | % | | | 1.07 | % | | | 1.12 | % | | | 1.19 | % |
| Operating expenses including reimbursement/waiver | | | 1.06 | % | | | 1.04 | % | | | 1.07 | % | | | 1.12 | % | | | 1.19 | % |
| PORTFOLIO TURNOVER RATE | | | 48 | % | | | 64 | % | | | 66 | % | | | 54 | % | | | 45 | % |
| (a) | Per share amounts are based upon average shares outstanding. |
See Notes to Financial Statements.
| 56 | www.emeraldmutualfunds.com |
| Emerald Small Cap Value Fund | Financial Highlights |
For a share outstanding throughout the years presented
| | | CLASS A | |
| | | Year Ended April 30, 2020 | | | Year Ended April 30, 2019 | | | Year Ended April 30, 2018 | | | Year Ended April 30, 2017 | | | For the Period October 1, 2015 to April 30, 2016(a) | | | Period Ended September 30, 2015(b) | |
| NET ASSET VALUE, BEGINNING OF PERIOD | | $ | 7.29 | | | $ | 10.45 | | | $ | 16.27 | | | $ | 13.00 | | | $ | 12.70 | | | $ | 14.12 | |
| INCOME/(LOSS) FROM OPERATIONS: | | | | | | | | | | | | | | | | | | | | | | | | |
| Net investment loss(c) | | | (0.01 | ) | | | (0.02 | ) | | | (0.06 | )(d) | | | (0.07 | )(d) | | | (0.09 | ) | | | (0.01 | ) |
| Net realized and unrealized gain/(loss) on investments | | | (2.03 | ) | | | (1.06 | ) | | | 2.13 | | | | 3.34 | | | | 0.44 | | | | (1.03 | ) |
| Total from Investment Operations | | | (2.04 | ) | | | (1.08 | ) | | | 2.07 | | | | 3.27 | | | | 0.35 | | | | (1.04 | ) |
| | | | | | | | | | | | | | | | | | | | | | | | | |
| LESS DISTRIBUTIONS: | | | | | | | | | | | | | | | | | | | | | | | | |
| From investment income | | | – | | | | – | | | | – | | | | – | | | | (0.05 | ) | | | – | |
| From capital gains | | | – | | | | (2.08 | ) | | | (7.89 | ) | | | – | | | | – | | | | (0.38 | ) |
| Total Distributions | | | – | | | | (2.08 | ) | | | (7.89 | ) | | | – | | | | (0.05 | ) | | | (0.38 | ) |
| NET INCREASE/(DECREASE) IN NET ASSET VALUE | | | (2.04 | ) | | | (3.16 | ) | | | (5.82 | ) | | | 3.27 | | | | 0.30 | | | | (1.42 | ) |
| NET ASSET VALUE, END OF PERIOD | | $ | 5.25 | | | $ | 7.29 | | | $ | 10.45 | | | $ | 16.27 | | | $ | 13.00 | | | $ | 12.70 | |
| | | | | | | | | | | | | | | | | | | | | | | | | |
| TOTAL RETURN(e) | | | (27.98 | )% | | | (7.30 | )% | | | 12.41 | % | | | 25.15 | % | | | 2.77 | %(f) | | | (7.49 | )%(f) |
| RATIOS/SUPPLEMENTAL DATA: | | | | | | | | | | | | | | | | | | | | | | | | |
| Net Assets, End of Period (000s) | | $ | 1,068 | | | $ | 2,664 | | | $ | 3,959 | | | $ | 1,909 | | | $ | 340 | | | $ | 14 | |
| RATIOS TO AVERAGE NET ASSETS: | | | | | | | | | | | | | | | | | | | | | | | | |
| Net Investment loss | | | (0.13 | )% | | | (0.19 | )% | | | (0.42 | )% | | | (0.46 | )% | | | (1.13 | )%(g) | | | (0.24 | )%(g) |
| Operating expenses excluding reimbursement/waiver | | | 5.35 | % | | | 2.89 | % | | | 2.56 | % | | | 2.26 | % | | | 2.69 | %(g) | | | 2.16 | %(g) |
| Operating expenses including reimbursement/waiver | | | 1.35 | % | | | 1.35 | % | | | 1.35 | % | | | 1.35 | % | | | 1.35 | %(g) | | | 1.35 | %(g) |
| PORTFOLIO TURNOVER RATE | | | 79 | % | | | 101 | % | | | 71 | % | | | 66 | % | | | 31 | %(f) | | | 69 | %(f)(h) |
| (a) | Effective March 3, 2015 the Board approved changing the fiscal year-end of the Fund from September 30 to April 30. |
| (b) | Class A commenced operations on June 30, 2015. |
| (c) | Per share amounts are based upon average shares outstanding. |
| (d) | The amount shown for a share outstanding throughout the period may not correlate with the Statement of Operations for the period due to the timing of sales and redemptions of Fund shares in relation to income earned and/or fluctuating market value of the investments of the Fund. |
| (e) | Total return does not reflect the effect of sales charges. |
| (h) | Portfolio turnover rate is calculated at the Fund level and represents the year ended September 30, 2015. |
See Notes to Financial Statements.
| Annual Report | April 30, 2020 | 57 |
| Emerald Small Cap Value Fund | Financial Highlights |
For a share outstanding throughout the years presented
| | | CLASS C | |
| | | Year Ended April 30, 2020 | | | Year Ended April 30, 2019 | | | Year Ended April 30, 2018 | | | Year Ended April 30, 2017 | | | For the Period October 1, 2015 to April 30, 2016(a) | | | Period Ended September 30, 2015(b) | |
| NET ASSET VALUE, BEGINNING OF PERIOD | | $ | 6.96 | | | $ | 10.15 | | | $ | 16.10 | | | $ | 12.94 | | | $ | 12.68 | | | $ | 14.12 | |
| INCOME/(LOSS) FROM OPERATIONS: | | | | | | | | | | | | | | | | | | | | | | | | |
| Net investment loss(c) | | | (0.05 | ) | | | (0.08 | ) | | | (0.13 | )(d) | | | (0.13 | )(d) | | | (0.14 | ) | | | (0.03 | ) |
| Net realized and unrealized gain/(loss) on investments | | | (1.93 | ) | | | (1.03 | ) | | | 2.07 | | | | 3.29 | | | | 0.43 | | | | (1.03 | ) |
| Total from Investment Operations | | | (1.98 | ) | | | (1.11 | ) | | | 1.94 | | | | 3.16 | | | | 0.29 | | | | (1.06 | ) |
| | | | | | | | | | | | | | | | | | | | | | | | | |
| LESS DISTRIBUTIONS: | | | | | | | | | | | | | | | | | | | | | | | | |
| From investment income | | | – | | | | – | | | | – | | | | – | | | | (0.03 | ) | | | – | |
| From capital gains | | | – | | | | (2.08 | ) | | | (7.89 | ) | | | – | | | | – | | | | (0.38 | ) |
| Total Distributions | | | – | | | | (2.08 | ) | | | (7.89 | ) | | | – | | | | (0.03 | ) | | | (0.38 | ) |
| NET INCREASE/(DECREASE) IN NET ASSET VALUE | | | (1.98 | ) | | | (3.19 | ) | | | (5.95 | ) | | | 3.16 | | | | 0.26 | | | | (1.44 | ) |
| NET ASSET VALUE, END OF PERIOD | | $ | 4.98 | | | $ | 6.96 | | | $ | 10.15 | | | $ | 16.10 | | | $ | 12.94 | | | $ | 12.68 | |
| | | | | | | | | | | | | | | | | | | | | | | | | |
| TOTAL RETURN(e) | | | (28.45 | )% | | | (7.88 | )% | | | 11.63 | % | | | 24.42 | % | | | 2.28 | %(f) | | | (7.63 | )%(f) |
| RATIOS/SUPPLEMENTAL DATA: | | | | | | | | | | | | | | | | | | | | | | | | |
| Net Assets, End of Period (000s) | | $ | 28 | | | $ | 38 | | | $ | 108 | | | $ | 211 | | | $ | 566 | | | $ | 14 | |
| RATIOS TO AVERAGE NET ASSETS: | | | | | | | | | | | | | | | | | | | | | | | | |
| Net Investment loss | | | (0.76 | )% | | | (0.88 | )% | | | (0.98 | )% | | | (0.93 | )% | | | (2.06 | )%(g) | | | (0.89 | )%(g) |
| Operating expenses excluding reimbursement/waiver | | | 6.20 | % | | | 3.44 | % | | | 3.20 | % | | | 2.70 | % | | | 3.37 | %(g) | | | 2.81 | %(g) |
| Operating expenses including reimbursement/waiver | | | 2.00 | % | | | 2.00 | % | | | 2.00 | % | | | 2.00 | % | | | 2.00 | %(g) | | | 2.00 | %(g) |
| PORTFOLIO TURNOVER RATE | | | 79 | % | | | 101 | % | | | 71 | % | | | 66 | % | | | 31 | %(f) | | | 69 | %(f)(h) |
| (a) | Effective March 3, 2015 the Board approved changing the fiscal year-end of the Fund from September 30 to April 30. |
| (b) | Class C commenced operations on June 30, 2015. |
| (c) | Per share amounts are based upon average shares outstanding. |
| (d) | The amount shown for a share outstanding throughout the period may not correlate with the Statement of Operations for the period due to the timing of sales and redemptions of Fund shares in relation to income earned and/or fluctuating market value of the investments of the Fund. |
| (e) | Total return does not reflect the effect of sales charges. |
| (h) | Portfolio turnover rate is calculated at the Fund level and represents the year ended September 30, 2015. |
See Notes to Financial Statements.
| 58 | www.emeraldmutualfunds.com |
| Emerald Small Cap Value Fund | Financial Highlights |
For a share outstanding throughout the years presented
| | | INSTITUTIONAL CLASS | |
| | | Year Ended April 30, 2020 | | | Year Ended April 30, 2019 | | | Year Ended April 30, 2018 | | | Year Ended April 30, 2017 | | | For the Period October 1, 2015 to April 30, 2016(a) | | | Year Ended September 30, 2015(b) | |
| NET ASSET VALUE, BEGINNING OF PERIOD | | $ | 7.46 | | | $ | 10.59 | | | $ | 16.35 | | | $ | 13.02 | | | $ | 12.71 | | | $ | 12.76 | |
| INCOME FROM OPERATIONS: | | | | | | | | | | | | | | | | | | | | | | | | |
| Net investment income/(loss)(c) | | | 0.02 | | | | 0.01 | (d) | | | 0.00 | (e) | | | 0.02 | | | | (0.01 | ) | | | 0.06 | |
| Net realized and unrealized gain/(loss) on investments | | | (2.09 | ) | | | (1.06 | ) | | | 2.13 | | | | 3.31 | | | | 0.38 | | | | 0.33 | |
| Total from Investment Operations | | | (2.07 | ) | | | (1.05 | ) | | | 2.13 | | | | 3.33 | | | | 0.37 | | | | 0.39 | |
| | | | | | | | | | | | | | | | | | | | | | | | | |
| LESS DISTRIBUTIONS: | | | | | | | | | | | | | | | | | | | | | | | | |
| From investment income | | | – | | | | – | | | | – | | | | – | | | | (0.06 | ) | | | (0.06 | ) |
| From capital gains | | | – | | | | (2.08 | ) | | | (7.89 | ) | | | – | | | | – | | | | (0.38 | ) |
| Total Distributions | | | – | | | | (2.08 | ) | | | (7.89 | ) | | | – | | | | (0.06 | ) | | | (0.44 | ) |
| NET INCREASE/(DECREASE) IN NET ASSET VALUE | | | (2.07 | ) | | | (3.13 | ) | | | (5.76 | ) | | | 3.33 | | | | 0.31 | | | | (0.05 | ) |
| NET ASSET VALUE, END OF PERIOD | | $ | 5.39 | | | $ | 7.46 | | | $ | 10.59 | | | $ | 16.35 | | | $ | 13.02 | | | $ | 12.71 | |
| | | | | | | | | | | | | | | | | | | | | | | | | |
| TOTAL RETURN | | | (27.75 | )% | | | (6.90 | )% | | | 12.76 | % | | | 25.58 | % | | | 2.94 | %(f) | | | 2.93 | % |
| SUPPLEMENTAL DATA: | | | | | | | | | | | | | | | | | | | | | | | | |
| Net Assets, End of Period (000s) | | $ | 501 | | | $ | 874 | | | $ | 3,177 | | | $ | 4,989 | | | $ | 13,691 | | | $ | 16,507 | |
| RATIOS TO AVERAGE NET ASSETS: | | | | | | | | | | | | | | | | | | | | | | | | |
| Net Investment income/(loss) | | | 0.23 | % | | | 0.13 | % | | | 0.02 | % | | | 0.13 | % | | | (0.07 | )%(g) | | | 0.45 | % |
| Operating expenses excluding reimbursement/waiver | | | 5.12 | % | | | 2.44 | % | | | 2.20 | % | | | 1.56 | % | | | 1.75 | %(g) | | | 1.43 | % |
| Operating expenses including reimbursement/waiver | | | 1.00 | % | | | 1.00 | % | | | 1.00 | % | | | 1.00 | % | | | 1.00 | %(g) | | | 1.00 | % |
| PORTFOLIO TURNOVER RATE | | | 79 | % | | | 101 | % | | | 71 | % | | | 66 | % | | | 31 | %(f) | | | 69 | % |
| (a) | Effective March 3, 2015 the Board approved changing the fiscal year-end of the Fund from September 30 to April 30. |
| (b) | Prior to its June 26, 2015 reorganization with and into the Emerald Small Cap Value Fund, the Fund was known as the Elessar Small Cap Value Fund. |
| (c) | Per share amounts are based upon average shares outstanding. |
| (d) | The amount shown for a share outstanding throughout the period may not correlate with the Statement of Operations for the period due to the timing of sales and redemptions of Fund shares in relation to income earned and/or fluctuating market value of the investments of the Fund. |
| (e) | Less than $0.005 per share. |
See Notes to Financial Statements.
| Annual Report | April 30, 2020 | 59 |
| Emerald Small Cap Value Fund | Financial Highlights |
For a share outstanding throughout the years presented
| | | INVESTOR CLASS | |
| | | Year Ended April 30, 2020 | | | Year Ended April 30, 2019 | | | Year Ended April 30, 2018 | | | Year Ended April 30, 2017 | | | For the Period October 1, 2015 to April 30, 2016(a) | | | Year Ended September 30, 2015(b) | |
| NET ASSET VALUE, BEGINNING OF PERIOD | | $ | 7.33 | | | $ | 10.46 | | | $ | 16.26 | | | $ | 12.98 | | | $ | 12.68 | | | $ | 12.73 | |
| INCOME FROM OPERATIONS: | | | | | | | | | | | | | | | | | | | | | | | | |
| Net investment income/(loss)(c) | | | (0.00 | )(d) | | | (0.01 | ) | | | (0.04 | )(e) | | | (0.02 | )(e) | | | (0.02 | ) | | | 0.03 | |
| Net realized and unrealized gain/(loss) on investments | | | (2.04 | ) | | | (1.04 | ) | | | 2.13 | | | | 3.30 | | | | 0.37 | | | | 0.35 | |
| Total from Investment Operations | | | (2.04 | ) | | | (1.05 | ) | | | 2.09 | | | | 3.28 | | | | 0.35 | | | | 0.38 | |
| | | | | | | | | | | | | | | | | | | | | | | | | |
| LESS DISTRIBUTIONS: | | | | | | | | | | | | | | | | | | | | | | | | |
| From investment income | | | – | | | | – | | | | – | | | | – | | | | (0.05 | ) | | | (0.05 | ) |
| From capital gains | | | – | | | | (2.08 | ) | | | (7.89 | ) | | | – | | | | – | | | | (0.38 | ) |
| Total Distributions | | | – | | | | (2.08 | ) | | | (7.89 | ) | | | – | | | | (0.05 | ) | | | (0.43 | ) |
| NET INCREASE/(DECREASE) IN NET ASSET VALUE | | | (2.04 | ) | | | (3.13 | ) | | | (5.80 | ) | | | 3.28 | | | | 0.30 | | | | (0.05 | ) |
| NET ASSET VALUE, END OF PERIOD | | $ | 5.29 | | | $ | 7.33 | | | $ | 10.46 | | | $ | 16.26 | | | $ | 12.98 | | | $ | 12.68 | |
| | | | | | | | | | | | | | | | | | | | | | | | | |
| TOTAL RETURN | | | (27.83 | )% | | | (6.99 | )% | | | 12.54 | % | | | 25.27 | % | | | 2.80 | %(f) | | | 2.82 | % |
| SUPPLEMENTAL DATA: | | | | | | | | | | | | | | | | | | | | | | | | |
| Net Assets, End of Period (000s) | | $ | 333 | | | $ | 509 | | | $ | 556 | | | $ | 614 | | | $ | 1,946 | | | $ | 399 | |
| RATIOS TO AVERAGE NET ASSETS: | | | | | | | | | | | | | | | | | | | | | | | | |
| Net Investment income/(loss) | | | (0.02 | )% | | | (0.10 | )% | | | (0.25 | )% | | | (0.11 | )% | | | (0.25 | )%(g) | | | 0.22 | % |
| Operating expenses excluding reimbursement/waiver | | | 5.39 | % | | | 2.83 | % | | | 2.44 | % | | | 1.83 | % | | | 2.14 | %(g) | | | 1.67 | % |
| Operating expenses including reimbursement/waiver | | | 1.25 | % | | | 1.25 | % | | | 1.25 | % | | | 1.25 | % | | | 1.25 | %(g) | | | 1.25 | % |
| PORTFOLIO TURNOVER RATE | | | 79 | % | | | 101 | % | | | 71 | % | | | 66 | % | | | 31 | %(f) | | | 69 | % |
| (a) | Effective March 3, 2015 the Board approved changing the fiscal year-end of the Fund from September 30 to April 30. |
| (b) | Prior to its June 26, 2015 reorganization with and into the Emerald Small Cap Value Fund, the Fund was known as the Elessar Small Cap Value Fund. |
| (c) | Per share amounts are based upon average shares outstanding. |
| (d) | Less than $0.005 per share. |
| (e) | The amount shown for a share outstanding throughout the period may not correlate with the Statement of Operations for the period due to the timing of sales and redemptions of Fund shares in relation to income earned and/or fluctuating market value of the investments of the Fund. |
See Notes to Financial Statements.
| 60 | www.emeraldmutualfunds.com |
| Emerald Insights Fund | Financial Highlights |
For a share outstanding throughout the years presented
| | | CLASS A | |
| | | Year Ended April 30, 2020 | | | Year Ended April 30, 2019 | | | Year Ended April 30, 2018 | | | Year Ended April 30, 2017 | | | Year Ended April 30, 2016 | |
| NET ASSET VALUE, BEGINNING OF PERIOD | | $ | 11.51 | | | $ | 13.09 | | | $ | 11.33 | | | $ | 9.69 | | | $ | 10.98 | |
| INCOME/(LOSS) FROM OPERATIONS: | | | | | | | | | | | | | | | | | | | | |
| Net investment loss(a) | | | (0.10 | ) | | | (0.09 | ) | | | (0.07 | ) | | | (0.06 | ) | | | (0.05 | ) |
| Net realized and unrealized gain/(loss) on investments | | | 0.72 | | | | 1.04 | | | | 1.83 | | | | 1.70 | | | | (1.24 | ) |
| Total from Investment Operations | | | 0.62 | | | | 0.95 | | | | 1.76 | | | | 1.64 | | | | (1.29 | ) |
| | | | | | | | | | | | | | | | | | | | | |
| LESS DISTRIBUTIONS: | | | | | | | | | | | | | | | | | | | | |
| From capital gains | | | 0.00 | (b) | | | (2.53 | ) | | | – | | | | – | | | | – | |
| Total Distributions | | | – | | | | (2.53 | ) | | | – | | | | – | | | | – | |
| NET INCREASE/(DECREASE) IN NET ASSET VALUE | | | 0.62 | | | | (1.58 | ) | | | 1.76 | | | | 1.64 | | | | (1.29 | ) |
| NET ASSET VALUE, END OF PERIOD | | $ | 12.13 | | | $ | 11.51 | | | $ | 13.09 | | | $ | 11.33 | | | $ | 9.69 | |
| | | | | | | | | | | | | | | | | | | | | |
| TOTAL RETURN(c) | | | 5.43 | % | | | 11.53 | % | | | 15.53 | % | | | 16.92 | % | | | (11.75 | %) |
| RATIOS/SUPPLEMENTAL DATA: | | | | | | | | | | | | | | | | | | | | |
| Net Assets, End of Period (000s) | | $ | 10,174 | | | $ | 9,397 | | | $ | 9,321 | | | $ | 10,127 | | | $ | 11,388 | |
| RATIOS TO AVERAGE NET ASSETS: | | | | | | | | | | | | | | | | | | | | |
| Net Investment loss | | | (0.83 | %) | | | (0.71 | %) | | | (0.58 | %) | | | (0.57 | %) | | | (0.54 | %) |
| Operating expenses excluding reimbursement/waiver | | | 2.25 | % | | | 2.18 | % | | | 2.10 | % | | | 2.10 | % | | | 2.01 | % |
| Operating expenses including reimbursement/waiver | | | 1.35 | % | | | 1.35 | % | | | 1.35 | % | | | 1.35 | % | | | 1.35 | % |
| PORTFOLIO TURNOVER RATE | | | 94 | % | | | 63 | % | | | 138 | % | | | 75 | % | | | 99 | % |
| (a) | Per share amounts are based upon average shares outstanding. |
| (b) | Less than $(0.005) per share. |
| (c) | Total return does not reflect the effect of sales charges. |
See Notes to Financial Statements.
| Annual Report | April 30, 2020 | 61 |
| Emerald Insights Fund | Financial Highlights |
For a share outstanding throughout the years presented
| | | CLASS C | |
| | | Year Ended April 30, 2020 | | | Year Ended April 30, 2019 | | | Year Ended April 30, 2018 | | | Year Ended April 30, 2017 | | | Year Ended April 30, 2016 | |
| NET ASSET VALUE, BEGINNING OF PERIOD | | $ | 11.04 | | | $ | 12.75 | | | $ | 11.11 | | | $ | 9.56 | | | $ | 10.92 | |
| INCOME/(LOSS) FROM OPERATIONS: | | | | | | | | | | | | | | | | | | | | |
| Net investment loss(a) | | | (0.16 | ) | | | (0.16 | ) | | | (0.15 | ) | | | (0.13 | ) | | | (0.11 | ) |
| Net realized and unrealized gain/(loss) on investments | | | 0.69 | | | | 0.98 | | | | 1.79 | | | | 1.68 | | | | (1.25 | ) |
| Total from Investment Operations | | | 0.53 | | | | 0.82 | | | | 1.64 | | | | 1.55 | | | | (1.36 | ) |
| | | | | | | | | | | | | | | | | | | | | |
| LESS DISTRIBUTIONS: | | | | | | | | | | | | | | | | | | | | |
| From capital gains | | | 0.00 | (b) | | | (2.53 | ) | | | – | | | | – | | | | – | |
| Total Distributions | | | – | | | | (2.53 | ) | | | – | | | | – | | | | – | |
| NET INCREASE/(DECREASE) IN NET ASSET VALUE | | | 0.53 | | | | (1.71 | ) | | | 1.64 | | | | 1.55 | | | | (1.36 | ) |
| NET ASSET VALUE, END OF PERIOD | | $ | 11.57 | | | $ | 11.04 | | | $ | 12.75 | | | $ | 11.11 | | | $ | 9.56 | |
| | | | | | | | | | | | | | | | | | | | | |
| TOTAL RETURN(c) | | | 4.84 | % | | | 10.75 | % | | | 14.76 | % | | | 16.21 | % | | | (12.45 | %) |
| RATIOS/SUPPLEMENTAL DATA: | | | | | | | | | | | | | | | | | | | | |
| Net Assets, End of Period (000s) | | $ | 138 | | | $ | 141 | | | $ | 129 | | | $ | 112 | | | $ | 101 | |
| RATIOS TO AVERAGE NET ASSETS: | | | | | | | | | | | | | | | | | | | | |
| Net Investment loss | | | (1.48 | %) | | | (1.36 | %) | | | (1.24 | %) | | | (1.22 | %) | | | (1.17 | %) |
| Operating expenses excluding reimbursement/waiver | | | 2.90 | % | | | 2.84 | % | | | 2.75 | % | | | 2.76 | % | | | 2.70 | % |
| Operating expenses including reimbursement/waiver | | | 2.00 | % | | | 2.00 | % | | | 2.00 | % | | | 2.00 | % | | | 2.00 | % |
| PORTFOLIO TURNOVER RATE | | | 94 | % | | | 63 | % | | | 138 | % | | | 75 | % | | | 99 | % |
| (a) | Per share amounts are based upon average shares outstanding. |
| (b) | Less than $(0.005) per share. |
| (c) | Total return does not reflect the effect of sales charges. |
See Notes to Financial Statements.
| 62 | www.emeraldmutualfunds.com |
| Emerald Insights Fund | Financial Highlights |
For a share outstanding throughout the years presented
| | | | | | INSTITUTIONAL CLASS | | | | |
| | | Year Ended April 30, 2020 | | | Year Ended April 30, 2019 | | | Year Ended April 30, 2018 | | | Year Ended April 30, 2017 | | | Year Ended April 30, 2016 | |
| NET ASSET VALUE, BEGINNING OF PERIOD | | $ | 11.69 | | | $ | 13.22 | | | $ | 11.41 | | | $ | 9.73 | | | $ | 10.99 | |
| INCOME/(LOSS) FROM OPERATIONS: | | | | | | | | | | | | | | | | | | | | |
| Net investment loss(a) | | | (0.06 | ) | | | (0.05 | ) | | | (0.04 | ) | | | (0.03 | ) | | | (0.00 | )(b) |
| Net realized and unrealized gain/(loss) on investments | | | 0.74 | | | | 1.05 | | | | 1.85 | | | | 1.71 | | | | (1.26 | ) |
| Total from Investment Operations | | | 0.68 | | | | 1.00 | | | | 1.81 | | | | 1.68 | | | | (1.26 | ) |
| | | | | | | | | | | | | | | | | | | | | |
| LESS DISTRIBUTIONS: | | | | | | | | | | | | | | | | | | | | |
| From capital gains | | | 0.00 | (c) | | | (2.53 | ) | | | – | | | | – | | | | – | |
| Total Distributions | | | – | | | | (2.53 | ) | | | – | | �� | | – | | | | – | |
| NET INCREASE/(DECREASE) IN NET ASSET VALUE | | | 0.68 | | | | (1.53 | ) | | | 1.81 | | | | 1.68 | | | | (1.26 | ) |
| NET ASSET VALUE, END OF PERIOD | | $ | 12.37 | | | $ | 11.69 | | | $ | 13.22 | | | $ | 11.41 | | | $ | 9.73 | |
| | | | | | | | | | | | | | | | | | | | | |
| TOTAL RETURN | | | 5.85 | % | | | 11.81 | % | | | 15.86 | % | | | 17.27 | % | | | (11.46 | %) |
| RATIOS/SUPPLEMENTAL DATA: | | | | | | | | | | | | | | | | | | | | |
| Net Assets, End of Period (000s) | | $ | 1,462 | | | $ | 1,383 | | | $ | 1,228 | | | $ | 1,048 | | | $ | 1,729 | |
| RATIOS TO AVERAGE NET ASSETS: | | | | | | | | | | | | | | | | | | | | |
| Net Investment loss | | | (0.53 | %) | | | (0.41 | %) | | | (0.29 | %) | | | (0.28 | %) | | | (0.05 | %) |
| Operating expenses excluding reimbursement/waiver | | | 1.93 | % | | | 1.87 | % | | | 1.77 | % | | | 1.78 | % | | | 1.90 | % |
| Operating expenses including reimbursement/waiver | | | 1.05 | % | | | 1.05 | % | | | 1.05 | % | | | 1.05 | % | | | 1.05 | % |
| PORTFOLIO TURNOVER RATE | | | 94 | % | | | 63 | % | | | 138 | % | | | 75 | % | | | 99 | % |
| (a) | Per share amounts are based upon average shares outstanding. |
| (b) | Less than $0.005 per share. |
| (c) | Less than $(0.005) per share. |
See Notes to Financial Statements.
| Annual Report | April 30, 2020 | 63 |
| Emerald Insights Fund | Financial Highlights |
For a share outstanding throughout the years presented
| | | INVESTOR CLASS | |
| | | Year Ended April 30, 2020 | | | Year Ended April 30, 2019 | | | Year Ended April 30, 2018 | | | Year Ended April 30, 2017 | | | Year Ended April 30, 2016 | |
| NET ASSET VALUE, BEGINNING OF PERIOD | | $ | 11.45 | | | $ | 13.05 | | | $ | 11.29 | | | $ | 9.67 | | | $ | 10.96 | |
| INCOME/(LOSS) FROM OPERATIONS: | | | | | | | | | | | | | | | | | | | | |
| Net investment loss(a) | | | (0.09 | ) | | | (0.10 | ) | | | (0.08 | ) | | | (0.07 | ) | | | (0.08 | ) |
| Net realized and unrealized gain/(loss) on investments | | | 0.71 | | | | 1.03 | | | | 1.84 | | | | 1.69 | | | | (1.21 | ) |
| Total from Investment Operations | | | 0.62 | | | | 0.93 | | | | 1.76 | | | | 1.62 | | | | (1.29 | ) |
| | | | | | | | | | | | | | | | | | | | | |
| LESS DISTRIBUTIONS: | | | | | | | | | | | | | | | | | | | | |
| From capital gains | | | 0.00 | (b) | | | (2.53 | ) | | | – | | | | – | | | | – | |
| Total Distributions | | | – | | | | (2.53 | ) | | | – | | | | – | | | | – | |
| NET INCREASE/(DECREASE) IN NET ASSET VALUE | | | 0.62 | | | | (1.60 | ) | | | 1.76 | | | | 1.62 | | | | (1.29 | ) |
| NET ASSET VALUE, END OF PERIOD | | $ | 12.07 | | | $ | 11.45 | | | $ | 13.05 | | | $ | 11.29 | | | $ | 9.67 | |
| | | | | | | | | | | | | | | | | | | | | |
| TOTAL RETURN | | | 5.45 | % | | | 11.41 | % | | | 15.59 | % | | | 16.75 | % | | | (11.77 | %) |
| | | | | | | | | | | | | | | | | | | | | |
| RATIOS/SUPPLEMENTAL DATA: | | | | | | | | | | | | | | | | | | | | |
| Net Assets, End of Period (000s) | | $ | 274 | | | $ | 174 | | | $ | 126 | | | $ | 88 | | | $ | 86 | |
| RATIOS TO AVERAGE NET ASSETS: | | | | | | | | | | | | | | | | | | | | |
| Net Investment loss | | | (0.82 | %) | | | (0.77 | %) | | | (0.65 | %) | | | (0.63 | %) | | | (0.72 | %) |
| Operating expenses excluding reimbursement/waiver | | | 2.17 | % | | | 2.08 | % | | | 2.07 | % | | | 2.09 | % | | | 1.91 | % |
| Operating expenses including reimbursement/waiver | | | 1.40 | % | | | 1.40 | % | | | 1.40 | % | | | 1.40 | % | | | 1.40 | % |
| PORTFOLIO TURNOVER RATE | | | 94 | % | | | 63 | % | | | 138 | % | | | 75 | % | | | 99 | % |
| (a) | Per share amounts are based upon average shares outstanding. |
| (b) | Less than $(0.005) per share. |
See Notes to Financial Statements.
| 64 | www.emeraldmutualfunds.com |
| Emerald Banking and Finance Fund | Financial Highlights |
For a share outstanding throughout the years presented
| | | CLASS A | |
| | | Year Ended April 30, 2020 | | | Year Ended April 30, 2019 | | | Year Ended April 30, 2018 | | | Year Ended April 30, 2017 | | | Year Ended April 30, 2016 | |
| NET ASSET VALUE, BEGINNING OF PERIOD | | $ | 32.71 | | | $ | 46.01 | | | $ | 41.61 | | | $ | 31.27 | | | $ | 28.85 | |
| INCOME/(LOSS) FROM OPERATIONS: | | | | | | | | | | | | | | | | | | | | |
| Net investment loss(a) | | | (0.03 | ) | | | (0.24 | ) | | | (0.29 | ) | | | (0.17 | ) | | | (0.06 | ) |
| Net realized and unrealized gain/(loss) on investments | | | (9.79 | ) | | | (5.35 | ) | | | 5.98 | | | | 10.51 | | | | 2.48 | |
| Total from Investment Operations | | | (9.82 | ) | | | (5.59 | ) | | | 5.69 | | | | 10.34 | | | | 2.42 | |
| | | | | | | | | | | | | | | | | | | | | |
| LESS DISTRIBUTIONS: | | | | | | | | | | | | | | | | | | | | |
| From capital gains | | | – | | | | (7.71 | ) | | | (1.29 | ) | | | – | | | | – | |
| Total Distributions | | | – | | | | (7.71 | ) | | | (1.29 | ) | | | – | | | | – | |
| NET INCREASE/(DECREASE) IN NET ASSET VALUE | | | (9.82 | ) | | | (13.30 | ) | | | 4.40 | | | | 10.34 | | | | 2.42 | |
| NET ASSET VALUE, END OF PERIOD | | $ | 22.89 | | | $ | 32.71 | | | $ | 46.01 | | | $ | 41.61 | | | $ | 31.27 | |
| | | | | | | | | | | | | | | | | | | | | |
| TOTAL RETURN(b) | | | (30.02 | )% | | | (10.65 | )% | | | 13.59 | % | | | 33.07 | % | | | 8.39 | % |
| RATIOS/SUPPLEMENTAL DATA: | | | | | | | | | | | | | | | | | | | | |
| Net Assets, End of Period (000s) | | $ | 37,933 | | | $ | 87,267 | | | $ | 172,338 | | | $ | 172,106 | | | $ | 110,601 | |
| RATIOS TO AVERAGE NET ASSETS: | | | | | | | | | | | | | | | | | | | | |
| Net Investment loss | | | (0.10 | )% | | | (0.58 | )% | | | (0.65 | )% | | | (0.46 | )% | | | (0.21 | )% |
| Operating expenses excluding reimbursement/waiver | | | 1.48 | % | | | 1.42 | % | | | 1.41 | % | | | 1.43 | % | | | 1.48 | % |
| Operating expenses including reimbursement/waiver | | | 1.48 | % | | | 1.42 | % | | | 1.41 | % | | | 1.43 | % | | | 1.48 | % |
| PORTFOLIO TURNOVER RATE | | | 46 | % | | | 55 | % | | | 62 | % | | | 36 | % | | | 30 | % |
| (a) | Per share amounts are based upon average shares outstanding. |
| (b) | Total return does not reflect the effect of sales charges. |
See Notes to Financial Statements.
| Annual Report | April 30, 2020 | 65 |
| Emerald Banking and Finance Fund | Financial Highlights |
For a share outstanding throughout the years presented
| | | CLASS C | |
| | | Year Ended April 30, 2020 | | | Year Ended April 30, 2019 | | | Year Ended April 30, 2018 | | | Year Ended April 30, 2017 | | | Year Ended April 30, 2016 | |
| NET ASSET VALUE, BEGINNING OF PERIOD | | $ | 27.87 | | | $ | 40.83 | | | $ | 37.29 | | | $ | 28.20 | | | $ | 26.19 | |
| INCOME/(LOSS) FROM OPERATIONS: | | | | | | | | | | | | | | | | | | | | |
| Net investment loss(a) | | | (0.20 | ) | | | (0.44 | ) | | | (0.51 | ) | | | (0.36 | ) | | | (0.24 | ) |
| Net realized and unrealized gain/(loss) on investments | | | (8.29 | ) | | | (4.81 | ) | | | 5.34 | | | | 9.45 | | | | 2.25 | |
| Total from Investment Operations | | | (8.49 | ) | | | (5.25 | ) | | | 4.83 | | | | 9.09 | | | | 2.01 | |
| | | | | | | | | | | | | | | | | | | | | |
| LESS DISTRIBUTIONS: | | | | | | | | | | | | | | | | | | | | |
| From capital gains | | | – | | | | (7.71 | ) | | | (1.29 | ) | | | – | | | | – | |
| Total Distributions | | | – | | | | (7.71 | ) | | | (1.29 | ) | | | – | | | | – | |
| NET INCREASE/(DECREASE) IN NET ASSET VALUE | | | (8.49 | ) | | | (12.96 | ) | | | 3.54 | | | | 9.09 | | | | 2.01 | |
| NET ASSET VALUE, END OF PERIOD | | $ | 19.38 | | | $ | 27.87 | | | $ | 40.83 | | | $ | 37.29 | | | $ | 28.20 | |
| | | | | | | | | | | | | | | | | | | | | |
| TOTAL RETURN(b) | | | (30.46 | )% | | | (11.21 | )% | | | 12.85 | % | | | 32.23 | % | | | 7.67 | % |
| RATIOS/SUPPLEMENTAL DATA: | | | | | | | | | | | | | | | | | | | | |
| Net Assets, End of Period (000s) | | $ | 16,804 | | | $ | 50,079 | | | $ | 78,988 | | | $ | 76,072 | | | $ | 52,366 | |
| RATIOS TO AVERAGE NET ASSETS: | | | | | | | | | | | | | | | | | | | | |
| Net Investment loss | | | (0.73 | )% | | | (1.23 | )% | | | (1.30 | )% | | | (1.11 | )% | | | (0.87 | )% |
| Operating expenses excluding reimbursement/waiver | | | 2.13 | % | | | 2.07 | % | | | 2.06 | % | | | 2.08 | % | | | 2.13 | % |
| Operating expenses including reimbursement/waiver | | | 2.13 | % | | | 2.07 | % | | | 2.06 | % | | | 2.08 | % | | | 2.13 | % |
| PORTFOLIO TURNOVER RATE | | | 46 | % | | | 55 | % | | | 62 | % | | | 36 | % | | | 30 | % |
| (a) | Per share amounts are based upon average shares outstanding. |
| (b) | Total return does not reflect the effect of sales charges. |
See Notes to Financial Statements.
| 66 | www.emeraldmutualfunds.com |
| Emerald Banking and Finance Fund | Financial Highlights |
For a share outstanding throughout the years presented
| | | INSTITUTIONAL CLASS | |
| | | Year Ended April 30, 2020 | | | Year Ended April 30, 2019 | | | Year Ended April 30, 2018 | | | Year Ended April 30, 2017 | | | Year Ended April 30, 2016 | |
| NET ASSET VALUE, BEGINNING OF PERIOD | | $ | 33.70 | | | $ | 46.95 | | | $ | 42.30 | | | $ | 31.69 | | | $ | 29.15 | |
| INCOME/(LOSS) FROM OPERATIONS: | | | | | | | | | | | | | | | | | | | | |
| Net investment income/(loss)(a) | | | 0.09 | | | | (0.09 | ) | | | (0.15 | ) | | | (0.05 | ) | | | 0.03 | |
| Net realized and unrealized gain/(loss) on investments | | | (10.12 | ) | | | (5.45 | ) | | | 6.09 | | | | 10.66 | | | | 2.51 | |
| Total from Investment Operations | | | (10.03 | ) | | | (5.54 | ) | | | 5.94 | | | | 10.61 | | | | 2.54 | |
| | | | | | | | | | | | | | | | | | | | | |
| LESS DISTRIBUTIONS: | | | | | | | | | | | | | | | | | | | | |
| From capital gains | | | – | | | | (7.71 | ) | | | (1.29 | ) | | | – | | | | – | |
| Total Distributions | | | – | | | | (7.71 | ) | | | (1.29 | ) | | | – | | | | – | |
| NET INCREASE/(DECREASE) IN NET ASSET VALUE | | | (10.03 | ) | | | (13.25 | ) | | | 4.65 | | | | 10.61 | | | | 2.54 | |
| NET ASSET VALUE, END OF PERIOD | | $ | 23.67 | | | $ | 33.70 | | | $ | 46.95 | | | $ | 42.30 | | | $ | 31.69 | |
| | | | | | | | | | | | | | | | | | | | | |
| TOTAL RETURN | | | (29.76 | )% | | | (10.30 | )% | | | 13.97 | % | | | 33.48 | % | | | 8.71 | % |
| RATIOS/SUPPLEMENTAL DATA: | | | | | | | | | | | | | | | | | | | | |
| Net Assets, End of Period (000s) | | $ | 67,358 | | | $ | 162,910 | | | $ | 221,638 | | | $ | 134,027 | | | $ | 61,654 | |
| RATIOS TO AVERAGE NET ASSETS: | | | | | | | | | | | | | | | | | | | | |
| Net Investment income/(loss) | | | 0.28 | % | | | (0.23 | )% | | | (0.34 | )% | | | (0.14 | )% | | | 0.11 | % |
| Operating expenses excluding reimbursement/waiver | | | 1.13 | % | | | 1.06 | % | | | 1.09 | % | | | 1.11 | % | | | 1.15 | % |
| Operating expenses including reimbursement/waiver | | | 1.13 | % | | | 1.06 | % | | | 1.09 | % | | | 1.11 | % | | | 1.15 | % |
| PORTFOLIO TURNOVER RATE | | | 46 | % | | | 55 | % | | | 62 | % | | | 36 | % | | | 30 | % |
| (a) | Per share amounts are based upon average shares outstanding. |
See Notes to Financial Statements.
| Annual Report | April 30, 2020 | 67 |
| Emerald Banking and Finance Fund | Financial Highlights |
For a share outstanding throughout the years presented
| | | INVESTOR CLASS | |
| | | Year Ended April 30, 2020 | | | Year Ended April 30, 2019 | | | Year Ended April 30, 2018 | | | Year Ended April 30, 2017 | | | Year Ended April 30, 2016 | |
| NET ASSET VALUE, BEGINNING OF PERIOD | | $ | 30.96 | | | $ | 44.05 | | | $ | 39.86 | | | $ | 29.95 | | | $ | 27.64 | |
| INCOME/(LOSS) FROM OPERATIONS: | | | | | | | | | | | | | | | | | | | | |
| Net investment loss(a) | | | (0.04 | ) | | | (0.23 | ) | | | (0.25 | ) | | | (0.16 | ) | | | (0.07 | ) |
| Net realized and unrealized gain/(loss) on investments | | | (9.26 | ) | | | (5.15 | ) | | | 5.73 | | | | 10.07 | | | | 2.38 | |
| Total from Investment Operations | | | (9.30 | ) | | | (5.38 | ) | | | 5.48 | | | | 9.91 | | | | 2.31 | |
| | | | | | | | | | | | | | | | | | | | | |
| LESS DISTRIBUTIONS: | | | | | | | | | | | | | | | | | | | | |
| From capital gains | | | – | | | | (7.71 | ) | | | (1.29 | ) | | | – | | | | – | |
| Total Distributions | | | – | | | | (7.71 | ) | | | (1.29 | ) | | | – | | | | – | |
| NET INCREASE/(DECREASE) IN NET ASSET VALUE | | | (9.30 | ) | | | (13.09 | ) | | | 4.19 | | | | 9.91 | | | | 2.31 | |
| NET ASSET VALUE, END OF PERIOD | | $ | 21.66 | | | $ | 30.96 | | | $ | 44.05 | | | $ | 39.86 | | | $ | 29.95 | |
| | | | | | | | | | | | | | | | | | | | | |
| TOTAL RETURN | | | (30.04 | )% | | | (10.64 | )% | | | 13.67 | % | | | 33.09 | % | | | 8.36 | % |
| RATIOS/SUPPLEMENTAL DATA: | | | | | | | | | | | | | | | | | | | | |
| Net Assets, End of Period (000s) | | $ | 15,472 | | | $ | 41,410 | | | $ | 71,236 | | | $ | 85,557 | | | $ | 80,404 | |
| RATIOS TO AVERAGE NET ASSETS: | | | | | | | | | | | | | | | | | | | | |
| Net Investment loss | | | (0.12 | )% | | | (0.60 | )% | | | (0.60 | )% | | | (0.46 | )% | | | (0.23 | )% |
| Operating expenses excluding reimbursement/waiver | | | 1.51 | % | | | 1.43 | % | | | 1.37 | % | | | 1.43 | % | | | 1.48 | % |
| Operating expenses including reimbursement/waiver | | | 1.51 | % | | | 1.43 | % | | | 1.37 | % | | | 1.43 | % | | | 1.48 | % |
| PORTFOLIO TURNOVER RATE | | | 46 | % | | | 55 | % | | | 62 | % | | | 36 | % | | | 30 | % |
| (a) | Per share amounts are based upon average shares outstanding. |
See Notes to Financial Statements.
| 68 | www.emeraldmutualfunds.com |
| Emerald Select trueLiberty Income Fund | Consolidated Financial Highlights |
For a share outstanding throughout the period presented
| CLASS A |
| | | For the Period January 2, 2020 (Inception) to April 30, 2020 | |
| NET ASSET VALUE, BEGINNING OF PERIOD | | $ | 10.00 | |
| INCOME/(LOSS) FROM OPERATIONS: | | | | |
| Net investment income(a) | | | 0.04 | |
| Net realized and unrealized loss on investments | | | (4.17 | ) |
| Total from Investment Operations | | | (4.13 | ) |
| | | | | |
| NET DECREASE IN NET ASSET VALUE | | | (4.13 | ) |
| NET ASSET VALUE, END OF PERIOD | | $ | 5.87 | |
| | | | | |
| TOTAL RETURN | | | (41.30 | )% |
| RATIOS/SUPPLEMENTAL DATA: | | | | |
| Net Assets, End of Period (000s) | | $ | 66 | |
| RATIOS TO AVERAGE NET ASSETS: | | | | |
| Net Investment income | | | 1.92 | %(b) |
| Operating expenses excluding reimbursement/waiver | | | 95.87 | %(b)(c) |
| Operating expenses including reimbursement/waiver | | | 1.06 | %(b)(c) |
| PORTFOLIO TURNOVER RATE | | | 439 | %(d) |
| (a) | Per share amounts are based upon average shares outstanding. |
| (c) | Expense ratios before reductions for startup costs may not be representative of longer term operating period. |
See Notes to Financial Statements.
| Annual Report | April 30, 2020 | 69 |
| Emerald Select trueLiberty Income Fund | Consolidated Financial Highlights |
For a share outstanding throughout the period presented
| INSTITUTIONAL CLASS |
| | | For the Period January 2, 2020 (Inception) to April 30, 2020 | |
| NET ASSET VALUE, BEGINNING OF PERIOD | | $ | 10.00 | |
| INCOME/(LOSS) FROM OPERATIONS: | | | | |
| Net investment income(a) | | | 0.02 | |
| Net realized and unrealized loss on investments | | | (4.15 | ) |
| Total from Investment Operations | | | (4.13 | ) |
| | | | | |
| NET DECREASE IN NET ASSET VALUE | | | (4.13 | ) |
| NET ASSET VALUE, END OF PERIOD | | $ | 5.87 | |
| | | | | |
| TOTAL RETURN | | | (41.30 | )% |
| RATIOS/SUPPLEMENTAL DATA: | | | | |
| Net Assets, End of Period (000s) | | $ | 1,279 | |
| RATIOS TO AVERAGE NET ASSETS: | | | | |
| Net Investment income | | | 1.33 | %(b) |
| Operating expenses excluding reimbursement/waiver | | | 45.48 | %(b)(c) |
| Operating expenses including reimbursement/waiver | | | 0.76 | %(b)(c) |
| PORTFOLIO TURNOVER RATE | | | 439 | %(d) |
| (a) | Per share amounts are based upon average shares outstanding. |
| (c) | Expense ratios before reductions for startup costs may not be representative of longer term operating period. |
See Notes to Financial Statements.
| 70 | www.emeraldmutualfunds.com |
| Emerald Funds | Notes to Financial Statements |
| | April 30, 2020 |
1. ORGANIZATION
Financial Investors Trust (the “Trust”), a Delaware statutory trust, is an open-end management investment company registered under the Investment Company Act of 1940, as amended (the “1940 Act”). The Trust consists of multiple separate portfolios or series. This annual report describes the Emerald Growth Fund, Emerald Small Cap Value Fund, Emerald Insights Fund, Emerald Banking and Finance Fund and Emerald Select trueLiberty Income Fund (each a “Fund” and collectively, the “Funds”). The Emerald Small Cap Value Fund is a successor to a previously operational fund which was a series of Elessar Funds Investment Trust, a Delaware statutory trust, and was organized into a series of the Trust effective as of the close of business on June 26, 2015. Effective March 3, 2015, the Board approved changing the fiscal year end of the Emerald Small Cap Value Fund from September 30 to April 30.
The Emerald Growth Fund and Emerald Insights Fund seek to achieve long-term growth through capital appreciation. The Emerald Small Cap Value Fund seeks long-term capital appreciation. The Emerald Banking and Finance Fund seeks to achieve long-term growth through capital appreciation with income as a secondary objective. The Emerald Select trueLiberty Income Fund seeks to provide current income with capital appreciation as a secondary investment objective.
Basis of Consolidation for the Emerald Select trueLiberty Income Fund: Emerald Select trueMLP Strategy Offshore Fund, Ltd. (the “Subsidiary”), a Cayman Islands exempted company, is a wholly owned subsidiary of the Emerald Select trueLiberty Income Fund (the "Select Fund"). The investment objective of the Subsidiary is designed to enhance the ability of the Select Fund to obtain exposure to equities, financial, currency and commodities markets consistent with the limits of the U.S. federal tax law requirements applicable to registered investment companies. The Subsidiary is subject to substantially the same investment policies and investment restrictions as the Select Fund. The Subsidiary acts as an investment vehicle for the Select Fund in order to effect certain commodity-related investments on behalf of the Fund. Investments in the Subsidiary are expected to provide the Fund with exposure to the commodity markets within the limitations of Subchapter M of the Internal Revenue Code of 1986, as amended (the “Code”), and recent IRS revenue rulings, as discussed below under “Federal Income Taxes”. The Select Fund is the sole shareholder of the Subsidiary pursuant to a subscription agreement, and it is intended that the Select Fund will remain the sole shareholder and will continue to control the Subsidiary. Under the Articles of Association of the Subsidiary, shares issued by the Subsidiary confer upon a shareholder the right to wholly own and vote at general meetings of the Subsidiary and certain rights in connection with any winding-up or repayment of capital, as well as the right to participate in the profits or assets of the Subsidiary. The Select Fund may invest up to 25% of its total assets in shares of the Subsidiary. As a wholly owned subsidiary of the Select Fund, the financial statements of the Subsidiary are included in the Consolidated financial statements and financial highlights of the Select Fund. All investments held by the Subsidiary are disclosed in the accounts of the Select Fund. As of April 30, 2020, net assets of the Select Fund were $1,344,524 of which $238,490 or 17.74%, represented the Select Fund's ownership of all issued shares and voting rights of the Subsidiary.
2. SIGNIFICANT ACCOUNTING POLICIES
The accompanying financial statements were prepared in accordance with accounting principles generally accepted in the United States of America (“U.S. GAAP”). The preparation of financial statements in conformity with U.S. GAAP requires management to make certain estimates and assumptions that affect the reported amounts of assets and liabilities and disclosures of contingent assets and liabilities at the date of the financial statements and the reported amounts of revenue and expenses during the period. Actual results could differ from those estimates. The Funds are considered an investment company for financial reporting purposes under U.S. GAAP and follows the accounting and reporting guidance applicable to investment companies in the Financial Accounting Standards Board Accounting Standards Codification Topic 946. The following is a summary of significant accounting policies consistently followed by the Funds in preparation of their financial statements.
Investment Valuation: The Funds generally value their securities based on market prices determined at the close of regular trading on the New York Stock Exchange (“NYSE”), normally, 4:00 p.m. Eastern Time, on each business day the NYSE is open for trading.
For equity securities and mutual funds that are traded on an exchange, the market price is usually the closing sale or official closing price on that exchange. In the case of equity securities not traded on an exchange, or if such closing prices are not otherwise available, the securities are valued at the mean of the most recent bid and ask prices on such day. Redeemable securities issued by open-end registered investment companies are valued at the investment company’s applicable net asset value, with the exception of exchange-traded open-end investment companies, which are priced as equity securities.
The market price for debt obligations is generally the price supplied by an independent third-party pricing service approved by the Board of Trustees of the Trust (the “Board” or the “Trustees”), which may use a matrix, formula or other objective method that takes into consideration quotations from dealers, market transactions in comparable investments, market indices and yield curves. If vendors are unable to supply a price, or if the price supplied is deemed to be unreliable, the market price may be determined using quotations received from one or more brokers–dealers that make a market in the security.
| Annual Report | April 30, 2020 | 71 |
| Emerald Funds | Notes to Financial Statements |
| | April 30, 2020 |
Equity securities that are primarily traded on foreign securities exchanges are valued at the preceding closing values of such securities on their respective exchanges, except when an occurrence subsequent to the time a value was so established is likely to have changed such value. In such an event, the fair values of those securities are determined in good faith through consideration of other factors in accordance with procedures established by and under the general supervision of the Board.
When such prices or quotations are not available, or when Emerald Mutual Fund Advisers Trust, (the “Adviser”), believes that they are unreliable, securities may be priced using fair value procedures approved by the Board.
Fair Value Measurements: A three-tier hierarchy has been established to classify fair value measurements for disclosure purposes. Inputs refer broadly to the assumptions that market participants would use in pricing the asset or liability, including assumptions about risk. Inputs may be observable or unobservable. Observable inputs are inputs that reflect the assumptions market participants would use in pricing the asset or liability that are developed based on market data obtained from sources independent of the reporting entity. Unobservable inputs are inputs that reflect the reporting entity’s own assumptions about the assumptions market participants would use in pricing the asset or liability that are developed based on the best information available. Various inputs are used in determining the value of each Fund’s investments as of the reporting period end. The designated input levels are not necessarily an indication of the risk or liquidity associated with these investments.
These inputs are categorized in the following hierarchy under applicable financial accounting standards:
| Level 1 – | Unadjusted quoted prices in active markets for identical investments, unrestricted assets or liabilities that the Funds have the ability to access at the measurement date; |
| Level 2 – | Quoted prices which are not active, quoted prices for similar assets or liabilities in active markets or inputs other than quoted prices that are observable (either directly or indirectly) for substantially the full term of the asset or liability; and |
| Level 3 – | Significant unobservable prices or inputs (including the Funds’ own assumptions in determining the fair value of investments) where there is little or no market activity for the asset or liability at the measurement date. |
The following is a summary of each input used to value the Funds as of April 30, 2020:
| Investments in Securities at Value(a) | | Level 1 - Quoted Prices | | | Level 2 - Other Significant Observable Inputs | | | Level 3 - Significant Unobservable Inputs | | | Total | |
| Emerald Growth Fund | | | | | | | | | | | | | | | | |
| Common Stocks | | $ | 1,075,953,878 | | | $ | – | | | $ | – | | | $ | 1,075,953,878 | |
| Short Term Investments | | | 30,239,703 | | | | – | | | | – | | | | 30,239,703 | |
| TOTAL | | $ | 1,106,193,581 | | | $ | – | | | $ | – | | | $ | 1,106,193,581 | |
| Investments in Securities at Value(a) | | Level 1 - Quoted Prices | | | Level 2 - Other Significant Observable Inputs | | | Level 3 - Significant Unobservable Inputs | | | Total | |
| Emerald Small Cap Value Fund | | | | | | | | | | | | | | | | |
| Common Stocks | | $ | 1,840,118 | | | $ | – | | | $ | – | | | $ | 1,840,118 | |
| Short Term Investments | | | 44,730 | | | | – | | | | – | | | | 44,730 | |
| TOTAL | | $ | 1,884,848 | | | $ | – | | | $ | – | | | $ | 1,884,848 | |
| Investments in Securities at Value(a) | | Level 1 - Quoted Prices | | | Level 2 - Other Significant Observable Inputs | | | Level 3 - Significant Unobservable Inputs | | | Total | |
| Emerald Insights Fund | | | | | | | | | | | | | | | | |
| Common Stocks | | $ | 11,297,526 | | | $ | – | | | $ | – | | | $ | 11,297,526 | |
| Exchange Traded Funds | | | 400,824 | | | | – | | | | – | | | | 400,824 | |
| Short Term Investments | | | 500,883 | | | | – | | | | – | | | | 500,883 | |
| TOTAL | | $ | 12,199,233 | | | $ | – | | | $ | – | | | $ | 12,199,233 | |
| 72 | www.emeraldmutualfunds.com |
| Emerald Funds | Notes to Financial Statements |
| | April 30, 2020 |
| Investments in Securities at Value(a) | | Level 1 - Quoted Prices | | | Level 2 - Other Significant Observable Inputs | | | Level 3 - Significant Unobservable Inputs | | | Total | |
| Emerald Banking and Finance Fund | | | | | | | | | | | | | | | | |
| Common Stocks | | | | | | | | | | | | | | | | |
| Commercial Finance & Mortgage Companies | | $ | 4,597,511 | | | $ | 3,474,852 | | | $ | – | | | $ | 8,072,363 | |
| Other | | | 125,366,626 | | | | – | | | | – | | | | 125,366,626 | |
| Short Term Investments | | | 4,088,197 | | | | – | | | | – | | | | 4,088,197 | |
| TOTAL | | $ | 134,052,334 | | | $ | 3,474,852 | | | $ | – | | | $ | 137,527,186 | |
| Investments in Securities at Value(a) | | Level 1 - Quoted Prices | | | Level 2 - Other Significant Observable Inputs | | | Level 3 - Significant Unobservable Inputs | | | Total | |
| Emerald Select trueLiberty Income Fund | | | | | | | | | | | | |
| Common Stocks | | $ | 241,202 | | | $ | – | | | $ | – | | | $ | 241,202 | |
| TOTAL | | $ | 241,202 | | | $ | – | | | $ | – | | | $ | 241,202 | |
| (a) | For detailed descriptions of sector and industry, see the accompanying Schedule of Investments. |
For the period or year ended April 30, 2020, the Funds did not have any securities that used significant unobservable inputs (Level 3) in determining fair value.
Investment Transactions and Investment Income: Investment transactions are accounted for on the date the investments are purchased or sold (trade date). Realized gains and losses from investment transactions are reported on an identified cost basis, which is the same basis the Funds use for federal income tax purposes. Interest income, which includes accretion of discounts, is accrued and recorded as earned. Dividend income is recognized on the ex-dividend date or for certain foreign securities, as soon as information is available to the Funds. All of the realized and unrealized gains and losses and net investment income, are allocated daily to each class in proportion to its average daily net assets.
Real Estate Investment Trusts (“REITs”): The Funds may invest a portion of their assets in REITs and are subject to certain risks associated with direct investment in REITs. REITs may be affected by changes in the value of their underlying properties and by defaults by borrowers or tenants. REITs depend generally on their ability to generate cash flow to make distributions to shareowners, and certain REITs have self-liquidation provisions by which mortgages held may be paid in full and distributions of capital returns may be made at any time. In addition, the performance of a REIT may be affected by its failure to qualify for tax-free pass-through of income under the Internal Revenue Code of 1986, as amended (the “Code”), or its failure to maintain exemption from registration under the 1940 Act. A Fund’s investments in REITs may result in such Fund’s receipt of cash in excess of the REITs’ earnings. If the Fund receives such distributions all or a portion of these distributions will constitute a return of capital to such Fund. Receiving a return of capital distribution from REITs will reduce the amount of income available to be distributed to Fund shareholders. Income from REITs generally will not be eligible for treatment as qualified dividend income. As the final character of the distributions is not known until reported by the REITs on their 1099s, the Funds utilize an average of the prior year’s reallocation information as an estimate for the current year character of distributions.
Trust Expenses: Some expenses of the Trust can be directly attributed to the Funds. Expenses which cannot be directly attributed to the Funds are apportioned among all funds in the Trust based on average net assets of each fund.
Fund and Class Expenses: Expenses that are specific to a Fund or class of shares of a Fund, including distribution fees (Rule 12b-1 fees) and shareholder servicing fees, are charged directly to that Fund or share class. All expenses of a Fund, other than class specific expenses, are allocated daily to each class in proportion to its average daily net assets. Expenses that are common to the Funds generally are allocated among the Funds in proportion to their average daily net assets.
Offering Costs: Offering costs, including costs of printing initial prospectuses, legal and registration fees, are being amortized over twelve months from the inception date of the Select Fund. Amounts amortized during the period ended April 30, 2020 for the Select Fund are shown on the Consolidated Statement of Operations.
| Annual Report | April 30, 2020 | 73 |
| Emerald Funds | Notes to Financial Statements |
| | April 30, 2020 |
Federal Income Taxes: Each Fund complies with the requirements under Subchapter M of the Code, applicable to regulated investment companies and intends to distribute substantially all of its net taxable income and net capital gains, if any, each year so that the Funds will not be subject to excise tax on undistributed income and gains. The Funds are not subject to income taxes to the extent such distributions are made.
As of and during the period or year ended April 30, 2020, the Funds did not have a liability for any unrecognized tax benefits. The Funds file U.S. federal, state, and local tax returns as required. The Funds’ tax returns are subject to examination by the relevant tax authorities until expiration of the applicable statute of limitations, which is generally three years after the filing of the tax return for federal purposes and four years for most state returns. Tax returns for open years have incorporated no uncertain tax positions that require a provision for income taxes.
Distributions to Shareholders: Each Fund normally pays dividends and distributes capital gains, if any, on an annual basis. Income dividend distributions are derived from dividends and other income each Fund receives from its investments, including short-term capital gains. Long term capital gain distributions are derived from gains realized when each Fund sells a security it has owned for more than a year. Each Fund may make additional distributions and dividends at other times if the portfolio manager believes doing so may be necessary for each Fund to avoid or reduce taxes.
Epidemic and Pandemic Risk. Certain countries have been susceptible to epidemics, most recently COVID-19, which has been designated as a pandemic by world health authorities. The outbreak of such epidemics, together with any resulting restrictions on travel or quarantines imposed, could have a negative impact on the economy and business activity globally (including in the countries in which we invest), and thereby could adversely affect the performance of our investments. Furthermore, the rapid development of epidemics could preclude prediction as to their ultimate adverse impact on economic and market conditions, and, as a result, present material uncertainty and risk with respect to us and the performance of our investments.
3. DERIVATIVE INSTRUMENTS
Swap Contracts: The Select Fund may enter into swap transactions for hedging purposes or to seek to increase total return. At the present time, the Select Fund primarily enters into swap transactions for the purpose of increasing total return. Risks may arise as a result of the failure of the counterparty to the swap contract to comply with the terms of the swap contract. The loss incurred by the failure of a counterparty is generally limited to the net payment to be received by the Select Fund and/or the termination value at the end of the contract.
Additionally, risks may arise from unanticipated movements in interest rates or in the value of the underlying reference asset or index. Entering into these agreements involves, to varying degrees, market risk, liquidity risk and elements of credit, legal and documentation risk that are not directly reflected in the amounts.
Risk of Investing in Derivatives: Additional associated risks from investing in derivatives also exist and potentially could have significant effects on the valuation of the derivative and the Select Fund. Typically, the associated risks are not the risks that the Select Fund is attempting to increase or decrease exposure to, per its investment objectives, but are the additional risks from investing in derivatives.
Examples of these associated risks are liquidity risk, which is the risk that the Select Fund will not be able to sell or close out the derivative in a timely manner, and counterparty credit risk, which is the risk that the counterparty will not fulfill its obligation to the Select Fund. In addition, use of derivatives may increase or decrease exposure equity risk. Equity risk relates to the change in value of equity securities as they relate to increases or decreases in the general market. Associated risks can be different for each type of derivative and are discussed by each derivative type in the notes that follow.
The Select Fund invests in total return swaps to obtain exposure to a security or market without owning such security or investing directly in that market or to transfer the risk/return of one market (e.g., fixed income) to another market (e.g., equity) (equity risk and/or interest rate risk). Total return swaps are agreements in which there is an exchange of cash flows whereby one party commits to make payments based on the total return (coupons plus capital gains/losses) of an underlying instrument in exchange for fixed or floating rate interest payments. To the extent the total return of the instrument or index underlying the transaction exceeds or falls short of the offsetting interest rate obligation, the Select Fund will receive a payment from or make a payment to the counterparty. The Select Fund must set aside liquid assets, or engage in other appropriate measures, to cover its obligations under these contracts. Swaps are marked to market daily using either pricing vendor quotations, counterparty prices, or model prices and the change in value, if any, is recorded as an unrealized gain or loss. Upfront payments made and/or received by the Select Fund are recorded as an asset and/or liability and realized gains or losses are recognized ratably over the contract’s term/event, with the exception of forward starting interest rate swaps, whose realized gains or losses are recognized ratably from the effective start date. Periodic payments received or made on swap contracts are recorded as realized gains or losses. Gains or losses are realized upon reset of a swap contract. Swap agreements held as of April 30, 2020 are disclosed in the Consolidated Schedule of Investments.
Cash collateral is being pledged to cover derivative obligations of the Select Fund and cash collateral received from the counterparty, if any, is reported separately on the Consolidated Statement of Assets and Liabilities as deposits with brokers for total return swap contracts and payable to
| 74 | www.emeraldmutualfunds.com |
| Emerald Funds | Notes to Financial Statements |
| | April 30, 2020 |
broker for total return swap contracts, respectively. Non-cash collateral pledged by the Select Fund, if any, is noted in the Consolidated Statement of Investments.
| Risk Exposure | | Statement of Operations Location | | Realized Gain/(Loss) on Derivatives Recognized in Income | | | Change in Unrealized Appreciation/(Depreciation) on Derivatives Recognized in Income | |
| Emerald Select trueLiberty Income Fund | | | | | | | | | | |
Equity Contract
(Total Return Swap Contract) | | Net realized loss on total return swap contracts/Net change in unrealized depreciation on total return swap contracts | | $ | (538,379 | ) | | $ | – | |
| Total | | | | $ | (538,379 | ) | | $ | – | |
Volume of Derivative Instruments for the Fund during the period ended April 30, 2020 was as follows:
| Derivative Type | Unit of Measurement | Monthly Average |
| Emerald Select trueLiberty Income Fund | | |
| Equity Contracts (Total Return Swap Contract) | Notional Quantity | 764,752 |
4. TAX BASIS INFORMATION
Reclassifications: As of April 30, 2020, permanent differences on book and tax accounting were reclassified. These differences had no effect on net assets and were primarily attributed to net operating losses, non-deductible expenses, and the differing book and tax treatment of investments held in a controlled foreign corporation.
| | | Distributable earnings | | | Paid-in Capital | |
| Emerald Growth Fund | | $ | 4,549,404 | | | $ | (4,549,404 | ) |
| Emerald Small Cap Value Fund | | | 4,028 | | | | (4,028 | ) |
| Emerald Insights Fund | | | 83,823 | | | | (83,823 | ) |
| Emerald Banking and Finance Fund | | | 688,002 | | | | (688,002 | ) |
| Emerald Select trueLiberty Income Fund | | | 538,521 | | | | (538,521 | ) |
Included in the amounts reclassified was a net operating loss offset to Paid-in capital for the Emerald Growth Fund, the Emerald Small Cap Value Fund, the Emerald Insights Fund and the Emerald Banking and Finance Fund in the amount of $4,549,404, $4,028, $83,814, and $688,002, respectively.
Tax Basis of Investments: As of April 30, 2020, the aggregate cost of investments, gross unrealized appreciation/(depreciation) and net unrealized appreciation/(depreciation) for Federal tax purposes was as follows:
| | | Gross Appreciation (excess of value over tax cost) | | | Gross Depreciation (excess of tax cost over value) | | | Net Unrealized Appreciation/(Depreciation) | | | Cost of Investments for Income Tax Purposes | |
| Emerald Growth Fund | | $ | 316,770,691 | | | $ | (110,810,904 | ) | | $ | 205,959,787 | | | $ | 900,233,794 | |
| Emerald Small Cap Value Fund | | | 159,857 | | | | (460,594 | ) | | | (300,737 | ) | | | 2,185,585 | |
| Emerald Insights Fund | | | 2,656,642 | | | | (400,118 | ) | | | 2,256,524 | | | | 9,942,709 | |
| Emerald Banking and Finance Fund | | | 16,534,441 | | | | (19,179,194 | ) | | | (2,644,753 | ) | | | 140,171,939 | |
| Emerald Select trueLiberty Income Fund | | | 898,137 | | | | (1,044,621 | ) | | | (146,484 | ) | | | 387,686 | |
| Annual Report | April 30, 2020 | 75 |
| Emerald Funds | Notes to Financial Statements |
| | April 30, 2020 |
Components of Distributable Earnings: As of April 30, 2020, components of distributable earnings were as follows:
| | | Emerald Growth Fund | | | Emerald Small Cap Value Fund | | | Emerald Insights Fund | | | Emerald Banking and Finance Fund | | | Emerald Select trueLiberty Income Fund | |
| Undistributed ordinary income | | $ | – | | | $ | – | | | $ | – | | | $ | – | | | $ | 12,214 | |
| Accumulated capital gains/(losses) | | | 52,720,875 | | | | (318,804 | ) | | | 326,144 | | | | (36,799,450 | ) | | | – | |
| Net unrealized appreciation/(depreciation) on | | | | | | | | | | | | | | | | | | | | |
| investments | | | 205,959,787 | | | | (300,737 | ) | | | 2,256,524 | | | | (2,644,753 | ) | | | (146,484 | ) |
| Other cumulative effect of timing differences | | | (1,610,654 | ) | | | – | | | | (34,605 | ) | | | – | | | | – | |
| Total | | $ | 257,070,008 | | | $ | (619,541 | ) | | $ | 2,548,063 | | | $ | (39,444,203 | ) | | $ | (134,270 | ) |
Under current law, capital losses maintain their character as short-term or long-term and are carried forward to the next tax year without expiration. As of the current fiscal year end, the following amounts are available as carry forwards to the next tax year:
| | | Short-Term | | | Long-Term | |
| Emerald Growth Fund | | $ | – | | | $ | – | |
| Emerald Small Cap Value Fund | | | 317,259 | | | | – | |
| Emerald Insights Fund | | | – | | | | – | |
| Emerald Banking and Finance Fund | | | 3,900,205 | | | | – | |
| Emerald Select trueLiberty Income Fund | | | – | | | | – | |
The Emerald Small Cap Value Fund and Emerald Banking and Finance Fund elected to defer to the period ending April 30, 2021, capital losses recognized during the period November 1, 2019 to April 30, 2020 in the amount of $1,545 and $32,899,245, respectively.
Ordinary Losses: As of April 30, 2020, the Emerald Growth Fund and Emerald Insights Fund elected to defer to the period ending April 30, 2021, late year ordinary losses in the amount of $1,610,654 and $34,605, respectively.
Tax Basis of Distributions to Shareholders: The character of distributions made during the year from net investment income or net realized gains may differ from its ultimate characterization for federal income tax purposes. Also, due to the timing of dividend distributions, the fiscal year in which amounts are distributed may differ from the fiscal year in which the income or realized gain were recorded by each Fund.
The tax characters of distributions paid by the Funds for the fiscal year or period ended April 30, 2020 were as follows:
| | | Ordinary Income | | | Long-Term Capital Gain | |
| Emerald Growth Fund | | $ | – | | | $ | 18,434,222 | |
| Emerald Small Cap Value Fund | | | – | | | | – | |
| Emerald Insights Fund | | | – | | | | 4,578 | |
| Emerald Banking and Finance Fund | | | – | | | | – | |
| Emerald Select trueLiberty Income Fund | | | – | | | | – | |
The tax characters of distributions paid by the Funds for the fiscal year ended April 30, 2019 were as follows:
| | | Ordinary Income | | | Long-Term Capital Gain | |
| Emerald Growth Fund | | $ | – | | | $ | 116,684,237 | |
| Emerald Small Cap Value Fund | | | – | | | | 1,226,932 | |
| Emerald Insights Fund | | | 170,539 | | | | 1,740,059 | |
| Emerald Banking and Finance Fund | | | – | | | | 86,106,387 | |
| 76 | www.emeraldmutualfunds.com |
| Emerald Funds | Notes to Financial Statements |
| | April 30, 2020 |
5. SECURITIES TRANSACTIONS
The cost of purchases and proceeds from sales of securities (excluding short-term securities) during the period or year ended April 30, 2020 was as follows:
| Funds | | Cost of Investments Purchased | | | Proceeds from Investments Sold | |
| Emerald Growth Fund | | $ | 596,943,066 | | | $ | 752,565,267 | |
| Emerald Small Cap Value Fund | | | 2,366,152 | | | | 3,808,681 | |
| Emerald Insights Fund | | | 10,573,582 | | | | 10,487,520 | |
| Emerald Banking and Finance Fund | | | 118,200,798 | | | | 253,162,965 | |
| Emerald Select trueLiberty Income Fund | | | 2,029,623 | | | | 840,438 | |
6. SHARES OF BENEFICIAL INTEREST
The capitalization of the Trust consists of an unlimited number of shares of beneficial interest with no par value per share. Holders of the shares of the Funds of the Trust have one vote for each share held and a proportionate fraction of a vote for each fractional share. All shares issued and outstanding are fully paid and are transferable and redeemable at the option of the shareholder. Purchasers of the shares do not have any obligation to make payments to the Trust or its creditors (other than the purchase price for the shares) or make contributions to the Trust or its creditors solely by reason of the purchaser’s ownership of the shares. Shares have no pre-emptive rights.
7. MANAGEMENT AND RELATED-PARTY TRANSACTIONS
The Adviser, subject to the authority of the Board, is responsible for the overall management and administration of the Funds’ business affairs. The Adviser manages the investments of the Funds in accordance with the Funds’ investment objective, policies and limitations and investment guidelines established jointly by the Adviser and the Trustees. Pursuant to the Advisory Agreement, the Funds pay the Adviser fees for the services and facilities it provides payable on a monthly basis at the annual rate set forth below of the Funds’ average daily net assets. The management fee is paid on a monthly basis.
| Emerald Growth Fund | |
| Average Total Net Assets | Contractual Fee |
| Up to and including $250M | 0.75% |
| Over $250M and including $500M | 0.65% |
| Over $500M and including $750M | 0.55% |
| Over $750M | 0.45% |
| Emerald Small Cap Value Fund | |
| Average Total Net Assets | Contractual Fee |
| Up to and including $250M | 0.75% |
| Over $250M and including $500M | 0.65% |
| Over $500M and including $750M | 0.55% |
| Over $750M | 0.45% |
| Emerald Insights Fund | |
| Average Total Net Assets | Contractual Fee |
| Up to and including $250M | 0.75% |
| Over $250M and including $500M | 0.65% |
| Over $500M and including $750M | 0.55% |
| Over $750M | 0.45% |
| Annual Report | April 30, 2020 | 77 |
| Emerald Funds | Notes to Financial Statements |
| | April 30, 2020 |
| Emerald Banking and Finance Fund |
| Average Total Net Assets | Contractual Fee |
| Up to and including $100M | 1.00% |
| Over $100M | 0.90% |
| Emerald Select trueLiberty Income Fund | |
| Average Total Net Assets | Contractual Fee |
| Average Net Assets | 0.85% |
The Subsidiary has entered into a separate advisory agreement (the “Subsidiary Advisory Agreement”) with the Adviser for the management of the Subsidiary’s portfolio pursuant to which the Subsidiary is obligated to pay the Adviser a management fee at the same rate that the Fund pays the Adviser for investment advisory services provided to the Fund. The Adviser has agreed to waive the advisory fee it receives from the Fund in an amount equal to the management fee paid by the Subsidiary. This waiver may not be terminated or modified without the consent of the Board. This agreement may not be terminated or modified prior to this date except with the approval of the Board. For the period ended April 30, 2020, this amount equaled $182 and is disclosed in the Consolidated Statement of Operations for the Select Fund.
The Adviser has contractually agreed to limit each Fund’s total annual operating expenses (exclusive of acquired fund fees and expenses, brokerage expenses, interest expenses, taxes and extraordinary expense) set forth to the annual shares (as percentages of a Fund’s average daily net assets) in the following table for Class A, Class C, Institutional Class, and Investor Class shares. This agreement (the “Expense Agreement”) is in effect from September 1, 2019 through August 31, 2020, for all Fund's except the Select Fund, which is in effect from September 20, 2019 through August 31, 2021. The prior Expense Agreement was in effect from September 1, 2018 through August 31, 2019 for all Fund's except the Select Fund. The Adviser will be permitted to recover, on a class-by-class basis, expenses it has borne through the expense agreement to the extent that a Fund’s expenses in later periods fall below the expense cap in effect at the time of the waiver or reimbursement. Notwithstanding the foregoing, the Funds will not be obligated to pay any such fees and expenses more than three years after the date of the waiver or reimbursement. The Adviser may not discontinue this waiver, prior to August 31, 2020, without the approval by the Fund’s Board, for all Fund's except the Select Fund, which is August 31, 2021. Fees waived/reimbursed by the Adviser for the period or year ended April 30, 2020 are disclosed in the Statements of Operations and the Consolidated Statement of Operations.
| Emerald Growth Fund |
| Class A | Class C | Institutional Class | Investor Class |
| 1.29% | 1.94% | 0.99% | 1.34% |
| Emerald Small Cap Value Fund | | |
| Class A | Class C | Institutional Class | Investor Class |
| 1.35% | 2.00% | 1.00% | 1.25% |
| Emerald Insights Fund | | | |
| Class A | Class C | Institutional Class | Investor Class |
| 1.35% | 2.00% | 1.05% | 1.40% |
| Emerald Banking and Finance Fund | |
| Class A | Class C | Institutional Class | Investor Class |
| 1.84% | 2.49% | 1.54% | 1.89% |
| Emerald trueLiberty Fund | |
| Class A | Institutional Class |
| 1.06% | 0.76% |
| 78 | www.emeraldmutualfunds.com |
| Emerald Funds | Notes to Financial Statements |
| | April 30, 2020 |
For the period or year ended April 30, 2020, the fee waivers/reimbursements and recoupments of past waived fees were as follows:
| Fund | | Fees Waived/ Reimbursed By Adviser | | | Recoupment of Past Waived Fees By Adviser | |
| Emerald Growth Fund | | | | | | |
| Class A | | $ | – | | | $ | – | |
| Class C | | | – | | | | – | |
| Institutional Class | | | – | | | | – | |
| Investor Class | | | – | | | | – | |
| Emerald Small Cap Value Fund | | | | | | | | |
| Class A | | $ | 72,647 | | | $ | – | |
| Class C | | | 1,556 | | | | – | |
| Institutional Class | | | 30,474 | | | | – | |
| Investor Class | | | 18,986 | | | | – | |
| Emerald Insights Fund | | | | | | | | |
| Class A | | $ | 88,177 | | | $ | – | |
| Class C | | | 1,283 | | | | – | |
| Institutional Class | | | 12,318 | | | | – | |
| Investor Class | | | 1,098 | | | | – | |
| Emerald Banking and Finance Fund | | | | | | | | |
| Class A | | $ | – | | | $ | – | |
| Class C | | | – | | | | – | |
| Institutional Class | | | – | | | | – | |
| Investor Class | | | – | | | | – | |
| Emerald Select trueLiberty Income Fund | | | | | | | | |
| Class A | | $ | 23,340 | | | $ | – | |
| Class C | | | – | | | | – | |
| Institutional Class | | | 98,572 | | | | – | |
| Investor Class | | | – | | | | – | |
| Annual Report | April 30, 2020 | 79 |
| Emerald Funds | Notes to Financial Statements |
| | April 30, 2020 |
As of April 30, 2020, the balances of recoupable expenses for each Fund were as follows:
| Fund | | Expires 2021 | | | Expires 2022 | | | Expires 2023 | | | Total | |
| Emerald Growth Fund | | | | | | | | | | | | |
| Class A | | $ | – | | | $ | – | | | $ | – | | | $ | – | |
| Class C | | | – | | | | – | | | | – | | | | – | |
| Institutional Class | | | – | | | | – | | | | – | | | | – | |
| Investor Class | | | – | | | | – | | | | – | | | | – | |
| Emerald Small Cap Value Fund | | | | | | | | | | | | | | | | |
| Class A | | $ | 32,984 | | | $ | 63,581 | | | $ | 72,647 | | | $ | 169,212 | |
| Class C | | | 1,410 | | | | 936 | | | | 1,556 | | | | 3,902 | |
| Institutional Class | | | 53,258 | | | | 27,060 | | | | 30,474 | | | | 110,791 | |
| Investor Class | | | 7,303 | | | | 8,872 | | | | 18,986 | | | | 35,161 | |
| Emerald Insights Fund | | | | | | | | | | | | | | | | |
| Class A | | $ | 72,407 | | | $ | 77,413 | | | $ | 88,177 | | | $ | 237,997 | |
| Class C | | | 908 | | | | 1,019 | | | | 1,283 | | | | 3,211 | |
| Institutional Class | | | 8,238 | | | | 11,141 | | | | 12,318 | | | | 31,696 | |
| Investor Class | | | 693 | | | | 1,004 | | | | 1,098 | | | | 2,794 | |
| Emerald Banking and Finance Fund | | | | | | | | | | | | | | | | |
| Class A | | $ | – | | | $ | – | | | $ | – | | | $ | – | |
| Class C | | | – | | | | – | | | | – | | | | – | |
| Institutional Class | | | – | | | | – | | | | – | | | | – | |
| Investor Class | | | – | | | | – | | | | – | | | | – | |
| Emerald Select trueLiberty Income Fund | | | | | | | | | | | | | | | | |
| Class A | | $ | – | | | $ | – | | | $ | 23,340 | | | $ | 23,340 | |
| Institutional Class | | | – | | | | – | | | | 98,572 | | | | 98,572 | |
Fund Administrator Fees and Expenses: ALPS Fund Services, Inc. (“ALPS”) serves as administrator to the Funds and the Funds have agreed to pay expenses incurred in connection with their administrative activities. Pursuant to an Administration Agreement, ALPS provides operational services to the Funds including, but not limited to, fund accounting and fund administration and generally assist in the Funds’ operations. Officers of the Trust are employees of ALPS. The Funds’ administration fee is accrued on a daily basis and paid monthly. Administration fees paid by the Funds for the period or year ended April 30, 2020 are disclosed in the Statements of Operations or Consolidated Statement of Operations.
The Administrator is also reimbursed by the Funds for certain out-of-pocket expenses.
Transfer Agent: ALPS serves as transfer, dividend paying and shareholder servicing agent for the Funds. ALPS receives an annual minimum fee, a fee based upon the number of shareholder accounts, and is also reimbursed by the Funds for certain out-of-pocket expenses. Transfer agent fees paid by the Funds for the period or year ended April 30, 2020 are disclosed in the Statements of Operations or Consolidated Statement of Operations.
Compliance Services: ALPS provides services that assist the Trust’s chief compliance officer in monitoring and testing the policies and procedures of the Trust in conjunction with requirements under Rule 38a-1 under the 1940 Act and receives an annual base fee. ALPS is reimbursed for certain out-of-pocket expenses by the Funds. Compliance service fees paid by the Funds for the period or year ended April 30, 2020 are disclosed in the Statements of Operations or Consolidated Statement of Operations.
Principal Financial Officer: ALPS receives an annual fee for providing principal financial officer services to the Funds. Principal financial officer fees paid by the Funds for the period or year ended April 30, 2020 are disclosed in the Statements of Operations or Consolidated Statement of Operations.
Distributor: ALPS Distributors, Inc. (“ADI” or the “Distributor”) (an affiliate of ALPS) acts as the distributor of the Funds’ shares pursuant to a Distribution Agreement with the Trust. Shares are sold on a continuous basis by ADI as agent for the Funds, and ADI has agreed to use its best efforts to solicit orders for the sale of Funds’ shares, although it is not obliged to sell any particular amount of shares. ADI is not entitled to any compensation for its services as Distributor. ADI is registered as a broker‐dealer with the U.S. Securities and Exchange Commission.
Each Fund has adopted a separate Distribution and Services Plan (each a “Plan” and collectively, the “Plans”) pursuant to Rule 12b‐1 of the 1940 Act. The Plans allow each Fund, as applicable, to use each Fund’s assets to pay fees in connection with the distribution and marketing of the Funds’
| 80 | www.emeraldmutualfunds.com |
| Emerald Funds | Notes to Financial Statements |
| | April 30, 2020 |
shares and/or the provision of shareholder services to the Funds’ shareholders. The Plan permits payment for services in connection with the administration of plans or programs that use shares of each Fund as their funding medium and for related expenses. The recipients of such payments may include other affiliates of the Adviser, broker‐dealers, financial institutions, plan sponsors and administrators and other financial intermediaries through which investors may purchase shares of the Fund. The Plans permit each Fund to make total payments at an annual rate of up to 0.35%, 0.75% and 0.25% of the average daily net asset value of Class A, Class C and Investor Class, respectively. Because these fees are paid out of the Funds’ assets on an ongoing basis, over time they will increase the cost of an investment in the Funds, and Plan fees may cost an investor more than other types of sales charges.
Each Fund, except the Emerald Small Cap Value Fund, has adopted a Shareholder Services Plan (a “Shareholder Services Plan”) with respect to its Class C, Institutional Class and Investor Class shares. Under the Shareholder Services Plan, a Fund is authorized to compensate certain financial intermediaries, including broker‐dealers and Fund affiliates which may include the Distributor, Adviser and/or the transfer agent (the “Participating Organizations”), an aggregate fee in an amount not to exceed on an annual basis 0.25%, 0.05% and 0.15% of the average daily net asset value of Class C, Institutional Class and Investor Class, respectively, of the Funds attributable to or held in the name of the Participating Organizations pursuant to an agreement with such Participating Organizations (the “Agreement”). Each Agreement will set forth the non‐distribution related shareholder services to be performed by the Participating Organizations for the benefit of a Fund’s shareholders who have elected to have such Participating Organizations service their accounts. Any amount of such payment not paid to Participating Organizations during a Fund’s fiscal year for such service activities shall be reimbursed to the Fund as soon as practicable. Shareholder Services Plan fees are included with distribution and service fees in the Statements of Operations. Fees recaptured pursuant to the Shareholder Services Plan for the year ended April 30 are included as an offset to distribution and service fees as disclosed in the Statements of Operations.
The Emerald Small Cap Value Fund has adopted a Shareholder Services Plan (the “Plan”) with respect to its Class C shares. Under the Plan, the Fund is authorized to pay banks and its affiliates and other institutions, including broker‐dealers and Fund affiliates which may include the Distributor, Adviser and/or the transfer agent (“Class C Participating Organizations”), an aggregate fee in an amount not to exceed on an annual basis 0.25% of the average daily net asset value of Class C shares of the Fund attributable to or held in the name of the Participating Organizations for its clients as compensation for providing shareholder service activities, which do not include distribution services pursuant to an agreement with Participating Organizations. Any amount of such payment not paid to the Participating Organizations during the Fund’s fiscal year for such service activities shall be reimbursed to the Fund as soon as practicable. Plan fees are included with distribution and service fees in the Statements of Operations. Fees recaptured pursuant to the Plan for the year ended April 30, 2020 are included as an offset to distribution and service fees as disclosed in the Statements of Operations.
Trustees
The fees and expenses of the Trustees of the Board are presented in the Statements of Operations or Consolidated Statement of Operations.
8. INDEMNIFICATIONS
Under the Trust’s organizational documents, its officers and Trustees are indemnified against certain liability arising out of the performance of their duties to the Trust. Additionally, in the normal course of business, the Trust enters into contracts with service providers that may contain general indemnification clauses, which may permit indemnification to the extent permissible under applicable law. The Trust’s maximum exposure under these arrangements is unknown, as this would involve future claims that may be made against the Trust that have not yet occurred.
| Annual Report | April 30, 2020 | 81 |
| Emerald Funds | Report of Independent Registered Public Accounting Firm |
To the shareholders and the Board of Trustees of Financial Investors Trust
Opinion on the Financial Statements and Financial Highlights
We have audited the accompanying statements of assets and liabilities, including the schedules of investments, of Emerald Growth Fund, Emerald Small Cap Value Fund, Emerald Insights Fund, and Emerald Banking and Finance Fund, four of the funds constituting the Financial Investors Trust, as of April 30, 2020; the related statements of operations for the year then ended, the statements of changes in net assets for each of the two years in the period then ended, and the financial highlights for each of the five years in the period then ended for Emerald Growth Fund, Emerald Insights Fund, and Emerald Banking and Finance Fund; the related statements of operations, changes in net assets, and the financial highlights for the periods indicated in the table below for Emerald Small Cap Value Fund; and the related notes. We have also audited the accompanying consolidated statement of assets and liabilities, including the consolidated schedule of investments, of Emerald Select trueLiberty Income Fund (together with the funds listed above, the “Funds”), one of the funds constituting the Financial Investors Trust, as of April 30, 2020, and the related consolidated statements of operations, changes in net assets, and the financial highlights for the period from January 2, 2020 (inception) through April 30, 2020, and the related notes.
In our opinion, the financial statements and financial highlights present fairly, in all material respects, the financial position of each of the funds listed above constituting Financial Investors Trust, except for Emerald Select trueLiberty Income Fund, as of April 30, 2020, and the results of their operations for the year then ended (or for the period listed in the table below), the changes in their net assets for each of the two years in the period then ended (or the period listed in the table below), and the financial highlights for each of the five years in the period then ended (or for the period listed in the table below), in conformity with accounting principles generally accepted in the United States of America. Also, in our opinion, the consolidated financial statements and financial highlights present fairly, in all material respects, the financial position of Emerald Select trueLiberty Income Fund of Financial Investors Trust as of April 30, 2020, and the results of its operations, the changes in its net assets, and the financial highlights for the period from January 2, 2020 (inception) through April 30, 2020, in conformity with accounting principles generally accepted in the United States of America.
| Individual Fund Comprising the Financial Investors Trust | Statement of Operations | Statements of Changes in Net Assets | Financial Highlights |
| Emerald Small Cap Value Fund | For the year ended April 30, 2020 | For the years ended April 30, 2020 and 2019 | For the years ended April 30, 2020, 2019, 2018, 2017, the period from October 1, 2015 to April 30, 2016, and the year ended September 30, 2015 |
Basis for Opinion
These financial statements and financial highlights are the responsibility of the Funds’ management. Our responsibility is to express an opinion on the Funds’ financial statements and financial highlights based on our audits. We are a public accounting firm registered with the Public Company Accounting Oversight Board (United States) (PCAOB) and are required to be independent with respect to the Funds in accordance with the U.S. federal securities laws and the applicable rules and regulations of the Securities and Exchange Commission and the PCAOB.
We conducted our audits in accordance with the standards of the PCAOB. Those standards require that we plan and perform the audit to obtain reasonable assurance about whether the financial statements and financial highlights are free of material misstatement, whether due to error or fraud. The Funds are not required to have, nor were we engaged to perform, an audit of their internal control over financial reporting. As part of our audits we are required to obtain an understanding of internal control over financial reporting but not for the purpose of expressing an opinion on the effectiveness of the Funds’ internal control over financial reporting. Accordingly, we express no such opinion.
Our audits included performing procedures to assess the risks of material misstatement of the financial statements and financial highlights, whether due to error or fraud, and performing procedures that respond to those risks. Such procedures included examining, on a test basis, evidence regarding the amounts and disclosures in the financial statements and financial highlights. Our audits also included evaluating the accounting principles used and significant estimates made by management, as well as evaluating the overall presentation of the financial statements and financial highlights. Our procedures included confirmation of securities owned as of April 30, 2020, by correspondence with the custodian and brokers; when replies were not received from brokers, we performed other auditing procedures. We believe that our audits provide a reasonable basis for our opinion.
DELOITTE & TOUCHE LLP
Denver, Colorado
June 29, 2020
We have served as the auditor of one or more investment companies advised by Emerald Mutual Fund Advisers Trust since 2012.
| 82 | www.emeraldmutualfunds.com |
| Emerald Funds | Additional Information |
| | April 30, 2020 (Unaudited) |
1. FUND HOLDINGS
The Funds file their complete schedule of portfolio holdings with the Commission for the first and third quarters of each fiscal year as an exhibit to its reports on Form N-PORT. The Funds’ Form N-PORT reports are available on the Commission’s Web site at http://www.sec.gov. The Funds’ Form N-PORTs are also available upon request by calling (toll-free) (855) 828-9909.
2. FUND PROXY VOTING POLICIES, PROCEDURES AND SUMMARIES
Each Fund’s policies and procedures used in determining how to vote proxies and information regarding how the Funds voted proxies relating to portfolio securities during the most recent prior 12-month period ending June 30 are available without charge, (1) upon request, by calling (toll-free) (855) 828-9909 and (2) on the SEC’s website at http://www.sec.gov.
3. TAX INFORMATION (UNAUDITED)
The Funds designate the following for federal income tax purposes for distributions made during the calendar year ended December 31, 2019:
| | QDI | DRD |
| Emerald Emerald Banking and Finance Fund | N/A | N/A |
| Emerald Growth Fund | N/A | N/A |
| Emerald Insights Fund | N/A | N/A |
| Emerald Small-Cap Value Fund | N/A | N/A |
In early 2020, if applicable, shareholders of record received this information for the distribution paid to them by the Funds during the calendar year 2019 via Form 1099. The Funds will notify shareholders in early 2021 of amounts paid to them by the Funds, if any, during the calendar year 2020.
Pursuant to Section 852(b)(3) of the Internal Revenue Code, the Emerald Growth Fund and the Emerald Insights Fund designated $18,434,222 and $4,578 respectively, as long-term capital gain dividends.
| Annual Report | April 30, 2020 | 83 |
| Emerald Funds | Disclosure Regarding Approval of Fund Advisory Agreement |
| | April 30, 2020 (Unaudited) |
On March 10, 2020, the Trustees met in person to discuss, among other things, the renewal of the Investment Advisory Agreement between Emerald Mutual Fund Advisers Trust (“Emerald”) and the Trust, with respect to the Emerald Banking and Finance Fund, the Emerald Growth Fund, the Emerald Insights Fund, and the Emerald Small Cap Value Fund (together, the “Emerald Funds”), in accordance with Section 15(c) of the 1940 Act. In renewing and approving the Investment Advisory Agreement between Emerald and the Trust, on behalf of the Emerald Funds, dated October 1, 2018 (the “Emerald Investment Advisory Agreement”), the Trustees, including the Independent Trustees, considered the following factors with respect to the Emerald Funds:
Nature, Extent, and Quality of the Services under the Investment Advisory Agreement: The Trustees received and considered information regarding the nature, extent, and quality of services to be provided to the Funds under the Emerald Investment Advisory Agreement. The Trustees reviewed certain background materials supplied by Emerald in its presentation, including its Form ADV.
The Trustees reviewed and considered Emerald’s investment advisory personnel, its history as an asset manager, and its performance and the amount of assets currently under management by Emerald and its affiliated entities. The Trustees also reviewed the research and decision-making processes utilized by Emerald, including the methods adopted to seek to achieve compliance with the investment objectives, policies, and restrictions of the Funds.
The Trustees considered the background and experience of Emerald’s management in connection with the Funds, including reviewing the qualifications, backgrounds, and responsibilities of the management team primarily responsible for the day-to-day portfolio management of the Funds and the extent of the resources devoted to research and analysis of actual and potential investments.
The Trustees also reviewed, among other things, Emerald’s insider trading policies and procedures and its Code of Ethics.
Performance: The Trustees reviewed performance information for each of the Funds for the 3-month, 1-year, 3-year, 5-year, and 10-year periods ended December 31, 2019, as applicable. That review included a comparison of each Fund’s performance to the performance of a group of comparable funds provided by an independent provider of investment company data (the “Data Provider”). With regard to the Emerald Banking and Finance Fund, the Trustees noted that the performance of each of the share classes was below the Data Provider peer group median for the 3-month, 1-year, and 3-year periods and above the Data Provider peer group median for the 5-year and 10-year periods, as applicable. With regard to the Emerald Growth Fund, the Trustees noted that the performance of each of the share classes was generally above the Data Provider peer group median for the 3-month and 1-year periods and generally below the Data Provider peer group median for the 3-year, 5-year, and 10-year periods, as applicable. With regard to the Emerald Insights Fund, the Trustees noted that the performance of each of the share classes was generally above the Data Provider peer group median for the 3-month, 1-year, 3-year, and 5-year periods. With regard to the Emerald Small Cap Value Fund, the Trustees noted that the performance of each of the share classes was generally above the Data Provider peer group median for the 3-month, 1-year, 3-year, and 5-year periods, as applicable.
The Trustees also considered Emerald’s discussion of each Fund’s top contributors and top detractors, as well as Emerald’s performance and reputation generally.
Investment Advisory Fee Rate: The Trustees reviewed and considered the contractual annual advisory fee paid by the Trust, on behalf of the Funds, to Emerald of 1.00% of the Emerald Banking and Finance Fund’s daily average net assets up to and including $100 million and 0.90% in excess of $100 million and, for each of the other Funds, 0.75% of the daily average net assets up to and including $250 million, 0.65% in excess of $250 million and up to and including $500 million, 0.55% in excess of $500 million and up to and including $750 million, and 0.45% in excess of $750 million, in light of the extent and quality of the advisory services provided by Emerald to the Funds.
The Board received and considered information including a comparison of each of the Fund’s contractual advisory fees with those of funds in the expense peer group of comparable funds provided by the Data Provider. With regard to the Emerald Growth Fund and the Emerald Small Cap Value Fund, the Trustees noted that the contractual advisory fee rate, for each share class of each Fund, was below the Data Provider peer group median. With regard to the Emerald Banking and Finance Fund, the Trustees noted that the contractual advisory fee rate, for each share class, was above the Data Provider peer group median. With regard to the Emerald Insights Fund, the Trustees noted that the contractual advisory fee rate, for each share class, was generally the same as the Data Provider peer group median.
Total Expense Ratios: The Trustees further reviewed and considered the total expense ratios (net of waivers) of 1.42% for Class A, 2.07% for Class C, 1.06% for Institutional Class, and 1.43% for Investor Class of the Emerald Banking and Finance Fund; 1.01% for Class A, 1.66% for Class C, 0.69% for Institutional Class, and 1.04% for Investor Class of the Emerald Growth Fund; 1.35% for Class A, 2.00% for Class C, 1.05% for Institutional Class, and 1.40% for Investor Class of the Emerald Insights Fund; and 1.35% for Class A, 2.00% for Class C, 1.00% for Institutional Class, and 1.25% for Investor Class of the Emerald Small Cap Value Fund.
With regard to the Emerald Growth Fund, the Trustees noted that the total net expense ratio, for each share class, was below the Data Provider peer group median. With regard to the Emerald Banking and Finance Fund, the Trustees noted that the total net expense ratio, for each share class, was above the Data Provider peer group median. With regard to Emerald Small Cap Value Fund, the Trustees noted that the total net expense ratio, for each share class, was generally below the Data Provider peer group median. With regard to the Emerald Insights Fund, the
| 84 | www.emeraldmutualfunds.com |
| Emerald Funds | Disclosure Regarding Approval of Fund Advisory Agreement |
| | April 30, 2020 (Unaudited) |
Trustees noted that the total net expense ratio, for Class A, Institutional Class, and Investor Class, was above the Data Provider peer group median, and for Class C, was below the Data Provider peer group median.
Comparable Accounts: The Trustees noted certain information provided by Emerald regarding fees charged to its other clients utilizing a strategy similar to that employed by the Funds.
Profitability: The Trustees received and considered a retrospective and projected profitability analysis prepared by Emerald based on the fees payable under the Emerald Investment Advisory Agreement with respect to each Fund. The Trustees considered the profits, if any, anticipated to be realized by Emerald in connection with the operation of each Emerald Fund. The Board then reviewed Emerald’s audited financial statements for the years ended September 30, 2018 and 2017 in order to analyze the financial condition and stability and profitability of Emerald.
Economies of Scale: The Trustees considered whether economies of scale in the provision of services to the Funds are or will be passed along to the shareholders under the proposed agreements, and noted breakpoints in the advisory fee schedule.
Other Benefits to the Adviser: The Trustees reviewed and considered any other incidental benefits derived or to be derived by Emerald from its relationship with the Funds, including whether soft dollar arrangements were used.
In renewing Emerald as the Funds’ investment adviser and renewing the Emerald Investment Advisory Agreement and the fees charged under the Emerald Investment Advisory Agreement, the Trustees concluded that no single factor reviewed by the Trustees was identified by the Trustees to be determinative as the principal factor in whether to renew the Emerald Investment Advisory Agreement. Further, the Independent Trustees were advised by separate independent legal counsel throughout the process. The Trustees, including all of the Independent Trustees, concluded that:
| ● | The nature, extent, and quality of services rendered by Emerald under the Emerald Investment Advisory Agreement with respect to the Funds was adequate; |
| ● | With regard to the Emerald Banking and Finance Fund, the Trustees noted that the performance of each of the share classes was below the Data Provider peer group median for the 3-month, 1-year, and 3-year periods and above the Data Provider peer group median for the 5-year and 10-year periods, as applicable. With regard to the Emerald Growth Fund, the Trustees noted that the performance of each of the share classes was generally above the Data Provider peer group median for the 3-month and 1-year periods and generally below the Data Provider peer group median for the 3-year, 5-year, and 10-year periods, as applicable. With regard to the Emerald Insights Fund, the Trustees noted that the performance of each of the share classes was generally above the Data Provider peer group median for the 3- month, 1-year, 3-year, and 5-year periods. With regard to the Emerald Small Cap Value Fund, the Trustees noted that the performance of each of the share classes was generally above the Data Provider peer group median for the 3-month, 1-year, 3-year, and 5-year periods, as applicable; |
| ● | With regard to the Emerald Growth Fund and the Emerald Small Cap Value Fund, the Trustees noted that the contractual advisory fee rate, for each share class of each Fund, was below the Data Provider peer group median. With regard to the Emerald Banking and Finance Fund, the Trustees noted that the contractual advisory fee rate, for each share class, was above the Data Provider peer group median. With regard to the Emerald Insights Fund, the Trustees noted that the contractual advisory fee rate, for each share class, was generally the same as the Data Provider peer group median; |
| ● | With regard to the Emerald Growth Fund, the Trustees noted that the total net expense ratio, for each share class, was below the Data Provider peer group median. With regard to the Emerald Banking and Finance Fund, the Trustees noted that the total net expense ratio, for each share class, was above the Data Provider peer group median. With regard to Emerald Small Cap Value Fund, the Trustees noted that the total net expense ratio, for each share class, was generally below the Data Provider peer group median. With regard to the Emerald Insights Fund, the Trustees noted that the total net expense ratio, for Class A, Institutional Class, and Investor Class, was above the Data Provider peer group median, and for Class C, was below the Data Provider peer group median; |
| ● | Bearing in mind the limitations of comparing different types of managed accounts and the different levels of service typically associated with such accounts, the fee structures applicable to Emerald’s other clients employing a comparable strategy to one or more of the Funds were not indicative of any unreasonableness with respect to the advisory fees proposed to be payable by the Funds; |
| ● | The profit, if any, realized by Emerald in connection with the operation of the Funds is not unreasonable to the Funds; and |
| ● | There were no material economies of scale or other incidental benefits accruing to Emerald in connection with its relationship with the Funds. |
Based on the Trustees’ deliberations and their evaluation of the information described above, the Trustees, including all of the Independent Trustees, concluded that Emerald’s compensation for investment advisory services is consistent with the best interests of the Funds and their shareholders.
| Annual Report | April 30, 2020 | 85 |
| Emerald Funds | Liquidity Risk Management Program |
| | April 30, 2020 (Unaudited) |
The Financial Investors Trust (the “Trust”) has established a liquidity risk management program (the “Program”) to govern the Trust’s approach to managing liquidity risk for each Fund in the Trust (each a “Fund”). The Program is overseen by the Liquidity Committee (the “Committee”), a committee comprised of representatives of the Trust’s investment advisers, sub-advisers, and Officers of the Trust. The Trust’s Board of Trustees (the “Board”) has approved the designation of the Committee to oversee the Program.
The Program’s principal objectives include supporting each Fund’s compliance with limits on investments in illiquid assets and mitigating the risk that a Fund will be unable to meet its redemption obligations in a timely manner. The Program also includes a number of elements that support the management and assessment of liquidity risk, including a periodic assessment of factors that influence a Fund’s liquidity and the periodic classification and re-classification of the Fund’s investments into groupings that reflect the Committee’s assessment of their relative liquidity under current market conditions.
At a meeting of the Board held on March 10, 2020, the Trustees received a report from the Committee regarding the design and operational effectiveness of the Program since its implementation on December 1, 2018. The Committee determined, and reported to the Board, that the Program is reasonably designed to assess and manage each Fund’s liquidity risk and has operated adequately and effectively to manage each Fund’s liquidity risk since implementation.
The Committee reported that during the period covered by the report, there were no liquidity events that impacted the Funds or their ability to timely meet redemptions without dilution to existing shareholders. Among other things, the Board noted that the Funds are not required to have a highly liquid investment minimum based on their liquidity classifications. The Board further noted that no material changes have been made to the Program since its implementation.
| 86 | www.emeraldmutualfunds.com |
| Emerald Funds | Trustees and Officers |
| | April 30, 2020 (Unaudited) |
Additional information regarding the Fund’s trustees is included in the Statement of Additional Information, which can be obtained without charge by calling 855-828-9909.
INDEPENDENT TRUSTEES
| Name, Address* & Year of Birth | Position(s) Held with Fund | Term of Office** and Length of Time Served | Principal Occupation(s) During Past 5 Years*** | Number of Funds in Fund Complex Overseen by Trustee**** | Other Directorships Held by Trustee During Past 5 Years*** |
| Mary K. Anstine, 1940 | Trustee and Chairman | Ms. Anstine was elected at a special meeting of shareholders held on March 21, 1997 and re-elected at a special meeting of shareholders held on August 7, 2009. Ms. Anstine was appointed Chairman of the Board at the June 6, 2017 meeting of the Board of Trustees. | Ms. Anstine was formerly an Executive Vice President of First Interstate Bank of Denver until 1994, President/Chief Executive Officer of HealthONE Alliance, Denver, Colorado, from 1994 to 2004, and has been retired since 2004. Ms. Anstine is also Trustee/Director of AV Hunter Trust and Colorado Uplift Board. Ms. Anstine was formerly a Director of the Trust Bank of Colorado (later purchased and now known as Northern Trust Bank), HealthONE and Denver Area Council of the Boy Scouts of America, and a member of the American Bankers Association Trust Executive Committee. | 31 | Ms. Anstine is a Trustee of ALPS ETF Trust (16 funds); ALPS Variable Investment Trust (7 funds); Reaves Utility Income Fund (1 fund); and Segall Bryant & Hamill Trust (16 funds). |
| Jeremy W. Deems, 1976 | Trustee | Mr. Deems was appointed as a Trustee at the March 11, 2008 meeting of the Board of Trustees and elected at a special meeting of shareholders held on August 7, 2009. | Mr. Deems is the Co-Founder, Chief Operations Officer and Chief Financial Officer of Green Alpha Advisors, LLC, a registered investment advisor, and Co-Portfolio Manager of the Shelton Green Alpha Fund. Prior to joining Green Alpha Advisors, Mr. Deems was CFO and Treasurer of Forward Management, LLC, ReFlow Management Co., LLC, ReFlow Fund, LLC, a private investment fund, and Sutton Place Management, LLC, an administrative services company, from 1998 to June 2007. From 2004 to 2005, Mr. Deems also served as Treasurer of the Forward Funds and the Sierra Club Funds. | 31 | Mr. Deems is a Trustee of ALPS ETF Trust (16 funds); ALPS Variable Investment Trust (7 funds); Clough Funds Trust (1 fund); and Reaves Utility Income Fund (1 fund). |
| Annual Report | April 30, 2020 | 87 |
| Emerald Funds | Trustees and Officers |
| | April 30, 2020 (Unaudited) |
INDEPENDENT TRUSTEES
| Name, Address* & Year of Birth | Position(s) Held with Fund | Term of Office** and Length of Time Served | Principal Occupation(s) During Past 5 Years*** | Number of Funds in Fund Complex Overseen by Trustee**** | Other Directorships Held by Trustee During Past 5 Years*** |
| Jerry G. Rutledge, 1944 | Trustee | Mr. Rutledge was elected at a special meeting of shareholders held on August 7, 2009. | Mr. Rutledge is the President and owner of Rutledge’s Inc., a retail clothing business. Mr. Rutledge is currently Director of the American National Bank. He was from 1994 to 2007 a Regent of the University of Colorado. | 31 | Mr. Rutledge is a Trustee of Clough Global Dividend and Income Fund (1 fund); Clough Global Equity Fund (1 fund); Clough Global Opportunities Fund (1 fund); and Principal Real Estate Income Fund (1 fund). |
| Michael “Ross” Shell, 1970 | Trustee | Mr. Shell was elected at a special meeting of shareholders held on August 7, 2009. | Mr. Shell is Founder and CEO of Red Idea, LLC, a strategic consulting/early stage venture firm (since June 2008). From 1999 to 2009, he was a part-owner and Director of Tesser, Inc., a brand agency. From December 2005 to May 2008, he was Director, Marketing and Investor Relations, of Woodbourne, a REIT/real estate hedge fund and private equity firm. Prior to this, from May 2004 to November 2005, he worked as a business strategy consultant; from June 2003 to April 2004, he was on the Global Client Services team of IDEO, a product design/innovation firm; and from 1999 to 2003, he was President of Tesser, Inc. Mr. Shell graduated with honors from Stanford University with a degree in Political Science. | 31 | None. |
| 88 | www.emeraldmutualfunds.com |
| Emerald Funds | Trustees and Officers |
| | April 30, 2020 (Unaudited) |
INTERESTED TRUSTEE
| Name, Address* & Year of Birth | Position(s) Held with Fund | Term of Office** and Length of Time Served | Principal Occupation(s) During Past 5 Years*** | Number of Funds in Fund Complex Overseen by Trustee**** | Other Directorships Held by Trustee During Past 5 Years*** |
| Edmund J. Burke, 1961 | Trustee | Mr. Burke was elected as Trustee at a special meeting of shareholders held on August 7, 2009. | Mr. Burke joined ALPS in 1991 and served as the President and Director of ALPS Holdings, Inc., and ALPS Advisors, Inc., and Director of ALPS Distributors, Inc., ALPS Fund Services, Inc. (“ALPS”), and ALPS Portfolio Solutions Distributor, Inc. (collectively, the “ALPS Companies”). Mr. Burke retired from the ALPS Companies in June 2019. Mr. Burke is deemed an interested Trustee by virtue of his prior positions with the ALPS Companies. | 31 | Mr. Burke is a Trustee of ALPS ETF Trust (16 funds); Clough Global Dividend and Income Fund (1 fund); Clough Global Equity Fund (1 fund); Clough Global Opportunities Fund (1 fund); Clough Funds Trust (1 fund); Liberty All-Star Equity Fund (1 fund); and Director of the Liberty All-Star Growth Fund, Inc. (1 fund). |
| Annual Report | April 30, 2020 | 89 |
| Emerald Funds | Trustees and Officers |
| | April 30, 2020 (Unaudited) |
OFFICERS
| Name, Address* & Year of Birth | Position(s) Held with Fund | Term of Office** and Length of Time Served | Principal Occupation(s) During Past 5 Years*** |
| Bradley J. Swenson, 1972 | President | Mr. Swenson was elected President of the Trust at the June 11 – 12, 2019 meeting of the Board of Trustees. | Mr. Swenson joined ALPS in 2004 and has served as its President since June 2019. In this role, he serves as an officer to certain other closed-end and open-end investment companies. He previously served as the Chief Operating Officer of ALPS (2015-2019). Mr. Swenson also previously served as Chief Compliance Officer to ALPS, its affiliated entities, and to certain ETF, closed-end and open-end investment companies (2004-2015). Because of his position with ALPS, Mr. Swenson is deemed an affiliate of the Trust as defined under the 1940 Act. |
| Kimberly R. Storms, 1972 | Treasurer | Ms. Storms was elected Treasurer of the Trust at the March 12, 2013 meeting of the Board of Trustees. | Ms. Storms is Senior Vice President - Director of Fund Administration of ALPS. Because of her position with ALPS, Ms. Storms is deemed an affiliate of the Trust as defined under the 1940 Act. Ms. Storms is also Treasurer of ALPS Series Trust. Ms. Storms also serves as a Board member and Treasurer of The Center for Trauma & Resilience, a nonprofit agency. |
| Karen S. Gilomen, 1970 | Secretary | Ms. Gilomen was elected Secretary of the Trust at the December 13, 2016 meeting of the Board of Trustees. | Ms. Gilomen joined ALPS in August 2016 as Vice President and Senior Counsel. Prior to joining ALPS, Ms. Gilomen was Vice President - General Counsel & CCO of Monticello Associates, Inc. from 2010 to 2016. Because of her position with ALPS, Ms. Gilomen is deemed an affiliate of the Trust, as defined under the 1940 Act. Ms. Gilomen is also the Secretary of ALPS Variable Investment Trust and Reaves Utility Income Fund, and the Assistant Secretary of the WesMark Funds. |
| Ted Uhl, 1974 | Chief Compliance Officer (“CCO”) | Mr. Uhl was appointed CCO of the Trust at the June 8, 2010 meeting of the Board of Trustees. | Mr. Uhl joined ALPS in October 2006, and is currently Deputy Compliance Officer of ALPS. Prior to his current role, Mr. Uhl served as Senior Risk Manager for ALPS from October 2006 until June 2010. Before joining ALPS, Mr. Uhl served a Sr. Analyst with Enenbach and Associates (RIA), and a Sr. Financial Analyst at Sprint. Because of his position with ALPS, Mr. Uhl is deemed an affiliate of the Trust as defined under the 1940 Act. Mr. Uhl is also CCO of the Boulder Growth & Income Fund, Inc., Centre Funds, Index Funds, Reality Shares ETF Trust, Reaves Utility Income Fund and XAI Octagon Floating Rate & Alternative Income Term Trust. |
| Jennell Panella, 1974 | Assistant Treasurer | Ms. Panella was elected Assistant Treasurer of the Trust at the September 15, 2015 meeting of the Board of Trustees | Ms. Panella joined ALPS in June 2012 and is currently Fund Controller of ALPS Fund Services, Inc. Prior to joining ALPS, Ms. Panella served as Financial Reporting Manager for Parker Global Strategies, LLC (2009-2012). Because of her position with ALPS, Ms. Panella is deemed an affiliate of the Trust as defined under the 1940 Act. Ms. Panella also serves as Assistant Treasurer of James Advantage Funds. |
| 90 | www.emeraldmutualfunds.com |
| Emerald Funds | Trustees and Officers |
| | April 30, 2020 (Unaudited) |
OFFICERS
| Name, Address* & Year of Birth | Position(s) Held with Fund | Term of Office** and Length of Time Served | Principal Occupation(s) During Past 5 Years*** |
| Sharon Akselrod, 1974 | Assistant Secretary | Ms. Akselrod was elected Assistant Secretary of the Trust at the September 15, 2015 meeting of the Board of Trustees. | Ms. Akselrod joined ALPS in August 2014 and is currently Senior Investment Company Act Paralegal of ALPS Fund Services, Inc. Prior to joining ALPS, Ms. Akselrod served as Corporate Governance and Regulatory Associate for Nordstrom fsb (2013-2014) and Senior Legal Assistant – Legal Manager for AXA Equitable Life Insurance Company (2008-2013). Because of her position with ALPS, Ms. Akselrod is deemed an affiliate of the Trust as defined under the 1940 Act. Ms. Akselrod is also Secretary of Principal Real Estate Income Fund and Assistant Secretary of ALPS ETF Trust and Clough Funds Trust. |
| Jennifer Craig, 1973 | Assistant Secretary | Ms. Craig was elected Assistant Secretary of the Trust at the June 8, 2016 meeting of the Board of Trustees. | Ms. Craig joined ALPS in 2007 and is currently Assistant Vice President and Paralegal Manager of ALPS. Because of her position with ALPS, Ms. Craig is deemed an affiliate of the Trust as defined under the 1940 Act. Ms. Craig is also Assistant Secretary of Clough Global Dividend and Income Fund, Clough Global Equity Fund, Clough Global Opportunities Fund, Principal Real Estate Income Fund, Liberty All‐Star Equity Fund and Liberty All‐Star Growth Fund, Inc. |
| Sareena Khwaja-Dixon, 1980 | Assistant Secretary | Ms. Khwaja-Dixon was elected Assistant Secretary of the Trust at the December 12, 2017 meeting of the Board of Trustees. | Ms. Khwaja-Dixon joined ALPS in August 2015 and is currently Senior Counsel and Vice President of ALPS Fund Services, Inc. Prior to joining ALPS, Ms. Khwaja-Dixon served as a Senior Paralegal/Paralegal for Russell Investments (2011 – 2015). Because of her position with ALPS, Ms. Khwaja-Dixon is deemed an affiliate of the Trust as defined under the 1940 Act. Ms. Khwaja-Dixon is also Secretary of Liberty All-Star Equity Fund, Liberty All-Star Growth Fund, Inc., Clough Funds Trust, Clough Global Dividend and Income Fund, Clough Global Opportunities Fund, and Clough Global Equity Fund. |
| * | All communications to Trustees and Officers may be directed to Financial Investors Trust c/o 1290 Broadway, Suite 1000, Denver, CO 80203. |
| ** | This is the period for which the Trustee or Officer began serving the Trust. Each Trustee serves an indefinite term, until such Trustees successor is elected and appointed, or such Trustee resigns or is deceased. Officers are elected on an annual basis. |
| *** | Except as otherwise indicated, each individual has held the office shown or other offices in the same company for the last five years. |
| **** | The Fund Complex includes all series of the Trust, currently 31, and any other investment companies for which any Trustee serves as trustee for and for which Emerald Mutual Fund Advisers Trust provides investment advisory services (currently none). |
| Annual Report | April 30, 2020 | 91 |
| Emerald Funds | Privacy Policy |
| Who We Are | |
| Who is providing this notice? | Emerald Banking and Finance Fund, Emerald Growth Fund, Emerald Insights Fund and Emerald Small Cap Value Fund |
| What We Do | |
| How do the Funds protect my personal information? | To protect your personal information from unauthorized access and use, we use security measures that comply with federal law. These measures include computer safeguards and secured files and buildings. |
| How do the Funds collect my personal information? | We collect your personal information, for example, when you
• open an account
• provide account information or give us your contact information
• make a wire transfer or deposit money |
| Why can’t I limit all sharing? | Federal law gives you the right to limit only • sharing for affiliates’ everyday business purposes-information about your creditworthiness • affiliates from using your information to market to you
• sharing for non-affiliates to market to you
State laws and individual companies may give you additional rights to limit sharing.
|
| Definitions | |
| Affiliates | Companies related by common ownership or control. They can be financial and nonfinancial companies. |
| Non-affiliates | Companies not related by common ownership or control. They can be financial and nonfinancial companies.
• The Funds do not share with non-affiliates so they can market to you. |
| Joint marketing | A formal agreement between non-affiliated financial companies that together market financial products or services to you.
• The Funds do not jointly market. |
| Other Important Information | |
| California residents | If your account has a California home address, your personal information will not be disclosed to nonaffiliated third parties except as permitted by applicable California law, and we will limit sharing such personal information with our affiliates to comply with California privacy laws that apply to us. |
| Vermont residents | The State of Vermont requires financial institutions to obtain your consent prior to sharing personal information that they collect about you with affiliated companies and nonaffiliated third parties other than in certain limited circumstances. Except as permitted by law, we will not share personal information we collect about you with nonaffiliated third parties or other affiliated companies unless you provide us with your written consent to share such information. |
| 92 | www.emeraldmutualfunds.com |
| Emerald Funds | Privacy Policy |
| FACTS | WHAT DO THE FUNDS DO WITH YOUR PERSONAL INFORMATION? |
| WHY? | Financial companies choose how they share your personal information. Federal law gives consumers the right to limit some but not all sharing. Federal law also requires us to tell you how we collect, share, and protect your personal information. Please read this notice carefully to understand what we do. |
| WHAT? | The types of personal information we collect and share depend on the product or service you have with us. This information can include: • Social Security number and account transactions • Account balances and transaction history • Wire transfer instructions |
| HOW? | All financial companies need to share customers’ personal information to run their everyday business. In the section below, we list the reasons financial companies can share their customers’ personal information; the reasons the Funds choose to share; and whether you can limit this sharing. |
| Reasons we can share your personal information | Do the funds share: | Can you limit this sharing? |
| For our everyday business purposes – | | |
| such as to process your transactions, maintain your account(s), respond to court orders and legal investigations, or report to credit bureaus | Yes | No |
| For our marketing purposes – | | |
| to offer our products and services to you | No | We do not share. |
| For joint marketing with other financial companies | No | We do not share. |
| For our affiliates’ everyday business purposes – | | |
| information about your transactions and experiences | Yes | No |
| For our affiliates’ everyday business purposes – | | |
| information about your creditworthiness | No | We do not share. |
| For non-affiliates to market to you | No | We do not share. |
| Annual Report | April 30, 2020 | 93 |


Beginning on January 1, 2021, as permitted by regulations adopted by the U.S. Securities and Exchange Commission, paper copies of the Funds’ annual and semi-annual shareholder reports will no longer be sent by mail, unless you specifically request paper copies of the reports. Instead, the reports will be made available on the Funds’ website at www.GrandeurPeakGlobal.com and you will be notified by mail each time a report is posted and provided with a website link to access the report.
You may, notwithstanding the availability of shareholder reports online, elect to receive all future shareholder reports in paper free of charge. If you invest through a financial intermediary, you can contact your financial intermediary to request that you continue to receive paper copies of your shareholder reports. If you invest directly with the Funds, you can call 1-855-377-PEAK (7325) to let the Funds know you wish to continue receiving paper copies of your shareholder reports.
If you already elected to receive shareholder reports electronically, you will not be affected by this change and you need not take any action. You may elect to receive shareholder reports and other communications from the Funds electronically anytime by contacting your financial intermediary (such as a broker-dealer or bank) or, if you are a direct investor, by enrolling at www.GrandeurPeakGlobal.com.

TABLE OF CONTENTS
| Shareholder Letter | 2 |
| Performance Update | 7 |
| Disclosure of Fund Expenses | 34 |
| Portfolio of Investments | |
| Grandeur Peak Emerging Markets Opportunities Fund | 37 |
| Grandeur Peak Global Contrarian Fund | 40 |
| Grandeur Peak Global Micro Cap Fund | 43 |
| Grandeur Peak Global Opportunities Fund | 46 |
| Grandeur Peak Global Reach Fund | 50 |
| Grandeur Peak Global Stalwarts Fund | 55 |
| Grandeur Peak International Opportunities Fund | 58 |
| Grandeur Peak International Stalwarts Fund | 61 |
| Grandeur Peak US Stalwarts Fund | 64 |
| Statements of Assets and Liabilities | 66 |
| Statements of Operations | 69 |
| Statements of Changes in Net Assets | |
| Grandeur Peak Emerging Markets Opportunities Fund | 72 |
| Grandeur Peak Global Contrarian Fund | 73 |
| Grandeur Peak Global Micro Cap Fund | 74 |
| Grandeur Peak Global Opportunities Fund | 75 |
| Grandeur Peak Global Reach Fund | 76 |
| Grandeur Peak Global Stalwarts Fund | 77 |
| Grandeur Peak International Opportunities Fund | 78 |
| Grandeur Peak International Stalwarts Fund | 79 |
| Grandeur Peak US Stalwarts Fund | 80 |
| Financial Highlights | |
| Grandeur Peak Emerging Markets Opportunities Fund | 81 |
| Grandeur Peak Global Contrarian Fund | 83 |
| Grandeur Peak Global Micro Cap Fund | 84 |
| Grandeur Peak Global Opportunities Fund | 85 |
| Grandeur Peak Global Reach Fund | 87 |
| Grandeur Peak Global Stalwarts Fund | 89 |
| Grandeur Peak International Opportunities Fund | 91 |
| Grandeur Peak International Stalwarts Fund | 93 |
| Grandeur Peak US Stalwarts Fund | 95 |
| Notes to Financial Statements | 96 |
| Report of Independent Registered Public Accounting Firm | 110 |
| Disclosure Regarding Approval of Fund Advisory Agreement | 112 |
| Additional Information | 114 |
| Liquidity Risk Management Program | 116 |
| Trustees and Officers | 117 |
| Privacy Policy | 122 |
| Grandeur Peak Funds® | Shareholder Letter |
April 30, 2020 (Unaudited)
Dear Fellow Shareholders,
These are unusual times. Below is Founder and Chairman Robert Gardiner's letter to shareholders from March 21st in case you missed it:
It’s Saturday morning after one of the most grueling weeks of my career and I feel the need to write to our valued clients, shareholders and employees. One message that I would of course give is that I’ve been here before. I had been engaged to my wife Susie for just a few weeks as a young optimistic analyst when the Dow Jones Industrial Index ("the Dow") plunged 22.6% in a single day on Black Monday October 19, 1987. I was in the same chair I’m sitting in now in my home office on September 11, 2001 when the attacks in New York City occurred. Stock markets were closed for about a week and by September 21st the Dow had fallen -18.6%. I lived through the Global Financial Crisis in 2007-09 which saw the Global Equity market, as measured by the MSCI All-Country World Index (ACWI IMI), fall 56.4% from its October 2007 peak to its February 2009 trough.
For some of these major market events over the last 3+ decades I have been well prepared. When the dot-com bubble burst in 2000, my portfolios were particularly well positioned; and for the Gulf War recession of 1990, I was also positioned nicely. Others not as well. Hindsight is always 20/20. I wished I’d paid full attention to the developing COVID-19 threat. Having lived through MERS, SARS, Swine Flu (H1N1), and more recently the Ebola scare, I was optimistic that this new coronavirus would remain more contained than has proved to be the case.
The events of 9/11 hit particularly close to home as my best friend and founding partner Eric Huefner and his family were living in New York City at the time, and I knew of some of the asset managers who worked in the twin towers. There was a realization that it could have just as easily been my firm or my friend or me! With the coronavirus having now reached Salt Lake City and your city, this morning it’s clear that my friends, my family, my clients, and my colleagues will almost certainly soon be affected intimately by this event. To add insult to injury, you may have heard we had an earthquake in Salt Lake City this week (fortunately only 5.7). It was a sobering feeling yesterday, and one of mental exhaustion, as the US market (S&P 500) faded late in the session to end the week down -14.98% (as of 4/20/20), on top of the declines from the prior weeks, making this fall top-to-bottom of around -32.80% for the S&P 500, -32.49% for the ACWI IMI, and -36.72% for the ACWI Small Cap Index so far over 20, 27, and 26 trading days respectively1.
While this past week has been tough, and the future coming weeks are unlikely to be different, I want to tell you that I remain both tremendously optimistic AND totally energized to meet the challenges to come. Exhausted mentally and physically at market close yesterday, but rejuvenated this morning! Today is a new day and there is a new week coming. Our team is ready and prepared for the war in front of us. Like that newly engaged analyst I was in 1987, I remain very optimistic for the future and ready to go to battle! My message today to you is one of hope and optimism!
Let me tell you where things stand for our firm . . .
Our team was very well prepared for these events in terms of business continuity. Working remotely has been part of our DNA since inception and we’ve spared little expense to be able to do so from day one. Our entire team worked from home all week and we experienced no real disruption, other than the fact that our children are also home schooling now! We are doing all we can to selfquarantine and keep our team healthy. As you know, we discontinued travel completely several weeks ago, after having discontinued Asian travel months ago. Travel is part of our process, but we know how to interact with our companies and conduct due diligence without travel, and we are doing so at full speed during this market volatility.
Our research team is prepared. We’ve spent the past 9 years figuring out what we believe are the very best (top 10%) of public companies in the world. While we always have more work to do, the work we’ve already done is substantial and will be extremely valuable for this period ahead. In recent weeks, for example, we’ve bought a significant number of our watch A companies that we’ve followed for years but were too expensive to buy until this correction.
Our playbook has generally worked well over my career in this kind of market environment. Indeed, our team’s goal has always been to try to keep up in bull markets and seek to shine in bear markets. My experience has been that our strategy to own the very best companies we can find, at reasonable valuations, gives us a good chance to perform in this fashion. Good companies are resilient in tough periods.
We of course continue to try to identify the long-run themes that will be important. Certainly, health care diagnostic companies should have a tail wind long-run from this. Remote networking and learning will be beneficiaries. We like security as a theme here in particular.
| 1 | Past performance is no guarantee of future results. |
| 2 | 1.855.377.7325 | www.GrandeurPeakGlobal.com |
| Grandeur Peak Funds® | Shareholder Letter |
April 30, 2020 (Unaudited)
And my favorite theme coming out of COVID-19 and the recent trade wars, is that there will be many new investments around supply chain issues. It’s not good enough to just source everything from one place (e.g. China).
At the same time, we also have a contrarian gene in us. Let me illustrate this. Is it time to buy Zoom Video Communications (ticker: ZM) or is it time to buy Texas Roadhouse (ticker: TXRH)? Zoom is a clear winner in remote video conferencing. Many of our kids are using Zoom this week. Its stock is up 90% year-to-date through March 20th. Texas Roadhouse on the other hand is a restaurant company whose stock has fallen in half since February 21st, as it is clear they will have a very tough period coming up. But our belief is that great companies with strong balance sheets can weather these storms and can be tremendous investments right now if they can survive. We believe both companies have promising long-term potential, but their short-term valuations provide very different opportunities.2
Companies with elevated debt levels have been pummeled. While we do own a few companies with leverage issues, our portfolios in general have far lower levels of debt than the benchmarks, and we believe this will help us. Some of what we consider to be great companies do have elevated debt, but levels we think will be manageable. These stocks have also been severely hit and present what we see as buying opportunities.
So, we will also remain contrarian investors at the edges of our portfolio.
Looking at performance since Jan 31, 2020 across the small-cap universe (as measured by the MSCI Small Cap Indexes), the US has underperformed both Non-US Developed and Emerging Markets, while Emerging Markets have outperformed Developed. This has helped us a little as we have been overweight Emerging Markets. Micro- and small-cap companies continue to underperform larger-cap companies, so that remains a substantial headwind for us right now. We’ve seen a similar pattern in past downturns, but we have also historically seen that there can be a nice snapback in small-cap stocks when the market rebounds.
I want to emphasize though that the dominant theme for us right now remains simple . . . good companies can get stronger in tough times. So, we are looking for those companies that we believe will come out of this period stronger. Right now, our toughest decision is to sell a good company at a really good valuation to buy a better, great company at what we believe is a great valuation. In the end, these kinds of periods have historically benefited the strong companies, and the weaker ones have fallen by the wayside. This is our overriding strategy and the first page of our playbook.
I can report that so far we are doing well compared to our benchmarks and peers in this downturn (go to pages 7-33 to see performance for each fund)3. Of course, that doesn’t diminish the fact that absolute performance has taken a substantial hit, and it’s still very early to know how this period will play out. There is much work for us to do. We think we have a good playbook for it, and I promise we will put forth our very best efforts.
I have personally made significant additional investments into our funds over the last couple of weeks. In addition, Grandeur Peak has taken a meaningful portion of its balance sheet to purchase our funds. We also accelerated a special dividend, and paid it in the form of shares of our Stalwarts funds, to all Grandeur Peak employees in celebration of the very successful five-year anniversary of our Global and International Stalwarts funds (which officially occurs 9/1/20). I know other colleagues at Grandeur Peak have also invested additional personal funds recently. We eat our own cooking and we are standing shoulder to shoulder with you in these investments.
I would also like to highlight that similar to what Blake and I did in November of 2008, when we launched the Wasatch Global Opportunities Fund in the depth of the Global Financial Crisis, Grandeur Peak has taken this opportunity to finally launch our US Stalwarts Fund (GUSYX). We’ve been waiting nine years for a correction in the US market to do this. In hindsight, I wish we’d also waited until now to launch our Global Contrarian Fund (GPGCX), which we launched last September, but we’re really excited about both of these new funds. With such small asset bases they are particularly nimble in this market and we think that could be a nice advantage. Overall, we continue to feel quite nimble as a firm, having limited the assets in all of our small- and micro-cap funds.
I want to let you know that our firm is strong. We intend to retain all of our people in this downturn. We have saved for a rainy day, and we’ve been prudent in the structuring of our business model. If things get a lot worse, I will do all in my power to keep our full team intact. In fact, we are in the process of hiring someone to fill the role of full-time chief compliance officer & general counsel, in line with our longterm game plan. We also have two new research interns joining us later in the spring.
One of the great masters of investing, Sir John Templeton said, "Bull markets are born on pessimism, grown on skepticism, mature on optimism and die on euphoria. The time of maximum pessimism is the best time to buy, and the time of maximum optimism is the best
| 2 | This is for illustrative purposes only. It is not a recommendation to buy or sell either of these securities. |
| 3 | Past performance is no guarantee of future results. |
| Annual Report | April 30, 2020 | 3 |
| Grandeur Peak Funds® | Shareholder Letter |
April 30, 2020 (Unaudited)
time to sell." He also said, "To buy when others are despondently selling and sell when others are greedily buying requires the greatest fortitude and pays the greatest reward."
One of my goals in this downturn is to particularly help the young generation invest for their future retirement. In this regard, I am personally adding to my grandkids’, my nieces' and nephews' and grand nieces’ and nephews' funds with Grandeur Peak to try to encourage them to do the same, and I'm encouraging other young people to consider investing at this time. If history is repeated, it will be one of the best gifts we can give a young person (or anyone) who is in a position to invest.
To end I'd like to quote Sir John Templeton again, "Happiness comes from spiritual wealth, not material wealth... Happiness comes from giving, not getting. If we try hard to bring happiness to others, we cannot stop it from coming to us also. To get joy, we must give it, and to keep joy, we must scatter it." To this end our firm will continue to contribute 2% (at least) of our revenues to global and local charities this year. Especially this year! This week we will also try to help local restaurant owners in Salt Lake City who are suffering.
My thoughts and prayers are with you and your families at this frightening time. My prayers and hopes are also that our firm's leadership team will have the wisdom necessary to lead our company and research team through this significant storm onto a brighter day and that we can perform well for you. The coming year may be very difficult, but I believe the future is still bright!
Notes fromthe Road Home (During A Quarantine)
You may be wondering, what do research analysts in a global investment firm do when they can't travel? Over the last few months, our team has dealt first-hand with the repercussions of the COVID-19 virus. By early January, we decided that trips to Asia needed to be canceled. As the quarter progressed, our travel policy changed from “Unlimited Travel” to “Needs Approval” to “No Travel Allowed.” While meeting companies face to face is an important part of our research process, having the technology to adapt when circumstances change has meant that our team could proceed with “business as usual” as we transitioned to work-from-home protocols.
Research Analyst Spencer Randall was scheduled to travel with Miranda Jacobs (Research Analyst), Amy Sunderland (Portfolio Manager) and Blake Clayton (Rondure Portfolio Manager), to the Philippines in January. He shares his experience in planning and then adjusting their trip:
At the end of 2019, our geography teams sat down together and drew up our anticipated travel schedules for the 2020 year. For the South East Asia team, a visit to the Philippines was at the top of our list. Our team believes that the Philippines is an exciting area to be invested in right now and we wanted to get boots on the ground for further due diligence. Traveling in Asia can be difficult, and we typically utilize our in-country broker relationships when planning trips to ease the logistical burden.
The team included Miranda, Amy S, Blake C (Rondure), and me. Thanks to our frequent screening exercises, we were able to collaborate and quickly compile a long list of companies to visit. We then sent the list to our brokers who checked on company management availability and helped work out the logistics. After a few weeks of back and forth emails, we had an exciting schedule of management meetings, factory tours, and various store visits. Flights and hotels were booked, and we shifted our focus for the next few weeks to preparing for the abundance of meetings we had ahead of us.
It was around this time that news of the COVID-19 outbreak in Wuhan, China broke. Not yet knowing the full extent of the virus, we continued to anticipate our upcoming research trip. I was in frequent contact with our brokers on the ground (who were already informing on the Taal volcano eruption in Southern Luzon4), when travel restrictions began to emerge. It became clear that the virus was more serious than originally anticipated. Given the uncertainty surrounding the situation, the decision was made to postpone all Asia travel within the firm. While we were disappointed with the situation, we proceeded to inform the broker and to transfer the higher priority meetings into calls with management where possible. Most management teams were extremely understanding, and we have since been able to touch base with most of these companies. A few weeks later, the first cases of COVID-19 reached the U.S. and the era of "work from home" began.
Working from home during quarantine has been an adjustment. It is now acceptable to work in sweats or grow a scraggly mustache. And it is much easier to forget about needing to take breaks to eat, sleep, and exercise. It is a challenge not being able to walk through the office and engage in friendly market banter or easily bounce ideas off team members. However, the transition from a technology standpoint was seamless and we seem to have settled into our new routines. The number of times the phone rings everyday has tripled and while there are new interruptions hourly at home, we are keeping up with our regular team meetings. I now spend much more time talking to team members on the phone, through email, or on a video conference call rather than in person as continued collaboration remains strong. During this time, I have gained an even greater appreciation for our process and how hard everyone works. I look forward
| 4 | https://www.cnn.com/2020/01/17/asia/taal-volcano-philippines-fatal-attraction-intl-hnk/index.html |
| 4 | 1.855.377.7325 | www.GrandeurPeakGlobal.com |
| Grandeur Peak Funds® | Shareholder Letter |
April 30, 2020 (Unaudited)
to being able to return to our office with the team and again travel the globe in search for great companies. Until then, our team is very focused on the task at hand.
Business Update
We join with many in expressing our sympathies and concerns for those who have been personally affected by COVID-19. We recognize there are many ways this pandemic has altered lives around the globe. We salute the medical personnel at the front lines of the fight, the small business owners who are working to stay afloat, the workers who help provide essential services to our communities, and the scientists who are working on treatments. As a firm, we have tried to do our part to support relief efforts. We've reached out to our local and global charities to offer financial support as they identify critical needs in their organizations. We have invited employees to support our local restaurants by ordering take-out in lieu of our normal Friday lunches together. We have delivered masks and funding to our local hospitals. We are encouraging and supporting our team to continue healthy lifestyles, including maintaining good mental health. We hope you are finding creative ways to cope and deal with all the upheaval in your own lives. We recognize that it is through the small efforts of many people around the globe that solutions become possible.
After seeing the sell-off in the US markets, our team decided to launch our long-awaited US Stalwarts Fund on March 19, 2020. It may seem outlandish to launch a new fund during this period of uncertainty and volatility, but our team was well prepared and felt the current opportunity was compelling. We feel the work on our US names has been beneficial to all of our global strategies as we had names teed up when the markets saw some of its biggest drops in history. Randy Pearce and Brad Barth are the Portfolio Managers of the US Stalwarts Fund, with Stuart Rigby as guardian portfolio manager, and is run as a sister fund to the existing Stalwarts strategies. We believe seeing the global picture will potentially make us better US investors, and having a dedicated focus on a US fund should in turn make us better global investors.
We also recently announced the re-opening of our funds to certain investors. We believe it is the best interest of our current shareholders and potential new shareholders to have the funds open at this time. As a portfolio manager it is so helpful to have small net inflows given the opportunities present in a market sell-off. We continue to regard our nimbleness and limited-asset capacity as a competitive advantage as a firm and are prepared to limit the asset size of our funds in the event the market has an unexpected rebound or the flows into our funds exceed our target asset levels. However, in these current depressed market conditions, we believe shareholders with a long-term view should have the opportunity to invest.
Fund Performance & Attribution
See full performance on pages 7-33.
After the bull market continued through 2019, the first few months of 2020 were intensely volatile. The first quarter sell-off was one of the fastest drops in market history. Perhaps equally surprising was the partial rebound in April despite a very uncertain global economic outlook.
Emerging Markets Opportunities: For the year ended April 30, 2020, the Institutional share class returned very nice relative performance of -6.03% vs -18.47% for the benchmark. All regions of the emerging markets benchmark index posted negative returns for the year, but we were able to post positive returns in our largest region, Asia Pacific. We also outperformed the benchmark nicely in South and Central America. Our weakest regional performance was in Africa/Middle East. Across sectors, we outperformed the benchmark in every sector except for a small underperformance in Financials.
Global Contrarian: Since Inception (9/17/19), the Fund returned nice relative performance of -11.96% vs -20.68% for the benchmark. Asia Pacific is our largest region, and we delivered positive returns there while the benchmark was down roughly 14%. Our absolute and relative worst performance came from Central Asia. Our strongest performing sector was Health Care. Financials was our weakest performing sector, but we slightly beat the benchmark, and our significant underweight to Financials really helped the Fund's relative performance.
Global Micro Cap: For the year ended April 30, 2020, the Fund returned very nice relative performance of -1.62% vs -14.70% for the small cap benchmark. We delivered solid outperformance in both of our largest regions, Asia Pacific and Western Europe, which account for 78% of the Fund. Our worst performance came in Africa/Middle East and Eastern Europe. From a sector standpoint, we did well relative to the index across all sectors except for a small underperformance in Technology.
Global Opportunities/International Opportunities: For the year ended April 30, 2020, the Global Opportunities Institutional share class returned very nice relative performance of -1.42% vs -14.70% for the benchmark, and the International Opportunities Institutional share class returned nice relative outperformance of -5.60% vs -13.15% for the benchmark. Our stock picking and underweight in the US was a nice benefit to the Global Opportunities Fund this year. Asia Pacific was a strong region for both funds, where our positive returns easily beat the benchmark, which was down around 10%. Central Asia hurt both funds. We outperformed in Central Asia, but the region was particularly weak, and we were overweight. The Funds outperformed the benchmark across all five sectors. Health care saw the strongest performance, while Financials was the weakest.
Past performance does not guarantee future results.
| Annual Report | April 30, 2020 | 5 |
| Grandeur Peak Funds® | Shareholder Letter |
April 30, 2020 (Unaudited)
Global Reach: For the year ended April 30, 2020, the Institutional share class returned very nice relative performance of -3.09% vs -14.70% for the benchmark. Our stock picking and underweight in the US was a nice benefit to the Fund. The Fund's positive returns in Asia Pacific also contributed nicely for the year. Our weakest performance was in Central Asia. We outperformed in Central Asia, but the region was particularly weak, and we were overweight. The Fund outperformed the benchmark across all five sectors. Health care saw the strongest performance, while Industrials was our weakest.
Global Stalwarts/International Stalwarts: For the year ended April 30, 2020, the Global Stalwarts Institutional share class returned very nice relative performance of -1.98% vs -10.73% for the benchmark, and the International Stalwarts Institutional share class returned very nice relative performance of -1.49% vs -12.65% for the benchmark. Our stock picking and underweight in the US was a nice benefit to the Global Stalwarts Fund. Asia Pacific was a strong region for both funds, where our positive returns easily beat the benchmark, which was down around 10%. Central Asia hurt both funds. We outperformed in Central Asia, but the region was particularly weak, and we were overweight. The Funds outperformed the benchmark across all five sectors. Health care saw the strongest performance, while Financials was the weakest.
US Stalwarts: Since Inception (3/19/20), the Fund returned performance of +31.50% vs +24.66% for the benchmark. We're pleased to see the Fund off to a nice start, but it's too early to make any meaningful analysis of its performance.
Again, we wish to extend our appreciation to you, our partners in this journey. We are motivated by the confidence you have shown in our team and we are hopeful that we can have the wisdom and discipline to bring us through these uncertain times. We promise our best efforts and know that we continue to have a lot of work in front of us. We hope the hard work of many can bring benefits, not only to our research effort, but to the improvement and healing of the world at large.
Sincerely,
Robert Gardiner, CFA
Chairman & Portfolio Manager
Blake Walker
CEO & Portfolio Manager
Randy Pearce, CFA, MBA
CIO & Portfolio Manager
The objective of all Grandeur Peak Funds is long-term growth of capital.
RISKS: Investing in small and micro-cap funds will be more volatile and loss of principal could be greater than investing in large cap or more diversified funds. Investing in foreign securities entails special risks, such as currency fluctuations and political uncertainties, which are described in more detail in the prospectus. Investments in emerging markets are subject to the same risks as other foreign securities and may be subject to greater risks than investments in foreign countries with more established economies and securities markets.
Must be proceeded by or accompanied by a prospectus.
The views and information discussed in this commentary are as of the date of publication, are subject to change, and may not reflect the writer's current views. The views expressed represent an assessment of market conditions at a specific point in time, are opinions only and should not be relied upon as investment advice regarding a particular investment or markets in general. Such information does not constitute a recommendation to buy or sell specific securities or investment vehicles. It should not be assumed that any investment will be profitable or will equal the performance of the Funds or any securities or any sectors mentioned herein. The subject matter contained herein has been derived from several sources believed to be reliable and accurate at the time of compilation. The Funds do not accept any liability for losses either direct or consequential caused by the use of this information.
Past performance does not guarantee future results.
Eric Huefner is a registered representatives of ALPS Distributors, Inc.
ALPS Distributors, Inc. is the Distributor for the Grandeur Peak Funds.
Grandeur Peak Global Advisors and ALPS Distributors, Inc. are not affiliated.
| 6 | 1.855.377.7325 | www.GrandeurPeakGlobal.com |
| Grandeur Peak Emerging Markets Opportunities Fund | Performance Update |
April 30, 2020 (Unaudited)
Annualized Total Return Performance for the periods ended April 30, 2020
| | 6 Months | 1 Year | 3 Years | 5 Years | Since Inception(a) | Expense Ratio(b) |
| Gross | Net(c) |
| Grandeur Peak Emerging Markets Opportunities Fund – Investor (GPEOX) | -9.65% | -6.29% | -1.04% | 0.23% | 2.81% | 1.78% | 1.77% |
| Grandeur Peak Emerging Markets Opportunities Fund – Institutional (GPEIX) | -9.53% | -6.03% | -0.82% | 0.46% | 3.04% | 1.53% | 1.52% |
| MSCI Emerging Markets SMID Cap Index(d) | -17.01% | -18.47% | -4.28% | -3.43% | -0.76% | |
| MSCI Emerging Markets IMI Index(e) | -11.14% | -12.43% | 0.19% | -0.22% | 1.39% | |
Performance data quoted represents past performance. Past performance does not guarantee future results. Investment return and principal value of an investment will fluctuate so that an investor’s shares, when sold or redeemed, may be worth more or less than the original cost. The Fund imposes a 2.00% redemption fee on shares held for less than 60 days. Current performance data may be higher or lower than actual data quoted. For the most current month-end performance data, please call 1-855-377-PEAK (7325).
The table does not reflect the deduction of taxes a shareholder would pay on Fund distributions or redemption of Fund shares.
Subject to investment risks, including possible loss of the principal amount invested.
Returns for periods less than 1 year are cumulative.
| (a) | Fund inception date of December 16, 2013. |
| (b) | Ratios as of the Prospectus dated August 31, 2019 and may differ from the ratios presented in the Financial Highlights. |
| (c) | Grandeur Peak Global Advisors, LLC (the “Adviser”), has agreed to waive and/or reimburse fees or expenses in order to limit Total Annual Fund Operating Expenses After Fee Waiver/Expense Reimbursement (excluding acquired fund fees and expenses, brokerage expenses, interest expenses, taxes and extraordinary expenses) to 1.95% and 1.70% of the Fund’s average daily net assets for the Fund’s Investor Class Shares and Institutional Class Shares, respectively. This agreement (the “Expense Agreement”) is in effect through August 31, 2020. The Adviser will be permitted to recover, on a class- by-class basis, expenses it has borne through the Expense Agreement to the extent that a Fund’s expenses in later periods fall below annual rates set forth in the Expense Agreement; provided, however, that such recapture payments do not cause the Fund’s expense ratio (after recapture) to exceed the lesser of (i) the expense cap in effect at the time of the waiver and (ii) the expense cap in effect at the time of the recapture. Notwithstanding the foregoing, the Fund will not be obligated to pay any such deferred fees and expenses more than three years after the date on which the fee and expenses was deferred. The Expense Agreement may not be terminated or modified prior to August 31, 2020 except with the approval of the Fund’s Board of Trustees. |
| (d) | The MSCI Emerging Markets SMID Cap Index is designed to measure the equity market performance of small and mid-cap companies across emerging markets. MSCI makes no express or implied warranties or representations and shall have no liability whatsoever with respect to any MSCI data contained herein. The MSCI data may not be further redistributed or used to create indices or financial products. The Index is not actively managed and does not reflect any deductions for fees, expenses or taxes. An investor may not invest directly into the Index. |
| (e) | The MSCI Emerging Markets IMI Index is designed to measure the equity market performance of large, mid, and small-cap companies across emerging markets. The Index is not actively managed and does not reflect any deductions for fees, expenses or taxes. An investor may not invest directly into the Index. |
| Annual Report | April 30, 2020 | 7 |
| Grandeur Peak Emerging Markets Opportunities Fund | Performance Update |
April 30, 2020 (Unaudited)
Growth of $10,000 for the period ended April 30, 2020
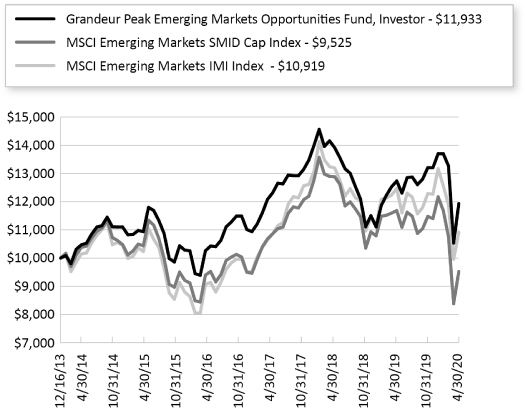
The chart shown above represents a hypothetical investment of $10,000 in the Fund’s Investor Class shares for the period from inception to April 30, 2020. All returns reflect reinvested dividends, but do not reflect the deduction of taxes that an investor would pay on distributions or redemptions.
Investing in the Fund is subject to investment risks, including possible loss of the principal amount invested.
The Fund also offers Institutional Class shares, performance for which is not reflected in the graphs above. The performance of Institutional Class shares may be higher or lower than the performance of the Investor Class shares shown in the graphs above based upon differences in fees paid by shareholders investing in the Investor Class shares and Institutional Class shares.
| 8 | 1.855.377.7325 | www.GrandeurPeakGlobal.com |
| Grandeur Peak Emerging Markets Opportunities Fund | Performance Update |
April 30, 2020 (Unaudited)
| Regional Allocation (as a % of Net Assets)* |
| Asia ex Japan | 72.2% |
| Latin America | 9.8% |
| Europe | 8.1% |
| North America | 4.0% |
| Africa/Middle East | 4.7% |
| Cash, Cash Equivalents, & Other Net Assets | 1.2% |
| Total | 100.0% |
| Industry Sector Allocation (as a % of Net Assets)* | |
| Consumer | 33.1% |
| Technology | 29.1% |
| Financials | 13.0% |
| Health Care | 11.9% |
| Industrials | 8.6% |
| Energy & Materials | 3.1% |
| Cash, Cash Equivalents, & Other Net Assets | 1.2% |
| Total | 100.0% |
| Top 10 Holdings (as a % of Net Assets)* | |
| Silergy Corp. | 3.9% |
| WNS Holdings, Ltd. | 2.5% |
| Genpact, Ltd. | 1.9% |
| Poya International Co., Ltd. | 1.9% |
| LEENO Industrial, Inc. | 1.9% |
| Dino Polska SA | 1.8% |
| Koolearn Technology Holding, Ltd. | 1.7% |
| LG Household & Health Care, Ltd. | 1.6% |
| Pagseguro Digital, Ltd. | 1.6% |
| Wilcon Depot, Inc. | 1.6% |
| Total | 20.4% |
| * | Holdings are subject to change, and may not reflect the current or future position of the portfolio. |
| Annual Report | April 30, 2020 | 9 |
| Grandeur Peak Global Contrarian Fund | Performance Update |
April 30, 2020 (Unaudited)
Annualized Total Return Performance for the periods ended April 30, 2020
| | 6 Months | Since Inception(a) | Expense Ratio(b) |
| Gross | Net(c) |
| Grandeur Peak Global Contrarian Fund – Institutional (GPGCX) | -13.35% | -11.96% | 1.90% | 1.35% |
| MSCI All Country World Index Small Cap Value(d) | -22.10% | -20.68% | |
| MSCI All Country World Index Small Cap(e) | -15.30% | -14.22% | |
Performance data quoted represents past performance. Past performance does not guarantee future results. Investment return and principal value of an investment will fluctuate so that an investor’s shares, when sold or redeemed, may be worth more or less than the original cost. The Fund imposes a 2.00% redemption fee on shares held for less than 60 days. Current performance data may be higher or lower than actual data quoted. For the most current month-end performance data, please call 1-855-377-PEAK (7325).
The table does not reflect the deduction of taxes a shareholder would pay on Fund distributions or redemption of Fund shares.
Subject to investment risks, including possible loss of the principal amount invested.
Returns for periods less than 1 year are cumulative.
| (a) | Fund inception date of September 17, 2019. |
| (b) | Ratios as of the Prospectus dated September 12, 2019 and may differ from the ratios presented in the Financial Highlights. |
| (c) | Grandeur Peak Global Advisors, LLC (the “Adviser”), has agreed to waive and/or reimburse fees or expenses in order to limit Total Annual Fund Operating Expenses After Fee Waiver/Expense Reimbursement (excluding acquired fund fees and expenses, brokerage expenses, interest expenses, taxes and extraordinary expenses) to 1.35% of the Fund’s average daily net assets for the Fund’s Institutional Class Shares. This agreement (the “Expense Agreement”) is in effect through August 31, 2021. The Adviser will be permitted to recover, on a class- by-class basis, expenses it has borne through the Expense Agreement to the extent that a Fund’s expenses in later periods fall below annual rates set forth in the Expense Agreement; provided, however, that such recapture payments do not cause the Fund’s expense ratio (after recapture) to exceed the lesser of (i) the expense cap in effect at the time of the waiver and (ii) the expense cap in effect at the time of the recapture. Notwithstanding the foregoing, the Fund will not be obligated to pay any such deferred fees and expenses more than three years after the date on which the fee and expenses was deferred. The Expense Agreement may not be terminated or modified prior to August 31, 2021 except with the approval of the Fund’s Board of Trustees. |
| (d) | The MSCI ACWI Small Cap Value Index is designed to measure small cap companies exhibiting overall value style characteristics across developed and emerging markets globally. The Index is not actively managed and does not reflect any deductions for fees, expenses or taxes. An investor may not invest directly into the Index. |
| (e) | The MSCI ACWI Small Cap Index is designed to measure the equity market performance of performance of small-cap companies across developed and emerging markets globally. MSCI makes no express or implied warranties or representations and shall have no liability whatsoever with respect to any MSCI data contained herein. The MSCI data may not be further redistributed or used to create indices or financial products. The Index is not actively managed and does not reflect any deductions for fees, expenses or taxes. An investor may not invest directly into the Index. |
| 10 | 1.855.377.7325 | www.GrandeurPeakGlobal.com |
| Grandeur Peak Global Contrarian Fund | Performance Update |
April 30, 2020 (Unaudited)
Growth of $10,000 for the period ended April 30, 2020
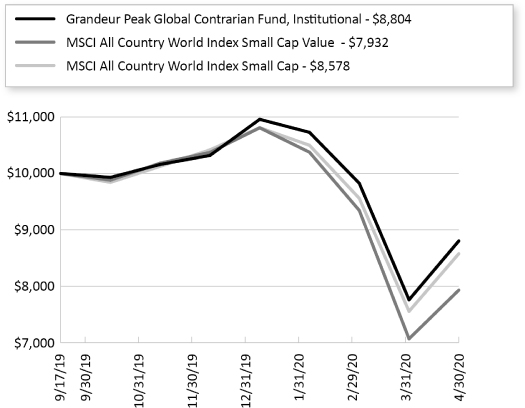
The chart shown above represents a hypothetical investment of $10,000 in the Fund’s Institutional Class shares for the period from inception to April 30, 2020. All returns reflect reinvested dividends, but do not reflect the deduction of taxes that an investor would pay on distributions or redemptions.
Investing in the Fund is subject to investment risks, including possible loss of the principal amount invested.
| Annual Report | April 30, 2020 | 11 |
| Grandeur Peak Global Contrarian Fund | Performance Update |
April 30, 2020 (Unaudited)
| Regional Allocation (as a % of Net Assets)* | |
| Asia ex Japan | 30.5% |
| Europe | 29.6% |
| North America | 15.3% |
| Japan | 14.7% |
| Australia/New Zealand | 6.0% |
| Africa/Middle East | 1.7% |
| Latin America | 1.5% |
| Cash, Cash Equivalents, & Other Net Assets | 0.7% |
| Total | 100.0% |
| Industry Sector Allocation (as a % of Net Assets)* | |
| Consumer | 22.3% |
| Industrials | 21.3% |
| Financials | 20.3% |
| Technology | 17.2% |
| Health Care | 13.8% |
| Energy & Materials | 4.4% |
| Cash, Cash Equivalents, & Other Net Assets | 0.7% |
| Total | 100.0% |
| Top 10 Holdings (as a % of Net Assets)* | |
| BBI Life Sciences Corp. | 3.3% |
| Bioteque Corp. | 2.7% |
| Trancom Co., Ltd. | 2.2% |
| Fiducian Group, Ltd. | 2.1% |
| KNOW IT AB | 2.0% |
| WNS Holdings, Ltd. | 1.8% |
| Vietnam Dairy Products JSC | 1.7% |
| Hackett Group, Inc. | 1.7% |
| Plover Bay Technologies, Ltd. | 1.7% |
| Selamat Sempurna Tbk PT | 1.6% |
| Total | 20.8% |
| * | Holdings are subject to change, and may not reflect the current or future position of the portfolio. |
| 12 | 1.855.377.7325 | www.GrandeurPeakGlobal.com |
| Grandeur Peak Global Micro Cap Fund | Performance Update |
April 30, 2020 (Unaudited)
Annualized Total Return Performance for the periods ended April 30, 2020
| | 6 Months | 1 Year | 3 Years | Since Inception(a) | Expense Ratio(b) |
| Gross | Net(c) |
| Grandeur Peak Global Micro Cap Fund – Institutional (GPMCX) | -4.33% | -1.62% | 2.24% | 5.89% | 2.05% | 2.00% |
| MSCI All Country World Index Small Cap(d) | -15.30% | -14.70% | -0.62% | 3.60% | |
| MSCI World Micro Cap Index(e) | -13.87% | -13.80% | -2.17% | 2.95% | |
Performance data quoted represents past performance. Past performance does not guarantee future results. Investment return and principal value of an investment will fluctuate so that an investor’s shares, when sold or redeemed, may be worth more or less than the original cost. The Fund imposes a 2.00% redemption fee on shares held for less than 60 days. Current performance data may be higher or lower than actual data quoted. For the most current month-end performance data, please call 1-855-377-PEAK (7325).
The table does not reflect the deduction of taxes a shareholder would pay on Fund distributions or redemption of Fund shares.
Subject to investment risks, including possible loss of the principal amount invested.
Returns for periods less than 1 year are cumulative.
| (a) | Fund inception date of October 20, 2015. |
| (b) | Ratios as of the Prospectus dated August 31, 2019 and may differ from the ratios presented in the Financial Highlights. |
| (c) | Grandeur Peak Global Advisors, LLC (the “Adviser”), has agreed to waive and/or reimburse fees or expenses in order to limit Total Annual Fund Operating Expenses After Fee Waiver/ Expense Reimbursement (excluding acquired fund fees and expenses, brokerage expenses, interest expenses, taxes and extraordinary expenses) to 2.00% of the Fund’s average daily net assets for the Fund’s Institutional Class Shares. This agreement is in effect through August 31, 2020. The Adviser will be permitted to recover expenses it has borne through this agreement to the extent that a Fund’s expenses in later periods fall below annual rates set forth in the Expense Agreement; provided, however, that such recapture payments do not cause the Fund’s expense ratio (after recapture) to exceed the lesser of (i) the expense cap in effect at the time of the waiver and (ii) the expense cap in effect at the time of the recapture. Notwithstanding the foregoing, the Fund will not be obligated to pay any such deferred fees and expenses more than three years after the date on which the fee and expenses was deferred . This agreement may not be terminated or modified prior to August 31, 2020 except with the approval of the Fund’s Board of Trustees. |
| (d) | The MSCI ACWI Small Cap Index is designed to measure the equity market performance of performance of small-cap companies across developed and emerging markets globally. MSCI makes no express or implied warranties or representations and shall have no liability whatsoever with respect to any MSCI data contained herein. The MSCI data may not be further redistributed or used to create indices or financial products. The Index is not actively managed and does not reflect any deductions for fees, expenses or taxes. An investor may not invest directly into the Index. |
| (e) | The MSCI World Micro Cap Index is designed to measure the equity market performance of micro-cap companies across developed markets globally. It does not include emerging markets. The Index is not actively managed and does not reflect any deductions for fees, expenses or taxes. An investor may not invest directly into the Index. |
| Annual Report | April 30, 2020 | 13 |
| Grandeur Peak Global Micro Cap Fund | Performance Update |
April 30, 2020 (Unaudited)
Growth of $10,000 for the period ended April 30, 2020
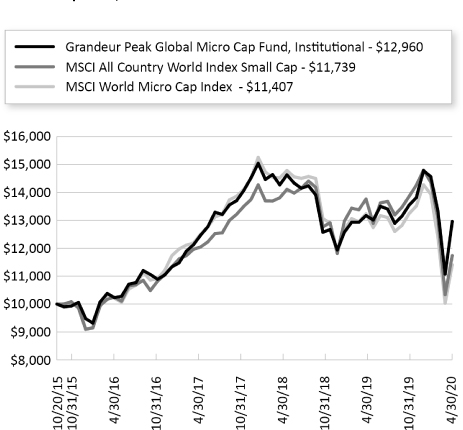
The chart shown above represents a hypothetical investment of $10,000 in the Fund’s Institutional Class shares for the period from inception to April 30, 2020. All returns reflect reinvested dividends, but do not reflect the deduction of taxes that an investor would pay on distributions or redemptions.
Investing in the Fund is subject to investment risks, including possible loss of the principal amount invested.
| 14 | 1.855.377.7325 | www.GrandeurPeakGlobal.com |
| Grandeur Peak Global Micro Cap Fund | Performance Update |
April 30, 2020 (Unaudited)
| Regional Allocation (as a % of Net Assets)* | |
| Europe | 33.5% |
| Asia ex Japan | 27.5% |
| Japan | 15.2% |
| North America | 9.8% |
| Australia/New Zealand | 9.0% |
| Latin America | 0.4% |
| Africa/Middle East | 0.2% |
| Cash, Cash Equivalents, & Other Net Assets | 4.4% |
| Total | 100.0% |
| Industry Sector Allocation (as a % of Net Assets)* | |
| Consumer | 27.6% |
| Health Care | 20.9% |
| Financials | 17.4% |
| Industrials | 13.9% |
| Technology | 13.6% |
| Energy & Materials | 2.2% |
| Cash, Cash Equivalents, & Other Net Assets | 4.4% |
| Total | 100.0% |
| Top 10 Holdings (as a % of Net Assets)* | |
| BBI Life Sciences Corp. | 3.9% |
| Sarantis SA | 3.4% |
| M&A Capital Partners Co., Ltd. | 2.3% |
| Kogan.com, Ltd. | 2.2% |
| Oxford Immunotec Global PLC | 2.1% |
| Joint Corp. | 2.0% |
| Self Storage Group ASA | 2.0% |
| YAKUODO Holdings Co., Ltd. | 1.9% |
| Fiducian Group, Ltd. | 1.9% |
| Vaibhav Global, Ltd. | 1.9% |
| Total | 23.6% |
| * | Holdings are subject to change, and may not reflect the current or future position of the portfolio. |
| Annual Report | April 30, 2020 | 15 |
| Grandeur Peak Global Opportunities Fund | Performance Update |
April 30, 2020 (Unaudited)
Annualized Total Return Performance for the periods ended April 30, 2020
| | 6 Months | 1 Year | 3 Years | 5 Years | Since Inception(a) | Expense Ratio(b) |
| Gross | Net(c) |
Grandeur Peak Global Opportunities Fund – Investor (GPGOX) | -3.67% | -1.73% | 4.53% | 4.90% | 11.22% | 1.62% | 1.58% |
| Grandeur Peak Global Opportunities Fund – Institutional (GPGIX) | -3.61% | -1.42% | 4.70% | 5.11% | 11.51% | 1.37% | 1.33% |
| MSCI All Country World Index Small Cap(d) | -15.30% | -14.70% | -0.62% | 2.16% | 7.63% | |
| MSCI All Country World Index IMI(e) | -8.38% | -5.71% | 4.32% | 4.60% | 8.61% | |
Performance data quoted represents past performance. Past performance does not guarantee future results. Investment return and principal value of an investment will fluctuate so that an investor’s shares, when sold or redeemed, may be worth more or less than the original cost. The Fund imposes a 2.00% redemption fee on shares held for less than 60 days. Current performance data may be higher or lower than actual data quoted. For the most current month-end performance data, please call 1-855-377-PEAK (7325).
The table does not reflect the deduction of taxes a shareholder would pay on Fund distributions or redemption of Fund shares.
Subject to investment risks, including possible loss of the principal amount invested.
Returns for periods less than 1 year are cumulative.
| (a) | Fund inception date of October 17, 2011. |
| (b) | Ratios as of the Prospectus dated August 31, 2019 and may differ from the ratios presented in the Financial Highlights. |
| (c) | Grandeur Peak Global Advisors, LLC (the “Adviser”), has agreed to waive and/or reimburse fees or expenses in order to limit Total Annual Fund Operating Expenses After Fee Waiver/ Expense Reimbursement (excluding acquired fund fees and expenses, brokerage expenses, interest expenses, taxes and extraordinary expenses) to 1.75% and 1.50% of the Fund’s average daily net assets for the Fund’s Investor Class Shares and Institutional Class Shares, respectively. This agreement (the “Expense Agreement”) is in effect through August 31, 2020. The Adviser will be permitted to recover, on a class- by-class basis, expenses it has borne the Expense Agreement to the extent that a Fund’s expenses in later periods fall below annual rates set forth in the Expense Agreement; provided, however, that such recapture payments do not cause the Fund’s expense ratio (after recapture) to exceed the lesser of (i) the expense cap in effect at the time of the waiver and (ii) the expense cap in effect at the time of the recapture . Notwithstanding the foregoing, the Fund will not be obligated to pay any such deferred fees and expenses more than three years after the date on which the fee and expenses was deferred. The Expense Agreement may not be terminated or modified prior to August 31, 2020 except with the approval of the Fund’s Board of Trustees. |
| (d) | The MSCI ACWI Small Cap Index is designed to measure the equity market performance of performance of small-cap companies across developed and emerging markets globally. MSCI makes no express or implied warranties or representations and shall have no liability whatsoever with respect to any MSCI data contained herein. The MSCI data may not be further redistributed or used to create indices or financial products. The Index is not actively managed and does not reflect any deductions for fees, expenses or taxes. An investor may not invest directly into the Index. |
| (e) | The MSCI ACWI IMI Index is designed to measure the equity market performance of large, mid, and small-cap companies across developed and emerging markets globally. The Index is not actively managed and does not reflect any deductions for fees, expenses or taxes. An investor may not invest directly into the Index. |
| 16 | 1.855.377.7325 | www.GrandeurPeakGlobal.com |
| Grandeur Peak Global Opportunities Fund | Performance Update |
April 30, 2020 (Unaudited)
Growth of $10,000 for the period ended April 30, 2020
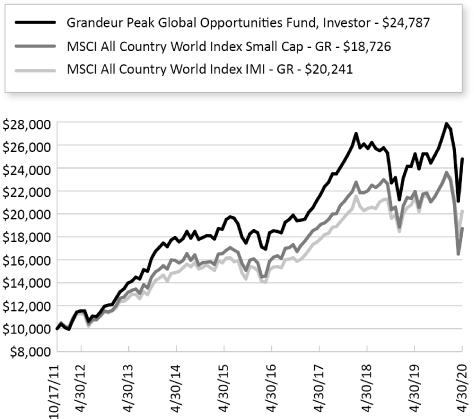
The chart shown above represents a hypothetical investment of $10,000 in the Fund’s Investor Class shares for the period from inception to April 30, 2020. All returns reflect reinvested dividends, but do not reflect the deduction of taxes that an investor would pay on distributions or redemptions.
Investing in the Fund is subject to investment risks, including possible loss of the principal amount invested.
The Fund also offers Institutional Class shares, performance for which is not reflected in the graphs above. The performance of Institutional Class shares may be higher or lower than the performance of the Investor Class shares shown in the graphs above based upon differences in fees paid by shareholders investing in the Investor Class shares and Institutional Class shares.
| Annual Report | April 30, 2020 | 17 |
| Grandeur Peak Global Opportunities Fund | Performance Update |
April 30, 2020 (Unaudited)
| Regional Allocation (as a % of Net Assets)* |
| Europe | 33.8% |
| North America | 30.0% |
| Asia ex Japan | 19.6% |
| Japan | 10.0% |
| Latin America | 2.3% |
| Australia/New Zealand | 1.6% |
| Africa/Middle East | 1.0% |
| Cash, Cash Equivalents, & Other Net Assets | 1.7% |
| Total | 100.0% |
| Industry Sector Allocation (as a % of Net Assets)* |
| Technology | 32.8% |
| Consumer | 19.6% |
| Health Care | 18.1% |
| Financials | 14.4% |
| Industrials | 13.1% |
| Energy & Materials | 0.3% |
| Cash, Cash Equivalents, & Other Net Assets | 1.7% |
| Total | 100.0% |
| Top 10 Holdings (as a % of Net Assets)* | |
| Silergy Corp. | 3.2% |
| Power Integrations, Inc. | 2.7% |
| EPAM Systems, Inc. | 2.4% |
| Dechra Pharmaceuticals PLC | 2.3% |
| WNS Holdings, Ltd. | 1.7% |
| Qualys, Inc. | 1.5% |
| Endava PLC | 1.5% |
| CVS Group PLC | 1.4% |
| Oxford Immunotec Global PLC | 1.4% |
| B&M European Value Retail SA | 1.3% |
| Total | 19.4% |
| * | Holdings are subject to change, and may not reflect the current or future position of the portfolio. |
| 18 | 1.855.377.7325 | www.GrandeurPeakGlobal.com |
| Grandeur Peak Global Reach Fund | Performance Update |
April 30, 2020 (Unaudited)
Annualized Total Return Performance for the periods ended April 30, 2020
| | 6 Months | 1 Year | 3 Years | 5 Years | Since Inception(a) | Expense Ratio(b) |
| Gross | Net(c) |
| Grandeur Peak Global Reach Fund – Investor (GPROX) | -5.21% | -3.31% | 4.06% | 4.48% | 8.34% | 1.52% | 1.52% |
| Grandeur Peak Global Reach Fund – Institutional (GPRIX) | -5.11% | -3.09% | 4.31% | 4.73% | 8.60% | 1.27% | 1.27% |
| MSCI All Country World Small Cap Index(d) | -15.30% | -14.70% | -0.62% | 2.16% | 5.03% | |
| MSCI All Country World IMI Index(e) | -8.38% | -5.71% | 4.32% | 4.60% | 6.75% | |
Performance data quoted represents past performance. Past performance does not guarantee future results. Investment return and principal value of an investment will fluctuate so that an investor’s shares, when sold or redeemed, may be worth more or less than the original cost. The Fund imposes a 2.00% redemption fee on shares held for less than 60 days. Current performance data may be higher or lower than actual data quoted. For the most current month-end performance data, please call 1-855-377-PEAK (7325).
The table does not reflect the deduction of taxes a shareholder would pay on Fund distributions or redemption of Fund shares.
Subject to investment risks, including possible loss of the principal amount invested.
Returns for periods less than 1 year are cumulative.
| (a) | Fund inception date of June 19, 2013. |
| (b) | Ratios as of the Prospectus dated August 31, 2019 and may differ from the ratios presented in the Financial Highlights. |
| (c) | Grandeur Peak Global Advisors, LLC (the “Adviser”), has agreed to waive and/or reimburse fees or expenses in order to limit Total Annual Fund Operating Expenses After Fee Waiver/Expense Reimbursement (excluding acquired fund fees and expenses, brokerage expenses, interest expenses, taxes and extraordinary expenses) to 1.60% and 1.35% of the Fund’s average daily net assets for the Fund’s Investor Class Shares and Institutional Class Shares, respectively. This agreement (the “Expense Agreement”) is in effect through August 31, 2020. The Adviser will be permitted to recover, on a class- by-class basis, expenses it has borne through the Expense Agreement to the extent that a Fund’s expenses in later periods fall below annual rates set forth in the Expense Agreement; provided, however, that such recapture payments do not cause the Fund’s expense ratio (after recapture) to exceed the lesser of (i) the expense cap in effect at the time of the waiver and (ii) the expense cap in effect at the time of the recapture . Notwithstanding the foregoing, the Fund will not be obligated to pay any such deferred fees and expenses more than three years after the date on which the fee and expenses was deferred. The Expense Agreement may not be terminated or modified prior to August 31, 2020 except with the approval of the Fund’s Board of Trustees. |
| (d) | The MSCI ACWI Small Cap Index is designed to measure the equity market performance of performance of small-cap companies across developed and emerging markets globally. MSCI makes no express or implied warranties or representations and shall have no liability whatsoever with respect to any MSCI data contained herein. The MSCI data may not be further redistributed or used to create indices or financial products. The Index is not actively managed and does not reflect any deductions for fees, expenses or taxes. An investor may not invest directly into the Index. |
| (e) | The MSCI ACWI IMI Index is designed to measure the equity market performance of large, mid, and small-cap companies across developed and emerging markets globally. The Index is not actively managed and does not reflect any deductions for fees, expenses or taxes. An investor may not invest directly into the Index. |
| Annual Report | April 30, 2020 | 19 |
| Grandeur Peak Global Reach Fund | Performance Update |
April 30, 2020 (Unaudited)
Growth of $10,000 for the period ended April 30, 2020
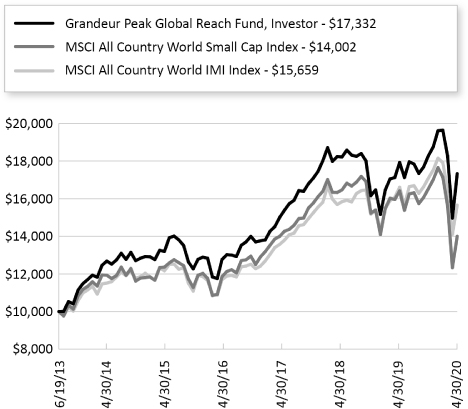
The chart shown above represents a hypothetical investment of $10,000 in the Fund’s Investor Class shares for the period from inception to April 30, 2020. All returns reflect reinvested dividends, but do not reflect the deduction of taxes that an investor would pay on distributions or redemptions.
Investing in the Fund is subject to investment risks, including possible loss of the principal amount invested.
The Fund also offers Institutional Class shares, performance for which is not reflected in the graphs above. The performance of Institutional Class shares may be higher or lower than the performance of the Investor Class shares shown in the graphs above based upon differences in fees paid by shareholders investing in the Investor Class shares and Institutional Class shares.
| 20 | 1.855.377.7325 | www.GrandeurPeakGlobal.com |
| Grandeur Peak Global Reach Fund | Performance Update |
April 30, 2020 (Unaudited)
| Regional Allocation (as a % of Net Assets)* | |
| Europe | 29.7% |
| North America | 28.8% |
| Asia ex Japan | 21.1% |
| Japan | 6.7% |
| Australia/New Zealand | 4.2% |
| Latin America | 3.3% |
| Africa/Middle East | 2.4% |
| Cash, Cash Equivalents, & Other Net Assets | 3.8% |
| Total | 100.0% |
| Industry Sector Allocation (as a % of Net Assets)* | |
| Technology | 25.3% |
| Financials | 19.9% |
| Consumer | 19.0% |
| Industrials | 16.6% |
| Health Care | 12.6% |
| Energy & Materials | 2.8% |
| Cash, Cash Equivalents, & Other Net Assets | 3.8% |
| Total | 100.0% |
| Top 10 Holdings (as a % of Net Assets)* | |
| Silergy Corp. | 1.6% |
| EPAM Systems, Inc. | 1.5% |
| BBI Life Sciences Corp. | 1.4% |
| WNS Holdings, Ltd. | 1.2% |
| First Republic Bank | 1.2% |
| Apollo Global Management, Inc. | 1.0% |
| Esker SA | 1.0% |
| Parex Resources, Inc. | 1.0% |
| Endava PLC | 1.0% |
| Qualys, Inc. | 1.0% |
| Total | 11.9% |
| * | Holdings are subject to change, and may not reflect the current or future position of the portfolio. |
| Annual Report | April 30, 2020 | 21 |
| Grandeur Peak Global Stalwarts Fund | Performance Update |
April 30, 2020 (Unaudited)
Annualized Total Return Performance for the periods ended April 30, 2020
| | 6 Months | 1 Year | 3 Years | Since Inception(a) | Expense Ratio(b) |
| Gross | Net(c) |
| Grandeur Peak Global Stalwarts Fund – Investor (GGSOX) | -2.42% | -2.22%* | 6.03% | 9.45% | 1.27% | 1.27% |
| Grandeur Peak Global Stalwarts Fund – Institutional (GGSYX) | -2.25% | -1.98%* | 6.30% | 9.73% | 1.02% | 1.02% |
| MSCI All Country World Mid Cap Index(d) | -13.17% | -10.73% | 1.27% | 5.03% | |
| MSCI All Country World Small Cap Index(e) | -15.30% | -14.70% | -0.62% | 4.39% | |
Performance data quoted represents past performance. Past performance does not guarantee future results. Investment return and principal value of an investment will fluctuate so that an investor’s shares, when sold or redeemed, may be worth more or less than the original cost. The Fund imposes a 2.00% redemption fee on shares held for less than 60 days. Current performance data may be higher or lower than actual data quoted. For the most current month-end performance data, please call 1-855-377-PEAK (7325).
The table does not reflect the deduction of taxes a shareholder would pay on Fund distributions or redemption of Fund shares.
Subject to investment risks, including possible loss of the principal amount invested.
Returns for periods less than 1 year are cumulative.
| * | Excludes adjustments in accordance with accounting principles generally accepted in the United States of America and as such, the net asset value and total return for shareholder transactions reported to the market may differ from the net asset value for financial reporting purposes. |
| (a) | Fund inception date of September 1, 2015. |
| (b) | Ratios as of the Prospectus dated August 31, 2019 and may differ from the ratios presented in the Financial Highlights. |
| (c) | Grandeur Peak Global Advisors, LLC (the “Adviser”), has agreed to waive and/or reimburse fees or expenses in order to limit Total Annual Fund Operating Expenses After Fee Waiver/ Expense Reimbursement (excluding acquired fund fees and expenses, brokerage expenses, interest expenses, taxes and extraordinary expenses) to 1.35% and 1.10% of the Fund’s average daily net assets for the Fund’s Investor Class Shares and Institutional Class Shares, respectively. This agreement is in effect through August 31, 2020. The Adviser will be permitted to recover, on a class-by-class basis, expenses it has borne through this agreement to the extent that a Fund’s expenses in later periods fall below annual rates set forth in the Expense Agreement; provided, however, that such recapture payments do not cause the Fund’s expense ratio (after recapture) to exceed the lesser of (i) the expense cap in effect at the time of the waiver and (ii) the expense cap in effect at the time of the recapture . Notwithstanding the foregoing, the Fund will not be obligated to pay any such deferred fees and expenses more than three years after the date on which the fee and expenses was deferred. This agreement may not be terminated or modified prior to August 31, 2020 except with the approval of the Fund’s Board of Trustees. |
| (d) | The MSCI ACWI Mid Cap Index is designed to measure the equity market performance of performance of mid-cap companies across developed and emerging markets globally. MSCI makes no express or implied warranties or representations and shall have no liability whatsoever with respect to any MSCI data contained herein. The MSCI data may not be further redistributed or used to create indices or financial products. The Index is not actively managed and does not reflect any deductions for fees, expenses or taxes. An investor may not invest directly into the Index. |
| (e) | The MSCI ACWI Small Cap Index is designed to measure the equity market performance of small-cap companies across developed and emerging markets globally. The Index is not actively managed and does not reflect any deductions for fees, expenses or taxes. An investor may not invest directly into the Index. |
| 22 | 1.855.377.7325 | www.GrandeurPeakGlobal.com |
| Grandeur Peak Global Stalwarts Fund | Performance Update |
April 30, 2020 (Unaudited)
Growth of $10,000 for the period ended April 30, 2020

The chart shown above represents a hypothetical investment of $10,000 in the Fund’s Investor Class shares for the period from inception to April 30, 2020. All returns reflect reinvested dividends, but do not reflect the deduction of taxes that an investor would pay on distributions or redemptions.
Investing in the Fund is subject to investment risks, including possible loss of the principal amount invested.
The Fund also offers Institutional Class shares, performance for which is not reflected in the graphs above. The performance of Institutional Class shares may be higher or lower than the performance of the Investor Class shares shown in the graphs above based upon differences in fees paid by shareholders investing in the Investor Class shares and Institutional Class shares.
| Annual Report | April 30, 2020 | 23 |
| Grandeur Peak Global Stalwarts Fund | Performance Update |
April 30, 2020 (Unaudited)
| Regional Allocation (as a % of Net Assets)* | |
| North America | 43.8% |
| Europe | 27.4% |
| Asia ex Japan | 16.1% |
| Japan | 5.9% |
| Latin America | 2.2% |
| Australia/New Zealand | 1.9% |
| Africa/Middle East | 1.2% |
| Cash, Cash Equivalents, & Other Net Assets | 1.5% |
| Total | 100.0% |
| Industry Sector Allocation (as a % of Net Assets)* | |
| Technology | 34.0% |
| Financials | 22.3% |
| Consumer | 18.7% |
| Industrials | 12.0% |
| Health Care | 11.5% |
| Cash, Cash Equivalents, & Other Net Assets | 1.5% |
| Total | 100.0% |
Top 10 Holdings (as a % of Net Assets)*
| Silergy Corp. | 3.4% |
| First Republic Bank | 3.2% |
| EPAM Systems, Inc. | 2.7% |
| Power Integrations, Inc. | 2.5% |
| WNS Holdings, Ltd. | 2.4% |
| Paycom Software, Inc. | 2.1% |
| Dechra Pharmaceuticals PLC | 2.1% |
| Pluralsight, Inc. | 2.0% |
| St. James's Place PLC | 2.0% |
| Fastenal Co. | 1.9% |
| Total | 24.3% |
| * | Holdings are subject to change, and may not reflect the current or future position of the portfolio. |
| 24 | 1.855.377.7325 | www.GrandeurPeakGlobal.com |
| Grandeur Peak International Opportunities Fund | Performance Update |
April 30, 2020 (Unaudited)
Annualized Total Return Performance for the periods ended April 30, 2020
| | 6 Months | 1 Year | 3 Years | 5 Years | Since Inception(a) | Expense Ratio(b) |
| Gross | Net(c) |
| Grandeur Peak International Opportunities Fund – Investor (GPIOX) | -6.35% | -5.79% | 1.34% | 2.93% | 9.69% | 1.62% | 1.57% |
| Grandeur Peak International Opportunities Fund – Institutional (GPIIX) | -6.16% | -5.60% | 1.51% | 3.16% | 9.92% | 1.37% | 1.32% |
| MSCI All Country World Index ex USA Small Cap Index(d) | -14.90% | -13.15% | -1.77% | 0.70% | 4.84% | |
| MSCI All Country World IMI ex USA Index(e) | -13.27% | -11.34% | -0.03% | 0.36% | 4.25% | |
Performance data quoted represents past performance. Past performance does not guarantee future results. Investment return and principal value of an investment will fluctuate so that an investor’s shares, when sold or redeemed, may be worth more or less than the original cost. The Fund imposes a 2.00% redemption fee on shares held for less than 60 days. Current performance data may be higher or lower than actual data quoted. For the most current month-end performance data, please call 1-855-377-PEAK (7325).
The table does not reflect the deduction of taxes a shareholder would pay on Fund distributions or redemption of Fund shares.
Subject to investment risks, including possible loss of the principal amount invested.
Returns for periods less than 1 year are cumulative.
| (a) | Fund inception date of October 17, 2011. |
| (b) | Ratios as of the Prospectus dated August 31, 2019 and may differ from the ratios presented in the Financial Highlights. |
| (c) | Grandeur Peak Global Advisors, LLC (the “Adviser”), has agreed to waive and/or reimburse fees or expenses in order to limit Total Annual Fund Operating Expenses After Fee Waiver/Expense Reimbursements (excluding acquired fund fees and expenses, brokerage expenses, interest expenses, taxes and extraordinary expenses) to 1.75% and 1.50% of the Fund’s average daily net assets for the Fund’s Investor Class Shares and Institutional Class Shares, respectively. This agreement (the “Expense Agreement”) is in effect through August 31, 2020. The Adviser will be permitted to recover, on a class- by-class basis, expenses it has borne through the Expense Agreement to the extent that a Fund’s expenses in later periods fall below annual rates set forth in the Expense Agreement; provided, however, that such recapture payments do not cause the Fund’s expense ratio (after recapture) to exceed the lesser of (i) the expense cap in effect at the time of the waiver and (ii) the expense cap in effect at the time of the recapture . Notwithstanding the foregoing, the Funds will not be obligated to pay any such deferred fees and expenses more than three years after the date on which the fee and expenses was deferred. The Expense Agreement may not be terminated or modified prior to August 31, 2020 except with the approval of the Fund’s Board of Trustees. |
| (d) | The MSCI ACWI ex USA Small Cap Index is designed to measure the equity market performance of small-cap companies across developed and emerging markets globally, excluding the United States. MSCI makes no express or implied warranties or representations and shall have no liability whatsoever with respect to any MSCI data contained herein. The MSCI data may not be further redistributed or used to create indices or financial products. The Index is not actively managed and does not reflect any deductions for fees, expenses or taxes. An investor may not invest directly into the Index. |
| (e) | The MSCI ACWI ex USA IMI Index is designed to measure the equity market performance of large, mid, and small-cap companies across developed and emerging markets globally, excluding the United States. The Index is not actively managed and does not reflect any deductions for fees, expenses or taxes. An investor may not invest directly into the Index. |
| Annual Report | April 30, 2020 | 25 |
| Grandeur Peak International Opportunities Fund | Performance Update |
April 30, 2020 (Unaudited)
Growth of $10,000 for the period ended April 30, 2020
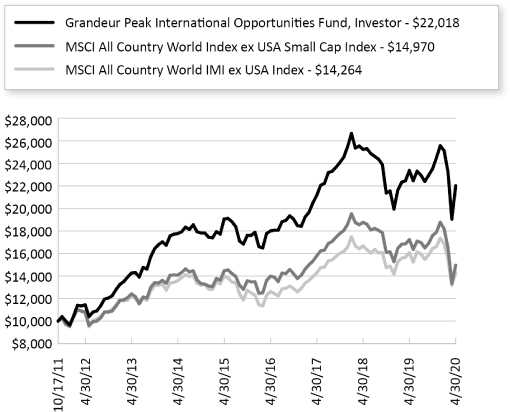
The chart shown above represents a hypothetical investment of $10,000 in the Fund’s Investor Class shares for the period from inception to April 30, 2020. All returns reflect reinvested dividends, but do not reflect the deduction of taxes that an investor would pay on distributions or redemptions.
Investing in the Fund is subject to investment risks, including possible loss of the principal amount invested.
The Fund also offers Institutional Class shares, performance for which is not reflected in the graphs above. The performance of Institutional Class shares may be higher or lower than the performance of the Investor Class shares shown in the graphs above based upon differences in fees paid by shareholders investing in the Investor Class shares and Institutional Class shares.
| 26 | 1.855.377.7325 | www.GrandeurPeakGlobal.com |
| Grandeur Peak International Opportunities Fund | Performance Update |
April 30, 2020 (Unaudited)
| Regional Allocation (as a % of Net Assets)* | |
| Europe | 38.4% |
| Asia ex Japan | 28.1% |
| Japan | 16.5% |
| North America | 6.8% |
| Australia/New Zealand | 3.7% |
| Latin America | 3.7% |
| Africa/Middle East | 2.0% |
| Cash, Cash Equivalents, & Other Net Assets | 0.8% |
| Total | 100.0% |
| Industry Sector Allocation (as a % of Net Assets)* | |
| Technology | 27.8% |
| Industrials | 18.2% |
| Consumer | 17.8% |
| Financials | 17.2% |
| Health Care | 16.3% |
| Energy & Materials | 1.9% |
| Cash, Cash Equivalents, & Other Net Assets | 0.8% |
| Total | 100.0% |
Top 10 Holdings (as a % of Net Assets)*
| Silergy Corp. | 3.2% |
| EPAM Systems, Inc. | 2.5% |
| Dechra Pharmaceuticals PLC | 2.3% |
| WNS Holdings, Ltd. | 1.9% |
| boohoo Group PLC | 1.7% |
| B&M European Value Retail SA | 1.6% |
| CVS Group PLC | 1.6% |
| Aalberts NV | 1.5% |
| Irish Residential Properties REIT PLC | 1.4% |
| BBI Life Sciences Corp. | 1.4% |
| Total | 19.1% |
| * | Holdings are subject to change, and may not reflect the current or future position of the portfolio. |
| Annual Report | April 30, 2020 | 27 |
| Grandeur Peak International Stalwarts Fund | Performance Update |
April 30, 2020 (Unaudited)
Annualized Total Return Performance for the periods ended April 30, 2020
| | 6 Months | 1 Year | 3 Years | Since Inception(a) | Expense Ratio(b) |
| Gross | Net(c) |
| Grandeur Peak International Stalwarts Fund – Investor (GISOX) | -2.50% | -1.77%* | 4.82% | 9.18% | 1.19% | 1.19% |
| Grandeur Peak International Stalwarts Fund – Institutional (GISYX) | -2.35% | -1.49%* | 5.07% | 9.44% | 0.94% | 0.94% |
| MSCI All Country World ex USA Mid Cap Index(d) | -15.20% | -12.65% | -1.06% | 3.02% | |
| MSCI All Country World ex USA Small Index(e) | -14.90% | -13.15% | -1.77% | 3.17% | |
Performance data quoted represents past performance. Past performance does not guarantee future results. Investment return and principal value of an investment will fluctuate so that an investor’s shares, when sold or redeemed, may be worth more or less than the original cost. The Fund imposes a 2.00% redemption fee on shares held for less than 60 days. Current performance data may be higher or lower than actual data quoted. For the most current month-end performance data, please call 1-855-377-PEAK (7325).
The table does not reflect the deduction of taxes a shareholder would pay on Fund distributions or redemption of Fund shares.
Subject to investment risks, including possible loss of the principal amount invested.
Returns for periods less than 1 year are cumulative.
| * | Excludes adjustments in accordance with accounting principles generally accepted in the United States of America and as such, the net asset value and total return for shareholder transactions reported to the market may differ from the net asset value for financial reporting purposes. |
| (a) | Fund inception date of September 1, 2015. |
| (b) | Ratios as of the Prospectus dated August 31, 2019 and may differ from the ratios presented in the Financial Highlights. |
| (c) | Grandeur Peak Global Advisors, LLC (the “Adviser”), has agreed to waive and/or reimburse fees or expenses in order to limit Total Annual Fund Operating Expenses After Fee Waiver/ Expense Reimbursements (excluding acquired fund fees and expenses, brokerage expenses, interest expenses, taxes and extraordinary expenses) to 1.35% and 1.10% of the Fund’s average daily net assets for the Fund’s Investor Class Shares and Institutional Class Shares, respectively. This agreement is in effect through August 31, 2020. The Adviser will be permitted to recover, on a class-by-class basis, expenses it has borne through this agreement to the extent that a Fund’s expenses in later periods fall below annual rates set forth in the Expense Agreement; provided, however, that such recapture payments do not cause the Fund’s expense ratio (after recapture) to exceed the lesser of (i) the expense cap in effect at the time of the waiver and (ii) the expense cap in effect at the time of the recapture . Notwithstanding the foregoing, the Funds will not be obligated to pay any such deferred fees and expenses more than three years after the date on which the fee and expenses was deferred This agreement may not be terminated or modified prior to August 31, 2020 except with the approval of the Fund’s Board of Trustees. |
| (d) | The MSCI ACWI ex USA Mid Cap Index is designed to measure the equity market performance of midcap companies across developed and emerging markets globally, excluding the United States. MSCI makes no express or implied warranties or representations and shall have no liability whatsoever with respect to any MSCI data contained herein. The MSCI data may not be further redistributed or used to create indices or financial products. The Index is not actively managed and does not reflect any deductions for fees, expenses or taxes. An investor may not invest directly into the Index. |
| (e) | The MSCI ACWI ex USA Small Cap Index is designed to measure the equity market performance of small-cap companies across developed and emerging markets globally, excluding the United States. The Index is not actively managed and does not reflect any deductions for fees, expenses or taxes. An investor may not invest directly into the Index. |
| 28 | 1.855.377.7325 | www.GrandeurPeakGlobal.com |
| Grandeur Peak International Stalwarts Fund | Performance Update |
April 30, 2020 (Unaudited)
Growth of $10,000 for the period ended April 30, 2020
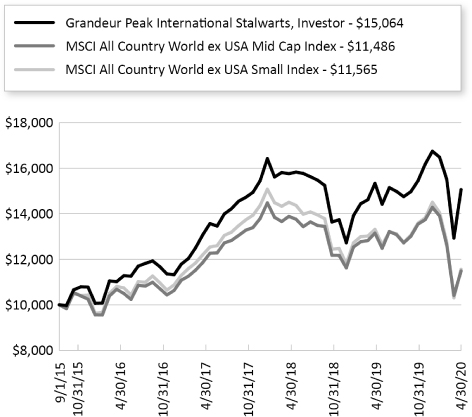
The chart shown above represents a hypothetical investment of $10,000 in the Fund’s Investor Class shares for the period from inception to April 30, 2020. All returns reflect reinvested dividends, but do not reflect the deduction of taxes that an investor would pay on distributions or redemptions.
Investing in the Fund is subject to investment risks, including possible loss of the principal amount invested.
The Fund also offers Institutional Class shares, performance for which is not reflected in the graphs above. The performance of Institutional Class shares may be higher or lower than the performance of the Investor Class shares shown in the graphs above based upon differences in fees paid by shareholders investing in the Investor Class shares and Institutional Class shares.
| Annual Report | April 30, 2020 | 29 |
| Grandeur Peak International Stalwarts Fund | Performance Update |
April 30, 2020 (Unaudited)
Regional Allocation (as a % of Net Assets)*
| Europe | 44.0% |
| Asia ex Japan | 22.8% |
| North America | 12.1% |
| Japan | 10.0% |
| Latin America | 3.2% |
| Australia/New Zealand | 2.9% |
| Africa/Middle East | 1.6% |
| Cash, Cash Equivalents, & Other Net Assets | 3.4% |
| Total | 100.0% |
| Industry Sector Allocation (as a % of Net Assets)* | |
| Technology | 27.0% |
| Consumer | 21.9% |
| Financials | 20.0% |
| Industrials | 15.4% |
| Health Care | 12.3% |
| Cash, Cash Equivalents, & Other Net Assets | 3.4% |
| Total | 100.0% |
Top 10 Holdings (as a % of Net Assets)*
| Silergy Corp. | 4.6% |
| EPAM Systems, Inc. | 3.3% |
| Dechra Pharmaceuticals PLC | 2.9% |
| WNS Holdings, Ltd. | 2.8% |
| Nihon M&A Center, Inc. | 2.8% |
| B&M European Value Retail SA | 2.6% |
| St. James's Place PLC | 2.6% |
| Lululemon Athletica, Inc. | 2.6% |
| Sanne Group PLC | 2.1% |
| MonotaRO Co., Ltd. | 1.9% |
| Total | 28.2% |
| * | Holdings are subject to change, and may not reflect the current or future position of the portfolio. |
| 30 | 1.855.377.7325 | www.GrandeurPeakGlobal.com |
| Grandeur Peak US Stalwarts Fund | Performance Update |
April 30, 2020 (Unaudited)
Annualized Total Return Performance for the periods ended April 30, 2020
| | 1 Month | Since Inception(a) | Expense Ratio(b) |
| Gross | Net(c) |
| Grandeur Peak US Stalwarts Fund – Institutional (GUSYX) | 18.58% | 31.50% | 1.31% | 1.00% |
| MSCI USA Mid Cap Index(d) | 14.43% | 24.66% | |
| MSCI USA Small Cap Index(e) | 14.88% | 25.89% | |
Performance data quoted represents past performance. Past performance does not guarantee future results. Investment return and principal value of an investment will fluctuate so that an investor’s shares, when sold or redeemed, may be worth more or less than the original cost. The Fund imposes a 2.00% redemption fee on shares held for less than 60 days. Current performance data may be higher or lower than actual data quoted. For the most current month-end performance data, please call 1-855-377-PEAK (7325).
The table does not reflect the deduction of taxes a shareholder would pay on Fund distributions or redemption of Fund shares.
Subject to investment risks, including possible loss of the principal amount invested.
Returns for periods less than 1 year are cumulative.
| (a) | Fund inception date of March 19, 2020. |
| (b) | Ratios as of the Prospectus dated December 23, 2019 and may differ from the ratios presented in the Financial Highlights. |
| (c) | Grandeur Peak Global Advisors, LLC (the “Adviser”), has agreed to waive and/or reimburse fees or expenses in order to limit Total Annual Fund Operating Expenses After Fee Waiver/Expense Reimbursement (excluding acquired fund fees and expenses, brokerage expenses, interest expenses, taxes and extraordinary expenses) to 1.00% of the Fund’s average daily net assets for the Fund’s Institutional Class Shares. This agreement (the “Expense Agreement”) is in effect through August 31, 2021. The Adviser will be permitted to recover, on a class- by-class basis, expenses it has borne through the Expense Agreement to the extent that a Fund’s expenses in later periods fall below annual rates set forth in the Expense Agreement; provided, however, that such recapture payments do not cause the Fund’s expense ratio (after recapture) to exceed the lesser of (i) the expense cap in effect at the time of the waiver and (ii) the expense cap in effect at the time of the recapture. Notwithstanding the foregoing, the Fund will not be obligated to pay any such deferred fees and expenses more than three years after the date on which the fee and expenses was deferred. The Expense Agreement may not be terminated or modified prior to August 31, 2021 except with the approval of the Fund’s Board of Trustees. |
| (d) | The MSCI USA Mid Cap Index is designed to measure the performance of the mid cap segments of the US market. With 339 constituents, the index covers approximately 15% of the free float-adjusted market capitalization in the US. The Index is not actively managed and does not reflect any deductions for fees, expenses or taxes. An investor may not invest directly into the Index. |
| (e) | The MSCI USA Small Cap Index is designed to measure the performance of the small cap segment of the US equity market. With 1,740 constituents, the index represents approximately 14% of the free float-adjusted market capitalization in the US. The Index is not actively managed and does not reflect any deductions for fees, expenses or taxes. An investor may not invest directly into the Index. |
| Annual Report | April 30, 2020 | 31 |
| Grandeur Peak US Stalwarts Fund | Performance Update |
April 30, 2020 (Unaudited)
Growth of $10,000 for the period ended April 30, 2020

The chart shown above represent a hypothetical investment of $10,000 in the Fund’s Institutional Class shares for the period from inception to April 30, 2020. All returns reflect reinvested dividends, but do not reflect the deduction of taxes that an investor would pay on distributions or redemptions.
Investing in the Fund is subject to investment risks, including possible loss of the principal amount invested.
| 32 | 1.855.377.7325 | www.GrandeurPeakGlobal.com |
| Grandeur Peak US Stalwarts Fund | Performance Update |
April 30, 2020 (Unaudited)
| Regional Allocation (as a % of Net Assets)* |
| North America | 83.8% |
| Europe | 5.8% |
| Asia ex Japan | 4.1% |
| Latin America | 2.3% |
| Africa/Middle East | 1.0% |
| Cash, Cash Equivalents, & Other Net Assets | 3.0% |
| Total | 100.0% |
| Industry Sector Allocation (as a % of Net Assets)* |
| Technology | 38.3% |
| Financials | 20.8% |
| Health Care | 15.0% |
| Consumer | 11.7% |
| Industrials | 11.2% |
| Cash, Cash Equivalents, & Other Net Assets | 3.0% |
| Total | 100.0% |
| Top 10 Holdings (as a % of Net Assets)* | |
| EPAM Systems, Inc. | 3.9% |
| Paycom Software, Inc. | 3.8% |
| First Republic Bank | 3.2% |
| Qualys, Inc. | 2.8% |
| IDEXX Laboratories, Inc. | 2.6% |
| Power Integrations, Inc. | 2.5% |
| Apollo Global Management, Inc. | 2.5% |
| Lululemon Athletica, Inc. | 2.5% |
| Fastenal Co. | 2.5% |
| WNS Holdings, Ltd. | 2.4% |
| Total | 28.7% |
| * | Holdings are subject to change, and may not reflect the current or future position of the portfolio. |
| Annual Report | April 30, 2020 | 33 |
| Grandeur Peak Funds® | Disclosure of Fund Expenses |
April 30, 2020 (Unaudited)
As a shareholder of a Fund, you incur two types of costs: (1) transaction costs, including sales charges (loads) on purchase payments, reinvested dividends, or other distributions; redemption fees; and exchange fees; and (2) ongoing costs, including management fees; distribution and/or service (12b-1) fees; and other Fund expenses. This example is intended to help you understand your ongoing costs (in dollars) of investing in the Fund and to compare these costs with the ongoing costs of investing in other mutual funds.
This example is based on an investment of $1,000 invested at the beginning of the period and held for the entire six-month period of November 1, 2019 through April 30, 2020.
Actual Expenses The first line of the table provides information about actual account values and actual expenses. You may use the information in this line, together with the amount you invested, to estimate the expenses that you paid over the period. Simply divide your account value by $1,000 (for example, an $8,600 account value divided by $1,000 = 8.6), then multiply the result by the number in the first line under the heading “Expenses Paid During Period” to estimate the expenses you paid on your account during this period.
Hypothetical Example for Comparison Purposes The second line of the table provides information about hypothetical account values and hypothetical expenses based on the Fund's actual expense ratio and an assumed rate of return of 5% per year before expenses, which is not the Fund's actual return. The hypothetical account values and expenses may not be used to estimate the actual ending account balance or expenses you paid for the period. You may use this information to compare the ongoing costs of investing in the Fund and other mutual funds. To do so, compare this 5% hypothetical example with the 5% hypothetical examples that appear in the shareholder reports of the other funds.
Please note that the expenses shown in the table are meant to highlight your ongoing costs only and do not reflect any transactional costs, such as redemption fees or exchange fees. Therefore, the second line of the table is useful in comparing ongoing costs only and will not help you determine the relative total costs of owning different funds. In addition, if these transactional costs were included, your costs would have been higher.
| 34 | 1.855.377.7325 | www.GrandeurPeakGlobal.com |
| Grandeur Peak Funds® | Disclosure of Fund Expenses |
April 30, 2020 (Unaudited)
| | | Beginning Account Value November 1, 2019 | | | Ending Account Value April 30, 2020 | | | Expense Ratio(a) | | | Expenses Paid During period November 1, 2019 - April 30, 2020(b) | |
| Grandeur Peak Emerging Markets Opportunities Fund | | | | | | | | | | | | |
| Investor Class | | | | | | | | | | | | |
| Actual | | $ | 1,000.00 | | | $ | 903.50 | | | | 1.74 | % | | $ | 8.23 | |
| Hypothetical (5% return before expenses) | | $ | 1,000.00 | | | $ | 1,016.21 | | | | 1.74 | % | | $ | 8.72 | |
| Institutional Class | | | | | | | | | | | | | | | | |
| Actual | | $ | 1,000.00 | | | $ | 904.70 | | | | 1.51 | % | | $ | 7.15 | |
| Hypothetical (5% return before expenses) | | $ | 1,000.00 | | | $ | 1,017.35 | | | | 1.51 | % | | $ | 7.57 | |
| Grandeur Peak Global Contrarian Fund | | | | | | | | | | | | | | | | |
| Institutional Class | | | | | | | | | | | | | | | | |
| Actual | | $ | 1,000.00 | | | $ | 866.50 | | | | 1.35 | % | | $ | 6.27 | |
| Hypothetical (5% return before expenses) | | $ | 1,000.00 | | | $ | 1,018.15 | | | | 1.35 | % | | $ | 6.77 | |
| Grandeur Peak Global Micro Cap Fund | | | | | | | | | | | | | | | | |
| Institutional Class | | | | | | | | | | | | | | | | |
| Actual | | $ | 1,000.00 | | | $ | 956.70 | | | | 2.00 | % | | $ | 9.73 | |
| Hypothetical (5% return before expenses) | | $ | 1,000.00 | | | $ | 1,014.92 | | | | 2.00 | % | | $ | 10.02 | |
| Grandeur Peak Global Opportunities Fund | | | | | | | | | | | | | | | | |
| Investor Class | | | | | | | | | | | | | | | | |
| Actual | | $ | 1,000.00 | | | $ | 963.30 | | | | 1.57 | % | | $ | 7.66 | |
| Hypothetical (5% return before expenses) | | $ | 1,000.00 | | | $ | 1,017.06 | | | | 1.57 | % | | $ | 7.87 | |
| Institutional Class | | | | | | | | | | | | | | | | |
| Actual | | $ | 1,000.00 | | | $ | 963.90 | | | | 1.33 | % | | $ | 6.49 | |
| Hypothetical (5% return before expenses) | | $ | 1,000.00 | | | $ | 1,018.25 | | | | 1.33 | % | | $ | 6.67 | |
| Grandeur Peak Global Reach Fund | | | | | | | | | | | | | | | | |
| Investor Class | | | | | | | | | | | | | | | | |
| Actual | | $ | 1,000.00 | | | $ | 947.90 | | | | 1.52 | % | | $ | 7.36 | |
| Hypothetical (5% return before expenses) | | $ | 1,000.00 | | | $ | 1,017.30 | | | | 1.52 | % | | $ | 7.62 | |
| Institutional Class | | | | | | | | | | | | | | | | |
| Actual | | $ | 1,000.00 | | | $ | 948.90 | | | | 1.27 | % | | $ | 6.15 | |
| Hypothetical (5% return before expenses) | | $ | 1,000.00 | | | $ | 1,018.55 | | | | 1.27 | % | | $ | 6.37 | |
| Grandeur Peak Global Stalwarts Fund | | | | | | | | | | | | | | | | |
| Investor Class | | | | | | | | | | | | | | | | |
| Actual | | $ | 1,000.00 | | | $ | 975.80 | | | | 1.23 | % | | $ | 6.04 | |
| Hypothetical (5% return before expenses) | | $ | 1,000.00 | | | $ | 1,018.75 | | | | 1.23 | % | | $ | 6.17 | |
| Institutional Class | | | | | | | | | | | | | | | | |
| Actual | | $ | 1,000.00 | | | $ | 977.50 | | | | 0.98 | % | | $ | 4.82 | |
| Hypothetical (5% return before expenses) | | $ | 1,000.00 | | | $ | 1,019.99 | | | | 0.98 | % | | $ | 4.92 | |
| Grandeur Peak International Opportunities Fund | | | | | | | | | | | | | | | | |
| Investor Class | | | | | | | | | | | | | | | | |
| Actual | | $ | 1,000.00 | | | $ | 936.50 | | | | 1.58 | % | | $ | 7.61 | |
| Hypothetical (5% return before expenses) | | $ | 1,000.00 | | | $ | 1,017.01 | | | | 1.58 | % | | $ | 7.92 | |
| Institutional Class | | | | | | | | | | | | | | | | |
| Actual | | $ | 1,000.00 | | | $ | 938.40 | | | | 1.34 | % | | $ | 6.46 | |
| Hypothetical (5% return before expenses) | | $ | 1,000.00 | | | $ | 1,018.20 | | | | 1.34 | % | | $ | 6.72 | |
| Grandeur Peak International Stalwarts Fund | | | | | | | | | | | | | | | | |
| Investor Class | | | | | | | | | | | | | | | | |
| Actual | | $ | 1,000.00 | | | $ | 975.00 | | | | 1.17 | % | | $ | 5.75 | |
| Hypothetical (5% return before expenses) | | $ | 1,000.00 | | | $ | 1,019.05 | | | | 1.17 | % | | $ | 5.87 | |
| Institutional Class | | | | | | | | | | | | | | | | |
| Actual | | $ | 1,000.00 | | | $ | 976.50 | | | | 0.92 | % | | $ | 4.52 | |
| Hypothetical (5% return before expenses) | | $ | 1,000.00 | | | $ | 1,020.29 | | | | 0.92 | % | | $ | 4.62 | |
| Grandeur Peak US Stalwarts Fund | | | | | | | | | | | | | | | | |
| Institutional Class | | | | | | | | | | | | | | | | |
| Actual | | $ | 1,000.00 | | | $ | 1,315.00 | | | | 1.02 | % | | $ | 5.87 | |
| Hypothetical (5% return before expenses) | | $ | 1,000.00 | | | $ | 1,019.79 | | | | 1.02 | % | | $ | 5.12 | |
| Annual Report | April 30, 2020 | 35 |
| Grandeur Peak Funds® | Disclosure of Fund Expenses |
April 30, 2020 (Unaudited)
| (a) | The Fund's expense ratios have been annualized based on the Fund's most recent fiscal half-year expenses. |
| (b) | Expenses are equal to the Fund's annualized expense ratio multiplied by the average account value over the period, multiplied by the number of days in the most recent fiscal half-year (182)/366 (to reflect the half-year period). |
| 36 | 1.855.377.7325 | www.GrandeurPeakGlobal.com |
| Grandeur Peak Emerging Markets Opportunities Fund | Portfolio of Investments |
April 30, 2020
| | | Shares | | | Value (Note 2) | |
| COMMON STOCKS (98.85%) | | | | | | | | |
| Argentina (1.21%) | | | | | | | | |
| Globant SA(a) | | | 41,673 | | | $ | 4,820,316 | |
| | | | | | | | | |
| Bangladesh (0.80%) | | | | | | | | |
| Square Pharmaceuticals, Ltd. | | | 1,557,448 | | | | 3,192,275 | |
| | | | | | | | | |
| Brazil (6.43%) | | | | | | | | |
| Arco Platform, Ltd., Class A(a) | | | 97,100 | | | | 4,876,362 | |
| BK Brasil Operacao e Assessoria a Restaurantes SA | | | 215,600 | | | | 384,582 | |
| Fleury SA | | | 720,300 | | | | 3,009,474 | |
| Hypera SA | | | 466,300 | | | | 2,496,183 | |
| Locaweb Servicos de Internet SA(a)(b)(c) | | | 623,500 | | | | 2,668,097 | |
| Magazine Luiza SA | | | 201,900 | | | | 1,865,326 | |
| Pagseguro Digital, Ltd., Class A(a) | | | 256,875 | | | | 6,506,644 | |
| Raia Drogasil SA | | | 101,400 | | | | 1,964,824 | |
| TOTVS SA | | | 175,500 | | | | 1,913,818 | |
| | | | | | | | 25,685,310 | |
| | | | | | | | | |
| China (25.14%) | | | | | | | | |
| 51job, Inc., ADR(a) | | | 47,000 | | | | 2,817,180 | |
| 58.com, Inc., ADR(a) | | | 61,300 | | | | 3,184,535 | |
| AK Medical Holdings, Ltd.(b)(c) | | | 1,130,000 | | | | 3,075,524 | |
| Alibaba Group Holding, Ltd., Sponsored ADR(a) | | | 24,000 | | | | 4,864,080 | |
| ANTA Sports Products, Ltd. | | | 524,000 | | | | 4,423,838 | |
| Autohome, Inc., ADR | | | 15,775 | | | | 1,295,916 | |
| Baozun, Inc., Sponsored ADR(a) | | | 97,850 | | | | 3,115,544 | |
| BBI Life Sciences Corp.(c) | | | 10,274,500 | | | | 4,506,069 | |
| CSPC Pharmaceutical Group, Ltd. | | | 1,774,000 | | | | 3,523,973 | |
| Essex Bio-technology, Ltd. | | | 3,781,000 | | | | 2,375,165 | |
| Hangzhou Robam Appliances Co., Ltd., Class A | | | 436,500 | | | | 1,973,259 | |
| Hangzhou Tigermed Consulting Co., Ltd., Class A | | | 176,250 | | | | 1,924,427 | |
| HUYA, Inc., ADR(a) | | | 130,177 | | | | 2,112,773 | |
| Jiangsu Hengrui Medicine Co., Ltd., Class A(a) | | | 189,900 | | | | 2,504,318 | |
| Koolearn Technology Holding, Ltd.(a)(b)(c) | | | 1,362,000 | | | | 6,623,334 | |
| Li Ning Co., Ltd. | | | 754,000 | | | | 2,377,981 | |
| Man Wah Holdings, Ltd. | | | 6,353,200 | | | | 3,663,180 | |
| ManpowerGroup Greater China, Ltd.(a)(c) | | | 2,043,000 | | | | 2,213,634 | |
| New Oriental Education & Technology Group, Inc., Sponsored ADR(a) | | | 40,450 | | | | 5,163,847 | |
| O2Micro International, Ltd., ADR(a) | | | 462,244 | | | | 614,785 | |
| Silergy Corp. | | | 384,422 | | | | 15,448,499 | |
| | | Shares | | | Value (Note 2) | |
| China (continued) | | | | | | | | |
| Suofeiya Home Collection Co., Ltd., Class A | | | 992,800 | | | $ | 2,653,717 | |
| Tencent Holdings, Ltd. | | | 58,900 | | | | 3,168,178 | |
| TK Group Holdings, Ltd. | | | 6,362,000 | | | | 1,994,152 | |
| Trip.com Group, Ltd., ADR(a) | | | 188,200 | | | | 4,848,032 | |
| WuXi AppTec Co., Ltd., Class H(b)(c) | | | 330,000 | | | | 4,661,077 | |
| Wuxi Biologics Cayman, Inc.(a)(b)(c) | | | 173,000 | | | | 2,700,161 | |
| Yum China Holdings, Inc. | | | 53,475 | | | | 2,591,399 | |
| | | | | | | | 100,418,577 | |
| | | | | | | | | |
| Colombia (0.89%) | | | | | | | | |
| Parex Resources, Inc.(a) | | | 324,731 | | | | 3,560,038 | |
| | | | | | | | | |
| Egypt (0.70%) | | | | | | | | |
| African Export-Import Bank, GDR | | | 500,000 | | | | 1,587,500 | |
| Integrated Diagnostics Holdings PLC(b)(c) | | | 371,100 | | | | 1,194,942 | |
| | | | | | | | 2,782,442 | |
| | | | | | | | | |
| Georgia (1.46%) | | | | | | | | |
| Bank of Georgia Group PLC | | | 185,712 | | | | 2,329,674 | |
| Georgia Capital PLC(a) | | | 115,112 | | | | 608,928 | |
| Georgia Healthcare Group PLC(b)(c) | | | 356,781 | | | | 394,541 | |
| TBC Bank Group PLC | | | 240,293 | | | | 2,478,683 | |
| | | | | | | | 5,811,826 | |
| | | | | | | | | |
| Greece (2.32%) | | | | | | | | |
| JUMBO SA | | | 262,100 | | | | 4,104,423 | |
| Sarantis SA | | | 603,670 | | | | 5,159,968 | |
| | | | | | | | 9,264,391 | |
| | | | | | | | | |
| Hong Kong (3.58%) | | | | | | | | |
| Jacobson Pharma Corp., Ltd.(c) | | | 10,222,000 | | | | 1,925,072 | |
| Plover Bay Technologies, Ltd.(c) | | | 8,956,000 | | | | 1,178,345 | |
| Techtronic Industries Co., Ltd. | | | 351,000 | | | | 2,673,531 | |
| Value Partners Group, Ltd. | | | 10,871,800 | | | | 4,375,365 | |
| Vitasoy International Holdings, Ltd. | | | 1,156,383 | | | | 4,161,636 | |
| | | | | | | | 14,313,949 | |
| | | | | | | | | |
| India (10.54%) | | | | | | | | |
| Bajaj Finance, Ltd. | | | 150,000 | | | | 4,630,335 | |
| Can Fin Homes, Ltd. | | | 504,500 | | | | 2,150,482 | |
| City Union Bank, Ltd. | | | 1,009,075 | | | | 1,939,676 | |
| Cyient, Ltd. | | | 668,095 | | | | 2,031,553 | |
| Essel Propack, Ltd. | | | 646,464 | | | | 1,549,120 | |
| Gulf Oil Lubricants India, Ltd. | | | 213,607 | | | | 1,686,356 | |
| HDFC Bank, Ltd. | | | 163,500 | | | | 2,181,161 | |
| Hexaware Technologies, Ltd. | | | 602,632 | | | | 2,244,573 | |
See Notes to Financial Statements.
| Annual Report | April 30, 2020 | 37 |
| Grandeur Peak Emerging Markets Opportunities Fund | Portfolio of Investments |
April 30, 2020
| | | Shares | | | Value (Note 2) | |
| India (continued) | | | | | | | | |
| L&T Technology Services, Ltd.(b)(c) | | | 172,763 | | | $ | 2,841,807 | |
| Metropolis Healthcare, Ltd.(b)(c) | | | 367,701 | | | | 6,182,538 | |
| Mindtree, Ltd. | | | 85,500 | | | | 1,042,862 | |
| Time Technoplast, Ltd. | | | 2,390,721 | | | | 1,087,198 | |
| Vaibhav Global, Ltd. | | | 199,362 | | | | 2,548,738 | |
| WNS Holdings, Ltd., ADR(a) | | | 204,375 | | | | 9,983,719 | |
| | | | | | | | 42,100,118 | |
| | | | | | | | | |
| Indonesia (3.89%) | | | | | | | | |
| Ace Hardware Indonesia Tbk PT | | | 26,020,300 | | | | 2,658,881 | |
| Arwana Citramulia Tbk PT | | | 45,188,500 | | | | 1,239,456 | |
| Bank Central Asia Tbk PT | | | 1,169,000 | | | | 2,031,506 | |
| Bank Tabungan Pensiunan Nasional Syariah Tbk PT | | | 7,334,500 | | | | 1,079,836 | |
| Hexindo Adiperkasa Tbk PT | | | 3,557,100 | | | | 621,745 | |
| Link Net Tbk PT | | | 7,350,500 | | | | 1,373,741 | |
| Panin Sekuritas Tbk PT | | | 2,487,400 | | | | 119,562 | |
| Selamat Sempurna Tbk PT | | | 52,028,900 | | | | 4,337,199 | |
| Ultrajaya Milk Industry & Trading Co. Tbk PT | | | 22,365,800 | | | | 2,074,945 | |
| | | | | | | | 15,536,871 | |
| | | | | | | | | |
| Kenya (0.74%) | | | | | | | | |
| Safaricom PLC | | | 11,096,600 | | | | 2,948,747 | |
| | | | | | | | | |
| Malaysia (0.74%) | | | | | | | | |
| AEON Credit Service M Bhd | | | 855,114 | | | | 1,811,649 | |
| Mynews Holdings Bhd | | | 2,292,100 | | | | 461,085 | |
| Scicom MSC Bhd | | | 3,545,500 | | | | 680,241 | |
| | | | | | | | 2,952,975 | |
| | | | | | | | | |
| Mexico (1.49%) | | | | | | | | |
| Credito Real SAB de CV SOFOM ER | | | 1,448,154 | | | | 862,247 | |
| Grupo Herdez SAB de CV | | | 2,201,660 | | | | 2,739,628 | |
| Regional SAB de CV(a) | | | 952,000 | | | | 2,339,611 | |
| | | | | | | | 5,941,486 | |
| | | | | | | | | |
| Pakistan (0.30%) | | | | | | | | |
| Meezan Bank, Ltd. | | | 2,914,067 | | | | 1,192,337 | |
| | | | | | | | | |
| Peru (1.27%) | | | | | | | | |
| Alicorp SAA | | | 999,553 | | | | 2,031,383 | |
| Credicorp, Ltd. | | | 20,325 | | | | 3,028,832 | |
| | | | | | | | 5,060,215 | |
| | | | | | | | | |
| Philippines (4.54%) | | | | | | | | |
| Altus San Nicolas Corp.(a)(d) | | | 71,561 | | | | 7,060 | |
| Concepcion Industrial Corp. | | | 1,861,792 | | | | 886,392 | |
| D&L Industries, Inc. | | | 11,306,000 | | | | 1,186,446 | |
| Philippine Seven Corp. | | | 949,000 | | | | 2,324,965 | |
| Puregold Price Club, Inc. | | | 5,007,200 | | | | 4,598,956 | |
| | | Shares | | | Value (Note 2) | |
| Philippines (continued) | | | | | | |
| Robinsons Land Corp. | | | 3,716,762 | | | $ | 1,108,909 | |
| Robinsons Retail Holdings, Inc. | | | 1,279,000 | | | | 1,699,921 | |
| Wilcon Depot, Inc. | | | 21,691,900 | | | | 6,325,549 | |
| | | | | | | | 18,138,198 | |
| | | | | | | | | |
| Poland (2.95%) | | | | | | | | |
| Dino Polska SA(a)(b)(c) | | | 168,413 | | | | 7,087,570 | |
| LiveChat Software SA | | | 239,800 | | | | 3,439,091 | |
| PGS Software SA(a) | | | 426,467 | | | | 1,269,491 | |
| | | | | | | | 11,796,152 | |
| | | | | | | | | |
| Russia (1.36%) | | | | | | | | |
| HeadHunter Group PLC, ADR | | | 141,100 | | | | 2,328,150 | |
| TCS Group Holding PLC, GDR(c) | | | 86,700 | | | | 1,205,130 | |
| Yandex NV, Class A(a) | | | 49,900 | | | | 1,885,222 | |
| | | | | | | | 5,418,502 | |
| | | | | | | | | |
| South Africa (2.14%) | | | | | | | | |
| ARB Holdings, Ltd. | | | 1,093,858 | | | | 177,043 | |
| Capitec Bank Holdings, Ltd. | | | 23,200 | | | | 1,128,990 | |
| City Lodge Hotels, Ltd. | | | 57,892 | | | | 85,891 | |
| Clicks Group, Ltd. | | | 177,900 | | | | 2,214,308 | |
| Italtile, Ltd. | | | 3,636,472 | | | | 1,959,934 | |
| Shoprite Holdings, Ltd. | | | 83,700 | | | | 483,762 | |
| Transaction Capital, Ltd. | | | 3,071,128 | | | | 2,500,247 | |
| | | | | | | | 8,550,175 | |
| | | | | | | | | |
| South Korea (7.18%) | | | | | | | | |
| Douzone Bizon Co., Ltd. | | | 62,500 | | | | 4,508,802 | |
| Hy-Lok Corp. | | | 18,500 | | | | 183,717 | |
| LEENO Industrial, Inc. | | | 101,700 | | | | 7,453,576 | |
| LG Household & Health Care, Ltd. | | | 5,725 | | | | 6,512,249 | |
| NAVER Corp. | | | 13,560 | | | | 2,197,957 | |
| Settle Bank, Inc./Korea | | | 70,000 | | | | 1,462,104 | |
| Suprema, Inc.(a) | | | 75,000 | | | | 2,108,211 | |
| Tokai Carbon Korea Co., Ltd. | | | 72,124 | | | | 4,261,913 | |
| | | | | | | | 28,688,529 | |
| | | | | | | | | |
| Taiwan (10.16%) | | | | | | | | |
| ASPEED Technology, Inc. | | | 106,000 | | | | 4,241,925 | |
| Bioteque Corp. | | | 765,000 | | | | 2,945,622 | |
| eMemory Technology, Inc. | | | 80,000 | | | | 760,009 | |
| FineTek Co., Ltd. | | | 409,500 | | | | 974,984 | |
| Gourmet Master Co., Ltd. | | | 372,760 | | | | 1,209,670 | |
| Pacific Hospital Supply Co., Ltd. | | | 455,000 | | | | 1,222,555 | |
| Poya International Co., Ltd. | | | 453,000 | | | | 7,616,902 | |
| Rafael Microelectronics, Inc. | | | 312,000 | | | | 1,322,012 | |
| Realtek Semiconductor Corp. | | | 192,000 | | | | 1,662,603 | |
| Sinmag Equipment Corp. | | | 818,502 | | | | 2,614,890 | |
| Sporton International, Inc. | | | 752,760 | | | | 4,999,583 | |
| Tehmag Foods Corp. | | | 145,200 | | | | 1,037,614 | |
| Test Research, Inc. | | | 886,000 | | | | 1,546,362 | |
See Notes to Financial Statements.
| 38 | 1.855.377.7325 | www.GrandeurPeakGlobal.com |
| Grandeur Peak Emerging Markets Opportunities Fund | Portfolio of Investments |
April 30, 2020
| | | Shares | | | Value (Note 2) | |
| Taiwan (continued) | | | | | | |
| TSC Auto ID Technology Co., Ltd. | | | 228,800 | | | $ | 1,565,779 | |
| TTFB Co., Ltd. | | | 179,000 | | | | 1,378,474 | |
| Voltronic Power Technology Corp. | | | 230,100 | | | | 5,493,955 | |
| | | | | | | | 40,592,939 | |
| | | | | | | | | |
| Thailand (1.86%) | | | | | | | | |
| Muangthai Capital PCL | | | 1,888,000 | | | | 2,771,751 | |
| Netbay PCL | | | 1,489,000 | | | | 1,438,147 | |
| TOA Paint Thailand PCL | | | 2,776,000 | | | | 3,217,432 | |
| | | | | | | | 7,427,330 | |
| | | | | | | | | |
| Turkey (0.25%) | | | | | | | | |
| DP Eurasia NV(a)(b)(c) | | | 1,646,300 | | | | 1,009,796 | |
| | | | | | | | | |
| United Arab Emirates (0.85%) | | | | | | | | |
| Aramex PJSC | | | 2,626,419 | | | | 2,159,396 | |
| Network International Holdings PLC(a)(b)(c) | | | 236,400 | | | | 1,235,639 | |
| | | | | | | | 3,395,035 | |
| | | | | | | | | |
| United States (2.54%) | | | | | | | | |
| FirstCash, Inc. | | | 33,570 | | | | 2,411,669 | |
| Genpact, Ltd. | | | 224,750 | | | | 7,738,142 | |
| | | | | | | | 10,149,811 | |
| | | | | | | | | |
| Vietnam (3.52%) | | | | | | | | |
| FPT Corp. | | | 1,364,611 | | | | 2,958,822 | |
| Ho Chi Minh City Development Joint Stock Commercial Bank(a) | | | 2,240,203 | | | | 1,974,484 | |
| Lix Detergent JSC | | | 437,310 | | | | 1,054,591 | |
| Vietnam Dairy Products JSC | | | 961,035 | | | | 4,060,885 | |
| Vietnam Technological & Commercial Joint Stock Bank(a) | | | 3,207,629 | | | | 2,354,826 | |
| Vincom Retail JSC | | | 1,699,320 | | | | 1,675,457 | |
| | | | | | | | 14,079,065 | |
| | | | | | | | | |
| TOTAL COMMON STOCKS | | | | | | | | |
| (Cost $364,252,201) | | | | | | | 394,827,405 | |
| | | | | | | | | |
| TOTAL INVESTMENTS (98.85%) | | | | | | | | |
| (Cost $364,252,201) | | | | | | $ | 394,827,405 | |
| | | | | | | | | |
| Other Assets In Excess Of Liabilities (1.15%) | | | | | | | 4,602,211 | |
| | | | | | | | | |
| NET ASSETS (100.00%) | | | | | | $ | 399,429,616 | |
| (a) | Non-Income Producing Security. |
| (b) | Security exempt from registration under Rule 144A of the Securities Act of 1933. These securities may be resold in the ordinary course of business in transactions exempt from registration, normally to qualified institutional buyers. As of April 30, 2020, these securities had a total aggregate market value of $39,675,026, representing 9.93% of net assets. |
| (c) | Security was purchased pursuant to Regulation S under the Securities Act of 1933, which exempts securities offered and sold outside of the United States from registration. Such security cannot be sold in the United States without either an effective registration statement filed pursuant to the Securities Act of 1933, or pursuant to an exemption from registration. As of April 30, 2020, the aggregate market value of these securities was $50,703,276, representing 12.69% of net assets. |
| (d) | As a result of the use of significant unobservable inputs to determine fair value, these investments have been classified as level 3 assets. See also Note 2 to the financial statements for additional information. |
For Fund compliance purposes, the Fund's geographical classifications refer to any one or more of the country sub-classifications used by one or more widely recognized market indexes or ratings group indexes, and/or as defined by Fund management. This definition may not apply for purposes of this report, which may combine sub-classifications for reporting ease. Geographical regions are shown as a percentage of net assets.
See Notes to Financial Statements.
| Annual Report | April 30, 2020 | 39 |
| Grandeur Peak Global Contrarian Fund | Portfolio of Investments |
April 30, 2020
| | | Shares | | | Value (Note 2) | |
| COMMON STOCKS (99.31%) | | | | | | |
| Australia (5.54%) | | | | | | | | |
| Corporate Travel Management, Ltd. | | | 11,700 | | | $ | 96,828 | |
| Fiducian Group, Ltd. | | | 62,209 | | | | 186,882 | |
| Lycopodium, Ltd. | | | 24,900 | | | | 71,395 | |
| National Storage REIT | | | 120,055 | | | | 135,735 | |
| | | | | | | | 490,840 | |
| | | | | | | | | |
| Belgium (0.57%) | | | | | | | | |
| X-Fab Silicon Foundries SE(a)(b)(c) | | | 14,529 | | | | 50,631 | |
| | | | | | | | | |
| Britain (9.86%) | | | | | | | | |
| Ascential PLC(b)(c) | | | 24,600 | | | | 78,388 | |
| B&M European Value Retail SA | | | 22,845 | | | | 95,757 | |
| City of London Investment Group PLC | | | 16,583 | | | | 63,912 | |
| Close Brothers Group PLC | | | 4,663 | | | | 64,075 | |
| CVS Group PLC | | | 7,997 | | | | 92,160 | |
| K3 Capital Group PLC | | | 37,219 | | | | 85,082 | |
| On the Beach Group PLC(b)(c) | | | 20,000 | | | | 70,028 | |
| Oxford Immunotec Global PLC(a) | | | 10,850 | | | | 135,191 | |
| Premier Miton Group PLC | | | 6,666 | | | | 8,270 | |
| Sabre Insurance Group PLC(b)(c) | | | 24,780 | | | | 88,013 | |
| Senior PLC | | | 47,326 | | | | 38,744 | |
| Volution Group PLC | | | 26,177 | | | | 54,400 | |
| | | | | | | | 874,020 | |
| | | | | | | | | |
| Canada (1.71%) | | | | | | | | |
| Biosyent, Inc.(a) | | | 16,836 | | | | 49,349 | |
| Guardian Capital Group, Ltd. | | | 6,855 | | | | 102,336 | |
| | | | | | | | 151,685 | |
| | | | | | | | | |
| China (7.59%) | | | | | | | | |
| BBI Life Sciences Corp.(c) | | | 661,500 | | | | 290,113 | |
| Hangzhou Robam Appliances Co., Ltd., Class A | | | 16,800 | | | | 75,946 | |
| Man Wah Holdings, Ltd. | | | 108,000 | | | | 62,272 | |
| O2Micro International, Ltd., ADR(a) | | | 65,875 | | | | 87,614 | |
| TK Group Holdings, Ltd. | | | 148,000 | | | | 46,390 | |
| Xin Point Holdings, Ltd.(c) | | | 570,000 | | | | 110,287 | |
| | | | | | | | 672,622 | |
| | | | | | | | | |
| Colombia (1.51%) | | | | | | | | |
| Parex Resources, Inc.(a) | | | 12,200 | | | | 133,749 | |
| | | | | | | | | |
| France (2.87%) | | | | | | | | |
| Neurones | | | 3,662 | | | | 78,254 | |
| Rothschild & Co. | | | 4,547 | | | | 89,990 | |
| | | Shares | | | Value (Note 2) | |
| France (continued) | | | | | | | | |
| Thermador Groupe | | | 1,772 | | | $ | 86,024 | |
| | | | | | | | 254,268 | |
| | | | | | | | | |
| Georgia (2.36%) | | | | | | | | |
| Bank of Georgia Group PLC | | | 4,920 | | | | 61,719 | |
| Georgia Healthcare Group PLC(b)(c) | | | 89,246 | | | | 98,691 | |
| TBC Bank Group PLC | | | 4,744 | | | | 48,936 | |
| | | | | | | | 209,346 | |
| | | | | | | | | |
| Germany (2.16%) | | | | | | | | |
| Aroundtown SA | | | 9,400 | | | | 50,578 | |
| Grand City Properties SA | | | 3,917 | | | | 81,986 | |
| Norma Group SE | | | 2,335 | | | | 58,699 | |
| | | | | | | | 191,263 | |
| | | | | | | | | |
| Greece (0.96%) | | | | | | | | |
| Sarantis SA | | | 10,000 | | | | 85,477 | |
| | | | | | | | | |
| Hong Kong (3.90%) | | | | | | | | |
| Jacobson Pharma Corp., Ltd.(c) | | | 664,000 | | | | 125,049 | |
| Plover Bay Technologies, Ltd.(c) | | | 1,121,000 | | | | 147,490 | |
| Value Partners Group, Ltd. | | | 181,000 | | | | 72,844 | |
| | | | | | | | 345,383 | |
| | | | | | | | | |
| India (3.63%) | | | | | | | | |
| Cyient, Ltd. | | | 18,000 | | | | 54,735 | |
| Hexaware Technologies, Ltd. | | | 16,925 | | | | 63,039 | |
| Time Technoplast, Ltd. | | | 106,811 | | | | 48,573 | |
| WNS Holdings, Ltd., ADR(a) | | | 3,175 | | | | 155,099 | |
| | | | | | | | 321,446 | |
| | | | | | | | | |
| Indonesia (1.57%) | | | | | | | | |
| Selamat Sempurna Tbk PT | | | 1,672,100 | | | | 139,389 | |
| | | | | | | | | |
| Ireland (2.28%) | | | | | | | | |
| Hostelworld Group PLC(b)(c) | | | 125,966 | | | | 121,370 | |
| Irish Residential Properties REIT PLC | | | 57,000 | | | | 80,453 | |
| | | | | | | | 201,823 | |
| | | | | | | | | |
| Italy (2.92%) | | | | | | | | |
| Banca Sistema SpA(b)(c) | | | 59,271 | | | | 86,387 | |
| Freni Brembo SpA | | | 6,678 | | | | 56,825 | |
| Piovan SpA(b)(c) | | | 25,704 | | | | 115,347 | |
| | | | | | | | 258,559 | |
| | | | | | | | | |
| Japan (14.69%) | | | | | | | | |
| Beenos, Inc. | | | 10,300 | | | | 96,459 | |
| Central Automotive Products, Ltd. | | | 7,800 | | | | 133,010 | |
| GMO Financial Holdings, Inc. | | | 13,400 | | | | 68,551 | |
| Japan Lifeline Co., Ltd. | | | 7,700 | | | | 91,483 | |
See Notes to Financial Statements.
| 40 | 1.855.377.7325 | www.GrandeurPeakGlobal.com |
| Grandeur Peak Global Contrarian Fund | Portfolio of Investments |
April 30, 2020
| | | Shares | | | Value (Note 2) | |
| Japan (continued) | | | | | | | | |
| Medikit Co., Ltd. | | | 2,200 | | | $ | 70,624 | |
| Naigai Trans Line, Ltd. | | | 9,900 | | | | 103,507 | |
| Open Door, Inc.(a) | | | 10,000 | | | | 90,388 | |
| Seria Co., Ltd. | | | 3,700 | | | | 120,673 | |
| Sundrug Co., Ltd. | | | 3,000 | | | | 103,294 | |
| Synchro Food Co., Ltd.(a) | | | 34,700 | | | | 93,447 | |
| Tokyo Century Corp. | | | 1,300 | | | | 44,640 | |
| Trancom Co., Ltd. | | | 2,900 | | | | 192,947 | |
| YAMADA Consulting Group Co., Ltd. | | | 8,800 | | | | 92,416 | |
| | | | | | | | 1,301,439 | |
| | | | | | | | | |
| Mexico (0.80%) | | | | | | | | |
| Regional SAB de CV(a) | | | 28,800 | | | | 70,778 | |
| | | | | | | | | |
| Netherlands (1.29%) | | | | | | | | |
| Aalberts NV | | | 4,071 | | | | 114,653 | |
| | | | | | | | | |
| New Zealand (0.48%) | | | | | | | | |
| Kathmandu Holdings, Ltd. | | | 88,436 | | | | 42,858 | |
| | | | | | | | | |
| Norway (0.66%) | | | | | | | | |
| Sbanken ASA(a)(b)(c) | | | 10,924 | | | | 58,325 | |
| | | | | | | | | |
| Philippines (1.63%) | | | | | | | | |
| Concepcion Industrial Corp. | | | 169,800 | | | | 80,841 | |
| Pryce Corp. | | | 767,700 | | | | 63,962 | |
| | | | | | | | 144,803 | |
| | | | | | | | | |
| Poland (0.88%) | | | | | | | | |
| PGS Software SA(a) | | | 26,156 | | | | 77,860 | |
| | | | | | | | | |
| Singapore (1.46%) | | | | | | | | |
| Riverstone Holdings, Ltd./Singapore | | | 156,300 | | | | 129,682 | |
| | | | | | | | | |
| South Africa (0.72%) | | | | | | | | |
| Italtile, Ltd. | | | 118,471 | | | | 63,852 | |
| | | | | | | | | |
| South Korea (1.99%) | | | | | | | | |
| LEENO Industrial, Inc. | | | 1,109 | | | | 81,278 | |
| Tokai Carbon Korea Co., Ltd. | | | 1,614 | | | | 95,374 | |
| | | | | | | | 176,652 | |
| | | | | | | | | |
| Sweden (2.78%) | | | | | | | | |
| Beijer Alma AB | | | 6,900 | | | | 66,626 | |
| KNOW IT AB(a) | | | 12,000 | | | | 179,341 | |
| | | | | | | | 245,967 | |
| | | | | | | | | |
| Taiwan (4.19%) | | | | | | | | |
| Bioteque Corp. | | | 61,000 | | | | 234,880 | |
| FineTek Co., Ltd. | | | 33,000 | | | | 78,570 | |
| | | Shares | | | Value (Note 2) | |
| Taiwan (continued) | | | | | | | | |
| Sinmag Equipment Corp. | | | 18,000 | | | $ | 57,505 | |
| | | | | | | | 370,955 | |
| | | | | | | | | |
| Turkey (0.84%) | | | | | | | | |
| DP Eurasia NV(a)(b)(c) | | | 120,702 | | | | 74,035 | |
| | | | | | | | | |
| United Arab Emirates (1.01%) | | | | | | | | |
| Aramex PJSC | | | 109,000 | | | | 89,618 | |
| | | | | | | | | |
| United States (12.78%) | | | | | | | | |
| Bank of NT Butterfield & Son, Ltd. | | | 5,499 | | | | 121,033 | |
| CH Robinson Worldwide, Inc. | | | 806 | | | | 57,145 | |
| Core Laboratories NV | | | 2,539 | | | | 49,790 | |
| Esquire Financial Holdings, Inc.(a) | | | 4,350 | | | | 71,427 | |
| Five Below, Inc.(a) | | | 1,000 | | | | 90,160 | |
| Hackett Group, Inc. | | | 10,040 | | | | 148,893 | |
| HD Supply Holdings, Inc.(a) | | | 2,525 | | | | 74,942 | |
| Hingham Institution for Savings | | | 416 | | | | 63,656 | |
| Microchip Technology, Inc. | | | 827 | | | | 72,553 | |
| NV5 Global, Inc.(a) | | | 1,364 | | | | 63,767 | |
| Systemax, Inc. | | | 6,549 | | | | 130,063 | |
| TriMas Corp.(a) | | | 2,895 | | | | 69,017 | |
| Virtusa Corp.(a) | | | 1,768 | | | | 58,344 | |
| WW Grainger, Inc. | | | 225 | | | | 62,006 | |
| | | | | | | | 1,132,796 | |
| | | | | | | | | |
| Vietnam (3.68%) | | | | | | | | |
| Hoa Phat Group JSC(a) | | | 105,000 | | | | 96,355 | |
| Vietnam Dairy Products JSC | | | 35,540 | | | | 150,176 | |
| Vietnam Technological & Commercial Joint Stock Bank(a) | | | 108,000 | | | | 79,286 | |
| | | | | | | | 325,817 | |
| | | | | | | | | |
| TOTAL COMMON STOCKS | | | | | | | | |
| (Cost $9,801,102) | | | | | | | 8,800,591 | |
| | | | | | | | | |
| TOTAL INVESTMENTS (99.31%) | | | | | | | | |
| (Cost $9,801,102) | | | | | | $ | 8,800,591 | |
| | | | | | | | | |
| Other Assets In Excess Of Liabilities (0.69%) | | | | | | | 60,826 | |
| | | | | | | | | |
| NET ASSETS (100.00%) | | | | | | $ | 8,861,417 | |
| (a) | Non-Income Producing Security. |
| (b) | Security exempt from registration under Rule 144A of the Securities Act of 1933. These securities may be resold in the ordinary course of business in transactions exempt from registration, normally to qualified institutional buyers. As of April 30, 2020, these securities had a total aggregate market value of $841,215, representing 9.49% of net assets. |
See Notes to Financial Statements.
| Annual Report | April 30, 2020 | 41 |
| Grandeur Peak Global Contrarian Fund | Portfolio of Investments |
April 30, 2020
| (c) | Security was purchased pursuant to Regulation S under the Securities Act of 1933, which exempts securities offered and sold outside of the United States from registration. Such security cannot be sold in the United States without either an effective registration statement filed pursuant to the Securities Act of 1933, or pursuant to an exemption from registration. As of April 30, 2020, the aggregate market value of these securities was $1,514,154, representing 17.09% of net assets. |
For Fund compliance purposes, the Fund's geographical classifications refer to any one or more of the country sub-classifications used by one or more widely recognized market indexes or ratings group indexes, and/or as defined by Fund management. This definition may not apply for purposes of this report, which may combine sub-classifications for reporting ease. Geographical regions are shown as a percentage of net assets.
See Notes to Financial Statements.
| 42 | 1.855.377.7325 | www.GrandeurPeakGlobal.com |
| Grandeur Peak Global Micro Cap Fund | Portfolio of Investments |
April 30, 2020
| | | Shares | | | Value (Note 2) | |
| COMMON STOCKS (95.65%) | | | | | | | | |
| Australia (8.64%) | | | | | | | | |
| Australian Ethical Investment, Ltd. | | | 31,300 | | | $ | 95,048 | |
| Corporate Travel Management, Ltd. | | | 19,800 | | | | 163,863 | |
| Fiducian Group, Ltd. | | | 190,828 | | | | 573,266 | |
| Kogan.com, Ltd. | | | 127,011 | | | | 661,304 | |
| Mainstream Group Holdings, Ltd. | | | 465,778 | | | | 119,892 | |
| National Storage REIT | | | 475,451 | | | | 537,550 | |
| People Infrastructure, Ltd. | | | 75,538 | | | | 88,604 | |
| Temple & Webster Group, Ltd.(a) | | | 125,800 | | | | 319,712 | |
| | | | | | | | 2,559,239 | |
| | | | | | | | | |
| Brazil (0.40%) | | | | | | | | |
| Locaweb Servicos de Internet SA(a)(b)(c) | | | 27,500 | | | | 117,679 | |
| | | | | | | | | |
| Britain (13.06%) | | | | | | | | |
| AB Dynamics PLC | | | 13,514 | | | | 306,374 | |
| City of London Investment Group PLC | | | 43,608 | | | | 168,068 | |
| Curtis Banks Group PLC | | | 78,479 | | | | 270,832 | |
| CVS Group PLC | | | 31,500 | | | | 363,018 | |
| dotdigital group PLC | | | 129,000 | | | | 163,287 | |
| Impax Asset Management Group PLC | | | 93,081 | | | | 426,149 | |
| JTC PLC(b)(c) | | | 51,800 | | | | 270,101 | |
| K3 Capital Group PLC | | | 143,979 | | | | 329,133 | |
| On the Beach Group PLC(b)(c) | | | 82,200 | | | | 287,814 | |
| Oxford Immunotec Global PLC(a) | | | 49,717 | | | | 619,474 | |
| Premier Miton Group PLC | | | 51,749 | | | | 64,200 | |
| Sanne Group PLC | | | 18,500 | | | | 150,988 | |
| Tracsis PLC | | | 19,300 | | | | 145,849 | |
| Volution Group PLC | | | 86,601 | | | | 179,971 | |
| XPS Pensions Group PLC(c) | | | 90,380 | | | | 125,216 | |
| | | | | | | | 3,870,474 | |
| | | | | | | | | |
| Canada (0.03%) | | | | | | | | |
| StorageVault Canada, Inc. | | | 3,800 | | | | 8,272 | |
| | | | | | | | | |
| China (4.81%) | | | | | | | | |
| BBI Life Sciences Corp.(c) | | | 2,645,000 | | | | 1,160,013 | |
| Essex Bio-technology, Ltd. | | | 1,000 | | | | 628 | |
| O2Micro International, Ltd., ADR(a) | | | 112,655 | | | | 149,831 | |
| TK Group Holdings, Ltd. | | | 369,000 | | | | 115,662 | |
| | | | | | | | 1,426,134 | |
| | | | | | | | | |
| Finland (0.85%) | | | | | | | | |
| Musti Group Oyj(a) | | | 20,800 | | | | 253,011 | |
| | | Shares | | | Value (Note 2) | |
| France (2.92%) | | | | | | | | |
| Esker SA | | | 3,700 | | | $ | 432,227 | |
| Neurones | | | 6,900 | | | | 147,447 | |
| Thermador Groupe | | | 5,874 | | | | 285,161 | |
| | | | | | | | 864,835 | |
| | | | | | | | | |
| Georgia (0.68%) | | | | | | | | |
| Georgia Healthcare Group PLC(b)(c) | | | 78,281 | | | | 86,566 | |
| TBC Bank Group PLC | | | 11,050 | | | | 113,983 | |
| | | | | | | | 200,549 | |
| | | | | | | | | |
| Germany (0.88%) | | | | | | | | |
| Marley Spoon AG(a) | | | 150,636 | | | | 111,905 | |
| Nexus AG | | | 3,900 | | | | 149,584 | |
| | | | | | | | 261,489 | |
| | | | | | | | | |
| Greece (3.36%) | | | | | | | | |
| Sarantis SA | | | 116,542 | | | | 996,162 | |
| | | | | | | | | |
| Hong Kong (1.44%) | | | | | | | | |
| Jacobson Pharma Corp., Ltd.(c) | | | 859,000 | | | | 161,772 | |
| Plover Bay Technologies, Ltd.(c) | | | 2,008,000 | | | | 264,194 | |
| | | | | | | | 425,966 | |
| | | | | | | | | |
| India (5.28%) | | | | | | | | |
| Cyient, Ltd. | | | 23,640 | | | | 71,885 | |
| Essel Propack, Ltd. | | | 72,500 | | | | 173,732 | |
| Gulf Oil Lubricants India, Ltd. | | | 21,500 | | | | 169,735 | |
| Metropolis Healthcare, Ltd.(b)(c) | | | 18,316 | | | | 307,966 | |
| Vaibhav Global, Ltd. | | | 43,970 | | | | 562,133 | |
| Westlife Development, Ltd.(a) | | | 67,000 | | | | 278,724 | |
| | | | | | | | 1,564,175 | |
| | | | | | | | | |
| Indonesia (2.22%) | | | | | | | | |
| Arwana Citramulia Tbk PT | | | 7,920,100 | | | | 217,237 | |
| Selamat Sempurna Tbk PT | | | 5,271,800 | | | | 439,464 | |
| | | | | | | | 656,701 | |
| | | | | | | | | |
| Ireland (1.07%) | | | | | | | | |
| Irish Residential Properties REIT PLC | | | 137,000 | | | | 193,370 | |
| Uniphar PLC | | | 77,700 | | | | 123,465 | |
| | | | | | | | 316,835 | |
| | | | | | | | | |
| Italy (0.71%) | | | | | | | | |
| Piovan SpA(b)(c) | | | 47,181 | | | | 211,726 | |
| | | | | | | | | |
| Japan (15.24%) | | | | | | | | |
| Atrae, Inc.(a) | | | 3,700 | | | | 89,505 | |
| BayCurrent Consulting, Inc. | | | 4,800 | | | | 275,078 | |
| Beenos, Inc. | | | 9,500 | | | | 88,967 | |
See Notes to Financial Statements.
| Annual Report | April 30, 2020 | 43 |
| Grandeur Peak Global Micro Cap Fund | Portfolio of Investments |
April 30, 2020
| | | Shares | | | Value (Note 2) | |
| Japan (continued) | | | | | | | | |
| Central Automotive Products, Ltd. | | | 10,900 | | | $ | 185,873 | |
| eGuarantee, Inc. | | | 20,200 | | | | 358,768 | |
| Future Corp. | | | 10,200 | | | | 135,442 | |
| gremz, Inc. | | | 5,500 | | | | 99,068 | |
| M&A Capital Partners Co., Ltd.(a) | | | 23,500 | | | | 666,799 | |
| MarkLines Co., Ltd. | | | 9,100 | | | | 149,752 | |
| Medikit Co., Ltd. | | | 4,000 | | | | 128,407 | |
| Meinan M&A Co., Ltd.(a) | | | 3,400 | | | | 86,335 | |
| Naigai Trans Line, Ltd. | | | 24,700 | | | | 258,243 | |
| Open Door, Inc.(a) | | | 41,300 | | | | 373,303 | |
| Strike Co., Ltd. | | | 4,000 | | | | 164,189 | |
| Synchro Food Co., Ltd.(a) | | | 54,800 | | | | 147,577 | |
| System Information Co., Ltd. | | | 17,600 | | | | 136,615 | |
| Syuppin Co., Ltd. | | | 22,100 | | | | 151,363 | |
| Trancom Co., Ltd. | | | 2,700 | | | | 179,639 | |
| Vega Corp. Co., Ltd.(a) | | | 31,300 | | | | 267,748 | |
| YAKUODO Holdings Co., Ltd. | | | 24,100 | | | | 573,783 | |
| | | | | | | | 4,516,454 | |
| | | | | | | | | |
| Malaysia (0.36%) | | | | | | | | |
| Mynews Holdings Bhd | | | 535,000 | | | | 107,622 | |
| | | | | | | | | |
| Netherlands (1.71%) | | | | | | | | |
| Shop Apotheke Europe NV(a)(b)(c) | | | 6,875 | | | | 507,792 | |
| | | | | | | | | |
| New Zealand (0.41%) | | | | | | | | |
| CBL Corp., Ltd.(a)(d) | | | 159,993 | | | | 0 | |
| NZX, Ltd. | | | 156,114 | | | | 122,584 | |
| | | | | | | | 122,584 | |
| | | | | | | | | |
| Norway (3.17%) | | | | | | | | |
| Infront ASA(a) | | | 72,633 | | | | 136,120 | |
| Medistim ASA | | | 7,989 | | | | 135,684 | |
| Sbanken ASA(a)(b)(c) | | | 16,631 | | | | 88,795 | |
| Self Storage Group ASA(a) | | | 227,748 | | | | 577,981 | |
| | | | | | | | 938,580 | |
| | | | | | | | | |
| Philippines (1.91%) | | | | | | | | |
| Concepcion Industrial Corp. | | | 334,770 | | | | 159,383 | |
| Pryce Corp. | | | 3,697,000 | | | | 308,022 | |
| Wilcon Depot, Inc. | | | 335,000 | | | | 97,689 | |
| | | | | | | | 565,094 | |
| | | | | | | | | |
| Poland (1.06%) | | | | | | | | |
| LiveChat Software SA | | | 11,300 | | | | 162,059 | |
| PGS Software SA(a) | | | 51,047 | | | | 151,955 | |
| | | | | | | | 314,014 | |
| | | | | | | | | |
| Singapore (0.72%) | | | | | | | | |
| Riverstone Holdings, Ltd./Singapore | | | 257,800 | | | | 213,896 | |
| | | Shares | | | Value (Note 2) | |
| South Africa (0.21%) | | | | | | | | |
| ARB Holdings, Ltd. | | | 383,630 | | | $ | 62,091 | |
| | | | | | | | | |
| South Korea (1.96%) | | | | | | | | |
| LEENO Industrial, Inc. | | | 3,800 | | | | 278,501 | |
| MegaStudyEdu Co., Ltd. | | | 2,818 | | | | 104,075 | |
| Suprema, Inc.(a) | | | 3,500 | | | | 98,383 | |
| Tokai Carbon Korea Co., Ltd. | | | 1,681 | | | | 99,333 | |
| | | | | | | | 580,292 | |
| | | | | | | | | |
| Sweden (3.96%) | | | | | | | | |
| Absolent Group AB | | | 2,858 | | | | 126,557 | |
| KNOW IT AB(a) | | | 20,150 | | | | 301,144 | |
| OEM International AB, Class B(a) | | | 5,685 | | | | 118,295 | |
| SwedenCare AB | | | 36,978 | | | | 340,378 | |
| Vitec Software Group AB, Class B | | | 15,200 | | | | 288,242 | |
| | | | | | | | 1,174,616 | |
| | | | | | | | | |
| Taiwan (6.36%) | | | | | | | | |
| Bioteque Corp. | | | 130,000 | | | | 500,563 | |
| FineTek Co., Ltd. | | | 59,150 | | | | 140,831 | |
| Gourmet Master Co., Ltd. | | | 34,000 | | | | 110,336 | |
| Pacific Hospital Supply Co., Ltd. | | | 53,000 | | | | 142,408 | |
| Poya International Co., Ltd. | | | 25,000 | | | | 420,359 | |
| Sporton International, Inc. | | | 27,725 | | | | 184,140 | |
| Tehmag Foods Corp. | | | 13,300 | | | | 95,043 | |
| TSC Auto ID Technology Co., Ltd. | | | 25,700 | | | | 175,876 | |
| TTFB Co., Ltd. | | | 15,000 | | | | 115,515 | |
| | | | | | | | 1,885,071 | |
| | | | | | | | | |
| Thailand (0.73%) | | | | | | | | |
| Humanica PCL(a) | | | 462,000 | | | | 94,242 | |
| Netbay PCL | | | 125,000 | | | | 120,731 | |
| | | | | | | | 214,973 | |
| | | | | | | | | |
| Turkey (0.39%) | | | | | | | | |
| DP Eurasia NV(a)(b)(c) | | | 186,084 | | | | 114,139 | |
| | | | | | | | | |
| United States (9.78%) | | | | | | | | |
| BioDelivery Sciences International, Inc.(a) | | | 11,250 | | | | 51,300 | |
| Castle Biosciences, Inc.(a) | | | 3,300 | | | | 102,069 | |
| Coastal Financial Corp.(a) | | | 12,400 | | | | 162,812 | |
| Esquire Financial Holdings, Inc.(a) | | | 14,510 | | | | 238,254 | |
| Hackett Group, Inc. | | | 7,625 | | | | 113,079 | |
| Heska Corp.(a) | | | 3,666 | | | | 259,553 | |
| Joint Corp.(a) | | | 48,350 | | | | 585,035 | |
| Kinsale Capital Group, Inc. | | | 1,625 | | | | 176,507 | |
| LeMaitre Vascular, Inc. | | | 7,975 | | | | 227,208 | |
| MaxCyte, Inc.(a) | | | 74,400 | | | | 153,210 | |
See Notes to Financial Statements.
| 44 | 1.855.377.7325 | www.GrandeurPeakGlobal.com |
| Grandeur Peak Global Micro Cap Fund | Portfolio of Investments |
April 30, 2020
| | | Shares | | | Value (Note 2) | |
| United States (continued) | | | | | | | | |
| Seacoast Commerce Banc Holdings | | | 9,450 | | | $ | 115,762 | |
| STAAR Surgical Co.(a) | | | 7,250 | | | | 277,820 | |
| Systemax, Inc. | | | 7,450 | | | | 147,957 | |
| Transcat, Inc.(a) | | | 3,266 | | | | 91,742 | |
| Veracyte, Inc.(a) | | | 7,304 | | | | 196,989 | |
| | | | | | | | 2,899,297 | |
| | | | | | | | | |
| Vietnam (1.33%) | | | | | | | | |
| Lix Detergent JSC | | | 163,520 | | | | 394,335 | |
| | | | | | | | | |
| TOTAL COMMON STOCKS | | | | | | | | |
| (Cost $25,115,721) | | | | | | | 28,344,097 | |
| | | | | | | | | |
| TOTAL INVESTMENTS (95.65%) | | | | | | | | |
| (Cost $25,115,721) | | | | | | $ | 28,344,097 | |
| | | | | | | | | |
| Other Assets In Excess Of Liabilities (4.35%) | | | | | | | 1,289,830 | |
| | | | | | | | | |
| NET ASSETS (100.00%) | | | | | | $ | 29,633,927 | |
| (a) | Non-Income Producing Security. |
| (b) | Security exempt from registration under Rule 144A of the Securities Act of 1933. These securities may be resold in the ordinary course of business in transactions exempt from registration, normally to qualified institutional buyers. As of April 30, 2020, these securities had a total aggregate market value of $1,992,578, representing 6.72% of net assets. |
| (c) | Security was purchased pursuant to Regulation S under the Securities Act of 1933, which exempts securities offered and sold outside of the United States from registration. Such security cannot be sold in the United States without either an effective registration statement filed pursuant to the Securities Act of 1933, or pursuant to an exemption from registration. As of April 30, 2020, the aggregate market value of these securities was $3,703,773, representing 12.50% of net assets. |
| (d) | As a result of the use of significant unobservable inputs to determine fair value, these investments have been classified as level 3 assets. See also Note 2 to the financial statements for additional information. |
For Fund compliance purposes, the Fund's geographical classifications refer to any one or more of the country sub-classifications used by one or more widely recognized market indexes or ratings group indexes, and/or as defined by Fund management. This definition may not apply for purposes of this report, which may combine sub-classifications for reporting ease. Geographical regions are shown as a percentage of net assets.
See Notes to Financial Statements.
| Annual Report | April 30, 2020 | 45 |
| Grandeur Peak Global Opportunities Fund | Portfolio of Investments |
| | | Shares | | | Value (Note 2) | |
| COMMON STOCKS (98.00%) | | | | | | | | |
| Argentina (0.61%) | | | | | | | | |
| Globant SA(a) | | | 29,450 | | | $ | 3,406,481 | |
| | | | | | | | | |
| Australia (1.64%) | | | | | | | | |
| Corporate Travel Management, Ltd. | | | 307,200 | | | | 2,542,367 | |
| Fiducian Group, Ltd. | | | 174,227 | | | | 523,395 | |
| Kogan.com, Ltd. | | | 498,607 | | | | 2,596,082 | |
| National Storage REIT | | | 3,150,556 | | | | 3,562,050 | |
| | | | | | | | 9,223,894 | |
| | | | | | | | | |
| Bangladesh (0.17%) | | | | | | | | |
| Square Pharmaceuticals, Ltd. | | | 473,390 | | | | 970,300 | |
| | | | | | | | | |
| Belgium (0.96%) | | | | | | | | |
| Melexis NV | | | 57,693 | | | | 3,512,045 | |
| Warehouses De Pauw CVA | | | 69,200 | | | | 1,895,828 | |
| | | | | | | | 5,407,873 | |
| | | | | | | | | |
| Brazil (1.68%) | | | | | | | | |
| Fleury SA | | | 478,200 | | | | 1,997,959 | |
| Locaweb Servicos de Internet SA(a)(b)(c) | | | 226,400 | | | | 968,817 | |
| Pagseguro Digital, Ltd., Class A(a) | | | 256,754 | | | | 6,503,579 | |
| | | | | | | | 9,470,355 | |
| | | | | | | | | |
| Britain (14.87%) | | | | | | | | |
| AB Dynamics PLC | | | 69,100 | | | | 1,566,558 | |
| Ascential PLC(b)(c) | | | 1,724,239 | | | | 5,494,319 | |
| B&M European Value Retail SA | | | 1,798,700 | | | | 7,539,420 | |
| boohoo Group PLC(a) | | | 1,462,200 | | | | 5,948,469 | |
| City of London Investment Group PLC | | | 78,996 | | | | 304,455 | |
| Clipper Logistics PLC | | | 22,551 | | | | 60,498 | |
| Curtis Banks Group PLC | | | 196,200 | | | | 677,089 | |
| CVS Group PLC | | | 689,662 | | | | 7,947,917 | |
| Dechra Pharmaceuticals PLC | | | 368,400 | | | | 12,852,727 | |
| Endava PLC, ADR(a) | | | 187,661 | | | | 8,213,922 | |
| FDM Group Holdings PLC | | | 177,400 | | | | 1,671,287 | |
| Impax Asset Management Group PLC | | | 221,901 | | | | 1,015,920 | |
| Intermediate Capital Group PLC | | | 92,128 | | | | 1,308,870 | |
| JTC PLC(b)(c) | | | 482,638 | | | | 2,516,621 | |
| K3 Capital Group PLC | | | 526,400 | | | | 1,203,340 | |
| On the Beach Group PLC(b)(c) | | | 960,284 | | | | 3,362,330 | |
| Oxford Immunotec Global PLC(a) | | | 636,583 | | | | 7,931,824 | |
| Premier Miton Group PLC | | | 610,877 | | | | 757,855 | |
| Sabre Insurance Group PLC(b)(c) | | | 333,700 | | | | 1,185,226 | |
| Sanne Group PLC | | | 448,674 | | | | 3,661,861 | |
| Softcat PLC | | | 258,037 | | | | 3,672,454 | |
| | | Shares | | | Value (Note 2) | |
| Britain (continued) | | | | | | | | |
| St. James's Place PLC | | | 386,555 | | | $ | 4,145,156 | |
| Volution Group PLC | | | 323,595 | | | | 672,484 | |
| | | | | | | | 83,710,602 | |
| | | | | | | | | |
| Canada (1.23%) | | | | | | | | |
| Gildan Activewear, Inc. | | | 207,000 | | | | 2,887,992 | |
| Richelieu Hardware, Ltd. | | | 212,665 | | | | 4,039,558 | |
| | | | | | | | 6,927,550 | |
| | | | | | | | | |
| China (6.63%) | | | | | | | | |
| BBI Life Sciences Corp.(c) | | | 13,832,000 | | | | 6,066,275 | |
| Hangzhou Tigermed Consulting Co., Ltd., Class A | | | 52,900 | | | | 577,601 | |
| Man Wah Holdings, Ltd. | | | 4,451,000 | | | | 2,566,394 | |
| O2Micro International, Ltd., ADR(a) | | | 961,111 | | | | 1,278,278 | |
| Silergy Corp. | | | 446,352 | | | | 17,937,237 | |
| Suofeiya Home Collection Co., Ltd., Class A | | | 941,800 | | | | 2,517,396 | |
| Trip.com Group, Ltd., ADR(a) | | | 134,650 | | | | 3,468,584 | |
| WuXi AppTec Co., Ltd., Class H(b)(c) | | | 208,200 | | | | 2,940,716 | |
| | | | | | | | 37,352,481 | |
| | | | | | | | | |
| Denmark (0.54%) | | | | | | | | |
| Ambu A/S, Class B | | | 97,298 | | | | 3,052,150 | |
| | | | | | | | | |
| Egypt (0.07%) | | | | | | | | |
| Integrated Diagnostics Holdings PLC(b)(c) | | | 125,600 | | | | 404,432 | |
| | | | | | | | | |
| Finland (0.46%) | | | | | | | | |
| Musti Group Oyj(a) | | | 214,900 | | | | 2,614,040 | |
| | | | | | | | | |
| France (2.99%) | | | | | | | | |
| Alten SA | | | 38,581 | | | | 2,777,741 | |
| BioMerieux | | | 37,900 | | | | 4,705,675 | |
| Esker SA | | | 35,947 | | | | 4,199,259 | |
| Neurones | | | 50,134 | | | | 1,071,321 | |
| Rothschild & Co. | | | 27,200 | | | | 538,319 | |
| Thermador Groupe | | | 72,678 | | | | 3,528,252 | |
| | | | | | | | 16,820,567 | |
| | | | | | | | | |
| Georgia (0.54%) | | | | | | | | |
| Georgia Capital PLC(a) | | | 191,300 | | | | 1,011,953 | |
| Georgia Healthcare Group PLC(b)(c) | | | 292,028 | | | | 322,935 | |
| TBC Bank Group PLC | | | 167,585 | | | | 1,728,681 | |
| | | | | | | | 3,063,569 | |
| | | | | | | | | |
| Germany (3.71%) | | | | | | | | |
| Dermapharm Holding SE | | | 141,600 | | | | 6,710,455 | |
| Grand City Properties SA | | | 140,323 | | | | 2,937,075 | |
| GRENKE AG | | | 16,000 | | | | 1,122,155 | |
See Notes to Financial Statements.
| 46 | 1.855.377.7325 | www.GrandeurPeakGlobal.com |
| Grandeur Peak Global Opportunities Fund | Portfolio of Investments |
April 30, 2020
| | | Shares | | | Value (Note 2) | |
| Germany (continued) | | | | | | | | |
| Nexus AG | | | 90,624 | | | $ | 3,475,875 | |
| Norma Group SE | | | 124,668 | | | | 3,134,016 | |
| PATRIZIA AG | | | 106,513 | | | | 2,375,308 | |
| Wirecard AG | | | 11,400 | | | | 1,129,344 | |
| | | | | | | | 20,884,228 | |
| | | | | | | | | |
| Hong Kong (0.87%) | | | | | | | | |
| Jacobson Pharma Corp., Ltd.(c) | | | 6,534,000 | | | | 1,230,524 | |
| Value Partners Group, Ltd. | | | 9,083,000 | | | | 3,655,461 | |
| | | | | | | | 4,885,985 | |
| | | | | | | | | |
| India (4.25%) | | | | | | | | |
| Bajaj Finance, Ltd. | | | 123,250 | | | | 3,804,592 | |
| Cyient, Ltd. | | | 502,116 | | | | 1,526,842 | |
| Gulf Oil Lubricants India, Ltd. | | | 138,167 | | | | 1,090,782 | |
| L&T Technology Services, Ltd.(b)(c) | | | 106,700 | | | | 1,755,126 | |
| Metropolis Healthcare, Ltd.(b)(c) | | | 318,791 | | | | 5,360,163 | |
| Time Technoplast, Ltd. | | | 1,240,759 | | | | 564,244 | |
| WNS Holdings, Ltd., ADR(a) | | | 201,500 | | | | 9,843,275 | |
| | | | | | | | 23,945,024 | |
| | | | | | | | | |
| Indonesia (1.30%) | | | | | | | | |
| Arwana Citramulia Tbk PT | | | 58,214,800 | | | | 1,596,749 | |
| Selamat Sempurna Tbk PT | | | 55,561,200 | | | | 4,631,656 | |
| Ultrajaya Milk Industry & Trading Co. Tbk PT | | | 11,504,000 | | | | 1,067,262 | |
| | | | | | | | 7,295,667 | |
| | | | | | | | | |
| Ireland (1.96%) | | | | | | | | |
| ICON PLC, ADR(a) | | | 7,190 | | | | 1,153,779 | |
| Irish Residential Properties REIT PLC | | | 4,361,546 | | | | 6,156,150 | |
| Keywords Studios PLC | | | 185,207 | | | | 3,715,943 | |
| | | | | | | | 11,025,872 | |
| | | | | | | | | |
| Israel (0.52%) | | | | | | | | |
| Wix.com, Ltd.(a) | | | 22,187 | | | | 2,902,281 | |
| | | | | | | | | |
| Italy (2.02%) | | | | | | | | |
| DiaSorin SpA | | | 22,014 | | | | 3,746,479 | |
| FinecoBank Banca Fineco SpA | | | 200,993 | | | | 2,233,427 | |
| Interpump Group SpA | | | 163,595 | | | | 4,765,164 | |
| Piovan SpA(b)(c) | | | 144,291 | | | | 647,509 | |
| | | | | | | | 11,392,579 | |
| | | | | | | | | |
| Japan (9.99%) | | | | | | | | |
| AIT Corp. | | | 223,100 | | | | 1,552,958 | |
| BayCurrent Consulting, Inc. | | | 70,400 | | | | 4,034,478 | |
| Create SD Holdings Co., Ltd. | | | 170,100 | | | | 4,858,189 | |
| Future Corp. | | | 166,100 | | | | 2,205,586 | |
| gremz, Inc. | | | 21,200 | | | | 381,863 | |
| Japan Lifeline Co., Ltd. | | | 298,900 | | | | 3,551,204 | |
| | | Shares | | | Value (Note 2) | |
| Japan (continued) | | | | | | | | |
| M&A Capital Partners Co., Ltd.(a) | | | 83,000 | | | $ | 2,355,076 | |
| MarkLines Co., Ltd. | | | 53,200 | | | | 875,471 | |
| Medikit Co., Ltd. | | | 50,000 | | | | 1,605,088 | |
| MISUMI Group, Inc. | | | 102,600 | | | | 2,472,381 | |
| MonotaRO Co., Ltd. | | | 73,300 | | | | 2,370,135 | |
| Naigai Trans Line, Ltd. | | | 83,300 | | | | 870,918 | |
| Nihon M&A Center, Inc. | | | 132,900 | | | | 4,402,549 | |
| Open Door, Inc.(a) | | | 144,100 | | | | 1,302,493 | |
| Seria Co., Ltd. | | | 140,000 | | | | 4,565,997 | |
| Strike Co., Ltd. | | | 44,700 | | | | 1,834,818 | |
| Synchro Food Co., Ltd.(a) | | | 402,300 | | | | 1,083,397 | |
| Systena Corp. | | | 218,300 | | | | 3,112,324 | |
| Syuppin Co., Ltd. | | | 188,500 | | | | 1,291,036 | |
| Trancom Co., Ltd. | | | 69,670 | | | | 4,635,361 | |
| Tsuruha Holdings, Inc. | | | 29,000 | | | | 3,885,943 | |
| YAKUODO Holdings Co., Ltd. | | | 126,600 | | | | 3,014,145 | |
| | | | | | | | 56,261,410 | |
| | | | | | | | | |
| Mexico (0.67%) | | | | | | | | |
| Grupo Herdez SAB de CV | | | 2,041,000 | | | | 2,539,712 | |
| Regional SAB de CV(a) | | | 493,927 | | | | 1,213,862 | |
| | | | | | | | 3,753,574 | |
| | | | | | | | | |
| Netherlands (2.29%) | | | | | | | | |
| Aalberts NV | | | 173,222 | | | | 4,878,531 | |
| Just Eat Takeaway.com NV(a)(b)(c) | | | 33,600 | | | | 3,425,062 | |
| Shop Apotheke Europe NV(a)(b)(c) | | | 62,322 | | | | 4,603,139 | |
| | | | | | | | 12,906,732 | |
| | | | | | | | | |
| New Zealand (0.00%)(d) | | | | | | | | |
| CBL Corp., Ltd.(a)(e) | | | 1,107,672 | | | | 1 | |
| | | | | | | | | |
| Norway (0.91%) | | | | | | | | |
| Medistim ASA | | | 76,500 | | | | 1,299,262 | |
| Nordic Semiconductor ASA(a) | | | 114,100 | | | | 672,680 | |
| Sbanken ASA(a)(b)(c) | | | 588,410 | | | | 3,141,617 | |
| | | | | | | | 5,113,559 | |
| | | | | | | | | |
| Philippines (1.08%) | | | | | | | | |
| Concepcion Industrial Corp. | | | 1,035,152 | | | | 492,831 | |
| Puregold Price Club, Inc. | | | 5,246,800 | | | | 4,819,021 | |
| Wilcon Depot, Inc. | | | 2,717,500 | | | | 792,447 | |
| | | | | | | | 6,104,299 | |
| | | | | | | | | |
| Poland (0.82%) | | | | | | | | |
| Dino Polska SA(a)(b)(c) | | | 100,797 | | | | 4,241,987 | |
| PGS Software SA(a) | | | 120,487 | | | | 358,662 | |
| | | | | | | | 4,600,649 | |
See Notes to Financial Statements.
| Annual Report | April 30, 2020 | 47 |
| Grandeur Peak Global Opportunities Fund | Portfolio of Investments |
April 30, 2020
| | | Shares | | | Value (Note 2) | |
| Singapore (0.54%) | | | | | | | | |
| Riverstone Holdings, Ltd./Singapore | | | 3,665,000 | | | $ | 3,040,847 | |
| | | | | | | | | |
| South Africa (0.17%) | | | | | | | | |
| Italtile, Ltd. | | | 1,791,241 | | | | 965,418 | |
| | | | | | | | | |
| South Korea (1.16%) | | | | | | | | |
| LEENO Industrial, Inc. | | | 66,801 | | | | 4,895,834 | |
| Tokai Carbon Korea Co., Ltd. | | | 27,372 | | | | 1,617,452 | |
| | | | | | | | 6,513,286 | |
| | | | | | | | | |
| Sweden (1.24%) | | | | | | | | |
| Beijer Alma AB | | | 70,520 | | | | 680,933 | |
| EQT AB(a) | | | 137,100 | | | | 1,916,873 | |
| KNOW IT AB(a) | | | 112,310 | | | | 1,678,485 | |
| Nibe Industrier AB, Class B | | | 120,000 | | | | 2,249,147 | |
| OEM International AB, Class B(a) | | | 21,488 | | | | 447,130 | |
| | | | | | | | 6,972,568 | |
| | | | | | | | | |
| Switzerland (0.40%) | | | | | | | | |
| Partners Group Holding AG | | | 2,850 | | | | 2,243,388 | |
| | | | | | | | | |
| Taiwan (2.44%) | | | | | | | | |
| ASPEED Technology, Inc. | | | 36,500 | | | | 1,460,663 | |
| Bioteque Corp. | | | 1,055,000 | | | | 4,062,264 | |
| Poya International Co., Ltd. | | | 190,000 | | | | 3,194,727 | |
| Sporton International, Inc. | | | 672,671 | | | | 4,467,658 | |
| Voltronic Power Technology Corp. | | | 22,000 | | | | 525,280 | |
| | | | | | | | 13,710,592 | |
| | | | | | | | | |
| Turkey (0.04%) | | | | | | | | |
| DP Eurasia NV(a)(b)(c) | | | 403,911 | | | | 247,748 | |
| | | | | | | | | |
| United Arab Emirates (0.26%) | | | | | | | | |
| Aramex PJSC | | | 1,794,645 | | | | 1,475,526 | |
| | | | | | | | | |
| United States (27.80%) | | | | | | | | |
| Apollo Global Management, Inc., Class A | | | 37,900 | | | | 1,534,571 | |
| Bank of NT Butterfield & Son, Ltd. | | | 123,225 | | | | 2,712,182 | |
| BioDelivery Sciences International, Inc.(a) | | | 213,132 | | | | 971,882 | |
| CDW Corp. | | | 7,325 | | | | 811,610 | |
| CH Robinson Worldwide, Inc. | | | 15,700 | | | | 1,113,130 | |
| EPAM Systems, Inc.(a) | | | 60,075 | | | | 13,269,967 | |
| Esquire Financial Holdings, Inc.(a) | | | 17,086 | | | | 280,552 | |
| Etsy, Inc.(a) | | | 25,850 | | | | 1,676,890 | |
| ExlService Holdings, Inc.(a) | | | 56,475 | | | | 3,486,202 | |
| Fastenal Co. | | | 66,250 | | | | 2,399,575 | |
| First Republic Bank | | | 59,976 | | | | 6,254,897 | |
| Five Below, Inc.(a) | | | 40,192 | | | | 3,623,711 | |
| | | Shares | | | Value (Note 2) | |
| United States (continued) | | | | | | | | |
| Genpact, Ltd. | | | 201,300 | | | $ | 6,930,759 | |
| Hamilton Lane, Inc., Class A | | | 23,117 | | | | 1,499,137 | |
| Heska Corp.(a) | | | 103,013 | | | | 7,293,320 | |
| Houlihan Lokey, Inc. | | | 9,475 | | | | 562,626 | |
| HubSpot, Inc.(a) | | | 2,000 | | | | 337,260 | |
| IDEXX Laboratories, Inc.(a) | | | 6,675 | | | | 1,852,980 | |
| Inphi Corp.(a) | | | 51,375 | | | | 4,959,743 | |
| Joint Corp.(a) | | | 50,342 | | | | 609,138 | |
| Knight-Swift Transportation Holdings, Inc. | | | 30,686 | | | | 1,140,905 | |
| LeMaitre Vascular, Inc. | | | 58,100 | | | | 1,655,269 | |
| Littelfuse, Inc. | | | 16,350 | | | | 2,374,674 | |
| Lululemon Athletica, Inc.(a) | | | 33,255 | | | | 7,431,827 | |
| Microchip Technology, Inc. | | | 60,845 | | | | 5,337,932 | |
| Moelis & Co., Class A | | | 18,400 | | | | 549,608 | |
| Monolithic Power Systems, Inc. | | | 7,975 | | | | 1,594,282 | |
| Monro, Inc. | | | 35,800 | | | | 1,986,542 | |
| New Relic, Inc.(a) | | | 71,825 | | | | 3,856,284 | |
| NV5 Global, Inc.(a) | | | 59,875 | | | | 2,799,156 | |
| Old Dominion Freight Line, Inc. | | | 9,975 | | | | 1,449,268 | |
| Paycom Software, Inc.(a) | | | 22,075 | | | | 5,762,017 | |
| Paylocity Holding Corp.(a) | | | 5,600 | | | | 641,368 | |
| PJT Partners, Inc., Class A | | | 35,275 | | | | 1,715,776 | |
| Pluralsight, Inc., Class A(a) | | | 288,039 | | | | 4,735,361 | |
| Power Integrations, Inc. | | | 150,704 | | | | 15,424,554 | |
| PPD, Inc.(a) | | | 53,250 | | | | 1,272,675 | |
| Qualys, Inc.(a) | | | 81,830 | | | | 8,628,155 | |
| Rapid7, Inc.(a) | | | 32,950 | | | | 1,500,873 | |
| Revolve Group, Inc.(a) | | | 215,320 | | | | 2,366,367 | |
| Silicon Laboratories, Inc.(a) | | | 33,430 | | | | 3,250,065 | |
| STAAR Surgical Co.(a) | | | 61,800 | | | | 2,368,176 | |
| SVB Financial Group(a) | | | 18,075 | | | | 3,491,548 | |
| Systemax, Inc. | | | 172,904 | | | | 3,433,873 | |
| Terreno Realty Corp. | | | 20,100 | | | | 1,101,882 | |
| Texas Roadhouse, Inc. | | | 20,575 | | | | 968,877 | |
| TriMas Corp.(a) | | | 72,105 | | | | 1,718,983 | |
| Ulta Beauty, Inc.(a) | | | 9,950 | | | | 2,168,304 | |
| Veracyte, Inc.(a) | | | 45,228 | | | | 1,219,799 | |
| Virtusa Corp.(a) | | | 71,800 | | | | 2,369,400 | |
| | | | | | | | 156,493,932 | |
| | | | | | | | | |
| Vietnam (1.17%) | | | | | | | | |
| Vietnam Dairy Products JSC | | | 644,470 | | | | 2,723,229 | |
| Vietnam Technological & Commercial Joint Stock Bank(a) | | | 5,188,364 | | | | 3,808,949 | |
| Vincom Retail JSC | | | 34,650 | | | | 34,163 | |
| | | | | | | | 6,566,341 | |
| | | | | | | | | |
| TOTAL COMMON STOCKS | | | | | | | | |
| (Cost $445,256,811) | | | | | | | 551,725,800 | |
See Notes to Financial Statements.
| 48 | 1.855.377.7325 | www.GrandeurPeakGlobal.com |
| Grandeur Peak Global Opportunities Fund | Portfolio of Investments |
| | | Shares | | | Value (Note 2) | |
| PREFERRED STOCKS (0.36%) | | | | | | | | |
| United States (0.36%) | | | | | | | | |
| Dataminr, Inc.(a)(e) | | | 96,640 | | | $ | 2,022,675 | |
| | | | | | | | | |
| TOTAL PREFERRED STOCKS | | | | | | | | |
| (Cost $1,923,136) | | | | | | | 2,022,675 | |
| | | | | | | | | |
| TOTAL INVESTMENTS (98.36%) | | | | | | | | |
| (Cost $447,179,947) | | | | | | $ | 553,748,475 | |
| | | | | | | | | |
| Other Assets In Excess Of Liabilities (1.64%) | | | | | | | 9,237,038 | |
| | | | | | | | | |
| NET ASSETS (100.00%) | | | | | | $ | 562,985,513 | |
| (a) | Non-Income Producing Security. |
| (b) | Security exempt from registration under Rule 144A of the Securities Act of 1933. These securities may be resold in the ordinary course of business in transactions exempt from registration, normally to qualified institutional buyers. As of April 30, 2020, these securities had a total aggregate market value of $40,617,747, representing 7.21% of net assets. |
| (c) | Security was purchased pursuant to Regulation S under the Securities Act of 1933, which exempts securities offered and sold outside of the United States from registration. Such security cannot be sold in the United States without either an effective registration statement filed pursuant to the Securities Act of 1933, or pursuant to an exemption from registration. As of April 30, 2020, the aggregate market value of these securities was $47,914,546, representing 8.51% of net assets. |
| (e) | As a result of the use of significant unobservable inputs to determine fair value, these investments have been classified as level 3 assets. See also Note 2 to the financial statements for additional information. |
For Fund compliance purposes, the Fund's geographical classifications refer to any one or more of the country sub-classifications used by one or more widely recognized market indexes or ratings group indexes, and/or as defined by Fund management. This definition may not apply for purposes of this report, which may combine sub-classifications for reporting ease. Geographical regions are shown as a percentage of net assets.
See Notes to Financial Statements.
| Annual Report | April 30, 2020 | 49 |
| Grandeur Peak Global Reach Fund | Portfolio of Investments |
April 30, 2020
| | | Shares | | | Value (Note 2) | |
| COMMON STOCKS (95.83%) | | | | | | | | |
| Argentina (0.56%) | | | | | | | | |
| Globant SA(a) | | | 11,638 | | | $ | 1,346,167 | |
| | | | | | | | | |
| Australia (3.75%) | | | | | | | | |
| Appen, Ltd. | | | 55,042 | | | | 926,471 | |
| Australian Ethical Investment, Ltd. | | | 381,415 | | | | 1,158,236 | |
| Corporate Travel | | | | | | | | |
| Management, Ltd. | | | 74,881 | | | | 619,710 | |
| Domino's Pizza Enterprises, Ltd. | | | 7,200 | | | | 272,363 | |
| EQT Holdings, Ltd. | | | 33,583 | | | | 470,513 | |
| Kogan.com, Ltd. | | | 241,047 | | | | 1,255,052 | |
| Lycopodium, Ltd. | | | 121,976 | | | | 349,736 | |
| Mainstream Group Holdings, Ltd. | | | 1,775,618 | | | | 457,046 | |
| National Storage REIT | | | 1,086,807 | | | | 1,228,755 | |
| Netwealth Group, Ltd. | | | 120,026 | | | | 593,650 | |
| People Infrastructure, Ltd. | | | 535,930 | | | | 628,628 | |
| Temple & Webster Group, Ltd.(a) | | | 430,651 | | | | 1,094,469 | |
| | | | | | | | 9,054,629 | |
| | | | | | | | | |
| Belgium (0.55%) | | | | | | | | |
| Melexis NV | | | 9,497 | | | | 578,127 | |
| Warehouses De Pauw CVA | | | 27,200 | | | | 745,181 | |
| | | | | | | | 1,323,308 | |
| | | | | | | | | |
| Brazil (1.75%) | | | | | | | | |
| Arco Platform, Ltd., Class A(a) | | | 17,950 | | | | 901,449 | |
| Fleury SA | | | 167,500 | | | | 699,829 | |
| Locaweb Servicos de Internet SA(a)(b)(c) | | | 123,300 | | | | 527,628 | |
| Pagseguro Digital, Ltd., Class A(a) | | | 58,450 | | | | 1,480,539 | |
| Raia Drogasil SA | | | 32,300 | | | | 625,876 | |
| | | | | | | | 4,235,321 | |
| | | | | | | | | |
| Britain (12.95%) | | | | | | | | |
| AB Dynamics PLC | | | 57,576 | | | | 1,305,299 | |
| Abcam PLC | | | 43,900 | | | | 702,205 | |
| Ascential PLC(b)(c) | | | 101,100 | | | | 322,157 | |
| B&M European Value Retail SA | | | 487,900 | | | | 2,045,079 | |
| Big Yellow Group PLC | | | 61,600 | | | | 831,709 | |
| boohoo Group PLC(a) | | | 409,800 | | | | 1,667,134 | |
| Clinigen Group PLC | | | 35,700 | | | | 324,639 | |
| Curtis Banks Group PLC | | | 234,100 | | | | 807,882 | |
| CVS Group PLC | | | 85,400 | | | | 984,181 | |
| Dechra Pharmaceuticals PLC | | | 54,700 | | | | 1,908,372 | |
| Diploma PLC | | | 18,500 | | | | 401,936 | |
| dotdigital group PLC | | | 1,089,556 | | | | 1,379,150 | |
| Endava PLC, ADR(a) | | | 54,998 | | | | 2,407,262 | |
| FDM Group Holdings PLC | | | 34,600 | | | | 325,967 | |
| First Derivatives PLC | | | 14,850 | | | | 484,420 | |
| | | Shares | | | Value (Note 2) | |
| Britain (continued) | | | | | | | | |
| Gamma Communications PLC | | | 39,000 | | | $ | 655,755 | |
| Horizon Discovery Group PLC(a) | | | 281,550 | | | | 368,795 | |
| Impax Asset Management Group PLC | | | 439,565 | | | | 2,012,442 | |
| Intermediate Capital Group PLC | | | 47,723 | | | | 678,005 | |
| Intertek Group PLC | | | 9,700 | | | | 580,312 | |
| JTC PLC(b)(c) | | | 325,942 | | | | 1,699,560 | |
| K3 Capital Group PLC | | | 170,800 | | | | 390,445 | |
| On the Beach Group PLC(b)(c) | | | 464,800 | | | | 1,627,447 | |
| Oxford Immunotec Global PLC(a) | | | 87,600 | | | | 1,091,496 | |
| Rotork PLC | | | 160,979 | | | | 504,041 | |
| Sabre Insurance Group PLC(b)(c) | | | 139,371 | | | | 495,014 | |
| Sanne Group PLC | | | 278,378 | | | | 2,271,987 | |
| Softcat PLC | | | 55,938 | | | | 796,125 | |
| St. James's Place PLC | | | 34,138 | | | | 366,073 | |
| Volution Group PLC | | | 244,347 | | | | 507,793 | |
| XPS Pensions Group PLC(c) | | | 944,516 | | | | 1,308,573 | |
| | | | | | | | 31,251,255 | |
| | | | | | | | | |
| Canada (1.39%) | | | | | | | | |
| Badger Daylighting, Ltd. | | | 23,800 | | | | 517,224 | |
| Richelieu Hardware, Ltd. | | | 25,000 | | | | 474,873 | |
| Ritchie Bros Auctioneers, Inc. | | | 28,230 | | | | 1,216,431 | |
| StorageVault Canada, Inc. | | | 531,600 | | | | 1,157,188 | |
| | | | | | | | 3,365,716 | |
| | | | | | | | | |
| China (6.24%) | | | | | | | | |
| 58.com, Inc., ADR(a) | | | 9,925 | | | | 515,604 | |
| BBI Life Sciences Corp.(c) | | | 7,532,500 | | | | 3,303,515 | |
| CSPC Pharmaceutical Group, Ltd. | | | 301,000 | | | | 597,923 | |
| HUYA, Inc., ADR(a) | | | 21,488 | | | | 348,750 | |
| Koolearn Technology Holding, Ltd.(a)(b)(c) | | | 113,000 | | | | 549,513 | |
| Man Wah Holdings, Ltd. | | | 1,608,400 | | | | 927,384 | |
| O2Micro International, Ltd., ADR(a) | | | 292,039 | | | | 388,412 | |
| Silergy Corp. | | | 98,925 | | | | 3,975,430 | |
| Suofeiya Home Collection Co., Ltd., Class A | | | 203,500 | | | | 543,948 | |
| TK Group Holdings, Ltd. | | | 1,720,000 | | | | 539,129 | |
| Trip.com Group, Ltd., ADR(a) | | | 13,250 | | | | 341,320 | |
| WuXi AppTec Co., Ltd., Class H(b)(c) | | | 138,400 | | | | 1,954,828 | |
| Yum China Holdings, Inc. | | | 21,975 | | | | 1,064,909 | |
| | | | | | | | 15,050,665 | |
| | | | | | | | | |
| Colombia (1.02%) | | | | | | | | |
| Parex Resources, Inc.(a) | | | 224,361 | | | | 2,459,678 | |
See Notes to Financial Statements.
| 50 | 1.855.377.7325 | www.GrandeurPeakGlobal.com |
| Grandeur Peak Global Reach Fund | Portfolio of Investments |
April 30, 2020
| | | Shares | | | Value (Note 2) | |
| Egypt (0.35%) | | | | | | | | |
| African Export-Import Bank, GDR | | | 200,000 | | | $ | 635,000 | |
| Integrated Diagnostics Holdings PLC(b)(c) | | | 62,237 | | | | 200,403 | |
| | | | | | | | 835,403 | |
| | | | | | | | | |
| Finland (0.34%) | | | | | | | | |
| Musti Group Oyj(a) | | | 67,400 | | | | 819,853 | |
| | | | | | | | | |
| France (2.66%) | | | | | | | | |
| Alten SA | | | 10,400 | | | | 748,775 | |
| BioMerieux | | | 4,900 | | | | 608,385 | |
| Bureau Veritas SA | | | 27,262 | | | | 565,836 | |
| Esker SA | | | 21,509 | | | | 2,512,640 | |
| Infotel SA | | | 9,960 | | | | 363,460 | |
| Neurones | | | 17,282 | | | | 369,302 | |
| Thermador Groupe | | | 25,708 | | | | 1,248,030 | |
| | | | | | | | 6,416,428 | |
| | | | | | | | | |
| Georgia (0.13%) | | | | | | | | |
| Georgia Healthcare Group PLC(b)(c) | | | 284,198 | | | | 314,276 | |
| | | | | | | | | |
| Germany (2.71%) | | | | | | | | |
| CANCOM SE | | | 13,300 | | | | 678,023 | |
| Dermapharm Holding SE | | | 17,100 | | | | 810,373 | |
| FUCHS PETROLUB SE | | | 5,500 | | | | 213,724 | |
| Grand City Properties SA | | | 56,900 | | | | 1,190,963 | |
| Nexus AG | | | 16,985 | | | | 651,458 | |
| Norma Group SE | | | 13,460 | | | | 338,370 | |
| PATRIZIA AG | | | 65,604 | | | | 1,463,011 | |
| Puma SE | | | 13,300 | | | | 836,306 | |
| Wirecard AG | | | 3,621 | | | | 358,715 | |
| | | | | | | | 6,540,943 | |
| | | | | | | | | |
| Greece (0.70%) | | | | | | | | |
| Sarantis SA | | | 199,040 | | | | 1,701,327 | |
| | | | | | | | | |
| Hong Kong (1.43%) | | | | | | | | |
| Jacobson Pharma Corp., Ltd.(c) | | | 4,737,000 | | | | 892,102 | |
| Plover Bay Technologies, Ltd.(c) | | | 3,254,000 | | | | 428,130 | |
| Techtronic Industries Co., Ltd. | | | 121,000 | | | | 921,645 | |
| Vitasoy International Holdings, Ltd. | | | 336,000 | | | | 1,209,210 | |
| | | | | | | | 3,451,087 | |
| | | | | | | | | |
| India (4.63%) | | | | | | | | |
| Bajaj Finance, Ltd. | | | 26,600 | | | | 821,113 | |
| Essel Propack, Ltd. | | | 441,000 | | | | 1,056,767 | |
| Gulf Oil Lubricants India, Ltd. | | | 85,300 | | | | 673,415 | |
| HDFC Bank, Ltd. | | | 38,000 | | | | 506,937 | |
| IndiaMart InterMesh, Ltd.(b)(c)(c) | | | 18,969 | | | | 567,731 | |
| | | Shares | | | Value (Note 2) | |
| India (continued) | | | | | | |
| L&T Technology Services, Ltd.(b)(c) | | | 21,000 | | | $ | 345,432 | |
| Metropolis Healthcare, Ltd.(b)(c) | | | 93,050 | | | | 1,564,546 | |
| Poly Medicure, Ltd. | | | 138,226 | | | | 417,835 | |
| TCI Express, Ltd. | | | 84,959 | | | | 799,301 | |
| Time Technoplast, Ltd. | | | 712,756 | | | | 324,131 | |
| Vaibhav Global, Ltd. | | | 55,876 | | | | 714,345 | |
| Westlife Development, Ltd.(a) | | | 126,000 | | | | 524,168 | |
| WNS Holdings, Ltd., ADR(a) | | | 58,450 | | | | 2,855,283 | |
| | | | | | | | 11,171,004 | |
| | | | | | | | | |
| Indonesia (1.82%) | | | | | | | | |
| Arwana Citramulia Tbk PT | | | 26,137,200 | | | | 716,906 | |
| Bank Central Asia Tbk PT | | | 293,500 | | | | 510,049 | |
| Bank Tabungan Pensiunan Nasional Syariah Tbk PT | | | 3,448,500 | | | | 507,712 | |
| Hexindo Adiperkasa Tbk PT | | | 1,636,900 | | | | 286,114 | |
| Selamat Sempurna Tbk PT | | | 22,307,600 | | | | 1,859,591 | |
| Ultrajaya Milk Industry & Trading Co. Tbk PT | | | 5,474,800 | | | | 507,914 | |
| | | | | | | | 4,388,286 | |
| | | | | | | | | |
| Ireland (1.60%) | | | | | | | | |
| ICON PLC, ADR(a) | | | 5,825 | | | | 934,738 | |
| Irish Residential Properties REIT PLC | | | 871,726 | | | | 1,230,407 | |
| Keywords Studios PLC | | | 35,300 | | | | 708,250 | |
| Uniphar PLC | | | 626,500 | | | | 995,501 | |
| | | | | | | | 3,868,896 | |
| | | | | | | | | |
| Israel (0.90%) | | | | | | | | |
| Wix.com, Ltd.(a) | | | 16,527 | | | | 2,161,897 | |
| | | | | | | | | |
| Italy (1.16%) | | | | | | | | |
| DiaSorin SpA | | | 3,479 | | | | 592,078 | |
| FinecoBank Banca Fineco SpA | | | 45,222 | | | | 502,505 | |
| Freni Brembo SpA | | | 43,093 | | | | 366,692 | |
| Interpump Group SpA | | | 24,807 | | | | 722,573 | |
| Piovan SpA(b)(c) | | | 138,608 | | | | 622,007 | |
| | | | | | | | 2,805,855 | |
| | | | | | | | | |
| Japan (6.71%) | | | | | | | | |
| AIT Corp. | | | 64,700 | | | | 450,365 | |
| BayCurrent Consulting, Inc. | | | 26,100 | | | | 1,495,737 | |
| eGuarantee, Inc. | | | 13,100 | | | | 232,666 | |
| Funai Soken Holdings, Inc. | | | 15,500 | | | | 334,511 | |
| Future Corp. | | | 69,300 | | | | 920,212 | |
| gremz, Inc. | | | 45,200 | | | | 814,160 | |
| Japan Lifeline Co., Ltd. | | | 46,300 | | | | 550,086 | |
| MarkLines Co., Ltd. | | | 24,800 | | | | 408,114 | |
| Medikit Co., Ltd. | | | 17,900 | | | | 574,621 | |
| MISUMI Group, Inc. | | | 28,000 | | | | 674,724 | |
| MonotaRO Co., Ltd. | | | 33,000 | | | | 1,067,046 | |
| Naigai Trans Line, Ltd. | | | 68,150 | | | | 712,522 | |
See Notes to Financial Statements.
| Annual Report | April 30, 2020 | 51 |
| Grandeur Peak Global Reach Fund | Portfolio of Investments |
April 30, 2020
| | | Shares | | | Value (Note 2) | |
| Japan (continued) | | | | | | | | |
| Nihon M&A Center, Inc. | | | 39,200 | | | $ | 1,298,570 | |
| Open Door, Inc.(a) | | | 83,700 | | | | 756,548 | |
| Seria Co., Ltd. | | | 18,100 | | | | 590,318 | |
| Synchro Food Co., Ltd.(a) | | | 113,400 | | | | 305,387 | |
| System Information Co., Ltd. | | | 49,100 | | | | 381,124 | |
| Systena Corp. | | | 51,200 | | | | 729,963 | |
| Syuppin Co., Ltd. | | | 50,400 | | | | 345,189 | |
| Trancom Co., Ltd. | | | 17,000 | | | | 1,131,063 | |
| Tsuruha Holdings, Inc. | | | 3,800 | | | | 509,193 | |
| Vega Corp. Co., Ltd.(a) | | | 77,600 | | | | 663,810 | |
| YAKUODO Holdings Co., Ltd. | | | 31,100 | | | | 740,442 | |
| YAMADA Consulting Group Co., Ltd. | | | 48,300 | | | | 507,237 | |
| | | | | | | | 16,193,608 | |
| | | | | | | | | |
| Mexico (0.17%) | | | | | | | | |
| Grupo Herdez SAB de CV | | | 235,790 | | | | 293,404 | |
| Regional SAB de CV(a) | | | 47,157 | | | | 115,892 | |
| | | | | | | | 409,296 | |
| | | | | | | | | |
| Netherlands (1.15%) | | | | | | | | |
| Aalberts NV | | | 46,082 | | | | 1,297,828 | |
| Just Eat Takeaway.com NV(a)(b)(c) | | | 5,000 | | | | 509,682 | |
| Shop Apotheke Europe NV(a)(b)(c) | | | 13,200 | | | | 974,960 | |
| | | | | | | | 2,782,470 | |
| | | | | | | | | |
| New Zealand (0.40%) | | | | | | | | |
| CBL Corp., Ltd.(a)(d) | | | 819,006 | | | | 0 | |
| NZX, Ltd. | | | 1,230,372 | | | | 966,111 | |
| | | | | | | | 966,111 | |
| | | | | | | | | |
| Norway (1.10%) | | | | | | | | |
| Infront ASA(a) | | | 190,066 | | | | 356,198 | |
| Medistim ASA | | | 12,841 | | | | 218,089 | |
| Nordic Semiconductor ASA(a) | | | 11,845 | | | | 69,832 | |
| Sbanken ASA(a)(b)(c) | | | 45,900 | | | | 245,068 | |
| Self Storage Group ASA(a) | | | 694,169 | | | | 1,761,670 | |
| | | | | | | | 2,650,857 | |
| | | | | | | | | |
| Philippines (1.73%) | | | | | | | | |
| Concepcion Industrial Corp. | | | 1,793,920 | | | | 854,078 | |
| Pryce Corp. | | | 6,894,800 | | | | 574,452 | |
| Puregold Price Club, Inc. | | | 992,700 | | | | 911,764 | |
| Wilcon Depot, Inc. | | | 6,270,400 | | | | 1,828,504 | |
| | | | | | | | 4,168,798 | |
| | | | | | | | | |
| Poland (1.11%) | | | | | | | | |
| Dino Polska SA(a)(b)(c) | | | 53,018 | | | | 2,231,234 | |
| LiveChat Software SA | | | 31,404 | | | | 450,380 | |
| | | | | | | | 2,681,614 | |
| | | | | | | | | |
| South Africa (0.62%) | | | | | | | | |
| ARB Holdings, Ltd. | | | 2,093,266 | | | | 338,799 | |
| | | Shares | | | Value (Note 2) | |
| South Africa (continued) | | | | | | | | |
| Clicks Group, Ltd. | | | 63,800 | | | $ | 794,114 | |
| Italtile, Ltd. | | | 665,000 | | | | 358,412 | |
| | | | | | | | 1,491,325 | |
| | | | | | | | | |
| South Korea (0.61%) | | | | | | | | |
| LEENO Industrial, Inc. | | | 6,000 | | | | 439,739 | |
| LG Household & Health Care, Ltd. | | | 383 | | | | 435,666 | |
| Tokai Carbon Korea Co., Ltd. | | | 10,000 | | | | 590,915 | |
| | | | | | | | 1,466,320 | |
| | | | | | | | | |
| Spain (0.00%)(e) | | | | | | | | |
| Let's GOWEX SA(a)(d) | | | 10,700 | | | | 0 | |
| | | | | | | | | |
| Sweden (3.00%) | | | | | | | | |
| Epiroc AB, Class B | | | 63,300 | | | | 628,218 | |
| EQT AB(a) | | | 119,500 | | | | 1,670,797 | |
| Hexpol AB(a) | | | 39,100 | | | | 285,564 | |
| KNOW IT AB(a) | | | 74,700 | | | | 1,116,400 | |
| Nibe Industrier AB, Class B | | | 32,200 | | | | 603,521 | |
| OEM International AB, Class B(a) | | | 13,943 | | | | 290,131 | |
| Sagax AB, Class A | | | 47,309 | | | | 540,705 | |
| SwedenCare AB | | | 134,004 | | | | 1,233,490 | |
| Vitec Software Group AB, Class B | | | 46,200 | | | | 876,103 | |
| | | | | | | | 7,244,929 | |
| | | | | | | | | |
| Switzerland (0.50%) | | | | | | | | |
| Partners Group Holding AG | | | 1,542 | | | | 1,213,791 | |
| | | | | | | | | |
| Taiwan (2.88%) | | | | | | | | |
| ASPEED Technology, Inc. | | | 6,000 | | | | 240,109 | |
| Bioteque Corp. | | | 243,000 | | | | 935,668 | |
| FineTek Co., Ltd. | | | 155,400 | | | | 369,994 | |
| Pacific Hospital Supply Co., Ltd. | | | 324,000 | | | | 870,566 | |
| Poya International Co., Ltd. | | | 98,000 | | | | 1,647,807 | |
| Sporton International, Inc. | | | 192,859 | | | | 1,280,906 | |
| Test Research, Inc. | | | 409,440 | | | | 714,608 | |
| TSC Auto ID Technology Co., Ltd. | | | 52,060 | | | | 356,270 | |
| Voltronic Power Technology Corp. | | | 21,950 | | | | 524,086 | |
| | | | | | | | 6,940,014 | |
| | | | | | | | | |
| Thailand (0.31%) | | | | | | | | |
| TOA Paint Thailand PCL | | | 643,000 | | | | 745,248 | |
| | | | | | | | | |
| United Arab Emirates (0.54%) | | | | | | | | |
| Aramex PJSC | | | 1,593,033 | | | | 1,309,764 | |
| | | | | | | | | |
| United States (26.88%) | | | | | | | | |
| 8x8, Inc.(a) | | | 44,525 | | | | 755,144 | |
| ABIOMED, Inc.(a) | | | 1,425 | | | | 272,531 | |
See Notes to Financial Statements.
| 52 | 1.855.377.7325 | www.GrandeurPeakGlobal.com |
| Grandeur Peak Global Reach Fund | Portfolio of Investments |
April 30, 2020
| | | Shares | | | Value (Note 2) | |
| United States (continued) | | | | | | | | |
| Accenture PLC, Class A | | | 1,375 | | | $ | 254,636 | |
| Amazon.com, Inc.(a) | | | 507 | | | | 1,254,318 | |
| Apollo Global Management, Inc., Class A | | | 62,425 | | | | 2,527,588 | |
| Bank of NT Butterfield & Son, Ltd. | | | 11,750 | | | | 258,618 | |
| BioDelivery Sciences International, Inc.(a) | | | 155,975 | | | | 711,246 | |
| Blackline, Inc.(a) | | | 15,275 | | | | 927,803 | |
| Blackstone Group, Inc., Class A | | | 34,800 | | | | 1,817,952 | |
| Cactus, Inc., Class A | | | 27,025 | | | | 480,504 | |
| Castle Biosciences, Inc.(a) | | | 7,600 | | | | 235,068 | |
| CBOE Holdings, Inc. | | | 2,420 | | | | 240,500 | |
| CH Robinson Worldwide, Inc. | | | 7,135 | | | | 505,871 | |
| CoreSite Realty Corp. | | | 13,425 | | | | 1,626,976 | |
| DexCom, Inc.(a) | | | 950 | | | | 318,440 | |
| Edwards Lifesciences Corp.(a) | | | 1,425 | | | | 309,937 | |
| EPAM Systems, Inc.(a) | | | 15,925 | | | | 3,517,673 | |
| Equinix, Inc. | | | 2,425 | | | | 1,637,360 | |
| Esquire Financial Holdings, Inc.(a) | | | 22,387 | | | | 367,595 | |
| Etsy, Inc.(a) | | | 20,643 | | | | 1,339,111 | |
| ExlService Holdings, Inc.(a) | | | 16,950 | | | | 1,046,323 | |
| Fastenal Co. | | | 35,782 | | | | 1,296,024 | |
| Fastly, Inc., Class A(a) | | | 27,500 | | | | 595,375 | |
| First Republic Bank | | | 27,200 | | | | 2,836,688 | |
| Five Below, Inc.(a) | | | 7,294 | | | | 657,627 | |
| Freshpet, Inc.(a) | | | 6,725 | | | | 507,132 | |
| Frontage Holdings Corp.(a)(b)(c) | | | 685,000 | | | | 313,673 | |
| Genpact, Ltd. | | | 50,225 | | | | 1,729,247 | |
| Goosehead Insurance, Inc., Class A(a) | | | 10,685 | | | | 599,856 | |
| Hackett Group, Inc. | | | 16,400 | | | | 243,212 | |
| Hannon Armstrong Sustainable Infrastructure Capital, Inc. | | | 4,525 | | | | 126,655 | |
| HD Supply Holdings, Inc.(a) | | | 25,750 | | | | 764,260 | |
| HealthEquity, Inc.(a) | | | 8,000 | | | | 450,160 | |
| HEICO Corp., Class A | | | 4,100 | | | | 296,553 | |
| Heska Corp.(a) | | | 13,075 | | | | 925,710 | |
| Houlihan Lokey, Inc. | | | 14,375 | | | | 853,587 | |
| HubSpot, Inc.(a) | | | 1,600 | | | | 269,808 | |
| I3 Verticals, Inc., Class A(a) | | | 19,550 | | | | 454,342 | |
| IDEXX Laboratories, Inc.(a) | | | 2,600 | | | | 721,760 | |
| Inphi Corp.(a) | | | 11,950 | | | | 1,153,653 | |
| Intersect ENT, Inc.(a) | | | 21,650 | | | | 248,542 | |
| Joint Corp.(a) | | | 21,075 | | | | 255,008 | |
| Kinsale Capital Group, Inc. | | | 4,700 | | | | 510,514 | |
| LeMaitre Vascular, Inc. | | | 13,975 | | | | 398,148 | |
| LGI Homes, Inc.(a) | | | 10,500 | | | | 636,090 | |
| Littelfuse, Inc. | | | 3,100 | | | | 450,244 | |
| Lululemon Athletica, Inc.(a) | | | 6,915 | | | | 1,545,364 | |
| Medallia, Inc.(a) | | | 13,375 | | | | 287,295 | |
| Medpace Holdings, Inc.(a) | | | 2,950 | | | | 235,587 | |
| Microchip Technology, Inc. | | | 9,000 | | | | 789,570 | |
| | | Shares | | | Value (Note 2) | |
| United States (continued) | | | | | | | | |
| Mimecast, Ltd.(a) | | | 6,410 | | | $ | 262,169 | |
| Moelis & Co., Class A | | | 20,375 | | | | 608,601 | |
| Monolithic Power Systems, Inc. | | | 1,650 | | | | 329,852 | |
| MSCI, Inc. | | | 745 | | | | 243,615 | |
| New Relic, Inc.(a) | | | 33,420 | | | | 1,794,320 | |
| NV5 Global, Inc.(a) | | | 22,500 | | | | 1,051,875 | |
| NVIDIA Corp. | | | 1,175 | | | | 343,429 | |
| Old Dominion Freight Line, Inc. | | | 3,337 | | | | 484,833 | |
| Paycom Software, Inc.(a) | | | 6,178 | | | | 1,612,582 | |
| Paylocity Holding Corp.(a) | | | 6,250 | | | | 715,813 | |
| PJT Partners, Inc., Class A | | | 32,850 | | | | 1,597,824 | |
| Pluralsight, Inc., Class A(a) | | | 108,264 | | | | 1,779,860 | |
| Power Integrations, Inc. | | | 12,740 | | | | 1,303,939 | |
| PPD, Inc.(a) | | | 9,450 | | | | 225,855 | |
| Qualys, Inc.(a) | | | 22,000 | | | | 2,319,680 | |
| Rapid7, Inc.(a) | | | 14,350 | | | | 653,643 | |
| Revolve Group, Inc.(a) | | | 59,100 | | | | 649,509 | |
| Rexford Industrial Realty, Inc. | | | 20,400 | | | | 830,688 | |
| Silicon Laboratories, Inc.(a) | | | 5,800 | | | | 563,876 | |
| STAAR Surgical Co.(a) | | | 7,354 | | | | 281,805 | |
| SVB Financial Group(a) | | | 2,900 | | | | 560,193 | |
| Systemax, Inc. | | | 51,413 | | | | 1,021,062 | |
| Terreno Realty Corp. | | | 21,825 | | | | 1,196,447 | |
| Texas Roadhouse, Inc. | | | 4,975 | | | | 234,273 | |
| Transcat, Inc.(a) | | | 22,827 | | | | 641,210 | |
| TriMas Corp.(a) | | | 15,750 | | | | 375,480 | |
| Ulta Beauty, Inc.(a) | | | 1,825 | | | | 397,704 | |
| Veracyte, Inc.(a) | | | 21,007 | | | | 566,559 | |
| Virtusa Corp.(a) | | | 20,525 | | | | 677,325 | |
| WW Grainger, Inc. | | | 3,528 | | | | 972,246 | |
| | | | | | | | 64,853,145 | |
| | | | | | | | | |
| Vietnam (1.48%) | | | | | | | | |
| Vietnam Dairy Products JSC | | | 298,409 | | | | 1,260,937 | |
| Vietnam Technological & Commercial Joint Stock Bank(a) | | | 2,138,281 | | | | 1,569,782 | |
| Vincom Retail JSC | | | 750,960 | | | | 740,415 | |
| | | | | | | | 3,571,134 | |
| | | | | | | | | |
| TOTAL COMMON STOCKS | | | | | | | | |
| (Cost $185,361,424) | | | | | | | 231,250,418 | |
| | | | | | | | | |
| PREFERRED STOCKS (0.40%) | | | | | | | | |
| United States (0.40%) | | | | | | | | |
| Dataminr, Inc.(a)(d) | | | 45,833 | | | | 959,285 | |
| | | | | | | | | |
| TOTAL PREFERRED STOCKS | | | | | | | | |
| (Cost $912,077) | | | | | | | 959,285 | |
See Notes to Financial Statements.
| Annual Report | April 30, 2020 | 53 |
| Grandeur Peak Global Reach Fund | Portfolio of Investments |
April 30, 2020
| TOTAL INVESTMENTS (96.23%) | | | |
| (Cost $186,273,501) | | $ | 232,209,703 | |
| | | | | |
| Other Assets In Excess Of Liabilities (3.77%)(f) | | | 9,085,944 | |
| | | | | |
| NET ASSETS (100.00%) | | $ | 241,295,647 | |
| (a) | Non-Income Producing Security. |
| (b) | Security exempt from registration under Rule 144A of the Securities Act of 1933. These securities may be resold in the ordinary course of business in transactions exempt from registration, normally to qualified institutional buyers. As of April 30, 2020, these securities had a total aggregate market value of $15,065,159, representing 6.24% of net assets. |
| (c) | Security was purchased pursuant to Regulation S under the Securities Act of 1933, which exempts securities offered and sold outside of the United States from registration. Such security cannot be sold in the United States without either an effective registration statement filed pursuant to the Securities Act of 1933, or pursuant to an exemption from registration. As of April 30, 2020, the aggregate market value of these securities was $20,997,479, representing 8.70% of net assets. |
| (d) | As a result of the use of significant unobservable inputs to determine fair value, these investments have been classified as level 3 assets. See also Note 2 to the financial statements for additional information. |
| (f) | Includes cash which is being held as collateral for securities sold short. See also Note 2 to the financial statements for additional information. |
See Notes to Financial Statements.
| 54 | 1.855.377.7325 | www.GrandeurPeakGlobal.com |
| Grandeur Peak Global Stalwarts Fund | Portfolio of Investments |
April 30, 2020
| | | Shares | | | Value (Note 2) | |
| COMMON STOCKS (98.35%) | | | | | | |
| Argentina (0.96%) | | | | | | |
| Globant SA(a) | | | 16,950 | | | $ | 1,960,607 | |
| | | | | | | | | |
| Australia (1.91%) | | | | | | | | |
| Appen, Ltd. | | | 63,400 | | | | 1,067,154 | |
| Corporate Travel Management, Ltd. | | | 133,900 | | | | 1,108,147 | |
| Domino's Pizza Enterprises, Ltd. | | | 21,400 | | | | 809,523 | |
| Netwealth Group, Ltd. | | | 186,300 | | | | 921,442 | |
| | | | | | | | 3,906,266 | |
| | | | | | | | | |
| Bangladesh (0.00%)(b) | | | | | | | | |
| Square Pharmaceuticals, Ltd. | | | 25 | | | | 51 | |
| | | | | | | | | |
| Belgium (1.12%) | | | | | | | | |
| Melexis NV | | | 24,696 | | | | 1,503,362 | |
| Warehouses De Pauw CVA | | | 29,086 | | | | 796,850 | |
| | | | | | | | 2,300,212 | |
| | | | | | | | | |
| Brazil (1.27%) | | | | | | | | |
| Fleury SA | | | 82,800 | | | | 345,945 | |
| Pagseguro Digital, Ltd., Class A(a) | | | 61,275 | | | | 1,552,096 | |
| Raia Drogasil SA | | | 36,000 | | | | 697,571 | |
| | | | | | | | 2,595,612 | |
| | | | | | | | | |
| Britain (12.04%) | | | | | | | | |
| Abcam PLC | | | 63,900 | | | | 1,022,117 | |
| Ascential PLC(c)(d) | | | 266,800 | | | | 850,163 | |
| B&M European Value Retail SA | | | 893,500 | | | | 3,745,189 | |
| boohoo Group PLC(a) | | | 513,200 | | | | 2,087,782 | |
| Dechra Pharmaceuticals PLC | | | 121,600 | | | | 4,242,377 | |
| Endava PLC, ADR(a) | | | 55,573 | | | | 2,432,430 | |
| Intermediate Capital Group PLC | | | 59,649 | | | | 847,438 | |
| Intertek Group PLC | | | 15,900 | | | | 951,232 | |
| Sanne Group PLC | | | 370,820 | | | | 3,026,454 | |
| Softcat PLC | | | 102,618 | | | | 1,460,488 | |
| St. James's Place PLC | | | 374,389 | | | | 4,014,696 | |
| | | | | | | | 24,680,366 | |
| | | | | | | | | |
| Canada (1.19%) | | | | | | | | |
| Gildan Activewear, Inc. | | | 63,867 | | | | 891,050 | |
| Ritchie Bros Auctioneers, Inc. | | | 35,950 | | | | 1,549,086 | |
| | | | | | | | 2,440,136 | |
| | | | | | | | | |
| China (6.93%) | | | | | | | | |
| Baozun, Inc., Sponsored ADR(a) | | | 23,500 | | | | 748,240 | |
| CSPC Pharmaceutical Group, Ltd. | | | 354,000 | | | | 703,205 | |
| | | Shares | | | Value (Note 2) | |
| China (continued) | | | | | | |
| Hangzhou Tigermed Consulting Co., Ltd., Class A | | | 61,700 | | | $ | 673,686 | |
| Li Ning Co., Ltd. | | | 257,000 | | | | 810,532 | |
| Silergy Corp. | | | 176,000 | | | | 7,072,789 | |
| Trip.com Group, Ltd., ADR(a) | | | 53,550 | | | | 1,379,448 | |
| WuXi AppTec Co., Ltd., Class H(c)(d) | | | 75,400 | | | | 1,064,986 | |
| Yum China Holdings, Inc. | | | 36,275 | | | | 1,757,887 | |
| | | | | | | | 14,210,773 | |
| | | | | | | | | |
| Denmark (0.50%) | | | | | | | | |
| Ambu A/S, Class B | | | 32,581 | | | | 1,022,036 | |
| | | | | | | | | |
| France (2.00%) | | | | | | | | |
| Alten SA | | | 26,792 | | | | 1,928,961 | |
| BioMerieux | | | 10,093 | | | | 1,253,150 | |
| Bureau Veritas SA | | | 43,950 | | | | 912,203 | |
| | | | | | | | 4,094,314 | |
| | | | | | | | | |
| Georgia (0.35%) | | | | | | | | |
| Bank of Georgia Group PLC | | | 57,262 | | | | 718,326 | |
| | | | | | | | | |
| Germany (3.23%) | | | | | | | | |
| CANCOM SE | | | 15,700 | | | | 800,373 | |
| Dermapharm Holding SE | | | 33,900 | | | | 1,606,528 | |
| Grand City Properties SA | | | 77,900 | | | | 1,630,511 | |
| PATRIZIA AG | | | 73,915 | | | | 1,648,351 | |
| Puma SE | | | 14,900 | | | | 936,914 | |
| | | | | | | | 6,622,677 | |
| | | | | | | | | |
| Hong Kong (1.74%) | | | | | | | | |
| Techtronic Industries Co., Ltd. | | | 132,000 | | | | 1,005,430 | |
| Value Partners Group, Ltd. | | | 2,312,900 | | | | 930,829 | |
| Vitasoy International Holdings, Ltd. | | | 450,500 | | | | 1,621,277 | |
| | | | | | | | 3,557,536 | |
| | | | | | | | | |
| India (4.30%) | | | | | | | | |
| Avenue Supermarts, Ltd.(a)(c)(d) | | | 20,000 | | | | 634,836 | |
| Bajaj Finance, Ltd. | | | 82,570 | | | | 2,548,845 | |
| HDFC Bank, Ltd. | | | 48,000 | | | | 640,341 | |
| WNS Holdings, Ltd., ADR(a) | | | 102,050 | | | | 4,985,142 | |
| | | | | | | | 8,809,164 | |
| | | | | | | | | |
| Indonesia (0.37%) | | | | | | | | |
| Bank Tabungan Pensiunan Nasional Syariah Tbk PT | | | 5,139,200 | | | | 756,628 | |
| | | | | | | | | |
| Ireland (0.54%) | | | | | | | | |
| ICON PLC, ADR(a) | | | 6,850 | | | | 1,099,220 | |
| | | | | | | | | |
| Israel (0.84%) | | | | | | | | |
| Wix.com, Ltd.(a) | | | 13,225 | | | | 1,729,962 | |
See Notes to Financial Statements.
| Annual Report | April 30, 2020 | 55 |
| Grandeur Peak Global Stalwarts Fund | Portfolio of Investments |
April 30, 2020
| | | Shares | | | Value (Note 2) | |
| Italy (2.01%) | | | | | | |
| DiaSorin SpA | | | 10,567 | | | $ | 1,798,357 | |
| FinecoBank Banca Fineco SpA | | | 84,532 | | | | 939,317 | |
| Interpump Group SpA | | | 47,092 | | | | 1,371,687 | |
| | | | | | | | 4,109,361 | |
| | | | | | | | | |
| Japan (5.87%) | | | | | | | | |
| Japan Lifeline Co., Ltd. | | | 57,500 | | | | 683,152 | |
| MISUMI Group, Inc. | | | 14,300 | | | | 344,591 | |
| MonotaRO Co., Ltd. | | | 65,800 | | | | 2,127,624 | |
| Nihon M&A Center, Inc. | | | 111,800 | | | | 3,703,574 | |
| Seria Co., Ltd. | | | 35,900 | | | | 1,170,852 | |
| Systena Corp. | | | 168,900 | | | | 2,408,023 | |
| Tokyo Century Corp. | | | 11,900 | | | | 408,624 | |
| Tsuruha Holdings, Inc. | | | 8,900 | | | | 1,192,583 | |
| | | | | | | | 12,039,023 | |
| | | | | | | | | |
| Netherlands (1.77%) | | | | | | | | |
| Aalberts NV | | | 83,985 | | | | 2,365,308 | |
| Just Eat Takeaway.com NV(a)(c)(d) | | | 12,400 | | | | 1,264,011 | |
| | | | | | | | 3,629,319 | |
| | | | | | | | | |
| Philippines (1.00%) | | | | | | | | |
| Philippine Seven Corp. | | | 259,000 | | | | 634,527 | |
| Puregold Price Club, Inc. | | | 771,000 | | | | 708,139 | |
| Wilcon Depot, Inc. | | | 2,399,400 | | | | 699,686 | |
| | | | | | | | 2,042,352 | |
| | | | | | | | | |
| Poland (0.93%) | | | | | | | | |
| Dino Polska SA(a)(c)(d) | | | 45,330 | | | | 1,907,689 | |
| | | | | | | | | |
| Sweden (1.65%) | | | | | | | | |
| AddTech AB, Class B | | | 23,500 | | | | 643,644 | |
| EQT AB(a) | | | 82,000 | | | | 1,146,489 | |
| Nibe Industrier AB, Class B | | | 46,608 | | | | 873,569 | |
| Sweco AB, Class B | | | 20,702 | | | | 713,006 | |
| | | | | | | | 3,376,708 | |
| | | | | | | | | |
| Switzerland (0.75%) | | | | | | | | |
| Partners Group Holding AG | | | 1,950 | | | | 1,534,950 | |
| | | | | | | | | |
| Taiwan (0.37%) | | | | | | | | |
| Voltronic Power Technology Corp. | | | 31,833 | | | | 760,057 | |
| | | | | | | | | |
| United Arab Emirates (0.32%) | | | | | | | | |
| Network International Holdings PLC(a)(c)(d) | | | 124,300 | | | | 649,703 | |
| | | | | | | | | |
| United States (42.99%) | | | | | | | | |
| 8x8, Inc.(a) | | | 35,075 | | | | 594,872 | |
| ABIOMED, Inc.(a) | | | 18,475 | | | | 3,533,344 | |
| Apollo Global Management, Inc., Class A | | | 80,500 | | | | 3,259,445 | |
| Ashtead Group PLC | | | 37,300 | | | | 1,021,796 | |
| | | Shares | | | Value (Note 2) | |
| United States (continued) | | | | | | |
| Bank of NT Butterfield & Son, Ltd. | | | 55,510 | | | $ | 1,221,775 | |
| Blackline, Inc.(a) | | | 23,650 | | | | 1,436,501 | |
| Blackstone Group, Inc., Class A | | | 14,200 | | | | 741,808 | |
| CDW Corp. | | | 7,025 | | | | 778,370 | |
| CoreSite Realty Corp. | | | 14,275 | | | | 1,729,987 | |
| EPAM Systems, Inc.(a) | | | 24,650 | | | | 5,444,938 | |
| Equinix, Inc. | | | 1,300 | | | | 877,760 | |
| Etsy, Inc.(a) | | | 2,500 | | | | 162,175 | |
| ExlService Holdings, Inc.(a) | | | 16,925 | | | | 1,044,780 | |
| Fastenal Co. | | | 108,125 | | | | 3,916,287 | |
| First Republic Bank | | | 62,825 | | | | 6,552,019 | |
| Five Below, Inc.(a) | | | 22,885 | | | | 2,063,312 | |
| Freshpet, Inc.(a) | | | 7,075 | | | | 533,526 | |
| Genpact, Ltd. | | | 84,677 | | | | 2,915,429 | |
| Goosehead Insurance, Inc., Class A(a) | | | 17,325 | | | | 972,625 | |
| Hannon Armstrong Sustainable Infrastructure Capital, Inc. | | | 13,325 | | | | 372,967 | |
| HD Supply Holdings, Inc.(a) | | | 24,050 | | | | 713,804 | |
| HealthEquity, Inc.(a) | | | 18,557 | | | | 1,044,202 | |
| Houlihan Lokey, Inc. | | | 13,900 | | | | 825,382 | |
| IDEXX Laboratories, Inc.(a) | | | 5,650 | | | | 1,568,440 | |
| Inphi Corp.(a) | | | 22,450 | | | | 2,167,323 | |
| Kinsale Capital Group, Inc. | | | 7,150 | | | | 776,633 | |
| LGI Homes, Inc.(a) | | | 19,850 | | | | 1,202,513 | |
| Littelfuse, Inc. | | | 4,375 | | | | 635,425 | |
| Lululemon Athletica, Inc.(a) | | | 17,488 | | | | 3,908,218 | |
| Medallia, Inc.(a) | | | 32,700 | | | | 702,396 | |
| Microchip Technology, Inc. | | | 20,750 | | | | 1,820,397 | |
| Monolithic Power Systems, Inc. | | | 6,550 | | | | 1,309,411 | |
| New Relic, Inc.(a) | | | 22,375 | | | | 1,201,314 | |
| Old Dominion Freight Line, Inc. | | | 7,725 | | | | 1,122,365 | |
| Paycom Software, Inc.(a) | | | 16,325 | | | | 4,261,152 | |
| Paylocity Holding Corp.(a) | | | 7,725 | | | | 884,744 | |
| PJT Partners, Inc., Class A | | | 35,775 | | | | 1,740,096 | |
| Pluralsight, Inc., Class A(a) | | | 251,284 | | | | 4,131,109 | |
| Pool Corp. | | | 10,075 | | | | 2,132,475 | |
| Power Integrations, Inc. | | | 49,100 | | | | 5,025,385 | |
| PPD, Inc.(a) | | | 31,350 | | | | 749,265 | |
| Qualys, Inc.(a) | | | 24,275 | | | | 2,559,556 | |
| Rapid7, Inc.(a) | | | 16,050 | | | | 731,078 | |
| Revolve Group, Inc.(a) | | | 30,975 | | | | 340,415 | |
| Silicon Laboratories, Inc.(a) | | | 10,975 | | | | 1,066,990 | |
| STAAR Surgical Co.(a) | | | 31,650 | | | | 1,212,828 | |
| SVB Financial Group(a) | | | 5,810 | | | | 1,122,318 | |
| Terreno Realty Corp. | | | 20,801 | | | | 1,140,311 | |
| Texas Roadhouse, Inc. | | | 27,450 | | | | 1,292,621 | |
| Ulta Beauty, Inc.(a) | | | 4,312 | | | | 939,671 | |
See Notes to Financial Statements.
| 56 | 1.855.377.7325 | www.GrandeurPeakGlobal.com |
| Grandeur Peak Global Stalwarts Fund | Portfolio of Investments |
April 30, 2020
| | | Shares | | | Value (Note 2) | |
| United States (continued) | | | | | | | | |
| WW Grainger, Inc. | | | 2,175 | | | $ | 599,386 | |
| | | | | | | | 88,100,939 | |
| | | | | | | | | |
| Vietnam (1.40%) | | | | | | | | |
| Ho Chi Minh City Development Joint Stock Commercial Bank(a) | | | 609,106 | | | | 536,858 | |
| Vietnam Dairy Products JSC | | | 213,454 | | | | 901,957 | |
| Vietnam Technological & Commercial Joint Stock Bank(a) | | | 909,095 | | | | 667,396 | |
| Vincom Retail JSC | | | 777,710 | | | | 766,789 | |
| | | | | | | | 2,873,000 | |
| | | | | | | | | |
| TOTAL COMMON STOCKS | | | | | | | | |
| (Cost $169,889,306) | | | | | | | 201,526,987 | |
| | | | | | | | | |
| PREFERRED STOCKS (0.25%) | | | | | | | | |
| United States (0.25%) | | | | | | | | |
| Dataminr, Inc.(a)(e) | | | 24,262 | | | | 507,803 | |
| | | | | | | | | |
| TOTAL PREFERRED STOCKS | | | | | | | | |
| (Cost $482,814) | | | | | | | 507,803 | |
| | | | | | | | | |
| TOTAL INVESTMENTS (98.60%) | | | | | | | | |
| (Cost $170,372,120) | | | | | | $ | 202,034,790 | |
| | | | | | | | | |
| Other Assets In Excess Of Liabilities (1.40%) | | | | | | | 2,875,677 | |
| | | | | | | | | |
| NET ASSETS (100.00%) | | | | | | $ | 204,910,467 | |
| (a) | Non-Income Producing Security. |
| (c) | Security exempt from registration under Rule 144A of the Securities Act of 1933. These securities may be resold in the ordinary course of business in transactions exempt from registration, normally to qualified institutional buyers. As of April 30, 2020, these securities had a total aggregate market value of $6,371,388, representing 3.11% of net assets. |
| (d) | Security was purchased pursuant to Regulation S under the Securities Act of 1933, which exempts securities offered and sold outside of the United States from registration. Such security cannot be sold in the United States without either an effective registration statement filed pursuant to the Securities Act of 1933, or pursuant to an exemption from registration. As of April 30, 2020, the aggregate market value of these securities was $6,371,388, representing 3.11% of net assets. |
| (e) | As a result of the use of significant unobservable inputs to determine fair value, these investments have been classified as level 3 assets. See also Note 2 to the financial statements for additional information. |
For Fund compliance purposes, the Fund's geographical classifications refer to any one or more of the country sub-classifications used by one or more widely recognized market indexes or ratings group indexes, and/or as defined by Fund management. This definition may not apply for purposes of this report, which may combine sub-classifications for reporting ease. Geographical regions are shown as a percentage of net assets.
See Notes to Financial Statements.
| Annual Report | April 30, 2020 | 57 |
| Grandeur Peak International Opportunities Fund | Portfolio of Investments |
April 30, 2020
| | | Shares | | | Value (Note 2) | |
| COMMON STOCKS (99.24%) | | | | | | | | |
| Argentina (0.81%) | | | | | | | | |
| Globant SA(a) | | | 36,175 | | | $ | 4,184,362 | |
| | | | | | | | | |
| Australia (3.68%) | | | | | | | | |
| Appen, Ltd. | | | 209,700 | | | | 3,529,687 | |
| Corporate Travel Management, Ltd. | | | 283,100 | | | | 2,342,917 | |
| Fiducian Group, Ltd. | | | 201,848 | | | | 606,371 | |
| HUB24, Ltd. | | | 349,961 | | | | 2,228,063 | |
| Kogan.com, Ltd. | | | 856,932 | | | | 4,461,762 | |
| National Storage REIT | | | 3,095,869 | | | | 3,500,220 | |
| Netwealth Group, Ltd. | | | 257,600 | | | | 1,274,093 | |
| People Infrastructure, Ltd. | | | 852,907 | | | | 1,000,432 | |
| | | | | | | | 18,943,545 | |
| | | | | | | | | |
| Bangladesh (0.60%) | | | | | | | | |
| Square Pharmaceuticals, Ltd. | | | 1,504,505 | | | | 3,083,759 | |
| | | | | | | | | |
| Belgium (1.23%) | | | | | | | | |
| Melexis NV | | | 74,368 | | | | 4,527,130 | |
| Warehouses De Pauw CVA | | | 66,000 | | | | 1,808,160 | |
| | | | | | | | 6,335,290 | |
| | | | | | | | | |
| Brazil (1.96%) | | | | | | | | |
| Arco Platform, Ltd., Class A(a) | | | 28,925 | | | | 1,452,614 | |
| Fleury SA | | | 521,100 | | | | 2,177,199 | |
| Locaweb Servicos de Internet SA(a)(b)(c) | | | 661,900 | | | | 2,832,419 | |
| Pagseguro Digital, Ltd., Class A(a) | | | 143,575 | | | | 3,636,755 | |
| | | | | | | | 10,098,987 | |
| | | | | | | | | |
| Britain (16.25%) | | | | | | | | |
| Ascential PLC(b)(c) | | | 1,004,600 | | | | 3,201,176 | |
| B&M European Value Retail SA | | | 2,002,900 | | | | 8,395,344 | |
| boohoo Group PLC(a) | | | 2,175,900 | | | | 8,851,918 | |
| Clinigen Group PLC | | | 215,373 | | | | 1,958,504 | |
| CVS Group PLC | | | 728,400 | | | | 8,394,347 | |
| Dechra Pharmaceuticals PLC | | | 343,300 | | | | 11,977,039 | |
| Endava PLC, ADR(a) | | | 136,113 | | | | 5,957,666 | |
| FDM Group Holdings PLC | | | 175,900 | | | | 1,657,156 | |
| First Derivatives PLC | | | 77,400 | | | | 2,524,856 | |
| Impax Asset Management Group PLC | | | 780,911 | | | | 3,575,213 | |
| JTC PLC(b)(c) | | | 594,874 | | | | 3,101,853 | |
| K3 Capital Group PLC | | | 439,700 | | | | 1,005,146 | |
| On the Beach Group PLC(b)(c) | | | 1,118,430 | | | | 3,916,062 | |
| Oxford Immunotec Global PLC(a) | | | 380,490 | | | | 4,740,905 | |
| Sanne Group PLC | | | 775,306 | | | | 6,327,673 | |
| Softcat PLC | | | 210,578 | | | | 2,997,004 | |
| St. James's Place PLC | | | 320,234 | | | | 3,433,974 | |
| | | Shares | | | Value (Note 2) | |
| Britain (continued) | | | | | | | | |
| Volution Group PLC | | | 823,200 | | | $ | 1,710,745 | |
| | | | | | | | 83,726,581 | |
| | | | | | | | | |
| Canada (1.75%) | | | | | | | | |
| Gildan Activewear, Inc. | | | 104,300 | | | | 1,455,157 | |
| Richelieu Hardware, Ltd. | | | 159,350 | | | | 3,026,843 | |
| Ritchie Bros Auctioneers, Inc. | | | 31,900 | | | | 1,374,571 | |
| Stantec, Inc. | | | 59,610 | | | | 1,757,102 | |
| StorageVault Canada, Inc. | | | 647,300 | | | | 1,409,044 | |
| | | | | | | | 9,022,717 | |
| | | | | | | | | |
| China (8.14%) | | | | | | | | |
| BBI Life Sciences Corp.(c) | | | 16,117,500 | | | | 7,068,623 | |
| CSPC Pharmaceutical Group, Ltd. | | | 1,474,000 | | | | 2,928,036 | |
| Man Wah Holdings, Ltd. | | | 5,555,000 | | | | 3,202,948 | |
| O2Micro International, Ltd., ADR(a) | | | 1,054,233 | | | | 1,402,130 | |
| Silergy Corp. | | | 416,199 | | | | 16,725,499 | |
| Suofeiya Home Collection Co., Ltd., Class A | | | 1,158,500 | | | | 3,096,627 | |
| TK Group Holdings, Ltd. | | | 4,684,000 | | | | 1,468,187 | |
| Trip.com Group, Ltd., ADR(a) | | | 113,775 | | | | 2,930,844 | |
| WuXi AppTec Co., Ltd., Class H(b)(c) | | | 221,200 | | | | 3,124,334 | |
| | | | | | | | 41,947,228 | |
| | | | | | | | | |
| Colombia (0.89%) | | | | | | | | |
| Parex Resources, Inc.(a) | | | 419,301 | | | | 4,596,813 | |
| | | | | | | | | |
| Finland (0.51%) | | | | | | | | |
| Musti Group Oyj(a) | | | 214,400 | | | | 2,607,958 | |
| | | | | | | | | |
| France (3.42%) | | | | | | | | |
| Alten SA | | | 41,900 | | | | 3,016,701 | |
| Bureau Veritas SA | | | 116,500 | | | | 2,418,014 | |
| Esker SA | | | 60,443 | | | | 7,060,835 | |
| Neurones | | | 50,872 | | | | 1,087,092 | |
| Thermador Groupe | | | 83,436 | | | | 4,050,513 | |
| | | | | | | | 17,633,155 | |
| | | | | | | | | |
| Georgia (0.69%) | | | | | | | | |
| Bank of Georgia Group PLC | | | 65,283 | | | | 818,946 | |
| Georgia Capital PLC(a) | | | 163,711 | | | | 866,010 | |
| TBC Bank Group PLC | | | 183,446 | | | | 1,892,292 | |
| | | | | | | | 3,577,248 | |
| | | | | | | | | |
| Germany (5.19%) | | | | | | | | |
| CANCOM SE | | | 86,500 | | | | 4,409,696 | |
| Dermapharm Holding SE | | | 141,362 | | | | 6,699,177 | |
| Grand City Properties SA | | | 212,756 | | | | 4,453,157 | |
| Nexus AG | | | 63,706 | | | | 2,443,438 | |
| Norma Group SE | | | 94,103 | | | | 2,365,646 | |
See Notes to Financial Statements.
| 58 | 1.855.377.7325 | www.GrandeurPeakGlobal.com |
| Grandeur Peak International Opportunities Fund | Portfolio of Investments |
April 30, 2020
| | | Shares | | | Value (Note 2) | |
| Germany (continued) | | | | | | | | |
| PATRIZIA AG | | | 286,450 | | | $ | 6,388,017 | |
| | | | | | | | 26,759,131 | |
| | | | | | | | | |
| Greece (0.17%) | | | | | | | | |
| Sarantis SA | | | 100,600 | | | | 859,895 | |
| | | | | | | | | |
| Hong Kong (1.58%) | | | | | | | | |
| Jacobson Pharma Corp., Ltd.(c) | | | 4,138,000 | | | | 779,294 | |
| Value Partners Group, Ltd. | | | 11,119,000 | | | | 4,474,851 | |
| Vitasoy International Holdings, Ltd. | | | 804,338 | | | | 2,894,683 | |
| | | | | | | | 8,148,828 | |
| | | | | | | | | |
| India (5.73%) | | | | | | | | |
| Bajaj Finance, Ltd. | | | 95,760 | | | | 2,956,006 | |
| Cyient, Ltd. | | | 615,700 | | | | 1,872,230 | |
| Essel Propack, Ltd. | | | 938,089 | | | | 2,247,941 | |
| Gulf Oil Lubricants India, Ltd. | | | 172,478 | | | | 1,361,656 | |
| IndiaMart InterMesh, Ltd.(b)(c)(c) | | | 45,199 | | | | 1,352,780 | |
| L&T Technology Services, Ltd.(b)(c) | | | 105,618 | | | | 1,737,328 | |
| Metropolis Healthcare, Ltd.(b)(c) | | | 408,000 | | | | 6,860,126 | |
| Time Technoplast, Ltd. | | | 3,187,734 | | | | 1,449,645 | |
| WNS Holdings, Ltd., ADR(a) | | | 197,700 | | | | 9,657,645 | |
| | | | | | | | 29,495,357 | |
| | | | | | | | | |
| Indonesia (2.13%) | | | | | | | | |
| Arwana Citramulia Tbk PT | | | 63,783,500 | | | | 1,749,490 | |
| Bank Tabungan Pensiunan Nasional Syariah Tbk PT | | | 8,194,500 | | | | 1,206,451 | |
| Link Net Tbk PT | | | 8,891,900 | | | | 1,661,814 | |
| Panin Sekuritas Tbk PT | | | 3,148,800 | | | | 151,354 | |
| Selamat Sempurna Tbk PT | | | 48,677,500 | | | | 4,057,822 | |
| Ultrajaya Milk Industry & Trading Co. Tbk PT | | | 22,958,000 | | | | 2,129,885 | |
| | | | | | | | 10,956,816 | |
| | | | | | | | | |
| Ireland (2.69%) | | | | | | | | |
| Irish Residential Properties | | | | | | | | |
| REIT PLC | | | 5,088,718 | | | | 7,182,524 | |
| Keywords Studios PLC | | | 108,046 | | | | 2,167,806 | |
| Uniphar PLC | | | 2,840,100 | | | | 4,512,887 | |
| | | | | | | | 13,863,217 | |
| | | | | | | | | |
| Israel (0.73%) | | | | | | | | |
| Wix.com, Ltd.(a) | | | 28,808 | | | | 3,768,375 | |
| | | | | | | | | |
| Italy (2.97%) | | | | | | | | |
| DiaSorin SpA | | | 27,092 | | | | 4,610,684 | |
| FinecoBank Banca Fineco SpA | | | 403,915 | | | | 4,488,289 | |
| Interpump Group SpA | | | 146,141 | | | | 4,256,767 | |
| | | Shares | | | Value (Note 2) | |
| Italy (continued) | | | | | | | | |
| Piovan SpA(b)(c) | | | 437,003 | | | $ | 1,961,061 | |
| | | | | | | | 15,316,801 | |
| | | | | | | | | |
| Japan (16.47%) | | | | | | | | |
| AIT Corp. | | | 362,600 | | | | 2,523,992 | |
| BayCurrent Consulting, Inc. | | | 100,700 | | | | 5,770,908 | |
| Create SD Holdings Co., Ltd. | | | 93,600 | | | | 2,673,289 | |
| eGuarantee, Inc. | | | 208,200 | | | | 3,697,798 | |
| Funai Soken Holdings, Inc. | | | 49,600 | | | | 1,070,434 | |
| Future Corp. | | | 262,900 | | | | 3,490,961 | |
| gremz, Inc. | | | 142,000 | | | | 2,557,760 | |
| Japan Lifeline Co., Ltd. | | | 303,900 | | | | 3,610,609 | |
| M&A Capital Partners Co., Ltd.(a) | | | 92,300 | | | | 2,618,958 | |
| MISUMI Group, Inc. | | | 76,700 | | | | 1,848,262 | |
| MonotaRO Co., Ltd. | | | 111,200 | | | | 3,595,620 | |
| Naigai Trans Line, Ltd. | | | 88,500 | | | | 925,285 | |
| Nihon M&A Center, Inc. | | | 177,300 | | | | 5,873,377 | |
| Open Door, Inc.(a) | | | 248,000 | | | | 2,241,625 | |
| Seria Co., Ltd. | | | 190,300 | | | | 6,206,495 | |
| SMS Co., Ltd. | | | 182,900 | | | | 4,030,737 | |
| Strike Co., Ltd. | | | 62,800 | | | | 2,577,776 | |
| Synchro Food Co., Ltd.(a) | | | 556,500 | | | | 1,498,658 | |
| System Information Co., Ltd. | | | 505,000 | | | | 3,919,909 | |
| Systena Corp. | | | 300,000 | | | | 4,277,128 | |
| Syuppin Co., Ltd. | | | 274,300 | | | | 1,878,680 | |
| Tokyo Century Corp. | | | 153,800 | | | | 5,281,210 | |
| Trancom Co., Ltd. | | | 88,990 | | | | 5,920,781 | |
| Tsuruha Holdings, Inc. | | | 28,000 | | | | 3,751,945 | |
| YAKUODO Holdings Co., Ltd. | | | 126,500 | | | | 3,011,764 | |
| | | | | | | | 84,853,961 | |
| | | | | | | | | |
| Malaysia (0.77%) | | | | | | | | |
| AEON Credit Service M Bhd | | | 604,937 | | | | 1,281,622 | |
| My EG Services Bhd | | | 4,672,400 | | | | 1,379,988 | |
| Mynews Holdings Bhd | | | 3,136,000 | | | | 630,847 | |
| Scicom MSC Bhd | | | 3,549,500 | | | | 681,009 | |
| | | | | | | | 3,973,466 | |
| | | | | | | | | |
| Mexico (0.27%) | | | | | | | | |
| Regional SAB de CV(a) | | | 560,065 | | | | 1,376,401 | |
| | | | | | | | | |
| Netherlands (1.46%) | | | | | | | | |
| Aalberts NV | | | 267,576 | | | | 7,535,865 | |
| | | | | | | | | |
| New Zealand (0.00%)(d) | | | | | | | | |
| CBL Corp., Ltd.(a)(e) | | | 1,542,256 | | | | 1 | |
| | | | | | | | | |
| Norway (1.78%) | | | | | | | | |
| Medistim ASA | | | 85,511 | | | | 1,452,302 | |
| Nordic Semiconductor ASA(a) | | | 392,000 | | | | 2,311,048 | |
| Sbanken ASA(a)(b)(c) | | | 688,929 | | | | 3,678,305 | |
| Self Storage Group ASA(a) | | | 683,772 | | | | 1,735,284 | |
| | | | | | | | 9,176,939 | |
See Notes to Financial Statements.
| Annual Report | April 30, 2020 | 59 |
| Grandeur Peak International Opportunities Fund | Portfolio of Investments |
| | | Shares | | | Value (Note 2) | |
| Philippines (1.34%) | | | | | | | | |
| Concepcion Industrial Corp. | | | 3,070,600 | | | $ | 1,461,901 | |
| Puregold Price Club, Inc. | | | 5,001,000 | | | | 4,593,261 | |
| Wilcon Depot, Inc. | | | 2,886,000 | | | | 841,583 | |
| | | | | | | | 6,896,745 | |
| | | | | | | | | |
| Poland (0.96%) | | | | | | | | |
| Dino Polska SA(a)(b)(c) | | | 79,162 | | | | 3,331,490 | |
| LiveChat Software SA | | | 85,000 | | | | 1,219,027 | |
| PGS Software SA(a) | | | 130,778 | | | | 389,295 | |
| | | | | | | | 4,939,812 | |
| | | | | | | | | |
| Singapore (0.79%) | | | | | | | | |
| Riverstone Holdings, Ltd./Singapore | | | 4,887,400 | | | | 4,055,071 | |
| | | | | | | | | |
| South Africa (0.44%) | | | | | | | | |
| Italtile, Ltd. | | | 4,209,423 | | | | 2,268,735 | |
| | | | | | | | | |
| South Korea (2.42%) | | | | | | | | |
| Hy-Lok Corp. | | | 84,332 | | | | 837,472 | |
| LEENO Industrial, Inc. | | | 85,000 | | | | 6,229,636 | |
| Suprema, Inc.(a) | | | 97,000 | | | | 2,726,620 | |
| Tokai Carbon Korea Co., Ltd. | | | 45,362 | | | | 2,680,507 | |
| | | | | | | | 12,474,235 | |
| | | | | | | | | |
| Sweden (1.12%) | | | | | | | | |
| Epiroc AB, Class B | | | 237,600 | | | | 2,358,050 | |
| KNOW IT AB(a) | | | 156,100 | | | | 2,332,932 | |
| Nibe Industrier AB, Class B | | | 58,300 | | | | 1,092,710 | |
| | | | | | | | 5,783,692 | |
| | | | | | | | | |
| Taiwan (3.00%) | | | | | | | | |
| ASPEED Technology, Inc. | | | 31,000 | | | | 1,240,563 | |
| Bioteque Corp. | | | 908,000 | | | | 3,496,242 | |
| Poya International Co., Ltd. | | | 4,000 | | | | 67,257 | |
| Sinmag Equipment Corp. | | | 416,158 | | | | 1,329,511 | |
| Sporton International, Inc. | | | 786,003 | | | | 5,220,372 | |
| Test Research, Inc. | | | 1,013,252 | | | | 1,768,459 | |
| TSC Auto ID Technology Co., Ltd. | | | 151,800 | | | | 1,038,835 | |
| Voltronic Power Technology Corp. | | | 53,000 | | | | 1,265,448 | |
| | | | | | | | 15,426,687 | |
| | | | | | | | | |
| Turkey (0.08%) | | | | | | | | |
| DP Eurasia NV(a)(b)(c) | | | 635,340 | | | | 389,701 | |
| | | | | | | | | |
| United Arab Emirates (0.84%) | | | | | | | | |
| Aramex PJSC | | | 3,322,125 | | | | 2,731,393 | |
| Network International Holdings PLC(a)(b)(c) | | | 307,300 | | | | 1,606,226 | |
| | | | | | | | 4,337,619 | |
| | | Shares | | | Value (Note 2) | |
| United States (4.82%) | | | | | | | | |
| Bank of NT Butterfield & Son, Ltd. | | | 196,634 | | | $ | 4,327,914 | |
| EPAM Systems, Inc.(a) | | | 58,475 | | | | 12,916,543 | |
| Genpact, Ltd. | | | 109,675 | | | | 3,776,110 | |
| Lululemon Athletica, Inc.(a) | | | 16,975 | | | | 3,793,573 | |
| | | | | | | | 24,814,140 | |
| | | | | | | | | |
| Vietnam (1.56%) | | | | | | | | |
| Ho Chi Minh City Development Joint Stock Commercial Bank(a) | | | 2,161,861 | | | | 1,905,434 | |
| Vietnam Dairy Products JSC | | | 831,556 | | | | 3,513,767 | |
| Vietnam Technological & Commercial Joint Stock Bank(a) | | | 3,570,063 | | | | 2,620,901 | |
| | | | | | | | 8,040,102 | |
| | | | | | | | | |
| TOTAL COMMON STOCKS | | | | | | | | |
| (Cost $431,565,232) | | | | | | | 511,269,235 | |
| | | | | | | | | |
| TOTAL INVESTMENTS (99.24%) | | | | | | | | |
| (Cost $431,565,232) | | | | | | $ | 511,269,235 | |
| | | | | | | | | |
| Other Assets In Excess Of Liabilities (0.76%) | | | | | | | 3,902,284 | |
| | | | | | | | | |
| NET ASSETS (100.00%) | | | | | | $ | 515,171,519 | |
| (a) | Non-Income Producing Security. |
| (b) | Security exempt from registration under Rule 144A of the Securities Act of 1933. These securities may be resold in the ordinary course of business in transactions exempt from registration, normally to qualified institutional buyers. As of April 30, 2020, these securities had a total aggregate market value of $37,092,861, representing 7.20% of net assets. |
| (c) | Security was purchased pursuant to Regulation S under the Securities Act of 1933, which exempts securities offered and sold outside of the United States from registration. Such security cannot be sold in the United States without either an effective registration statement filed pursuant to the Securities Act of 1933, or pursuant to an exemption from registration. As of April 30, 2020, the aggregate market value of these securities was $44,940,778, representing 8.72% of net assets. |
| (e) | As a result of the use of significant unobservable inputs to determine fair value, these investments have been classified as level 3 assets. See also Note 2 to the financial statements for additional information. |
For Fund compliance purposes, the Fund's geographical classifications refer to any one or more of the country sub-classifications used by one or more widely recognized market indexes or ratings group indexes, and/or as defined by Fund management. This definition may not apply for purposes of this report, which may combine sub-classifications for reporting ease. Geographical regions are shown as a percentage of net assets.
See Notes to Financial Statements.
| 60 | 1.855.377.7325 | www.GrandeurPeakGlobal.com |
| Grandeur Peak International Stalwarts Fund | Portfolio of Investments |
April 30, 2020
| | | Shares | | | Value (Note 2) | |
| COMMON STOCKS (96.69%) | | | | | | |
| Argentina (1.37%) | | | | | | | | |
| Globant SA(a) | | | 112,500 | | | $ | 13,012,875 | |
| | | | | | | | | |
| Australia (2.92%) | | | | | | | | |
| Appen, Ltd. | | | 467,900 | | | | 7,875,729 | |
| Corporate Travel Management, Ltd. | | | 945,800 | | | | 7,827,378 | |
| Domino's Pizza Enterprises, Ltd. | | | 168,400 | | | | 6,370,266 | |
| Netwealth Group, Ltd. | | | 1,170,800 | | | | 5,790,790 | |
| | | | | | | | 27,864,163 | |
| | | | | | | | | |
| Bangladesh (0.20%) | | | | | | | | |
| Square Pharmaceuticals, Ltd. | | | 939,409 | | | | 1,925,491 | |
| | | | | | | | | |
| Belgium (1.72%) | | | | | | | | |
| Melexis NV | | | 151,398 | | | | 9,216,309 | |
| Warehouses De Pauw CVA | | | 261,653 | | | | 7,168,340 | |
| | | | | | | | 16,384,649 | |
| | | | | | | | | |
| Brazil (1.88%) | | | | | | | | |
| Fleury SA | | | 627,300 | | | | 2,620,912 | |
| Pagseguro Digital, Ltd., Class A(a) | | | 432,300 | | | | 10,950,159 | |
| Raia Drogasil SA | | | 225,500 | | | | 4,369,505 | |
| | | | | | | | 17,940,576 | |
| | | | | | | | | |
| Britain (17.68%) | | | | | | | | |
| Abcam PLC | | | 444,100 | | | | 7,103,631 | |
| Ascential PLC(b)(c) | | | 1,930,500 | | | | 6,151,574 | |
| B&M European Value Retail SA | | | 5,989,300 | | | | 25,104,715 | |
| Big Yellow Group PLC | | | 250,300 | | | | 3,379,493 | |
| boohoo Group PLC(a) | | | 3,932,914 | | | | 15,999,738 | |
| Dechra Pharmaceuticals PLC | | | 787,700 | | | | 27,481,252 | |
| Endava PLC, ADR(a) | | | 329,975 | | | | 14,443,006 | |
| Intermediate Capital Group PLC | | | 416,268 | | | | 5,913,955 | |
| Intertek Group PLC | | | 153,100 | | | | 9,159,351 | |
| Sanne Group PLC | | | 2,415,300 | | | | 19,712,513 | |
| Softcat PLC | | | 679,735 | | | | 9,674,176 | |
| St. James's Place PLC | | | 2,274,542 | | | | 24,390,658 | |
| | | | | | | | 168,514,062 | |
| | | | | | | | | |
| Canada (1.92%) | | | | | | | | |
| Gildan Activewear, Inc. | | | 416,534 | | | | 5,811,337 | |
| Ritchie Bros Auctioneers, Inc. | | | 224,349 | | | | 9,667,199 | |
| Stantec, Inc. | | | 96,085 | | | | 2,832,262 | |
| | | | | | | | 18,310,798 | |
| | | | | | | | | |
| China (10.51%) | | | | | | | | |
| 51job, Inc., ADR(a) | | | 25,450 | | | | 1,525,473 | |
| 58.com, Inc., ADR(a) | | | 48,100 | | | | 2,498,795 | |
| Baozun, Inc., Sponsored ADR(a) | | | 153,500 | | | | 4,887,440 | |
| | | Shares | | | Value (Note 2) | |
| China (continued) | | | | | | | | |
| CSPC Pharmaceutical Group, Ltd. | | | 2,292,000 | | | $ | 4,552,957 | |
| Hangzhou Tigermed Consulting Co., Ltd., Class A | | | 450,050 | | | | 4,913,976 | |
| Li Ning Co., Ltd. | | | 1,842,000 | | | | 5,809,339 | |
| Silergy Corp. | | | 1,090,200 | | | | 43,811,108 | |
| Trip.com Group, Ltd., ADR(a) | | | 323,150 | | | | 8,324,344 | |
| WuXi AppTec Co., Ltd., Class H(b)(c) | | | 546,400 | | | | 7,717,614 | |
| Yum China Holdings, Inc. | | | 333,925 | | | | 16,182,005 | |
| | | | | | | | 100,223,051 | |
| | | | | | | | | |
| Denmark (0.73%) | | | | | | | | |
| Ambu A/S, Class B | | | 222,812 | | | | 6,989,410 | |
| | | | | | | | | |
| France (3.67%) | | | | | | | | |
| Alten SA | | | 173,864 | | | | 12,517,796 | |
| BioMerieux | | | 69,300 | | | | 8,604,309 | |
| Bureau Veritas SA | | | 318,650 | | | | 6,613,734 | |
| Eurofins Scientific SE | | | 13,159 | | | | 7,282,276 | |
| | | | | | | | 35,018,115 | |
| | | | | | | | | |
| Georgia (0.54%) | | | | | | | | |
| Bank of Georgia Group PLC | | | 362,723 | | | | 4,550,199 | |
| Georgia Capital PLC(a) | | | 108,500 | | | | 573,951 | |
| | | | | | | | 5,124,150 | |
| | | | | | | | | |
| Germany (6.22%) | | | | | | | | |
| CANCOM SE | | | 118,100 | | | | 6,020,637 | |
| Dermapharm Holding SE | | | 222,564 | | | | 10,547,357 | |
| Grand City Properties SA | | | 638,300 | | | | 13,360,142 | |
| GRENKE AG | | | 55,450 | | | | 3,888,968 | |
| Norma Group SE | | | 181,050 | | | | 4,551,398 | |
| PATRIZIA AG | | | 598,980 | | | | 13,357,635 | |
| Puma SE | | | 121,000 | | | | 7,608,495 | |
| | | | | | | | 59,334,632 | |
| | | | | | | | | |
| Hong Kong (2.71%) | | | | | | | | |
| Techtronic Industries Co., Ltd. | | | 917,500 | | | | 6,988,504 | |
| Value Partners Group, Ltd. | | | 18,182,000 | | | | 7,317,361 | |
| Vitasoy International Holdings, Ltd. | | | 3,209,000 | | | | 11,548,674 | |
| | | | | | | | 25,854,539 | |
| | | | | | | | | |
| India (5.44%) | | | | | | | | |
| Avenue Supermarts, Ltd.(a)(b)(c) | | | 126,500 | | | | 4,015,337 | |
| Bajaj Finance, Ltd. | | | 486,430 | | | | 15,015,559 | |
| HDFC Bank, Ltd. | | | 296,000 | | | | 3,948,769 | |
| L&T Technology Services, Ltd.(b)(c) | | | 129,598 | | | | 2,131,779 | |
| WNS Holdings, Ltd., ADR(a) | | | 546,970 | | | | 26,719,484 | |
| | | | | | | | 51,830,928 | |
See Notes to Financial Statements.
| Annual Report | April 30, 2020 | 61 |
| Grandeur Peak International Stalwarts Fund | Portfolio of Investments |
| | | Shares | | | Value (Note 2) | |
| Indonesia (0.49%) | | | | | | |
| Bank Tabungan Pensiunan Nasional Syariah Tbk PT | | | 31,614,900 | | | $ | 4,654,563 | |
| | | | | | | | | |
| Ireland (0.80%) | | | | | | | | |
| ICON PLC, ADR(a) | | | 47,375 | | | | 7,602,266 | |
| | | | | | | | | |
| Israel (1.12%) | | | | | | | | |
| Wix.com, Ltd.(a) | | | 81,375 | | | | 10,644,664 | |
| | | | | | | | | |
| Italy (3.93%) | | | | | | | | |
| DiaSorin SpA | | | 86,501 | | | | 14,721,275 | |
| FinecoBank Banca Fineco SpA | | | 781,479 | | | | 8,683,766 | |
| Freni Brembo SpA | | | 546,614 | | | | 4,651,308 | |
| Interpump Group SpA | | | 323,027 | | | | 9,409,069 | |
| | | | | | | | 37,465,418 | |
| | | | | | | | | |
| Japan (10.00%) | | | | | | | | |
| Japan Lifeline Co., Ltd. | | | 435,800 | | | | 5,177,701 | |
| MISUMI Group, Inc. | | | 186,100 | | | | 4,484,505 | |
| MonotaRO Co., Ltd. | | | 566,500 | | | | 18,317,616 | |
| Nihon M&A Center, Inc. | | | 792,100 | | | | 26,239,720 | |
| Seria Co., Ltd. | | | 355,800 | | | | 11,604,156 | |
| Systena Corp. | | | 1,218,300 | | | | 17,369,417 | |
| Tokyo Century Corp. | | | 141,000 | | | | 4,841,681 | |
| Tsuruha Holdings, Inc. | | | 54,600 | | | | 7,316,293 | |
| | | | | | | | 95,351,089 | |
| | | | | | | | | |
| Mexico (0.21%) | | | | | | | | |
| Regional SAB de CV(a) | | | 825,750 | | | | 2,029,342 | |
| | | | | | | | | |
| Netherlands (2.63%) | | | | | | | | |
| Aalberts NV | | | 614,458 | | | | 17,305,262 | |
| Just Eat Takeaway.com NV(a)(b)(c) | | | 76,400 | | | | 7,787,939 | |
| | | | | | | | 25,093,201 | |
| | | | | | | | | |
| Philippines (1.11%) | | | | | | | | |
| Puregold Price Club, Inc. | | | 5,954,700 | | | | 5,469,205 | |
| Wilcon Depot, Inc. | | | 17,593,800 | | | | 5,130,507 | |
| | | | | | | | 10,599,712 | |
| | | | | | | | | |
| Poland (1.34%) | | | | | | | | |
| Dino Polska SA(a)(b)(c) | | | 302,672 | | | | 12,737,787 | |
| | | | | | | | | |
| Sweden (2.78%) | | | | | | | | |
| AddTech AB, Class B | | | 178,400 | | | | 4,886,218 | |
| EQT AB(a) | | | 684,700 | | | | 9,573,181 | |
| Nibe Industrier AB, Class B | | | 359,900 | | | | 6,745,566 | |
| Sweco AB, Class B | | | 153,100 | | | | 5,272,979 | |
| | | | | | | | 26,477,944 | |
| | | | | | | | | |
| Switzerland (1.30%) | | | | | | | | |
| Partners Group Holding AG | | | 15,690 | | | | 12,350,440 | |
| | | Shares | | | Value (Note 2) | |
| Taiwan (0.54%) | | | | | | |
| Voltronic Power Technology Corp. | | | 213,700 | | | $ | 5,102,383 | |
| | | | | | | | | |
| United Arab Emirates (0.45%) | | | | | | | | |
| Network International Holdings PLC(a)(b)(c) | | | 819,800 | | | | 4,285,011 | |
| | | | | | | | | |
| United States (10.64%) | | | | | | | | |
| Accenture PLC, Class A | | | 30,250 | | | | 5,601,998 | |
| Ashtead Group PLC | | | 218,800 | | | | 5,993,803 | |
| Bank of NT Butterfield & Son, Ltd. | | | 409,457 | | | | 9,012,149 | |
| EPAM Systems, Inc.(a) | | | 142,225 | | | | 31,416,080 | |
| Genpact, Ltd. | | | 496,000 | | | | 17,077,280 | |
| Lululemon Athletica, Inc.(a) | | | 108,925 | | | | 24,342,559 | |
| Monolithic Power Systems, Inc. | | | 39,750 | | | | 7,946,422 | |
| | | | | | | | 101,390,291 | |
| | | | | | | | | |
| Vietnam (1.84%) | | | | | | | | |
| Ho Chi Minh City Development Joint Stock Commercial Bank(a) | | | 3,336,248 | | | | 2,940,523 | |
| Vietnam Dairy Products JSC | | | 1,383,960 | | | | 5,847,968 | |
| Vietnam Technological & Commercial Joint Stock Bank(a) | | | 5,669,127 | | | | 4,161,893 | |
| Vincom Retail JSC | | | 4,659,760 | | | | 4,594,326 | |
| | | | | | | | 17,544,710 | |
| | | | | | | | | |
| TOTAL COMMON STOCKS | | | | | | | | |
| (Cost $849,343,878) | | | | | | | 921,656,260 | |
| | | | | | | | | |
| TOTAL INVESTMENTS (96.69%) | | | | | | | | |
| (Cost $849,343,878) | | | | | | $ | 921,656,260 | |
| | | | | | | | | |
| Other Assets In Excess Of Liabilities (3.31%) | | | | | | | 31,549,434 | |
| | | | | | | | | |
| NET ASSETS (100.00%) | | | | | | $ | 953,205,694 | |
| (a) | Non-Income Producing Security. |
| (b) | Security exempt from registration under Rule 144A of the Securities Act of 1933. These securities may be resold in the ordinary course of business in transactions exempt from registration, normally to qualified institutional buyers. As of April 30, 2020, these securities had a total aggregate market value of $44,827,041, representing 4.70% of net assets. |
See Notes to Financial Statements.
| 62 | 1.855.377.7325 | www.GrandeurPeakGlobal.com |
| Grandeur Peak International Stalwarts Fund | Portfolio of Investments |
April 30, 2020
| (c) | Security was purchased pursuant to Regulation S under the Securities Act of 1933, which exempts securities offered and sold outside of the United States from registration. Such security cannot be sold in the United States without either an effective registration statement filed pursuant to the Securities Act of 1933, or pursuant to an exemption from registration. As of April 30, 2020, the aggregate market value of these securities was $44,827,041, representing 4.70% of net assets. |
For Fund compliance purposes, the Fund's geographical classifications refer to any one or more of the country sub-classifications used by one or more widely recognized market indexes or ratings group indexes, and/or as defined by Fund management. This definition may not apply for purposes of this report, which may combine sub-classifications for reporting ease. Geographical regions are shown as a percentage of net assets.
See Notes to Financial Statements.
| Annual Report | April 30, 2020 | 63 |
| Grandeur Peak US Stalwarts Fund | Portfolio of Investments |
April 30, 2020
| | | Shares | | | Value (Note 2) | |
| COMMON STOCKS (97.01%) | | | | | | |
| Argentina (2.27%) | | | | | | |
| Globant SA(a) | | | 1,850 | | | $ | 213,990 | |
| | | | | | | | | |
| Britain (3.43%) | | | | | | | | |
| Endava PLC, ADR(a) | | | 5,150 | | | | 225,416 | |
| Oxford Immunotec Global PLC(a) | | | 7,850 | | | | 97,811 | |
| | | | | | | | 323,227 | |
| | | | | | | | | |
| Canada (0.48%) | | | | | | | | |
| Ritchie Bros Auctioneers, Inc. | | | 1,050 | | | | 45,245 | |
| | | | | | | | | |
| China (0.69%) | | | | | | | | |
| Trip.com Group, Ltd., ADR(a) | | | 2,500 | | | | 64,400 | |
| | | | | | | | | |
| Hong Kong (1.05%) | | | | | | | | |
| Techtronic Industries Co., Ltd. | | | 13,000 | | | | 99,020 | |
| | | | | | | | | |
| India (2.41%) | | | | | | | | |
| WNS Holdings, Ltd., ADR(a) | | | 4,650 | | | | 227,153 | |
| | | | | | | | | |
| Ireland (1.58%) | | | | | | | | |
| ICON PLC, ADR(a) | | | 925 | | | | 148,434 | |
| | | | | | | | | |
| Israel (0.97%) | | | | | | | | |
| Wix.com, Ltd.(a) | | | 700 | | | | 91,567 | |
| | | | | | | | | |
| United States (84.13%) | | | | | | | | |
| 8x8, Inc.(a) | | | 4,175 | | | | 70,808 | |
| ABIOMED, Inc.(a) | | | 675 | | | | 129,094 | |
| Apollo Global Management, Inc., Class A | | | 5,800 | | | | 234,841 | |
| Ashtead Group PLC | | | 2,725 | | | | 74,649 | |
| Bank of NT Butterfield & Son, Ltd. | | | 3,100 | | | | 68,231 | |
| BioDelivery Sciences International, Inc.(a) | | | 2,847 | | | | 12,982 | |
| Blackline, Inc.(a) | | | 2,000 | | | | 121,480 | |
| Blackstone Group, Inc., Class A | | | 2,175 | | | | 113,622 | |
| CDW Corp. | | | 325 | | | | 36,010 | |
| CoreSite Realty Corp. | | | 1,175 | | | | 142,398 | |
| DexCom, Inc.(a) | | | 150 | | | | 50,280 | |
| EPAM Systems, Inc.(a) | | | 1,675 | | | | 369,990 | |
| Equinix, Inc. | | | 225 | | | | 151,920 | |
| Etsy, Inc.(a) | | | 500 | | | | 32,435 | |
| Exact Sciences Corp.(a) | | | 375 | | | | 29,618 | |
| ExlService Holdings, Inc.(a) | | | 2,000 | | | | 123,460 | |
| Fastenal Co. | | | 6,450 | | | | 233,618 | |
| First Republic Bank | | | 2,875 | | | | 299,834 | |
| Five Below, Inc.(a) | | | 1,700 | | | | 153,271 | |
| Freshpet, Inc.(a) | | | 800 | | | | 60,328 | |
| Genpact, Ltd. | | | 5,975 | | | | 205,719 | |
| Goosehead Insurance, Inc., Class A(a) | | | 2,575 | | | | 144,561 | |
| | | Shares | | | Value (Note 2) | |
| United States (continued) | | | | | | | | |
| Hamilton Lane, Inc., Class A | | | 1,450 | | | $ | 94,033 | |
| HD Supply Holdings, Inc.(a) | | | 2,350 | | | | 69,748 | |
| HealthEquity, Inc.(a) | | | 1,550 | | | | 87,219 | |
| HEICO Corp., Class A | | | 1,025 | | | | 74,138 | |
| Heska Corp.(a) | | | 2,125 | | | | 150,449 | |
| Houlihan Lokey, Inc. | | | 1,800 | | | | 106,884 | |
| IDEXX Laboratories, Inc.(a) | | | 885 | | | | 245,675 | |
| Inphi Corp.(a) | | | 1,125 | | | | 108,608 | |
| Kinsale Capital Group, Inc. | | | 1,300 | | | | 141,206 | |
| LeMaitre Vascular, Inc. | | | 4,950 | | | | 141,026 | |
| LGI Homes, Inc.(a) | | | 1,575 | | | | 95,414 | |
| Littelfuse, Inc. | | | 275 | | | | 39,941 | |
| Lululemon Athletica, Inc.(a) | | | 1,050 | | | | 234,654 | |
| Medallia, Inc.(a) | | | 2,200 | | | | 47,256 | |
| Microchip Technology, Inc. | | | 925 | | | | 81,150 | |
| Moelis & Co., Class A | | | 1,700 | | | | 50,779 | |
| Monolithic Power Systems, Inc. | | | 1,050 | | | | 209,906 | |
| Monro, Inc. | | | 875 | | | | 48,554 | |
| New Relic, Inc.(a) | | | 1,750 | | | | 93,958 | |
| NV5 Global, Inc.(a) | | | 2,125 | | | | 99,344 | |
| Old Dominion Freight Line, Inc. | | | 950 | | | | 138,025 | |
| Paycom Software, Inc.(a) | | | 1,375 | | | | 358,902 | |
| Paylocity Holding Corp.(a) | | | 950 | | | | 108,804 | |
| PJT Partners, Inc., Class A | | | 2,950 | | | | 143,488 | |
| Pluralsight, Inc., Class A(a) | | | 13,150 | | | | 216,186 | |
| Pool Corp. | | | 925 | | | | 195,786 | |
| Power Integrations, Inc. | | | 2,325 | | | | 237,963 | |
| PPD, Inc.(a) | | | 2,175 | | | | 51,983 | |
| Qualys, Inc.(a) | | | 2,475 | | | | 260,964 | |
| Rapid7, Inc.(a) | | | 1,275 | | | | 58,076 | |
| Rexford Industrial Realty, Inc. | | | 1,175 | | | | 47,846 | |
| Silicon Laboratories, Inc.(a) | | | 1,050 | | | | 102,081 | |
| STAAR Surgical Co.(a) | | | 3,000 | | | | 114,960 | |
| SVB Financial Group(a) | | | 475 | | | | 91,756 | |
| Systemax, Inc. | | | 5,150 | | | | 102,279 | |
| Terreno Realty Corp. | | | 2,349 | | | | 128,772 | |
| Texas Roadhouse, Inc. | | | 2,000 | | | | 94,180 | |
| TriMas Corp.(a) | | | 1,075 | | | | 25,628 | |
| Ulta Beauty, Inc.(a) | | | 550 | | | | 119,856 | |
| Veracyte, Inc.(a) | | | 1,100 | | | | 29,667 | |
| WW Grainger, Inc. | | | 350 | | | | 96,453 | |
| Zoetis, Inc. | | | 950 | | | | 122,845 | |
| | | | | | | | 7,925,591 | |
| | | | | | | | | |
| TOTAL COMMON STOCKS | | | | | | | | |
| (Cost $7,657,390) | | | | | | | 9,138,627 | |
| | | | | | | | | |
| TOTAL INVESTMENTS (97.01%) | | | | | | | | |
| (Cost $7,657,390) | | | | | | $ | 9,138,627 | |
| | | | | | | | | |
| Other Assets In Excess Of Liabilities (2.99%) | | | | | | | 282,134 | |
| | | | | | | | | |
| NET ASSETS (100.00%) | | | | | | $ | 9,420,761 | |
See Notes to Financial Statements.
| 64 | 1.855.377.7325 | www.GrandeurPeakGlobal.com |
| Grandeur Peak US Stalwarts Fund | Portfolio of Investments |
April 30, 2020
| (a) | Non-Income Producing Security. |
For Fund compliance purposes, the Fund's geographical classifications refer to any one or more of the country sub-classifications used by one or more widely recognized market indexes or ratings group indexes, and/or as defined by Fund management. This definition may not apply for purposes of this report, which may combine sub-classifications for reporting ease. Geographical regions are shown as a percentage of net assets.
See Notes to Financial Statements.
| Annual Report | April 30, 2020 | 65 |
| Grandeur Peak Funds® | Statements of Assets and Liabilities |
| | | Grandeur Peak Emerging Markets Opportunities Fund | | | Grandeur Peak Global Contrarian Fund | | | Grandeur Peak Global Micro Cap Fund | |
| ASSETS | | | | | | | | | | | | |
| Investments, at value (Cost - see below) | | $ | 394,827,405 | | | $ | 8,800,591 | | | $ | 28,344,097 | |
| Cash | | | 4,483,187 | | | | 45,170 | | | | 1,565,643 | |
| Foreign cash, at value (Cost $396,592, $83,273 and $3,013, respectively) | | | 398,188 | | | | 83,274 | | | | 3,019 | |
| Dividends and interest receivable | | | 866,075 | | | | 17,585 | | | | 46,134 | |
| Receivable for investments sold | | | 546,835 | | | | 63,879 | | | | 32,642 | |
| Receivable for fund shares subscribed | | | 207 | | | | 255 | | | | 60 | |
| Deferred offering cost | | | – | | | | 25,616 | | | | – | |
| Prepaid and other assets | | | 14,677 | | | | 1,838 | | | | 5,358 | |
| Total assets | | | 401,136,574 | | | | 9,038,208 | | | | 29,996,953 | |
| | | | | | | | | | | | | |
| LIABILITIES | | | | | | | | | | | | |
| Payable for investments purchased | | | 1,733 | | | | 99,841 | | | | 257,944 | |
| Foreign capital gains tax | | | 40,854 | | | | – | | | | 714 | |
| Payable for fund shares redeemed | | | 1,028,184 | | | | – | | | | 6,332 | |
| Advisory fees payable | | | 424,653 | | | | 4,277 | | | | 37,758 | |
| Administration fees payable | | | 36,234 | | | | 26,562 | | | | 13,325 | |
| Custodian fees payable | | | 108,034 | | | | 7,780 | | | | 8,284 | |
| Payable for trustee fees and expenses | | | 14,176 | | | | 289 | | | | 948 | |
| Payable for chief compliance officer fee | | | 1,844 | | | | 38 | | | | 123 | |
| Payable for principal financial officer fees | | | 368 | | | | 8 | | | | 25 | |
| Distribution and service fees payable | | | 1,978 | | | | – | | | | – | |
| Payable for transfer agency fees | | | 7,043 | | | | 5,456 | | | | 6,564 | |
| Accrued expenses and other liabilities | | | 41,857 | | | | 32,540 | | | | 31,009 | |
| Total liabilities | | | 1,706,958 | | | | 176,791 | | | | 363,026 | |
| NET ASSETS | | $ | 399,429,616 | | | $ | 8,861,417 | | | $ | 29,633,927 | |
| | | | | | | | | | | | | |
| NET ASSETS CONSISTS OF | | | | | | | | | | | | |
| Paid-in capital (Note 5) | | $ | 379,023,329 | | | $ | 10,360,875 | | | $ | 26,163,688 | |
| Total distributable earnings | | | 20,406,287 | | | | (1,499,458 | ) | | | 3,470,239 | |
| NET ASSETS | | $ | 399,429,616 | | | $ | 8,861,417 | | | $ | 29,633,927 | |
| | | | | | | | | | | | | |
| INVESTMENTS, AT COST | | $ | 364,252,201 | | | $ | 9,801,102 | | | $ | 25,115,721 | |
| | | | | | | | | | | | | |
| PRICING OF SHARES | | | | | | | | | | | | |
| Investor Class | | | | | | | | | | | | |
| Net Assets | | $ | 10,056,494 | | | $ | – | | | $ | – | |
| Net Asset Value, offering and redemption price per share | | $ | 11.07 | | | $ | – | | | $ | – | |
| Shares of beneficial interest outstanding | | | 908,087 | | | | – | | | | – | |
| Institutional Class | | | | | | | | | | | | |
| Net Assets | | $ | 389,373,122 | | | $ | 8,861,417 | | | $ | 29,633,927 | |
| Net Asset Value, offering and redemption price per share | | $ | 11.14 | | | $ | 8.78 | | | $ | 11.05 | |
| Shares of beneficial interest outstanding | | | 34,939,333 | | | | 1,009,325 | | | | 2,683,011 | |
See Notes to Financial Statements.
| 66 | 1.855.377.7325 | www.GrandeurPeakGlobal.com |
| Grandeur Peak Funds® | Statements of Assets and Liabilities |
April 30, 2020
| | | Grandeur Peak Global Opportunities Fund | | | Grandeur Peak Global Reach Fund | | | Grandeur Peak Global Stalwarts Fund | |
| ASSETS | | | | | | | | | |
| Investments, at value (Cost - see below) | | $ | 553,748,475 | | | $ | 232,209,703 | | | $ | 202,034,790 | |
| Cash | | | 6,754,679 | | | | 8,206,977 | | | | 5,143,959 | |
| Deposit with broker for short sales (Note 2) | | | – | | | | 1,000,208 | | | | – | |
| Foreign cash, at value (Cost $627,094, $31 and $5,914, respectively) | | | 629,117 | | | | 31 | | | | 5,914 | |
| Dividends and interest receivable | | | 1,084,794 | | | | 346,498 | | | | 291,032 | |
| Receivable for investments sold | | | 3,144,704 | | | | 2,507,707 | | | | 378,256 | |
| Receivable for fund shares subscribed | | | 282,522 | | | | 46,162 | | | | 33,653 | |
| Prepaid and other assets | | | 12,437 | | | | 3,620 | | | | 6,611 | |
| Total assets | | | 565,656,728 | | | | 244,320,906 | | | | 207,894,215 | |
| | | | | | | | | | | | | |
| LIABILITIES | | | | | | | | | | | | |
| Payable for investments purchased | | | 162,188 | | | | 2,563,637 | | | | 1,308,871 | |
| Foreign capital gains tax | | | – | | | | 5,760 | | | | – | |
| Payable for fund shares redeemed | | | 1,765,292 | | | | 115,298 | | | | 1,442,060 | |
| Advisory fees payable | | | 529,454 | | | | 202,887 | | | | 123,432 | |
| Administration fees payable | | | 41,777 | | | | 30,903 | | | | 18,765 | |
| Custodian fees payable | | | 64,021 | | | | 39,222 | | | | 23,635 | |
| Payable for trustee fees and expenses | | | 19,415 | | | | 7,955 | | | | 6,067 | |
| Payable for chief compliance officer fee | | | 2,526 | | | | 1,035 | | | | 789 | |
| Payable for principal financial officer fees | | | 504 | | | | 206 | | | | 157 | |
| Distribution and service fees payable | | | 17,762 | | | | 7,603 | | | | 16,037 | |
| Payable for transfer agency fees | | | 12,369 | | | | 9,774 | | | | 12,014 | |
| Accrued expenses and other liabilities | | | 55,907 | | | | 40,979 | | | | 31,921 | |
| Total liabilities | | | 2,671,215 | | | | 3,025,259 | | | | 2,983,748 | |
| NET ASSETS | | $ | 562,985,513 | | | $ | 241,295,647 | | | $ | 204,910,467 | |
| | | | | | | | | | | | | |
| NET ASSETS CONSISTS OF | | | | | | | | | | | | |
| Paid-in capital (Note 5) | | $ | 451,036,038 | | | $ | 192,277,603 | | | $ | 175,077,644 | |
| Total distributable earnings | | | 111,949,475 | | | | 49,018,044 | | | | 29,832,823 | |
| NET ASSETS | | $ | 562,985,513 | | | $ | 241,295,647 | | | $ | 204,910,467 | |
| | | | | | | | | | | | | |
| INVESTMENTS, AT COST | | $ | 447,179,947 | | | $ | 186,273,501 | | | $ | 170,372,120 | |
| | | | | | | | | | | | | |
| PRICING OF SHARES | | | | | | | | | | | | |
| Investor Class | | | | | | | | | | | | |
| Net Assets | | $ | 92,843,049 | | | $ | 40,307,439 | | | $ | 85,310,322 | |
| Net Asset Value, offering and redemption price per share | | $ | 3.24 | | | $ | 14.12 | | | $ | 14.26 | |
| Shares of beneficial interest outstanding | | | 28,692,936 | | | | 2,854,512 | | | | 5,982,410 | |
| Institutional Class | | | | | | | | | | | | |
| Net Assets | | $ | 470,142,464 | | | $ | 200,988,208 | | | $ | 119,600,145 | |
| Net Asset Value, offering and redemption price per share | | $ | 3.29 | | | $ | 14.19 | | | $ | 14.37 | |
| Shares of beneficial interest outstanding | | | 142,973,678 | | | | 14,165,057 | | | | 8,325,257 | |
See Notes to Financial Statements.
| Annual Report | April 30, 2020 | 67 |
| Grandeur Peak Funds® | Statements of Assets and Liabilities |
April 30, 2020
| | | Grandeur Peak International Opportunities Fund | | | Grandeur Peak International Stalwarts Fund | | | Grandeur Peak US Stalwarts Fund | |
| ASSETS | | | | | | | | | | | | |
| Investments, at value (Cost - see below) | | $ | 511,269,235 | | | $ | 921,656,260 | | | $ | 9,138,627 | |
| Cash | | | 10,574,900 | | | | 31,076,088 | | | | 850,239 | |
| Foreign cash, at value (Cost $28, $336,624 and $–, respectively) | | | 28 | | | | 336,621 | | | | – | |
| Dividends and interest receivable | | | 1,396,192 | | | | 1,733,212 | | | | 1,989 | |
| Receivable for investments sold | | | 1,174,692 | | | | 388,927 | | | | 6,409 | |
| Receivable for fund shares subscribed | | | 188,633 | | | | 2,204,849 | | | | 15,050 | |
| Receivable due from advisor | | | – | | | | – | | | | 19,626 | |
| Deferred offering cost | | | – | | | | – | | | | 49,224 | |
| Prepaid and other assets | | | 12,354 | | | | 12,326 | | | | – | |
| Total assets | | | 524,616,034 | | | | 957,408,283 | | | | 10,081,164 | |
| | | | | | | | | | | | | |
| LIABILITIES | | | | | | | | | | | | |
| Payable for investments purchased | | | – | | | | 3,234,483 | | | | 577,089 | |
| Foreign capital gains tax | | | 36,510 | | | | – | | | | – | |
| Payable for fund shares redeemed | | | 8,705,707 | | | | 146,984 | | | | – | |
| Advisory fees payable | | | 504,615 | | | | 564,242 | | | | – | |
| Administration fees payable | | | 41,767 | | | | 54,111 | | | | 2,443 | |
| Custodian fees payable | | | 73,385 | | | | 81,682 | | | | 2,900 | |
| Payable for trustee fees and expenses | | | 18,739 | | | | 28,650 | | | | 40 | |
| Payable for chief compliance officer fee | | | 2,438 | | | | 3,727 | | | | 14 | |
| Payable for principal financial officer fees | | | 486 | | | | 744 | | | | 3 | |
| Distribution and service fees payable | | | 7,906 | | | | 15,264 | | | | – | |
| Payable for transfer agency fees | | | 6,944 | | | | 25,028 | | | | 3,369 | |
| Accrued expenses and other liabilities | | | 46,018 | | | | 47,674 | | | | 74,545 | |
| Total liabilities | | | 9,444,515 | | | | 4,202,589 | | | | 660,403 | |
| NET ASSETS | | $ | 515,171,519 | | | $ | 953,205,694 | | | $ | 9,420,761 | |
| | | | | | | | | | | | | |
| NET ASSETS CONSISTS OF | | | | | | | | | | | | |
| Paid-in capital (Note 5) | | $ | 438,551,074 | | | $ | 892,927,670 | | | $ | 7,925,406 | |
| Total distributable earnings | | | 76,620,445 | | | | 60,278,024 | | | | 1,495,355 | |
| NET ASSETS | | $ | 515,171,519 | | | $ | 953,205,694 | | | $ | 9,420,761 | |
| | | | | | | | | | | | | |
| INVESTMENTS, AT COST | | $ | 431,565,232 | | | $ | 849,343,878 | | | $ | 7,657,390 | |
| | | | | | | | | | | | | |
| PRICING OF SHARES | | | | | | | | | | | | |
| Investor Class | | | | | | | | | | | | |
| Net Assets | | $ | 41,351,200 | | | $ | 82,289,379 | | | $ | – | |
| Net Asset Value, offering and redemption price per share | | $ | 3.04 | | | $ | 14.40 | | | $ | – | |
| Shares of beneficial interest outstanding | | | 13,591,057 | | | | 5,713,709 | | | | – | |
| Institutional Class | | | | | | | | | | | | |
| Net Assets | | $ | 473,820,319 | | | $ | 870,916,315 | | | $ | 9,420,761 | |
| Net Asset Value, offering and redemption price per share | | $ | 3.06 | | | $ | 14.46 | | | $ | 13.15 | |
| Shares of beneficial interest outstanding | | | 154,683,765 | | | | 60,217,824 | | | | 716,575 | |
See Notes to Financial Statements.
| 68 | 1.855.377.7325 | www.GrandeurPeakGlobal.com |
| Grandeur Peak Funds® | Statements of Operations |
For the Year Ended April 30, 2020
| | | Grandeur Peak Emerging Markets Opportunities Fund | | | Grandeur Peak Global Contrarian Fund(a) | | | Grandeur Peak Global Micro Cap Fund | |
| INVESTMENT INCOME | | | | | | | | | |
| Dividends | | $ | 8,893,857 | | | $ | 105,492 | | | $ | 767,261 | |
| Interest | | | 7,377 | | | | – | | | | 2,178 | |
| Foreign taxes withheld | | | (792,697 | ) | | | (5,331 | ) | | | (73,409 | ) |
| Total investment income | | | 8,108,537 | | | | 100,161 | | | | 696,030 | |
| | | | | | | | | | | | | |
| EXPENSES | | | | | | | | | | | | |
| Investment advisor fees (Note 6) | | | 6,052,077 | | | | 41,519 | | | | 500,016 | |
| Recoupment of previously waived fees (Note 6) | | | – | | | | – | | | | 4,502 | |
| Administrative fees | | | 174,480 | | | | 33,557 | | | | 37,123 | |
| Distribution and service fees - Investor Class | | | 28,361 | | | | – | | | | – | |
| Transfer agent fees | | | 39,388 | | | | 18,886 | | | | 37,447 | |
| Professional fees | | | 52,082 | | | | 22,625 | | | | 33,213 | |
| Printing fees | | | 11,334 | | | | 1,691 | | | | 2,442 | |
| Registration fees | | | 35,375 | | | | 1,310 | | | | 20,420 | |
| Custodian fees | | | 441,258 | | | | 31,154 | | | | 46,430 | |
| Trustee fees and expenses | | | 21,899 | | | | 368 | | | | 1,520 | |
| Chief compliance officer fees | | | 11,121 | | | | 107 | | | | 820 | |
| Principal financial officer fees | | | 2,158 | | | | 21 | | | | 159 | |
| Offering costs | | | – | | | | 40,601 | | | | – | |
| Other expenses | | | 22,468 | | | | 3,648 | | | | 5,887 | |
| Total expenses | | | 6,892,001 | | | | 195,487 | | | | 689,979 | |
| Voluntary waiver of investment advisory fees (Note 6) | | | (77,162 | ) | | | – | | | | – | |
| Less fees waived/reimbursed by investment advisor (Note 6) | | | – | | | | (139,213 | ) | | | (23,568 | ) |
| Total net expenses | | | 6,814,839 | | | | 56,274 | | | | 666,411 | |
| NET INVESTMENT INCOME | | | 1,293,698 | | | | 43,887 | | | | 29,619 | |
| | | | | | | | | | | | | |
| REALIZED AND UNREALIZED GAIN/(LOSS) ON INVESTMENTS | | | | | | | | | | | | |
| Net realized gain/(loss) on investments | | | (672,347 | ) | | | (517,057 | ) | | | 736,377 | |
| Net realized loss on foreign currency transactions | | | (216,510 | ) | | | (6,993 | ) | | | (25,135 | ) |
| Net realized gain/(loss) | | | (888,857 | ) | | | (524,050 | ) | | | 711,242 | |
| Net change in unrealized depreciation on investments (net of change in foreign capital gains tax of $(551,377), $0 and $(6,723), respectively) | | | (27,810,543 | ) | | | (1,000,511 | ) | | | (1,057,309 | ) |
| Net change in unrealized appreciation/(depreciation) on translation of assets and liabilities in foreign currencies | | | (1,253 | ) | | | 239 | | | | 471 | |
| Net change in unrealized depreciation | | | (27,811,796 | ) | | | (1,000,272 | ) | | | (1,056,838 | ) |
| NET REALIZED AND UNREALIZED LOSS ON INVESTMENTS AND FOREIGN CURRENCY TRANSACTIONS | | | (28,700,653 | ) | | | (1,524,322 | ) | | | (345,596 | ) |
| NET DECREASE IN NET ASSETS RESULTING FROM OPERATIONS | | $ | (27,406,955 | ) | | $ | (1,480,435 | ) | | $ | (315,977 | ) |
| (a) | For the period from September 18, 2019 (Commencement of Operations) to April 30, 2020. |
See Notes to Financial Statements.
| Annual Report | April 30, 2020 | 69 |
| Grandeur Peak Funds® | Statements of Operations |
For the Year Ended April 30, 2020
| | | Grandeur Peak Global Opportunities Fund | | | Grandeur Peak Global Reach Fund | | | Grandeur Peak Global Stalwarts Fund | |
| INVESTMENT INCOME | | | | | | | | | | | | |
| Dividends | | $ | 9,670,586 | | | $ | 4,809,489 | | | $ | 2,337,991 | |
| Interest | | | 5,527 | | | | 11,148 | | | | – | |
| Foreign taxes withheld | | | (782,000 | ) | | | (404,800 | ) | | | (153,365 | ) |
| Total investment income | | | 8,894,113 | | | | 4,415,837 | | | | 2,184,626 | |
| | | | | | | | | | | | | |
| EXPENSES | | | | | | | | | | | | |
| Investment advisor fees (Note 6) | | | 7,999,744 | | | | 3,285,964 | | | | 1,514,573 | |
| Administrative fees | | | 231,055 | | | | 132,919 | | | | 83,675 | |
| Distribution and service fees - Investor Class | | | 278,372 | | | | 119,941 | | | | 211,662 | |
| Transfer agent fees | | | 65,637 | | | | 54,222 | | | | 62,786 | |
| Professional fees | | | 51,686 | | | | 46,030 | | | | 32,253 | |
| Printing fees | | | 25,186 | | | | 16,792 | | | | 11,735 | |
| Registration fees | | | 35,596 | | | | 34,917 | | | | 34,531 | |
| Custodian fees | | | 261,697 | | | | 190,764 | | | | 109,575 | |
| Trustee fees and expenses | | | 30,802 | | | | 13,371 | | | | 9,281 | |
| Chief compliance officer fees | | | 15,865 | | | | 7,366 | | | | 4,652 | |
| Principal financial officer fees | | | 3,083 | | | | 1,428 | | | | 903 | |
| Other expenses | | | 28,579 | | | | 21,294 | | | | 11,546 | |
| Total expenses | | | 9,027,302 | | | | 3,925,008 | | | | 2,087,172 | |
| Voluntary waiver of investment advisory fees (Note 6) | | | (211,627 | ) | | | – | | | | – | |
| Total net expenses | | | 8,815,675 | | | | 3,925,008 | | | | 2,087,172 | |
| NET INVESTMENT INCOME | | | 78,438 | | | | 490,829 | | | | 97,454 | |
| | | | | | | | | | | | | |
| REALIZED AND UNREALIZED GAIN/(LOSS) ON INVESTMENTS | | | | | | | | | | | | |
| Net realized gain/(loss) on investments | | | 26,937,639 | | | | 10,640,385 | | | | (224,791 | ) |
| Net realized loss on foreign currency transactions | | | (243,041 | ) | | | (104,396 | ) | | | (28,431 | ) |
| Net realized gain/(loss) | | | 26,694,598 | | | | 10,535,989 | | | | (253,222 | ) |
| Net change in unrealized depreciation on investments (net of change in foreign capital gains tax of $(283,761), $(156,564) and $(193,025), respectively) | | | (44,213,883 | ) | | | (15,664,769 | ) | | | (1,540,839 | ) |
| Net change in unrealized appreciation on translation of assets and liabilities in foreign currencies | | | 444 | | | | 1,727 | | | | 4,253 | |
| Net change in unrealized depreciation | | | (44,213,439 | ) | | | (15,663,042 | ) | | | (1,536,586 | ) |
| NET REALIZED AND UNREALIZED LOSS ON INVESTMENTS AND FOREIGN CURRENCY TRANSACTIONS | | | (17,518,841 | ) | | | (5,127,053 | ) | | | (1,789,808 | ) |
| NET DECREASE IN NET ASSETS RESULTING FROM OPERATIONS | | $ | (17,440,403 | ) | | $ | (4,636,224 | ) | | $ | (1,692,354 | ) |
See Notes to Financial Statements.
| 70 | 1.855.377.7325 | www.GrandeurPeakGlobal.com |
| Grandeur Peak Funds® | Statements of Operations |
For the Year Ended April 30, 2020
| | | Grandeur Peak International Opportunities Fund | | | Grandeur Peak International Stalwarts Fund | | | Grandeur Peak US Stalwarts Fund(a) | |
| INVESTMENT INCOME | | | | | | | | | | | | |
| Dividends | | $ | 11,136,825 | | | $ | 10,048,535 | | | $ | 3,001 | |
| Interest | | | 7,360 | | | | – | | | | – | |
| Foreign taxes withheld | | | (1,084,430 | ) | | | (766,700 | ) | | | – | |
| Total investment income | | | 10,059,755 | | | | 9,281,835 | | | | 3,001 | |
| | | | | | | | | | | | | |
| EXPENSES | | | | | | | | | | | | |
| Investment advisor fees (Note 6) | | | 7,971,400 | | | | 5,975,240 | | | | 4,617 | |
| Administrative fees | | | 231,283 | | | | 259,863 | | | | 2,443 | |
| Distribution and service fees - Investor Class | | | 123,690 | | | | 191,319 | | | | – | |
| Transfer agent fees | | | 39,404 | | | | 120,559 | | | | 3,369 | |
| Professional fees | | | 50,883 | | | | 48,043 | | | | 17,695 | |
| Printing fees | | | 20,572 | | | | 34,107 | | | | 1,527 | |
| Registration fees | | | 37,301 | | | | 44,711 | | | | – | |
| Custodian fees | | | 320,362 | | | | 321,342 | | | | 2,900 | |
| Trustee fees and expenses | | | 30,136 | | | | 41,849 | | | | 40 | |
| Chief compliance officer fees | | | 15,858 | | | | 18,449 | | | | 14 | |
| Principal financial officer fees | | | 3,070 | | | | 3,605 | | | | 3 | |
| Offering costs | | | – | | | | – | | | | 6,401 | |
| Other expenses | | | 28,452 | | | | 23,090 | | | | 758 | |
| Total expenses | | | 8,872,411 | | | | 7,082,177 | | | | 39,767 | |
| Voluntary waiver of investment advisory fees (Note 6) | | | (209,433 | ) | | | – | | | | – | |
| Less fees waived/reimbursed by investment advisor (Note 6) | | | – | | | | – | | | | (33,383 | ) |
| Total net expenses | | | 8,662,978 | | | | 7,082,177 | | | | 6,384 | |
| NET INVESTMENT INCOME/(LOSS) | | | 1,396,777 | | | | 2,199,658 | | | | (3,383 | ) |
| | | | | | | | | | | | | |
| REALIZED AND UNREALIZED GAIN/(LOSS) ON INVESTMENTS | | | | | | | | | | | | |
| Net realized gain/(loss) on investments | | | 18,546,849 | | | | (9,045,273 | ) | | | 9,525 | |
| Net realized gain/(loss) on foreign currency transactions | | | 18,692 | | | | (152,895 | ) | | | 47 | |
| Net realized gain/(loss) | | | 18,565,541 | | | | (9,198,168 | ) | | | 9,572 | |
| Net change in unrealized appreciation/(depreciation) on investments (net of change in foreign capital gains tax of $(111,289), $(728,821) and $0, respectively) | | | (59,866,761 | ) | | | (14,977,101 | ) | | | 1,481,237 | |
| Net change in unrealized appreciation on translation of assets and liabilities in foreign currencies | | | 4,060 | | | | 6,294 | | | | 1 | |
| Net change in unrealized appreciation/(depreciation) | | | (59,862,701 | ) | | | (14,970,807 | ) | | | 1,481,238 | |
| NET REALIZED AND UNREALIZED GAIN/(LOSS) ON INVESTMENTS AND FOREIGN CURRENCY TRANSACTIONS | | | (41,297,160 | ) | | | (24,168,975 | ) | | | 1,490,810 | |
| NET INCREASE/(DECREASE) IN NET ASSETS RESULTING FROM OPERATIONS | | $ | (39,900,383 | ) | | $ | (21,969,317 | ) | | $ | 1,487,427 | |
| (a) | For the period from March 20, 2020 (Commencement of Operations) to April 30, 2020. |
See Notes to Financial Statements.
| Annual Report | April 30, 2020 | 71 |
| Grandeur Peak Emerging Markets Opportunities Fund | Statements of Changes in Net Assets |
| | | For the Year Ended April 30, 2020 | | | For the Year Ended April 30, 2019 | |
| OPERATIONS | | | | | | | | |
| Net investment income | | $ | 1,293,698 | | | $ | 1,227,659 | |
| Net realized loss | | | (888,857 | ) | | | (9,273,234 | ) |
| Net change in unrealized depreciation | | | (27,811,796 | ) | | | (30,664,882 | ) |
| Net decrease in net assets resulting from operations | | | (27,406,955 | ) | | | (38,710,457 | ) |
| | | | | | | | | |
| DISTRIBUTIONS TO SHAREHOLDERS (NOTE 3) | | | | | | | | |
| Investor Class | | | (8,164 | ) | | | (127,582 | ) |
| Institutional Class | | | (986,840 | ) | | | (4,727,858 | ) |
| Net decrease in net assets from distributions | | | (995,004 | ) | | | (4,855,440 | ) |
| | | | | | | | | |
| CAPITAL SHARE TRANSACTIONS (NOTE 5) | | | | | | | | |
| Investor Class | | | | | | | | |
| Proceeds from sales of shares | | | 451,669 | | | | 1,059,350 | |
| Distributions reinvested | | | 8,003 | | | | 125,079 | |
| Cost of shares redeemed | | | (3,475,235 | ) | | | (4,014,777 | ) |
| Redemption fees | | | – | | | | 7 | |
| Net decrease from capital shares transactions | | | (3,015,563 | ) | | | (2,830,341 | ) |
| | | | | | | | | |
| Institutional Class | | | | | | | | |
| Proceeds from sales of shares | | | 67,811,609 | | | | 90,993,584 | |
| Distributions reinvested | | | 920,902 | | | | 4,442,600 | |
| Cost of shares redeemed | | | (104,284,799 | ) | | | (72,570,056 | ) |
| Redemption fees | | | 850 | | | | 668 | |
| Net increase/(decrease) from capital shares transactions | | | (35,551,438 | ) | | | 22,866,796 | |
| | | | | | | | | |
| Net decrease in net assets | | | (66,968,960 | ) | | | (23,529,442 | ) |
| | | | | | | | | |
| NET ASSETS | | | | | | | | |
| Beginning of year | | | 466,398,576 | | | | 489,928,018 | |
| End of year | | $ | 399,429,616 | | | $ | 466,398,576 | |
| | | | | | | | | |
| | | | | | | | | |
| OTHER INFORMATION | | | | | | | | |
| Shares Transactions | | | | | | | | |
| Investor Class | | | | | | | | |
| Issued | | | 40,303 | | | | 93,074 | |
| Issued to shareholders in reinvestment of distributions | | | 631 | | | | 12,299 | |
| Redeemed | | | (306,328 | ) | | | (362,466 | ) |
| Net decrease in share transactions | | | (265,394 | ) | | | (257,093 | ) |
| | | | | | | | | |
| Institutional Class | | | | | | | | |
| Issued | | | 5,981,655 | | | | 8,122,212 | |
| Issued to shareholders in reinvestment of distributions | | | 72,228 | | | | 434,697 | |
| Redeemed | | | (9,192,424 | ) | | | (6,406,798 | ) |
| Net increase/(decrease) in share transactions | | | (3,138,541 | ) | | | 2,150,111 | |
See Notes to Financial Statements.
| 72 | 1.855.377.7325 | www.GrandeurPeakGlobal.com |
| Grandeur Peak Global Contrarian Fund | Statements of Changes in Net Assets |
| | | For the Period September 18, 2019 (Commencement of Operations) to April 30, 2020 | |
| OPERATIONS | | | | |
| Net investment income | | $ | 43,887 | |
| Net realized loss | | | (524,050 | ) |
| Net change in unrealized depreciation | | | (1,000,272 | ) |
| Net decrease in net assets resulting from operations | | | (1,480,435 | ) |
| | | | | |
| DISTRIBUTIONS TO SHAREHOLDERS (NOTE 3) | | | | |
| Institutional Class | | | (19,023 | ) |
| Net decrease in net assets from distributions | | | (19,023 | ) |
| | | | | |
| CAPITAL SHARE TRANSACTIONS (NOTE 5) | | | | |
| Institutional Class | | | | |
| Proceeds from sales of shares | | | 12,724,690 | |
| Distributions reinvested | | | 18,940 | |
| Cost of shares redeemed | | | (2,384,958 | ) |
| Redemption fees | | | 2,203 | |
| Net increase from capital shares transactions | | | 10,360,875 | |
| | | | | |
| Net increase in net assets | | | 8,861,417 | |
| | | | | |
| NET ASSETS | | | | |
| Beginning of period | | | – | |
| End of period | | $ | 8,861,417 | |
| | | | | |
| OTHER INFORMATION | | | | |
| Shares Transactions | | | | |
| Institutional Class | | | | |
| Issued | | | 1,260,722 | |
| Issued to shareholders in reinvestment of distributions | | | 1,747 | |
| Redeemed | | | (253,144 | ) |
| Net increase in share transactions | | | 1,009,325 | |
See Notes to Financial Statements.
| Annual Report | April 30, 2020 | 73 |
| Grandeur Peak Global Micro Cap Fund | Statements of Changes in Net Assets |
| | | For the Year Ended April 30, 2020 | | | For the Year Ended April 30, 2019 | |
| OPERATIONS | | | | | | | | |
| Net investment income/(loss) | | $ | 29,619 | | | $ | (22,768 | ) |
| Net realized gain | | | 711,242 | | | | 213,901 | |
| Net change in unrealized depreciation | | | (1,056,838 | ) | | | (3,433,311 | ) |
| Net decrease in net assets resulting from operations | | | (315,977 | ) | | | (3,242,178 | ) |
| | | | | | | | | |
| DISTRIBUTIONS TO SHAREHOLDERS (NOTE 3) | | | | | | | | |
| Institutional Class | | | (250,282 | ) | | | (2,218,023 | ) |
| Net decrease in net assets from distributions | | | (250,282 | ) | | | (2,218,023 | ) |
| | | | | | | | | |
| CAPITAL SHARE TRANSACTIONS (NOTE 5) | | | | | | | | |
| Institutional Class | | | | | | | | |
| Proceeds from sales of shares | | | 2,296,880 | | | | 1,235,898 | |
| Distributions reinvested | | | 235,712 | | | | 2,094,860 | |
| Cost of shares redeemed | | | (7,986,889 | ) | | | (3,925,444 | ) |
| Redemption fees | | | 2 | | | | 18 | |
| Net decrease from capital shares transactions | | | (5,454,295 | ) | | | (594,668 | ) |
| | | | | | | | | |
| Net decrease in net assets | | | (6,020,554 | ) | | | (6,054,869 | ) |
| | | | | | | | | |
| NET ASSETS | | | | | | | | |
| Beginning of year | | | 35,654,481 | | | | 41,709,350 | |
| End of year | | $ | 29,633,927 | | | $ | 35,654,481 | |
| | | | | | | | | |
| | | | | | | | | |
| OTHER INFORMATION | | | | | | | | |
| Shares Transactions | | | | | | | | |
| Institutional Class | | | | | | | | |
| Issued | | | 217,579 | | | | 107,279 | |
| Issued to shareholders in reinvestment of distributions | | | 18,872 | | | | 207,617 | |
| Redeemed | | | (706,293 | ) | | | (341,842 | ) |
| Net decrease in share transactions | | | (469,842 | ) | | | (26,946 | ) |
See Notes to Financial Statements.
| 74 | 1.855.377.7325 | www.GrandeurPeakGlobal.com |
| Grandeur Peak Global Opportunities Fund | Statements of Changes in Net Assets |
| | | For the Year Ended April 30, 2020 | | | For the Year Ended April 30, 2019 | |
| OPERATIONS | | | | | | | | |
| Net investment income | | $ | 78,438 | | | $ | 535,030 | |
| Net realized gain | | | 26,694,598 | | | | 48,492,349 | |
| Net change in unrealized depreciation | | | (44,213,439 | ) | | | (76,714,505 | ) |
| Net decrease in net assets resulting from operations | | | (17,440,403 | ) | | | (27,687,126 | ) |
| | | | | | | | | |
| DISTRIBUTIONS TO SHAREHOLDERS (NOTE 3) | | | | | | | | |
| Investor Class | | | (6,708,303 | ) | | | (13,296,063 | ) |
| Institutional Class | | | (30,103,204 | ) | | | (47,299,225 | ) |
| Net decrease in net assets from distributions | | | (36,811,507 | ) | | | (60,595,288 | ) |
| | | | | | | | | |
| CAPITAL SHARE TRANSACTIONS (NOTE 5) | | | | | | | | |
| Investor Class | | | | | | | | |
| Proceeds from sales of shares | | | 7,454,239 | | | | 12,071,234 | |
| Distributions reinvested | | | 6,371,304 | | | | 12,221,920 | |
| Cost of shares redeemed | | | (41,539,676 | ) | | | (60,190,701 | ) |
| Redemption fees | | | 754 | | | | 1,633 | |
| Net decrease from capital shares transactions | | | (27,713,379 | ) | | | (35,895,914 | ) |
| | | | | | | | | |
| Institutional Class | | | | | | | | |
| Proceeds from sales of shares | | | 65,579,216 | | | | 44,492,723 | |
| Distributions reinvested | | | 28,060,062 | | | | 44,606,172 | |
| Cost of shares redeemed | | | (103,299,952 | ) | | | (90,165,710 | ) |
| Redemption fees | | | 4,046 | | | | 3,396 | |
| Net decrease from capital shares transactions | | | (9,656,628 | ) | | | (1,063,419 | ) |
| | | | | | | | | |
| Net decrease in net assets | | | (91,621,917 | ) | | | (125,241,747 | ) |
| | | | | | | | | |
| NET ASSETS | | | | | | | | |
| Beginning of year | | | 654,607,430 | | | | 779,849,177 | |
| End of year | | $ | 562,985,513 | | | $ | 654,607,430 | |
| | | | | | | | | |
| OTHER INFORMATION | | | | | | | | |
| Shares Transactions | | | | | | | | |
| Investor Class | | | | | | | | |
| Issued | | | 2,224,286 | | | | 3,435,546 | |
| Issued to shareholders in reinvestment of distributions | | | 1,750,358 | | | | 4,243,722 | |
| Redeemed | | | (12,872,148 | ) | | | (17,770,409 | ) |
| Net decrease in share transactions | | | (8,897,504 | ) | | | (10,091,141 | ) |
| | | | | | | | | |
| Institutional Class | | | | | | | | |
| Issued | | | 19,482,616 | | | | 12,712,597 | |
| Issued to shareholders in reinvestment of distributions | | | 7,604,353 | | | | 15,328,581 | |
| Redeemed | | | (32,775,945 | ) | | | (27,328,207 | ) |
| Net increase/(decrease) in share transactions | | | (5,688,976 | ) | | | 712,971 | |
See Notes to Financial Statements.
| Annual Report | April 30, 2020 | 75 |
| Grandeur Peak Global Reach Fund | Statements of Changes in Net Assets |
| | | For the Year Ended April 30, 2020 | | | For the Year Ended April 30, 2019 | |
| OPERATIONS | | | | | | | | |
| Net investment income | | $ | 490,829 | | | $ | 844,408 | |
| Net realized gain | | | 10,535,989 | | | | 20,115,164 | |
| Net change in unrealized depreciation | | | (15,663,042 | ) | | | (30,255,494 | ) |
| Net decrease in net assets resulting from operations | | | (4,636,224 | ) | | | (9,295,922 | ) |
| | | | | | | | | |
| DISTRIBUTIONS TO SHAREHOLDERS (NOTE 3) | | | | | | | | |
| Investor Class | | | (1,188,362 | ) | | | (5,034,062 | ) |
| Institutional Class | | | (6,944,162 | ) | | | (24,526,234 | ) |
| Net decrease in net assets from distributions | | | (8,132,524 | ) | | | (29,560,296 | ) |
| | | | | | | | | |
| CAPITAL SHARE TRANSACTIONS (NOTE 5) | | | | | | | | |
| Investor Class | | | | | | | | |
| Proceeds from sales of shares | | | 7,664,510 | | | | 6,349,549 | |
| Distributions reinvested | | | 1,160,085 | | | | 4,744,648 | |
| Cost of shares redeemed | | | (24,000,795 | ) | | | (13,942,928 | ) |
| Redemption fees | | | 243 | | | | 126 | |
| Net decrease from capital shares transactions | | | (15,175,957 | ) | | | (2,848,605 | ) |
| | | | | | | | | |
| Institutional Class | | | | | | | | |
| Proceeds from sales of shares | | | 30,887,024 | | | | 16,753,765 | |
| Distributions reinvested | | | 6,260,838 | | | | 22,514,921 | |
| Cost of shares redeemed | | | (96,958,918 | ) | | | (36,706,628 | ) |
| Redemption fees | | | 1,537 | | | | 213 | |
| Net increase/(decrease) from capital shares transactions | | | (59,809,519 | ) | | | 2,562,271 | |
| | | | | | | | | |
| Net decrease in net assets | | | (87,754,224 | ) | | | (39,142,552 | ) |
| | | | | | | | | |
| NET ASSETS | | | | | | | | |
| Beginning of year | | | 329,049,871 | | | | 368,192,423 | |
| End of year | | $ | 241,295,647 | | | $ | 329,049,871 | |
| | | | | | | | | |
| OTHER INFORMATION | | | | | | | | |
| Shares Transactions | | | | | | | | |
| Investor Class | | | | | | | | |
| Issued | | | 602,908 | | | | 410,809 | |
| Issued to shareholders in reinvestment of distributions | | | 72,733 | | | | 381,403 | |
| Redeemed | | | (1,579,288 | ) | | | (918,342 | ) |
| Net decrease in share transactions | | | (903,647 | ) | | | (126,130 | ) |
| | | | | | | | | |
| Institutional Class | | | | | | | | |
| Issued | | | 2,095,909 | | | | 1,076,282 | |
| Issued to shareholders in reinvestment of distributions | | | 391,058 | | | | 1,804,077 | |
| Redeemed | | | (6,457,674 | ) | | | (2,500,050 | ) |
| Net increase/(decrease) in share transactions | | | (3,970,707 | ) | | | 380,309 | |
See Notes to Financial Statements.
| 76 | 1.855.377.7325 | www.GrandeurPeakGlobal.com |
| Grandeur Peak Global Stalwarts Fund | Statements of Changes in Net Assets |
| | | For the Year Ended April 30, 2020 | | | For the Year Ended April 30, 2019 | |
| OPERATIONS | | | | | | | | |
| Net investment income | | $ | 97,454 | | | $ | 318,633 | |
| Net realized gain/(loss) | | | (253,222 | ) | | | 4,096,782 | |
| Net change in unrealized depreciation | | | (1,536,586 | ) | | | (1,425,050 | ) |
| Net increase/(decrease) in net assets resulting from operations | | | (1,692,354 | ) | | | 2,990,365 | |
| | | | | | | | | |
| DISTRIBUTIONS TO SHAREHOLDERS (NOTE 3) | | | | | | | | |
| Investor Class | | | (1,469,313 | ) | | | (2,285,402 | ) |
| Institutional Class | | | (1,886,642 | ) | | | (2,952,434 | ) |
| Net decrease in net assets from distributions | | | (3,355,955 | ) | | | (5,237,836 | ) |
| | | | | | | | | |
| CAPITAL SHARE TRANSACTIONS (NOTE 5) | | | | | | | | |
| Investor Class | | | | | | | | |
| Proceeds from sales of shares | | | 18,760,212 | | | | 32,838,523 | |
| Distributions reinvested | | | 1,431,115 | | | | 2,227,413 | |
| Cost of shares redeemed | | | (22,089,480 | ) | | | (36,091,435 | ) |
| Redemption fees | | | 5,329 | | | | 10,751 | |
| Net decrease from capital shares transactions | | | (1,892,824 | ) | | | (1,014,748 | ) |
| | | | | | | | | |
| Institutional Class | | | | | | | | |
| Proceeds from sales of shares | | | 38,109,836 | | | | 37,702,923 | |
| Distributions reinvested | | | 1,647,207 | | | | 2,636,334 | |
| Cost of shares redeemed | | | (27,260,248 | ) | | | (25,830,716 | ) |
| Redemption fees | | | 20,718 | | | | 3,063 | |
| Net increase from capital shares transactions | | | 12,517,513 | | | | 14,511,604 | |
| | | | | | | | | |
| Net increase in net assets | | | 5,576,380 | | | | 11,249,385 | |
| | | | | | | | | |
| NET ASSETS | | | | | | | | |
| Beginning of year | | | 199,334,087 | | | | 188,084,702 | |
| End of year | | $ | 204,910,467 | | | $ | 199,334,087 | |
| | | | | | | | | |
| OTHER INFORMATION | | | | | | | | |
| Shares Transactions | | | | | | | | |
| Investor Class | | | | | | | | |
| Issued | | | 1,356,611 | | | | 2,290,756 | |
| Issued to shareholders in reinvestment of distributions | | | 90,922 | | | | 187,493 | |
| Redeemed | | | (1,559,169 | ) | | | (2,529,238 | ) |
| Net decrease in share transactions | | | (111,636 | ) | | | (50,989 | ) |
| | | | | | | | | |
| Institutional Class | | | | | | | | |
| Issued | | | 2,855,814 | | | | 2,668,874 | |
| Issued to shareholders in reinvestment of distributions | | | 103,990 | | | | 220,614 | |
| Redeemed | | | (1,932,732 | ) | | | (1,899,776 | ) |
| Net increase in share transactions | | | 1,027,072 | | | | 989,712 | |
See Notes to Financial Statements.
| Annual Report | April 30, 2020 | 77 |
| Grandeur Peak International Opportunities Fund | Statements of Changes in Net Assets |
| | | For the Year Ended April 30, 2020 | | | For the Year Ended April 30, 2019 | |
| OPERATIONS | | | | | | | | |
| Net investment income | | $ | 1,396,777 | | | $ | 2,792,585 | |
| Net realized gain | | | 18,565,541 | | | | 37,319,295 | |
| Net change in unrealized depreciation | | | (59,862,701 | ) | | | (114,461,975 | ) |
| Net decrease in net assets resulting from operations | | | (39,900,383 | ) | | | (74,350,095 | ) |
| | | | | | | | | |
| DISTRIBUTIONS TO SHAREHOLDERS (NOTE 3) | | | | | | | | |
| Investor Class | | | (1,839,214 | ) | | | (6,654,430 | ) |
| Institutional Class | | | (22,483,478 | ) | | | (62,445,383 | ) |
| Net decrease in net assets from distributions | | | (24,322,692 | ) | | | (69,099,813 | ) |
| | | | | | | | | |
| CAPITAL SHARE TRANSACTIONS (NOTE 5) | | | | | | | | |
| Investor Class | | | | | | | | |
| Proceeds from sales of shares | | | 4,655,083 | | | | 13,888,009 | |
| Distributions reinvested | | | 1,750,795 | | | | 6,248,519 | |
| Cost of shares redeemed | | | (17,993,458 | ) | | | (27,708,151 | ) |
| Redemption fees | | | 2,029 | | | | 3,291 | |
| Net decrease from capital shares transactions | | | (11,585,551 | ) | | | (7,568,332 | ) |
| | | | | | | | | |
| Institutional Class | | | | | | | | |
| Proceeds from sales of shares | | | 66,126,881 | | | | 98,259,521 | |
| Distributions reinvested | | | 20,460,565 | | | | 56,560,067 | |
| Cost of shares redeemed | | | (206,920,088 | ) | | | (184,500,982 | ) |
| Redemption fees | | | 1,152 | | | | 2,687 | |
| Net decrease from capital shares transactions | | | (120,331,490 | ) | | | (29,678,707 | ) |
| | | | | | | | | |
| Net decrease in net assets | | | (196,140,116 | ) | | | (180,696,947 | ) |
| | | | | | | | | |
| NET ASSETS | | | | | | | | |
| Beginning of year | | | 711,311,635 | | | | 892,008,582 | |
| End of year | | $ | 515,171,519 | | | $ | 711,311,635 | |
| | | | | | | | | |
| | | | | | | | | |
| OTHER INFORMATION | | | | | | | | |
| Shares Transactions | | | | | | | | |
| Investor Class | | | | | | | | |
| Issued | | | 1,502,144 | | | | 3,846,422 | |
| Issued to shareholders in reinvestment of distributions | | | 495,976 | | | | 2,231,614 | |
| Redeemed | | | (5,810,441 | ) | | | (7,851,116 | ) |
| Net decrease in share transactions | | | (3,812,321 | ) | | | (1,773,080 | ) |
| | | | | | | | | |
| Institutional Class | | | | | | | | |
| Issued | | | 21,300,368 | | | | 29,904,063 | |
| Issued to shareholders in reinvestment of distributions | | | 5,763,539 | | | | 20,056,761 | |
| Redeemed | | | (67,024,606 | ) | | | (52,526,853 | ) |
| Net decrease in share transactions | | | (39,960,699 | ) | | | (2,566,029 | ) |
See Notes to Financial Statements.
| 78 | 1.855.377.7325 | www.GrandeurPeakGlobal.com |
| Grandeur Peak International Stalwarts Fund | Statements of Changes in Net Assets |
| | | For the Year Ended April 30, 2020 | | | For the Year Ended April 30, 2019 | |
| OPERATIONS | | | | | | | | |
| Net investment income | | $ | 2,199,658 | | | $ | 2,724,996 | |
| Net realized loss | | | (9,198,168 | ) | | | (306,903 | ) |
| Net change in unrealized depreciation | | | (14,970,807 | ) | | | (17,935,986 | ) |
| Net decrease in net assets resulting from operations | | | (21,969,317 | ) | | | (15,517,893 | ) |
| | | | | | | | | |
| DISTRIBUTIONS TO SHAREHOLDERS (NOTE 3) | | | | | | | | |
| Investor Class | | | (122,186 | ) | | | (1,361,964 | ) |
| Institutional Class | | | (1,992,693 | ) | | | (12,223,593 | ) |
| Net decrease in net assets from distributions | | | (2,114,879 | ) | | | (13,585,557 | ) |
| | | | | | | | | |
| CAPITAL SHARE TRANSACTIONS (NOTE 5) | | | | | | | | |
| Investor Class | | | | | | | | |
| Proceeds from sales of shares | | | 39,311,307 | | | | 35,814,499 | |
| Distributions reinvested | | | 60,668 | | | | 1,177,844 | |
| Cost of shares redeemed | | | (27,261,155 | ) | | | (15,609,386 | ) |
| Redemption fees | | | 6,267 | | | | 4,368 | |
| Net increase from capital shares transactions | | | 12,117,087 | | | | 21,387,325 | |
| | | | | | | | | |
| Institutional Class | | | | | | | | |
| Proceeds from sales of shares | | | 470,808,042 | | | | 195,348,183 | |
| Distributions reinvested | | | 1,834,446 | | | | 11,176,627 | |
| Cost of shares redeemed | | | (140,807,902 | ) | | | (114,352,225 | ) |
| Redemption fees | | | 34,124 | | | | 11,165 | |
| Net increase from capital shares transactions | | | 331,868,710 | | | | 92,183,750 | |
| | | | | | | | | |
| Net increase in net assets | | | 319,901,601 | | | | 84,467,625 | |
| | | | | | | | | |
| NET ASSETS | | | | | | | | |
| Beginning of year | | | 633,304,093 | | | | 548,836,468 | |
| End of year | | $ | 953,205,694 | | | $ | 633,304,093 | |
| | | | | | | | | |
| OTHER INFORMATION | | | | | | | | |
| Shares Transactions | | | | | | | | |
| Investor Class | | | | | | | | |
| Issued | | | 2,693,314 | | | | 2,579,877 | |
| Issued to shareholders in reinvestment of distributions | | | 3,778 | | | | 98,154 | |
| Redeemed | | | (1,896,118 | ) | | | (1,144,985 | ) |
| Net increase in share transactions | | | 800,974 | | | | 1,533,046 | |
| | | | | | | | | |
| Institutional Class | | | | | | | | |
| Issued | | | 31,956,402 | | | | 13,577,287 | |
| Issued to shareholders in reinvestment of distributions | | | 113,799 | | | | 929,063 | |
| Redeemed | | | (9,910,143 | ) | | | (8,335,344 | ) |
| Net increase in share transactions | | | 22,160,058 | | | | 6,171,006 | |
See Notes to Financial Statements.
| Annual Report | April 30, 2020 | 79 |
| Grandeur Peak US Stalwarts Fund | Statements of Changes in Net Assets |
| | | For the Period March 20, 2020 (Commencement of Operations) to April 30, 2020 | |
| OPERATIONS | | | | |
| Net investment loss | | $ | (3,383 | ) |
| Net realized gain | | | 9,572 | |
| Net change in unrealized appreciation | | | 1,481,238 | |
| Net increase in net assets resulting from operations | | | 1,487,427 | |
| | | | | |
| CAPITAL SHARE TRANSACTIONS (NOTE 5) | | | | |
| Institutional Class | | | | |
| Proceeds from sales of shares | | | 7,953,203 | |
| Cost of shares redeemed | | | (20,274 | ) |
| Redemption fees | | | 405 | |
| Net increase from capital shares transactions | | | 7,933,334 | |
| | | | | |
| Net increase in net assets | | | 9,420,761 | |
| | | | | |
| NET ASSETS | | | | |
| Beginning of period | | | – | |
| End of period | | $ | 9,420,761 | |
| | | | | |
| OTHER INFORMATION | | | | |
| Shares Transactions | | | | |
| Institutional Class | | | | |
| Issued | | | 718,380 | |
| Redeemed | | | (1,805 | ) |
| Net increase in share transactions | | | 716,575 | |
See Notes to Financial Statements.
| 80 | 1.855.377.7325 | www.GrandeurPeakGlobal.com |
| Grandeur Peak Emerging Markets Opportunities Fund | Financial Highlights |
For a Share Outstanding Throughout the Periods Presented
| Investor Class | | Year Ended April 30, 2020 | | | Year Ended April 30, 2019 | | | Year Ended April 30, 2018 | | | Year Ended April 30, 2017 | | | Year Ended April 30, 2016 | |
| NET ASSET VALUE, BEGINNING OF PERIOD | | $ | 11.82 | | | $ | 13.05 | | | $ | 11.55 | | | $ | 9.82 | | | $ | 11.51 | |
| | | | | | | | | | | | | | | | | | | | | |
| INCOME FROM INVESTMENT OPERATIONS | | | | | | | | | | | | | | | | | | | | |
| Net investment income(a) | | | 0.01 | | | | 0.01 | | | | 0.03 | | | | 0.02 | | | | 0.07 | |
| Net realized and unrealized gain/(loss) on investments | | | (0.75 | ) | | | (1.13 | ) | | | 1.47 | | | | 1.75 | | | | (1.41 | ) |
| Total income/(loss) from investment operations | | | (0.74 | ) | | | (1.12 | ) | | | 1.50 | | | | 1.77 | | | | (1.34 | ) |
| | | | | | | | | | | | | | | | | | | | | |
| DISTRIBUTIONS | | | | | | | | | | | | | | | | | | | | |
| From net investment income | | | (0.01 | ) | | | (0.02 | ) | | | – | | | | (0.04 | ) | | | – | |
| From net realized gain on investments | | | – | | | | (0.09 | ) | | | – | | | | – | | | | (0.35 | ) |
| Total distributions | | | (0.01 | ) | | | (0.11 | ) | | | – | | | | (0.04 | ) | | | (0.35 | ) |
| | | | | | | | | | | | | | | | | | | | | |
| REDEMPTION FEES ADDED TO PAID-IN CAPITAL | | | – | | | | 0.00 | (b) | | | – | | | | 0.00 | (b) | | | 0.00 | (b) |
| | | | | | | | | | | | | | | | | | | | | |
| INCREASE/DECREASE IN NET ASSET VALUE | | | (0.75 | ) | | | (1.23 | ) | | | 1.50 | | | | 1.73 | | | | (1.69 | ) |
| NET ASSET VALUE, END OF PERIOD | | $ | 11.07 | | | $ | 11.82 | | | $ | 13.05 | | | $ | 11.55 | | | $ | 9.82 | |
| | | | | | | | | | | | | | | | | | | | | |
| TOTAL RETURN | | | (6.29 | )% | | | (8.48 | )% | | | 12.99 | % | | | 18.08 | % | | | (11.62 | )% |
| | | | | | | | | | | | | | | | | | | | | |
| RATIOS AND SUPPLEMENTAL DATA | | | | | | | | | | | | | | | | | | | | |
| Net assets, end of period (in 000s) | | $ | 10,056 | | | $ | 13,869 | | | $ | 18,668 | | | $ | 18,074 | | | $ | 20,548 | |
| | | | | | | | | | | | | | | | | | | | | |
| RATIOS TO AVERAGE NET ASSETS | | | | | | | | | | | | | | | | | | | | |
| Expenses (excluding fees waived/reimbursed by investment advisor) | | | 1.76 | % | | | 1.77 | % | | | 1.79 | % | | | 1.76 | % | | | 1.77 | % |
| Expenses (including fees waived/reimbursed by investment advisor) | | | 1.74 | % | | | 1.76 | % | | | 1.78 | % | | | 1.76 | % | | | 1.77 | % |
| Net investment income | | | 0.09 | % | | | 0.11 | % | | | 0.26 | % | | | 0.21 | % | | | 0.69 | % |
| | | | | | | | | | | | | | | | | | | | | |
| PORTFOLIO TURNOVER RATE | | | 24 | % | | | 34 | % | | | 33 | % | | | 42 | % | | | 40 | % |
| (a) | Per share numbers have been calculated using the average shares method. |
| (b) | Less than $0.005 or ($0.005) per share. |
See Notes to Financial Statements.
| Annual Report | April 30, 2020 | 81 |
| Grandeur Peak Emerging Markets Opportunities Fund | Financial Highlights |
For a Share Outstanding Throughout the Periods Presented
| Institutional Class | | Year Ended April 30, 2020 | | | Year Ended April 30, 2019 | | | Year Ended April 30, 2018 | | | Year Ended April 30, 2017 | | | Year Ended April 30, 2016 | |
| NET ASSET VALUE, BEGINNING OF PERIOD | | $ | 11.88 | | | $ | 13.12 | | | $ | 11.60 | | | $ | 9.85 | | | $ | 11.52 | |
| | | | | | | | | | | | | | | | | | | | | |
| INCOME FROM INVESTMENT OPERATIONS | | | | | | | | | | | | | | | | | | | | |
| Net investment income(a) | | | 0.04 | | | | 0.03 | | | | 0.06 | | | | 0.04 | | | | 0.08 | |
| Net realized and unrealized gain/(loss) on investments | | | (0.75 | ) | | | (1.14 | ) | | | 1.48 | | | | 1.77 | | | | (1.40 | ) |
| Total income/(loss) from investment operations | | | (0.71 | ) | | | (1.11 | ) | | | 1.54 | | | | 1.81 | | | | (1.32 | ) |
| | | | | | | | | | | | | | | | | | | | | |
| DISTRIBUTIONS | | | | | | | | | | | | | | | | | | | | |
| From net investment income | | | (0.03 | ) | | | (0.04 | ) | | | (0.02 | ) | | | (0.06 | ) | | | – | |
| From net realized gain on investments | | | – | | | | (0.09 | ) | | | – | | | | – | | | | (0.35 | ) |
| Total distributions | | | (0.03 | ) | | | (0.13 | ) | | | (0.02 | ) | | | (0.06 | ) | | | (0.35 | ) |
| | | | | | | | | | | | | | | | | | | | | |
| REDEMPTION FEES ADDED TO PAID-IN CAPITAL | | | 0.00 | (b) | | | 0.00 | (b) | | | 0.00 | (b) | | | 0.00 | (b) | | | 0.00 | (b) |
| | | | | | | | | | | | | | | | | | | | | |
| INCREASE/DECREASE IN NET ASSET VALUE | | | (0.74 | ) | | | (1.24 | ) | | | 1.52 | | | | 1.75 | | | | (1.67 | ) |
| NET ASSET VALUE, END OF PERIOD | | $ | 11.14 | | | $ | 11.88 | | | $ | 13.12 | | | $ | 11.60 | | | $ | 9.85 | |
| | | | | | | | | | | | | | | | | | | | | |
| TOTAL RETURN | | | (6.03 | )% | | | (8.32 | )% | | | 13.24 | % | | | 18.42 | % | | | (11.44 | )% |
| | | | | | | | | | | | | | | | | | | | | |
| RATIOS AND SUPPLEMENTAL DATA | | | | | | | | | | | | | | | | | | | | |
| Net assets, end of period (in 000s) | | $ | 389,373 | | | $ | 452,530 | | | $ | 471,260 | | | $ | 398,891 | | | $ | 349,493 | |
| | | | | �� | | | | | | | | | | | | | | | | |
| RATIOS TO AVERAGE NET ASSETS | | | | | | | | | | | | | | | | | | | | |
| Expenses (excluding fees waived/reimbursed by investment advisor) | | | 1.53 | % | | | 1.53 | % | | | 1.55 | % | | | 1.55 | % | | | 1.55 | % |
| Expenses (including fees waived/reimbursed by investment advisor) | | | 1.51 | % | | | 1.52 | % | | | 1.54 | % | | | 1.55 | % | | | 1.55 | % |
| Net investment income | | | 0.29 | % | | | 0.29 | % | | | 0.49 | % | | | 0.35 | % | | | 0.75 | % |
| | | | | | | | | | | | | | | | | | | | | |
| PORTFOLIO TURNOVER RATE | | | 24 | % | | | 34 | % | | | 33 | % | | | 42 | % | | | 40 | % |
| (a) | Per share numbers have been calculated using the average shares method. |
| (b) | Less than $0.005 or ($0.005) per share. |
See Notes to Financial Statements.
| 82 | 1.855.377.7325 | www.GrandeurPeakGlobal.com |
| Grandeur Peak Global Contrarian Fund | Financial Highlights |
For a Share Outstanding Throughout the Period Presented
| Institutional Class | | For the Period September 18, 2019 (Commencement of Operations) to April 30, 2020 | |
| NET ASSET VALUE, BEGINNING OF PERIOD | | $ | 10.00 | |
| | | | | |
| INCOME FROM INVESTMENT OPERATIONS | | | | |
| Net investment income(a) | | | 0.06 | |
| Net realized and unrealized loss on investments | | | (1.25 | ) |
| Total loss from investment operations | | | (1.19 | ) |
| | | | | |
| DISTRIBUTIONS | | | | |
| From net investment income | | | (0.01 | ) |
| From net realized gain on investments | | | (0.02 | ) |
| Total distributions | | | (0.03 | ) |
| | | | | |
| REDEMPTION FEES ADDED TO PAID-IN CAPITAL | | | 0.00 | (b) |
| | | | | |
| DECREASE IN NET ASSET VALUE | | | (1.22 | ) |
| NET ASSET VALUE, END OF PERIOD | | $ | 8.78 | |
| | | | | |
| TOTAL RETURN | | | (11.96 | )%(c) |
| | | | | |
| RATIOS AND SUPPLEMENTAL DATA | | | | |
| Net assets, end of period (in 000s) | | $ | 8,861 | |
| | | | | |
| RATIOS TO AVERAGE NET ASSETS | | | | |
| Expenses (excluding fees waived/ reimbursed by investment advisor) | | | 4.69 | %(d)(e) |
| Expenses (including fees waived/ reimbursed by investment advisor) | | | 1.35 | %(d)(e) |
| Net investment income | | | 1.05 | %(d) |
| | | | | |
| PORTFOLIO TURNOVER RATE | | | 34 | %(c) |
| (a) | Per share numbers have been calculated using the average shares method. |
| (b) | Less than $0.005 or ($0.005) per share. |
| (e) | Expense ratios during startup periods may not be representative of longer term operating periods. |
See Notes to Financial Statements.
| Annual Report | April 30, 2020 | 83 |
| Grandeur Peak Global Micro Cap Fund | Financial Highlights |
For a Share Outstanding Throughout the Periods Presented
| Institutional Class | | Year Ended April 30, 2020 | | | Year Ended April 30, 2019 | | | Year Ended April 30, 2018 | | | Year Ended April 30, 2017 | | | For the Period October 21, 2015 (Commencement of Operations) to April 30, 2016 | |
| NET ASSET VALUE, BEGINNING OF PERIOD | | $ | 11.31 | | | $ | 13.12 | | | $ | 11.98 | | | $ | 10.38 | | | $ | 10.00 | |
| | | | | | | | | | | | | | | | | | | | | |
| INCOME FROM INVESTMENT OPERATIONS | | | | | | | | | | | | | | | | | | | | |
| Net investment income/(loss)(a) | | | 0.01 | | | | (0.01 | ) | | | (0.00 | )(b) | | | 0.01 | | | | (0.02 | ) |
| Net realized and unrealized gain/(loss) on investments | | | (0.19 | ) | | | (1.08 | ) | | | 2.12 | | | | 1.72 | | | | 0.40 | |
| Total income/(loss) from investment operations | | | (0.18 | ) | | | (1.09 | ) | | | 2.12 | | | | 1.73 | | | | 0.38 | |
| | | | | | | | | | | | | | | | | | | | | |
| DISTRIBUTIONS | | | | | | | | | | | | | | | | | | | | |
| From net investment income | | | (0.03 | ) | | | – | | | | (0.06 | ) | | | (0.02 | ) | | | – | |
| From net realized gain on investments | | | (0.05 | ) | | | (0.72 | ) | | | (0.92 | ) | | | (0.11 | ) | | | – | |
| Total distributions | | | (0.08 | ) | | | (0.72 | ) | | | (0.98 | ) | | | (0.13 | ) | | | – | |
| | | | | | | | | | | | | | | | | | | | | |
| REDEMPTION FEES ADDED TO PAID-IN CAPITAL | | | 0.00 | (b) | | | 0.00 | (b) | | | 0.00 | (b) | | | 0.00 | (b) | | | 0.00 | (b) |
| | | | | | | | | | | | | | | | | | | | | |
| INCREASE/DECREASE IN NET ASSET VALUE | | | (0.26 | ) | | | (1.81 | ) | | | 1.14 | | | | 1.60 | | | | 0.38 | |
| NET ASSET VALUE, END OF PERIOD | | $ | 11.05 | | | $ | 11.31 | | | $ | 13.12 | | | $ | 11.98 | | | $ | 10.38 | |
| | | | | | | | | | | | | | | | | | | | | |
| TOTAL RETURN | | | (1.62 | )% | | | (7.67 | )% | | | 17.68 | % | | | 16.81 | % | | | 3.80 | %(c) |
| | | | | | | | | | | | | | | | | | | | | |
| RATIOS AND SUPPLEMENTAL DATA | | | | | | | | | | | | | | | | | | | | |
| Net assets, end of period (in 000s) | | $ | 29,634 | | | $ | 35,654 | | | $ | 41,709 | | | $ | 36,620 | | | $ | 30,735 | |
| | | | | | | | | | | | | | | | | | | | | |
| RATIOS TO AVERAGE NET ASSETS | | | | | | | | | | | | | | | | | | | | |
| Expenses (excluding fees waived/ reimbursed by investment advisor) | | | 2.06 | % | | | 2.05 | % | | | 2.06 | % | | | 2.17 | % | | | 2.30 | %(d)(e) |
| Expenses (including fees waived/ reimbursed by investment advisor) | | | 2.00 | % | | | 2.00 | % | | | 2.00 | % | | | 2.00 | % | | | 2.00 | %(d)(e) |
| Net investment income/(loss) | | | 0.09 | % | | | (0.06 | )% | | | 0.00 | %(f) | | | 0.11 | % | | | (0.41 | )%(d) |
| | | | | | | | | | | | | | | | | | | | | |
| PORTFOLIO TURNOVER RATE | | | 33 | % | | | 37 | % | | | 46 | % | | | 37 | % | | | 8 | %(c) |
| (a) | Per share numbers have been calculated using the average shares method. |
| (b) | Less than $0.005 or ($0.005) per share. |
| (e) | Expense ratios during startup periods may not be representative of longer term operating periods. |
| (f) | Less than 0.005% of average net assets. |
See Notes to Financial Statements.
| 84 | 1.855.377.7325 | www.GrandeurPeakGlobal.com |
| Grandeur Peak Global Opportunities Fund | Financial Highlights |
For a Share Outstanding Throughout the Periods Presented
| Investor Class | | Year Ended April 30, 2020 | | | Year Ended April 30, 2019 | | | Year Ended April 30, 2018 | | | Year Ended April 30, 2017 | | | Year Ended April 30, 2016 | |
| NET ASSET VALUE, BEGINNING OF PERIOD | | $ | 3.48 | | | $ | 3.95 | | | $ | 3.52 | | | $ | 3.01 | | | $ | 3.43 | |
| | | | | | | | | | | | | | | | | | | | | |
| INCOME FROM INVESTMENT OPERATIONS | | | | | | | | | | | | | | | | | | | | |
| Net investment income/(loss)(a) | | | (0.01 | )(b) | | | (0.00 | )(c) | | | 0.00 | (c) | | | (0.00 | )(b)(c) | | | 0.00 | (c) |
| Net realized and unrealized gain/(loss) on investments | | | (0.03 | ) | | | (0.14 | ) | | | 0.65 | | | | 0.51 | | | | (0.18 | ) |
| Total income/(loss) from investment operations | | | (0.04 | ) | | | (0.14 | ) | | | 0.65 | | | | 0.51 | | | | (0.18 | ) |
| | | | | | | | | | | | | | | | | | | | | |
| DISTRIBUTIONS | | | | | | | | | | | | | | | | | | | | |
| From net investment income | | | – | | | | (0.00 | )(c) | | | – | | | | – | | | | (0.00 | )(c) |
| From net realized gain on investments | | | (0.20 | ) | | | (0.33 | ) | | | (0.22 | ) | | | (0.00 | )(c) | | | (0.24 | ) |
| Total distributions | | | (0.20 | ) | | | (0.33 | ) | | | (0.22 | ) | | | (0.00 | )(c) | | | (0.24 | ) |
| | | | | | | | | | | | | | | | | | | | | |
| REDEMPTION FEES ADDED TO PAID-IN CAPITAL | | | 0.00 | (c) | | | 0.00 | (c) | | | 0.00 | (c) | | | 0.00 | (c) | | | 0.00 | (c) |
| | | | | | | | | | | | | | | | | | | | | |
| INCREASE/DECREASE IN NET ASSET VALUE | | | (0.24 | ) | | | (0.47 | ) | | | 0.43 | | | | 0.51 | | | | (0.42 | ) |
| NET ASSET VALUE, END OF PERIOD | | $ | 3.24 | | | $ | 3.48 | | | $ | 3.95 | | | $ | 3.52 | | | $ | 3.01 | |
| | | | | | | | | | | | | | | | | | | | | |
| TOTAL RETURN | | | (1.73 | )% | | | (1.83 | )% | | | 18.41 | % | | | 17.09 | % | | | (5.03 | )% |
| | | | | | | | | | | | | | | | | | | | | |
| RATIOS AND SUPPLEMENTAL DATA | | | | | | | | | | | | | | | | | | | | |
| Net assets, end of period (in 000s) | | $ | 92,843 | | | $ | 130,745 | | | $ | 188,379 | | | $ | 166,284 | | | $ | 173,156 | |
| | | | | | | | | | | | | | | | | | | | | |
| RATIOS TO AVERAGE NET ASSETS | | | | | | | | | | | | | | | | | | | | |
| Expenses (excluding fees waived/ reimbursed by investment advisor) | | | 1.61 | % | | | 1.61 | % | | | 1.61 | % | | | 1.61 | % | | | 1.62 | % |
| Expenses (including fees waived/ reimbursed by investment advisor) | | | 1.57 | % | | | 1.57 | % | | | 1.55 | % | | | 1.59 | % | | | 1.62 | % |
| Net investment income/(loss) | | | (0.17 | )% | | | (0.12 | )% | | | 0.03 | % | | | (0.06 | )% | | | 0.06 | % |
| | | | | | | | | | | | | | | | | | | | | |
| PORTFOLIO TURNOVER RATE | | | 41 | % | | | 38 | % | | | 29 | % | | | 30 | % | | | 32 | % |
| (a) | Per share numbers have been calculated using the average shares method. |
| (b) | The per share amount does not correspond to activity reflected in the Statement of Operations due to class specific expenses during the period. |
| (c) | Less than $0.005 or ($0.005) per share. |
See Notes to Financial Statements.
| Annual Report | April 30, 2020 | 85 |
| Grandeur Peak Global Opportunities Fund | Financial Highlights |
For a Share Outstanding Throughout the Periods Presented
| Institutional Class | | Year Ended April 30, 2020 | | | Year Ended April 30, 2019 | | | Year Ended April 30, 2018 | | | Year Ended April 30, 2017 | | | Year Ended April 30, 2016 | |
| NET ASSET VALUE, BEGINNING OF PERIOD | | $ | 3.52 | | | $ | 4.00 | | | $ | 3.56 | | | $ | 3.03 | | | $ | 3.46 | |
| | | | | | | | | | | | | | | | | | | | | |
| INCOME FROM INVESTMENT OPERATIONS | | | | | | | | | | | | | | | | | | | | |
| Net investment income(a) | | | 0.00 | (b) | | | 0.00 | (b) | | | 0.01 | | | | 0.01 | | | | 0.01 | |
| Net realized and unrealized gain/(loss) on investments | | | (0.03 | ) | | | (0.14 | ) | | | 0.65 | | | | 0.52 | | | | (0.19 | ) |
| Total income/(loss) from investment operations | | | (0.03 | ) | | | (0.14 | ) | | | 0.66 | | | | 0.53 | | | | (0.18 | ) |
| | | | | | | | | | | | | | | | | | | | | |
| DISTRIBUTIONS | | | | | | | | | | | | | | | | | | | | |
| From net investment income | | | – | | | | (0.01 | ) | | | (0.00 | )(b) | | | (0.00 | )(b) | | | (0.01 | ) |
| From net realized gain on investments | | | (0.20 | ) | | | (0.33 | ) | | | (0.22 | ) | | | (0.00 | )(b) | | | (0.24 | ) |
| Total distributions | | | (0.20 | ) | | | (0.34 | ) | | | (0.22 | ) | | | (0.00 | )(a) | | | (0.25 | ) |
| | | | | | | | | | | | | | | | | | | | | |
| REDEMPTION FEES ADDED TO PAID-IN CAPITAL | | | 0.00 | (b) | | | 0.00 | (b) | | | 0.00 | (b) | | | 0.00 | (b) | | | 0.00 | (b) |
| | | | | | | | | | | | | | | | | | | | | |
| INCREASE/DECREASE IN NET ASSET VALUE | | | (0.23 | ) | | | (0.48 | ) | | | 0.44 | | | | 0.53 | | | | (0.43 | ) |
| NET ASSET VALUE, END OF PERIOD | | $ | 3.29 | | | $ | 3.52 | | | $ | 4.00 | | | $ | 3.56 | | | $ | 3.03 | |
| | | | | | | | | | | | | | | | | | | | | |
| TOTAL RETURN | | | (1.42 | )% | | | (1.84 | )% | | | 18.62 | % | | | 17.81 | % | | | (5.12 | )% |
| | | | | | | | | | | | | | | | | | | | | |
| RATIOS AND SUPPLEMENTAL DATA | | | | | | | | | | | | | | | | | | | | |
| Net assets, end of period (in 000s) | | $ | 470,142 | | | $ | 523,862 | | | $ | 591,470 | | | $ | 532,946 | | | $ | 452,030 | |
| | | | | | | | | | | | | | | | | | | | | |
| RATIOS TO AVERAGE NET ASSETS | | | | | | | | | | | | | | | | | | | | |
| Expenses (excluding fees waived/ reimbursed by investment advisor) | | | 1.37 | % | | | 1.37 | % | | | 1.36 | % | | | 1.37 | % | | | 1.38 | % |
| Expenses (including fees waived/ reimbursed by investment advisor) | | | 1.33 | % | | | 1.33 | % | | | 1.31 | % | | | 1.35 | % | | | 1.38 | % |
| Net investment income | | | 0.05 | % | | | 0.13 | % | | | 0.28 | % | | | 0.18 | % | | | 0.30 | % |
| | | | | | | | | | | | | | | | | | | | | |
| PORTFOLIO TURNOVER RATE | | | 41 | % | | | 38 | % | | | 29 | % | | | 30 | % | | | 32 | % |
| (a) | Per share numbers have been calculated using the average shares method. |
| (b) | Less than $0.005 or ($0.005) per share. |
See Notes to Financial Statements.
| 86 | 1.855.377.7325 | www.GrandeurPeakGlobal.com |
| Grandeur Peak Global Reach Fund | Financial Highlights |
For a Share Outstanding Throughout the Periods Presented
| Investor Class | | Year Ended April 30, 2020 | | | Year Ended April 30, 2019 | | | Year Ended April 30, 2018 | | | Year Ended April 30, 2017 | | | Year Ended April 30, 2016 | |
| NET ASSET VALUE, BEGINNING OF PERIOD | | $ | 14.98 | | | $ | 16.97 | | | $ | 14.52 | | | $ | 12.31 | | | $ | 13.65 | |
| | | | | | | | | | | | | | | | | | | | | |
| INCOME FROM INVESTMENT OPERATIONS | | | | | | | | | | | | | | | | | | | | |
| Net investment income/(loss)(a) | | | (0.01 | )(b) | | | 0.01 | | | | 0.01 | | | | 0.01 | | | | 0.01 | |
| Net realized and unrealized gain/(loss) on investments | | | (0.44 | ) | | | (0.58 | ) | | | 2.66 | | | | 2.22 | | | | (0.89 | ) |
| Total income/(loss) from investment operations | | | (0.45 | ) | | | (0.57 | ) | | | 2.67 | | | | 2.23 | | | | (0.88 | ) |
| | | | | | | | | | | | | | | | | | | | | |
| DISTRIBUTIONS | | | | | | | | | | | | | | | | | | | | |
| From net investment income | | | – | | | | (0.00 | ) | | | – | | | | (0.02 | ) | | | (0.01 | ) |
| From net realized gain on investments | | | (0.41 | ) | | | (1.42 | ) | | | (0.22 | ) | | | – | | | | (0.45 | ) |
| Total distributions | | | (0.41 | ) | | | (1.42 | ) | | | (0.22 | ) | | | (0.02 | ) | | | (0.46 | ) |
| | | | | | | | | | | | | | | | | | | | | |
| REDEMPTION FEES ADDED TO PAID-IN CAPITAL | | | 0.00 | (c) | | | 0.00 | (c) | | | 0.00 | (c) | | | 0.00 | (c) | | | 0.00 | (c) |
| | | | | | | | | | | | | | | | | | | | | |
| INCREASE/DECREASE IN NET ASSET VALUE | | | (0.86 | ) | | | (1.99 | ) | | | 2.45 | | | | 2.21 | | | | (1.34 | ) |
| NET ASSET VALUE, END OF PERIOD | | $ | 14.12 | | | $ | 14.98 | | | $ | 16.97 | | | $ | 14.52 | | | $ | 12.31 | |
| | | | | | | | | | | | | | | | | | | | | |
| TOTAL RETURN | | | (3.31 | )% | | | (1.61 | )% | | | 18.44 | % | | | 18.11 | % | | | (6.45 | )% |
| | | | | | | | | | | | | | | | | | | | | |
| RATIOS AND SUPPLEMENTAL DATA | | | | | | | | | | | | | | | | | | | | |
| Net assets, end of period (in 000s) | | $ | 40,307 | | | $ | 56,307 | | | $ | 65,923 | | | $ | 67,574 | | | $ | 66,984 | |
| | | | | | | | | | | | | | | | | | | | | |
| RATIOS TO AVERAGE NET ASSETS | | | | | | | | | | | | | | | | | | | | |
| Expenses (excluding fees waived/reimbursed by investment advisor) | | | 1.52 | % | | | 1.52 | % | | | 1.52 | % | | | 1.52 | % | | | 1.60 | % |
| Expenses (including fees waived/reimbursed by investment advisor) | | | 1.52 | % | | | 1.52 | % | | | 1.52 | % | | | 1.52 | % | | | 1.60 | % |
| Net investment income/(loss) | | | (0.04 | )% | | | 0.05 | % | | | 0.06 | % | | | 0.07 | % | | | 0.10 | % |
| | | | | | | | | | | | | | | | | | | | | |
| PORTFOLIO TURNOVER RATE | | | 32 | % | | | 50 | % | | | 43 | % | | | 42 | % | | | 46 | % |
| (a) | Per share numbers have been calculated using the average shares method. |
| (b) | The per share amount does not correspond to activity reflected in the Statement of Operations due to class specific expenses during the period. |
| (c) | Less than $0.005 or ($0.005) per share. |
See Notes to Financial Statements.
| Annual Report | April 30, 2020 | 87 |
| Grandeur Peak Global Reach Fund | Financial Highlights |
For a Share Outstanding Throughout the Periods Presented
| Institutional Class | | Year Ended April 30, 2020 | | | Year Ended April 30, 2019 | | | Year Ended April 30, 2018 | | | Year Ended April 30, 2017 | | | Year Ended April 30, 2016 | |
| NET ASSET VALUE, BEGINNING OF PERIOD | | $ | 15.04 | | | $ | 17.02 | | | $ | 14.55 | | | $ | 12.33 | | | $ | 13.66 | |
| | | | | | | | | | | | | | | | | | | | | |
| INCOME FROM INVESTMENT OPERATIONS | | | | | | | | | | | | | | | | | | | | |
| Net investment income(a) | | | 0.03 | | | | 0.05 | | | | 0.04 | | | | 0.04 | | | | 0.04 | |
| Net realized and unrealized gain/(loss) on investments | | | (0.45 | ) | | | (0.58 | ) | | | 2.67 | | | | 2.22 | | | | (0.89 | ) |
| Total income/(loss) from investment operations | | | (0.42 | ) | | | (0.53 | ) | | | 2.71 | | | | 2.26 | | | | (0.85 | ) |
| | | | | | | | | | | | | | | | | | | | | |
| DISTRIBUTIONS | | | | | | | | | | | | | | | | | | | | |
| From net investment income | | | (0.02 | ) | | | (0.03 | ) | | | (0.02 | ) | | | (0.04 | ) | | | (0.03 | ) |
| From net realized gain on investments | | | (0.41 | ) | | | (1.42 | ) | | | (0.22 | ) | | | – | | | | (0.45 | ) |
| Total distributions | | | (0.43 | ) | | | (1.45 | ) | | | (0.24 | ) | | | (0.04 | ) | | | (0.48 | ) |
| | | | | | | | | | | | | | | | | | | | | |
| REDEMPTION FEES ADDED TO PAID-IN CAPITAL | | | 0.00 | (b) | | | 0.00 | (b) | | | 0.00 | (b) | | | 0.00 | (b) | | | 0.00 | (b) |
| | | | | | | | | | | | | | | | | | | | | |
| INCREASE/DECREASE IN NET ASSET VALUE | | | (0.85 | ) | | | (1.98 | ) | | | 2.47 | | | | 2.22 | | | | (1.33 | ) |
| NET ASSET VALUE, END OF PERIOD | | $ | 14.19 | | | $ | 15.04 | | | $ | 17.02 | | | $ | 14.55 | | | $ | 12.33 | |
| | | | | | | | | | | | | | | | | | | | | |
| TOTAL RETURN | | | (3.09 | )% | | | (1.33 | )% | | | 18.69 | % | | | 18.36 | % | | | (6.18 | )% |
| | | | | | | | | | | | | | | | | | | | | |
| RATIOS AND SUPPLEMENTAL DATA | | | | | | | | | | | | | | | | | | | | |
| Net assets, end of period (in 000s) | | $ | 200,988 | | | $ | 272,743 | | | $ | 302,269 | | | $ | 258,683 | | | $ | 221,759 | |
| | | | | | | | | | | | | | | | | | | | | |
| RATIOS TO AVERAGE NET ASSETS | | | | | | | | | | | | | | | | | | | | |
| Expenses (excluding fees waived/reimbursed by investment advisor) | | | 1.27 | % | | | 1.27 | % | | | 1.28 | % | | | 1.29 | % | | | 1.35 | % |
| Expenses (including fees waived/reimbursed by investment advisor) | | | 1.27 | % | | | 1.27 | % | | | 1.28 | % | | | 1.29 | % | | | 1.35 | % |
| Net investment income | | | 0.21 | % | | | 0.29 | % | | | 0.27 | % | | | 0.28 | % | | | 0.34 | % |
| | | | | | | | | | | | | | | | | | | | | |
| PORTFOLIO TURNOVER RATE | | | 32 | % | | | 50 | % | | | 43 | % | | | 42 | % | | | 46 | % |
| (a) | Per share numbers have been calculated using the average shares method. |
| (b) | Less than $0.005 or ($0.005) per share. |
See Notes to Financial Statements.
| 88 | 1.855.377.7325 | www.GrandeurPeakGlobal.com |
| Grandeur Peak Global Stalwarts Fund | Financial Highlights |
For a Share Outstanding Throughout the Periods Presented
| | | | | | | | | | | | | | | For the Period September 2, 2015 (Commencement | |
| Investor Class | | Year Ended April 30, 2020 | | | Year Ended April 30, 2019 | | | Year Ended April 30, 2018 | | | Year Ended April 30, 2017 | | | of Operations) to April 30, 2016 | |
| NET ASSET VALUE, BEGINNING OF PERIOD | | $ | 14.83 | | | $ | 15.06 | | | $ | 12.76 | | | $ | 10.85 | | | $ | 10.00 | |
| | | | | | | | | | | | | | | | | | | | | |
| INCOME FROM INVESTMENT OPERATIONS | | | | | | | | | | | | | | | | | | | | |
| Net investment income/(loss)(a) | | | (0.01 | )(b) | | | 0.01 | | | | (0.00 | )(c) | | | (0.03 | ) | | | 0.00 | (c) |
| Net realized and unrealized gain/(loss) on investments | | | (0.31 | ) | | | 0.16 | | | | 2.52 | | | | 1.95 | | | | 0.85 | |
| Total income/(loss) from investment operations | | | (0.32 | ) | | | 0.17 | | | | 2.52 | | | | 1.92 | | | | 0.85 | |
| | | | | | | | | | | | | | | | | | | | | |
| DISTRIBUTIONS | | | | | | | | | | | | | | | | | | | | |
| From net investment income | | | (0.00 | )(c) | | | – | | | | – | | | | (0.01 | ) | | | (0.00 | )(c) |
| From net realized gain on investments | | | (0.25 | ) | | | (0.40 | ) | | | (0.22 | ) | | | – | | | | (0.00 | )(c) |
| Total distributions | | | (0.25 | ) | | | (0.40 | ) | | | (0.22 | ) | | | (0.01 | ) | | | (0.00 | )(a) |
| | | | | | | | | | | | | | | | | | | | | |
| REDEMPTION FEES ADDED TO PAID-IN CAPITAL | | | 0.00 | (c) | | | 0.00 | (c) | | | 0.00 | (c) | | | 0.00 | (c) | | | 0.00 | (c) |
| | | | | | | | | | | | | | | | | | | | | |
| INCREASE/DECREASE IN NET ASSET VALUE | | | (0.57 | ) | | | (0.23 | ) | | | 2.30 | | | | 1.91 | | | | 0.85 | |
| NET ASSET VALUE, END OF PERIOD | | $ | 14.26 | | | $ | 14.83 | | | $ | 15.06 | | | $ | 12.76 | | | $ | 10.85 | |
| | | | | | | | | | | | | | | | | | | | | |
| TOTAL RETURN | | | (2.29 | )% | | | 1.78 | % | | | 19.79 | % | | | 17.70 | % | | | 8.55 | %(d) |
| | | | | | | | | | | | | | | | | | | | | |
| RATIOS AND SUPPLEMENTAL DATA | | | | | | | | | | | | | | | | | | | | |
| Net assets, end of period (in 000s) | | $ | 85,310 | | | $ | 90,400 | | | $ | 92,552 | | | $ | 61,212 | | | $ | 19,131 | |
| | | | | | | | | | | | | | | | | | | | | |
| RATIOS TO AVERAGE NET ASSETS | | | | | | | | | | | | | | | | | | | | |
| Expenses (excluding fees waived/ reimbursed by investment advisor) | | | 1.24 | % | | | 1.27 | % | | | 1.35 | % | | | 1.41 | % | | | 2.06 | %(e)(f) |
| Expenses (including fees waived/ reimbursed by investment advisor) | | | 1.24 | % | | | 1.27 | % | | | 1.35 | % | | | 1.35 | % | | | 1.35 | %(e)(f) |
| Net investment income/(loss) | | | (0.10 | )% | | | 0.05 | % | | | (0.03 | )% | | | (0.23 | )% | | | 0.00 | %(e)(g) |
| | | | | | | | | | | | | | | | | | | | | |
| PORTFOLIO TURNOVER RATE | | | 50 | % | | | 52 | % | | | 30 | % | | | 32 | % | | | 24 | %(d) |
| (a) | Per share numbers have been calculated using the average shares method. |
| (b) | The per share amount does not correspond to activity reflected in the Statement of Operations due to class specific expenses during the period. |
| (c) | Less than $0.005 or ($0.005) per share. |
| (f) | Expense ratios during startup periods may not be representative of longer term operating periods. |
| (g) | Less than 0.005% of average net assets. |
See Notes to Financial Statements.
| Annual Report | April 30, 2020 | 89 |
| Grandeur Peak Global Stalwarts Fund | Financial Highlights |
For a Share Outstanding Throughout the Periods Presented
| Institutional Class | | Year Ended April 30, 2020 | | | Year Ended April 30, 2019 | | | Year Ended April 30, 2018 | | | Year Ended April 30, 2017 | | | For the Period September 2, 2015 (Commencement of Operations) to April 30, 2016 | |
| NET ASSET VALUE, BEGINNING OF PERIOD | | $ | 14.93 | | | $ | 15.14 | | | $ | 12.79 | | | $ | 10.87 | | | $ | 10.00 | |
| | | | | | | | | | | | | | | | | | | | | |
| INCOME FROM INVESTMENT OPERATIONS | | | | | | | | | | | | | | | | | | | | |
| Net investment income(a) | | | 0.03 | | | | 0.04 | | | | 0.03 | | | | 0.01 | (b) | | | 0.02 | |
| Net realized and unrealized gain/(loss) on investments | | | (0.31 | ) | | | 0.17 | | | | 2.54 | | | | 1.93 | | | | 0.85 | |
| Total income/(loss) from investment operations | | | (0.28 | ) | | | 0.21 | | | | 2.57 | | | | 1.94 | | | | 0.87 | |
| | | | | | | | | | | | | | | | | | | | | |
| DISTRIBUTIONS | | | | | | | | | | | | | | | | | | | | |
| From net investment income | | | (0.03 | ) | | | (0.02 | ) | | | – | | | | (0.02 | ) | | | (0.00 | )(c) |
| From net realized gain on investments | | | (0.25 | ) | | | (0.40 | ) | | | (0.22 | ) | | | – | | | | (0.00 | )(c) |
| Total distributions | | | (0.28 | ) | | | (0.42 | ) | | | (0.22 | ) | | | (0.02 | ) | | | (0.00 | )(a) |
| | | | | | | | | | | | | | | | | | | | | |
| REDEMPTION FEES ADDED TO PAID-IN CAPITAL | | | 0.00 | (c) | | | 0.00 | (c) | | | 0.00 | (c) | | | 0.00 | (c) | | | 0.00 | (c) |
| | | | | | | | | | | | | | | | | | | | | |
| INCREASE/DECREASE IN NET ASSET VALUE | | | (0.56 | ) | | | (0.21 | ) | | | 2.35 | | | | 1.92 | | | | 0.87 | |
| NET ASSET VALUE, END OF PERIOD | | $ | 14.37 | | | $ | 14.93 | | | $ | 15.14 | | | $ | 12.79 | | | $ | 10.87 | |
| | | | | | | | | | | | | | | | | | | | | |
| TOTAL RETURN | | | (2.05 | )% | | | 2.08 | % | | | 20.14 | % | | | 17.92 | % | | | 8.76 | %(d) |
| | | | | | | | | | | | | | | | | | | | | |
| RATIOS AND SUPPLEMENTAL DATA | | | | | | | | | | | | | | | | | | | | |
| Net assets, end of period (in 000s) | | $ | 119,600 | | | $ | 108,934 | | | $ | 95,533 | | | $ | 47,811 | | | $ | 17,562 | |
| | | | | | | | | | | | | | | | | | | | | |
| RATIOS TO AVERAGE NET ASSETS | | | | | | | | | | | | | | | | | | | | |
| Expenses (excluding fees waived/ reimbursed by investment advisor) | | | 0.99 | % | | | 1.02 | % | | | 1.10 | % | | | 1.17 | % | | | 1.86 | %(e)(f) |
| Expenses (including fees waived/ reimbursed by investment advisor) | | | 0.99 | % | | | 1.02 | % | | | 1.10 | % | | | 1.10 | % | | | 1.10 | %(e)(f) |
| Net investment income | | | 0.17 | % | | | 0.27 | % | | | 0.24 | % | | | 0.05 | % | | | 0.22 | %(e) |
| | | | | | | | | | | | | | | | | | | | | |
| PORTFOLIO TURNOVER RATE | | | 50 | % | | | 52 | % | | | 30 | % | | | 32 | % | | | 24 | %(d) |
| (a) | Per share numbers have been calculated using the average shares method. |
| (b) | The per share amount does not correspond to activity reflected in the Statement of Operations due to class specific expenses during the period. |
| (c) | Less than $0.005 or ($0.005) per share. |
| (f) | Expense ratios during startup periods may not be representative of longer term operating periods. |
See Notes to Financial Statements.
| 90 | 1.855.377.7325 | www.GrandeurPeakGlobal.com |
| Grandeur Peak International Opportunities Fund | Financial Highlights |
For a Share Outstanding Throughout the Periods Presented
| Investor Class | | Year Ended April 30, 2020 | | | Year Ended April 30, 2019 | | | Year Ended April 30, 2018 | | | Year Ended April 30, 2017 | | | Year Ended April 30, 2016 | |
| NET ASSET VALUE, BEGINNING OF PERIOD | | $ | 3.34 | | | $ | 4.10 | | | $ | 3.55 | | | $ | 3.09 | | | $ | 3.42 | |
| | | | | | | | | | | | | | | | | | | | | |
| INCOME FROM INVESTMENT OPERATIONS | | | | | | | | | | | | | | | | | | | | |
| Net investment income(a) | | | 0.00 | (b) | | | 0.00 | (b) | | | 0.01 | | | | 0.01 | | | | 0.01 | |
| Net realized and unrealized gain/(loss) on investments | | | (0.18 | ) | | | (0.38 | ) | | | 0.68 | | | | 0.52 | | | | (0.20 | ) |
| Total income/(loss) from investment operations | | | (0.18 | ) | | | (0.38 | ) | | | 0.69 | | | | 0.53 | | | | (0.19 | ) |
| | | | | | | | | | | | | | | | | | | | | |
| DISTRIBUTIONS | | | | | | | | | | | | | | | | | | | | |
| From net investment income | | | (0.00 | )(b) | | | (0.01 | ) | | | (0.01 | ) | | | (0.02 | ) | | | (0.01 | ) |
| From net realized gain on investments | | | (0.12 | ) | | | (0.37 | ) | | | (0.13 | ) | | | (0.05 | ) | | | (0.13 | ) |
| Total distributions | | | (0.12 | ) | | | (0.38 | ) | | | (0.14 | ) | | | (0.07 | ) | | | (0.14 | ) |
| | | | | | | | | | | | | | | | | | | | | |
| REDEMPTION FEES ADDED TO PAID-IN CAPITAL | | | 0.00 | (b) | | | 0.00 | (b) | | | 0.00 | (b) | | | 0.00 | (b) | | | 0.00 | (b) |
| | | | | | | | | | | | | | | | | | | | | |
| INCREASE/DECREASE IN NET ASSET VALUE | | | (0.30 | ) | | | (0.76 | ) | | | 0.55 | | | | 0.46 | | | | (0.33 | ) |
| NET ASSET VALUE, END OF PERIOD | | $ | 3.04 | | | $ | 3.34 | | | $ | 4.10 | | | $ | 3.55 | | | $ | 3.09 | |
| | | | | | | | | | | | | | | | | | | | | |
| TOTAL RETURN | | | (5.79 | )% | | | (7.40 | )% | | | 19.30 | % | | | 17.50 | % | | | (5.53 | )% |
| | | | | | | | | | | | | | | | | | | | | |
| RATIOS AND SUPPLEMENTAL DATA | | | | | | | | | | | | | | | | | | | | |
| Net assets, end of period (in 000s) | | $ | 41,351 | | | $ | 58,070 | | | $ | 78,686 | | | $ | 78,403 | | | $ | 123,922 | |
| | | | | | | | | | | | | | | | | | | | | |
| RATIOS TO AVERAGE NET ASSETS | | | | | | | | | | | | | | | | | | | | |
| Expenses (excluding fees waived/ reimbursed by investment advisor) | | | 1.61 | % | | | 1.62 | % | | | 1.61 | % | | | 1.61 | % | | | 1.62 | % |
| Expenses (including fees waived/ reimbursed by investment advisor) | | | 1.58 | % | | | 1.57 | % | | | 1.55 | % | | | 1.58 | % | | | 1.62 | % |
| Net investment income | | | 0.01 | % | | | 0.11 | % | | | 0.31 | % | | | 0.16 | % | | | 0.45 | % |
| | | | | | | | | | | | | | | | | | | | | |
| PORTFOLIO TURNOVER RATE | | | 27 | % | | | 34 | % | | | 26 | % | | | 30 | % | | | 34 | % |
| (a) | Per share numbers have been calculated using the average shares method. |
| (b) | Less than $0.005 or ($0.005) per share. |
See Notes to Financial Statements.
| Annual Report | April 30, 2020 | 91 |
| Grandeur Peak International Opportunities Fund | Financial Highlights |
For a Share Outstanding Throughout the Periods Presented
| Institutional Class | | Year Ended April 30, 2020 | | | Year Ended April 30, 2019 | | | Year Ended April 30, 2018 | | | Year Ended April 30, 2017 | | | Year Ended April 30, 2016 | |
| NET ASSET VALUE, BEGINNING OF PERIOD | | $ | 3.36 | | | $ | 4.12 | | | $ | 3.57 | | | $ | 3.11 | | | $ | 3.43 | |
| | | | | | | | | | | | | | | | | | | | | |
| INCOME FROM INVESTMENT OPERATIONS | | | | | | | | | | | | | | | | | | | | |
| Net investment income(a) | | | 0.01 | | | | 0.01 | | | | 0.02 | | | | 0.01 | | | | 0.02 | |
| Net realized and unrealized gain/(loss) on investments | | | (0.18 | ) | | | (0.38 | ) | | | 0.67 | | | | 0.52 | | | | (0.20 | ) |
| Total income/(loss) from investment operations | | | (0.17 | ) | | | (0.37 | ) | | | 0.69 | | | | 0.53 | | | | (0.18 | ) |
| | | | | | | | | | | | | | | | | | | | | |
| DISTRIBUTIONS | | | | | | | | | | | | | | | | | | | | |
| From net investment income | | | (0.01 | ) | | | (0.02 | ) | | | (0.01 | ) | | | (0.02 | ) | | | (0.01 | ) |
| From net realized gain on investments | | | (0.12 | ) | | | (0.37 | ) | | | (0.13 | ) | | | (0.05 | ) | | | (0.13 | ) |
| Total distributions | | | (0.13 | ) | | | (0.39 | ) | | | (0.14 | ) | | | (0.07 | ) | | | (0.14 | ) |
| | | | | | | | | | | | | | | | | | | | | |
| REDEMPTION FEES ADDED TO PAID-IN CAPITAL | | | 0.00 | (b) | | | 0.00 | (b) | | | 0.00 | (b) | | | 0.00 | (b) | | | 0.00 | (b) |
| | | | | | | | | | | | | | | | | | | | | |
| INCREASE/DECREASE IN NET ASSET VALUE | | | (0.30 | ) | | | (0.76 | ) | | | 0.55 | | | | 0.46 | | | | (0.32 | ) |
| NET ASSET VALUE, END OF PERIOD | | $ | 3.06 | | | $ | 3.36 | | | $ | 4.12 | | | $ | 3.57 | | | $ | 3.11 | |
| | | | | | | | | | | | | | | | | | | | | |
| TOTAL RETURN | | | (5.60 | )% | | | (7.19 | )% | | | 19.38 | % | | | 17.59 | % | | | (5.02 | )% |
| | | | | | | | | | | | | | | | | | | | | |
| RATIOS AND SUPPLEMENTAL DATA | | | | | | | | | | | | | | | | | | | | |
| Net assets, end of period (in 000s) | | $ | 473,820 | | | $ | 653,241 | | | $ | 813,322 | | | $ | 698,504 | | | $ | 579,371 | |
| | | | | | | | | | | | | | | | | | | | | |
| RATIOS TO AVERAGE NET ASSETS | | | | | | | | | | | | | | | | | | | | |
| Expenses (excluding fees waived/ reimbursed by investment advisor) | | | 1.37 | % | | | 1.37 | % | | | 1.37 | % | | | 1.37 | % | | | 1.38 | % |
| Expenses (including fees waived/ reimbursed by investment advisor) | | | 1.34 | % | | | 1.32 | % | | | 1.30 | % | | | 1.34 | % | | | 1.38 | % |
| Net investment income | | | 0.24 | % | | | 0.41 | % | | | 0.54 | % | | | 0.42 | % | | | 0.65 | % |
| | | | | | | | | | | | | | | | | | | | | |
| PORTFOLIO TURNOVER RATE | | | 27 | % | | | 34 | % | | | 26 | % | | | 30 | % | | | 34 | % |
| (a) | Per share numbers have been calculated using the average shares method. |
| (b) | Less than $0.005 or ($0.005) per share. |
See Notes to Financial Statements.
| 92 | 1.855.377.7325 | www.GrandeurPeakGlobal.com |
| Grandeur Peak International Stalwarts Fund | Financial Highlights |
For a Share Outstanding Throughout the Periods Presented
| Investor Class | | Year Ended April 30, 2020 | | | Year Ended April 30, 2019 | | | Year Ended April 30, 2018 | | | Year Ended April 30, 2017 | | | For the Period September 2, 2015 (Commencement of Operations) to April 30, 2016 | |
| NET ASSET VALUE, BEGINNING OF PERIOD | | $ | 14.70 | | | $ | 15.53 | | | $ | 13.04 | | | $ | 11.02 | | | $ | 10.00 | |
| | | | | | | | | | | | | | | | | | | | | |
| INCOME FROM INVESTMENT OPERATIONS | | | | | | | | | | | | | | | | | | | | |
| Net investment income(a) | | | 0.01 | | | | 0.04 | | | | 0.05 | | | | 0.02 | | | | 0.03 | |
| Net realized and unrealized gain/(loss) on investments | | | (0.29 | ) | | | (0.53 | ) | | | 2.62 | | | | 2.03 | | | | 0.99 | |
| Total income/(loss) from investment operations | | | (0.28 | ) | | | (0.49 | ) | | | 2.67 | | | | 2.05 | | | | 1.02 | |
| | | | | | | | | | | | | | | | | | | | | |
| DISTRIBUTIONS | | | | | | | | | | | | | | | | | | | | |
| From net investment income | | | (0.02 | ) | | | (0.05 | ) | | | – | | | | (0.03 | ) | | | – | |
| From net realized gain on investments | | | – | | | | (0.29 | ) | | | (0.18 | ) | | | – | | | | – | |
| Total distributions | | | (0.02 | ) | | | (0.34 | ) | | | (0.18 | ) | | | (0.03 | ) | | | – | |
| | | | | | | | | | | | | | | | | | | | | |
| REDEMPTION FEES ADDED TO PAID-IN CAPITAL | | | 0.00 | (b) | | | 0.00 | (b) | | | 0.00 | (b) | | | 0.00 | (b) | | | 0.00 | (b) |
| | | | | | | | | | | | | | | | | | | | | |
| INCREASE/DECREASE IN NET ASSET VALUE | | | (0.30 | ) | | | (0.83 | ) | | | 2.49 | | | | 2.02 | | | | 1.02 | |
| NET ASSET VALUE, END OF PERIOD | | $ | 14.40 | | | $ | 14.70 | | | $ | 15.53 | | | $ | 13.04 | | | $ | 11.02 | |
| | | | | | | | | | | | | | | | | | | | | |
| TOTAL RETURN | | | (1.91 | )% | | | (2.69 | )% | | | 20.50 | % | | | 18.68 | % | | | 10.20 | %(c) |
| | | | | | | | | | | | | | | | | | | | | |
| RATIOS AND SUPPLEMENTAL DATA | | | | | | | | | | | | | | | | | | | | |
| Net assets, end of period (in 000s) | | $ | 82,289 | | | $ | 72,204 | | | $ | 52,478 | | | $ | 31,045 | | | $ | 22,028 | |
| | | | | | | | | | | | | | | | | | | | | |
| RATIOS TO AVERAGE NET ASSETS | | | | | | | | | | | | | | | | | | | | |
| Expenses (excluding fees waived/ reimbursed by investment advisor) | | | 1.17 | % | | | 1.19 | % | | | 1.19 | % | | | 1.27 | % | | | 1.45 | %(d)(e) |
| Expenses (including fees waived/ reimbursed by investment advisor) | | | 1.17 | % | | | 1.19 | % | | | 1.19 | % | | | 1.27 | % | | | 1.35 | %(d)(e) |
| Net investment income | | | 0.04 | % | | | 0.26 | % | | | 0.33 | % | | | 0.19 | % | | | 0.44 | %(d) |
| | | | | | | | | | | | | | | | | | | | | |
| PORTFOLIO TURNOVER RATE | | | 32 | % | | | 42 | % | | | 24 | % | | | 37 | % | | | 59 | %(c) |
| (a) | Per share numbers have been calculated using the average shares method. |
| (b) | Less than $0.005 or ($0.005) per share. |
| (e) | Expense ratios during startup periods may not be representative of longer term operating periods. |
See Notes to Financial Statements.
| Annual Report | April 30, 2020 | 93 |
| Grandeur Peak International Stalwarts Fund | Financial Highlights |
For a Share Outstanding Throughout the Periods Presented
| Institutional Class | | Year Ended April 30, 2020 | | | Year Ended April 30, 2019 | | | Year Ended April 30, 2018 | | | Year Ended April 30, 2017 | | | For the Period September 2, 2015 (Commencement of Operations) to April 30, 2016 | |
| NET ASSET VALUE, BEGINNING OF PERIOD | | $ | 14.74 | | | $ | 15.57 | | | $ | 13.06 | | | $ | 11.03 | | | $ | 10.00 | |
| | | | | | | | | | | | | | | | | | | | | |
| INCOME FROM INVESTMENT OPERATIONS | | | | | | | | | | | | | | | | | | | | |
| Net investment income(a) | | | 0.05 | | | | 0.07 | | | | 0.08 | | | | 0.04 | | | | 0.04 | |
| Net realized and unrealized gain/(loss) on investments | | | (0.29 | ) | | | (0.54 | ) | | | 2.63 | | | | 2.04 | | | | 0.99 | |
| Total income/(loss) from investment operations | | | (0.24 | ) | | | (0.47 | ) | | | 2.71 | | | | 2.08 | | | | 1.03 | |
| | | | | | | | | | | | | | | | | | | | | |
| DISTRIBUTIONS | | | | | | | | | | | | | | | | | | | | |
| From net investment income | | | (0.04 | ) | | | (0.07 | ) | | | (0.02 | ) | | | (0.05 | ) | | | (0.00 | )(b) |
| From net realized gain on investments | | | – | | | | (0.29 | ) | | | (0.18 | ) | | | – | | | | – | |
| Total distributions | | | (0.04 | ) | | | (0.36 | ) | | | (0.20 | ) | | | (0.05 | ) | | | (0.00 | )(b) |
| | | | | | | | | | | | | | | | | | | | | |
| REDEMPTION FEES ADDED TO PAID-IN CAPITAL | | | 0.00 | (b) | | | 0.00 | (b) | | | 0.00 | (b) | | | 0.00 | (b) | | | 0.00 | (b) |
| | | | | | | | | | | | | | | | | | | | | |
| INCREASE/DECREASE IN NET ASSET VALUE | | | (0.28 | ) | | | (0.83 | ) | | | 2.51 | | | | 2.03 | | | | 1.03 | |
| NET ASSET VALUE, END OF PERIOD | | $ | 14.46 | | | $ | 14.74 | | | $ | 15.57 | | | $ | 13.06 | | | $ | 11.03 | |
| | | | | | | | | | | | | | | | | | | | | |
| TOTAL RETURN | | | (1.63 | )% | | | (2.50 | )% | | | 20.79 | % | | | 18.96 | % | | | 10.34 | %(c) |
| | | | | | | | | | | | | | | | | | | | | |
| RATIOS AND SUPPLEMENTAL DATA | | | | | | | | | | | | | | | | | | | | |
| Net assets, end of period (in 000s) | | $ | 870,916 | | | $ | 561,100 | | | $ | 496,358 | | | $ | 265,393 | | | $ | 119,070 | |
| | | | | | | | | | | | | | | | | | | | | |
| RATIOS TO AVERAGE NET ASSETS | | | | | | | | | | | | | | | | | | | | |
| Expenses (excluding fees waived/ reimbursed by investment advisor) | | | 0.92 | % | | | 0.94 | % | | | 0.94 | % | | | 1.02 | % | | | 1.20 | %(d)(e) |
| Expenses (including fees waived/ reimbursed by investment advisor) | | | 0.92 | % | | | 0.94 | % | | | 0.94 | % | | | 1.02 | % | | | 1.10 | %(d)(e) |
| Net investment income | | | 0.32 | % | | | 0.51 | % | | | 0.57 | % | | | 0.37 | % | | | 0.60 | %(d) |
| | | | | | | | | | | | | | | | | | | | | |
| PORTFOLIO TURNOVER RATE | | | 32 | % | | | 42 | % | | | 24 | % | | | 37 | % | | | 59 | %(c) |
| (a) | Per share numbers have been calculated using the average shares method. |
| (b) | Less than $0.005 or ($0.005) per share. |
| (e) | Expense ratios during startup periods may not be representative of longer term operating periods. |
See Notes to Financial Statements.
| 94 | 1.855.377.7325 | www.GrandeurPeakGlobal.com |
| Grandeur Peak US Stalwarts Fund | Financial Highlights |
For a Share Outstanding Throughout the Period Presented
| Institutional Class | | For the Period March 20, 2020 (Commencement of Operations) to April 30, 2020 | |
| NET ASSET VALUE, BEGINNING OF PERIOD | | $ | 10.00 | |
| | | | | |
| INCOME FROM INVESTMENT OPERATIONS | | | | |
| Net investment loss(a) | | | (0.01 | ) |
| Net realized and unrealized gain on investments | | | 3.16 | |
| Total income from investment operations | | | 3.15 | |
| | | | | |
| REDEMPTION FEES ADDED TO PAID-IN CAPITAL | | | 0.00 | (b) |
| | | | | |
| INCREASE IN NET ASSET VALUE | | | 3.15 | |
| NET ASSET VALUE, END OF PERIOD | | $ | 13.15 | |
| | | | | |
| TOTAL RETURN | | | 31.50 | %(c) |
| | | | | |
| RATIOS AND SUPPLEMENTAL DATA | | | | |
| Net assets, end of period (in 000s) | | $ | 9,421 | |
| | | | | |
| RATIOS TO AVERAGE NET ASSETS | | | | |
| Expenses (excluding fees waived/ reimbursed by investment advisor) | | | 6.23 | %(d)(e) |
| Expenses (including fees waived/ reimbursed by investment advisor) | | | 1.00 | %(d)(e) |
| Net investment loss | | | (0.53 | )%(d) |
| | | | | |
| PORTFOLIO TURNOVER RATE | | | 2 | %(c) |
| (a) | Per share numbers have been calculated using the average shares method. |
| (b) | Less than $0.005 or ($0.005) per share. |
| (e) | Expense ratios during startup periods may not be representative of longer term operating periods. |
See Notes to Financial Statements.
| Annual Report | April 30, 2020 | 95 |
| Grandeur Peak Funds® | Notes to Financial Statements |
April 30, 2020
1. ORGANIZATION
Financial Investors Trust (the “Trust”), a Delaware statutory trust, is an open-end management investment company registered under the Investment Company Act of 1940, as amended (“1940 Act”). As of April 30, 2020, the Trust consists of multiple separate portfolios or series. This annual report describes the Grandeur Peak Emerging Markets Opportunities Fund, Grandeur Peak Global Contrarian Fund, Grandeur Peak Global Micro Cap Fund, Grandeur Peak Global Opportunities Fund, Grandeur Peak Global Reach Fund, Grandeur Peak Global Stalwarts Fund, Grandeur Peak International Opportunities Fund, Grandeur Peak International Stalwarts Fund and Grandeur Peak US Stalwarts Fund (individually a “Fund” and collectively, the “Funds”). The Funds seek long-term growth of capital. The Funds offer Investor Class (except the Grandeur Peak Global Contrarian Fund, Grandeur Peak Global Micro Cap Fund and Grandeur Peak US Stalwarts Fund) and Institutional Class shares.
2. SIGNIFICANT ACCOUNTING POLICIES
The accompanying financial statements were prepared in accordance with accounting principles generally accepted in the United States of America (“U.S. GAAP”). The preparation of financial statements in conformity with U.S. GAAP requires management to make certain estimates and assumptions that affect the reported amounts of assets and liabilities and disclosures of contingent assets and liabilities at the date of the financial statements and the reported amounts of revenue and expenses during the period. Actual results could differ from those estimates. The Funds are considered an investment company for financial reporting purposes under U.S. GAAP and follows the accounting and reporting guidance applicable to investment companies in the Financial Accounting Standards Board Accounting Standards Codification Topic 946. The following is a summary of significant accounting policies consistently followed by the Funds in preparation of their financial statements.
Investment Valuation: The Funds generally value their securities based on market prices determined at the close of regular trading on the New York Stock Exchange (“NYSE”), normally 4:00 p.m. Eastern Time, on each day the NYSE is open for trading.
For equity securities and mutual funds that are traded on an exchange, the market price is usually the closing sale or official closing price on that exchange. In the case of equity securities not traded on an exchange, or if such closing prices are not otherwise available, the securities are valued at the mean of the most recent bid and ask prices on such day. Redeemable securities issued by open-end registered investment companies are valued at the investment company’s applicable net asset value, with the exception of exchange-traded open-end investment companies, which are priced as equity securities.
Equity securities that are primarily traded on foreign securities exchanges are valued at the closing values of such securities on their respective foreign exchanges, except when an event occurs subsequent to the close of the foreign exchange and the close of the NYSE that was likely to have changed such value. In such an event, the fair value of those securities are determined in good faith through consideration of other factors in accordance with procedures established by and under the general supervision of the Board of Trustees of the Trust (the “Board” or the “Trustees”). The Funds will use a fair valuation model provided by an independent pricing service, which is intended to reflect fair value when a security’s value or a meaningful portion of each Fund’s portfolio is believed to have been materially affected by a valuation event that has occurred between the close of the exchange or market on which the security is traded and the close of the regular trading day on the NYSE. The Funds’ valuation procedures set forth certain triggers which instruct when to use the fair valuation model.
Corporate bonds are valued using market models that consider trade data, quotations from dealers and active market makers, relevant yield curve and spread data, creditworthiness, trade data or market information on comparable securities, and other relevant security specific information.
Forward currency exchange contracts have a fair value determined by the prevailing foreign currency exchange daily rates and current foreign currency exchange forward rates. The foreign currency exchange forward rates are calculated using an automated system that estimates rates on the basis of the current day foreign currency exchange rates and forward foreign currency exchange rates supplied by a pricing service.
When such prices or quotations are not available, or when Grandeur Peak Global Advisors, LLC (the “Adviser” or “Grandeur Peak”) believes that they are unreliable, securities may be priced using fair value procedures approved by the Board.
Fair Value Measurements: The Funds disclose the classification of their fair value measurements following a three-tier hierarchy based on the inputs used to measure fair value. Inputs refer broadly to the assumptions that market participants would use in pricing the asset or liability, including assumptions about risk. Inputs may be observable or unobservable. Observable inputs reflect the assumptions market participants would use in pricing the asset or liability that are developed based on market data obtained from sources independent of the reporting entity. Unobservable inputs reflect the reporting entity’s own assumptions about the assumptions market participants would use in pricing the asset or liability that are developed based on the best information available.
| 96 | 1.855.377.7325 | www.GrandeurPeakGlobal.com |
| Grandeur Peak Funds® | Notes to Financial Statements |
April 30, 2020
Various inputs are used in determining the value of the Funds’ investments as of the end of the reporting period. When inputs used fall into different levels of the fair value hierarchy, the level in the hierarchy within which the fair value measurement falls is determined based on the lowest level input that is significant to the fair value measurement in its entirety. The designated input levels are not necessarily an indication of the risk or liquidity associated with these investments. These inputs are categorized in the following hierarchy under applicable financial accounting standards:
Level 1 – Unadjusted quoted prices in active markets for identical investments, unrestricted assets or liabilities that the Funds have the ability to access at the measurement date;
Level 2 – Quoted prices which are not active, quoted prices for similar assets or liabilities in active markets or inputs other than quoted prices that are observable (either directly or indirectly) for substantially the full term of the asset or liability; and
Level 3 – Significant unobservable prices or inputs (including the Funds’ own assumptions in determining the fair value of investments) where there is little or no market activity for the asset or liability at the measurement date.
The following is a summary of each Fund’s investments in the fair value hierarchy as of April 30, 2020:
| Investments in Securities at Value | | Level 1 - Quoted and Unadjusted Prices | | | Level 2 - Other Significant Observable Inputs | | | Level 3 - Significant Unobservable Inputs | | | Total | |
| Grandeur Peak Emerging Markets Opportunities Fund | | | | | | | | | | | | | | | | |
| Common Stocks | | | | | | | | | | | | | | | | |
| Bangladesh | | $ | – | | | $ | 3,192,275 | | | $ | – | | | $ | 3,192,275 | |
| Philippines | | | 18,131,138 | | | | – | | | | 7,060 | | | | 18,138,198 | |
| Other* | | | 373,496,932 | | | | – | | | | – | | | | 373,496,932 | |
| Total | | $ | 391,628,070 | | | $ | 3,192,275 | | | $ | 7,060 | | | $ | 394,827,405 | |
| Investments in Securities at Value | | Level 1 - Quoted and Unadjusted Prices | | | Level 2 - Other Significant Observable Inputs | | | Level 3 - Significant Unobservable Inputs | | | Total | |
| Grandeur Peak Global Contrarian Fund | | | | | | | | | | | | |
| Common Stocks* | | | 8,800,591 | | | | – | | | | – | | | | 8,800,591 | |
| Total | | $ | 8,800,591 | | | $ | – | | | $ | – | | | $ | 8,800,591 | |
| Investments in Securities at Value | | Level 1 - Quoted and Unadjusted Prices | | | Level 2 - Other Significant Observable Inputs | | | Level 3 - Significant Unobservable Inputs | | | Total | |
| Grandeur Peak Global Micro Cap Fund | | | | | | | | | | | | | | | | |
| Common Stocks | | | | | | | | | | | | | | | | |
| New Zealand | | $ | 122,584 | | | $ | – | | | $ | – | | | $ | 122,584 | |
| Other* | | | 28,221,513 | | | | – | | | | – | | | | 28,221,513 | |
| Total | | $ | 28,344,097 | | | $ | – | | | $ | – | | | $ | 28,344,097 | |
| Investments in Securities at Value | | Level 1 - Quoted and Unadjusted Prices | | | Level 2 - Other Significant Observable Inputs | | | Level 3 - Significant Unobservable Inputs | | | Total | |
| Grandeur Peak Global Opportunities Fund | | | | | | | | | | | | | | | | |
| Common Stocks | | | | | | | | | | | | | | | | |
| Bangladesh | | $ | – | | | $ | 970,300 | | | $ | – | | | $ | 970,300 | |
| New Zealand | | | – | | | | – | | | | 1 | | | | 1 | |
| Other* | | | 550,755,499 | | | | – | | | | – | | | | 550,755,499 | |
| Preferred Stocks* | | | – | | | | – | | | | 2,022,675 | | | | 2,022,675 | |
| Total | | $ | 550,755,499 | | | $ | 970,300 | | | $ | 2,022,676 | | | $ | 553,748,475 | |
| Annual Report | April 30, 2020 | 97 |
| Grandeur Peak Funds® | Notes to Financial Statements |
April 30, 2020
| Investments in Securities at Value | | Level 1 – Quoted and Unadjusted Prices | | | Level 2 - Other Significant Observable Inputs | | | Level 3 - Significant Unobservable Inputs | | | Total | |
| Grandeur Peak Global Reach Fund | | | | | | | | | | | | |
| Common Stocks | | | | | | | | | | | | | | | | |
| New Zealand | | $ | 966,111 | | | $ | – | | | $ | – | | | $ | 966,111 | |
| Spain | | | – | | | | – | | | | – | | | | – | |
| Other* | | | 230,284,307 | | | | – | | | | – | | | | 230,284,307 | |
| Preferred Stocks* | | | – | | | | – | | | | 959,285 | | | | 959,285 | |
| Total | | $ | 231,250,418 | | | $ | – | | | $ | 959,285 | | | $ | 232,209,703 | |
| Investments in Securities at Value | | Level 1 - Quoted and Unadjusted Prices | | | Level 2 - Other Significant Observable Inputs | | | Level 3 - Significant Unobservable Inputs | | | Total | |
| Grandeur Peak Global Stalwarts Fund | | | | | | | | | | | | |
| Common Stocks | | | | | | | | | | | | | | | | |
| Bangladesh | | $ | – | | | $ | 51 | | | $ | – | | | $ | 51 | |
| Other* | | | 201,526,936 | | | | – | | | | – | | | | 201,526,936 | |
| Preferred Stocks* | | | – | | | | – | | | | 507,803 | | | | 507,803 | |
| Total | | $ | 201,526,936 | | | $ | 51 | | | $ | 507,803 | | | $ | 202,034,790 | |
| Investments in Securities at Value | | Level 1 - Quoted and Unadjusted Prices | | | Level 2 - Other Significant Observable Inputs | | | Level 3 - Significant Unobservable Inputs | | | Total | |
| Grandeur Peak International Opportunities Fund | | | | | | | | | | | | |
| Common Stocks | | | | | | | | | | | | | | | | |
| Bangladesh | | $ | – | | | $ | 3,083,759 | | | $ | – | | | $ | 3,083,759 | |
| New Zealand | | | – | | | | – | | | | 1 | | | | 1 | |
| Other* | | | 508,185,475 | | | | – | | | | – | | | | 508,185,475 | |
| Total | | $ | 508,185,475 | | | $ | 3,083,759 | | | $ | 1 | | | $ | 511,269,235 | |
| Investments in Securities at Value | | Level 1 - Quoted and Unadjusted Prices | | | Level 2 - Other Significant Observable Inputs | | | Level 3 - Significant Unobservable Inputs | | | Total | |
| Grandeur Peak International Stalwarts Fund | | | | | | | | | | | | | | | | |
| Common Stocks | | | | | | | | | | | | | | | | |
| Bangladesh | | $ | – | | | $ | 1,925,491 | | | $ | – | | | $ | 1,925,491 | |
| Other* | | | 919,730,769 | | | | – | | | | – | | | | 919,730,769 | |
| Total | | $ | 919,730,769 | | | $ | 1,925,491 | | | $ | – | | | $ | 921,656,260 | |
| Investments in Securities at Value | | Level 1 - Quoted and Unadjusted Prices | | | Level 2 - Other Significant Observable Inputs | | | Level 3 - Significant Unobservable Inputs | | | Total | |
| Grandeur Peak US Stalwarts Fund | | | | | | | | | | | | | | | | |
| Common Stocks* | | | 9,138,627 | | | | – | | | | – | | | | 9,138,627 | |
| Total | | $ | 9,138,627 | | | $ | – | | | $ | – | | | $ | 9,138,627 | |
| * | For a detailed country breakdown, see the accompanying Portfolio of Investments. |
| 98 | 1.855.377.7325 | www.GrandeurPeakGlobal.com |
| Grandeur Peak Funds® | Notes to Financial Statements |
April 30, 2020
The following is a reconciliation of the investments in which significant unobservable inputs (Level 3) were used in determining fair value:
| Grandeur Peak Emerging Markets Opportunities Fund | | Common Stocks | | | Total | |
| Balance as of April 30, 2019 | | $ | – | | | $ | – | |
| Accrued Discount/Premium | | | – | | | | – | |
| Realized Gain/(Loss) | | | – | | | | – | |
| Change in Unrealized Appreciation/(Depreciation) | | | 7,060 | | | | 7,060 | |
| Purchases | | | – | | | | – | |
| Sales Proceeds | | | – | | | | – | |
| Transfer into Level 3 | | | – | | | | – | |
| Transfer out of Level 3 | | | – | | | | – | |
| Balance as of April 30, 2020 | | $ | 7,060 | | | $ | 7,060 | |
| Net change in unrealized Appreciation/(Depreciation) included in the Statements of Operations attributable to Level 3 investments held at April 30, 2020 | | $ | 7,060 | | | $ | 7,060 | |
| Grandeur Peak Global Opportunities Fund | | Common Stocks | | | Preferred Stocks | | | Total | |
| Balance as of April 30, 2019 | | $ | 1 | | | $ | 1,923,136 | | | $ | 1,923,137 | |
| Accrued Discount/Premium | | | – | | | | – | | | | – | |
| Realized Gain/(Loss) | | | – | | | | – | | | | – | |
| Change in Unrealized Appreciation/(Depreciation) | | | – | | | | 99,539 | | | | 99,539 | |
| Purchases | | | – | | | | – | | | | – | |
| Sales Proceeds | | | – | | | | – | | | | – | |
| Transfer into Level 3 | | | – | | | | – | | | | – | |
| Transfer out of Level 3 | | | – | | | | – | | | | – | |
| Balance as of April 30, 2020 | | $ | 1 | | | $ | 2,022,675 | | | $ | 2,022,676 | |
| Net change in unrealized Appreciation/(Depreciation) included in the Statements of Operations attributable to Level 3 investments held at April 30, 2020 | | $ | – | | | $ | 99,539 | | | $ | 99,539 | |
| Grandeur Peak Global Reach Fund | | Common Stocks | | | Preferred Stocks | | | Total | |
| Balance as of April 30, 2019 | | $ | 1 | | | $ | 912,077 | | | $ | 912,078 | |
| Accrued Discount/Premium | | | – | | | | – | | | | – | |
| Realized Gain/(Loss) | | | – | | | | – | | | | – | |
| Change in Unrealized Appreciation/(Depreciation) | | | (1 | ) | | | 47,208 | | | | 47,207 | |
| Purchases | | | – | | | | – | | | | – | |
| Sales Proceeds | | | – | | | | – | | | | – | |
| Transfer into Level 3 | | | – | | | | – | | | | – | |
| Transfer out of Level 3 | | | – | | | | – | | | | – | |
| Balance as of April 30, 2020 | | $ | – | | | $ | 959,285 | | | $ | 959,285 | |
| Net change in unrealized Appreciation/(Depreciation) included in the Statements of Operations attributable to Level 3 investments held at April 30, 2020 | | $ | (1 | ) | | $ | 47,208 | | | $ | 47,207 | |
| Grandeur Peak Global Stalwarts Fund | | Preferred Stocks | | | Total | |
| Balance as of April 30, 2019 | | $ | 482,814 | | | $ | 482,814 | |
| Accrued Discount/Premium | | | – | | | | – | |
| Realized Gain/(Loss) | | | – | | | | – | |
| Change in Unrealized Appreciation/(Depreciation) | | | 24,989 | | | | 24,989 | |
| Purchases | | | – | | | | – | |
| Sales Proceeds | | | – | | | | – | |
| Transfer into Level 3 | | | – | | | | – | |
| Transfer out of Level 3 | | | – | | | | – | |
| Balance as of April 30, 2020 | | $ | 507,803 | | | $ | 507,803 | |
| Net change in unrealized Appreciation/(Depreciation) included in the Statements of Operations attributable to Level 3 investments held at April 30, 2020 | | $ | 24,989 | | | $ | 24,989 | |
| Annual Report | April 30, 2020 | 99 |
| Grandeur Peak Funds® | Notes to Financial Statements |
April 30, 2020
| Grandeur Peak International Opportunities Fund | | Common Stocks | | | Total | |
| Balance as of April 30, 2019 | | $ | 1 | | | $ | 1 | |
| Accrued Discount/Premium | | | – | | | | – | |
| Realized Gain/(Loss) | | | – | | | | – | |
| Change in Unrealized Appreciation/(Depreciation) | | | – | | | | – | |
| Purchases | | | – | | | | – | |
| Sales Proceeds | | | – | | | | – | |
| Transfer into Level 3 | | | – | | | | – | |
| Transfer out of Level 3 | | | – | | | | – | |
| Balance as of April 30, 2020 | | $ | 1 | | | $ | 1 | |
| Net change in unrealized Appreciation/(Depreciation) included in the Statements of Operations attributable to Level 3 investments held at April 30, 2020 | | $ | – | | | $ | – | |
Change in unrealized appreciation/depreciation on Level 3 securities is included on the Statements of Operations under Net change in unrealized appreciation/(depreciation) on investments. Realized gain/(loss) on Level 3 securities is included on the Statements of Operations under Net realized gain/(loss) on investments.
The table below provides additional information about the Level 3 Fair Value Measurements as of April 30, 2020:
Quantitative Information about Level 3 Fair Value Measurements
Grandeur Peak Emerging Markets Opportunities Fund
| Asset Class | Fair Value (USD) at 4/30/2020 | Valuation Technique | Unobservable Inputs(a) | Value/Range |
| Common Stock | $7,060 | Market Approach | Price-to-Book Multiple | 0.80x |
Grandeur Peak Global Opportunities Fund
| Asset Class | Fair Value (USD) at 4/30/2020 | Valuation Technique | Unobservable Inputs(a) | Value/Range |
| Preferred Stock | $2,022,675 | Market Approach | Enterprise Value-to-Sales Multiple | 9.8x |
Grandeur Peak Global Reach Fund
| Asset Class | Fair Value (USD) at 4/30/2020 | Valuation Technique | Unobservable Inputs(a) | Value/Range |
| Preferred Stock | $959,285 | Market Approach | Enterprise Value-to-Sales Multiple | 9.8x |
Grandeur Peak Global Stalwarts Fund
��
| Asset Class | Fair Value (USD) at 4/30/2020 | Valuation Technique | Unobservable Inputs(a) | Value/Range |
| Preferred Stock | $507,803 | Market Approach | Enterprise Value-to-Sales Multiple | 9.8x |
| (a) | A change to the unobservable input may result in a significant change to the value of the investment as follows: |
| Unobservable Input | Impact to Value if Input Increases | Impact to Value if Input Decreases |
| Price-to-Book Multiple | Increase | Decrease |
| Enterprise Value-to-Sales Multiple | Increase | Decrease |
Investment Transactions and Investment Income: Investment transactions are accounted for on the date the investments are purchased or sold (trade date). Realized gains and losses from investment transactions are reported on an identified cost which is the same basis the Fund uses for federal income tax purposes. Interest income, which includes accretion of discounts and amortization of premiums, is accrued and recorded as earned. Dividend income is recognized on the ex-dividend date or for certain foreign securities, as soon as information is available to the Funds. All
| 100 | 1.855.377.7325 | www.GrandeurPeakGlobal.com |
| Grandeur Peak Funds® | Notes to Financial Statements |
April 30, 2020
of the realized and unrealized gains and losses and net investment income, are allocated daily to each class in proportion to its average daily net assets.
Cash Management Transactions: The Funds subscribe to the Brown Brothers Harriman & Co. (“BBH”) Cash Management Service (“CMS”), whereby cash balances are automatically swept into overnight offshore demand deposits with either the BBH Grand Cayman branch or a branch of a pre-approved commercial bank. This fully automated program allows the Funds to earn interest on cash balances. Excess cash with deposit institutions domiciled outside of the U.S. are subject to sovereign actions in the jurisdiction of the deposit institution including, but not limited to, freeze, seizure or diminution. Cash balances in the BBH CMS are included on the Statements of Assets and Liabilities under Cash and Foreign Cash, at Value. As of April 30, 2020, the Funds had the following cash balances participating in the BBH CMS:
| Fund | | | |
| Grandeur Peak Emerging Markets Opportunities Fund | | $ | 4,483,187 | |
| Grandeur Peak Global Contrarian Fund | | | 45,170 | |
| Grandeur Peak Global Micro Cap Fund | | | 1,565,644 | |
| Grandeur Peak Global Opportunities Fund | | | 6,754,679 | |
| Grandeur Peak Global Reach Fund | | | 8,206,977 | |
| Grandeur Peak Global Stalwarts Fund | | | 5,143,959 | |
| Grandeur Peak International Opportunities Fund | | | 10,574,900 | |
| Grandeur Peak International Stalwarts Fund | | | 31,076,088 | |
| Grandeur Peak US Stalwarts Fund | | | 850,239 | |
As of April 30, 2020, the Funds had the following foreign cash balances participating in the BBH CMS (cost and value of foreign cash balances are equal):
| Fund | | | |
| Grandeur Peak Emerging Markets Opportunities Fund | | $ | – | |
| Grandeur Peak Global Contrarian Fund | | | – | |
| Grandeur Peak Global Micro Cap Fund | | | – | |
| Grandeur Peak Global Opportunities Fund | | | 123,926 | |
| Grandeur Peak Global Reach Fund | | | – | |
| Grandeur Peak Global Stalwarts Fund | | | 5,592 | |
| Grandeur Peak International Opportunities Fund | | | – | |
| Grandeur Peak International Stalwarts Fund | | | 52,569 | |
Short Sales: The Funds may make short sales of securities consistent with their strategies. A short sale is a transaction in which a Fund sells a security it does not own in anticipation that the market price of that security will decline.
When a Fund makes a short sale, it must borrow the security sold short and deliver it to the broker dealer through which it made the short sale as collateral for its obligation to deliver the security upon conclusion of the sale. The Fund may have to pay a fee to borrow particular securities and is often obligated to pay over any accrued interest and dividends on such borrowed securities.
If the price of the security sold short increases between the time of the short sale and the time that a Fund replaces the borrowed security, the Fund will incur a loss; conversely, if the price declines, the Fund will realize a capital gain. Any gain will be decreased, and any loss increased, by the transaction costs described above. The successful use of short selling may be adversely affected by imperfect correlation between movements in the price of the security sold short and the securities being hedged.
To the extent that a Fund engages in short sales, it will provide collateral to the broker-dealer and (except in the case of short sales “against the box”) will maintain additional asset coverage in the form of segregated or “earmarked” assets determined to be liquid in accordance with procedures established by the Board and that is equal to the current market value of the securities sold short, or will ensure that such positions are covered by “offsetting” positions, until the Fund replaces the borrowed security. A short sale is “against the box” to the extent that the Fund contemporaneously owns, or has the right to obtain at no added cost, securities identical to those sold short. The Fund may engage in short selling to the extent permitted by the federal securities laws and rules and interpretations thereunder. To the extent a Fund engages in short selling in foreign (non-U.S.) jurisdictions, the Fund will do so to the extent permitted by the laws and regulations of such jurisdiction. As of April 30, 2020, the Funds did not hold any securities sold short.
| Annual Report | April 30, 2020 | 101 |
| Grandeur Peak Funds® | Notes to Financial Statements |
April 30, 2020
Foreign Securities: The Funds may directly purchase securities of foreign issuers. Investing in securities of foreign issuers involves special risks not typically associated with investing in securities of U.S. issuers. The risks include possible reevaluation of currencies, the inability to repatriate foreign currency, less complete financial information about companies and possible future adverse political and economic developments. Moreover, securities of many foreign issuers and their markets may be less liquid and their prices more volatile than those of securities of comparable U.S. issuers.
Foreign Currency Translation: The books and records of the Funds are maintained in U.S. dollars. Investment valuations and other assets and liabilities initially expressed in foreign currencies are converted each business day into U.S. dollars based upon current exchange rates. Prevailing foreign exchange rates may generally be obtained at the close of the NYSE (normally, 4:00 p.m. Eastern Time). The portion of realized and unrealized gains or losses on investments due to fluctuations in foreign currency exchange rates is not separately disclosed and is included in realized and unrealized gains or losses on investments, when applicable.
Foreign Currency Spot Contracts: The Funds may enter into foreign currency spot contracts to facilitate transactions in foreign securities or to convert foreign currency receipts into U.S. dollars. A foreign currency spot contract is an agreement between two parties to buy and sell currencies at the current market rate, for settlement generally within two business days. The U.S. dollar value of the contracts is determined using current currency exchange rates supplied by a pricing service.
The contract is marked-to-market daily for settlements beyond one day and any change in market value is recorded as an unrealized gain or loss. When the contract is closed, a realized gain or loss is recorded equal to the difference between the value on the open and close date. Losses may arise from changes in the value of the foreign currency, or if the counterparties do not perform under the contract’s terms. The maximum potential loss from such contracts is the aggregate face value in U.S. dollars at the time the contract was opened.
Trust Expenses: Some expenses of the Trust can be directly attributed to the Funds. Expenses which cannot be directly attributed to the Funds are apportioned among all funds in the Trust based on average net assets of each fund.
Fund and Class Expenses: Expenses that are specific to a Fund or class of shares of a Fund, including distribution fees (Rule 12b-1 fees), are charged directly to that Fund or share class. Expenses that are common to all Funds generally are allocated among the Funds in proportion to their average daily net assets.
Offering Costs: Offering costs, including costs of printing initial prospectuses, legal and registration fees, are being amortized over twelve months from the inception date of the Grandeur Peak Global Contrarian Fund and Grandeur Peak US Stalwarts Fund. Amounts amortized during the period ended April 30, 2020 for the Grandeur Peak Global Contrarian Fund and Grandeur Peak US Stalwarts Fund are shown on the Statements of Operations.
Federal Income Taxes: The Funds comply with the requirements under Subchapter M of the Internal Revenue Code of 1986, as amended, applicable to regulated investment companies and intend to distribute substantially all of their net taxable income and net capital gains, if any, each year so that it will not be subject to excise tax on undistributed income and gains. The Funds are not subject to income taxes to the extent such distributions are made.
As of and during the year ended April 30, 2020, the Funds had a liability for unrecognized capital gains tax. These amounts are disclosed as Foreign Capital Gains Tax on the Statements of Assets and Liabilities. The Funds file U.S. federal, state, and local tax returns as required. The Funds’ tax returns are subject to examination by the relevant tax authorities until expiration of the applicable statute of limitations, which is generally three years after the filing of the tax return for federal purposes and four years for most state returns. Tax returns for open years have incorporated no uncertain tax positions that require a provision for income taxes.
Distributions to Shareholders: Each Fund normally pays dividends and distributes capital gains, if any, on an annual basis. Income dividend distributions are derived from dividends and other income each Fund receives from their investments, including short term capital gains. Long term capital gain distributions are derived from gains realized when each Fund sells a security it has owned for more than a year. Each Fund may make additional distributions and dividends at other times if the portfolio manager believes doing so may be necessary for each Fund to avoid or reduce taxes. The Funds intend to pass through foreign tax credits to shareholders.
Epidemic and Pandemic Risk: Certain countries have been susceptible to epidemics, most recently COVID-19, which has been designated as a pandemic by world health authorities. The outbreak of such epidemics, together with any resulting restrictions on travel or quarantines imposed, could have a negative impact on the economy and business activity globally (including in the countries in which we invest), and thereby could adversely affect the performance of our investments. Furthermore, the rapid development of epidemics could preclude prediction as to their
| 102 | 1.855.377.7325 | www.GrandeurPeakGlobal.com |
| Grandeur Peak Funds® | Notes to Financial Statements |
April 30, 2020
ultimate adverse impact on economic and market conditions, and, as a result, present material uncertainty and risk with respect to us and the performance of our investments.
3. TAX BASIS INFORMATION
Reclassifications: As of April 30, 2020, permanent differences in book and tax accounting were reclassified. These differences had no effect on net assets and are primarily attributed to tax equalization. The reclassifications were as follows:
| Fund | | Paid-in Capital | | | Distributable earnings | |
| Grandeur Peak Emerging Markets Opportunities Fund | | $ | – | | | $ | – | |
| Grandeur Peak Global Contrarian Fund | | | – | | | | – | |
| Grandeur Peak Global Micro Cap Fund | | | 77,121 | | | | (77,121 | ) |
| Grandeur Peak Global Opportunities Fund | | | 3,051,308 | | | | (3,051,308 | ) |
| Grandeur Peak Global Reach Fund | | | 2,425,759 | | | | (2,425,759 | ) |
| Grandeur Peak Global Stalwarts Fund | | | 31,293 | | | | (31,293 | ) |
| Grandeur Peak International Opportunities Fund | | | 1,250,739 | | | | (1,250,739 | ) |
| Grandeur Peak International Stalwarts Fund | | | 357,353 | | | | (357,353 | ) |
| Grandeur Peak US Stalwarts Fund | | | (7,928 | ) | | | 7,928 | |
Tax Basis of Investments: As of April 30, 2020, the aggregate cost of investments, gross unrealized appreciation/(depreciation) and net unrealized appreciation/(depreciation) for Federal tax purposes was as follows:
| Fund | | Gross Appreciation (excess of value over tax cost) | | | Gross Depreciation (excess of tax cost over value) | | | Net Appreciation/ (Depreciation) of Foreign Currency | | | Net Unrealized Appreciation/(Depreciation) | | | Cost of Investments for Income Tax Purposes | |
| Grandeur Peak Emerging Markets Opportunities Fund | | $ | 94,453,187 | | | $ | (64,085,715 | ) | | $ | (51,907 | ) | | $ | 30,315,565 | | | $ | 364,459,933 | |
| Grandeur Peak Global Contrarian Fund | | | 524,987 | | | | (1,557,571 | ) | | | 239 | | | | (1,032,345 | ) | | | 9,833,175 | |
| Grandeur Peak Global Micro Cap Fund | | | 6,429,365 | | | | (3,314,281 | ) | | | (606 | ) | | | 3,114,478 | | | | 25,229,013 | |
| Grandeur Peak Global Opportunities Fund | | | 163,731,910 | | | | (58,791,808 | ) | | | (7,864 | ) | | | 104,932,238 | | | | 448,808,373 | |
| Grandeur Peak Global Reach Fund | | | 66,835,877 | | | | (21,357,113 | ) | | | (6,585 | ) | | | 45,472,179 | | | | 186,730,939 | |
| Grandeur Peak Global Stalwarts Fund | | | 45,339,190 | | | | (14,662,375 | ) | | | 573 | | | | 30,677,388 | | | | 171,357,975 | |
| Grandeur Peak International Opportunities Fund | | | 140,126,952 | | | | (63,456,480 | ) | | | (46,451 | ) | | | 76,624,021 | | | | 434,598,763 | |
| Grandeur Peak International Stalwarts Fund | | | 164,268,796 | | | | (96,816,919 | ) | | | (5,092 | ) | | | 67,446,785 | | | | 854,204,383 | |
| Grandeur Peak US Stalwarts Fund | | | 1,495,836 | | | | (14,598 | ) | | | – | | | | 1,481,238 | | | | 7,657,390 | |
Components of Earnings: As of April 30, 2020, components of distributable earnings on a tax basis were as follows:
| Fund | | Undistributed Ordinary Income | | | Accumulated Capital Gains/(Losses) | | | Other Accumulated Gain/(Loss) | | | Net Unrealized Appreciation/(Depreciation) on Investments and Foreign Currency | | | Total Distributable Earnings | |
| Grandeur Peak Emerging Markets Opportunities Fund | | $ | – | | | $ | (9,720,166 | ) | | $ | (189,112 | ) | | $ | 30,315,565 | | | $ | 20,406,287 | |
| Grandeur Peak Global Contrarian Fund | | | 38,449 | | | | (501,926 | ) | | | (3,636 | ) | | | (1,032,345 | ) | | | (1,499,458 | ) |
| Grandeur Peak Global Micro Cap Fund | | | – | | | | 355,895 | | | | (134 | ) | | | 3,114,478 | | | | 3,470,239 | |
| Grandeur Peak Global Opportunities Fund | | | – | | | | 7,017,750 | | | | (513 | ) | | | 104,932,238 | | | | 111,949,475 | |
| Grandeur Peak Global Reach Fund | | | – | | | | 3,546,486 | | | | (621 | ) | | | 45,472,179 | | | | 49,018,044 | |
| Grandeur Peak Global Stalwarts Fund | | | – | | | | (827,532 | ) | | | (17,033 | ) | | | 30,677,388 | | | | 29,832,823 | |
| Grandeur Peak International Opportunities Fund | | | – | | | | – | | | | (3,576 | ) | | | 76,624,021 | | | | 76,620,445 | |
| Grandeur Peak International Stalwarts Fund | | | 246,479 | | | | (7,421,456 | ) | | | 6,216 | | | | 67,446,785 | | | | 60,278,024 | |
| Grandeur Peak US Stalwarts Fund | | | 14,088 | | | | 29 | | | | – | | | | 1,481,238 | | | | 1,495,355 | |
| Annual Report | April 30, 2020 | 103 |
| Grandeur Peak Funds® | Notes to Financial Statements |
April 30, 2020
Tax Basis of Distributions to Shareholders: The character of distributions made during the year from net investment income or net realized gains may differ from its ultimate characterization for federal income tax purposes. Also, due to the timing of dividend distributions, the fiscal year in which amounts are distributed may differ from the fiscal year in which the income or realized gain were recorded by the Funds.
The tax character of distributions paid by the Funds for the fiscal year ended April 30, 2020 were as follows:
| Fund | | Ordinary Income | | | Long-Term Capital Gain | |
| Grandeur Peak Emerging Markets Opportunities Fund | | $ | 995,004 | | | $ | – | |
| Grandeur Peak Global Contrarian Fund | | | 19,023 | | | | – | |
| Grandeur Peak Global Micro Cap Fund | | | 25,741 | | | | 224,541 | |
| Grandeur Peak Global Opportunities Fund | | | – | | | | 36,811,507 | |
| Grandeur Peak Global Reach Fund | | | 805,795 | | | | 7,326,729 | |
| Grandeur Peak Global Stalwarts Fund | | | 179,533 | | | | 3,176,422 | |
| Grandeur Peak International Opportunities Fund | | | 1,679,453 | | | | 22,643,239 | |
| Grandeur Peak International Stalwarts Fund | | | 2,114,879 | | | | – | |
| Grandeur Peak US Stalwarts Fund | | | – | | | | – | |
The tax character of distributions paid by the Funds for the fiscal year ended April 30, 2019 were as follows:
| Fund | | Ordinary Income | | | Long-Term Capital Gain | |
| Grandeur Peak Emerging Markets Opportunities Fund | | $ | 1,399,313 | | | $ | 3,456,127 | |
| Grandeur Peak Global Contrarian Fund | | | – | | | | – | |
| Grandeur Peak Global Micro Cap Fund | | | 10,964 | | | | 2,207,059 | |
| Grandeur Peak Global Opportunities Fund | | | 4,541,112 | | | | 56,054,176 | |
| Grandeur Peak Global Reach Fund | | | 2,440,188 | | | | 27,120,108 | |
| Grandeur Peak Global Stalwarts Fund | | | 150,604 | | | | 5,087,232 | |
| Grandeur Peak International Opportunities Fund | | | 6,846,633 | | | | 62,253,180 | |
| Grandeur Peak International Stalwarts Fund | | | 2,587,918 | | | | 10,997,639 | |
| Grandeur Peak US Stalwarts Fund | | | – | | | | – | |
Under current law, capital losses maintain their character as short- term or long-term and are carried forward to the next tax year without expiration. As of the current fiscal year end, the following amounts are available as carry forwards to the next tax year:
| Fund | | Short-Term | | | Long-Term | |
| Grandeur Peak Emerging Markets Opportunities Fund | | $ | 2,562,730 | | | $ | 6,736,853 | |
| Grandeur Peak International Stalwarts Fund | | | 1,550,827 | | | | – | |
The following Funds elect to defer to the year ending April 30, 2021, capital losses recognized during the period November 1, 2019 – April 30, 2020 in the amount of:
| Fund | | Capital Losses Recognized | |
| Grandeur Peak Emerging Markets Opportunities Fund | | $ | 420,583 | |
| Grandeur Peak Global Contrarian Fund | | | 501,926 | |
| Grandeur Peak Global Stalwarts Fund | | | 827,532 | |
| Grandeur Peak International Stalwarts Fund | | | 5,870,629 | |
The following Funds elect to defer to the period ending April 30, 2021, late year ordinary losses in the amount of:
| Fund | | Ordinary Losses Recognized | |
| Grandeur Peak Emerging Markets Opportunities Fund | | $ | 189,112 | |
| Grandeur Peak Global Contrarian Fund | | | 3,216 | |
| Grandeur Peak Global Stalwarts Fund | | | 16,556 | |
| 104 | 1.855.377.7325 | www.GrandeurPeakGlobal.com |
| Grandeur Peak Funds® | Notes to Financial Statements |
April 30, 2020
4. SECURITIES TRANSACTIONS
The cost of purchases and proceeds from sales of securities (excluding short term securities) during the year ended April 30, 2020 were as follows:
| Fund | | Purchases of Securities | | | Proceeds From Sales of Securities | |
| Grandeur Peak Emerging Markets Opportunities Fund | | $ | 100,407,522 | | | $ | 109,312,223 | |
| Grandeur Peak Global Contrarian Fund | | | 12,368,713 | | | | 2,047,746 | |
| Grandeur Peak Global Micro Cap Fund | | | 10,758,850 | | | | 17,505,534 | |
| Grandeur Peak Global Opportunities Fund | | | 251,114,401 | | | | 312,765,287 | |
| Grandeur Peak Global Reach Fund | | | 94,927,251 | | | | 183,625,795 | |
| Grandeur Peak Global Stalwarts Fund | | | 102,108,798 | | | | 92,305,820 | |
| Grandeur Peak International Opportunities Fund | | | 164,776,973 | | | | 264,358,296 | |
| Grandeur Peak International Stalwarts Fund | | | 570,019,225 | | | | 226,752,853 | |
| Grandeur Peak US Stalwarts Fund | | | 7,744,538 | | | | 96,438 | |
5. SHARES OF BENEFICIAL INTEREST
The capitalization of the Trust consists of an unlimited number of shares of beneficial interest with no par value per share. Holders of the shares of the Funds of the Trust have one vote for each share held and a proportionate fraction of a vote for each fractional share. All shares issued and outstanding are fully paid and are transferable and redeemable at the option of the shareholder. Purchasers of the share do not have any obligation to make payments to the Trust or its creditors solely by reason of the purchasers’ ownership of the shares. Shares have no pre-emptive rights.
Shares redeemed within 60 days of purchase may incur a 2% short-term redemption fee deducted from the redemption amount. For the year ended April 30, 2020 and the year ended April 30, 2019, the redemption fees charged by the Funds are presented in the Statements of Changes in Net Assets.
6. MANAGEMENT AND RELATED-PARTY TRANSACTIONS
The Adviser, subject to the authority of the Board, is responsible for the overall management and administration of the Funds’ business affairs. The Adviser manages the investments of the Funds in accordance with the Funds’ investment objective, policies and limitations and investment guidelines established jointly by the Adviser and the Trustees. Pursuant to the Advisory Agreement, (the “Advisory Agreement”), each Fund pays the Adviser an annual management fee based on each Fund’s average daily net assets. The management fee is paid on a monthly basis. The following table reflects the Funds’ advisory fee rates.
| Fund | | Advisory Fee | |
| Grandeur Peak Emerging Markets Opportunities Fund | | | 1.35 | % |
| Grandeur Peak Global Contrarian Fund | | | 1.00 | % |
| Grandeur Peak Global Opportunities Fund | | | 1.25 | % |
| Grandeur Peak Global Reach Fund | | | 1.10 | % |
| Grandeur Peak Global Stalwarts Fund | | | 0.80 | % |
| Grandeur Peak International Opportunities Fund | | | 1.25 | % |
| Grandeur Peak International Stalwarts Fund | | | 0.80 | % |
| Grandeur Peak US Stalwarts Fund | | | 0.75 | % |
| Annual Report | April 30, 2020 | 105 |
| Grandeur Peak Funds® | Notes to Financial Statements |
April 30, 2020
The Adviser has contractually agreed to limit certain of each Fund’s expenses (excluding acquired fund fees and expenses, brokerage expenses, interest expenses, taxes and extraordinary expenses). The following table reflects the Funds’ expense cap.
| Fund | Expense Cap | Term of Expense Limit Agreements |
| Grandeur Peak Emerging Markets Opportunities Fund | | September 1, 2019 – August 31, 2020 / |
| Investor Class | 1.95% | September 1, 2018 – August 31, 2019 |
| Institutional Class | 1.70% | |
| | | |
| Grandeur Peak Global Contrarian Fund | | September 12, 2019 – August 31, 2021 |
| Institutional Class | 1.35% | |
| | | |
| Grandeur Peak Global Micro Cap Fund | | September 1, 2019 – August 31, 2020 / |
| Institutional Class | 2.00% | September 1, 2018 – August 31, 2019 |
| | | |
| Grandeur Peak Global Opportunities Fund | | September 1, 2019 – August 31, 2020 / |
| Investor Class | 1.75% | September 1, 2018 – August 31, 2019 |
| Institutional Class | 1.50% | |
| | | |
| Grandeur Peak Global Reach Fund | | September 1, 2019 – August 31, 2020 / |
| Investor Class | 1.60% | September 1, 2018 – August 31, 2019 |
| Institutional Class | 1.35% | |
| | | |
| Grandeur Peak Global Stalwarts Fund | | September 1, 2019 – August 31, 2020 / |
| Investor Class | 1.35% | September 1, 2018 – August 31, 2019 |
| Institutional Class | 1.10% | |
| | | |
| Grandeur Peak International Opportunities Fund | | September 1, 2019 – August 31, 2020 / |
| Investor Class | 1.75% | September 1, 2018 – August 31, 2019 |
| Institutional Class | 1.50% | |
| | | |
| Grandeur Peak International Stalwarts Fund | | September 1, 2019 – August 31, 2020 / |
| Investor Class | 1.35% | September 1, 2018 – August 31, 2019 |
| Institutional Class | 1.10% | |
| | | |
| Grandeur Peak US Stalwarts Fund | | December 23, 2019 - August 31, 2021 |
| Institutional Class | 1.00% | |
Pursuant to these agreements, each Fund will reimburse the Adviser for any previous fee waivers and expense reimbursements made by the Adviser, provided that any such reimbursements made by the Funds to the Adviser will not cause the Funds’ expense limitation to exceed expense limitations in existence at the time the expense was incurred, or at the time of the reimbursement, whichever is lower, and the reimbursement is made within three years after the expenses were incurred. Fees waived/reimbursed by the Adviser for the period or year ended April 30, 2020 are disclosed in the Statements of Operations.
In addition to the foregoing contractual arrangements, the Adviser has voluntarily agreed, effective September 1, 2016, to waive, with respect to the Grandeur Peak Global Opportunities Fund and the Grandeur Peak International Opportunities Fund, annual management fees to the extent such fees exceed 1.10% on assets above $500 million (the annual management fee rate with respect to such funds will remain 1.25% on the first $500 million in assets). The Adviser has also voluntarily agreed, effective January 1, 2018, to waive, with respect to the Grandeur Peak Emerging Markets Opportunities Fund, annual management fees to the extent such fees exceed 1.20% on all assets above $400 million (the annual management fee rate with respect to the Fund will remain 1.35% on the first $400 million in assets). These voluntary arrangements may be terminated at any time by the Adviser. Voluntary waivers are not subject to recoupment by the Adviser. Voluntary fees waived by the Adviser for the year ended April 30, 2020 are disclosed in the Statements of Operations.
| 106 | 1.855.377.7325 | www.GrandeurPeakGlobal.com |
| Grandeur Peak Funds® | Notes to Financial Statements |
April 30, 2020
For the period or year ended April 30, 2020, the fee waivers/reimbursements and/or recoupments, excluding voluntary waivers, were as follows:
| Fund | | Fees Waived/Reimbursed By Adviser | | | Recoupment of Previously Waived Fees By Adviser | |
| Grandeur Peak Emerging Markets Opportunities Fund | | | | | | |
| Investor Class | | $ | – | | | $ | – | |
| Institutional Class | | | – | | | | – | |
| Grandeur Peak Global Contrarian Fund | | | | | | | | |
| Institutional Class | | $ | 139,213 | | | $ | – | |
| Grandeur Peak Global Micro Cap Fund | | | | | | | | |
| Institutional Class | | $ | 23,568 | | | $ | 4,502 | |
| Grandeur Peak Global Opportunities Fund | | | | | | | | |
| Investor Class | | $ | – | | | $ | – | |
| Institutional Class | | | – | | | | – | |
| Grandeur Peak Global Reach Fund | | | | | | | | |
| Investor Class | | $ | – | | | $ | – | |
| Institutional Class | | | – | | | | – | |
| Grandeur Peak Global Stalwarts Fund | | | | | | | | |
| Investor Class | | $ | – | | | $ | – | |
| Institutional Class | | | – | | | | – | |
| Grandeur Peak International Opportunities Fund | | | | | | | | |
| Investor Class | | $ | – | | | $ | – | |
| Institutional Class | | | – | | | | – | |
| Grandeur Peak International Stalwarts Fund | | | | | | | | |
| Investor Class | | $ | – | | | $ | – | |
| Institutional Class | | | – | | | | – | |
| Grandeur Peak US Stalwarts Fund | | | | | | | | |
| Institutional Class | | $ | 33,383 | | | $ | – | |
| Annual Report | April 30, 2020 | 107 |
| Grandeur Peak Funds® | Notes to Financial Statements |
April 30, 2020
As of April 30, 2020, the balances of recoupable expenses for each Fund were as follows:
| Fund | | Expires 2021 | | | Expires 2022 | | | Expires 2023 | | | Total | |
| Grandeur Peak Emerging Markets Opportunities Fund | | | | | | | | | | | | |
| Investor Class | | $ | – | | | $ | – | | | $ | – | | | $ | – | |
| Institutional Class | | | – | | | | – | | | | – | | | | – | |
| Grandeur Peak Global Contrarian Fund | | | | | | | | | | | | | | | | |
| Institutional Class | | $ | – | | | $ | – | | | $ | 139,213 | | | $ | 139,213 | |
| Grandeur Peak Global Micro Cap Fund | | | | | | | | | | | | | | | | |
| Institutional Class | | $ | 23,008 | | | $ | 25,568 | | | $ | 23,568 | | | $ | 72,144 | |
| Grandeur Peak Global Opportunities Fund | | | | | | | | | | | | | | | | |
| Investor Class | | $ | – | | | $ | – | | | $ | – | | | $ | – | |
| Institutional Class | | | – | | | | – | | | | – | | | | – | |
| Grandeur Peak Global Reach Fund | | | | | | | | | | | | | | | | |
| Investor Class | | $ | – | | | $ | – | | | $ | – | | | $ | – | |
| Institutional Class | | | – | | | | – | | | | – | | | | – | |
| Grandeur Peak Global Stalwarts Fund | | | | | | | | | | | | | | | | |
| Investor Class | | $ | – | | | $ | – | | | $ | – | | | $ | – | |
| Institutional Class | | | – | | | | – | | | | – | | | | – | |
| Grandeur Peak International Opportunities Fund | | | | | | | | | | | | | | | | |
| Investor Class | | $ | – | | | $ | – | | | $ | – | | | $ | – | |
| Institutional Class | | | – | | | | – | | | | – | | | | – | |
| Grandeur Peak International Stalwarts Fund | | | | | | | | | | | | | | | | |
| Investor Class | | $ | – | | | $ | – | | | $ | – | | | $ | – | |
| Institutional Class | | | – | | | | – | | | | – | | | | – | |
| Grandeur Peak US Stalwarts Fund | | | | | | | | | | | | | | | | |
| Institutional Class | | $ | – | | | $ | – | | | $ | 33,383 | | | $ | 33,383 | |
Administrator Fees and Expenses: ALPS Fund Services, Inc. (“ALPS”) serves as administrator to the Funds and the Funds have agreed to pay expenses incurred in connection with their administrative activities. Pursuant to an Administration Agreement, ALPS provides operational services to the Funds including, but not limited to, fund accounting and fund administration and generally assists in the Funds’ operations. Officers of the Trust are employees of ALPS. The Funds’ administration fee is accrued on a daily basis and paid monthly. Administration fees paid by the Funds for the period or year ended April 30, 2020 are disclosed in the Statements of Operations.
ALPS is reimbursed by the Funds for certain out-of-pocket expenses.
Transfer Agent: ALPS serves as transfer, dividend paying and shareholder servicing agent for the Funds. ALPS receives an annual minimum fee, a fee based upon the number of shareholder accounts, and is also reimbursed by the Funds for certain out-of-pocket expenses. Transfer agent fees paid by the Funds for the period or year ended April 30, 2020 are disclosed in the Statements of Operations.
Compliance Services: ALPS provides services that assist the Trust’s chief compliance officer in monitoring and testing the policies and procedures of the Trust in conjunction with requirements under Rule 38a-1 under the 1940 Act and receives an annual base fee. ALPS is reimbursed for certain out-of-pocket expenses by the Funds. Compliance service fees paid by the Funds for the period or year ended April 30, 2020 are disclosed in the Statements of Operations.
Principal Financial Officer: ALPS receives an annual fee for providing principal financial officer services to the Funds. Principal financial officer fees paid by the Fund for the period or year ended April 30, 2020 are disclosed in the Statements of Operations.
Trustees: The fees and expenses of the Trustees of the Board are presented in the Statements of Operations.
Distributor: ALPS Distributors, Inc. (“ADI” or the “Distributor”) (an affiliate of ALPS) acts as the distributor of the Funds’ shares pursuant to a Distribution Agreement with the Trust. Shares are sold on a continuous basis by ADI as agent for the Funds, and ADI has agreed to use its best efforts to solicit orders for the sale of Funds’ shares, although it is not obliged to sell any particular amount of shares. ADI is not entitled to any compensation for its services as Distributor. ADI is registered as a broker-dealer with the U.S. Securities and Exchange Commission.
| 108 | 1.855.377.7325 | www.GrandeurPeakGlobal.com |
| Grandeur Peak Funds® | Notes to Financial Statements |
April 30, 2020
Each Fund has adopted a Distribution and Services (Rule 12b-1) Plan pursuant to Rule 12b-1 of the 1940 Act (the “Plan”) for its Investor Class shares. The Plan allows the Funds to use Investor Class assets to pay fees in connection with the distribution and marketing of Investor Class shares and/or the provision of shareholder services to Investor Class shareholders. The Plan permits payment for services in connection with the administration of plans or programs that use Investor Class shares of each Fund as their funding medium and for related expenses. The recipients of such payments may include the Distributor, other affiliates of the Adviser, broker-dealers, financial institutions, plan sponsors and administrators and other financial intermediaries through which investors may purchase shares of the Fund. The Plan permits the Funds to make total payments at an annual rate of up to 0.25% of each Fund’s average daily net assets attributable to its Investor Class shares. The expenses of the Plan are reflected as distribution and service fees in the Statements of Operations.
7. INDEMNIFICATIONS
Under the Trust’s organizational documents, its officers and Trustees are indemnified against certain liability arising out of the performance of their duties to the Trust. Additionally, in the normal course of business, the Trust enters into contracts with service providers that may contain general indemnification clauses, which may permit indemnification to the extent permissible under applicable law. The Trust’s maximum exposure under these arrangements is unknown, as this would involve future claims that may be made against the Trust that have not yet occurred.
| Annual Report | April 30, 2020 | 109 |
| Grandeur Peak Funds® | Report of Independent Registered Public Accounting Firm |
To the shareholders and the Board of Trustees of Financial Investors Trust
Opinion on the Financial Statements and Financial Highlights
We have audited the accompanying statements of assets and liabilities, including the portfolios of investments, of Grandeur Peak Emerging Markets Opportunities Fund, Grandeur Peak Global Contrarian Fund, Grandeur Peak Global Micro Cap Fund, Grandeur Peak Global Opportunities Fund, Grandeur Peak Global Reach Fund, Grandeur Peak Global Stalwarts Fund, Grandeur Peak International Opportunities Fund, Grandeur Peak International Stalwarts Fund, and Grandeur Peak US Stalwarts Fund (the “Funds”), nine of the funds constituting the Financial Investors Trust, as of April 30, 2020; the related statements of operations for the year then ended, the statements of changes in net assets for each of the two years in the period then ended, and the financial highlights for each of the five years in the period then ended for Grandeur Peak Emerging Markets Opportunities Fund, Grandeur Peak Global Opportunities Fund, Grandeur Peak Global Reach Fund, and Grandeur Peak International Opportunities Fund; the related statements of operations, changes in net assets, and the financial highlights for the periods indicated in the table below for Grandeur Peak Global Contrarian Fund, Grandeur Peak Global Micro Cap Fund, Grandeur Peak Global Stalwarts Fund, Grandeur Peak International Stalwarts Fund, and Grandeur Peak US Stalwarts Fund; and the related notes.
In our opinion, the financial statements and financial highlights present fairly, in all material respects, the financial position of each of the funds listed above constituting Financial Investors Trust as of April 30, 2020, and the results of their operations for the year then ended (or for the period listed in the table below), the changes in their net assets for each of the two years in the period then ended (or for the periods listed in the table below), and the financial highlights for each of the five years in the period then ended (or for the periods listed in the table below), in conformity with accounting principles generally accepted in the United States of America.
| Individual Fund Comprising the Financial Investors Trust | Statement of Operations | Statements of Changes in Net Assets | Financial Highlights |
| Grandeur Peak Global Contrarian Fund | From September 18, 2019 (commencement of operations) through April 30, 2020 |
| | | | |
| Grandeur Peak Global Micro Cap Fund | For the year ended April 30, 2020 | For the years ended April 30, 2019 and 2018 | For the years ended April 30, 2019, 2018, 2017, and the period from September 2, 2015 (commencement of operations) through April 30, 2016 |
| Grandeur Peak Global Stalwarts Fund | For the year ended April 30, 2020 | For the years ended April 30, 2019 and 2018 | For the years ended April 30, 2019, 2018, 2017, and the period from September 2, 2015 (commencement of operations) through April 30, 2016 |
| Grandeur Peak International Stalwarts Fund | For the year ended April 30, 2020 | For the years ended April 30, 2019 and 2018 | For the years ended April 30, 2019, 2018, 2017, and the period from September 2, 2015 (commencement of operations) through April 30, 2016 |
| Grandeur Peak US Stalwarts Fund | For the period | from March 20, 2020 (commencement of operations) through April 30, 2020 |
Basis for Opinion
These financial statements and financial highlights are the responsibility of the Funds’ management. Our responsibility is to express an opinion on the Funds’ financial statements and financial highlights based on our audits. We are a public accounting firm registered with the Public Company Accounting Oversight Board (United States) (PCAOB) and are required to be independent with respect to the Funds in accordance with the U.S. federal securities laws and the applicable rules and regulations of the Securities and Exchange Commission and the PCAOB.
We conducted our audits in accordance with the standards of the PCAOB. Those standards require that we plan and perform the audit to obtain reasonable assurance about whether the financial statements and financial highlights are free of material misstatement, whether due to error or fraud. The Funds are not required to have, nor were we engaged to perform, an audit of their internal control over financial reporting. As part of our audits we are required to obtain an understanding of internal control over financial reporting but not for the purpose of expressing an opinion on the effectiveness of the Funds’ internal control over financial reporting. Accordingly, we express no such opinion.
Our audits included performing procedures to assess the risks of material misstatement of the financial statements and financial highlights, whether due to error or fraud, and performing procedures that respond to those risks. Such procedures included examining, on a test basis, evidence regarding the amounts and disclosures in the financial statements and financial highlights. Our audits also included evaluating the accounting principles used and significant estimates made by management, as well as evaluating the overall presentation of the financial
| 110 | 1.855.377.7325 | www.GrandeurPeakGlobal.com |
| Grandeur Peak Funds® | Report of Independent Registered Public Accounting Firm |
statements and financial highlights. Our procedures included confirmation of securities owned as of April 30, 2020, by correspondence with the custodian and brokers; when replies were not received from brokers, we performed other auditing procedures. We believe that our audits provide a reasonable basis for our opinion.
DELOITTE & TOUCHE LLP
Denver, Colorado June 29, 2020
We have served as the auditor of one or more investment companies advised by Grandeur Peak Global Advisors, LLC since 2012.
| Annual Report | April 30, 2020 | 111 |
| Grandeur Peak Funds® | Disclosure Regarding Approval of Fund Advisory Agreement |
Grandeur Peak US Stalwarts Fund
On December 10, 2019, the Trustees met in person to discuss, among other things, the approval of the Investment Advisory Agreement between Grandeur Peak Global Advisors, LLC (“Grandeur Peak”) and the Trust, with respect to the Grandeur Peak US Stalwarts Fund (the “New Grandeur Peak Fund”), in accordance with Section 15(c) of the 1940 Act. In approving the Investment Advisory Agreement with Grandeur Peak, the Trustees, including the Independent Trustees, considered the following factors with respect to the New Grandeur Peak Fund:
Investment Advisory Fee Rate: The Trustees reviewed and considered the contractual annual advisory fee to be paid by the Trust, on behalf of the New Grandeur Peak Fund, of 0.75% of such Fund’s daily average net assets, to Grandeur Peak, in light of the extent and quality of the advisory services provided by Grandeur Peak to the New Grandeur Peak Fund.
The Board received and considered information including a comparison of the New Grandeur Peak Fund’s contractual advisory fees with those of funds in the peer group and universe of funds provided by an independent provider of investment company data (the “Data Provider”). The Trustees noted that the contractual and gross advisory fee rates for Institutional Class shares of the New Grandeur Peak Fund were below its Data Provider peer group median and equivalent to the Data Provider universe median.
Total Net Expense Ratios: The Trustees further reviewed and considered the total net expense ratio of 1.00% for the Institutional Class shares of the New Grandeur Peak Fund. The Trustees noted that the total net expense ratio of Institutional Class shares of the New Grandeur Peak Fund was equivalent to its Data Provider peer group median and above its Data Provider universe median.
Nature, Extent, and Quality of the Services under the Investment Advisory Agreement: The Trustees received and considered information regarding the nature, extent, and quality of services to be provided to the New Grandeur Peak Fund under the Investment Advisory Agreement. The Trustees noted that they had previously reviewed certain background materials supplied by Grandeur Peak, including its Form ADV.
The Trustees reviewed and considered Grandeur Peak’s investment advisory personnel, history as an asset manager, performance, and the amount of assets currently under management. The Trustees also reviewed the research and decision-making processes utilized by Grandeur Peak, including the methods adopted to seek to achieve compliance with the investment objective, policies, and restrictions of the New Grandeur Peak Fund.
The Trustees considered the background and experience of Grandeur Peak’s management in connection with the New Grandeur Peak Fund, including reviewing the qualifications, backgrounds, and responsibilities of the management team primarily responsible for the day-to-day portfolio management of the Fund and the extent of the resources devoted to research and analysis of actual and potential investments.
The Trustees noted that they had also previously reviewed, among other things, Grandeur Peak’s insider trading policy and procedures and Code of Ethics.
Performance: The Trustees noted that since the New Grandeur Peak Fund has not yet begun operations, there was no performance to be reviewed or analyzed at this time. The Trustees further considered the reputation of Grandeur Peak’s personnel generally and its investment techniques, risk management controls, and decision-making processes.
Comparable Accounts: The Trustees noted that Grandeur Peak has no other comparable clients to the New Grandeur Peak Fund.
Profitability: The Trustees received and considered a projected profitability analysis prepared by Grandeur Peak based on the fees to be paid under the Investment Advisory Agreement with respect to the New Grandeur Peak Fund. The Trustees considered the profits, if any, anticipated to be realized by Grandeur Peak in connection with the operation of the New Grandeur Peak Fund. The Board then reviewed Grandeur Peak’s estimated income statement for 2019 and projected income statement for 2020 in order to analyze the financial condition, stability, and profitability of Grandeur Peak.
Economies of Scale: The Trustees considered whether economies of scale in the provision of services to the New Grandeur Peak Fund will be passed along to the shareholders under the agreement.
Other Benefits to the Adviser: The Trustees reviewed and considered any other incidental benefits to be derived by Grandeur Peak from its relationship with the New Grandeur Peak Fund, including whether soft dollar arrangements would be used.
| 112 | 1.855.377.7325 | www.GrandeurPeakGlobal.com |
| Grandeur Peak Funds® | Disclosure Regarding Approval of Fund Advisory Agreement |
The Trustees, including all of the Independent Trustees, concluded that:
| • | the contractual and gross advisory fee rates for Institutional Class shares of the New Grandeur Peak Fund were below its Data Provider peer group median and equivalent to the Data Provider universe median; |
| • | the total net expense ratio of Institutional Class shares of the New Grandeur Peak Fund was equivalent to its Data Provider peer group median and above its Data Provider universe median; |
| • | the nature, extent and quality of services to be rendered by Grandeur Peak under the Investment Advisory Agreement with respect to the New Grandeur Peak Fund were adequate; |
| • | since the New Grandeur Peak Fund had not yet begun operations, there was no performance to be reviewed or analyzed at this time; |
| • | there were no directly comparable accounts managed by Grandeur Peak for the Board to consider; |
| • | the profit, if any, anticipated to be realized by Grandeur Peak in connection with the operation of the New Grandeur Peak Fund is not unreasonable; and |
| • | there were no material economies of scale or other incidental benefits accruing to Grandeur Peak in connection with its relationship with the New Grandeur Peak Fund. |
Based on the Trustees’ deliberations and their evaluation of the information described above, the Trustees, including all of the Independent Trustees, concluded that Grandeur Peak’s compensation for investment advisory services is consistent with the best interests of the New Grandeur Peak Fund and its shareholders.
| Annual Report | April 30, 2020 | 113 |
| Grandeur Peak Funds® | Additional Information |
April 30, 2020 (Unaudited)
1. FUND HOLDINGS
The Funds file their complete schedule of portfolio holdings with the Commission for the first and third quarters of each fiscal year as an exhibit to its reports on Form N-PORT. The Funds’ Form N-PORT reports are available on the Commission’s Web site at http://www.sec.gov. The Funds’ Form N-PORTs are also available upon request by calling 1-855-377-PEAK (7325).
2. FUND PROXY VOTING POLICIES, PROCEDURES AND SUMMARIES
The Funds’ policies and procedures used in determining how to vote proxies and information regarding how the Funds voted proxies relating to portfolio securities during the most recent prior 12-month period ending June 30 are available without charge, (1) upon request, by calling 1-855-377-PEAK (7325) and (2) on the SEC’s website at http://www.sec.gov.
3. TAX DESIGNATIONS
The Funds designate the following amounts for federal income tax purposes for the fiscal year ended April 30, 2020:
| | | Foreign Taxes Paid | | | Foreign Source Income | |
| Grandeur Peak Global Opportunities Fund | | $ | 766,438 | | | $ | 9,059,203 | |
| Grandeur Peak International Opportunities Fund | | $ | 710,171 | | | $ | 11,674,322 | |
| Grandeur Peak Global Reach Fund | | $ | 404,486 | | | $ | 4,677,268 | |
| Grandeur Peak Emerging Markets Opportunities Fund | | $ | 704,305 | | | $ | 7,915,436 | |
| Grandeur Peak Global Micro Cap Fund | | $ | 69,340 | | | $ | 787,662 | |
| Grandeur Peak Global Stalwarts Fund | | | – | | | | – | |
| Grandeur Peak International Stalwarts Fund | | $ | 769,260 | | | $ | 9,751,197 | |
| Grandeur Peak Global Contrarian Fund | | $ | 3,552 | | | $ | 70,814 | |
| Grandeur Peak US Stalwarts Fund | | | – | | | | – | |
Of the distributions paid by the Funds from ordinary income for the calendar year ended December 31, 2019, the following percentages met the requirements to be treated as qualifying for the corporate dividends received deduction and qualified dividend income:
| | | Dividend Received Deduction | | | Qualified Dividend Income | |
| Grandeur Peak Global Opportunities Fund | | | 0.00 | % | | | 0.00 | % |
| Grandeur Peak International Opportunities Fund | | | 0.00 | % | | | 100.00 | % |
| Grandeur Peak Global Reach Fund | | | 40.26 | % | | | 100.00 | % |
| Grandeur Peak Emerging Markets Opportunities Fund | | | 6.87 | % | | | 100.00 | % |
| Grandeur Peak Global Micro Cap Fund | | | 32.09 | % | | | 100.00 | % |
| Grandeur Peak Global Stalwarts Fund | | | 100.00 | % | | | 100.00 | % |
| Grandeur Peak International Stalwarts Fund | | | 4.79 | % | | | 100.00 | % |
| Grandeur Peak Global Contrarian Fund | | | 17.21 | % | | | 96.04 | % |
| Grandeur Peak US Stalwarts Fund | | | 0.00 | % | | | 0.00 | % |
In early 2020, if applicable, shareholders of record received this information for the distributions paid to them by the Funds during the calendar year 2019 via Form 1099. The Funds will notify shareholders in early 2021 of amounts paid to them by the Funds, if any, during the calendar year 2020.
Pursuant to Section 852(b)(3) of the Internal Revenue Code, the Funds designate the following as long-term capital gain dividends:
| Grandeur Peak Global Opportunities Fund | | $ | 36,811,507 | |
| Grandeur Peak International Opportunities Fund | | $ | 21,620,647 | |
| Grandeur Peak Global Reach Fund | | $ | 6,623,146 | |
| Grandeur Peak Emerging Markets Opportunities Fund | | | – | |
| Grandeur Peak Global Micro Cap Fund | | $ | 155,254 | |
| Grandeur Peak Global Stalwarts Fund | | $ | 3,161,510 | |
| Grandeur Peak International Stalwarts Fund | | | – | |
| Grandeur Peak Grandeur Peak Global Contrarian Fund | | | – | |
| Grandeur Peak Grandeur Peak US Stalwarts Fund | | | – | |
| 114 | 1.855.377.7325 | www.GrandeurPeakGlobal.com |
| Grandeur Peak Funds® | Additional Information |
April 30, 2020 (Unaudited)
For the fiscal year ended April 30, 2020, the following long term amounts were utilized as earnings and profits distributed to shareholders on redemptions:
| Grandeur Peak Global Opportunities Fund | | $ | 3,042,433 | |
| Grandeur Peak International Opportunities Fund | | $ | 1,250,738 | |
| Grandeur Peak Global Reach Fund | | $ | 2,425,761 | |
| Grandeur Peak Emerging Markets Opportunities Fund | | | – | |
| Grandeur Peak Global Micro Cap Fund | | $ | 77,121 | |
| Grandeur Peak Global Stalwarts Fund | | $ | 31,293 | |
| Grandeur Peak International Stalwarts Fund | | | – | |
| Grandeur Peak Global Contrarian Fund | | | – | |
| Grandeur Peak US Stalwarts Fund | | | – | |
| Annual Report | April 30, 2020 | 115 |
| Grandeur Peak Funds® | Liquidity Risk Management Program |
April 30, 2020 (Unaudited)
The Financial Investors Trust (the “Trust”) has established a liquidity risk management program (the “Program”) to govern the Trust’s approach to managing liquidity risk for each fund in the Trust (each a “Fund”). The Program is overseen by the Liquidity Committee (the “Committee”), a committee comprised of representatives of the Trust’s investment advisers, sub-advisers, and Officers of the Trust. The Trust’s Board of Trustees (the “Board”) has approved the designation of the Committee to oversee the Program.
The Program’s principal objectives include supporting each Fund’s compliance with limits on investments in illiquid assets and mitigating the risk that a Fund will be unable to meet its redemption obligations in a timely manner. The Program also includes a number of elements that support the management and assessment of liquidity risk, including a periodic assessment of factors that influence a Fund’s liquidity and the periodic classification and re-classification of the Fund’s investments into groupings that reflect the Committee’s assessment of their relative liquidity under current market conditions.
At a meeting of the Board held on March 10, 2020, the Trustees received a report from the Committee regarding the design and operational effectiveness of the Program since its implementation on December 1, 2018. The Committee determined, and reported to the Board, that the Program is reasonably designed to assess and manage each Fund’s liquidity risk and has operated adequately and effectively to manage each Fund’s liquidity risk since implementation.
The Committee reported that during the period covered by the report, there were no liquidity events that impacted the Funds or their ability to timely meet redemptions without dilution to existing shareholders. Among other things, the Board noted that the Funds are not required to have a highly liquid investment minimum based on their liquidity classifications. The Board further noted that no material changes have been made to the Program since its implementation.
| 116 | 1.855.377.7325 | www.GrandeurPeakGlobal.com |
| Grandeur Peak Funds® | Trustees and Officers |
April 30, 2020 (Unaudited)
Additional information regarding the Fund’s trustees is included in the Statement of Additional Information, which can be obtained without charge by calling 1-855-377-PEAK (7325).
INDEPENDENT TRUSTEES
| Name, Address* & Year of Birth | Position(s) Held with Fund | Term of Office** and Length of Time Served | Principal Occupation(s) During Past 5 Years*** | Number of Funds in Fund Complex Overseen by Trustee**** | Other Directorships Held by Trustee During Past 5 Years*** |
| Mary K. Anstine, 1940 | Trustee and Chairman | Ms. Anstine was elected at a special meeting of shareholders held on March 21, 1997 and re-elected at a special meeting of shareholders held on August 7, 2009. Ms. Anstine was appointed Chairman of the Board at the June 6, 2017 meeting of the Board of Trustees. | Ms. Anstine was formerly an Executive Vice President of First Interstate Bank of Denver until 1994, President/Chief Executive Officer of HealthONE Alliance, Denver, Colorado, from 1994 to 2004, and has been retired since 2004. Ms. Anstine is also Trustee/Director of AV Hunter Trust and Colorado Uplift Board. Ms. Anstine was formerly a Director of the Trust Bank of Colorado (later purchased and now known as Northern Trust Bank), HealthONE and Denver Area Council of the Boy Scouts of America, and a member of the American Bankers Association Trust Executive Committee. | 31 | Ms. Anstine is a Trustee of ALPS ETF Trust (16 funds); ALPS Variable Investment Trust (7 funds); Reaves Utility Income Fund (1 fund); and Segall Bryant & Hamill Trust (16 funds). |
| Jeremy W. Deems, 1976 | Trustee | Mr. Deems was appointed as a Trustee at the March 11, 2008 meeting of the Board of Trustees and elected at a special meeting of shareholders held on August 7, 2009. | Mr. Deems is the Co-Founder, Chief Operations Officer and Chief Financial Officer of Green Alpha Advisors, LLC, a registered investment advisor, and Co-Portfolio Manager of the Shelton Green Alpha Fund. Prior to joining Green Alpha Advisors, Mr. Deems was CFO and Treasurer of Forward Management, LLC, ReFlow Management Co., LLC, ReFlow Fund, LLC, a private investment fund, and Sutton Place Management, LLC, an administrative services company, from 1998 to June 2007. From 2004 to 2005, Mr. Deems also served as Treasurer of the Forward Funds and the Sierra Club Funds. | 31 | Mr. Deems is a Trustee of ALPS ETF Trust (16 funds); ALPS Variable Investment Trust (7 funds); Clough Funds Trust (1 fund); and Reaves Utility Income Fund (1 fund). |
| Annual Report | April 30, 2020 | 117 |
| Grandeur Peak Funds® | Trustees and Officers |
April 30, 2020 (Unaudited)
INDEPENDENT TRUSTEES
| Name, Address* & Year of Birth | Position(s) Held with Fund | Term of Office** and Length of Time Served | Principal Occupation(s) During Past 5 Years*** | Number of Funds in Fund Complex Overseen by Trustee**** | Other Directorships Held by Trustee During Past 5 Years*** |
| Jerry G. Rutledge, 1944 | Trustee | Mr. Rutledge was elected at a special meeting of shareholders held on August 7, 2009. | Mr. Rutledge is the President and owner of Rutledge’s Inc., a retail clothing business. Mr. Rutledge is currently Director of the American National Bank. He was from 1994 to 2007 a Regent of the University of Colorado. | 31 | Mr. Rutledge is a Trustee of Clough Global Dividend and Income Fund (1 fund); Clough Global Equity Fund (1 fund); Clough Global Opportunities Fund (1 fund); and Principal Real Estate Income Fund (1 fund). |
| Michael “Ross” Shell, 1970 | Trustee | Mr. Shell was elected at a special meeting of shareholders held on August 7, 2009. | Mr. Shell is Founder and CEO of Red Idea, LLC, a strategic consulting/early stage venture firm (since June 2008). From 1999 to 2009, he was a part-owner and Director of Tesser, Inc., a brand agency. From December 2005 to May 2008, he was Director, Marketing and Investor Relations, of Woodbourne, a REIT/real estate hedge fund and private equity firm. Prior to this, from May 2004 to November 2005, he worked as a business strategy consultant; from June 2003 to April 2004, he was on the Global Client Services team of IDEO, a product design/innovation firm; and from 1999 to 2003, he was President of Tesser, Inc. Mr. Shell graduated with honors from Stanford University with a degree in Political Science. | 31 | None. |
| 118 | 1.855.377.7325 | www.GrandeurPeakGlobal.com |
| Grandeur Peak Funds® | Trustees and Officers |
April 30, 2020 (Unaudited)
INTERESTED TRUSTEE
| Name, Address* & Year of Birth | Position(s) Held with Fund | Term of Office** and Length of Time Served | Principal Occupation(s) During Past 5 Years*** | Number of Funds in Fund Complex Overseen by Trustee**** | Other Directorships Held by Trustee During Past 5 Years*** |
| Edmund J. Burke, 1961 | Trustee | Mr. Burke was elected as Trustee at a special meeting of shareholders held on August 7, 2009. | Mr. Burke joined ALPS in 1991 and served as the President and Director of ALPS Holdings, Inc., and ALPS Advisors, Inc., and Director of ALPS Distributors, Inc., ALPS Fund Services, Inc. (“ALPS”), and ALPS Portfolio Solutions Distributor, Inc. (collectively, the “ALPS Companies”). Mr. Burke retired from the ALPS Companies in June 2019. Mr. Burke is deemed an interested Trustee by virtue of his prior positions with the ALPS Companies. | 31 | Mr. Burke is a Trustee of ALPS ETF Trust (16 funds); Clough Global Dividend and Income Fund (1 fund); Clough Global Equity Fund (1 fund); Clough Global Opportunities Fund (1 fund); Clough Funds Trust (1 fund); Liberty All-Star Equity Fund (1 fund); and Director of the Liberty All-Star Growth Fund, Inc. (1 fund). |
| Annual Report | April 30, 2020 | 119 |
| Grandeur Peak Funds® | Trustees and Officers |
April 30, 2020 (Unaudited)
OFFICERS
| Name, Address* & Year of Birth | Position(s) Held with Fund | Term of Office** and Length of Time Served | Principal Occupation(s) During Past 5 Years*** |
| Bradley J. Swenson, 1972 | President | Mr. Swenson was elected President of the Trust at the June 11 – 12, 2019 meeting of the Board of Trustees. | Mr. Swenson joined ALPS in 2004 and has served as its President since June 2019. In this role, he serves as an officer to certain other closed-end and open-end investment companies. He previously served as the Chief Operating Officer of ALPS (2015-2019). Mr. Swenson also previously served as Chief Compliance Officer to ALPS, its affiliated entities, and to certain ETF, closed-end and open-end investment companies (2004-2015). Because of his position with ALPS, Mr. Swenson is deemed an affiliate of the Trust as defined under the 1940 Act. |
| Kimberly R. Storms, 1972 | Treasurer | Ms. Storms was elected Treasurer of the Trust at the March 12, 2013 meeting of the Board of Trustees. | Ms. Storms is Senior Vice President - Director of Fund Administration of ALPS. Because of her position with ALPS, Ms. Storms is deemed an affiliate of the Trust as defined under the 1940 Act. Ms. Storms is also Treasurer of ALPS Series Trust. Ms. Storms also serves as a Board member and Treasurer of The Center for Trauma & Resilience, a nonprofit agency. |
| Karen S. Gilomen, 1970 | Secretary | Ms. Gilomen was elected Secretary of the Trust at the December 13, 2016 meeting of the Board of Trustees. | Ms. Gilomen joined ALPS in August 2016 as Vice President and Senior Counsel. Prior to joining ALPS, Ms. Gilomen was Vice President - General Counsel & CCO of Monticello Associates, Inc. from 2010 to 2016. Because of her position with ALPS, Ms. Gilomen is deemed an affiliate of the Trust, as defined under the 1940 Act. Ms. Gilomen is also the Secretary of ALPS Variable Investment Trust and Reaves Utility Income Fund, and the Assistant Secretary of the WesMark Funds. |
| Ted Uhl, 1974 | Chief Compliance Officer (“CCO”) | Mr. Uhl was appointed CCO of the Trust at the June 8, 2010 meeting of the Board of Trustees. | Mr. Uhl joined ALPS in October 2006, and is currently Deputy Compliance Officer of ALPS. Prior to his current role, Mr. Uhl served as Senior Risk Manager for ALPS from October 2006 until June 2010. Before joining ALPS, Mr. Uhl served a Sr. Analyst with Enenbach and Associates (RIA), and a Sr. Financial Analyst at Sprint. Because of his position with ALPS, Mr. Uhl is deemed an affiliate of the Trust as defined under the 1940 Act. Mr. Uhl is also CCO of the Boulder Growth & Income Fund, Inc., Centre Funds, Index Funds, Reality Shares ETF Trust, Reaves Utility Income Fund and XAI Octagon Floating Rate & Alternative Income Term Trust. |
| Jennell Panella, 1974 | Assistant Treasurer | Ms. Panella was elected Assistant Treasurer of the Trust at the September 15, 2015 meeting of the Board of Trustees | Ms. Panella joined ALPS in June 2012 and is currently Fund Controller of ALPS Fund Services, Inc. Prior to joining ALPS, Ms. Panella served as Financial Reporting Manager for Parker Global Strategies, LLC (2009-2012). Because of her position with ALPS, Ms. Panella is deemed an affiliate of the Trust as defined under the 1940 Act. Ms. Panella also serves as Assistant Treasurer of James Advantage Funds. |
| 120 | 1.855.377.7325 | www.GrandeurPeakGlobal.com |
| Grandeur Peak Funds® | Trustees and Officers |
April 30, 2020 (Unaudited)
OFFICERS
| Name, Address* & Year of Birth | Position(s) Held with Fund | Term of Office** and Length of Time Served | Principal Occupation(s) During Past 5 Years*** |
| Sharon Akselrod, 1974 | Assistant Secretary | Ms. Akselrod was elected Assistant Secretary of the Trust at the September 15, 2015 meeting of the Board of Trustees. | Ms. Akselrod joined ALPS in August 2014 and is currently Senior Investment Company Act Paralegal of ALPS Fund Services, Inc. Prior to joining ALPS, Ms. Akselrod served as Corporate Governance and Regulatory Associate for Nordstrom fsb (2013-2014) and Senior Legal Assistant – Legal Manager for AXA Equitable Life Insurance Company (2008-2013). Because of her position with ALPS, Ms. Akselrod is deemed an affiliate of the Trust as defined under the 1940 Act. Ms. Akselrod is also Secretary of Principal Real Estate Income Fund and Assistant Secretary of ALPS ETF Trust and Clough Funds Trust. |
| Jennifer Craig, 1973 | Assistant Secretary | Ms. Craig was elected Assistant Secretary of the Trust at the June 8, 2016 meeting of the Board of Trustees. | Ms. Craig joined ALPS in 2007 and is currently Assistant Vice President and Paralegal Manager of ALPS. Because of her position with ALPS, Ms. Craig is deemed an affiliate of the Trust as defined under the 1940 Act. Ms. Craig is also Assistant Secretary of Clough Global Dividend and Income Fund, Clough Global Equity Fund, Clough Global Opportunities Fund, Principal Real Estate Income Fund, Liberty All-Star Equity Fund and Liberty All-Star Growth Fund, Inc. |
| Sareena Khwaja-Dixon, 1980 | Assistant Secretary | Ms. Khwaja-Dixon was elected Assistant Secretary of the Trust at the December 12, 2017 meeting of the Board of Trustees. | Ms. Khwaja-Dixon joined ALPS in August 2015 and is currently Senior Counsel and Vice President of ALPS Fund Services, Inc. Prior to joining ALPS, Ms. Khwaja-Dixon served as a Senior Paralegal/Paralegal for Russell Investments (2011 – 2015). Because of her position with ALPS, Ms. Khwaja-Dixon is deemed an affiliate of the Trust as defined under the 1940 Act. Ms. Khwaja-Dixon is also Secretary of Liberty All-Star Equity Fund, Liberty All-Star Growth Fund, Inc., Clough Funds Trust, Clough Global Dividend and Income Fund, Clough Global Opportunities Fund, and Clough Global Equity Fund. |
| * | All communications to Trustees and Officers may be directed to Financial Investors Trust c/o 1290 Broadway, Suite 1000, Denver, CO 80203. |
| ** | This is the period for which the Trustee or Officer began serving the Trust. Each Trustee serves an indefinite term, until such Trustees successor is elected and appointed, or such Trustee resigns or is deceased. Officers are elected on an annual basis. |
| *** | Except as otherwise indicated, each individual has held the office shown or other offices in the same company for the last five years. |
| **** | The Fund Complex includes all series of the Trust, currently 31, and any other investment companies for which any Trustee serves as trustee for and for which Grandeur Peak Global Advisors, LLC provides investment advisory services (currently none). |
| Annual Report | April 30, 2020 | 121 |
| Grandeur Peak Funds® | Privacy Policy |
April 30, 2020 (Unaudited)
| Who We Are | |
| Who is providing this notice? | Grandeur Peak Global Opportunities Fund, Grandeur Peak International Opportunities Fund, Grandeur Peak Global Reach Fund, Grandeur Peak Emerging Markets Opportunities Fund, Grandeur Peak Global Micro Cap Fund, Grandeur Peak Global Stalwarts Fund, and Grandeur Peak International Stalwarts Fund. |
| What We Do | |
| How do the Funds protect my personal information? | To protect your personal information from unauthorized access and use, we use security measures that comply with federal law. These measures include computer safeguards and secured files and buildings. |
| How do the Funds collect my personal information? | We collect your personal information, for example, when you • open an account • provide account information or give us your contact information •make a wire transfer or deposit money |
| Why can't I limit all sharing? | Federal law gives you the right to limit only • sharing for affiliates’ everyday business purposes-information about your creditworthiness • affiliates from using your information to market to you • sharing for non-affiliates to market to you State laws and individual companies may give you additional rights to limit sharing. |
| Definitions | |
| Affiliates | Companies related by common ownership or control. They can be financial and nonfinancial companies. |
| Non-affiliates | Companies not related by common ownership or control. They can be financial and nonfinancial companies. • The Funds does not share with non-affiliates so they can market to you. |
| Joint marketing | A formal agreement between non-affiliated financial companies that together market financial products or services to you. • The Funds does not jointly market. |
| Other Important Information | |
| California Residents | If your account has a California home address, your personal information will not be disclosed to nonaffiliated third parties except as permitted by applicable California law, and we will limit sharing such personal information with our affiliates to comply with California privacy laws that apply to us. |
| Vermont Residents | The State of Vermont requires financial institutions to obtain your consent prior to sharing personal information that they collect about you with affiliated companies and nonaffiliated third parties other than in certain limited circumstances. Except as permitted by law, we will not share personal information we collect about you with nonaffiliated third parties or other affiliated companies unless you provide us with your written consent to share such information. |
| 122 | 1.855.377.7325 | www.GrandeurPeakGlobal.com |
| Grandeur Peak Funds® | Privacy Policy |
April 30, 2020 (Unaudited)
| FACTS | WHAT DO THE FUNDS DO WITH YOUR PERSONAL INFORMATION? |
| Why? | Financial companies choose how they share your personal information. Federal law gives consumers the right to limit some but not all sharing. Federal law also requires us to tell you how we collect, share, and protect your personal information. Please read this notice carefully to understand what we do. |
| What? | The types of personal information we collect and share depend on the product or service you have with us. This information can include: • Social Security number and account transactions • Account balances and transaction history • Wire transfer instructions |
| How? | All financial companies need to share customers’ personal information to run their everyday business. In the section below, we list the reasons financial companies can share their customers’ personal information; the reasons the Funds choose to share; and whether you can limit this sharing. |
| Reasons we can share your personal information | Do the Funds share: | Can you limit this sharing? |
| For our everyday business purposes — such as to process your transactions, maintain your account(s), respond to court orders and legal investigations, or report to credit bureaus | Yes | No |
| For our marketing purposes — to offer our products and services to you | No | We do not share. |
| For joint marketing with other financial companies | No | We do not share. |
| For our affiliates’ everyday business purposes — information about your transactions and experiences | Yes | No |
| For our affiliates’ everyday business purposes — information about your creditworthiness | No | We do not share. |
| For nonaffiliates to market to you | No | We do not share. |
| Annual Report | April 30, 2020 | 123 |

ANNUAL April 30, 2020
Highland Resolute Fund
Class I RMRGX
| Highland Resolute Fund | Table of Contents |
| | PAGE |
| Shareholder Letter | 2 |
| Performance Update | 7 |
| Consolidated Disclosure of Fund Expenses | 9 |
| Consolidated Schedule of Investments | 10 |
| Consolidated Statement of Assets and Liabilities | 21 |
| Consolidated Statement of Operations | 22 |
| Consolidated Statements of Changes in Net Assets | 23 |
| Consolidated Financial Highlights | 24 |
| Notes to Consolidated Financial Statements | 25 |
| Report of Independent Registered Accounting Firm | 36 |
| Additional Information | 37 |
| Disclosure Regarding Approval of Fund Advisory Agreements | 38 |
| Liquidity Risk Management Program | 40 |
| Trustees & Officers | 41 |
| Privacy Policy | 46 |
1
| Highland Resolute Fund | Shareholder Letter |
April 30, 2020 (Unaudited)
PERFORMANCE:
April 30, 2020
The Highland Resolute Fund (the “Fund”) underperformed the HFRX Global Hedge Index by about 560 basis points YTD ending April 30, 2020. The Fund historically has strong up market capture with down market capture in line with the index. Since inception, the Fund has outperformed the HFRX Global Hedge Index by roughly 70 basis points annualized. This is due primarily to a higher level of net equity exposure than the benchmark in hopes of keeping up with strong equity markets.
When compared to the peer group (Morningstar Multi-Alternative Universe), the Fund has underperformed the Universe over the last year but has outperformed the Universe materially over longer time horizons – by about 64 basis points annualized since inception. As with the HFRX Global Hedge Index, the Universe is very diverse and contains a number of market-neutral and other low net equity strategies that have caused the average net equity exposure for the Universe to be considerably less than our Fund. So, we anticipate outperforming the Universe in up markets and underperforming in down markets - recent performance has been consistent with our expectations.
Beta Sleeve – Parametric Defensive Equity and an S&P 500® Index fund were added mid-April. The S&P 500 Index had a return of 4.7% for the second half of the month while Parametric was up 2.4%.
Liquidity Sleeve – The sole collateral mutual fund underperformed the Bloomberg Barclays U.S. Aggregate Bond Index by 10.6% on a year-to-date basis.
Alpha Sleeve – The overall alpha sleeve outperformed on a year-to-date basis with only one manager underperforming its respective benchmark.
Past performance is no guarantee of future results.
COVID-19
COVID-19’s rapid spread across the globe sent markets into a tailspin as investors tried to understand the lasting effects of shutting down the global economy. What ensued was the fastest drawdown in market history, as prices on global equities (as measured by the MSCI AC World Index) fell 33.6% from the peak on February 19 to the trough on March 23. The drawdown was so severe that even core fixed income (as measured by the Bloomberg Barclays U.S. Aggregate Bond Index) fell 0.9%. Only U.S. Treasuries remained positive, gaining 5.4% during the severe drawdown.
Since the close of the first quarter, risk markets have led the way. For the month of April, global equities gained 10.7% and credit markets (as measured by the Bloomberg Barclays U.S. Aggregate Credit Index) returned 4.6%. This has been a much better environment for active management, as managers began to recoup some of the underperformance. While the rebound has been substantial, there are still many questions that remain.
The adviser put their business continuity plan into place around mid-March. All employees of the adviser have been working remotely and have had no issues operating in the current environment.
2
| Highland Resolute Fund | Shareholder Letter |
April 30, 2020 (Unaudited)
HIGHLAND RESOLUTE FUND
Table 1 notes the performance for the Fund as of quarter end under standard reporting (since inception) as well as of April 30, 2020.
Table 1
Performance (amounts greater than one year are annualized)
| | | | Standardized Performance Data as of March 31, 2020 | | | Non-Standardized Performance Data as of April 30, 2020 |
| | YTD | 1-Year | 3-Year | 5-Year | Since Inception (12/30/11) | YTD | 1-Year | 3-Year | 5-Year | Since Inception (12/30/11) |
| Highland Resolute Fund | -12.35% | -10.01% | -2.19% | -0.75% | 1.69% | -9.73% | -8.85% | -1.22% | -0.16% | 2.04% |
| Morningstar Multi- Alternative Universe | -7.96% | -4.86% | -0.74% | -0.69% | 1.36% | -5.71% | -3.59% | -0.13% | -0.20% | 1.40% |
| HFRX Global Hedge Fund Index | -6.85% | -1.39% | -0.54% | -0.65% | 0.99% | -4.17% | 0.79% | 0.27% | -0.12% | 1.33% |
| | Gross Expense Ratio | Less Expense Waivers | Net Expense Ratio | Net Ratio ex Dividend & Short Expense |
| Highland Resolute Fund | 2.38% | -0.95% | 1.43% | 1.35% |
Performance data quoted represents past performance. Past performance does not guarantee future results. Investment return and principal value of an investment will fluctuate so that an investor’s shares, when sold or redeemed, may be worth more or less than the original cost. Current performance data may be higher or lower than actual data quoted. For the most current month-end performance data please call 1-855-268-2242.
The Fund has a redemption fee of 2.00% for shares redeemed within the first 90 days of purchase. Performance shown at NAV does not include these sales charges and would have been lower had it been taken into account.
Ratios as of the Prospectus dated August 31, 2019 and may differ from the ratios presented in the Financial Highlights
The Adviser has agreed to waive the portion of its 1.50% Management Fee in excess of any sub-advisory fees paid by the Adviser to sub-advisors in connection with the Fund (“Sub-Advisory Fees”). This agreement (the “Expense Agreement”) is in effect through August 31, 2020. The Adviser may not discontinue this agreement to waive fees prior to August 31, 2020 without the approval by the Fund’s Board of Trustees.
Net Ratio ex Dividend & Short Expense is the Net Expense Ratio less any Dividend and Interest Expense on Securities Sold Short.
Non-standardized performance is any performance period that doesn’t fall on a quarter end.
Portfolio Changes:
During the period, the Incline account was liquidated. Parametric Defensive Equity and an S&P 500® Index were added in mid-April.
Closing:
We continue to seek to add value both in our allocation and manager selection decisions. We appreciate your investment in our Highland Resolute Fund, please feel free to contact us with any questions.
| Sincerely, | |
| | |
 | |
| R. Scott Graham, CFA & Michael T. Lytle, CFA | |
| Portfolio Managers | |
| Annual Report | April 30, 2020 | 3 |
| Highland Resolute Fund | Shareholder Letter |
April 30, 2020 (Unaudited)
Underlying Allocation Weights:
Figure 1 lists the long-term target asset allocation for the Fund as well as the allocation as of April 30, 2020.
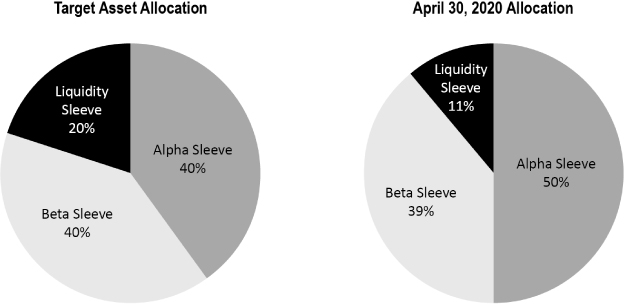
Holdings and allocations subject to change and may not reflect the current or future position of the portfolio.
4
| Highland Resolute Fund | Shareholder Letter |
April 30, 2020 (Unaudited)
IMPORTANT NOTES AND DISCLOSURES
Past performance does not guarantee future results.
Fund prices fluctuate as the underlying assets have exposure to market fluctuations and other risks, as described in the Fund’s prospectus. Please call 1-855-268-2242 to obtain current performance information and for the current prospectus and statement of additional information. This material must be preceded or accompanied by a prospectus. Please read the prospectus carefully before investing.
The views of Highland Associates, Inc. and the information discussed in this commentary are as of the date of publication, are subject to change, and may not reflect the writers’ current views. The views expressed are those of the Fund’s adviser only, and represent an assessment of market conditions at a specific point in time, are opinions only and should not be relied upon as investment advice regarding a particular investment or markets in general. Such information does not constitute a recommendation to buy or sell specific securities or investment vehicles. It should not be assumed that any investment will be profitable or will equal the performance of the portfolios or any securities or any sectors mentioned in this letter. The subject matter contained in this letter has been derived from several sources believed to be reliable and accurate at the time of compilation. Neither Highland Associates, Inc. nor the Fund accepts any liability for losses either direct or consequential caused by the use of this information.
The Highland Resolute Fund is distributed by ALPS Distributors, Inc.
The Fund is subject to investment risks, including possible loss of the principal amount invested and therefore is not suitable for all investors. The Fund may not achieve its objectives.
Diversification does not eliminate the risk of experiencing investment losses.
RISKS:
The Fund’s strategy may expose it to the risks of investments in Swap Contracts and Other Investment Companies. These risks include, but are not limited to higher expenses, allocation risk, underlying fund risk, transparency risk, and underlying fund managed portfolio risk. Investments which focus on alternative strategies are subject to increased risk and loss of principal and are not suitable for all investors. Swap Risk involves swap agreements and are subject to counterparty default risk and may not perform as intended. Derivatives Risk involves the exercise of skill and judgment. Derivatives may expire worthless or not perform as expected. Equity risk may cause the value of the securities held by the Fund to fall due to general market and economic conditions, perceptions regarding the industries in which the issuers of securities held by the Fund participate, or factors relating to specific companies in which the Fund invest.
The Fund’s investments in non-U.S. issuers may be even more volatile and may present more risks than investments in U.S. issuers.
Commodity Risk may subject the Funds to greater volatility than traditional investments because of global supply and demand, changes in interest rates, commodity index volatility, and factors affecting a particular industry or commodity. Commodity-linked investments may not move in the same direction and to the same extent as the underlying commodities.
Basis point is a common unit of measure for interest rates and other percentages in finance. One basis point is equal to 1/100th of 1% or 0.01%(.0001).
Beta is a measure of the volatility–or systematic risk–of a security or portfolio compared to the market as a whole. Beta is used in the capital asset pricing model (CAPM), which describes the relationship between systematic risk and expected return for assets (usually stocks).
Alpha is referred to as “excess return” or “abnormal rate of return,” which refers to the idea that markets are efficient, and so there is no way to systematically earn returns that exceed the broad market as a whole.
The MSCI AC World Index is a market capitalization weighted index designed to provide a broad measure of equity-market performance throughout the world. The Index is maintained by Morgan Stanley Capital International and is comprised of stocks from 23 developed countries and 24 emerging markets. The index figures do not reflect any fees, expense, or taxes. Investors cannot invest directly in an index.
The Bloomberg Barclays US Aggregate Bond Index is a broad base, market capitalization-weighted bond market index representing intermediate term investment grade bonds traded in the United States. Investors frequently use the index as a stand-in for measuring the performance of the US bond market. The index figures do not reflect any fees, expense, or taxes. Investors cannot invest directly in an index.
The Bloomberg Barclays US Credit Index measures the investment grade, US dollar-denominated, fixed-rate, taxable corporate and government related bond markets. It is composed of the US Corporate Index and a non-corporate component that includes foreign agencies, sovereigns, supranationals and local authorities. The index figures do not reflect any fees, expense, or taxes. Investors cannot invest directly in an index.
| Annual Report | April 30, 2020 | 5 |
| Highland Resolute Fund | Shareholder Letter |
April 30, 2020 (Unaudited)
The Morningstar Multi-Alternative Universe is designed to represent the exposure to alternative investment tactics. Funds in this category have the majority of their assets exposed to alternative strategies. An investor’s exposure to different tactics may change slightly over time in response to market movements. Funds in this category include both funds with static allocations to alternative strategies and funds tactically allocating among alternative strategies and asset classes. The gross short exposure is greater than 20%.
The HFRX Global Hedge Fund Index is designed to be representative of the overall composition of the hedge fund universe, and includes convertible arbitrage, distressed securities, equity hedge, equity market neutral, event driven, macro, merger arbitrage, and relative value strategies. The index returns are updated periodically and are subject to change. The returns were accurate as of the date of this publication. Investors cannot invest directly in an index.
The HFRX Equity Hedge Index is designed to be representative of a subset of the overall composition of the hedge fund universe. Equity Hedge strategies maintain positions both long and short in primarily equity and equity derivative securities. The index returns are updated periodically and are subject to change. The returns were accurate as of the date of this publication. The index figures do not reflect any fees, expense, or taxes. Investors cannot invest directly in an index.
The HFRX Macro Index is designed to be representative of a subset of the overall composition of the hedge fund universe. Macro strategy managers trade a broad range of strategies in which the investment process is predicated on movements in underlying economic variables and the impact these have on equity, fixed income, hard currency and commodity markets. Managers employ a variety of techniques, both discretionary and systematic analysis, combinations of top down and bottom up theses, quantitative and fundamental approaches and long and short-term holding periods. The index returns are updated periodically and are subject to change. The returns were accurate as of the date of this publication. The index figures do not reflect any fees, expense, or taxes. Investors cannot invest directly in an index.
The HFRX Fixed Income – Credit Index is designed to be representative of a subset of the overall composition of the hedge fund universe. It includes strategies with exposure to credit across a broad continuum of credit sub-strategies, including Corporate, Sovereign, Distressed, Convertible, Asset Backed, Capital Structure Arbitrage, Multi-Strategy and other Relative Value and Event Driven sub-strategies. The index returns are updated periodically and are subject to change. The returns were accurate as of the date of this publication. The index figures do not reflect any fees, expense, or taxes. Investors cannot invest directly in an index.
The HFRX Relative Value Arbitrage Index is designed to be representative of a subset of the overall composition of the hedge fund universe. Relative Value investment managers who maintain positions in which the investment thesis is predicated on realization of a valuation discrepancy in the relationship between multiple securities. Managers employ a variety of fundamental and quantitative techniques to establish investment theses, and security types range broadly across equity, fixed income, derivative or other security types. The index returns are updated periodically and are subject to change. The returns were accurate as of the date of this publication. The index figures do not reflect any fees, expense, or taxes. Investors cannot invest directly in an index.
The HFRX Event Driven Index maintains positions in companies currently or prospectively involved in corporate transactions of a wide variety including but not limited to mergers, restructurings, financial distress, tender offers, shareholder buybacks, debt exchanges, security issuance or other capital structure adjustments. Security types can range from most senior in the capital structure to most junior or subordinated, and frequently involve additional derivative securities. Event Driven exposure includes a combination of sensitivities to equity markets, credit markets and idiosyncratic, company specific developments. The index returns are updated periodically and are subject to change. The returns were accurate as of the date of this publication. The index figures do not reflect any fees, expense, or taxes. Investors cannot invest directly in an index.
The S&P 500® Index is an unmanaged index of 500 common stocks chosen for market size, liquidity, and industry group representation. It is a market value weighted index. The S&P 500® Index figures do not reflect any fees, expenses, or taxes. Investors cannot invest directly in this index.
Highland Associates, Inc. has agreed to waive the portion of its 1.50% Management Fee in excess of any sub-advisory fees paid by the Adviser to sub-advisors in connection with the Highland Resolute Fund. This agreement is in effect through August 31, 2020. The Adviser may not discontinue this agreement to waive fees without the approval by the Fund’s Board of Trustees.
Ratios as of the Prospectus dated August 31, 2019 and may differ from the ratios presented in the Financial Highlights.
R. Scott Graham and Michael T. Lytle are registered representatives of ALPS Distributors, Inc. CFA Institute Marks are trademarks owned by the CFA Institute.
6
| Highland Resolute Fund | Performance Update |
April 30, 2020 (Unaudited)
Performance (for the period ended April 30, 2020)
Highland Resolute Fund
Cumulative Total Return(a)
(for the period ended April 30, 2020) | 6 Months | 1 Year | 3 Year | 5 Year | Since Inception* | Gross Ratio(b) | Net Ratio(b) |
| Highland Resolute Fund - Class I - NAV | -7.32% | -8.85% | -1.22% | -0.16% | 2.04% | 2.38% | 1.43% |
| S&P 500® Index(c) | -3.16% | 0.86% | 9.04% | 9.12% | 12.92% | | |
| Dow Jones U.S. Select Dividend Index(d) | -19.09% | -16.69% | -0.30% | 4.51% | 8.99% | | |
| HFRX Global Hedge Fund Index(e) | -2.01% | 0.79% | 0.27% | -0.12% | 1.33% | | |
Performance data quoted represents past performance. Past performance does not guarantee future results. Investment return and principal value of an investment will fluctuate so that an investor’s shares, when sold or redeemed, may be worth more or less than the original cost. Current performance data may be higher or lower than actual data quoted. For the most current month-end performance data please call 1-855-268-2242.
The Fund has a redemption fee of 2.00% for shares redeemed within the first 90 days of purchase. Performance shown at NAV does not include these sales charges and would have been lower had it been taken into account.
The Adviser has agreed to waive the portion of its 1.50% Management Fee in excess of any sub-advisory fees paid by the Adviser to sub-advisors in connection with the Fund (“Sub-Advisory Fees”). This agreement (the “Expense Agreement”) is in effect through August 31, 2020. The Adviser may not discontinue this agreement to waive fees prior to August 31, 2020 without the approval by the Fund’s Board of Trustees.
| * | Fund inception date of 12/30/11. |
| (a) | Excludes adjustments in accordance with accounting principles generally accepted in the United States of America and as such, the net asset value and total return for shareholder transactions reported to the market may differ from the net asset value for financial reporting purposes. |
| (b) | Ratios as of the Prospectus dated August 31, 2019 and may differ from the ratios presented in the Financial Highlights. |
| (c) | The S&P 500® Index is the Standard & Poor's composite index of 500 stocks, a widely recognized, unmanaged index of common stock prices. The index is not actively managed and does not reflect any deduction of fees, expenses or taxes. An investor may not invest directly in an index. |
| (d) | The Dow Jones U.S. Select Dividend Index is an additional index, and represents the country’s top stocks by dividend yield, selected annually and subject to screening and buffering criteria. The index is not actively managed and does not reflect any deductions of fees, expenses or taxes. An investor may not invest directly in an index. |
| (e) | The HFRX Global Hedge Fund Index is an additional index, and is designed to be representative of the overall composition of the hedge fund universe and includes convertible arbitrage, distressed securities, equity hedge, equity market neutral, event driven, macro, merger arbitrage and relative value strategies. The index returns are updated periodically and are subject to change. The returns were accurate as of the date of this publication. The index is not actively managed and does not reflect any deduction of fees, expenses or taxes. An investor may not invest directly in an index. |
The table does not reflect the deduction of taxes that a shareholder would pay on Fund distributions or the redemption of Fund shares.
Top Ten Holdings**
(for the period ended April 30, 2020)
| As a percentage of Net Assets | |
| Vanguard Institutional Index Fund | 20.29% |
| PSAM Highland | 17.15% |
| Melchior Segregated Portfolio | 17.10% |
| WABR | 14.00% |
| PIMCO Short-Term Fund, Institutional Class | 13.83% |
| Vanguard S&P 500 ETF | 10.65% |
| PIMCO Income Fund, Institutional Class | 9.71% |
| BHDG Systematic Trading Segregated Portfolio | 4.38% |
| Vericast Corp. | 2.09% |
| United States Treasury Bill | 1.67% |
| Top Ten Holdings | 110.87% |
| ** | Holdings are subject to change, and may not reflect the current or future position of the portfolio. |
| Annual Report | April 30, 2020 | 7 |
| Highland Resolute Fund | Performance Update |
April 30, 2020 (Unaudited)
Performance of $10,000 Initial Investment (for the period ended April 30, 2020)
Comparison of change in value of a $10,000 investment
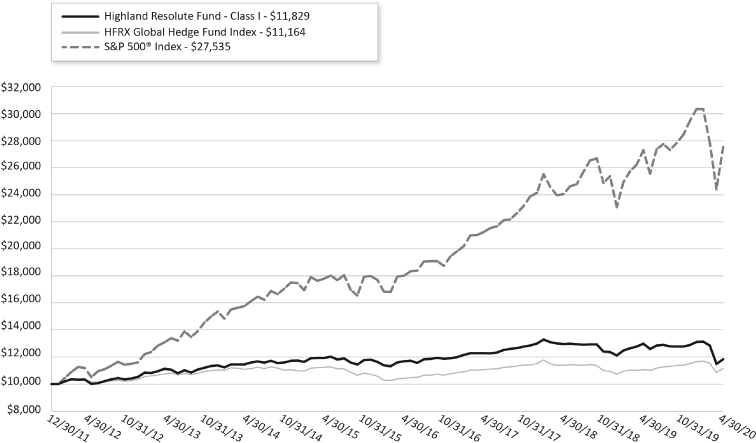
The chart represents historical performance of a hypothetical investment of $10,000 in the Fund since inception. Past performance does not guarantee future results. This chart does not reflect the deduction of taxes that a shareholder would pay on Fund distributions or the redemption of Fund shares.
Investing in the Fund is subject to investment risks, including possible loss of the principal amount invested.
8
| Highland Resolute Fund | Consolidated Disclosure of Fund Expenses |
April 30, 2020 (Unaudited)
As a shareholder of the Fund, you incur two types of costs: (1) transaction costs, including applicable sales charges (loads), redemption fees; and (2) ongoing costs, including management fees, shareholder service fees and other Fund operating expenses. This example is intended to help you understand your ongoing costs (in dollars) of investing in the Fund and to compare these costs with the ongoing costs of investing in other mutual funds.
This example is based on an investment of $1,000 invested at the beginning of the period and held for the six-month period of November 1, 2019 to April 30, 2020.
Actual Expenses. The first line of the table below provides information about actual account values and actual expenses. You may use the information in this line, together with the amount you invested to estimate the expenses that you paid over the period. Simply divide your account value by $1,000 (for example, an $8,600 account value divided by $1,000 = 8.6), then multiply the result by the number in the first line of the table below under the heading titled “Expenses Paid During Period” to estimate the expenses you paid on your account during this period.
Hypothetical Example for Comparison Purposes. The second line of the table below provides information about hypothetical account values and hypothetical expenses based on the Fund’s actual expense ratio and an assumed rate of return of 5% per year before expenses, which is not the Fund’s actual return. The hypothetical account values and expenses may not be used to estimate the actual ending account balance or expenses you paid for the period. You may use this information to compare the ongoing costs of investing in the Fund and other mutual funds. To do so, compare this 5% hypothetical example with the 5% hypothetical examples that appear in the shareholder reports of the other funds.
Please note that the expenses shown in the table below are meant to highlight your ongoing costs only and do not reflect any transactional costs, such as applicable sales charges (loads), redemption fees, or exchange fees. Therefore, the second line of the table below is useful in comparing ongoing costs only and will not help you determine the relative total costs of owning different funds. In addition, if these transactional costs were included, your costs would have been higher.
| Highland Resolute Fund | BEGINNING ACCOUNT VALUE 11/01/19 | ENDING ACCOUNT VALUE 04/30/20 | EXPENSE RATIO(a) | EXPENSES PAID DURING THE PERIOD 11/01/19- 04/30/20(b) |
| Class I | | | | |
| Actual | $ 1,000.00 | $ 926.80 | 0.68% | $ 3.26 |
| Hypothetical (5% return before expenses) | $ 1,000.00 | $ 1,021.48 | 0.68% | $ 3.42 |
| (a) | Annualized, based on the Fund's most recent fiscal half year expenses. |
| (b) | Expenses are equal to the Fund's annualized expense ratio multiplied by the average account value over the period, multiplied by the number of days in the most recent fiscal half-year (182)/366 (to reflect the half-year period). |
| Annual Report | April 30, 2020 | 9 |
| Highland Resolute Fund | Consolidated Schedule of Investments |
April 30, 2020
| Description | | Shares | | | Value (Note 2) | |
| COMMON STOCKS (0.20%) | | | | | | | | |
| COMMERCIAL SERVICES (0.20%) | | | | | | | | |
| Opal Acquisition(a)(b) | | | 3,209 | | | $ | 359,388 | |
| | | | | | | | | |
| TOTAL COMMON STOCKS | | | | | | | | |
| (Cost $384,930) | | | | | | | 359,388 | |
| | | | | | | | | |
| EXCHANGE TRADED FUNDS (10.65%) | | | | | | | | |
| Vanguard S&P 500 ETF | | | 71,671 | | | | 19,143,324 | |
| | | | | | | | | |
| TOTAL EXCHANGE TRADED FUNDS | | | | | | | | |
| (Cost $18,708,037) | | | | | | | 19,143,324 | |
| | | | | | | | | |
| OPEN-END MUTUAL FUNDS (43.83%) | | | | | | | | |
| PIMCO Income Fund, Institutional Class | | | 1,565,398 | | | | 17,454,183 | |
| PIMCO Short-Term Fund, Institutional Class | | | 2,579,975 | | | | 24,870,959 | |
| Vanguard Institutional Index Fund | | | 140,250 | | | | 36,476,259 | |
| | | | | | | | 78,801,401 | |
| TOTAL OPEN-END MUTUAL FUNDS | | | | | | | | |
| (Cost $77,322,773) | | | | | | | 78,801,401 | |
| | | | | | | | | |
| PREFERRED STOCK (1.20%) | | | | | | | | |
| Opal Acquisition(a)(b) | | | 19,341 | | | | 2,166,219 | |
| | | | | | | | | |
| TOTAL PREFERRED STOCK | | | | | | | | |
| (Cost $2,320,176) | | | | | | | 2,166,219 | |
| Description | | Principal Amount | | | Value (Note 2) | |
| CORPORATE BONDS (5.31%) | | | | | | |
| COMPUTERS (4.05%) | | | | | | |
| Vericast Corp. | | | | | | |
| 8.38%, 08/15/2022(c) | | $ | 886,000 | | | | 640,534 | |
| 9.25%, 03/01/2021(c) | | | 2,870,500 | | | | 2,888,440 | |
| 12.50%, 05/01/2024(c) | | | 3,673,102 | | | | 3,755,747 | |
| | | | | | | | 7,284,721 | |
| HEALTHCARE-SERVICES (1.26%) | | | | | | | | |
| One Call Corp. | | | | | | | | |
| 7.50%, 07/01/2024(c) | | | 2,374,412 | | | | 2,267,563 | |
| | | | | | | | | |
| TOTAL CORPORATE BONDS | | | | | | | | |
| (Cost $9,241,640) | | | | | | | 9,552,284 | |
| Description | | Shares | | | Value (Note 2) | |
| Short-Term Investments (18.09%) | | | | | | | | |
| MONEY MARKET FUNDS (13.09%) | | | | | | | | |
| Dreyfus Treasury Cash Management Fund, Institutional Class, 7- day yield, 0.167%(d) | | | 23,524,638 | | | | 23,524,638 | |
| | | | | | | | | |
| U.S. TREASURY BILLS (5.00%) | | | | | | | | |
| 0.213%, 09/24/2020(e) | | | 3,000,000 | | | | 2,998,570 | |
| 0.207%, 12/31/2020(d)(e) | | | 3,000,000 | | | | 2,997,331 | |
See Notes to Financial Statements.
10
| Highland Resolute Fund | Consolidated Schedule of Investments |
April 30, 2020
| Description | | Shares | | | Value (Note 2) | |
| U.S. TREASURY BILLS (continued) | | | | | | |
| 0.195%, 02/25/2021(e) | | | 3,000,000 | | | $ | 2,996,313 | |
| | | | | | | | 8,992,214 | |
| TOTAL SHORT-TERM INVESTMENTS | | | | | | | | |
| (Cost $32,512,962) | | | | | | | 32,516,852 | |
| | | | | | | | | |
| TOTAL INVESTMENTS (79.28%) | | | | | | | | |
| (Cost $140,490,518) | | | | | | $ | 142,539,468 | |
| | | | | | | | | |
| SEGREGATED CASH WITH BROKERS (24.42%)(f) | | | | | | | 43,910,178 | |
| | | | | | | | | |
| LIABILITIES IN EXCESS OF OTHER ASSETS (-3.70%) | | | | | | | (6,649,505 | ) |
| NET ASSETS (100.00%) | | | | | | $ | 179,800,141 | |
| (a) | As a result of the use of significant unobservable inputs to determine fair value, these investments have been classified as level 3 assets. See also Note 2 to the Notes to Consolidated Financial Statements for additional information. |
| (b) | Non-income producing security. |
| (c) | Security exempt from registration under rule 144A of the Securities Act of 1933. This security may be resold in transactions exempt from registration, normally to qualified institutional buyers. At period end, the fair value of those securities held in long positions was $9,552,284, representing 5.31% of the Fund's net assets. |
| (d) | Security position either entirely or partially held in a segregated account as collateral for written option contracts and total return swaps. Aggregate total fair value of $2,397,848. |
| (e) | Rate shown represents the bond equivalent yield to maturity at date of purchase. |
| (f) | Includes cash which is being held as collateral for written option contracts and total return swap contracts. |
WRITTEN OPTION CONTRACTS (0.20%)
| Counterparty | | Expiration Date | | | Strike Price | | | Contracts | | | Premiums Received | | | Notional Value | | | Value (Note 2) | |
| Put Option Contracts - (0.03%) | | | | | | |
| S&P 500® Index: | | | | | | |
| Citigroup | | | 05/11/2020 | | | $ | 2,500 | | | | (5) | | | $ | 14,830 | | | $ | (1,456,215 | ) | | $ | (1,400 | ) |
| Citigroup | | | 05/13/2020 | | | | 2,500 | | | | (3) | | | | 13,284 | | | | (873,729 | ) | | | (1,485 | ) |
| Citigroup | | | 05/15/2020 | | | | 2,575 | | | | (3) | | | | 11,697 | | | | (873,729 | ) | | | (3,480 | ) |
| Citigroup | | | 05/18/2020 | | | | 2,590 | | | | (6) | | | | 15,931 | | | | (1,747,458 | ) | | | (7,926 | ) |
| Citigroup | | | 05/20/2020 | | | | 2,500 | | | | (6) | | | | 15,213 | | | | (1,747,458 | ) | | | (6,120 | ) |
| Citigroup | | | 05/22/2020 | | | | 2,530 | | | | (7) | | | | 18,861 | | | | (2,038,701 | ) | | | (10,052 | ) |
| Citigroup | | | 05/26/2020 | | | | 2,650 | | | | (6) | | | | 18,971 | | | | (1,747,458 | ) | | | (16,596 | ) |
| Citigroup | | | 05/27/2020 | | | | 2,710 | | | | (6) | | | | 20,663 | | | | (1,747,458 | ) | | | (22,722 | ) |
| | | | | | | | | | | | | | | | | | | | | | | | | |
| Call Option Contracts - (0.17%) | | | | | | | | | | | | |
| S&P 500® Index: | | | | | | | | | | | | |
| Citigroup | | | 05/01/2020 | | | | 2,685 | | | | (3) | | | | 52,313 | | | | (873,729 | ) | | | (66,075 | ) |
| Citigroup | | | 05/04/2020 | | | | 2,800 | | | | (6) | | | | 62,764 | | | | (1,747,458 | ) | | | (72,120 | ) |
| Citigroup | | | 05/06/2020 | | | | 2,950 | | | | (5) | | | | 14,574 | | | | (1,456,215 | ) | | | (10,800 | ) |
| Citigroup | | | 05/08/2020 | | | | 2,840 | | | | (6) | | | | 54,168 | | | | (1,747,458 | ) | | | (60,036 | ) |
| Citigroup | | | 05/11/2020 | | | | 3,050 | | | | (5) | | | | 5,336 | | | | (1,456,215 | ) | | | (2,930 | ) |
| Citigroup | | | 05/13/2020 | | | | 2,980 | | | | (5) | | | | 11,698 | | | | (1,456,215 | ) | | | (13,550 | ) |
| Citigroup | | | 05/15/2020 | | | | 3,050 | | | | (5) | | | | 9,151 | | | | (1,456,215 | ) | | | (5,090 | ) |
| Citigroup | | | 05/18/2020 | | | | 3,050 | | | | (5) | | | | 10,118 | | | | (1,456,215 | ) | | | (6,735 | ) |
| Citigroup | | | 05/20/2020 | | | | 3,000 | | | | (5) | | | | 12,514 | | | | (1,456,215 | ) | | | (15,825 | ) |
| Citigroup | | | 05/22/2020 | | | | 2,980 | | | | (5) | | | | 15,337 | | | | (1,456,215 | ) | | | (22,030 | ) |
| Citigroup | | | 05/26/2020 | | | | 3,025 | | | | (5) | | | | 11,804 | | | | (1,456,215 | ) | | | (14,625 | ) |
| Citigroup | | | 05/27/2020 | | | | 3,075 | | | | (5) | | | | 9,199 | | | | (1,456,215 | ) | | | (8,195 | ) |
| | | | | | | | | | | | | | | | | | | | | | | | | |
| TOTAL WRITTEN OPTION CONTRACTS | | | | | | $ | 398,426 | | | $ | (29,706,786 | ) | | $ | (367,792 | ) |
| See Notes to Financial Statements. | |
| Annual Report | April 30, 2020 | 11 |
| Highland Resolute Fund | Consolidated Schedule of Investments |
April 30, 2020
TOTAL RETURN SWAP CONTRACTS*
| Counterparty | | Reference Obligation | | Notional Amount | | | Value | | | Rate Paid by the Fund | | Reference Rate | | Termination Date | | Unrealized Appreciation/ (Depreciation) | |
| Morgan Stanley | | BHDG Systematic Trading Segregated Portfolio(a) | | $ | 7,871,306 | | | $ | 7,871,312 | | | 65 bps | | N/A | | 09/13/2023 | | $ | 6 | |
| Morgan Stanley | | Long/Short Impala Segregated Portfolio(b) | | | 206,535 | | | | 206,538 | | | 145 bps + 1M LIBOR | | 24 bps | | 03/19/2021 | | | 3 | |
| Morgan Stanley | | Melchior Segregated Portfolio(c) | | | 30,750,045 | | | | 30,750,049 | | | 115 bps | | N/A | | 03/19/2021 | | | 4 | |
| Morgan Stanley | | PSAM Highland(d) | | | 30,838,517 | | | | 30,838,518 | | | 215 bps + 1M EURIBOR | | -44 bps | | 06/03/2021 | | | 1 | |
| Morgan Stanley | | WABR(e) | | | 25,172,126 | | | | 25,172,138 | | | 145 bps + 1M LIBOR | | 24 bps | | 09/01/2020 | | | 12 | |
| | | | | $ | 94,838,529 | | | $ | 94,838,555 | | | | | | | | | $ | 26 | |
| * | For the long positions, the Fund receives payments based on any positive return of the Reference Obligation less the rate paid by the Fund. The Fund makes payments on any negative return of such Reference Obligation plus the rate paid by the Fund. For short positions, the Fund receives payments based on any negative return of the Reference Obligation less the rate paid by the fund. The Fund makes payments on any positive return of such Reference Obligation plus the rate paid by the Fund. Payments are made monthly. |
| (a) | BHDG Systematic Trading Segregated Portfolio is a quantitative trend following strategy that uses forward foreign currency contracts. BHDG will employ some short, medium, and long term signals. Interest rate, commodity, equity, and soveriegn debt forward foreign currency contracts will be used. Any asset class may have net long or short exposure, and exposures in aggregate may be net long or short. |
| (b) | Long/Short Impala Segregated Portfolio is a European equity long/short strategy that employs a flexible, low-net strategy (0% to 50%), and long exposure will vary between 60% and 100%. The portfolio is primarily comprised of large and mid-cap stocks listed on European exchanges. As of April 30, 2020 the Portfolio only held a cash balance of $206,538. |
| (c) | Melchior Segregated Portfolio is a global equity long/short strategy that uses a long-biased strategy that is focused on cyclical sectors. The strategy has a net exposure that ranges between 50% and 80%, and long exposure varies between 80% and 100%. The strategy is comprised of large cap stocks listed on exchanges of developed and emerging market countries. |
| (d) | PSAM Highland employs an event driven strategy. The fund will primarily make investments in equity special situations and merger arbitrage. The strategy will also opportunistically allocate to liquid high yield credit positions when trading at stressed levels. The strategy will employ gross long exposure of up to 120%, and net exposure will typically vary from 40% to 80%. |
| (e) | WABR incorporates an absolute return oriented approach within a risk parity framework. Active absolute return strategies include fundamental long/short equity, credit relative value, discretionary macro, and equity market neutral strategies. The strategy also maintains a passive risk weighted allocation to equities and fixed income, but each of the three allocations is equally risk weighted subject to a 40% limit on the absolute return allocation. Gross equity long exposure will typically be 140% or less, and net equity exposure will vary between 5% and 35%. |
See Notes to Financial Statements.
12
| Highland Resolute Fund | Consolidated Schedule of Investments |
April 30, 2020
BHDG SYSTEMATIC TRADING SEGREGATED PORTFOLIO
| Description | | Counterparty | | Settlement Date | | Fund Receiving | | U.S. $ Value at April 30th, 2020 | | | Fund Delivering | | U.S. $ Value at April 30, 2020 | | | Unrealized Appreciation/ (Depreciation) | | | Percentage of Value | |
| LONG SECURITIES | | | |
| OUTSTANDING FORWARD FOREIGN CURRENCY CONTRACTS | | | | | | | | | | | | |
| | | Morgan Stanley & Co. LLC | | 6/17/20 | | AUD | | $ | 659,151 | | | JPY | | $ | 628,005 | | | $ | 31,146 | | | | 8.37 | % |
| | | Morgan Stanley & Co. LLC | | 6/17/20 | | AUD | | | 1,424,062 | | | USD | | | 1,356,517 | | | | 67,545 | | | | 18.09 | % |
| | | Morgan Stanley & Co. LLC | | 6/17/20 | | BRL | | | 450,825 | | | USD | | | 478,878 | | | | (28,053 | ) | | | 5.73 | % |
| | | Morgan Stanley & Co. LLC | | 6/17/20 | | CAD | | | 1,084,538 | | | USD | | | 1,071,376 | | | | 13,162 | | | | 13.78 | % |
| | | Morgan Stanley & Co. LLC | | 6/17/20 | | CHF | | | 1,828,124 | | | USD | | | 1,864,624 | | | | (36,500 | ) | | | 23.23 | % |
| | | Morgan Stanley & Co. LLC | | 6/17/20 | | CLP | | | 331,326 | | | USD | | | 324,689 | | | | 6,637 | | | | 4.21 | % |
| | | Morgan Stanley & Co. LLC | | 6/17/20 | | EUR | | | 1,037,027 | | | PLN | | | 1,047,490 | | | | (10,463 | ) | | | 13.17 | % |
| | | Morgan Stanley & Co. LLC | | 6/17/20 | | EUR | | | 538,127 | | | TRY | | | 550,557 | | | | (12,430 | ) | | | 6.84 | % |
| | | Morgan Stanley & Co. LLC | | 6/17/20 | | EUR | | | 1,444,664 | | | USD | | | 1,461,780 | | | | (17,116 | ) | | | 18.35 | % |
| | | Morgan Stanley & Co. LLC | | 6/17/20 | | GBP | | | 318,588 | | | USD | | | 314,163 | | | | 4,425 | | | | 4.05 | % |
| | | Morgan Stanley & Co. LLC | | 6/17/20 | | INR | | | 919,398 | | | USD | | | 899,022 | | | | 20,376 | | | | 11.68 | % |
| | | Morgan Stanley & Co. LLC | | 6/17/20 | | JPY | | | 714,988 | | | AUD | | | 720,413 | | | | (5,425 | ) | | | 9.08 | % |
| | | Morgan Stanley & Co. LLC | | 6/17/20 | | JPY | | | 1,360,697 | | | USD | | | 1,382,847 | | | | (22,150 | ) | | | 17.29 | % |
| | | Morgan Stanley & Co. LLC | | 6/17/20 | | KRW | | | 432,663 | | | USD | | | 420,502 | | | | 12,161 | | | | 5.50 | % |
| | | Morgan Stanley & Co. LLC | | 6/17/20 | | NOK | | | 658,864 | | | USD | | | 652,473 | | | | 6,391 | | | | 8.37 | % |
| | | Morgan Stanley & Co. LLC | | 6/17/20 | | NZD | | | 772,986 | | | USD | | | 759,325 | | | | 13,661 | | | | 9.82 | % |
| | | Morgan Stanley & Co. LLC | | 6/17/20 | | PHP | | | 1,059,403 | | | USD | | | 1,047,733 | | | | 11,670 | | | | 13.46 | % |
| | | Morgan Stanley & Co. LLC | | 6/17/20 | | PLN | | | 666,623 | | | EUR | | | 675,632 | | | | (9,009 | ) | | | 8.47 | % |
| | | Morgan Stanley & Co. LLC | | 6/17/20 | | PLN | | | 535,663 | | | USD | | | 566,683 | | | | (31,020 | ) | | | 6.81 | % |
| | | Morgan Stanley & Co. LLC | | 6/17/20 | | SEK | | | 366,198 | | | USD | | | 360,003 | | | | 6,195 | | | | 4.65 | % |
| | | Morgan Stanley & Co. LLC | | 6/17/20 | | SGD | | | 1,925,086 | | | USD | | | 1,904,864 | | | | 20,222 | | | | 24.47 | % |
| | | Morgan Stanley & Co. LLC | | 6/17/20 | | THB | | | 717,049 | | | USD | | | 717,147 | | | | (98 | ) | | | 9.11 | % |
| | | Morgan Stanley & Co. LLC | | 6/17/20 | | TRY | | | 378,296 | | | EUR | | | 412,435 | | | | (34,139 | ) | | | 4.81 | % |
| | | Morgan Stanley & Co. LLC | | 6/17/20 | | TRY | | | 492,228 | | | USD | | | 522,298 | | | | (30,070 | ) | | | 6.25 | % |
| OUTSTANDING FORWARD FOREIGN CURRENCY CONTRACTS Total | | | 20,116,574 | | | | | | | | | | | | | | 255.59 | % |
| TOTAL LONG | | | 20,116,574 | | | | | | | | | | | | | | 255.59 | % |
| See Notes to Financial Statements. | |
| Annual Report | April 30, 2020 | 13 |
| Highland Resolute Fund | Consolidated Schedule of Investments |
April 30, 2020
| Description | | Counterparty | | Settlement Date | | Fund Receiving | | U.S. $ Value at April 30th, 2020 | | | Fund Delivering | | U.S. $ Value at April 30, 2020 | | | Unrealized Appreciation/ (Depreciation) | | | Percentage of Value | |
| SECURITIES SOLD SHORT | | | | | | |
| OUTSTANDING FORWARD FOREIGN CURRENCY CONTRACTS | | | | | | | | | | | | |
| | | Morgan Stanley & Co. LLC | | 6/17/20 | | JPY | | $ | (720,413 | ) | | AUD | | $ | (747,694 | ) | | $ | (27,281 | ) | | | -9.50 | % |
| | | Morgan Stanley & Co. LLC | | 6/17/20 | | USD | | | (1,499,097 | ) | | AUD | | | (1,529,821 | ) | | | (30,724 | ) | | | -19.44 | % |
| | | Morgan Stanley & Co. LLC | | 6/17/20 | | USD | | | (615,276 | ) | | BRL | | | (545,900 | ) | | | 69,376 | | | | -6.94 | % |
| | | Morgan Stanley & Co. LLC | | 6/17/20 | | USD | | | (1,489,111 | ) | | CAD | | | (1,488,528 | ) | | | 583 | | | | -18.91 | % |
| | | Morgan Stanley & Co. LLC | | 6/17/20 | | USD | | | (1,804,710 | ) | | CHF | | | (1,808,551 | ) | | | (3,841 | ) | | | -22.98 | % |
| | | Morgan Stanley & Co. LLC | | 6/17/20 | | USD | | | (386,435 | ) | | CLP | | | (387,271 | ) | | | (836 | ) | | | -4.92 | % |
| | | Morgan Stanley & Co. LLC | | 6/17/20 | | PLN | | | (675,632 | ) | | EUR | | | (668,703 | ) | | | 6,929 | | | | -8.50 | % |
| | | Morgan Stanley & Co. LLC | | 6/17/20 | | TRY | | | (412,435 | ) | | EUR | | | (401,525 | ) | | | 10,910 | | | | -5.10 | % |
| | | Morgan Stanley & Co. LLC | | 6/17/20 | | USD | | | (1,742,961 | ) | | EUR | | | (1,746,843 | ) | | | (3,882 | ) | | | -22.19 | % |
| | | Morgan Stanley & Co. LLC | | 6/17/20 | | USD | | | (513,496 | ) | | GBP | | | (527,810 | ) | | | (14,314 | ) | | | -6.71 | % |
| | | Morgan Stanley & Co. LLC | | 6/17/20 | | USD | | | (437,298 | ) | | HUF | | | (435,732 | ) | | | 1,566 | | | | -5.54 | % |
| | | Morgan Stanley & Co. LLC | | 6/17/20 | | USD | | | (1,045,546 | ) | | INR | | | (1,046,379 | ) | | | (833 | ) | | | -13.29 | % |
| | | Morgan Stanley & Co. LLC | | 6/17/20 | | AUD | | | (628,006 | ) | | JPY | | | (623,901 | ) | | | 4,105 | | | | -7.93 | % |
| | | Morgan Stanley & Co. LLC | | 6/17/20 | | USD | | | (1,037,731 | ) | | JPY | | | (1,046,173 | ) | | | (8,442 | ) | | | -13.29 | % |
| | | Morgan Stanley & Co. LLC | | 6/17/20 | | USD | | | (509,036 | ) | | KRW | | | (504,263 | ) | | | 4,773 | | | | -6.41 | % |
| | | Morgan Stanley & Co. LLC | | 6/17/20 | | USD | | | (842,501 | ) | | NOK | | | (807,734 | ) | | | 34,767 | | | | -10.26 | % |
| | | Morgan Stanley & Co. LLC | | 6/17/20 | | USD | | | (981,738 | ) | | NZD | | | (976,884 | ) | | | 4,854 | | | | -12.41 | % |
| | | Morgan Stanley & Co. LLC | | 6/17/20 | | USD | | | (816,788 | ) | | PHP | | | (843,634 | ) | | | (26,846 | ) | | | -10.72 | % |
| | | Morgan Stanley & Co. LLC | | 6/17/20 | | EUR | | | (1,047,490 | ) | | PLN | | | (1,019,487 | ) | | | 28,003 | | | | -12.95 | % |
| | | Morgan Stanley & Co. LLC | | 6/17/20 | | USD | | | (770,763 | ) | | PLN | | | (745,744 | ) | | | 25,019 | | | | -9.47 | % |
| | | Morgan Stanley & Co. LLC | | 6/17/20 | | USD | | | (561,129 | ) | | SEK | | | (569,814 | ) | | | (8,685 | ) | | | -7.24 | % |
| | | Morgan Stanley & Co. LLC | | 6/17/20 | | USD | | | (2,224,277 | ) | | SGD | | | (2,219,606 | ) | | | 4,671 | | | | -28.20 | % |
| | | Morgan Stanley & Co. LLC | | 6/17/20 | | USD | | | (866,673 | ) | | THB | | | (851,539 | ) | | | 15,134 | | | | -10.82 | % |
| | | Morgan Stanley & Co. LLC | | 6/17/20 | | EUR | | | (550,557 | ) | | TRY | | | (507,063 | ) | | | 43,494 | | | | -6.44 | % |
| | | Morgan Stanley & Co. LLC | | 6/17/20 | | USD | | | (626,845 | ) | | TRY | | | (570,792 | ) | | | 56,053 | | | | -7.25 | % |
| | | Morgan Stanley & Co. LLC | | 6/17/20 | | USD | | | (355,699 | ) | | ZAR | | | (323,187 | ) | | | 32,512 | | | | -4.11 | % |
| OUTSTANDING FORWARD FOREIGN CURRENCY CONTRACTS Total | | | | | | | | | (22,944,578 | ) | | | | | | | -291.52 | % |
| TOTAL SHORT | | | | | | | | | (22,944,578 | ) | | | | | | | 291.52 | % |
| | | | | | | | | | | | | | | | | | | | | | | | | |
| REMAINING SECURITIES AND CASH | | | | | | | | | 10,699,316 | | | | | | | | 135.93 | % |
| TOTAL VALUE | | | | | | | | $ | 7,871,312 | | | | | | | | | |
See Notes to Financial Statements.
14
| Highland Resolute Fund | Consolidated Schedule of Investments |
April 30, 2020
MELCHIOR SEGREGATED PORTFOLIO
| Description | | Contracts/ Shares | | | Notional Value | | | Value | | | Percentage
of Value | | | Counterparty | | Floating Rte/ Fixed Rate Amount paid by Fund | |
Reference
Rate | | Termination Date | |
Unrealized
Gain
(Loss) | |
| LONG SECURITIES COMMON STOCK | | | | | | | | | | | | | | | | | | | | | | | |
| GRIFOLS SA-ADR | | | 29,014 | | | | | | | $ | 588,990 | | | | 1.92 | % | | | | | | | | | | | | |
| | | | | | | | | | | | | | | | | | | | | | | | | | | | | |
| EQUITY SWAPS | | | | | | | | | | | | | | | | | | | | | | | | | | | | |
| ALTEN SA(PAR) | | | | | | $ | 299,922 | | | | 238,722 | | | | 0.78 | % | | Morgan Stanley & Co. LLC | | 55 bps + 1M EURIB | | -44 bps | | 3/26/2021 | | $ | (61,200 | ) |
| APPLUS SERVICES SA(MAD) | | | | | | | 1,276,506 | | | | 890,064 | | | | 2.89 | % | | Morgan Stanley & Co. LLC | | 55 bps + 1M EURIB | | -44 bps | | 3/26/2021 | | | (386,442 | ) |
| ASCENTIAL PLC | | | | | | | 448,983 | | | | 367,665 | | | | 1.20 | % | | Morgan Stanley & Co. LLC | | 55 bps + 1M LIBOR | | 24 bps | | 3/26/2021 | | | (81,318 | ) |
| ASML HOLDING NV (EOE) | | | | | | | 283,995 | | | | 340,838 | | | | 1.11 | % | | Morgan Stanley & Co. LLC | | 55 bps + 1M EURIB | | -44 bps | | 3/26/2021 | | | 56,843 | |
| ASR NEDERLAND NV | | | | | | | 1,023,329 | | | | 942,059 | | | | 3.06 | % | | Morgan Stanley & Co. LLC | | 55 bps + 1M EURIB | | -44 bps | | 3/26/2021 | | | (81,270 | ) |
| AVAST PLC | | | | | | | 631,074 | | | | 695,763 | | | | 2.26 | % | | Morgan Stanley & Co. LLC | | 55 bps + 1M LIBOR | | 24 bps | | 3/26/2021 | | | 64,689 | |
| AVON RUBBER PLC(LSE) | | | | | | | 551,050 | | | | 586,786 | | | | 1.91 | % | | Morgan Stanley & Co. LLC | | 55 bps + 1M LIBOR | | 24 bps | | 3/26/2021 | | | 35,736 | |
| CERVED GROUP SPA | | | | | | | 444,942 | | | | 389,568 | | | | 1.27 | % | | Morgan Stanley & Co. LLC | | 55 bps + 1M EURIB | | -44 bps | | 3/26/2021 | | | (55,374 | ) |
| COMPASS GROUP PLC | | | | | | | 356,088 | | | | 463,641 | | | | 1.51 | % | | Morgan Stanley & Co. LLC | | 55 bps + 1M LIBOR | | 24 bps | | 3/26/2021 | | | 107,553 | |
| DELIVERY HERO SE | | | | | | | 157,090 | | | | 190,782 | | | | 0.62 | % | | Morgan Stanley & Co. LLC | | 55 bps + 1M EURIB | | -44 bps | | 3/25/2021 | | | 33,692 | |
| ERSTE GROUP BANK AG(VIE) | | | | | | | 532,946 | | | | 430,867 | | | | 1.40 | % | | Morgan Stanley & Co. LLC | | 55 bps + 1M EURIB | | -44 bps | | 3/26/2021 | | | (102,079 | ) |
| FERGUSON PLC | | | | | | | 665,284 | | | | 744,897 | | | | 2.42 | % | | Morgan Stanley & Co. LLC | | 55 bps + 1M LIBOR | | 24 bps | | 3/26/2021 | | | 79,613 | |
| FINECOBANK SPA(MIL) | | | | | | | 885,933 | | | | 1,024,123 | | | | 3.33 | % | | Morgan Stanley & Co. LLC | | 55 bps + 1M EURIB | | -44 bps | | 3/26/2021 | | | 138,190 | |
| GAMES WORKSHOP GROUP PLC(LSE) | | | | | | | 576,451 | | | | 665,053 | | | | 2.16 | % | | Morgan Stanley & Co. LLC | | 55 bps + 1M LIBOR | | 24 bps | | 3/26/2021 | | | 88,602 | |
| GOCO GROUP PLC | | | | | | | 295,614 | | | | 339,028 | | | | 1.10 | % | | Morgan Stanley & Co. LLC | | 55 bps + 1M LIBOR | | 24 bps | | 3/26/2021 | | | 43,414 | |
| INGENICO GROUP(PAR) | | | | | | | 283,351 | | | | 337,491 | | | | 1.10 | % | | Morgan Stanley & Co. LLC | | 55 bps + 1M EURIB | | -44 bps | | 3/26/2021 | | | 54,140 | |
| INMOBILIARIA COLONIAL SOCIMI | | | | | | | 792,892 | | | | 941,888 | | | | 3.06 | % | | Morgan Stanley & Co. LLC | | 55 bps + 1M EURIB | | -44 bps | | 3/26/2021 | | | 148,996 | |
| LAMDA DEVELOPMENT SA(ATH) | | | | | | | 466,752 | | | | 420,647 | | | | 1.37 | % | | Morgan Stanley & Co. LLC | | 175 bps + 1M EURIB | | -44 bps | | 2/23/2022 | | | (46,105 | ) |
| LONDON STOCK EXCHANGE GROUP | | | | | | | 466,240 | | | | 536,873 | | | | 1.75 | % | | Morgan Stanley & Co. LLC | | 55 bps + 1M LIBOR | | 24 bps | | 3/26/2021 | | | 70,633 | |
| LONZA GROUP AG-REG | | | | | | | 442,467 | | | | 484,949 | | | | 1.58 | % | | Morgan Stanley & Co. LLC | | 55 bps + 1M LIBOR | | 24 bps | | 3/26/2021 | | | 42,482 | |
| METRO BANK PLC | | | | | | | 102,269 | | | | 65,868 | | | | 0.21 | % | | Morgan Stanley & Co. LLC | | 55 bps + 1M LIBOR | | 24 bps | | 3/26/2021 | | | (36,401 | ) |
| MTU AERO ENGINES | | | | | | | | | | | | | | | | | | | | | | | | | | | | |
| AG(GER) | | | | | | | 309,792 | | | | 260,717 | | | | 0.85 | % | | Morgan Stanley & Co. LLC | | 55 bps + 1M EURIB | | -44 bps | | 3/25/2021 | | | (49,075 | ) |
| PERSIMMON PLC | | | | | | | 298,082 | | | | 352,050 | | | | 1.14 | % | | Morgan Stanley & Co. LLC | | 55 bps + 1M LIBOR | | 24 bps | | 3/26/2021 | | | 53,968 | |
| PROSEGUR CASH SA | | | | | | | 480,106 | | | | 331,370 | | | | 1.08 | % | | Morgan Stanley & Co. LLC | | 55 bps + 1M EURIB | | -44 bps | | 3/26/2021 | | | (148,736 | ) |
| PRUDENTIAL PLC | | | | | | | 602,171 | | | | 527,797 | | | | 1.72 | % | | Morgan Stanley & Co. LLC | | 55 bps + 1M LIBOR | | 24 bps | | 3/26/2021 | | | (74,374 | ) |
| RECKITT BENCKISER GROUP PLC(LSE) | | | | | | | 808,072 | | | | 851,686 | | | | 2.77 | % | | Morgan Stanley & Co. LLC | | 55 bps + 1M LIBOR | | 24 bps | | 3/26/2021 | | | 43,614 | |
| ROBERTET SA | | | | | | | 1,728,982 | | | | 1,555,656 | | | | 5.06 | % | | Morgan Stanley & Co. LLC | | 55 bps + 1M EURIB | | -44 bps | | 3/26/2021 | | | (173,326 | ) |
| ROCHE HOLDING AGGENUSSCHEIN(VTX) | | | | | | | 1,418,968 | | | | 1,599,065 | | | | 5.20 | % | | Morgan Stanley & Co. LLC | | 55 bps + 1M LIBOR | | 24 bps | | 3/26/2021 | | | 180,097 | |
| SBANKEN ASA | | | | | | | 337,146 | | | | 286,051 | | | | 0.93 | % | | Morgan Stanley & Co. LLC | | 55 bps + 1M NIBOR | | 64 bps | | 4/30/2021 | | | (51,095 | ) |
| TOTAL SA(PAR) | | | | | | | 579,077 | | | | 481,316 | | | | 1.57 | % | | Morgan Stanley & Co. LLC | | 55 bps + 1M EURIB | | -44 bps | | 3/26/2021 | | | (97,761 | ) |
| VIVENDI(PAR) | | | | | | | 1,484,744 | | | | 1,449,609 | | | | 4.70 | % | | Morgan Stanley & Co. LLC | | 55 bps + 1M EURIB | | -44 bps | | 3/26/2021 | | | (35,135 | ) |
| WH SMITH PLC | | | | | | | 518,213 | | | | 393,466 | | | | 1.28 | % | | Morgan Stanley & Co. LLC | | 55 bps + 1M LIBOR | | 24 bps | | 3/26/2021 | | | (124,747 | ) |
| EQUITY SWAPS Total | | | | | | | 19,548,531 | | | | 19,186,355 | | | | 62.39 | % | | | | | | | | | | | | |
| TOTAL LONG | | | | | | | 19,548,531 | | | | 19,775,345 | | | | 64.31 | % | | | | | | | | | | | | |
| See Notes to Financial Statements. | |
| Annual Report | April 30, 2020 | 15 |
| Highland Resolute Fund | Consolidated Schedule of Investments |
April 30, 2020
| Description | | Contracts/ Shares | | | Notional Value | | | Value | | | Percentage
of Value | | | Counterparty | | Floating Rate/ Fixed Rate Amount paid by Fund | | Reference Rate | | Termination Date | | Unrealized Gain (Loss) | |
| SECURITIES SOLD SHORT | | | | | | | | | | | | | | | | | | | | | | | |
| CORPORATE BONDS | | | | | | | | | | | | | | | | | | | | | | | |
| GLENLN 1.5% 15 OCT 2026 EMTN | | | (385,767 | ) | | | | | | $ | (406,263 | ) | | | -1.32 | % | | | | | | | | | | | | |
| SMDSLN 0.875% 12 SEP 2026 EMTN | | | (771,533 | ) | | | | | | | (780,562 | ) | | | -2.54 | % | | | | | | | | | | | | |
| IGIM 1.0% 11 DEC 2031 EMTN | | | (385,767 | ) | | | | | | | (412,193 | ) | | | -1.34 | % | | | | | | | | | | | | |
| CORPORATE BONDS | | | | | | | | | | | | | | | | | | | | | | | | | | | | |
| Total | | | | | | | | | | | (1,599,018 | ) | | | -5.20 | % | | | | | | | | | | | | |
| | | | | | | | | | | | | | | | | | | | | | | | | | | | | |
| EQUITY SWAPS | | | | | | | | | | | | | | | | | | | | | | | | | | | | |
| AENA SME SA | | | | | | $ | (442,113 | ) | | | (326,330 | ) | | | -1.06 | % | | Morgan Stanley & Co. LLC | | 1D EONIA -50 bps | | -45 bps | | 3/26/2021 | | $ | 115,783 | |
| BEKAERT NV | | | | | | | (352,014 | ) | | | (278,942 | ) | | | -0.91 | % | | Morgan Stanley & Co. LLC | | 1D EONIA -50 bps | | -45 bps | | 3/26/2021 | | | 73,072 | |
| BOOHOO GROUP PLC | | | | | | | (462,553 | ) | | | (625,258 | ) | | | -2.03 | % | | Morgan Stanley & Co. LLC | | 1D SONIA -35 bps | | 7 bps | | 3/26/2021 | | | (162,705 | ) |
| DECHRA PHARMACEUTICALS PLC | | | | | | | (451,112 | ) | | | (494,177 | ) | | | -1.61 | % | | Morgan Stanley & Co. LLC | | 1D SONIA - 35 bps | | 7 bps | | 3/26/2021 | | | (43,065 | ) |
| DOW JONES STOXX INSURANCE (PRI | | | | | | | (397,266 | ) | | | (326,744 | ) | | | -1.06 | % | | Morgan Stanley & Co. LLC | | 1D EONIA - 45 bps | | -45 bps | | 8/3/2020 | | | 70,522 | |
| EUROFINS SCIENTIFIC(PAR) | | | | | | | (625,996 | ) | | | (689,722 | ) | | | -2.24 | % | | Morgan Stanley & Co. LLC | | 1D EONIA - 75 bps | | -45 bps | | 3/26/2021 | | | (63,726 | ) |
| FUTURE PLC(LSE) | | | | | | | (395,825 | ) | | | (452,737 | ) | | | -1.47 | % | | Morgan Stanley & Co. LLC | | 1D SONIA -35 bps | | 7 bps | | 3/26/2021 | | | (56,912 | ) |
| KERRY GROUP PLCA(ISE) | | | | | | | (932,720 | ) | | | (889,660 | ) | | | -2.89 | % | | Morgan Stanley & Co. LLC | | 1D EONIA - 35 bps | | -45 bps | | 3/26/2021 | | | 43,060 | |
| LANDIS+GYR GROUP AG | | | | | | | (366,479 | ) | | | (301,119 | ) | | | -0.98 | % | | Morgan Stanley & Co. LLC | | 1D SARON -40 bps | | -66 bps | | 3/26/2021 | | | 65,360 | |
| ORPEA(PAR) | | | | | | | (583,655 | ) | | | (514,548 | ) | | | -1.67 | % | | Morgan Stanley & Co. LLC | | 1D EONIA -40 bps | | -45 bps | | 3/26/2021 | | | 69,107 | |
| STXE 600 BANK EUR PR | | | | | | | (204,681 | ) | | | (159,208 | ) | | | -0.52 | % | | Morgan Stanley & Co. LLC | | 1D EONIA -45 bps | | -45 bps | | 8/3/2020 | | | 45,473 | |
| TEMENOS AG - REG | | | | | | | (429,942 | ) | | | (380,410 | ) | | | -1.24 | % | | Morgan Stanley & Co. LLC | | 1D SARON -40 bps | | -66 bps | | 3/26/2021 | | | 49,532 | |
| WIRECARD AG | | | | | | | (461,521 | ) | | | (371,510 | ) | | | -1.21 | % | | Morgan Stanley & Co. LLC | | 1D EONIA -375 bps | | -45 bps | | 3/25/2021 | | | 90,011 | |
| EQUITY SWAPS Total | | | | | | | (6,105,877 | ) | | | (5,810,365 | ) | | | -18.89 | % | | | | | | | | | | | | |
| | | | | | | | | | | | | | | | | | | | | | | | | | | | | |
| FUTURE CONTRACT | | | | | | | | | | | | | | | | | | | | | | | | | | | | |
| EURO STOXX 50 JUN20 | | | (251 | ) | | | | | | | (156,144 | ) | | | -0.51 | % | | Morgan Stanley & Co. LLC | | | | | | | | | | |
| | | | | | | | | | | | | | | | | | | | | | | | | | | | | |
| TOTAL SHORT | | | | | | | (6,105,877 | ) | | | (7,565,527 | ) | | | -24.60 | % | | | | | | | | | | | | |
| | | | | | | | | | | | | | | | | | | | | | | | | | | | | |
| REMAINING SECURITIES AND CASH | | | | | | | | | | | 18,540,231 | | | | 60.29 | % | | | | | | | | | | | | |
| TOTAL VALUE | | | | | | | | | | $ | 30,750,049 | | | | | | | | | | | | | | | | | |
See Notes to Financial Statements.
16
| Highland Resolute Fund | Consolidated Schedule of Investments |
April 30, 2020
| PSAM HIGHLAND | | | | | | | | | | | | | | | | | | | | | | | | | | | |
| Description | | Contracts/ Shares | | | Notional Value | | | Value | | | Percentage of Value | | | Counterparty | | | Floating Rate/ Fixed Rate Amount paid by Fund | | | Reference Rate | | | Termination Date | | | Unrealized Gain (Loss) | |
| LONG SECURITIES COMMON STOCKS | | | | | | | | | | | | | | | | | | | | | | | | | | | | | | | | | | | | |
| ANIXTER INTL INC COM STK | | | 11,770 | | | | | | | $ | 1,092,989 | | | | 3.54 | % | | | | | | | | | | | | | | | | | | | | |
| BOMBARDIER CAD'B' | | | 286,328 | | | | | | | | 100,769 | | | | 0.33 | % | | | | | | | | | | | | | | | | | | | | |
| CAESARS ENTERTAINMENT CORP COM STK | | | 149,782 | | | | | | | | 1,446,895 | | | | 4.70 | % | | | | | | | | | | | | | | | | | | | | |
| CARRIER GB CP WI | | | 19,126 | | | | | | | | 338,730 | | | | 1.10 | % | | | | | | | | | | | | | | | | | | | | |
| E TRADE FINL CORP COM STK | | | 5,285 | | | | | | | | 214,640 | | | | 0.70 | % | | | | | | | | | | | | | | | | | | | | |
| ENERGY HARBOR CORP | | | 47,222 | | | | | | | | 1,511,109 | | | | 4.91 | % | | | | | | | | | | | | | | | | | | | | |
| FORESCOUT TECHNOLOGIES INC | | | 15,653 | | | | | | | | 497,136 | | | | 1.61 | % | | | | | | | | | | | | | | | | | | | | |
| HEWLETT PACKARD | | | 8,364 | | | | | | | | 129,733 | | | | 0.42 | % | | | | | | | | | | | | | | | | | | | | |
| KEIHIN CORP 50 | | | 11,807 | | | | | | | | 281,363 | | | | 0.91 | % | | | | | | | | | | | | | | | | | | | | |
| L BRANDS COM STK | | | 15,107 | | | | | | | | 179,620 | | | | 0.58 | % | | | | | | | | | | | | | | | | | | | | |
| LEGG MASON INC COM STK | | | 4,792 | | | | | | | | 238,762 | | | | 0.77 | % | | | | | | | | | | | | | | | | | | | | |
| MCKESSON EUROPE AG (GFR LISTING) | | | 41,572 | | | | | | | | 1,156,992 | | | | 3.75 | % | | | | | | | | | | | | | | | | | | | | |
| MEET GROUP INC/THE COM STK | | | 32,349 | | | | | | | | 199,595 | | | | 0.65 | % | | | | | | | | | | | | | | | | | | | | |
| OSRAM LICHT AG Z.VERKAUF EING.NAMENS-AKT | | | 8,339 | | | | | | | | 368,675 | | | | 1.20 | % | | | | | | | | | | | | | | | | | | | | |
| OTIS WORLDWDE WI | | | 5,272 | | | | | | | | 268,415 | | | | 0.87 | % | | | | | | | | | | | | | | | | | | | | |
| PRIMO WATER CORP | | | 24,861 | | | | | | | | 255,069 | | | | 0.83 | % | | | | | | | | | | | | | | | | | | | | |
| RESIDEO TECHNOLOGIESINC | | | 44,931 | | | | | | | | 230,496 | | | | 0.75 | % | | | | | | | | | | | | | | | | | | | | |
| TAUBMAN CTRS INC COM REIT | | | 11,094 | | | | | | | | 478,162 | | | | 1.55 | % | | | | | | | | | | | | | | | | | | | | |
| TECH DATA CORP COM STK | | | 6,699 | | | | | | | | 942,176 | | | | 3.06 | % | | | | | | | | | | | | | | | | | | | | |
| TERRAFORM POWER INC. COM STK | | | 38,288 | | | | | | | | 663,141 | | | | 2.15 | % | | | | | | | | | | | | | | | | | | | | |
| TIFFANY & CO COM STK | | | 18,008 | | | | | | | | 2,277,981 | | | | 7.39 | % | | | | | | | | | | | | | | | | | | | | |
| TRINITY INDS INC COM STK | | | 8,808 | | | | | | | | 169,909 | | | | 0.55 | % | | | | | | | | | | | | | | | | | | | | |
| WABCO HOLDINGS INC | | | 16,910 | | | | | | | | 2,272,383 | | | | 7.38 | % | | | | | | | | | | | | | | | | | | | | |
| WRIGHT MEDICAL GROUPNV COM STK | | | 79,210 | | | | | | | | 2,306,581 | | | | 7.49 | % | | | | | | | | | | | | | | | | | | | | |
| COMMON STOCKS | | | | | | | | | | | | | | | | | | | | | | | | | | | | | | | | | | | | |
| Total | | | | | | | | | | | 17,621,321 | | | | 57.19 | % | | | | | | | | | | | | | | | | | | | | |
| | | | | | | | | | | | | | | | | | | | | | | | | | | | | | | | | | | | | |
| CORPORATE BONDS | | | | | | | | | | | | | | | | | | | | | | | | | | | | | | | | | | | | |
| FINRSK 8.25 | | | | | | | | | | | | | | | | | | | | | | | | | | | | | | | | | | | | |
| 15NOV2026 144A | | | 745,806 | | | | | | | | 837,572 | | | | 2.72 | % | | | | | | | | | | | | | | | | | | | | |
| GNW FRN 15NOV2036 | | | 506,907 | | | | | | | | 200,645 | | | | 0.65 | % | | | | | | | | | | | | | | | | | | | | |
| GTT 7.875 31DEC2024 144A | | | 510,922 | | | | | | | | 317,331 | | | | 1.03 | % | | | | | | | | | | | | | | | | | | | | |
| LB 6.875 01NOV2035 | | | 595,240 | | | | | | | | 459,630 | | | | 1.49 | % | | | | | | | | | | | | | | | | | | | | |
| PCG 4.45 15APR2042 | | | 617,323 | | | | | | | | 652,819 | | | | 2.12 | % | | | | | | | | | | | | | | | | | | | | |
| PCG 4.75 15FEB2044 | | | 541,538 | | | | | | | | 596,030 | | | | 1.93 | % | | | | | | | | | | | | | | | | | | | | |
| PCG 5.4 15JAN2040 | | | 846,686 | | | | | | | | 946,170 | | | | 3.07 | % | | | | | | | | | | | | | | | | | | | | |
| PCG 5.8 01MAR2037 | | | 683,572 | | | | | | | | 765,845 | | | | 2.48 | % | | | | | | | | | | | | | | | | | | | | |
| SGMS 7 15MAY2028 144A | | | 148,057 | | | | | | | | 111,249 | | | | 0.36 | % | | | | | | | | | | | | | | | | | | | | |
See Notes to Financial Statements.
| Annual Report | April 30, 2020 | 17 |
| Highland Resolute Fund | Consolidated Schedule of Investments |
April 30, 2020
| Description | | Contracts/ Shares | | | Notional Value | | | Value | | | Percentage of Value | | | Counterparty | | Floating Rate/ Fixed Rate Amount paid by Fund | | Reference Rate | | Termination Date | | Unrealized Gain (Loss) | |
| CORPORATE BONDS (CONTINUED) | | | | | | | | | | | | | | | | | | | | |
| UNIT 7.875 15FEB2025 144A | | | 118,948 | | | | | | | $ | 116,817 | | | | 0.38 | % | | | | | | | | | | | | |
| UNIT 8.25 15OCT2023 | | | 443,167 | | | | | | | | 369,321 | | | | 1.20 | % | | | | | | | | | | | | |
| CORPORATE BONDS Total | | | | | | | | | | | 5,373,429 | | | | 17.43 | % | | | | | | | | | | | | |
| | | | | | | | | | | | | | | | | | | | | | | | | | | | | |
| EQUITY SWAPS | | | | | | | | | | | | | | | | | | | | | | | | | | | | |
| ALLERGAN PLC | | | | | | $ | 2,671,301 | | | | 2,982,434 | | | | 9.68 | % | | Morgan Stanley & Co. LLC | | 40 bps + 1D FEDEF | | 4 bps | | 12/30/2020 | | $ | 311,133 | |
| EDP RENOVAVEIS SA | | | | | | | 283,184 | | | | 415,684 | | | | 1.35 | % | | Morgan Stanley & Co. LLC | | 65 bps + 1D EONIA | | -45 bps | | 12/15/2020 | | | 132,500 | |
| FIAT CHRYSLER AUTOMOBILES NV | | | | | | | 2,100,293 | | | | 1,494,312 | | | | 4.85 | % | | Morgan Stanley & Co. LLC | | 65 bps + 1D EONIA | | -45 bps | | 12/15/2020 | | | (605,981 | ) |
| GRANDVISION NV- W/I (NET LISTING) | | | | | | | 1,877,434 | | | | 1,659,695 | | | | 5.38 | % | | Morgan Stanley & Co. LLC | | 65 bps + 1D EONIA | | -45 bps | | 12/15/2020 | | | (217,739 | ) |
| STARS GROUP INC | | | | | | | 1,046,865 | | | | 1,399,774 | | | | 4.54 | % | | Morgan Stanley & Co. LLC | | 40 bps + 1D SONIA | | 7 bps | | 10/6/2021 | | | 352,909 | |
| UNITED MALT GROUP LTD (AUL LISTING) | | | | | | | — | | | | 222,208 | | | | 0.72 | % | | Morgan Stanley & Co. LLC | | 0 bps + 1M BBSW- | | 29 bps | | 12/15/2020 | | | 222,208 | |
| VODAFONE GROUP (UKM LISTING) | | | | | | | 715,961 | | | | 561,221 | | | | 1.82 | % | | Morgan Stanley & Co. LLC | | 65 bps + 1D SONIA | | 7 bps | | 12/15/2020 | | | (154,740 | ) |
| EQUITY SWAPS Total | | | | | | | 8,695,038 | | | | 8,735,328 | | | | 28.34 | % | | | | | | | | | | | | |
| TOTAL LONG | | | | | | | 8,695,038 | | | | 31,730,078 | | | | 102.96 | % | | | | | | | | | | | | |
| | | | | | | | | | | | | | | | | | | | | | | | | | | | | |
| SECURITIES SOLD SHORT | | | | | | | | | | | | | | | | | | | | | | | | | | | | |
| COMMON STOCKS | | | | | | | | | | | | | | | | | | | | | | | | | | | | |
| ELDORADO RESORTS LLC | | | (13,407 | ) | | | | | | | (287,456 | ) | | | -0.93 | % | | | | | | | | | | | | |
| MORGAN STANLEY COM STK | | | (5,514 | ) | | | | | | | (219,337 | ) | | | -0.71 | % | | | | | | | | | | | | |
| SPDR S&P 500 ETF TRUST | | | (5,840 | ) | | | | | | | (1,696,541 | ) | | | -5.50 | % | | | | | | | | | | | | |
| COMMON STOCKS Total | | | | | | | | | | | (2,203,334 | ) | | | -7.14 | % | | | | | | | | | | | | |
| | | | | | | | | | | | | | | | | | | | | | | | | | | | | |
| CORPORATE BONDS | | | | | | | | | | | | | | | | | | | | | | | | | | | | |
| EIX 3.65 01FEB2050 | | | (129,487 | ) | | | | | | | (142,830 | ) | | | -0.46 | % | | | | | | | | | | | | |
| EIX 4 01APR2047 | | | (149,563 | ) | | | | | | | (167,245 | ) | | | -0.54 | % | | | | | | | | | | | | |
| CORPORATE BONDS Total | | | | | | | | | | | (310,075 | ) | | | -1.00 | % | | | | | | | | | | | | |
| | | | | | | | | | | | | | | | | | | | | | | | | | | | | |
| EQUITY SWAPS | | | | | | | | | | | | | | | | | | | | | | | | | | | | |
| FLUTTER ENTERTAINMENT PLC | | | | | | $ | (1,159,757 | ) | | | (1,377,316 | ) | | | -4.47 | % | | Morgan Stanley & Co. LLC | | 1D SONIA - 75 bps | | 7 bps | | 12/15/2020 | | | (217,559 | ) |
| PEUGEOT SA FF35 | | | | | | | (1,792,752 | ) | | | (1,274,985 | ) | | | -4.13 | % | | Morgan Stanley & Co. LLC | | 1D EONIA -40 bps | | -45 bps | | 12/15/2020 | | | 517,767 | |
| EQUITY SWAPS Total | | | | | | | (2,952,509 | ) | | | (2,652,301 | ) | | | -8.60 | % | | | | | | | | | | | | |
| Settlement Date | | Fund Receiving | | U.S. $ Value at April 30th, 2020 | | Fund Delivering | | | | | U.S. $ Value at April 30, 2020 | | Unrealized Appreciation/(Depreciation) | | | Percentage of Value | |
| OUTSTANDING FORWARD FOREIGN CURRENCY CONTRACTS | | | | | | | | |
| 5/4/20 | | USD | | (277,006) | | | EUR | | | Morgan Stanley & Co. LLC | | (301,133) | | | (24,127 | ) | | | -0.98 | % |
| | | | | | | | | | | | | | | | | | | | | |
| TOTAL SHORT | | (2,952,509) | | (5,442,716) | | | -17.72 | % | | | | | | | | | | | | |
| | | | | | | | | | | | | | | | | | | | | |
| REMAINING SECURITIES AND CASH | | 4,551,157 | | | 14.76 | % | | | | | | | | | | | | |
| TOTAL VALUE | | | | $30,838,519 | | | | | | | | | | | | | | | | |
See Notes to Financial Statements.
18
| Highland Resolute Fund | Consolidated Schedule of Investments |
April 30, 2020
WABR
| Description | | Contracts/ Shares | | | Value | | | Percentage of Value | | | Counterparty |
| LONG SECURITIES | | | | | | | | | | | | | | |
| COMMON STOCKS | | | | | | | | | | | | | | |
| ADOBE ORD (NMQ) | | | 284 | | | $ | 100,434 | | | | 0.40 | % | | |
| ALLERGAN ORD (NYS) | | | 2,462 | | | | 461,231 | | | | 1.83 | % | | |
| ALPHABET CL A ORD (NMS) | | | 98 | | | | 131,977 | | | | 0.52 | % | | |
| APPLE ORD (NMS) | | | 425 | | | | 124,865 | | | | 0.50 | % | | |
| AVAYA HOLDINGS ORD (NYS) | | | 23,777 | | | | 236,344 | | | | 0.94 | % | | |
| BOSTON PROPERTIES REIT ORD (NYS) | | | 1,357 | | | | 131,873 | | | | 0.52 | % | | |
| DOVER ORD (NYS) | | | 981 | | | | 91,871 | | | | 0.36 | % | | |
| EVERGY ORD (NYS) | | | 2,998 | | | | 175,173 | | | | 0.70 | % | | |
| FIRSTENERGY ORD (NYS) | | | 2,588 | | | | 106,807 | | | | 0.42 | % | | |
| FREEPORT MCMORAN ORD (NYS) | | | 11,348 | | | | 100,203 | | | | 0.40 | % | | |
| HILTON WORLDWIDE HOLDINGS ORD (NYS) | | | 1,609 | | | | 121,817 | | | | 0.48 | % | | |
| ISHARES IBOXX HIGH YIELD BOND ETF (PSE) | | | 34,871 | | | | 2,804,675 | | | | 11.15 | % | | |
| ISHARES IBOXX INVT GRADE BOND ETF (PSE) | | | 23,172 | | | | 2,993,127 | | | | 11.90 | % | | |
| MICRON TECHNOLOGY ORD (NMS) | | | 2,642 | | | | 126,525 | | | | 0.50 | % | | |
| MICROSOFT ORD (NMS) | | | 762 | | | | 136,558 | | | | 0.54 | % | | |
| NEXTERA ENERGY ORD (NYS) | | | 471 | | | | 108,858 | | | | 0.43 | % | | |
| PIEDMONT OFFICE REIT CL A ORD (NYS) | | | 5,407 | | | | 93,811 | | | | 0.37 | % | | |
| QIAGEN ORD (NYS) | | | 4,957 | | | | 206,658 | | | | 0.82 | % | | |
| RIO TINTO ADR REP ONE ORD (NYS) | | | 2,217 | | | | 102,403 | | | | 0.41 | % | | |
| VERTIV HOLDINGS CL A ORD (NYS) | | | 20,998 | | | | 222,369 | | | | 0.88 | % | | |
| VICI PPTYS ORD (NYS) | | | 9,761 | | | | 170,037 | | | | 0.68 | % | | |
| WELLTOWER ORD (NYS) | | | 1,897 | | | | 97,183 | | | | 0.39 | % | | |
| COMMON STOCKS Total | | | | | | | 8,844,799 | | | | 35.14 | % | | |
| | | | | | | | | | | | | | | |
| CORPORATE BONDS | | | | | | | | | | | | | | |
| BESPL EMTN 0.0000% 2021-01-15 | | | 700,000 | | | | 200,163 | | | | 0.80 | % | | |
| | | | | | | | | | | | | | | |
| INTEREST RATE FUTURE CONTRACTS | | | | | | | | | | | | | | |
| 10 YR US GOVT TREASURY NOTE Jun-20 | | | 21 | | | | 108,969 | | | | 0.43 | % | | Morgan Stanley & Co. LLC |
| ULTRA LONG TERM US TREASURY BOND Jun-20 | | | 12 | | | | 228,654 | | | | 0.91 | % | | Morgan Stanley & Co. LLC |
| INTEREST RATE FUTURE CONTRACTS Total | | | | | | | 337,623 | | | | 1.34 | % | | |
| | | | | | | | | | | | | | | |
| INDEX FUTURE CONTRACTS | | | | | | | | | | | | | | |
| E-MINI S&P 500 STOCK INDEX Jun-20 | | | 15 | | | | 345,325 | | | | 1.37 | % | | Morgan Stanley & Co. LLC |
| E-MINI S&P MIDCAP 400 Jun-20 | | | 8 | | | | 217,243 | | | | 0.86 | % | | Morgan Stanley & Co. LLC |
| INDEX FUTURE CONTRACTS Total | | | | | | | 562,568 | | | | 2.23 | % | | |
| | | | | | | | | | | | | | | |
| TOTAL LONG | | | | | | | 9,945,153 | | | | 39.51 | % | | |
| | | | | | | | | | | | | | | |
| SECURITIES SOLD SHORT | | | | | | | | | | | | | | |
| COMMON STOCKS | | | | | | | | | | | | | | |
| ABBVIE ORD (NYS) | | | (1,761 | ) | | | (144,754 | ) | | | -0.58 | % | | |
| ACACIA COMMUNICATIONS ORD (NMS) | | | (1,456 | ) | | | (98,557 | ) | | | -0.39 | % | | |
| ADVANCED DISPOSAL SERVICES ORD (NYS) | | | (3,165 | ) | | | (102,071 | ) | | | -0.41 | % | | |
| AMERICAN AIRLINES GROUP ORD (NMS) | | | (7,931 | ) | | | (95,251 | ) | | | -0.38 | % | | |
| CAMDEN PROPERTY REIT ORD (NYS) | | | (1,030 | ) | | | (90,712 | ) | | | -0.36 | % | | |
| CANADIAN PACIFIC RAILWAY ORD (NYS) | | | (409 | ) | | | (92,978 | ) | | | -0.37 | % | | |
| DUKE ENERGY ORD (NYS) | | | (1,224 | ) | | | (103,624 | ) | | | -0.41 | % | | |
| FEDERAL REIT ORD (NYS) | | | (1,129 | ) | | | (94,012 | ) | | | -0.37 | % | | |
| HEALTHCARE REAL REIT ORD (NYS) | | | (4,649 | ) | | | (136,634 | ) | | | -0.54 | % | | |
| INVSC QQQ TRUST SRS 1 ETF (NMS) | | | (1,086 | ) | | | (237,736 | ) | | | -0.94 | % | | |
See Notes to Financial Statements.
| Annual Report | April 30, 2020 | 19 |
| Highland Resolute Fund | Consolidated Schedule of Investments |
April 30, 2020
| Description | | Contracts/ Shares | | | Value | | | Percentage of Value | | | Counterparty |
| COMMON STOCKS (CONTINUED) | | | | | | | | | | | |
| ISHARES US REAL ESTATE ETF (PSE) | | | (1,768 | ) | | $ | (134,457 | ) | | | -0.53 | % | | |
| ISHARES US TECHNOLOGY ETF (PSE) | | | (684 | ) | | | (160,248 | ) | | | -0.64 | % | | |
| JB HUNT TRANSPORT SERVICES ORD (NMS) | | | (1,252 | ) | | | (126,602 | ) | | | -0.50 | % | | |
| LTC PROPERTIES REIT ORD (NYS) | | | (3,393 | ) | | | (120,791 | ) | | | -0.48 | % | | |
| OMNICOM GROUP ORD (NYS) | | | (1,665 | ) | | | (94,955 | ) | | | -0.38 | % | | |
| SAP ADR REP 1 ORD (NYS) | | | (1,332 | ) | | | (157,895 | ) | | | -0.63 | % | | |
| SELECT SECTOR UTI SELECT SPDR ETF (PSE) | | | (5,646 | ) | | | (323,290 | ) | | | -1.28 | % | | |
| SPDR S&P SEMICONDUCTOR ETF (PSE) | | | (1,170 | ) | | | (116,450 | ) | | | -0.46 | % | | |
| TAUBMAN CNTR REIT ORD (NYS) | | | (2,148 | ) | | | (92,579 | ) | | | -0.37 | % | | |
| TEXAS INSTRUMENTS ORD (NMS) | | | (848 | ) | | | (98,428 | ) | | | -0.39 | % | | |
| VANECK VECTORS SEMICONDUCTOR ETF (NMS) | | | (775 | ) | | | (103,641 | ) | | | -0.41 | % | | |
| VORNADO REALTY REIT ORD (NYS) | | | (3,207 | ) | | | (140,531 | ) | | | -0.56 | % | | |
| WERNER ENTERPRISES ORD (NMS) | | | (3,776 | ) | | | (151,493 | ) | | | -0.60 | % | | |
| COMMON STOCKS Total | | | | | | | (3,017,689 | ) | | | -11.98 | % | | |
| | | | | | | | | | | | | | | |
| TOTAL SHORT | | | | | | | (3,017,689 | ) | | | -11.98 | % | | |
| | | | | | | | | | | | | | | |
| REMAINING SECURITIES AND CASH | | | | | | | 18,244,674 | | | | 72.47 | % | | |
| TOTAL VALUE | | | | | | $ | 25,172,138 | | | | | | | |
Common Abbreviations:
AQR - AQR Capital Management LLC.
BBA - British Bankers Association.
EURIBOR - Euro Interbank Offered Rate.
LIBOR - London Interbank Offered Rate.
PIMCO - Pacific Investment Management Company.
S&P - Standard & Poor's.
SPDR - Standard & Poor's Depositary Receipt.
Currency Abbreviations:
AUD - Australian Dollar
CAD - Canada Dollar
CHF - Franc Switzerland
EUR - Euro
GBP - Great British Pound
INR - India Rupee
ILS - Israel Shekel
JPY - Japan Yen
KRW - South Korea Won
MXN - Mexico Peso
NOK - Norwegian Krone
PLN - Poland Zloty
SEK - Swedish Krona
SGD - Singapore Dollar
USD - United States Dollar
See Notes to Financial Statements.
20
| Highland Resolute Fund | Consolidated Statement of Assets and Liabilities |
April 30, 2020
| ASSETS | | | |
| Investments, at value | | $ | 142,539,468 | |
| Unrealized appreciation on total return swap contracts | | | 26 | |
| Deposits with brokers for total return swap contracts | | | 43,910,178 | |
| Cash | | | 8,323 | |
| Foreign currency, at value (Cost $30,911) | | | 31,416 | |
| Receivable for investments sold | | | 115,558 | |
| Dividends receivable | | | 250,931 | |
| Interest receivable | | | 230,383 | |
| Receivable for total return swap reset | | | 2,796,138 | |
| Other assets | | | 14,874 | |
| Total assets | | | 189,897,295 | |
| LIABILITIES | | | | |
| Written options, at value (Premiums received 398,426) | | | 367,792 | |
| Investment advisory fees payable | | | 32,623 | |
| Shareholder service fees payable | | | 57,361 | |
| Payable for interest expense on total return swap contracts | | | 125,172 | |
| Payable for total return swap reset | | | 400,170 | |
| Payable for investments purchased | | | 8,956,834 | |
| Trustee fees and expenses payable | | | 12,820 | |
| Chief compliance officer fees payable | | | 7,417 | |
| Principal financial officer fees payable | | | 1,250 | |
| Administration fees payable | | | 44,741 | |
| Transfer agency fees payable | | | 8,814 | |
| Professional fees payable | | | 52,212 | |
| Custody fees payable | | | 22,063 | |
| Accrued expenses and other liabilities | | | 7,885 | |
| Total liabilities | | | 10,097,154 | |
| NET ASSETS | | $ | 179,800,141 | |
| NET ASSETS CONSIST OF | | | | |
| Paid-in capital (Note 6) | | $ | 211,982,352 | |
| Total distributable earnings/(loss) | | | (32,182,211 | ) |
| NET ASSETS | | $ | 179,800,141 | |
| INVESTMENTS, AT COST | | $ | 140,490,518 | |
| PRICING OF SHARES | | | | |
| Class I: | | | | |
| Net Asset Value, offering and redemption price per share | | $ | 9.28 | |
| Net Assets | | $ | 179,800,141 | |
| Shares of beneficial interest outstanding (unlimited number of shares, no par value common stock authorized) | | | 19,374,899 | |
See Notes to Financial Statements.
| Annual Report | April 30, 2020 | 21 |
| Highland Resolute Fund | Consolidated Statement of Operations |
For the Year Ended April 30, 2020
| INVESTMENT INCOME | | | |
| Dividends | | $ | 5,370,042 | |
| Interest | | | 2,137,778 | |
| Foreign taxes withheld | | | (8,541 | ) |
| Total investment income | | | 7,499,279 | |
| | | | | |
| EXPENSES | | | | |
| Investment advisory fees (Note 7) | | | 4,366,551 | |
| Investment advisory fees-subsidiary | | | 272,531 | |
| Administration fees | | | 442,730 | |
| Transfer agency fees | | | 73,900 | |
| Shareholder service fees | | | | |
| Class I | | | 37,317 | |
| Professional fees | | | 80,279 | |
| Custody fees | | | 71,936 | |
| Reports to shareholders and printing fees | | | 7,020 | |
| Trustee fees and expenses | | | 22,118 | |
| Registration/filing fees | | | 24,306 | |
| Chief compliance officer fees | | | 88,167 | |
| Principal financial officer fees | | | 14,431 | |
| Dividend expense on securities sold short | | | 212,020 | |
| Interest expense on securities sold short | | | 26,525 | |
| Other | | | 56,156 | |
| Total expenses before waivers | | | 5,795,987 | |
| Less fees waived/reimbursed by investment adviser (Note 7) | | | | |
| Class I | | | (3,523,592 | ) |
| Waiver of investment advisory fees - subsidiary (Note 7) | | | (272,531 | ) |
| Total net expenses | | | 1,999,864 | |
| NET INVESTMENT INCOME | | | 5,499,415 | |
| Net realized loss on investments | | | (21,477,776 | ) |
| Net realized gain on securities sold short | | | 1,774,468 | |
| Net realized gain on written options | | | 5,424 | |
| Net realized loss on total return swap contracts | | | (17,456,360 | ) |
| Net realized loss on foreign currency transactions | | | (24,399 | ) |
| Total net realized loss | | | (37,178,643 | ) |
| | | | | |
| Net change in unrealized appreciation on investments | | | 1,031,535 | |
| Net change in unrealized appreciation on securities sold short | | | 778,464 | |
| Net change in unrealized appreciation on written options | | | 30,634 | |
| Net change in unrealized appreciation on total return swap contracts | | | 43,268 | |
| Net change in unrealized depreciation on translation of assets and liabilities in foreign currency transactions | | | (11,826 | ) |
| Total net change in unrealized appreciation | | | 1,872,075 | |
| NET REALIZED AND UNREALIZED LOSS ON INVESTMENTS | | | (35,306,568 | ) |
| NET DECREASE IN NET ASSETS RESULTING FROM OPERATIONS | | $ | (29,807,153 | ) |
See Notes to Financial Statements.
22
| Highland Resolute Fund | Consolidated Statements of Changes in Net Assets |
| | | For the Year Ended April 30, 2020 | | | For the Year Ended April 30, 2019 | |
| OPERATIONS | | | | | | |
| Net investment income | | $ | 5,499,415 | | | $ | 6,846,351 | |
| Net realized loss | | | (37,178,643 | ) | | | (5,212,697 | ) |
| Net realized gain distributions from other investment companies | | | – | | | | 50,001 | |
| Net change in unrealized appreciation/(depreciation) | | | 1,872,075 | | | | (2,199,323 | ) |
| Net decrease in net assets resulting from operations | | | (29,807,153 | ) | | | (515,668 | ) |
| TOTAL DISTRIBUTIONS (NOTE 4) | | | | | | | | |
| Class I | | | (3,500,019 | ) | | | (15,995,417 | ) |
| Net decrease in net assets from distributions | | | (3,500,019 | ) | | | (15,995,417 | ) |
| BENEFICIAL INTEREST TRANSACTIONS (NOTE 6) | | | | | | | | |
| Shares sold | | | | | | | | |
| Class I | | | 9,378,217 | | | | 9,834,051 | |
| Dividends reinvested | | | | | | | | |
| Class I | | | 3,500,019 | | | | 15,995,417 | |
| Shares redeemed, net of redemption fees | | | | | | | | |
| Class I | | | (132,205,860 | ) | | | (50,748,365 | ) |
| Net decrease in net assets derived from beneficial interest transactions | | | (119,327,624 | ) | | | (24,918,897 | ) |
| Net decrease in Net Assets | | | (152,634,796 | ) | | | (41,429,982 | ) |
| NET ASSETS: | | | | | | | | |
| Beginning of period | | | 332,434,937 | | | | 373,864,919 | |
| End of period | | $ | 179,800,141 | | | $ | 332,434,937 | |
See Notes to Financial Statements.
| Annual Report | April 30, 2020 | 23 |
| Highland Resolute Fund | Consolidated Financial Highlights |
For a share outstanding throughout the periods presented
| | | Class I | |
| | | For the Year Ended April 30, 2020 | | | For the Year Ended April 30, 2019 | | | For the Year Ended April 30, 2018(a) | | | For the Year Ended April 30, 2017(b) | | | For the Year Ended April 30, 2016 | |
| | | | | | | | | | | | | | | | |
| NET ASSET VALUE, BEGINNING OF PERIOD | | $ | 10.30 | | | $ | 10.81 | | | $ | 11.14 | | | $ | 10.75 | | | $ | 11.32 | |
| INCOME/(LOSS) FROM OPERATIONS | | | | | | | | | | | | | | | | | | | | |
| Net investment income(c) | | | 0.19 | | | | 0.20 | | | | 0.25 | | | | 0.09 | | | | 0.16 | |
| Net realized and unrealized gain/(loss) on investments | | | (1.09 | ) | | | (0.22 | ) | | | 0.38 | | | | 0.45 | | | | (0.39 | ) |
| Total from Investment Operations | | | (0.90 | ) | | | (0.02 | ) | | | 0.63 | | | | 0.54 | | | | (0.23 | ) |
| | | | | | | | | | | | | | | | | | | | | |
| LESS DISTRIBUTIONS | | | | | | | | | | | | | | | | | | | | |
| Net investment income | | | (0.12 | ) | | | (0.15 | ) | | | (0.77 | ) | | | (0.13 | ) | | | (0.18 | ) |
| Net realized gain on investments | | | – | | | | (0.34 | ) | | | (0.19 | ) | | | (0.02 | ) | | | (0.16 | ) |
| Total Distributions | | | (0.12 | ) | | | (0.49 | ) | | | (0.96 | ) | | | (0.15 | ) | | | (0.34 | ) |
| NET INCREASE/(DECREASE) IN NET ASSET VALUE | | | (1.02 | ) | | | (0.51 | ) | | | (0.33 | ) | | | 0.39 | | | | (0.57 | ) |
| NET ASSET VALUE, END OF PERIOD | | $ | 9.28 | | | $ | 10.30 | | | $ | 10.81 | | | $ | 11.14 | | | $ | 10.75 | |
| TOTAL RETURN(d) | | | (8.65 | )% | | | 0.22 | % | | | 5.51 | % | | | 5.04 | % | | | (2.02 | )% |
| | | | | | | | | | | | | | | | | | | | | |
| RATIOS/SUPPLEMENTAL DATA | | | | | | | | | | | | | | | | | | | | |
| Net assets, End of Period (000s) | | $ | 179,800 | | | $ | 332,435 | | | $ | 373,865 | | | $ | 491,811 | | | $ | 686,659 | |
| RATIOS TO AVERAGE NET ASSETS: | | | | | | | | | | | | | | | | | | | | |
| Operating expenses excluding reimbursement/waiver(e) | | | 1.90 | %(f)(g) | | | 1.89 | %(f)(g) | | | 1.94 | %(f)(g) | | | 1.77 | %(f)(g) | | | 1.69 | %(f) |
| Operating expenses including reimbursement/waiver(e) | | | 0.69 | %(f) | | | 0.74 | %(f) | | | 0.82 | %(f) | | | 0.52 | %(f) | | | 0.35 | %(f) |
| Net investment income including reimbursement/waiver(e) | | | 1.89 | % | | | 1.95 | % | | | 2.24 | % | | | 0.86 | % | | | 1.49 | % |
| PORTFOLIO TURNOVER RATE | | | 104 | % | | | 55 | % | | | 79 | % | | | 94 | % | | | 27 | % |
| (a) | Prior to August 31, 2017 the Highland Resolute Fund was known as the Redmont Resolute Fund. |
| (b) | Prior to August 31, 2016 the Highland Resolute Fund was known as the Redmont Resolute Fund II. |
| (c) | Calculated using the average shares method. |
| (d) | Total investment return is calculated assuming a purchase of a common share at the opening of the first day and a sale at closing on the last day of each period reported. Dividends and distributions, if any, are assumed for purposes of this calculation to be reinvested at prices obtained under the Fund's dividend reinvestment plan. Total returns would have been lower had certain expenses not been waived during the period. Total investment returns do not reflect brokerage commissions, if any, and are not annualized. |
| (e) | The ratios exclude the impact of expenses of the underlying funds in which the Fund invests as represented in the Consolidated Schedule of Investments. |
| (f) | Dividend and interest expense on securities sold short totaled 0.09%, 0.19%, 0.25%, 0.10%, and 0.08% of average net assets for the years ended April 30, 2020, 2019, 2018, 2017, and 2016, respectively. |
| (g) | The ratio of operating expenses excluding fee waiver/reimbursements to average net assets is calculated excluding the waived Subsidiary management fee (See Note 7 for additional detail). The ratio inclusive of that fee would be 1.99%, 1.97%, 2.01% and 1.81% for the years ended April 30, 2020, 2019, 2018 and 2017, respectively. |
See Notes to Financial Statements.
24
| Highland Resolute Fund | Notes to Consolidated Financial Statements |
April 30, 2020
1. ORGANIZATION
Financial Investors Trust (the “Trust”), a Delaware statutory trust, is an open-end management investment company registered under the Investment Company Act of 1940, as amended (“1940 Act”). The Trust consists of multiple separate portfolios or series. This annual report describes the Highland Resolute Fund (the “Fund”). Effective August 31, 2017, the Fund changed its name from Redmont Resolute Fund. The Fund seeks to provide long-term total return with reduced volatility and reduced correlation to the conventional stock and bond markets. The Fund offers Class I shares.
Basis of Consolidation: Highland Resolute Cayman (the “Subsidiary”), a Cayman Islands exempted company, is a wholly owned subsidiary of the Fund. The Subsidiary’s investment objective is designed to enhance the ability of the Fund to obtain exposure to equities, financial, currency and commodities markets consistent with the limits of the U.S. federal tax law requirements applicable to registered investment companies. The Subsidiary is subject to substantially the same investment policies and investment restrictions as the Fund. The Subsidiary acts as an investment vehicle for the Fund in order to effect certain commodity-related investments on behalf of the Fund. Investments in the Subsidiary are expected to provide the Fund with exposure to the commodity markets within the limitations of Subchapter M of the Internal Revenue Code of 1986, as amended (the “Code”), and recent IRS revenue rulings, as discussed below under “Federal Income Taxes”. The Fund is the sole shareholder of the Subsidiary pursuant to a subscription agreement, and it is intended that the Fund will remain the sole shareholder and will continue to control the Subsidiary. Under the Articles of Association of the Subsidiary, shares issued by the Subsidiary confer upon a shareholder the right to wholly own and vote at general meetings of the Subsidiary and certain rights in connection with any winding-up or repayment of capital, as well as the right to participate in the profits or assets of the Subsidiary. The Fund may invest up to 25% of its total assets in shares of the Subsidiary. As a wholly owned subsidiary of the Fund, all assets and liabilities, income and expenses of the Subsidiary are consolidated in the financial statements and financial highlights of the Fund collectively referred to as the "financial statements" in these notes to the consolidated financial statements. All investments held by the Subsidiary are disclosed in the accounts of the Fund. As of April 30, 2020, net assets of the Fund were $179,800,141, of which $16,821,992 or 9.35%, represented the Fund’s ownership of all issued shares and voting rights of the Subsidiary. The Fund and the Subsidiary are "commodity pools" under the U.S. Commodity Exchange Act, and Highland Associates, Inc. (the "Adviser") is a "commodity pool operator" registered with and regulated by the Commodities Futures Trading Commission (CFTC).
2. SIGNIFICANT ACCOUNTING POLICIES
The accompanying financial statements were prepared in accordance with accounting principles generally accepted in the United States of America (“U.S. GAAP”). The preparation of financial statements in conformity with U.S. GAAP requires management to make certain estimates and assumptions that affect the reported amounts of assets and liabilities and disclosures of contingent assets and liabilities at the date of the financial statements and the reported amounts of increases and decreases in net assets from operations during the reporting period. Actual results could differ from those estimates. The Fund is considered an investment company for financial reporting purposes under U.S. GAAP and follows the accounting and reporting guidance applicable to investment companies in the Financial Accounting Standards Board Accounting Standards Codification Topic 946 Financial Services – Investment Companies. The following is a summary of significant accounting policies consistently followed by the Fund and Subsidiary in preparation of the financial statements.
Investment Valuation: The Fund generally values its securities based on market prices determined at the close of regular trading on the New York Stock Exchange (“NYSE”), normally 4:00 p.m. Eastern Time, on each day the NYSE is open for trading.
For equity securities and mutual funds that are traded on an exchange, the market price is usually the closing sale or official closing price on that exchange. In the case of equity securities not traded on an exchange, or if such closing prices are not otherwise available, the securities are valued at the mean of the most recent bid and ask prices on such day. Redeemable securities issued by open-end registered investment companies are valued at the investment company’s applicable net asset value, with the exception of exchange-traded open-end investment companies, which are priced as equity securities.
The market price for debt obligations is generally the price supplied by an independent third-party pricing service approved by the Board of Trustees of the Trust (the “Board”), which may use a matrix, formula or other objective method that takes into consideration quotations from dealers, market transactions in comparable investments, market indices and yield curves. If vendors are unable to supply a price, or if the price supplied is deemed to be unreliable, the market price may be determined using quotations received from one or more brokers–dealers that make a market in the security. Municipal securities having a remaining maturity of greater than 60 days, are typically valued at the evaluated bid price formulated by an independent pricing service. Corporate Bonds, U.S. Government & Agency, and U.S. Treasury Bonds & Notes are valued using market models that consider trade data, quotations from dealers and active market makers, relevant yield curve and spread data, creditworthiness, trade data or market information on comparable securities, and other relevant security specific information. Mortgage-related and asset-backed securities are valued based on models that consider trade data, prepayment and default projections, benchmark yield and spread data and
| Annual Report | April 30, 2020 | 25 |
| Highland Resolute Fund | Notes to Consolidated Financial Statements |
April 30, 2020
estimated cash flows of each tranche of the issuer. Publicly traded foreign government debt securities are typically traded internationally in the over-the-counter market and are valued at the mean between the bid and asked prices as of the close of business of that market.
Futures contracts that are listed or traded on a national securities exchange, commodities exchange, contract market or comparable over the counter market, and that are freely transferrable, are valued at their closing settlement price on the exchange on which they are primarily traded or based upon the current settlement price for a like instrument acquired on the day on which the instrument is being valued. A settlement price may not be used if the market makes a limit move with respect to a particular commodity. Over-the-counter swap contracts for which market quotations are readily available are valued based on quotes received from independent pricing services or one or more dealers that make markets in such securities. Options contracts listed for trading on a securities exchange or board of trade are valued at the last quoted sales price or, in the absence of a sale at the mean of the last bid and asked price.
Forward currency exchange contracts have a fair value determined by the current foreign currency exchange forward rates. The foreign currency exchange forward rates are calculated using an automated system that estimates rates on the basis of the current day foreign currency exchange rates and forward foreign currency exchange rates supplied by a pricing service. Foreign exchange rates and forward foreign currency exchange rates may generally be obtained at the close of the NYSE, normally 4:00 p.m. Eastern Time.
When such prices or quotations are not available, or when the Adviser believes that they are unreliable, securities may be priced using fair value procedures approved by the Board.
Fair Value Measurements: The Fund discloses the classification of its fair value measurements following a three-tier hierarchy based on the inputs used to measure fair value. Inputs refer broadly to the assumptions that market participants would use in pricing the asset or liability, including assumptions about risk. Inputs may be observable or unobservable. Observable inputs reflect the assumptions market participants would use in pricing the asset or liability that are developed based on market data obtained from sources independent of the reporting entity. Unobservable inputs reflect the reporting entity’s own assumptions about the assumptions market participants would use in pricing the asset or liability that are developed based on the best information available.
Various inputs are used in determining the value of the Fund’s investments as of the end of the reporting period. When inputs used fall into different levels of the fair value hierarchy, the level in the hierarchy within which the fair value measurement falls is determined based on the lowest level input that is significant to the fair value measurement in its entirety. The designated input levels are not necessarily an indication of the risk or liquidity associated with these investments. These inputs are categorized in the following hierarchy under applicable financial accounting standards:
| | Level 1 – | Unadjusted quoted prices in active markets for identical investments, unrestricted assets or liabilities that the Fund has the ability to access at the measurement date; |
| | | |
| | Level 2 – | Quoted prices which are not active, quoted prices for similar assets or liabilities in active markets or inputs other than quoted prices that are observable (either directly or indirectly) for substantially the full term of the asset or liability; and |
| | | |
| | Level 3 – | Significant unobservable prices or inputs (including the Fund’s own assumptions in determining the fair value of investments) where there is little or no market activity for the asset or liability at the measurement date. |
26
| Highland Resolute Fund | Notes to Consolidated Financial Statements |
April 30, 2020
The following is a summary of the inputs used to value the Fund’s investments as of April 30, 2020:
Highland Resolute Fund
| Investments in Securities at Value | | Level 1 - Quoted Prices | | | Level 2 - Other Significant Observable Inputs | | | Level 3 - Significant Unobservable Inputs | | | Total | |
| Common Stocks* | | $ | – | | | $ | – | | | $ | 359,388 | | | $ | 359,388 | |
| Exchange Traded Funds | | | 19,143,324 | | | | – | | | | – | | | | 19,143,324 | |
| Open-End Mutual Funds | | | 78,801,401 | | | | – | | | | – | | | | 78,801,401 | |
| Preferred Stock | | | – | | | | – | | | | 2,166,219 | | | | 2,166,219 | |
| Corporate Bonds* | | | – | | | | 9,552,284 | | | | – | | | | 9,552,284 | |
| Short-Term Investments | | | | | | | | | | | | | | | | |
| Money Market Fund | | | 23,524,638 | | | | – | | | | – | | | | 23,524,638 | |
| U.S. Treasury Bills | | | – | | | | 8,992,214 | | | | – | | | | 8,992,214 | |
| Total | | $ | 121,469,363 | | | $ | 18,544,498 | | | $ | 2,525,607 | | | $ | 142,539,468 | |
| | | | | | | | | | | | | | | | | |
| Other Financial Instruments** | | | | | | | | | | | | | | | | |
| Assets: | | | | | | | | | | | | | | | | |
| Total Return Swap Contracts | | $ | – | | | $ | 26 | | | $ | – | | | $ | 26 | |
| Liabilities: | | | | | | | | | | | | | | | | |
| Written Option Contracts | | | (367,792 | ) | | | – | | | | – | | | | (367,792 | ) |
| Total | | $ | (367,792 | ) | | $ | 26 | | | $ | – | | | $ | (367,766 | ) |
| * | For detailed descriptions, see the accompanying Consolidated Schedule of Investments. |
| ** | Other financial instruments are derivative instruments reflected in the Consolidated Schedule of Investments. The Total Return Swap Contracts shown in the table are reported at their unrealized appreciation/(depreciation) at measurement date, which represents the change in the contract’s value from trade date. |
The changes of the fair value of investments for which the Fund have used Level 3 inputs to determine the fair value are as follows:
| Highland Resolute Fund | | Common Stocks | | | Preferred Stock | | | Total | |
| Balance as of April 30, 2019 | | $ | – | | | $ | – | | | $ | – | |
| Accrued Discount/Premium | | | – | | | | – | | | | – | |
| Return of Capital | | | – | | | | – | | | | – | |
| Realized Gain/(Loss) | | | – | | | | – | | | | – | |
| Change in Unrealized Depreciation | | | (25,542 | ) | | | (153,957 | ) | | | (179,499 | ) |
| Purchases | | | 384,930 | | | | 2,320,176 | | | | 2,705,106 | |
| Sales Proceeds | | | – | | | | – | | | | – | |
| Transfer into Level 3 | | | – | | | | – | | | | – | |
| Transfer out of Level 3 | | | – | | | | – | | | | – | |
| Balance as of April 30, 2020 | | $ | 359,388 | | | $ | 2,166,219 | | | $ | 2,525,607 | |
| Net change in Unrealized | | | | | | | | | | | | |
| Depreciation attributable to | | | | | | | | | | | | |
| Level 3 investments held at | | | | | | | | | | | | |
| April 30, 2020 | | $ | (25,542 | ) | | $ | (153,957 | ) | | $ | (179,499 | ) |
| Annual Report | April 30, 2020 | 27 |
| Highland Resolute Fund | Notes to Consolidated Financial Statements |
April 30, 2020
Quantitative Information about Level 3 Fair Value Measurements
| Asset Class | | Fair Value (USD) at 4/30/2020 | | | Valuation Technique | | Unobservable Inputs(a) | | Value/Range (USD) |
| Common Stocks | | $ | 359,388 | | | ● Income Approach | | ● Discount Rate | | ● 10.75% |
| | | | | | | ● Comparable Company Approach | | ● Revenue Multiple/ EBITA Multiple | | ● 1.25x-1.50x/ 11.0x -13.0x |
| | | | | | | ● Market Transaction Approach | | ● EBITA Multiple | | ● 11.50x-13.50x |
| | | | | | | | | ● Historical and Projected Company Financial Information | | ● N/A |
| | | | | | | | | | | |
| Preferred Stock | | $ | 2,166,219 | | | ● Income Approach | | ● Discount Rate | | ● 10.75% |
| | | | | | | ● Comparable Company Approach | | ● Revenue Multiple/ EBITA Multiple | | ● 1.25x-1.50x/ 11.0x -13.0x |
| | | | | | | ● Market Transaction Approach | | ● EBITA Multiple | | ● 11.50x-13.50x |
| | | | | | | | | ● Historical and Projected Company Financial Information | | ● N/A |
| (a) | A change to the unobservable input may result in a significant change to the value of the investment as follows: |
| Unobservable Input | Impact to Value if Input Increases | Impact to Value if Input Decreases |
| ● Discount Rate | ● Decrease | ● Increase |
| ● Revenue Multiple/EBITA Multiple | ● Increase | ● Decrease |
| ● EBITA Multiple | ● Increase | ● Decrease |
Trust Expenses: Some expenses of the Trust can be directly attributed to the Fund. Expenses which cannot be directly attributed to the Fund are apportioned among all funds in the Trust based on average net assets of the Fund.
Federal Income Taxes: The Fund complies with the requirements under Subchapter M of the Internal Revenue Code of 1986, as amended, applicable to regulated investment companies and intends to distribute substantially all of its net taxable income and net capital gains, if any, each year so that the Fund will not be subject to excise tax on undistributed income and gains. The Fund is not subject to income taxes to the extent such distributions are made.
As of and during the year ended April 30, 2020, the Fund did not have a liability for any unrecognized tax benefits. The Fund files U.S. federal, state, and local tax returns as required. The Fund’s tax returns are subject to examination by the relevant tax authorities until expiration of the applicable statute of limitations, which is generally three years after the filing of the tax return for federal purposes and four years for most state returns. Tax returns for open years have incorporated no uncertain tax positions that require a provision for income taxes. For tax purposes, the Subsidiary is an exempt Cayman Islands investment company and has received an undertaking from the Government of the Cayman Islands exempting it from all local income, profits, and capital gains taxes. No such taxes are levied in the Cayman Islands at the present time. For U.S. income tax purposes, the Subsidiary is a controlled foreign corporation ("CFC") and as such is not subject to U.S. income tax. However, as a wholly-owned CFC, the net income and capital gain of the CFC, to the extent of its earnings and profits, will be included each year in the Fund's taxable income. The Fund recognizes interest and penalties, if any, related to tax liabilities as income tax expense in the Consolidated Statement of Operations.
Concentration of Credit Risk: The Fund places its cash with a banking institution, which is insured by the FDIC. The FDIC limit is $250,000. At various times throughout the year, the amount on deposit may exceed the FDIC limit and subject the Fund to a credit risk. The Fund does not believe that such deposits are subject to any unusual risk associated with investment activities.
Investment Transactions and Investment Income: Investment transactions are accounted for on the date the investments are purchased or sold (trade date basis). Net realized gains and losses from investment transactions are reported on an identified cost basis. Interest income, which includes accretion of discounts and amortization of premiums, is accrued and recorded as earned using the effective yield method. Dividend income is recognized on the ex-dividend date or for withholding taxes or certain foreign securities, as soon as information is available to the Fund. All of the realized and unrealized gains and losses and net investment income, are allocated daily to each class in proportion to its average daily net assets.
28
| Highland Resolute Fund | Notes to Consolidated Financial Statements |
April 30, 2020
Withholding taxes on foreign dividends are paid (a portion of which may be reclaimable) or provided for in accordance with the applicable country’s tax rules and rates and are disclosed in the Consolidated Statement of Operations.
Foreign Securities: The Fund may directly purchase securities of foreign issuers. Investing in securities of foreign issuers involves special risks not typically associated with investing in securities of U.S. issuers. The risks include possible re-evaluation of currencies, the inability to repatriate foreign currency, less complete financial information about companies and possible future adverse political and economic developments. Moreover, securities of many foreign issuers and their markets may be less liquid and their prices more volatile than those of securities of comparable U.S. issuers.
Foreign Currency Translation: Values of investments denominated in foreign currencies are converted into U.S. dollars using the current exchange rates each business day (generally 4:00 p.m. Eastern Time). Purchases and sales of investments and dividend income are translated into U.S. dollars using the current prevailing exchange rate on the transaction date. The effect of changes in foreign exchange rates on realized and unrealized gains or losses on securities is reflected as a component of such gains or losses. Transactions in foreign denominated assets may involve greater risks than domestic transactions.
Short Sales: The Fund may make short sales of securities consistent with its strategies. A short sale is a transaction in which a Fund sells a security it does not own in anticipation that the market price of that security will decline.
When a Fund makes a short sale, it must borrow the security sold short and deliver it to the broker dealer through which it made the short sale as collateral for its obligation to deliver the security upon conclusion of the sale. The Fund may have to pay a fee to borrow particular securities and is often obligated to pay over any accrued interest and dividends on such borrowed securities.
If the price of the security sold short increases between the time of the short sale and the time that a Fund replaces the borrowed security, the Fund will incur a loss; conversely, if the price declines, the Fund will realize a capital gain. Any gain will be decreased, and any loss increased, by the transaction costs described above. The successful use of short selling may be adversely affected by imperfect correlation between movements in the price of the security sold short and the securities being hedged. Losses incurred from engaging in short sales may be unlimited.
To the extent that a Fund engages in short sales, it will provide collateral to the broker-dealer and (except in the case of short sales “against the box”) will maintain additional asset coverage in the form of segregated or “earmarked” assets determined to be liquid in accordance with procedures established by the Board and that is equal to the current market value of the securities sold short, or will ensure that such positions are covered by “offsetting” positions, until the Fund replaces the borrowed security. A short sale is “against the box” to the extent that the Fund contemporaneously owns, or has the right to obtain at no added cost, securities identical to those sold short. The Fund may engage in short selling to the extent permitted by the federal securities laws and rules and interpretations thereunder. To the extent a Fund engages in short selling in foreign (non-U.S.) jurisdictions, the Fund will do so to the extent permitted by the laws and regulations of such jurisdiction.
Distributions to Shareholders: The Fund normally pays dividends and distributes capital gains, if any, on an annual basis. Income dividend distributions are derived from interest and dividends and other income the Fund receives from their investments, including distributions of short term capital gains. Capital gain distributions are derived from gains realized when the Fund sells a security it has owned for more than a year. The Fund may make additional distributions and dividends at other times if its portfolio manager or managers believe doing so may be necessary for the Fund to avoid or reduce taxes.
Epidemic and Pandemic Risk: Certain countries have been susceptible to epidemics, most recently COVID-19, which has been designated as a pandemic by world health authorities. The outbreak of such epidemics, together with any resulting restrictions on travel or quarantines imposed, could have a negative impact on the economy and business activity globally (including in the countries in which we invest), and thereby could adversely affect the performance of our investments. Furthermore, the rapid development of epidemics could preclude prediction as to their ultimate adverse impact on economic and market conditions, and, as a result, present material uncertainty and risk with respect to us and the performance of our investments.
3. DERIVATIVE INSTRUMENTS
Swap Contracts: The Fund may enter into swap transactions for hedging purposes or to seek to increase total return. At the present time, the Fund primarily enters into swap transactions for the purpose of increasing total return. Risks may arise as a result of the failure of the counterparty to the swap contract to comply with the terms of the swap contract. The loss incurred by the failure of a counterparty is generally limited to the net payment to be received by the Fund and/or the termination value at the end of the contract.
| Annual Report | April 30, 2020 | 29 |
| Highland Resolute Fund | Notes to Consolidated Financial Statements |
April 30, 2020
Therefore, the Fund considers the creditworthiness of each counterparty to a contract in evaluating potential credit risk. Additionally, risks may arise from unanticipated movements in interest rates or in the value of the underlying reference asset or index. Entering into these agreements involves, to varying degrees, market risk, liquidity risk and elements of credit, legal and documentation risk that are not directly reflected in the amounts recognized in the Consolidated Statement of Assets and Liabilities.
The Fund invests in total return swaps to obtain exposure to a security or market without owning such security or investing directly in that market or to transfer the risk/return of one market (e.g., fixed income) to another market (e.g., equity) (equity risk and/or interest rate risk). Total return swaps are agreements in which there is an exchange of cash flows whereby one party commits to make payments based on the total return (coupons plus capital gains/losses) of an underlying instrument in exchange for fixed or floating rate interest payments. To the extent the total return of the instrument or index underlying the transaction exceeds or falls short of the offsetting interest rate obligation, the Fund will receive a payment from or make a payment to the counterparty. The Fund may pay or receive cash as collateral on these contracts which may be recorded as an asset and/or liability. The Fund must set aside liquid assets, or engage in other appropriate measures, to cover its obligations under these contracts. Swaps are marked to market daily using either pricing vendor quotations, counterparty prices or model prices and the change in value, if any, is recorded as an unrealized gain or loss. Upfront payments made and/or received by the Fund are recorded as an asset and/or liability and realized gains or losses are recognized ratably over the contract’s term/event, with the exception of forward starting interest rate swaps, whose realized gains or losses are recognized ratably from the effective start date. Periodic payments received or made on swap contracts are recorded as realized gains or losses. Gains or losses are realized upon termination of a swap contract and are recorded on the Consolidated Statement of Operations. Swap agreements held at April 30, 2020 are disclosed in the Consolidated Schedule of Investments.
International Swaps and Derivatives Association, Inc. Master Agreements (“ISDA Master Agreements”) govern OTC financial derivative transactions entered into by the Fund and those counterparties. The ISDA Master Agreements maintain provisions for general obligations, representations, agreements, collateral and events of default or termination. Events of termination include conditions that may entitle counterparties to elect to terminate early and cause settlement of all outstanding transactions under the applicable ISDA Master Agreement. Any election to early terminate could be material to the financial statements.
Option Contracts: The Fund may enter into options transactions for hedging purposes and for non-hedging purposes such as seeking to enhance return. The Fund may write covered put and call options on any stocks or stock indices, currencies traded on domestic and foreign securities exchanges, or futures contracts on stock indices, interest rates and currencies traded on domestic and, to the extent permitted by the CFTC, foreign exchanges. A call option on an asset written by the Fund obligates the Fund to sell the specified asset to the holder (purchaser) at a stated price (the exercise price) if the option is exercised before a specified date (the expiration date). A put option on an asset written by a Fund obligates the Fund to buy the specified asset from the purchaser at the exercise price if the option is exercised before the expiration date. Premiums received when writing options are recorded as liabilities and are subsequently adjusted to the current value of the options written. Premiums received from writing options that expire are treated as realized gains. Premiums received from writing options, which are either exercised or closed, are offset against the proceeds received or amount paid on the transaction to determine realized gains or losses which are recorded on the Consolidated Statement of Operations.
Futures: The Fund may enter into futures contracts for hedging purposes. A futures contract represents a commitment for the future purchase or sale of an asset at a specified price on a specified date. Upon entering into a futures contract, the Fund is required to deposit an initial margin with the broker in an amount equal to a certain percentage of the contract amount. The Fund receives from or pays to the broker, on a daily basis, an amount of cash equal to the daily fluctuation in value of the contract. Such receipts or payments are known as “variation margin,” and are recorded by the Fund as unrealized gains or losses. When the futures contract is closed, the Fund records a gain or loss equal to the difference between the value of the contract at the time it was opened and the value at the time it was closed.
The Fund’s potential losses from the use of futures extend beyond its initial investment in such contracts. The use of futures contracts involves, to varying degrees, elements of market risk in excess of the amount recognized in the Consolidated Statement of Assets and Liabilities. The predominant risk is that the movement of a futures contract’s price may result in a loss, which could render the Fund’s hedging strategy unsuccessful. There is minimal counterparty credit risk since futures contracts are exchange traded and the exchange’s clearinghouse, as counterparty to all exchange traded futures, guarantees the futures against default.
30
| Highland Resolute Fund | Notes to Consolidated Financial Statements |
April 30, 2020
Risk Exposure: The following tables disclose the amounts related to the Fund’s use of derivative instruments.
The effect of derivative instruments on the Consolidated Statements of Assets and Liabilities as of April 30, 2020 was as follows:
| Risk Exposure | | Asset Derivatives Statement of Assets and Liabilities Location | | Fair Value | | | Liability Derivatives Statement of Assets and Liabilities Location | | Fair Value | |
| Highland Resolute Fund | | | | | | | | | | | | |
| Equity Contracts (Total Return Swap Contracts) | | Unrealized appreciation on total return swap contracts | | $ | 20 | | | N/A | | $ | – | |
| Foreign Exchange Rate Risk (Total Return Swap Contracts) | | Unrealized appreciation on total return swap contracts | | | 6 | | | N/A | | | – | |
| Equity Contracts (Written Options) | | N/A | | | N/A | | | Written options, at value | | | 367,792 | |
| Total | | | | $ | 26 | | | | | $ | 367,792 | |
The effect of derivative instruments on the Consolidated Statements of Operations for the year ended April 30, 2020 was as follows:
| Risk Exposure | | Statement of Operations Location | | Realized Gain/(Loss) on Derivatives Recognized in Income | | | Change in Unrealized Appreciation/(Depreciation) on Derivatives Recognized in Income | |
| Highland Resolute Fund | | | | | | | | | | |
| Equity Contracts (Total Return Swap Contracts) | | Net realized gain/(loss) on total return swap contracts/Net change in unrealized appreciation/ (depreciation) on total return swap contracts | | $ | (17,985,139 | ) | | $ | 43,271 | |
| Foreign Exchange Rate Risk (Total Return Swap Contracts) | | Net realized gain/(loss) on total return swap contracts/Net change in unrealized appreciation/ (depreciation) on total return swap contracts | | | 528,779 | | | | (3 | ) |
| Equity Contracts (Purchased Options) | | Net realized loss on investments/Net change in unrealized appreciation/(depreciation) on investments | | | (158,152 | ) | | | 46,741 | |
| Equity Contracts (Written Options) | | Net realized gain on written options/Net change in unrealized appreciation on written options | | | 5,424 | | | | 30,634 | |
| Total | | | | $ | (17,609,088 | ) | | $ | 120,643 | |
Volume of Derivative Instruments for the Fund during the year ended April 30, 2020 was as follows:
| Derivative Type | Unit of Measurement | Monthly Average |
| Highland Resolute Fund | | |
| Equity Contracts (Total Return Swap Contracts) | Notional Quantity | 143,522,828 |
| Foreign Exchange Rate Risk (Total Return Swap Contracts) | Notional Quantity | 15,844,204 |
| Equity Contracts (Purchased Options) | Contracts | 60 |
| Equity Contracts (Written Options) | Contracts | (9) |
Certain derivative contracts are executed under either standardized netting agreements or, for exchange-traded derivatives, the relevant contracts for a particular exchange which contain enforceable netting provisions. A derivative netting arrangement creates an enforceable right of set-off that becomes effective, and affects the realization of settlement on individual assets, liabilities and collateral amounts, only following a specified event of default or early termination. Default events may include the failure to make payments or deliver securities timely, material adverse
| Annual Report | April 30, 2020 | 31 |
| Highland Resolute Fund | Notes to Consolidated Financial Statements |
April 30, 2020
changes in financial condition or insolvency, the breach of minimum regulatory capital requirements, or loss of license, charter or other legal authorization necessary to perform under the contract.
The following table presents financial instruments that are subject to enforceable netting arrangements or other similar agreements as of April 30, 2020:
Highland Resolute Fund
Offsetting of Derivatives Assets
| | | | | | | | | | | | Gross Amounts Not Offset in the Statement of Assets and Liabilities | |
| | | Gross Amounts of Recognized Assets | | | Gross Amounts Offset in the Statement of Assets and Liabilities | | | Net Amounts Presented in the Statement of Assets and Liabilities | | | Financial Instruments Available for Offset(a) | | | Cash Collateral Received(a) | | | Net Receivable Amount | |
| Total Return Swap Contracts | | $ | 26 | | | $ | – | | | $ | 26 | | | $ | – | | | $ | – | | | $ | 26 | |
| Total | | $ | 26 | | | $ | – | | | $ | 26 | | | $ | – | | | $ | – | | | $ | 26 | |
| (a) | These amounts are limited to the derivative asset/liability balance and, accordingly, do not include excess collateral received/pledged. |
4. TAX BASIS INFORMATION
Reclassifications: As of April 30, 2020, permanent differences in book and tax accounting were reclassified. These differences had no effect on net assets and were primarily attributed to differing book and tax treatment of partnership investments, bond premium amortization and investments held in a controlled foreign corporation. The reclassifications were as follows:
| Fund | | Paid-in Capital | | | Distributable earnings | |
| Highland Resolute Fund | | $ | (548 | ) | | $ | 548 | |
Tax Basis of Investments: As of April 30, 2020, the aggregate cost of investments, gross unrealized appreciation/(depreciation) and net unrealized appreciation for Federal tax purposes were as follows:
| | | Gross Appreciation (excess of value over tax cost) | | | Gross Depreciation (excess of tax cost over value) | | | Net Appreciation/(Depreciation) of Foreign Currency | | | Net Unrealized Appreciation/(Depreciation) | | | Cost of Investments for Income Tax Purposes | |
| Highland Resolute Fund | | $ | 89,835,411 | | | $ | (89,292,829 | ) | | $ | 391 | | | $ | 542,973 | | | $ | 142,027,526 | |
The difference between the federal income tax cost of portfolio investments and other financial instruments and the financial statement cost is due to certain timing differences in the recognition of capital gains or losses under income tax regulations and GAAP. These “book/tax” differences are temporary in nature and are due to the tax deferral of losses on wash sales and certain market to market adjustments.
Components of Earnings: As of April 30, 2020, components of distributable earnings were as follows:
| | | Undistributed net investment income | | | Accumulated net realized gain/(loss) on investments | | | Other cumulative effect of timing differences | | | Net unrealized appreciation/(depreciation) on investments | | | Total | |
| Highland Resolute Fund | | $ | – | | | $ | (29,583,888 | ) | | $ | (3,141,296 | ) | | $ | 542,973 | | | $ | (32,182,211 | ) |
Other Cumulative Effect of Timing Differences is due to the late year ordinary loss deferral.
32
| Highland Resolute Fund | Notes to Consolidated Financial Statements |
April 30, 2020
Tax Basis of Distributions to Shareholders: The character of distributions made during the year from net investment income or net realized gains may differ from its ultimate characterization for federal income tax purposes. Also, due to the timing of dividend distributions, the fiscal year in which amounts are distributed may differ from the fiscal year in which the income or realized gain were recorded by the Fund.
The tax character of distributions paid by the Fund for the fiscal year ended April 30, 2020, were as follows:
| Fund | | Ordinary Income | | | Long-Term Capital Gain | |
| Highland Resolute Fund | | $ | 3,500,019 | | | $ | – | |
The tax character of distributions paid by the Fund for the fiscal year ended April 30, 2019, were as follows:
| | | Ordinary Income | | | Long-Term Capital Gains | |
| Highland Resolute Fund | | $ | 5,227,081 | | | $ | 10,768,336 | |
Under current law, capital losses maintain their character as short-term or long-term and are carried forward to the next tax year without expiration. As of April 30, 2020, the Fund elects to carry forward $6,504,781 in long-term capital losses to the next tax year.
The Fund elects to defer to the period ending April 30, 2021, capital losses recognized during the period November 1, 2019 through April 30, 2020 in the amount of $23,079,107.
The Fund elects to defer to the period ending April 30, 2021, ordinary losses recognized during the period November 1, 2019 through April 30, 2020 in the amount of $3,141,296.
5. SECURITIES TRANSACTIONS
Purchases and sales of securities, excluding short-term securities and U.S. Government Obligations during the year ended April 30, 2020 were as follows:
| Fund | | Purchases of Securities | | | Proceeds From Sales of Securities | |
| Highland Resolute Fund | | $ | 203,015,017 | | | $ | 310,408,437 | |
6. BENEFICIAL SHARE TRANSACTIONS
The capitalization of the Trust consists of an unlimited number of shares of beneficial interest with no par value per share. Holders of the shares of the Fund of the Trust have one vote for each share held and a proportionate fraction of a vote for each fractional share. All shares issued and outstanding are fully paid and are transferable and redeemable at the option of the shareholder. Purchasers of the shares do not have any obligation to make payments to the Trust or its creditors solely by reason of the purchasers’ ownership of the shares. Shares have no pre-emptive rights.
Transactions in common shares were as follows:
Highland Resolute Fund
| Class I: | | For the Year Ended April 30, 2020 | | | For the Year Ended April 30, 2019 | |
| Common Shares Outstanding - Beginning of Period | | | 32,287,022 | | | | 34,589,249 | |
| Common Shares Sold | | | 926,202 | | | | 935,962 | |
| Common Shares Issued as Reinvestment of Dividends | | | 340,801 | | | | 1,669,668 | |
| Common Shares Redeemed | | | (14,179,126 | ) | | | (4,907,857 | ) |
| Common Shares Outstanding - End of Period | | | 19,374,899 | | | | 32,287,022 | |
| Annual Report | April 30, 2020 | 33 |
| Highland Resolute Fund | Notes to Consolidated Financial Statements |
April 30, 2020
Shares redeemed within 90 days of purchase may incur a 2% short-term redemption fee deducted from the redemption amount. Redemption fees are reflected in the “Shares redeemed, net of redemption fees” in the Consolidated Statement of Changes in Net Assets. For the year ended April 30, 2020 and the year ended April 30, 2019, the Fund retained fees as follows:
| Fund | | For the Year Ended April 30, 2020 | | | For the Year Ended April 30, 2019 | |
| Highland Resolute Fund | | $ | 16 | �� | | $ | 337 | |
7. MANAGEMENT AND RELATED PARTY TRANSACTIONS
Investment Advisory
The Adviser, subject to the authority of the Board, is responsible for the overall management and administration of the Fund’s business affairs. Pursuant to the Investment Advisory Agreement (the “Advisory Agreement”), the Adviser is entitled to an investment advisory fee, computed daily and payable monthly of 1.50% of the average daily net assets for the Fund. The management fee is paid on a monthly basis.
The Subsidiary has entered into a separate advisory agreement (the “Subsidiary Advisory Agreement”) with the Adviser for the management of the Subsidiary’s portfolio pursuant to which the Subsidiary is obligated to pay the Adviser a management fee at the same rate that the Fund pays the Adviser for investment advisory services provided to the Fund. The Adviser has agreed to waive the advisory fee it receives from the Fund in an amount equal to the management fee paid by the Subsidiary. This waiver may not be terminated or modified without the consent of the Board. This agreement may not be terminated or modified prior to this date except with the approval of the Board. For the year ended April 30, 2020, this amount equaled $272,531 and is disclosed in the Consolidated Statement of Operations. Fees under the Subsidiary Advisory Agreement are not permitted to be recouped.
The Adviser entered into Investment Sub-Advisory Agreements with Chatham Asset Management, LLC (“Chatham”) and Parametric Portfolio Associates, LLC (“Parametric”). The Investment Sub-Advisory Agreements are in accordance with the Fund’s investment objective, policies and limitations and investment guidelines established jointly by the Adviser and the Board. The Adviser determines the allocation of the Fund’s assets among Chatham and Parametric (collectively the “Sub-Advisers”) and other open-end investment companies. The Fund is not required to invest with any minimum number of sub-advisers or open-end investment companies, and does not have minimum or maximum limitations with respect to allocations of assets to the Sub-Advisers, investment strategy or market sector. The Adviser may change the allocation of the Fund’s assets among the available investment options, and may add or remove sub-advisers, at any time. Each Sub-Adviser is responsible for the day-to-day management of its allocated portion of Fund assets. The Adviser has ultimate responsibility, subject to the oversight of the Board of the Fund, to oversee the Sub-Advisers, and to recommend their hiring, termination and replacement.
Pursuant to each Investment Sub-Advisory Agreement, the Adviser pays the Sub-Advisers an annual sub-advisory management fee which is based on the Fund’s average quarterly market value of the assets managed by the Sub-Advisers. The Adviser is required to pay all fees due to Sub-Advisers out of the management fee the Adviser receives from the Fund. The following table reflects the Fund’s contractual sub-advisory fee rates.
| Sub-Advisers | Contractual Sub-Advisory Fee |
| Chatham Asset Management, LLC | 1.00% |
| Parametric Portfolio Associates, LLC | 0.30% |
The Adviser has agreed, with respect to the Fund’s Class I shares, to waive the portion of its 1.50% management fee in excess of any sub-advisory fees (as defined in the Prospectus), and effective September 1, 2019, less third-party administrative costs charged to the Adviser in connection with the non-recurring addition of a new investment sub-adviser for the Fund or removal of an existing investment sub-adviser to the Fund. The Adviser may not discontinue this agreement to waive fees prior to August 31, 2020 without the approval of the Fund’s Board of Trustees. The Adviser is not permitted to recoup any amounts waived or reimbursed to the extent actual fees and expenses for a fiscal period are less than the expense limitation cap. Fees waived/reimbursed by the Adviser for the year ended April 30, 2020 are disclosed in the Consolidated Statement of Operations.
For the year ended April 30, 2020, the fee waivers and/or reimbursements were as follows:
| | | Fees Waived/ Reimbursed By Adviser | |
| Highland Resolute Fund - Class I | | $ | (3,523,592 | ) |
34
| Highland Resolute Fund | Notes to Consolidated Financial Statements |
April 30, 2020
Administrator Fees and Expenses
ALPS Fund Services, Inc. (“ALPS”) serves as administrator to the Fund, and the Fund has agreed to pay expenses incurred in connection with its administrative activities. Pursuant to an Administration Agreement, ALPS provides operational services to the Fund including, but not limited to, fund accounting and fund administration and generally assists in the Fund’s operations. Officers of the Trust are employees of ALPS. The Fund’s administration fee is accrued on a daily basis and paid monthly. Administration fees paid by the Fund for the year ended April 30, 2020 are disclosed in the Consolidated Statement of Operations.
ALPS is reimbursed by the Fund for certain out-of-pocket expenses.
Transfer Agent
ALPS serves as transfer, dividend paying and shareholder servicing agent for the Fund. ALPS receives an annual minimum fee, a fee based upon the number of shareholder accounts and is also reimbursed by the Fund for certain out-of-pocket expenses. Transfer agent fees paid by the Fund for the year ended April 30, 2020 are disclosed in the Consolidated Statement of Operations.
Compliance Services
ALPS provides services that assist the Fund’s chief compliance officer in monitoring and testing the policies and procedures of the Fund in conjunction with requirements under Rule 38a-1 under the 1940 Act and receives an annual base fee. ALPS is reimbursed for certain out-of-pocket expenses by the Fund. Compliance service fees paid by the Fund for the year ended April 30, 2020 are disclosed in the Consolidated Statement of Operations.
Principal Financial Officer
ALPS receives an annual fee for providing principal financial officer services to the Fund. Principal financial officer fees paid by the Fund for the year ended April 30, 2020 are disclosed in the Consolidated Statement of Operations.
Distributor
ALPS Distributors, Inc. (“ADI” or the “Distributor”) (an affiliate of ALPS) acts as the distributor of the Fund’s shares pursuant to a Distribution Agreement with the Trust on behalf of the Fund. Shares are sold on a continuous basis by ADI as agent for the Fund, and ADI has agreed to use its best efforts to solicit orders for the sale of Fund’s shares, although it is not obliged to sell any particular amount of shares. ADI is not entitled to any compensation for its services as Distributor. ADI is registered as a broker-dealer with the U.S. Securities and Exchange Commission.
Shareholder Services Plan
Effective December 12, 2017, the Fund has adopted a Shareholder Services Plan (the “Plan”) with respect to its Class I shares. Under the Plan, the Fund is authorized to pay banks and its affiliates and other institutions, including broker-dealers and Fund affiliates which may include the Distributor, Adviser and/or the transfer agent (“Participating Organizations”), an aggregate fee in an amount not to exceed on an annual basis 0.10% of the average daily net asset value of Class I shares of the Fund attributable to or held in the name of the Participating Organizations for its clients as compensation for providing shareholder service activities, which do not include distribution services pursuant to an agreement with Participating Organizations. Any amount of such payment not paid to the Participating Organizations during the Fund’s fiscal year for such service activities shall be reimbursed to the Fund as soon as practicable. During the year ended April 30, 2020, the Fund was reimbursed from the Plan of 0.06% of average net assets. Plan fees are included with shareholder service fees in the Statement of Operations. Fees recaptured pursuant to the Plan for the year ended April 30, 2020 are included as an offset to shareholder service fees as disclosed in the Consolidated Statement of Operations.
Trustees
The fees and expenses of the Trustees of the Board are presented in the Consolidated Statement of Operations.
8. INDEMNIFICATIONS
Under the Trust’s organizational documents, its officers and Trustees are indemnified against certain liability arising out of the performance of their duties to the Trust. Additionally, in the normal course of business, the Trust enters into contracts with service providers that may contain general indemnification clauses which may permit indemnification to the extent permissible under applicable law. The Trust’s maximum exposure under these arrangements is unknown, as this would involve future claims that may be made against the Trust that have not yet occurred.
9. SUBSEQUENT EVENT
Subsequent events after the date of the Consolidated Statement of Assets and Liabilities have been evaluated through the date the financial statements were issued.
| Annual Report | April 30, 2020 | 35 |
| Highland Resolute Fund | Report of Independent Registered Accounting Firm |
April 30, 2020
To the Shareholders of Highland Resolute Fund and Board of Trustees of Financial Investors Trust
Opinion on the Financial Statements
We have audited the accompanying consolidated statement of assets and liabilities, including the consolidated schedule of investments, of Highland Resolute Fund (the “Fund”), a series of Financial Investors Trust, as of April 30, 2020, and the related consolidated statements of operations and changes in net assets, including the related notes, and the consolidated financial highlights for the year then ended (collectively referred to as the “financial statements”). In our opinion, the financial statements present fairly, in all material respects, the financial position of the Fund as of April 30, 2020, the results of its operations, the changes in its net assets, and the financial highlights for the year then ended, in conformity with accounting principles generally accepted in the United States of America.
The Fund’s consolidated financial statements and financial highlights for the years ended April 30, 2019, and prior, were audited by other auditors whose report dated June 25, 2019, expressed an unqualified opinion on those consolidated financial statements and financial highlights.
Basis for Opinion
These financial statements are the responsibility of the Fund’s management. Our responsibility is to express an opinion on the Fund’s financial statements based on our audit. We are a public accounting firm registered with the Public Company Accounting Oversight Board (United States) (“PCAOB”) and are required to be independent with respect to the Fund in accordance with the U.S. federal securities laws and the applicable rules and regulations of the Securities and Exchange Commission and the PCAOB.
We conducted our audit in accordance with the standards of the PCAOB. Those standards require that we plan and perform the audit to obtain reasonable assurance about whether the financial statements are free of material misstatement whether due to error or fraud.
Our audit included performing procedures to assess the risks of material misstatement of the financial statements, whether due to error or fraud, and performing procedures that respond to those risks. Such procedures included examining, on a test basis, evidence regarding the amounts and disclosures in the financial statements. Our procedures included confirmation of securities owned as of April 30, 2020, by correspondence with the custodian, issuer, and brokers. Our audit also included evaluating the accounting principles used and significant estimates made by management, as well as evaluating the overall presentation of the financial statements. We believe that our audit provides a reasonable basis for our opinion.
We have served as the Fund’s auditor since 2020.
COHEN & COMPANY, LTD.
Cleveland, Ohio
June 29, 2020
36
| Highland Resolute Fund | Additional Information |
April 30, 2020 (Unaudited)
1. FUND HOLDINGS
The Fund files its complete schedule of portfolio holdings with the SEC for the first and third quarters of each fiscal year on Form N-PORT. The Fund files its complete schedule of portfolio holdings with the Commission for the first and third quarters of each fiscal year as an exhibit to its reports on Form N-PORT. The Fund’s Form N-PORT reports are available on the Commission’s Web site at http://www.sec.gov. The Fund's Form N-PORT is also available upon request by calling toll-free (855) 268-2242.
2. FUND PROXY VOTING POLICIES, PROCEDURES AND SUMMARIES
Fund policies and procedures used in determining how to vote proxies and information regarding how each of the Fund voted proxies relating to portfolio securities during the most recent prior 12-month period ending June 30 are available without charge, (1) upon request, by calling (toll-free) (855) 268-2242 and (2) on the SEC’s website at http://www.sec.gov.
3. TAX INFORMATION
The Fund designates the following for federal income tax purposes for distributions made during the calendar year ended December 31, 2019:
| | QDI | DRD |
| Highland Resolute Fund | 6.02 % | 6.31 % |
In early 2020, if applicable, shareholders of record received this information for the distribution paid to them by the Fund during the calendar year 2019 via Form 1099. The Fund will notify shareholders in early 2021 of amounts paid to them by the Funds, if any, during the calendar year 2020.
4. CHANGE IN AUDITOR
Effective December 10, 2019, the Board of Trustees appointed, upon recommendation of the Audit Committee, Cohen & Company, Ltd. (“Cohen”) as the Fund’s independent registered public accounting firm. Cohen provides audit services, tax return review and assistance. Cohen is located at 1350 Euclid Ave., Suite 800, Cleveland, Ohio 44115.
| Annual Report | April 30, 2020 | 37 |
| Highland Resolute Fund | Disclosure Regarding Approval of Fund Advisory Agreements |
April 30, 2020 (Unaudited)
On March 10, 2020, the Trustees met in person to discuss, among other things, the renewal of the Investment Advisory Agreement between Highland Associates, Inc. (“Highland”) and the Trust, and the Investment Sub-Advisory Agreements with each of Chatham Asset Management, LLC (“Chatham”) and Incline Global Management, LLC (“Incline”), with respect to the Highland Fund, in accordance with Section 15(c) of the 1940 Act. In renewing and approving the Investment Advisory Agreement and Investment Sub-Advisory Agreements, the Trustees, including the Independent Trustees, considered the following factors with respect to the Highland Fund:
Nature, Extent, and Quality of the Services under the Investment Advisory and Sub-Advisory Agreements: The Trustees received and considered information regarding the nature, extent, and quality of services to be provided to the Highland Fund under the Highland Investment Advisory and Highland Sub-Advisory Agreements. The Trustees reviewed certain background materials supplied by Highland, Chatham, and Incline in their presentations, including their Forms ADV.
The Trustees reviewed and considered Highland’s, Chatham’s, and Incline’s investment advisory personnel, their history as asset managers and their performance and the amount of assets currently under management by Highland, Chatham, and Incline and their affiliated entities. The Trustees also reviewed the research and decision-making processes utilized by Highland, Chatham, and Incline, including the methods adopted to seek to achieve compliance with the investment objectives, policies, and restrictions of the Highland Fund.
The Trustees considered the background and experience of Highland’s, Chatham’s, and Incline’s management in connection with the Highland Fund, including reviewing the qualifications, backgrounds, and responsibilities of the management team primarily responsible for the day-to-day portfolio management of the Highland Fund and the extent of the resources devoted to research and analysis of actual and potential investments.
The Trustees also reviewed, among other things, Highland’s, Chatham’s, and Incline’s insider trading policies and procedures and their Codes of Ethics.
Performance: The Trustees reviewed performance information for the Highland Fund for the 3-month, 1-year, 3-year, and 5-year periods ended December 31, 2019. That review included a comparison of the Highland Fund’s performance to the performance of a group of comparable funds selected by an independent provider of investment company data (the “Data Provider”). The Trustees noted that the performance of the Highland Fund was above its Data Provider peer group median for the 3-month, 1-year, 3-year, and 5-year periods ended December 31, 2019. The Trustees also considered Highland’s, Chatham’s, and Incline’s discussion of the Highland Fund’s top contributors and top detractors, as well as Highland’s, Chatham’s, and Incline’s performance and reputation generally.
Investment Advisory and Sub-Advisory Fee Rates: The Trustees reviewed and considered the contractual annual advisory fee paid by the Trust, on behalf of the Highland Fund, to Highland of 1.50% of the Highland Fund’s daily average net assets, in light of the extent and quality of the advisory services provided by Highland to the Highland Fund. The Trustees also reviewed and considered the contractual annual sub-advisory fee paid by Highland to Chatham of 1.00% of the Highland Fund’s daily average net assets allocated to Chatham. The Trustees also reviewed and considered the contractual annual sub-advisory fee paid by Highland to Incline of 1.25% of the Highland Fund’s daily average net assets allocated to Incline.
The Board received and considered information including a comparison of the Highland Fund’s contractual fees and overall expenses with those of funds in the Data Provider peer group. The Trustees noted that the Highland Fund’s contractual advisory fee rate was above the Data Provider peer group median.
Total Expense Ratios: The Trustees further reviewed and considered the total net expense ratio of 0.55% for the Highland Fund. The Trustees noted that the total net expense ratio for the Highland Fund was below the Data Provider peer group median total net expense ratio.
Comparable Accounts: The Trustees noted certain information provided by Chatham and Incline regarding fees charged to its other clients utilizing a strategy similar to that employed by the portion of the Highland Fund for which such entity was responsible.
Profitability: The Trustees received and considered retrospective and projected profitability analyses prepared by Highland, Chatham, and Incline based on the fees payable under the Highland Investment Advisory Agreement and each Highland Sub-Advisory Agreement, with respect to the Highland Fund. The Trustees considered the profits, if any, anticipated to be realized by Highland, Chatham, and Incline in connection with the operation of the Highland Fund. The Board then reviewed Region’s Form 10-K for the fiscal year ended December 31, 2018 and the financial information provided by Chatham and Incline in order to analyze the financial condition and stability and profitability of Highland, Chatham, and Incline.
Economies of Scale: The Trustees considered whether economies of scale in the provision of services to the Highland Fund will be passed along to the shareholders under the agreements.
38
| Highland Resolute Fund | Disclosure Regarding Approval of Fund Advisory Agreements |
April 30, 2020 (Unaudited)
Other Benefits to the Adviser: The Trustees reviewed and considered any other incidental benefits derived or to be derived by Highland from its relationship with the Highland Fund, including whether soft dollar arrangements were used.
In renewing Highland as the investment adviser of the Highland Fund, and Chatham and Incline as sub-advisers of the Highland Fund, and the fees charged under the Investment Advisory and Sub-Advisory Agreements, the Trustees concluded that no single factor reviewed by the Trustees was identified by the Trustees to be determinative as the principal factor in whether to renew the Investment Advisory and Sub-Advisory Agreements. Further, the Independent Trustees were advised by separate independent legal counsel throughout the process. The Trustees, including all of the Independent Trustees, concluded that:
| ● | the nature, extent, and quality of services rendered by Highland, Chatham, and Incline under the Highland Investment Advisory Agreement and Highland Sub-Advisory Agreements, respectively, with respect to the Highland Fund were adequate; |
| ● | the performance of the Highland Fund was above its Data Provider peer group median for the 3-month, 1-year, 3-year, and 5-year periods ended December 31, 2019; |
| ● | the Highland Fund’s contractual advisory fee rate was above the Data Provider peer group median; |
| ● | Chatham’s and Incline’s fees under their respective sub-advisory agreements are paid directly by Highland; |
| ● | the total net expense ratio for the Highland Fund was below the Data Provider peer group median total net expense ratio; |
| ● | bearing in mind the limitations of comparing different types of managed accounts and the different levels of service typically associated with such accounts, the fee structures applicable to Chatham’s and Incline’s other clients employing a comparable strategy to the Highland Fund were not indicative of any unreasonableness with respect to the sub-advisory fees payable by Highland; |
| ● | the profit, if any, realized by Highland, Chatham, and Incline in connection with the operation of the Highland Fund is not unreasonable to the Fund; and |
| ● | there were no material economies of scale or other incidental benefits accruing to Highland, Chatham, and Incline in connection with their relationship with the Highland Fund. |
Based on the Trustees’ deliberations and their evaluation of the information described above, the Trustees, including all of the Independent Trustees, concluded that Highland’s, Chatham’s, and Incline’s compensation for investment advisory and sub-advisory services is consistent with the best interests of the Highland Fund and its shareholders.
| Annual Report | April 30, 2020 | 39 |
| Highland Resolute Fund | Liquidity Risk Management Program |
April 30, 2020 (Unaudited)
The Financial Investors Trust (the “Trust”) has established a liquidity risk management program (the “Program”) to govern the Trust’s approach to managing liquidity risk for each fund in the Trust (each a “Fund”). The Program is overseen by the Liquidity Committee (the “Committee”), a committee comprised of representatives of the Trust’s investment advisers, sub-advisers, and Officers of the Trust. The Trust’s Board of Trustees (the “Board”) has approved the designation of the Committee to oversee the Program.
The Program’s principal objectives include supporting each Fund’s compliance with limits on investments in illiquid assets and mitigating the risk that a Fund will be unable to meet its redemption obligations in a timely manner. The Program also includes a number of elements that support the management and assessment of liquidity risk, including a periodic assessment of factors that influence a Fund’s liquidity and the periodic classification and re-classification of the Fund’s investments into groupings that reflect the Committee’s assessment of their relative liquidity under current market conditions.
At a meeting of the Board held on March 10, 2020, the Trustees received a report from the Committee regarding the design and operational effectiveness of the Program since its implementation on December 1, 2018. The Committee determined, and reported to the Board, that the Program is reasonably designed to assess and manage each Fund’s liquidity risk and has operated adequately and effectively to manage each Fund’s liquidity risk since implementation.
The Committee reported that during the period covered by the report, there were no liquidity events that impacted the Funds or their ability to timely meet redemptions without dilution to existing shareholders. Among other things, the Board noted that the Funds are not required to have a highly liquid investment minimum based on their liquidity classifications. The Board further noted that no material changes have been made to the Program since its implementation.
40
| Highland Resolute Fund | Trustees & Officers |
April 30, 2020 (Unaudited)
Additional information regarding the Fund’s trustees is included in the Statement of Additional Information, which can be obtained without charge by calling 855-268-2242.
| INDEPENDENT TRUSTEES | | | | |
| Name, Address* & Year of Birth | Position(s) Held with Fund | Term of Office** and Length of Time Served | Principal Occupation(s) During Past 5 Years*** | Number of Funds in Fund Complex Overseen by Trustee**** | Other Directorships Held by Trustee During Past 5 Years*** |
| Mary K. Anstine, 1940 | Trustee and Chairman | Ms. Anstine was elected at a special meeting of shareholders held on March 21, 1997 and re-elected at a special meeting of shareholders held on August 7, 2009. Ms. Anstine was appointed Chairman of the Board at the June 6, 2017 meeting of the Board of Trustees. | Ms. Anstine was formerly an Executive Vice President of First Interstate Bank of Denver until 1994, President/Chief Executive Officer of HealthONE Alliance, Denver, Colorado, from 1994 to 2004, and has been retired since 2004. Ms. Anstine is also Trustee/Director of AV Hunter Trust and Colorado Uplift Board. Ms. Anstine was formerly a Director of the Trust Bank of Colorado (later purchased and now known as Northern Trust Bank), HealthONE and Denver Area Council of the Boy Scouts of America, and a member of the American Bankers Association Trust Executive Committee. | 31 | Ms. Anstine is a Trustee of ALPS ETF Trust (16 funds); ALPS Variable Investment Trust (7 funds); Reaves Utility Income Fund (1 fund); and Segall Bryant & Hamill Trust (16 funds). |
| Jeremy W. Deems, 1976 | Trustee | Mr. Deems was appointed as a Trustee at the March 11, 2008 meeting of the Board of Trustees and elected at a special meeting of shareholders held on August 7, 2009. | Mr. Deems is the Co-Founder, Chief Operations Officer and Chief Financial Officer of Green Alpha Advisors, LLC, a registered investment advisor, and Co-Portfolio Manager of the Shelton Green Alpha Fund. Prior to joining Green Alpha Advisors, Mr. Deems was CFO and Treasurer of Forward Management, LLC, ReFlow Management Co., LLC, ReFlow Fund, LLC, a private investment fund, and Sutton Place Management, LLC, an administrative services company, from 1998 to June 2007. From 2004 to 2005, Mr. Deems also served as Treasurer of the Forward Funds and the Sierra Club Funds. | 31 | Mr. Deems is a Trustee of ALPS ETF Trust (16 funds); ALPS Variable Investment Trust (7 funds); Clough Funds Trust (1 fund); and Reaves Utility Income Fund (1 fund). |
| Annual Report | April 30, 2020 | 41 |
| Highland Resolute Fund | Trustees & Officers |
April 30, 2020 (Unaudited)
| INDEPENDENT TRUSTEES | | | | |
| Name, Address* & Year of Birth | Position(s) Held with Fund | Term of Office** and Length of Time Served | Principal Occupation(s) During Past 5 Years*** | Number of Funds in Fund Complex Overseen by Trustee**** | Other Directorships Held by Trustee During Past 5 Years*** |
| Jerry G. Rutledge, 1944 | Trustee | Mr. Rutledge was elected at a special meeting of shareholders held on August 7, 2009. | Mr. Rutledge is the President and owner of Rutledge’s Inc., a retail clothing business. Mr. Rutledge is currently Director of the American National Bank. He was from 1994 to 2007 a Regent of the University of Colorado. | 31 | Mr. Rutledge is a Trustee of Clough Global Dividend and Income Fund (1 fund); Clough Global Equity Fund (1 fund); Clough Global Opportunities Fund (1 fund); and Principal Real Estate Income Fund (1 fund). |
| Michael “Ross” Shell, 1970 | Trustee | Mr. Shell was elected at a special meeting of shareholders held on August 7, 2009. | Mr. Shell is Founder and CEO of Red Idea, LLC, a strategic consulting/early stage venture firm (since June 2008). From 1999 to 2009, he was a part-owner and Director of Tesser, Inc., a brand agency. From December 2005 to May 2008, he was Director, Marketing and Investor Relations, of Woodbourne, a REIT/real estate hedge fund and private equity firm. Prior to this, from May 2004 to November 2005, he worked as a business strategy consultant; from June 2003 to April 2004, he was on the Global Client Services team of IDEO, a product design/innovation firm; and from 1999 to 2003, he was President of Tesser, Inc. Mr. Shell graduated with honors from Stanford University with a degree in Political Science. | 31 | None. |
42
| Highland Resolute Fund | Trustees & Officers |
April 30, 2020 (Unaudited)
| INTERESTED TRUSTEE |
| Name, Address* & Year of Birth | Position(s) Held with Fund | Term of Office** and Length of Time Served | Principal Occupation(s) During Past 5 Years*** | Number of Funds in Fund Complex Overseen by Trustee**** | Other Directorships Held by Trustee During Past 5 Years*** |
| Edmund J. Burke, 1961 | Trustee | Mr. Burke was elected as Trustee at a special meeting of shareholders held on August 7, 2009. | Mr. Burke joined ALPS in 1991 and served as the President and Director of ALPS Holdings, Inc., and ALPS Advisors, Inc., and Director of ALPS Distributors, Inc., ALPS Fund Services, Inc. (“ALPS”), and ALPS Portfolio Solutions Distributor, Inc. (collectively, the “ALPS Companies”). Mr. Burke retired from the ALPS Companies in June 2019. Mr. Burke is deemed an interested Trustee by virtue of his prior positions with the ALPS Companies. | 31 | Mr. Burke is a Trustee of ALPS ETF Trust (16 funds); Clough Global Dividend and Income Fund (1 fund); Clough Global Equity Fund (1 fund); Clough Global Opportunities Fund (1 fund); Clough Funds Trust (1 fund); Liberty All-Star Equity Fund (1 fund); and Director of the Liberty All-Star Growth Fund, Inc. (1 fund). |
| Annual Report | April 30, 2020 | 43 |
| Highland Resolute Fund | Trustees & Officers |
April 30, 2020 (Unaudited)
| OFFICERS | | | |
| Name, Address* & Year of Birth | Position(s) Held with Fund | Term of Office** and Length of Time Served | Principal Occupation(s) During Past 5 Years*** |
| Bradley J. Swenson, 1972 | President | Mr. Swenson was elected President of the Trust at the June 11 – 12, 2019 meeting of the Board of Trustees. | Mr. Swenson joined ALPS in 2004 and has served as its President since June 2019. In this role, he serves as an officer to certain other closed-end and open-end investment companies. He previously served as the Chief Operating Officer of ALPS (2015-2019). Mr. Swenson also previously served as Chief Compliance Officer to ALPS, its affiliated entities, and to certain ETF, closed-end and open-end investment companies (2004-2015). Because of his position with ALPS, Mr. Swenson is deemed an affiliate of the Trust as defined under the 1940 Act. |
| Kimberly R. Storms, 1972 | Treasurer | Ms. Storms was elected Treasurer of the Trust at the March 12, 2013 meeting of the Board of Trustees. | Ms. Storms is Senior Vice President - Director of Fund Administration of ALPS. Because of her position with ALPS, Ms. Storms is deemed an affiliate of the Trust as defined under the 1940 Act. Ms. Storms is also Treasurer of ALPS Series Trust. Ms. Storms also serves as a Board member and Treasurer of The Center for Trauma & Resilience, a nonprofit agency. |
| Karen S. Gilomen, 1970 | Secretary | Ms. Gilomen was elected Secretary of the Trust at the December 13, 2016 meeting of the Board of Trustees. | Ms. Gilomen joined ALPS in August 2016 as Vice President and Senior Counsel. Prior to joining ALPS, Ms. Gilomen was Vice President - General Counsel & CCO of Monticello Associates, Inc. from 2010 to 2016. Because of her position with ALPS, Ms. Gilomen is deemed an affiliate of the Trust, as defined under the 1940 Act. Ms. Gilomen is also the Secretary of ALPS Variable Investment Trust and Reaves Utility Income Fund, and the Assistant Secretary of the WesMark Funds. |
| Ted Uhl, 1974 | Chief Compliance Officer (“CCO”) | Mr. Uhl was appointed CCO of the Trust at the June 8, 2010 meeting of the Board of Trustees. | Mr. Uhl joined ALPS in October 2006, and is currently Deputy Compliance Officer of ALPS. Prior to his current role, Mr. Uhl served as Senior Risk Manager for ALPS from October 2006 until June 2010. Before joining ALPS, Mr. Uhl served a Sr. Analyst with Enenbach and Associates (RIA), and a Sr. Financial Analyst at Sprint. Because of his position with ALPS, Mr. Uhl is deemed an affiliate of the Trust as defined under the 1940 Act. Mr. Uhl is also CCO of the Boulder Growth & Income Fund, Inc., Centre Funds, Index Funds, Reality Shares ETF Trust, Reaves Utility Income Fund and XAI Octagon Floating Rate & Alternative Income Term Trust. |
| Jennell Panella, 1974 | Assistant Treasurer | Ms. Panella was elected Assistant Treasurer of the Trust at the September 15, 2015 meeting of the Board of Trustees | Ms. Panella joined ALPS in June 2012 and is currently Fund Controller of ALPS Fund Services, Inc. Prior to joining ALPS, Ms. Panella served as Financial Reporting Manager for Parker Global Strategies, LLC (2009-2012). Because of her position with ALPS, Ms. Panella is deemed an affiliate of the Trust as defined under the 1940 Act. Ms. Panella also serves as Assistant Treasurer of James Advantage Funds. |
44
| Highland Resolute Fund | Trustees & Officers |
April 30, 2020 (Unaudited)
| OFFICERS | | | |
| Name, Address* & Year of Birth | Position(s) Held with Fund | Term of Office** and Length of Time Served | Principal Occupation(s) During Past 5 Years*** |
| Sharon Akselrod, 1974 | Assistant Secretary | Ms. Akselrod was elected Assistant Secretary of the Trust at the September 15, 2015 meeting of the Board of Trustees. | Ms. Akselrod joined ALPS in August 2014 and is currently Senior Investment Company Act Paralegal of ALPS Fund Services, Inc. Prior to joining ALPS, Ms. Akselrod served as Corporate Governance and Regulatory Associate for Nordstrom fsb (2013-2014) and Senior Legal Assistant – Legal Manager for AXA Equitable Life Insurance Company (2008-2013). Because of her position with ALPS, Ms. Akselrod is deemed an affiliate of the Trust as defined under the 1940 Act. Ms. Akselrod is also Secretary of Principal Real Estate Income Fund and Assistant Secretary of ALPS ETF Trust and Clough Funds Trust. |
| Jennifer Craig, 1973 | Assistant Secretary | Ms. Craig was elected Assistant Secretary of the Trust at the June 8, 2016 meeting of the Board of Trustees. | Ms. Craig joined ALPS in 2007 and is currently Assistant Vice President and Paralegal Manager of ALPS. Because of her position with ALPS, Ms. Craig is deemed an affiliate of the Trust as defined under the 1940 Act. Ms. Craig is also Assistant Secretary of Clough Global Dividend and Income Fund, Clough Global Equity Fund, Clough Global Opportunities Fund, Principal Real Estate Income Fund, Liberty All-Star Equity Fund and Liberty All-Star Growth Fund, Inc. |
| Sareena Khwaja-Dixon, 1980 | Assistant Secretary | Ms. Khwaja-Dixon was elected Assistant Secretary of the Trust at the December 12, 2017 meeting of the Board of Trustees. | Ms. Khwaja-Dixon joined ALPS in August 2015 and is currently Senior Counsel and Vice President of ALPS Fund Services, Inc. Prior to joining ALPS, Ms. Khwaja-Dixon served as a Senior Paralegal/Paralegal for Russell Investments (2011 – 2015). Because of her position with ALPS, Ms. Khwaja-Dixon is deemed an affiliate of the Trust as defined under the 1940 Act. Ms. Khwaja-Dixon is also Secretary of Liberty All-Star Equity Fund, Liberty All-Star Growth Fund, Inc., Clough Funds Trust, Clough Global Dividend and Income Fund, Clough Global Opportunities Fund, and Clough Global Equity Fund. |
| * | All communications to Trustees and Officers may be directed to Financial Investors Trust c/o 1290 Broadway, Suite 1000, Denver, CO 80203. |
| ** | This is the period for which the Trustee or Officer began serving the Trust. Each Trustee serves an indefinite term, until such Trustees successor is elected and appointed, or such Trustee resigns or is deceased. Officers are elected on an annual basis. |
| *** | Except as otherwise indicated, each individual has held the office shown or other offices in the same company for the last five years. |
| **** | The Fund Complex includes all series of the Trust, currently 31, and any other investment companies for which any Trustee serves as trustee for and for which Emerald Mutual Fund Advisers Trust provides investment advisory services (currently none). |
| Annual Report | April 30, 2020 | 45 |
| Highland Resolute Fund | Privacy Policy |
April 30, 2020 (Unaudited)
| Who We Are | |
| Who is providing this notice? | Highland Resolute Fund |
| What We Do | |
| How does the Fund protect my personal information? | To protect your personal information from unauthorized access and use, we use security measures that comply with federal law. These measures include computer safeguards and secured files and buildings. |
| How does the Fund collect my personal information? | We collect your personal information, for example, when you • open an account • provide account information or give us your contact information • make a wire transfer or deposit money |
| Why can't I limit all sharing? | Federal law gives you the right to limit only • sharing for affiliates’ everyday business purposes-information about your creditworthiness • affiliates from using your information to market to you • sharing for non-affiliates to market to you State laws and individual companies may give you additional rights to limit sharing. |
| Definitions | |
| Affiliates | Companies related by common ownership or control. They can be financial and nonfinancial companies. |
| Non-affiliates | Companies not related by common ownership or control. They can be financial and nonfinancial companies. • The Fund does not share with non-affiliates so they can market to you. |
| Joint marketing | A formal agreement between non-affiliated financial companies that together market financial products or services to you. • The Fund does not jointly market. |
| Other Important Information | |
| California Residents | If your account has a California home address, your personal information will not be disclosed to nonaffiliated third parties except as permitted by applicable California law, and we will limit sharing such personal information with our affiliates to comply with California privacy laws that apply to us. |
| Vermont Residents | The State of Vermont requires financial institutions to obtain your consent prior to sharing personal information that they collect about you with affiliated companies and nonaffiliated third parties other than in certain limited circumstances. Except as permitted by law, we will not share personal information we collect about you with nonaffiliated third parties or other affiliated companies unless you provide us with your written consent to share such information. |
46
| Highland Resolute Fund | Privacy Policy |
April 30, 2020 (Unaudited)
| FACTS | WHAT DOES THE FUND DO WITH YOUR PERSONAL INFORMATION? |
| Why? | Financial companies choose how they share your personal information. Federal law gives consumers the right to limit some but not all sharing. Federal law also requires us to tell you how we collect, share, and protect your personal information. Please read this notice carefully to understand what we do. |
| What? | The types of personal information we collect and share depend on the product or service you have with us. This information can include: • Social Security number and account transactions • Account balances and transaction history • Wire transfer instructions |
| How? | All financial companies need to share customers’ personal information to run their everyday business. In the section below, we list the reasons financial companies can share their customers’ personal information; the reasons the Fund chooses to share; and whether you can limit this sharing. |
| Reasons we can share your personal information | Does the Fund share: | Can you limit this sharing? |
| For our everyday business purposes — such as to process your transactions, maintain your account(s), respond to court orders and legal investigations, or report to credit bureaus | Yes | No |
| For our marketing purposes — to offer our products and services to you | No | We do not share. |
| For joint marketing with other financial companies | No | We do not share. |
| For our affiliates’ everyday business purposes — information about your transactions and experiences | Yes | No |
| For our affiliates’ everyday business purposes — information about your creditworthiness | No | We do not share. |
| For nonaffiliates to market to you | No | We do not share. |
| Annual Report | April 30, 2020 | 47 |

 | TABLE OF CONTENTS |
| Shareholder Letter | 1 |
| Performance Update | 3 |
| Disclosure of Fund Expenses | 9 |
| Portfolio of Investments | |
| Rondure New World Fund | 10 |
| Rondure Overseas Fund | 13 |
| Statements of Assets and Liabilities | 16 |
| Statements of Operations | 17 |
| Statement of Changes in Net Assets | |
| Rondure New World Fund | 18 |
| Rondure Overseas Fund | 19 |
| Financial Highlights | |
| Rondure New World Fund | 20 |
| Rondure Overseas Fund | 22 |
| Notes to Financial Statements | 24 |
| Report of Independent Registered Public Accounting Firm | 31 |
| Additional Information | 32 |
| Disclosure Regarding Approval of Fund Advisory Agreement | 33 |
| Liquidity Risk Management Program | 35 |
| Trustees and Officers | 36 |
| Privacy Policy | 41 |
Beginning on January 1, 2021, as permitted by regulations adopted by the U.S. Securities and Exchange Commission, paper copies of the Fund’s annual and semi-annual shareholder reports will no longer be sent by mail, unless you specifically request paper copies of the reports. Instead, the reports will be made available on the Funds’ website at www.rondureglobal.com and you will be notified by mail each time a report is posted and provided with a website link to access the report.
You may, notwithstanding the availability of shareholder reports online, elect to receive all future shareholder reports in paper free of charge. If you invest through a financial intermediary, you can contact your financial intermediary to request that you continue to receive paper copies of your shareholder reports. If you invest directly with the Funds, you can call 1.855.775.3337 to let the Funds know you wish to continue receiving paper copies of your shareholder reports.
If you already elected to receive shareholder reports electronically, you will not be affected by this change and you need not take any action. You may elect to receive shareholder reports and other communications from the Funds electronically anytime by contacting your financial intermediary (such as a broker-dealer or bank) or, if you are a direct investor, by enrolling at www.rondureglobal.com.
| Rondure Funds | Shareholder Letter |
| | April 30, 2020 (Unaudited) |
Dear Fellow Shareholders,
The first quarter of 2020 was marked by a fierce and sudden rush for liquidity in global capital markets, specifically in U.S. dollars. No asset class was immune, with even traditional havens like gold and utilities yielding to the selling pressure. It began calmly, with equity markets in the G7 nations pricing in a continuation of the previous year’s robust consumer spending and job creation in the United States and beyond. But the mood soon darkened. Over the course of the quarter, it became clear that the COVID-19 crisis, which initially took hold in China, was far more than an isolated East Asian phenomenon. The spread of the virus worsened in the early weeks of the year until it had devolved into a full-fledged global pandemic.
Policymakers worldwide took a series of previously unthinkable actions to curb its spread, mandating business closures, travel restrictions, and shelter-in-place orders that remain in effect as of the date of this report throughout much of the world. The combined impact of these restrictions brought the global economy to a sudden, screeching halt. Adding to the economic dislocation was an historic drop in WTI crude oil prices to around $20 per barrel. Central banks around the world undertook a series of emergency capital injections and rate cuts in a desperate attempt to keep capital markets from freezing up.
A few data points underscore the magnitude of what transpired in a single quarter’s time. Consider the real economy. Air traffic in Europe declined by 88%, or 5.2 million fewer daily travelers, in the last week of March versus the prior year. In Italy, one of the hardest hit nations, the drop in flight traffic was a staggering 98% year-on-year.1 Industrial output in China fell by roughly 40% over the same period.2 U.S. unemployment claims during the final two weeks of March totaled 9.9 million. The surge in joblessness is totally without precedent in U.S. history, vastly eclipsing anything experienced in the depths of the 2008 financial crisis or the Great Depression. Equity benchmarks around the world followed suit. During the quarter, the MSCI World benchmark (Net) collapsed by 21.05%.3
Without question, the defining theme for the year was the cascading fallout from COVID-19 on global economies. Exceedingly few common stocks around the world emerged unscathed. Yet some securities, sectors, and countries fared better than others, and in April we saw a somewhat surprisingly strong rebound in stock markets despite a very uncertain global economic outlook.
Fund Performance & Attribution
For more in-depth analysis of each Fund, please see our website at www.rondureglobal.com.
Rondure Overseas: For the year, the Institutional share class returned -6.15% vs. -11.34% for the MSCI EAFE Index. The two large investment regions for the Fund are Western Europe and Japan. We outperformed nicely in Europe where we are underweight vs. the benchmark, and we actually delivered positive returns in Japan. The countries detracting from the Fund’s relative performance were Hong Kong, New Zealand, Netherlands, and the UK due to a few specific holdings that have been more directly impacted by COVID-19.
The Fund remained significantly overweight in the Consumer Staples sector, where we outperformed vs. the benchmark. The Fund benefited nicely from the lack of Financial holdings given the weakness of that sector. On the flip side, we missed out by being underweight Technology, which was the strongest sector for the year. Our weakest sector performance was in Consumer Discretionary, which was hit particularly hard by COVID-19. Our underweight in Health Care was also a detractor to relative performance.
Rondure New World: For the year, the Institutional share class returned -7.31% vs. -11.65% for the MSCI Emerging Markets Index. The Pacific Rim is by far the largest weight for the benchmark and the Fund. We outperformed vs. the benchmark in this region, which was the greatest contributor to our relative outperformance. Our performance vs. the benchmark was solid across regions, with our stock selections outpacing the benchmark in every region. We did have a few countries where specific picks led to relative underperformance, such as South Korea and Russia.
The Fund remained significantly overweight in the Consumer sector, where we outperformed vs. the benchmark. The Fund really benefited from the lack of Financial holdings, as this sector was down over 24% in the benchmark. On the flip side, we missed out by being underweight Technology. Our weakest stock picking came in Real Estate and Industrials, as this sector made up less than 10% of the Fund’s holdings.
Past performance is no guarantee of future results.
Parting Thoughts and Market Outlook
Taking a step back from relative performance, this was a difficult year by any measure. At the heart of the sell-off is a health-related issue, making the events of the last several months a uniquely human tragedy. It goes beyond capital markets. Our deepest sympathies at Rondure Global
| Annual Report | April 30, 2020 | 1 |
| Rondure Funds | Shareholder Letter |
| | April 30, 2020 (Unaudited) |
Advisors go out to all those affected by COVID-19 and the ensuing economic fallout. We wish a speedy recovery and return to health and prosperity for all involved, wherever they are around the world.
As an investment firm, we take our mandate to protect client capital seriously. We came into the year relatively well positioned for a downside event of some kind, which drove our large overweight position in Consumer Staples and underweight to Financial Services and Energy. Avoiding downside risk is paramount to our investment process. As a result, we were braced, in terms of our security selection and weighting, for a slowdown in the global economy. We did not (and could not) have envisioned a bear market precisely like this one, given its almost totally unprecedented nature. Moreover, as long-only equity investors, there were almost no places to hide during the meltdown in equities. The velocity of the flight to safety to cash, and cash alone, was far too swift and too narrow for equities as a class to offer shelter.
Looking forward, from an investment viewpoint, we see a silver lining to the sell-off: These kinds of panics give us a rare opportunity to grow our stakes in what we feel are the very best businesses in the world—the crème de la crème. The bull market of the last decade has afforded relatively few chances to buy what we see as truly exemplary businesses (or what we at Rondure call “Quality Compounders”) at attractive prices. The first quarter sell-off afforded us some of those shots. We took them enthusiastically.
Some clients have asked us our time horizon for when COVID-19 will be behind us and equity markets will return to their previous levels. We look at the issue slightly differently. As we like to say, while we can’t tell time, we can tell price. We believe we have a fairly good sense of when our favorite stocks are truly well-priced for long-term returns. Our focus is to follow the price of our very favorite securities closely, looking for opportunities to accrue. We will continue to hew to companies that have a history of all-weather balance sheets, stable free cash flow, and reliable growing earnings and dividend streams. Our experience has shown that companies that fit that profile have historically been best positioned for long-term compounding.
Sincerely,
Laura Geritz, CFA
Founder, CEO, and Portfolio Manager
Blake Clayton, DPhil
Portfolio Manager
| 1 | Reuters, “Airlines facing what official calls ‘deepest crisis ever.’” 1 April 2020. Accessed at https://www.nasdaq.com/articles/airlines-facing-what-official-calls-deepest-crisis-ever-2020-04-01. |
| 2 | Reuters, “5 charts that show the global economic impact of coronavirus.” 30 March 2020. Accessed at https://www.weforum.org/agenda/2020/03/take-five-quarter-life-crisis/. |
| 3 | Data provided by Bloomberg. |
The CFA designation is owned by the CFA institute.
The objective of all Rondure Funds is long-term growth of capital.
RISKS: Mutual fund investing involves risks and loss of principal is possible. Investing in small and micro-cap funds will be more volatile and loss of principal could be greater than investing in large cap or more diversified funds. Investing in foreign securities entails special risks, such as currency fluctuations and political uncertainties, which are described in more detail in the prospectus. Investments in emerging markets are subject to the same risks as other foreign securities and may be subject to greater risks than investments in foreign countries with more established economies and securities markets.
Must be preceded or accompanied by a prospectus.
The views and information discussed in this commentary are as of the date of publication, are subject to change, and may not reflect the writer's current views. The views expressed represent an assessment of market conditions at a specific point in time, are opinions only and should not be relied upon as investment advice regarding a particular investment or markets in general. Such information does not constitute a recommendation to buy or sell specific securities or investment vehicles. It should not be assumed that any investment will be profitable or will equal the performance of the Funds or any securities or any sectors mentioned herein. The subject matter contained herein has been derived from several sources believed to be reliable and accurate at the time of compilation. The Funds do not accept any liability for losses either direct or consequential caused by the use of this information.
Past performance does not guarantee future results.
The Rondure Funds are distributed by ALPS Distributors Inc. (ADI). ADI is not affiliated with Rondure Global Advisors.
| 2 | 1.855.775.3337 | www.rondureglobal.com |
| Rondure New World Fund | Performance Update |
| | April 30, 2020 (Unaudited) |
Annualized Total Return Performance for the periods ended April 30, 2020
| | | | | | Expense Ratio(b) |
| | 6 Months | 1 Year | 3 Year | Since Inception(a) | Gross | Net(c) |
| Rondure New World Fund – Institutional (RNWIX) | -12.27% | -7.31% | 0.43% | 0.43% | 1.46% | 1.10% |
| Rondure New World Fund – Investor (RNWOX) | -12.44% | -7.56% | 0.17% | 0.17% | 1.76% | 1.35% |
| MSCI Emerging Markets Index(d) | -10.39% | -11.65% | 0.88% | 0.88% | | |
Performance data quoted represents past performance. Past performance does not guarantee future results. Investment return and principal value of an investment will fluctuate so that an investor’s shares, when sold or redeemed, may be worth more or less than the original cost. The Fund imposes a 2.00% redemption fee on shares held for less than 60 days. Current performance data may be higher or lower than actual data quoted. For the most current month-end performance data, please call 1-855-775-3337.
The table does not reflect the deduction of taxes a shareholder would pay on Fund distributions or redemption of Fund shares.
Subject to investment risks, including possible loss of the principal amount invested.
Returns for periods less than 1 year are cumulative.
| (a) | Fund inception date of May 1, 2017. |
| (b) | Ratios as of the Prospectus dated August 31, 2019 and may differ from the ratios presented in the Financial Highlights. |
| (c) | Rondure Global Advisors, LLC (the “Advisor”), has agreed to waive and/or reimburse fees or expenses in order to limit Total Annual Fund Operating Expenses After Fee Waiver/ Expense Reimbursement (excluding acquired fund fees and expenses, brokerage expenses, interest expenses, taxes and extraordinary expenses) to 1.35% and 1.10% of the Fund’s average daily net assets for the Fund’s Investor Class Shares and Institutional Class Shares, respectively. This agreement (the “Expense Agreement”) is in effect through August 31, 2020. The Advisor will be permitted to recover, on a class-by-class basis, expenses it has borne through the Expense Agreement to the extent that a Fund’s expenses in later periods fall below the expense cap in effect at the time of waiver or reimbursement. However, such recapture payments may not cause the Fund’s expense ratio (after recapture) to exceed the lesser of (i) the expense cap in effect at the time of the waiver and (ii) the expense cap in effect at the time of the recapture. Notwithstanding the foregoing, the Fund will not be obligated to pay any such deferred fees and expenses more than three years after the date of the waiver or reimbursement. The Expense Agreement may not be terminated or modified by the Advisor prior to August 31, 2020, except with the approval of the Fund’s Board of Trustees. |
| (d) | The MSCI Emerging Markets Index is an unmanaged total return index, reported in U.S. Dollars, based on share prices and reinvested dividends of approximately 800 companies from 24 emerging market countries. The Index is not actively managed and does not reflect any deductions for fees, expense, or taxes. An investor may not invest directly in the Index. |
| Annual Report | April 30, 2020 | 3 |
| Rondure New World Fund | Performance Update |
| | April 30, 2020 (Unaudited) |
Growth of $10,000 for the period ended April 30, 2020
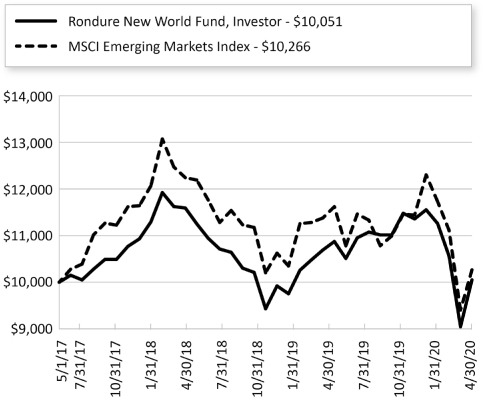
The chart shown above represent a hypothetical investment of $10,000 in the Fund’s Investor Class shares for the period from inception to April 30, 2020. All returns reflect reinvested dividends, but do not reflect the deduction of taxes that an investor would pay on distributions or redemptions.
Investing in the Fund is subject to investment risks, including possible loss of the principal amount invested.
The Fund also offers Institutional Class shares, performance for which is not reflected in the graphs above. The performance of Institutional Class shares may be higher or lower than the performance of the Investor Class shares shown in the graphs above based upon differences in fees paid by shareholders investing in the Investor Class shares and Institutional Class shares.
| 4 | 1.855.775.3337 | www.rondureglobal.com |
| Rondure New World Fund | Performance Update |
| | April 30, 2020 (Unaudited) |
| Regional Allocation (as a % of Net Assets)* | |
| Asia ex Japan | 76.6% |
| North America | 8.1% |
| Africa/Middle East | 6.7% |
| Europe | 4.4% |
| Latin America | 4.2% |
| Cash, Cash Equivalents, & Other Net Assets | 0.0% |
| Total | 100.0% |
| Industry Sector Allocation (as a % of Net Assets)* | |
| Consumer | 61.9% |
| Technology | 15.5% |
| Financials | 7.2% |
| Industrials | 6.5% |
| Energy & Materials | 4.6% |
| Health Care | 4.3% |
| Cash, Cash Equivalents, & Other Net Assets | 0.0% |
| Total | 100.0% |
| Top 10 Holdings (as a % of Net Assets)* | |
| Taiwan Semiconductor Manufacturing Co., Ltd. | 4.8% |
| Li Ning Co., Ltd. | 3.6% |
| Yum China Holdings, Inc. | 3.5% |
| Philippine Seven Corp. | 3.0% |
| TOA Paint Thailand PCL | 2.8% |
| Safaricom PLC | 2.7% |
| Carlsberg Brewery Malaysia Bhd | 2.6% |
| Wal-Mart de Mexico SAB de CV | 2.5% |
| Tata Consultancy Services, Ltd. | 2.4% |
| Heineken Malaysia Bhd | 2.4% |
| Total | 30.3% |
| * | Holdings are subject to change, and may not reflect the current or future position of the portfolio. |
| Annual Report | April 30, 2020 | 5 |
| Rondure Overseas Fund | Performance Update |
| | April 30, 2020 (Unaudited) |
Annualized Total Return Performance for the periods ended April 30, 2020
| | | | | | Expense Ratio(b) |
| | 6 Months | 1 Year | 3 Year | Since Inception(a) | Gross | Net(c) |
| Rondure Overseas Fund – Institutional (ROSIX) | -10.35% | -6.15%(d) | 2.23% | 2.23% | 1.72% | 0.85% |
| Rondure Overseas Fund – Investor (ROSOX) | -10.39% | -6.20%(d) | 2.03% | 2.03% | 2.04% | 1.10% |
| MSCI EAFE Index(e) | -14.21% | -11.34% | -0.68% | -0.68% | | |
Performance data quoted represents past performance. Past performance does not guarantee future results. Investment return and principal value of an investment will fluctuate so that an investor’s shares, when sold or redeemed, may be worth more or less than the original cost. The Fund imposes a 2.00% redemption fee on shares held for less than 60 days. Current performance data may be higher or lower than actual data quoted. For the most current month-end performance data, please call 1-855-775-3337.
The table does not reflect the deduction of taxes a shareholder would pay on Fund distributions or redemption of Fund shares.
Subject to investment risks, including possible loss of the principal amount invested.
Returns for periods less than 1 year are cumulative.
| (a) | Fund inception date of May 1, 2017. |
| (b) | Ratios as of the Prospectus dated August 31, 2019 and may differ from the ratios presented in the Financial Highlights. |
| (c) | Rondure Global Advisors, LLC (the “Advisor”), has agreed to waive and/or reimburse fees or expenses in order to limit Total Annual Fund Operating Expenses After Fee Waiver/ Expense Reimbursement (excluding acquired fund fees and expenses, brokerage expenses, interest expenses, taxes and extraordinary expenses) to 1.10% and 0.85% of the Fund’s average daily net assets for the Fund’s Investor Class Shares and Institutional Class Shares, respectively. This agreement (the “Expense Agreement”) is in effect through August 31, 2020. The Advisor will be permitted to recover, on a class-by-class basis, expenses it has borne through the Expense Agreement to the extent that a Fund’s expenses in later periods fall below the expense cap in effect at the time of waiver or reimbursement. However, such recapture payments may not cause the Fund’s expense ratio (after recapture) to exceed the lesser of (i) the expense cap in effect at the time of the waiver and (ii) the expense cap in effect at the time of the recapture. Notwithstanding the foregoing, the Fund will not be obligated to pay any such deferred fees and expenses more than three years after the date of the waiver or reimbursement. The Expense Agreement may not be terminated or modified by the Advisor prior to August 31, 2020, except with the approval of the Fund’s Board of Trustees. |
| (d) | Excludes adjustments in accordance with accounting principles generally accepted in the United States of America and as such, the net asset value and total return for shareholder transactions reported to the market may differ from the net asset value for financial reporting purposes. |
| (e) | The MSCI EAFE Index is an unmanaged total return index, reported in U.S. dollars, based on share prices and reinvested net dividends of approximately 1,100 companies from 22 developed market countries excluding the US and Canada. The Index is not actively managed and does not reflect any deductions for fees, expense, or taxes. An investor may not invest directly in the Index. |
| 6 | 1.855.775.3337 | www.rondureglobal.com |
| Rondure Overseas Fund | Performance Update |
| | April 30, 2020 (Unaudited) |
Growth of $10,000 for the period ended April 30, 2020
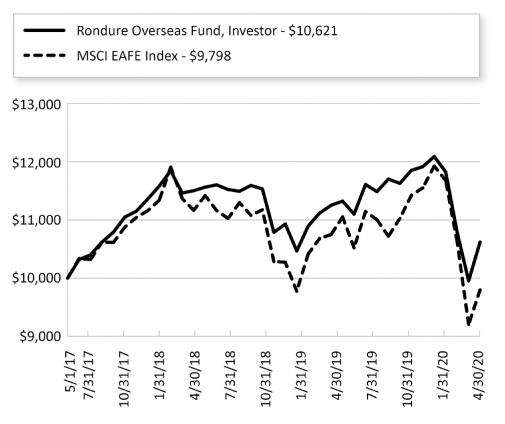
The chart shown above represent a hypothetical investment of $10,000 in the Fund’s Investor Class shares for the period from inception to April 30, 2020. All returns reflect reinvested dividends, but do not reflect the deduction of taxes that an investor would pay on distributions or redemptions.
Investing in the Fund is subject to investment risks, including possible loss of the principal amount invested.
The Fund also offers Institutional Class shares, performance for which is not reflected in the graphs above. The performance of Institutional Class shares may be higher or lower than the performance of the Investor Class shares shown in the graphs above based upon differences in fees paid by shareholders investing in the Investor Class shares and Institutional Class shares.
| Annual Report | April 30, 2020 | 7 |
| Rondure Overseas Fund | Performance Update |
| | April 30, 2020 (Unaudited) |
| Regional Allocation (as a % of Net Assets)* | |
| Europe | 57.0% |
| Japan | 19.9% |
| North America | 11.5% |
| Australia/New Zealand | 7.4% |
| Asia ex Japan | 3.3% |
| Cash, Cash Equivalents, & Other Net Assets | 0.9% |
| Total | 100.0% |
| Industry Sector Allocation (as a % of Net Assets)* | |
| Consumer | 57.3% |
| Technology | 12.4% |
| Industrials | 12.0% |
| Health Care | 6.5% |
| Financials | 5.3% |
| Energy & Materials | 5.1% |
| Financial | 0.5% |
| Cash, Cash Equivalents, & Other Net Assets | 0.9% |
| Total | 100.0% |
| Top 10 Holdings (as a % of Net Assets)* | |
| Nestle SA | 4.9% |
| Unilever NV | 4.3% |
| Danone SA | 4.1% |
| Chocoladefabriken Lindt & Spruengli AG | 2.9% |
| REA Group, Ltd. | 2.6% |
| Olvi Oyj | 2.4% |
| Diageo PLC | 2.3% |
| L'Oreal SA | 2.2% |
| Axfood AB | 2.2% |
| Ferrari NV | 2.1% |
| Total | 30.0% |
| * | Holdings are subject to change, and may not reflect the current or future position of the portfolio. |
| 8 | 1.855.775.3337 | www.rondureglobal.com |
| Rondure Funds | Disclosure of Fund Expenses |
| | April 30, 2020 (Unaudited) |
As a shareholder of a Fund, you incur two types of costs: (1) transaction costs, including sales charges (loads) on purchase payments, reinvested dividends, or other distributions; redemption fees; and exchange fees; and (2) ongoing costs, including management fees; distribution and/or service (12b-1) fees; and other Fund expenses. This example is intended to help you understand your ongoing costs (in dollars) of investing in the Fund and to compare these costs with the ongoing costs of investing in other mutual funds.
This example is based on an investment of $1,000 invested at the beginning of the period and held for the entire six-month period of November 1, 2019 through April 30, 2020.
Actual Expenses The first line of the table provides information about actual account values and actual expenses. You may use the information in this line, together with the amount you invested, to estimate the expenses that you paid over the period. Simply divide your account value by $1,000 (for example, an $8,600 account value divided by $1,000 = 8.6), then multiply the result by the number in the first line under the heading “Expenses Paid During Period” to estimate the expenses you paid on your account during this period.
Hypothetical Example for Comparison Purposes The second line of the table provides information about hypothetical account values and hypothetical expenses based on the Fund’s actual expense ratio and an assumed rate of return of 5% per year before expenses, which is not the Fund’s actual return. The hypothetical account values and expenses may not be used to estimate the actual ending account balance or expenses you paid for the period. You may use this information to compare the ongoing costs of investing in the Fund and other mutual funds. To do so, compare this 5% hypothetical example with the 5% hypothetical examples that appear in the shareholder reports of the other funds. Please note that the expenses shown in the table are meant to highlight your ongoing costs only and do not reflect any transactional costs, such as redemption fees or exchange fees. Therefore, the second line of the table is useful in comparing ongoing costs only and will not help you determine the relative total costs of owning different funds. In addition, if these transactional costs were included, your costs would have been higher.
| | Beginning Account Value November 1, 2019 | Ending Account Value April 30, 2020 | Expense Ratio(a) | Expenses Paid During Period November 1, 2019 - April 30, 2020(b) |
| Rondure New World Fund | | | | |
| Institutional Class | | | | |
| Actual | $ 1,000.00 | $ 877.30 | 1.10% | $ 5.13 |
| Hypothetical (5% return before expenses) | $ 1,000.00 | $ 1,019.39 | 1.10% | $ 5.52 |
| Investor Class | | | | |
| Actual | $ 1,000.00 | $ 875.60 | 1.35% | $ 6.30 |
| Hypothetical (5% return before expenses) | $ 1,000.00 | $ 1,018.15 | 1.35% | $ 6.77 |
| Rondure Overseas Fund | | | | |
| Institutional Class | | | | |
| Actual | $ 1,000.00 | $ 897.40 | 0.85% | $ 4.01 |
| Hypothetical (5% return before expenses) | $ 1,000.00 | $ 1,020.64 | 0.85% | $ 4.27 |
| Investor Class | | | | |
| Actual | $ 1,000.00 | $ 896.10 | 1.10% | $ 5.19 |
| Hypothetical (5% return before expenses) | $ 1,000.00 | $ 1,019.39 | 1.10% | $ 5.52 |
| (a) | The Fund's expense ratios have been annualized based on the Fund's most recent fiscal half-year expenses. |
| (b) | Expenses are equal to the Fund's annualized expense ratio multiplied by the average account value over the period, multiplied by the number of days in the most recent fiscal half-year (182)/366 (to reflect the half-year period). |
| Annual Report | April 30, 2020 | 9 |
| Rondure New World Fund | Portfolio of Investments |
| | April 30, 2020 |
| | | Shares | | | Value (Note 2) | |
| COMMON STOCKS (99.98%) | | | | | | | | |
| Bangladesh (0.63%) | | | | | | | | |
| Square Pharmaceuticals, Ltd. | | | 418,832 | | | $ | 858,473 | |
| | | | | | | | | |
| Brazil (3.35%) | | | | | | | | |
| Ambev SA | | | 402,200 | | | | 840,952 | |
| B3 SA - Brasil Bolsa Balcao | | | 252,400 | | | | 1,775,373 | |
| Hypera SA | | | 171,400 | | | | 917,533 | |
| Raia Drogasil SA | | | 44,700 | | | | 866,151 | |
| TOTVS SA | | | 18,200 | | | | 198,470 | |
| | | | | | | | 4,598,479 | |
| | | | | | | | | |
| China (16.74%) | | | | | | | | |
| Alibaba Group Holding, Ltd., Sponsored ADR(a) | | | 7,000 | | | | 1,418,690 | |
| ANTA Sports Products, Ltd. | | | 246,000 | | | | 2,076,840 | |
| China Resources Beer Holdings Co., Ltd. | | | 140,000 | | | | 667,269 | |
| Chongqing Brewery Co., Ltd., Class A(a) | | | 111,100 | | | | 857,657 | |
| Haier Electronics Group Co., Ltd. | | | 233,000 | | | | 641,670 | |
| Hengan International Group Co., Ltd. | | | 105,000 | | | | 936,569 | |
| Kweichow Moutai Co., Ltd., Class A | | | 4,400 | | | | 789,705 | |
| Li Ning Co., Ltd. | | | 1,552,000 | | | | 4,894,731 | |
| Shanghai International Airport Co., Ltd., Class A(a) | | | 136,700 | | | | 1,370,470 | |
| Sichuan Swellfun Co., Ltd.(a) | | | 153,900 | | | | 1,006,054 | |
| TravelSky Technology, Ltd., Class H | | | 409,000 | | | | 722,773 | |
| Tsingtao Brewery Co., Ltd., Class H | | | 381,000 | | | | 2,317,207 | |
| Want Want China Holdings, Ltd. | | | 590,000 | | | | 423,141 | |
| Yum China Holdings, Inc. | | | 99,600 | | | | 4,826,616 | |
| | | | | | | | 22,949,392 | |
| | | | | | | | | |
| Greece (1.40%) | | | | | | | | |
| JUMBO SA | | | 122,456 | | | | 1,917,631 | |
| | | | | | | | | |
| Hong Kong (3.88%) | | | | | | | | |
| Cafe de Coral Holdings, Ltd. | | | 214,000 | | | | 441,664 | |
| | | Shares | | | Value (Note 2) | |
| Hong Kong (continued) | | | | | | | | |
| Hong Kong Exchanges & Clearing, Ltd. | | | 67,000 | | | $ | 2,177,878 | |
| Vitasoy International Holdings, Ltd. | | | 750,000 | | | | 2,699,129 | |
| | | | | | | | 5,318,671 | |
| | | | | | | | | |
| India (12.82%) | | | | | | | | |
| 3M India, Ltd.(a) | | | 1,575 | | | | 406,889 | |
| Asian Paints, Ltd. | | | 68,244 | | | | 1,598,252 | |
| Britannia Industries, Ltd. | | | 14,622 | | | | 616,414 | |
| Castrol India, Ltd. | | | 423,000 | | | | 730,583 | |
| Colgate-Palmolive India, Ltd. | | | 46,704 | | | | 907,461 | |
| Dabur India, Ltd. | | | 180,000 | | | | 1,172,834 | |
| Divi's Laboratories, Ltd. | | | 13,500 | | | | 419,391 | |
| Dr Lal PathLabs, Ltd.(b)(c) | | | 18,000 | | | | 380,122 | |
| HCL Technologies, Ltd. | | | 95,500 | | | | 691,245 | |
| HDFC Bank, Ltd. | | | 64,000 | | | | 853,788 | |
| Hindustan Unilever, Ltd. | | | 25,135 | | | | 734,687 | |
| Honeywell Automation India, Ltd. | | | 355 | | | | 135,411 | |
| Jubilant Foodworks, Ltd. | | | 123,000 | | | | 2,634,603 | |
| Marico, Ltd. | | | 14,900 | | | | 56,945 | |
| Nestle India, Ltd. | | | 3,718 | | | | 887,460 | |
| Pidilite Industries, Ltd. | | | 6,385 | | | | 129,834 | |
| Schaeffler India, Ltd. | | | 23,500 | | | | 1,077,849 | |
| SKF India, Ltd. | | | 24,500 | | | | 484,046 | |
| Tata Consultancy Services, Ltd. | | | 123,500 | | | | 3,312,931 | |
| United Breweries, Ltd. | | | 27,500 | | | | 343,718 | |
| | | | | | | | 17,574,463 | |
| | | | | | | | | |
| Indonesia (4.94%) | | | | | | | | |
| Ace Hardware Indonesia Tbk PT | | | 17,144,800 | | | | 1,751,939 | |
| Indofood CBP Sukses Makmur Tbk PT | | | 4,105,200 | | | | 2,725,301 | |
| Multi Bintang Indonesia Tbk PT | | | 515,000 | | | | 379,109 | |
| Unilever Indonesia Tbk PT | | | 3,434,200 | | | | 1,910,454 | |
| | | | | | | | 6,766,803 | |
| | | | | | | | | |
| Kenya (2.67%) | | | | | | | | |
| Safaricom PLC | | | 13,781,600 | | | | 3,662,243 | |
| See Notes to Financial Statements. | |
| 10 | 1.855.775.3337 | www.rondureglobal.com |
| Rondure New World Fund | Portfolio of Investments |
| | April 30, 2020 |
| | | Shares | | | Value (Note 2) | |
| Malaysia (6.54%) | | | | | | | | |
| Carlsberg Brewery Malaysia Bhd | | | 558,000 | | | $ | 3,581,581 | |
| Hartalega Holdings Bhd | | | 776,000 | | | | 1,371,535 | |
| Heineken Malaysia Bhd | | | 588,000 | | | | 3,276,391 | |
| Top Glove Corp. Bhd | | | 432,000 | | | | 729,377 | |
| | | | | | | | 8,958,884 | |
| | | | | | | | | |
| Mexico (4.42%) | | | | | | | | |
| Becle SAB de CV | | | 1,769,600 | | | | 2,699,813 | |
| Wal-Mart de Mexico SAB de CV | | | 1,392,900 | | | | 3,361,893 | |
| | | | | | | | 6,061,706 | |
| | | | | | | | | |
| Pakistan (0.12%) | | | | | | | | |
| Nestle Pakistan, Ltd. | | | 4,578 | | | | 162,710 | |
| | | | | | | | | |
| Peru (0.81%) | | | | | | | | |
| Alicorp SAA | | | 236,846 | | | | 481,340 | |
| InRetail Peru Corp.(b)(c) | | | 20,196 | | | | 626,076 | |
| | | | | | | | 1,107,416 | |
| | | | | | | | | |
| Philippines (7.01%) | | | | | | | | |
| International Container Terminal Services, Inc. | | | 272,000 | | | | 483,460 | |
| Jollibee Foods Corp. | | | 247,000 | | | | 701,164 | |
| Philippine Seven Corp. | | | 1,678,447 | | | | 4,112,045 | |
| Puregold Price Club, Inc. | | | 1,288,000 | | | | 1,182,988 | |
| San Miguel Food and Beverage, Inc. | | | 1,278,390 | | | | 1,496,231 | |
| Wilcon Depot, Inc. | | | 5,601,500 | | | | 1,633,447 | |
| | | | | | | | 9,609,335 | |
| | | | | | | | | |
| Poland (1.05%) | | | | | | | | |
| AmRest Holdings SE(a) | | | 94,000 | | | | 619,673 | |
| Dino Polska SA(a)(b)(c) | | | 19,400 | | | | 816,439 | |
| | | | | | | | 1,436,112 | |
| | | | | | | | | |
| Russia (1.94%) | | | | | | | | |
| Moscow Exchange MICEX-RTS PJSC | | | 1,644,720 | | | | 2,664,394 | |
| | | | | | | | | |
| South Africa (1.84%) | | | | | | | | |
| Clicks Group, Ltd. | | | 115,400 | | | | 1,436,375 | |
| Distell Group Holdings, Ltd. | | | 69,900 | | | | 297,920 | |
| | | Shares | | | Value (Note 2) | |
| South Africa (continued) | | | | | | | | |
| Shoprite Holdings, Ltd. | | | 137,200 | | | $ | 792,978 | |
| | | | | | | | 2,527,273 | |
| | | | | | | | | |
| South Korea (2.91%) | | | | | | | | |
| LG Household & Health Care, Ltd. | | | 964 | | | | 1,096,561 | |
| S-1 Corp. | | | 13,800 | | | | 979,687 | |
| Samsung Electronics Co., Ltd. | | | 46,500 | | | | 1,908,162 | |
| | | | | | | | 3,984,410 | |
| | | | | | | | | |
| Sri Lanka (0.94%) | | | | | | | | |
| Lion Brewery Ceylon PLC | | | 472,256 | | | | 1,289,098 | |
| | | | | | | | | |
| Taiwan (9.25%) | | | | | | | | |
| President Chain Store Corp. | | | 284,000 | | | | 2,941,570 | |
| Taiwan FamilyMart Co., Ltd. | | | 274,000 | | | | 2,045,567 | |
| Taiwan Semiconductor Manufacturing Co., Ltd. | | | 640,000 | | | | 6,553,562 | |
| Uni-President Enterprises Corp. | | | 487,000 | | | | 1,138,214 | |
| | | | | | | | 12,678,913 | |
| | | | | | | | | |
| Tanzania (0.12%) | | | | | | | | |
| Tanzania Breweries, Ltd. | | | 34,234 | | | | 161,258 | |
| | | | | | | | | |
| Thailand (6.15%) | | | | | | | | |
| Airports of Thailand PCL | | | 721,000 | | | | 1,387,181 | |
| Bangkok Dusit Medical Services PCL | | | 1,987,000 | | | | 1,277,379 | |
| CP ALL PCL | | | 129,000 | | | | 283,078 | |
| Home Product Center PCL | | | 1,620,000 | | | | 680,946 | |
| MK Restaurants Group PCL | | | 559,000 | | | | 950,240 | |
| TOA Paint Thailand PCL | | | 3,321,000 | | | | 3,849,096 | |
| | | | | | | | 8,427,920 | |
| | | | | | | | | |
| Turkey (0.62%) | | | | | | | | |
| BIM Birlesik Magazalar AS | | | 107,600 | | | | 852,087 | |
| | | | | | | | | |
| United Arab Emirates (1.95%) | | | | | | | | |
| Aramex PJSC | | | 3,253,000 | | | | 2,674,560 | |
| | | | | | | | | |
| United States (3.65%) | | | | | | | | |
| Amazon.com, Inc.(a) | | | 30 | | | | 74,220 | |
| Apple, Inc. | | | 2,325 | | | | 683,085 | |
| See Notes to Financial Statements. | |
| Annual Report | April 30, 2020 | 11 |
| Rondure New World Fund | Portfolio of Investments |
| | April 30, 2020 |
| | | Shares | | | Value (Note 2) | |
| United States (continued) | | | | | | | | |
| Facebook, Inc., Class A(a) | | | 4,300 | | | $ | 880,253 | |
| Mastercard, Inc., Class A | | | 2,500 | | | | 687,425 | |
| Microsoft Corp. | | | 3,800 | | | | 680,998 | |
| Starbucks Corp. | | | 9,700 | | | | 744,281 | |
| Visa, Inc., Class A | | | 3,900 | | | | 697,008 | |
| Walmart, Inc. | | | 550 | | | | 66,853 | |
| The Walt Disney Co. | | | 4,475 | | | | 483,971 | |
| | | | | | | | 4,998,094 | |
| | | | | | | | | |
| Vietnam (4.23%) | | | | | | | | |
| Saigon Beer Alcohol Beverage Corp. | | | 64,520 | | | | 448,878 | |
| Vietnam Dairy Products JSC | | | 705,732 | | | | 2,982,093 | |
| Vincom Retail JSC | | | 2,403,065 | | | | 2,369,320 | |
| | | | | | | | 5,800,291 | |
| | | | | | | | | |
| TOTAL COMMON STOCKS | | | | | | | | |
| (Cost $137,640,272) | | | | | | | 137,040,616 | |
| | | | | | | | | |
| TOTAL INVESTMENTS (99.98%) | | | | | | | | |
| (Cost $137,640,272) | | | | | | $ | 137,040,616 | |
| | | | | | | | | |
| Other Assets In Excess Of Liabilities (0.02%) | | | | | | | 26,071 | |
| | | | | | | | | |
| NET ASSETS (100.00%) | | | | | | $ | 137,066,687 | |
| (a) | Non-Income Producing Security. |
| (b) | Security exempt from registration under Rule 144A of the Securities Act of 1933. These securities may be resold in the ordinary course of business in transactions exempt from registration, normally to qualified institutional buyers. As of April 30, 2020, these securities had a total aggregate market value of $1,822,637 representing 1.33% of net assets. |
| (c) | Security was purchased pursuant to Regulation S under the Securities Act of 1933, which exempts securities offered and sold outside of the United States from registration. Such security cannot be sold in the United States without either an effective registration statement filed pursuant to the Securities Act of 1933, or pursuant to an exemption from registration. As of April 30, 2020, the aggregate market value of those securities was $1,822,637, representing 1.33% of net assets. |
| See Notes to Financial Statements. | |
| 12 | 1.855.775.3337 | www.rondureglobal.com |
| Rondure Overseas Fund | Portfolio of Investments |
| | April 30, 2020 |
| | | Shares | | | Value (Note 2) | |
| COMMON STOCKS (99.12%) | | | | | | | | |
| Australia (6.18%) | | | | | | | | |
| ASX, Ltd. | | | 2,000 | | | $ | 106,284 | |
| Coca-Cola Amatil, Ltd. | | | 34,200 | | | | 193,446 | |
| Cochlear, Ltd. | | | 808 | | | | 97,145 | |
| CSL, Ltd. | | | 969 | | | | 195,395 | |
| REA Group, Ltd. | | | 8,571 | | | | 497,257 | |
| Sonic Healthcare, Ltd. | | | 6,070 | | | | 107,550 | |
| | | | | | | | 1,197,077 | |
| | | | | | | | | |
| Austria (1.10%) | | | | | | | | |
| Mayr Melnhof Karton AG | | | 1,550 | | | | 213,001 | |
| | | | | | | | | |
| Belgium (0.49%) | | | | | | | | |
| Lotus Bakeries NV | | | 31 | | | | 94,101 | |
| | | | | | | | | |
| Britain (13.60%) | | | | | | | | |
| Abcam PLC | | | 6,600 | | | | 105,571 | |
| Compass Group PLC | | | 6,996 | | | | 117,720 | |
| Diageo PLC | | | 12,600 | | | | 436,414 | |
| Diploma PLC | | | 4,500 | | | | 97,768 | |
| Greggs PLC | | | 4,800 | | | | 110,755 | |
| Halma PLC | | | 3,800 | | | | 100,029 | |
| Intertek Group PLC | | | 1,700 | | | | 101,704 | |
| London Stock Exchange Group PLC | | | 1,987 | | | | 186,595 | |
| Rightmove PLC | | | 41,800 | | | | 261,971 | |
| Smith & Nephew PLC | | | 4,400 | | | | 86,341 | |
| Softcat PLC | | | 7,300 | | | | 103,896 | |
| Spirax-Sarco Engineering PLC | | | 847 | | | | 93,109 | |
| Unilever NV | | | 16,700 | | | | 834,149 | |
| | | | | | | | 2,636,022 | |
| | | | | | | | | |
| Canada (5.16%) | | | | | | | | |
| Alimentation Couche-Tard, Inc., Class B | | | 13,900 | | | | 387,856 | |
| Canadian National Railway Co. | | | 4,002 | | | | 330,953 | |
| Dollarama, Inc. | | | 3,440 | | | | 107,900 | |
| Fortis, Inc. | | | 4,500 | | | | 174,381 | |
| | | | | | | | 1,001,090 | |
| | | | | | | | | |
| Denmark (2.45%) | | | | | | | | |
| Coloplast A/S, Class B | | | 1,685 | | | | 266,512 | |
| Ossur HF | | | 3,127 | | | | 20,045 | |
| | | Shares | | | Value (Note 2) | |
| Denmark (continued) | | | | | | | | |
| Royal Unibrew A/S(a) | | | 2,440 | | | $ | 188,843 | |
| | | | | | | | 475,400 | |
| | | | | | | | | |
| Finland (3.35%) | | | | | | | | |
| Kone Oyj, Class B | | | 3,200 | | | | 193,993 | |
| Olvi Oyj, Class A | | | 10,805 | | | | 455,867 | |
| | | | | | | | 649,860 | |
| | | | | | | | | |
| France (12.31%) | | | | | | | | |
| Air Liquide SA | | | 2,007 | | | | 255,348 | |
| Danone SA | | | 11,480 | | | | 795,837 | |
| Dassault Systemes SE | | | 300 | | | | 43,905 | |
| EssilorLuxottica SA | | | 738 | | | | 91,105 | |
| Hermes International | | | 240 | | | | 175,635 | |
| L'Oreal SA | | | 1,500 | | | | 436,095 | |
| LVMH Moet Hennessy Louis Vuitton SE | | | 453 | | | | 174,964 | |
| Pernod Ricard SA | | | 2,082 | | | | 317,366 | |
| Sodexo SA | | | 1,200 | | | | 95,339 | |
| | | | | | | | 2,385,594 | |
| | | | | | | | | |
| Germany (4.69%) | | | | | | | | |
| adidas AG | | | 1,545 | | | | 354,195 | |
| Beiersdorf AG | | | 900 | | | | 94,268 | |
| Carl Zeiss Meditec AG(a) | | | 900 | | | | 88,715 | |
| Puma SE | | | 1,460 | | | | 91,805 | |
| SAP SE | | | 1,600 | | | | 191,012 | |
| Symrise AG | | | 880 | | | | 89,029 | |
| | | | | | | | 909,024 | |
| | | | | | | | | |
| Hong Kong (2.51%) | | | | | | | | |
| Hong Kong Exchanges & Clearing, Ltd. | | | 6,400 | | | | 208,036 | |
| Link REIT | | | 9,000 | | | | 80,800 | |
| Vitasoy International Holdings, Ltd. | | | 55,000 | | | | 197,936 | |
| | | | | | | | 486,772 | |
| | | | | | | | | |
| Ireland (0.52%) | | | | | | | | |
| Kerry Group PLC, Class A | | | 875 | | | | 100,394 | |
| | | | | | | | | |
| Italy (3.42%) | | | | | | | | |
| Davide Campari-Milano SpA | | | 12,957 | | | | 100,387 | |
| DiaSorin SpA | | | 865 | | | | 147,211 | |
| See Notes to Financial Statements. | |
| Annual Report | April 30, 2020 | 13 |
| Rondure Overseas Fund | Portfolio of Investments |
| | April 30, 2020 |
| | | Shares | | | Value (Note 2) | |
| Italy (continued) | | | | | | | | |
| Ferrari NV | | | 2,642 | | | $ | 415,178 | |
| | | | | | | | 662,776 | |
| | | | | | | | | |
| Japan (19.93%) | | | | | | | | |
| ABC-Mart, Inc. | | | 2,700 | | | | 138,629 | |
| Asahi Intecc Co., Ltd. | | | 3,900 | | | | 104,046 | |
| Cosmos Pharmaceutical Corp. | | | 900 | | | | 241,113 | |
| Create SD Holdings Co., Ltd. | | | 8,500 | | | | 242,767 | |
| Kobayashi Pharmaceutical Co., Ltd. | | | 2,000 | | | | 185,249 | |
| Kusuri no Aoki Holdings Co., Ltd. | | | 2,500 | | | | 195,919 | |
| M3, Inc. | | | 600 | | | | 21,749 | |
| Matsumotokiyoshi Holdings Co., Ltd. | | | 7,500 | | | | 259,283 | |
| McDonald's Holdings Co. Japan, Ltd. | | | 400 | | | | 19,680 | |
| MISUMI Group, Inc. | | | 3,200 | | | | 77,111 | |
| MonotaRO Co., Ltd. | | | 10,500 | | | | 339,515 | |
| Nihon M&A Center, Inc. | | | 9,400 | | | | 311,392 | |
| Nippon Paint Holdings Co., Ltd. | | | 2,500 | | | | 144,668 | |
| Oriental Land Co., Ltd. | | | 2,600 | | | | 331,435 | |
| Secom Co., Ltd. | | | 4,500 | | | | 377,603 | |
| Seria Co., Ltd. | | | 4,700 | | | | 153,287 | |
| Sundrug Co., Ltd. | | | 7,200 | | | | 247,906 | |
| Tsuruha Holdings, Inc. | | | 1,300 | | | | 174,197 | |
| Unicharm Corp. | | | 8,100 | | | | 298,141 | |
| | | | | | | | 3,863,690 | |
| | | | | | | | | |
| Netherlands (2.47%) | | | | | | | | |
| Akzo Nobel NV | | | 1,500 | | | | 113,750 | |
| ASML Holding NV | | | 320 | | | | 94,910 | |
| Euronext NV(b)(c) | | | 1,190 | | | | 99,891 | |
| Heineken NV | | | 2,000 | | | | 170,120 | |
| | | | | | | | 478,671 | |
| | | | | | | | | |
| New Zealand (1.23%) | | | | | | | | |
| Fisher & Paykel Healthcare Corp., Ltd. | | | 1,100 | | | | 18,482 | |
| Mainfreight, Ltd. | | | 9,859 | | | | 220,753 | |
| | | | | | | | 239,235 | |
| | | Shares | | | Value (Note 2) | |
| Singapore (0.81%) | | | | | | | | |
| Singapore Exchange, Ltd. | | | 23,000 | | | $ | 157,395 | |
| | | | | | | | | |
| Spain (0.43%) | | | | | | | | |
| Amadeus IT Group SA | | | 1,715 | | | | 82,543 | |
| | | | | | | | | |
| Sweden (3.22%) | | | | | | | | |
| Assa Abloy AB, Class B | | | 4,450 | | | | 80,304 | |
| Axfood AB | | | 19,844 | | | | 421,464 | |
| Essity AB, Class B(a) | | | 3,741 | | | | 121,751 | |
| | | | | | | | 623,519 | |
| | | | | | | | | |
| Switzerland (8.89%) | | | | | | | | |
| Chocoladefabriken Lindt & Spruengli AG | | | 73 | | | | 569,102 | |
| Nestle SA | | | 9,080 | | | | 958,562 | |
| Partners Group Holding AG | | | 125 | | | | 98,394 | |
| Schindler Holding AG | | | 456 | | | | 97,790 | |
| | | | | | | | 1,723,848 | |
| | | | | | | | | |
| United States (6.36%) | | | | | | | | |
| Accenture PLC, Class A | | | 2,012 | | | | 372,602 | |
| BlackRock, Inc. | | | 195 | | | | 97,898 | |
| Mastercard, Inc., Class A | | | 1,375 | | | | 378,084 | |
| MSCI, Inc. | | | 300 | | | | 98,100 | |
| Visa, Inc., Class A | | | 1,600 | | | | 285,952 | |
| | | | | | | | 1,232,636 | |
| | | | | | | | | |
| TOTAL COMMON STOCKS | | | | | | | | |
| (Cost $18,122,139) | | | | | | | 19,212,648 | |
| | | | | | | | | |
| TOTAL INVESTMENTS (99.12%) | | | | | | | | |
| (Cost $18,122,139) | | | | | | $ | 19,212,648 | |
| | | | | | | | | |
| Other Assets In Excess Of Liabilities (0.88%) | | | | | | | 171,520 | |
| | | | | | | | | |
| NET ASSETS (100.00%) | | | | | | $ | 19,384,168 | |
| (a) | Non-Income Producing Security. |
| (b) | Security exempt from registration under Rule 144A of the Securities Act of 1933. These securities may be resold in the ordinary course of business in transactions exempt from registration, normally to qualified institutional buyers. As of April 30, 2020, these securities had a total aggregate market value of $99,891 representing 0.52% of net assets. |
| See Notes to Financial Statements. | |
| 14 | 1.855.775.3337 | www.rondureglobal.com |
| Rondure Overseas Fund | Portfolio of Investments |
| | April 30, 2020 |
| (c) | Security was purchased pursuant to Regulation S under the Securities Act of 1933, which exempts securities offered and sold outside of the United States from registration. Such security cannot be sold in the United States without either an effective registration statement filed pursuant to the Securities Act of 1933, or pursuant to an exemption from registration. As of April 30, 2020, the aggregate market value of those securities was $99,891, representing 0.52% of net assets. |
| See Notes to Financial Statements. | |
| Annual Report | April 30, 2020 | 15 |
| Rondure Funds | Statements of Assets and Liabilities |
| | April 30, 2020 |
| | | Rondure New World Fund | | | Rondure Overseas Fund | |
| ASSETS | | | | | | | | |
| Investments, at value (Cost - see below) | | $ | 137,040,616 | | | $ | 19,212,648 | |
| Foreign cash, at value (Cost $4,551 and $17,194, respectively) | | | 4,550 | | | | 17,194 | |
| Cash | | | 629,623 | | | | 191,534 | |
| Dividends and interest receivable | | | 63,769 | | | | 63,600 | |
| Receivable for investments sold | | | – | | | | 446,055 | |
| Receivable for fund shares subscribed | | | 69,946 | | | | 300 | |
| Prepaid and other assets | | | 14,020 | | | | 13,318 | |
| Total assets | | | 137,822,524 | | | | 19,944,649 | |
| | | | | | | | | |
| LIABILITIES | | | | | | | | |
| Payable for investments purchased | | | 478,594 | | | | 491,562 | |
| Payable for fund shares redeemed | | | 8,158 | | | | – | |
| Advisory fees payable | | | 39,982 | | | | 41 | |
| Administration fees payable | | | 53,277 | | | | 23,816 | |
| Custodian fees payable | | | 87,750 | | | | 7,154 | |
| Payable for professional fees | | | 23,067 | | | | 22,600 | |
| Payable for trustee fees and expenses | | | 5,958 | | | | 837 | |
| Payable for chief compliance officer fee | | | 5,203 | | | | 731 | |
| Payable for principal financial officer fees | | | 2,192 | | | | 308 | |
| Distribution and service fees payable - Investor Class | | | 3,560 | | | | 512 | |
| Payable for transfer agency fees | | | 40,704 | | | | 10,763 | |
| Accrued expenses and other liabilities | | | 7,392 | | | | 2,157 | |
| Total liabilities | | | 755,837 | | | | 560,481 | |
| NET ASSETS | | $ | 137,066,687 | | | $ | 19,384,168 | |
| | | | | | | | | |
| NET ASSETS CONSISTS OF | | | | | | | | |
| Paid-in capital (Note 5) | | $ | 146,982,339 | | | $ | 20,235,782 | |
| Total distributable earnings | | | (9,915,652 | ) | | | (851,614 | ) |
| NET ASSETS | | $ | 137,066,687 | | | $ | 19,384,168 | |
| | | | | | | | | |
| INVESTMENTS, AT COST | | $ | 137,640,272 | | | $ | 18,122,139 | |
| | | | | | | | | |
| PRICING OF SHARES | | | | | | | | |
| Institutional Class | | | | | | | | |
| Net Assets | | $ | 118,684,587 | | | $ | 16,757,922 | |
| Net Asset Value, offering and redemption price per share | | $ | 9.93 | | | $ | 10.34 | |
| Shares of beneficial interest outstanding | | | 11,956,255 | | | | 1,621,161 | |
| Investor Class | | | | | | | | |
| Net Assets | | $ | 18,382,100 | | | $ | 2,626,246 | |
| Net Asset Value, offering and redemption price per share | | $ | 9.90 | | | $ | 10.34 | |
| Shares of beneficial interest outstanding | | | 1,856,758 | | | | 254,053 | |
| See Notes to Financial Statements. | |
| 16 | 1.855.775.3337 | www.rondureglobal.com |
| Rondure Funds | Statements of Operations |
| | For the Year Ended April 30, 2020 |
| | | Rondure New World Fund | | | Rondure Overseas Fund | |
| INVESTMENT INCOME | | | | | | | | |
| Dividends | | $ | 2,834,193 | | | $ | 424,276 | |
| Interest | | | 65 | | | | – | |
| Foreign taxes withheld | | | (228,635 | ) | | | (49,260 | ) |
| Other Income | | | 48,238 | | | | 5,562 | |
| Total investment income | | | 2,653,861 | | | | 380,578 | |
| EXPENSES | | | | | | | | |
| Investment advisor fees (Note 6) | | | 1,169,693 | | | | 153,536 | |
| Administrative fees | | | 251,778 | | | | 68,298 | |
| Distribution and service fees - Investor Class | | | 49,236 | | | | 8,805 | |
| Transfer agent fees | | | 201,812 | | | | 62,270 | |
| Professional fees | | | 34,577 | | | | 25,520 | |
| Printing fees | | | 17,891 | | | | 2,357 | |
| Registration fees | | | 37,825 | | | | 32,276 | |
| Custodian fees | | | 192,159 | | | | 23,021 | |
| Trustee fees and expenses | | | 7,092 | | | | 1,012 | |
| Chief compliance officer fees | | | 31,225 | | | | 4,964 | |
| Principal financial officer fees | | | 12,460 | | | | 1,970 | |
| Other expenses | | | 16,967 | | | | 7,426 | |
| Total expenses | | | 2,022,715 | | | | 391,455 | |
| Less fees waived/reimbursed by investment advisor (Note 6) | | | (459,600 | ) | | | (196,295 | ) |
| Total net expenses | | | 1,563,115 | | | | 195,160 | |
| NET INVESTMENT INCOME | | | 1,090,746 | | | | 185,418 | |
| REALIZED AND UNREALIZED GAIN/(LOSS) ON INVESTMENTS | | | | | | | | |
| Net realized loss on investments | | | (1,256,042 | ) | | | (1,240,801 | ) |
| Net realized gain/(loss) on foreign currency transactions | | | (5,820 | ) | | | 2,758 | |
| Net realized loss | | | (1,261,862 | ) | | | (1,238,043 | ) |
| Net change in unrealized depreciation on investments (net of change in foreign capital gains tax of ($36,450) and $0, respectively) | | | (11,237,184 | ) | | | (144,934 | ) |
| Net change in unrealized appreciation on translation of assets and liabilities in foreign currencies | | | 1,868 | | | | 3,574 | |
| Net change in unrealized depreciation | | | (11,235,316 | ) | | | (141,360 | ) |
| NET REALIZED AND UNREALIZED LOSS ON INVESTMENTS AND FOREIGN CURRENCY TRANSACTIONS | | | (12,497,178 | ) | | | (1,379,403 | ) |
| NET DECREASE IN NET ASSETS RESULTING FROM OPERATIONS | | $ | (11,406,432 | ) | | $ | (1,193,985 | ) |
| See Notes to Financial Statements. | |
| Annual Report | April 30, 2020 | 17 |
| Rondure New World Fund | Statement of Changes in Net Assets |
| | | For the Year Ended April 30, 2020 | | | For the Year Ended April 30, 2019 | |
| OPERATIONS | | | | | | | | |
| Net investment income | | $ | 1,090,746 | | | $ | 1,008,257 | |
| Net realized loss | | | (1,261,862 | ) | | | (7,966,966 | ) |
| Net change in unrealized appreciation/(depreciation) | | | (11,235,316 | ) | | | 2,660,191 | |
| Net decrease in net assets resulting from operations | | | (11,406,432 | ) | | | (4,298,518 | ) |
| TOTAL DISTRIBUTIONS TO SHAREHOLDERS (NOTE 3) | | | | | | | | |
| From distributable earnings | | | | | | | | |
| Institutional Class | | | (1,036,130 | ) | | | (805,429 | ) |
| Investor Class | | | (138,384 | ) | | | (134,438 | ) |
| Net decrease in net assets from distributions | | | (1,174,514 | ) | | | (939,867 | ) |
| CAPITAL SHARE TRANSACTIONS (NOTE 5) | | | | | | | | |
| Institutional Class | | | | | | | | |
| Proceeds from sales of shares | | | 33,531,344 | | | | 45,561,068 | |
| Distributions reinvested | | | 1,015,211 | | | | 775,462 | |
| Cost of shares redeemed | | | (15,803,966 | ) | | | (32,437,400 | ) |
| Redemption fees | | | 15,734 | | | | 2,181 | |
| Net increase from capital shares transactions | | | 18,758,323 | | | | 13,901,311 | |
| Investor Class | | | | | | | | |
| Proceeds from sales of shares | | | 6,220,152 | | | | 10,226,719 | |
| Distributions reinvested | | | 138,268 | | | | 133,941 | |
| Cost of shares redeemed | | | (6,865,062 | ) | | | (12,623,048 | ) |
| Redemption fees | | | 1,211 | | | | 1,142 | |
| Net decrease from capital shares transactions | | | (505,431 | ) | | | (2,261,246 | ) |
| Net increase in net assets | | | 5,671,946 | | | | 6,401,680 | |
| | | | | | | | | |
| NET ASSETS | | | | | | | | |
| Beginning of period | | | 131,394,741 | | | | 124,993,061 | |
| End of period | | $ | 137,066,687 | | | $ | 131,394,741 | |
| | | | | | | | | |
| OTHER INFORMATION | | | | | | | | |
| Shares Transactions | | | | | | | | |
| Institutional Class | | | | | | | | |
| Issued | | | 3,149,600 | | | | 4,483,691 | |
| Issued to shareholders in reinvestment of distributions | | | 88,820 | | | | 81,115 | |
| Redeemed | | | (1,543,323 | ) | | | (3,256,312 | ) |
| Net increase in share transactions | | | 1,695,097 | | | | 1,308,494 | |
| Investor Class | | | | | | | | |
| Issued | | | 579,043 | | | | 1,005,992 | |
| Issued to shareholders in reinvestment of distributions | | | 12,118 | | | | 14,025 | |
| Redeemed | | | (644,762 | ) | | | (1,265,236 | ) |
| Net decrease in share transactions | | | (53,601 | ) | | | (245,219 | ) |
| See Notes to Financial Statements. | |
| 18 | 1.855.775.3337 | www.rondureglobal.com |
| Rondure Overseas Fund | Statement of Changes in Net Assets |
| | | For the Year Ended April 30, 2020 | | | For the Year Ended April 30, 2019 | |
| OPERATIONS | | | | | | | | |
| Net investment income | | $ | 185,418 | | | $ | 214,145 | |
| Net realized loss | | | (1,238,043 | ) | | | (711,512 | ) |
| Net change in unrealized depreciation | | | (141,360 | ) | | | (30,254 | ) |
| Net decrease in net assets resulting from operations | | | (1,193,985 | ) | | | (527,621 | ) |
| TOTAL DISTRIBUTIONS TO SHAREHOLDERS (NOTE 3) | | | | | | | | |
| From distributable earnings | | | | | | | | |
| Institutional Class | | | (181,265 | ) | | | (239,395 | ) |
| Investor Class | | | (29,412 | ) | | | (49,787 | ) |
| Net decrease in net assets from distributions | | | (210,677 | ) | | | (289,182 | ) |
| CAPITAL SHARE TRANSACTIONS (NOTE 5) | | | | | | | | |
| Institutional Class | | | | | | | | |
| Proceeds from sales of shares | | | 2,445,201 | | | | 8,892,000 | |
| Distributions reinvested | | | 175,567 | | | | 229,107 | |
| Cost of shares redeemed | | | (3,488,107 | ) | | | (3,918,374 | ) |
| Redemption fees | | | 26 | | | | 1,619 | |
| Net increase/(decrease) from capital shares transactions | | | (867,313 | ) | | | 5,204,352 | |
| Investor Class | | | | | | | | |
| Proceeds from sales of shares | | | 578,474 | | | | 1,539,008 | |
| Distributions reinvested | | | 29,251 | | | | 49,575 | |
| Cost of shares redeemed | | | (1,720,062 | ) | | | (2,683,077 | ) |
| Redemption fees | | | 1,376 | | | | 1,670 | |
| Net decrease from capital shares transactions | | | (1,110,961 | ) | | | (1,092,824 | ) |
| Net increase/(decrease) in net assets | | | (3,382,936 | ) | | | 3,294,725 | |
| | | | | | | | | |
| NET ASSETS | | | | | | | | |
| Beginning of period | | | 22,767,104 | | | | 19,472,379 | |
| End of period | | $ | 19,384,168 | | | $ | 22,767,104 | |
| | | | | | | | | |
| OTHER INFORMATION | | | | | | | | |
| Shares Transactions | | | | | | | | |
| Institutional Class | | | | | | | | |
| Issued | | | 233,288 | | | | 787,230 | |
| Issued to shareholders in reinvestment of distributions | | | 14,841 | | | | 22,528 | |
| Redeemed | | | (323,690 | ) | | | (359,383 | ) |
| Net increase/(decrease) in share transactions | | | (75,561 | ) | | | 450,375 | |
| Investor Class | | | | | | | | |
| Issued | | | 54,253 | | | | 139,570 | |
| Issued to shareholders in reinvestment of distributions | | | 2,470 | | | | 4,865 | |
| Redeemed | | | (155,568 | ) | | | (243,574 | ) |
| Net decrease in share transactions | | | (98,845 | ) | | | (99,139 | ) |
| See Notes to Financial Statements. | |
| Annual Report | April 30, 2020 | 19 |
| Rondure New World Fund – Institutional Class | Financial Highlights |
For a Share Outstanding Throughout the Period Presented
| Institutional Class | | Year Ended April 30, 2020 | | | Year Ended April 30, 2019 | | | For the Period May 2, 2017 (Commencement of Operations) to April 30, 2018 | |
| NET ASSET VALUE, BEGINNING OF PERIOD | | $ | 10.80 | | | $ | 11.25 | | | $ | 10.00 | |
| | | | | | | | | | | | | |
| INCOME FROM INVESTMENT OPERATIONS | | | | | | | | | | �� | | |
| Net investment income(a) | | | 0.09 | | | | 0.09 | | | | 0.05 | |
| Net realized and unrealized gain/(loss) on investments | | | (0.87 | ) | | | (0.45 | ) | | | 1.23 | |
| Total income/(loss) from investment operations | | | (0.78 | ) | | | (0.36 | ) | | | 1.28 | |
| | | | | | | | | | | | | |
| DISTRIBUTIONS | | | | | | | | | | | | |
| From net investment income | | | (0.09 | ) | | | (0.09 | ) | | | (0.03 | ) |
| From net realized gain on investments | | | – | | | | – | | | | (0.00 | )(b) |
| Total distributions | | | (0.09 | ) | | | (0.09 | ) | | | (0.03 | ) |
| | | | | | | | | | | | | |
| REDEMPTION FEES ADDED TO PAID-IN CAPITAL | | | 0.00 | (b) | | | 0.00 | (b) | | | 0.00 | (b) |
| | | | | | | | | | | | | |
| INCREASE/DECREASE IN NET ASSET VALUE | | | (0.87 | ) | | | (0.45 | ) | | | 1.25 | |
| NET ASSET VALUE, END OF PERIOD | | $ | 9.93 | | | $ | 10.80 | | | $ | 11.25 | |
| | | | | | | | | | | | | |
| TOTAL RETURN | | | (7.31 | )% | | | (3.09 | )% | | | 12.78 | %(c) |
| | | | | | | | | | | | | |
| RATIOS AND SUPPLEMENTAL DATA | | | | | | | | | | | | |
| Net assets, end of period (in 000s) | | $ | 118,685 | | | $ | 110,800 | | | $ | 100,760 | |
| | | | | | | | | | | | | |
| RATIOS TO AVERAGE NET ASSETS | | | | | | | | | | | | |
| Expenses (excluding fees waived/ reimbursed by investment advisor) | | | 1.43 | % | | | 1.46 | % | | | 1.62 | %(d) |
| Expenses (including fees waived/ reimbursed by investment advisor) | | | 1.10 | % | | | 1.10 | % | | | 1.10 | %(d) |
| Net investment income | | | 0.83 | % | | | 0.87 | % | | | 0.43 | %(d) |
| | | | | | | | | | | | | |
| PORTFOLIO TURNOVER RATE | | | 27 | % | | | 37 | % | | | 13 | %(c) |
| (a) | Per share numbers have been calculated using the average shares method. |
| (b) | Less than $0.005 or ($0.005) per share. |
| See Notes to Financial Statements. | |
| 20 | 1.855.775.3337 | www.rondureglobal.com |
| Rondure New World Fund – Investor Class | Financial Highlights |
For a Share Outstanding Throughout the Period Presented
| Investor Class | | Year Ended April 30, 2020 | | | Year Ended April 30, 2019 | | | For the Period May 2, 2017 (Commencement of Operations) to April 30, 2018 | |
| NET ASSET VALUE, BEGINNING OF PERIOD | | $ | 10.78 | | | $ | 11.24 | | | $ | 10.00 | |
| | | | | | | | | | | | | |
| INCOME FROM INVESTMENT OPERATIONS | | | | | | | | | | | | |
| Net investment income(a) | | | 0.06 | | | | 0.07 | | | | 0.03 | |
| Net realized and unrealized gain/(loss) on investments | | | (0.87 | ) | | | (0.46 | ) | | | 1.22 | |
| Total income/(loss) from investment operations | | | (0.81 | ) | | | (0.39 | ) | | | 1.25 | |
| | | | | | | | | | | | | |
| DISTRIBUTIONS | | | | | | | | | | | | |
| From net investment income | | | (0.07 | ) | | | (0.07 | ) | | | (0.01 | ) |
| From net realized gain on investments | | | – | | | | – | | | | (0.00 | )(b) |
| Total distributions | | | (0.07 | ) | | | (0.07 | ) | | | (0.01 | ) |
| | | | | | | | | | | | | |
| REDEMPTION FEES ADDED TO PAID-IN CAPITAL | | | 0.00 | (b) | | | 0.00 | (b) | | | 0.00 | (b) |
| | | | | | | | | | | | | |
| INCREASE/DECREASE IN NET ASSET VALUE | | | (0.88 | ) | | | (0.46 | ) | | | 1.24 | |
| NET ASSET VALUE, END OF PERIOD | | $ | 9.90 | | | $ | 10.78 | | | $ | 11.24 | |
| | | | | | | | | | | | | |
| TOTAL RETURN | | | (7.56 | )% | | | (3.37 | )% | | | 12.53 | %(c) |
| | | | | | | | | | | | | |
| RATIOS AND SUPPLEMENTAL DATA | | | | | | | | | | | | |
| Net assets, end of period (in 000s) | | $ | 18,382 | | | $ | 20,595 | | | $ | 24,233 | |
| | | | | | | | | | | | | |
| RATIOS TO AVERAGE NET ASSETS | | | | | | | | | | | | |
| Expenses (excluding fees waived/ reimbursed by investment advisor) | | | 1.72 | % | | | 1.76 | % | | | 1.91 | %(d) |
| Expenses (including fees waived/ reimbursed by investment advisor) | | | 1.35 | % | | | 1.35 | % | | | 1.35 | %(d) |
| Net investment income | | | 0.59 | % | | | 0.66 | % | | | 0.24 | %(d) |
| | | | | | | | | | | | | |
| PORTFOLIO TURNOVER RATE | | | 27 | % | | | 37 | % | | | 13 | %(c) |
| (a) | Per share numbers have been calculated using the average shares method. |
| (b) | Less than $0.005 or ($0.005) per share. |
| See Notes to Financial Statements. | |
| Annual Report | April 30, 2020 | 21 |
| Rondure Overseas Fund – Institutional Class | Financial Highlights |
For a Share Outstanding Throughout the Period Presented
| Institutional Class | | Year Ended April 30, 2020 | | | Year Ended April 30, 2019 | | | For the Period May 2, 2017 (Commencement of Operations) to April 30, 2018 | |
| NET ASSET VALUE, BEGINNING OF PERIOD | | $ | 11.11 | | | $ | 11.46 | | | $ | 10.00 | |
| | | | | | | | | | | | | |
| INCOME FROM INVESTMENT OPERATIONS | | | | | | | | | | | | |
| Net investment income(a) | | | 0.10 | | | | 0.10 | | | | 0.10 | |
| Net realized and unrealized gain/(loss) on investments | | | (0.76 | ) | | | (0.31 | ) | | | 1.48 | |
| Total income/(loss) from investment operations | | | (0.66 | ) | | | (0.21 | ) | | | 1.58 | |
| | | | | | | | | | | | | |
| DISTRIBUTIONS | | | | | | | | | | | | |
| From net investment income | | | (0.11 | ) | | | (0.11 | ) | | | (0.04 | ) |
| From net realized gain on investments | | | – | | | | (0.03 | ) | | | (0.08 | ) |
| Total distributions | | | (0.11 | ) | | | (0.14 | ) | | | (0.12 | ) |
| | | | | | | | | | | | | |
| REDEMPTION FEES ADDED TO PAID-IN CAPITAL | | | 0.00 | (b) | | | 0.00 | (b) | | | 0.00 | (b) |
| | | | | | | | | | | | | |
| INCREASE/DECREASE IN NET ASSET VALUE | | | (0.77 | ) | | | (0.35 | ) | | | 1.46 | |
| NET ASSET VALUE, END OF PERIOD | | $ | 10.34 | | | $ | 11.11 | | | $ | 11.46 | |
| | | | | | | | | | | | | |
| TOTAL RETURN | | | (6.06 | )% | | | (1.76 | )% | | | 15.88 | %(c) |
| | | | | | | | | | | | | |
| RATIOS AND SUPPLEMENTAL DATA | | | | | | | | | | | | |
| Net assets, end of period (in 000s) | | $ | 16,758 | | | $ | 18,845 | | | $ | 14,283 | |
| | | | | | | | | | | | | |
| RATIOS TO AVERAGE NET ASSETS | | | | | | | | | | | | |
| Expenses (excluding fees waived/ reimbursed by investment advisor) | | | 1.73 | % | | | 1.72 | % | | | 2.57 | %(d) |
| Expenses (including fees waived/ reimbursed by investment advisor) | | | 0.85 | % | | | 0.85 | % | | | 0.85 | %(d) |
| Net investment income | | | 0.89 | % | | | 0.95 | % | | | 0.92 | %(d) |
| | | | | | | | | | | | | |
| PORTFOLIO TURNOVER RATE | | | 66 | % | | | 40 | % | | | 14 | %(c) |
| (a) | Per share numbers have been calculated using the average shares method. |
| (b) | Less than $0.005 or ($0.005) per share. |
| See Notes to Financial Statements. | |
| 22 | 1.855.775.3337 | www.rondureglobal.com |
| Rondure Overseas Fund – Investor Class | Financial Highlights |
For a Share Outstanding Throughout the Period Presented
| Investor Class | | Year Ended April 30, 2020 | | | Year Ended April 30, 2019 | | | For the Period May 2, 2017 (Commencement of Operations) to April 30, 2018 | |
| NET ASSET VALUE, BEGINNING OF PERIOD | | $ | 11.12 | | | $ | 11.48 | | | $ | 10.00 | |
| | | | | | | | | | | | | |
| INCOME FROM INVESTMENT OPERATIONS | | | | | | | | | | | | |
| Net investment income(a) | | | 0.07 | | | | 0.08 | | | | 0.09 | |
| Net realized and unrealized gain/(loss) on investments | | | (0.76 | ) | | | (0.32 | ) | | | 1.46 | |
| Total income/(loss) from investment operations | | | (0.69 | ) | | | (0.24 | ) | | | 1.55 | |
| | | | | | | | | | | | | |
| DISTRIBUTIONS | | | | | | | | | | | | |
| From net investment income | | | (0.09 | ) | | | (0.09 | ) | | | – | |
| From net realized gain on investments | | | – | | | | (0.03 | ) | | | (0.08 | ) |
| Total distributions | | | (0.09 | ) | | | (0.12 | ) | | | (0.08 | ) |
| | | | | | | | | | | | | |
| REDEMPTION FEES ADDED TO PAID-IN CAPITAL | | | 0.00 | (b) | | | 0.00 | (b) | | | 0.01 | |
| | | | | | | | | | | | | |
| INCREASE/DECREASE IN NET ASSET VALUE | | | (0.78 | ) | | | (0.36 | ) | | | 1.48 | |
| NET ASSET VALUE, END OF PERIOD | | $ | 10.34 | | | $ | 11.12 | | | $ | 11.48 | |
| | | | | | | | | | | | | |
| TOTAL RETURN | | | (6.28 | )% | | | (1.98 | )% | | | 15.63 | %(c) |
| | | | | | | | | | | | | |
| RATIOS AND SUPPLEMENTAL DATA | | | | | | | | | | | | |
| Net assets, end of period (in 000s) | | $ | 2,626 | | | $ | 3,922 | | | $ | 5,189 | |
| | | | | | | | | | | | | |
| RATIOS TO AVERAGE NET ASSETS | | | | | | | | | | | | |
| Expenses (excluding fees waived/ reimbursed by investment advisor) | | | 2.06 | % | | | 2.04 | % | | | 2.45 | %(d) |
| Expenses (including fees waived/ reimbursed by investment advisor) | | | 1.10 | % | | | 1.10 | % | | | 1.10 | %(d) |
| Net investment income | | | 0.61 | % | | | 0.74 | % | | | 0.82 | %(d) |
| | | | | | | | | | | | | |
| PORTFOLIO TURNOVER RATE | | | 66 | % | | | 40 | % | | | 14 | %(c) |
| (a) | Per share numbers have been calculated using the average shares method. |
| (b) | Less than $0.005 or ($0.005) per share. |
| See Notes to Financial Statements. | |
| Annual Report | April 30, 2020 | 23 |
| Rondure Funds | Notes to Financial Statements |
| | April 30, 2020 |
1. ORGANIZATION
Financial Investors Trust (the “Trust”), a Delaware statutory trust, is an open-end management investment company registered under the Investment Company Act of 1940, as amended (“1940 Act”). As of April 30, 2020, the Trust consists of multiple separate Portfolios or series. This annual report describes the Rondure New World Fund and the Rondure Overseas Fund (individually a “Fund” and collectively, the “Funds”). The Funds seek long-term growth of capital. The Funds offer Investor Class and Institutional Class shares.
2. SIGNIFICANT ACCOUNTING POLICIES
The accompanying financial statements were prepared in accordance with accounting principles generally accepted in the United States of America (“U.S. GAAP”). The preparation of financial statements in conformity with U.S. GAAP requires management to make certain estimates and assumptions that affect the reported amounts of assets and liabilities and disclosures of contingent assets and liabilities at the date of the financial statements and the reported amounts of revenue and expenses during the period. Actual results could differ from those estimates. The Funds are considered an investment company for financial reporting purposes under U.S. GAAP and follows the accounting and reporting guidance applicable to investment companies in the Financial Accounting Standards Board Accounting Standards Codification Topic 946. The following is a summary of significant accounting policies consistently followed by the Funds in preparation of its financial statements.
Investment Valuation: The Funds generally value their securities based on market prices determined at the close of regular trading on the New York Stock Exchange (“NYSE”), normally 4:00 p.m. Eastern Time, on each day the NYSE is open for trading.
For equity securities and mutual funds that are traded on an exchange, the market price is usually the closing sale or official closing price on that exchange. In the case of equity securities not traded on an exchange, or if such closing prices are not otherwise available, the securities are valued at the mean of the most recent bid and ask prices on such day. Redeemable securities issued by open-end registered investment companies are valued at the investment company’s applicable net asset value, with the exception of exchange-traded open-end investment companies, which are priced as equity securities.
Equity securities that are primarily traded on foreign securities exchanges are valued at the closing values of such securities on their respective foreign exchanges, except when an event occurs subsequent to the close of the foreign exchange and the close of the NYSE that was likely to have changed such value. In such an event, the fair value of those securities are determined in good faith through consideration of other factors in accordance with procedures established by and under the general supervision of the Board of Trustees of the Trust (the “Board” or the “Trustees”). The Funds will use a fair valuation model provided by an independent pricing service, which is intended to reflect fair value when a security’s value or a meaningful portion of each Fund’s portfolio is believed to have been materially affected by a valuation event that has occurred between the close of the exchange or market on which the security is traded and the close of the regular trading day on the NYSE. The Funds’ valuation procedures set forth certain triggers which instruct when to use the fair valuation model.
Forward currency exchange contracts have a fair value determined by the prevailing foreign currency exchange daily rates and current foreign currency exchange forward rates. The foreign currency exchange forward rates are calculated using an automated system that estimates rates on the basis of the current day foreign currency exchange rates and forward foreign currency exchange rates supplied by a pricing service.
When such prices or quotations are not available, or when Rondure Global Advisors, LLC (the “Advisor” or “Rondure”) believes that they are unreliable, securities may be priced using fair value procedures approved by the Board.
Fair Value Measurements: The Funds disclose the classification of their fair value measurements following a three-tier hierarchy based on the inputs used to measure fair value. Inputs refer broadly to the assumptions that market participants would use in pricing the asset or liability, including assumptions about risk. Inputs may be observable or unobservable. Observable inputs reflect the assumptions market participants would use in pricing the asset or liability that are developed based on market data obtained from sources independent of the reporting entity. Unobservable inputs reflect the reporting entity’s own assumptions about the assumptions market participants would use in pricing the asset or liability that are developed based on the best information available.
Various inputs are used in determining the value of the Funds’ investments as of the end of the reporting period. When inputs used fall into different levels of the fair value hierarchy, the level in the hierarchy within which the fair value measurement falls is determined based on the lowest level input that is significant to the fair value measurement in its entirety. The designated input levels are not necessarily an indication of the risk or liquidity associated with these investments. These inputs are categorized in the following hierarchy under applicable financial accounting standards:
| 24 | 1.855.775.3337 | www.rondureglobal.com |
| Rondure Funds | Notes to Financial Statements |
| | April 30, 2020 |
Level 1 – Unadjusted quoted prices in active markets for identical investments, unrestricted assets or liabilities that the Funds have the ability to access at the measurement date;
Level 2 – Quoted prices which are not active, quoted prices for similar assets or liabilities in active markets or inputs other than quoted prices that are observable (either directly or indirectly) for substantially the full term of the asset or liability; and
Level 3 – Significant unobservable prices or inputs (including the Funds’ own assumptions in determining the fair value of investments) where there is little or no market activity for the asset or liability at the measurement date.
The following is a summary of each Fund’s investments in the fair value hierarchy as of April 30, 2020:
| Investments in Securities at Value | | Level 1 - Quoted and Unadjusted Prices | | | Level 2 - Other Significant Observable Inputs | | | Level 3 - Significant Unobservable Inputs | | | Total | |
| Rondure New World Fund | | | | | | | | | | | | | | | | |
| Common Stocks | | | | | | | | | | | | | | | | |
| Bangladesh | | $ | – | | | $ | 858,473 | | | $ | – | | | $ | 858,473 | |
| Other* | | | 136,182,143 | | | | – | | | | – | | | | 136,182,143 | |
| Total | | $ | 136,182,143 | | | $ | 858,473 | | | $ | – | | | $ | 137,040,616 | |
| Investments in Securities at Value | | Level 1 - Quoted and Unadjusted Prices | | | Level 2 - Other Significant Observable Inputs | | | Level 3 - Significant Unobservable Inputs | | | Total | |
| Rondure Overseas Fund | | | | | | | | | | | | | | | | |
| Common Stocks* | | $ | 19,212,648 | | | $ | – | | | $ | – | | | $ | 19,212,648 | |
| Total | | $ | 19,212,648 | | | $ | – | | | $ | – | | | $ | 19,212,648 | |
| * | For a detailed country breakdown, see the accompanying Portfolio of Investments. |
For the year ended April 30, 2020, the Funds did not have any securities that used significant unobservable inputs (Level 3) in determining fair value.
Investment Transactions and Investment Income: Investment transactions are accounted for on the date the investments are purchased or sold (trade date). Realized gains and losses from investment transactions are reported on an identified cost which is the same basis the Fund uses for federal income tax purposes. Interest income, which includes accretion of discounts and amortization of premiums, is accrued and recorded as earned. Dividend income is recognized on the ex-dividend date or for certain foreign securities, as soon as information is available to the Funds. All of the realized and unrealized gains and losses and net investment income, are allocated daily to each class in proportion to its average daily net assets.
Cash Management Transactions: The Funds subscribe to the Brown Brothers Harriman & Co. (“BBH”) Cash Management Service (“CMS”), whereby cash balances are automatically swept into overnight offshore demand deposits with either the BBH Grand Cayman branch or a branch of a pre-approved commercial bank. This fully automated program allows the Funds to earn interest on cash balances. Excess cash with deposit institutions domiciled outside of the U.S. are subject to sovereign actions in the jurisdiction of the deposit institution including, but not limited to, freeze, seizure or diminution. Cash balances in the BBH CMS are included on the Statements of Assets and Liabilities under Cash and Foreign Cash, at Value. As of April 30, 2020, the Funds had the following cash balances participating in the BBH CMS:
| Fund | | | |
| Rondure New World Fund | | $ | 629,623 | |
| Rondure Overseas Fund | | | 191,534 | |
| Annual Report | April 30, 2020 | 25 |
| Rondure Funds | Notes to Financial Statements |
| | April 30, 2020 |
As of April 30, 2020, the Funds had the following foreign cash balances participating in the BBH CMS (cost and value of foreign cash balances are equal):
| Fund | | | |
| Rondure New World Fund | | $ | 11 | |
| Rondure Overseas Fund | | | 16,513 | |
Foreign Securities: The Funds may directly purchase securities of foreign issuers. Investing in securities of foreign issuers involves special risks not typically associated with investing in securities of U.S. issuers. The risks include possible reevaluation of currencies, the inability to repatriate foreign currency, less complete financial information about companies and possible future adverse political and economic developments. Moreover, securities of many foreign issuers and their markets may be less liquid and their prices more volatile than those of securities of comparable U.S. issuers.
Foreign Currency Translation: The books and records of the Funds are maintained in U.S. dollars. Investment valuations and other assets and liabilities initially expressed in foreign currencies are converted each business day into U.S. dollars based upon current exchange rates. Prevailing foreign exchange rates may generally be obtained at the close of the NYSE (normally, 4:00 p.m. Eastern Time). The portion of realized and unrealized gains or losses on investments due to fluctuations in foreign currency exchange rates are separately disclosed.
Foreign Currency Spot Contracts: The Funds may enter into foreign currency spot contracts to facilitate transactions in foreign securities or to convert foreign currency receipts into U.S. dollars. A foreign currency spot contract is an agreement between two parties to buy and sell currencies at the current market rate, for settlement generally within two business days. The U.S. dollar value of the contracts is determined using current currency exchange rates supplied by a pricing service.
The contract is marked-to-market daily for settlements beyond one day and any change in market value is recorded as an unrealized gain or loss. When the contract is closed, a realized gain or loss is recorded equal to the difference between the value on the open and close date. Losses may arise from changes in the value of the foreign currency, or if the counterparties do not perform under the contract’s terms. The maximum potential loss from such contracts is the aggregate face value in U.S. dollars at the time the contract was opened.
Trust Expenses: Some expenses of the Trust can be directly attributed to the Funds. Expenses which cannot be directly attributed to the Funds are apportioned among all funds in the Trust based on average net assets of each fund.
Fund and Class Expenses: Expenses that are specific to a Fund or class of shares of a Fund, including distribution fees (Rule 12b-1 fees), are charged directly to that Fund or share class. Expenses that are common to all Funds generally are allocated among the Funds in proportion to their average daily net assets.
Federal Income Taxes: The Funds comply with the requirements under Subchapter M of the Internal Revenue Code of 1986, as amended, applicable to regulated investment companies and intend to distribute substantially all of their net taxable income and net capital gains, if any, each year so that it will not be subject to excise tax on undistributed income and gains. The Funds are not subject to income taxes to the extent such distributions are made.
Distributions to Shareholders: Each Fund normally pays dividends and distributes capital gains, if any, on an annual basis. Income dividend distributions are derived from dividends and other income each Fund receives from their investments, including short term capital gains. Long term capital gain distributions are derived from gains realized when each Fund sells a security it has owned for more than a year. Each Fund may make additional distributions and dividends at other times if the portfolio manager believes doing so may be necessary for each Fund to avoid or reduce taxes. The Funds intend to pass through foreign tax credits to shareholders.
Epidemic and Pandemic Risk: Certain countries have been susceptible to epidemics, most recently COVID-19, which has been designated as a pandemic by world health authorities. The outbreak of such epidemics, together with any resulting restrictions on travel or quarantines imposed, could have a negative impact on the economy and business activity globally (including in the countries in which we invest), and thereby could adversely affect the performance of our investments. Furthermore, the rapid development of epidemics could preclude prediction as to their ultimate adverse impact on economic and market conditions, and, as a result, present material uncertainty and risk with respect to us and the performance of our investments.
| 26 | 1.855.775.3337 | www.rondureglobal.com |
| Rondure Funds | Notes to Financial Statements |
| | April 30, 2020 |
3. TAX BASIS INFORMATION
Reclassifications: As of April 30, 2020, permanent differences in book and tax accounting were reclassified. These differences had no effect on net assets. The reclassifications were as follows:
| Fund | | Paid-in Capital | | | Distributable earnings | |
| Rondure New World Fund | | $ | – | | | $ | – | |
| Rondure Overseas Fund | | | 1 | | | | (1 | ) |
Tax Basis of Investments: As of April 30, 2020, the aggregate cost of investments, gross unrealized appreciation/(depreciation) and net unrealized appreciation/(depreciation) for Federal tax purposes was as follows:
| Fund | | Gross Appreciation (excess of value over tax cost) | | | Gross Depreciation (excess of tax cost over value) | | | Net Appreciation/ (Depreciation) of Foreign Currency | | | Net Unrealized Appreciation/ (Depreciation) | | | Cost of Investments for Income Tax Purposes | |
| Rondure New World Fund | | $ | 16,549,918 | | | $ | (17,224,727 | ) | | $ | (1,077 | ) | | $ | (675,886 | ) | | $ | 137,715,425 | |
| Rondure Overseas Fund | | | 1,847,757 | | | | (793,119 | ) | | | 3,684 | | | | 1,058,322 | | | | 18,158,010 | |
Components of Earnings: As of April 30, 2020, components of distributable earnings on a tax basis were as follows:
| | | Rondure New World Fund | | | Rondure Overseas Fund | |
| Undistributed ordinary income | | $ | 30,736 | | | $ | 72,571 | |
| Accumulated capital losses | | | (9,270,502 | ) | | | (1,982,507 | ) |
| Net unrealized appreciation/(depreciation) on investments | | | (675,886 | ) | | | 1,058,322 | |
| Total distributable earnings | | $ | (9,915,652 | ) | | $ | (851,614 | ) |
Capital Losses arising in the post-October period of the current fiscal year may be deferred to the next fiscal year if the fund elects to defer the recognition of these losses. When this election is made, any losses recognized during the period are treated as having occurred on the first day of the next fiscal year separate from and in addition to the application of normal capital loss carry forwards as described below.
The Funds elect to defer to the period ending April 30, 2021, capital losses recognized during the period November 1, 2019 – April 30, 2020 in the amounts of:
| Fund | | Capital Losses Recognized | |
| Rondure New World Fund | | $ | 1,300,851 | |
| Rondure Overseas Fund | | | 855,222 | |
Under current law, capital losses maintain their character as short-term or long-term and are carried forward to the next tax year without expiration. As of the current fiscal year end, the following amounts are available as carry forwards to the next tax year:
| Fund | | Short-Term | | | Long-Term | |
| Rondure New World Fund | | $ | 4,246,720 | | | $ | 3,722,931 | |
| Rondure Overseas Fund | | | 765,303 | | | | 361,982 | |
Tax Basis of Distributions to Shareholders: The character of distributions made during the year from net investment income or net realized gains may differ from its ultimate characterization for federal income tax purposes. Also, due to the timing of dividend distributions, the fiscal year in which amounts are distributed may differ from the fiscal year in which the income or realized gain were recorded by the Funds.
| Annual Report | April 30, 2020 | 27 |
| Rondure Funds | Notes to Financial Statements |
| | April 30, 2020 |
The tax characters of distributions paid by the Funds for the year ended April 30, 2020 were as follows:
| Fund | | Ordinary Income | | | Long-Term Capital Gain | |
| Rondure New World Fund | | $ | 1,174,514 | | | $ | – | |
| Rondure Overseas Fund | | | 210,677 | | | | – | |
The tax characters of distributions paid by the Funds for the year ended April 30, 2019 were as follows:
| Fund | | Ordinary Income | | | Long-Term Capital Gain | |
| Rondure New World Fund | | $ | 939,867 | | | $ | – | |
| Rondure Overseas Fund | | | 289,182 | | | | – | |
4. SECURITIES TRANSACTIONS
The cost of purchases and proceeds from sales of securities (excluding short term securities) during the year ended April 30, 2020 were as follows:
| Fund | | Purchases of Securities | | | Proceeds From Sales of Securities | |
| Rondure New World Fund | | $ | 56,702,214 | | | $ | 35,390,482 | |
| Rondure Overseas Fund | | | 13,938,494 | | | | 16,099,469 | |
5. SHARES OF BENEFICIAL INTEREST
The capitalization of the Trust consists of an unlimited number of shares of beneficial interest with no par value per share. Holders of the shares of the Funds of the Trust have one vote for each share held and a proportionate fraction of a vote for each fractional share. All shares issued and outstanding are fully paid and are transferable and redeemable at the option of the shareholder. Purchasers of the share do not have any obligation to make payments to the Trust or its creditors solely by reason of the purchasers’ ownership of the shares. Shares have no pre-emptive rights.
Shares redeemed within 60 days of purchase may incur a 2% short-term redemption fee deducted from the redemption amount. For the year ended April 30, 2020, the redemption fees charged by the Funds are presented in the Statement of Changes in Net Assets.
6. MANAGEMENT AND RELATED-PARTY TRANSACTIONS
The Advisor, subject to the authority of the Board, is responsible for the overall management and administration of the Funds’ business affairs. The Advisor manages the investments of the Funds in accordance with the Funds’ investment objective, policies and limitations and investment guidelines established jointly by the Advisor and the Trustees. Pursuant to the Advisory Agreement, (the “Advisory Agreement”), each Fund pays the Advisor an annual management fee based on each Fund’s average daily net assets. The management fee is paid on a monthly basis. The following table reflects the Funds’ advisory fee rates.
| Fund | | Advisory Fee | |
| Rondure New World Fund | | | 0.85 | % |
| Rondure Overseas Fund | | | 0.70 | % |
| 28 | 1.855.775.3337 | www.rondureglobal.com |
| Rondure Funds | Notes to Financial Statements |
| | April 30, 2020 |
The Advisor has contractually agreed to limit certain of each Fund’s expenses (excluding acquired fund fees and expenses, brokerage expenses, interest expense, taxes and extraordinary expenses). The following table reflects the Funds’ expense cap.
| Fund | Expense Cap | Term of Expense Limit Agreements |
| Rondure New World Fund | | |
| Institutional Class | 1.10% | September 1, 2019 – August 31, 2020/ |
| Investor Class | 1.35% | September 1, 2018 – August 31, 2019 |
| Rondure Overseas Fund | | |
| Institutional Class | 0.85% | September 1, 2019 – August 31, 2020/ |
| Investor Class | 1.10% | September 1, 2018 – August 31, 2019 |
Pursuant to these agreements, the Advisor may seek reimbursement from a Fund for any previous fee waivers and expense reimbursements made by the Advisor, provided that any such reimbursements made by the Funds to the Advisor will not cause the Funds’ expense limitation to exceed expense limitations in existence at the time the expense was incurred, or at the time of the reimbursement, whichever is lower, and the reimbursement is made within three years after the expenses were incurred. Fees waived/reimbursed by Advisor for the year ended April 30, 2020 are disclosed in the Statements of Operations.
For the year ended April 30, 2020, the fee waivers/reimbursements and/or recoupments were as follows:
| Fund | | Fees Waived/Reimbursed By Adviser | |
| Rondure New World Fund Fund | | | |
| Institutional Class | | $ | 385,786 | |
| Investor Class | | | 73,814 | |
| Rondure Overseas Fund Fund | | | | |
| Institutional Class | | $ | 162,555 | |
| Investor Class | | | 33,740 | |
| Fund | | Expires 2021 | | | Expires 2022 | | | Expires 2023 | | | Total | |
| Rondure New World Fund | | | | | | | | | | | | |
| Institutional Class | | $ | 366,501 | | | $ | 357,945 | | | $ | 385,786 | | | $ | 1,110,232 | |
| Investor Class | | | 90,647 | | | | 90,396 | | | | 73,814 | | | | 254,857 | |
| Rondure Overseas Fund | | | | | | | | | | | | | | | | |
| Institutional Class | | $ | 186,581 | | | $ | 165,269 | | | $ | 162,555 | | | $ | 514,405 | |
| Investor Class | | | 33,311 | | | | 42,849 | | | | 33,740 | | | | 109,900 | |
Administrator Fees and Expenses
ALPS Fund Services, Inc. (“ALPS”) serves as administrator to the Funds and the Funds have agreed to pay expenses incurred in connection with their administrative activities. Pursuant to an Administration Agreement, ALPS provides operational services to the Funds including, but not limited to, fund accounting and fund administration and generally assists in the Funds’ operations. Officers of the Trust are employees of ALPS. The Funds’ administration fee is accrued on a daily basis and paid monthly. Administration fees paid by the Funds for the year ended April 30, 2020 are disclosed in the Statements of Operations.
ALPS is reimbursed by the Funds for certain out-of-pocket expenses.
Transfer Agent
ALPS serves as transfer, dividend paying and shareholder servicing agent for the Funds. ALPS receives an annual minimum fee, a fee based upon the number of shareholder accounts, and is also reimbursed by the Funds for certain out-of-pocket expenses. Transfer agent fees paid by the Funds for the year ended April 30, 2020 are disclosed in the Statements of Operations.
| Annual Report | April 30, 2020 | 29 |
| Rondure Funds | Notes to Financial Statements |
| | April 30, 2020 |
Compliance Services
ALPS provides services that assist the Trust’s chief compliance officer in monitoring and testing the policies and procedures of the Trust in conjunction with requirements under Rule 38a-1 under the 1940 Act and receives an annual base fee. ALPS is reimbursed for certain out-of-pocket expenses by the Funds. Compliance service fees paid by the Funds for the year ended April 30, 2020 are disclosed in the Statements of Operations.
Principal Financial Officer
ALPS receives an annual fee for providing principal financial officer services to the Funds. Principal financial officer fees paid by the Fund for the year ended April 30, 2020 are disclosed in the Statements of Operations.
Distributor
ALPS Distributors, Inc. (“ADI” or the “Distributor”) (an affiliate of ALPS) acts as the distributor of the Funds’ shares pursuant to a Distribution Agreement with the Trust. Shares are sold on a continuous basis by ADI as agent for the Funds, and ADI has agreed to use its best efforts to solicit orders for the sale of each Fund’s shares, although it is not obliged to sell any particular amount of shares. ADI is not entitled to any compensation for its services as Distributor. ADI is registered as a broker-dealer with the U.S. Securities and Exchange Commission.
Each Fund has adopted a Distribution and Services (Rule 12b-1) Plan pursuant to Rule 12b-1 of the 1940 Act (the “Plan”) for its Investor Class shares. The Plan allows the Funds to use Investor Class assets to pay fees in connection with the distribution and marketing of Investor Class shares and/or the provision of shareholder services to Investor Class shareholders. The Plan permits payment for services in connection with the administration of plans or programs that use Investor Class shares of each Fund as their funding medium and for related expenses. The recipients of such payments may include the Distributor, other affiliates of the Advisor, broker-dealers, financial institutions, plan sponsors and administrators and other financial intermediaries through which investors may purchase shares of the Fund. The Plan permits the Funds to make total payments at an annual rate of up to 0.25% of each Fund’s average daily net assets attributable to its Investor Class shares. The expenses of the Plan are reflected as distribution and service fees in the Statements of Operations.
Trustees
The fees and expenses of the Trustees of the Board are presented in the Statements of Operations.
7. INDEMNIFICATIONS
Under the Trust’s organizational documents, its officers and Trustees are indemnified against certain liability arising out of the performance of their duties to the Trust. Additionally, in the normal course of business, the Trust enters into contracts with service providers that may contain general indemnification clauses, which may permit indemnification to the extent permissible under applicable law. The Trust’s maximum exposure under these arrangements is unknown, as this would involve future claims that may be made against the Trust that have not yet occurred.
| 30 | 1.855.775.3337 | www.rondureglobal.com |
| | Report of Independent Registered |
| Rondure Funds | Public Accounting Firm |
To the shareholders and the Board of Trustees of Financial Investors Trust
Opinion on the Financial Statements and Financial Highlights
We have audited the accompanying statements of assets and liabilities, including the portfolios of investments, of Rondure New World Fund and Rondure Overseas Fund (the "Funds"), two of the funds constituting the Financial Investors Trust, as of April 30, 2020, the related statements of operations for the year then ended, the statements of changes in net assets for each of the two years in the period then ended, the financial highlights for each of the two years in the period then ended and for the period May 2, 2017 (commencement of operations) to April 30, 2018, and the related notes. In our opinion, the financial statements and financial highlights present fairly, in all material respects, the financial position of Rondure New World Fund and Rondure Overseas Fund of Financial Investors Trust as of April 30, 2020, and the results of their operations for the year then ended, the changes in their net assets for each of the two years in the period then ended, and the financial highlights for each of the two years in the period then ended and for the period May 2, 2017 (commencement of operations) to April 30, 2018, in conformity with accounting principles generally accepted in the United States of America.
Basis for Opinion
These financial statements and financial highlights are the responsibility of the Funds’ management. Our responsibility is to express an opinion on the Funds’ financial statements and financial highlights based on our audits. We are a public accounting firm registered with the Public Company Accounting Oversight Board (United States) (PCAOB) and are required to be independent with respect to the Funds in accordance with the U.S. federal securities laws and the applicable rules and regulations of the Securities and Exchange Commission and the PCAOB.
We conducted our audits in accordance with the standards of the PCAOB. Those standards require that we plan and perform the audit to obtain reasonable assurance about whether the financial statements and financial highlights are free of material misstatement, whether due to error or fraud. The Funds are not required to have, nor were we engaged to perform, an audit of their internal control over financial reporting. As part of our audits we are required to obtain an understanding of internal control over financial reporting but not for the purpose of expressing an opinion on the effectiveness of the Funds’ internal control over financial reporting. Accordingly, we express no such opinion.
Our audits included performing procedures to assess the risks of material misstatement of the financial statements and financial highlights, whether due to error or fraud, and performing procedures that respond to those risks. Such procedures included examining, on a test basis, evidence regarding the amounts and disclosures in the financial statements and financial highlights. Our audits also included evaluating the accounting principles used and significant estimates made by management, as well as evaluating the overall presentation of the financial statements and financial highlights. Our procedures included confirmation of securities owned as of April 30, 2020, by correspondence with the custodian and brokers; when replies were not received from brokers, we performed other auditing procedures. We believe that our audits provide a reasonable basis for our opinion.
DELOITTE & TOUCHE LLP
Denver, Colorado
June 29, 2020
We have served as the auditor of one or more investment companies advised by Rondure Global Advisors, LLC since 2018.
| Annual Report | April 30, 2020 | 31 |
| Rondure Funds | Additional Information |
| | April 30, 2020 (Unaudited) |
1. FUND HOLDINGS
The Funds file their complete schedule of portfolio holdings with the Commission for the first and third quarters of each fiscal year as an exhibit to its reports on Form N-PORT. The Funds’ Form N-PORT reports are available on the Commission’s Web site at http://www.sec.gov. The Funds’ Form N-PORTs are also available upon request by calling toll-free (855) 775-3337.
2. FUND PROXY VOTING POLICIES, PROCEDURES AND SUMMARIES
The Funds’ policies and procedures used in determining how to vote proxies and information regarding how the Funds voted proxies relating to portfolio securities during the most recent prior 12-month period ending June 30 are available without charge, (1) upon request, by calling (toll-free) 1-855-775-3337 and (2) on the SEC’s website at http://www.sec.gov.
3. TAX DESIGNATIONS
The Funds designate the following amounts for federal income tax purposes for the fiscal year ended April 30, 2020:
| | Foreign Taxes Paid | Foreign Source Income |
| Rondure Overseas Fund | $44,461 | $422,571 |
| Rondure New World Fund | $210,052 | $2,930,766 |
Of the distributions paid by the Funds from ordinary income for the calendar year ended December 31, 2019, the following percentages met the requirements to be treated as qualifying for the corporate dividends received deduction and qualified dividend income:
| | Dividend Received Deduction | Qualified Dividend Income |
| Rondure Overseas Fund | 1.89% | 100.00% |
| Rondure New World Fund | 8.29% | 80.27% |
In early 2020, if applicable, shareholders of record received this information for the distributions paid to them by the Funds during the calendar year 2019 via Form 1099. The Funds will notify shareholders in early 2021 of amounts paid to them by the Funds, if any, during the calendar year 2020.
| 32 | 1.855.775.3337 | www.rondureglobal.com |
| Rondure Funds | Disclosure Regarding Approval of Fund Advisory Agreement |
| | April 30, 2020 (Unaudited) |
Rondure Funds
On September 10, 2019, the Trustees met in person to discuss, among other things, the approval of the Investment Advisory Agreement between the Trust, with respect to the Rondure New World Fund and the Rondure Overseas Fund (collectively, the “Rondure Funds”) and Rondure, in accordance with Section 15(c) of the 1940 Act. In renewing and approving the Investment Advisory Agreement with Rondure, on behalf of the Rondure Funds, the Trustees, including the independent Trustees, considered the following factors with respect to the Rondure Funds:
Investment Advisory Fee Rate: The Trustees reviewed and considered the contractual annual advisory fees paid by the Trust, on behalf of the Rondure Funds, to Rondure, of 0.85% of the Rondure New World Fund’s daily net assets and 0.70% of the Rondure Overseas Fund’s daily net assets, in light of the extent and quality of the advisory services provided by Rondure to each of the Rondure Funds.
The Board received and considered information including a comparison of the Investor Class and Institutional Class of each Rondure Fund’s contractual advisory fee rate with those of funds in the peer group and universe of funds provided by an independent provider of investment company data (the “Data Provider”). The Trustees noted that the contractual advisory fee rate of both classes of each of the Rondure Funds was below the Data Provider peer group and universe medians.
Total Net Expense Ratios: The Trustees further reviewed and considered that the total net expense ratios of both classes of each of the Rondure Funds was generally below the Data Provider peer group and universe medians.
Nature, Extent, and Quality of the Services under the Investment Advisory Agreement: The Trustees received and considered information regarding the nature, extent, and quality of services provided to the Rondure Funds under the Investment Advisory Agreement. The Trustees reviewed certain background materials supplied by Rondure in its presentation, including its Form ADV.
The Trustees reviewed and considered Rondure’s investment advisory personnel, its history as an asset manager, and its performance and the amount of assets currently under management by Rondure and its affiliated entities. The Trustees also reviewed the research and decision-making processes utilized by Rondure, including the methods adopted to seek to achieve compliance with the investment objectives, policies, and restrictions of the Rondure Funds.
The Trustees considered the background and experience of Rondure’s management in connection with the Rondure Funds, including reviewing the qualifications, backgrounds, and responsibilities of the management team primarily responsible for the day-to-day portfolio management of each Rondure Fund and the extent of the resources devoted to research and analysis of actual and potential investments.
The Trustees also reviewed, among other things, Rondure’s insider trading policies and procedures and its Code of Ethics.
Performance: The Trustees reviewed performance information for the Investor Class and Institutional Class shares of the Rondure Funds for the 3-month and 1-year periods ended June 30, 2019. That review included a comparison of each Rondure Fund’s performance to the performance of a group of comparable funds selected by the Data Provider. The Trustees noted that the performance of both classes of the Rondure New World Fund was above the Data Provider universe median for the 3-month and 1-year periods and that the performance of both classes of the Rondure Overseas Fund was below the Data Provider universe median for the 3-month and 1-year periods. The Trustees also considered Rondure’s discussion of its reputation generally and its investment techniques, risk management controls, and decision-making processes.
Comparable Accounts: The Trustees noted certain information provided by Rondure regarding fees charged to its other clients utilizing a strategy similar to that employed by the Rondure Funds.
Profitability: The Trustees received and considered a retrospective and projected profitability analysis prepared by Rondure based on the fees payable under the Investment Advisory Agreement with respect to the Rondure Funds. The Trustees considered the profits, if any, anticipated to be realized by Rondure in connection with the operation of the Rondure Funds. The Board then reviewed Rondure’s income statement and balance sheet for the years ended December 31, 2016 through December 31, 2018 in order to analyze the financial condition, stability, and profitability of Rondure.
Economies of Scale: The Trustees considered whether economies of scale in the provision of services to the Rondure Funds will be passed along to the shareholders under the proposed agreements.
Other Benefits to the Adviser: The Trustees reviewed and considered any other incidental benefits derived or to be derived by Rondure from its relationship with the Rondure Funds, including whether soft dollar arrangements were used.
| Annual Report | April 30, 2020 | 33 |
| Rondure Funds | Disclosure Regarding Approval of Fund Advisory Agreement |
| | April 30, 2020 (Unaudited) |
In renewing Rondure as the Rondure Funds’ investment adviser and renewing the Investment Advisory Agreement and the fees charged under the Investment Advisory Agreement, the Trustees concluded that no single factor reviewed by the Trustees was identified by the Trustees to be determinative as the principal factor in whether to renew the Investment Advisory Agreement. Further, the Independent Trustees were advised by separate independent legal counsel throughout the process. The Trustees, including all of the Independent Trustees, concluded that:
| ● | the contractual advisory fee rate of both classes of each of the Rondure Funds was below the Data Provider peer group and universe medians; |
| ● | the total net expense ratios of both classes of each of the Rondure Funds was below the Data Provider peer group and universe medians; |
| ● | the nature, extent, and quality of services rendered by Rondure under the Investment Advisory Agreement with respect to each Rondure Fund were adequate; |
| ● | for the period ended June 30, 2019, the performance of both classes of the Rondure New World Fund was above the Data Provider universe median for the 3-month and 1-year periods and the performance of both classes of the Rondure Overseas Fund was below the Data Provider universe median for the 3-month and 1-year periods; |
| ● | bearing in mind the limitations of comparing different types of managed accounts and the different levels of service typically associated with such accounts, the fee structures applicable to Rondure’s other clients employing a comparable strategy to any of the Rondure Funds were not indicative of any unreasonableness with respect to the advisory fee payable by the Rondure Funds; |
| ● | the profit, if any, realized by Rondure in connection with the operation of any of the Rondure Funds is not unreasonable; and |
| ● | there were no material economies of scale or other incidental benefits accruing to Rondure in connection with its relationship with any of the Rondure Funds. |
Based on the Trustees’ deliberations and their evaluation of the information described above, the Trustees, including all of the Independent Trustees, concluded that Rondure’s compensation for investment advisory services is consistent with the best interests of each of the Rondure Funds and their shareholders.
| 34 | 1.855.775.3337 | www.rondureglobal.com |
| Rondure Funds | Liquidity Risk Management Program |
| | April 30, 2020 (Unaudited) |
The Financial Investors Trust (the “Trust”) has established a liquidity risk management program (the “Program”) to govern the Trust’s approach to managing liquidity risk for each fund in the Trust (each a “Fund”). The Program is overseen by the Liquidity Committee (the “Committee”), a committee comprised of representatives of the Trust’s investment advisers, sub-advisers, and Officers of the Trust. The Trust’s Board of Trustees (the “Board”) has approved the designation of the Committee to oversee the Program.
The Program’s principal objectives include supporting each Fund’s compliance with limits on investments in illiquid assets and mitigating the risk that a Fund will be unable to meet its redemption obligations in a timely manner. The Program also includes a number of elements that support the management and assessment of liquidity risk, including a periodic assessment of factors that influence a Fund’s liquidity and the periodic classification and re-classification of the Fund’s investments into groupings that reflect the Committee’s assessment of their relative liquidity under current market conditions.
At a meeting of the Board held on March 10, 2020, the Trustees received a report from the Committee regarding the design and operational effectiveness of the Program since its implementation on December 1, 2018. The Committee determined, and reported to the Board, that the Program is reasonably designed to assess and manage each Fund’s liquidity risk and has operated adequately and effectively to manage each Fund’s liquidity risk since implementation.
The Committee reported that during the period covered by the report, there were no liquidity events that impacted the Funds or their ability to timely meet redemptions without dilution to existing shareholders. Among other things, the Board noted that the Funds are not required to have a highly liquid investment minimum based on their liquidity classifications. The Board further noted that no material changes have been made to the Program since its implementation.
| Annual Report | April 30, 2020 | 35 |
| Rondure Funds | Trustees and Officers |
| | April 30, 2020 |
Additional information regarding the Fund’s trustees is included in the Statement of Additional Information, which can be obtained without charge by calling 855-775-3337.
INDEPENDENT TRUSTEES
| Name, Address* & Year of Birth | Position(s) Held with Fund | Term of Office** and Length of Time Served | Principal Occupation(s) During Past 5 Years*** | Number of Funds in Fund Complex Overseen by Trustee**** | Other Directorships Held by Trustee During Past 5 Years*** |
Mary K. Anstine,
1940 | Trustee and Chairman | Ms. Anstine was elected at a special meeting of shareholders held on March 21, 1997 and re-elected at a special meeting of shareholders held on August 7, 2009. Ms. Anstine was appointed Chairman of the Board at the June 6, 2017 meeting of the Board of Trustees. | Ms. Anstine was formerly an Executive Vice President of First Interstate Bank of Denver until 1994, President/Chief Executive Officer of HealthONE Alliance, Denver, Colorado, from 1994 to 2004, and has been retired since 2004. Ms. Anstine is also Trustee/Director of AV Hunter Trust and Colorado Uplift Board. Ms. Anstine was formerly a Director of the Trust Bank of Colorado (later purchased and now known as Northern Trust Bank), HealthONE and Denver Area Council of the Boy Scouts of America, and a member of the American Bankers Association Trust Executive Committee. | 31 | Ms. Anstine is a Trustee of ALPS ETF Trust (16 funds); ALPS Variable Investment Trust (7 funds); Reaves Utility Income Fund (1 fund); and Segall Bryant & Hamill Trust (16 funds). |
Jeremy W. Deems,
1976 | Trustee | Mr. Deems was appointed as a Trustee at the March 11, 2008 meeting of the Board of Trustees and elected at a special meeting of shareholders held on August 7, 2009. | Mr. Deems is the Co-Founder, Chief Operations Officer and Chief Financial Officer of Green Alpha Advisors, LLC, a registered investment advisor, and Co-Portfolio Manager of the Shelton Green Alpha Fund. Prior to joining Green Alpha Advisors, Mr. Deems was CFO and Treasurer of Forward Management, LLC, ReFlow Management Co., LLC, ReFlow Fund, LLC, a private investment fund, and Sutton Place Management, LLC, an administrative services company, from 1998 to June 2007. From 2004 to 2005, Mr. Deems also served as Treasurer of the Forward Funds and the Sierra Club Funds. | 31 | Mr. Deems is a Trustee of ALPS ETF Trust (16 funds); ALPS Variable Investment Trust (7 funds); Clough Funds Trust (1 fund); and Reaves Utility Income Fund (1 fund). |
| 36 | 1.855.775.3337 | www.rondureglobal.com |
| Rondure Funds | Trustees and Officers |
| | April 30, 2020 |
INDEPENDENT TRUSTEES
| Name, Address* & Year of Birth | Position(s) Held with Fund | Term of Office** and Length of Time Served | Principal Occupation(s) During Past 5 Years*** | Number of Funds in Fund Complex Overseen by Trustee**** | Other Directorships Held by Trustee During Past 5 Years*** |
Jerry G. Rutledge,
1944 | Trustee | Mr. Rutledge was elected at a special meeting of shareholders held on August 7, 2009. | Mr. Rutledge is the President and owner of Rutledge’s Inc., a retail clothing business. Mr. Rutledge is currently Director of the American National Bank. He was from 1994 to 2007 a Regent of the University of Colorado. | 31 | Mr. Rutledge is a Trustee of Clough Global Dividend and Income Fund (1 fund); Clough Global Equity Fund (1 fund); Clough Global Opportunities Fund (1 fund); and Principal Real Estate Income Fund (1 fund). |
Michael “Ross” Shell,
1970 | Trustee | Mr. Shell was elected at a special meeting of shareholders held on August 7, 2009. | Mr. Shell is Founder and CEO of Red Idea, LLC, a strategic consulting/early stage venture firm (since June 2008). From 1999 to 2009, he was a part-owner and Director of Tesser, Inc., a brand agency. From December 2005 to May 2008, he was Director, Marketing and Investor Relations, of Woodbourne, a REIT/real estate hedge fund and private equity firm. Prior to this, from May 2004 to November 2005, he worked as a business strategy consultant; from June 2003 to April 2004, he was on the Global Client Services team of IDEO, a product design/innovation firm; and from 1999 to 2003, he was President of Tesser, Inc. Mr. Shell graduated with honors from Stanford University with a degree in Political Science. | 31 | None. |
| Annual Report | April 30, 2020 | 37 |
| Rondure Funds | Trustees and Officers |
| | April 30, 2020 |
INTERESTED TRUSTEE
| Name, Address* & Year of Birth | Position(s) Held with Fund | Term of Office** and Length of Time Served | Principal Occupation(s) During Past 5 Years*** | Number of Funds in Fund Complex Overseen by Trustee**** | Other Directorships Held by Trustee During Past 5 Years*** |
Edmund J. Burke,
1961 | Trustee | Mr. Burke was elected as Trustee at a special meeting of shareholders held on August 7, 2009. | Mr. Burke joined ALPS in 1991 and served as the President and Director of ALPS Holdings, Inc., and ALPS Advisors, Inc., and Director of ALPS Distributors, Inc., ALPS Fund Services, Inc. (“ALPS”), and ALPS Portfolio Solutions Distributor, Inc. (collectively, the “ALPS Companies”). Mr. Burke retired from the ALPS Companies in June 2019. Mr. Burke is deemed an interested Trustee by virtue of his prior positions with the ALPS Companies. | 31 | Mr. Burke is a Trustee of ALPS ETF Trust (16 funds); Clough Global Dividend and Income Fund (1 fund); Clough Global Equity Fund (1 fund); Clough Global Opportunities Fund (1 fund); Clough Funds Trust (1 fund); Liberty All-Star Equity Fund (1 fund); and Director of the Liberty All-Star Growth Fund, Inc. (1 fund). |
| 38 | 1.855.775.3337 | www.rondureglobal.com |
| Rondure Funds | Trustees and Officers |
| | April 30, 2020 |
OFFICERS
| Name, Address* & Year of Birth | Position(s) Held with Fund | Term of Office** and Length of Time Served | Principal Occupation(s) During Past 5 Years*** |
Bradley J. Swenson,
1972 | President | Mr. Swenson was elected President of the Trust at the June 11 – 12, 2019 meeting of the Board of Trustees. | Mr. Swenson joined ALPS in 2004 and has served as its President since June 2019. In this role, he serves as an officer to certain other closed-end and open-end investment companies. He previously served as the Chief Operating Officer of ALPS (2015-2019). Mr. Swenson also previously served as Chief Compliance Officer to ALPS, its affiliated entities, and to certain ETF, closed-end and open-end investment companies (2004-2015). Because of his position with ALPS, Mr. Swenson is deemed an affiliate of the Trust as defined under the 1940 Act. |
Kimberly R. Storms,
1972 | Treasurer | Ms. Storms was elected Treasurer of the Trust at the March 12, 2013 meeting of the Board of Trustees. | Ms. Storms is Senior Vice President - Director of Fund Administration of ALPS. Because of her position with ALPS, Ms. Storms is deemed an affiliate of the Trust as defined under the 1940 Act. Ms. Storms is also Treasurer of ALPS Series Trust. Ms. Storms also serves as a Board member and Treasurer of The Center for Trauma & Resilience, a nonprofit agency. |
Karen S. Gilomen,
1970 | Secretary | Ms. Gilomen was elected Secretary of the Trust at the December 13, 2016 meeting of the Board of Trustees. | Ms. Gilomen joined ALPS in August 2016 as Vice President and Senior Counsel. Prior to joining ALPS, Ms. Gilomen was Vice President - General Counsel & CCO of Monticello Associates, Inc. from 2010 to 2016. Because of her position with ALPS, Ms. Gilomen is deemed an affiliate of the Trust, as defined under the 1940 Act. Ms. Gilomen is also the Secretary of ALPS Variable Investment Trust and Reaves Utility Income Fund, and the Assistant Secretary of the WesMark Funds. |
Ted Uhl,
1974 | Chief Compliance Officer (“CCO”) | Mr. Uhl was appointed CCO of the Trust at the June 8, 2010 meeting of the Board of Trustees. | Mr. Uhl joined ALPS in October 2006, and is currently Deputy Compliance Officer of ALPS. Prior to his current role, Mr. Uhl served as Senior Risk Manager for ALPS from October 2006 until June 2010. Before joining ALPS, Mr. Uhl served a Sr. Analyst with Enenbach and Associates (RIA), and a Sr. Financial Analyst at Sprint. Because of his position with ALPS, Mr. Uhl is deemed an affiliate of the Trust as defined under the 1940 Act. Mr. Uhl is also CCO of the Boulder Growth & Income Fund, Inc., Centre Funds, Index Funds, Reality Shares ETF Trust, Reaves Utility Income Fund and XAI Octagon Floating Rate & Alternative Income Term Trust. |
Jennell Panella,
1974 | Assistant Treasurer | Ms. Panella was elected Assistant Treasurer of the Trust at the September 15, 2015 meeting of the Board of Trustees | Ms. Panella joined ALPS in June 2012 and is currently Fund Controller of ALPS Fund Services, Inc. Prior to joining ALPS, Ms. Panella served as Financial Reporting Manager for Parker Global Strategies, LLC (2009-2012). Because of her position with ALPS, Ms. Panella is deemed an affiliate of the Trust as defined under the 1940 Act. Ms. Panella also serves as Assistant Treasurer of James Advantage Funds. |
| Annual Report | April 30, 2020 | 39 |
| Rondure Funds | Trustees and Officers |
| | April 30, 2020 |
OFFICERS
| Name, Address* & Year of Birth | Position(s) Held with Fund | Term of Office** and Length of Time Served | Principal Occupation(s) During Past 5 Years*** |
Sharon Akselrod,
1974 | Assistant Secretary | Ms. Akselrod was elected Assistant Secretary of the Trust at the September 15, 2015 meeting of the Board of Trustees. | Ms. Akselrod joined ALPS in August 2014 and is currently Senior Investment Company Act Paralegal of ALPS Fund Services, Inc. Prior to joining ALPS, Ms. Akselrod served as Corporate Governance and Regulatory Associate for Nordstrom fsb (2013-2014) and Senior Legal Assistant – Legal Manager for AXA Equitable Life Insurance Company (2008-2013). Because of her position with ALPS, Ms. Akselrod is deemed an affiliate of the Trust as defined under the 1940 Act. Ms. Akselrod is also Secretary of Principal Real Estate Income Fund and Assistant Secretary of ALPS ETF Trust and Clough Funds Trust. |
Jennifer Craig,
1973 | Assistant Secretary | Ms. Craig was elected Assistant Secretary of the Trust at the June 8, 2016 meeting of the Board of Trustees. | Ms. Craig joined ALPS in 2007 and is currently Assistant Vice President and Paralegal Manager of ALPS. Because of her position with ALPS, Ms. Craig is deemed an affiliate of the Trust as defined under the 1940 Act. Ms. Craig is also Assistant Secretary of Clough Global Dividend and Income Fund, Clough Global Equity Fund, Clough Global Opportunities Fund, Principal Real Estate Income Fund, Liberty All-Star Equity Fund and Liberty All-Star Growth Fund, Inc. |
Sareena Khwaja-Dixon,
1980 | Assistant Secretary | Ms. Khwaja-Dixon was elected Assistant Secretary of the Trust at the December 12, 2017 meeting of the Board of Trustees. | Ms. Khwaja-Dixon joined ALPS in August 2015 and is currently Senior Counsel and Vice President of ALPS Fund Services, Inc. Prior to joining ALPS, Ms. Khwaja-Dixon served as a Senior Paralegal/Paralegal for Russell Investments (2011 – 2015). Because of her position with ALPS, Ms. Khwaja-Dixon is deemed an affiliate of the Trust as defined under the 1940 Act. Ms. Khwaja-Dixon is also Secretary of Liberty All-Star Equity Fund, Liberty All-Star Growth Fund, Inc., Clough Funds Trust, Clough Global Dividend and Income Fund, Clough Global Opportunities Fund, and Clough Global Equity Fund. |
| * | All communications to Trustees and Officers may be directed to Financial Investors Trust c/o 1290 Broadway, Suite 1000, Denver, CO 80203. |
| ** | This is the period for which the Trustee or Officer began serving the Trust. Each Trustee serves an indefinite term, until such Trustees successor is elected and appointed, or such Trustee resigns or is deceased. Officers are elected on an annual basis. |
| *** | Except as otherwise indicated, each individual has held the office shown or other offices in the same company for the last five years. |
| **** | The Fund Complex includes all series of the Trust, currently 31, and any other investment companies for which any Trustee serves as trustee for and for which Rondure Global Advisors, LLC provides investment advisory services (currently none). |
| 40 | 1.855.775.3337 | www.rondureglobal.com |
| Rondure Funds | Privacy Policy |
| | April 30, 2020 (Unaudited) |
| Who We Are | |
| Who is providing this notice? | Rondure New World Fund and Rondure Overseas Fund. |
| What We Do | |
| How do the Funds protect my personal information? | To protect your personal information from unauthorized access and use, we use security measures that comply with federal law. These measures include computer safeguards and secured files and buildings. |
| How do the Funds collect my personal information? | We collect your personal information, for example, when you • open an account • provide account information or give us your contact information • make a wire transfer or deposit money |
| Why can't I limit all sharing? | Federal law gives you the right to limit only • sharing for affiliates’ everyday business purposes-information about your creditworthiness • affiliates from using your information to market to you • sharing for non-affiliates to market to you State laws and individual companies may give you additional rights to limit sharing. |
| Definitions | |
| Affiliates | Companies related by common ownership or control. They can be financial and nonfinancial companies. |
| Non-affiliates | Companies not related by common ownership or control. They can be financial and nonfinancial companies. • The Funds does not share with non-affiliates so they can market to you. |
| Joint marketing | A formal agreement between non-affiliated financial companies that together market financial products or services to you. • The Funds does not jointly market. |
| Other Important Information | |
| California Residents | If your account has a California home address, your personal information will not be disclosed to nonaffiliated third parties except as permitted by applicable California law, and we will limit sharing such personal information with our affiliates to comply with California privacy laws that apply to us. |
| Vermont Residents | The State of Vermont requires financial institutions to obtain your consent prior to sharing personal information that they collect about you with affiliated companies and nonaffiliated third parties other than in certain limited circumstances. Except as permitted by law, we will not share personal information we collect about you with nonaffiliated third parties or other affiliated companies unless you provide us with your written consent to share such information. |
| Annual Report | April 30, 2020 | 41 |
| Rondure Funds | Privacy Policy |
| | April 30, 2020 (Unaudited) |
| FACTS | WHAT DO THE FUNDS DO WITH YOUR PERSONAL INFORMATION? |
| Why? | Financial companies choose how they share your personal information. Federal law gives consumers the right to limit some but not all sharing. Federal law also requires us to tell you how we collect, share, and protect your personal information. Please read this notice carefully to understand what we do. |
| What? | The types of personal information we collect and share depend on the product or service you have with us. This information can include: • Social Security number and account transactions • Account balances and transaction history • Wire transfer instructions |
| How? | All financial companies need to share customers’ personal information to run their everyday business. In the section below, we list the reasons financial companies can share their customers’ personal information; the reasons the Funds choose to share; and whether you can limit this sharing. |
| Reasons we can share your personal information | Do the Funds share: | Can you limit this sharing? |
| For our everyday business purposes — such as to process your transactions, maintain your account(s), respond to court orders and legal investigations, or report to credit bureaus | Yes | No |
| For our marketing purposes — to offer our products and services to you | No | We do not share. |
| For joint marketing with other financial companies | No | We do not share. |
| For our affiliates’ everyday business purposes — information about your transactions and experiences | Yes | No |
| For our affiliates’ everyday business purposes — information about your creditworthiness | No | We do not share. |
| For nonaffiliates to market to you | No | We do not share. |
| 42 | 1.855.775.3337 | www.rondureglobal.com |
Page Intentionally Left Blank

| Contact Us | | |
| Mail: | Rondure Funds, P.O. Box 13664, Denver, CO 80201 | E-Mail: | rondureglobal@alpsinc.com |
| Phone: | 1.855.775.3337 | Web: | www.rondureglobal.com |
TABLE OF CONTENTS
| Letter to Shareholders | 1 |
| Performance Review | |
| Seafarer Overseas Growth and Income Fund | 5 |
| Seafarer Overseas Value Fund | 11 |
| Disclosure of Fund Expenses | 18 |
| Portfolio of Investments | 20 |
| Statements of Assets and Liabilities | 27 |
| Statements of Operations | 28 |
| Statements of Changes in Net Assets | 29 |
| Financial Highlights | 32 |
| Notes to Financial Statements | 40 |
| Report of Independent Registered Public Accounting Firm | 51 |
| Additional Information | 52 |
| Approval of Fund Advisory Agreement | 53 |
| Liquidity Risk Management Program | 55 |
| Trustees and Officers | 56 |
| Privacy Policy | 61 |
Beginning on January 1, 2021, as permitted by regulations adopted by the U.S. Securities and Exchange Commission, paper copies of the Funds’ annual and semi-annual shareholder reports will no longer be sent by mail, unless you specifically request paper copies of the reports. Instead, the reports will be made available on the Funds’ website at seafarerfunds.com, and you will be notified by mail each time a report is posted and provided with a website link to access the report.
If you already elected to receive shareholder reports electronically, you will not be affected by this change, and you need not take any action. You may elect to receive shareholder reports and other communications from the Funds electronically by contacting your financial intermediary or, if you invest directly with the Funds, by logging into your Seafarer Funds account at seafarerfunds.com and enrolling in electronic delivery.
You may elect to receive future shareholder reports in paper format free of charge by contacting your financial intermediary or, if you invest directly with the Funds, by calling (855) 732-9220.
| Seafarer Funds | Letter to Shareholders |
April 30, 2020
LETTER TO SHAREHOLDERS
May 15, 2020
Dear Fellow Shareholders,
It is my pleasure to address you, our clients and shareholders of the Seafarer Overseas Growth and Income Fund and the Seafarer Overseas Value Fund (the “Seafarer Funds” and the “Funds”), at this challenging time. Having communicated directly with many of you in my role as Managing Director of Business Development and Client Services, it is an honor to be able to offer my viewpoints on Seafarer Capital Partners (“Seafarer,” the adviser to the Funds) and the state of U.S. investors’ exposure in the emerging markets.
This shareholder report covers the Funds’ 2019-20 fiscal year (May 1, 2019 – April 30, 2020).
Update on Seafarer Capital Partners – COVID-19 Response
The team at Seafarer has been resilient in the face of the disruptions to normal business operations brought about by the COVID-19 pandemic. Nonetheless, like many asset managers, the firm is experiencing the effects of the recent downdraft in markets. These challenging times have led to many productive conversations as clients assess how to incorporate emerging markets in portfolios moving forward.
While the effects of the pandemic on the markets have been multifaceted and complex, with further discussion below, this is first and foremost a public health crisis. Our thoughts are with those who have suffered from the disease or seen loved ones suffer. For Seafarer, the first priority is the health and safety of our employees and their families. The firm began deferring travel to China in January and travel to the rest of Asia shortly thereafter. The team began working remotely on a voluntary basis in early March. Shortly after Seafarer published a Message to Shareholders Regarding COVID-191 on March 16, the entire San Francisco Bay Area was placed under a Shelter-in-Place order, which remains in effect as of the date of this letter. Seafarer has sought to be thorough and thoughtful with business continuity planning. The firm has designed its systems so that the entire team is able to work remotely without disruption. Our remote work preparations were tested last year during the wildfires (and resulting power outages) in Northern California. Now, after more than two months of working remotely, operations within Seafarer have continued to run smoothly, as technology allows us to stay in close communication.
We at Seafarer hope for the safety and security of our shareholders during this challenging time. We look forward to resuming work travel and in-person visits with portfolio companies when it is safe to do so. In the meantime, we will continue to utilize technology and virtual communications to perform our jobs to the best of our ability.
Emerging Markets Exposure for Developed Market Investors in a Time of Crisis
In my years of helping developed market investors understand the risks and opportunities of investing in emerging markets, the most common question asked is, “Why should we bet on China instead of the U.S.?” Underlying this view is the fact that most U.S. investors still think of international equity investing in terms of broad-brush country views, rather than the individual companies that are the actual focus of our investment process. Also embedded in this question is an understanding that China is very different from the U.S. in terms of politics and economic structures. These differences can make it seem as if there is an insurmountable divergence of values between the two countries.
Seafarer has written extensively on the challenges of investing in a non-democratic country like China.2 The “Chinese Economic Miracle” has lifted 850 million people from extreme poverty in the last generation, a massive achievement.3 While that number in itself is staggering, at the same time we cannot brush over the issues and problems associated with Chinese Communist Party rule.
The question of whether investors should bet on China or the U.S. poses a false dichotomy. Developed market investors are not required to choose between either country; in fact, equity investors are
| Annual Report – April 30, 2020 | 1 |
| Seafarer Funds | Letter to Shareholders |
April 30, 2020
generally not investing in the countries at all, but in companies that happen to be located in the various countries. Rather than making a binary choice between markets, investors are diversifying their portfolios with a mix of risks and rewards in an effort to lower concentration risk.
The current environment, with the global spread of COVID-19 after its emergence in Wuhan, China, seems to have reinvigorated this nationalistic question about investing in China. My response to the question remains the same: I believe most developed market investors could benefit from the diversification offered by investing in the emerging markets globally and China specifically. However, I believe this exposure should not be achieved by simply investing in China or the emerging markets, but by investing in specific companies that have been well researched. While no analyst observing a company from the outside is ever fully able to trust the numbers (in China, the U.S. or anywhere) a well-diversified portfolio of emerging market equities whose current valuations under-represent their long-term growth potential could be a good diversifier for U.S. investors.
While my belief in the long-term benefits of emerging markets exposure for developed market investors remains steadfast, a review of the current crisis and various government responses raises some extremely challenging questions for the short and medium term. As the COVID-19 pandemic began to impact the U.S. economy in late February and March, equity and fixed income markets experienced a significant shock. The U.S. Federal Reserve and U.S. Congress immediately stepped in with monetary and fiscal responses to support fixed income markets and affected industries such as the airlines. These interventions, relative to those of the 2008 global financial crisis, were not only very large, but occurred rapidly and with little public discussion. In 2008, I recall weeks of debate concerning the merits of market intervention before the implementation of the Troubled Asset Relief Program (TARP) in October. For years afterward, financial industry conferences discussed the ramifications of the intervention. In 2020, I do not believe I have seen a headline or article that included a discussion of moral hazard. It seems to me that market observers have come to accept, or even anticipate, that the U.S. government will attempt to rescue markets during significant pullbacks. I have been taught in my career that the markets are the most efficient mechanism to determine the risk/reward tradeoff for securities – more efficient over short and medium time periods than any investor can be. If the markets have evolved to truly price in a “government put,” whereby they will be rescued in the time of crisis, the risk/reward mechanism of the market is skewed in an unprecedented way. This poses a significant challenge to active managers, particularly those who propose to manage portfolios in an effort to limit downside risk.
I was fortunate that a colleague recommended I read Charles P. Kindleberger’s 1978 book, Manias, Panics, and Crashes: A History of Financial Crises, in 2007. Dr. Kindleberger walks us through several of the most significant financial crises in history and the manias that preceded them. He describes three primary stages: the mania, in which investors scramble to gain access to assets at almost any price; the shock, which creates an initial panic as investors rush to exit these positions; and the resulting crash, where the economic impact of the panic is felt with real businesses declaring bankruptcy for lack of access to capital. This book helped me to understand what I experienced in the dot-com boom and bust of 2000-02, when I was a young financial advisor attempting to build a career in this industry. It also helped me to comprehend and contextualize the global financial crisis of 2008-09 as I attempted to build client relationships with professional investors.
I recently pulled the book from my bookshelf and have kept it on my desk as a reminder through the current market environment. I believe that it is important to keep a perspective on what has occurred so far in 2020. Flat market performance is not generally what one would expect in a health and economic crisis. While the equity market decline in the first quarter was dramatic and sharp, so too was the recovery. In fact, at the time of this letter, the S&P 500 (representing U.S. equity markets) is almost unchanged from its level just one year ago. While we face an unprecedented global health challenge, the peak to trough decline in the market this year pales in comparison to the NASDAQ decline in the early 2000s dot-com bust, the S&P 500 downturn in the Global Financial Crisis in 2008-09, and the significant pullback experienced by the “Tiger Economies” of Asia in the late 1990s. In Dr. Kindleberger’s construct, it appears to me that we have experienced a mania in the U.S. toward equities over the last several years, and a panic in global capital markets in March of 2020, but we have not yet experienced the crash phase, which can be so painful for equity investors and economies as a whole.
| 2 | (855) 732-9220 seafarerfunds.com |
| Seafarer Funds | Letter to Shareholders |
April 30, 2020
I would certainly never attempt to predict short-term market moves. Many investors much smarter and more attuned than I have gotten short-term calls consistently wrong. To say that we have not yet experienced the crash phase of the market cycle does not necessarily mean that we will. My view that the long bull market since the global financial crisis was a mania could be incorrect. It is possible that the U.S. Federal Reserve’s unprecedented intervention will be able to stave off the worst economic ramifications of the COVID-19 pandemic. In another year, we may be looking at the first quarter of 2020 as a blip in the bull market, similar to that of December 2018. However, I feel that investors should remain vigilant to the potential that while the initial panic may be over, there could be significant negative economic and market events to come. I do not believe that investors will be able to time the cycle and correctly guess when to re-enter at the bottom of a crash. The best remedy, in my opinion, is to build a well-diversified portfolio of real income producing assets in appropriate amounts to meet each investor’s particular risk tolerance, and rebalance to that appropriate asset allocation on a systematic, time-scheduled basis.
What Seafarer is Doing About the Crisis
I am very proud to be associated with the highly skilled, professional and diligent investment team at Seafarer Capital Partners. Throughout the last year, the team has continued to stay focused on the areas that we can control – our investment research activities on behalf of the Funds, our communications with shareholders and clients, and our internal management practices – while understanding that in the current environment there are many challenges that we cannot control. The team has remained focused on bottom-up research and security selection, and continues to re-assess the strategies and portfolios in light of the new market realities. To me, the Seafarer investment team strikes an impressive balance between sticking to established core principles for guidance while rejecting dogma that could blind the research process to new realities on the ground in the emerging markets. The Seafarer investment team continues to manage the strategies with the same investment philosophy and process that has been in place since the genesis of the firm in 2011.
In addition to managing the strategies, the Seafarer investment team produced two unique and important commentaries that were released in early April 2020, during the height of uncertainty in the markets. The China Investment Dilemma: Risks for U.S. Investors During A Turbulent Time4 by Nicholas Borst and A Tale of Two Indices5 by Steph Gan offer important views into the long-term viability of the emerging markets for U.S. investors.
While the future is uncertain at this time, that is the hallmark of equity investing. Taking an ownership position in a company entails the risk of loss of capital. However, in my experience, such risks are generally rewarded higher expected rates of return. As a result, I believe equity ownership can be one of the best ways to build long-term wealth and future income. Seafarer appreciates the opportunity to be your investment adviser seeking equity opportunities in the developing world.
Expense Ratios and Economies of Scale
As described in the Letter to Shareholders as of April 30, 2017, Seafarer has committed to reduce expenses for the Funds, particularly as time and scale afford greater efficiency.6
The scale of the Growth and Income Fund declined during the 2019-20 fiscal year; this in turn reversed some of the economies of scale that the Fund enjoyed in the prior year. The operating expense ratios for the fiscal year increased to 0.92% and 1.02% for the Institutional and Investor classes, respectively. For reference, the expense ratios were 0.90% and 0.99% for the respective classes during the preceding fiscal year.7 Despite the increase in the Fund’s expense ratios, Seafarer’s intention remains the same: to offer shareholders positive economies, over time and with scale.
Compared to the Growth and Income Fund, the Value Fund’s smaller scale does not yield an equivalent degree of cost efficiency. However, Seafarer has established the same underlying expense structure for both Funds. Should the Value Fund’s assets grow over time, it is expected to achieve similar economies of scale. In the meantime, Seafarer continues to “cap” the Fund’s operating expenses via a contractual commitment, such that its net expense ratios remain 1.05% and 1.15% for the Institutional and Investor classes, respectively.8
| Annual Report – April 30, 2020 | 3 |
| Seafarer Funds | Letter to Shareholders |
April 30, 2020
Thank you for entrusting us with your investment capital.
Daniel Duncan
Managing Director, Business Development and Client Services
Seafarer Capital Partners, LLC
The Funds are subject to investment risks, including possible loss of the principal amount invested and therefore are not suitable for all investors. The Funds may not achieve their objectives. Diversification does not ensure a profit or guarantee against loss.
Information on the Seafarer website and references to Seafarer publications are provided for textual reference only, and are not incorporated by reference into this report.
The S&P 500 Total Return Index is a stock market index based on the market capitalizations of 500 large companies with common stock listed on the NYSE or NASDAQ.
The NASDAQ Composite is a stock market index of the common stocks and similar securities (e.g. ADRs, tracking stocks, limited partnership interests) listed on the Nasdaq stock market.
It is not possible to invest directly in an index.
The views and information discussed in this commentary are as of the date of publication, are subject to change, and may not reflect Seafarer’s current views. The views expressed represent an assessment of market conditions at a specific point in time, are opinions only and should not be relied upon as investment advice regarding a particular investment or markets in general. Such information does not constitute a recommendation to buy or sell specific securities or investment vehicles. It should not be assumed that any investment will be profitable or will equal the performance of the portfolios or any securities or any sectors mentioned herein. The subject matter contained herein has been derived from several sources believed to be reliable and accurate at the time of compilation. Seafarer does not accept any liability for losses either direct or consequential caused by the use of this information.
| 1 | www.seafarerfunds.com/message-to-shareholders/2020/03/16 |
| 2 | www.seafarerfunds.com/letters-to-shareholders/2018/04/annual#china-at-a-crossroads www.seafarerfunds.com/letters-to-shareholders/2017/10/semi-annual#dream-for-china |
| 3 | China Overview (www.worldbank.org/en/country/china/overview), World Bank, 2020. |
| 4 | www.seafarerfunds.com/commentary/the-china-investment-dilemma |
| 5 | www.seafarerfunds.com/commentary/a-tale-of-two-indices |
| 6 | www.seafarerfunds.com/letters-to-shareholders/2017/04/annual#cost-reduction |
| 7 | The Growth and Income Fund’s Prospectus (dated August 31, 2019) states that the Fund’s expenses are 0.89% and 0.99% for the Institutional and Investor classes, respectively. |
| 8 | Seafarer Capital Partners, LLC has agreed contractually to waive and/or reimburse fees or expenses in order to limit Total Annual Fund Operating Expenses After Fee Waiver / Expense Reimbursements (inclusive of acquired fund fees and expenses, and exclusive of brokerage expenses, interest expenses, taxes and extraordinary expenses) to 1.15% and 1.05% of each Fund’s average daily net assets for the Investor and Institutional share classes, respectively. This agreement is in effect through August 31, 2020. |
| 4 | (855) 732-9220 seafarerfunds.com |
| Seafarer Overseas Growth and Income Fund | Performance Review |
April 30, 2020
SEAFARER OVERSEAS GROWTH AND INCOME FUND
PERFORMANCE REVIEW
May 15, 2020
This report addresses the Seafarer Overseas Growth and Income Fund’s 2019-20 fiscal year (May 1, 2019 to April 30, 2020).
During the fiscal year, the Fund returned -8.34%, while the Fund’s benchmark, the MSCI Emerging Markets Total Return Index, returned -11.65%.1 By way of broader comparison, the S&P 500 Index increased 0.86%.
From the Fund’s inception (February 15, 2012) through the end of the fiscal year (April 30, 2020), the Fund generated an annualized rate of return of 3.67%.2 The benchmark index rose at an annualized rate of 1.16% over the same period.
The Fund began the fiscal year with a net asset value (NAV) of $11.61 per share. During the ensuing twelve months, the Fund paid two distributions: $0.181 per share in June 2019 and $0.132 per share in December 2019. Those payments brought the cumulative distribution per share, as measured from the Fund’s inception to the end of the fiscal year, to $2.993. The Fund finished the fiscal year with a value of $10.36 per share.3
* * *
In the Growth and Income Fund’s semi-annual report for the period ended October 31, 2019, I attributed the benchmark’s wild swings to two elements: first, confusion and rapidly shifting sentiments regarding the progress towards resolution of the U.S.-China trade disputes; and second, the sharp deterioration in earnings results for companies in the developing world.4 At the end of 2019, the benchmark and the Growth and Income Fund appeared to rise on news of the U.S. and China publicly agreeing on “Phase 1” of a trade deal. In my view, markets responded not because of the merit of the deal itself – most thorny issues between the U.S. and China went unresolved – but rather because the agreement’s negotiation was drawn out for such a lengthy and public period that it became a facile “event” around which speculators engaged in short-term trading activity.
Yet such short-term gains would soon be reversed. In the first months of 2020, no stock market went unscathed as a novel coronavirus wrought social disruption, economic havoc, and death around the world. In February, equities in China and East Asia plunged; over the month of March, financial assets of all sorts gyrated wildly each day in response to the virus’ progression; by late March, stocks probed new depths due to the virus’ economic toll and malfunctions in critical U.S. financial markets. The U.S. Federal Reserve undertook unprecedented interventions that stabilized markets and established the Fed as a backstop for a remarkable range of financial assets. In response, global equities have recovered some ground, partly in anticipation of major economies ending lockdowns and re-opening businesses.
The Fund outperformed the benchmark over the fiscal year, but the Fund’s performance in February and March was disheartening. Despite the Fund’s substantial holdings in companies with cash-rich balance sheets, stable dividends and durable businesses, shareholders in the emerging markets dumped stocks in an indiscriminate manner, sending nearly all stock prices lower. Stocks with stable cash flow, substantial amounts of accumulated cash and attractive dividend yields were not defensive in March’s crash. This outcome was in equal parts frustrating and mystifying: it is exactly such businesses that are built and managed to withstand such difficult times, and yet investors dropped the stocks without regard to valuation or viability.
The only evident haven within the emerging markets was among high growth (but often loss-making) technology and software stocks. Such stocks proved remarkably resilient, despite high valuations and poor cash flow – no different, in fact, from the U.S. experience, where the expensive, technology-heavy and yield-poor NASDAQ Composite index performed substantially better than the Dow Jones Industrial Average index. On one hand, the outperformance of such “growth/momentum” stocks is not wholly surprising: in some cases, the companies they track deliver virtual, adaptable and clever services that
| Annual Report – April 30, 2020 | 5 |
| Seafarer Overseas Growth and Income Fund | Performance Review |
April 30, 2020
enjoy rising demand in an increasingly fraught world. Indeed, several companies of this sort have proven remarkably prescient and adaptive in their delivery of virtual services for communication, media, commerce and entertainment – services that can be delivered to an isolated populace amid pandemics, firestorms, floods and other social disruptions. Yet despite such obvious merit, I suspect that this same group of “growth/momentum” stocks in both developed and emerging countries have entered a valuation bubble, one that may yet come undone. With recession and possibly depression looming, will their customers’ demand not wane? And for those that make regular and large operating losses: how will they raise the billions necessary to stay in operation? How can the market be so cavalier about such threats?
One top contributor to the Fund’s total return during the fiscal year was Qualicorp, a Brazil-based life insurance broker. Qualicorp’s stock was propelled higher, at least until the pandemic struck, by substantial free cash flow generation and return of capital to shareholders. Other notable top contributors to total return during the period include Naver (a leading internet media company in South Korea), Orion (a Korea-based snack cake company with operations that span China and Vietnam), and Samsung Electronics (a semiconductor company from Korea).
The top detractors to the Fund’s total return for the fiscal year include Sanlam (a South Africa-based insurance company), First Pacific (a Hong Kong-headquartered conglomerate), and Hyundai Mobis (a Korea-based manufacturer of auto parts and systems).
Thank you for entrusting us with your capital. We are honored to serve as your investment adviser in the emerging markets.
Andrew Foster and Paul Espinosa
Portfolio Managers, Seafarer Overseas Growth and Income Fund
Seafarer Capital Partners, LLC
The MSCI Emerging Markets Total Return Index, Standard (Large+Mid Cap) Core, Gross (dividends reinvested), USD is a free float-adjusted market capitalization index designed to measure equity market performance of emerging markets. Index code: GDUEEGF.
The S&P 500 Total Return Index is a stock market index based on the market capitalizations of 500 large companies with common stock listed on the NYSE or NASDAQ.
The NASDAQ Composite Index is a stock market index of the common stocks and similar securities (e.g. ADRs, tracking stocks, limited partnership interests) listed on the Nasdaq stock market. Index code: COMP.
The Dow Jones Industrial Average Index is a stock market index that measures the stock performance of 30 large companies listed on stock exchanges in the U.S. Index code: DJIA.
It is not possible to invest directly in an index.
The Fund is subject to investment risks, including possible loss of the principal amount invested and therefore is not suitable for all investors. The Fund may not achieve its objectives. Diversification does not ensure a profit or guarantee against loss.
Information on the Seafarer website is provided for textual reference only, and is not incorporated by reference into this report.
The views and information discussed in this commentary are as of the date of publication, are subject to change, and may not reflect Seafarer’s current views. The views expressed represent an assessment of market conditions at a specific point in time, are opinions only and should not be relied upon as investment advice regarding a particular investment or markets in general. Such information does not constitute a recommendation to buy or sell specific securities or investment vehicles. It should not be assumed that any investment will be profitable or will equal the performance of the portfolios or any securities or any sectors mentioned herein. The subject matter contained herein has been derived from several sources believed to be reliable and accurate at the time of compilation. Seafarer does not accept any liability for losses either direct or consequential caused by the use of this information.
| 6 | (855) 732-9220 seafarerfunds.com |
| Seafarer Overseas Growth and Income Fund | Performance Review |
April 30, 2020
| 1 | References to the “Fund” pertain to the Fund’s Institutional share class (ticker: SIGIX). The Investor share class (ticker: SFGIX) returned -8.44% during the fiscal year. |
| 2 | The Fund’s Investor share class generated an annualized rate of return of 3.55% from the Fund’s inception through the end of the fiscal year. |
| 3 | The Fund’s Investor share class began the fiscal year with a net asset value of $11.56 per share. The Fund paid two distributions: $0.179 per share in June 2019 and $0.126 per share in December 2019. The Fund finished the fiscal year with a value of $10.31 per share. |
| 4 | The Growth and Income Fund’s performance review in the semi-annual report for the period ended October 31, 2019 is available at: www.seafarerfunds.com/reports/2019/semi-annual |
| Annual Report – April 30, 2020 | 7 |
| Seafarer Overseas Growth and Income Fund | Performance Review |
April 30, 2020
Total Returns
| | | | | Since Inception | Gross Expense |
| As of April 30, 2020 | 1 Year | 3 Year | 5 Year | Annualized(1) | Ratio(2) |
| Investor Class (SFGIX) | (8.44%) | (1.80%) | (0.73%) | 3.55% | 0.99% |
| Institutional Class (SIGIX) | (8.34%) | (1.72%) | (0.62%) | 3.67% | 0.89% |
| MSCI Emerging Markets Total Return Index(3) | (11.65%) | 0.94% | 0.28% | 1.16% | |
All performance is in U.S. dollars with gross (pre-tax) dividends and/or distributions reinvested. The performance data quoted represents past performance and does not guarantee future results. Future returns may be lower or higher. The investment return and principal value will fluctuate so that an investor's shares, when redeemed, may be worth more or less than the original cost. Prior to August 31, 2016, shares of the Fund redeemed or exchanged within 90 days of purchase were subject to a 2% redemption fee. Performance does not reflect this fee, which if deducted would reduce an individual's return. To obtain the Fund’s most recent month-end performance, visit seafarerfunds.com or call (855) 732-9220.
| 1 | Inception Date: February 15, 2012. |
| 2 | Ratios as of Prospectus dated August 31, 2019. Seafarer Capital Partners, LLC has agreed contractually to waive and/or reimburse fees or expenses in order to limit Total Annual Fund Operating Expenses After Fee Waiver/Expense Reimbursements (inclusive of acquired fund fees and expenses, and exclusive of brokerage expenses, interest expenses, taxes and extraordinary expenses) to 1.15% and 1.05% of the Fund’s average daily net assets for the Investor and Institutional share classes, respectively. This agreement is in effect through August 31, 2020. |
| 3 | The MSCI Emerging Markets Total Return Index, Standard (Large+Mid Cap) Core, Gross (dividends reinvested), USD is a free float-adjusted market capitalization index designed to measure equity market performance of emerging markets. Index code: GDUEEGF. The index is not actively managed and does not reflect any deductions for fees, expense or taxes. An investor may not invest directly in an index. |
| 8 | (855) 732-9220 seafarerfunds.com |
| Seafarer Overseas Growth and Income Fund | Performance Review |
April 30, 2020
Performance of a $10,000 Investment Since Inception
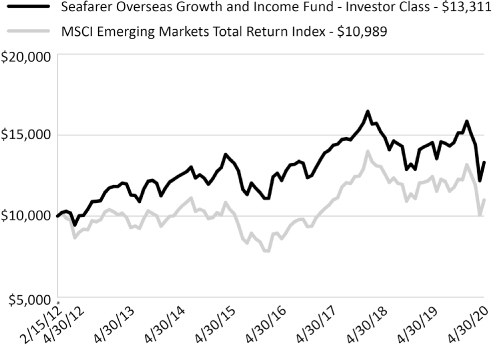
* Inception Date: February 15, 2012.
The chart shown above represents historical performance of a hypothetical investment of $10,000 in the Fund’s Investor Class shares for the period from inception to April 30, 2020. All returns reflect reinvested dividends and/or distributions, but do not reflect the deduction of taxes that an investor would pay on distributions or redemptions.
The Fund also offers Institutional Class shares, performance for which is not reflected in the chart above. The performance of Institutional Class shares may be higher or lower than the performance of the Investor Class shares shown above based upon differences in fees paid by shareholders investing in the Investor Class shares and Institutional Class shares.
Investment Objective
The Fund seeks to provide long-term capital appreciation along with some current income. The Fund seeks to mitigate adverse volatility in returns as a secondary objective.
Strategy
The Fund invests primarily in the securities of companies located in developing countries. The Fund invests in several asset classes including dividend-paying common stocks, preferred stocks, and fixed-income securities.
The Fund seeks to offer investors a relatively stable means of participating in developing countries’ growth prospects, while attempting to mitigate adverse volatility in returns.
| Annual Report – April 30, 2020 | 9 |
| Seafarer Overseas Growth and Income Fund | Performance Review |
April 30, 2020
| Portfolio Composition by Region | % Net Assets |
| East & South Asia | 76.6% |
| Emerging Europe | 5.6% |
| Latin America | 6.3% |
| Middle East & Africa | 7.1% |
| Cash & Other Assets, Less Liabilities | 4.1% |
| Government Bond, Short-term - USD and Foreign Currency | 0.3% |
| Total | 100.0% |
| Portfolio Composition by Sector | % Net Assets |
| Communication Services | 6.5% |
| Consumer Discretionary | 18.8% |
| Consumer Staples | 11.6% |
| Energy | 2.1% |
| Financials | 9.5% |
| Health Care | 11.0% |
| Industrials | 7.4% |
| Information Technology | 22.3% |
| Materials | 1.0% |
| Real Estate | 1.7% |
| Utilities | 3.7% |
| Cash & Other Assets, Less Liabilities | 4.1% |
| Government Bond, Short-term - USD and Foreign Currency | 0.3% |
| Total | 100.0% |
| Top 10 Holdings | % Net Assets |
| Alibaba Group Holding, Ltd., Sponsored ADR | 5.7% |
| Samsung Electronics Co., Ltd. | 5.1% |
| Venture Corp., Ltd. | 4.7% |
| Hyundai Mobis Co., Ltd. | 4.4% |
| Richter Gedeon Nyrt | 4.3% |
| NAVER Corp. | 4.1% |
| Samsung SDI Co., Ltd. | 4.0% |
| Orion Corp. | 3.5% |
| Sanlam, Ltd. | 3.2% |
| Infosys, Ltd. | 3.0% |
| Total | 42.0% |
| | |
| Total Number of Holdings | 431 |
Holdings are subject to change, and may not reflect the current or future position of the portfolio.
Source: ALPS Fund Services, Inc.
| 1 | Excludes short-term government bonds; includes medium- and long-term government bonds. |
| 10 | (855) 732-9220 seafarerfunds.com |
| Seafarer Overseas Value Fund | Performance Review |
April 30, 2020
SEAFARER OVERSEAS VALUE FUND
PERFORMANCE REVIEW
May 15, 2020
This report addresses the Seafarer Overseas Value Fund’s 2019-20 fiscal year (May 1, 2019 to April 30, 2020).
During the fiscal year, the Fund returned -14.47%, while the Fund’s benchmark, the MSCI Emerging Markets Total Return Index, returned -11.65%.1 By way of broader comparison, the S&P 500 Index increased 0.86%.
From the Fund’s inception (May 31, 2016) through the end of the fiscal year (April 30, 2020), the Fund generated an annualized rate of return of 1.43%.2 The benchmark index rose at an annualized rate of 6.45% over the same period.
The Fund began the fiscal year with a net asset value (NAV) of $11.43 per share. The Fund paid a distribution of $0.365 per share in December 2019. That payment brought the cumulative distribution per share, as measured from the Fund’s inception to the end of the fiscal year, to $1.235. The Fund finished the fiscal year with a value of $9.48 per share.3
* * *
The best way to analyze the performance of the Seafarer Overseas Value Fund (the “Value Fund”) during this annual period is to divide it into pre- and post-COVID-19 eras. While the Fund trailed the benchmark for the fiscal year, it outperformed the index during the pre-COVID period, and underperformed it during the market drawdown that accompanied the pandemic. I am disappointed with the Fund’s performance since January of 2020, as I expected a selection of carefully chosen stocks with low valuation and diversified across the sources of investment return, the seven categories of value described in the white paper On Value in the Emerging Markets, to perform better during a market drawdown.4
From the beginning of the fiscal year to December 31, 2019, just before the start of the pandemic, the Fund delivered a 7.54% total return, whereas the MSCI Emerging Markets Total Return Index appreciated by 5.87%.5 The Fund’s resilience in absolute terms and relative to the benchmark during this period – which was dominated by mass protests in Hong Kong and the U.S.-China trade dispute – is best explained by the value realization of individual stocks, driven by their own fundamental drivers as opposed to broad market movements.
One of the top positive contributors to performance for this pre-COVID period, and the top positive contributor for the entire fiscal year, was Asia Satellite Telecommunications Holdings (Deleveraging source of value; Seafarer’s seven sources of value,4 hereafter referenced using parenthesized italics, are defined in Figure 1). Asia Satellite is a Hong Kong-based company that owns and operates satellites. The company’s share price languished since the Value Fund purchased the stock at the Fund’s inception. Market participants seemed to ignore the company’s cash flow from operations, which management used to reduce debt and restart a dividend. Attuned to this market oversight, the controlling shareholders tendered for the publicly traded shares of the company, which delisted in September of 2019, thus permanently locking in the Fund’s capital gain in the stock.
| Annual Report – April 30, 2020 | 11 |
| Seafarer Overseas Value Fund | Performance Review |
April 30, 2020
Figure 1. Sources of Value
Seafarer has identified seven distinct sources of value in emerging markets that may give rise to viable opportunities for long-term, value-oriented investments.
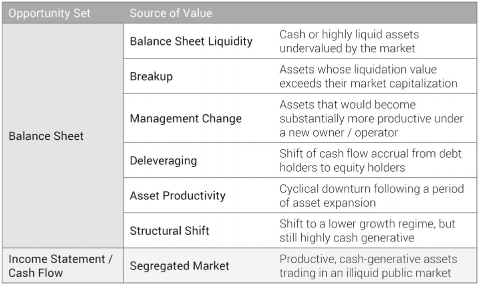
Source: Seafarer
The Value strategy also derived investment returns from companies that improved their balance sheet efficiency by returning capital to shareholders. Specifically, Qualicorp (Structural Shift), a Brazilian health insurance broker, reduced shareholder equity by paying an extraordinary dividend that equated to a 12% yield on the declaration date. Similarly, Moneta Money Bank (Asset Productivity), a Czech bank and holding of the Fund since early 2019, continued to improve its balance sheet efficiency by not only paying a generous dividend that equated to an 11.3% yield for the calendar year of 2019, but also announcing the acquisition of a mortgage bank that will put Moneta’s excess capitalization to productive use. Another strong contributor to the Fund’s performance during the pre-COVID period was Philip Morris CR (Structural Shift), the Czech subsidiary of Philip Morris International, whose dividend yielded 10.5%.
I was pleased not simply with the Fund’s absolute and relative performance in the pre-COVID period, but also by its nature, as it performed for the right reason: stock-specific value realization. It is interesting to note that the seeds of the subsequent underperformance relative to the index germinated during the fourth quarter of 2019. Indeed, the Fund’s outperformance relative to the benchmark narrowed significantly during December 2019, as the emerging market technology sector, dominated by a handful of very large companies, appreciated meaningfully, carrying the entire index with it. That index leadership continued during the first quarter of 2020 as the pandemic gathered momentum.
Two of the top detractors to performance for the pre-COVID period include PetroVietnam Technical Services (Management Change), a Vietnam-based service provider to oil and gas exploration and production companies, and PetroVietnam Fertilizer (Management Change), a Vietnam-based fertilizer manufacturer.
During the post-COVID period from January 1, 2020 to the end of the fiscal year on April 30, 2020, the Fund’s performance benefited from several stocks that managed to appreciate in absolute terms even during an unprecedented market drawdown. These holdings included Samsung SDI (Breakup Value), a South Korean battery manufacturer; Qatar Gas Transport (Deleveraging), an owner and operator of liquefied natural gas (LNG) transport vessels; and Tabreed (Deleveraging and Structural Shift), an owner and operator of district air-cooling services in the Middle East. What these holdings have in common is the perceived resilience of demand for their products and services in the face of the pandemic.
| 12 | (855) 732-9220 seafarerfunds.com |
| Seafarer Overseas Value Fund | Performance Review |
April 30, 2020
While the remaining portfolio holdings enjoyed varying degrees of demand resilience, the pandemic directly and negatively impacted five stocks: Shangri-La Asia (Breakup Value and Asset Productivity), a hotel owner and operator; Melco International Development (Deleveraging and Breakup Value) and Genting Singapore (Balance Sheet Liquidity), both casino owners and operators; Hang Lung Properties (Breakup Value), an owner and operator of luxury malls and office space, as well as a housing developer; and Pico Far East (Segregated Market), an exhibition and conference designer and manager. The common thread among these stocks is their customers’ need to travel, which the viral nature of the health crisis prevented.
Additionally, the ramifications of the pandemic extended from the halt of virtually all long-distance travel to disruptions in the supply chains of most industries; more expensive U.S. dollar funding around the globe; and sharp movements in macroeconomic variables, such as foreign exchange rates. The latter negatively impacted the U.S. dollar price performance of two Fund holdings in particular. Qualicorp had performed admirably in the pre-COVID era. Then, during the first four months of 2020, the 26.6% depreciation of the Brazilian Real accounted for just over half of the company’s 48.5% U.S. dollar share price decline. During the same time period, the 21.7% depreciation of the Mexican Peso accounted for approximately half of the 52.2% U.S. dollar share price contraction for Crédito Real (Asset Productivity), a Mexican consumer finance company. It is worth noting that neither Qualicorp nor Crédito Real suffer from a weak balance sheet that might explain such severe share price reactions to the virus-induced liquidity crisis. Furthermore, Crédito Real is one of the few financial companies around the world whose assets mature faster than its liabilities.
In summary, the low valuation that characterizes the Value Fund proved insufficient to make portfolio performance resilient in absolute or relative terms in the post-COVID era, presumably due to the unique nature of the shock, which combines concurrent demand and supply disruptions.
Thank you for entrusting us with your capital. We are honored to serve as your investment adviser in the emerging markets.
Paul Espinosa
Portfolio Manager, Seafarer Overseas Value Fund
Seafarer Capital Partners, LLC
The MSCI Emerging Markets Total Return Index, Standard (Large+Mid Cap) Core, Gross (dividends reinvested), USD is a free float-adjusted market capitalization index designed to measure equity market performance of emerging markets. Index code: GDUEEGF.
The S&P 500 Total Return Index is a stock market index based on the market capitalizations of 500 large companies with common stock listed on the NYSE or NASDAQ.
It is not possible to invest directly in an index.
The Fund is subject to investment risks, including possible loss of the principal amount invested and therefore is not suitable for all investors. The Fund may not achieve its objectives. Diversification does not ensure a profit or guarantee against loss.
Information on the Seafarer website is provided for textual reference only, and is not incorporated by reference into this report.
The views and information discussed in this commentary are as of the date of publication, are subject to change, and may not reflect Seafarer’s current views. The views expressed represent an assessment of market conditions at a specific point in time, are opinions only and should not be relied upon as investment advice regarding a particular investment or markets in general. Such information does not constitute a recommendation to buy or sell specific securities or investment vehicles. It should not be assumed that any investment will be profitable or will equal the performance of the portfolios or any securities or any sectors mentioned herein. The subject matter contained herein has been derived from several sources believed to be reliable and accurate at the time of compilation. Seafarer does not accept any liability for losses either direct or consequential caused by the use of this information.
| Annual Report – April 30, 2020 | 13 |
| Seafarer Overseas Value Fund | Performance Review |
April 30, 2020
As of April 30, 2020, the Fund did not own shares in Asia Satellite Telecommunications Holdings or Philip Morris CR.
| 1 | References to the “Fund” pertain to the Fund’s Institutional share class (ticker: SIVLX). The Investor share class (ticker: SFVLX) returned -14.54% during the fiscal year. |
| 2 | The Fund’s Investor share class generated an annualized rate of return of 1.32% from the Fund’s inception through the end of the fiscal year. |
| 3 | The Fund’s Investor share class began the fiscal year with a net asset value of $11.41 per share; it paid an annual distribution of $0.359 per share in December 2019; and it finished the fiscal year with a value of $9.46 per share. |
| 4 | Additional information on Seafarer’s seven sources of value is available in the white paper On Value in the Emerging Markets (www.seafarerfunds.com/value-in-em). |
| 5 | The Fund’s Investor share class returned 7.50% from the beginning of the fiscal year to December 31, 2019. |
| 14 | (855) 732-9220 seafarerfunds.com |
| Seafarer Overseas Value Fund | Performance Review |
April 30, 2020
Total Returns
| As of April 30, 2020 | 1 Year | 3 Year | Since Inception Annualized(1) | Net Expense Ratio(2) |
| Investor Class (SFVLX) | (14.54%) | (2.67%) | 1.32% | 1.15% |
| Institutional Class (SIVLX) | (14.47%) | (2.56%) | 1.43% | 1.05% |
| MSCI Emerging Markets Total Return Index(3) | (11.65%) | 0.94% | 6.45% | |
Gross expense ratio: 1.60% for Investor Class; 1.50% for Institutional Class.2
All performance is in U.S. dollars with gross (pre-tax) dividends and/or distributions reinvested. The performance data quoted represents past performance and does not guarantee future results. Future returns may be lower or higher. The investment return and principal value will fluctuate so that an investor's shares, when redeemed, may be worth more or less than the original cost. Prior to August 31, 2016, shares of the Fund redeemed or exchanged within 90 days of purchase were subject to a 2% redemption fee. Performance does not reflect this fee, which if deducted would reduce an individual's return. To obtain the Fund’s most recent month-end performance, visit seafarerfunds.com or call (855) 732-9220.
| 1 | Inception Date: May 31, 2016. |
| 2 | Ratios as of Prospectus dated August 31, 2019. Seafarer Capital Partners, LLC has agreed contractually to waive and/or reimburse fees or expenses in order to limit Total Annual Fund Operating Expenses After Fee Waiver/Expense Reimbursements (inclusive of acquired fund fees and expenses, and exclusive of brokerage expenses, interest expenses, taxes and extraordinary expenses) to 1.15% and 1.05% of the Fund’s average daily net assets for the Investor and Institutional share classes, respectively. This agreement is in effect through August 31, 2020. |
| 3 | The MSCI Emerging Markets Total Return Index, Standard (Large+Mid Cap) Core, Gross (dividends reinvested), USD is a free float-adjusted market capitalization index designed to measure equity market performance of emerging markets. Index code: GDUEEGF. The index is not actively managed and does not reflect any deductions for fees, expense or taxes. An investor may not invest directly in an index. |
| Annual Report – April 30, 2020 | 15 |
| Seafarer Overseas Value Fund | Performance Review |
April 30, 2020
Performance of a $10,000 Investment Since Inception
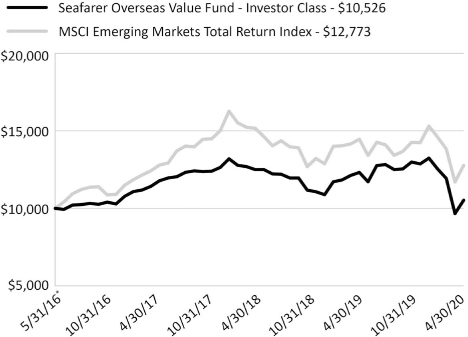
* Inception Date: May 31, 2016.
The chart shown above represents historical performance of a hypothetical investment of $10,000 in the Fund’s Investor Class shares for the period from inception to April 30, 2020. All returns reflect reinvested dividends and/or distributions, but do not reflect the deduction of taxes that an investor would pay on distributions or redemptions.
The Fund also offers Institutional Class shares, performance for which is not reflected in the chart above. The performance of Institutional Class shares may be higher or lower than the performance of the Investor Class shares shown above based upon differences in fees paid by shareholders investing in the Investor Class shares and Institutional Class shares.
Investment Objective
The Fund seeks to provide long-term capital appreciation.
Strategy
The Fund invests primarily in the securities of companies located in developing countries. The Fund invests in several asset classes including common stocks, preferred stocks, and fixed-income securities.
The Fund’s portfolio is comprised of securities identified through a bottom-up security selection process based on fundamental research. The Fund seeks to produce a minimum long-term rate of return by investing in securities priced at a discount to their intrinsic value.
| 16 | (855) 732-9220 seafarerfunds.com |
| Seafarer Overseas Value Fund | Performance Review |
April 30, 2020
| Portfolio Composition by Region | % Net Assets |
| East & South Asia | 69.1% |
| Emerging Europe | 7.7% |
| Latin America | 4.3% |
| Middle East & Africa | 11.4% |
| Cash & Other Assets, Less Liabilities | 7.5% |
| Total | 100.0% |
| Portfolio Composition by Sector | % Net Assets |
| Communication Services | 3.8% |
| Consumer Discretionary | 14.0% |
| Consumer Staples | 19.6% |
| Energy | 7.5% |
| Financials | 10.5% |
| Health Care | 3.1% |
| Industrials | 13.7% |
| Information Technology | 6.8% |
| Materials | 8.4% |
| Real Estate | 2.6% |
| Utilities | 2.5% |
| Cash & Other Assets, Less Liabilities | 7.5% |
| Total | 100.0% |
| Top 10 Holdings | % Net Assets |
| Samsung SDI Co., Ltd. | 6.8% |
| National Central Cooling Co. PJSC | 5.9% |
| WH Group, Ltd. | 5.8% |
| Qatar Gas Transport Co., Ltd. | 5.5% |
| Shangri-La Asia, Ltd. | 5.2% |
| Wilmar International, Ltd. | 4.7% |
| China Foods, Ltd. | 4.1% |
| HRnetgroup, Ltd. | 4.1% |
| First Pacific Co., Ltd. | 3.6% |
| China Resources Beer Holdings Co., Ltd. | 3.5% |
| Total | 49.2% |
| | |
| Total Number of Holdings | 29 |
Holdings are subject to change, and may not reflect the current or future position of the portfolio.
Source: ALPS Fund Services, Inc.
| Annual Report – April 30, 2020 | 17 |
| Seafarer Funds | Disclosure of Fund Expenses |
April 30, 2020 (Unaudited)
DISCLOSURE OF FUND EXPENSES
As a shareholder of a Fund you will incur two types of costs: (1) transaction costs; and (2) ongoing costs, including management fees and other Fund expenses. The following examples are intended to help you understand your ongoing costs (in dollars) of investing in a Fund and to compare these costs with the ongoing costs of investing in other mutual funds. The examples are based on an investment of $1,000 invested on November 1, 2019 and held until April 30, 2020.
Actual Expenses. For each Fund and share class, the first line of the following table provides information about actual account values and actual expenses. You may use the information in this line, together with the amount you invested, to estimate the expenses that you paid over the period. Simply divide your account value by $1,000 (for example, an $8,600 account value divided by $1,000 = 8.6), then multiply the result by the number in the first line under the heading “Expenses Paid During Period” to estimate the expenses you paid on your account during this period.
Hypothetical Example for Comparison Purposes. For each Fund and share class, the second line of the following table provides information about hypothetical account values and hypothetical expenses based on the Fund’s actual expense ratio and an assumed rate of return of 5% per year before expenses, which is not the Fund’s actual return. The hypothetical account values and expenses may not be used to estimate the actual ending account balance or expenses you paid for the period. You may use this information to compare the ongoing costs of investing in the Fund and other mutual funds. To do so, compare this 5% hypothetical example with the 5% hypothetical examples that appear in the shareholder reports of the other mutual funds.
Please note the expenses shown in the following table are meant to highlight your ongoing costs only and do not reflect transaction costs. Therefore, for each Fund and share class, the second line of the following table is useful in comparing ongoing costs only, and will not help you determine the relative total costs of owning different funds. In addition, if these transactional costs were included, your costs would have been higher.
| 18 | (855) 732-9220 seafarerfunds.com |
| Seafarer Funds | Disclosure of Fund Expenses |
April 30, 2020 (Unaudited)
| | Beginning Account Value 11/01/19 | Ending Account Value 04/30/20 | Expense Ratio(a) | Expenses Paid During Period 11/01/19 - 04/30/20(b) |
| | | | | |
| SEAFARER OVERSEAS GROWTH AND INCOME FUND | |
| Investor Class | | | | |
| Actual | $ 1,000.00 | $ 879.30 | 1.03% | $ 4.81 |
| Hypothetical (5% return before expenses) | $ 1,000.00 | $ 1,019.74 | 1.03% | $ 5.17 |
| Institutional Class | | | |
| Actual | $ 1,000.00 | $ 879.50 | 0.93% | $ 4.35 |
| Hypothetical (5% return before expenses) | $ 1,000.00 | $ 1,020.24 | 0.93% | $ 4.67 |
| | | | | |
| SEAFARER OVERSEAS VALUE FUND | | | |
| Investor Class | | | | |
| Actual | $ 1,000.00 | $ 810.50 | 1.15% | $ 5.18 |
| Hypothetical (5% return before expenses) | $ 1,000.00 | $ 1,019.14 | 1.15% | $ 5.77 |
| Institutional Class | | | |
| Actual | $ 1,000.00 | $ 811.30 | 1.05% | $ 4.73 |
| Hypothetical (5% return before expenses) | $ 1,000.00 | $ 1,019.64 | 1.05% | $ 5.27 |
| (a) | Annualized, based on the Fund's most recent fiscal half year expenses. |
| (b) | Expenses are equal to the Fund's annualized expense ratio multiplied by the average account value over the period, multiplied by the number of days in the most recent fiscal half-year (182)/366 (to reflect the half-year period). |
| Annual Report – April 30, 2020 | 19 |
| Seafarer Overseas Growth and Income Fund | Portfolio of Investments |
April 30, 2020
| | | Currency | | Shares | | | Value | |
| COMMON STOCKS (90.5%) | | | | | | | | | | |
| Brazil (3.6%) | | | | | | | | | | |
| Odontoprev SA | | BRL | | | 8,500,000 | | | $ | 23,978,007 | |
| Qualicorp Consultoria e Corretora de Seguros SA | | BRL | | | 4,500,000 | | | | 21,697,714 | |
| | | | | | | | | | | |
| Total Brazil | | | | | | | | | 45,675,721 | |
| | | | | | | | | | | |
| China / Hong Kong (27.5%) | | | | | | | | | | |
| Alibaba Group Holding, Ltd., Sponsored ADR(a) | | USD | | | 355,000 | | | | 71,947,850 | |
| China Foods, Ltd. | | HKD | | | 82,000,000 | | | | 27,021,361 | |
| China Resources Beer Holdings Co., Ltd. | | HKD | | | 3,900,000 | | | | 18,368,262 | |
| China Yangtze Power Co., Ltd., Class A | | CNY | | | 10,000,000 | | | | 24,632,595 | |
| First Pacific Co., Ltd. | | HKD | | | 92,000,000 | | | | 19,010,517 | |
| Greatview Aseptic Packaging Co., Ltd. | | HKD | | | 35,000,000 | | | | 12,898,474 | |
| Hang Lung Properties, Ltd. | | HKD | | | 10,000,000 | | | | 21,392,068 | |
| Jiangsu Hengrui Medicine Co., Ltd., Class A(a) | | CNY | | | 1,750,000 | | | | 22,759,642 | |
| OneConnect Financial Technology Co., Ltd., ADR(a) | | USD | | | 34,953 | | | | 351,278 | |
| Pacific Basin Shipping, Ltd. | | HKD | | | 120,000,000 | | | | 14,701,343 | |
| Pico Far East Holdings, Ltd. | | HKD | | | 52,296,000 | | | | 7,487,721 | |
| Shangri-La Asia, Ltd. | | HKD | | | 32,000,000 | | | | 26,424,739 | |
| Shenzhou International Group Holdings, Ltd. | | HKD | | | 2,575,000 | | | | 29,719,715 | |
| WH Group, Ltd. | | HKD | | | 29,600,000 | | | | 28,231,096 | |
| | | | | | | | | | | |
Xinhua Winshare Publishing and Media Co., Ltd.,
Class H | | HKD | | | 30,000,000 | | | | 20,648,916 | |
| | | | | | | | | | | |
| Total China / Hong Kong | | | | | | | | | 345,595,577 | |
| | | | | | | | | | | |
| Czech Republic (1.3%) | | | | | | | | | | |
| Moneta Money Bank AS | | CZK | | | 8,000,000 | | | | 16,619,697 | |
| | | | | | | | | | | |
| Total Czech Republic | | | | | | | | | 16,619,697 | |
| | | | | | | | | | | |
| Hungary (4.3%) | | | | | | | | | | |
| Richter Gedeon Nyrt | | HUF | | | 2,526,843 | | | | 53,995,474 | |
| | | | | | | | | | | |
| Total Hungary | | | | | | | | | 53,995,474 | |
| | | | | | | | | | | |
| India (3.0%) | | | | | | | | | | |
| Infosys, Ltd., Sponsored ADR | | USD | | | 4,050,000 | | | | 37,381,500 | |
| | | | | | | | | | | |
| Total India | | | | | | | | | 37,381,500 | |
| 20 | (855) 732-9220 seafarerfunds.com |
| Seafarer Overseas Growth and Income Fund | Portfolio of Investments |
| | | Currency | | Shares | | | Value | |
| Indonesia (0.4%) | | | | | | | | |
| Bank Rakyat Indonesia Persero Tbk PT | | IDR | | | 30,000,000 | | | $ | 5,456,625 | |
| | | | | | | | | | | |
| Total Indonesia | | | | | | | | | 5,456,625 | |
| | | | | | | | | | | |
| Mexico (2.6%) | | | | | | | | | | |
| Bolsa Mexicana de Valores SAB de CV | | MXN | | | 14,676,910 | | | | 26,484,329 | |
| Credito Real SAB de CV SOFOM ER | | MXN | | | 10,618,433 | | | | 6,322,332 | |
| | | | | | | | | | | |
| Total Mexico | | | | | | | | | 32,806,661 | |
| | | | | | | | | | | |
| Qatar (2.1%) | | | | | | | | | | |
| Qatar Gas Transport Co., Ltd. | | QAR | | | 37,613,950 | | | | 25,806,000 | |
| | | | | | | | | | | |
| Total Qatar | | | | | | | | | 25,806,000 | |
| | | | | | | | | | | |
| Singapore (7.0%) | | | | | | | | | | |
| Venture Corp., Ltd. | | SGD | | | 5,323,700 | | | | 59,495,975 | |
| Wilmar International, Ltd. | | SGD | | | 11,500,000 | | | | 28,960,256 | |
| | | | | | | | | | | |
| Total Singapore | | | | | | | | | 88,456,231 | |
| | | | �� | | | | | | | |
| South Africa (3.2%) | | | | | | | | | | |
| Sanlam, Ltd. | | ZAR | | | 12,500,000 | | | | 39,961,414 | |
| | | | | | | | | | | |
| Total South Africa | | | | | | | | | 39,961,414 | |
| | | | | | | | | | | |
| South Korea (23.0%) | | | | | | | | | | |
| Coway Co., Ltd. | | KRW | | | 625,892 | | | | 31,721,353 | |
| Hyundai Mobis Co., Ltd. | | KRW | | | 390,000 | | | | 55,138,279 | |
| Innocean Worldwide, Inc. | | KRW | | | 480,000 | | | | 22,966,884 | |
| Koh Young Technology, Inc. | | KRW | | | 375,000 | | | | 25,004,259 | |
| NAVER Corp. | | KRW | | | 315,000 | | | | 51,071,130 | |
| Orion Corp. | | KRW | | | 425,000 | | | | 43,539,698 | |
| Samsung SDI Co., Ltd. | | KRW | | | 210,000 | | | | 49,609,540 | |
| Sindoh Co., Ltd. | | KRW | | | 400,000 | | | | 9,066,774 | |
| | | | | | | | | | | |
| Total South Korea | | | | | | | | | 288,117,917 | |
| | | | | | | | | | | |
| Taiwan (7.1%) | | | | | | | | | | |
| Bizlink Holding, Inc. | | TWD | | | 4,285,000 | | | | 27,919,437 | |
| Taiwan Semiconductor Manufacturing Co., Ltd. | | TWD | | | 3,525,000 | | | | 35,559,494 | |
| Voltronic Power Technology Corp. | | TWD | | | 1,100,000 | | | | 26,112,237 | |
| | | | | | | | | | | |
| Total Taiwan | | | | | | | | | 89,591,168 | |
| Annual Report – April 30, 2020 | 21 |
| Seafarer Overseas Growth and Income Fund | Portfolio of Investments |
| | Currency | | Shares | | | Value | |
| Thailand (1.3%) | | | | | | | | |
| Bangkok Dusit Medical Services PCL, Class F | | THB | | | 25,000,000 | | | $ | 15,902,657 | |
| | | | | | | | | | | |
| Total Thailand | | | | | | | | | 15,902,657 | |
| | | | | | | | | | | |
| United Arab Emirates (1.9%) | | | | | | | | | | |
| National Central Cooling Co. PJSC | | AED | | | 41,732,307 | | | | 23,859,043 | |
| | | | | | | | | | | |
| Total United Arab Emirates | | | | | | | | | 23,859,043 | |
| | | | | | | | | | | |
| Vietnam (2.2%) | | | | | | | | | | |
| Bao Viet Holdings | | VND | | | 2,700,000 | | | | 5,358,996 | |
| PetroVietnam Gas JSC | | VND | | | 8,100,000 | | | | 21,951,357 | |
| | | | | | | | | | | |
| Total Vietnam | | | | | | | | | 27,310,353 | |
| | | | | | | | | | | |
| TOTAL COMMON STOCKS | | | | | | | | | | |
| (Cost $1,243,155,363) | | | | | | | | | 1,136,536,038 | |
| | | | | | | | | | | |
| PREFERRED STOCKS (5.1%) | | | | | | | | | | |
| South Korea (5.1%) | | | | | | | | | | |
| Samsung Electronics Co., Ltd. | | KRW | | | 1,850,000 | | | | 64,131,393 | |
| | | | | | | | | | | |
| Total South Korea | | | | | | | | | 64,131,393 | |
| | | | | | | | | | | |
| TOTAL PREFERRED STOCKS | | | | | | | | | | |
| (Cost $44,541,723) | | | | | | | | | 64,131,393 | |
| | | | | | | Maturity | | Principal | | | | |
| | | Currency | | Rate | | Date | | Amount | | | Value | |
| GOVERNMENT BOND, SHORT-TERM - USD AND FOREIGN CURRENCY (0.3%) | | |
| South Korea (0.3%) | | | | | | | | | | | | | | |
| Korea Development Bank | | USD | | 2.25% | | 05/18/20 | | | 4,000,000 | | | | 4,000,440 | |
| | | | | | | | | | | | | | | |
| Total South Korea | | | | | | | | | | | | | 4,000,440 | |
| | | | | | | | | | | | | | | |
| TOTAL GOVERNMENT BOND, SHORT-TERM - USD AND FOREIGN CURRENCY | | | | | | | | |
| (Cost $3,999,437) | | | | | | | | | | | | | 4,000,440 | |
| | | | | | | | | | | | | | | |
| TOTAL INVESTMENTS | | | | | | | | | | | | | | |
| (Cost $1,291,696,523) (95.9%) | | | | | | | | | | | | $ | 1,204,667,871 | |
| | | | | | | | | | | | | | | |
| Cash and Other Assets, Less Liabilities (4.1%) | | | | | | | 50,890,598 | |
| NET ASSETS (100.0%) | | | | | | | | | | | | $ | 1,255,558,469 | |
| 22 | (855) 732-9220 seafarerfunds.com |
| Seafarer Overseas Growth and Income Fund | Portfolio of Investments |
April 30, 2020
Principal Amount is stated in local currency unless otherwise noted.
| (a) | Non-income producing security. |
| Currency Abbreviations |
| AED | - | United Arab Emirates Dirham |
| BRL | - | Brazil Real |
| CNY | - | China Yuan |
| CZK | - | Czech Koruna |
| HKD | - | Hong Kong Dollar |
| HUF | - | Hungary Forint |
| IDR | - | Indonesia Rupiah |
| KRW | - | South Korea Won |
| MXN | - | Mexico Peso |
| QAR | - | Qatar Riyal |
| SGD | - | Singapore Dollar |
| THB | - | Thailand Baht |
| TWD | - | Taiwan New Dollar |
| USD | - | United States Dollar |
| VND | - | Vietnam Dong |
| ZAR | - | South Africa Rand |
For Fund compliance purposes, the Fund's geographical classifications refer to any one or more of the sub-classifications used by one or more widely recognized market indexes or ratings group indexes, and/or as defined by Fund management. This definition may not apply for purposes of this report, which may combine sub-classifications for reporting ease. Geographical regions are shown as a percentage of net assets.
See accompanying Notes to Financial Statements.
| Annual Report – April 30, 2020 | 23 |
| Seafarer Overseas Value Fund | Portfolio of Investments |
| | | Currency | | Shares | | | Value | |
| COMMON STOCKS (92.5%) | | | | | | | | | | |
| Brazil (3.1%) | | | | | | | | | | |
| Qualicorp Consultoria e Corretora de Seguros SA | | BRL | | | 191,000 | | | $ | 920,947 | |
| | | | | | | | | | | |
| Total Brazil | | | | | | | | | 920,947 | |
| | | | | | | | | | | |
| China / Hong Kong (40.4%) | | | | | | | | | | |
| AMVIG Holdings, Ltd. | | HKD | | | 3,754,000 | | | | 717,584 | |
| China Foods, Ltd. | | HKD | | | 3,750,000 | | | | 1,235,733 | |
| China Resources Beer Holdings Co., Ltd. | | HKD | | | 224,000 | | | | 1,054,998 | |
| China Yangtze Power Co., Ltd., Class A | | CNY | | | 301,990 | | | | 743,880 | |
| First Pacific Co., Ltd. | | HKD | | | 5,190,000 | | | | 1,072,441 | |
| Giordano International, Ltd. | | HKD | | | 3,700,000 | | | | 745,901 | |
| Greatview Aseptic Packaging Co., Ltd. | | HKD | | | 2,000,000 | | | | 737,056 | |
| Hang Lung Properties, Ltd. | | HKD | | | 367,000 | | | | 785,089 | |
| Melco International Development, Ltd. | | HKD | | | 549,000 | | | | 1,026,254 | |
| Pacific Basin Shipping, Ltd. | | HKD | | | 4,600,000 | | | | 563,551 | |
| Pico Far East Holdings, Ltd. | | HKD | | | 538,000 | | | | 77,031 | |
| Shangri-La Asia, Ltd. | | HKD | | | 1,880,000 | | | | 1,552,453 | |
| WH Group, Ltd. | | HKD | | | 1,798,000 | | | | 1,714,849 | |
| | | | | | | | | | | |
| Total China / Hong Kong | | | | | | | | | 12,026,820 | |
| | | | | | | | | | | |
| Czech Republic (2.9%) | | | | | | | | | | |
| Moneta Money Bank AS | | CZK | | | 420,000 | | | | 872,534 | |
| | | | | | | | | | | |
| Total Czech Republic | | | | | | | | | 872,534 | |
| | | | | | | | | | | |
| Georgia (2.7%) | | | | | | | | | | |
| Georgia Capital PLC(a) | | GBP | | | 152,388 | | | | 804,513 | |
| | | | | | | | | | | |
| Total Georgia | | | | | | | | | 804,513 | |
| | | | | | | | | | | |
| Mexico (1.3%) | | | | | | | | | | |
| Credito Real SAB de CV SOFOM ER | | MXN | | | 631,564 | | | | 376,040 | |
| | | | | | | | | | | |
| Total Mexico | | | | | | | | | 376,040 | |
| | | | | | | | | | | |
| Philippines (1.3%) | | | | | | | | | | |
| Del Monte Pacific, Ltd. | | SGD | | | 5,000,000 | | | | 379,392 | |
| | | | | | | | | | | |
| Total Philippines | | | | | | | | | 379,392 | |
| 24 | (855) 732-9220 seafarerfunds.com |
| Seafarer Overseas Value Fund | Portfolio of Investments |
April 30, 2020
| | | Currency | | Shares | | | Value | |
| Qatar (5.4%) | | | | | | | | |
| Qatar Gas Transport Co., Ltd. | | QAR | | | 2,370,000 | | | $ | 1,625,998 | |
| | | | | | | | | | | |
| Total Qatar | | | | | | | | | 1,625,998 | |
| | | | | | | | | | | |
| Russia (2.0%) | | | | | | | | | | |
| Cherkizovo Group PJSC | | RUB | | | 2,288 | | | | 51,977 | |
| Global Ports Investments PLC, GDR(a) | | USD | | | 231,196 | | | | 554,870 | |
| | | | | | | | | | | |
| Total Russia | | | | | | | | | 606,847 | |
| | | | | | | | | | | |
| Singapore (11.6%) | | | | | | | | | | |
| Genting Singapore, Ltd. | | SGD | | | 1,500,000 | | | | 832,303 | |
| HRnetgroup, Ltd. | | SGD | | | 3,200,000 | | | | 1,219,803 | |
| Wilmar International, Ltd. | | SGD | | | 560,000 | | | | 1,410,239 | |
| | | | | | | | | | | |
| Total Singapore | | | | | | | | �� | 3,462,345 | |
| | | | | | | | | | | |
| South Korea (10.3%) | | | | | | | | | | |
| Innocean Worldwide, Inc. | | KRW | | | 22,000 | | | | 1,052,649 | |
| Samsung SDI Co., Ltd. | | KRW | | | 8,600 | | | | 2,031,629 | |
| | | | | | | | | | | |
| Total South Korea | | | | | | | | | 3,084,278 | |
| | | | | | | | | | | |
| United Arab Emirates (5.9%) | | | | | | | | | | |
| National Central Cooling Co. PJSC | | AED | | | 3,078,393 | | | | 1,759,968 | |
| | | | | | | | | | | |
| Total United Arab Emirates | | | | | | | | | 1,759,968 | |
| | | | | | | | | | | |
| Vietnam (5.6%) | | | | | | | | | | |
| Petrovietnam Fertilizer & Chemicals JSC | | VND | | | 1,718,000 | | | | 1,047,072 | |
| PetroVietnam Technical Services Corp. | | VND | | | 1,263,780 | | | | 623,833 | |
| | | | | | | | | | | |
| Total Vietnam | | | | | | | | | 1,670,905 | |
| | | | | | | | | | | |
| TOTAL COMMON STOCKS | | | | | | | | | | |
| (Cost $33,573,009) | | | | | | | | | 27,590,587 | |
| | | | | | | | | | | |
| TOTAL INVESTMENTS | | | | | | | | | | |
| (Cost $33,573,009) (92.5%) | | | | | | | | $ | 27,590,587 | |
| | | | | | | | | | | |
| Cash and Other Assets, Less Liabilities (7.5%) | | | | | | | | | 2,244,406 | |
| NET ASSETS (100.0%) | | | | | | | | $ | 29,834,993 | |
| Annual Report – April 30, 2020 | 25 |
| Seafarer Overseas Value Fund | Portfolio of Investments |
April 30, 2020
Principal Amount is stated in local currency unless otherwise noted.
| (a) | Non-income producing security. |
| Currency Abbreviations |
| AED | - | United Arab Emirates Dirham |
| BRL | - | Brazil Real |
| CNY | - | China Yuan |
| CZK | - | Czech Koruna |
| GBP | - | Great British Pound |
| HKD | - | Hong Kong Dollar |
| KRW | - | South Korea Won |
| MXN | - | Mexico Peso |
| QAR | - | Qatar Riyal |
| RUB | - | Russia Ruble |
| SGD | - | Singapore Dollar |
| USD | - | United States Dollar |
| VND | - | Vietnam Dong |
For Fund compliance purposes, the Fund's geographical classifications refer to any one or more of the sub-classifications used by one or more widely recognized market indexes or ratings group indexes, and/or as defined by Fund management. This definition may not apply for purposes of this report, which may combine sub-classifications for reporting ease. Geographical regions are shown as a percentage of net assets.
See accompanying Notes to Financial Statements.
| 26 | (855) 732-9220 seafarerfunds.com |
| Seafarer Funds | Statements of Assets and Liabilities |
April 30, 2020
| | | Seafarer Overseas Growth and Income Fund | | | Seafarer Overseas Value Fund | |
| ASSETS: | | | | | | |
| | | | | | | |
| Investments, at value | | $ | 1,204,667,871 | | | $ | 27,590,587 | |
| Cash | | | 48,334,440 | | | | 2,061,409 | |
| Foreign currency, at value (Cost $142,304 and $34,873) | | | 142,730 | | | | 34,892 | |
| Receivable for investments sold | | | 7,060,150 | | | | 162,894 | |
| Receivable for shares sold | | | 1,028,692 | | | | – | |
| Interest and dividends receivable | | | 932,626 | | | | 49,157 | |
| Prepaid expenses and other assets | | | 26,236 | | | | 250 | |
| Total Assets | | | 1,262,192,745 | | | | 29,899,189 | |
| LIABILITIES: | | | | | | | | |
| Payable for investments purchased | | | 136,139 | | | | – | |
| Administrative fees payable | | | 87,754 | | | | 12,478 | |
| Shareholder service plan fees payable | | | 151,981 | | | | 2,467 | |
| Payable for shares redeemed | | | 5,170,595 | | | | – | |
| Investment advisory fees payable | | | 746,441 | | | | 2,426 | |
| Payable for chief compliance officer fees | | | 4,115 | | | | 4,115 | |
| Trustee fees and expenses payable | | | 59,548 | | | | 1,510 | |
| Payable for principal financial officer fees | | | 1,250 | | | | 1,250 | |
| Audit and tax fees payable | | | 24,601 | | | | 19,751 | |
| Accrued expenses and other liabilities | | | 251,852 | | | | 20,199 | |
| Total Liabilities | | | 6,634,276 | | | | 64,196 | |
| NET ASSETS | | $ | 1,255,558,469 | | | $ | 29,834,993 | |
| NET ASSETS CONSIST OF: | | | | | | | | |
| Paid-in capital (Note 5) | | $ | 1,444,503,084 | | | $ | 36,875,460 | |
| Total distributable earnings | | | (188,944,615 | ) | | | (7,040,467 | ) |
| NET ASSETS | | $ | 1,255,558,469 | | | $ | 29,834,993 | |
| INVESTMENTS, AT COST | | $ | 1,291,696,523 | | | $ | 33,573,009 | |
| PRICING OF SHARES | | | | | | | | |
| Investor Class: | | | | | | | | |
| Net Asset Value, offering and redemption price per share | | $ | 10.31 | | | $ | 9.46 | |
| Net Assets | | $ | 154,016,624 | | | $ | 278,377 | |
| Shares of beneficial interest outstanding | | | 14,935,943 | | | | 29,419 | |
| Institutional Class: | | | | | | | | |
| Net Asset Value, offering and redemption price per share | | $ | 10.36 | | | $ | 9.48 | |
| Net Assets | | $ | 1,101,541,845 | | | $ | 29,556,616 | |
| Shares of beneficial interest outstanding | | | 106,334,053 | | | | 3,118,678 | |
See accompanying Notes to Financial Statements.
| Annual Report – April 30, 2020 | 27 |
| Seafarer Funds | Statements of Operations |
Year Ended April 30, 2020
| | | Seafarer Overseas Growth and Income Fund | | | Seafarer Overseas Value Fund | |
| | | | | | | |
| INVESTMENT INCOME: | | | | | | |
| Dividends | | $ | 44,313,065 | | | $ | 1,279,798 | |
| Foreign taxes withheld | | | (3,099,160 | ) | | | (19,696 | ) |
| Interest and other income | | | 954,722 | | | | 36,216 | |
| Total investment income | | | 42,168,627 | | | | 1,296,318 | |
| EXPENSES: | | | | | | | | |
| Investment advisory fees (Note 6) | | | 11,087,030 | | | | 263,477 | |
| Administrative and transfer agency fees | | | 558,661 | | | | 65,495 | |
| Trustee fees and expenses | | | 73,426 | | | | 1,871 | |
| Registration/filing fees | | | 38,542 | | | | 33,750 | |
| Shareholder service plan fees | | | | | | | | |
| Investor Class | | | 279,824 | | | | – | |
| Institutional Class | | | 566,783 | | | | 12,275 | |
| Recoupment of previously waived fees | | | | | | | | |
| Investor Class | | | – | | | | 37 | |
| Institutional Class | | | – | | | | – | |
| Legal fees | | | 22,692 | | | | 521 | |
| Audit and tax fees | | | 44,022 | | | | 21,012 | |
| Reports to shareholders and printing fees | | | 70,054 | | | | 1,696 | |
| Custody fees | | | 1,081,741 | | | | 61,981 | |
| Chief compliance officer fees | | | 24,837 | | | | 24,837 | |
| Principal financial officer fees | | | 7,215 | | | | 7,215 | |
| Insurance expense | | | 19,434 | | | | 412 | |
| Miscellaneous | | | 17,961 | | | | 5,491 | |
| Total expenses | | | 13,892,222 | | | | 500,070 | |
| Less fees waived/reimbursed by investment adviser (Note 6) | | | | | | | | |
| Investor Class | | | – | | | | (912 | ) |
| Institutional Class | | | – | | | | (129,046 | ) |
| Total net expenses | | | 13,892,222 | | | | 370,112 | |
| NET INVESTMENT INCOME: | | | 28,276,405 | | | | 926,206 | |
| Net realized loss on investments | | | (31,927,013 | ) | | | (496,987 | ) |
| Net realized loss on foreign currency transactions | | | (712,909 | ) | | | (1,909 | ) |
| Net realized loss | | | (32,639,922 | ) | | | (498,896 | ) |
| Net change in unrealized depreciation on investments | | | (125,110,846 | ) | | | (6,054,388 | ) |
| Net change in unrealized appreciation/(depreciation) on translation of assets and liabilities in foreign currency transactions | | | 49,294 | | | | (740 | ) |
| Net unrealized depreciation | | | (125,061,552 | ) | | | (6,055,128 | ) |
| NET REALIZED AND UNREALIZED LOSS ON | | | | | | | | |
| INVESTMENTS AND FOREIGN CURRENCY TRANSLATIONS | | | (157,701,474 | ) | | | (6,554,024 | ) |
| NET DECREASE IN NET ASSETS RESULTING FROM OPERATIONS | | $ | (129,425,069 | ) | | $ | (5,627,818 | ) |
See accompanying Notes to Financial Statements.
| 28 | (855) 732-9220 seafarerfunds.com |
| Seafarer Overseas Growth and Income Fund | Statements of Changes in Net Assets |
| | | Year Ended | | | Year Ended | |
| | | April 30, 2020 | | | April 30, 2019 | |
| OPERATIONS: | | | | | | |
| Net investment income | | $ | 28,276,405 | | | $ | 50,058,210 | |
| Net realized loss | | | (32,639,922 | ) | | | (78,375,229 | ) |
| Net change in unrealized depreciation | | | (125,061,552 | ) | | | (157,770,194 | ) |
| Net decrease in net assets resulting from operations | | | (129,425,069 | ) | | | (186,087,213 | ) |
| DISTRIBUTIONS TO SHAREHOLDERS (NOTE 3): | | | | | | | | |
| Total amount of distribution | | | | | | | | |
| Investor Class | | | (5,408,005 | ) | | | (24,164,869 | ) |
| Institutional Class | | | (35,937,028 | ) | | | (109,435,374 | ) |
| Net decrease in net assets from distributions | | | (41,345,033 | ) | | | (133,600,243 | ) |
| BENEFICIAL INTEREST TRANSACTIONS (NOTE 5): | | | | | | | | |
| Shares sold | | | | | | | | |
| Investor Class | | | 22,164,876 | | | | 44,452,361 | |
| Institutional Class | | | 325,774,608 | | | | 774,931,703 | |
| Dividends reinvested | | | | | | | | |
| Investor Class | | | 5,308,481 | | | | 23,834,890 | |
| Institutional Class | | | 26,911,893 | | | | 94,069,305 | |
| Shares redeemed | | | | | | | | |
| Investor Class | | | (83,481,230 | ) | | | (652,824,161 | ) |
| Institutional Class | | | (407,913,072 | ) | | | (1,455,504,946 | ) |
| Net decrease in net assets derived from beneficial interest transactions | | | (111,234,444 | ) | | | (1,171,040,848 | ) |
| Net decrease in net assets | | | (282,004,546 | ) | | | (1,490,728,304 | ) |
| NET ASSETS: | | | | | | | | |
| Beginning of period | | | 1,537,563,015 | | | | 3,028,291,319 | |
| End of period | | $ | 1,255,558,469 | | | $ | 1,537,563,015 | |
| | | | | | | | | |
| Other Information: | | | | | | | | |
| SHARE TRANSACTIONS: | | | | | | | | |
| Investor Class | | | | | | | | |
| Sold | | | 2,037,998 | | | | 3,794,490 | |
| Distributions reinvested | | | 459,978 | | | | 2,179,970 | |
| Redeemed | | | (7,725,123 | ) | | | (54,038,510 | ) |
| Net decrease in shares outstanding | | | (5,227,147 | ) | | | (48,064,050 | ) |
| Institutional Class | | | | | | | | |
| Sold | | | 29,550,598 | | | | 65,086,770 | |
| Distributions reinvested | | | 2,321,132 | | | | 8,768,097 | |
| Redeemed | | | (37,912,324 | ) | | | (123,834,889 | ) |
| Net decrease in shares outstanding | | | (6,040,594 | ) | | | (49,980,022 | ) |
See accompanying Notes to Financial Statements.
| Annual Report – April 30, 2020 | 29 |
| Seafarer Overseas Value Fund | Statements of Changes in Net Assets |
| | | Year Ended | | | Year Ended | |
| | | April 30, 2020 | | | April 30, 2019 | |
| OPERATIONS: | | | | | | |
| Net investment income | | $ | 926,206 | | | $ | 722,172 | |
| Net realized loss | | | (498,896 | ) | | | (44,789 | ) |
| Net change in unrealized depreciation | | | (6,055,128 | ) | | | (1,126,907 | ) |
| Net decrease in net assets resulting from operations | | | (5,627,818 | ) | | | (449,524 | ) |
| DISTRIBUTIONS TO SHAREHOLDERS (NOTE 3): | | | | | | | | |
| Total amount of distribution | | | | | | | | |
| Investor Class | | | (10,203 | ) | | | (8,420 | ) |
| Institutional Class | | | (1,187,165 | ) | | | (806,121 | ) |
| Net decrease in net assets from distributions | | | (1,197,368 | ) | | | (814,541 | ) |
| BENEFICIAL INTEREST TRANSACTIONS (NOTE 5): | | | | | | | | |
| Shares sold | | | | | | | | |
| Investor Class | | | 76,836 | | | | 36,125 | |
| Institutional Class | | | 18,676,589 | | | | 11,105,956 | |
| Dividends reinvested | | | | | | | | |
| Investor Class | | | 9,407 | | | | 8,124 | |
| Institutional Class | | | 1,179,600 | | | | 777,710 | |
| Shares redeemed | | | | | | | | |
| Investor Class | | | (77,747 | ) | | | (17,747 | ) |
| Institutional Class | | | (12,380,590 | ) | | | (7,072,100 | ) |
| Net increase in net assets derived from beneficial interest transactions | | | 7,484,095 | | | | 4,838,068 | |
| Net increase in net assets | | | 658,909 | | | | 3,574,003 | |
| NET ASSETS: | | | | | | | | |
| Beginning of period | | | 29,176,084 | | | | 25,602,081 | |
| End of period | | $ | 29,834,993 | | | $ | 29,176,084 | |
| Other Information: | | | | | | | | |
| SHARE TRANSACTIONS: | | | | | | | | |
| Investor Class | | | | | | | | |
| Sold | | | 7,196 | | | | 3,312 | |
| Distributions reinvested | | | 805 | | | | 789 | |
| Redeemed | | | (7,208 | ) | | | (1,530 | ) |
| Net increase in shares outstanding | | | 793 | | | | 2,571 | |
| Institutional Class | | | | | | | | |
| Sold | | | 1,670,988 | | | | 1,003,072 | |
| Distributions reinvested | | | 100,907 | | | | 75,506 | |
| Redeemed | | | (1,177,965 | ) | | | (668,216 | ) |
| Net increase in shares outstanding | | | 593,930 | | | | 410,362 | |
See accompanying Notes to Financial Statements.
| 30 | (855) 732-9220 seafarerfunds.com |
Page Intentionally Left Blank
Seafarer Overseas Growth and Income Fund
| Investor Class |
| NET ASSET VALUE, BEGINNING OF PERIOD |
| INCOME FROM OPERATIONS: |
| Net investment income(a) |
| Net realized and unrealized gain/(loss) on investments |
| Total from investment operations |
| |
| LESS DISTRIBUTIONS: |
| From net investment income |
| From net realized gains on investments |
| Total distributions |
| REDEMPTION FEES ADDED TO PAID IN CAPITAL |
| NET INCREASE/(DECREASE) IN NET ASSET VALUE |
| NET ASSET VALUE, END OF PERIOD |
| |
| TOTAL RETURN(d) |
| SUPPLEMENTAL DATA: |
| Net assets, end of period (in 000s) |
| RATIOS TO AVERAGE NET ASSETS: |
| Operating expenses excluding reimbursement/waiver |
| Operating expenses including reimbursement/waiver |
| Net investment income including reimbursement/waiver |
| PORTFOLIO TURNOVER RATE |
| (a) | Calculated using the average shares method. |
| (b) | Less than $0.005 per share. |
| (c) | In preparing the financial statements in accordance with U.S. GAAP, management made certain adjustments as required by U.S. GAAP which caused the net asset value for purposes of these financial statements to differ from the net asset value used to process shareholder transactions as of the date of these financial statements. As a result, the net asset value increased from $12.50 to $12.51. |
| (d) | Total returns are for the periods indicated and have not been annualized. In some periods, total returns would have been lower had certain expenses not been waived during the periods. Returns shown do not reflect the deduction of taxes that a shareholder would pay on Fund distributions or the redemption of Fund shares. |
| (e) | Includes adjustments in accordance with U.S. GAAP and as such, the total return for shareholder transactions reported to the market may differ from the total return for financial reporting purposes. As a result, the total return decreased from 8.12% to 8.03%. |
| (f) | Includes adjustments in accordance with U.S. GAAP and as such, the total return for shareholder transactions reported to the market may differ from the total return for financial reporting purposes. As a result, the total return increased from 11.13% to 11.22%. |
| (g) | Effective September 1, 2015, the Adviser agreed to limit expenses to 1.15%. The Adviser agreed to limit expenses to 1.25% for the period September 1, 2014 through August 31, 2015. Prior to September 1, 2014, the Adviser agreed to limit expenses to 1.40%. (See Note 6.) |
| 32 | (855) 732-9220 seafarerfunds.com |
| For a share outstanding through the years presented |
| Year Ended | | | Year Ended | | | Year Ended | | | Year Ended | | | Year Ended | |
| April 30, 2020 | | | April 30, 2019 | | | April 30, 2018 | | | April 30, 2017 | | | April 30, 2016 | |
| $ | 11.56 | | | $ | 13.11 | | | $ | 12.51 | | | $ | 11.44 | | | $ | 12.64 | |
| | | | | | | | | | | | | | | | | | | |
| | 0.21 | | | | 0.36 | | | | 0.28 | | | | 0.22 | | | | 0.16 | |
| | (1.15 | ) | | | (1.02 | ) | | | 0.72 | | | | 1.04 | | | | (1.23 | ) |
| | (0.94 | ) | | | (0.66 | ) | | | 1.00 | | | | 1.26 | | | | (1.07 | ) |
| | | | | | | | | | | | | | | | | | | |
| | | | | | | | | | | | | | | | | | | |
| | (0.31 | ) | | | (0.01 | ) | | | (0.37 | ) | | | (0.19 | ) | | | (0.11 | ) |
| | – | | | | (0.88 | ) | | | (0.03 | ) | | | – | | | | (0.02 | ) |
| | (0.31 | ) | | | (0.89 | ) | | | (0.40 | ) | | | (0.19 | ) | | | (0.13 | ) |
| | – | | | | – | | | | – | | | | 0.00 | (b) | | | 0.00 | (b) |
| | (1.25 | ) | | | (1.55 | ) | | | 0.60 | | | | 1.07 | | | | (1.20 | ) |
| $ | 10.31 | | | $ | 11.56 | | | $ | 13.11 | | | $ | 12.51 | (c) | | $ | 11.44 | |
| | | | | | | | | | | | | | | | | | | |
| | (8.44 | %) | | | (4.36 | %) | | | 8.03 | %(e) | | | 11.22 | %(f) | | | (8.39 | %) |
| | | | | | | | | | | | | | | | | | | |
| $ | 154,017 | | | $ | 233,072 | | | $ | 894,241 | | | $ | 877,384 | | | $ | 613,795 | |
| | | | | | | | | | | | | | | | | | | |
| | 1.02 | % | | | 0.99 | % | | | 0.97 | % | | | 1.02 | % | | | 1.14 | % |
| | 1.02 | % | | | 0.99 | % | | | 0.97 | % | | | 1.02 | % | | | 1.14 | %(g) |
| | 1.88 | % | | | 3.02 | % | | | 2.12 | % | | | 1.88 | % | | | 1.50 | % |
| | 29 | % | | | 52 | % | | | 23 | % | | | 14 | % | | | 7 | % |
See accompanying Notes to Financial Statements.
| Annual Report – April 30, 2020 | 33 |
Seafarer Overseas Growth and Income Fund
| Institutional Class |
| NET ASSET VALUE, BEGINNING OF PERIOD |
| INCOME FROM OPERATIONS: |
| Net investment income(a) |
| Net realized and unrealized gain/(loss) on investments |
| Total from investment operations |
| |
| LESS DISTRIBUTIONS: |
| From net investment income |
| From net realized gains on investments |
| Total distributions |
| REDEMPTION FEES ADDED TO PAID IN CAPITAL |
| NET INCREASE/(DECREASE) IN NET ASSET VALUE |
| NET ASSET VALUE, END OF PERIOD |
| |
| TOTAL RETURN(c) |
| SUPPLEMENTAL DATA: |
| Net assets, end of period (in 000s) |
| RATIOS TO AVERAGE NET ASSETS: |
| Operating expenses excluding reimbursement/waiver |
| Operating expenses including reimbursement/waiver |
| Net investment income including reimbursement/waiver |
| PORTFOLIO TURNOVER RATE |
| (a) | Calculated using the average shares method. |
| (b) | Less than $0.005 per share. |
| (c) | Total returns are for the periods indicated and have not been annualized. In some periods, total returns would have been lower had certain expenses not been waived during the periods. Returns shown do not reflect the deduction of taxes that a shareholder would pay on Fund distributions or the redemption of Fund shares. |
| 34 | (855) 732-9220 seafarerfunds.com |
| For a share outstanding through the years presented |
| Year Ended | | | Year Ended | | | Year Ended | | | Year Ended | | | Year Ended | |
| April 30, 2020 | | | April 30, 2019 | | | April 30, 2018 | | | April 30, 2017 | | | April 30, 2016 | |
| $ | 11.61 | | | $ | 13.14 | | | $ | 12.54 | | | $ | 11.46 | | | $ | 12.66 | |
| | | | | | | | | | | | | | | | | | | |
| | 0.22 | | | | 0.29 | | | | 0.28 | | | | 0.21 | | | | 0.19 | |
| | (1.16 | ) | | | (0.93 | ) | | | 0.73 | | | | 1.07 | | | | (1.26 | ) |
| | (0.94 | ) | | | (0.64 | ) | | | 1.01 | | | | 1.28 | | | | (1.07 | ) |
| | | | | | | | | | | | | | | | | | | |
| | (0.31 | ) | | | (0.01 | ) | | | (0.38 | ) | | | (0.20 | ) | | | (0.12 | ) |
| | – | | | | (0.88 | ) | | | (0.03 | ) | | | – | | | | (0.02 | ) |
| | (0.31 | ) | | | (0.89 | ) | | | (0.41 | ) | | | (0.20 | ) | | | (0.14 | ) |
| | – | | | | – | | | | – | | | | 0.00 | (b) | | | 0.01 | |
| | (1.25 | ) | | | (1.53 | ) | | | 0.60 | | | | 1.08 | | | | (1.20 | ) |
| $ | 10.36 | | | $ | 11.61 | | | $ | 13.14 | | | $ | 12.54 | | | $ | 11.46 | |
| | (8.34 | %) | | | (4.17 | %) | | | 8.08 | % | | | 11.37 | % | | | (8.32 | %) |
| | | | | �� | | | | | | | | | | | | | | |
| $ | 1,101,542 | | | $ | 1,304,491 | | | $ | 2,134,051 | | | $ | 1,500,310 | | | $ | 605,178 | |
| | 0.92 | % | | | 0.90 | % | | | 0.87 | % | | | 0.92 | % | | | 1.03 | % |
| | 0.92 | % | | | 0.90 | % | | | 0.87 | % | | | 0.92 | % | | | 1.03 | % |
| | 1.91 | % | | | 2.45 | % | | | 2.09 | % | | | 1.82 | % | | | 1.72 | % |
| | 29 | % | | | 52 | % | | | 23 | % | | | 14 | % | | | 7 | % |
See accompanying Notes to Financial Statements.
| Annual Report – April 30, 2020 | 35 |
Seafarer Overseas Value Fund
| Investor Class |
| NET ASSET VALUE, BEGINNING OF PERIOD |
| INCOME FROM OPERATIONS: |
| Net investment income(a) |
| Net realized and unrealized gain/(loss) on investments |
| Total from investment operations |
| |
| LESS DISTRIBUTIONS: |
| From net investment income |
| From net realized gains on investments |
| Total distributions |
| NET INCREASE/(DECREASE) IN NET ASSET VALUE |
| NET ASSET VALUE, END OF PERIOD |
| |
| TOTAL RETURN(b) |
| SUPPLEMENTAL DATA: |
| Net assets, end of period (in 000s) |
| RATIOS TO AVERAGE NET ASSETS: |
| Operating expenses excluding reimbursement/waiver |
| Operating expenses including reimbursement/waiver |
| Net investment income including reimbursement/waiver |
| PORTFOLIO TURNOVER RATE(d) |
| (a) | Calculated using the average shares method. |
| (b) | Total returns are for the periods indicated and have not been annualized. In some periods, total returns would have been lower had certain expenses not been waived during the periods. Returns shown do not reflect the deduction of taxes that a shareholder would pay on Fund distributions or the redemption of Fund shares. |
| (d) | Portfolio turnover rate for a period less than one full year has not been annualized. |
| 36 | (855) 732-9220 seafarerfunds.com |
Financial Highlights
For a share outstanding through the years presented
| Year Ended | | | Year Ended | | | Year Ended | | | May 31, 2016 (Inception) | |
| April 30, 2020 | | | April 30, 2019 | | | April 30, 2018 | | | to April 30, 2017 | |
| $ | 11.41 | | | $ | 11.95 | | | $ | 11.30 | | | $ | 10.00 | |
| | | | | | | | | | | | | | | |
| | 0.29 | | | | 0.29 | | | | 0.35 | | | | 0.12 | |
| | (1.88 | ) | | | (0.51 | ) | | | 0.72 | | | | 1.28 | |
| | (1.59 | ) | | | (0.22 | ) | | | 1.07 | | | | 1.40 | |
| | | | | | | | | | | | | | | |
| | (0.31 | ) | | | (0.29 | ) | | | (0.42 | ) | | | (0.10 | ) |
| | (0.05 | ) | | | (0.03 | ) | | | – | | | | – | |
| | (0.36 | ) | | | (0.32 | ) | | | (0.42 | ) | | | (0.10 | ) |
| | (1.95 | ) | | | (0.54 | ) | | | 0.65 | | | | 1.30 | |
| $ | 9.46 | | | $ | 11.41 | | | $ | 11.95 | | | $ | 11.30 | |
| | | | | | | | | | | | | | | |
| | (14.54 | %) | | | (1.50 | %) | | | 9.55 | % | | | 14.15 | % |
| | | | | | | | | | | | | | | |
| $ | 278 | | | $ | 327 | | | $ | 311 | | | $ | 280 | |
| | | | | | | | | | | | | | | |
| | 1.44 | % | | | 1.45 | % | | | 1.80 | % | | | 3.71 | %(c) |
| | 1.15 | % | | | 1.15 | % | | | 1.15 | % | | | 1.15 | %(c) |
| | 2.61 | % | | | 2.59 | % | | | 2.91 | % | | | 1.24 | %(c) |
| | 25 | % | | | 3 | % | | | 3 | % | | | 0 | % |
See accompanying Notes to Financial Statements.
| Annual Report – April 30, 2020 | 37 |
Seafarer Overseas Value Fund
| Institutional Class |
| NET ASSET VALUE, BEGINNING OF PERIOD |
| INCOME FROM OPERATIONS: |
| Net investment income(a) |
| Net realized and unrealized gain/(loss) on investments |
| Total from investment operations |
| |
| LESS DISTRIBUTIONS: |
| From net investment income |
| From net realized gains on investments |
| Total distributions |
| NET INCREASE/(DECREASE) IN NET ASSET VALUE |
| NET ASSET VALUE, END OF PERIOD |
| |
| TOTAL RETURN(c) |
| SUPPLEMENTAL DATA: |
| Net assets, end of period (in 000s) |
| RATIOS TO AVERAGE NET ASSETS: |
| Operating expenses excluding reimbursement/waiver |
| Operating expenses including reimbursement/waiver |
| Net investment income including reimbursement/waiver |
| PORTFOLIO TURNOVER RATE(g) |
| (a) | Calculated using the average shares method. |
| (b) | In preparing the financial statements in accordance with U.S. GAAP, management made certain adjustments as required by U.S. GAAP which caused the net asset value for purposes of these financial statements to differ from the net asset value used to process shareholder transactions as of the date of these financial statements. As a result, the net asset value decreased from $11.29 to $11.28. |
| (c) | Total returns are for the periods indicated and have not been annualized. In some periods, total returns would have been lower had certain expenses not been waived during the periods. Returns shown do not reflect the deduction of taxes that a shareholder would pay on Fund distributions or the redemption of Fund shares. |
| (d) | Includes adjustments in accordance with U.S. GAAP and as such, the total return for shareholder transactions reported to the market may differ from the total return for financial reporting purposes. As a result, the total return increased from 9.64% to 9.74%. |
| (e) | Includes adjustments in accordance with U.S. GAAP and as such, the total return for shareholder transactions reported to the market may differ from the total return for financial reporting purposes. As a result, the total return decreased from 14.29% to 14.18%. |
| (g) | Portfolio turnover rate for a period less than one full year has not been annualized. |
| 38 | (855) 732-9220 seafarerfunds.com |
Financial Highlights
For a share outstanding through the years presented
| Year Ended | | | Year Ended | | | Year Ended | | | May 31, 2016 (Inception) | |
| April 30, 2020 | | | April 30, 2019 | | | April 30, 2018 | | | to April 30, 2017 | |
| | | | | | | | | | | |
| $ | 11.43 | | | $ | 11.96 | | | $ | 11.28 | | | $ | 10.00 | |
| | | | | | | | | | | | | | | |
| | 0.30 | | | | 0.30 | | | | 0.35 | | | | 0.13 | |
| | (1.88 | ) | | | (0.50 | ) | | | 0.74 | | | | 1.28 | |
| | (1.58 | ) | | | (0.20 | ) | | | 1.09 | | | | 1.41 | |
| | | | | | | | | | | | | | | |
| | | | | | | | | | | | | | | |
| | (0.32 | ) | | | (0.30 | ) | | | (0.41 | ) | | | (0.13 | ) |
| | (0.05 | ) | | | (0.03 | ) | | | – | | | | – | |
| | (0.37 | ) | | | (0.33 | ) | | | (0.41 | ) | | | (0.13 | ) |
| | (1.95 | ) | | | (0.53 | ) | | | 0.68 | | | | 1.28 | |
| $ | 9.48 | | | $ | 11.43 | | | $ | 11.96 | | | $ | 11.28 | (b) |
| | | | | | | | | | | | | | | |
| | (14.47 | %) | | | (1.34 | %) | | | 9.74 | %(d) | | | 14.18 | %(e) |
| | | | | | | | | | | | | | | |
| $ | 29,557 | | | $ | 28,849 | | | $ | 25,291 | | | $ | 9,846 | |
| | | | | | | | | | | | | | | |
| | 1.42 | % | | | 1.48 | % | | | 1.76 | % | | | 3.63 | %(f) |
| | 1.05 | % | | | 1.05 | % | | | 1.05 | % | | | 1.05 | %(f) |
| | 2.63 | % | | | 2.65 | % | | | 2.90 | % | | | 1.36 | %(f) |
| | 25 | % | | | 3 | % | | | 3 | % | | | 0 | % |
See accompanying Notes to Financial Statements.
| Annual Report – April 30, 2020 | 39 |
| Seafarer Funds | Notes to Financial Statements |
NOTES TO FINANCIAL STATEMENTS
1. Organization
Financial Investors Trust (the “Trust”), a Delaware statutory trust, is an open-end management investment company registered under the Investment Company Act of 1940, as amended (“1940 Act”). The Trust consists of multiple separate portfolios or series. This annual report describes the Seafarer Overseas Growth and Income Fund and the Seafarer Overseas Value Fund (individually a “Fund” and collectively, the “Funds”). The Seafarer Overseas Growth and Income Fund seeks to provide long-term capital appreciation along with some current income; it also seeks to mitigate adverse volatility in returns as a secondary objective. The Seafarer Overseas Value Fund seeks to provide long-term capital appreciation. The Funds each offer Investor Class and Institutional Class shares.
2. Significant Accounting Policies
The accompanying financial statements were prepared in accordance with accounting principles generally accepted in the United States of America (“U.S. GAAP”). The preparation of financial statements in conformity with U.S. GAAP requires management to make certain estimates and assumptions that affect the reported amounts of assets and liabilities and disclosures of contingent assets and liabilities at the date of the financial statements and the reported amounts of revenue and expenses during the period. Actual results could differ from those estimates. The Funds are considered an investment company for financial reporting purposes under U.S. GAAP and follow the accounting and reporting guidance applicable to investment companies in the Financial Accounting Standards Board Accounting Standards Codification Topic 946.The following is a summary of significant accounting policies consistently followed by the Funds in preparation of their financial statements.
Investment Valuation
Each Fund generally values its securities based on market prices determined at the close of regular trading on the New York Stock Exchange (“NYSE”), normally 4:00 p.m. Eastern Time, on each day the NYSE is open for trading.
For equity securities and exchange traded funds, the market price is usually the closing sale or official closing price on that exchange. In the case of equity securities not traded on an exchange, or if such closing prices are not otherwise available, the securities are valued at the mean of the most recent bid and ask prices on such day. Redeemable securities issued by open-end registered investment companies are valued at the investment company’s applicable net asset value, with the exception of exchange-traded open-end investment companies, which are priced as equity securities.
Equity securities that are primarily traded on foreign securities exchanges are valued at the closing values of such securities on their respective foreign exchanges, except when an event occurs subsequent to the close of the foreign exchange but before the close of the NYSE, such that the securities’ value would likely change. In such an event, the fair values of those securities are determined in good faith through consideration of other factors in accordance with procedures established by and under the general supervision of the Board of Trustees of the Trust (the “Board” or the “Trustees”). Each Fund uses a fair valuation model provided by an independent pricing service, which is intended to reflect fair value when a security’s value or a meaningful portion of the Fund’s portfolio is believed to have been materially affected by a valuation event that has occurred between the close of the exchange or market on which the security is traded and the close of the regular trading day on the NYSE.
The market price for debt obligations is generally the price supplied by an independent third-party pricing service approved by the Board, which may use a matrix, formula or other objective method that takes into consideration quotations from dealers, market transactions in comparable investments, market indices and yield curves. If vendors are unable to supply a price, or if the price supplied is deemed to be unreliable, the market price may be determined using quotations received from one or more broker-dealers that make a market in the security. Corporate bonds and convertible bonds are valued using market models that consider trade data, quotations from dealers and active market makers, relevant yield curve and spread
| 40 | (855) 732-9220 seafarerfunds.com |
| Seafarer Funds | Notes to Financial Statements |
data, creditworthiness, trade data or market information on comparable securities, and other relevant security specific information. Publicly traded foreign government debt securities and foreign corporate bonds are typically traded internationally in the over-the-counter market and are valued at the mean between the bid and asked prices as of the close of business of that market.
Forward currency exchange contracts have a market value determined by the prevailing foreign currency exchange daily rates and current foreign currency exchange forward rates. The foreign currency exchange forward rates are calculated using an automated system that estimates rates on the basis of the current day foreign currency exchange rates and forward foreign currency exchange rates supplied by a pricing service.
When such prices or quotations are not available, or when the Trust’s Valuation Committee believes that they are unreliable, securities may be priced using fair value procedures approved by the Board.
Certain foreign countries impose a tax on capital gains which is accrued by each Fund based on unrealized appreciation, if any, on affected securities. The tax is paid when the gain is realized.
Fair Value Measurements
Each Fund discloses the classification of its fair value measurements following a three-tier hierarchy based on the inputs used to measure fair value. Inputs refer broadly to the assumptions that market participants would use in pricing the asset or liability, including assumptions about risk. Inputs may be observable or unobservable. Observable inputs reflect the assumptions market participants would use in pricing the asset or liability. Such inputs are developed based on market data obtained from sources independent of the reporting entity. Unobservable inputs reflect the reporting entity’s own assumptions about the assumptions market participants would use in pricing the asset or liability, which are developed based on the information available and the reporting entity’s best efforts to interpret such information.
Various inputs are used in determining the value of the Funds’ investments as of the end of the reporting period. When inputs used fall into different levels of the fair value hierarchy, the level in the hierarchy within which the fair value measurement falls is determined based on the lowest level input that is significant to the fair value measurement in its entirety. The designated input levels are not necessarily an indication of the risk or liquidity associated with these investments. These inputs are categorized in the following hierarchy under applicable financial accounting standards:
| Level 1 – | Unadjusted quoted prices in active markets for identical investments, unrestricted assets or liabilities that the Funds have the ability to access at the measurement date; |
| Level 2 – | Quoted prices which are not active, quoted prices for similar assets or liabilities in active markets or inputs other than quoted prices that are observable (either directly or indirectly) for substantially the full term of the asset or liability; and |
| Level 3 – | Significant unobservable prices or inputs (including the Funds’ own assumptions in determining the fair value of investments) where there is little or no market activity for the asset or liability at the measurement date. |
| Annual Report – April 30, 2020 | 41 |
| Seafarer Funds | Notes to Financial Statements |
The following is a summary of the inputs used to value each Fund as of April 30, 2020:
| Investments in Securities at Value(a) | | Level 1 - Quoted Prices | | | Level 2 - Other Significant Observable Inputs | | | Level 3 - Significant Unobservable Inputs | | | Total | |
| Seafarer Overseas Growth and Income Fund | | | | | | | | | | | | | | | | |
| Common Stocks | | | | | | | | | | | | | | | | |
| Brazil | | $ | 45,675,721 | | | $ | – | | | $ | – | | | $ | 45,675,721 | |
| China / Hong Kong | | | 79,786,849 | | | | 265,808,728 | | | | – | | | | 345,595,577 | |
| Czech Republic | | | – | | | | 16,619,697 | | | | – | | | | 16,619,697 | |
| Hungary | | | – | | | | 53,995,474 | | | | – | | | | 53,995,474 | |
| India | | | 37,381,500 | | | | – | | | | – | | | | 37,381,500 | |
| Indonesia | | | – | | | | 5,456,625 | | | | – | | | | 5,456,625 | |
| Mexico | | | 32,806,661 | | | | – | | | | – | | | | 32,806,661 | |
| Qatar | | | 25,806,000 | | | | – | | | | – | | | | 25,806,000 | |
| Singapore | | | – | | | | 88,456,231 | | | | – | | | | 88,456,231 | |
| South Africa | | | – | | | | 39,961,414 | | | | – | | | | 39,961,414 | |
| South Korea | | | 22,966,884 | | | | 265,151,033 | | | | – | | | | 288,117,917 | |
| Taiwan | | | – | | | | 89,591,168 | | | | – | | | | 89,591,168 | |
| Thailand | | | – | | | | 15,902,657 | | | | – | | | | 15,902,657 | |
| United Arab Emirates | | | 23,859,043 | | | | – | | | | – | | | | 23,859,043 | |
| Vietnam | | | – | | | | 27,310,353 | | | | – | | | | 27,310,353 | |
| Preferred Stocks | | | – | | | | 64,131,393 | | | | – | | | | 64,131,393 | |
| Government Bond, Short-term - USD and Foreign Currency | | | – | | | | 4,000,440 | | | | – | | | | 4,000,440 | |
| Total | | $ | 268,282,658 | | | $ | 936,385,213 | | | $ | – | | | $ | 1,204,667,871 | |
| 42 | (855) 732-9220 seafarerfunds.com |
| Seafarer Funds | Notes to Financial Statements |
| Investments in Securities at Value(a) | | Level 1 - Quoted Prices | | | Level 2 - Other Significant Observable Inputs | | | Level 3 - Significant Unobservable Inputs | | | Total | |
| Seafarer Overseas Value Fund | | | | | | | | | | | | |
| Common Stocks | | | | | | | | | | | | |
| Brazil | | $ | 920,947 | | | $ | – | | | $ | – | | | $ | 920,947 | |
| China / Hong Kong | | | 77,031 | | | | 11,949,789 | | | | – | | | | 12,026,820 | |
| Czech Republic | | | – | | | | 872,534 | | | | – | | | | 872,534 | |
| Georgia | | | – | | | | 804,513 | | | | – | | | | 804,513 | |
| Mexico | | | 376,040 | | | | – | | | | – | | | | 376,040 | |
| Philippines | | | 379,392 | | | | – | | | | – | | | | 379,392 | |
| Qatar | | | 1,625,998 | | | | – | | | | – | | | | 1,625,998 | |
| Russia | | | 554,870 | | | | 51,977 | | | | – | | | | 606,847 | |
| Singapore | | | – | | | | 3,462,345 | | | | – | | | | 3,462,345 | |
| South Korea | | | 1,052,649 | | | | 2,031,629 | | | | – | | | | 3,084,278 | |
| United Arab Emirates | | | 1,759,968 | | | | – | | | | – | | | | 1,759,968 | |
| Vietnam | | | – | | | | 1,670,905 | | | | – | | | | 1,670,905 | |
| Total | | $ | 6,746,895 | | | $ | 20,843,692 | $ | | | – | | | $ | 27,590,587 | |
| (a) | For detailed descriptions of securities by country, see the accompanying Portfolio of Investments. |
For the year ended April 30, 2020, the Funds did not have any securities that used significant unobservable inputs (Level 3) in determining fair value.
Investment Transactions and Investment Income
Investment transactions are accounted for on the date the investments are purchased or sold (trade date). Realized gains and losses from investment transactions are reported on an identified cost basis. Interest income, which includes accretion of discounts and amortization of premiums, is accrued and recorded as earned. Dividend income is recognized on the ex-dividend date or for certain foreign securities, as soon as information is available to the Funds. All of the realized and unrealized gains and losses and net investment income are allocated daily to each share class in proportion to its average daily net assets.
Cash Management Transactions
Each of the Funds subscribes to the Brown Brothers Harriman & Co. (“BBH”) Cash Management Service (“CMS”), whereby cash balances are automatically swept into overnight offshore demand deposits with either the BBH Grand Cayman branch or a branch of a pre-approved commercial bank. This fully automated program allows the Funds to earn interest on cash balances. Excess cash with deposit institutions domiciled outside of the U.S. are subject to sovereign actions in the jurisdiction of the deposit institution including, but not limited to, freeze, seizure or diminution. Cash balances in the BBH CMS are included on the Statements of Assets and Liabilities under Cash and Foreign currency, at value. As of April 30, 2020, the Funds had the following cash balances participating in the BBH CMS:
| Fund | | | |
| Seafarer Overseas Growth and Income Fund | | $ | 48,319,000 | |
| Seafarer Overseas Value Fund | | | 2,061,409 | |
| Annual Report – April 30, 2020 | 43 |
| Seafarer Funds | Notes to Financial Statements |
As of April 30, 2020, the Funds had the following foreign cash balances participating in the BBH CMS (cost and value of foreign cash balances are equal):
| Fund | | | | |
| Seafarer Overseas Growth and Income Fund | | $ | — | |
| Seafarer Overseas Value Fund | | | — | |
Foreign Securities
The Funds may directly purchase securities of foreign issuers. Investing in securities of foreign issuers involves special risks not typically associated with investing in securities of U.S. issuers. The risks include possible revaluation of currencies, the inability to repatriate foreign currency, less complete financial information about companies, and possible future adverse political and economic developments. Moreover, securities of many foreign issuers and their markets may be less liquid and their prices more volatile than those of securities of comparable U.S. issuers.
Foreign Currency Translation
The books and records of the Funds are maintained in U.S. dollars. Investment valuations and other assets and liabilities initially expressed in foreign currencies are converted each business day into U.S. dollars based upon current exchange rates. Prevailing foreign exchange rates may generally be obtained at the close of the NYSE (normally, 4:00 p.m. Eastern Time). The portion of realized and unrealized gains or losses on investments due to fluctuations in foreign currency exchange rates is not separately disclosed and is included in realized and unrealized gains or losses on investments, when applicable.
Foreign Currency Spot Contracts
Each Fund may enter into foreign currency spot contracts to facilitate transactions in foreign securities or to convert foreign currency receipts into U.S. dollars. A foreign currency spot contract is an agreement between two parties to buy and sell currencies at the current market rate, for settlement generally within two business days. The U.S. dollar value of a contract is determined using current currency exchange rates supplied by a pricing service. The contract is marked-to-market daily for settlements beyond one day and any change in market value is recorded as an unrealized gain or loss. When the contract is closed, the Fund records a realized gain or loss equal to the difference between the value on the open and close date. Losses may arise from changes in the value of the foreign currency, or if the counterparties do not perform under the contract’s terms. The maximum potential loss from such contracts is the aggregate face value in U.S. dollars at the time the contract was opened.
Trust Expenses
Some expenses of the Trust can be directly attributed to the Funds. Expenses that cannot be directly attributed to the Funds are apportioned among all funds in the Trust based on the average daily net assets of each fund.
Fund and Class Expenses
Expenses that are specific to a Fund or class of shares of a Fund, including shareholder servicing fees, are charged directly to that Fund or share class. Expenses that are common to all Funds are generally allocated among the Funds in proportion to their average daily net assets.
Federal Income Taxes
Each Fund complies with the requirements under Subchapter M of the Internal Revenue Code of 1986, as amended, applicable to regulated investment companies and intends to distribute substantially all of its net taxable income and net capital gains, if any, each year so that it will not be subject to excise tax on undistributed income and gains. The Funds are not subject to income taxes to the extent such distributions are made.
| 44 | (855) 732-9220 seafarerfunds.com |
| Seafarer Funds | Notes to Financial Statements |
As of and during the year ended April 30, 2020, the Funds did not have a liability for any unrecognized tax benefits. The Funds file U.S. federal, state, and local tax returns as required. The Funds’ tax returns are subject to examination by the relevant tax authorities until expiration of the applicable statute of limitations, which is generally three years after the filing of the tax return for federal purposes and four years for most state returns. Tax returns for open years have incorporated no uncertain tax positions that require a provision for income taxes.
Distributions to Shareholders
In general, the Seafarer Overseas Growth and Income Fund’s policy is to distribute to its shareholders substantially all net investment income paid out via semi-annual dividends, in June and December. The Seafarer Overseas Value Fund’s policy is to distribute to its shareholders substantially all net investment income via one annual dividend in December. It is also each Fund’s policy to distribute annually all net realized short-term and long-term capital gains, if any, after offsetting any capital loss carryovers. Income dividend distributions are derived from dividends and other income each Fund receives from its investments, including short-term capital gains. Long-term capital gain distributions are derived from gains realized when a Fund sells a security it has owned for more than one year. Each Fund may make additional distributions if Seafarer Capital Partners, LLC (the “Adviser”) believes doing so may be necessary for the Fund to share tax obligations more ratably and more equitably across shareholders over time.
Epidemic and Pandemic Risk
Certain countries have been susceptible to epidemics, most recently Covid-19, which has been designated as a pandemic by world health authorities. The outbreak of such epidemics, together with any resulting restrictions on travel or quarantines imposed, could have a negative impact on the economy and business activity globally (including in the countries in which the Funds invest), and thereby could adversely affect the performance of the Funds’ investments. Furthermore, the rapid development of epidemics could preclude prediction as to their ultimate adverse impact on economic and market conditions, and, as a result, present material uncertainty and risk with respect to the performance of the Funds’ investments.
3. Tax Basis Information
Reclassifications
As of April 30, 2020, permanent differences in book and tax accounting were reclassified. These differences had no effect on net assets and were primarily attributed to equalization. The reclassifications were as follows:
| Fund | | Paid-in Capital | | | Distributable Earnings | |
| Seafarer Overseas Growth and Income Fund | | $ | – | | | $ | – | |
| Seafarer Overseas Value Fund | | $ | 70,637 | | | $ | (70,637 | ) |
| Annual Report – April 30, 2020 | 45 |
| Seafarer Funds | Notes to Financial Statements |
Tax Basis of Investments
As of April 30, 2020, the aggregate cost of investments, gross unrealized appreciation/(depreciation), and net unrealized depreciation for Federal income tax purposes were as follows:
| | | Cost of | | | Gross Unrealized | | | Gross Unrealized | | | Net Appreciation/ (Depreciation) on Foreign | | | Net Unrealized | |
| Fund | | Investments | | | Appreciation | | | Depreciation | | | Currencies | | | Depreciation | |
| Seafarer Overseas Growth and Income Fund | | | | | |
| | | $ | 1,302,013,593 | | | $ | 120,341,035 | | | $ | (217,686,757 | ) | | $ | 40,467 | | | $ | (97,305,255 | ) |
| Seafarer Overseas Value Fund | | | | | | | | | | |
| | | | 33,950,375 | | | | 2,765,496 | | | | (9,125,284 | ) | | | (1,176 | ) | | | (6,360,964 | ) |
Components of Distributable Earnings
As of April 30, 2020, components of distributable earnings were as follows:
| Seafarer Overseas Growth and Income Fund | | | |
| Accumulated net investment income | | $ | 1,510,873 | |
| Accumulated net realized loss | | | (93,150,233 | ) |
| Net unrealized depreciation on investments | | | (97,305,255 | ) |
| Total distributable earnings | | $ | (188,944,615 | ) |
| | | | | |
| Seafarer Overseas Value Fund | | | | |
| Accumulated net investment income | | $ | 17,893 | |
| Accumulated net realized loss | | | (697,396 | ) |
| Net unrealized depreciation on investments | | | (6,360,964 | ) |
| Total distributable earnings | | $ | (7,040,467 | ) |
Capital Losses
Under current law, capital losses maintain their character as short-term or long-term and are carried forward to the next tax year without expiration. As of the current fiscal year end, the following amounts are available as carry forwards to the next tax year:
| Fund | | Short-Term | | | Long-Term | |
| Seafarer Overseas Growth and Income Fund | | $ | 36,651,926 | | | $ | 12,566,793 | |
| Seafarer Overseas Value Fund | | | – | | | | – | |
| 46 | (855) 732-9220 seafarerfunds.com |
| Seafarer Funds | Notes to Financial Statements |
The Funds elect to defer to the period ending April 30, 2021, capital losses recognized during the period November 1, 2019 – April 30, 2020 in the amounts of:
| Fund | | Capital Losses Recognized | |
| Seafarer Overseas Growth and Income Fund | | $ | 43,931,514 | |
| Seafarer Overseas Value Fund | | | 697,396 | |
Tax Basis of Distributions to Shareholders
The character of distributions made during the fiscal year from net investment income or net realized gains may differ from the ultimate characterization for federal income tax purposes. Also, due to the timing of dividend distributions, the fiscal year in which amounts are distributed may differ from the fiscal year in which the income or realized gain is recorded by a Fund.
The tax character of distributions paid by the Funds for the fiscal year ended April 30, 2020 was as follows:
| Fund | | Ordinary Income | | | Long-Term Capital Gain | |
| Seafarer Overseas Growth and Income Fund | | $ | 41,345,033 | | | $ | – | |
| Seafarer Overseas Value Fund | | | 1,063,690 | | | | 133,678 | |
The tax character of distributions paid by the Funds for the fiscal year ended April 30, 2019 was as follows:
| Fund | | Ordinary Income | | | Long-Term Capital Gain | |
| Seafarer Overseas Growth and Income Fund | | $ | 2,805,129 | | | $ | 130,795,114 | |
| Seafarer Overseas Value Fund | | | 751,764 | | | | 62,777 | |
4. Securities Transactions
The cost of purchases and proceeds from sales of securities excluding short-term securities during the fiscal year ended April 30, 2020 were as follows:
| Fund | | Purchases of Securities | | | Proceeds from Sales of Securities | |
| Seafarer Overseas Growth and Income Fund | | $ | 422,518,033 | | | $ | 577,136,797 | |
| Seafarer Overseas Value Fund | | | 14,248,035 | | | | 7,574,667 | |
5. Shares of Beneficial Interest
The capitalization of the Trust consists of an unlimited number of shares of beneficial interest with no par value per share. Holders of shares of the Funds of the Trust have one vote for each share held and a proportionate fraction of a vote for each fractional share. All shares issued and outstanding are fully paid and are transferable and redeemable at the option of the shareholder. Purchasers of the shares do not have any obligation to make payments to the Trust or its creditors solely by reason of the purchasers’ ownership of the shares. Shares have no pre-emptive rights.
| Annual Report – April 30, 2020 | 47 |
| Seafarer Funds | Notes to Financial Statements |
6. Management and Related Party Transactions
The Adviser, subject to the authority of the Board, is responsible for the overall management and administration of the Funds’ business affairs. The Adviser manages the investments of the Funds in accordance with the Funds’ investment objectives, policies, limitations and investment guidelines established jointly by the Adviser and the Trustees. Pursuant to the investment advisory agreement, the Funds, in the aggregate, pay the Adviser an annual management fee of 0.75% of the aggregate average daily net assets of the Funds up to $1.5 billion and 0.70% of the aggregate average daily net assets of the Funds over $1.5 billion. Each Fund pays the Adviser a monthly fee at the annual rate using the applicable management fee calculated based on the Fund’s pro rata share of the Funds’ combined average daily net assets. Prior to August 31, 2016, the Funds paid the Adviser an annual management fee of 0.75% of the aggregate average daily net assets of the Funds.
Effective September 1, 2014, the Adviser contractually agreed to limit certain Fund expenses (excluding brokerage expenses, interest expenses, taxes and extraordinary expenses) to 1.25% and 1.05% of the Funds’ average daily net assets in the Investor and Institutional share classes, respectively, through August 31, 2015. Effective September 1, 2015, the Adviser contractually, through successive one-year agreements, agreed to waive and/or reimburse fees or expenses in order to limit Total Annual Fund Operating Expenses After Fee Waiver / Expense Reimbursements (excluding brokerage expenses, interest expenses, taxes and extraordinary expenses) to 1.15% and 1.05% of the Funds’ average daily net assets for the Investor and Institutional share classes, respectively. The current agreement (the “Expense Agreement”) is in effect through August 31, 2020. The Adviser will be permitted to recover, on a class-by-class basis, expenses it has borne through the Expense Agreement to the extent that the Funds’ expenses in later periods fall below the expense cap in effect at the time of waiver or reimbursement. The Funds will not be obligated to pay any such deferred fees and expenses more than three years after the date of the waiver. This agreement may not be terminated or modified prior to August 31, 2020, except with the approval of the Funds’ Board. During the year ended April 30, 2020, the Adviser agreed that it will only seek to recoup waived management fees and will not recoup any reimbursed expenses. As of April 30, 2020, the Adviser has recouped all available waived management fees from the Seafarer Overseas Growth and Income Fund.
For the year ended April 30, 2020, the fee waivers and/or reimbursements were as follows for the Seafarer Overseas Value Fund:
| Fund | | Fees Waived/ Reimbursed By Adviser | | | Recoupment of Past Waived Fees By Adviser | |
| Seafarer Overseas Value Fund | | | | | | |
| Investor Class | | $ | 912 | | | $ | 37 | |
| Institutional Class | | | 129,046 | | | | – | |
As of April 30, 2020 the balances of recoupable expenses for each class were as follows for the Funds:
| Fund | | Expires 2021 | | | Expires 2022 | | | Expires 2023 | | | Total | |
| Seafarer Overseas Growth and Income Fund | | | | | | | | | | | | |
| Investor Class | | $ | – | | | $ | – | | | $ | – | | | $ | – | |
| Institutional Class | | | – | | | | – | | | | – | | | | – | |
| Seafarer Overseas Value Fund | | | | | | | | | | | | | | | | |
| Investor Class | | $ | 1,686 | | | $ | 897 | | | $ | 912 | | | $ | 3,495 | |
| Institutional Class | | | 108,082 | | | | 115,259 | | | | 129,046 | | | | 352,387 | |
| 48 | (855) 732-9220 seafarerfunds.com |
| Seafarer Funds | Notes to Financial Statements |
Fund Administrator
ALPS Fund Services, Inc. (“ALPS” and the “Administrator”) provides administrative, fund accounting and other services to the Funds under the Administration, Bookkeeping and Pricing Services Agreement with the Trust.
The Funds’ administrative fee is accrued on a daily basis and paid monthly. The Administrator is also reimbursed by the Funds for certain out-of-pocket expenses. Administration fees paid by the Funds for the year ended April 30, 2020 are disclosed in the Statements of Operations.
Transfer Agent
ALPS serves as transfer, dividend paying and shareholder servicing agent for the Funds (“Transfer Agent”). ALPS is paid an annual base fee per Fund and a fee based on the number of shareholder accounts. The Transfer Agent is also reimbursed by the Funds for certain out-of-pocket expenses. Transfer agent fees paid by the Funds for the year ended April 30, 2020 are disclosed in the Statements of Operations.
Compliance Services
ALPS provides compliance services to the Funds under the Chief Compliance Officer Services Agreement with the Trust. ALPS provides services that assist the Trust’s chief compliance officer in monitoring and testing the policies and procedures of the Trust in accordance with the requirements of Rule 38a-1 under the 1940 Act. ALPS is paid an annual base fee and is reimbursed for certain out-of-pocket expenses. Compliance service fees paid by the Funds for the year ended April 30, 2020 are disclosed in the Statements of Operations.
Principal Financial Officer
ALPS provides principal financial officer services to the Funds under the Principal Financial Officer Services Agreement with the Trust. Under this Agreement, ALPS is paid an annual base fee and is reimbursed for certain out-of-pocket expenses. Principal financial officer fees paid by the Funds for the year ended April 30, 2020 are disclosed in the Statements of Operations.
Distributor
ALPS Distributors, Inc. (“ADI” or the “Distributor”) (an affiliate of ALPS) acts as the distributor of the Funds’ shares pursuant to the Distribution Agreement with the Trust. Under a side letter agreement, the Adviser pays ADI an annual base fee per Fund for the distribution services. The Adviser also reimburses ADI for certain out-of-pocket expenses. Shares are sold on a continuous basis by ADI as agent for the Funds, and ADI has agreed to use its best efforts to solicit orders for the sale of the Funds’ shares, although it is not obliged to sell any particular amount of shares. ADI is registered as a broker-dealer with the U.S. Securities and Exchange Commission.
Shareholder Service Plan for Investor Class and Institutional Class Shares
Each Fund has adopted a Shareholder Services Plan (a “Services Plan”) for each of its share classes. Under the Services Plan, each Fund is authorized to enter into shareholder service agreements with investment advisers, financial institutions and other service providers (“Participating Organizations”) to maintain and provide certain administrative and servicing functions in relation to the accounts of shareholders. Shareholder service arrangements typically include processing orders for shares, generating account and confirmation statements, sub-accounting, account maintenance, tax reporting, and disbursing cash dividends as well as other investment or administrative services required for a particular Participating Organizations’ products, programs, platform and accounts. The Services Plan will cause each Fund to pay an aggregate fee, not to exceed on an annual basis 0.15% and 0.05% of the average daily net asset value of the Investor and Institutional share classes, respectively. Such payments will be made on assets attributable to or held in the name of a Participating Organization, on behalf of its clients as compensation for providing service activities pursuant to an agreement with the Participating Organization. Any amount of such payment not paid to a Participating Organization for such service activities shall be reimbursed
| Annual Report – April 30, 2020 | 49 |
| Seafarer Funds | Notes to Financial Statements |
to the Fund as soon as practicable. Shareholder Services Plan fees paid by the Funds for the year ended April 30, 2020 are disclosed in the Statements of Operations.
Trustees
The fees and expenses of the Trustees of the Board are presented in the Statements of Operations.
7. Indemnifications
Under the Trust’s organizational documents, its officers and Trustees are indemnified against certain liability arising out of the performance of their duties to the Trust. Additionally, in the normal course of business, the Trust enters into contracts with service providers that may contain general indemnification clauses, which may permit indemnification to the extent permissible under the applicable law. The Trust’s maximum exposure under these arrangements is unknown, as this would involve future claims that may be made against the Trust that have not yet occurred.
| 50 | (855) 732-9220 seafarerfunds.com |
| Seafarer Funds | Report of Independent Registered Public Accounting Firm |
To the shareholders and the Board of Trustees of Financial Investors Trust
Opinion on the Financial Statements and Financial Highlights
We have audited the accompanying statements of assets and liabilities, including the portfolios of investments, of Seafarer Overseas Growth and Income Fund and Seafarer Overseas Value Fund (the "Funds"), two of the funds constituting the Financial Investors Trust, as of April 30, 2020, the related statement of operations for the year then ended, the statements of changes in net assets for each of the two years in the period then ended, the financial highlights for each of the five years in the period then ended for Seafarer Overseas Growth and Income Fund; the related statement of operations for the year then ended, the statements of changes in net assets for each of the two years in the period then ended, the financial highlights for each of the three years in the period then ended and for the period from May 31, 2016 (inception) through April 30, 2017 for Seafarer Overseas Value Fund; and the related notes.
In our opinion, the financial statements and financial highlights present fairly, in all material respects, the financial position of Seafarer Overseas Growth and Income Fund as of April 30, 2020, and the results of its operations for the year then ended, the changes in its net assets for each of the two years in the period then ended, and the financial highlights for each of the five years in the period then ended in conformity with accounting principles generally accepted in the United States of America. Also, in our opinion, the financial statements and financial highlights present fairly, in all material respects, the financial position of Seafarer Overseas Value Fund as of April 30, 2020, and the results of its operations for the year then ended, the changes in its net assets for each of the two years in the period then ended, and the financial highlights for each of the three years in the period then ended and for the period from May 31, 2016 (inception) through April 30, 2017 in conformity with accounting principles generally accepted in the United States of America.
Basis for Opinion
These financial statements and financial highlights are the responsibility of the Funds’ management. Our responsibility is to express an opinion on the Funds’ financial statements and financial highlights based on our audits. We are a public accounting firm registered with the Public Company Accounting Oversight Board (United States) (PCAOB) and are required to be independent with respect to the Funds in accordance with the U.S. federal securities laws and the applicable rules and regulations of the Securities and Exchange Commission and the PCAOB.
We conducted our audits in accordance with the standards of the PCAOB. Those standards require that we plan and perform the audit to obtain reasonable assurance about whether the financial statements and financial highlights are free of material misstatement, whether due to error or fraud. The Funds are not required to have, nor were we engaged to perform, an audit of their internal control over financial reporting. As part of our audits we are required to obtain an understanding of internal control over financial reporting but not for the purpose of expressing an opinion on the effectiveness of the Funds’ internal control over financial reporting. Accordingly, we express no such opinion.
Our audits included performing procedures to assess the risks of material misstatement of the financial statements and financial highlights, whether due to error or fraud, and performing procedures that respond to those risks. Such procedures included examining, on a test basis, evidence regarding the amounts and disclosures in the financial statements and financial highlights. Our audits also included evaluating the accounting principles used and significant estimates made by management, as well as evaluating the overall presentation of the financial statements and financial highlights. Our procedures included confirmation of securities owned as of April 30, 2020, by correspondence with the custodian and brokers; when replies were not received from brokers, we performed other auditing procedures. We believe that our audits provide a reasonable basis for our opinion.
DELOITTE & TOUCHE LLP
Denver, Colorado
June 29, 2020
We have served as the auditor of one or more investment companies advised by Seafarer Capital Partners, LLC since 2012.
| Annual Report – April 30, 2020 | 51 |
| Seafarer Funds | Additional Information |
| | April 30, 2020 (Unaudited) |
ADDITIONAL INFORMATION
1. Fund Holdings
The Funds file their complete schedule of portfolio holdings with the Commission for the first and third quarters of each fiscal year as an exhibit to their reports on Form N-PORT. The Funds’ Form N-PORT reports are available on the Commission’s Web site at http://www.sec.gov. The Funds’ Form N-PORTs are also available upon request by calling toll-free (855) 732-9220.
2. Fund Proxy Voting Policies, Procedures and Summaries
The Funds’ policies and procedures used in determining how to vote proxies and information regarding how the Funds voted proxies relating to portfolio securities during the most recent prior 12-month period ending June 30 are available without charge, (1) upon request, by calling toll-free (855) 732-9220 and (2) on the SEC’s website at http://www.sec.gov.
3. Tax Designations (Unaudited)
The Funds designate the following as a percentage of taxable ordinary income distributions, or up to the maximum amount allowable, for the calendar year ended December 31, 2019:
| Fund | | Dividends Received Deduction | | | Qualified Dividend Income | |
| Seafarer Overseas Growth and Income Fund | | | 0.00 | % | | | 24.49 | % |
| Seafarer Overseas Value Fund | | | 0.00 | % | | | 20.11 | % |
In early 2020, if applicable, shareholders of record received this information for the distributions paid to them by the Funds during the calendar year 2019 via Form 1099. The Funds will notify shareholders in early 2021 of amounts paid to them by the Funds, if any, during the calendar year 2020.
The Seafarer Overseas Growth and Income Fund and the Seafarer Overseas Value Fund designate foreign taxes paid in the amounts of $4,056,087 and $31,631 and foreign source income in the amounts of $49,057,690 and $1,385,493, respectively, for federal income tax purposes for the year ended April 30, 2020.
Please consult a tax advisor if you have questions about federal or state income tax laws, or how to prepare your tax returns.
| 52 | (855) 732-9220 seafarerfunds.com |
| Seafarer Funds | Approval of Fund Advisory Agreement |
April 30, 2020 (Unaudited)
DISCLOSURE REGARDING APPROVAL OF FUND ADVISORY AGREEMENT
On December 10, 2019, the Trustees met in person to discuss, among other things, the renewal of the Investment Advisory Agreement between Seafarer Capital Partners, LLC (“Seafarer”) and the Trust, with respect to the Seafarer Overseas Growth and Income Fund and the Seafarer Overseas Value Fund (together, the “Seafarer Funds”), in accordance with Section 15(c) of the 1940 Act. In renewing and approving the Investment Advisory Agreement with Seafarer, the Trustees, including the Independent Trustees, considered the following factors with respect to the Seafarer Funds:
Investment Advisory Fee Rate
The Trustees reviewed and considered the contractual annual advisory fee paid by the Trust, on behalf of the Seafarer Overseas Growth and Income Fund and the Seafarer Overseas Value Fund, to Seafarer, respectively, of 0.75% of the Fund’s daily average net assets up to $1.5 billion and 0.70% over $1.5 billion, in light of the extent and quality of the advisory services provided by Seafarer to the Funds.
The Board received and considered information including a comparison of each Seafarer Fund’s contractual and actual management fees and overall expenses with those of funds in the expense group and universe of funds selected by an independent provider of investment company data (the “Data Provider”). The Trustees noted that the contractual and gross advisory fee rates for the Institutional Class shares of each Seafarer Fund were below the Data Provider peer group and universe medians.
Total Expense Ratio
The Trustees further reviewed and considered the total net expense ratio of 0.90% for the Institutional Class of the Seafarer Overseas Growth and Income Fund and 1.05% for the Institutional Class of the Seafarer Overseas Value Fund, and noted that each Fund’s total net expense ratio was below the Data Provider peer group and universe medians.
Nature, Extent, and Quality of the Services under the Investment Advisory Agreement
The Trustees received and considered information regarding the nature, extent, and quality of services provided to the Seafarer Funds under the Investment Advisory Agreement. The Trustees reviewed certain background materials supplied by Seafarer in its presentation, including its Form ADV.
The Trustees reviewed and considered Seafarer’s investment advisory personnel, its history as an asset manager, and its performance and the amount of assets currently under management by Seafarer. The Trustees also reviewed the research and decision-making processes utilized by Seafarer, including the methods adopted to seek to achieve compliance with the investment objectives, policies, and restrictions of the Seafarer Funds.
The Trustees considered the background and experience of Seafarer’s management in connection with the Seafarer Funds, including reviewing the qualifications, backgrounds, and responsibilities of the management team primarily responsible for the day-to-day portfolio management of the Seafarer Funds and the extent of the resources devoted to research and analysis of actual and potential investments.
The Trustees also reviewed, among other things, Seafarer’s insider trading policies and procedures and its Code of Ethics.
Performance
The Trustees reviewed performance information for the Institutional Classes of the Seafarer Funds for the 3-month, 1-year, 3-year, 3-year, 5-year and since inception periods ended September 30, 2019, as applicable. That review included a comparison of each Fund’s performance to the performance universe median of funds selected by the Data Provider. The Trustees noted the performance of the Seafarer Overseas Growth and Income Fund, as of September 30, 2019, was above the universe median for the 3-month, 1-year, 5-year, and since inception periods and below the universe median for the 3-year
| Annual Report – April 30, 2020 | 53 |
| Seafarer Funds | Approval of Fund Advisory Agreement |
April 30, 2020 (Unaudited)
period. The Trustees also noted that the performance of the Seafarer Overseas Value Fund, as of September 30, 2019, was above the universe median for the 3-month, 1-year and 3-year periods and below the universe median for the since inception period. The Trustees also considered Seafarer’s discussion of each Fund’s top contributors and top detractors, as well as Seafarer’s performance and reputation generally.
Comparable Accounts
The Trustees noted that Seafarer’s only clients were the Seafarer Funds.
Profitability
The Trustees received and considered a retrospective and projected profitability analysis prepared by Seafarer based on the fees payable under the Investment Advisory Agreement with respect to each Seafarer Fund. The Trustees considered the profits, if any, anticipated to be realized by Seafarer in connection with the operation of each Seafarer Fund. The Board then reviewed Seafarer’s audited financial statements for the year ended December 31, 2018 in order to analyze the financial condition and stability and profitability of Seafarer.
Economies of Scale
The Trustees considered whether economies of scale in the provision of services to the Seafarer Funds will be passed along to the shareholders under the Investment Advisory Agreement.
Other Benefits to the Adviser
The Trustees reviewed and considered any other incidental benefits derived or to be derived by Seafarer from its relationship with the Seafarer Funds, including whether soft dollar arrangements were used.
In renewing Seafarer as the investment adviser to the Seafarer Funds and renewing the Investment Advisory Agreement and the fees charged under the Investment Advisory Agreement, the Trustees concluded that no single factor reviewed by the Trustees was identified by the Trustees to be determinative as the principal factor in whether to renew the Investment Advisory Agreement. Further, the Independent Trustees were advised by separate independent legal counsel throughout the process. The Trustees, including all of the Independent Trustees, concluded that:
| ● | the contractual and gross advisory fee rates for the Institutional Class shares of each Seafarer Fund were below the Data Provider peer group and universe medians; |
| ● | each Seafarer Fund’s total net expense ratio was below the Data Provider peer group and universe medians; |
| ● | the nature, extent, and quality of services rendered by Seafarer under the Investment Advisory Agreement with respect to the Seafarer Funds were adequate; |
| ● | the performance of the Seafarer Overseas Growth and Income Fund, as of September 30, 2019, was above the universe median for the 3-month, 1-year, 5-year, and since inception periods and below the universe median for the 3-year period; and the performance of the Seafarer Overseas Value Fund, as of September 30, 2019, was above the universe median for the 3-month, 1-year and 3-year periods and below the universe median for the since inception period; |
| ● | that Seafarer had no other accounts with comparable investment objectives and strategies to the Seafarer Funds; |
| ● | the profit, if any, realized by Seafarer in connection with the operation of the Seafarer Funds is not unreasonable; and |
| ● | there were no material economies of scale or other incidental benefits accruing to Seafarer in connection with its relationship with the Seafarer Funds. |
Based on the Trustees’ deliberations and their evaluation of the information described above, the Trustees, including all of the Independent Trustees, concluded that Seafarer’s compensation for investment advisory services is consistent with the best interests of each Seafarer Fund and its shareholders.
| 54 | (855) 732-9220 seafarerfunds.com |
| Seafarer Funds | Liquidity Risk Management Program |
April 30, 2020 (Unaudited)
The Financial Investors Trust (the “Trust”) has established a liquidity risk management program (the “Program”) to govern the Trust’s approach to managing liquidity risk for each fund in the Trust (each a “Fund”). The Program is overseen by the Liquidity Committee (the “Committee”), a committee comprised of representatives of the Trust’s investment advisers, sub-advisers, and Officers of the Trust. The Trust’s Board of Trustees (the “Board”) has approved the designation of the Committee to oversee the Program.
The Program’s principal objectives include supporting each Fund’s compliance with limits on investments in illiquid assets and mitigating the risk that a Fund will be unable to meet its redemption obligations in a timely manner. The Program also includes a number of elements that support the management and assessment of liquidity risk, including a periodic assessment of factors that influence a Fund’s liquidity and the periodic classification and re-classification of the Fund’s investments into groupings that reflect the Committee’s assessment of their relative liquidity under current market conditions.
At a meeting of the Board held on March 10, 2020, the Trustees received a report from the Committee regarding the design and operational effectiveness of the Program since its implementation on December 1, 2018. The Committee determined, and reported to the Board, that the Program is reasonably designed to assess and manage each Fund’s liquidity risk and has operated adequately and effectively to manage each Fund’s liquidity risk since implementation.
The Committee reported that during the period covered by the report, there were no liquidity events that impacted the Seafarer Funds or their ability to timely meet redemptions without dilution to existing shareholders. Among other things, the Board noted that the Funds are not required to have a highly liquid investment minimum based on their liquidity classifications. The Board further noted that no material changes have been made to the Program since its implementation.
| Annual Report – April 30, 2020 | 55 |
| Seafarer Funds | Trustees and Officers |
April 30, 2020 (Unaudited)
Additional information regarding the Funds’ trustees is included in the Statement of Additional Information, which can be obtained without charge at seafarerfunds.com or by calling 855-732-9220.
INDEPENDENT TRUSTEES
| Name, Address* & Year of Birth | Position(s) Held with Fund | Term of Office** and Length of Time Served | Principal Occupation(s) During Past 5 Years*** | Number of Funds in Fund Complex Overseen by Trustee**** | Other Directorships Held by Trustee During Past 5 Years*** |
| Mary K. Anstine, 1940 | Trustee and Chairman | Ms. Anstine was elected at a special meeting of shareholders held on March 21, 1997 and re-elected at a special meeting of shareholders held on August 7, 2009. Ms. Anstine was appointed Chairman of the Board at the June 6, 2017 meeting of the Board of Trustees. | Ms. Anstine was formerly an Executive Vice President of First Interstate Bank of Denver until 1994, President/Chief Executive Officer of HealthONE Alliance, Denver, Colorado, from 1994 to 2004, and has been retired since 2004. Ms. Anstine is also Trustee/Director of AV Hunter Trust and Colorado Uplift Board. Ms. Anstine was formerly a Director of the Trust Bank of Colorado (later purchased and now known as Northern Trust Bank), HealthONE and Denver Area Council of the Boy Scouts of America, and a member of the American Bankers Association Trust Executive Committee. | 31 | Ms. Anstine is a Trustee of ALPS ETF Trust (16 funds); ALPS Variable Investment Trust (7 funds); Reaves Utility Income Fund (1 fund); and Segall Bryant & Hamill Trust (16 funds). |
| Jeremy W. Deems, 1976 | Trustee | Mr. Deems was appointed as a Trustee at the March 11, 2008 meeting of the Board of Trustees and elected at a special meeting of shareholders held on August 7, 2009. | Mr. Deems is the Co-Founder, Chief Operations Officer and Chief Financial Officer of Green Alpha Advisors, LLC, a registered investment advisor, and Co- Portfolio Manager of the Shelton Green Alpha Fund. Prior to joining Green Alpha Advisors, Mr. Deems was CFO and Treasurer of Forward Management, LLC, ReFlow Management Co., LLC, ReFlow Fund, LLC, a private investment fund, and Sutton Place Management, LLC, an administrative services company, from 1998 to June 2007. From 2004 to 2005, Mr. Deems also served as Treasurer of the Forward Funds and the Sierra Club Funds. | 31 | Mr. Deems is a Trustee of ALPS ETF Trust (16 funds); ALPS Variable Investment Trust (7 funds); Clough Funds Trust (1 fund); and Reaves Utility Income Fund (1 fund). |
| 56 | (855) 732-9220 seafarerfunds.com |
| Seafarer Funds | Trustees and Officers |
April 30, 2020 (Unaudited)
INDEPENDENT TRUSTEES (continued)
| Name, Address* & Year of Birth | Position(s) Held with Fund | Term of Office** and Length of Time Served | Principal Occupation(s) During Past 5 Years*** | Number of Funds in Fund Complex Overseen by Trustee**** | Other Directorships Held by Trustee During Past 5 Years*** |
| Jerry G. Rutledge, 1944 | Trustee | Mr. Rutledge was elected at a special meeting of shareholders held on August 7, 2009. | Mr. Rutledge is the President and owner of Rutledge’s Inc., a retail clothing business. Mr. Rutledge is currently Director of the American National Bank. He was from 1994 to 2007 a Regent of the University of Colorado. | 31 | Mr. Rutledge is a Trustee of Clough Global Dividend and Income Fund (1 fund); Clough Global Equity Fund (1 fund); Clough Global Opportunities Fund (1 fund); and Principal Real Estate Income Fund (1 fund). |
| Michael “Ross” Shell, 1970 | Trustee | Mr. Shell was elected at a special meeting of shareholders held on August 7, 2009. | Mr. Shell is Founder and CEO of Red Idea, LLC, a strategic consulting/early stage venture firm (since June 2008). From 1999 to 2009, he was a part-owner and Director of Tesser, Inc., a brand agency. From December 2005 to May 2008, he was Director, Marketing and Investor Relations, of Woodbourne, a REIT/real estate hedge fund and private equity firm. Prior to this, from May 2004 to November 2005, he worked as a business strategy consultant; from June 2003 to April 2004, he was on the Global Client Services team of IDEO, a product design/innovation firm; and from 1999 to 2003, he was President of Tesser, Inc. Mr. Shell graduated with honors from Stanford University with a degree in Political Science. | 31 | None. |
| Annual Report – April 30, 2020 | 57 |
| Seafarer Funds | Trustees and Officers |
April 30, 2020 (Unaudited)
INTERESTED TRUSTEE
| Name, Address* & Year of Birth | Position(s) Held with Fund | Term of Office** and Length of Time Served | Principal Occupation(s) During Past 5 Years*** | Number of Funds in Fund Complex Overseen by Trustee**** | Other Directorships Held by Trustee During Past 5 Years*** |
| Edmund J. Burke, 1961 | Trustee | Mr. Burke was elected as Trustee at a special meeting of shareholders held on August 7, 2009. | Mr. Burke joined ALPS in 1991 and served as the President and Director of ALPS Holdings, Inc., and ALPS Advisors, Inc., and Director of ALPS Distributors, Inc., ALPS Fund Services, Inc. (“ALPS”), and ALPS Portfolio Solutions Distributor, Inc. (collectively, the “ALPS Companies”). Mr. Burke retired from the ALPS Companies in June 2019. Mr. Burke is deemed an interested Trustee by virtue of his prior positions with the ALPS Companies. | 31 | Mr. Burke is a Trustee of ALPS ETF Trust (16 funds); Clough Global Dividend and Income Fund (1 fund); Clough Global Equity Fund (1 fund); Clough Global Opportunities Fund (1 fund); Clough Funds Trust (1 fund); Liberty All-Star Equity Fund (1 fund); and Director of the Liberty All-Star Growth Fund, Inc. (1 fund). |
| 58 | (855) 732-9220 seafarerfunds.com |
| Seafarer Funds | Trustees and Officers |
April 30, 2020 (Unaudited)
OFFICERS
| Name, Address* & Year of Birth | Position(s) Held with Fund | Term of Office** and Length of Time Served | Principal Occupation(s) During Past 5 Years*** |
| Bradley J. Swenson, 1972 | President | Mr. Swenson was elected President of the Trust at the June 11-12, 2019 meeting of the Board of Trustees. | Mr. Swenson joined ALPS in 2004 and has served as its President since June 2019. In this role, he serves as an officer to certain other closed-end and open-end investment companies. He previously served as the Chief Operating Officer of ALPS (2015-2019). Mr. Swenson also previously served as Chief Compliance Officer to ALPS, its affiliated entities, and to certain ETF, closed-end and open-end investment companies (2004-2015). Because of his position with ALPS, Mr. Swenson is deemed an affiliate of the Trust as defined under the 1940 Act. |
| Kimberly R. Storms, 1972 | Treasurer | Ms. Storms was elected Treasurer of the Trust at the March 12, 2013 meeting of the Board of Trustees. | Ms. Storms is Senior Vice President - Director of Fund Administration of ALPS. Because of her position with ALPS, Ms. Storms is deemed an affiliate of the Trust as defined under the 1940 Act. Ms. Storms is also Treasurer of ALPS Series Trust. Ms. Storms also serves as a Board member and Treasurer of The Center for Trauma & Resilience, a nonprofit agency. |
| Karen S. Gilomen, 1970 | Secretary | Ms. Gilomen was elected Secretary of the Trust at the December 13, 2016 meeting of the Board of Trustees. | Ms. Gilomen joined ALPS in August 2016 as Vice President and Senior Counsel. Prior to joining ALPS, Ms. Gilomen was Vice President - General Counsel & CCO of Monticello Associates, Inc. from 2010 to 2016. Because of her position with ALPS, Ms. Gilomen is deemed an affiliate of the Trust, as defined under the 1940 Act. Ms. Gilomen is also the Secretary of ALPS Variable Investment Trust and Reaves Utility Income Fund, and the Assistant Secretary of the WesMark Funds. |
| Ted Uhl, 1974 | Chief Compliance Officer (“CCO”) | Mr. Uhl was appointed CCO of the Trust at the June 8, 2010 meeting of the Board of Trustees. | Mr. Uhl joined ALPS in October 2006, and is currently Deputy Compliance Officer of ALPS. Prior to his current role, Mr. Uhl served as Senior Risk Manager for ALPS from October 2006 until June 2010. Before joining ALPS, Mr. Uhl served a Sr. Analyst with Enenbach and Associates (RIA), and a Sr. Financial Analyst at Sprint. Because of his position with ALPS, Mr. Uhl is deemed an affiliate of the Trust as defined under the 1940 Act. Mr. Uhl is also CCO of the Boulder Growth & Income Fund, Inc., Centre Funds, Index Funds, Reality Shares ETF Trust, Reaves Utility Income Fund and XAI Octagon Floating Rate & Alternative Income Term Trust. |
| Jennell Panella, 1974 | Assistant Treasurer | Ms. Panella was elected Assistant Treasurer of the Trust at the September 15, 2015 meeting of the Board of Trustees. | Ms. Panella joined ALPS in June 2012 and is currently Fund Controller of ALPS Fund Services, Inc. Prior to joining ALPS, Ms. Panella served as Financial Reporting Manager for Parker Global Strategies, LLC (2009-2012). Because of her position with ALPS, Ms. Panella is deemed an affiliate of the Trust as defined under the 1940 Act. Ms. Panella also serves as Assistant Treasurer of James Advantage Funds. |
| Annual Report – April 30, 2020 | 59 |
| Seafarer Funds | Trustees and Officers |
April 30, 2020 (Unaudited)
OFFICERS (continued)
| Name, Address* & Year of Birth | Position(s) Held with Fund | Term of Office** and Length of Time Served | Principal Occupation(s) During Past 5 Years*** |
| Sharon Akselrod, 1974 | Assistant Secretary | Ms. Akselrod was elected Assistant Secretary of the Trust at the September 15, 2015 meeting of the Board of Trustees. | Ms. Akselrod joined ALPS in August 2014 and is currently Senior Investment Company Act Paralegal of ALPS Fund Services, Inc. Prior to joining ALPS, Ms. Akselrod served as Corporate Governance and Regulatory Associate for Nordstrom fsb (2013-2014) and Senior Legal Assistant - Legal Manager for AXA Equitable Life Insurance Company (2008-2013). Because of her position with ALPS, Ms. Akselrod is deemed an affiliate of the Trust as defined under the 1940 Act. Ms. Akselrod is also Secretary of Principal Real Estate Income Fund and Assistant Secretary of ALPS ETF Trust and Clough Funds Trust. |
| Jennifer Craig, 1973 | Assistant Secretary | Ms. Craig was elected Assistant Secretary of the Trust at the June 8, 2016 meeting of the Board of Trustees. | Ms. Craig joined ALPS in 2007 and is currently Assistant Vice President and Paralegal Manager of ALPS. Because of her position with ALPS, Ms. Craig is deemed an affiliate of the Trust as defined under the 1940 Act. Ms. Craig is also Assistant Secretary of Clough Global Dividend and Income Fund, Clough Global Equity Fund, Clough Global Opportunities Fund, Principal Real Estate Income Fund, Liberty All-Star Equity Fund and Liberty All-Star Growth Fund, Inc. |
| Sareena Khwaja- Dixon, 1980 | Assistant Secretary | Ms. Khwaja- Dixon was elected Assistant Secretary of the Trust at the December 12, 2017 meeting of the Board of Trustees. | Ms. Khwaja-Dixon joined ALPS in August 2015 and is currently Senior Counsel and Vice President of ALPS Fund Services, Inc. Prior to joining ALPS, Ms. Khwaja-Dixon served as a Senior Paralegal/Paralegal for Russell Investments (2011-2015). Because of her position with ALPS, Ms. Khwaja-Dixon is deemed an affiliate of the Trust as defined under the 1940 Act. Ms. Khwaja-Dixon is also Secretary of Liberty All-Star Equity Fund, Liberty All-Star Growth Fund, Inc., Clough Funds Trust, Clough Global Dividend and Income Fund, Clough Global Opportunities Fund, and Clough Global Equity Fund. |
| * | All communications to Trustees and Officers may be directed to Financial Investors Trust c/o 1290 Broadway, Suite 1000, Denver, CO 80203. |
| ** | This is the period for which the Trustee or Officer began serving the Trust. Each Trustee serves an indefinite term, until such Trustees successor is elected and appointed, or such Trustee resigns or is deceased. Officers are elected on an annual basis. |
| *** | Except as otherwise indicated, each individual has held the office shown or other offices in the same company for the last five years. |
| **** | The Fund Complex includes all series of the Trust, currently 31, and any other investment companies for which any Trustee serves as trustee for and for which Seafarer Capital Partners, LLC provides investment advisory services (currently none). |
| 60 | (855) 732-9220 seafarerfunds.com |
| Seafarer Funds | Privacy Policy |
April 30, 2020 (Unaudited)
| FACTS | WHAT DO THE FUNDS DO WITH YOUR PERSONAL INFORMATION? |
| Why? | Financial companies choose how they share your personal information. Federal law gives consumers the right to limit some but not all sharing. Federal law also requires us to tell you how we collect, share, and protect your personal information. Please read this notice carefully to understand what we do. |
| What? | The types of personal information we collect and share depend on the product or service you have with us. This information can include: • Social Security number and account transactions • Account balances and transaction history • Wire transfer instructions |
| How? | All financial companies need to share customers’ personal information to run their everyday business. In the section below, we list the reasons financial companies can share their customers’ personal information; the reasons the Funds choose to share; and whether you can limit this sharing. |
| Reasons we can share your personal information | Do we share: | Can you limit this sharing? |
| For our everyday business purposes – such as to process your transactions, maintain your account(s), respond to court orders and legal investigations, or report to credit bureaus | Yes | No |
| For our marketing purposes – to offer our products and services to you | No | We do not share. |
| For joint marketing with other financial companies | No | We do not share. |
| For our affiliates’ everyday business purposes – information about your transactions and experiences | Yes | No |
| For our affiliates’ everyday business purposes – information about your creditworthiness | No | We do not share. |
| For nonaffiliates to market to you | No | We do not share. |
| Annual Report – April 30, 2020 | 61 |
| Seafarer Funds | Privacy Policy |
April 30, 2020 (Unaudited)
| Who We Are | |
| Who is providing this notice? | Seafarer Overseas Growth and Income Fund and Seafarer Overseas Value Fund. |
| | |
| What We Do | |
| How do the Funds protect my personal information? | To protect your personal information from unauthorized access and use, we use security measures that comply with federal law. These measures include computer safeguards and secured files and buildings. |
| How do the Funds collect my personal information? | We collect your personal information, for example, when you |
| | • open an account |
| | • provide account information or give us your contact information |
| | • make a wire transfer or deposit money |
| Why can’t I limit all sharing? | Federal law gives you the right to limit only |
| | • sharing for affiliates’ everyday business purposes-information about your creditworthiness |
| | • affiliates from using your information to market to you |
| | • sharing for non-affiliates to market to you |
| | State laws and individual companies may give you additional rights to limit sharing. |
| Definitions | |
| Affiliates | Companies related by common ownership or control. They can be financial and nonfinancial companies. |
| Non-affiliates | Companies not related by common ownership or control. They can be financial and nonfinancial companies. |
| | • The Funds do not share with non-affiliates so they can market to you. |
| Joint marketing | A formal agreement between non-affiliated financial companies that together market financial products or services to you. |
| | • The Funds do not jointly market. |
| Other Important Information | |
| California Residents | If your account has a California home address, your personal information will not be disclosed to nonaffiliated third parties except as permitted by applicable California law, and we will limit sharing such personal information with our affiliates to comply with California privacy laws that apply to us. |
| Vermont Residents | The State of Vermont requires financial institutions to obtain your consent prior to sharing personal information that they collect about you with affiliated companies and nonaffiliated third parties other than in certain limited circumstances. Except as permitted by law, we will not share personal information we collect about you with nonaffiliated third parties or other affiliated companies unless you provide us with your written consent to share such information. |
| 62 | (855) 732-9220 seafarerfunds.com |
Page Intentionally Left Blank
Table of Contents
| CONTENTS | PAGE |
| Shareholder Letter | 1 |
| Fund Overview | |
| Vulcan Value Partners Fund | 8 |
| Vulcan Value Partners Small Cap Fund | 12 |
| Disclosure of Fund Expenses | |
| Vulcan Value Partners Fund | 10 |
| Vulcan Value Partners Small Cap Fund | 14 |
| Statements of Investments | |
| Vulcan Value Partners Fund | 16 |
| Vulcan Value Partners Small Cap Fund | 18 |
| Statements of Assets and Liabilities | 21 |
| Statements of Operations | 23 |
| Statements of Changes in Net Assets | |
| Vulcan Value Partners Fund | 24 |
| Vulcan Value Partners Small Cap Fund | 25 |
| Financial Highlights | |
| Vulcan Value Partners Fund | 26 |
| Vulcan Value Partners Small Cap Fund | 30 |
| Notes to Financial Statements | 33 |
| Report of Independent Registered Public Accounting Firm | 43 |
| Additional Information | 44 |
| Disclosure Regarding Approval of Fund Advisory Agreements | 45 |
| Liquidity Risk Management Program | 48 |
| Trustees and Officers | 49 |
| Privacy Policy | 54 |
Beginning on January 1, 2021, as permitted by regulations adopted by the U.S. Securities and Exchange Commission, paper copies of the Funds’ annual and semi-annual shareholder reports will no longer be sent by mail, unless you specifically request paper copies of the reports. Instead, the reports will be made available on the Funds’ website at www.vulcanvaluepartners.com and you will be notified by mail each time a report is posted and provided with a website link to access the report.
You may, notwithstanding the availability of shareholder reports online, elect to receive all future shareholder reports in paper free of charge. If you invest through a financial intermediary, you can contact your financial intermediary to request that you continue to receive paper copies of your shareholder reports. If you invest directly with the Funds, you can call 1.877.421.5078 to let the Funds know you wish to continue receiving paper copies of your shareholder reports.
If you already elected to receive shareholder reports electronically, you will not be affected by this change and you need not take any action. You may elect to receive shareholder reports and other communications from the Funds electronically anytime by contacting your financial intermediary (such as a broker-dealer or bank) or, if you are a direct investor, by enrolling at www.vulcanvaluepartners.com.
Shareholder Letter
April 30, 2020 (Unaudited)
Annual Shareholder Letter 04.30.2020
Vulcan Value Partners Fund returned -3.15% versus -11.01% for the Russell 1000® Value Index and 0.86% for the S&P 500® Index for the year ended April 30, 2020. The Vulcan Value Partners Small Cap Fund returned -27.28 % versus -23.84% for the Russell 2000® Value Index and -16.39% for the Russell 2000® Index for the year ended April 30, 2020.
As we have often said, we place no weight on short-term results, good or bad, and neither should you. In fact, we have made and will continue to make decisions that could negatively impact short-term performance when we think we can improve our long-term returns and mitigate risk. We encourage you to place more weight on our longer-term historical results and a great deal of weight on our long-term prospects.
We are concerned about COVID-19’s impact on people’s lives, health and the economy. We are assuming the economic conditions will be worse than any forecast we have seen to date. At the same time, we are more bullish about our portfolios than we have been at any time since the financial crisis. Let me explain.
Vulcan Value Partners began working off premises on Monday, March 16th. Our technology infrastructure has worked flawlessly, and all our team members have risen to the occasion. Since that time the research team has been stress testing our portfolio companies with an emphasis on liquidity, balance sheet strength, free cash flow1 production, and value stability. In our stress tests we are assuming a longer, deeper recession than commonly predicted. We think the odds of a second wave of infections is high. We expect a deep recession to last until a vaccine is widely available.
First, a brief refresher course on statistics: In a normal distribution, three standard deviations2 from the mean covers 99.7% of outcomes. The effect of the response to the pandemic on the economy is greater than a three standard deviation event. For objective proof, look at initial weekly unemployment claims as just one example. Over a fifty year plus period ended February 2020, initial weekly unemployment claims averaged roughly 350,000. Three standard deviations from this average is approximately 617,000. On March 21st claims hit 3.3 million, and then claims more than doubled to 6.9 million on March 28th. The previous all-time high for initial weekly unemployment claims was 695,000 in October of 1982.3 The current initial weekly unemployment claims number is approximately ten times greater than the previous all-time high, which is powerful, objective proof that what we are experiencing is in fact a greater than three standard deviation event.
Performance data quoted represents past performance. Past performance does not guarantee future results. Investment return and principal value of an investment will fluctuate so that an investor’s shares, when sold or redeemed, may be worth more or less than the original cost. Current performance data may be higher or lower than actual data quoted. For the most current month-end performance data, please call 1-877-421-5078.
| Annual Report | April 30, 2020 | 1 |
Shareholder Letter
April 30, 2020 (Unaudited)
Going into the COVID-19 crisis we were confident that all of our portfolio companies could withstand a three standard deviation event. In the few cases where we did not believe that one could weather a greater than three standard deviation event, we sold our positions. We reallocated capital to companies that we believe can withstand a greater than three standard deviation event. Importantly, we reduced risk in the portfolios and improved our prospective returns without any negative impact on our price to value ratios4. In fact, we believe that a significant number of the businesses we own will benefit over the long term from the COVID-19 crisis.
We are bullish because, even assuming an economic recession lasting until 2022, and incorporating that severe recession into our values, our portfolios’ price to value ratios are approaching levels last seen during the 2008-2009 financial crisis. We have taken advantage of this market volatility to seek to improve both the quality and price to value ratios of our portfolios.
We have thrived in times of market volatility like we are experiencing today because we follow a dual discipline. We are as disciplined about the quality of the businesses we own as we are about the price we pay for them. Our dual discipline allows us to take advantage of stock price volatility because, in our view, our values are stable. We do not define stock price volatility as risk. Our definition of risk is the probability of permanently losing capital over our five-year time horizon. We believe stock price volatility creates opportunities when you limit yourselves to companies with stable values. As a result, by improving our margin of safety5, we have substantially reduced risk in our portfolios and enhanced our prospective long-term returns.
We have expressed the following in every letter Vulcan Value Partners has ever written. They are especially applicable today:
“We place no weight on short-term results, good or bad, and neither should you. In fact, we have made and will continue to make decisions that negatively impact short-term performance when we think we can improve our long-term returns and lower risk. We encourage you to place more weight on our longer-term historical results and a great deal of weight on our long-term prospects.”
With attractive price to value ratios in every portfolio, our margins of safety, as well as our prospective returns, look better than they have in years and are approaching levels we haven’t seen since the financial crisis. We believe now is an opportune time to allocate capital to Vulcan Value Partners.
We generally define material contributors and detractors as companies having a greater than 1% impact on the portfolio.
Performance data quoted represents past performance. Past performance does not guarantee future results.
Vulcan Value Partners Fund Review
In the discussion that follows, we highlight a few holdings in the Vulcan Value Partners Fund. Material contributors over the one-year period ending April 30, 2020 include Qorvo Inc., Skyworks
| 2 | www.vulcanvaluepartners.com |
Shareholder Letter
April 30, 2020 (Unaudited)
Solutions Inc., NVIDIA Corporation, Amazon.com Inc., Microsoft Corporation, and Alphabet Inc. Over the same period, material detractors include Jones Lang LaSalle Inc., Whitbread plc, Credit Acceptance Corporation, National Oilwell Varco Inc., Marriott International Inc., and Airbus SE.
Skyworks Solutions and Qorvo, Inc. materially contributed to performance during this period. We have discussed these businesses in detail in past letters. They are competitively entrenched as two of the three major manufacturers of radio frequency systems for mobile devices including mobile phones, tablets, and increasingly other connected devices in the Internet of Things. Their stock prices declined in 2019 as a result of exposure to Huawei and reduced handset sales due to sanctions. We also expected growth rates to slow during the transition from 4G to 5G. During this time, both companies used their substantial free cash flow coupons6 to aggressively repurchase their discounted shares. Over the course of last year, they were able to offset sales related to Huawei with orders from other manufacturers and 5G tailwinds are occurring earlier and larger than expected.
NVIDIA Corporation, a material contributor during this period, is a dominant supplier of Graphics Processing Units (GPUs) worldwide. It is at the intersection of every major computing trend currently impacting the technology sector. NVIDIA Corporation is benefiting from the move to the cloud, growing investments in artificial intelligence, autonomous vehicles, and growth in gaming. Behind all of it is a breakdown in Moore's law7. Central Processing Units (CPUs) are reaching the physical limits of their ability to increase performance. However, demand for performance continues to increase at exponential rates. The solution is to pair CPUs with GPUs. NVIDIA Corporation’s position in GPUs is comparable to Intel's position in CPUs. In late 2018, NVIDIA Corporation missed overly optimistic Wall Street earnings estimates and entered a time period of approximately a year of negative earnings comparisons. As a result, its stock price declined. We were aware that its earnings comparisons were going to be negative for roughly a year, and we were willing to purchase NVIDIA Corporation as we believe it has value stability and given our long-term outlook. In 2019, NVIDIA Corporation's stock price has rebounded significantly as Wall Street’s outlook has improved and sees NVIDIA Corporation returning to earnings growth.
Credit Acceptance Corporation, another material contributor provides auto loans to borrowers at the lower end of the credit spectrum. These loans are distributed through a network of 13,000 dealers in the United States. Credit Acceptance Corporation sets itself apart from its competitors with its unique underwriting discipline, underleveraged balance sheet, and its loan structure. Credit Acceptance Corporation is a company we initially owned in Vulcan Value Partners Small Cap Fund. The company’s biggest competitive advantage is its unique underwriting model. The model aligns incentives with their dealer network by advancing approximately 80% of the loan up front and providing the dealers the opportunity to earn back end payments which depend on loan performance. This opportunity for future payments allows the dealers to share in the credit risk and incentivizes the dealers to treat their customers well. In turn, Credit Acceptance Corporation achieves a greater margin of safety as the dealer is only advanced enough of the loan to earn a small profit at the time of sale. During this period, we had the opportunity to purchase Credit Acceptance Corporation at a discount to its intrinsic value8 in Vulcan Value Partners Fund.
National Oilwell Varco was a material detractor for the period. Our original investment case for National Oilwell Varco was based on the replacement cycle and the ongoing aftermarket
| Annual Report | April 30, 2020 | 3 |
Shareholder Letter
April 30, 2020 (Unaudited)
maintenance and servicing needs for its drilling equipment. Historically, normal fluctuations in oil prices had very little impact on the demand for its business. During the time we have owned National Oilwell Varco, it has experienced two recovery periods in which earnings faltered in response to a swift decline in oil prices. Potential long-term revenue has been affected by lengthened replacement cycles and resourceful operators who use old equipment for parts. Demand for its products and services has been further compromised by the price war between Russia and Saudi Arabia and the global response to COVID-19. As a result, we expect continued reduction of demand over the next one to two years. Nevertheless, National Oilwell Varco’s strong balance sheet and free cash flow production have remained consistent contributors to its value. We believe its competitive position should improve during the downturn as many of its competitors could cease to exist and, as a result, its market share is likely to increase. Its value has been impacted by decreased demand; however, its price is still incredibly discounted.
Jones Lang LaSalle, a material detractor for the period, is a leading global real estate services company providing leasing, property sales and acquisitions, consulting, property management and investment management to its clients. It is one of three real estate services firms with global scale, which makes it an attractive partner for the global Fortune 1000. As such, Jones Lang LaSalle is benefitting from the trend towards outsourcing and is gaining market share at the expense of its smaller regional and local competitors. We expect Jones Lang LaSalle to be impacted in the short run by the crisis. However, the company has generated strong free cash flow, has a strong balance sheet, good long-term growth prospects, and high returns on capital. Although its price is down, we believe its value is stable.
Marriott International Inc., a material detractor and a company we exited during this period, showed weakness in our stress testing. Revenue per available room will go to virtually zero for a quarter or two and could last longer. As we dove deeper into its liquidity profile, amount of debt and debt structure, we determined it may have issues refinancing its near-term debt. It is probable that Marriott will survive the current crisis, but not certain. With opportunities to invest in other businesses we feel have more stable values without Marriott’s liquidity risk, we sold Marriott to redeploy capital into companies equally or more discounted that we believe can withstand a greater than a three standard deviation event.
As we previously mentioned, in light of the pandemic and the significant stock market decline, we have been stress testing our companies to assess their value stability and their ability to withstand a severe recession. Airbus SE was the largest detractor during this period. Just over a month ago, we viewed Airbus as one of the strongest businesses that we follow. It operates within a duopoly and has gained a competitive lead on narrow body aircraft within that duopoly. With net cash on its balance sheet and a backlog of roughly a decade of airplane orders, Airbus held a strong competitive position. Globally, this pandemic is impacting the travel industry the most. As new information presented itself almost daily, we concluded that airlines are under severe pressure and may be forced to cancel their delivery of airplanes, which leaves Airbus in a difficult position. Airbus will have to cut production, or it will risk significant cash outflows to support the infrastructure and supply chain needed to quickly ramp up production. A significant production cut will impair its supply chain for years to come. We are ruthlessly objective, and we are humble. We are not anchored to previous decisions when we receive new data and facts change. Although we do not know with any certainty how this pandemic will affect Airbus, we now feel the risk of
| 4 | www.vulcanvaluepartners.com |
Shareholder Letter
April 30, 2020 (Unaudited)
permanent capital loss is too high. Said differently, we are confident that Airbus can withstand a greater than three standard deviation event, but we are not certain. We followed our discipline and decided to sell Airbus to lower risk in the portfolio. We redeployed capital into businesses we feel have more stable values at equal or better discounts without increasing the weighted average price to value ratio9 of the portfolio.
Vulcan Value Partners Small Cap Fund Review
In the discussion that follows, we highlight a few holdings in the Vulcan Value Partners Small Cap Fund. Material contributors over the one-year period ending April 30, 2020 include Sotheby's, Wyndham Hotels & Resorts Inc., Avast plc, and ISS A/S. Over the same time period, there were seventeen material detractors. We will discuss Jones Lang LaSalle Inc., Cushman & Wakefield plc, and Resideo Technologies Inc.
We exited Sotheby’s, our largest contributor, during this period. Sotheby’s is an auctioneer of art, jewelry, wine and other expensive luxury collectables. Having been in operation since 1744, the Sotheby’s brand is irreplaceable and its heritage is impossible to duplicate. On June 17, 2019, the company announced an agreement to be acquired and taken private by billionaire Patrick Drahi. The stock price appreciated close to the deal price, and we exited our position for a considerable gain. We are grateful to Ted Smith and the management team for their excellent stewardship of capital. We are sad to see Sotheby’s leave the portfolio.
Wyndham Hotels and Resorts, a material contributor for the period, spun out of Wyndham Worldwide in June of 2018. Its well-known brands include La Quinta, Days Inn, and Howard Johnson, along with many more. Wyndham is the leader in both the economy hotel and midscale hotel segments, controlling roughly a 40% share of each market. Wyndham has nearly six thousand franchisees spanning over eighty countries with long-term contracts ranging up to twenty-five years. Retention rates of over 90% are driven by its strong loyalty program, which consists of more than seventy million members. We like this business because of its robust free cash flow, asset-light business model, recurring revenue, strong brands, and high consumer recognition and satisfaction.
Avast was a material contributor during this period. Avast provides a comprehensive set of internet security products, mostly to consumers, but also to small and medium businesses all over the world. It has a unique business model that we believe gives it a significant competitive advantage. Cybercrime is a large and growing problem, which will be a tailwind for Avast as they provide a protection against this threat. We purchased shares of this business in 2018, and at that time we told you that Avast was an under-appreciated company. Avast is consistently compounding its intrinsic value, which the market is beginning to recognize.
Cushman and Wakefield plc and Jones Lang LaSalle, two material detractors for the quarter, are real estate services companies who provide a wide array of services. These businesses are asset light. They do not own buildings and instead are involved in property management, leasing, tenant representation, and capital markets activities. We think over time the businesses can grow slightly faster than Gross Domestic Product (GDP) as they gain market share as the trend towards outsourcing increases. These businesses will experience a cyclical downturn during the recession
| Annual Report | April 30, 2020 | 5 |
Shareholder Letter
April 30, 2020 (Unaudited)
as revenues and profits decrease, however, we expect their free cash flow to remain positive. Each company’s cost structure is highly variable and can be adjusted to reduce costs. We believe, both Cushman and Wakefield and Jones Lang LaSalle have sufficient liquidity to weather the next several years.
We sold Resideo, our largest detractor, during this period. In the past, we have had many successes with spinouts, most recently with Frontdoor. We thought Resideo qualified for investment as it had a promising outlook, strong competitive advantages, and it was being spun out of Honeywell, another MVP company that we knew and trusted. After the company reported third quarter earnings, we participated in calls with management which we felt confirmed our outlook for the year. Roughly six weeks later, the CFO resigned, and guidance was revised materially downward. This news came as a shock to us and to other shareholders. We spoke with management, and confirmed the revised guidance, and we then reevaluated our investment case. We determined that Resideo’s value had become unstable. Once the value of a company becomes unstable, we follow our discipline and sell it regardless of profit or a loss. We have a dual discipline of both quality and price. If we only cared about cheapness, we would still own Resideo but it is now a turnaround. What lessons did we learn? Resideo was a subsegment within a larger Honeywell segment. As a result, we were unable to independently verify Resideo’s historical results and had to rely on proforma numbers provided by its former parent. In the future, we will be more careful and very skeptical of subsegment spinouts.
Closing
I am pleased with the work our entire team did during these unprecedented times to seek to mitigate risk and improve our long-term prospective returns. We believe we were able to execute our investment philosophy and lower price to value ratios, reduce risk, and improve liquidity. We feel we are well positioned over our five-year time horizon.
We greatly appreciate your partnership and the confidence you have placed in us. We look forward to updating you again soon.
C.T. Fitzpatrick, CFA
Chief Executive Officer
Vulcan Value Partners, LLC
| 1 | Free cash flow is the amount of cash that a company has left over after it has paid all of its expenses, including investments. |
| 2 | Standard deviation is a measure of the amount of variation or dispersion of a set of values. |
| 3 | Unemployment claims sourced from the Federal Reserve of St. Louis (FRED Economic Data). https://fred.stlouisfed.org/series/ICSA |
| 4 | The price to value ratio is a calculation that compares the price of a company’s stock to our appraisal of the company’s intrinsic value. |
| 5 | Margin of safety is a principle of investing in which an investor only purchases securities when their market price is significantly below their intrinsic value. In other words, when the market price of a security is significantly below your estimation of its intrinsic value, the difference is the margin of safety. Because investors may set a margin of safety in accordance |
| 6 | www.vulcanvaluepartners.com |
Shareholder Letter
April 30, 2020 (Unaudited)
with their own risk preferences, buying securities when this difference is present allows an investment to be made with minimal downside risk.
| 6 | Free cash flow coupon, or free cash flow yield, is a security’s free cash flow divided by its market price. |
| 7 | Moore’s Law: The prediction made by American engineer Gordon Moore in 1965 that the number of transistors incorporated in a silicon chip will approximately double every 24 months. |
| 8 | Fair, or intrinsic, value is our estimate of the price a willing buyer would pay and a willing seller would accept, assuming neither was compelled to enter into a transaction. |
| 9 | The weighted average price to value ratio is a calculation that compares the price of a company's stock to our appraisal of the company's intrinsic value. |
Past performance does not guarantee future results. The Funds’ prices fluctuate as the underlying assets have exposure to market fluctuations and other risks, as described in the Funds’ prospectus. Please call 877.421.5078 to obtain current performance information and for the current prospectus and statement of additional information. This material must be preceded or accompanied by a prospectus. Please read the prospectus carefully before investing.
The views of the Vulcan Value Partners, LLC and information discussed in this commentary are as of the date of publication, are subject to change, and may not reflect the writer's current views. The views expressed represent an assessment of market conditions at a specific point in time, are opinions only and should not be relied upon as investment advice regarding a particular investment or markets in general. Such information does not constitute a recommendation to buy or sell specific securities or investment vehicles. It should not be assumed that any investment will be profitable or will equal the performance of the Funds or any securities or any sectors mentioned in this letter. The subject matter contained in this letter has been derived from several sources believed to be reliable and accurate at the time of compilation. Neither Vulcan Value Partners, LLC nor the Funds accept any liability for losses either direct or consequential caused by the use of this information.
The Funds are distributed by ALPS Distributors, Inc.
The Funds are subject to investment risks, including possible loss of the principal amount invested and therefore is not suitable for all investors. The Funds may not achieve their objectives.
Diversification does not eliminate the risk of experiencing investment losses.
| Annual Report | April 30, 2020 | 7 |
Fund Overview
April 30, 2020 (Unaudited)
VULCAN VALUE PARTNERS FUND
Annualized Total Returns (as of 4/30/20)
| | | | | | | Since | Expense Ratios(1) |
| | 6 Month | 1 Year | 3 Year | 5 Year | 10 Year | Inception* | Total | Net(2) |
| Vulcan Value Partners Fund | | | | | | | | |
| - Investor Class(3) | -10.19% | -3.15% | 5.25% | 4.42% | 10.24% | 10.48% | 1.08% | 1.08% |
| Vulcan Value Partners Fund | | | | | | | | |
| - Institutional Class | -10.10% | -2.83% | – | – | – | -2.83% | 1.08% | 0.85% |
| S&P 500® Total Return Index(4) | -3.16% | 0.86% | 9.04% | 9.12% | 11.69% | 11.93% | | |
| Russell 1000® Value Index(5) | -13.66% | -11.01% | 1.42% | 3.90% | 8.54% | 9.12% | | |
Performance data quoted represents past performance. Past performance does not guarantee future results. Investment return and principal value of an investment will fluctuate so that an investor’s shares, when sold or redeemed, may be worth more or less than the original cost. The Fund imposes a 2.00% redemption fee on shares held for less than 90 days. Current performance data may be higher or lower than actual data quoted. For the most current month-end performance data, please call 1-877-421-5078.
The table does not reflect the deduction of taxes that a shareholder would pay on Fund distributions or the redemption of Fund shares.
Subject to investment risks, including possible loss of the principal amount invested.
Returns for periods less than 1 year are cumulative.
| * | Inception Dates – Investor Class: 12/30/09, Institutional Class: 5/01/19 |
| (1) | Ratios as of the Prospectus dated August 31, 2019 and may differ from the ratios presented in the Financial Highlights. |
| (2) | Vulcan Value Partners, LLC (“Vulcan” or the “Adviser”) has contractually agreed to limit the Fund’s total annual fund operating expenses (exclusive of Acquired Fund Fees and Expenses, brokerage expenses, interest expense, taxes and extraordinary expenses) to 1.25% and 0.85% of the Fund’s average daily net assets with respect to Investor Class shares and Institutional Class shares, respectively. This agreement (the “Expense Agreement”) is in effect through August 31, 2020. The Adviser will be permitted to recover, on a class-by-class basis, expenses it has borne through the Expense Agreement to the extent that the Fund’s expenses in later periods fall below the expense cap in effect at the time of waiver or reimbursement. Notwithstanding the foregoing, the Fund will not be obligated to pay any such fees and expenses more than three years after the end of the fiscal year in which the fees or expenses were foregone or reimbursed. The Adviser may not discontinue or modify this waiver prior to August 31, 2020 without the approval by the Fund’s Board of Trustees. |
| (3) | The initial share class of the Fund was redesignated as Investor Class shares effective April 23, 2019. |
| (4) | The S&P 500® Total Return Index is an unmanaged index of 500 common stocks chosen for market size, liquidity and industry group representation. It is a market-value weighted index. The Index is not actively managed and does not reflect any deductions for fees, expenses or taxes. An investor may not invest directly in the Index. |
| (5) | The Russell 1000® Value Index is presented here as an additional index, and measures the performance of the large-cap value segment of the U.S. equity universe. It includes those Russell 1000® companies with lower price-to-book ratios and lower expected growth values. The Index is not actively managed and does not reflect any deductions for fees, expenses or taxes. An investor may not invest directly in the Index. |
| 8 | www.vulcanvaluepartners.com |
Fund Overview
April 30, 2020 (Unaudited)
Growth of $10,000 Initial Investment (for the period ended April 30, 2020)
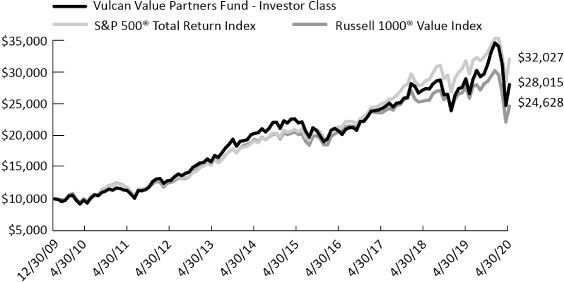
The chart above represents historical performance of a hypothetical investment of $10,000 in the Fund since inception. Past performance does not guarantee future results. This chart does not reflect the deduction of taxes that a shareholder would pay on Fund distributions or the redemption of Fund shares.
Investing in the Fund is subject to investment risks, including possible loss of the principal amount invested.
Industry Allocation (as a % of Net Assets)*
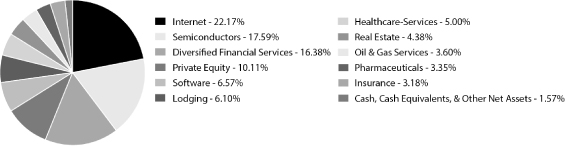
Top Ten Holdings (as a % of Net Assets)*
| Skyworks Solutions, Inc. | 7.78% |
| Qorvo, Inc. | 7.28% |
| Mastercard, Inc. | 7.14% |
| Alphabet, Inc. | 7.11% |
| Amazon.com, Inc. | 6.85% |
| KKR & Co., Inc. | 5.15% |
| Anthem, Inc. | 5.00% |
| Carlyle Group, Inc. | 4.95% |
| Facebook, Inc. | 4.77% |
| Credit Acceptance Corp. | 4.72% |
| Top Ten Holdings | 60.75% |
| * | Holdings are subject to change, and may not reflect the current or future position of the portfolio. |
| Annual Report | April 30, 2020 | 9 |
Disclosure of Fund Expenses
April 30, 2020 (Unaudited)
As a shareholder of the Vulcan Value Partners Fund (the “Fund”), you will incur two types of costs: (1) transaction costs, including applicable redemption fees; and (2) ongoing costs, including management fees and other fund operating expenses. The following examples are intended to help you understand your ongoing costs (in dollars) of investing in the Fund and to compare these costs with the ongoing costs of investing in other mutual funds. The examples are based on an investment of $1,000 invested on November 1, 2019 and held until April 30, 2020.
Actual Expenses. The first line of each table below provides information about actual account values and actual expenses. You may use the information in this line, together with the amount you invested, to estimate the expenses that you paid over the period. Simply divide your account value by $1,000 (for example, an $8,600 account value divided by $1,000 = 8.6), then multiply the result by the number in the first line under the heading “Expenses Paid During Period” to estimate the expenses you paid on your account during this period.
Hypothetical Example for Comparison Purposes. The second line of the table below provides information about hypothetical account values and hypothetical expenses based on the Fund’s actual expense ratio and an assumed rate of return of 5% per year before expenses, which is not the Fund’s actual return. The hypothetical account values and expenses may not be used to estimate the actual ending account balance or expenses you paid for the period. You may use this information to compare the ongoing costs of investing in the Fund and other mutual funds. To do so, compare this 5% hypothetical example with the 5% hypothetical examples that appear in the shareholder reports of the other mutual funds.
Please note the expenses shown in the table are meant to highlight ongoing Fund costs only and do not reflect transactional costs, such as redemption fees or exchange fees. Therefore, the second line of the table below is useful in comparing your ongoing costs only, and will not help you determine the relative total costs of owning different funds. In addition, if these transactional costs were included, your costs would have been higher.
Vulcan Value Partners Fund
| | Beginning Account Value 11/1/19 | Ending Account Value 4/30/20 | Expense Ratio(a) | Expenses Paid During period 11/1/19 - 4/30/20(b) |
| VULCAN VALUE PARTNERS FUND | | | | |
| Investor Class | | | | |
| Actual | $1,000.00 | $ 898.10 | 1.09% | $ 5.14 |
| Hypothetical (5% return before expenses) | $1,000.00 | $1,019.44 | 1.09% | $ 5.47 |
| Institutional Class | | | | |
| Actual | $1,000.00 | $ 899.00 | 0.85% | $ 4.01 |
| Hypothetical (5% return before expenses) | $1,000.00 | $1,020.64 | 0.85% | $ 4.27 |
| 10 | www.vulcanvaluepartners.com |
Disclosure of Fund Expenses
April 30, 2020 (Unaudited)
| (a) | The Fund's expense ratios have been annualized based on the Fund's most recent fiscal half-year expenses. |
| (b) | Expenses are equal to the Fund's annualized expense ratio multiplied by the average account value over the period, multiplied by the number of days in the most recent fiscal half-year (182)/366 (to reflect the half-year period). |
| Annual Report | April 30, 2020 | 11 |
Fund Overview
April 30, 2020 (Unaudited)
VULCAN VALUE PARTNERS SMALL CAP FUND
Annualized Total Returns (as of 4/30/20)
| | | | | | | Since | Expense Ratios(1) |
| | 6 Month | 1 Year | 3 Year | 5 Year | 10 Year | Inception* | Total | Net(2) |
| Vulcan Value Partners Small | | | | | | | | |
| Cap Fund – Investor Class(3) | -27.70% | -27.28% | -7.74% | -1.88% | 6.58% | 7.90% | 1.28% | 1.26% |
| Vulcan Value Partners Small | | | | | | | | |
| Cap Fund – Institutional Class | -27.61% | -26.56% | – | – | – | -26.56% | 1.27% | 1.01% |
| Russell 2000® Value Index(4) | -23.44% | -23.84% | -6.06% | 0.30% | 5.30% | 6.65% | | |
| Russell 2000® Index(5) | -15.47% | -16.39% | -0.82% | 2.88% | 7.69% | 8.77% | | |
Performance data quoted represents past performance. Past performance does not guarantee future results. Investment return and principal value of an investment will fluctuate so that an investor’s shares, when sold or redeemed, may be worth more or less than the original cost. The Fund imposes a 2.00% redemption fee on shares held for less than 90 days. Current performance data may be higher or lower than actual data quoted. For the most current month-end performance data, please call 1-877-421-5078.
The table does not reflect the deduction of taxes that a shareholder would pay on Fund distributions or the redemption of Fund shares.
Subject to investment risks, including possible loss of the principal amount invested.
Returns for periods less than 1 year are cumulative.
| * | Inception Dates – Investor Class: 12/30/09, Institutional Class: 5/01/19 |
| (1) | Ratios as of the Prospectus dated August 31, 2019 and may differ from the ratios presented in the Financial Highlights. |
| (2) | Vulcan Value Partners, LLC (“Vulcan” or the “Adviser”) has contractually agreed to limit the Fund’s total annual fund operating expenses (exclusive of Acquired Fund Fees and Expenses, brokerage expenses, interest expense, taxes and extraordinary expenses) to 1.25% and 1.00% of the Fund’s average daily net assets with respect to Investor Class shares and Institutional Class shares, respectively. This agreement (the “Expense Agreement”) is in effect through August 31, 2020. The Adviser will be permitted to recover, on a class-by-class basis, expenses it has borne through the Expense Agreement to the extent that the Fund’s expenses in later periods fall below the expense cap in effect at the time of waiver or reimbursement. Notwithstanding the foregoing, the Fund will not be obligated to pay any such fees and expenses more than three years after the end of the fiscal year in which the fees or expenses were foregone or reimbursed. The Adviser may not discontinue or modify this waiver prior to August 31, 2020 without the approval by the Fund’s Board of Trustees. |
| (3) | The initial share class of the Fund was redesignated as Investor Class shares effective April 23, 2019. |
| (4) | The Russell 2000® Value Index is presented here as an additional index, and measures the performance of small-cap value segment of the U.S.equity universe. It includes those Russell 2000® companies with lower price-to-book ratios and lower forecasted growth values. The Index is not actively managed and does not reflect any deductions for fees, expenses or taxes. An investor may not invest directly in the Index. |
| (5) | The Russell 2000® Index is presented here as an additional index, and measures the performance of the small-cap segment of the U.S. equity universe. The Russell 2000® Index is a subset of the Russell 3000® Index representing approximately 8% of the total market capitalization of that index. It includes approximately 2,000 of the smallest securities based on a combination of their market cap and current index membership. The Index is not actively managed and does not reflect any deductions for fees, expenses or taxes. An investor may not invest directly in the Index. |
| 12 | www.vulcanvaluepartners.com |
Fund Overview
April 30, 2020 (Unaudited)
Growth of $10,000 Initial Investment (for the period ended April 30, 2020)

The chart above represents historical performance of a hypothetical investment of $10,000 in the Fund since inception. Past performance does not guarantee future results. This chart does not reflect the deduction of taxes that a shareholder would pay on Fund distributions or the redemption of Fund shares.
Investing in the Fund is subject to investment risks, including possible loss of the principal amount invested.
Industry Allocation (as a % of Net Assets)*
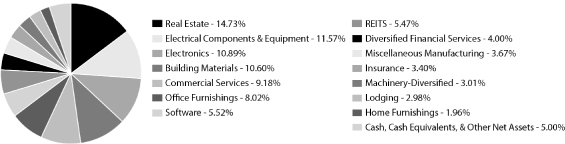
Top Ten Holdings (as a % of Net Assets)*
| Forterra PLC | 6.12% |
| Coherent, Inc. | 6.06% |
| ISS A/S | 5.93% |
| Cushman & Wakefield PLC | 5.76% |
| Herman Miller, Inc. | 5.51% |
| Park Hotels & Resorts, Inc. | 5.47% |
| EnerSys | 5.14% |
| Jones Lang LaSalle, Inc. | 5.11% |
| Ituran Location and Control, Ltd. | 4.82% |
| Ibstock PLC | 4.47% |
| Top Ten Holdings | 54.39% |
| * | Holdings are subject to change, and may not reflect the current or future position of the portfolio. |
| Annual Report | April 30, 2020 | 13 |
Disclosure of Fund Expenses
April 30, 2020 (Unaudited)
As a shareholder of the Vulcan Value Partners Small Cap Fund (the “Fund”), you will incur two types of costs: (1) transaction costs, including applicable redemption fees; and (2) ongoing costs, including management fees and other fund operating expenses. The following examples are intended to help you understand your ongoing costs (in dollars) of investing in the Fund and to compare these costs with the ongoing costs of investing in other mutual funds. The examples are based on an investment of $1,000 invested on November 1, 2019 and held until April 30, 2020.
Actual Expenses. The first line of each table below provides information about actual account values and actual expenses. You may use the information in this line, together with the amount you invested, to estimate the expenses that you paid over the period. Simply divide your account value by $1,000 (for example, an $8,600 account value divided by $1,000 = 8.6), then multiply the result by the number in the first line under the heading “Expenses Paid During Period” to estimate the expenses you paid on your account during this period.
Hypothetical Example for Comparison Purposes. The second line of the table below provides information about hypothetical account values and hypothetical expenses based on the Fund’s actual expense ratio and an assumed rate of return of 5% per year before expenses, which is not the Fund’s actual return. The hypothetical account values and expenses may not be used to estimate the actual ending account balance or expenses you paid for the period. You may use this information to compare the ongoing costs of investing in the Fund and other mutual funds. To do so, compare this 5% hypothetical example with the 5% hypothetical examples that appear in the shareholder reports of the other mutual funds.
Please note the expenses shown in the table are meant to highlight ongoing Fund costs only and do not reflect transactional costs, such as redemption fees or exchange fees. Therefore, the second line of the table below is useful in comparing your ongoing costs only, and will not help you determine the relative total costs of owning different funds. In addition, if these transactional costs were included, your costs would have been higher.
Vulcan Value Partners Small Cap Fund
| | Beginning Account Value 11/1/19 | Ending Account Value 4/30/20 | Expense Ratio(a) | Expenses Paid During period 11/1/19 - 4/30/20(b) |
| VULCAN VALUE PARTNERS SMALL CAP FUND | | | |
| Investor Class | | | | |
| Actual | $1,000.00 | $ 723.00 | 1.25% | $ 5.35 |
| Hypothetical (5% return before expenses) | $1,000.00 | $1,018.65 | 1.25% | $ 6.27 |
| Institutional Class | | | | |
| Actual | $1,000.00 | $ 723.90 | 1.00% | $ 4.29 |
| Hypothetical (5% return before expenses) | $1,000.00 | $1,019.89 | 1.00% | $ 5.02 |
| 14 | www.vulcanvaluepartners.com |
Disclosure of Fund Expenses
April 30, 2020 (Unaudited)
| (a) | The Fund's expense ratios have been annualized based on the Fund's most recent fiscal half-year expenses. |
| (b) | Expenses are equal to the Fund's annualized expense ratio multiplied by the average account value over the period, multiplied by the number of days in the most recent fiscal half-year (182)/366 (to reflect the half-year period). |
| Annual Report | April 30, 2020 | 15 |
| Statement of Investments | Vulcan Value Partners Fund |
| | | Shares | | | Value (Note 2) | |
| COMMON STOCKS (98.43%) | | | | | | | | |
| Communications (22.17%) | | | | | | | | |
| Internet (22.17%) | | | | | | | | |
| Alphabet, Inc., Class C(a) | | | 66,918 | | | $ | 90,249,630 | |
| Amazon.com, Inc.(a) | | | 35,119 | | | | 86,884,406 | |
| Booking Holdings, Inc.(a) | | | 29,545 | | | | 43,743,441 | |
| Facebook, Inc., Class A(a) | | | 295,413 | | | | 60,473,995 | |
| | | | | | | | 281,351,472 | |
| | | | | | | | | |
| TOTAL COMMUNICATIONS | | | | | | | 281,351,472 | |
| | | | | | | | | |
| Consumer, Cyclical (6.10%) | | | | | | | | |
| Lodging (6.10%) | | | | | | | | |
| Hilton Worldwide Holdings, Inc. | | | 681,127 | | | | 51,568,125 | |
| Whitbread PLC | | | 687,204 | | | | 25,792,762 | |
| | | | | | | | 77,360,887 | |
| | | | | | | | | |
| TOTAL CONSUMER, CYCLICAL | | | | | | | 77,360,887 | |
| | | | | | | | | |
| Consumer, Non-cyclical (8.35%) | | | | | | | | |
| Healthcare-Services (5.00%) | | | | | | | | |
| Anthem, Inc. | | | 226,055 | | | | 63,460,420 | |
| | | | | | | | | |
| Pharmaceuticals (3.35%) | | | | | | | | |
| CVS Health Corp. | | | 691,270 | | | | 42,547,668 | |
| | | | | | | | | |
| TOTAL CONSUMER, NON-CYCLICAL | | | | | | | 106,008,088 | |
| | | | | | | | | |
| Energy (3.60%) | | | | | | | | |
| Oil & Gas Services (3.60%) | | | | | | | | |
| National Oilwell Varco, Inc. | | | 3,618,256 | | | | 45,734,756 | |
| | | | | | | | | |
| TOTAL ENERGY | | | | | | | 45,734,756 | |
| | | | | | | | | |
| Financial (34.05%) | | | | | | | | |
| Diversified Financial Services (16.38%) | | | | | | | | |
| Credit Acceptance Corp.(a) | | | 192,062 | | | | 59,840,757 | |
| Mastercard, Inc., Class A | | | 329,353 | | | | 90,562,195 | |
| Visa, Inc., Class A | | | 321,378 | | | | 57,436,676 | |
| | | | | | | | 207,839,628 | |
| | | | | | | | | |
| Insurance (3.18%) | | | | | | | | |
| Everest Re Group, Ltd. | | | 53,133 | | | | 9,198,916 | |
| Swiss Re AG | | | 432,224 | | | | 31,192,669 | |
| | | | | | | | 40,391,585 | |
| 16 | www.vulcanvaluepartners.com |
| Vulcan Value Partners Fund | Statement of Investments |
| | | Shares | | | Value (Note 2) | |
| Financial (continued) | | | | | | | | |
| Private Equity (10.11%) | | | | | | | | |
| Carlyle Group, Inc. | | | 2,681,320 | | | $ | 62,850,141 | |
| KKR & Co., Inc., Class A | | | 2,594,892 | | | | 65,417,227 | |
| | | | | | | | 128,267,368 | |
| | | | | | | | | |
| Real Estate (4.38%) | | | | | | | | |
| Jones Lang LaSalle, Inc. | | | 526,877 | | | | 55,627,674 | |
| | | | | | | | | |
| TOTAL FINANCIAL | | | | | | | 432,126,255 | |
| | | | | | | | | |
| Technology (24.16%) | | | | | | | | |
| Semiconductors (17.59%) | | | | | | | | |
| NVIDIA Corp. | | | 109,819 | | | | 32,097,897 | |
| Qorvo, Inc.(a) | | | 941,795 | | | | 92,324,164 | |
| Skyworks Solutions, Inc. | | | 951,030 | | | | 98,792,997 | |
| | | | | | | | 223,215,058 | |
| | | | | | | | | |
| Software (6.57%) | | | | | | | | |
| Microsoft Corp. | | | 318,117 | | | | 57,009,747 | |
| Oracle Corp. | | | 496,570 | | | | 26,303,313 | |
| | | | | | | | 83,313,060 | |
| | | | | | | | | |
| TOTAL TECHNOLOGY | | | | | | | 306,528,118 | |
| | | | | | | | | |
| TOTAL COMMON STOCKS | | | | | | | | |
| (Cost $1,112,427,731) | | | | | | | 1,249,109,576 | |
| | | | | | | | | |
| TOTAL INVESTMENTS (98.43%) | | | | | | | | |
| (Cost $1,112,427,731) | | | | | | $ | 1,249,109,576 | |
| | | | | | | | | |
| Other Assets In Excess Of Liabilities (1.57%) | | | | | | | 19,925,922 | |
| | | | | | | | | |
| NET ASSETS (100.00%) | | | | | | $ | 1,269,035,498 | |
| (a) | Non-Income Producing Security. |
For Fund compliance purposes, the Fund's industry classifications refer to any one or more of the industry sub-classifications used by one or more widely recognized market indexes or ratings group indexes, and/or as defined by Fund management. This definition may not apply for purposes of this report, which may combine industry sub-classifications for reporting ease. Industries are shown as a percentage of net assets.
See Accompanying Notes to Financial Statements.
| Annual Report | April 30, 2020 | 17 |
| Statement of Investments | Vulcan Value Partners Small Cap Fund |
April 30, 2020
| | | Shares | | | Value (Note 2) | |
| COMMON STOCKS (95.00%) | | | | | | | | |
| Consumer, Cyclical (12.96%) | | | | | | | | |
| Home Furnishings (1.96%) | | | | | | | | |
| Howden Joinery Group PLC | | | 1,190,088 | | | $ | 7,872,265 | |
| | | | | | | | | |
| Lodging (2.98%) | | | | | | | | |
| Wyndham Hotels & Resorts, Inc. | | | 316,701 | | | | 11,942,795 | |
| | | | | | | | | |
| Office Furnishings (8.02%) | | | | | | | | |
| Herman Miller, Inc. | | | 979,920 | | | | 22,087,397 | |
| Knoll, Inc. | | | 862,833 | | | | 10,060,632 | |
| | | | | | | | 32,148,029 | |
| | | | | | | | | |
| TOTAL CONSUMER, CYCLICAL | | | | | | | 51,963,089 | |
| | | | | | | | | |
| Consumer, Non-cyclical (9.18%) | | | | | | | | |
| Commercial Services (9.18%) | | | | | | | | |
| ISS A/S(a) | | | 1,594,222 | | | | 23,787,195 | |
| Savills PLC | | | 1,070,290 | | | | 13,008,424 | |
| | | | | | | | 36,795,619 | |
| | | | | | | | | |
| TOTAL CONSUMER, NON-CYCLICAL | | | | | | | 36,795,619 | |
| | | | | | | | | |
| Financial (27.60%) | | | | | | | | |
| Diversified Financial Services (4.00%) | | | | | | | | |
| Virtus Investment Partners, Inc. | | | 197,293 | | | | 16,034,002 | |
| | | | | | | | | |
| Insurance (3.40%) | | | | | | | | |
| Axis Capital Holdings, Ltd. | | | 214,369 | | | | 7,845,906 | |
| Everest Re Group, Ltd. | | | 33,280 | | | | 5,761,766 | |
| | | | | | | | 13,607,672 | |
| | | | | | | | | |
| Real Estate (14.73%) | | | | | | | | |
| Cushman & Wakefield PLC(a) | | | 1,896,844 | | | | 23,084,591 | |
| Jones Lang LaSalle, Inc. | | | 193,875 | | | | 20,469,323 | |
| Marcus & Millichap, Inc.(a) | | | 533,691 | | | | 15,503,724 | |
| | | | | | | | 59,057,638 | |
| | | | | | | | | |
| REITS (5.47%) | | | | | | | | |
| Park Hotels & Resorts, Inc. | | | 2,305,346 | | | | 21,923,840 | |
| | | | | | | | | |
| TOTAL FINANCIAL | | | | | | | 110,623,152 | |
| | | | | | | | | |
| Industrial (39.74%) | | | | | | | | |
| Building Materials (10.60%) | | | | | | | | |
| Forterra PLC | | | 8,087,556 | | | | 24,548,799 | |
| 18 | www.vulcanvaluepartners.com |
| Vulcan Value Partners Small Cap Fund | Statement of Investments |
| | | Shares | | | Value (Note 2) | |
| Industrial (continued) | | | | | | | | |
| Building Materials (continued) | | | | | | | | |
| Ibstock PLC | | | 7,063,942 | | | $ | 17,936,329 | |
| | | | | | | | 42,485,128 | |
| | | | | | | | | |
| Electrical Components & Equipment (11.57%) | | | | | | | | |
| Acuity Brands, Inc. | | | 114,963 | | | | 9,954,646 | |
| EnerSys | | | 353,148 | | | | 20,620,312 | |
| Littelfuse, Inc. | | | 108,781 | | | | 15,799,352 | |
| | | | | | | | 46,374,310 | |
| | | | | | | | | |
| Electronics (10.89%) | | | | | | | | |
| Coherent, Inc.(a) | | | 190,091 | | | | 24,306,936 | |
| Ituran Location and Control, Ltd. | | | 1,092,361 | | | | 19,334,790 | |
| | | | | | | | 43,641,726 | |
| | | | | | | | | |
| Machinery-Diversified (3.01%) | | | | | | | | |
| Stabilus SA | | | 282,473 | | | | 12,090,995 | |
| | | | | | | | | |
| Miscellaneous Manufacturing (3.67%) | | | | | | | | |
| Crane Co. | | | 270,646 | | | | 14,736,675 | |
| | | | | | | | | |
| TOTAL INDUSTRIAL | | | | | | | 159,328,834 | |
| | | | | | | | | |
| Technology (5.52%) | | | | | | | | |
| Software (5.52%) | | | | | | | | |
| ACI Worldwide, Inc.(a) | | | 560,890 | | | | 15,368,386 | |
| Lectra | | | 429,496 | | | | 6,777,577 | |
| | | | | | | | 22,145,963 | |
| | | | | | | | | |
| TOTAL TECHNOLOGY | | | | | | | 22,145,963 | |
| | | | | | | | | |
| TOTAL COMMON STOCKS | | | | | | | | |
| (Cost $425,955,754) | | | | | | | 380,856,657 | |
| Annual Report | April 30, 2020 | 19 |
| Statement of Investments | Vulcan Value Partners Small Cap Fund |
April 30, 2020
| | | 7-Day Yield | | | Shares | | | Value (Note 2) | |
| SHORT TERM INVESTMENTS (3.06%) | | | | | | | | | | | | |
| Money Market Fund (3.06%) | | | | | | | | | | | | |
| Invesco Government & Agency Portfolio, | | | | | | | | | | | | |
| Institutional Class | | | 0.204 | % | | | 12,254,706 | | | $ | 12,254,706 | |
| | | | | | | | | | | | | |
| TOTAL SHORT TERM INVESTMENTS | | | | | | | | | | | | |
| (Cost $12,254,706) | | | | | | | | | | | 12,254,706 | |
| | | | | | | | | | | | | |
| TOTAL INVESTMENTS (98.06%) | | | | | | | | | | | | |
| (Cost $438,210,460) | | | | | | | | | | $ | 393,111,363 | |
| | | | | | | | | | | | | |
| Other Assets In Excess Of Liabilities (1.94%) | | | | | | | | | | | 7,767,296 | |
| | | | | | | | | | | | | |
| NET ASSETS (100.00%) | | | | | | | | | | $ | 400,878,659 | |
| (a) | Non-Income Producing Security. |
For Fund compliance purposes, the Fund's industry classifications refer to any one or more of the industry sub-classifications used by one or more widely recognized market indexes or ratings group indexes, and/or as defined by Fund management. This definition may not apply for purposes of this report, which may combine industry sub-classifications for reporting ease. Industries are shown as a percentage of net assets.
See Accompanying Notes to Financial Statements.
| 20 | www.vulcanvaluepartners.com |
| Statements of Assets and Liabilities |
| | | Vulcan Value Partners Fund | | | Vulcan Value Partners Small Cap Fund | |
| ASSETS: | | | | | | | | |
| Investments, at value | | $ | 1,249,109,576 | | | $ | 393,111,363 | |
| Foreign currency, at value (Cost $– and $88,267) | | | – | | | | 86,817 | |
| Receivable for investments sold | | | 20,921,873 | | | | 5,955,565 | |
| Receivable for shares sold | | | 1,933,507 | | | | 3,062,012 | |
| Dividends receivable | | | 3,341,531 | | | | 303,688 | |
| Other assets | | | 29,888 | | | | 20,798 | |
| Total assets | | | 1,275,336,375 | | | | 402,540,243 | |
| | | | | | | | | |
| LIABILITIES: | | | | | | | | |
| Cash due to custodian | | | 122,742 | | | | – | |
| Payable for shares redeemed | | | 5,210,884 | | | | 1,309,884 | |
| Payable to adviser | | | 765,370 | | | | 260,602 | |
| Payable for administration fees | | | 35,442 | | | | 13,732 | |
| Payable for transfer agency fees | | | 85,097 | | | | 44,122 | |
| Payable for delegated transfer agent equivalent services fees | | | 7,288 | | | | 4,603 | |
| Payable for professional fees | | | 11,586 | | | | 5,044 | |
| Payable for trustee fees and expenses | | | 22,075 | | | | 6,837 | |
| Payable for principal financial officer fees | | | 948 | | | | 302 | |
| Accrued expenses and other liabilities | | | 39,445 | | | | 16,458 | |
| Total liabilities | | | 6,300,877 | | | | 1,661,584 | |
| NET ASSETS | | $ | 1,269,035,498 | | | $ | 400,878,659 | |
| | | | | | | | | |
| NET ASSETS CONSIST OF: | | | | | | | | |
| | | | | | | | | |
| Paid-in capital (Note 5) | | $ | 1,159,001,061 | | | $ | 493,538,049 | |
| Total distributable earnings | | | 110,034,437 | | | | (92,659,390 | ) |
| NET ASSETS | | $ | 1,269,035,498 | | | $ | 400,878,659 | |
| | | | | | | | | |
| INVESTMENTS, AT COST | | $ | 1,112,427,731 | | | $ | 438,210,460 | |
See Accompanying Notes to Financial Statements.
| Annual Report | April 30, 2020 | 21 |
Statements of Assets and Liabilities
April 30, 2020
| | | Vulcan Value Partners Fund | | | Vulcan Value Partners Small Cap Fund | |
| PRICING OF SHARES: | | | | | | | | |
| Investor Class: | | | | | | | | |
| Net Asset Value, offering and redemption price per share | | $ | 19.50 | | | $ | 12.01 | |
| Net Assets | | $ | 500,309,283 | | | $ | 153,249,183 | |
| Shares of beneficial interest outstanding (unlimited number of shares, no par value common stock authorized) | | | 25,663,235 | | | | 12,761,787 | |
| Institutional Class: | | | | | | | | |
| Net Asset Value, offering and redemption price per share | | | 19.52 | | | | 12.03 | |
| Net Assets | | | 768,726,215 | | | | 247,629,476 | |
| Shares of beneficial interest outstanding (unlimited number of shares, no par value common stock authorized) | | | 39,378,536 | | | | 20,581,105 | |
See Accompanying Notes to Financial Statements.
| 22 | www.vulcanvaluepartners.com |
Statements of Operations
For the Year Ended April 30, 2020
| | | Vulcan Value Partners Fund | | | Vulcan Value Partners Small Cap Fund | |
| INVESTMENT INCOME: | | | | | | | | |
| Dividends | | $ | 17,247,362 | | | $ | 9,565,901 | |
| Foreign taxes withheld | | | (432,792 | ) | | | (365,720 | ) |
| Total investment income | | | 16,814,570 | | | | 9,200,181 | |
| | | | | | | | | |
| EXPENSES: | | | | | | | | |
| Investment advisory fees (Note 6) | | | 13,679,401 | | | | 5,535,738 | |
| Administrative fees | | | 435,958 | | | | 161,641 | |
| Transfer agency fees | | | 95,461 | | | | 98,160 | |
| Delegated transfer agent equivalent services fees | | | | | | | | |
| Investor Class | | | 94,346 | | | | 33,785 | |
| Institutional Class(a) | | | 321,715 | | | | 139,394 | |
| Professional fees | | | 59,954 | | | | 36,208 | |
| Custodian fees | | | 160,747 | | | | 57,275 | |
| Principal financial officer fees | | | 10,686 | | | | 3,744 | |
| Trustee fees and expenses | | | 69,172 | | | | 22,330 | |
| Recoupment of previously waived fees | | | | | | | | |
| Investor Class | | | – | | | | 4,227 | |
| ReFlow Fees (Note 2) | | | 122,714 | | | | 20,902 | |
| Other | | | 128,559 | | | | 81,001 | |
| Total expenses before waiver | | | 15,178,713 | | | | 6,194,405 | |
| Less fees waived/reimbursed by investment adviser (Note 6) | | | | | | | | |
| Investor Class | | | – | | | | (43,468 | ) |
| Institutional Class | | | (1,571,670 | ) | | | (594,605 | ) |
| Total net expenses | | | 13,607,043 | | | | 5,556,332 | |
| NET INVESTMENT INCOME | | | 3,207,527 | | | | 3,643,849 | |
| | | | | | | | | |
| Net realized gain/(loss) on investments(b) | | | 52,947,538 | | | | (29,868,462 | ) |
| Net realized loss on foreign currency transactions | | | (284,616 | ) | | | (131,980 | ) |
| Net realized gain/(loss) | | | 52,662,922 | | | | (30,000,442 | ) |
| Net change in unrealized depreciation of investments | | | (90,321,130 | ) | | | (118,079,432 | ) |
| Net change in unrealized appreciation/(depreciation) on translation of assets and liabilities denominated in foreign currencies | | | 134,352 | | | | (4,250 | ) |
| Net change in unrealized depreciation | | | (90,186,778 | ) | | | (118,083,682 | ) |
| NET REALIZED AND UNREALIZED LOSS ON INVESTMENTS | | | (37,523,856 | ) | | | (148,084,124 | ) |
| NET DECREASE IN NET ASSETS RESULTING FROM OPERATIONS | | $ | (34,316,329 | ) | | $ | (144,440,275 | ) |
| (a) | Institutional Class inception date was May 1, 2019. |
| (b) | See Note 2 for gain/(loss) on In-Kind transactions. |
See Accompanying Notes to Financial Statements.
| Annual Report | April 30, 2020 | 23 |
| Statements of Changes in Net Assets | Vulcan Value Partners Fund |
| | | For the Year Ended April 30, 2020 | | | For the Year Ended April 30, 2019 | |
| OPERATIONS: | | | | | | | | |
| Net investment income | | $ | 3,207,527 | | | $ | 5,078,555 | |
| Net realized gain | | | 52,662,922 | | | | 72,617,855 | |
| Net change in unrealized depreciation | | | (90,186,778 | ) | | | (3,680,794 | ) |
| Net increase/(decrease) in net assets resulting from operations | | | (34,316,329 | ) | | | 74,015,616 | |
| | | | | | | | | |
| DISTRIBUTIONS TO SHAREHOLDERS (Note 3): | | | | | | | | |
| Total amount of distribution | | | | | | | | |
| Investor Class(a) | | | (32,843,455 | ) | | | (98,666,500 | ) |
| Institutional Class(b) | | | (33,490,625 | ) | | | – | |
| Net decrease in net assets from distributions | | | (66,334,080 | ) | | | (98,666,500 | ) |
| | | | | | | | | |
| SHARE TRANSACTIONS (Note 5): | | | | | | | | |
| Investor Class(a) | | | | | | | | |
| Proceeds from sales of shares | | | 181,355,243 | | | | 257,281,793 | |
| Issued to shareholders in reinvestment of distributions | | | 28,416,427 | | | | 85,760,192 | |
| Cost of shares redeemed, net of redemption fees | | | (974,172,281 | ) | | | (348,353,451 | ) |
| Institutional Class(b) | | | | | | | | |
| Proceeds from sales of shares | | | 970,339,907 | | | | – | |
| Issued to shareholders in reinvestment of distributions | | | 31,558,042 | | | | – | |
| Cost of shares redeemed, net of redemption fees | | | (152,367,669 | ) | | | – | |
| Net increase/(decrease) from share transactions | | | 85,129,669 | | | | (5,311,466 | ) |
| | | | | | | | | |
| Net decrease in net assets | | | (15,520,740 | ) | | | (29,962,350 | ) |
| | | | | | | | | |
| NET ASSETS: | | | | | | | | |
| Beginning of year | | | 1,284,556,238 | | | | 1,314,518,588 | |
| End of year | | $ | 1,269,035,498 | | | $ | 1,284,556,238 | |
| (a) | Prior to April 23, 2019, the Investor class was the initial share class. |
| (b) | Institutional Class inception date was May 1, 2019. |
See Accompanying Notes to Financial Statements.
| 24 | www.vulcanvaluepartners.com |
| Vulcan Value Partners Small Cap Fund | Statements of Changes in Net Assets |
| | | For the Year Ended April 30, 2020 | | | For the Year Ended April 30, 2019 | |
| OPERATIONS: | | | | | | | | |
| Net investment income | | $ | 3,643,849 | | | $ | 4,412,446 | |
| Net realized gain/(loss) | | | (30,000,442 | ) | | | 97,428,463 | |
| Net change in unrealized depreciation | | | (118,083,682 | ) | | | (99,582,592 | ) |
| Net increase/(decrease) in net assets resulting from operations | | | (144,440,275 | ) | | | 2,258,317 | |
| | | | | | | | | |
| DISTRIBUTIONS TO SHAREHOLDERS (Note 3): | | | | | | | | |
| Total amount of distribution | | | | | | | | |
| Investor Class(a) | | | (11,207,675 | ) | | | (91,839,425 | ) |
| Institutional Class(b) | | | (12,648,479 | ) | | | – | |
| Net decrease in net assets from distributions | | | (23,856,154 | ) | | | (91,839,425 | ) |
| | | | | | | | | |
| SHARE TRANSACTIONS (Note 5): | | | | | | | | |
| Investor Class(a) | | | | | | | | |
| Proceeds from sales of shares | | | 48,105,590 | | | | 162,197,866 | |
| Issued to shareholders in reinvestment of distributions | | | 9,756,596 | | | | 79,373,996 | |
| Cost of shares redeemed, net of redemption fees | | | (371,647,565 | ) | | | (805,375,212 | ) |
| Institutional Class(b) | | | | | | | | |
| Proceeds from sales of shares | | | 415,146,676 | | | | – | |
| Issued to shareholders in reinvestment of distributions | | | 11,957,260 | | | | – | |
| Cost of shares redeemed, net of redemption fees | | | (87,317,255 | ) | | | – | |
| Net increase/(decrease) from share transactions | | | 26,001,302 | | | | (563,803,350 | ) |
| | | | | | | | | |
| Net decrease in net assets | | | (142,295,127 | ) | | | (653,384,458 | ) |
| | | | | | | | | |
| NET ASSETS: | | | | | | | | |
| Beginning of year | | | 543,173,786 | | | | 1,196,558,244 | |
| End of year | | $ | 400,878,659 | | | $ | 543,173,786 | |
| (a) | Prior to April 23, 2019, the Investor class was the initial share class. |
| (b) | Institutional Class inception date was May 1, 2019. |
See Accompanying Notes to Financial Statements.
| Annual Report | April 30, 2020 | 25 |
Financial Highlights
For a share outstanding throughout the years presented.
| Investor Class |
| NET ASSET VALUE, BEGINNING OF PERIOD |
| INCOME/(LOSS) FROM OPERATIONS: |
| Net investment income(a) |
| Net realized and unrealized gain/(loss) on investments |
| Total from investment operations |
| |
| LESS DISTRIBUTIONS TO SHAREHOLDERS: |
| From net investment income |
| From net realized gains on investments |
| Total distributions |
| |
| Redemption fees added to paid-in capital |
| Increase/(decrease) in net asset value |
| NET ASSET VALUE, END OF YEAR |
| |
| Total return |
| |
| RATIOS AND SUPPLEMENTAL DATA: |
| Net assets, end of year (000's) |
Ratio of expenses to average net assets without fee waivers/reimbursements
Ratio of expenses to average net assets including fee waivers/reimbursements
Net investment income to average net assets including fee waivers/reimbursements
Portfolio turnover rate
| (a) | Per share numbers have been calculated using the average shares method. |
| (b) | Less than $0.005 per share. |
See Accompanying Notes to Financial Statements.
| 26 | www.vulcanvaluepartners.com |
Vulcan Value Partners Fund
| For the Year Ended | | | For the Year Ended | | | For the Year Ended | | | For the Year Ended | | | For the Year Ended | |
| April 30, 2020 | | | April 30, 2019 | | | April 30, 2018 | | | April 30, 2017 | | | April 30, 2016 | |
| $ | 21.05 | | | $ | 21.39 | | | $ | 19.30 | | | $ | 17.17 | | | $ | 19.97 | |
| | | | | | | | | | | | | | | | | | | |
| | 0.03 | | | | 0.08 | | | | 0.09 | | | | 0.18 | | | | 0.20 | |
| | (0.53 | ) | | | 1.13 | | | | 2.35 | | | | 2.18 | | | | (1.51 | ) |
| | (0.50 | ) | | | 1.21 | | | | 2.44 | | | | 2.36 | | | | (1.31 | ) |
| | | | | | | | | | | | | | | | | | | |
| | | | | | | | | | | | | | | | | | | |
| | 0.00 | (b) | | | (0.13 | ) | | | (0.12 | ) | | | (0.23 | ) | | | (0.13 | ) |
| | (1.05 | ) | | | (1.42 | ) | | | (0.23 | ) | | | – | | | | (1.36 | ) |
| | (1.05 | ) | | | (1.55 | ) | | | (0.35 | ) | | | (0.23 | ) | | | (1.49 | ) |
| | | | | | | | | | | | | | | | | | | |
| | 0.00 | (b) | | | 0.00 | (b) | | | 0.00 | (b) | | | 0.00 | (b) | | | 0.00 | (b) |
| | (1.55 | ) | | | (0.34 | ) | | | 2.09 | | | | 2.13 | | | | (2.80 | ) |
| $ | 19.50 | | | $ | 21.05 | | | $ | 21.39 | | | $ | 19.30 | | | $ | 17.17 | |
| | | | | | | | | | | | | | | | | | | |
| | (3.15 | %) | | | 6.80 | % | | | 12.72 | % | | | 13.85 | % | | | (6.49 | %) |
| | | | | | | | | | | | | | | | | | | |
| $ | 500,309 | | | $ | 1,284,556 | | | $ | 1,314,519 | | | $ | 1,284,669 | | | $ | 1,528,080 | |
| | | | | | | | | | | | | | | | | | | |
| | 1.09 | % | | | 1.08 | % | | | 1.08 | % | | | 1.07 | % | | | 1.08 | % |
| | 1.09 | % | | | 1.08 | % | | | 1.08 | % | | | 1.07 | % | | | 1.08 | % |
| | 0.12 | % | | | 0.38 | % | | | 0.46 | % | | | 1.01 | % | | | 1.10 | % |
| | | | | | | | | | | | | | | | | | | |
| | 80 | % | | | 73 | % | | | 50 | % | | | 49 | % | | | 85 | % |
See Accompanying Notes to Financial Statements.
| Annual Report | April 30, 2020 | 27 |
| Financial Highlights | Vulcan Value Partners Fund |
For a share outstanding throughout the years presented.
| Institutional Class | | For the Period May 1, 2019 (Inception) to April 30, 2020 | |
| NET ASSET VALUE, BEGINNING OF PERIOD | | $ | 21.02 | |
| INCOME/(LOSS) FROM OPERATIONS: | | | | |
| Net investment income(a) | | | 0.09 | |
| Net realized and unrealized loss on investments | | | (0.51 | ) |
| Total from investment operations | | | (0.42 | ) |
| | | | | |
| LESS DISTRIBUTIONS TO SHAREHOLDERS: | | | | |
| From net investment income | | | (0.03 | ) |
| From net realized gains on investments | | | (1.05 | ) |
| Total distributions | | | (1.08 | ) |
| | | | | |
| Redemption fees added to paid-in capital | | | 0.00 | (b) |
| Decrease in net asset value | | | (1.50 | ) |
| NET ASSET VALUE, END OF YEAR | | $ | 19.52 | |
| | | | | |
| Total return | | | (2.83 | %) |
| | | | | |
| RATIOS AND SUPPLEMENTAL DATA: | | | | |
| Net assets, end of year (000's) | | $ | 768,726 | |
| | | | | |
| Ratio of expenses to average net assets without fee waivers/reimbursements | | | 1.14 | % |
| Ratio of expenses to average net assets including fee waivers/reimbursements | | | 0.85 | % |
| Net investment income to average net assets including fee waivers/reimbursements | | | 0.40 | % |
| | | | | |
| Portfolio turnover rate | | | 80 | % |
| (a) | Per share numbers have been calculated using the average shares method. |
| (b) | Less than $0.005 per share. |
See Accompanying Notes to Financial Statements.
| 28 | www.vulcanvaluepartners.com |
Intentionally Left Blank
Financial Highlights
For a share outstanding throughout the years presented.
| Investor Class |
| NET ASSET VALUE, BEGINNING OF PERIOD |
| INCOME/(LOSS) FROM OPERATIONS: |
| Net investment income(a) |
| Net realized and unrealized gain/(loss) on investments |
| Total from investment operations |
| |
| LESS DISTRIBUTIONS TO SHAREHOLDERS: |
| From net investment income |
| From net realized gains on investments |
| Total distributions |
| |
| Redemption fees added to paid-in capital |
| Increase/(decrease) in net asset value |
| NET ASSET VALUE, END OF YEAR |
| |
| Total return |
| |
| RATIOS AND SUPPLEMENTAL DATA: |
| Net assets, end of year (000's) |
| |
| Ratio of expenses to average net assets without fee waivers/reimbursements |
| Ratio of expenses to average net assets including fee waivers/reimbursements |
| Net investment income to average net assets including fee waivers/reimbursements |
| |
| Portfolio turnover rate |
| (a) | Per share numbers have been calculated using the average shares method. |
| (b) | Less than $0.005 per share. |
See Accompanying Notes to Financial Statements.
| 30 | www.vulcanvaluepartners.com |
Vulcan Value Partners Small Cap Fund
| For the Year Ended | | | For the Year Ended | | | For the Year Ended | | | For the Year Ended | | | For the Year Ended | |
| April 30, 2020 | | | April 30, 2019 | | | April 30, 2018 | | | April 30, 2017 | | | April 30, 2016 | |
| $ | 17.31 | | | $ | 19.52 | | | $ | 20.16 | | | $ | 16.58 | | | $ | 18.61 | |
| | | | | | | | | | | | | | | | | | | |
| | 0.12 | | | | 0.10 | | | | 0.02 | | | | 0.03 | | | | 0.10 | |
| | (4.57 | ) | | | 0.38 | | | | 0.59 | | | | 3.61 | | | | (1.05 | ) |
| | (4.45 | ) | | | 0.48 | | | | 0.61 | | | | 3.64 | | | | (0.95 | ) |
| | | | | | | | | | | | | | | | | | | |
| | | | | | | | | | | | | | | | | | | |
| | (0.08 | ) | | | (0.12 | ) | | | (0.03 | ) | | | (0.06 | ) | | | (0.06 | ) |
| | (0.77 | ) | | | (2.57 | ) | | | (1.22 | ) | | | – | | | | (1.02 | ) |
| | (0.85 | ) | | | (2.69 | ) | | | (1.25 | ) | | | (0.06 | ) | | | (1.08 | ) |
| | | | | | | | | | | | | | | | | | | |
| | 0.00 | (b) | | | 0.00 | (b) | | | 0.00 | (b) | | | 0.00 | (b) | | | 0.00 | (b) |
| | (5.30 | ) | | | (2.21 | ) | | | (0.64 | ) | | | 3.58 | | | | (2.03 | ) |
| $ | 12.01 | | | $ | 17.31 | | | $ | 19.52 | | | $ | 20.16 | | | $ | 16.58 | |
| | | | | | | | | | | | | | | | | | | |
| | (27.28 | %) | | | 4.76 | % | | | 3.08 | % | | | 21.97 | % | | | (5.04 | %) |
| | | | | | | | | | | | | | | | | | | |
| $ | 153,249 | | | $ | 543,174 | | | $ | 1,196,558 | | | $ | 1,255,606 | | | $ | 1,147,007 | |
| | | | | | | | | | | | | | | | | | | |
| | 1.26 | % | | | 1.27 | % | | | 1.24 | % | | | 1.25 | % | | | 1.25 | % |
| | 1.25 | % | | | 1.25 | % | | | 1.24 | % | | | 1.25 | % | | | 1.25 | % |
| | 0.75 | % | | | 0.54 | % | | | 0.08 | % | | | 0.18 | % | | | 0.61 | % |
| | | | | | | | | | | | | | | | | | | |
| | 102 | % | | | 68 | % | | | 68 | % | | | 52 | % | | | 80 | % |
| Annual Report | April 30, 2020 | 31 |
| Financial Highlights | Vulcan Value Partners Small Cap Fund |
For a share outstanding throughout the years presented.
| Institutional Class | | For the Period May 1, 2019 (Inception) to April 30, 2020 | |
| NET ASSET VALUE, BEGINNING OF PERIOD | | $ | 17.18 | |
| INCOME/(LOSS) FROM OPERATIONS: | | | | |
| Net investment income(a) | | | 0.12 | |
| Net realized and unrealized loss on investments | | | (4.41 | ) |
| Total from investment operations | | | (4.29 | ) |
| | | | | |
| LESS DISTRIBUTIONS TO SHAREHOLDERS: | | | | |
| From net investment income | | | (0.09 | ) |
| From net realized gains on investments | | | (0.77 | ) |
| Total distributions | | | (0.86 | ) |
| | | | | |
| Redemption fees added to paid-in capital | | | 0.00 | (b) |
| Decrease in net asset value | | | (5.15 | ) |
| NET ASSET VALUE, END OF YEAR | | $ | 12.03 | |
| | | | | |
| Total return | | | (26.56 | %) |
| | | | | |
| RATIOS AND SUPPLEMENTAL DATA: | | | | |
| Net assets, end of year (000's) | | $ | 247,629 | |
| | | | | |
| Ratio of expenses to average net assets without fee waivers/reimbursements | | | 1.32 | % |
| Ratio of expenses to average net assets including fee waivers/reimbursements | | | 1.00 | % |
| Net investment income to average net assets including fee waivers/reimbursements | | | 0.76 | % |
| | | | | |
| Portfolio turnover rate | | | 102 | % |
| (a) | Per share numbers have been calculated using the average shares method. |
| (b) | Less than $0.005 per share. |
See Accompanying Notes to Financial Statements.
| 32 | www.vulcanvaluepartners.com |
Notes to Financial Statements
April 30, 2020
1. ORGANIZATION
Financial Investors Trust (the “Trust”) is organized as a Delaware statutory trust and is registered as an open-end management investment company under the Investment Company Act of 1940, as amended (“1940 Act”). The Trust consists of multiple separate portfolios or series. This annual report describes the Vulcan Value Partners Fund and Vulcan Value Partners Small Cap Fund (each a “Fund” and collectively, the “Funds”). The Funds seek to achieve long-term capital appreciation. The Funds offer Investor Class and Institutional Class shares.
2. SIGNIFICANT ACCOUNTING POLICIES
The accompanying financial statements were prepared in accordance with accounting principles generally accepted in the United States of America (“U.S. GAAP”), including policies specific to investment companies. The preparation of financial statements in conformity with U.S. GAAP requires management to make certain estimates and assumptions that affect the reported amounts of assets and liabilities and disclosures of contingent assets and liabilities at the date of the financial statements and the reported amounts of revenue and expenses during the period. Actual results could differ from those estimates. The Funds are considered an investment company for financial reporting purposes under U.S. GAAP and follows the accounting and reporting guidance applicable to investment companies in the Financial Accounting Standards Board Accounting Standards Codification Topic 946. The following is a summary of significant accounting policies consistently followed by the Funds in preparation of their financial statements.
Investment Valuation: The Funds generally value their securities based on market prices determined at the close of regular trading on the New York Stock Exchange (“NYSE”), normally 4:00 p.m. Eastern Time, on each day the NYSE is open for trading.
For equity securities and mutual funds that are traded on an exchange, the market price is usually the closing sale or official closing price on that exchange. In the case of equity securities not traded on an exchange, or if such closing prices are not otherwise available, the securities are valued at the mean of the most recent bid and ask prices on such day. Redeemable securities issued by open-end registered investment companies are valued at the investment company’s applicable net asset value, with the exception of exchange-traded open-end investment companies, which are priced as equity securities.
The market price for debt obligations is generally the quote supplied by an independent third-party pricing service approved by the Board of Trustees of the Trust (the “Board” or the “Trustees”), which may use a matrix, formula or other objective method that takes into consideration quotations from dealers, market transactions in comparable investments, market indices and yield curves. If vendors are unable to supply a quote, or if the quote supplied is deemed to be unreliable, the market price may be determined using quotations received from one or more broker–dealers that make a market in the security.
Equity securities that are primarily traded on foreign securities exchanges are valued at the preceding closing values of such securities on their respective exchanges, except when an occurrence subsequent to the time a value was so established is likely to have changed such value. In such an event, the fair values of those securities are determined in good faith through consideration of other factors in accordance with procedures established by and under the general supervision of the Board.
| Annual Report | April 30, 2020 | 33 |
Notes to Financial Statements
April 30, 2020
When such prices or quotations are not available, or when Vulcan Value Partners, LLC (the “Adviser”) believes that they are unreliable, securities may be priced using fair value procedures approved by the Board.
Fair Value Measurements: A three-tier hierarchy has been established to classify fair value measurements for disclosure purposes. Inputs refer broadly to the assumptions that market participants would use in pricing the asset or liability, including assumptions about risk. Inputs may be observable or unobservable. Observable inputs are inputs that reflect the assumptions market participants would use in pricing the asset or liability that are developed based on market data obtained from sources independent of the reporting entity. Unobservable inputs are inputs that reflect the reporting entity’s own assumptions about the assumptions market participants would use in pricing the asset or liability that are developed based on the best information available. Various inputs are used in determining the value of each Fund’s investments as of the reporting period end. The designated input levels are not necessarily an indication of the risk or liquidity associated with these investments. These inputs are categorized in the following hierarchy under applicable financial accounting standards:
| Level 1 – | Unadjusted quoted prices in active markets for identical investments, unrestricted assets or liabilities that the Funds have the ability to access at the measurement date; |
| Level 2 – | Quoted prices which are not active, quoted prices for similar assets or liabilities in active markets or inputs other than quoted prices that are observable (either directly or indirectly) for substantially the full term of the asset or liability; and |
| Level 3 – | Significant unobservable prices or inputs (including the Funds’ own assumptions in determining the fair value of investments) where there is little or no market activity for the asset or liability at the measurement date. |
The following is a summary of each input used to value each Fund’s investments as of April 30, 2020:
Vulcan Value Partners Fund:
| Investments in Securities at Value | | Level 1 - Unadjusted Quoted Prices | | | Level 2 - Other Significant Observable Inputs | | | Level 3 - Significant Unobservable Inputs | | | Total | |
| Common Stocks(a) | | $ | 1,249,109,576 | | | $ | – | | | $ | – | | | $ | 1,249,109,576 | |
| TOTAL | | $ | 1,249,109,576 | | | $ | – | | | $ | – | | | $ | 1,249,109,576 | |
Vulcan Value Partners Small Cap Fund:
| Investments in Securities at Value | | Level 1 - Unadjusted Quoted Prices | | | Level 2 - Other Significant Observable Inputs | | | Level 3 - Significant Unobservable Inputs | | | Total | |
| Common Stocks(a) | | $ | 380,856,657 | | | $ | – | | | $ | – | | | $ | 380,856,657 | |
| Short Term Investments | | | 12,254,706 | | | | – | | | | – | | | | 12,254,706 | |
| TOTAL | | $ | 393,111,363 | | | $ | – | | | $ | – | | | $ | 393,111,363 | |
| (a) | For detailed descriptions, see the accompanying Statements of Investments. |
For liabilities arising from overdrafts in the custody account, the carrying amount reported as cash due to custodian in the Statements of Assets and Liabilities approximates fair value due to the
| 34 | www.vulcanvaluepartners.com |
Notes to Financial Statements
April 30, 2020
relatively short-term maturity of these financial instruments. As of April 30, 2020, the liability related to custody overdrafts in the Vulcan Value Partners Fund are based on Level 2 inputs.
For the year ended April 30, 2020, the Funds did not have any securities that used significant unobservable inputs (Level 3) in determining fair value.
Investment Transactions and Investment Income: Investment transactions are accounted for on the date the investments are purchased or sold (trade date). Realized gains and losses from investment transactions are reported on an identified cost basis, which is the same basis the Funds use for federal income tax purposes. Interest income, which includes accretion of discounts and amortization of premiums, is accrued and recorded as earned. Dividend income is recognized on the ex-dividend date or, for certain foreign securities, as soon as information is available to the Funds. All of the realized and unrealized gains and losses and net investment income, are allocated daily to each class in proportion to its average daily net assets.
ReFlow Liquidity Program: Each Fund may participate in the ReFlow liquidity program, which is designed to provide an alternative liquidity source for mutual funds experiencing net redemptions of their shares. Pursuant to the program, ReFlow Fund, LLC (“ReFlow”) provides participating mutual funds with a source of cash to meet net shareholder redemptions by standing ready each business day to purchase fund shares up to the value of the net shares redeemed by other shareholders that are to settle the next business day. ReFlow will purchase shares of the Fund at net asset value and will not be subject to any investment minimums. Following purchases of Fund shares, ReFlow then generally redeems those shares when the Fund experiences net subscriptions, at the end of a maximum holding period determined by ReFlow (currently 28 days), or at other times as the Fund may request. ReFlow may choose to redeem its position in the Fund with an in-kind transfer of securities, instead of cash, enabling the Fund to avoid a realization of capital gains on the securities it transfers. ReFlow will not be subject to any short-term redemption fees. While ReFlow holds Fund shares, it will have the same rights and privileges with respect to those shares as any other shareholder. For use of the ReFlow service, a Fund pays a fee to ReFlow each time it purchases Fund shares, calculated by applying to the purchase amount a fee rate determined through an automated daily auction among participating mutual funds. The current minimum fee rate is 0.20% of the value of the Fund shares purchased by ReFlow although the Fund may submit a bid at a higher fee rate if it determines that doing so is in the best interest of Fund shareholders. In accordance with federal securities laws, ReFlow is prohibited from acquiring more than 3% of the outstanding voting securities of a Fund. There is no assurance that ReFlow will have sufficient funds available to meet the Funds’ liquidity needs on a particular day. During the year ended April 30, 2020, the Funds participated in ReFlow. Fees associated with ReFlow are disclosed in the Statements of Operations.
Real Estate Investment Trusts (“REITs”): The Funds may invest a portion of their assets in REITs and are subject to certain risks associated with direct investment in REITs. REITs may be affected by changes in the value of their underlying properties and by defaults by borrowers or tenants. REITs depend generally on their ability to generate cash flow to make distributions to shareowners, and certain REITs have self-liquidation provisions by which mortgages held may be paid in full and distributions of capital returns may be made at any time. In addition, the performance of a REIT may be affected by its failure to qualify for tax-free pass-through of income under the Internal Revenue Code of 1986, as amended (the “Code”), or its failure to maintain exemption from registration under the 1940 Act. A Fund’s investments in REITs may result in such
| Annual Report | April 30, 2020 | 35 |
Notes to Financial Statements
April 30, 2020
Fund’s receipt of cash in excess of the REITs’ earnings. If the Fund receives such distributions all or a portion of these distributions will constitute a return of capital to such Fund. Receiving a return of capital distribution from REITs will reduce the amount of income available to be distributed to Fund shareholders. Income from REITs generally will not be eligible for treatment as qualified dividend income. As the final character of the distributions is not known until reported by the REITs on their 1099s, the Funds utilize an average of the prior year’s reallocation information as an estimate for the current year character of distributions.
Foreign Securities: The Funds may directly purchase securities of foreign issuers. Investing in securities of foreign issuers involves special risks not typically associated with investing in securities of U.S. issuers. The risks include possible reevaluation of currencies, the inability to repatriate foreign currency, less complete financial information about companies and possible future adverse political and economic developments. Moreover, securities of many foreign issuers and their markets may be less liquid and their prices more volatile than those of securities of comparable U.S. issuers.
Foreign Currency Translation: The books and records of the Funds are maintained in U.S. dollars. Investment valuations and other assets and liabilities initially expressed in foreign currencies are converted each business day into U.S. dollars based upon current exchange rates. Prevailing foreign exchange rates may generally be obtained at the close of the NYSE (normally, 4:00 p.m. Eastern Time). The portion of realized and unrealized gains or losses on investments due to fluctuations in foreign currency exchange rates is not separately disclosed and is included in realized and unrealized gains or losses on investments, when applicable.
In-Kind Redemptions: During the year ended April 30, 2020, the Vulcan Value Partners Fund and the Vulcan Value Partners Small Cap Fund distributed portfolio securities rather than cash as payment for certain redemptions of fund shares (in-kind redemptions) in the amount of $51,123,962 and $8,185,727, respectively. For financial reporting purposes, the Vulcan Value Partners Fund and the Vulcan Value Partners Small Cap Fund recognized gains on the in-kind redemptions in the amount of $25,388,367 and $3,997,776, respectively. For tax purposes, the gains are not recognized.
Trust Expenses: Some expenses of the Trust can be directly attributed to the Funds. Expenses which cannot be directly attributed are apportioned among all funds in the Trust based on average net assets of each fund.
Fund Expenses: Expenses that are specific to a Fund are charged directly to that Fund.
Federal Income Taxes: Each Fund complies with the requirements under Subchapter M of the Internal Revenue Code of 1986, as amended, applicable to regulated investment companies and intends to distribute substantially all of its net taxable income and net capital gains, if any, each year so that it will not be subject to excise tax on undistributed income and gains. The Funds are not subject to income taxes to the extent such distributions are made.
As of and during the year ended April 30, 2020, the Funds did not have a liability for any unrecognized tax benefits. The Funds file U.S. federal, state, and local tax returns as required. The Fund’s tax returns are subject to examination by the relevant tax authorities until expiration of the
| 36 | www.vulcanvaluepartners.com |
Notes to Financial Statements
April 30, 2020
applicable statute of limitations, which is generally three years after the filing of the tax return for federal purposes and four years for most state returns. Tax returns for open years have incorporated no uncertain tax positions that require a provision for income taxes.
Distributions to Shareholders: Each Fund normally pays dividends and distributes capital gains, if any, on an annual basis. Income dividend distributions are derived from dividends and other income each Fund receives from its investments, including short-term capital gains. Long term capital gain distributions are derived from gains realized when each Fund sells a security it has owned for more than a year. Each Fund may make additional distributions and dividends at other times if the portfolio manager believes doing so may be necessary for each Fund to avoid or reduce taxes.
Epidemic and Pandemic Risk: Certain countries have been susceptible to epidemics, most recently COVID-19, which has been designated as a pandemic by world health authorities. The outbreak of such epidemics, together with any resulting restrictions on travel or quarantines imposed, could have a negative impact on the economy and business activity globally (including in the countries in which we invest), and thereby could adversely affect the performance of our investments. Furthermore, the rapid development of epidemics could preclude prediction as to their ultimate adverse impact on economic and market conditions, and, as a result, present material uncertainty and risk with respect to us and the performance of our investments.
3. TAX BASIS INFORMATION
Reclassifications: As of April 30, 2020 permanent differences in book and tax accounting were reclassified. These differences had no effect on net assets and were primarily attributed to in-kind redemptions. The reclassifications were as follows:
| Fund | | Paid-in Capital | | | Distributable earnings | |
| Vulcan Value Partners Fund | | $ | 25,593,877 | | | $ | (25,593,877 | ) |
| Vulcan Value Partners Small Cap Fund | | | 3,997,776 | | | | (3,997,776 | ) |
Tax Basis of Investments: As of April 30, 2020, the aggregate cost of investments, gross unrealized appreciation/(depreciation) and net unrealized appreciation for federal tax purposes was as follows:
| | | Vulcan Value Partners Fund | | | Vulcan Value Partners Small Cap Fund | |
Gross appreciation (excess of value over tax cost) | | $ | 244,439,514 | | | $ | 24,804,653 | |
Gross depreciation (excess of tax cost over value) | | | (130,487,287 | ) | | | (78,412,907 | ) |
| Net depreciation of foreign currency | | | 74,717 | | | | (12,750 | ) |
| Net unrealized appreciation | | $ | 114,026,944 | | | $ | (53,621,004 | ) |
| Cost of investments for income tax purposes | | $ | 1,135,157,349 | | | $ | 446,719,617 | |
| Annual Report | April 30, 2020 | 37 |
Notes to Financial Statements
April 30, 2020
Components of Earnings: As of April 30, 2020, components of distributable earnings were as follows:
| | | Vulcan Value Partners Fund | | | Vulcan Value Partners Small Cap Fund | |
| Undistributed ordinary income | | $ | 1,593,066 | | | $ | 1,036,239 | |
| Accumulated capital losses | | | (5,585,573 | ) | | | (40,074,625 | ) |
| Net unrealized appreciation/(depreciation) on investments | | | 114,026,944 | | | | (53,621,004 | ) |
| Total | | $ | 110,034,437 | | | $ | (92,659,390 | ) |
Capital Losses: The Funds elect to defer to the year ended April 30, 2021, capital losses recognized during the period November 1, 2019 to April 30, 2020 in the amount of:
| | | Capital Losses Recognized | |
| Vulcan Value Partners Fund | | $ | 5,585,573 | |
| Vulcan Value Partners Small Cap Fund | | | 40,074,625 | |
Tax Basis of Distributions to Shareholders: The character of distributions made during the year from net investment income or net realized gains may differ from its ultimate characterization for federal income tax purposes. Also, due to the timing of dividend distributions, the fiscal year in which amounts are distributed may differ from the fiscal year in which the income or realized gain were recorded by each Fund.
The tax character of distributions paid by the Funds for the fiscal year ended April 30, 2020 were as follows:
| | | Ordinary Income | | | Long-Term Capital Gain | |
| 2020 | | | | | | | | |
| Vulcan Value Partners Fund | | $ | 27,684,241 | | | $ | 38,649,839 | |
| Vulcan Value Partners Small Cap Fund | | | 9,335,803 | | | | 14,520,351 | |
The tax character of distributions paid by the Funds for the fiscal year ended April 30, 2019 were as follows:
| | | Ordinary Income | | | Long-Term Capital Gain | |
| 2019 | | | | | | | | |
| Vulcan Value Partners Fund | | $ | 56,597,050 | | | $ | 42,069,450 | |
| Vulcan Value Partners Small Cap Fund | | | 10,950,971 | | | | 80,888,454 | |
| 38 | www.vulcanvaluepartners.com |
Notes to Financial Statements
April 30, 2020
4. SECURITIES TRANSACTIONS
The cost of purchases and proceeds from sales of securities (excluding short-term securities and in-kind redemptions) during the year ended April 30, 2020 were as follows:
| Fund | | Purchases of Securities | | | Proceeds From Sales of Securities | |
| Vulcan Value Partners Fund | | $ | 1,120,073,549 | | | $ | 1,051,183,076 | |
| Vulcan Value Partners Small Cap Fund | | | 470,986,025 | | | | 466,474,267 | |
5. SHARES OF BENEFICIAL INTEREST
The capitalization of the Trust consists of an unlimited number of shares of beneficial interest with no par value per share. Holders of the shares of the Funds of the Trust have one vote for each share held and a proportionate fraction of a vote for each fractional share. All shares issued and outstanding are fully paid and are transferable and redeemable at the option of the shareholder. Purchasers of the shares do not have any obligation to make payments to the Trust or its creditors solely by reason of the purchasers’ ownership of the shares. Shares have no pre-emptive rights.
Shares redeemed within 90 days of purchase may incur a 2% short-term redemption fee deducted from the redemption amount. The Vulcan Value Partners Fund and the Vulcan Value Partners Small Cap Fund retained $64,738 and $53,717, respectively, for the year ended April 30, 2020, and $16,120 and $22,728, respectively, for the year ended April 30, 2019, which is reflected in the “Cost of shares redeemed, net of redemption fees” in the Statements of Changes in Net Assets.
Transactions in shares of capital stock for the dates listed below were as follows:
Vulcan Value Partners Fund
| | | For the Year Ended April 30, 2020 | | | For the Year Ended April 30, 2019 | |
| Shares Sold | | | | | | | | |
| Investor Class | | | 8,592,593 | | | | 12,191,768 | |
| Institutional Class | | | 45,052,843 | | | | – | |
| Shares Issued in Reinvestment of Dividends | | | | | | | | |
| Investor Class | | | 1,225,786 | | | | 4,689,102 | |
| Institutional Class | | | 1,358,666 | | | | – | |
| Less Shares Redeemed | | | | | | | | |
| Investor Class | | | (45,177,914 | ) | | | (17,310,102 | ) |
| Institutional Class | | | (7,032,973 | ) | | | – | |
| Net Increase/(Decrease) | | | 4,019,001 | | | | (429,232 | ) |
| Annual Report | April 30, 2020 | 39 |
Notes to Financial Statements
April 30, 2020
Vulcan Value Partners Small Cap Fund
| | | For the Year Ended April 30, 2020 | | | For the Year Ended April 30, 2019 | |
| Shares Sold | | | | | | | | |
| Investor Class | | | 3,210,869 | | | | 9,339,047 | |
| Institutional Class | | | 25,839,809 | | | | – | |
| Shares Issued in Reinvestment of Dividends | | | | | | | | |
| Investor Class | | | 550,493 | | | | 5,297,515 | |
| Institutional Class | | | 673,056 | | | | – | |
| Less Shares Redeemed | | | | | | | | |
| Investor Class | | | (22,380,086 | ) | | | (44,554,915 | ) |
| Institutional Class | | | (5,931,759 | ) | | | – | |
| Net Increase/(Decrease) | | | 1,962,382 | | | | (29,918,353 | ) |
6. MANAGEMENT AND RELATED-PARTY TRANSACTIONS
The Adviser, subject to the authority of the Board, is responsible for the overall management and administration of the Funds’ business affairs. The Adviser manages the investments of the Funds in accordance with each Fund’s investment objective, policies and limitations and investment guidelines established jointly by the Adviser and the Board. Pursuant to the Investment Advisory Agreement (the “Advisory Agreement”), the Funds pay the Adviser an annual management fee of 1.00% and 1.15% for Vulcan Value Partners Fund and Vulcan Value Partners Small Cap Fund, respectively, based on each Fund’s average daily net assets. The management fee is paid on a monthly basis.
The Adviser has contractually agreed to limit the Vulcan Value Partners Fund’s total annual fund operating expenses (exclusive of Acquired Fund Fees and Expenses, brokerage expenses, interest expense, taxes and extraordinary expenses) to 1.25% and 0.85% of the Fund’s average daily net assets with respect to Investor Class shares and Institutional Class shares, respectively.
The Adviser has contractually agreed to limit the Vulcan Value Partners Small Cap Fund’s total annual fund operating expenses (exclusive of Acquired Fund Fees and Expenses, brokerage expenses, interest expense, taxes and extraordinary expenses) to 1.25% and 1.00% of the Fund’s average daily net assets with respect to Investor Class shares and Institutional Class shares, respectively.
These agreements (the “Expense Agreements”) are in effect from September 1, 2019 through August 31, 2020. The prior Expense Agreements were in effect from September 1, 2018 through August 31, 2019. The Adviser will be permitted to recover, on a class-by-class basis, expenses it has borne through the Expense Agreements to the extent that a Fund’s expenses in later periods fall below the expense cap in effect at the time of waiver or reimbursement. Notwithstanding the foregoing, the Funds will not be obligated to pay any such fees and expenses more than three years after the date of the waiver or reimbursement. The Adviser may not discontinue or modify this waiver prior to August 31, 2020 without the approval by the Funds’ Board.
| 40 | www.vulcanvaluepartners.com |
Notes to Financial Statements
April 30, 2020
For the year ended April 30, 2020, the fee waivers and/or reimbursements and recoupment amounts were as follows:
| Fund | | Fees Waived/Reimbursed By Adviser | | | Recoupment of Previously Waived Fees by Adviser | |
| Vulcan Value Partners Fund | | | | | | | | |
| Investor | | $ | – | | | $ | – | |
| Institutional | | | (1,571,670 | ) | | | – | |
| Vulcan Value Partners Small Cap Fund | | | | | | | | |
| Investor | | | (43,468 | ) | | | 4,227 | |
| Institutional | | | (594,605 | ) | | | – | |
As of April 30, 2020, the balances of recoupable expenses for each Fund were as follows:
| Fund | | Expires 2021 | | | Expires 2022 | | | Expires 2023 | | | Total | |
| Vulcan Value Partners Fund | | | | | | | | | | | | | | | | |
| Investor | | $ | – | | | $ | – | | | $ | – | | | $ | – | |
| Institutional | | | – | | | | – | | | | 1,571,670 | | | | 1,571,670 | |
| Vulcan Value Partners Small Cap Fund | | | | | | | | | | | | | | | | |
| Investor | | | – | | | | 83,103 | | | | 43,468 | | | | 126,571 | |
| Institutional | | | – | | | | – | | | | 594,605 | | | | 594,605 | |
Fund Administrator Fees and Expenses: ALPS Fund Services, Inc. (“ALPS”) serves as administrator to the Funds and the Funds have agreed to pay expenses incurred in connection with their administrative activities. Pursuant to an Administration Agreement, ALPS provides operational services to the Funds including, but not limited to fund accounting and fund administration and generally assist in each Fund’s operations. Officers of the Trust are employees of ALPS. The Funds’ administration fee is accrued on a daily basis and paid monthly. Administration fees paid by the Funds for the year ended April 30, 2020 are disclosed in the Statements of Operations.
ALPS is reimbursed by the Funds for certain out-of-pocket expenses.
Transfer Agent: ALPS serves as transfer, dividend paying and shareholder servicing agent for the Funds. ALPS receives an annual minimum fee, a fee based upon the number of shareholder accounts, and is also reimbursed by the Funds for certain out-of-pocket expenses. Transfer agent fees paid by the Funds for the year ended April 30, 2020 are disclosed in the Statements of Operations.
Compliance Services: ALPS provides services that assist the Trust’s chief compliance officer in monitoring and testing the policies and procedures of the Trust in conjunction with requirements under Rule 38a-1 under the 1940 Act and receives an annual base fee. ALPS is reimbursed for certain out-of-pocket expenses by the Funds. Vulcan pays this fee on behalf of the Funds.
Principal Financial Officer: ALPS receives an annual fee for providing principal financial officer services to the Funds. Principal financial officer fees paid by the Fund for the year ended April 30, 2020 are disclosed in the Statements of Operations.
| Annual Report | April 30, 2020 | 41 |
Notes to Financial Statements
April 30, 2020
Distributor: ALPS Distributors, Inc. (“ADI” or the “Distributor”) (an affiliate of ALPS) acts as the distributor of each Fund’s shares pursuant to a Distribution Agreement with the Trust. Shares are sold on a continuous basis by ADI as agent for the Funds, and ADI has agreed to use its best efforts to solicit orders for the sale of each Fund’s shares, although it is not obliged to sell any particular amount of shares. ADI is not entitled to any compensation for its services as Distributor. ADI is registered as a broker-dealer with the U.S. Securities and Exchange Commission. Certain intermediaries may charge networking, omnibus account or other administrative fees with respect to transactions in shares of the Funds. Transactions may be processed through the National Securities Clearing Corporation (“NSCC”) or similar systems or processed on a manual basis. These fees are paid by the Funds to the Distributor, which uses such fees to reimburse intermediaries. In the event an intermediary receiving payments from the Distributor on behalf of the Funds converts from a networking structure to an omnibus account structure or otherwise experiences increased costs, fees borne by the Funds may increase. Fees are disclosed on the Statements of Operations as “Delegated transfer agent equivalent services fees”.
Trustees: The fees and expenses of the Trustees of the Board are presented in the Statements of Operations.
7. INDEMNIFICATIONS
Under the Trust’s organizational documents, its Officers and Trustees are indemnified against certain liability arising out of the performance of their duties to the Trust. Additionally, in the normal course of business, the Trust enters into contracts with service providers that may contain general indemnification clauses which may permit indemnification to the extent permissible under applicable law. The Trust’s maximum exposure under these arrangements is unknown, as this would involve future claims that may be made against the Trust that have not yet occurred.
8. SUBSEQUENT EVENT
Subsequent events after the date of the Statements of Assets and Liabilities have been evaluated through the date the financial statements were issued.
Effective May 14, 2020, the Funds will no longer impose a redemption fee.
| 42 | www.vulcanvaluepartners.com |
Report of Independent Registered Public Accounting Firm
To the shareholders and the Board of Trustees of Financial Investors Trust
Opinion on the Financial Statements and Financial Highlights
We have audited the accompanying statements of assets and liabilities, including the statements of investments, of Vulcan Value Partners Fund and Vulcan Value Partners Small Cap Fund (the "Funds"), two of the funds constituting the Financial Investors Trust, as of April 30, 2020, the related statements of operations for the year then ended, the statements of changes in net assets for each of the two years in the period then ended, the financial highlights for each of the five years in the period then ended, and the related notes. In our opinion, the financial statements and financial highlights present fairly, in all material respects, the financial position of Vulcan Value Partners Fund and Vulcan Value Partners Small Cap Fund of Financials Investors Trust as of April 30, 2020, and the results of their operations for the year then ended, the changes in their net assets for each of the two years in the period then ended, and the financial highlights for each of the five years in the period then ended in conformity with accounting principles generally accepted in the United States of America.
Basis for Opinion
These financial statements and financial highlights are the responsibility of the Funds’ management. Our responsibility is to express an opinion on the Funds’ financial statements and financial highlights based on our audits. We are a public accounting firm registered with the Public Company Accounting Oversight Board (United States) (PCAOB) and are required to be independent with respect to the Funds in accordance with the U.S. federal securities laws and the applicable rules and regulations of the Securities and Exchange Commission and the PCAOB.
We conducted our audits in accordance with the standards of the PCAOB. Those standards require that we plan and perform the audit to obtain reasonable assurance about whether the financial statements and financial highlights are free of material misstatement, whether due to error or fraud. The Funds are not required to have, nor were we engaged to perform, an audit of their internal control over financial reporting. As part of our audits we are required to obtain an understanding of internal control over financial reporting but not for the purpose of expressing an opinion on the effectiveness of the Funds’ internal control over financial reporting. Accordingly, we express no such opinion.
Our audits included performing procedures to assess the risks of material misstatement of the financial statements and financial highlights, whether due to error or fraud, and performing procedures that respond to those risks. Such procedures included examining, on a test basis, evidence regarding the amounts and disclosures in the financial statements and financial highlights. Our audits also included evaluating the accounting principles used and significant estimates made by management, as well as evaluating the overall presentation of the financial statements and financial highlights. Our procedures included confirmation of securities owned as of April 30, 2020, by correspondence with the custodian and brokers; when replies were not received from brokers, we performed other auditing procedures. We believe that our audits provide a reasonable basis for our opinion.
DELOITTE & TOUCHE LLP
Denver, Colorado
June 29, 2020
We have served as the auditor of one or more investment companies advised by Vulcan Value Partners, LLC since 2010.
| Annual Report | April 30, 2020 | 43 |
Additional Information
April 30, 2020 (Unaudited)
1. FUND HOLDINGS
The Funds file its complete schedule of portfolio holdings with the Commission for the first and third quarters of each fiscal year as an exhibit to its reports on Form N-PORT. The Funds’ Form N-PORT reports are available on the Commission’s Web site at http://www.sec.gov. The Funds’ Form N-PORT is also available upon request by calling (toll-free) (866) 759-5679.
2. FUND PROXY VOTING POLICIES, PROCEDURES AND SUMMARIES
The Funds’ policies and procedures used in determining how to vote proxies and information regarding how the Fund voted proxies relating to portfolio securities during the most recent prior
12-month period ending June 30 are available without charge, (1) upon request, by calling (toll-free) (866)-759-5679 and (2) on the SEC’s website at http://www.sec.gov.
3. TAX DESIGNATIONS
The Funds designate the following for federal income tax purposes for the calendar year ended December 31, 2019:
| | | Qualified Dividend Income | | | Dividend Received Deduction | |
| Vulcan Value Partners Fund | | | 56.14% | | | | 45.80% | |
| Vulcan Value Partners Small Cap Fund | | | 75.86% | | | | 23.76% | |
In early 2020, if applicable, shareholders of record received this information for the distributions paid to them by the Funds during the calendar year 2019 via Form 1099. The Funds will notify shareholders in early 2021 of amounts paid to them by the Funds, if any, during the calendar year 2020.
Pursuant to Section 852(b)(3) of the Internal Revenue Code, the Vulcan Value Partners Fund and the Vulcan Value Partners Small Cap Fund designated $38,649,839 and $14,520,601, respectively as long-term capital gain dividends.
| 44 | www.vulcanvaluepartners.com |
Disclosure Regarding Approval of Fund Advisory Agreements
April 30, 2020 (Unaudited)
Vulcan Funds
On December 10, 2019, the Trustees met in person to discuss, among other things, the renewal of the Investment Advisory Agreement between Vulcan Value Partners, LLC (“Vulcan”) and the Trust, with respect to the Vulcan Value Partners Fund and the Vulcan Value Partners Small Cap Fund (together, the “Vulcan Funds”), in accordance with Section 15(c) of the 1940 Act. In renewing and approving the Investment Advisory Agreement with Vulcan, the Trustees, including the Independent Trustees, considered the following factors with respect to the Vulcan Funds:
Investment Advisory Fee Rate: The Trustees reviewed and considered the contractual annual advisory fee paid by the Trust, on behalf of the Vulcan Funds, to Vulcan of 1.00% of the Vulcan Value Partners Fund’s daily average net assets and 1.15% of the Vulcan Value Partners Small Cap Fund’s daily average net assets, in light of the extent and quality of the advisory services provided by Vulcan to the Vulcan Funds.
The Board received and considered information including a comparison of each Vulcan Fund’s contractual and gross advisory fees and overall expenses with those of funds in the peer group and universe of funds provided by an independent provider of investment company data (the “Data Provider”). The Trustees noted that the contractual and gross advisory fee rates of each of the Vulcan Funds were in the highest quartile with respect to its respective Data Provider peer group and universe medians.
Total Expense Ratios: The Trustees further reviewed and considered the total net expense ratio of 1.08% for Investor Class and 0.85% for Institutional Class of the Vulcan Value Partners Fund and 1.25% for the Investor Class and 1.01% of the Institutional Class of the Vulcan Value Partners Small Cap Fund. The Trustees noted that the total net expense ratio of the Investor share class of the Vulcan Value Partners Fund was in the highest quartile with respect to its Data Provider peer group and universe medians, the Institutional Class of the Vulcan Value Partners Fund was slightly above its Data Provider peer group and universe medians, and each share class of the Vulcan Value Small Cap Fund was slightly above its respective Data Provider peer group and universe medians.
Nature, Extent, and Quality of the Services under the Investment Advisory Agreement: The Trustees received and considered information regarding the nature, extent, and quality of services to be provided to the Vulcan Funds under the Investment Advisory Agreement. The Trustees reviewed certain background materials supplied by Vulcan in its presentation, including its Form ADV.
The Trustees reviewed and considered Vulcan’s investment advisory personnel, its history as an asset manager, and its performance and the amount of assets currently under management by Vulcan. The Trustees also reviewed the research and decision-making processes utilized by Vulcan, including the methods adopted to seek to achieve compliance with the investment objectives, policies, and restrictions of the Vulcan Funds.
The Trustees considered the background and experience of Vulcan’s management in connection with the Vulcan Funds, including reviewing the qualifications, backgrounds, and responsibilities of the management team primarily responsible for the day-to-day portfolio management of the Vulcan Funds and the extent of the resources devoted to research and analysis of actual and potential investments.
| Annual Report | April 30, 2020 | 45 |
Disclosure Regarding Approval of Fund Advisory Agreements
April 30, 2020 (Unaudited)
The Trustees also reviewed, among other things, Vulcan’s insider trading policies and procedures and its Code of Ethics.
Performance: The Trustees reviewed performance information for each of the Vulcan Funds for the 3-month, 1-year, 3-year, 5-year, and since inception periods ended September 30, 2019, as applicable. That review included a comparison of each Fund’s performance to the performance universe median of a group of funds selected by the Data Provider. The Trustees noted that the performance of each class of each of the Vulcan Funds was above its respective Data Provider universe median performance for the 3-month, 1-year, 3-year, 5-year, and since inception periods ended September 30, 2019, as applicable. The Trustees also considered Vulcan’s discussion of each Fund’s top contributors and top detractors, as well as Vulcan’s performance and reputation generally.
Comparable Accounts: The Trustees noted certain information provided by Vulcan regarding fees charged to its other clients utilizing a strategy similar to that employed by a Vulcan Fund.
Profitability: The Trustees received and considered a retrospective and projected profitability analysis prepared by Vulcan based on the fees payable under the Investment Advisory Agreement with respect to each Vulcan Fund. The Trustees considered the profits, if any, anticipated to be realized by Vulcan in connection with the operation of each Vulcan Fund. The Board then reviewed Vulcan’s audited financial statements for the years ended December 31, 2018 and 2017, provided supplementally, in order to analyze the financial condition and stability and profitability of Vulcan.
Economies of Scale: The Trustees considered whether economies of scale in the provision of services to the Vulcan Funds will be passed along to the shareholders under the Investment Advisory Agreement.
Other Benefits to the Adviser: The Trustees reviewed and considered any other incidental benefits derived or to be derived by Vulcan from its relationship with the Vulcan Funds, including whether soft dollar arrangements were used.
In renewing Vulcan as the investment adviser to the Vulcan Funds and renewing the Investment Advisory Agreement and the fees charged under the Investment Advisory Agreement, the Trustees concluded that no single factor reviewed by the Trustees was identified by the Trustees to be determinative as the principal factor in whether to renew the Investment Advisory Agreement. Further, the Independent Trustees were advised by separate independent legal counsel throughout the process. The Trustees, including all of the Independent Trustees, concluded that:
| ● | the contractual and gross advisory fee rates for each of the Vulcan Funds were in the highest quartile with respect to its respective Data Provider peer group and universe medians; |
| ● | the total net expense ratio of the Investor share class of the Vulcan Value Partners Fund was in the highest quartile with respect to its Data Provider peer group and universe medians, the Institutional Class of the Vulcan Value Partners Fund was slightly above its Data Provider peer group and universe medians and each share class of the Vulcan Value Small Cap Fund was slightly above its respective Data Provider peer group and universe medians; |
| 46 | www.vulcanvaluepartners.com |
Disclosure Regarding Approval of Fund Advisory Agreements
April 30, 2020 (Unaudited)
| ● | the nature, extent, and quality of services rendered by Vulcan under the Investment Advisory Agreement with respect to the Vulcan Funds were adequate; |
| ● | the performance of each share class of each of the Vulcan Funds was above its respective Data Provider universe median for the 3-month, 1-year, 3-year, 5-year, and since inception periods ended September 30, 2019, as applicable; |
| ● | bearing in mind the limitations of comparing different types of managed accounts and the different levels of service typically associated with such accounts, the fee structures applicable to Vulcan’s other clients employing a comparable strategy to one or more of the Vulcan Funds were not indicative of any unreasonableness with respect to the advisory fees proposed to be payable by the Vulcan Funds; |
| ● | the profit realized by Vulcan in connection with the operation of each Vulcan Fund is not unreasonable; and |
| ● | there were no material economies of scale or other incidental benefits accruing to Vulcan in connection with its relationship with the Vulcan Funds. |
Based on the Trustees’ deliberations and their evaluation of the information described above, the Trustees, including all of the Independent Trustees, concluded that Vulcan’s compensation for investment advisory services is consistent with the best interests of each Vulcan Fund and their shareholders.
| Annual Report | April 30, 2020 | 47 |
Liquidity Risk Management Program
April 30, 2020 (Unaudited)
The Financial Investors Trust (the “Trust”) has established a liquidity risk management program (the “Program”) to govern the Trust’s approach to managing liquidity risk for each fund in the series (each a “Fund”). The Program is overseen by the Liquidity Committee (the “Committee”), a committee comprised of representatives of the Trust’s investment advisers, sub-advisers, and Officers of the Trust. The Trust’s Board of Trustees (the “Board”) has approved the designation of the Committee to oversee the Program.
The Program’s principal objectives include supporting each Fund’s compliance with limits on investments in illiquid assets and mitigating the risk that a Fund will be unable to meet its redemption obligations in a timely manner. The Program also includes a number of elements that support the management and assessment of liquidity risk, including a periodic assessment of factors that influence a Fund’s liquidity and the periodic classification and re-classification of the Fund’s investments into groupings that reflect the Committee’s assessment of their relative liquidity under current market conditions.
At a meeting of the Board held on March 10, 2020, the Trustees received a report from the Committee regarding the design and operational effectiveness of the Program since its implementation on December 1, 2018. The Committee determined, and reported to the Board, that the Program is reasonably designed to assess and manage each Fund’s liquidity risk and has operated adequately and effectively to manage each Fund’s liquidity risk since implementation.
The Committee reported that during the period covered by the report, there were no liquidity events that impacted the Funds or their ability to timely meet redemptions without dilution to existing shareholders. Among other things, the Board noted that the Funds are not required to have a highly liquid investment minimum based on their liquidity classifications. The Board further noted that no material changes have been made to the Program since its implementation.
| 48 | www.vulcanvaluepartners.com |
Trustees and Officers
April 30, 2020 (Unaudited)
Additional information regarding the Fund’s trustees is included in the Statement of Additional Information, which can be obtained without charge by calling 877-421-5078.
INDEPENDENT TRUSTEES
| Name, Address* & Year of Birth | Position(s) Held with Fund | Term of Office** and Length of Time Served | Principal Occupation(s) During Past 5 Years*** | Number of Funds in Fund Complex Overseen by Trustee**** | Other Directorships Held by Trustee During Past 5 Years*** |
| Mary K. Anstine, 1940 | Trustee and Chairman | Ms. Anstine was elected at a special meeting of shareholders held on March 21, 1997 and re-elected at a special meeting of shareholders held on August 7, 2009. Ms. Anstine was appointed Chairman of the Board at the June 6, 2017 meeting of the Board of Trustees. | Ms. Anstine was formerly an Executive Vice President of First Interstate Bank of Denver until 1994, President/Chief Executive Officer of HealthONE Alliance, Denver, Colorado, from 1994 to 2004, and has been retired since 2004. Ms. Anstine is also Trustee/Director of AV Hunter Trust and Colorado Uplift Board. Ms. Anstine was formerly a Director of the Trust Bank of Colorado (later purchased and now known as Northern Trust Bank), HealthONE and Denver Area Council of the Boy Scouts of America, and a member of the American Bankers Association Trust Executive Committee. | 31 | Ms. Anstine is a Trustee of ALPS ETF Trust (16 funds); ALPS Variable Investment Trust (7 funds); Reaves Utility Income Fund (1 fund); and Segall Bryant & Hamill Trust (16 funds). |
| Jeremy W. Deems, 1976 | Trustee | Mr. Deems was appointed as a Trustee at the March 11, 2008 meeting of the Board of Trustees and elected at a special meeting of shareholders held on August 7, 2009. | Mr. Deems is the Co-Founder, Chief Operations Officer and Chief Financial Officer of Green Alpha Advisors, LLC, a registered investment advisor, and Co-Portfolio Manager of the Shelton Green Alpha Fund. Prior to joining Green Alpha Advisors, Mr. Deems was CFO and Treasurer of Forward Management, LLC, ReFlow Management Co., LLC, ReFlow Fund, LLC, a private investment fund, and Sutton Place Management, LLC, an administrative services company, from 1998 to June 2007. From 2004 to 2005, Mr. Deems also served as Treasurer of the Forward Funds and the Sierra Club Funds. | 31 | Mr. Deems is a Trustee of ALPS ETF Trust (16 funds); ALPS Variable Investment Trust (7 funds); Clough Funds Trust (1 fund); and Reaves Utility Income Fund (1 fund). |
| Annual Report | April 30, 2020 | 49 |
Trustees and Officers
April 30, 2020 (Unaudited)
INDEPENDENT TRUSTEES (continued)
| Name, Address* & Year of Birth | Position(s) Held with Fund | Term of Office** and Length of Time Served | Principal Occupation(s) During Past 5 Years*** | Number of Funds in Fund Complex Overseen by Trustee**** | Other Directorships Held by Trustee During Past 5 Years*** |
| Jerry G. Rutledge, 1944 | Trustee | Mr. Rutledge was elected at a special meeting of shareholders held on August 7, 2009. | Mr. Rutledge is the President and owner of Rutledge’s Inc., a retail clothing business. Mr. Rutledge is currently Director of the American National Bank. He was from 1994 to 2007 a Regent of the University of Colorado. | 31 | Mr. Rutledge is a Trustee of Clough Global Dividend and Income Fund (1 fund); Clough Global Equity Fund (1 fund); Clough Global Opportunities Fund (1 fund); and Principal Real Estate Income Fund (1 fund). |
| Michael “Ross” Shell, 1970 | Trustee | Mr. Shell was elected at a special meeting of shareholders held on August 7, 2009. | Mr. Shell is Founder and CEO of Red Idea, LLC, a strategic consulting/early stage venture firm (since June 2008). From 1999 to 2009, he was a part-owner and Director of Tesser, Inc., a brand agency. From December 2005 to May 2008, he was Director, Marketing and Investor Relations, of Woodbourne, a REIT/real estate hedge fund and private equity firm. Prior to this, from May 2004 to November 2005, he worked as a business strategy consultant; from June 2003 to April 2004, he was on the Global Client Services team of IDEO, a product design/innovation firm; and from 1999 to 2003, he was President of Tesser, Inc. Mr. Shell graduated with honors from Stanford University with a degree in Political Science. | 31 | None. |
| 50 | www.vulcanvaluepartners.com |
Trustees and Officers
April 30, 2020 (Unaudited)
INTERESTED TRUSTEE
| Name, Address* & Year of Birth | Position(s) Held with Fund | Term of Office** and Length of Time Served | Principal Occupation(s) During Past 5 Years*** | Number of Funds in Fund Complex Overseen by Trustee**** | Other Directorships Held by Trustee During Past 5 Years*** |
Edmund J. Burke, 1961 | Trustee | Mr. Burke was elected as Trustee at a special meeting of shareholders held on August 7, 2009. | Mr. Burke joined ALPS in 1991 and served as the President and Director of ALPS Holdings, Inc., and ALPS Advisors, Inc., and Director of ALPS Distributors, Inc., ALPS Fund Services, Inc. (“ALPS”), and ALPS Portfolio Solutions Distributor, Inc. (collectively, the “ALPS Companies”). Mr. Burke retired from the ALPS Companies in June 2019. Mr. Burke is deemed an interested Trustee by virtue of his prior positions with the ALPS Companies. | 31 | Mr. Burke is a Trustee of ALPS ETF Trust (16 funds); Clough Global Dividend and Income Fund (1 fund); Clough Global Equity Fund (1 fund); Clough Global Opportunities Fund (1 fund); Clough Funds Trust (1 fund); Liberty All-Star Equity Fund (1 fund); and Director of the Liberty All-Star Growth Fund, Inc. (1 fund). |
| Annual Report | April 30, 2020 | 51 |
Trustees and Officers
April 30, 2020 (Unaudited)
OFFICERS
| Name, Address* & Year of Birth | Position(s) Held with Fund | Term of Office** and Length of Time Served | Principal Occupation(s) During Past 5 Years*** |
Bradley J. Swenson, 1972 | President | Mr. Swenson was elected President of the Trust at the June 11 – 12, 2019 meeting of the Board of Trustees. | Mr. Swenson joined ALPS in 2004 and has served as its President since June 2019. In this role, he serves as an officer to certain other closed-end and open-end investment companies. He previously served as the Chief Operating Officer of ALPS (2015-2019). Mr. Swenson also previously served as Chief Compliance Officer to ALPS, its affiliated entities, and to certain ETF, closed-end and open-end investment companies (2004-2015). Because of his position with ALPS, Mr. Swenson is deemed an affiliate of the Trust as defined under the 1940 Act. |
Kimberly R. Storms, 1972 | Treasurer | Ms. Storms was elected Treasurer of the Trust at the March 12, 2013 meeting of the Board of Trustees. | Ms. Storms is Senior Vice President -Director of Fund Administration of ALPS. Because of her position with ALPS, Ms. Storms is deemed an affiliate of the Trust as defined under the 1940 Act. Ms. Storms is also Treasurer of ALPS Series Trust. Ms. Storms also serves as a Board member and Treasurer of The Center for Trauma & Resilience, a nonprofit agency. |
Karen S. Gilomen, 1970 | Secretary | Ms. Gilomen was elected Secretary of the Trust at the December 13, 2016 meeting of the Board of Trustees. | Ms. Gilomen joined ALPS in August 2016 as Vice President and Senior Counsel. Prior to joining ALPS, Ms. Gilomen was Vice President - General Counsel & CCO of Monticello Associates, Inc. from 2010 to 2016. Because of her position with ALPS, Ms. Gilomen is deemed an affiliate of the Trust, as defined under the 1940 Act. Ms. Gilomen is also the Secretary of ALPS Variable Investment Trust and Reaves Utility Income Fund, and the Assistant Secretary of the WesMark Funds. |
Ted Uhl, 1974 | Chief Compliance Officer (“CCO”) | Mr. Uhl was appointed CCO of the Trust at the June 8, 2010 meeting of the Board of Trustees. | Mr. Uhl joined ALPS in October 2006, and is currently Deputy Compliance Officer of ALPS. Prior to his current role, Mr. Uhl served as Senior Risk Manager for ALPS from October 2006 until June 2010. Before joining ALPS, Mr. Uhl served a Sr. Analyst with Enenbach and Associates (RIA), and a Sr. Financial Analyst at Sprint. Because of his position with ALPS, Mr. Uhl is deemed an affiliate of the Trust as defined under the 1940 Act. Mr. Uhl is also CCO of the Boulder Growth & Income Fund, Inc., Centre Funds, Index Funds, Reality Shares ETF Trust, Reaves Utility Income Fund and XAI Octagon Floating Rate & Alternative Income Term Trust. |
| 52 | www.vulcanvaluepartners.com |
Trustees and Officers
April 30, 2020 (Unaudited)
OFFICERS (continued)
| Name, Address* & Year of Birth | Position(s) Held with Fund | Term of Office** and Length of Time Served | Principal Occupation(s) During Past 5 Years*** |
Sharon Akselrod, 1974 | Assistant Secretary | Ms. Akselrod was elected Assistant Secretary of the Trust at the September 15, 2015 meeting of the Board of Trustees. | Ms. Akselrod joined ALPS in August 2014 and is currently Senior Investment Company Act Paralegal of ALPS Fund Services, Inc. Prior to joining ALPS, Ms. Akselrod served as Corporate Governance and Regulatory Associate for Nordstrom fsb (2013-2014) and Senior Legal Assistant – Legal Manager for AXA Equitable Life Insurance Company (2008-2013). Because of her position with ALPS, Ms. Akselrod is deemed an affiliate of the Trust as defined under the 1940 Act. Ms. Akselrod is also Secretary of Principal Real Estate Income Fund and Assistant Secretary of ALPS ETF Trust and Clough Funds Trust. |
Jennifer Craig, 1973 | Assistant Secretary | Ms. Craig was elected Assistant Secretary of the Trust at the June 8, 2016 meeting of the Board of Trustees. | Ms. Craig joined ALPS in 2007 and is currently Assistant Vice President and Paralegal Manager of ALPS. Because of her position with ALPS, Ms. Craig is deemed an affiliate of the Trust as defined under the 1940 Act. Ms. Craig is also Assistant Secretary of Clough Global Dividend and Income Fund, Clough Global Equity Fund, Clough Global Opportunities Fund, Principal Real Estate Income Fund, Liberty All-Star Equity Fund and Liberty All-Star Growth Fund, Inc. |
Sareena Khwaja-Dixon, 1980 | Assistant Secretary | Ms. Khwaja-Dixon was elected Assistant Secretary of the Trust at the December 12, 2017 meeting of the Board of Trustees. | Ms. Khwaja-Dixon joined ALPS in August 2015 and is currently Senior Counsel and Vice President of ALPS Fund Services, Inc. Prior to joining ALPS, Ms. Khwaja-Dixon served as a Senior Paralegal/Paralegal for Russell Investments (2011 – 2015). Because of her position with ALPS, Ms. Khwaja-Dixon is deemed an affiliate of the Trust as defined under the 1940 Act. Ms. Khwaja-Dixon is also Secretary of Liberty All-Star Equity Fund, Liberty All-Star Growth Fund, Inc., Clough Funds Trust, Clough Global Dividend and Income Fund, Clough Global Opportunities Fund, and Clough Global Equity Fund. |
| * | All communications to Trustees and Officers may be directed to Financial Investors Trust c/o 1290 Broadway, Suite 1000, Denver, CO 80203. |
| ** | This is the period for which the Trustee or Officer began serving the Trust. Each Trustee serves an indefinite term, until his successor is elected. Officers are elected on an annual basis. |
| *** | Except as otherwise indicated, each individual has held the office shown or other offices in the same company for the last five years. |
| **** | The Fund Complex includes all series of the Trust (currently 31) and any other investment companies for which any Trustee serves as trustee for and which Vulcan Value Partners, LLC provides investment advisory services (currently none). |
| Annual Report | April 30, 2020 | 53 |
Privacy Policy
April 30, 2020 (Unaudited)
| WHO WE ARE | |
| Who is providing this notice? | Vulcan Value Partners Fund and Vulcan Value Partners Small Cap Fund. |
| WHAT WE DO | |
| How do the Funds protect my personal information? | To protect your personal information from unauthorized access and use, we use security measures that comply with federal law. These measures include computer safeguards and secured files and buildings. |
| How do the Funds collect my personal information? | We collect your personal information, for example, when you • open an account • provide account information or give us your contact information • make a wire transfer or deposit money |
| Why can’t I limit all sharing? | Federal law gives you the right to limit only • sharing for affiliates’ everyday business purposes-information about your creditworthiness • affiliates from using your information to market to you • sharing for non-affiliates to market to you State laws and individual companies may give you additional rights to limit sharing. |
| 54 | www.vulcanvaluepartners.com |
Privacy Policy
April 30, 2020 (Unaudited)
| FACTS | WHAT DO THE FUNDS DO WITH YOUR PERSONAL INFORMATION? |
| WHY? | Financial companies choose how they share your personal information. Federal law gives consumers the right to limit some but not all sharing. Federal law also requires us to tell you how we collect, share, and protect your personal information. Please read this notice carefully to understand what we do. |
| WHAT? | The types of personal information we collect and share depend on the product or service you have with us. This information can include: • Social Security number and account transactions • Account balances and transaction history • Wire transfer instructions |
| HOW? | All financial companies need to share customers’ personal information to run their everyday business. In the section below, we list the reasons financial companies can share their customers’ personal information; the reasons the Funds choose to share; and whether you can limit this sharing. |
| REASONS WE CAN SHARE YOUR PERSONAL INFORMATION | DO THE FUNDS SHARE: | CAN YOU LIMIT THIS SHARING? |
| For our everyday business purposes – | | |
| such as to process your transactions, maintain your account(s), respond to court orders and legal investigations, or report to credit bureaus | Yes | No |
| For our marketing purposes – | | |
| to offer our products and services to you | No | We do not share. |
| For joint marketing with other financial companies | No | We do not share. |
| For our affiliates’ everyday business purposes – | | |
| information about your transactions and experiences | Yes | No |
| For our affiliates’ everyday business purposes – | | |
| information about your creditworthiness | No | We do not share. |
| For non-affiliates to market to you | No | We do not share. |
| Annual Report | April 30, 2020 | 55 |

The Funds are neither insured nor guaranteed by the U.S. Government, the FDIC, the Federal Reserve Board or any other governmental agency or insurer.
This material must be accompanied or preceded by a prospectus.
Managed Accounts are available only for institutional and private clients of Vulcan Value Partners, LLC, a federally registered investment advisor. Vulcan Value Partners Funds are distributed by ALPS Distributors, Inc. Separately Managed Accounts and related investment advisory services are provided by Vulcan Value Partners, LLC, a federally regulated investment advisor. ALPS Distributors, Inc. is not affiliated with Vulcan Value Partners, LLC.
Item 2. Code of Ethics.
| (a) | The Registrant, as of the end of the period covered by this report, has adopted a code of ethics that applies to the Registrant’s principal executive officer, principal financial officer, principal accounting officer or controller or any persons performing similar functions on behalf of the Registrant. |
| (c) | During the period covered by this report, no amendments to the provisions of the code of ethics described in Item 2(a) above were made. |
| (d) | During the period covered by this report, no implicit or explicit waivers to the provisions of the code of ethics described in Item 2(a) above were granted. |
| (f) | The Registrant’s Code of Ethics is attached as an Exhibit to this report. |
Item 3. Audit Committee Financial Expert.
The Board of Trustees of the Registrant has determined that the Registrant has at least one Audit Committee Financial Expert serving on its audit committee. The Board of Trustees of the Registrant has designated Jeremy W. Deems as the Registrant’s “Audit Committee Financial Expert.” Mr. Deems is “independent” as defined in paragraph (a)(2) of Item 3 to Form N-CSR.
Item 4. Principal Accountant Fees and Services.
| (a) | Audit Fees: For the Registrant’s fiscal years ended April 30, 2020 and April 30, 2019, the aggregate fees billed for professional services rendered by the principal accountant for the audit of the Registrant’s annual financial statements or services that are normally provided by the accountant in connection with statutory and regulatory filings or engagements for those fiscal years were $395,180 and $338,280, respectively. |
| (b) | Audit-Related Fees: For the Registrant’s fiscal years ended April 30, 2020 and April 30, 2019, the aggregate fees billed for assurance and related services by the principal accountant that were reasonably related to the performance of the audit |
of the Registrant’s financial statements and are not reported under paragraph (a) of this Item were $0 and $0, respectively.
| (c) | Tax Fees: For the Registrant’s fiscal years ended April 30, 2020 and April 30, 2019, the aggregate fees billed for professional services rendered by the principal accountant for tax compliance, tax advice and tax planning were $98,965 and $96,055, respectively. The fiscal years 2020 and 2019 tax fees were for services for dividend calculation, excise tax preparation and tax return preparation. |
| (d) | All Other Fees: For the Registrant’s fiscal years ended April 30, 2020 and April 30, 2019, no fees were billed to Registrant by the principal accountant for products and services, other than the services reported in paragraphs (a) through (c) of this Item. |
| (e)(1) | Audit Committee Pre-Approval Policies and Procedures: All services to be performed by the Registrant’s principal accountant must be pre-approved by the Registrant’s Audit Committee. The Chairman of the Audit Committee may pre-approve non-audit services to be performed by the Registrant’s principal accountant on an interim basis, subject to ratification by the Audit Committee at its next regularly scheduled meeting. |
| (e)(2) | No services described in paragraphs (b) through (d) of this Item were approved by the Registrant’s Audit Committee pursuant to paragraph (c)(7)(i)(C) of Rule 2-01 of Regulation S-X. |
| (g) | The aggregate non-audit fees billed by the Registrant’s accountant to the Registrant, and rendered to the Registrant’s investment adviser (not including any sub-adviser whose role is primarily portfolio management and is subcontracted with or overseen by another investment adviser), and any entity controlling, controlled by, or under common control with the adviser that provides ongoing services to the Registrant, were $118,322 in the fiscal year ended April 30, 2020 and were $133,562 in the fiscal year ended April 30, 2019. These fees consisted of non-audit fees billed to (i) the Registrant of $98,965 in the fiscal year ended April 30, 2020 and $96,055 in the fiscal year ended April 30, 2019 as described in response to paragraph (c) above and (ii) to ALPS Fund Services, Inc. (“AFS”), an entity under common control with ALPS Advisors, Inc., the Registrant’s investment adviser, of $19,357 in the fiscal year ended April 30, 2020 and $37,507 in the fiscal year ended April 30, 2019. The non-audit fees billed to AFS related to SSAE 16 services and other compliance-related matters. |
| (h) | The Registrant’s audit committee has considered whether the provision of non-audit services that were rendered to the Registrant’s investment adviser (not including any sub-adviser whose role is primarily portfolio management and is subcontracted with or overseen by another investment adviser), and any entity |
controlling, controlled by, or under common control with the investment adviser that provides ongoing services to the Registrant that were not pre-approved pursuant to paragraph (c)(7)(ii) of Rule 2-01 of Regulation S-X, is compatible with maintaining the principal accountant’s independence. The Registrant’s audit committee determined that the provision of such non-audit services is compatible with maintaining the principal accountant’s independence.
Item 5. Audit Committee of Listed Registrants.
Not applicable to the Registrant.
Item 6. Investments.
| (a) | Schedule of Investments is included as part of the Reports to Stockholders filed under Item 1 of this Form N-CSR. |
Item 7. Disclosure of Proxy Voting Policies and Procedures for Closed-End Management Investment Companies.
Not applicable to the Registrant.
Item 8. Portfolio Managers of Closed-End Management Investment Companies.
Not applicable to the Registrant.
Item 9. Purchases of Equity Securities by Closed-End Management Investment Company and Affiliated Purchasers.
Not applicable to the Registrant.
Item 10. Submission of Matters to a Vote of Security Holders.
There have been no material changes to the procedures by which shareholders may recommend nominees to the Registrant’s Board of Trustees, where those changes were implemented after the Registrant last provided disclosure in response to the requirements of Item 407(c)(2)(iv) of Regulation S-K, or this Item.
Item 11. Controls and Procedures.
| (a) | The Registrant’s principal executive officer and principal financial officer have concluded that the Registrant’s disclosure controls and procedures (as defined in Rule 30a-3(c) under the Investment Company Act of 1940, as amended) are effective based on their evaluation of these controls and procedures as of a date within 90 days of the filing date of this report. |
| (b) | There was no change in the Registrant’s internal control over financial reporting (as defined in Rule 30a-3(d) under the Investment Company Act of 1940, as amended) during the period covered by this report that has materially affected, or is reasonably likely to materially affect, the Registrant’s internal control over financial reporting. |
Item 12. Disclosure of Securities Lending Activities for Closed-End Management Investment Companies.
Not applicable to the Registrant.
Item 13. Exhibits.
SIGNATURES
Pursuant to the requirements of the Securities Exchange Act of 1934 and the Investment Company Act of 1940, the Registrant has duly caused this report to be signed on its behalf by the undersigned, thereunto duly authorized.
| FINANCIAL INVESTORS TRUST | |
| | | |
| By: | /s/ Bradley J. Swenson | |
| | Bradley J. Swenson (Principal Executive Officer) | |
| | President | |
| | | |
| Date: | July 7, 2020 | |
Pursuant to the requirements of the Securities Exchange Act of 1934 and the Investment Company Act of 1940, this report has been signed below by the following persons on behalf of the Registrant and in the capacities and on the dates indicated.
| FINANCIAL INVESTORS TRUST | |
| | | |
| By: | /s/ Bradley J. Swenson | |
| | Bradley J. Swenson (Principal Executive Officer) | |
| | President | |
| | | |
| Date: | July 7, 2020 | |
| | | |
| By: | /s/ Kimberly R. Storms | |
| | Kimberly R. Storms (Principal Financial Officer) | |
| | Treasurer | |
| | | |
| Date: | July 7, 2020 | |