UNITED STATES
SECURITIES AND EXCHANGE COMMISSION
Washington, D.C. 20549
FORM N-CSR
CERTIFIED SHAREHOLDER REPORT OF REGISTERED
MANAGEMENT INVESTMENT COMPANIES
Investment Company Act file number: 811-08194
FINANCIAL INVESTORS TRUST
(Exact name of registrant as specified in charter)
1290 Broadway, Suite 1000, Denver, Colorado 80203
(Address of principal executive offices) (Zip code)
Cara Owen, Esq., Secretary
Financial Investors Trust
1290 Broadway, Suite 1000
Denver, Colorado 80203
(Name and address of agent for service)
Registrant’s telephone number, including area code: 303-623-2577
Date of fiscal year end: April 30
Date of reporting period: April 30, 2021
Explanatory Note
The Registrant is filing this amendment to its Form N-CSR for the period ended April 30, 2021, originally filed with the Securities and Exchange Commission on July 9, 2021 (Accession Number 0001398344-21-014213) (the “Original Filing”), to amend Item 1, “Reports to Stockholders.” The purpose of the amendment to Item 1 is to supplement the Annual Shareholder Report for the Grandeur Peak Emerging Markets Opportunities Fund, Grandeur Peak Global Contrarian Fund, Grandeur Peak Global Micro Cap Fund, Grandeur Peak Global Opportunities Fund, Grandeur Peak Global Reach Fund, Grandeur Peak Global Stalwarts Fund, Grandeur Peak International Opportunities Fund, Grandeur Peak International Stalwarts Fund, and Grandeur Peak US Stalwarts Fund (the “Grandeur Peak Report”) to include disclosure related to the annual Liquidity Risk Management Program review, which was inadvertently omitted from the Grandeur Peak Report.
The remainder of Item 1 and Items 2 through 12 of the Original Filing are incorporated by reference.
Item 1. Reports to Stockholders.

TABLE OF CONTENTS
| Shareholder Letter | 1 |
| Performance Update | 7 |
| Disclosure of Fund Expenses | 34 |
| Portfolio of Investments | |
| Grandeur Peak Emerging Markets Opportunities Fund | 36 |
| Grandeur Peak Global Contrarian Fund | 40 |
| Grandeur Peak Global Micro Cap Fund | 43 |
| Grandeur Peak Global Opportunities Fund | 47 |
| Grandeur Peak Global Reach Fund | 51 |
| Grandeur Peak Global Stalwarts Fund | 57 |
| Grandeur Peak International Opportunities Fund | 61 |
| Grandeur Peak International Stalwarts Fund | 65 |
| Grandeur Peak US Stalwarts Fund | 68 |
| Statements of Assets and Liabilities | 70 |
| Statements of Operations | 73 |
| Statements of Changes in Net Assets | |
| Grandeur Peak Emerging Markets Opportunities Fund | 76 |
| Grandeur Peak Global Contrarian Fund | 77 |
| Grandeur Peak Global Micro Cap Fund | 78 |
| Grandeur Peak Global Opportunities Fund | 79 |
| Grandeur Peak Global Reach Fund | 80 |
| Grandeur Peak Global Stalwarts Fund | 81 |
| Grandeur Peak International Opportunities Fund | 82 |
| Grandeur Peak International Stalwarts Fund | 83 |
| Grandeur Peak US Stalwarts Fund | 84 |
| Financial Highlights | |
| Grandeur Peak Emerging Markets Opportunities Fund | 85 |
| Grandeur Peak Global Contrarian Fund | 87 |
| Grandeur Peak Global Micro Cap Fund | 88 |
| Grandeur Peak Global Opportunities Fund | 89 |
| Grandeur Peak Global Reach Fund | 91 |
| Grandeur Peak Global Stalwarts Fund | 93 |
| Grandeur Peak International Opportunities Fund | 95 |
| Grandeur Peak International Stalwarts Fund | 97 |
| Grandeur Peak US Stalwarts Fund | 99 |
| Notes to Financial Statements | 100 |
| Report of Independent Registered Public Accounting Firm | 115 |
| Additional Information | 116 |
| Liquidity Risk Management Program | 118 |
| Trustees and Officers | 119 |
| Privacy Policy | 123 |
| Grandeur Peak Funds® | Shareholder Letter |
April 30, 2021 (Unaudited)
Dear Fellow Shareholders,
In June 1992, Eugene Fama and Kenneth French published their seminal paper, “Common Risk Factors in the Returns on Stocks and Bonds,” in the Journal of Financial Economics. With this paper, the era of Factor Investing was born and equity portfolios the world over began to be allocated into buckets of Small Cap vs. Large Cap and Value vs. Growth. To build their Size and Value Factors, Fama/French used excess returns on 25 portfolios, formed on market cap (Size) and book-to-market equity (Value) as dependent variables in the time-series regressions. The Size factor was named SMB: “Small minus Big” and the Value Factor was named HML: “High minus Low (Book-to-Market Equity Ratio).” The irony of the timing of their paper is that Large Cap Growth stocks1, the very type of stocks that the paper claimed underperform markets on a regular basis, went on a tear in the latter half of the 1990s, outperforming Small Cap Value stocks2 by 255% on a cumulative basis from January 1995 – August 2000, when Large Cap growth stocks peaked, as shown in Exhibit 1.
Exhibit 1: Large Cap Growth (Russell 200 Growth Index) vs. Small Cap Value (Russell 2000 Value Index)
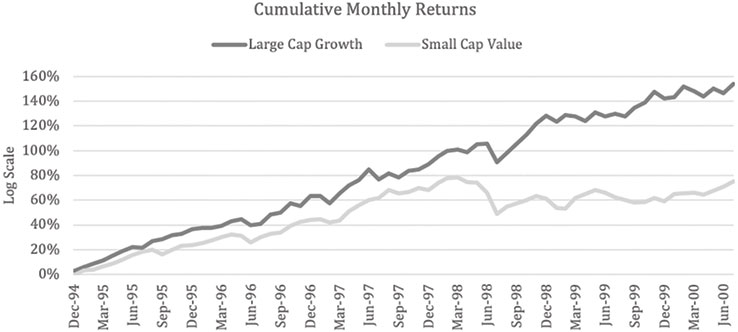
Source: FTSE Russell (data from January 1995 – August 2000).
Past performance is no indication of future returns.
In the close to 30 years since the Fama/French paper was published, the academics have discovered a myriad of other market factors, and the opportunists have launched a host of indexes and investment products based on those factors. And yet the debate still rages: Growth vs. Value, Small Cap vs. Large Cap, and Quality vs. Junk. Hopefully you know how we view the world at Grandeur Peak Global Advisors. We believe that Quality outperforms, but that Valuation is incredibly important. We also like hunting for great investments among the small cap names across the globe, not because we necessarily think the Fama/French Size Factor leads to excess return, but because we believe that smaller companies can grow faster for longer than large companies. We also believe that the enormity of the global small cap market makes for better fishing, and we like to throw as wide a net as possible when looking for opportunity, and we like to fish in lakes where there are fewer people casting their nets.
Index provider MSCI is one of the opportunists that have created a slew of Factor-based indexes over the years, and as we come up on our 10th anniversary as a firm, we thought it would be interesting to compare how our “Quality at a Reasonable Price,” investment style has fared. As Global investors, we like to compare MSCI’s series of World Indexes.
| 1 | As measured by the Russell 200 Large Cap Growth Index |
| 2 | As measured by the Russell 2000 Small Cap Value Index |
| Annual Report | April 30, 2021 | 1 |
| Grandeur Peak Funds® | Shareholder Letter |
April 30, 2021 (Unaudited)
The MSCI World Index captures Large- and Mid-cap representation across 23 Developed Market countries. The MSCI World Large Cap Index is a subset to the MSCI World Index, which captures the largest companies in each country (approximately 70% of the free float-adjusted market capitalization). The MSCI World Small Cap Index captures the smallest companies in each country (approximately 14% of the free float-adjusted market capitalization).
The MSCI World Growth Index is a subset of the MSCI World Index of stocks that exhibits overall Growth Characteristics using 5 variables3. The MSCI World Value Index is a subset of the MSCI World Index of stocks that exhibit Value Characteristics using 3 variables4.
The MSCI World Quality Index is a subset of the MSCI World Index of stocks that exhibit Quality Characteristics using 3 variables5. The MSCI World Prime Value Index is designed to represent the performance of companies with relatively low valuations and high quality characteristics. It can be considered a “Quality Value” index where the MSCI World Quality Index can be considered “Quality Growth”.
Exhibit 2 shows the 10yr annualized returns of these 7 indexes from April 2010 through the market meltdown of March 2020 (we’ll look at how they’ve done since then in just a moment).
Exhibit 2: Annualized 10-yr Returns through March 2020
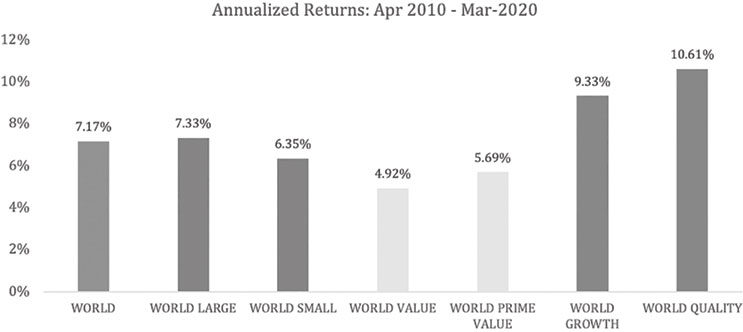
Source: MSCI (data from 3/31/2011 – 3/31/2021).
Past performance is no indication of future returns.
As you can see, over the 10 years ended March 31, 2020, Large companies outperformed Small (but not by much), Growth outperformed Value by a lot, and Quality outperformed generic stocks, both in the Growth and Value space. The Prime Value Index (Quality Value) outperformed the traditional Value index, and the Quality Index (Quality Growth) outperformed the traditional Growth index. Fortunately, for Grandeur Peak and our clients Quality Growth was the place to be.
Exhibit 3 takes a longer term view and shows Annualized returns from January 2001 through March 2020.
| 3 | Long-term forward Earnings-Per-Share (EPS) growth rate, Short-term forward EPS growth rate, Current internal growth rate, Long-term historical EPS growth trend, and Long-term historical sales per share growth trend |
| 4 | Book value-to-price ratio, 12-month forward earnings-to-price ratio, and Dividend yield |
| 5 | High return on equity (ROE), Stable year-over-year earnings growth, and Low financial leverage |
| 2 | 1.855.377.7325 | www.GrandeurPeakGlobal.com |
| Grandeur Peak Funds® | Shareholder Letter |
April 30, 2021 (Unaudited)
Exhibit 3: Annualized Returns Jan 2001 – Mar 2020
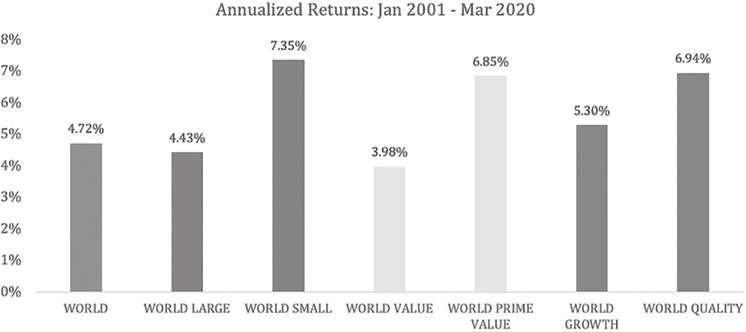
Source: MSCI (data from 12/31/2000 – 3/31/2021).
Past performance is no indication of future returns.
Longer-term, since the dot.com crash of 2001, Small Caps outperformed Large Caps by a lot. But more interesting for us is that while traditional Growth outperformed traditional Value, the difference between Quality Value and Quality Growth was negligible.
Exhibit 4 shows more recent returns for these indexes, for the last 12 months through from the 3/31/2020 market bottom through 3/31/2021.
Exhibit 4: Last 12-month Returns Apr 2020 – Mar 2021

Source: MSCI (data from 3/31/2020 – 3/31/2021).
Past performance is no indication of future returns.
| Annual Report | April 30, 2021 | 3 |
| Grandeur Peak Funds® | Shareholder Letter |
April 30, 2021 (Unaudited)
Since the market bottom last March (2020), Small caps have come screaming back and traditional Growth continues to outperform traditional Value as of the date of this report. But again, as of April 30th, Quality Value has continued to perform, even as Quality Growth has underperformed traditional Growth.
As you may recall, in September 2019 we launched a Quality Value strategy, Grandeur Peak Global Contrarian. Within our traditional Quality, Value, Momentum (QVM) framework, the Global Contrarian team is taking more of a VQM approach. That is, Value first, Quality second. While the Global Contrarian strategy is the purest expression of our Quality Value approach, the best thing about our QVM framework (in our opinion), is that we can be flexible across the Quality spectrum. So, while Quality Growth has been the place to be for the past 10 years, there may come a time where a more disciplined approach on valuation becomes warranted. That is, while we will never be able to guess which Factors may outperform over the next 10 years, we believe that we are well prepared to continue finding high quality companies, on both the Value and Growth side of the equation going forward.
Business Update
We recently closed several Funds to new investments due to the continued strength of global markets. We continuously monitor capacity at both the strategy and firm level. We are committed to keeping our investment strategies nimble to pursue their investment objectives without being unduly encumbered by their individual asset base or the firm’s collective assets. Achieving performance for Grandeur Peak clients is our paramount objective.6
Our tag line, “Elevated Global Investing,” highlights our focus and approach to go above and beyond in covering the global investable universe. We believe by seeing the global opportunity set, we can make elevated investment decisions. We’ve recently extended the tag line to include, “Active At Its Best,” to emphasize what we believe is a key differentiator of our investment approach… to very actively engage, and dig deep to understand, each company in which we invest. Active investing7 is a hallmark of our firm, and in an industry that has been shifting towards passive investments over the past decade, we feel our very active approach provides an increasingly distinct and exciting opportunity to outperform over the long-term. We are not shying away from our strength as active investors.
Our Sustainability Team has begun a quarterly report which summarizes many of the efforts being made across the investment team on ESG ("Environmental, Social and Governance") topics. The report includes details of our Sustainability Framework, company engagement and collaboration, our independent research and answers to frequently asked questions. It also includes sustainability profiles of our Funds and our owned companies for your reference.
Fund Performance & Attribution
The market has been favoring a very different set of companies to begin 2021 vs what we saw in 2020. With growing hope that we have turned the corner on COVID-19, many of what we would consider lower quality companies have been seeing a nice rebound, while many of our solid executors from last year have seen their stock prices underperform in markets rotating away from quality. Over the last several months we have been buying these higher quality names opportunistically in the Funds, taking advantage of the volatility, as we believe quality is the right space for long-term investments.
The last twelve months have been a very unusual period for global equity markets, with very strong absolute returns. It was definitely a period that brings to mind the common disclosure “past performance is no indication of future results.” We are very pleased to report the sizeable outperformance of the Grandeur Peak Funds vs their benchmarks for the year ending April 30, 2021. Given our quality focus, we generally seek to just keep up in strong bull markets, but the markets favored our style this year, and when combined with solid stock picking across our team, the nine Grandeur Peak Funds all delivered very nice gains, ranging from 59.92% to 102.43%.
Emerging Markets Opportunities: For the year, the Institutional share class returned a healthy +60.30% vs +63.05% for the benchmark. All regions of the emerging markets benchmark index posted very strong returns for the year. The Fund’s best returns came in Central Asia, but the Fund’s small underperformance in Asia Pacific, where the majority of the portfolio and benchmark reside, outweighed other areas of outperformance. Across sectors, the Fund outperformed the benchmark in Technology, but lagged in Consumer and Healthcare.
| 6 | The Grandeur Peak Funds’ investment objective is long-term growth of capital; Grandeur Peak Funds’ Prospectus dated 8/31/2020. |
| 7 | If you’re not familiar with the terms “Active” and “Passive” investing, Active investing refers to the process of actively evaluating individual companies and selecting investments based on the merits of each company, while Passive investing refers to investing in a bundle of companies, typically in the form of Index Funds (a group of companies compiled to mimic a specific index – e.g. the S&P 500) or ETFs (Exchange Traded Funds, which are also a basic group of companies designed to mimic an index, industry, geography, or such) without evaluating the individual companies within the bundle. |
| 4 | 1.855.377.7325 | www.GrandeurPeakGlobal.com |
| Grandeur Peak Funds® | Shareholder Letter |
April 30, 2021 (Unaudited)
Global Contrarian: For the year, the Fund outperformed with a +78.51% return vs +66.94% for the benchmark. The Fund outperformed the benchmark in every region except Eastern Europe and a slight underperformance in North America, which together only make up about 17% of the portfolio. The Fund’s largest concentration is in Asia Pacific, where the Fund outperformed by more than 29 percentage points. Across sectors, Technology was a large contributor to performance, as was Financials, while the Fund lagged in Consumer.
Global Micro Cap: For the year, the Fund enjoyed a return of +102.43% return vs +67.65% for the benchmark, as micro caps finally enjoyed a tailwind. Every geography saw positive returns, but the biggest drivers of Fund performance were Western Europe and Asia Pacific where the Fund was overweight and outperformed. The biggest detractor was North America, where the Fund still outperformed the benchmark, but was significantly underweight. From a sector standpoint, the Fund outperformed across each sector, but the underweight to Industrials detracted slightly from performance.
Global Opportunities/International Opportunities: For the year, the Global Opportunities Institutional share class returned +83.44% vs +67.65% for the benchmark, and the International Opportunities Institutional share class also returned relative outperformance of +76.29% vs 58.94% for the benchmark. The Funds’ common big weights are in Asia Pacific and Western Europe. The Funds outperformed and were overweight in both these geographies. The Global Fund’s underweight to North America was detractor to performance, even though the Fund slightly outperformed in that region as well. The International Fund outperformed the benchmark across sectors, while the Global Fund did so except in the Consumer sector.
Global Reach: For the year, the Institutional share class returned +77.81% vs +67.65% for the benchmark. Stock picking and the Fund’s underweight in the US contributed positively to performance during the period. The Fund’s big weights were in Asia Pacific, Western Europe, and North America. The Fund outperformed and was overweight in both Asia Pacific and Western Europe. The Fund slightly underperformed in the North American markets. The Fund outperformed the benchmark across Technology, Healthcare, Financials and Industrials, but slightly underperformed in the Consumer sector.
Global Stalwarts/International Stalwarts: For the year, the Global Stalwarts Institutional share class returned +68.62% vs +54.93% for the benchmark, and the International Stalwarts Institutional share class returned relative performance of +67.61% vs +47.49% for the benchmark. The Funds’ outperformance came from all regions, except Eastern Europe, which makes up less than 2% of either Fund. The Funds’ strength in Asia Pacific was a key driver to the Funds’ outperformance. The Global Fund remained a little underweight in the North America markets, but its outperformance in that region helped lessen the impact. The Funds outperformed the benchmark across sectors, with Consumer being the smallest outperformance for both Funds.
US Stalwarts: For the year, the Fund outperformed with a +73.67% return vs +62.89% for the benchmark. Health Care was the Fund’s strongest sector, and it helped to be a little overweight there. Fund performance also saw positive contributions from the Consumer and Industrials sectors. The Fund’s two largest sector weights were in Technology and Financials, both of which the Fund slightly underperformed the benchmark.
We are optimistic about the general decline in COVID-19 cases in Utah, which we hope will allow for a carefully planned return to our offices this summer. Regardless of where our team sits, we are fully engaged in our efforts to serve you, our clients, in seeking to find the most interesting investment opportunities around the world.
As always, please feel free to reach out any time with any questions, requests or comments. We appreciate the opportunity to work on your behalf.
Sincerely,
Your Grandeur Peak Team
The objective of all Grandeur Peak Funds is long-term growth of capital.
RISKS: Investing in small and micro-cap funds will be more volatile and loss of principal could be greater than investing in large cap or more diversified funds. Investing in foreign securities entails special risks, such as currency fluctuations and political uncertainties, which are described in more detail in the prospectus. Investments in emerging markets are subject to the same risks as other foreign securities and may be subject to greater risks than investments in foreign countries with more established economies and securities markets.
An investor should consider investment objectives, risks, charges, and expenses carefully before investing. To obtain a Grandeur Peak Funds prospectus, containing this and other information, visit www.grandeurpeakglobal.com or call 1-855-377-7325. Please read it carefully before investing.
The views and information discussed in this commentary are as of the date of publication, are subject to change, and may not reflect the writer’s current views. The views expressed represent an assessment of market conditions at a specific point in time, are opinions only and should not be relied upon as investment advice regarding a particular investment or markets in general. Such information does not constitute a recommendation to
| Annual Report | April 30, 2021 | 5 |
| Grandeur Peak Funds® | Shareholder Letter |
April 30, 2021 (Unaudited)
buy or sell specific securities or investment vehicles. It should not be assumed that any investment will be profitable or will equal the performance of the Funds or any securities or any sectors mentioned herein. The subject matter contained herein has been derived from several sources believed to be reliable and accurate at the time of compilation. The Funds do not accept any liability for losses either direct or consequential caused by the use of this information.
Past performance does not guarantee future results.
Grandeur Peak Funds are distributed by ALPS Distributors, Inc. (ADI). ADI is not affiliated with Grandeur Peak Global Advisors.
A mortgage-backed security is a type of asset-backed security which is secured by a mortgage or collection of mortgages. The mortgages are aggregated and sold to a group of individuals that securitizes, or packages, the loans together into a security that investors can buy.
The term “high-yield funds” generally refers to mutual funds or exchange-traded funds (ETFs) that hold stocks that pay above-average dividends, bonds with above-average interest payments, or a combination of both.
Investing in securities that meet ESG criteria may result in the Funds forgoing otherwise attractive opportunities, which may result in underperformance when compared to funds that do not consider ESG factors.
Quantitative easing is a monetary policy whereby a central bank purchases at scale government bonds or other financial assets in order to inject money into the economy to expand economic activity.
The S&P 500® Index is an unmanaged index of 500 common stocks chosen for market size, liquidity and industry group representation. It is a market-value weighted index. The Index is not actively managed and does not reflect any deductions for fees, expenses or taxes. An investor may not invest directly in the Index.
| 6 | 1.855.377.7325 | www.GrandeurPeakGlobal.com |
| Grandeur Peak Emerging Markets Opportunities Fund | Performance Update |
April 30, 2021 (Unaudited)
Annualized Total Return Performance for the periods ended April 30, 2021
| | | | | Since | Expense Ratio(b) |
| | 1 Year | 3 Years | 5 Years | Inception(a) | Gross | Net(c) |
Grandeur Peak Emerging Markets Opportunities Fund – Investor (GPEOX) | 59.92% | 11.11% | 12.85% | 9.16% | 1.78% | 1.78% |
Grandeur Peak Emerging Markets Opportunities Fund – Institutional (GPEIX) | 60.30% | 11.36% | 13.11% | 9.41% | 1.53% | 1.53% |
MSCI Emerging Markets SMID Cap Index(d) | 63.05% | 6.43% | 10.27% | 6.16% | | |
MSCI Emerging Markets IMI Index(e) | 51.70% | 7.88% | 12.64% | 7.09% | | |
Performance data quoted represents past performance. Past performance does not guarantee future results. Investment return and principal value of an investment will fluctuate so that an investor’s shares, when sold or redeemed, may be worth more or less than the original cost. The Fund imposes a 2.00% redemption fee on shares held for less than 60 days. Current performance data may be higher or lower than actual data quoted. For the most current month-end performance data, please call 1-855-377-PEAK (7325).
The table does not reflect the deduction of taxes a shareholder would pay on Fund distributions or redemption of Fund shares.
Subject to investment risks, including possible loss of the principal amount invested.
Returns for periods less than 1 year are cumulative.
| (a) | Fund inception date of December 16, 2013. |
| (b) | Ratios as of the Prospectus dated August 31, 2020 and may differ from the ratios presented in the Financial Highlights. |
| (c) | Grandeur Peak Global Advisors, LLC (the “Adviser”), has agreed to waive and/or reimburse fees or expenses in order to limit Total Annual Fund Operating Expenses After Fee Waiver/Expense Reimbursement (excluding acquired fund fees and expenses, brokerage expenses, interest expenses, taxes and extraordinary expenses) to 1.95% and 1.70% of the Fund’s average daily net assets for the Fund’s Investor Class Shares and Institutional Class Shares, respectively. This agreement (the “Expense Agreement”) is in effect through August 31, 2021. The Adviser will be permitted to recover, on a class- by-class basis, expenses it has borne through the Expense Agreement to the extent that a Fund’s expenses in later periods fall below annual rates set forth in the Expense Agreement; provided, however, that such recapture payments do not cause the Fund’s expense ratio (after recapture) to exceed the lesser of (i) the expense cap in effect at the time of the waiver and (ii) the expense cap in effect at the time of the recapture. Notwithstanding the foregoing, the Fund will not be obligated to pay any such deferred fees and expenses more than three years after the date on which the fee and expenses was deferred. The Expense Agreement may not be terminated or modified prior to August 31, 2021 except with the approval of the Fund’s Board of Trustees. |
| (d) | The MSCI Emerging Markets SMID Cap Index is designed to measure the equity market performance of small and mid-cap companies across emerging markets. MSCI makes no express or implied warranties or representations and shall have no liability whatsoever with respect to any MSCI data contained herein. The MSCI data may not be further redistributed or used to create indices or financial products. The Index is not actively managed and does not reflect any deductions for fees, expenses or taxes. An investor may not invest directly into the Index. |
| (e) | The MSCI Emerging Markets IMI Index is designed to measure the equity market performance of large, mid, and small-cap companies across emerging markets. The Index is not actively managed and does not reflect any deductions for fees, expenses or taxes. An investor may not invest directly into the Index. |
| Annual Report | April 30, 2021 | 7 |
| Grandeur Peak Emerging Markets Opportunities Fund | Performance Update |
April 30, 2021 (Unaudited)
Growth of $10,000 for the period ended April 30, 2021
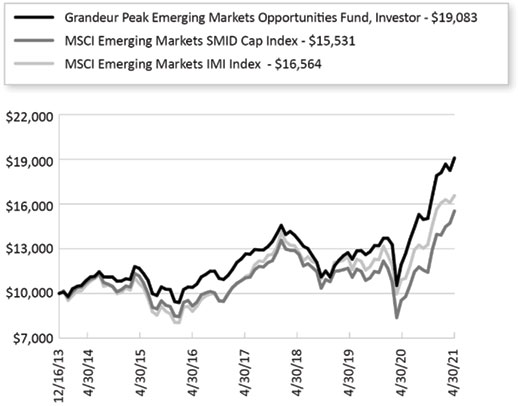
The chart shown above represents a hypothetical investment of $10,000 in the Fund’s Investor Class shares for the period from inception to April 30, 2021. All returns reflect reinvested dividends, but do not reflect the deduction of taxes that an investor would pay on distributions or redemptions.
Investing in the Fund is subject to investment risks, including possible loss of the principal amount invested.
The Fund also offers Institutional Class shares, performance for which is not reflected in the graphs above. The performance of Institutional Class shares may be higher or lower than the performance of the Investor Class shares shown in the graphs above based upon differences in fees paid by shareholders investing in the Investor Class shares and Institutional Class shares.
| 8 | 1.855.377.7325 | www.GrandeurPeakGlobal.com |
| Grandeur Peak Emerging Markets Opportunities Fund | Performance Update |
April 30, 2021 (Unaudited)
| Regional Allocation (as a % of Net Assets)* | |
| Asia ex Japan | 70.6% |
| Latin America | 10.6% |
| Europe | 8.7% |
| Africa/Middle East | 3.8% |
| North America | 3.4% |
| Cash, Cash Equivalents, & Other Net Assets | 2.9% |
| Total | 100.0% |
| | |
| Top 10 Holdings (as a % of Net Assets)* | |
| Silergy Corp. | 3.9% |
| WNS Holdings, Ltd. | 2.4% |
| Metropolis Healthcare, Ltd. | 1.9% |
| Poya International Co., Ltd. | 1.9% |
| Dino Polska SA | 1.8% |
| IndiaMart InterMesh, Ltd. | 1.8% |
| Pagseguro Digital, Ltd. | 1.5% |
| Genpact, Ltd. | 1.5% |
| Locaweb Servicos de Internet SA | 1.5% |
| Tokai Carbon Korea Co., Ltd. | 1.4% |
| Total | 19.6% |
| * | Holdings are subject to change, and may not reflect the current or future position of the portfolio. |
| Annual Report | April 30, 2021 | 9 |
| Grandeur Peak Global Contrarian Fund | Performance Update |
April 30, 2021 (Unaudited)
Annualized Total Return Performance for the periods ended April 30, 2021
| | | Since | Expense Ratio(b) |
| | 1 Year | Inception(a) | Gross | Net(c) |
Grandeur Peak Global Contrarian Fund – Institutional (GPGCX) | 78.51% | 32.21% | 4.08% | 1.36% |
| MSCI All Country World Index Small Cap Value(d) | 66.94% | 18.94% | | |
| MSCI All Country World Index Small Cap(e) | 67.65% | 25.16% | | |
Performance data quoted represents past performance. Past performance does not guarantee future results. Investment return and principal value of an investment will fluctuate so that an investor’s shares, when sold or redeemed, may be worth more or less than the original cost. The Fund imposes a 2.00% redemption fee on shares held for less than 60 days. Current performance data may be higher or lower than actual data quoted. For the most current month-end performance data, please call 1-855-377-PEAK (7325).
The table does not reflect the deduction of taxes a shareholder would pay on Fund distributions or redemption of Fund shares.
Subject to investment risks, including possible loss of the principal amount invested.
Returns for periods less than 1 year are cumulative.
| (a) | Fund inception date of September 17, 2019. |
| (b) | Ratios as of the Prospectus dated August 31, 2020 and may differ from the ratios presented in the Financial Highlights. |
| (c) | Grandeur Peak Global Advisors, LLC (the “Adviser”), has agreed to waive and/or reimburse fees or expenses in order to limit Total Annual Fund Operating Expenses After Fee Waiver/Expense Reimbursement (excluding acquired fund fees and expenses, brokerage expenses, interest expenses, taxes and extraordinary expenses) to 1.35% of the Fund’s average daily net assets for the Fund’s Institutional Class Shares. This agreement (the “Expense Agreement”) is in effect through August 31, 2021. The Adviser will be permitted to recover, on a class- by-class basis, expenses it has borne through the Expense Agreement to the extent that a Fund’s expenses in later periods fall below annual rates set forth in the Expense Agreement; provided, however, that such recapture payments do not cause the Fund’s expense ratio (after recapture) to exceed the lesser of (i) the expense cap in effect at the time of the waiver and (ii) the expense cap in effect at the time of the recapture. Notwithstanding the foregoing, the Fund will not be obligated to pay any such deferred fees and expenses more than three years after the date on which the fee and expenses was deferred. The Expense Agreement may not be terminated or modified prior to August 31, 2021 except with the approval of the Fund’s Board of Trustees. |
| (d) | The MSCI ACWI Small Cap Value Index is designed to measure small cap companies exhibiting overall value style characteristics across developed and emerging markets globally. The Index is not actively managed and does not reflect any deductions for fees, expenses or taxes. An investor may not invest directly into the Index. |
| (e) | The MSCI ACWI Small Cap Index is designed to measure the equity market performance of performance of small-cap companies across developed and emerging markets globally. MSCI makes no express or implied warranties or representations and shall have no liability whatsoever with respect to any MSCI data contained herein. The MSCI data may not be further redistributed or used to create indices or financial products. The Index is not actively managed and does not reflect any deductions for fees, expenses or taxes. An investor may not invest directly into the Index. |
| 10 | 1.855.377.7325 | www.GrandeurPeakGlobal.com |
| Grandeur Peak Global Contrarian Fund | Performance Update |
April 30, 2021 (Unaudited)
Growth of $10,000 for the period ended April 30, 2021
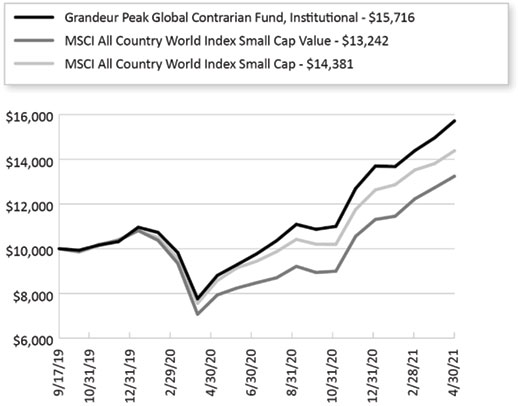
The chart shown above represents a hypothetical investment of $10,000 in the Fund’s Institutional Class shares for the period from inception to April 30, 2021. All returns reflect reinvested dividends, but do not reflect the deduction of taxes that an investor would pay on distributions or redemptions.
Investing in the Fund is subject to investment risks, including possible loss of the principal amount invested.
| Annual Report | April 30, 2021 | 11 |
| Grandeur Peak Global Contrarian Fund | Performance Update |
April 30, 2021 (Unaudited)
| Regional Allocation (as a % of Net Assets)* | |
| Asia ex Japan | 30.2% |
| Europe | 22.5% |
| North America | 21.9% |
| Japan | 14.4% |
| Australia/New Zealand | 4.8% |
| Africa/Middle East | 2.5% |
| Latin America | 0.8% |
| Cash, Cash Equivalents, & Other Net Assets | 2.9% |
| Total | 100.0% |
| | |
| Top 10 Holdings (as a % of Net Assets)* | |
| Seria Co., Ltd. | 2.8% |
| Barrett Business Services, Inc. | 2.6% |
| Bank of NT Butterfield & Son, Ltd. | 2.5% |
| Fiducian Group, Ltd. | 2.5% |
| Ultra Electronics Holdings PLC | 2.0% |
| Guardian Capital Group, Ltd. | 2.0% |
| Plover Bay Technologies, Ltd. | 1.9% |
| Hackett Group, Inc. | 1.9% |
| Naigai Trans Line, Ltd. | 1.9% |
| Esquire Financial Holdings, Inc. | 1.7% |
| Total | 21.8% |
| * | Holdings are subject to change, and may not reflect the current or future position of the portfolio. |
| 12 | 1.855.377.7325 | www.GrandeurPeakGlobal.com |
| Grandeur Peak Global Micro Cap Fund | Performance Update |
April 30, 2021 (Unaudited)
Annualized Total Return Performance for the periods ended April 30, 2021
| | | | | Since | Expense Ratio(b) |
| | 1 Year | 3 Years | 5 Years | Inception(a) | Gross | Net(c) |
Grandeur Peak Global Micro Cap Fund – Institutional (GPMCX) | 102.43% | 22.51% | 20.37% | 19.06% | 2.06% | 2.00% |
MSCI All Country World Index Small Cap(d) | 67.65% | 12.55% | 14.11% | 13.03% | | |
| MSCI World Micro Cap Index(e) | 80.94% | 12.44% | 14.81% | 14.00% | | |
Performance data quoted represents past performance. Past performance does not guarantee future results. Investment return and principal value of an investment will fluctuate so that an investor’s shares, when sold or redeemed, may be worth more or less than the original cost. The Fund imposes a 2.00% redemption fee on shares held for less than 60 days. Current performance data may be higher or lower than actual data quoted. For the most current month-end performance data, please call 1-855-377-PEAK (7325).
The table does not reflect the deduction of taxes a shareholder would pay on Fund distributions or redemption of Fund shares.
Subject to investment risks, including possible loss of the principal amount invested.
Returns for periods less than 1 year are cumulative.
| (a) | Fund inception date of October 20, 2015. |
| (b) | Ratios as of the Prospectus dated August 31, 2020 and may differ from the ratios presented in the Financial Highlights. |
| (c) | Grandeur Peak Global Advisors, LLC (the “Adviser”), has agreed to waive and/or reimburse fees or expenses in order to limit Total Annual Fund Operating Expenses After Fee Waiver/ Expense Reimbursement (excluding acquired fund fees and expenses, brokerage expenses, interest expenses, taxes and extraordinary expenses) to 2.00% of the Fund’s average daily net assets for the Fund’s Institutional Class Shares. This agreement is in effect through August 31, 2021. The Adviser will be permitted to recover expenses it has borne through this agreement to the extent that a Fund’s expenses in later periods fall below annual rates set forth in the Expense Agreement; provided, however, that such recapture payments do not cause the Fund’s expense ratio (after recapture) to exceed the lesser of (i) the expense cap in effect at the time of the waiver and (ii) the expense cap in effect at the time of the recapture. Notwithstanding the foregoing, the Fund will not be obligated to pay any such deferred fees and expenses more than three years after the date on which the fee and expenses was deferred . This agreement may not be terminated or modified prior to August 31, 2021 except with the approval of the Fund’s Board of Trustees. |
| (d) | The MSCI ACWI Small Cap Index is designed to measure the equity market performance of performance of small-cap companies across developed and emerging markets globally. MSCI makes no express or implied warranties or representations and shall have no liability whatsoever with respect to any MSCI data contained herein. The MSCI data may not be further redistributed or used to create indices or financial products. The Index is not actively managed and does not reflect any deductions for fees, expenses or taxes. An investor may not invest directly into the Index. |
| (e) | The MSCI World Micro Cap Index is designed to measure the equity market performance of micro-cap companies across developed markets globally. It does not include emerging markets. The Index is not actively managed and does not reflect any deductions for fees, expenses or taxes. An investor may not invest directly into the Index. |
| Annual Report | April 30, 2021 | 13 |
| Grandeur Peak Global Micro Cap Fund | Performance Update |
April 30, 2021 (Unaudited)
Growth of $10,000 for the period ended April 30, 2021
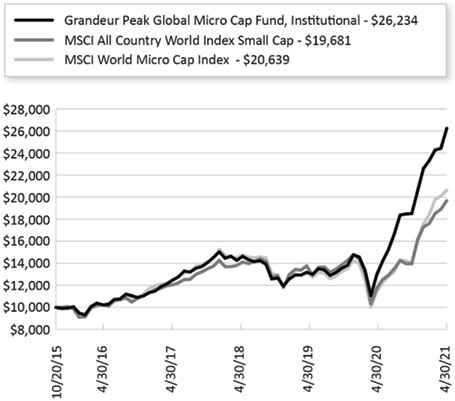
The chart shown above represents a hypothetical investment of $10,000 in the Fund’s Institutional Class shares for the period from inception to April 30, 2021. All returns reflect reinvested dividends, but do not reflect the deduction of taxes that an investor would pay on distributions or redemptions.
Investing in the Fund is subject to investment risks, including possible loss of the principal amount invested.
| 14 | 1.855.377.7325 | www.GrandeurPeakGlobal.com |
| Grandeur Peak Global Micro Cap Fund | Performance Update |
April 30, 2021 (Unaudited)
| Regional Allocation (as a % of Net Assets)* | |
| Europe | 41.4% |
| Asia ex Japan | 19.9% |
| Japan | 15.8% |
| North America | 15.1% |
| Australia/New Zealand | 5.7% |
| Latin America | 1.3% |
| Africa/Middle East | 0.5% |
| Cash, Cash Equivalents, & Other Net Assets | 0.3% |
| Total | 100.0% |
| | |
| Top 10 Holdings (as a % of Net Assets)* | |
| SwedenCare AB | 3.7% |
| Joint Corp. | 3.6% |
| Musti Group Oyj | 2.4% |
| Impax Asset Management Group PLC | 1.8% |
| K3 Capital Group PLC | 1.8% |
| Sarantis SA | 1.8% |
| Westwing Group AG | 1.8% |
| Kogan.com, Ltd. | 1.6% |
| Syuppin Co., Ltd. | 1.5% |
| TK Group Holdings, Ltd. | 1.5% |
| Total | 21.5% |
| * | Holdings are subject to change, and may not reflect the current or future position of the portfolio. |
| Annual Report | April 30, 2021 | 15 |
| Grandeur Peak Global Opportunities Fund | Performance Update |
April 30, 2021 (Unaudited)
Annualized Total Return Performance for the periods ended April 30, 2021
| | | | | Since | Expense Ratio(b) |
| | 1 Year | 3 Years | 5 Years | Inception(a) | Gross | Net(c) |
Grandeur Peak Global Opportunities Fund – Investor (GPGOX) | 82.94% | 20.84% | 19.60% | 17.18% | 1.62% | 1.62% |
Grandeur Peak Global Opportunities Fund – Institutional (GPGIX) | 83.44% | 21.08% | 19.93% | 17.49% | 1.37% | 1.37% |
MSCI All Country World Index Small Cap(d) | 67.65% | 12.55% | 14.11% | 12.75% | | |
| MSCI All Country World Index IMI(e) | 48.76% | 13.72% | 14.40% | 12.25% | | |
Performance data quoted represents past performance. Past performance does not guarantee future results. Investment return and principal value of an investment will fluctuate so that an investor’s shares, when sold or redeemed, may be worth more or less than the original cost. The Fund imposes a 2.00% redemption fee on shares held for less than 60 days. Current performance data may be higher or lower than actual data quoted. For the most current month-end performance data, please call 1-855-377-PEAK (7325).
The table does not reflect the deduction of taxes a shareholder would pay on Fund distributions or redemption of Fund shares.
Subject to investment risks, including possible loss of the principal amount invested.
Returns for periods less than 1 year are cumulative.
| (a) | Fund inception date of October 17, 2011. |
| (b) | Ratios as of the Prospectus dated August 31, 2020 and may differ from the ratios presented in the Financial Highlights. |
| (c) | Grandeur Peak Global Advisors, LLC (the “Adviser”), has agreed to waive and/or reimburse fees or expenses in order to limit Total Annual Fund Operating Expenses After Fee Waiver/ Expense Reimbursement (excluding acquired fund fees and expenses, brokerage expenses, interest expenses, taxes and extraordinary expenses) to 1.75% and 1.50% of the Fund’s average daily net assets for the Fund’s Investor Class Shares and Institutional Class Shares, respectively. This agreement (the “Expense Agreement”) is in effect through August 31, 2021. The Adviser will be permitted to recover, on a class- by-class basis, expenses it has borne the Expense Agreement to the extent that a Fund’s expenses in later periods fall below annual rates set forth in the Expense Agreement; provided, however, that such recapture payments do not cause the Fund’s expense ratio (after recapture) to exceed the lesser of (i) the expense cap in effect at the time of the waiver and (ii) the expense cap in effect at the time of the recapture . Notwithstanding the foregoing, the Fund will not be obligated to pay any such deferred fees and expenses more than three years after the date on which the fee and expenses was deferred. The Expense Agreement may not be terminated or modified prior to August 31, 2021 except with the approval of the Fund’s Board of Trustees. |
| (d) | The MSCI ACWI Small Cap Index is designed to measure the equity market performance of performance of small-cap companies across developed and emerging markets globally. MSCI makes no express or implied warranties or representations and shall have no liability whatsoever with respect to any MSCI data contained herein. The MSCI data may not be further redistributed or used to create indices or financial products. The Index is not actively managed and does not reflect any deductions for fees, expenses or taxes. An investor may not invest directly into the Index. |
| (e) | The MSCI ACWI IMI Index is designed to measure the equity market performance of large, mid, and small-cap companies across developed and emerging markets globally. The Index is not actively managed and does not reflect any deductions for fees, expenses or taxes. An investor may not invest directly into the Index. |
| 16 | 1.855.377.7325 | www.GrandeurPeakGlobal.com |
| Grandeur Peak Global Opportunities Fund | Performance Update |
April 30, 2021 (Unaudited)
Growth of $10,000 for the period ended April 30, 2021
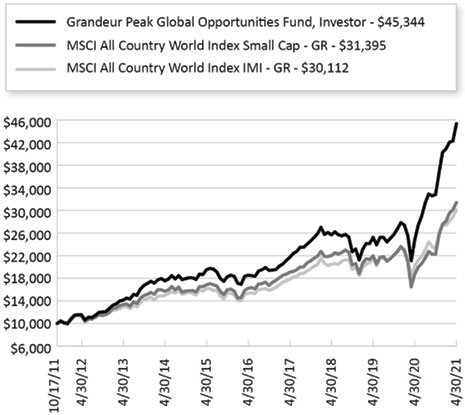
The chart shown above represents a hypothetical investment of $10,000 in the Fund’s Investor Class shares for the period from inception to April 30, 2021. All returns reflect reinvested dividends, but do not reflect the deduction of taxes that an investor would pay on distributions or redemptions.
Investing in the Fund is subject to investment risks, including possible loss of the principal amount invested.
The Fund also offers Institutional Class shares, performance for which is not reflected in the graphs above. The performance of Institutional Class shares may be higher or lower than the performance of the Investor Class shares shown in the graphs above based upon differences in fees paid by shareholders investing in the Investor Class shares and Institutional Class shares.
| Annual Report | April 30, 2021 | 17 |
| Grandeur Peak Global Opportunities Fund | Performance Update |
April 30, 2021 (Unaudited)
| Regional Allocation (as a % of Net Assets)* | |
| Europe | 42.0% |
| North America | 25.7% |
| Asia ex Japan | 18.6% |
| Japan | 8.9% |
| Latin America | 2.7% |
| Africa/Middle East | 1.2% |
| Australia/New Zealand | 0.7% |
| Cash, Cash Equivalents, & Other Net Assets | 0.2% |
| Total | 100.0% |
| | |
| Top 10 Holdings (as a % of Net Assets)* | |
| Dechra Pharmaceuticals PLC | 2.5% |
| Silergy Corp. | 2.2% |
| EPAM Systems, Inc. | 2.1% |
| Endava PLC | 2.0% |
| B&M European Value Retail SA | 1.9% |
| CVS Group PLC | 1.9% |
| Metropolis Healthcare, Ltd. | 1.4% |
| First Republic Bank | 1.4% |
| Heska Corp. | 1.3% |
| WNS Holdings, Ltd. | 1.3% |
| Total | 18.0% |
| * | Holdings are subject to change, and may not reflect the current or future position of the portfolio. |
| 18 | 1.855.377.7325 | www.GrandeurPeakGlobal.com |
| Grandeur Peak Global Reach Fund | Performance Update |
April 30, 2021 (Unaudited)
Annualized Total Return Performance for the periods ended April 30, 2021
| | | | | Since | Expense Ratio(b) |
| | 1 Year | 3 Years | 5 Years | Inception(a) | Gross | Net(c) |
Grandeur Peak Global Reach Fund – Investor (GPROX) | 77.38% | 19.06% | 18.74% | 15.35% | 1.52% | 1.52% |
Grandeur Peak Global Reach Fund – Institutional (GPRIX) | 77.81% | 19.35% | 19.02% | 15.62% | 1.27% | 1.27% |
MSCI All Country World Small Cap Index(d) | 67.65% | 12.55% | 14.11% | 11.46% | | |
MSCI All Country World IMI Index(e) | 48.76% | 13.72% | 14.40% | 11.35% | | |
Performance data quoted represents past performance. Past performance does not guarantee future results. Investment return and principal value of an investment will fluctuate so that an investor’s shares, when sold or redeemed, may be worth more or less than the original cost. The Fund imposes a 2.00% redemption fee on shares held for less than 60 days. Current performance data may be higher or lower than actual data quoted. For the most current month-end performance data, please call 1-855-377-PEAK (7325).
The table does not reflect the deduction of taxes a shareholder would pay on Fund distributions or redemption of Fund shares.
Subject to investment risks, including possible loss of the principal amount invested.
Returns for periods less than 1 year are cumulative.
| (a) | Fund inception date of June 19, 2013. |
| (b) | Ratios as of the Prospectus dated August 31, 2020 and may differ from the ratios presented in the Financial Highlights. |
| (c) | Grandeur Peak Global Advisors, LLC (the “Adviser”), has agreed to waive and/or reimburse fees or expenses in order to limit Total Annual Fund Operating Expenses After Fee Waiver/Expense Reimbursement (excluding acquired fund fees and expenses, brokerage expenses, interest expenses, taxes and extraordinary expenses) to 1.60% and 1.35% of the Fund’s average daily net assets for the Fund’s Investor Class Shares and Institutional Class Shares, respectively. This agreement (the “Expense Agreement”) is in effect through August 31, 2021. The Adviser will be permitted to recover, on a class- by-class basis, expenses it has borne through the Expense Agreement to the extent that a Fund’s expenses in later periods fall below annual rates set forth in the Expense Agreement; provided, however, that such recapture payments do not cause the Fund’s expense ratio (after recapture) to exceed the lesser of (i) the expense cap in effect at the time of the waiver and (ii) the expense cap in effect at the time of the recapture . Notwithstanding the foregoing, the Fund will not be obligated to pay any such deferred fees and expenses more than three years after the date on which the fee and expenses was deferred. The Expense Agreement may not be terminated or modified prior to August 31, 2021 except with the approval of the Fund’s Board of Trustees. |
| (d) | The MSCI ACWI Small Cap Index is designed to measure the equity market performance of performance of small-cap companies across developed and emerging markets globally. MSCI makes no express or implied warranties or representations and shall have no liability whatsoever with respect to any MSCI data contained herein. The MSCI data may not be further redistributed or used to create indices or financial products. The Index is not actively managed and does not reflect any deductions for fees, expenses or taxes. An investor may not invest directly into the Index. |
| (e) | The MSCI ACWI IMI Index is designed to measure the equity market performance of large, mid, and small-cap companies across developed and emerging markets globally. The Index is not actively managed and does not reflect any deductions for fees, expenses or taxes. An investor may not invest directly into the Index. |
| Annual Report | April 30, 2021 | 19 |
| Grandeur Peak Global Reach Fund | Performance Update |
April 30, 2021 (Unaudited)
Growth of $10,000 for the period ended April 30, 2021
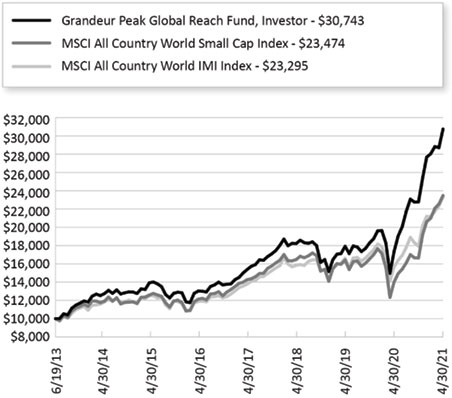
The chart shown above represents a hypothetical investment of $10,000 in the Fund’s Investor Class shares for the period from inception to April 30, 2021. All returns reflect reinvested dividends, but do not reflect the deduction of taxes that an investor would pay on distributions or redemptions.
Investing in the Fund is subject to investment risks, including possible loss of the principal amount invested.
The Fund also offers Institutional Class shares, performance for which is not reflected in the graphs above. The performance of Institutional Class shares may be higher or lower than the performance of the Investor Class shares shown in the graphs above based upon differences in fees paid by shareholders investing in the Investor Class shares and Institutional Class shares.
| 20 | 1.855.377.7325 | www.GrandeurPeakGlobal.com |
| Grandeur Peak Global Reach Fund | Performance Update |
April 30, 2021 (Unaudited)
| Regional Allocation (as a % of Net Assets)* | |
| Europe | 34.9% |
| North America | 29.3% |
| Asia ex Japan | 18.3% |
| Japan | 7.4% |
| Latin America | 3.9% |
| Australia/New Zealand | 3.1% |
| Africa/Middle East | 2.5% |
| Cash, Cash Equivalents, & Other Net Assets | 0.6% |
| Total | 100.0% |
| | |
| Top 10 Holdings (as a % of Net Assets)* | |
| Silergy Corp. | 1.6% |
| Impax Asset Management Group PLC | 1.5% |
| First Republic Bank | 1.4% |
| Esker SA | 1.4% |
| Endava PLC | 1.3% |
| EPAM Systems, Inc. | 1.2% |
| Wix.com, Ltd. | 1.2% |
| EQT AB | 1.1% |
| B&M European Value Retail SA | 1.0% |
| Vietnam Technological & Commercial Joint Stock Bank | 1.0% |
| Total | 12.7% |
| * | Holdings are subject to change, and may not reflect the current or future position of the portfolio. |
| Annual Report | April 30, 2021 | 21 |
| Grandeur Peak Global Stalwarts Fund | Performance Update |
April 30, 2021 (Unaudited)
Annualized Total Return Performance for the periods ended April 30, 2021
| | | | | Since | Expense Ratio(b) |
| | 1 Year | 3 Years | 5 Years | Inception(a) | Gross | Net(c) |
Grandeur Peak Global Stalwarts Fund – Investor (GGSOX)* | 68.24% | 18.74% | 18.74% | 18.08% | 1.24% | 1.24% |
Grandeur Peak Global Stalwarts Fund – Institutional (GGSYX)* | 68.62% | 19.05% | 19.04% | 18.38% | 0.99% | 0.99% |
| MSCI All Country World Mid Cap Index(d) | 54.93% | 11.88% | 12.86% | 12.49% | | |
| MSCI All Country World Small Cap Index(e) | 67.65% | 12.55% | 14.11% | 13.50% | | |
Performance data quoted represents past performance. Past performance does not guarantee future results. Investment return and principal value of an investment will fluctuate so that an investor’s shares, when sold or redeemed, may be worth more or less than the original cost. The Fund imposes a 2.00% redemption fee on shares held for less than 60 days. Current performance data may be higher or lower than actual data quoted. For the most current month-end performance data, please call 1-855-377-PEAK (7325).
The table does not reflect the deduction of taxes a shareholder would pay on Fund distributions or redemption of Fund shares.
Subject to investment risks, including possible loss of the principal amount invested.
Returns for periods less than 1 year are cumulative.
| * | Excludes adjustments in accordance with accounting principles generally accepted in the United States of America and as such, the net asset value and total return for shareholder transactions reported to the market may differ from the net asset value for financial reporting purposes. |
| (a) | Fund inception date of September 1, 2015. |
| (b) | Ratios as of the Prospectus dated August 31, 2020 and may differ from the ratios presented in the Financial Highlights. |
| (c) | Grandeur Peak Global Advisors, LLC (the “Adviser”), has agreed to waive and/or reimburse fees or expenses in order to limit Total Annual Fund Operating Expenses After Fee Waiver/ Expense Reimbursement (excluding acquired fund fees and expenses, brokerage expenses, interest expenses, taxes and extraordinary expenses) to 1.35% and 1.10% of the Fund’s average daily net assets for the Fund’s Investor Class Shares and Institutional Class Shares, respectively. This agreement is in effect through August 31, 2021. The Adviser will be permitted to recover, on a class-by-class basis, expenses it has borne through this agreement to the extent that a Fund’s expenses in later periods fall below annual rates set forth in the Expense Agreement; provided, however, that such recapture payments do not cause the Fund’s expense ratio (after recapture) to exceed the lesser of (i) the expense cap in effect at the time of the waiver and (ii) the expense cap in effect at the time of the recapture . Notwithstanding the foregoing, the Fund will not be obligated to pay any such deferred fees and expenses more than three years after the date on which the fee and expenses was deferred. This agreement may not be terminated or modified prior to August 31, 2021 except with the approval of the Fund’s Board of Trustees. |
| (d) | The MSCI ACWI Mid Cap Index is designed to measure the equity market performance of performance of mid-cap companies across developed and emerging markets globally. MSCI makes no express or implied warranties or representations and shall have no liability whatsoever with respect to any MSCI data contained herein. The MSCI data may not be further redistributed or used to create indices or financial products. The Index is not actively managed and does not reflect any deductions for fees, expenses or taxes. An investor may not invest directly into the Index. |
| (e) | The MSCI ACWI Small Cap Index is designed to measure the equity market performance of small-cap companies across developed and emerging markets globally. The Index is not actively managed and does not reflect any deductions for fees, expenses or taxes. An investor may not invest directly into the Index. |
| 22 | 1.855.377.7325 | www.GrandeurPeakGlobal.com |
| Grandeur Peak Global Stalwarts Fund | Performance Update |
April 30, 2021 (Unaudited)
Growth of $10,000 for the period ended April 30, 2021
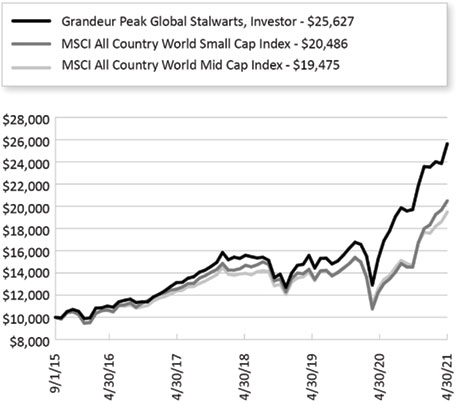
The chart shown above represents a hypothetical investment of $10,000 in the Fund’s Investor Class shares for the period from inception to April 30, 2021. All returns reflect reinvested dividends, but do not reflect the deduction of taxes that an investor would pay on distributions or redemptions.
Investing in the Fund is subject to investment risks, including possible loss of the principal amount invested.
The Fund also offers Institutional Class shares, performance for which is not reflected in the graphs above. The performance of Institutional Class shares may be higher or lower than the performance of the Investor Class shares shown in the graphs above based upon differences in fees paid by shareholders investing in the Investor Class shares and Institutional Class shares.
| Annual Report | April 30, 2021 | 23 |
| Grandeur Peak Global Stalwarts Fund | Performance Update |
April 30, 2021 (Unaudited)
| Regional Allocation (as a % of Net Assets)* | |
| North America | 43.1% |
| Europe | 25.5% |
| Asia ex Japan | 19.9% |
| Japan | 6.6% |
| Latin America | 2.0% |
| Africa/Middle East | 1.1% |
| Australia/New Zealand | 1.0% |
| Cash, Cash Equivalents, & Other Net Assets | 0.8% |
| Total | 100.0% |
| | |
| Top 10 Holdings (as a % of Net Assets)* | |
| Silergy Corp. | 4.0% |
| First Republic Bank | 3.3% |
| EPAM Systems, Inc. | 2.8% |
| Dechra Pharmaceuticals PLC | 2.6% |
| WNS Holdings, Ltd. | 2.4% |
| B&M European Value Retail SA | 2.2% |
| Endava PLC | 2.0% |
| St. James’s Place PLC | 1.5% |
| Intertek Group PLC | 1.3% |
| Fastenal Co. | 1.2% |
| Total | 23.3% |
| * | Holdings are subject to change, and may not reflect the current or future position of the portfolio. |
| 24 | 1.855.377.7325 | www.GrandeurPeakGlobal.com |
| Grandeur Peak International Opportunities Fund | Performance Update |
April 30, 2021 (Unaudited)
Annualized Total Return Performance for the periods ended April 30, 2021
| | | | | Since | Expense Ratio(b) |
| | 1 Year | 3 Years | 5 Years | Inception(a) | Gross | Net(c) |
Grandeur Peak International Opportunities Fund – Investor (GPIOX) | 75.87% | 15.34% | 16.55% | 15.25% | 1.62% | 1.62% |
Grandeur Peak International Opportunities Fund – Institutional (GPIIX) | 76.29% | 15.59% | 16.74% | 15.50% | 1.37% | 1.37% |
MSCI All Country World Index ex USA Small Cap Index(d) | 58.94% | 8.22% | 11.21% | 9.51% | | |
MSCI All Country World IMI ex USA Index(e) | 45.53% | 7.57% | 10.46% | 7.96% | | |
Performance data quoted represents past performance. Past performance does not guarantee future results. Investment return and principal value of an investment will fluctuate so that an investor’s shares, when sold or redeemed, may be worth more or less than the original cost. The Fund imposes a 2.00% redemption fee on shares held for less than 60 days. Current performance data may be higher or lower than actual data quoted. For the most current month-end performance data, please call 1-855-377-PEAK (7325).
The table does not reflect the deduction of taxes a shareholder would pay on Fund distributions or redemption of Fund shares.
Subject to investment risks, including possible loss of the principal amount invested.
Returns for periods less than 1 year are cumulative.
| (a) | Fund inception date of October 17, 2011. |
| (b) | Ratios as of the Prospectus dated August 31, 2020 and may differ from the ratios presented in the Financial Highlights. |
| (c) | Grandeur Peak Global Advisors, LLC (the “Adviser”), has agreed to waive and/or reimburse fees or expenses in order to limit Total Annual Fund Operating Expenses After Fee Waiver/Expense Reimbursements (excluding acquired fund fees and expenses, brokerage expenses, interest expenses, taxes and extraordinary expenses) to 1.75% and 1.50% of the Fund’s average daily net assets for the Fund’s Investor Class Shares and Institutional Class Shares, respectively. This agreement (the “Expense Agreement”) is in effect through August 31, 2021. The Adviser will be permitted to recover, on a class- by-class basis, expenses it has borne through the Expense Agreement to the extent that a Fund’s expenses in later periods fall below annual rates set forth in the Expense Agreement; provided, however, that such recapture payments do not cause the Fund’s expense ratio (after recapture) to exceed the lesser of (i) the expense cap in effect at the time of the waiver and (ii) the expense cap in effect at the time of the recapture . Notwithstanding the foregoing, the Funds will not be obligated to pay any such deferred fees and expenses more than three years after the date on which the fee and expenses was deferred. The Expense Agreement may not be terminated or modified prior to August 31, 2021 except with the approval of the Fund’s Board of Trustees. |
| (d) | The MSCI ACWI ex USA Small Cap Index is designed to measure the equity market performance of small-cap companies across developed and emerging markets globally, excluding the United States. MSCI makes no express or implied warranties or representations and shall have no liability whatsoever with respect to any MSCI data contained herein. The MSCI data may not be further redistributed or used to create indices or financial products. The Index is not actively managed and does not reflect any deductions for fees, expenses or taxes. An investor may not invest directly into the Index. |
| (e) | The MSCI ACWI ex USA IMI Index is designed to measure the equity market performance of large, mid, and small-cap companies across developed and emerging markets globally, excluding the United States. The Index is not actively managed and does not reflect any deductions for fees, expenses or taxes. An investor may not invest directly into the Index. |
| Annual Report | April 30, 2021 | 25 |
| Grandeur Peak International Opportunities Fund | Performance Update |
April 30, 2021 (Unaudited)
Growth of $10,000 for the period ended April 30, 2021
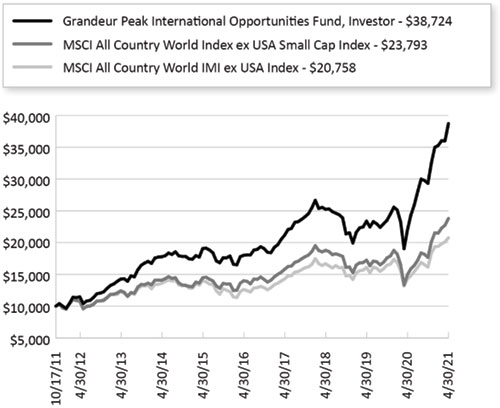
The chart shown above represents a hypothetical investment of $10,000 in the Fund’s Investor Class shares for the period from inception to April 30, 2021. All returns reflect reinvested dividends, but do not reflect the deduction of taxes that an investor would pay on distributions or redemptions.
Investing in the Fund is subject to investment risks, including possible loss of the principal amount invested.
The Fund also offers Institutional Class shares, performance for which is not reflected in the graphs above. The performance of Institutional Class shares may be higher or lower than the performance of the Investor Class shares shown in the graphs above based upon differences in fees paid by shareholders investing in the Investor Class shares and Institutional Class shares.
| 26 | 1.855.377.7325 | www.GrandeurPeakGlobal.com |
| Grandeur Peak International Opportunities Fund | Performance Update |
April 30, 2021 (Unaudited)
| Regional Allocation (as a % of Net Assets)* | |
| Europe | 47.5% |
| Asia ex Japan | 23.0% |
| Japan | 12.2% |
| North America | 7.4% |
| Latin America | 3.4% |
| Australia/New Zealand | 2.1% |
| Africa/Middle East | 1.4% |
| Cash, Cash Equivalents, & Other Net Assets | 3.0% |
| Total | 100.0% |
| | |
| Top 10 Holdings (as a % of Net Assets)* | |
| Dechra Pharmaceuticals PLC | 2.2% |
| CVS Group PLC | 2.2% |
| Silergy Corp. | 2.1% |
| EPAM Systems, Inc. | 2.1% |
| WNS Holdings, Ltd. | 1.7% |
| Endava PLC | 1.5% |
| B&M European Value Retail SA | 1.5% |
| Esker SA | 1.5% |
| Aalberts NV | 1.2% |
| Metropolis Healthcare, Ltd. | 1.2% |
| Total | 17.2% |
| * | Holdings are subject to change, and may not reflect the current or future position of the portfolio. |
| Annual Report | April 30, 2021 | 27 |
| Grandeur Peak International Stalwarts Fund | Performance Update |
April 30, 2021 (Unaudited)
Annualized Total Return Performance for the periods ended April 30, 2021
| | | | | Since | Expense Ratio(b) |
| | 1 Year | 3 Years | 5 Years | Inception(a) | Gross | Net(c) |
Grandeur Peak International Stalwarts Fund – Investor (GISOX)* | 67.13% | 16.90% | 17.97% | 17.71% | 1.17% | 1.17% |
Grandeur Peak International Stalwarts Fund – Institutional (GISYX)* | 67.61% | 17.20% | 18.26% | 17.99% | 0.92% | 0.92% |
| MSCI All Country World ex USA Mid Cap Index(d) | 47.49% | 6.85% | 9.66% | 9.75% | | |
| MSCI All Country World ex USA Small Index(e) | 58.94% | 8.22% | 11.21% | 11.35% | | |
Performance data quoted represents past performance. Past performance does not guarantee future results. Investment return and principal value of an investment will fluctuate so that an investor’s shares, when sold or redeemed, may be worth more or less than the original cost. The Fund imposes a 2.00% redemption fee on shares held for less than 60 days. Current performance data may be higher or lower than actual data quoted. For the most current month-end performance data, please call 1-855-377-PEAK (7325).
The table does not reflect the deduction of taxes a shareholder would pay on Fund distributions or redemption of Fund shares.
Subject to investment risks, including possible loss of the principal amount invested.
Returns for periods less than 1 year are cumulative.
| * | Excludes adjustments in accordance with accounting principles generally accepted in the United States of America and as such, the net asset value and total return for shareholder transactions reported to the market may differ from the net asset value for financial reporting purposes. |
| (a) | Fund inception date of September 1, 2015. |
| (b) | Ratios as of the Prospectus dated August 31, 2020 and may differ from the ratios presented in the Financial Highlights. |
| (c) | Grandeur Peak Global Advisors, LLC (the “Adviser”), has agreed to waive and/or reimburse fees or expenses in order to limit Total Annual Fund Operating Expenses After Fee Waiver/ Expense Reimbursements (excluding acquired fund fees and expenses, brokerage expenses, interest expenses, taxes and extraordinary expenses) to 1.35% and 1.10% of the Fund’s average daily net assets for the Fund’s Investor Class Shares and Institutional Class Shares, respectively. This agreement is in effect through August 31, 2021. The Adviser will be permitted to recover, on a class-by-class basis, expenses it has borne through this agreement to the extent that a Fund’s expenses in later periods fall below annual rates set forth in the Expense Agreement; provided, however, that such recapture payments do not cause the Fund’s expense ratio (after recapture) to exceed the lesser of (i) the expense cap in effect at the time of the waiver and (ii) the expense cap in effect at the time of the recapture . Notwithstanding the foregoing, the Funds will not be obligated to pay any such deferred fees and expenses more than three years after the date on which the fee and expenses was deferred This agreement may not be terminated or modified prior to August 31, 2021 except with the approval of the Fund’s Board of Trustees. |
| (d) | The MSCI ACWI ex USA Mid Cap Index is designed to measure the equity market performance of midcap companies across developed and emerging markets globally, excluding the United States. MSCI makes no express or implied warranties or representations and shall have no liability whatsoever with respect to any MSCI data contained herein. The MSCI data may not be further redistributed or used to create indices or financial products. The Index is not actively managed and does not reflect any deductions for fees, expenses or taxes. An investor may not invest directly into the Index. |
| (e) | The MSCI ACWI ex USA Small Cap Index is designed to measure the equity market performance of small-cap companies across developed and emerging markets globally, excluding the United States. The Index is not actively managed and does not reflect any deductions for fees, expenses or taxes. An investor may not invest directly into the Index. |
| 28 | 1.855.377.7325 | www.GrandeurPeakGlobal.com |
| Grandeur Peak International Stalwarts Fund | Performance Update |
April 30, 2021 (Unaudited)
Growth of $10,000 for the period ended April 30, 2021
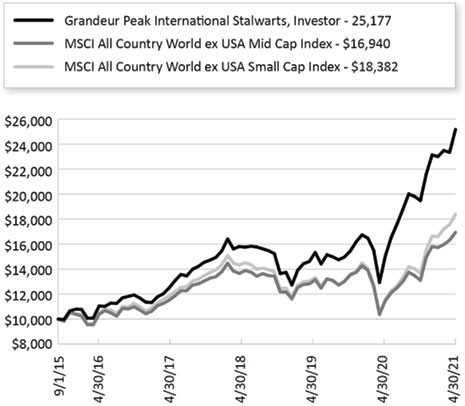
The chart shown above represents a hypothetical investment of $10,000 in the Fund’s Investor Class shares for the period from inception to April 30, 2021. All returns reflect reinvested dividends, but do not reflect the deduction of taxes that an investor would pay on distributions or redemptions.
Investing in the Fund is subject to investment risks, including possible loss of the principal amount invested.
The Fund also offers Institutional Class shares, performance for which is not reflected in the graphs above. The performance of Institutional Class shares may be higher or lower than the performance of the Investor Class shares shown in the graphs above based upon differences in fees paid by shareholders investing in the Investor Class shares and Institutional Class shares.
| Annual Report | April 30, 2021 | 29 |
| Grandeur Peak International Stalwarts Fund | Performance Update |
April 30, 2021 (Unaudited)
| Regional Allocation (as a % of Net Assets)* | |
| Europe | 41.5% |
| Asia ex Japan | 28.8% |
| North America | 12.3% |
| Japan | 10.0% |
| Latin America | 3.1% |
| Africa/Middle East | 1.8% |
| Australia/New Zealand | 1.4% |
| Cash, Cash Equivalents, & Other Net Assets | 1.1% |
| Total | 100.0% |
| | |
| Top 10 Holdings (as a % of Net Assets)* | |
| Silergy Corp. | 5.4% |
| EPAM Systems, Inc. | 4.1% |
| Dechra Pharmaceuticals PLC | 3.8% |
| B&M European Value Retail SA | 3.4% |
| WNS Holdings, Ltd. | 3.3% |
| Endava PLC | 2.4% |
| St. James’s Place PLC | 2.1% |
| EQT AB | 1.9% |
| Intertek Group PLC | 1.9% |
| Wix.com, Ltd. | 1.8% |
| Total | 30.1% |
| * | Holdings are subject to change, and may not reflect the current or future position of the portfolio. |
| 30 | 1.855.377.7325 | www.GrandeurPeakGlobal.com |
| Grandeur Peak US Stalwarts Fund | Performance Update |
April 30, 2021 (Unaudited)
Annualized Total Return Performance for the periods ended April 30, 2021
| | | Since | Expense Ratio(b) |
| | 1 Year | Inception(a) | Gross | Net(c) |
| Grandeur Peak US Stalwarts Fund – Institutional (GUSYX) | 73.67% | 109.72% | 6.10% | 1.00% |
| MSCI USA Mid Cap Index(d) | 62.89% | 88.61% | | |
| MSCI USA Small Cap Index(e) | 76.25% | 104.36% | | |
Performance data quoted represents past performance. Past performance does not guarantee future results. Investment return and principal value of an investment will fluctuate so that an investor’s shares, when sold or redeemed, may be worth more or less than the original cost. The Fund imposes a 2.00% redemption fee on shares held for less than 60 days. Current performance data may be higher or lower than actual data quoted. For the most current month-end performance data, please call 1-855-377-PEAK (7325).
The table does not reflect the deduction of taxes a shareholder would pay on Fund distributions or redemption of Fund shares.
Subject to investment risks, including possible loss of the principal amount invested.
Returns for periods less than 1 year are cumulative.
| (a) | Fund inception date of March 19, 2020. |
| (b) | Ratios as of the Prospectus dated August 31, 2020 and may differ from the ratios presented in the Financial Highlights. |
| (c) | Grandeur Peak Global Advisors, LLC (the “Adviser”), has agreed to waive and/or reimburse fees or expenses in order to limit Total Annual Fund Operating Expenses After Fee Waiver/Expense Reimbursement (excluding acquired fund fees and expenses, brokerage expenses, interest expenses, taxes and extraordinary expenses) to 1.00% of the Fund’s average daily net assets for the Fund’s Institutional Class Shares. This agreement (the “Expense Agreement”) is in effect through August 31, 2021. The Adviser will be permitted to recover, on a class- by-class basis, expenses it has borne through the Expense Agreement to the extent that a Fund’s expenses in later periods fall below annual rates set forth in the Expense Agreement; provided, however, that such recapture payments do not cause the Fund’s expense ratio (after recapture) to exceed the lesser of (i) the expense cap in effect at the time of the waiver and (ii) the expense cap in effect at the time of the recapture. Notwithstanding the foregoing, the Fund will not be obligated to pay any such deferred fees and expenses more than three years after the date on which the fee and expenses was deferred. The Expense Agreement may not be terminated or modified prior to August 31, 2021 except with the approval of the Fund’s Board of Trustees. |
| (d) | The MSCI USA Mid Cap Index is designed to measure the performance of the mid cap segments of the US market. With 339 constituents, the index covers approximately 15% of the free float-adjusted market capitalization in the US. The Index is not actively managed and does not reflect any deductions for fees, expenses or taxes. An investor may not invest directly into the Index. |
| (e) | The MSCI USA Small Cap Index is designed to measure the performance of the small cap segment of the US equity market. With 1,740 constituents, the index represents approximately 14% of the free float-adjusted market capitalization in the US. The Index is not actively managed and does not reflect any deductions for fees, expenses or taxes. An investor may not invest directly into the Index. |
| Annual Report | April 30, 2021 | 31 |
| Grandeur Peak US Stalwarts Fund | Performance Update |
April 30, 2021 (Unaudited)
Growth of $10,000 for the period ended April 30, 2021
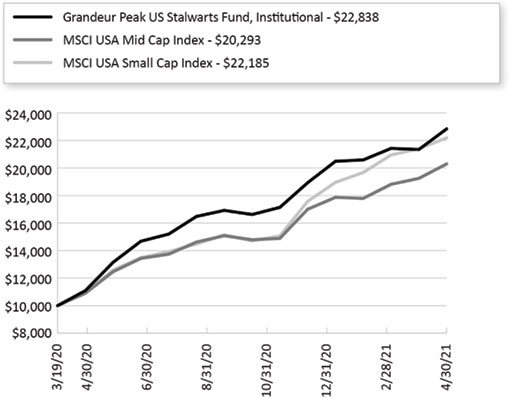
The chart shown above represent a hypothetical investment of $10,000 in the Fund’s Institutional Class shares for the period from inception to April 30, 2021. All returns reflect reinvested dividends, but do not reflect the deduction of taxes that an investor would pay on distributions or redemptions.
Investing in the Fund is subject to investment risks, including possible loss of the principal amount invested.
| 32 | 1.855.377.7325 | www.GrandeurPeakGlobal.com |
| Grandeur Peak US Stalwarts Fund | Performance Update |
April 30, 2021 (Unaudited)
| Regional Allocation (as a % of Net Assets)* | |
| North America | 88.9% |
| Europe | 3.3% |
| Asia ex Japan | 3.0% |
| Africa/Middle East | 2.1% |
| Latin America | 1.5% |
| Cash, Cash Equivalents, & Other Net Assets | 1.2% |
| Total | 100.0% |
| | |
| Top 10 Holdings (as a % of Net Assets)* | |
| First Republic Bank | 3.9% |
| EPAM Systems, Inc. | 3.4% |
| Heska Corp. | 2.7% |
| Endava PLC | 2.6% |
| Pool Corp. | 2.6% |
| PJT Partners, Inc. | 2.5% |
| Paycom Software, Inc. | 2.1% |
| Wix.com, Ltd. | 2.1% |
| WNS Holdings, Ltd. | 2.1% |
| Genpact, Ltd. | 2.0% |
| Total | 26.0% |
| * | Holdings are subject to change, and may not reflect the current or future position of the portfolio. |
| Annual Report | April 30, 2021 | 33 |
| Grandeur Peak Funds® | Disclosure of Fund Expenses |
April 30, 2021
As a shareholder of a Fund, you incur two types of costs: (1) transaction costs, including sales charges (loads) on purchase payments, reinvested dividends, or other distributions; redemption fees; and exchange fees; and (2) ongoing costs, including management fees; distribution and/or service (12b-1) fees; and other Fund expenses. This example is intended to help you understand your ongoing costs (in dollars) of investing in the Fund and to compare these costs with the ongoing costs of investing in other mutual funds.
This example is based on an investment of $1,000 invested at the beginning of the period and held for the entire six-month period of November 1, 2020 through April 30, 2021.
Actual Expenses The first line of the table provides information about actual account values and actual expenses. You may use the information in this line, together with the amount you invested, to estimate the expenses that you paid over the period. Simply divide your account value by $1,000 (for example, an $8,600 account value divided by $1,000 = 8.6), then multiply the result by the number in the first line under the heading “Expenses Paid During Period” to estimate the expenses you paid on your account during this period.
Hypothetical Example for Comparison Purposes The second line of the table provides information about hypothetical account values and hypothetical expenses based on the Fund’s actual expense ratio and an assumed rate of return of 5% per year before expenses, which is not the Fund’s actual return. The hypothetical account values and expenses may not be used to estimate the actual ending account balance or expenses you paid for the period. You may use this information to compare the ongoing costs of investing in the Fund and other mutual funds. To do so, compare this 5% hypothetical example with the 5% hypothetical examples that appear in the shareholder reports of the other funds.
Please note that the expenses shown in the table are meant to highlight your ongoing costs only and do not reflect any transactional costs, such as redemption fees or exchange fees. Therefore, the second line of the table is useful in comparing ongoing costs only and will not help you determine the relative total costs of owning different funds. In addition, if these transactional costs were included, your costs would have been higher.
| 34 | 1.855.377.7325 | www.GrandeurPeakGlobal.com |
| Grandeur Peak Funds® | Disclosure of Fund Expenses |
April 30, 2021
| | Beginning Account
Value
November 1, 2020 | Ending Account
Value
April 30, 2021 | Expense
Ratio(a) | Expenses Paid
During period
November 1, 2020 -
April 30, 2021(b) |
| Grandeur Peak Emerging Markets Opportunities Fund |
| Investor Class | | | | |
| Actual | $1,000.00 | $1,269.10 | 1.64% | $9.23 |
| Hypothetical (5% return before expenses) | $1,000.00 | $1,016.66 | 1.64% | $8.20 |
| Institutional Class | | | | |
| Actual | $1,000.00 | $1,270.10 | 1.41% | $7.94 |
| Hypothetical (5% return before expenses) | $1,000.00 | $1,017.80 | 1.41% | $7.05 |
| Grandeur Peak Global Contrarian Fund | | | | |
| Institutional Class | | | | |
| Actual | $1,000.00 | $1,428.80 | 1.35% | $8.13 |
| Hypothetical (5% return before expenses) | $1,000.00 | $1,018.10 | 1.35% | $6.76 |
| Grandeur Peak Global Micro Cap Fund | | | | |
| Institutional Class | | | | |
| Actual | $1,000.00 | $1,417.50 | 2.00% | $11.99 |
| Hypothetical (5% return before expenses) | $1,000.00 | $1,014.88 | 2.00% | $9.99 |
| Grandeur Peak Global Opportunities Fund | | | | |
| Investor Class | | | | |
| Actual | $1,000.00 | $1,381.60 | 1.47% | $8.68 |
| Hypothetical (5% return before expenses) | $1,000.00 | $1,017.50 | 1.47% | $7.35 |
| Institutional Class | | | | |
| Actual | $1,000.00 | $1,384.20 | 1.23% | $7.27 |
| Hypothetical (5% return before expenses) | $1,000.00 | $1,018.70 | 1.23% | $6.16 |
| Grandeur Peak Global Reach Fund | | | | |
| Investor Class | | | | |
| Actual | $1,000.00 | $1,349.40 | 1.50% | $8.74 |
| Hypothetical (5% return before expenses) | $1,000.00 | $1,017.36 | 1.50% | $7.50 |
| Institutional Class | | | | |
| Actual | $1,000.00 | $1,350.70 | 1.26% | $7.34 |
| Hypothetical (5% return before expenses) | $1,000.00 | $1,018.55 | 1.26% | $6.31 |
| Grandeur Peak Global Stalwarts Fund | | | | |
| Investor Class | | | | |
| Actual | $1,000.00 | $1,300.50 | 1.19% | $6.79 |
| Hypothetical (5% return before expenses) | $1,000.00 | $1,018.89 | 1.19% | $5.96 |
| Institutional Class | | | | |
| Actual | $1,000.00 | $1,302.30 | 0.94% | $5.37 |
| Hypothetical (5% return before expenses) | $1,000.00 | $1,020.13 | 0.94% | $4.71 |
| Grandeur Peak International Opportunities Fund | | | | |
| Investor Class | | | | |
| Actual | $1,000.00 | $1,320.10 | 1.49% | $8.57 |
| Hypothetical (5% return before expenses) | $1,000.00 | $1,017.41 | 1.49% | $7.45 |
| Institutional Class | | | | |
| Actual | $1,000.00 | $1,322.20 | 1.25% | $7.20 |
| Hypothetical (5% return before expenses) | $1,000.00 | $1,018.60 | 1.25% | $6.26 |
| Grandeur Peak International Stalwarts Fund | | | | |
| Investor Class | | | | |
| Actual | $1,000.00 | $1,292.20 | 1.15% | $6.54 |
| Hypothetical (5% return before expenses) | $1,000.00 | $1,019.09 | 1.15% | $5.76 |
| Institutional Class | | | | |
| Actual | $1,000.00 | $1,293.70 | 0.90% | $5.12 |
| Hypothetical (5% return before expenses) | $1,000.00 | $1,020.33 | 0.90% | $4.51 |
| Grandeur Peak US Stalwarts Fund | | | | |
| Institutional Class | | | | |
| Actual | $1,000.00 | $1,332.50 | 1.00% | $5.78 |
| Hypothetical (5% return before expenses) | $1,000.00 | $1,019.84 | 1.00% | $5.01 |
| (a) | The Fund’s expense ratios have been annualized based on the Fund’s most recent fiscal half-year expenses. |
| (b) | Expenses are equal to the Fund’s annualized expense ratio multiplied by the average account value over the period, multiplied by the number of days in the most recent fiscal half-year (181)/365 (to reflect the half-year period). |
| Annual Report | April 30, 2021 | 35 |
| Grandeur Peak Emerging Markets Opportunities Fund | Portfolio of Investments |
April 30, 2021
| | | Shares | | | Value
(Note 2) | |
| COMMON STOCKS (97.08%) | | | | | | | | |
| Argentina (0.86%) | | | | | | | | |
| Globant SA(a) | | | 24,017 | | | $ | 5,504,216 | |
| | | | | | | | | |
| Bangladesh (0.64%) | | | | | | | | |
| Square Pharmaceuticals, Ltd. | | | 1,635,320 | | | | 4,085,648 | |
| | | | | | | | | |
| Brazil (8.77%) | | | | | | | | |
| Arco Platform, Ltd., Class A(a) | | | 110,316 | | | | 2,830,709 | |
| Blau Farmaceutica SA(a) | | | 350,000 | | | | 2,731,934 | |
| Fleury SA | | | 1,035,600 | | | | 4,886,264 | |
| Hypera SA | | | 680,200 | | | | 4,318,829 | |
| Instituto Hermes Pardini SA | | | 1,092,400 | | | | 3,786,764 | |
| Locaweb Servicos de Internet SA(b)(c) | | | 1,770,400 | | | | 9,516,790 | |
| Magazine Luiza SA | | | 544,000 | | | | 2,007,934 | |
| Neogrid Participacoes SA | | | 2,019,000 | | | | 2,698,418 | |
| Pagseguro Digital, Ltd., Class A(a) | | | 212,506 | | | | 9,720,024 | |
| Patria Investments, Ltd.(a) | | | 253,135 | | | | 3,505,920 | |
| Raia Drogasil SA | | | 507,000 | | | | 2,462,175 | |
| TOTVS SA | | | 607,700 | | | | 3,481,489 | |
| Vasta Platform(a) | | | 192,634 | | | | 1,885,887 | |
| Westwing Comercio Varejista Ltda(a) | | | 1,323,500 | | | | 2,183,073 | |
| | | | | | | | 56,016,210 | |
| | | | | | | | | |
| China (20.89%) | | | | | | | | |
| AK Medical Holdings, Ltd.(b)(c) | | | 978,000 | | | | 1,523,453 | |
| Alibaba Group Holding, Ltd.(a) | | | 101,800 | | | | 2,948,730 | |
| ANTA Sports Products, Ltd. | | | 267,000 | | | | 4,795,018 | |
| Autohome, Inc., ADR | | | 32,564 | | | | 3,019,660 | |
| Baozun, Inc.(a) | | | 398,500 | | | | 4,663,339 | |
| CSPC Pharmaceutical Group, Ltd. | | | 4,336,720 | | | | 5,370,828 | |
| Fu Shou Yuan International Group, Ltd. | | | 3,722,000 | | | | 4,024,949 | |
| Hangzhou Robam Appliances Co., Ltd., Class A | | | 1,123,400 | | | | 6,660,721 | |
| Hangzhou Tigermed Consulting Co., Ltd., Class A | | | 125,050 | | | | 3,024,272 | |
| HUYA, Inc., ADR(a) | | | 130,177 | | | | 2,293,719 | |
| JD.com, Inc., Class A(a) | | | 76,100 | | | | 2,927,319 | |
| Jiangsu Hengrui Medicine Co., Ltd., Class A | | | 175,080 | | | | 2,275,242 | |
| Koolearn Technology Holding, Ltd.(a)(b)(c) | | | 1,571,100 | | | | 3,021,755 | |
| Li Ning Co., Ltd. | | | 823,700 | | | | 6,723,000 | |
| Man Wah Holdings, Ltd. | | | 2,750,000 | | | | 5,784,815 | |
| ManpowerGroup Greater China, Ltd.(c) | | | 2,266,500 | | | | 2,885,737 | |
| New Oriental Education & Technology Group, Inc., Sponsored ADR(a) | | | 332,500 | | | | 5,073,950 | |
| O2Micro International, Ltd., ADR(a) | | | 140,582 | | | | 957,363 | |
| | | Shares | | | Value
(Note 2) | |
| China (continued) | | | | | | | | |
| Silergy Corp. | | | 236,422 | | | $ | 24,756,895 | |
| Suofeiya Home Collection Co., Ltd., Class A(a) | | | 1,940,100 | | | | 8,729,925 | |
| Tencent Holdings, Ltd. | | | 58,900 | | | | 4,723,981 | |
| TK Group Holdings, Ltd. | | | 9,196,400 | | | | 4,025,330 | |
| Trip.com Group, Ltd., ADR(a) | | | 179,669 | | | | 7,021,464 | |
| WuXi AppTec Co., Ltd., Class H(b)(c) | | | 270,500 | | | | 6,397,071 | |
| Wuxi Biologics Cayman, Inc.(a)(b)(c) | | | 395,500 | | | | 5,575,263 | |
| Yum China Holdings, Inc. | | | 66,687 | | | | 4,195,946 | |
| | | | | | | | 133,399,745 | |
| | | | | | | | | |
| Colombia (0.93%) | | | | | | | | |
| Parex Resources, Inc.(a) | | | 315,631 | | | | 5,944,643 | |
| | | | | | | | | |
| Egypt (0.52%) | | | | | | | | |
| African Export-Import Bank, GDR | | | 500,000 | | | | 1,610,000 | |
| Integrated Diagnostics Holdings PLC(b)(c) | | | 1,484,400 | | | | 1,736,748 | |
| | | | | | | | 3,346,748 | |
| | | | | | | | | |
| Georgia (1.14%) | | | | | | | | |
| Bank of Georgia Group PLC(a) | | | 185,712 | | | | 2,621,189 | |
| Georgia Capital PLC(a) | | | 186,468 | | | | 1,449,840 | |
| TBC Bank Group PLC(a) | | | 240,293 | | | | 3,232,269 | |
| | | | | | | | 7,303,298 | |
| | | | | | | | | |
| Greece (1.83%) | | | | | | | | |
| JUMBO SA | | | 277,659 | | | | 5,190,855 | |
| Sarantis SA | | | 603,670 | | | | 6,473,829 | |
| | | | | | | | 11,664,684 | |
| | | | | | | | | |
| Hong Kong (2.04%) | | | | | | | | |
| Jacobson Pharma Corp., Ltd.(c) | | | 4,715,800 | | | | 473,538 | |
| Plover Bay Technologies, Ltd.(c) | | | 8,956,000 | | | | 1,706,399 | |
| Techtronic Industries Co., Ltd. | | | 351,000 | | | | 6,398,455 | |
| Vitasoy International Holdings, Ltd. | | | 1,156,383 | | | | 4,473,536 | |
| | | | | | | | 13,051,928 | |
| | | | | | | | | |
| India (17.44%) | | | | | | | | |
| Avenue Supermarts, Ltd.(a)(b)(c) | | | 62,000 | | | | 2,387,928 | |
| Bajaj Finance, Ltd.(a) | | | 72,399 | | | | 5,328,727 | |
| Castrol India, Ltd. | | | 2,727,212 | | | | 4,629,882 | |
| Cera Sanitaryware, Ltd.(a) | | | 3,854 | | | | 200,022 | |
| City Union Bank, Ltd.(a) | | | 1,756,435 | | | | 3,954,039 | |
| Computer Age Management Services, Ltd. | | | 203,629 | | | | 6,386,730 | |
| EPL, Ltd. | | | 1,135,862 | | | | 3,444,887 | |
| Gulf Oil Lubricants India, Ltd. | | | 264,757 | | | | 2,527,742 | |
| Happiest Minds Technologies, Ltd.(a) | | | 631,530 | | | | 6,176,542 | |
See Notes to Financial Statements.
| 36 | 1.855.377.7325 | www.GrandeurPeakGlobal.com |
| Grandeur Peak Emerging Markets Opportunities Fund | Portfolio of Investments |
April 30, 2021
| | | Shares | | | Value
(Note 2) | |
| India (continued) | | | | | | | | |
| HCL Technologies, Ltd. | | | 372,289 | | | $ | 4,518,130 | |
| HDFC Asset Management Co., Ltd.(b)(c) | | | 74,500 | | | | 2,792,373 | |
| HDFC Bank, Ltd.(a) | | | 342,947 | | | | 6,538,784 | |
| Home First Finance Co. India, Ltd.(a)(b)(c) | | | 502,237 | | | | 3,374,577 | |
| IndiaMart InterMesh, Ltd.(a)(b)(c) | | | 106,171 | | | | 11,393,110 | |
| L&T Technology Services, Ltd.(b)(c) | | | 138,752 | | | | 5,111,753 | |
| Marico, Ltd. | | | 345,835 | | | | 1,921,007 | |
| Metropolis Healthcare, Ltd.(b)(c) | | | 372,701 | | | | 12,050,863 | |
| Nippon Life India Asset Management, Ltd.(b)(c) | | | 781,684 | | | | 3,605,946 | |
| Polycab India, Ltd.(a) | | | 201,825 | | | | 3,997,264 | |
| Vaibhav Global, Ltd. | | | 100,932 | | | | 5,681,815 | |
| WNS Holdings, Ltd., ADR(a) | | | 211,650 | | | | 15,329,809 | |
| | | | | | | | 111,351,930 | |
| | | | | | | | | |
| Indonesia (2.94%) | | | | | | | | |
| Ace Hardware Indonesia Tbk PT | | | 26,020,300 | | | | 2,665,977 | |
| Arwana Citramulia Tbk PT | | | 45,188,500 | | | | 2,314,952 | |
| Bank Central Asia Tbk PT | | | 1,271,500 | | | | 2,818,954 | |
| Bank Tabungan Pensiunan Nasional Syariah | | | 14,450,300 | | | | 3,271,200 | |
| Selamat Sempurna Tbk PT | | | 52,028,900 | | | | 4,736,449 | |
| Ultrajaya Milk Industry & Trading Co. Tbk PT | | | 26,276,000 | | | | 2,928,651 | |
| | | | | | | | 18,736,183 | |
| | | | | | | | | |
| Kenya (0.65%) | | | | | | | | |
| Safaricom PLC | | | 11,096,600 | | | | 4,151,579 | |
| | | | | | | | | |
| Malaysia (0.16%) | | | | | | | | |
| Scicom MSC Bhd | | | 3,545,500 | | | | 1,021,309 | |
| | | | | | | | | |
| Mexico (0.94%) | | | | | | | | |
| Grupo Herdez SAB de CV | | | 306,276 | | | | 642,579 | |
| Regional SAB de CV(a) | | | 1,048,200 | | | | 5,347,854 | |
| | | | | | | | 5,990,433 | |
| | | | | | | | | |
| Philippines (3.04%) | | | | | | | | |
| Concepcion Industrial Corp. | | | 1,861,792 | | | | 868,063 | |
| Philippine Seven Corp. | | | 1,023,000 | | | | 2,273,333 | |
| Puregold Price Club, Inc. | | | 7,163,100 | | | | 5,548,985 | |
| Robinsons Land Corp. | | | 8,164,200 | | | | 2,777,354 | |
| Wilcon Depot, Inc. | | | 21,691,900 | | | | 7,928,919 | |
| | | | | | | | 19,396,654 | |
| | | | | | | | | |
| Poland (3.47%) | | | | | | | | |
| Allegro.eu SA(a)(b)(c) | | | 105,054 | | | | 1,610,632 | |
| Dino Polska SA(a)(b)(c) | | | 179,921 | | | | 11,680,964 | |
| LiveChat Software SA | | | 221,945 | | | | 7,315,839 | |
| | | Shares | | | Value
(Note 2) | |
| Poland (continued) | | | | | | | | |
| PGS Software SA | | | 426,467 | | | $ | 1,529,442 | |
| | | | | | | | 22,136,877 | |
| | | | | | | | | |
| Russia (2.23%) | | | | | | | | |
| HeadHunter Group PLC, ADR(a) | | | 141,100 | | | | 5,797,799 | |
| TCS Group Holding PLC, GDR(c) | | | 64,357 | | | | 3,719,835 | |
| Yandex NV, Class A(a) | | | 72,377 | | | | 4,744,312 | |
| | | | | | | | 14,261,946 | |
| | | | | | | | | |
| Singapore (0.66%) | | | | | | | | |
| Riverstone Holdings, Ltd./Singapore | | | 3,882,400 | | | | 4,230,306 | |
| | | | | | | | | |
| South Africa (2.62%) | | | | | | | | |
| Capitec Bank Holdings, Ltd.(a) | | | 23,200 | | | | 2,377,830 | |
| Clicks Group, Ltd. | | | 216,900 | | | | 3,622,353 | |
| Italtile, Ltd. | | | 3,636,472 | | | | 4,277,760 | |
| Transaction Capital, Ltd.(a) | | | 2,843,328 | | | | 6,448,341 | |
| | | | | | | | 16,726,284 | |
| | | | | | | | | |
| South Korea (6.27%) | | | | | | | | |
| Douzone Bizon Co., Ltd. | | | 46,000 | | | | 3,486,133 | |
| Hyundai Ezwel Co., Ltd. | | | 333,659 | | | | 2,963,591 | |
| LEENO Industrial, Inc. | | | 19,622 | | | | 2,875,341 | |
| LG Household & Health Care, Ltd. | | | 5,375 | | | | 7,436,621 | |
| NAVER Corp. | | | 13,560 | | | | 4,382,452 | |
| Orion Corp./Republic of Korea | | | 32,304 | | | | 3,397,823 | |
| Ray Co. Ltd/KR(a) | | | 43,000 | | | | 2,002,427 | |
| Settle Bank, Inc./Korea | | | 96,500 | | | | 2,906,234 | |
| Suprema, Inc.(a) | | | 68,000 | | | | 1,632,220 | |
| Tokai Carbon Korea Co., Ltd. | | | 50,654 | | | | 8,920,860 | |
| | | | | | | | 40,003,702 | |
| | | | | | | | | |
| Taiwan (10.44%) | | | | | | | | |
| ASPEED Technology, Inc. | | | 67,000 | | | | 5,061,039 | |
| Bioteque Corp. | | | 950,000 | | | | 4,251,244 | |
| Brighten Optix Corp. | | | 210,000 | | | | 1,841,907 | |
| eMemory Technology, Inc. | | | 98,000 | | | | 3,613,647 | |
| FineTek Co., Ltd. | | | 409,500 | | | | 1,298,883 | |
| GEM Services, Inc./Tw | | | 901,000 | | | | 2,586,912 | |
| M31 Technology Corp. | | | 164,000 | | | | 2,451,223 | |
| momo.com, Inc. | | | 178,000 | | | | 6,563,563 | |
| Pacific Hospital Supply Co., Ltd. | | | 500,384 | | | | 1,318,450 | |
| Poya International Co., Ltd.(a) | | | 548,000 | | | | 12,006,444 | |
| Rafael Microelectronics, Inc. | | | 138,000 | | | | 760,820 | |
| Realtek Semiconductor Corp. | | | 255,000 | | | | 4,856,621 | |
| Sporton International, Inc. | | | 827,760 | | | | 7,601,061 | |
| Voltronic Power Technology Corp. | | | 192,608 | | | | 8,791,580 | |
See Notes to Financial Statements.
| Annual Report | April 30, 2021 | 37 |
| Grandeur Peak Emerging Markets Opportunities Fund | Portfolio of Investments |
April 30, 2021
| | | Shares | | | Value
(Note 2) | |
| Taiwan (continued) | | | | | | | | |
| Wistron Information Technology & Services Corp. | | | 993,000 | | | $ | 3,661,583 | |
| | | | | | | | 66,664,977 | |
| | | | | | | | | |
| Thailand (1.72%) | | | | | | | | |
| Humanica PCL | | | 6,774,100 | | | | 2,327,832 | |
| Muangthai Capital PCL | | | 1,779,000 | | | | 3,656,556 | |
| Netbay PCL | | | 1,926,100 | | | | 1,917,594 | |
| TOA Paint Thailand PCL | | | 2,776,000 | | | | 3,075,777 | |
| | | | | | | | 10,977,759 | |
| | | | | | | | | |
| Turkey (0.25%) | | | | | | | | |
| DP Eurasia NV(a)(b)(c) | | | 1,646,300 | | | | 1,577,887 | |
| | | | | | | | | |
| United States (2.48%) | | | | | | | | |
| Frontage Holdings Corp.(a)(b)(c) | | | 9,170,000 | | | | 6,244,962 | |
| Genpact, Ltd. | | | 202,183 | | | | 9,609,758 | |
| | | | | | | | 15,854,720 | |
| | | | | | | | | |
| Vietnam (4.15%) | | | | | | | | |
| FPT Corp. | | | 1,592,002 | | | | 5,586,335 | |
| Ho Chi Minh City Development Joint Stock Commercial Bank(a) | | | 2,038,639 | | | | 2,409,582 | |
| Lix Detergent JSC | | | 437,310 | | | | 1,094,461 | |
| Orient Commercial Joint Stock Bank(a) | | | 260,000 | | | | 265,019 | |
| Vietnam Dairy Products JSC | | | 1,899,622 | | | | 7,703,954 | |
| Vietnam Technological & Commercial Joint Stock Bank(a) | | | 3,440,269 | | | | 6,118,023 | |
| Vincom Retail JSC(a) | | | 2,386,220 | | | | 3,312,038 | |
| | | | | | | | 26,489,412 | |
| | | | | | | | | |
| TOTAL COMMON STOCKS | | | | | | | | |
| (Cost $402,019,213) | | | | | | | 619,889,078 | |
| | | | | | | | | |
| TOTAL INVESTMENTS (97.08%) | | | | | |
| (Cost $402,019,213) | | | | | | $ | 619,889,078 | |
| | | | | | | | | |
| Other Assets In Excess Of Liabilities (2.92%) | | | | 18,660,258 | |
| | | | | | | | | |
| NET ASSETS (100.00%) | | | | | | $ | 638,549,336 | |
| (a) | Non-Income Producing Security. |
| (b) | Security exempt from registration under Rule 144A of the Securities Act of 1933. These securities may be resold in the ordinary course of business in transactions exempt from registration, normally to qualified institutional buyers. As of April 30, 2021, these securities had a total aggregate market value of $89,602,075, representing 14.03% of net assets. |
| (c) | Security was purchased pursuant to Regulation S under the Securities Act of 1933, which exempts securities offered and sold outside of the United States from registration. Such security cannot be sold in the United States without either an effective registration statement filed pursuant to the Securities Act of 1933, or pursuant to an exemption from registration. As of April 30, 2021, the aggregate market value of these securities was $98,387,584, representing 15.41% of net assets. |
For Fund compliance purposes, the Fund’s geographical classifications refer to any one or more of the country sub-classifications used by one or more widely recognized market indexes or ratings group indexes, and/or as defined by Fund management. This definition may not apply for purposes of this report, which may combine sub-classifications for reporting ease. Geographical regions are shown as a percentage of net assets.
Sector Composition (April 30, 2021)
| Consumer | 30.1% |
| Technology | 29.8% |
| Financials | 12.4% |
| Health Care | 12.3% |
| Industrials | 9.4% |
| Energy & Materials | 3.1% |
| Cash, Cash Equivalents, & Other Net Assets | 2.9% |
| Total | 100% |
See Notes to Financial Statements.
| 38 | 1.855.377.7325 | www.GrandeurPeakGlobal.com |
| Grandeur Peak Emerging Markets Opportunities Fund | Portfolio of Investments |
April 30, 2021
Industry Composition (April 30, 2021)
| IT Services | 12.5% |
| Semiconductors & Semiconductor Equipment | 8.9% |
| Banks | 6.7% |
| Food & Staples Retailing | 4.4% |
| Internet & Direct Marketing Retail | 4.4% |
| Software | 4.0% |
| Health Care Providers & Services | 3.5% |
| Professional Services | 3.4% |
| Life Sciences Tools & Services | 3.3% |
| Household Durables | 3.3% |
| Specialty Retail | 3.1% |
| Food Products | 3.0% |
| Textiles, Apparel & Luxury Goods | 2.7% |
| Diversified Consumer Services | 2.6% |
| Interactive Media & Services | 2.6% |
| Pharmaceuticals | 2.6% |
| Personal Products | 2.5% |
| Consumer Finance | 2.4% |
| Health Care Equipment & Supplies | 2.4% |
| Electrical Equipment | 2.2% |
| Multiline Retail | 2.2% |
| Capital Markets | 1.8% |
| Trading Companies & Distributors | 1.8% |
| Machinery | 1.6% |
| Chemicals | 1.6% |
| Other Industries (each less than 1%) | 7.6% |
| Cash and Other Assets, Less Liabilities | 2.9% |
| Total | 100% |
See Notes to Financial Statements.
| Annual Report | April 30, 2021 | 39 |
| Grandeur Peak Global Contrarian Fund | Portfolio of Investments |
April 30, 2021
| | | Shares | | | Value
(Note 2) | |
| COMMON STOCKS (97.13%) | | | | | | | | |
| Australia (4.18%) | | | | | | | | |
| Fiducian Group, Ltd. | | | 235,298 | | | $ | 1,223,519 | |
| Kogan.com, Ltd. | | | 41,200 | | | | 351,662 | |
| QANTM Intellectual Property, Ltd. | | | 585,684 | | | | 491,788 | |
| | | | | | | | 2,066,969 | |
| | | | | | | | | |
| Austria (0.46%) | | | | | | | | |
| Schoeller-Bleckmann Oilfield Equipment AG | | | 5,300 | | | | 226,842 | |
| | | | | | | | | |
| Bangladesh (0.64%) | | | | | | | | |
| Square Pharmaceuticals, Ltd. | | | 127,390 | | | | 318,268 | |
| | | | | | | | | |
| Belgium (0.53%) | | | | | | | | |
| X-Fab Silicon Foundries SE(a)(b)(c) | | | 27,095 | | | | 263,207 | |
| | | | | | | | | |
| Britain (10.14%) | | | | | | | | |
| Ascential PLC(a) | | | 73,707 | | | | 355,053 | |
| B&M European Value Retail SA | | | 74,752 | | | | 584,108 | |
| City of London Investment Group PLC | | | 57,641 | | | | 429,866 | |
| Clinigen Group PLC | | | 21,700 | | | | 255,782 | |
| K3 Capital Group PLC | | | 132,654 | | | | 597,235 | |
| On the Beach Group PLC(a)(b)(c) | | | 128,139 | | | | 734,407 | |
| Premier Miton Group PLC | | | 297,038 | | | | 717,889 | |
| Sabre Insurance Group PLC(b)(c) | | | 96,717 | | | | 347,951 | |
| Ultra Electronics Holdings PLC | | | 35,342 | | | | 986,915 | |
| | | | | | | | 5,009,206 | |
| | | | | | | | | |
| Canada (4.42%) | | | | | | | | |
| BioSyent, Inc.(a) | | | 112,087 | | | | 711,287 | |
| Guardian Capital Group, Ltd. | | | 37,292 | | | | 978,454 | |
| Kirkland Lake Gold, Ltd. | | | 13,242 | | | | 492,017 | |
| | | | | | | | 2,181,758 | |
| | | | | | | | | |
| China (3.83%) | | | | | | | | |
| Hangzhou Robam Appliances Co., Ltd., Class A | | | 63,400 | | | | 375,903 | |
| O2Micro International, Ltd., ADR(a) | | | 5,260 | | | | 35,821 | |
| TK Group Holdings, Ltd. | | | 1,744,000 | | | | 763,361 | |
| Xin Point Holdings, Ltd.(c) | | | 1,113,000 | | | | 716,424 | |
| | | | | | | | 1,891,509 | |
| | | | | | | | | |
| Colombia (0.77%) | | | | | | | | |
| Parex Resources, Inc.(a) | | | 20,214 | | | | 380,714 | |
| | | | | | | | | |
| France (3.58%) | | | | | | | | |
| Alten SA(a) | | | 1,400 | | | | 175,217 | |
| Neurones | | | 16,588 | | | | 546,439 | |
| Rothschild & Co.(a) | | | 11,143 | | | | 396,543 | |
| | | Shares | | | Value
(Note 2) | |
| France (continued) | | | | | | | | |
| Thermador Groupe | | | 2,347 | | | $ | 240,408 | |
| Wavestone(a) | | | 9,014 | | | | 411,811 | |
| | | | | | | | 1,770,418 | |
| | | | | | | | | |
| Georgia (1.00%) | | | | | | | | |
| Bank of Georgia Group PLC(a) | | | 16,357 | | | | 230,867 | |
| TBC Bank Group PLC(a) | | | 19,644 | | | | 264,239 | |
| | | | | | | | 495,106 | |
| | | | | | | | | |
| Germany (1.42%) | | | | | | | | |
| Grand City Properties SA | | | 16,417 | | | | 441,328 | |
| Norma Group SE | | | 4,641 | | | | 258,897 | |
| | | | | | | | 700,225 | |
| | | | | | | | | |
| Greece (1.99%) | | | | | | | | |
| Kri-Kri Milk Industry SA | | | 66,238 | | | | 614,782 | |
| Sarantis SA | | | 34,322 | | | | 368,073 | |
| | | | | | | | 982,855 | |
| | | | | | | | | |
| Hong Kong (2.53%) | | | | | | | | |
| Jacobson Pharma Corp., Ltd.(c) | | | 2,980,000 | | | | 299,237 | |
| Plover Bay Technologies, Ltd.(c) | | | 4,993,000 | | | | 951,323 | |
| | | | | | | | 1,250,560 | |
| | | | | | | | | |
| India (4.86%) | | | | | | | | |
| City Union Bank, Ltd.(a) | | | 162,500 | | | | 365,816 | |
| Gulf Oil Lubricants India, Ltd. | | | 50,713 | | | | 484,177 | |
| HCL Technologies, Ltd. | | | 17,988 | | | | 218,304 | |
| Mahanagar Gas, Ltd.(c) | | | 32,237 | | | | 489,762 | |
| Time Technoplast, Ltd. | | | 825,995 | | | | 840,798 | |
| | | | | | | | 2,398,857 | |
| | | | | | | | | |
| Indonesia (1.84%) | | | | | | | | |
| Selamat Sempurna Tbk PT | | | 3,587,700 | | | | 326,606 | |
| Ultrajaya Milk Industry & Trading Co. Tbk PT | | | 2,216,500 | | | | 247,045 | |
| Uni-Charm Indonesia Tbk PT | | | 2,956,100 | | | | 334,595 | |
| | | | | | | | 908,246 | |
| | | | | | | | | |
| Ireland (0.74%) | | | | | | | | |
| Irish Residential Properties REIT PLC | | | 186,406 | | | | 364,399 | |
| | | | | | | | | |
| Italy (1.59%) | | | | | | | | |
| Banca Sistema SpA(a)(b)(c) | | | 137,982 | | | | 345,050 | |
| Piovan SpA(b)(c) | | | 49,469 | | | | 441,300 | |
| | | | | | | | 786,350 | |
| | | | | | | | | |
| Japan (14.37%) | | | | | | | | |
| Beenos, Inc. | | | 27,400 | | | | 757,142 | |
| Central Automotive Products, Ltd. | | | 11,700 | | | | 310,994 | |
| Create SD Holdings Co., Ltd. | | | 11,000 | | | | 333,654 | |
See Notes to Financial Statements.
| 40 | 1.855.377.7325 | www.GrandeurPeakGlobal.com |
| Grandeur Peak Global Contrarian Fund | Portfolio of Investments |
April 30, 2021
| | | Shares | | | Value
(Note 2) | |
| Japan (continued) | | | | | | | | |
| Japan Lifeline Co., Ltd. | | | 51,000 | | | $ | 718,638 | |
| Medikit Co., Ltd. | | | 16,800 | | | | 496,514 | |
| Naigai Trans Line, Ltd. | | | 60,000 | | | | 945,375 | |
| Nikkon Holdings Co., Ltd. | | | 22,500 | | | | 470,834 | |
| Seria Co., Ltd. | | | 37,800 | | | | 1,371,369 | |
| Synchro Food Co., Ltd.(a) | | | 105,600 | | | | 360,406 | |
| Trancom Co., Ltd. | | | 7,800 | | | | 605,216 | |
| YAMADA Consulting Group Co., Ltd. | | | 69,400 | | | | 727,719 | |
| | | | | | | | 7,097,861 | |
| | | | | | | | | |
| Mexico (0.69%) | | | | | | | | |
| Regional SAB de CV(a) | | | 66,900 | | | | 341,320 | |
| | | | | | | | | |
| Netherlands (0.62%) | | | | | | | | |
| Aalberts NV | | | 5,643 | | | | 305,634 | |
| | | | | | | | | |
| New Zealand (0.62%) | | | | | | | | |
| a2 Milk Co., Ltd.(a) | | | 55,884 | | | | 305,928 | |
| | | | | | | | | |
| Oman (0.69%) | | | | | | | | |
| Tethys Oil AB | | | 46,576 | | | | 338,913 | |
| | | | | | | | | |
| Philippines (1.22%) | | | | | | | | |
| Concepcion Industrial Corp. | | | 530,800 | | | | 247,486 | |
| Pryce Corp. | | | 3,213,600 | | | | 353,730 | |
| | | | | | | | 601,216 | |
| | | | | | | | | |
| Singapore (1.54%) | | | | | | | | |
| Riverstone Holdings, Ltd./Singapore | | | 699,800 | | | | 762,510 | |
| | | | | | | | | |
| South Africa (0.93%) | | | | | | | | |
| City Lodge Hotels, Ltd.(a) | | | 849,600 | | | | 251,907 | |
| Italtile, Ltd. | | | 178,471 | | | | 209,944 | |
| | | | | | | | 461,851 | |
| | | | | | | | | |
| South Korea (1.41%) | | | | | | | | |
| HCT Co., Ltd. | | | 31,144 | | | | 488,572 | |
| Tokai Carbon Korea Co., Ltd. | | | 1,181 | | | | 207,990 | |
| | | | | | | | 696,562 | |
| | | | | | | | | |
| Sweden (0.47%) | | | | | | | | |
| Beijer Alma AB | | | 10,407 | | | | 234,311 | |
| | | | | | | | | |
| Taiwan (7.62%) | | | | | | | | |
| Bioteque Corp. | | | 152,000 | | | | 680,199 | |
| FineTek Co., Ltd. | | | 71,000 | | | | 225,203 | |
| Fuzetec Technology Co., Ltd. | | | 147,000 | | | | 377,854 | |
| GEM Services, Inc./Tw | | | 123,000 | | | | 353,152 | |
| Pacific Hospital Supply Co., Ltd. | | | 170,000 | | | | 447,929 | |
| Tehmag Foods Corp. | | | 70,000 | | | | 773,100 | |
| Tofu Restaurant Co., Ltd. | | | 64,000 | | | | 404,396 | |
| | | Shares | | | Value
(Note 2) | |
| Taiwan (continued) | | | | | | | | |
| Wistron Information Technology & Services Corp. | | | 136,000 | | | $ | 501,486 | |
| | | | | | | | 3,763,319 | |
| | | | | | | | | |
| United Arab Emirates (0.92%) | | | | | | | | |
| Aramex PJSC | | | 425,000 | | | | 452,405 | |
| | | | | | | | | |
| United States (16.79%) | | | | | | | | |
| Bank of NT Butterfield & Son, Ltd. | | | 31,556 | | | | 1,237,626 | |
| Barrett Business Services, Inc. | | | 17,301 | | | | 1,268,682 | |
| Esquire Financial Holdings, Inc.(a) | | | 36,657 | | | | 841,278 | |
| First Hawaiian, Inc. | | | 17,500 | | | | 480,550 | |
| Hackett Group, Inc. | | | 57,170 | | | | 950,737 | |
| Healthcare Services Group, Inc. | | | 16,347 | | | | 489,593 | |
| Hingham Institution For Savings The | | | 2,722 | | | | 827,869 | |
| Kimball International, Inc., Class B | | | 51,025 | | | | 743,944 | |
| LGI Homes, Inc.(a) | | | 1,375 | | | | 227,948 | |
| Samsonite International SA(a)(b)(c) | | | 198,000 | | | | 367,566 | |
| TriMas Corp.(a) | | | 7,154 | | | | 227,783 | |
| WW Grainger, Inc. | | | 1,463 | | | | 634,269 | |
| | | | | | | | 8,297,845 | |
| | | | | | | | | |
| Vietnam (4.72%) | | | | | | | | |
| FPT Corp. | | | 145,643 | | | | 511,061 | |
| Hoa Phat Group JSC | | | 146,880 | | | | 370,147 | |
| Orient Commercial Joint Stock Bank(a) | | | 537,500 | | | | 547,874 | |
| Vietnam Dairy Products JSC | | | 119,988 | | | | 486,614 | |
| Vietnam Technological & Commercial Joint Stock Bank(a) | | | 233,000 | | | | 414,357 | |
| | | | | | | | 2,330,053 | |
| | | | | | | | | |
| TOTAL COMMON STOCKS | | | | | | | | |
| (Cost $41,258,988) | | | | | | | 47,985,217 | |
| | | | | | | | | |
| TOTAL INVESTMENTS (97.13%) | | | | | |
| (Cost $41,258,988) | | | | | | $ | 47,985,217 | |
| | | | | | | | | |
| Other Assets In Excess Of Liabilities (2.87%) | | | | 1,417,827 | |
| | | | | | | | | |
| NET ASSETS (100.00%) | | | | | | $ | 49,403,044 | |
See Notes to Financial Statements.
| Annual Report | April 30, 2021 | 41 |
| Grandeur Peak Global Contrarian Fund | Portfolio of Investments |
April 30, 2021
| (a) | Non-Income Producing Security. |
| (b) | Security exempt from registration under Rule 144A of the Securities Act of 1933. These securities may be resold in the ordinary course of business in transactions exempt from registration, normally to qualified institutional buyers. As of April 30, 2021, these securities had a total aggregate market value of $2,499,481, representing 5.06% of net assets. |
| (c) | Security was purchased pursuant to Regulation S under the Securities Act of 1933, which exempts securities offered and sold outside of the United States from registration. Such security cannot be sold in the United States without either an effective registration statement filed pursuant to the Securities Act of 1933, or pursuant to an exemption from registration. As of April 30, 2021, the aggregate market value of these securities was $4,956,227, representing 10.03% of net assets. |
For Fund compliance purposes, the Fund’s geographical classifications refer to any one or more of the country sub-classifications used by one or more widely recognized market indexes or ratings group indexes, and/or as defined by Fund management. This definition may not apply for purposes of this report, which may combine sub-classifications for reporting ease. Geographical regions are shown as a percentage of net assets.
Sector Composition (April 30, 2021)
| Industrials | 24.0% |
| Financials | 21.9% |
| Consumer | 21.3% |
| Technology | 12.4% |
| Health Care | 9.3% |
| Energy & Materials | 7.2% |
| Utilities | 1.0% |
| Cash, Cash Equivalents, & Other Net Assets | 2.9% |
| Total | 100% |
Industry Composition (April 30, 2021)
| Banks | 10.3% |
| Capital Markets | 7.6% |
| Professional Services | 7.2% |
| IT Services | 6.7% |
| Health Care Equipment & Supplies | 6.3% |
| Food Products | 4.9% |
| Machinery | 4.5% |
| Multiline Retail | 4.0% |
| Hotels, Restaurants & Leisure | 2.8% |
| Pharmaceuticals | 2.7% |
| Commercial Services & Supplies | 2.5% |
| Internet & Direct Marketing Retail | 2.2% |
| Oil, Gas & Consumable Fuels | 2.2% |
| Road & Rail | 2.2% |
| Auto Components | 2.1% |
| Aerospace & Defense | 2.0% |
| Communications Equipment | 1.9% |
| Marine | 1.9% |
| Trading Companies & Distributors | 1.8% |
| Metals & Mining | 1.8% |
| Semiconductors & Semiconductor Equipment | 1.7% |
| Containers & Packaging | 1.7% |
| Thrifts & Mortgage Finance | 1.7% |
| Household Durables | 1.2% |
| Other Industries (each less than 1%) | 13.2% |
| Cash and Other Assets, Less Liabilities | 2.9% |
| Total | 100% |
See Notes to Financial Statements.
| 42 | 1.855.377.7325 | www.GrandeurPeakGlobal.com |
| Grandeur Peak Global Micro Cap Fund | Portfolio of Investments |
April 30, 2021
| | | Shares | | | Value
(Note 2) | |
| COMMON STOCKS (99.65%) | | | | | | | | |
| Australia (5.32%) | | | | | | | | |
| Australian Ethical Investment, Ltd. | | | 57,454 | | | $ | 386,387 | |
| Fiducian Group, Ltd. | | | 190,828 | | | | 992,280 | |
| Kogan.com, Ltd. | | | 133,811 | | | | 1,142,142 | |
| National Storage REIT | | | 257,787 | | | | 399,159 | |
| People Infrastructure, Ltd. | | | 76,774 | | | | 266,735 | |
| Redbubble, Ltd.(a) | | | 38,500 | | | | 121,600 | |
| Temple & Webster Group, Ltd.(a) | | | 27,368 | | | | 225,588 | |
| Whispir, Ltd.(a) | | | 85,100 | | | | 211,093 | |
| | | | | | | | 3,744,984 | |
| | | | | | | | | |
| Belgium (0.48%) | | | | | | | | |
| X-Fab Silicon Foundries SE(a)(b)(c) | | | 34,819 | | | | 338,240 | |
| | | | | | | | | |
| Brazil (1.26%) | | | | | | | | |
| Locaweb Servicos de Internet SA(b)(c) | | | 66,400 | | | | 356,933 | |
| Neogrid Participacoes SA | | | 220,300 | | | | 294,434 | |
| Westwing Comercio Varejista Ltda(a) | | | 143,200 | | | | 236,204 | |
| | | | | | | | 887,571 | |
| | | | | | | | | |
| Britain (13.77%) | | | | | | | | |
| AB Dynamics PLC | | | 13,514 | | | | 429,259 | |
| Acacia Pharma Group PLC(a) | | | 82,311 | | | | 232,553 | |
| Bytes Technology Group PLC(a) | | | 38,057 | | | | 259,113 | |
| City of London Investment Group PLC | | | 46,732 | | | | 348,510 | |
| Curtis Banks Group PLC | | | 78,479 | | | | 305,640 | |
| CVS Group PLC(a) | | | 19,010 | | | | 585,456 | |
| dotdigital group PLC | | | 129,000 | | | | 338,494 | |
| Foresight Group Holdings, Ltd.(a) | | | 54,168 | | | | 317,188 | |
| Impax Asset Management Group PLC | | | 93,518 | | | | 1,296,691 | |
| JTC PLC(b)(c) | | | 60,251 | | | | 559,998 | |
| K3 Capital Group PLC | | | 277,632 | | | | 1,249,956 | |
| Keystone Law Group PLC | | | 23,672 | | | | 217,402 | |
| On the Beach Group PLC(a)(b)(c) | | | 126,875 | | | | 727,163 | |
| Pensionbee Group PLC(a) | | | 306,740 | | | | 762,519 | |
| Premier Miton Group PLC | | | 385,142 | | | | 930,821 | |
| Tracsis PLC(a) | | | 19,300 | | | | 226,560 | |
| Tristel PLC | | | 12,810 | | | | 106,147 | |
| Volution Group PLC | | | 86,601 | | | | 498,133 | |
| XPS Pensions Group PLC(c) | | | 173,192 | | | | 295,394 | |
| | | | | | | | 9,686,997 | |
| | | | | | | | | |
| Canada (1.11%) | | | | | | | | |
| Guardian Capital Group, Ltd. | | | 22,300 | | | | 585,100 | |
| Pivotree, Inc.(a) | | | 26,400 | | | | 168,819 | |
| | | Shares | | | Value
(Note 2) | |
| Canada (continued) | | | | | | | | |
| WeCommerce Holdings, Ltd.(a) | | | 1,906 | | | $ | 24,919 | |
| | | | | | | | 778,838 | |
| | | | | | | | | |
| China (1.83%) | | | | | | | | |
| O2Micro International, Ltd., ADR(a) | | | 31,756 | | | | 216,258 | |
| TK Group Holdings, Ltd. | | | 2,452,600 | | | | 1,073,521 | |
| | | | | | | | 1,289,779 | |
| | | | | | | | | |
| Finland (2.41%) | | | | | | | | |
| Musti Group Oyj | | | 44,964 | | | | 1,696,347 | |
| | | | | | | | | |
| France (3.51%) | | | | | | | | |
| Esker SA | | | 3,700 | | | | 1,032,016 | |
| Neurones | | | 9,400 | | | | 309,653 | |
| Sidetrade(a) | | | 1,250 | | | | 269,005 | |
| Thermador Groupe | | | 5,874 | | | | 601,686 | |
| Wavestone(a) | | | 5,647 | | | | 257,987 | |
| | | | | | | | 2,470,347 | |
| | | | | | | | | |
| Georgia (0.21%) | | | | | | | | |
| TBC Bank Group PLC(a) | | | 11,050 | | | | 148,638 | |
| | | | | | | | | |
| Germany (5.89%) | | | | | | | | |
| Deutsche Industrie REIT AG | | | 9,460 | | | | 189,935 | |
| Exasol AG(a) | | | 29,465 | | | | 855,146 | |
| Fashionette AG(a) | | | 10,926 | | | | 441,364 | |
| Home24 SE(a) | | | 39,008 | | | | 914,034 | |
| Marley Spoon AG(a) | | | 111,136 | | | | 226,876 | |
| Nexus AG | | | 3,900 | | | | 269,606 | |
| Westwing Group AG(a) | | | 21,739 | | | | 1,249,293 | |
| | | | | | | | 4,146,254 | |
| | | | | | | | | |
| Greece (2.88%) | | | | | | | | |
| Kri-Kri Milk Industry SA | | | 83,721 | | | | 777,049 | |
| Sarantis SA | | | 116,542 | | | | 1,249,810 | |
| | | | | | | | 2,026,859 | |
| | | | | | | | | |
| Hong Kong (0.54%) | | | | | | | | |
| Plover Bay Technologies, Ltd.(c) | | | 2,008,000 | | | | 382,587 | |
| | | | | | | | | |
| India (6.19%) | | | | | | | | |
| Amrutanjan Health Care, Ltd. | | | 61,461 | | | | 528,047 | |
| Cera Sanitaryware, Ltd.(a) | | | 421 | | | | 21,850 | |
| EPL, Ltd. | | | 72,500 | | | | 219,881 | |
| Gulf Oil Lubricants India, Ltd. | | | 63,717 | | | | 608,332 | |
| Happiest Minds Technologies, Ltd.(a) | | | 43,552 | | | | 425,951 | |
| IndiaMart InterMesh, Ltd.(a)(b)(c) | | | 5,482 | | | | 588,268 | |
| Metropolis Healthcare, Ltd.(b)(c) | | | 18,316 | | | | 592,227 | |
| Vaibhav Global, Ltd. | | | 16,898 | | | | 951,247 | |
See Notes to Financial Statements.
| Annual Report | April 30, 2021 | 43 |
| Grandeur Peak Global Micro Cap Fund | Portfolio of Investments |
April 30, 2021
| | | Shares | | | Value
(Note 2) | |
| India (continued) | | | | | | | | |
| Westlife Development, Ltd.(a) | | | 71,521 | | | $ | 422,092 | |
| | | | | | | | 4,357,895 | |
| | | | | | | | | |
| Indonesia (1.26%) | | | | | | | | |
| Arwana Citramulia Tbk PT | | | 7,920,100 | | | | 405,737 | |
| Selamat Sempurna Tbk PT | | | 5,271,800 | | | | 479,918 | |
| | | | | | | | 885,655 | |
| | | | | | | | | |
| Ireland (0.84%) | | | | | | | | |
| Irish Residential Properties REIT PLC | | | 137,000 | | | | 267,817 | |
| Uniphar PLC | | | 90,411 | | | | 320,656 | |
| | | | | | | | 588,473 | |
| | | | | | | | | |
| Israel (0.20%) | | | | | | | | |
| Max Stock, Ltd.(a) | | | 41,382 | | | | 143,318 | |
| | | | | | | | | |
| Italy (0.60%) | | | | | | | | |
| Piovan SpA(b)(c) | | | 47,181 | | | | 420,889 | |
| | | | | | | | | |
| Japan (15.76%) | | | | | | | | |
| AIT Corp. | | | 35,400 | | | | 341,400 | |
| Atrae, Inc.(a) | | | 7,400 | | | | 113,956 | |
| Beenos, Inc. | | | 38,300 | | | | 1,058,340 | |
| Central Automotive Products, Ltd. | | | 10,900 | | | | 289,729 | |
| Charm Care Corp. | | | 58,400 | | | | 651,917 | |
| Creema, Ltd.(a) | | | 9,400 | | | | 342,749 | |
| eGuarantee, Inc. | | | 23,900 | | | | 460,986 | |
| ENECHANGE, Ltd.(a) | | | 15,200 | | | | 336,851 | |
| geechs, Inc. | | | 15,000 | | | | 227,971 | |
| Kinjiro Co., Ltd. | | | 12,200 | | | | 306,535 | |
| M&A Capital Partners Co., Ltd.(a) | | | 22,400 | | | | 1,037,094 | |
| MarkLines Co., Ltd. | | | 9,100 | | | | 240,718 | |
| Medikit Co., Ltd. | | | 4,000 | | | | 118,218 | |
| Meinan M&A Co., Ltd. | | | 14,500 | | | | 238,814 | |
| Open Door, Inc.(a) | | | 42,800 | | | | 784,804 | |
| Strike Co., Ltd. | | | 6,200 | | | | 260,106 | |
| Sun*, Inc.(a) | | | 16,500 | | | | 339,542 | |
| Synchro Food Co., Ltd.(a) | | | 83,800 | | | | 286,004 | |
| System Information Co., Ltd. | | | 22,000 | | | | 201,903 | |
| Syuppin Co., Ltd. | | | 101,500 | | | | 1,081,961 | |
| TeamSpirit, Inc.(a) | | | 17,800 | | | | 224,271 | |
| Trancom Co., Ltd. | | | 2,700 | | | | 209,498 | |
| User Local, Inc.(a) | | | 3,300 | | | | 139,349 | |
| Vega Corp. Co., Ltd. | | | 54,700 | | | | 851,856 | |
| WDB coco Co., Ltd. | | | 6,600 | | | | 221,329 | |
| YAKUODO Holdings Co., Ltd. | | | 33,600 | | | | 725,556 | |
| | | | | | | | 11,091,457 | |
| | | | | | | | | |
| Netherlands (0.41%) | | | | | | | | |
| Shop Apotheke Europe NV(a)(b)(c) | | | 1,410 | | | | 291,062 | |
| | | Shares | | | Value
(Note 2) | |
| New Zealand (0.34%) | | | | | | | | |
| CBL Corp., Ltd.(a)(d) | | | 159,993 | | | $ | 0 | |
| NZX, Ltd. | | | 162,500 | | | | 240,710 | |
| | | | | | | | 240,710 | |
| | | | | | | | | |
| Norway (2.03%) | | | | | | | | |
| 24sevenoffice Scandinavia AB(a) | | | 99,164 | | | | 412,327 | |
| Medistim ASA | | | 7,989 | | | | 261,053 | |
| Self Storage Group ASA(a) | | | 268,416 | | | | 751,333 | |
| | | | | | | | 1,424,713 | |
| | | | | | | | | |
| Oman (0.31%) | | | | | | | | |
| Tethys Oil AB | | | 30,300 | | | | 220,479 | |
| | | | | | | | | |
| Philippines (1.01%) | | | | | | | | |
| Concepcion Industrial Corp. | | | 334,770 | | | | 156,087 | |
| Pryce Corp. | | | 3,937,000 | | | | 433,356 | |
| Wilcon Depot, Inc. | | | 335,000 | | | | 122,451 | |
| | | | | | | | 711,894 | |
| | | | | | | | | |
| Poland (0.89%) | | | | | | | | |
| Answear.com SA(a) | | | 25,400 | | | | 230,410 | |
| LiveChat Software SA | | | 6,400 | | | | 210,959 | |
| PGS Software SA | | | 51,047 | | | | 183,070 | |
| | | | | | | | 624,439 | |
| | | | | | | | | |
| Singapore (0.53%) | | | | | | | | |
| Riverstone Holdings, Ltd./Singapore | | | 343,600 | | | | 374,390 | |
| | | | | | | | | |
| South Korea (1.53%) | | | | | | | | |
| Hyundai Ezwel Co., Ltd. | | | 25,910 | | | | 230,135 | |
| MegaStudyEdu Co., Ltd. | | | 2,818 | | | | 146,683 | |
| Ray Co. Ltd/KR(a) | | | 3,800 | | | | 176,959 | |
| Suprema, Inc.(a) | | | 8,703 | | | | 208,900 | |
| Tokai Carbon Korea Co., Ltd. | | | 1,781 | | | | 313,658 | |
| | | | | | | | 1,076,335 | |
| | | | | | | | | |
| Sweden (7.52%) | | | | | | | | |
| KNOW IT AB(a) | | | 19,882 | | | | 736,279 | |
| Lyko Group AB(a)(c) | | | 11,292 | | | | 421,505 | |
| OEM International AB, Class B | | | 13,485 | | | | 643,542 | |
| Sdiptech AB(a) | | | 8,000 | | | | 359,103 | |
| SwedenCare AB | | | 40,385 | | | | 2,614,240 | |
| Vitec Software Group AB, Class B | | | 10,899 | | | | 515,625 | |
| | | | | | | | 5,290,294 | |
| | | | | | | | | |
| Taiwan (5.81%) | | | | | | | | |
| Bioteque Corp. | | | 130,000 | | | | 581,749 | |
| Brighten Optix Corp. | | | 77,000 | | | | 675,366 | |
| FineTek Co., Ltd. | | | 96,150 | | | | 304,976 | |
| Fuzetec Technology Co., Ltd. | | | 192,000 | | | | 493,524 | |
| GEM Services, Inc./Tw | | | 182,000 | | | | 522,550 | |
| Poya International Co., Ltd.(a) | | | 16,000 | | | | 350,553 | |
See Notes to Financial Statements.
| 44 | 1.855.377.7325 | www.GrandeurPeakGlobal.com |
| Grandeur Peak Global Micro Cap Fund | Portfolio of Investments |
April 30, 2021
| | | Shares | | | Value
(Note 2) | |
| Taiwan (continued) | | | | | | | | |
| Sporton International, Inc. | | | 60,725 | | | $ | 557,619 | |
| Tehmag Foods Corp. | | | 13,300 | | | | 146,889 | |
| Tofu Restaurant Co., Ltd. | | | 36,050 | | | | 227,789 | |
| Wistron Information Technology & Services Corp. | | | 61,000 | | | | 224,931 | |
| | | | | | | | 4,085,946 | |
| | | | | | | | | |
| Thailand (0.63%) | | | | | | | | |
| Humanica PCL | | | 935,000 | | | | 321,301 | |
| Netbay PCL | | | 125,000 | | | | 124,448 | |
| | | | | | | | 445,749 | |
| | | | | | | | | |
| United States (14.00%) | | | | | | | | |
| 4imprint Group PLC(a) | | | 24,264 | | | | 787,477 | |
| Barrett Business Services, Inc. | | | 9,305 | | | | 682,336 | |
| Better Choice Co., Inc.(a) | | | 249,661 | | | | 347,029 | |
| Castle Biosciences, Inc.(a) | | | 3,300 | | | | 227,799 | |
| Coastal Financial Corp.(a) | | | 12,400 | | | | 369,148 | |
| Esquire Financial Holdings, Inc.(a) | | | 25,349 | | | | 581,759 | |
| Hackett Group, Inc. | | | 19,165 | | | | 318,714 | |
| Heska Corp.(a) | | | 3,666 | | | | 669,595 | |
| Intersect ENT, Inc.(a) | | | 17,275 | | | | 376,768 | |
| Joint Corp.(a) | | | 45,451 | | | | 2,521,621 | |
| LeMaitre Vascular, Inc. | | | 10,200 | | | | 535,194 | |
| Limeade, Inc.(a) | | | 493,905 | | | | 325,310 | |
| MaxCyte, Inc.(a) | | | 74,400 | | | | 932,967 | |
| ProntoForms Corp.(a) | | | 432,000 | | | | 414,726 | |
| Systemax, Inc. | | | 17,800 | | | | 760,416 | |
| | | | | | | | 9,850,859 | |
| | | | | | | | | |
| Vietnam (0.58%) | | | | | | | | |
| Lix Detergent JSC | | | 163,520 | | | | 409,243 | |
| | | | | | | | | |
| TOTAL COMMON STOCKS | | | | | | | | |
| (Cost $43,260,892) | | | | | | | 70,131,241 | |
| | | | | | | | | |
| TOTAL INVESTMENTS (99.65%) | | | | | |
| (Cost $43,260,892) | | | | | | $ | 70,131,241 | |
| | | | | | | | | |
| Other Assets In Excess Of Liabilities (0.35%) | | | | 243,516 | |
| | | | | | | | | |
| NET ASSETS (100.00%) | | | | | | $ | 70,374,757 | |
| (a) | Non-Income Producing Security. |
| (b) | Security exempt from registration under Rule 144A of the Securities Act of 1933. These securities may be resold in the ordinary course of business in transactions exempt from registration, normally to qualified institutional buyers. As of April 30, 2021, these securities had a total aggregate market value of $3,874,780, representing 5.51% of net assets. |
| (c) | Security was purchased pursuant to Regulation S under the Securities Act of 1933, which exempts securities offered and sold outside of the United States from registration. Such security cannot be sold in the United States without either an effective registration statement filed pursuant to the Securities Act of 1933, or pursuant to an exemption from registration. As of April 30, 2021, the aggregate market value of these securities was $4,974,266, representing 7.07% of net assets. |
| (d) | As a result of the use of significant unobservable inputs to determine fair value, these investments have been classified as level 3 assets. See also Note 2 to the financial statements for additional information. |
For Fund compliance purposes, the Fund’s geographical classifications refer to any one or more of the country sub-classifications used by one or more widely recognized market indexes or ratings group indexes, and/or as defined by Fund management. This definition may not apply for purposes of this report, which may combine sub-classifications for reporting ease. Geographical regions are shown as a percentage of net assets.
Sector Composition (April 30, 2021)
| Consumer | 27.3% |
| Technology | 20.7% |
| Health Care | 19.2% |
| Financials | 15.7% |
| Industrials | 14.7% |
| Energy & Materials | 2.1% |
| Cash, Cash Equivalents, & Other Net Assets | 0.3% |
| Total | 100% |
See Notes to Financial Statements.
| Annual Report | April 30, 2021 | 45 |
| Grandeur Peak Global Micro Cap Fund | Portfolio of Investments |
April 30, 2021
Industry Composition (April 30, 2021)
| Internet & Direct Marketing Retail | 13.1% |
| Capital Markets | 11.7% |
| Software | 9.9% |
| Health Care Providers & Services | 7.0% |
| Health Care Equipment & Supplies | 5.5% |
| IT Services | 5.2% |
| Pharmaceuticals | 4.8% |
| Professional Services | 4.2% |
| Trading Companies & Distributors | 3.7% |
| Specialty Retail | 3.2% |
| Personal Products | 2.3% |
| Machinery | 2.1% |
| Semiconductors & Semiconductor Equipment | 2.0% |
| Hotels, Restaurants & Leisure | 2.0% |
| Commercial Services & Supplies | 1.6% |
| Banks | 1.6% |
| Building Products | 1.5% |
| Textiles, Apparel & Luxury Goods | 1.4% |
| Biotechnology | 1.3% |
| Food Products | 1.3% |
| Auto Components | 1.3% |
| Equity Real Estate Investment Trusts (REITs) | 1.2% |
| Media | 1.1% |
| Diversified Financial Services | 1.1% |
| Food & Staples Retailing | 1.0% |
| Electronic Equipment, Instruments & Components | 1.0% |
| Other Industries (each less than 1%) | 7.6% |
| Cash and Other Assets, Less Liabilities | 0.3% |
| Total | 100% |
See Notes to Financial Statements.
| 46 | 1.855.377.7325 | www.GrandeurPeakGlobal.com |
| Grandeur Peak Global Opportunities Fund | Portfolio of Investments |
April 30, 2021
| | | Shares | | | Value
(Note 2) | |
| COMMON STOCKS (99.42%) | | | | | | | | |
| Argentina (0.56%) | | | | | | | | |
| Globant SA(a) | | | 24,775 | | | $ | 5,677,935 | |
| | | | | | | | | |
| Australia (0.72%) | | | | | | | | |
| Fiducian Group, Ltd. | | | 182,850 | | | | 950,796 | |
| Kogan.com, Ltd. | | | 745,408 | | | | 6,362,419 | |
| | | | | | | | 7,313,215 | |
| | | | | | | | | |
| Bangladesh (0.24%) | | | | | | | | |
| Square Pharmaceuticals, Ltd. | | | 962,029 | | | | 2,403,512 | |
| | | | | | | | | |
| Belgium (1.38%) | | | | | | | | |
| Melexis NV | | | 62,854 | | | | 6,846,331 | |
| Warehouses De Pauw CVA | | | 84,756 | | | | 2,987,660 | |
| X-Fab Silicon Foundries SE(a)(b)(c) | | | 442,506 | | | | 4,298,602 | |
| | | | | | | | 14,132,593 | |
| | | | | | | | | |
| Brazil (2.12%) | | | | | | | | |
| Fleury SA | | | 1,000,200 | | | | 4,719,236 | |
| Instituto Hermes Pardini SA | | | 708,600 | | | | 2,456,336 | |
| Locaweb Servicos de Internet SA(b)(c) | | | 642,900 | | | | 3,455,911 | |
| Neogrid Participacoes SA | | | 2,950,700 | | | | 3,943,646 | |
| Pagseguro Digital, Ltd., Class A(a) | | | 126,141 | | | | 5,769,689 | |
| Patria Investments, Ltd.(a) | | | 95,883 | | | | 1,327,979 | |
| | | | | | | | 21,672,797 | |
| | | | | | | | | |
| Britain (17.47%) | | | | | | | | |
| AB Dynamics PLC | | | 67,600 | | | | 2,147,247 | |
| Ascential PLC(a) | | | 1,826,939 | | | | 8,800,513 | |
| B&M European Value Retail SA | | | 2,524,207 | | | | 19,724,017 | |
| Bytes Technology Group PLC(a) | | | 437,194 | | | | 2,976,655 | |
| City of London Investment Group PLC | | | 393,420 | | | | 2,933,983 | |
| Curtis Banks Group PLC | | | 388,399 | | | | 1,512,637 | |
| CVS Group PLC(a) | | | 631,780 | | | | 19,457,103 | |
| Dechra Pharmaceuticals PLC | | | 455,423 | | | | 25,372,210 | |
| Diploma PLC | | | 129,290 | | | | 5,120,962 | |
| Endava PLC, ADR(a) | | | 226,518 | | | | 20,508,940 | |
| Gamma Communications PLC | | | 206,400 | | | | 5,182,162 | |
| Impax Asset Management Group PLC | | | 266,274 | | | | 3,692,070 | |
| JTC PLC(b)(c) | | | 482,638 | | | | 4,485,843 | |
| K3 Capital Group PLC | | | 865,551 | | | | 3,896,886 | |
| On the Beach Group PLC(a)(b)(c) | | | 1,128,677 | | | | 6,468,822 | |
| Pensionbee Group PLC(a) | | | 888,523 | | | | 2,208,760 | |
| Premier Miton Group PLC | | | 1,776,550 | | | | 4,293,613 | |
| Sabre Insurance Group PLC(b)(c) | | | 974,131 | | | | 3,504,552 | |
| Sanne Group PLC | | | 558,317 | | | | 4,981,049 | |
| Softcat PLC | | | 207,456 | | | | 5,492,317 | |
| | | Shares | | | Value
(Note 2) | |
| Britain (continued) | | | | | | | | |
| St. James's Place PLC | | | 445,740 | | | $ | 8,381,210 | |
| Team17 Group PLC(a) | | | 329,984 | | | | 3,531,848 | |
| Tristel PLC | | | 48,517 | | | | 402,025 | |
| Ultra Electronics Holdings PLC | | | 273,063 | | | | 7,625,204 | |
| Volution Group PLC | | | 1,006,553 | | | | 5,789,741 | |
| | | | | | | | 178,490,369 | |
| | | | | | | | | |
| Canada (1.76%) | | | | | | | | |
| Gildan Activewear, Inc.(a) | | | 226,300 | | | | 7,854,174 | |
| Guardian Capital Group, Ltd. | | | 115,200 | | | | 3,022,577 | |
| Pivotree, Inc.(a) | | | 191,300 | | | | 1,223,299 | |
| Richelieu Hardware, Ltd. | | | 168,565 | | | | 5,888,769 | |
| | | | | | | | 17,988,819 | |
| | | | | | | | | |
| China (6.47%) | | | | | | | | |
| CSPC Pharmaceutical Group, Ltd. | | | 2,758,920 | | | | 3,416,795 | |
| Hangzhou Robam Appliances Co., Ltd., Class A | | | 1,028,800 | | | | 6,099,831 | |
| Li Ning Co., Ltd. | | | 738,600 | | | | 6,028,417 | |
| Man Wah Holdings, Ltd. | | | 3,380,900 | | | | 7,111,957 | |
| O2Micro International, Ltd., ADR(a) | | | 289,520 | | | | 1,971,631 | |
| Silergy Corp. | | | 218,352 | | | | 22,864,698 | |
| Suofeiya Home Collection Co., Ltd., Class A(a) | | | 1,758,300 | | | | 7,911,875 | |
| Trip.com Group, Ltd., ADR(a) | | | 138,534 | | | | 5,413,909 | |
| WuXi AppTec Co., Ltd., Class H(b)(c) | | | 222,180 | | | | 5,254,349 | |
| | | | | | | | 66,073,462 | |
| | | | | | | | | |
| Egypt (0.11%) | | | | | | | | |
| Integrated Diagnostics Holdings PLC(b)(c) | | | 933,600 | | | | 1,092,312 | |
| | | | | | | | | |
| Finland (1.02%) | | | | | | | | |
| Musti Group Oyj | | | 276,174 | | | | 10,419,155 | |
| | | | | | | | | |
| France (4.68%) | | | | | | | | |
| Alten SA(a) | | | 60,082 | | | | 7,519,550 | |
| BioMerieux | | | 24,847 | | | | 2,954,982 | |
| Esker SA | | | 35,947 | | | | 10,026,455 | |
| Neurones | | | 110,960 | | | | 3,655,222 | |
| Rothschild & Co.(a) | | | 85,510 | | | | 3,043,024 | |
| Thermador Groupe | | | 73,248 | | | | 7,502,951 | |
| Virbac SA(a) | | | 34,462 | | | | 11,186,674 | |
| Wavestone(a) | | | 42,647 | | | | 1,948,358 | |
| | | | | | | | 47,837,216 | |
| | | | | | | | | |
| Georgia (0.50%) | | | | | | | | |
| Bank of Georgia Group PLC(a) | | | 92,641 | | | | 1,307,560 | |
| Georgia Capital PLC(a) | | | 300,557 | | | | 2,336,914 | |
| TBC Bank Group PLC(a) | | | 110,932 | | | | 1,492,187 | |
| | | | | | | | 5,136,661 | |
See Notes to Financial Statements.
| Annual Report | April 30, 2021 | 47 |
| Grandeur Peak Global Opportunities Fund | Portfolio of Investments |
April 30, 2021
| | | Shares | | | Value
(Note 2) | |
| Germany (7.51%) | | | | | | |
| Atoss Software AG | | | 12,700 | | | $ | 2,830,807 | |
| Dermapharm Holding SE | | | 113,975 | | | | 9,961,868 | |
| Exasol AG(a) | | | 208,200 | | | | 6,042,473 | |
| Fashionette AG(a) | | | 160,243 | | | | 6,473,141 | |
| Friedrich Vorwerk Group SE(a) | | | 60,903 | | | | 3,748,913 | |
| Grand City Properties SA | | | 112,198 | | | | 3,016,155 | |
| Home24 SE(a) | | | 129,187 | | | | 3,027,104 | |
| Nagarro SE(a) | | | 27,170 | | | | 2,979,074 | |
| Nexus AG | | | 82,624 | | | | 5,711,771 | |
| Norma Group SE | | | 213,223 | | | | 11,894,571 | |
| PATRIZIA AG | | | 131,095 | | | | 3,585,620 | |
| PharmaSGP Holding SE(a) | | | 159,300 | | | | 3,160,068 | |
| QIAGEN NV(a) | | | 167,477 | | | | 8,060,668 | |
| Westwing Group AG(a) | | | 108,845 | | | | 6,255,084 | |
| | | | | | | | 76,747,317 | |
| | | | | | | | | |
| Hong Kong (0.24%) | | | | | | | | |
| Jacobson Pharma Corp., Ltd.(c) | | | 2,412,100 | | | | 242,211 | |
| Vitasoy International Holdings, Ltd. | | | 584,000 | | | | 2,259,239 | |
| | | | | | | | 2,501,450 | |
| | | | | | | | | |
| India (4.67%) | | | | | | | | |
| Computer Age Management Services, Ltd. | | | 164,350 | | | | 5,154,762 | |
| EPL, Ltd. | | | 481,054 | | | | 1,458,960 | |
| Gulf Oil Lubricants India, Ltd. | | | 200,637 | | | | 1,915,562 | |
| HCL Technologies, Ltd. | | | 294,138 | | | | 3,569,683 | |
| IndiaMart InterMesh, Ltd.(a)(b)(c) | | | 49,575 | | | | 5,319,847 | |
| L&T Technology Services, Ltd.(b)(c) | | | 89,947 | | | | 3,313,731 | |
| Metropolis Healthcare, Ltd.(b)(c) | | | 431,609 | | | | 13,955,586 | |
| WNS Holdings, Ltd., ADR(a) | | | 180,376 | | | | 13,064,634 | |
| | | | | | | | 47,752,765 | |
| | | | | | | | | |
| Indonesia (1.00%) | | | | | | | | |
| Arwana Citramulia Tbk PT | | | 58,214,800 | | | | 2,982,274 | |
| Selamat Sempurna Tbk PT | | | 56,561,200 | | | | 5,149,047 | |
| Ultrajaya Milk Industry & Trading Co. Tbk PT | | | 18,240,200 | | | | 2,033,002 | |
| | | | | | | | 10,164,323 | |
| | | | | | | | | |
| Ireland (1.56%) | | | | | | | | |
| Irish Residential Properties REIT PLC | | | 4,325,741 | | | | 8,456,250 | |
| Keywords Studios PLC(a) | | | 201,271 | | | | 7,521,707 | |
| | | | | | | | 15,977,957 | |
| | | | | | | | | |
| Israel (0.83%) | | | | | | | | |
| Wix.com, Ltd.(a) | | | 26,747 | | | | 8,502,336 | |
| | | | | | | | | |
| Italy (1.40%) | | | | | | | | |
| DiaSorin SpA | | | 12,949 | | | | 2,198,981 | |
| | | Shares | | | Value
(Note 2) | |
| Italy (continued) | | | | | | | | |
| GVS SpA(a)(b)(c) | | | 179,465 | | | $ | 3,128,560 | |
| Interpump Group SpA | | | 143,595 | | | | 7,647,857 | |
| Piovan SpA(b)(c) | | | 144,291 | | | | 1,287,182 | |
| | | | | | | | 14,262,580 | |
| | | | | | | | | |
| Japan (8.85%) | | | | | | | | |
| AIT Corp. | | | 335,400 | | | | 3,234,620 | |
| Appier Group, Inc.(a) | | | 33,500 | | | | 585,767 | |
| BayCurrent Consulting, Inc. | | | 20,900 | | | | 5,708,345 | |
| Charm Care Corp. | | | 252,000 | | | | 2,813,066 | |
| Create SD Holdings Co., Ltd. | | | 182,700 | | | | 5,541,683 | |
| Japan Lifeline Co., Ltd. | | | 566,600 | | | | 7,983,933 | |
| Kinjiro Co., Ltd. | | | 88,600 | | | | 2,226,147 | |
| M&A Capital Partners Co., Ltd.(a) | | | 164,200 | | | | 7,602,269 | |
| MarkLines Co., Ltd. | | | 45,200 | | | | 1,195,656 | |
| Medikit Co., Ltd. | | | 80,500 | | | | 2,379,129 | |
| MonotaRO Co., Ltd. | | | 136,200 | | | | 3,476,969 | |
| Naigai Trans Line, Ltd. | | | 118,700 | | | | 1,870,266 | |
| Open Door, Inc.(a) | | | 337,300 | | | | 6,184,913 | |
| Seria Co., Ltd. | | | 322,900 | | | | 11,714,690 | |
| Strike Co., Ltd. | | | 94,800 | | | | 3,977,107 | |
| Synchro Food Co., Ltd.(a) | | | 449,300 | | | | 1,533,433 | |
| Systena Corp. | | | 153,200 | | | | 3,152,592 | |
| Syuppin Co., Ltd. | | | 164,600 | | | | 1,754,589 | |
| Trancom Co., Ltd. | | | 73,470 | | | | 5,700,664 | |
| User Local, Inc.(a) | | | 106,100 | | | | 4,480,296 | |
| Visional, Inc.(a) | | | 12,100 | | | | 691,966 | |
| YAKUODO Holdings Co., Ltd. | | | 305,700 | | | | 6,601,263 | |
| | | | | | | | 90,409,363 | |
| | | | | | | | | |
| Mexico (0.85%) | | | | | | | | |
| Grupo Herdez SAB de CV | | | 2,218,966 | | | | 4,655,480 | |
| Regional SAB de CV(a) | | | 781,527 | | | | 3,987,304 | |
| | | | | | | | 8,642,784 | |
| | | | | | | | | |
| Netherlands (1.60%) | | | | | | | | |
| Aalberts NV | | | 143,153 | | | | 7,753,397 | |
| Shop Apotheke Europe NV(a)(b)(c) | | | 41,456 | | | | 8,557,648 | |
| | | | | | | | 16,311,045 | |
| | | | | | | | | |
| New Zealand (0.00%)(d) | | | | | | | | |
| CBL Corp., Ltd.(a)(e) | | | 1,107,672 | | | | 1 | |
| | | | | | | | | |
| Norway (0.20%) | | | | | | | | |
| Medistim ASA | | | 64,055 | | | | 2,093,099 | |
| | | | | | | | | |
| Philippines (0.73%) | | | | | | | | |
| Concepcion Industrial Corp. | | | 1,035,152 | | | | 482,641 | |
| Puregold Price Club, Inc. | | | 6,155,800 | | | | 4,768,668 | |
| Wilcon Depot, Inc. | | | 6,158,500 | | | | 2,251,082 | |
| | | | | | | | 7,502,391 | |
See Notes to Financial Statements.
| 48 | 1.855.377.7325 | www.GrandeurPeakGlobal.com |
| Grandeur Peak Global Opportunities Fund | Portfolio of Investments |
April 30, 2021
| | | Shares | | | Value
(Note 2) | |
| Poland (0.69%) | | | | | | |
| Dino Polska SA(a)(b)(c) | | | 100,797 | | | $ | 6,544,017 | |
| PGS Software SA | | | 138,443 | | | | 496,499 | |
| | | | | | | | 7,040,516 | |
| | | | | | | | | |
| Singapore (0.53%) | | | | | | | | |
| Riverstone Holdings, Ltd./Singapore | | | 4,938,000 | | | | 5,380,500 | |
| | | | | | | | | |
| South Africa (0.25%) | | | | | | | | |
| Italtile, Ltd. | | | 2,148,741 | | | | 2,527,669 | |
| | | | | | | | | |
| South Korea (1.02%) | | | | | | | | |
| LEENO Industrial, Inc. | | | 24,704 | | | | 3,620,040 | |
| Tokai Carbon Korea Co., Ltd. | | | 38,780 | | | | 6,829,687 | |
| | | | | | | | 10,449,727 | |
| | | | | | | | | |
| Sweden (3.67%) | | | | | | | | |
| AddTech AB, Class B | | | 59,087 | | | | 1,032,996 | |
| Beijer Alma AB | | | 321,810 | | | | 7,245,481 | |
| Boozt AB(a)(b)(c) | | | 96,808 | | | | 2,253,942 | |
| Cint Group AB(a) | | | 204,468 | | | | 2,077,154 | |
| EQT AB | | | 101,324 | | | | 3,426,719 | |
| Hexpol AB | | | 325,814 | | | | 4,004,577 | |
| KNOW IT AB(a) | | | 174,959 | | | | 6,479,159 | |
| Lyko Group AB(a)(c) | | | 43,831 | | | | 1,636,113 | |
| OEM International AB, Class B | | | 62,406 | | | | 2,978,191 | |
| Sdiptech AB(a) | | | 44,439 | | | | 1,994,769 | |
| SwedenCare AB | | | 66,792 | | | | 4,323,643 | |
| | | | | | | | 37,452,744 | |
| | | | | | | | | |
| Switzerland (0.40%) | | | | | | | | |
| Partners Group Holding AG | | | 2,850 | | | | 4,056,940 | |
| | | | | | | | | |
| Taiwan (2.33%) | | | | | | | | |
| ASPEED Technology, Inc. | | | 53,500 | | | | 4,041,277 | |
| Bioteque Corp. | | | 1,169,000 | | | | 5,231,268 | |
| Brighten Optix Corp. | | | 172,000 | | | | 1,508,610 | |
| Poya International Co., Ltd.(a) | | | 208,000 | | | | 4,557,190 | |
| Sporton International, Inc. | | | 705,671 | | | | 6,479,956 | |
| Tofu Restaurant Co., Ltd. | | | 47,000 | | | | 296,979 | |
| Voltronic Power Technology Corp. | | | 37,100 | | | | 1,693,427 | |
| | | | | | | | 23,808,707 | |
| | | | | | | | | |
| United States (22.66%) | | | | | | | | |
| 4imprint Group PLC(a) | | | 162,955 | | | | 5,288,628 | |
| Bank of NT Butterfield & Son, Ltd. | | | 209,104 | | | | 8,201,059 | |
| Barrett Business Services, Inc. | | | 47,990 | | | | 3,519,107 | |
| Cardiovascular Systems, Inc.(a) | | | 129,773 | | | | 5,232,447 | |
| Castle Biosciences, Inc.(a) | | | 54,096 | | | | 3,734,247 | |
| EPAM Systems, Inc.(a) | | | 45,978 | | | | 21,046,430 | |
| Esquire Financial Holdings, Inc.(a) | | | 21,936 | | | | 503,431 | |
| Etsy, Inc.(a) | | | 17,631 | | | | 3,504,866 | |
| | | Shares | | | Value
(Note 2) | |
| United States (continued) | | | | | | | | |
| ExlService Holdings, Inc.(a) | | | 66,543 | | | $ | 6,147,242 | |
| First Republic Bank | | | 75,666 | | | | 13,865,038 | |
| Five Below, Inc.(a) | | | 22,052 | | | | 4,438,406 | |
| Frontage Holdings Corp.(a)(b)(c) | | | 2,815,100 | | | | 1,917,142 | |
| FTI Consulting, Inc.(a) | | | 38,574 | | | | 5,356,000 | |
| Genpact, Ltd. | | | 191,300 | | | | 9,092,489 | |
| Glacier Bancorp, Inc. | | | 140,254 | | | | 8,267,973 | |
| Heska Corp.(a) | | | 73,617 | | | | 13,446,145 | |
| Houlihan Lokey, Inc. | | | 42,250 | | | | 2,799,908 | |
| IDEXX Laboratories, Inc.(a) | | | 6,575 | | | | 3,609,609 | |
| Insperity, Inc. | | | 40,139 | | | | 3,513,768 | |
| Joint Corp.(a) | | | 28,615 | | | | 1,587,560 | |
| LeMaitre Vascular, Inc. | | | 173,934 | | | | 9,126,317 | |
| LGI Homes, Inc.(a) | | | 51,189 | | | | 8,486,112 | |
| Littelfuse, Inc. | | | 44,684 | | | | 11,851,984 | |
| Marcus & Millichap, Inc.(a) | | | 138,449 | | | | 4,890,019 | |
| MaxCyte, Inc.(a) | | | 286,500 | | | | 3,592,675 | |
| Moelis & Co., Class A | | | 16,169 | | | | 877,653 | |
| NV5 Global, Inc.(a) | | | 54,534 | | | | 4,915,149 | |
| Ollie's Bargain Outlet Holdings, Inc.(a) | | | 59,788 | | | | 5,516,639 | |
| Paylocity Holding Corp.(a) | | | 10,445 | | | | 2,018,392 | |
| PJT Partners, Inc., Class A | | | 91,475 | | | | 6,726,157 | |
| Poshmark, Inc.(a) | | | 26,850 | | | | 1,123,136 | |
| Power Integrations, Inc. | | | 37,854 | | | | 3,134,690 | |
| PPD, Inc.(a) | | | 97,349 | | | | 4,497,524 | |
| Qualys, Inc.(a) | | | 95,894 | | | | 9,719,816 | |
| Rapid7, Inc.(a) | | | 67,264 | | | | 5,465,200 | |
| Silicon Laboratories, Inc.(a) | | | 21,139 | | | | 2,979,542 | |
| SVB Financial Group(a) | | | 9,863 | | | | 5,639,959 | |
| Systemax, Inc. | | | 145,716 | | | | 6,224,988 | |
| TriMas Corp.(a) | | | 179,710 | | | | 5,721,966 | |
| Ulta Beauty, Inc.(a) | | | 11,927 | | | | 3,928,157 | |
| | | | | | | | 231,507,570 | |
| | | | | | | | | |
| Vietnam (1.40%) | | | | | | | | |
| Vietnam Dairy Products JSC | | | 914,196 | | | | 3,707,540 | |
| Vietnam Technological & Commercial Joint Stock Bank(a) | | | 5,964,004 | | | | 10,606,123 | |
| | | | | | | | 14,313,663 | |
| | | | | | | | | |
| TOTAL COMMON STOCKS | | | | | | | | |
| (Cost $610,028,375) | | | | | | | 1,015,643,493 | |
| | | | | | | | | |
| PREFERRED STOCKS (0.42%) | | | | | | | | |
| United States (0.42%) | | | | | | | | |
| Dataminr Inc - Private Placement(a)(e) | | | 96,640 | | | | 4,252,160 | |
| | | | | | | | | |
| TOTAL PREFERRED STOCKS | | | | | | | | |
| (Cost $1,923,136) | | | | | | | 4,252,160 | |
See Notes to Financial Statements.
| Annual Report | April 30, 2021 | 49 |
| Grandeur Peak Global Opportunities Fund | Portfolio of Investments |
April 30, 2021
| | | Value | |
| TOTAL INVESTMENTS (99.84%) | | | | |
| (Cost $611,951,511) | | $ | 1,019,895,653 | |
| | | | | |
| Other Assets In Excess Of Liabilities (0.16%) | | | 1,666,100 | |
| | | | | |
| NET ASSETS (100.00%) | | $ | 1,021,561,753 | |
| (a) | Non-Income Producing Security. |
| (b) | Security exempt from registration under Rule 144A of the Securities Act of 1933. These securities may be resold in the ordinary course of business in transactions exempt from registration, normally to qualified institutional buyers. As of April 30, 2021, these securities had a total aggregate market value of $74,838,046, representing 7.33% of net assets. |
| (c) | Security was purchased pursuant to Regulation S under the Securities Act of 1933, which exempts securities offered and sold outside of the United States from registration. Such security cannot be sold in the United States without either an effective registration statement filed pursuant to the Securities Act of 1933, or pursuant to an exemption from registration. As of April 30, 2021, the aggregate market value of these securities was $76,716,370, representing 7.51% of net assets. |
| (e) | As a result of the use of significant unobservable inputs to determine fair value, these investments have been classified as level 3 assets. See also Note 2 to the financial statements for additional information. |
For Fund compliance purposes, the Fund's geographical classifications refer to any one or more of the country sub-classifications used by one or more widely recognized market indexes or ratings group indexes, and/or as defined by Fund management. This definition may not apply for purposes of this report, which may combine sub-classifications for reporting ease. Geographical regions are shown as a percentage of net assets.
| Sector Composition (April 30, 2021) | |
| Technology | 29.1% |
| Consumer | 20.2% |
| Health Care | 19.9% |
| Financials | 15.0% |
| Industrials | 14.9% |
| Energy & Materials | 0.7% |
| Cash, Cash Equivalents, & Other Net Assets | 0.2% |
| Total | 100% |
| Industry Composition (April 30, 2021) | |
| IT Services | 14.0% |
| Capital Markets | 7.0% |
| Health Care Equipment & Supplies | 6.3% |
| Pharmaceuticals | 5.9% |
| Software | 5.6% |
| Semiconductors & Semiconductor Equipment | 5.5% |
| Banks | 5.3% |
| Internet & Direct Marketing Retail | 5.0% |
| Health Care Providers & Services | 4.9% |
| Multiline Retail | 4.1% |
| Machinery | 4.1% |
| Trading Companies & Distributors | 3.7% |
| Professional Services | 3.1% |
| Household Durables | 2.9% |
| Specialty Retail | 2.5% |
| Food & Staples Retailing | 2.3% |
| Life Sciences Tools & Services | 1.9% |
| Media | 1.4% |
| Textiles, Apparel & Luxury Goods | 1.4% |
| Food Products | 1.2% |
| Electronic Equipment, Instruments & Components | 1.2% |
| Real Estate Management & Development | 1.1% |
| Equity Real Estate Investment Trusts (REITs) | 1.1% |
| Other Industries (each less than 1%) | 8.3% |
| Cash and Other Assets, Less Liabilities | 0.2% |
| Total | 100% |
See Notes to Financial Statements.
| 50 | 1.855.377.7325 | www.GrandeurPeakGlobal.com |
| Grandeur Peak Global Reach Fund | Portfolio of Investments |
April 30, 2021
| | | Shares | | | Value
(Note 2) | |
| COMMON STOCKS (98.83%) | | | | | | | | |
| Argentina (0.37%) | | | | | | | | |
| Globant SA(a) | | | 6,105 | | | $ | 1,399,144 | |
| | | | | | | | | |
| Australia (2.68%) | | | | | | | | |
| Appen, Ltd. | | | 54,722 | | | | 660,149 | |
| Australian Ethical Investment, Ltd. | | | 373,810 | | | | 2,513,933 | |
| Bravura Solutions, Ltd. | | | 122,268 | | | | 265,614 | |
| EQT Holdings, Ltd. | | | 45,188 | | | | 853,208 | |
| Kogan.com, Ltd. | | | 163,531 | | | | 1,395,817 | |
| National Storage REIT | | | 470,466 | | | | 728,472 | |
| Netwealth Group, Ltd. | | | 89,313 | | | | 1,024,467 | |
| People Infrastructure, Ltd. | | | 299,959 | | | | 1,042,142 | |
| Redbubble, Ltd.(a) | | | 227,593 | | | | 718,838 | |
| Whispir, Ltd.(a) | | | 367,258 | | | | 910,994 | |
| | | | | | | | 10,113,634 | |
| | | | | | | | | |
| Austria (0.27%) | | | | | | | | |
| Schoeller-Bleckmann Oilfield Equipment AG | | | 23,700 | | | | 1,014,367 | |
| | | | | | | | | |
| Bangladesh (0.14%) | | | | | | | | |
| Square Pharmaceuticals, Ltd. | | | 202,545 | | | | 506,034 | |
| | | | | | | | | |
| Belgium (0.58%) | | | | | | | | |
| Melexis NV | | | 10,126 | | | | 1,102,968 | |
| Warehouses De Pauw CVA | | | 30,732 | | | | 1,083,307 | |
| | | | | | | | 2,186,275 | |
| | | | | | | | | |
| Brazil (2.80%) | | | | | | | | |
| Arco Platform, Ltd., Class A(a) | | | 11,542 | | | | 296,168 | |
| Diagnosticos da America SA(a) | | | 52,000 | | | | 551,202 | |
| Fleury SA | | | 339,800 | | | | 1,603,276 | |
| Hypera SA | | | 81,800 | | | | 519,377 | |
| Instituto Hermes Pardini SA | | | 198,300 | | | | 687,400 | |
| Locaweb Servicos de Internet SA(b)(c) | | | 327,268 | | | | 1,759,230 | |
| Neogrid Participacoes SA | | | 702,600 | | | | 939,033 | |
| Pagseguro Digital, Ltd., Class A(a) | | | 51,452 | | | | 2,353,414 | |
| Patria Investments, Ltd.(a) | | | 53,975 | | | | 747,554 | |
| Pet Center Comercio e Participacoes SA | | | 40,000 | | | | 174,299 | |
| Raia Drogasil SA | | | 140,000 | | | | 679,891 | |
| Vasta Platform(a) | | | 26,251 | | | | 256,997 | |
| | | | | | | | 10,567,841 | |
| | | | | | | | | |
| Britain (14.58%) | | | | | | | | |
| AB Dynamics PLC | | | 51,876 | | | | 1,647,790 | |
| Abcam PLC(a) | | | 65,482 | | | | 1,381,824 | |
| Ascential PLC(a) | | | 67,756 | | | | 326,386 | |
| B&M European Value Retail SA | | | 487,900 | | | | 3,812,424 | |
| Bytes Technology Group PLC(a) | | | 113,792 | | | | 774,758 | |
| | | Shares | | | Value
(Note 2) | |
| Britain (continued) | | | | | | | | |
| Clinigen Group PLC | | | 91,173 | | | $ | 1,074,675 | |
| Curtis Banks Group PLC | | | 104,800 | | | | 408,148 | |
| CVS Group PLC(a) | | | 74,800 | | | | 2,303,636 | |
| Darktrace PLC(a) | | | 25,000 | | | | 113,936 | |
| Dechra Pharmaceuticals PLC | | | 62,014 | | | | 3,454,881 | |
| Diploma PLC | | | 18,786 | | | | 744,082 | |
| dotdigital group PLC | | | 721,682 | | | | 1,893,682 | |
| Endava PLC, ADR(a) | | | 52,553 | | | | 4,758,149 | |
| First Derivatives PLC(a) | | | 7,600 | | | | 307,006 | |
| Foresight Group Holdings, Ltd.(a) | | | 216,892 | | | | 1,270,038 | |
| FRP Advisory Group PLC | | | 238,865 | | | | 394,210 | |
| Gamma Communications PLC | | | 74,969 | | | | 1,882,275 | |
| GlobalData PLC | | | 27,797 | | | | 600,786 | |
| Impax Asset Management Group PLC | | | 415,217 | | | | 5,757,266 | |
| Intertek Group PLC | | | 20,231 | | | | 1,714,951 | |
| JTC PLC(b)(c) | | | 369,856 | | | | 3,437,599 | |
| K3 Capital Group PLC | | | 532,428 | | | | 2,397,099 | |
| Keystone Law Group PLC | | | 119,151 | | | | 1,094,276 | |
| Ocado Group PLC(a) | | | 18,958 | | | | 549,033 | |
| On the Beach Group PLC(a)(b)(c) | | | 541,626 | | | | 3,104,238 | |
| Pensionbee Group PLC(a) | | | 815,693 | | | | 2,027,714 | |
| Rotork PLC | | | 140,010 | | | | 666,318 | |
| Sanne Group PLC | | | 295,332 | | | | 2,634,817 | |
| Softcat PLC | | | 28,098 | | | | 743,884 | |
| Team17 Group PLC(a) | | | 34,619 | | | | 370,530 | |
| Tristel PLC | | | 25,000 | | | | 207,157 | |
| Ultra Electronics Holdings PLC | | | 40,770 | | | | 1,138,490 | |
| Volution Group PLC | | | 193,447 | | | | 1,112,716 | |
| XPS Pensions Group PLC(c) | | | 510,185 | | | | 870,166 | |
| | | | | | | | 54,974,940 | |
| | | | | | | | | |
| Canada (1.17%) | | | | | | | | |
| Gildan Activewear, Inc.(a) | | | 49,600 | | | | 1,721,463 | |
| Guardian Capital Group, Ltd. | | | 16,000 | | | | 419,802 | |
| Pivotree, Inc.(a) | | | 50,200 | | | | 321,012 | |
| Richelieu Hardware, Ltd. | | | 17,100 | | | | 597,383 | |
| Ritchie Bros Auctioneers, Inc. | | | 21,401 | | | | 1,361,104 | |
| | | | | | | | 4,420,764 | |
| | | | | | | | | |
| China (4.72%) | | | | | | | | |
| CSPC Pharmaceutical Group, Ltd. | | | 769,520 | | | | 953,015 | |
| Guangzhou KDT Machinery Co., Ltd.(a) | | | 93,100 | | | | 776,133 | |
| Hangzhou Robam Appliances Co., Ltd., Class A | | | 102,700 | | | | 608,916 | |
| HUYA, Inc., ADR(a) | | | 21,488 | | | | 378,618 | |
| Koolearn Technology Holding, Ltd.(a)(b)(c) | | | 141,400 | | | | 271,960 | |
| Li Ning Co., Ltd. | | �� | 73,800 | | | | 602,352 | |
| Man Wah Holdings, Ltd. | | | 660,800 | | | | 1,390,039 | |
| ManpowerGroup Greater China, Ltd.(c) | | | 578,000 | | | | 735,917 | |
See Notes to Financial Statements.
| Annual Report | April 30, 2021 | 51 |
| Grandeur Peak Global Reach Fund | Portfolio of Investments |
April 30, 2021
| | | Shares | | | Value
(Note 2) | |
| China (continued) | | | | | | | | |
| O2Micro International, Ltd., ADR(a) | | | 117,745 | | | $ | 801,843 | |
| Silergy Corp. | | | 56,925 | | | | 5,960,893 | |
| Suofeiya Home Collection Co., Ltd., Class A(a) | | | 134,100 | | | | 603,414 | |
| TK Group Holdings, Ltd. | | | 1,830,000 | | | | 801,004 | |
| Trip.com Group, Ltd., ADR(a) | | | 13,250 | | | | 517,810 | |
| WuXi AppTec Co., Ltd., Class H(b)(c) | | | 118,760 | | | | 2,808,563 | |
| Yum China Holdings, Inc. | | | 8,943 | | | | 562,693 | |
| | | | | | | | 17,773,170 | |
| | | | | | | | | |
| Colombia (0.74%) | | | | | | | | |
| Parex Resources, Inc.(a) | | | 148,861 | | | | 2,803,671 | |
| | | | | | | | | |
| Egypt (0.26%) | | | | | | | | |
| African Export-Import Bank, GDR | | | 200,000 | | | | 644,000 | |
| Integrated Diagnostics Holdings PLC(b)(c) | | | 291,972 | | | | 341,607 | |
| | | | | | | | 985,607 | |
| | | | | | | | | |
| Finland (0.76%) | | | | | | | | |
| Musti Group Oyj | | | 75,531 | | | | 2,849,541 | |
| | | | | | | | | |
| France (3.22%) | | | | | | | | |
| Alten SA(a) | | | 10,400 | | | | 1,301,610 | |
| BioMerieux | | | 2,676 | | | | 318,249 | |
| Bureau Veritas SA(a) | | | 35,351 | | | | 1,056,998 | |
| Esker SA | | | 18,548 | | | | 5,173,469 | |
| Neurones | | | 17,282 | | | | 569,300 | |
| Sidetrade(a) | | | 2,745 | | | | 590,734 | |
| Thermador Groupe | | | 19,759 | | | | 2,023,957 | |
| Virbac SA(a) | | | 3,383 | | | | 1,098,152 | |
| | | | | | | | 12,132,469 | |
| | | | | | | | | |
| Germany (4.53%) | | | | | | | | |
| Dermapharm Holding SE | | | 17,100 | | | | 1,494,608 | |
| Deutsche Industrie REIT AG | | | 21,300 | | | | 427,654 | |
| Exasol AG(a) | | | 45,800 | | | | 1,329,228 | |
| Fashionette AG(a) | | | 41,523 | | | | 1,677,354 | |
| Friedrich Vorwerk Group SE(a) | | | 21,968 | | | | 1,352,251 | |
| Home24 SE(a) | | | 65,399 | | | | 1,532,427 | |
| Nagarro SE(a) | | | 8,803 | | | | 965,211 | |
| Nexus AG | | | 11,031 | | | | 762,570 | |
| Norma Group SE | | | 13,460 | | | | 750,861 | |
| PATRIZIA AG | | | 53,603 | | | | 1,466,112 | |
| PharmaSGP Holding SE(a) | | | 32,536 | | | | 645,424 | |
| Puma SE(a) | | | 5,149 | | | | 543,023 | |
| QIAGEN NV(a) | | | 24,225 | | | | 1,165,949 | |
| Westwing Group AG(a) | | | 51,400 | | | | 2,953,845 | |
| | | | | | | | 17,066,517 | |
| | | | | | | | | |
| Greece (0.72%) | | | | | | | | |
| Kri-Kri Milk Industry SA | | | 61,300 | | | | 568,951 | |
| | | Shares | | | Value
(Note 2) | |
| Greece (continued) | | | | | | | | |
| Sarantis SA | | | 199,040 | | | $ | 2,134,528 | |
| | | | | | | | 2,703,479 | |
| | | | | | | | | |
| Hong Kong (1.17%) | | | | | | | | |
| Jacobson Pharma Corp., Ltd.(c) | | | 2,583,300 | | | | 259,403 | |
| Plover Bay Technologies, Ltd.(c) | | | 3,254,000 | | | | 619,989 | |
| Techtronic Industries Co., Ltd. | | | 122,000 | | | | 2,223,964 | |
| Vitasoy International Holdings, Ltd. | | | 336,000 | | | | 1,299,836 | |
| | | | | | | | 4,403,192 | |
| | | | | | | | | |
| India (4.59%) | | | | | | | | |
| Avenue Supermarts, Ltd.(a)(b)(c) | | | 15,385 | | | | 592,553 | |
| Cera Sanitaryware, Ltd.(a) | | | 2,253 | | | | 116,930 | |
| Computer Age Management Services, Ltd. | | | 15,000 | | | | 470,468 | |
| EPL, Ltd. | | | 367,424 | | | | 1,114,338 | |
| Gulf Oil Lubricants India, Ltd. | | | 100,176 | | | | 956,421 | |
| HCL Technologies, Ltd. | | | 43,536 | | | | 528,356 | |
| HDFC Bank, Ltd.(a) | | | 67,037 | | | | 1,278,158 | |
| IndiaMart InterMesh, Ltd.(a)(b)(c) | | | 15,491 | | | | 1,662,325 | |
| L&T Technology Services, Ltd.(b)(c) | | | 28,748 | | | | 1,059,103 | |
| Metropolis Healthcare, Ltd.(b)(c) | | | 90,081 | | | | 2,912,667 | |
| Poly Medicure, Ltd.(a) | | | 33,085 | | | | 443,419 | |
| Polycab India, Ltd.(a) | | | 41,000 | | | | 812,029 | |
| Time Technoplast, Ltd. | | | 1,106,883 | | | | 1,126,720 | |
| Vaibhav Global, Ltd. | | | 8,197 | | | | 461,438 | |
| Westlife Development, Ltd.(a) | | | 75,255 | | | | 444,129 | |
| WNS Holdings, Ltd., ADR(a)(d) | | | 46,019 | | | | 3,333,156 | |
| | | | | | | | 17,312,210 | |
| | | | | | | | | |
| Indonesia (1.19%) | | | | | | | | |
| Arwana Citramulia Tbk PT | | | 26,137,200 | | | | 1,338,978 | |
| Bank Central Asia Tbk PT | | | 332,700 | | | | 737,606 | |
| Selamat Sempurna Tbk PT | | | 19,027,700 | | | | 1,732,186 | |
| Ultrajaya Milk Industry & Trading Co. Tbk PT | | | 6,163,200 | | | | 686,933 | |
| | | | | | | | 4,495,703 | |
| | | | | | | | | |
| Ireland (0.89%) | | | | | | | | |
| Keywords Studios PLC(a) | | | 39,519 | | | | 1,476,866 | |
| Uniphar PLC | | | 523,697 | | | | 1,857,372 | |
| | | | | | | | 3,334,238 | |
| | | | | | | | | |
| Israel (1.23%) | | | | | | | | |
| Max Stock, Ltd.(a) | | | 85,618 | | | | 296,520 | |
| Wix.com, Ltd.(a)(d) | | | 13,652 | | | | 4,339,698 | |
| | | | | | | | 4,636,218 | |
| | | | | | | | | |
| Italy (0.70%) | | | | | | | | |
| GVS SpA(a)(b)(c) | | | 17,537 | | | | 305,718 | |
See Notes to Financial Statements.
| 52 | 1.855.377.7325 | www.GrandeurPeakGlobal.com |
| Grandeur Peak Global Reach Fund | Portfolio of Investments |
April 30, 2021
| | | Shares | | | Value (Note 2) | |
| Italy (continued) | | | | | | | | |
| Interpump Group SpA | | | 20,850 | | | $ | 1,110,469 | |
| Piovan SpA(b)(c) | | | 138,608 | | | | 1,236,485 | |
| | | | | | | | 2,652,672 | |
| | | | | | | | | |
| Japan (7.38%) | | | | | | | | |
| AIT Corp. | | | 58,900 | | | | 568,036 | |
| Appier Group, Inc.(a) | | | 12,100 | | | | 211,576 | |
| BASE, Inc.(a) | | | 29,000 | | | | 483,731 | |
| BayCurrent Consulting, Inc. | | | 10,900 | | | | 2,977,079 | |
| Beenos, Inc. | | | 27,500 | | | | 759,905 | |
| Charm Care Corp. | | | 68,600 | | | | 765,779 | |
| Coconala, Inc.(a) | | | 19,100 | | | | 355,995 | |
| Creema, Ltd.(a) | | | 13,000 | | | | 474,014 | |
| eGuarantee, Inc. | | | 6,400 | | | | 123,444 | |
| ENECHANGE, Ltd.(a) | | | 16,600 | | | | 367,876 | |
| Funai Soken Holdings, Inc. | | | 36,700 | | | | 650,788 | |
| geechs, Inc. | | | 46,100 | | | | 700,632 | |
| gremz, Inc. | | | 69,100 | | | | 1,175,377 | |
| Industrial & Infrastructure Fund Investment Corp. | | | 409 | | | | 741,357 | |
| Japan Lifeline Co., Ltd. | | | 79,700 | | | | 1,123,049 | |
| Kinjiro Co., Ltd. | | | 29,100 | | | | 731,161 | |
| MarkLines Co., Ltd. | | | 24,800 | | | | 656,023 | |
| Medikit Co., Ltd. | | | 20,700 | | | | 611,776 | |
| MonotaRO Co., Ltd. | | | 36,200 | | | | 924,129 | |
| Naigai Trans Line, Ltd. | | | 68,150 | | | | 1,073,788 | |
| Nihon M&A Center, Inc. | | | 50,400 | | | | 1,320,758 | |
| Open Door, Inc.(a) | | | 60,200 | | | | 1,103,859 | |
| Seria Co., Ltd. | | | 22,400 | | | | 812,664 | |
| Synchro Food Co., Ltd.(a) | | | 113,400 | | | | 387,027 | |
| System Information Co., Ltd. | | | 43,600 | | | | 400,135 | |
| Systena Corp. | | | 35,800 | | | | 736,702 | |
| Syuppin Co., Ltd. | | | 119,100 | | | | 1,269,572 | |
| TeamSpirit, Inc.(a) | | | 22,800 | | | | 287,269 | |
| Trancom Co., Ltd. | | | 18,100 | | | | 1,404,410 | |
| Tsuruha Holdings, Inc. | | | 3,200 | | | | 369,512 | |
| User Local, Inc.(a) | | | 12,500 | | | | 527,839 | |
| Vega Corp. Co., Ltd. | | | 38,600 | | | | 601,127 | |
| Visional, Inc.(a) | | | 4,500 | | | | 257,343 | |
| WDB coco Co., Ltd. | | | 11,900 | | | | 399,062 | |
| WealthNavi, Inc.(a) | | | 29,600 | | | | 1,136,170 | |
| YAKUODO Holdings Co., Ltd. | | | 36,200 | | | | 781,700 | |
| YAMADA Consulting Group Co., Ltd. | | | 53,900 | | | | 565,188 | |
| | | | | | | | 27,835,852 | |
| | | | | | | | | |
| Netherlands (0.85%) | | | | | | | | |
| Aalberts NV | | | 27,756 | | | | 1,503,310 | |
| Shop Apotheke Europe NV(a)(b)(c) | | | 8,316 | | | | 1,716,649 | |
| | | | | | | | 3,219,959 | |
| | | | | | | | | |
| New Zealand (0.42%) | | | | | | | | |
| CBL Corp., Ltd.(a)(e) | | | 819,006 | | | | 0 | |
| | | Shares | | | Value
(Note 2) | |
| New Zealand (continued) | | | | | | | | |
| NZX, Ltd. | | | 1,059,037 | | | $ | 1,568,742 | |
| | | | | | | | 1,568,742 | |
| | | | | | | | | |
| Norway (1.20%) | | | | | | | | |
| 24sevenoffice Scandinavia AB(a) | | | 222,199 | | | | 923,910 | |
| CSAM Health Group AS(a) | | | 91,191 | | | | 943,242 | |
| Medistim ASA | | | 12,841 | | | | 419,600 | |
| Nordic Semiconductor ASA(a) | | | 11,845 | | | | 293,136 | |
| Self Storage Group ASA(a) | | | 694,169 | | | | 1,943,073 | |
| | | | | | | | 4,522,961 | |
| | | | | | | | | |
| Oman (0.33%) | | | | | | | | |
| Tethys Oil AB | | | 173,100 | | | | 1,259,571 | |
| | | | | | | | | |
| Philippines (1.13%) | | | | | | | | |
| Concepcion Industrial Corp. | | | 1,793,920 | | | | 836,418 | |
| Pryce Corp. | | | 6,894,800 | | | | 758,929 | |
| Puregold Price Club, Inc. | | | 490,700 | | | | 380,127 | |
| Wilcon Depot, Inc. | | | 6,270,400 | | | | 2,291,984 | |
| | | | | | | | 4,267,458 | |
| | | | | | | | | |
| Poland (1.06%) | | | | | | | | |
| Dino Polska SA(a)(b)(c) | | | 47,357 | | | | 3,074,546 | |
| LiveChat Software SA | | | 27,929 | | | | 920,607 | |
| | | | | | | | 3,995,153 | |
| | | | | | | | | |
| Singapore (0.15%) | | | | | | | | |
| Riverstone Holdings, Ltd./Singapore | | | 532,300 | | | | 580,000 | |
| | | | | | | | | |
| South Africa (0.53%) | | | | | | | | |
| Clicks Group, Ltd. | | | 73,588 | | | | 1,228,961 | |
| Italtile, Ltd. | | | 665,000 | | | | 782,272 | |
| | | | | | | | 2,011,233 | |
| | | | | | | | | |
| South Korea (0.91%) | | | | | | | | |
| Douzone Bizon Co., Ltd. | | | 3,400 | | | | 257,671 | |
| Hyundai Ezwel Co., Ltd. | | | 33,500 | | | | 297,550 | |
| LEENO Industrial, Inc. | | | 3,790 | | | | 555,374 | |
| Ray Co. Ltd/KR(a) | | | 7,896 | | | | 367,701 | |
| Suprema, Inc.(a) | | | 8,000 | | | | 192,026 | |
| Tokai Carbon Korea Co., Ltd. | | | 10,000 | | | | 1,761,136 | |
| | | | | | | | 3,431,458 | |
| | | | | | | | | |
| Spain (0.00%)(f) | | | | | | | | |
| Let's GOWEX SA(a)(e) | | | 10,700 | | | | 0 | |
| | | | | | | | | |
| Sweden (5.00%) | | | | | | | | |
| Beijer Alma AB | | | 82,700 | | | | 1,861,972 | |
| Boozt AB(a)(b)(c) | | | 21,200 | | | | 493,591 | |
| Cint Group AB(a) | | | 37,581 | | | | 381,779 | |
| EQT AB | | | 126,813 | | | | 4,288,742 | |
| KNOW IT AB(a) | | | 60,565 | | | | 2,242,870 | |
| Lyko Group AB(a)(c) | | | 16,800 | | | | 627,106 | |
See Notes to Financial Statements.
| Annual Report | April 30, 2021 | 53 |
| Grandeur Peak Global Reach Fund | Portfolio of Investments |
April 30, 2021
| | | Shares | | | Value (Note 2) | |
| Sweden (continued) | | | | | | | | |
| Nordnet AB publ | | | 34,622 | | | $ | 650,475 | |
| OEM International AB, Class B | | | 19,724 | | | | 941,285 | |
| Paradox Interactive AB | | | 14,841 | | | | 347,465 | |
| Sagax AB, Class A | | | 47,309 | | | | 1,262,982 | |
| Sagax AB B | | | 24,922 | | | | 659,441 | |
| Sdiptech AB(a) | | | 15,789 | | | | 708,734 | |
| SwedenCare AB | | | 53,487 | | | | 3,462,371 | |
| Vitec Software Group AB, Class B | | | 19,425 | | | | 918,985 | |
| | | | | | | | 18,847,798 | |
| | | | | | | | | |
| Switzerland (0.45%) | | | | | | | | |
| Partners Group Holding AG | | | 1,187 | | | | 1,689,680 | |
| | | | | | | | | |
| Taiwan (2.74%) | | | | | | | | |
| ASPEED Technology, Inc. | | | 5,000 | | | | 377,690 | |
| Bioteque Corp. | | | 284,000 | | | | 1,270,898 | |
| Brighten Optix Corp. | | | 102,000 | | | | 894,641 | |
| FineTek Co., Ltd. | | | 155,400 | | | | 492,909 | |
| Fuzetec Technology Co., Ltd. | | | 199,000 | | | | 511,517 | |
| GEM Services, Inc./Tw | | | 122,000 | | | | 350,281 | |
| momo.com, Inc. | | | 17,000 | | | | 626,857 | |
| Pacific Hospital Supply Co., Ltd. | | | 356,317 | | | | 938,851 | |
| Poya International Co., Ltd.(a) | | | 46,000 | | | | 1,007,840 | |
| Sporton International, Inc. | | | 249,859 | | | | 2,294,377 | |
| Voltronic Power Technology Corp. | | | 23,047 | | | | 1,051,979 | |
| Wistron Information | | | | | | | | |
| Technology & Services Corp. | | | 138,000 | | | | 508,861 | |
| | | | | | | | 10,326,701 | |
| | | | | | | | | |
| Thailand (0.12%) | | | | | | | | |
| TOA Paint Thailand PCL | | | 413,300 | | | | 457,932 | |
| | | | | | | | | |
| United Arab Emirates (0.16%) | | | | | | | | |
| Aramex PJSC | | | 550,033 | | | | 585,500 | |
| | | | | | | | | |
| United States (27.61%) | | | | | | | | |
| 4imprint Group PLC(a) | | | 25,771 | | | | 836,386 | |
| 8x8, Inc.(a) | | | 21,677 | | | | 712,957 | |
| Align Technology, Inc.(a) | | | 661 | | | | 393,645 | |
| Apollo Global Management, Inc. | | | 14,082 | | | | 779,720 | |
| Array Technologies, Inc.(a) | | | 70,193 | | | | 1,976,635 | |
| Bank of Hawaii Corp. | | | 16,705 | | | | 1,518,317 | |
| Bank of NT Butterfield & Son, Ltd. | | | 73,047 | | | | 2,864,903 | |
| Barrett Business Services, Inc. | | | 26,037 | | | | 1,909,293 | |
| Blackline, Inc.(a) | | | 12,841 | | | | 1,490,326 | |
| Blackstone Group, Inc., Class A | | | 29,433 | | | | 2,604,526 | |
| Cactus, Inc., Class A | | | 31,925 | | | | 951,684 | |
| Cardiovascular Systems, Inc.(a) | | | 16,655 | | | | 671,530 | |
| Castle Biosciences, Inc.(a) | | | 7,869 | | | | 543,197 | |
| | | Shares | | | Value
(Note 2) | |
| United States (continued) | | | | | | | | |
| Chewy, Inc.(a) | | | 6,633 | | | $ | 528,783 | |
| Cross Creek Lucid LP/Partnership Interest(a)(e) | | | 1,000,000 | | | | 1,000,000 | |
| Digital Realty Trust, Inc. | | | 4,875 | | | | 752,261 | |
| EPAM Systems, Inc.(a)(d) | | | 10,155 | | | | 4,648,451 | |
| Equinix, Inc. | | | 2,375 | | | | 1,711,805 | |
| Esquire Financial Holdings, Inc.(a) | | | 24,887 | | | | 571,157 | |
| Etsy, Inc.(a) | | | 6,265 | | | | 1,245,419 | |
| Exact Sciences Corp.(a) | | | 8,225 | | | | 1,084,219 | |
| ExlService Holdings, Inc.(a) | | | 15,550 | | | | 1,436,509 | |
| Fastenal Co. | | | 21,882 | | | | 1,143,991 | |
| First Hawaiian, Inc. | | | 43,436 | | | | 1,192,753 | |
| First Republic Bank(d) | | | 29,265 | | | | 5,362,519 | |
| Five Below, Inc.(a) | | | 2,945 | | | | 592,740 | |
| Freshpet, Inc.(a) | | | 3,361 | | | | 621,180 | |
| Frontage Holdings Corp.(a)(b)(c) | | | 2,551,000 | | | | 1,737,284 | |
| FTI Consulting, Inc.(a) | | | 8,680 | | | | 1,205,218 | |
| Genpact, Ltd. | | | 47,275 | | | | 2,246,981 | |
| Glacier Bancorp, Inc. | | | 25,201 | | | | 1,485,599 | |
| Goosehead Insurance, Inc., Class A | | | 10,174 | | | | 1,118,530 | |
| Healthcare Services Group, Inc. | | | 36,567 | | | | 1,095,182 | |
| Heska Corp.(a) | | | 11,160 | | | | 2,038,374 | |
| Houlihan Lokey, Inc. | | | 18,111 | | | | 1,200,216 | |
| HubSpot, Inc.(a) | | | 725 | | | | 381,676 | |
| I3 Verticals, Inc., Class A(a) | | | 22,900 | | | | 760,738 | |
| IDEXX Laboratories, Inc.(a) | | | 1,066 | | | | 585,223 | |
| Insperity, Inc. | | | 18,697 | | | | 1,636,735 | |
| Intersect ENT, Inc.(a) | | | 29,598 | | | | 645,532 | |
| Joint Corp.(a) | | | 15,602 | | | | 865,599 | |
| Kinsale Capital Group, Inc. | | | 3,619 | | | | 629,742 | |
| LeMaitre Vascular, Inc. | | | 24,525 | | | | 1,286,827 | |
| LGI Homes, Inc.(a) | | | 11,975 | | | | 1,985,215 | |
| Littelfuse, Inc. | | | 3,529 | | | | 936,032 | |
| Lululemon Athletica, Inc.(a) | | | 3,392 | | | | 1,137,236 | |
| MaxCyte, Inc.(a) | | | 120,600 | | | | 1,512,309 | |
| Medallia, Inc.(a) | | | 22,134 | | | | 652,732 | |
| Medpace Holdings, Inc.(a) | | | 7,942 | | | | 1,347,599 | |
| Microchip Technology, Inc. | | | 4,713 | | | | 708,317 | |
| Mimecast, Ltd.(a) | | | 24,363 | | | | 1,057,841 | |
| Morningstar, Inc. | | | 2,550 | | | | 675,775 | |
| MSCI, Inc. | | | 1,145 | | | | 556,207 | |
| New Relic, Inc.(a) | | | 21,925 | | | | 1,409,777 | |
| NV5 Global, Inc.(a) | | | 6,730 | | | | 606,575 | |
| NVIDIA Corp. | | | 975 | | | | 585,371 | |
| Ollie's Bargain Outlet Holdings, Inc.(a) | | | 14,321 | | | | 1,321,399 | |
| PagerDuty, Inc.(a) | | | 23,427 | | | | 994,710 | |
| Paycom Software, Inc.(a) | | | 1,867 | | | | 717,693 | |
| Paylocity Holding Corp.(a) | | | 8,950 | | | | 1,729,498 | |
| PJT Partners, Inc., Class A | | | 38,783 | | | | 2,851,714 | |
| Poshmark, Inc.(a) | | | 18,584 | | | | 777,369 | |
| Power Integrations, Inc. | | | 8,289 | | | | 686,412 | |
| PPD, Inc.(a) | | | 34,750 | | | | 1,605,450 | |
See Notes to Financial Statements.
| 54 | 1.855.377.7325 | www.GrandeurPeakGlobal.com |
| Grandeur Peak Global Reach Fund | Portfolio of Investments |
April 30, 2021
| | | Shares | | | Value
(Note 2) | |
| United States (continued) | | | | | | | | |
| ProntoForms Corp.(a) | | | 365,500 | | | $ | 350,885 | |
| Qualtrics International, Inc.(a) | | | 10,725 | | | | 400,579 | |
| Qualys, Inc.(a)(d) | | | 17,580 | | | | 1,781,909 | |
| Rapid7, Inc.(a) | | | 25,364 | | | | 2,060,825 | |
| Revolve Group, Inc.(a) | | | 36,164 | | | | 1,753,592 | |
| Rexford Industrial Realty, Inc. | | | 20,400 | | | | 1,133,220 | |
| Samsonite International SA(a)(b)(c) | | | 1,208,700 | | | | 2,243,823 | |
| ServiceNow, Inc.(a) | | | 675 | | | | 341,800 | |
| Shoals Technologies Group, Inc.(a) | | | 11,406 | | | | 365,790 | |
| Silicon Laboratories, Inc.(a) | | | 4,725 | | | | 665,989 | |
| Sumo Logic, Inc.(a) | | | 37,292 | | | | 726,821 | |
| SVB Financial Group(a) | | | 3,326 | | | | 1,901,907 | |
| Systemax, Inc. | | | 41,420 | | | | 1,769,462 | |
| Tabula Rasa HealthCare, Inc.(a) | | | 16,873 | | | | 802,480 | |
| Terreno Realty Corp. | | | 21,825 | | | | 1,408,149 | |
| TriMas Corp.(a) | | | 18,175 | | | | 578,692 | |
| Ulta Beauty, Inc.(a) | | | 1,825 | | | | 601,064 | |
| Unity Software, Inc.(a) | | | 1,719 | | | | 174,616 | |
| WW Grainger, Inc. | | | 3,403 | | | | 1,475,337 | |
| YETI Holdings, Inc.(a) | | | 12,675 | | | | 1,082,699 | |
| Zendesk, Inc.(a) | | | 3,825 | | | | 559,024 | |
| | | | | | | | 104,098,256 | |
| | | | | | | | | |
| Vietnam (1.48%) | | | | | | | | |
| FPT Corp. | | | 146,000 | | | | 512,314 | |
| Vietnam Dairy Products JSC | | | 308,062 | | | | 1,249,352 | |
| Vietnam Technological & Commercial Joint Stock Bank(a) | | | 2,138,281 | | | | 3,802,625 | |
| | | | | | | | 5,564,291 | |
| | | | | | | | | |
| TOTAL COMMON STOCKS | | | | | | | | |
| (Cost $217,817,922) | | | | | | | 372,594,231 | |
| | | | | | | | | |
| PREFERRED STOCKS (0.54%) | | | | | | | | |
| United States (0.54%) | | | | | | | | |
| Dataminr Inc - Private Placement(a)(e) | | | 45,833 | | | | 2,016,652 | |
| | | | | | | | | |
| TOTAL PREFERRED STOCKS | | | | | | | | |
| (Cost $912,077) | | | | | | | 2,016,652 | |
| | | | | | | | | |
| TOTAL INVESTMENTS (99.37%) | | | | | |
| (Cost $218,729,999) | | | | | | $ | 374,610,883 | |
| | | | | | | | | |
| Other Assets In Excess Of Liabilities (0.63%) | | | | 2,381,808 | |
| | | | | | | | | |
| NET ASSETS (100.00%) | | | | | | $ | 376,992,691 | |
| (a) | Non-Income Producing Security. |
| (b) | Security exempt from registration under Rule 144A of the Securities Act of 1933. These securities may be resold in the ordinary course of business in transactions exempt from registration, normally to qualified institutional buyers. As of April 30, 2021, these securities had a total aggregate market value of $28,757,941, representing 7.63% of net assets. |
| (c) | Security was purchased pursuant to Regulation S under the Securities Act of 1933, which exempts securities offered and sold outside of the United States from registration. Such security cannot be sold in the United States without either an effective registration statement filed pursuant to the Securities Act of 1933, or pursuant to an exemption from registration. As of April 30, 2021, the aggregate market value of these securities was $31,870,522, representing 8.45% of net assets. |
| (d) | Security position either entirely or partially pledged as collateral for securities sold short. Aggretate fair value of $6,941,225. See also Note 2 to the financial statements for additional information. |
| (e) | As a result of the use of significant unobservable inputs to determine fair value, these investments have been classified as level 3 assets. See also Note 2 to the financial statements for additional information. |
For Fund compliance purposes, the Fund's geographical classifications refer to any one or more of the country sub-classifications used by one or more widely recognized market indexes or ratings group indexes, and/or as defined by Fund management. This definition may not apply for purposes of this report, which may combine sub-classifications for reporting ease. Geographical regions are shown as a percentage of net assets.
See Notes to Financial Statements.
| Annual Report | April 30, 2021 | 55 |
| Grandeur Peak Global Reach Fund | Portfolio of Investments |
April 30, 2021
| Sector Composition (April 30, 2021) | |
| Technology | 26.0% |
| Financials | 19.8% |
| Consumer | 18.7% |
| Industrials | 17.8% |
| Health Care | 14.4% |
| Energy & Materials | 2.7% |
| Cash, Cash Equivalents, & Other Net Assets | 0.6% |
| Total | 100% |
| | |
| Industry Composition (April 30, 2021) | |
| Capital Markets | 10.9% |
| IT Services | 10.3% |
| Software | 9.6% |
| Professional Services | 5.6% |
| Internet & Direct Marketing Retail | 5.5% |
| Banks | 5.5% |
| Semiconductors & Semiconductor Equipment | 3.7% |
| Health Care Equipment & Supplies | 3.5% |
| Pharmaceuticals | 3.3% |
| Health Care Providers & Services | 3.3% |
| Machinery | 3.1% |
| Trading Companies & Distributors | 3.0% |
| Life Sciences Tools & Services | 2.7% |
| Specialty Retail | 2.1% |
| Equity Real Estate Investment Trusts (REITs) | 2.1% |
| Multiline Retail | 1.9% |
| Food & Staples Retailing | 1.9% |
| Textiles, Apparel & Luxury Goods | 1.8% |
| Commercial Services & Supplies | 1.7% |
| Oil, Gas & Consumable Fuels | 1.6% |
| Electrical Equipment | 1.3% |
| Household Durables | 1.2% |
| Food Products | 1.2% |
| Hotels, Restaurants & Leisure | 1.1% |
| Biotechnology | 1.1% |
| Other Industries (each less than 1%) | 10.4% |
| Cash and Other Assets, Less Liabilities | 0.6% |
| Total | 100% |
See Notes to Financial Statements.
| 56 | 1.855.377.7325 | www.GrandeurPeakGlobal.com |
| Grandeur Peak Global Stalwarts Fund | Portfolio of Investments |
April 30, 2021
| | | Shares | | | Value
(Note 2) | |
| COMMON STOCKS (98.90%) | | | | | | | | |
| Argentina (0.72%) | | | | | | | | |
| Globant SA(a) | | | 11,589 | | | $ | 2,655,967 | |
| | | | | | | | | |
| Australia (0.99%) | | | | | | | | |
| Kogan.com, Ltd. | | | 118,000 | | | | 1,007,187 | |
| Netwealth Group, Ltd. | | | 230,269 | | | | 2,641,306 | |
| | | | | | | | 3,648,493 | |
| | | | | | | | | |
| Belgium (1.39%) | | | | | | | | |
| Melexis NV | | | 28,011 | | | | 3,051,080 | |
| Warehouses De Pauw CVA | | | 58,669 | | | | 2,068,090 | |
| | | | | | | | 5,119,170 | |
| | | | | | | | | |
| Brazil (1.30%) | | | | | | | | |
| Locaweb Servicos de Internet SA(b)(c) | | | 283,000 | | | | 1,521,267 | |
| Pagseguro Digital, Ltd., Class A(a) | | | 15,484 | | | | 708,238 | |
| Patria Investments, Ltd.(a) | | | 103,316 | | | | 1,430,927 | |
| Raia Drogasil SA | | | 228,800 | | | | 1,111,136 | |
| | | | | | | | 4,771,568 | |
| | | | | | | | | |
| Britain (13.47%) | | | | | | | | |
| Abcam PLC(a) | | | 89,306 | | | | 1,884,566 | |
| B&M European Value Retail SA | | | 1,032,800 | | | | 8,070,243 | |
| Dechra Pharmaceuticals PLC | | | 174,040 | | | | 9,695,996 | |
| Diploma PLC | | | 47,364 | | | | 1,876,009 | |
| Endava PLC, ADR(a) | | | 81,573 | | | | 7,385,620 | |
| Gamma Communications PLC | | | 71,203 | | | | 1,787,721 | |
| Impax Asset Management Group PLC | | | 155,609 | | | | 2,157,625 | |
| Intertek Group PLC | | | 56,194 | | | | 4,763,479 | |
| Sanne Group PLC | | | 481,260 | | | | 4,293,582 | |
| Softcat PLC | | | 84,529 | | | | 2,237,872 | |
| St. James’s Place PLC | | | 284,819 | | | | 5,355,426 | |
| | | | | | | | 49,508,139 | |
| | | | | | | | | |
| Canada (0.96%) | | | | | | | | |
| Gildan Activewear, Inc.(a) | | | 47,399 | | | | 1,645,073 | |
| Ritchie Bros Auctioneers, Inc. | | | 29,425 | | | | 1,871,430 | |
| | | | | | | | 3,516,503 | |
| | | | | | | | | |
| China (8.34%) | | | | | | | | |
| Baozun, Inc., Sponsored ADR(a) | | | 44,306 | | | | 1,537,861 | |
| CSPC Pharmaceutical Group, Ltd. | | | 1,353,680 | | | | 1,676,470 | |
| Hangzhou Robam Appliances Co., Ltd., Class A | | | 212,600 | | | | 1,260,521 | |
| Hangzhou Tigermed Consulting Co., Ltd., Class A | | | 66,200 | | | | 1,601,014 | |
| Li Ning Co., Ltd. | | | 210,000 | | | | 1,714,010 | |
| Silergy Corp. | | | 140,000 | | | | 14,660,079 | |
| | | Shares | | | Value
(Note 2) | |
| China (continued) | | | | | | | | |
| Trip.com Group, Ltd., ADR(a) | | | 40,725 | | | $ | 1,591,533 | |
| WuXi AppTec Co., Ltd., Class H(b)(c) | | | 130,160 | | | | 3,078,162 | |
| Wuxi Biologics Cayman, Inc.(a)(b)(c) | | | 135,000 | | | | 1,903,061 | |
| Yum China Holdings, Inc. | | | 25,875 | | | | 1,628,055 | |
| | | | | | | | 30,650,766 | |
| | | | | | | | | |
| France (1.88%) | | | | | | | | |
| Alten SA(a) | | | 24,336 | | | | 3,045,767 | |
| BioMerieux | | | 8,193 | | | | 974,370 | |
| Bureau Veritas SA(a) | | | 73,887 | | | | 2,209,228 | |
| Esker SA | | | 2,427 | | | | 676,947 | |
| | | | | | | | 6,906,312 | |
| | | | | | | | | |
| Germany (1.84%) | | | | | | | | |
| Dermapharm Holding SE | | | 39,200 | | | | 3,426,236 | |
| PATRIZIA AG | | | 31,525 | | | | 862,250 | |
| Puma SE(a) | | | 12,248 | | | | 1,291,697 | |
| QIAGEN NV(a) | | | 24,865 | | | | 1,196,752 | |
| | | | | | | | 6,776,935 | |
| | | | | | | | | |
| Hong Kong (1.13%) | | | | | | | | |
| Techtronic Industries Co., Ltd. | | | 165,000 | | | | 3,007,821 | |
| Vitasoy International Holdings, Ltd. | | | 295,500 | | | | 1,143,159 | |
| | | | | | | | 4,150,980 | |
| | | | | | | | | |
| India (6.64%) | | | | | | | | |
| Avenue Supermarts, Ltd.(a)(b)(c) | | | 44,500 | | | | 1,713,916 | |
| Bajaj Finance, Ltd.(a) | | | 26,054 | | | | 1,917,632 | |
| HCL Technologies, Ltd. | | | 100,410 | | | | 1,218,584 | |
| HDFC Asset Management Co., Ltd.(b)(c) | | | 32,478 | | | | 1,217,325 | |
| HDFC Bank, Ltd.(a) | | | 88,069 | | | | 1,679,164 | |
| IndiaMart InterMesh, Ltd.(a)(b)(c) | | | 10,988 | | | | 1,179,112 | |
| Marico, Ltd. | | | 182,487 | | | | 1,013,659 | |
| Metropolis Healthcare, Ltd.(b)(c) | | | 96,966 | | | | 3,135,285 | |
| Nippon Life India Asset Management, Ltd.(b)(c) | | | 262,692 | | | | 1,211,811 | |
| Titan Co., Ltd. | | | 64,516 | | | | 1,299,204 | |
| WNS Holdings, Ltd., ADR(a) | | | 122,027 | | | | 8,838,416 | |
| | | | | | | | 24,424,108 | |
| | | | | | | | | |
| Indonesia (0.32%) | | | | | | | | |
| Bank Tabungan Pensiunan Nasional Syariah | | | 5,142,700 | | | | 1,164,183 | |
| | | | | | | | | |
| Ireland (0.92%) | | | | | | | | |
| Keywords Studios PLC(a) | | | 90,907 | | | | 3,397,290 | |
See Notes to Financial Statements.
| Annual Report | April 30, 2021 | 57 |
| Grandeur Peak Global Stalwarts Fund | Portfolio of Investments |
April 30, 2021
| | | Shares | | | Value
(Note 2) | |
| Israel (1.13%) | | | | | | | | |
| Wix.com, Ltd.(a) | | | 13,075 | | | $ | 4,156,281 | |
| | | | | | | | | |
| Italy (0.58%) | | | | | | | | |
| GVS SpA(a)(b)(c) | | | 56,990 | | | | 993,490 | |
| Interpump Group SpA | | | 21,092 | | | | 1,123,358 | |
| | | | | | | | 2,116,848 | |
| | | | | | | | | |
| Japan (6.63%) | | | | | | | | |
| BASE, Inc.(a) | | | 80,000 | | | | 1,334,431 | |
| BayCurrent Consulting, Inc. | | | 11,300 | | | | 3,086,330 | |
| Freee KK(a) | | | 14,500 | | | | 1,231,220 | |
| IR Japan Holdings, Ltd. | | | 27,300 | | | | 3,589,542 | |
| M&A Capital Partners Co., Ltd.(a) | | | 58,900 | | | | 2,727,002 | |
| M3, Inc. | | | 18,800 | | | | 1,303,391 | |
| MonotaRO Co., Ltd. | | | 83,000 | | | | 2,118,858 | |
| Nihon M&A Center, Inc. | | | 129,800 | | | | 3,401,475 | |
| Seria Co., Ltd. | | | 71,100 | | | | 2,579,481 | |
| Systena Corp. | | | 127,800 | | | | 2,629,904 | |
| Visional, Inc.(a) | | | 6,500 | | | | 371,717 | |
| | | | | | | | 24,373,351 | |
| | | | | | | | | |
| Netherlands (1.26%) | | | | | | | | |
| Aalberts NV | | | 33,784 | | | | 1,829,795 | |
| Shop Apotheke Europe NV(a)(b)(c) | | | 13,640 | | | | 2,815,668 | |
| | | | | | | | 4,645,463 | |
| | | | | | | | | |
| Philippines (0.29%) | | | | | | | | |
| Wilcon Depot, Inc. | | | 2,924,400 | | | | 1,068,939 | |
| | | | | | | | | |
| Poland (0.91%) | | | | | | | | |
| Dino Polska SA(a)(b)(c) | | | 51,253 | | | | 3,327,485 | |
| | | | | | | | | |
| Singapore (0.29%) | | | | | | | | |
| Riverstone Holdings, Ltd./Singapore | | | 961,700 | | | | 1,047,879 | |
| | | | | | | | | |
| South Korea (0.37%) | | | | | | | | |
| LEENO Industrial, Inc. | | | 9,328 | | | | 1,366,893 | |
| | | | | | | | | |
| Sweden (2.57%) | | | | | | | | |
| AddTech AB, Class B | | | 74,900 | | | | 1,309,448 | |
| EQT AB | | | 117,800 | | | | 3,983,928 | |
| Nibe Industrier AB, Class B | | | 32,708 | | | | 1,196,962 | |
| Sagax AB B | | | 77,431 | | | | 2,048,838 | |
| Sweco AB, Class B | | | 51,306 | | | | 915,145 | |
| | | | | | | | 9,454,321 | |
| | | | | | | | | |
| Switzerland (0.72%) | | | | | | | | |
| Partners Group Holding AG | | | 1,869 | | | | 2,660,498 | |
| | | | | | | | | |
| Taiwan (1.70%) | | | | | | | | |
| ASPEED Technology, Inc. | | | 20,000 | | | | 1,510,758 | |
| momo.com, Inc. | | | 69,000 | | | | 2,544,303 | |
| | | Shares | | | Value
(Note 2) | |
| Taiwan (continued) | | | | | | | | |
| Voltronic Power Technology Corp. | | | 47,875 | | | $ | 2,185,251 | |
| | | | | | | | 6,240,312 | |
| | | | | | | | | |
| United States (41.72%) | | | | | | | | |
| Align Technology, Inc.(a) | | | 2,925 | | | | 1,741,925 | |
| Apollo Global Management, Inc. | | | 39,138 | | | | 2,167,071 | |
| Array Technologies, Inc.(a) | | | 57,333 | | | | 1,614,497 | |
| Ashtead Group PLC | | | 28,084 | | | | 1,803,901 | |
| Bank of Hawaii Corp. | | | 28,620 | | | | 2,601,272 | |
| Bank of NT Butterfield & Son, Ltd. | | | 93,631 | | | | 3,672,208 | |
| Blackline, Inc.(a) | | | 23,544 | | | | 2,732,517 | |
| Blackstone Group, Inc., Class A | | | 31,000 | | | | 2,743,190 | |
| Cardiovascular Systems, Inc.(a) | | | 34,092 | | | | 1,374,589 | |
| Castle Biosciences, Inc.(a) | | | 21,110 | | | | 1,457,223 | |
| CDW Corp. | | | 5,466 | | | | 974,752 | |
| Chewy, Inc.(a) | | | 17,285 | | | | 1,377,960 | |
| Cross Creek Lucid LP/Partnership Interest(a)(d) | | | 1,300,000 | | | | 1,300,000 | |
| Elastic NV(a) | | | 9,131 | | | | 1,101,381 | |
| EPAM Systems, Inc.(a) | | | 22,313 | | | | 10,213,776 | |
| Equinix, Inc. | | | 2,500 | | | | 1,801,900 | |
| Etsy, Inc.(a) | | | 12,450 | | | | 2,474,935 | |
| Exact Sciences Corp.(a) | | | 12,883 | | | | 1,698,237 | |
| ExlService Holdings, Inc.(a) | | | 15,558 | | | | 1,437,248 | |
| Fastenal Co. | | | 87,100 | | | | 4,553,588 | |
| First Hawaiian, Inc. | | | 64,768 | | | | 1,778,529 | |
| First Republic Bank | | | 65,650 | | | | 12,029,706 | |
| Five Below, Inc.(a) | | | 14,877 | | | | 2,994,294 | |
| Freshpet, Inc.(a) | | | 6,350 | | | | 1,173,607 | |
| Genpact, Ltd. | | | 80,702 | | | | 3,835,766 | |
| Glacier Bancorp, Inc. | | | 34,350 | | | | 2,024,932 | |
| Goosehead Insurance, Inc., Class A | | | 23,775 | | | | 2,613,823 | |
| Heska Corp.(a) | | | 17,073 | | | | 3,118,383 | |
| Houlihan Lokey, Inc. | | | 24,325 | | | | 1,612,018 | |
| HubSpot, Inc.(a) | | | 3,042 | | | | 1,601,461 | |
| IDEXX Laboratories, Inc.(a) | | | 3,050 | | | | 1,674,419 | |
| Kinsale Capital Group, Inc. | | | 10,176 | | | | 1,770,726 | |
| LGI Homes, Inc.(a) | | | 23,397 | | | | 3,878,755 | |
| Littelfuse, Inc. | | | 13,228 | | | | 3,508,595 | |
| Lululemon Athletica, Inc.(a) | | | 11,337 | | | | 3,800,956 | |
| Medallia, Inc.(a) | | | 46,425 | | | | 1,369,073 | |
| Medpace Holdings, Inc.(a) | | | 16,425 | | | | 2,786,994 | |
| Microchip Technology, Inc. | | | 14,775 | | | | 2,220,535 | |
| Monolithic Power Systems, Inc. | | | 5,800 | | | | 2,096,004 | |
| MSCI, Inc. | | | 3,100 | | | | 1,505,887 | |
| Ollie’s Bargain Outlet Holdings, Inc.(a) | | | 22,677 | | | | 2,092,407 | |
| PagerDuty, Inc.(a) | | | 23,900 | | | | 1,014,794 | |
| Paycom Software, Inc.(a) | | | 7,666 | | | | 2,946,887 | |
See Notes to Financial Statements.
| 58 | 1.855.377.7325 | www.GrandeurPeakGlobal.com |
| Grandeur Peak Global Stalwarts Fund | Portfolio of Investments |
April 30, 2021
| | | Shares | | | Value
(Note 2) | |
| United States (continued) | | | | | | | | |
| Paylocity Holding Corp.(a) | | | 9,650 | | | $ | 1,864,766 | |
| PJT Partners, Inc., Class A | | | 55,075 | | | | 4,049,665 | |
| Pool Corp. | | | 8,925 | | | | 3,770,991 | |
| Poshmark, Inc.(a) | | | 42,497 | | | | 1,777,650 | |
| Power Integrations, Inc. | | | 40,825 | | | | 3,380,718 | |
| PPD, Inc.(a) | | | 46,350 | | | | 2,141,370 | |
| Qualtrics International, Inc.(a) | | | 87,150 | | | | 3,255,053 | |
| Qualys, Inc.(a) | | | 25,934 | | | | 2,628,670 | |
| Rapid7, Inc.(a) | | | 30,850 | | | | 2,506,563 | |
| Shoals Technologies Group, Inc.(a) | | | 35,441 | | | | 1,136,593 | |
| Silicon Laboratories, Inc.(a) | | | 10,643 | | | | 1,500,131 | |
| SVB Financial Group(a) | | | 5,514 | | | | 3,153,071 | |
| Systemax, Inc. | | | 57,200 | | | | 2,443,584 | |
| Terreno Realty Corp. | | | 31,951 | | | | 2,061,479 | |
| Ulta Beauty, Inc.(a) | | | 4,612 | | | | 1,518,962 | |
| WW Grainger, Inc. | | | 1,975 | | | | 856,241 | |
| YETI Holdings, Inc.(a) | | | 20,375 | | | | 1,740,433 | |
| Zendesk, Inc.(a) | | | 8,721 | | | | 1,274,574 | |
| | | | | | | | 153,351,235 | |
| | | | | | | | | |
| Vietnam (0.83%) | | | | | | | | |
| Vietnam Dairy Products JSC | | | 274,144 | | | | 1,111,796 | |
| Vietnam Technological & Commercial Joint Stock Bank(a) | | | 1,089,305 | | | | 1,937,172 | |
| | | | | | | | 3,048,968 | |
| | | | | | | | | |
| TOTAL COMMON STOCKS | | | | | |
| (Cost $228,461,898) | | | | | | | 363,548,887 | |
| | | | | | | | | |
| PREFERRED STOCKS (0.29%) | | | | | |
| United States (0.29%) | | | | | | | | |
| Dataminr Inc - Private Placement(a)(d) | | | 24,262 | | | | 1,067,528 | |
| | | | | | | | | |
| TOTAL PREFERRED STOCKS | | | | |
| (Cost $482,814) | | | | | | | 1,067,528 | |
| | | | | | | | | |
| TOTAL INVESTMENTS (99.19%) | | | | |
| (Cost $228,944,712) | | | | | | $ | 364,616,415 | |
| | | | | | | | | |
| Other Assets In Excess Of Liabilities (0.81%) | | | | 2,984,780 | |
| | | | | | | | | |
| NET ASSETS (100.00%) | | | | | | $ | 367,601,195 | |
| (a) | Non-Income Producing Security. |
| (b) | Security exempt from registration under Rule 144A of the Securities Act of 1933. These securities may be resold in the ordinary course of business in transactions exempt from registration, normally to qualified institutional buyers. As of April 30, 2021, these securities had a total aggregate market value of $22,096,582, representing 6.01% of net assets. |
| (c) | Security was purchased pursuant to Regulation S under the Securities Act of 1933, which exempts securities offered and sold outside of the United States from registration. Such security cannot be sold in the United States without either an effective registration statement filed pursuant to the Securities Act of 1933, or pursuant to an exemption from registration. As of April 30, 2021, the aggregate market value of these securities was $22,096,582, representing 6.01% of net assets. |
| (d) | As a result of the use of significant unobservable inputs to determine fair value, these investments have been classified as level 3 assets. See also Note 2 to the financial statements for additional information. |
For Fund compliance purposes, the Fund’s geographical classifications refer to any one or more of the country sub-classifications used by one or more widely recognized market indexes or ratings group indexes, and/or as defined by Fund management. This definition may not apply for purposes of this report, which may combine sub-classifications for reporting ease. Geographical regions are shown as a percentage of net assets.
| Sector Composition (April 30, 2021) | |
| Technology | 31.4% |
| Financials | 23.4% |
| Consumer | 18.3% |
| Health Care | 13.2% |
| Industrials | 12.9% |
| Cash, Cash Equivalents, & Other Net Assets | 0.8% |
| Total | 100% |
See Notes to Financial Statements.
| Annual Report | April 30, 2021 | 59 |
| Grandeur Peak Global Stalwarts Fund | Portfolio of Investments |
April 30, 2021
| Industry Composition (April 30, 2021) | |
| IT Services | 14.1% |
| Capital Markets | 11.2% |
| Banks | 8.2% |
| Semiconductors & Semiconductor Equipment | 8.1% |
| Software | 7.7% |
| Professional Services | 4.6% |
| Trading Companies & Distributors | 4.4% |
| Internet & Direct Marketing Retail | 4.1% |
| Pharmaceuticals | 4.0% |
| Multiline Retail | 3.5% |
| Life Sciences Tools & Services | 3.5% |
| Health Care Equipment & Supplies | 3.0% |
| Textiles, Apparel & Luxury Goods | 2.7% |
| Food & Staples Retailing | 1.7% |
| Machinery | 1.6% |
| Equity Real Estate Investment Trusts (REITs) | 1.6% |
| Specialty Retail | 1.5% |
| Household Durables | 1.4% |
| Electrical Equipment | 1.4% |
| Health Care Providers & Services | 1.3% |
| Electronic Equipment, Instruments & Components | 1.2% |
| Insurance | 1.2% |
| Distributors | 1.0% |
| Other Industries (each less than 1%) | 6.2% |
| Cash and Other Assets, Less Liabilities | 0.8% |
| Total | 100% |
See Notes to Financial Statements.
| 60 | 1.855.377.7325 | www.GrandeurPeakGlobal.com |
| Grandeur Peak International Opportunities Fund | Portfolio of Investments |
April 30, 2021
| | | Shares | | | Value
(Note 2) | |
| COMMON STOCKS (97.05%) | | | | | | | | |
| Argentina (0.48%) | | | | | | | | |
| Globant SA(a) | | | 20,248 | | | $ | 4,640,437 | |
| | | | | | | | | |
| Australia (2.13%) | | | | | | | | |
| Fiducian Group, Ltd. | | | 215,640 | | | | 1,121,300 | |
| HUB24, Ltd. | | | 225,392 | | | | 4,389,389 | |
| Kogan.com, Ltd. | | | 662,167 | | | | 5,651,917 | |
| National Storage REIT | | | 1,942,036 | | | | 3,007,058 | |
| Netwealth Group, Ltd. | | | 199,554 | | | | 2,288,989 | |
| People Infrastructure, Ltd. | | | 1,232,348 | | | | 4,281,524 | |
| | | | | | | | 20,740,177 | |
| | | | | | | | | |
| Bangladesh (0.40%) | | | | | | | | |
| Square Pharmaceuticals, Ltd. | | | 1,579,730 | | | | 3,946,763 | |
| | | | | | | | | |
| Belgium (1.00%) | | | | | | | | |
| Melexis NV | | | 49,162 | | | | 5,354,938 | |
| Warehouses De Pauw CVA | | | 123,834 | | | | 4,365,165 | |
| | | | | | | | 9,720,103 | |
| | | | | | | | | |
| Brazil (2.44%) | | | | | | | | |
| Fleury SA | | | 826,000 | | | | 3,897,309 | |
| Locaweb Servicos de Internet SA(b)(c) | | | 1,450,900 | | | | 7,799,317 | |
| Neogrid Participacoes SA | | | 3,003,700 | | | | 4,014,481 | |
| Pagseguro Digital, Ltd., Class A(a) | | | 138,675 | | | | 6,342,995 | |
| Patria Investments, Ltd.(a) | | | 123,851 | | | | 1,715,336 | |
| | | | | | | | 23,769,438 | |
| | | | | | | | | |
| Britain (19.12%) | | | | | | | | |
| Ascential PLC(a) | | | 1,004,600 | | | | 4,839,239 | |
| B&M European Value Retail SA | | | 1,885,409 | | | | 14,732,484 | |
| boohoo Group PLC(a) | | | 1,363,518 | | | | 6,404,348 | |
| Bytes Technology Group PLC(a) | | | 408,894 | | | | 2,783,974 | |
| Clinigen Group PLC | | | 442,273 | | | | 5,213,164 | |
| CVS Group PLC(a) | | | 679,400 | | | | 20,923,670 | |
| Dechra Pharmaceuticals PLC | | | 385,704 | | | | 21,488,074 | |
| Diploma PLC | | | 145,579 | | | | 5,766,142 | |
| Endava PLC, ADR(a) | | | 166,514 | | | | 15,076,178 | |
| Foresight Group Holdings, Ltd.(a) | | | 1,109,119 | | | | 6,494,586 | |
| Gamma Communications PLC | | | 254,024 | | | | 6,377,876 | |
| GlobalData PLC | | | 54,264 | | | | 1,172,826 | |
| Impax Asset Management Group PLC | | | 791,576 | | | | 10,975,739 | |
| JTC PLC(b)(c) | | | 663,047 | | | | 6,162,640 | |
| K3 Capital Group PLC | | | 810,360 | | | | 3,648,405 | |
| On the Beach Group PLC(a)(b)(c) | | | 1,454,633 | | | | 8,336,984 | |
| Pensionbee Group PLC(a) | | | 1,259,004 | | | | 3,129,731 | |
| Sabre Insurance Group PLC(b)(c) | | | 880,201 | | | | 3,166,628 | |
| Sanne Group PLC | | | 764,228 | | | | 6,818,093 | |
| | | Shares | | | Value
(Note 2) | |
| Britain (continued) | | | | | | | | |
| Softcat PLC | | | 309,584 | | | $ | 8,196,115 | |
| St. James’s Place PLC | | | 283,296 | | | | 5,326,790 | |
| Team17 Group PLC(a) | | | 446,526 | | | | 4,779,208 | |
| Tristel PLC | | | 34,951 | | | | 289,613 | |
| Ultra Electronics Holdings PLC | | | 264,257 | | | | 7,379,299 | |
| Volution Group PLC | | | 1,144,000 | | | | 6,580,342 | |
| | | | | | | | 186,062,148 | |
| | | | | | | | | |
| Canada (2.06%) | | | | | | | | |
| Gildan Activewear, Inc.(a) | | | 197,000 | | | | 6,837,261 | |
| Pivotree, Inc.(a) | | | 218,800 | | | | 1,399,152 | |
| Richelieu Hardware, Ltd. | | | 159,350 | | | | 5,566,846 | |
| Ritchie Bros Auctioneers, Inc. | | | 31,900 | | | | 2,028,840 | |
| StorageVault Canada, Inc. | | | 1,061,900 | | | | 3,801,294 | |
| WeCommerce Holdings, Ltd.(a) | | | 32,006 | | | | 418,449 | |
| | | | | | | | 20,051,842 | |
| | | | | | | | | |
| China (7.01%) | | | | | | | | |
| Baozun, Inc.(a) | | | 603,400 | | | | 7,061,126 | |
| CSPC Pharmaceutical Group, Ltd. | | | 3,479,680 | | | | 4,309,423 | |
| Hangzhou Robam Appliances Co., Ltd., Class A | | | 1,227,900 | | | | 7,280,310 | |
| Man Wah Holdings, Ltd. | | | 2,318,400 | | | | 4,876,915 | |
| O2Micro International, Ltd., ADR(a) | | | 167,266 | | | | 1,139,082 | |
| Silergy Corp. | | | 197,199 | | | | 20,649,664 | |
| Suofeiya Home Collection Co., Ltd., Class A(a) | | | 2,133,600 | | | | 9,600,623 | |
| TK Group Holdings, Ltd. | | | 7,310,000 | | | | 3,199,640 | |
| Trip.com Group, Ltd., ADR(a) | | | 130,768 | | | | 5,110,413 | |
| WuXi AppTec Co., Ltd., Class H(b)(c) | | | 210,680 | | | | 4,982,384 | |
| | | | | | | | 68,209,580 | |
| | | | | | | | | |
| Colombia (0.53%) | | | | | | | | |
| Parex Resources, Inc.(a) | | | 273,275 | | | | 5,146,903 | |
| | | | | | | | | |
| Finland (1.10%) | | | | | | | | |
| Musti Group Oyj | | | 283,265 | | | | 10,686,675 | |
| | | | | | | | | |
| France (5.06%) | | | | | | | | |
| Alten SA(a) | | | 47,500 | | | | 5,944,852 | |
| Bureau Veritas SA(a) | | | 196,483 | | | | 5,874,860 | |
| Esker SA | | | 52,205 | | | | 14,561,189 | |
| Neurones | | | 77,697 | | | | 2,559,479 | |
| Thermador Groupe | | | 83,436 | | | | 8,546,530 | |
| Virbac SA(a) | | | 36,192 | | | | 11,748,248 | |
| | | | | | | | 49,235,158 | |
| | | | | | | | | |
| Georgia (0.48%) | | | | | | | | |
| Bank of Georgia Group PLC(a) | | | 65,283 | | | | 921,422 | |
| Georgia Capital PLC(a) | | | 163,711 | | | | 1,272,898 | |
See Notes to Financial Statements.
| Annual Report | April 30, 2021 | 61 |
| Grandeur Peak International Opportunities Fund | Portfolio of Investments |
April 30, 2021
| | | Shares | | | Value
(Note 2) | |
| Georgia (continued) | | | | | | | | |
| TBC Bank Group PLC(a) | | | 183,446 | | | $ | 2,467,599 | |
| | | | | | | | 4,661,919 | |
| | | | | | | | | |
| Germany (8.19%) | | | | | | | | |
| Atoss Software AG | | | 16,900 | | | | 3,766,979 | |
| CANCOM SE | | | 71,700 | | | | 4,427,320 | |
| Dermapharm Holding SE | | | 126,476 | | | | 11,054,505 | |
| Deutsche Industrie REIT AG | | | 69,886 | | | | 1,403,148 | |
| Exasol AG(a) | | | 241,012 | | | | 6,994,758 | |
| Fashionette AG(a) | | | 132,020 | | | | 5,333,051 | |
| Friedrich Vorwerk Group SE(a) | | | 82,614 | | | | 5,085,344 | |
| Grand City Properties SA | | | 176,652 | | | | 4,748,835 | |
| Home24 SE(a) | | | 164,628 | | | | 3,857,557 | |
| Nagarro SE(a) | | | 48,040 | | | | 5,267,379 | |
| Nexus AG | | | 63,706 | | | | 4,403,976 | |
| Norma Group SE | | | 108,390 | | | | 6,046,498 | |
| PATRIZIA AG | | | 300,526 | | | | 8,219,780 | |
| PharmaSGP Holding SE(a) | | | 124,900 | | | | 2,477,668 | |
| QIAGEN NV(a) | | | 137,256 | | | | 6,606,131 | |
| | | | | | | | 79,692,929 | |
| | | | | | | | | |
| Greece (0.11%) | | | | | | | | |
| Sarantis SA | | | 100,600 | | | | 1,078,846 | |
| | | | | | | | | |
| Hong Kong (0.34%) | | | | | | | | |
| Jacobson Pharma Corp., Ltd.(c) | | | 2,109,100 | | | | 211,786 | |
| Vitasoy International Holdings, Ltd. | | | 804,338 | | | | 3,111,629 | |
| | | | | | | | 3,323,415 | |
| | | | | | | | | |
| India (6.26%) | | | | | | | | |
| Castrol India, Ltd. | | | 3,506,788 | | | | 5,953,338 | |
| Computer Age Management Services, Ltd. | | | 201,157 | | | | 6,309,197 | |
| EPL, Ltd. | | | 1,115,229 | | | | 3,382,311 | |
| Gulf Oil Lubricants India, Ltd. | | | 203,478 | | | | 1,942,686 | |
| IndiaMart InterMesh, Ltd.(a)(b)(c) | | | 58,144 | | | | 6,239,378 | |
| L&T Technology Services, Ltd.(b)(c) | | | 90,564 | | | | 3,336,462 | |
| Metropolis Healthcare, Ltd.(b)(c) | | | 367,832 | | | | 11,893,429 | |
| Nippon Life India Asset Management, Ltd.(b)(c) | | | 695,602 | | | | 3,208,845 | |
| Time Technoplast, Ltd. | | | 2,560,734 | | | | 2,606,627 | |
| WNS Holdings, Ltd., ADR(a) | | | 222,000 | | | | 16,079,460 | |
| | | | | | | | 60,951,733 | |
| | | | | | | | | |
| Indonesia (1.33%) | | | | | | | | |
| Arwana Citramulia Tbk PT | | | 63,783,500 | | | | 3,267,552 | |
| Bank Tabungan Pensiunan Nasional Syariah | | | 11,709,500 | | | | 2,650,749 | |
| Selamat Sempurna Tbk PT | | | 48,677,500 | | | | 4,431,354 | |
| | | Shares | | | Value
(Note 2) | |
| Indonesia (continued) | | | | | | | | |
| Ultrajaya Milk Industry & Trading Co. Tbk PT | | | 22,958,000 | | | $ | 2,558,836 | |
| | | | | | | | 12,908,491 | |
| | | | | | | | | |
| Ireland (2.87%) | | | | | | | | |
| Irish Residential Properties REIT PLC | | | 4,766,689 | | | | 9,318,245 | |
| Keywords Studios PLC(a) | | | 198,679 | | | | 7,424,842 | |
| Uniphar PLC | | | 3,144,449 | | | | 11,152,271 | |
| | | | | | | | 27,895,358 | |
| | | | | | | | | |
| Israel (0.87%) | | | | | | | | |
| Wix.com, Ltd.(a) | | | 26,683 | | | | 8,481,992 | |
| | | | | | | | | |
| Italy (1.72%) | | | | | | | | |
| DiaSorin SpA | | | 15,943 | | | | 2,707,418 | |
| GVS SpA(a)(b)(c) | | | 157,776 | | | | 2,750,462 | |
| Interpump Group SpA | | | 138,091 | | | | 7,354,715 | |
| Piovan SpA(b)(c) | | | 437,003 | | | | 3,898,388 | |
| | | | | | | | 16,710,983 | |
| | | | | | | | | |
| Japan (12.17%) | | | | | | | | |
| AIT Corp. | | | 392,300 | | | | 3,783,367 | |
| Appier Group, Inc.(a) | | | 31,900 | | | | 557,790 | |
| BayCurrent Consulting, Inc. | | | 33,400 | | | | 9,122,427 | |
| Charm Care Corp. | | | 412,400 | | | | 4,603,605 | |
| Create SD Holdings Co., Ltd. | | | 133,700 | | | | 4,055,408 | |
| eGuarantee, Inc. | | | 177,000 | | | | 3,414,000 | |
| Funai Soken Holdings, Inc. | | | 118,700 | | | | 2,104,864 | |
| Japan Lifeline Co., Ltd. | | | 533,500 | | | | 7,517,522 | |
| Kinjiro Co., Ltd. | | | 119,300 | | | | 2,997,509 | |
| M&A Capital Partners Co., Ltd.(a) | | | 156,300 | | | | 7,236,508 | |
| MonotaRO Co., Ltd. | | | 129,400 | | | | 3,303,376 | |
| Naigai Trans Line, Ltd. | | | 111,800 | | | | 1,761,548 | |
| Nihon M&A Center, Inc. | | | 180,200 | | | | 4,722,233 | |
| Open Door, Inc.(a) | | | 319,800 | | | | 5,864,024 | |
| Seria Co., Ltd. | | | 286,500 | | | | 10,394,112 | |
| SMS Co., Ltd. | | | 83,100 | | | | 2,268,921 | |
| Strike Co., Ltd. | | | 145,600 | | | | 6,108,299 | |
| Synchro Food Co., Ltd.(a) | | | 644,400 | | | | 2,199,297 | |
| System Information Co., Ltd. | | | 410,500 | | | | 3,767,330 | |
| Systena Corp. | | | 205,600 | | | | 4,230,894 | |
| Syuppin Co., Ltd. | | | 316,400 | | | | 3,372,733 | |
| Trancom Co., Ltd. | | | 88,990 | | | | 6,904,888 | |
| Tsuruha Holdings, Inc. | | | 37,200 | | | | 4,295,581 | |
| User Local, Inc.(a) | | | 92,500 | | | | 3,906,007 | |
| Visional, Inc.(a) | | | 17,200 | | | | 983,622 | |
| YAKUODO Holdings Co., Ltd. | | | 250,200 | | | | 5,402,800 | |
| Yumshin Group Co. | | | 269,325 | | | | 3,511,649 | |
| | | | | | | | 118,390,314 | |
| | | | | | | | | |
| Malaysia (0.10%) | | | | | | | | |
| Scicom MSC Bhd | | | 3,549,500 | | | | 1,022,461 | |
See Notes to Financial Statements.
| 62 | 1.855.377.7325 | www.GrandeurPeakGlobal.com |
| Grandeur Peak International Opportunities Fund | Portfolio of Investments |
April 30, 2021
| | | Shares | | | Value
(Note 2) | |
| Netherlands (1.76%) | | | | | | |
| Aalberts NV | | | 222,217 | | | $ | 12,035,630 | |
| Shop Apotheke Europe NV(a)(b)(c) | | | 24,607 | | | | 5,079,555 | |
| | | | | | | | 17,115,185 | |
| | | | | | | | | |
| New Zealand (0.00%)(d) | | | | | | | | |
| CBL Corp., Ltd.(a)(e) | | | 1,542,256 | | | | 1 | |
| | | | | | | | | |
| Norway (1.24%) | | | | | | | | |
| 24sevenoffice Scandinavia AB(a) | | | 204,934 | | | | 852,121 | |
| Medistim ASA | | | 85,511 | | | | 2,794,208 | |
| Nordic Semiconductor ASA(a) | | | 227,120 | | | | 5,620,702 | |
| Self Storage Group ASA(a) | | | 1,016,072 | | | | 2,844,123 | |
| | | | | | | | 12,111,154 | |
| | | | | | | | | |
| Philippines (0.94%) | | | | | | | | |
| Puregold Price Club, Inc. | | | 9,057,000 | | | | 7,016,119 | |
| Wilcon Depot, Inc. | | | 5,738,600 | | | | 2,097,598 | |
| | | | | | | | 9,113,717 | |
| | | | | | | | | |
| Poland (0.99%) | | | | | | | | |
| Dino Polska SA(a)(b)(c) | | | 105,634 | | | | 6,858,048 | |
| LiveChat Software SA | | | 85,000 | | | | 2,801,804 | |
| | | | | | | | 9,659,852 | |
| | | | | | | | | |
| Singapore (0.77%) | | | | | | | | |
| Riverstone Holdings, Ltd./Singapore | | | 6,884,800 | | | | 7,501,755 | |
| | | | | | | | | |
| South Africa (0.51%) | | | | | | | | |
| Italtile, Ltd. | | | 4,209,423 | | | | 4,951,750 | |
| | | | | | | | | |
| South Korea (2.13%) | | | | | | | | |
| Hyundai Ezwel Co., Ltd. | | | 317,661 | | | | 2,821,496 | |
| LEENO Industrial, Inc. | | | 23,508 | | | | 3,444,783 | |
| Settle Bank, Inc./Korea | | | 99,000 | | | | 2,981,525 | |
| Suprema, Inc.(a) | | | 91,500 | | | | 2,196,296 | |
| Tokai Carbon Korea Co., Ltd. | | | 52,555 | | | | 9,255,652 | |
| | | | | | | | 20,699,752 | |
| | | | | | | | | |
| Sweden (3.87%) | | | | | | | | |
| AddTech AB, Class B | | | 195,436 | | | | 3,416,733 | |
| Beijer Alma AB | | | 282,509 | | | | 6,360,628 | |
| Cint Group AB(a) | | | 267,830 | | | | 2,720,837 | |
| KNOW IT AB(a) | | | 194,292 | | | | 7,195,107 | |
| Lyko Group AB(a)(c) | | | 79,553 | | | | 2,969,535 | |
| Nibe Industrier AB, Class B | | | 37,457 | | | | 1,370,753 | |
| OEM International AB, Class B | | | 49,078 | | | | 2,342,141 | |
| Sagax AB B | | | 159,528 | | | | 4,221,140 | |
| Sdiptech AB(a) | | | 66,230 | | | | 2,972,920 | |
| SwedenCare AB | | | 63,289 | | | | 4,096,884 | |
| | | | | | | | 37,666,678 | |
| | | Shares | | | Value
(Note 2) | |
| Taiwan (2.54%) | | | | | | |
| ASPEED Technology, Inc. | | | 49,000 | | | $ | 3,701,357 | |
| Bioteque Corp. | | | 932,000 | | | | 4,170,694 | |
| Sporton International, Inc. | | | 1,034,003 | | | | 9,494,926 | |
| Voltronic Power Technology Corp. | | | 85,650 | | | | 3,909,489 | |
| Wistron Information Technology & Services Corp. | | | 923,000 | | | | 3,403,465 | |
| | | | | | | | 24,679,931 | |
| | | | | | | | | |
| United States (5.33%) | | | | | | | | |
| Bank of NT Butterfield & Son, Ltd. | | | 251,443 | | | | 9,861,594 | |
| EPAM Systems, Inc.(a) | | | 44,738 | | | | 20,478,820 | |
| Frontage Holdings Corp.(a)(b)(c) | | | 11,226,900 | | | | 7,645,753 | |
| Genpact, Ltd. | | | 202,618 | | | | 9,630,434 | |
| Lululemon Athletica, Inc.(a) | | | 12,717 | | | | 4,263,629 | |
| | | | | | | | 51,880,230 | |
| | | | | | | | | |
| Vietnam (1.20%) | | | | | | | | |
| Vietnam Dairy Products JSC | | | 1,224,917 | | | | 4,967,675 | |
| Vietnam Technological & Commercial Joint Stock Bank(a) | | | 3,772,473 | | | | 6,708,800 | |
| | | | | | | | 11,676,475 | |
| | | | | | | | | |
| TOTAL COMMON STOCKS | | | | | | | | |
| (Cost $564,955,589) | | | | | | | 944,384,145 | |
| | | | | | | | | |
| TOTAL INVESTMENTS (97.05%) | | | | | | | | |
| (Cost $564,955,589) | | | | | | $ | 944,384,145 | |
| | | | | | | | | |
| Other Assets In Excess Of Liabilities (2.95%) | | | | 28,716,399 | |
| | | | | | | | | |
| NET ASSETS (100.00%) | | | | | | $ | 973,100,544 | |
| (a) | Non-Income Producing Security. |
| (b) | Security exempt from registration under Rule 144A of the Securities Act of 1933. These securities may be resold in the ordinary course of business in transactions exempt from registration, normally to qualified institutional buyers. As of April 30, 2021, these securities had a total aggregate market value of $81,358,273, representing 8.36% of net assets. |
| (c) | Security was purchased pursuant to Regulation S under the Securities Act of 1933, which exempts securities offered and sold outside of the United States from registration. Such security cannot be sold in the United States without either an effective registration statement filed pursuant to the Securities Act of 1933, or pursuant to an exemption from registration. As of April 30, 2021, the aggregate market value of these securities was $84,539,594, representing 8.69% of net assets. |
See Notes to Financial Statements.
| Annual Report | April 30, 2021 | 63 |
| Grandeur Peak International Opportunities Fund | Portfolio of Investments |
April 30, 2021
| (e) | As a result of the use of significant unobservable inputs to determine fair value, these investments have been classified as level 3 assets. See also Note 2 to the financial statements for additional information. |
For Fund compliance purposes, the Fund’s geographical classifications refer to any one or more of the country sub-classifications used by one or more widely recognized market indexes or ratings group indexes, and/or as defined by Fund management. This definition may not apply for purposes of this report, which may combine sub-classifications for reporting ease. Geographical regions are shown as a percentage of net assets.
| Sector Composition (April 30, 2021) | |
| Technology | 28.0% |
| Consumer | 18.4% |
| Industrials | 17.6% |
| Health Care | 17.4% |
| Financials | 13.6% |
| Energy & Materials | 2.0% |
| Cash, Cash Equivalents, & Other Net Assets | 3.0% |
| Total | 100% |
| Industry Composition (April 30, 2021) | |
| IT Services | 15.3% |
| Capital Markets | 6.8% |
| Pharmaceuticals | 6.1% |
| Software | 5.6% |
| Health Care Providers & Services | 5.4% |
| Professional Services | 5.1% |
| Semiconductors & Semiconductor Equipment | 5.1% |
| Internet & Direct Marketing Retail | 4.9% |
| Machinery | 4.0% |
| Trading Companies & Distributors | 3.6% |
| Health Care Equipment & Supplies | 2.8% |
| Food & Staples Retailing | 2.8% |
| Multiline Retail | 2.6% |
| Life Sciences Tools & Services | 2.5% |
| Banks | 2.3% |
| Household Durables | 2.2% |
| Real Estate Management & Development | 2.2% |
| Specialty Retail | 2.1% |
| Equity Real Estate Investment Trusts (REITs) | 1.9% |
| Building Products | 1.2% |
| Textiles, Apparel & Luxury Goods | 1.1% |
| Food Products | 1.1% |
| Oil, Gas & Consumable Fuels | 1.1% |
| Other Industries (each less than 1%) | 9.2% |
| Cash and Other Assets, Less Liabilities | 3.0% |
| Total | 100% |
See Notes to Financial Statements.
| 64 | 1.855.377.7325 | www.GrandeurPeakGlobal.com |
| Grandeur Peak International Stalwarts Fund | Portfolio of Investments |
April 30, 2021
| | | Shares | | | Value
(Note 2) | |
| COMMON STOCKS (98.91%) | | | | |
| Argentina (1.35%) | | | | | | | | |
| Globant SA(a) | | | 119,750 | | | $ | 27,444,305 | |
| | | | | | | | | |
| Australia (1.36%) | | | | | | | | |
| Kogan.com, Ltd. | | | 925,063 | | | | 7,895,862 | |
| Netwealth Group, Ltd. | | | 1,728,376 | | | | 19,825,376 | |
| | | | | | | | 27,721,238 | |
| | | | | | | | | |
| Belgium (2.10%) | | | | | | | | |
| Melexis NV | | | 234,117 | | | | 25,501,040 | |
| Warehouses De Pauw CVA | | | 490,387 | | | | 17,286,205 | |
| | | | | | | | 42,787,245 | |
| | | | | | | | | |
| Brazil (1.77%) | | | | | | | | |
| Locaweb Servicos de Internet SA(b)(c) | | | 2,218,200 | | | | 11,923,940 | |
| Pagseguro Digital, Ltd., Class A(a) | | | 138,269 | | | | 6,324,424 | |
| Patria Investments, Ltd.(a) | | | 716,051 | | | | 9,917,307 | |
| Raia Drogasil SA | | | 1,602,400 | | | | 7,781,834 | |
| | | | | | | | 35,947,505 | |
| | | | | | | | | |
| Britain (20.23%) | | | | | | | | |
| Abcam PLC(a) | | | 970,235 | | | | 20,474,238 | |
| B&M European Value Retail SA | | | 8,781,200 | | | | 68,615,821 | |
| boohoo Group PLC(a) | | | 1,134,403 | | | | 5,328,211 | |
| Dechra Pharmaceuticals PLC | | | 1,373,600 | | | | 76,525,051 | |
| Diploma PLC | | | 393,793 | | | | 15,597,485 | |
| Endava PLC, ADR(a) | | | 542,349 | | | | 49,104,278 | |
| Gamma Communications PLC | | | 560,056 | | | | 14,061,537 | |
| Impax Asset Management Group PLC | | | 1,081,358 | | | | 14,993,764 | |
| Intertek Group PLC | | | 447,375 | | | | 37,923,293 | |
| Sanne Group PLC | | | 3,863,124 | | | | 34,465,027 | |
| Softcat PLC | | | 1,211,594 | | | | 32,076,478 | |
| St. James’s Place PLC | | | 2,247,048 | | | | 42,251,044 | |
| | | | | | | | 411,416,227 | |
| | | | | | | | | |
| Canada (1.92%) | | | | | | | | |
| Gildan Activewear, Inc.(a) | | | 581,584 | | | | 20,184,984 | |
| Ritchie Bros Auctioneers, Inc. | | | 298,224 | | | | 18,967,047 | |
| | | | | | | | 39,152,031 | |
| | | | | | | | | |
| China (11.76%) | | | | | | | | |
| Baozun, Inc., Sponsored ADR(a) | | | 302,943 | | | | 10,515,152 | |
| CSPC Pharmaceutical Group, Ltd. | | | 9,470,600 | | | | 11,728,901 | |
| Hangzhou Robam Appliances Co., Ltd., Class A | | | 1,450,000 | | | | 8,597,157 | |
| Hangzhou Tigermed Consulting Co., Ltd., Class A | | | 477,750 | | | | 11,554,145 | |
| Li Ning Co., Ltd. | | | 1,627,000 | | | | 13,279,495 | |
| | | Shares | | | Value
(Note 2) | |
| China (continued) | | | | | | | | |
| Silergy Corp. | | | 1,048,200 | | | $ | 109,762,109 | |
| Trip.com Group, Ltd., ADR(a) | | | 316,025 | | | | 12,350,257 | |
| WuXi AppTec Co., Ltd., Class H(b)(c) | | | 1,163,260 | | | | 27,510,008 | |
| Wuxi Biologics Cayman, Inc.(a)(b)(c) | | | 970,000 | | | | 13,673,844 | |
| Yum China Holdings, Inc. | | | 319,464 | | | | 20,100,675 | |
| | | | | | | | 239,071,743 | |
| | | | | | | | | |
| France (3.17%) | | | | | | | | |
| Alten SA(a) | | | 237,264 | | | | 29,694,726 | |
| BioMerieux | | | 75,050 | | | | 8,925,480 | |
| Bureau Veritas SA(a) | | | 659,012 | | | | 19,704,520 | |
| Esker SA | | | 21,721 | | | | 6,058,492 | |
| | | | | | | | 64,383,218 | |
| | | | | | | | | |
| Germany (3.40%) | | | | | | | | |
| Dermapharm Holding SE | | | 296,564 | | | | 25,920,871 | |
| MYT Netherlands Parent BV, ADR(a) | | | 10,000 | | | | 299,700 | |
| PATRIZIA AG | | | 705,980 | | | | 19,309,479 | |
| Puma SE(a) | | | 123,122 | | | | 12,984,673 | |
| QIAGEN NV(a) | | | 221,281 | | | | 10,650,254 | |
| | | | | | | | 69,164,977 | |
| | | | | | | | | |
| Hong Kong (1.80%) | | | | | | | | |
| Techtronic Industries Co., Ltd. | | | 1,400,500 | | | | 25,530,018 | |
| Vitasoy International Holdings, Ltd. | | | 2,861,700 | | | | 11,070,656 | |
| | | | | | | | 36,600,674 | |
| | | | | | | | | |
| India (9.16%) | | | | | | | | |
| Avenue Supermarts, Ltd.(a)(b)(c) | | | 324,500 | | | | 12,498,107 | |
| Bajaj Finance, Ltd.(a) | | | 227,376 | | | | 16,735,377 | |
| HCL Technologies, Ltd. | | | 779,861 | | | | 9,464,458 | |
| HDFC Asset Management Co., Ltd.(b)(c) | | | 252,479 | | | | 9,463,297 | |
| HDFC Bank, Ltd.(a) | | | 789,291 | | | | 15,048,981 | |
| IndiaMart InterMesh, Ltd.(a)(b)(c) | | | 88,101 | | | | 9,454,035 | |
| Marico, Ltd. | | | 1,372,658 | | | | 7,624,694 | |
| Metropolis Healthcare, Ltd.(b)(c) | | | 703,405 | | | | 22,743,800 | |
| Nippon Life India Asset Management, Ltd.(b)(c) | | | 1,615,720 | | | | 7,453,394 | |
| Titan Co., Ltd. | | | 432,255 | | | | 8,704,623 | |
| WNS Holdings, Ltd., ADR(a) | | | 926,920 | | | | 67,136,816 | |
| | | | | | | | 186,327,582 | |
| | | | | | | | | |
| Indonesia (0.39%) | | | | | | | | |
| Bank Tabungan Pensiunan Nasional Syariah | | | 34,880,500 | | | | 7,896,105 | |
See Notes to Financial Statements.
| Annual Report | April 30, 2021 | 65 |
| Grandeur Peak International Stalwarts Fund | Portfolio of Investments |
April 30, 2021
| | | Shares | | | Value
(Note 2) | |
| Ireland (1.25%) | | | | | | |
| Keywords Studios PLC(a) | | | 681,240 | | | $ | 25,458,651 | |
| | | | | | | | | |
| Israel (1.76%) | | | | | | | | |
| Wix.com, Ltd.(a) | | | 112,429 | | | | 35,738,930 | |
| | | | | | | | | |
| Italy (1.00%) | | | | | | | | |
| GVS SpA(a)(b)(c) | | | 455,497 | | | | 7,940,544 | |
| Interpump Group SpA | | | 231,829 | | | | 12,347,193 | |
| | | | | | | | 20,287,737 | |
| | | | | | | | | |
| Japan (9.99%) | | | | | | | | |
| BASE, Inc.(a) | | | 581,500 | | | | 9,699,648 | |
| BayCurrent Consulting, Inc. | | | 88,300 | | | | 24,117,074 | |
| Freee KK(a) | | | 98,500 | | | | 8,363,803 | |
| IR Japan Holdings, Ltd. | | | 194,900 | | | | 25,626,434 | |
| M&A Capital Partners Co., Ltd.(a) | | | 464,000 | | | | 21,482,661 | |
| M3, Inc. | | | 147,400 | | | | 10,219,140 | |
| MonotaRO Co., Ltd. | | | 912,600 | | | | 23,297,228 | |
| Nihon M&A Center, Inc. | | | 1,041,400 | | | | 27,290,416 | |
| Seria Co., Ltd. | | | 661,800 | | | | 24,009,854 | |
| Systena Corp. | | | 1,314,800 | | | | 27,056,320 | |
| Visional, Inc.(a) | | | 35,800 | | | | 2,047,305 | |
| | | | | | | | 203,209,883 | |
| | | | | | | | | |
| Netherlands (2.25%) | | | | | | | | |
| Aalberts NV | | | 446,158 | | | | 24,164,635 | |
| Shop Apotheke Europe NV(a)(b)(c) | | | 104,839 | | | | 21,641,627 | |
| | | | | | | | 45,806,262 | |
| | | | | | | | | |
| Norway (0.85%) | | | | | | | | |
| Nordic Semiconductor ASA(a) | | | 696,792 | | | | 17,244,012 | |
| | | | | | | | | |
| Philippines (0.41%) | | | | | | | | |
| Wilcon Depot, Inc. | | | 23,051,800 | | | | 8,425,995 | |
| | | | | | | | | |
| Poland (1.76%) | | | | | | | | |
| Allegro.eu SA(a)(b)(c) | | | 459,868 | | | | 7,050,452 | |
| Dino Polska SA(a)(b)(c) | | | 442,472 | | | | 28,726,493 | |
| | | | | | | | 35,776,945 | |
| | | | | | | | | |
| Singapore (0.47%) | | | | | | | | |
| Riverstone Holdings, Ltd./Singapore | | | 8,786,000 | | | | 9,573,323 | |
| | | | | | | | | |
| South Korea (0.92%) | | | | | | | | |
| Douzone Bizon Co., Ltd. | | | 104,500 | | | | 7,919,585 | |
| LEENO Industrial, Inc. | | | 73,428 | | | | 10,759,890 | |
| | | | | | | | 18,679,475 | |
| | | | | | | | | |
| Sweden (4.16%) | | | | | | | | |
| AddTech AB, Class B | | | 697,100 | | | | 12,187,135 | |
| EQT AB | | | 1,137,900 | | | | 38,483,119 | |
| | | Shares | | | Value
(Note 2) | |
| Sweden (continued) | | | | | | | | |
| Nibe Industrier AB, Class B | | | 261,597 | | | $ | 9,573,241 | |
| Sagax AB B | | | 610,304 | | | | 16,148,756 | |
| Sweco AB, Class B | | | 459,000 | | | | 8,187,182 | |
| | | | | | | | 84,579,433 | |
| | | | | | | | | |
| Switzerland (1.45%) | | | | | | | | |
| Partners Group Holding AG | | | 20,734 | | | | 29,514,591 | |
| | | | | | | | | |
| Taiwan (2.80%) | | | | | | | | |
| ASPEED Technology, Inc. | | | 171,000 | | | | 12,916,980 | |
| momo.com, Inc. | | | 531,000 | | | | 19,580,067 | |
| Voltronic Power Technology Corp. | | | 535,190 | | | | 24,428,713 | |
| | | | | | | | 56,925,760 | |
| | | | | | | | | |
| United States (10.36%) | | | | | | | | |
| Ashtead Group PLC | | | 232,501 | | | | 14,934,085 | |
| Bank of NT Butterfield & Son, Ltd. | | | 801,853 | | | | 31,448,675 | |
| EPAM Systems, Inc.(a) | | | 181,839 | | | | 83,236,802 | |
| Genpact, Ltd. | | | 674,850 | | | | 32,075,621 | |
| Lululemon Athletica, Inc.(a) | | | 98,189 | | | | 32,919,826 | |
| Monolithic Power Systems, Inc. | | | 44,275 | | | | 16,000,099 | |
| | | | | | | | 210,615,108 | |
| | | | | | | | | |
| Vietnam (1.07%) | | | | | | | | |
| Vietnam Dairy Products JSC | | | 2,034,652 | | | | 8,251,571 | |
| Vietnam Technological & Commercial Joint Stock Bank(a) | | | 7,584,926 | | | | 13,488,699 | |
| | | | | | | | 21,740,270 | |
| | | | | | | | | |
| TOTAL COMMON STOCKS | | | | | | | | |
| (Cost $1,306,984,334) | | | | | | | 2,011,489,225 | |
| | | | | | | | | |
| TOTAL INVESTMENTS (98.91%) | | | | | |
| (Cost $1,306,984,334) | | | | | | $ | 2,011,489,225 | |
| | | | | | | | | |
| Other Assets In Excess Of Liabilities (1.09%) | | | | 22,241,607 | |
| | | | | | | | | |
| NET ASSETS (100.00%) | | | | | | $ | 2,033,730,832 | |
| (a) | Non-Income Producing Security. |
| (b) | Security exempt from registration under Rule 144A of the Securities Act of 1933. These securities may be resold in the ordinary course of business in transactions exempt from registration, normally to qualified institutional buyers. As of April 30, 2021, these securities had a total aggregate market value of $180,079,541, representing 8.85% of net assets. |
See Notes to Financial Statements.
| 66 | 1.855.377.7325 | www.GrandeurPeakGlobal.com |
| Grandeur Peak International Stalwarts Fund | Portfolio of Investments |
April 30, 2021
| (c) | Security was purchased pursuant to Regulation S under the Securities Act of 1933, which exempts securities offered and sold outside of the United States from registration. Such security cannot be sold in the United States without either an effective registration statement filed pursuant to the Securities Act of 1933, or pursuant to an exemption from registration. As of April 30, 2021, the aggregate market value of these securities was $180,079,541, representing 8.85% of net assets. |
For Fund compliance purposes, the Fund’s geographical classifications refer to any one or more of the country sub-classifications used by one or more widely recognized market indexes or ratings group indexes, and/or as defined by Fund management. This definition may not apply for purposes of this report, which may combine sub-classifications for reporting ease. Geographical regions are shown as a percentage of net assets.
| Sector Composition (April 30, 2021) | |
| Technology | 33.3% |
| Consumer | 18.4% |
| Financials | 18.1% |
| Industrials | 16.5% |
| Health Care | 12.6% |
| Cash, Cash Equivalents, & Other Net Assets | 1.1% |
| Total | 100% |
| Industry Composition (April 30, 2021) | |
| IT Services | 20.6% |
| Capital Markets | 11.2% |
| Semiconductors & Semiconductor Equipment | 9.5% |
| Professional Services | 6.6% |
| Pharmaceuticals | 5.6% |
| Multiline Retail | 4.6% |
| Textiles, Apparel & Luxury Goods | 4.3% |
| Internet & Direct Marketing Retail | 4.2% |
| Trading Companies & Distributors | 3.7% |
| Banks | 3.3% |
| Life Sciences Tools & Services | 3.1% |
| Machinery | 3.1% |
| Software | 2.5% |
| Food & Staples Retailing | 2.4% |
| Real Estate Management & Development | 1.8% |
| Health Care Equipment & Supplies | 1.3% |
| Electrical Equipment | 1.2% |
| Health Care Providers & Services | 1.1% |
| Biotechnology | 1.0% |
| Other Industries (each less than 1%) | 7.8% |
| Cash and Other Assets, Less Liabilities | 1.1% |
| Total | 100% |
See Notes to Financial Statements.
| Annual Report | April 30, 2021 | 67 |
| Grandeur Peak US Stalwarts Fund | Portfolio of Investments |
April 30, 2021
| | | Shares | | | Value
(Note 2) | |
| COMMON STOCKS (98.75%) | | | | | | | | |
| Argentina (1.46%) | | | | | | | | |
| Globant SA(a) | | | 8,050 | | | $ | 1,844,899 | |
| | | | | | | | | |
| Britain (2.65%) | | | | | | | | |
| Endava PLC, ADR(a) | | | 36,875 | | | | 3,338,662 | |
| | | | | | | | | |
| Canada (1.19%) | | | | | | | | |
| Gildan Activewear, Inc.(a) | | | 15,944 | | | | 553,367 | |
| Ritchie Bros Auctioneers, Inc. | | | 14,800 | | | | 941,280 | |
| | | | | | | | 1,494,647 | |
| | | | | | | | | |
| Germany (0.64%) | | | | | | | | |
| QIAGEN NV(a) | | | 16,658 | | | | 801,750 | |
| | | | | | | | | |
| Hong Kong (0.92%) | | | | | | | | |
| Techtronic Industries Co., Ltd. | | | 64,000 | | | | 1,166,670 | |
| | | | | | | | | |
| India (2.09%) | | | | | | | | |
| WNS Holdings, Ltd., ADR(a) | | | 36,350 | | | | 2,632,831 | |
| | | | | | | | | |
| Israel (2.13%) | | | | | | | | |
| Wix.com, Ltd.(a) | | | 8,437 | | | | 2,681,954 | |
| | | | | | | | | |
| United States (87.67%) | | | | | | | | |
| 4imprint Group PLC(a) | | | 16,600 | | | | 538,745 | |
| Align Technology, Inc.(a) | | | 2,675 | | | | 1,593,043 | |
| Apollo Global Management, Inc. | | | 25,719 | | | | 1,424,061 | |
| Array Technologies, Inc.(a) | | | 45,703 | | | | 1,286,996 | |
| Ashtead Group PLC | | | 8,425 | | | | 541,158 | |
| Bank of Hawaii Corp. | | | 17,491 | | | | 1,589,757 | |
| Bank of NT Butterfield & Son, Ltd. | | | 57,436 | | | | 2,252,640 | |
| Blackline, Inc.(a) | | | 17,975 | | | | 2,086,179 | |
| Blackstone Group, Inc., Class A | | | 22,725 | | | | 2,010,935 | |
| Cardiovascular Systems, Inc.(a) | | | 25,838 | | | | 1,041,788 | |
| Castle Biosciences, Inc.(a) | | | 14,110 | | | | 974,013 | |
| CDW Corp. | | | 3,025 | | | | 539,448 | |
| Chewy, Inc.(a) | | | 15,550 | | | | 1,239,646 | |
| Cross Creek Lucid LP/Partnership Interest(a)(b) | | | 700,000 | | | | 700,000 | |
| Dexcom, Inc.(a) | | | 1,525 | | | | 588,803 | |
| Elastic NV(a) | | | 5,008 | | | | 604,065 | |
| EPAM Systems, Inc.(a) | | | 9,400 | | | | 4,302,849 | |
| Equinix, Inc. | | | 3,025 | | | | 2,180,299 | |
| Etsy, Inc.(a) | | | 9,175 | | | | 1,823,898 | |
| Exact Sciences Corp.(a) | | | 14,675 | | | | 1,934,459 | |
| ExlService Holdings, Inc.(a) | | | 15,275 | | | | 1,411,105 | |
| Fastenal Co. | | | 42,025 | | | | 2,197,066 | |
| First Hawaiian, Inc. | | | 34,934 | | | | 959,288 | |
| First Republic Bank | | | 26,650 | | | | 4,883,346 | |
| Five Below, Inc.(a) | | | 6,325 | | | | 1,273,033 | |
| Freshpet, Inc.(a) | | | 3,750 | | | | 693,075 | |
| | | Shares | | | Value
(Note 2) | |
| United States (continued) | | | | | | | | |
| Frontage Holdings Corp.(a)(c)(d) | | | 1,904,000 | | | $ | 1,296,664 | |
| Genpact, Ltd. | | | 53,100 | | | | 2,523,843 | |
| Glacier Bancorp, Inc. | | | 15,950 | | | | 940,253 | |
| Goosehead Insurance, Inc., Class A | | | 20,825 | | | | 2,289,500 | |
| Hamilton Lane, Inc., Class A | | | 10,500 | | | | 949,725 | |
| Heska Corp.(a) | | | 18,750 | | | | 3,424,687 | |
| Houlihan Lokey, Inc. | | | 23,875 | | | | 1,582,196 | |
| HubSpot, Inc.(a) | | | 1,586 | | | | 834,950 | |
| IDEXX Laboratories, Inc.(a) | | | 1,360 | | | | 746,626 | |
| Joint Corp.(a) | | | 20,283 | | | | 1,125,301 | |
| Kinsale Capital Group, Inc. | | | 10,988 | | | | 1,912,022 | |
| LeMaitre Vascular, Inc. | | | 34,150 | | | | 1,791,850 | |
| LGI Homes, Inc.(a) | | | 14,225 | | | | 2,358,221 | |
| Littelfuse, Inc. | | | 6,792 | | | | 1,801,510 | |
| Lululemon Athletica, Inc.(a) | | | 6,203 | | | | 2,079,680 | |
| Medallia, Inc.(a) | | | 20,000 | | | | 589,800 | |
| Medpace Holdings, Inc.(a) | | | 9,800 | | | | 1,662,864 | |
| Microchip Technology, Inc. | | | 5,200 | | | | 781,508 | |
| Mimecast, Ltd.(a) | | | 6,775 | | | | 294,171 | |
| Monolithic Power Systems, Inc. | | | 3,950 | | | | 1,427,451 | |
| Morningstar, Inc. | | | 1,450 | | | | 384,265 | |
| MSCI, Inc. | | | 1,650 | | | | 801,521 | |
| NV5 Global, Inc.(a) | | | 6,101 | | | | 549,883 | |
| Old Dominion Freight Line, Inc. | | | 1,750 | | | | 451,168 | |
| Ollie's Bargain Outlet Holdings, Inc.(a) | | | 16,672 | | | | 1,538,325 | |
| PagerDuty, Inc.(a) | | | 15,595 | | | | 662,164 | |
| Paycom Software, Inc.(a) | | | 6,991 | | | | 2,687,409 | |
| Paylocity Holding Corp.(a) | | | 7,825 | | | | 1,512,103 | |
| PJT Partners, Inc., Class A | | | 43,300 | | | | 3,183,849 | |
| Pool Corp. | | | 7,650 | | | | 3,232,278 | |
| Poshmark, Inc.(a) | | | 31,924 | | | | 1,335,381 | |
| Power Integrations, Inc. | | | 23,025 | | | | 1,906,701 | |
| PPD, Inc.(a) | | | 39,750 | | | | 1,836,449 | |
| Qualtrics International, Inc.(a) | | | 51,600 | | | | 1,927,260 | |
| Qualys, Inc.(a) | | | 20,613 | | | | 2,089,334 | |
| Rapid7, Inc.(a) | | | 14,225 | | | | 1,155,781 | |
| Rexford Industrial Realty, Inc. | | | 16,500 | | | | 916,575 | |
| Shoals Technologies Group, Inc.(a) | | | 27,957 | | | | 896,581 | |
| Silicon Laboratories, Inc.(a) | | | 4,753 | | | | 669,935 | |
| SVB Financial Group(a) | | | 3,580 | | | | 2,047,151 | |
| Systemax, Inc. | | | 47,725 | | | | 2,038,812 | |
| Terreno Realty Corp. | | | 24,999 | | | | 1,612,935 | |
| TriMas Corp.(a) | | | 20,050 | | | | 638,392 | |
| Ulta Beauty, Inc.(a) | | | 6,150 | | | | 2,025,502 | |
| WW Grainger, Inc. | | | 3,625 | | | | 1,571,583 | |
| YETI Holdings, Inc.(a) | | | 11,100 | | | | 948,162 | |
| Zendesk, Inc.(a) | | | 4,066 | | | | 594,246 | |
See Notes to Financial Statements.
| 68 | 1.855.377.7325 | www.GrandeurPeakGlobal.com |
| Grandeur Peak US Stalwarts Fund | Portfolio of Investments |
April 30, 2021
| | | Shares | | | Value
(Note 2) | |
| United States (continued) | | | | | | | | |
| Zoetis, Inc. | | | 1,591 | | | $ | 275,291 | |
| | | | | | | | 110,571,553 | |
| | | | | | | | | |
| TOTAL COMMON STOCKS | | | | | | | | |
| (Cost $104,066,562) | | | | | | | 124,532,966 | |
| | | | | | | | | |
| TOTAL INVESTMENTS (98.75%) | | | | | |
| (Cost $104,066,562) | | | | | | $ | 124,532,966 | |
| | | | | | | | | |
| Other Assets In Excess Of Liabilities (1.25%) | | | | 1,572,975 | |
| | | | | | | | | |
| NET ASSETS (100.00%) | | | | | | $ | 126,105,941 | |
| (a) | Non-Income Producing Security. |
| (b) | As a result of the use of significant unobservable inputs to determine fair value, these investments have been classified as level 3 assets. See also Note 2 to the financial statements for additional information. |
| (c) | Security exempt from registration under Rule 144A of the Securities Act of 1933. These securities may be resold in the ordinary course of business in transactions exempt from registration, normally to qualified institutional buyers. As of April 30, 2021, these securities had a total aggregate market value of $1,296,664, representing 1.03% of net assets. |
| (d) | Security was purchased pursuant to Regulation S under the Securities Act of 1933, which exempts securities offered and sold outside of the United States from registration. Such security cannot be sold in the United States without either an effective registration statement filed pursuant to the Securities Act of 1933, or pursuant to an exemption from registration. As of April 30, 2021, the aggregate market value of these securities was $1,296,664, representing 1.03% of net assets. |
For Fund compliance purposes, the Fund’s geographical classifications refer to any one or more of the country sub-classifications used by one or more widely recognized market indexes or ratings group indexes, and/or as defined by Fund management. This definition may not apply for purposes of this report, which may combine sub-classifications for reporting ease. Geographical regions are shown as a percentage of net assets.
| Sector Composition (April 30, 2021) | |
| Technology | 32.9% |
| Financials | 25.9% |
| Health Care | 15.2% |
| Consumer | 15.1% |
| Industrials | 9.7% |
| Cash, Cash Equivalents, & Other Net Assets | 1.2% |
| Total | 100% |
| Industry Composition (April 30, 2021) | |
| IT Services | 14.9% |
| Software | 11.9% |
| Banks | 10.1% |
| Capital Markets | 8.8% |
| Health Care Equipment & Supplies | 7.3% |
| Trading Companies & Distributors | 5.0% |
| Life Sciences Tools & Services | 4.4% |
| Semiconductors & Semiconductor Equipment | 3.8% |
| Equity Real Estate Investment Trusts (REITs) | 3.7% |
| Internet & Direct Marketing Retail | 3.5% |
| Insurance | 3.3% |
| Specialty Retail | 2.6% |
| Distributors | 2.6% |
| Textiles, Apparel & Luxury Goods | 2.1% |
| Household Durables | 1.9% |
| Electronic Equipment, Instruments & Components | 1.9% |
| Electrical Equipment | 1.7% |
| Health Care Providers & Services | 1.7% |
| Biotechnology | 1.5% |
| Machinery | 1.4% |
| Multiline Retail | 1.2% |
| Other Industries (each less than 1%) | 3.5% |
| Cash and Other Assets, Less Liabilities | 1.2% |
| Total | 100% |
See Notes to Financial Statements.
| Annual Report | April 30, 2021 | 69 |
| Grandeur Peak Funds® | Statements of Assets and Liabilities |
April 30, 2021
| | | Grandeur Peak Emerging Markets Opportunities Fund | | | Grandeur Peak Global Contrarian Fund | | | Grandeur Peak Global Micro Cap
Fund | |
| ASSETS | | | | | | | | | |
| Investments, at value (Cost - see below) | | $ | 619,889,078 | | | $ | 47,985,217 | | | $ | 70,131,241 | |
| Cash | | | 20,875,908 | | | | 1,608,194 | | | | 432,695 | |
| Foreign cash, at value (Cost $5,098,659, $71,389 and $87,665, respectively) | | | 5,098,960 | | | | 71,439 | | | | 87,556 | |
| Dividends and interest receivable | | | 483,217 | | | | 122,323 | | | | 78,745 | |
| Receivable for investments sold | | | 1,090,438 | | | | – | | | | 144,131 | |
| Receivable for fund shares subscribed | | | 123,734 | | | | 1,103,679 | | | | 92,011 | |
| Prepaid and other assets | | | 16,913 | | | | 5,868 | | | | 6,629 | |
| Total assets | | | 647,578,248 | | | | 50,896,720 | | | | 70,973,008 | |
| | | | | | | | | | | | | |
| LIABILITIES | | | | | | | | | | | | |
| Payable for investments purchased | | | 2,953,511 | | | | 1,280,563 | | | | 155,107 | |
| Foreign capital gains tax | | | 4,776,583 | | | | 66,465 | | | | 293,133 | |
| Payable for fund shares redeemed | | | 500,442 | | | | 69,887 | | | | – | |
| Advisory fees payable | | | 618,248 | | | | 28,049 | | | | 90,639 | |
| Administration fees payable | | | 28,119 | | | | 11,818 | | | | 15,329 | |
| Custodian fees payable | | | 90,375 | | | | 14,433 | | | | 9,594 | |
| Payable for trustee fees and expenses | | | 12,201 | | | | 819 | | | | 1,338 | |
| Payable for chief compliance officer fee | | | 815 | | | | 55 | | | | 89 | |
| Payable for principal financial officer fees | | | 149 | | | | 10 | | | | 16 | |
| Distribution and service fees payable | | | 3,020 | | | | – | | | | – | |
| Payable for transfer agency fees | | | 3,957 | | | | 2,783 | | | | 3,634 | |
| Accrued expenses and other liabilities | | | 41,492 | | | | 18,794 | | | | 29,372 | |
| Total liabilities | | | 9,028,912 | | | | 1,493,676 | | | | 598,251 | |
| NET ASSETS | | $ | 638,549,336 | | | $ | 49,403,044 | | | $ | 70,374,757 | |
| | | | | | | | | | | | | |
| NET ASSETS CONSISTS OF | | | | | | | | | | | | |
| Paid-in capital (Note 5) | | $ | 391,929,814 | | | $ | 40,181,483 | | | $ | 39,907,548 | |
| Total distributable earnings | | | 246,619,522 | | | | 9,221,561 | | | | 30,467,209 | |
| NET ASSETS | | $ | 638,549,336 | | | $ | 49,403,044 | | | $ | 70,374,757 | |
| | | | | | | | | | | | | |
| INVESTMENTS, AT COST | | $ | 402,019,213 | | | $ | 41,258,988 | | | $ | 43,260,892 | |
| | | | | | | | | | | | | |
| PRICING OF SHARES | | | | | | | | | | | | |
| Investor Class | | | | | | | | | | | | |
| Net Assets | | $ | 15,011,138 | | | $ | – | | | $ | – | |
| Net Asset Value, offering and redemption price per share | | $ | 17.70 | | | $ | – | | | $ | – | |
| Shares of beneficial interest outstanding | | | 848,128 | | | | – | | | | – | |
| Institutional Class | | | | | | | | | | | | |
| Net Assets | | $ | 623,538,198 | | | $ | 49,403,044 | | | $ | 70,374,757 | |
| Net Asset Value, offering and redemption price per share | | $ | 17.83 | | | $ | 15.41 | | | $ | 20.65 | |
| Shares of beneficial interest outstanding | | | 34,975,293 | | | | 3,205,192 | | | | 3,408,530 | |
See Notes to Financial Statements.
| 70 | 1.855.377.7325 | www.GrandeurPeakGlobal.com |
| Grandeur Peak Funds® | Statements of Assets and Liabilities |
April 30, 2021
| | | Grandeur Peak Global Opportunities Fund | | | Grandeur Peak Global Reach Fund | | | Grandeur Peak Global Stalwarts Fund | |
| ASSETS | | | | | | | | | |
| Investments, at value (Cost - see below) | | $ | 1,019,895,653 | | | $ | 374,610,883 | | | $ | 364,616,415 | |
| Cash | | | 3,436,884 | | | | 2,684,912 | | | | 3,325,090 | |
| Deposit with broker for short sales (Note 2) | | | – | | | | 1,000,000 | | | | – | |
| Foreign cash, at value (Cost $234,447, $69,120 and $11,469, respectively) | | | 232,394 | | | | 69,120 | | | | 11,333 | |
| Dividends and interest receivable | | | 1,925,924 | | | | 449,277 | | | | 543,174 | |
| Receivable for investments sold | | | – | | | | 626,112 | | | | 240,487 | |
| Receivable for fund shares subscribed | | | 136,159 | | | | 565,883 | | | | 252,427 | |
| Prepaid and other assets | | | 16,082 | | | | 6,701 | | | | 10,784 | |
| Total assets | | | 1,025,643,096 | | | | 380,012,888 | | | | 368,999,710 | |
| | | | | | | | | | | | | |
| LIABILITIES | | | | | | | | | | | | |
| Payable for investments purchased | | | 118,291 | | | | 1,707,901 | | | | 507,758 | |
| Foreign capital gains tax | | | 2,283,339 | | | | 765,574 | | | | – | |
| Payable for fund shares redeemed | | | 568,019 | | | | 80,780 | | | | 34,573 | |
| Advisory fees payable | | | 925,333 | | | | 332,634 | | | | 235,293 | |
| Administration fees payable | | | 35,897 | | | | 30,784 | | | | 18,491 | |
| Custodian fees payable | | | 57,203 | | | | 31,770 | | | | 22,112 | |
| Payable for trustee fees and expenses | | | 19,681 | | | | 7,146 | | | | 6,840 | |
| Payable for chief compliance officer fee | | | 1,314 | | | | 477 | | | | 457 | |
| Payable for principal financial officer fees | | | 240 | | | | 87 | | | | 84 | |
| Distribution and service fees payable | | | 26,406 | | | | 11,894 | | | | 20,962 | |
| Payable for transfer agency fees | | | 6,735 | | | | 5,283 | | | | 519,885 | |
| Accrued expenses and other liabilities | | | 38,885 | | | | 45,867 | | | | 32,060 | |
| Total liabilities | | | 4,081,343 | | | | 3,020,197 | | | | 1,398,515 | |
| NET ASSETS | | $ | 1,021,561,753 | | | $ | 376,992,691 | | | $ | 367,601,195 | |
| | | | | | | | | | | | | |
| NET ASSETS CONSISTS OF | | | | | | | | | | | | |
| Paid-in capital (Note 5) | | $ | 513,430,910 | | | $ | 185,504,663 | | | $ | 210,297,280 | |
| Total distributable earnings | | | 508,130,843 | | | | 191,488,028 | | | | 157,303,915 | |
| NET ASSETS | | $ | 1,021,561,753 | | | $ | 376,992,691 | | | $ | 367,601,195 | |
| | | | | | | | | | | | | |
| INVESTMENTS, AT COST | | $ | 611,951,511 | | | $ | 218,729,999 | | | $ | 228,944,712 | |
| | | | | | | | | | | | | |
| PRICING OF SHARES | | | | | | | | | | | | |
| Investor Class | | | | | | | | | | | | |
| Net Assets | | $ | 131,738,650 | | | $ | 59,164,328 | | | $ | 103,890,636 | |
| Net Asset Value, offering and redemption price per share | | $ | 5.51 | | | $ | 23.16 | | | $ | 23.26 | |
| Shares of beneficial interest outstanding | | | 23,924,303 | | | | 2,554,461 | | | | 4,466,459 | |
| Institutional Class | | | | | | | | | | | | |
| Net Assets | | $ | 889,823,103 | | | $ | 317,828,363 | | | $ | 263,710,559 | |
| Net Asset Value, offering and redemption price per share | | $ | 5.61 | | | $ | 23.31 | | | $ | 23.50 | |
| Shares of beneficial interest outstanding | | | 158,646,812 | | | | 13,635,389 | | | | 11,222,806 | |
See Notes to Financial Statements.
| Annual Report | April 30, 2021 | 71 |
| Grandeur Peak Funds® | Statements of Assets and Liabilities |
April 30, 2021
| | | Grandeur Peak International Opportunities Fund | | | Grandeur Peak International Stalwarts Fund | | | Grandeur Peak US Stalwarts Fund | |
| ASSETS | | | | | | | | | |
| Investments, at value (Cost - see below) | | $ | 944,384,145 | | | $ | 2,011,489,225 | | | $ | 124,532,966 | |
| Cash | | | 28,656,864 | | | | 23,845,122 | | | | 1,778,493 | |
| Foreign cash, at value (Cost $1,334,374, $102,608 and $–, respectively) | | | 1,334,014 | | | | 101,391 | | | | – | |
| Dividends and interest receivable | | | 2,110,834 | | | | 3,811,105 | | | | 36,683 | |
| Receivable for investments sold | | | 740,540 | | | | 601,073 | | | | 622,597 | |
| Receivable for fund shares subscribed | | | 156,270 | | | | 1,312,330 | | | | 147,452 | |
| Prepaid and other assets | | | 18,269 | | | | 20,232 | | | | 8,825 | |
| Total assets | | | 977,400,936 | | | | 2,041,180,478 | | | | 127,127,016 | |
| | | | | | | | | | | | | |
| LIABILITIES | | | | | | | | | | | | |
| Payable for investments purchased | | | 1,104,506 | | | | 1,316,906 | | | | 861,897 | |
| Foreign capital gains tax | | | 2,124,882 | | | | 3,714,968 | | | | – | |
| Payable for fund shares redeemed | | | 28,163 | | | | 861,852 | | | | 31,813 | |
| Advisory fees payable | | | 882,282 | | | | 1,294,894 | | | | 77,556 | |
| Administration fees payable | | | 34,949 | | | | 51,957 | | | | 10,268 | |
| Custodian fees payable | | | 59,674 | | | | 104,263 | | | | 6,252 | |
| Payable for trustee fees and expenses | | | 18,777 | | | | 37,849 | | | | 1,808 | |
| Payable for chief compliance officer fee | | | 1,254 | | | | 2,528 | | | | 121 | |
| Payable for principal financial officer fees | | | 229 | | | | 462 | | | | 22 | |
| Distribution and service fees payable | | | 13,789 | | | | 13,613 | | | | – | |
| Payable for transfer agency fees | | | 3,290 | | | | 17,295 | | | | 3,077 | |
| Accrued expenses and other liabilities | | | 28,597 | | | | 33,059 | | | | 28,261 | |
| Total liabilities | | | 4,300,392 | | | | 7,449,646 | | | | 1,021,075 | |
| NET ASSETS | | $ | 973,100,544 | | | $ | 2,033,730,832 | | | $ | 126,105,941 | |
| | | | | | | | | | | | | |
| NET ASSETS CONSISTS OF | | | | | | | | | | | | |
| Paid-in capital (Note 5) | | $ | 528,931,575 | | | $ | 1,272,009,372 | | | $ | 104,072,170 | |
| Total distributable earnings | | | 444,168,969 | | | | 761,721,460 | | | | 22,033,771 | |
| NET ASSETS | | $ | 973,100,544 | | | $ | 2,033,730,832 | | | $ | 126,105,941 | �� |
| | | | | | | | | | | | | |
| INVESTMENTS, AT COST | | $ | 564,955,589 | | | $ | 1,306,984,334 | | | $ | 104,066,562 | |
| | | | | | | | | | | | | |
| PRICING OF SHARES | | | | | | | | | | | | |
| Investor Class | | | | | | | | | | | | |
| Net Assets | | $ | 69,041,325 | | | $ | 67,687,734 | | | $ | – | |
| Net Asset Value, offering and redemption price per share | | $ | 5.17 | | | $ | 24.05 | | | $ | – | |
| Shares of beneficial interest outstanding | | | 13,352,880 | | | | 2,814,019 | | | | – | |
| Institutional Class | | | | | | | | | | | | |
| Net Assets | | $ | 904,059,219 | | | $ | 1,966,043,098 | | | $ | 126,105,941 | |
| Net Asset Value, offering and redemption price per share | | $ | 5.21 | | | $ | 24.19 | | | $ | 22.71 | |
| Shares of beneficial interest outstanding | | | 173,460,630 | | | | 81,272,280 | | | | 5,553,678 | |
See Notes to Financial Statements.
| 72 | 1.855.377.7325 | www.GrandeurPeakGlobal.com |
| Grandeur Peak Funds® | Statements of Operations |
For the Year Ended April 30, 2021
| | | Grandeur Peak Emerging Markets Opportunities Fund | | | Grandeur Peak Global Contrarian Fund | | | Grandeur Peak Global Micro Cap
Fund | |
| INVESTMENT INCOME | | | | | | | | | |
| Dividends | | $ | 6,727,235 | | | $ | 723,934 | | | $ | 725,459 | |
| Foreign taxes withheld | | | (703,280 | ) | | | (39,542 | ) | | | (70,992 | ) |
| Total investment income | | | 6,023,955 | | | | 684,392 | | | | 654,467 | |
| | | | | | | | | | | | | |
| EXPENSES | | | | | | | | | | | | |
| Investment advisor fees (Note 6) | | | 6,878,521 | | | | 208,698 | | | | 709,192 | |
| Administrative fees | | | 182,128 | | | | 15,392 | | | | 49,144 | |
| Distribution and service fees - Investor Class | | | 29,222 | | | | – | | | | – | |
| Transfer agent fees | | | 40,616 | | | | 31,026 | | | | 37,996 | |
| Recoupment of previously waived fees | | | – | | | | – | | | | 34,610 | |
| Professional fees | | | 62,675 | | | | 22,357 | | | | 31,627 | |
| Printing fees | | | 11,222 | | | | – | | | | 3,156 | |
| Registration fees | | | 36,406 | | | | 21,569 | | | | 20,462 | |
| Custodian fees | | | 482,329 | | | | 70,789 | | | | 59,489 | |
| Trustee fees and expenses | | | 25,271 | | | | 1,251 | | | | 2,560 | |
| Chief compliance officer fees | | | 10,203 | | | | 385 | | | | 928 | |
| Principal financial officer fees | | | 1,851 | | | | 70 | | | | 169 | |
| Offering costs | | | – | | | | 16,656 | | | | – | |
| Other expenses | | | 18,468 | | | | 4,025 | | | | 5,864 | |
| Total expenses | | | 7,778,912 | | | | 392,218 | | | | 955,197 | |
| Voluntary waiver of investment advisory fees (Note 6) | | | (350,781 | ) | | | – | | | | – | |
| Less fees waived/reimbursed by investment advisor (Note 6) | | | – | | | | (109,006 | ) | | | (7,343 | ) |
| Total net expenses | | | 7,428,131 | | | | 283,212 | | | | 947,854 | |
| NET INVESTMENT INCOME/(LOSS) | | | (1,404,176 | ) | | | 401,180 | | | | (293,387 | ) |
| | | | | | | | | | | | | |
| REALIZED AND UNREALIZED GAIN/(LOSS) ON INVESTMENTS | | | | | | | | | | | | |
| Net realized gain on investments | | | 46,955,704 | | | | 3,103,091 | | | | 8,095,477 | |
| Net realized loss on foreign currency transactions | | | (205,187 | ) | | | (15,723 | ) | | | (12,553 | ) |
| Net realized gain | | | 46,750,517 | | | | 3,087,368 | | | | 8,082,924 | |
| Net change in unrealized appreciation on investments (net of change in foreign capital gains tax of $4,735,729, $66,466 and $292,419, respectively) | | | 182,558,932 | | | | 7,660,274 | | | | 23,349,554 | |
| Net change in unrealized appreciation/(depreciation) on translation of assets and liabilities in foreign currencies | | | 13,963 | | | | (131 | ) | | | 622 | |
| Net change in unrealized appreciation | | | 182,572,895 | | | | 7,660,143 | | | | 23,350,176 | |
| NET REALIZED AND UNREALIZED GAIN ON INVESTMENTS AND FOREIGN CURRENCY TRANSACTIONS | | | 229,323,412 | | | | 10,747,511 | | | | 31,433,100 | |
| NET INCREASE IN NET ASSETS RESULTING FROM OPERATIONS | | $ | 227,919,236 | | | $ | 11,148,691 | | | $ | 31,139,713 | |
See Notes to Financial Statements.
| Annual Report | April 30, 2021 | 73 |
| Grandeur Peak Funds® | Statements of Operations |
For the Year Ended April 30, 2021
| | | Grandeur Peak Global Opportunities Fund | | | Grandeur Peak Global Reach
Fund | | | Grandeur Peak Global Stalwarts Fund | |
| INVESTMENT INCOME | | | | | | | | | | | | |
| Dividends | | $ | 10,535,641 | | | $ | 3,811,749 | | | $ | 3,040,824 | |
| Foreign taxes withheld | | | (998,511 | ) | | | (339,387 | ) | | | (215,196 | ) |
| Total investment income | | | 9,537,130 | | | | 3,472,362 | | | | 2,825,628 | |
| | | | | | | | | | | | | |
| EXPENSES | | | | | | | | | | | | |
| Investment advisor fees (Note 6) | | | 10,035,019 | | | | 3,371,158 | | | | 2,254,081 | |
| Administrative fees | | | 265,103 | | | | 143,425 | | | | 110,685 | |
| Distribution and service fees - Investor Class | | | 281,151 | | | | 126,442 | | | | 237,783 | |
| Transfer agent fees | | | 63,465 | | | | 52,048 | | | | 67,209 | |
| Professional fees | | | 60,321 | | | | 60,641 | | | | 42,676 | |
| Printing fees | | | 27,226 | | | | 19,693 | | | | 12,455 | |
| Registration fees | | | 37,159 | | | | 35,470 | | | | 35,746 | |
| Custodian fees | | | 318,948 | | | | 184,701 | | | | 140,426 | |
| Trustee fees and expenses | | | 40,614 | | | | 15,324 | | | | 14,565 | |
| Chief compliance officer fees | | | 15,916 | | | | 6,152 | | | | 5,649 | |
| Principal financial officer fees | | | 2,890 | | | | 1,117 | | | | 1,027 | |
| Other expenses | | | 27,436 | | | | 14,996 | | | | 14,717 | |
| Total expenses | | | 11,175,248 | | | | 4,031,167 | | | | 2,937,019 | |
| Voluntary waiver of investment advisory fees (Note 6) | | | (703,763 | ) | | | – | | | | – | |
| Total net expenses | | | 10,471,485 | | | | 4,031,167 | | | | 2,937,019 | |
| NET INVESTMENT LOSS | | | (934,355 | ) | | | (558,805 | ) | | | (111,391 | ) |
| | | | | | | | | | | | | |
| REALIZED AND UNREALIZED GAIN/(LOSS) ON INVESTMENTS | | | | | | | | | | | | |
| Net realized gain on investments | | | 168,407,252 | | | | 61,936,310 | | | | 36,555,452 | |
| Net realized loss on foreign currency transactions | | | (177,660 | ) | | | (9,894 | ) | | | (4,576 | ) |
| Net realized gain | | | 168,229,592 | | | | 61,926,416 | | | | 36,550,876 | |
| Net change in unrealized appreciation on investments (net of change in foreign capital gains tax of $2,283,340, $759,814 and $512,433, respectively) | | | 299,092,273 | | | | 109,184,868 | | | | 103,496,600 | |
| Net change in unrealized appreciation on translation of assets and liabilities in foreign currencies | | | 17,570 | | | | 7,421 | | | | 2,700 | |
| Net change in unrealized appreciation | | | 299,109,843 | | | | 109,192,289 | | | | 103,499,300 | |
| NET REALIZED AND UNREALIZED GAIN ON INVESTMENTS AND FOREIGN CURRENCY TRANSACTIONS | | | 467,339,435 | | | | 171,118,705 | | | | 140,050,176 | |
| NET INCREASE IN NET ASSETS RESULTING FROM OPERATIONS | | $ | 466,405,080 | | | $ | 170,559,900 | | | $ | 139,938,785 | |
See Notes to Financial Statements.
| 74 | 1.855.377.7325 | www.GrandeurPeakGlobal.com |
| Grandeur Peak Funds® | Statements of Operations |
For the Year Ended April 30, 2021
| | | Grandeur Peak International Opportunities Fund | | | Grandeur Peak International Stalwarts Fund | | | Grandeur Peak US Stalwarts Fund | |
| INVESTMENT INCOME | | | | | | | | | |
| Dividends | | $ | 10,668,071 | | | $ | 19,718,128 | | | $ | 307,615 | |
| Foreign taxes withheld | | | (1,175,399 | ) | | | (1,817,080 | ) | | | (823 | ) |
| Total investment income | | | 9,492,672 | | | | 17,901,048 | | | | 306,792 | |
| | | | | | | | | | | | | |
| EXPENSES | | | | | | | | | | | | |
| Investment advisor fees (Note 6) | | | 9,439,878 | | | | 11,874,065 | | | | 332,677 | |
| Administrative fees | | | 250,590 | | | | 446,367 | | | | 33,581 | |
| Distribution and service fees - Investor Class | | | 134,410 | | | | 209,632 | | | | – | |
| Transfer agent fees | | | 37,840 | | | | 144,806 | | | | 32,736 | |
| Professional fees | | | 56,507 | | | | 69,324 | | | | 16,466 | |
| Printing fees | | | 19,218 | | | | 56,211 | | | | 25 | |
| Registration fees | | | 55,828 | | | | 58,092 | | | | – | |
| Custodian fees | | | 337,946 | | | | 566,653 | | | | 30,480 | |
| Trustee fees and expenses | | | 38,509 | | | | 77,489 | | | | 2,823 | |
| Chief compliance officer fees | | | 14,939 | | | | 29,369 | | | | 787 | |
| Principal financial officer fees | | | 2,712 | | | | 5,341 | | | | 144 | |
| Offering costs | | | – | | | | – | | | | 40,186 | |
| Other expenses | | | 27,000 | | | | 43,269 | | | | 6,586 | |
| Total expenses | | | 10,415,377 | | | | 13,580,618 | | | | 496,491 | |
| Voluntary waiver of investment advisory fees (Note 6) | | | (601,414 | ) | | | – | | | | – | |
| Less fees waived/reimbursed by investment advisor (Note 6) | | | – | | | | – | | | | (49,676 | ) |
| Total net expenses | | | 9,813,963 | | | | 13,580,618 | | | | 446,815 | |
| NET INVESTMENT INCOME/(LOSS) | | | (321,291 | ) | | | 4,320,430 | | | | (140,023 | ) |
| | | | | | | | | | | | | |
| REALIZED AND UNREALIZED GAIN/(LOSS) ON INVESTMENTS | | | | | | | | | | | | |
| Net realized gain on investments | | | 104,049,870 | | | | 78,008,723 | | | | 2,016,644 | |
| Net realized gain/(loss) on foreign currency transactions | | | (781,261 | ) | | | 35,446 | | | | (292 | ) |
| Net realized gain | | | 103,268,609 | | | | 78,044,169 | | | | 2,016,352 | |
| Net change in unrealized appreciation on investments (net of change in foreign capital gains tax of $2,088,372, $3,714,968 and $0, respectively) | | | 297,636,181 | | | | 628,477,541 | | | | 18,985,167 | |
| Net change in unrealized appreciation/(depreciation) on translation of assets and liabilities in foreign currencies | | | 23,851 | | | | 23,464 | | | | (6 | ) |
| Net change in unrealized appreciation | | | 297,660,032 | | | | 628,501,005 | | | | 18,985,161 | |
| NET REALIZED AND UNREALIZED GAIN ON INVESTMENTS AND FOREIGN CURRENCY TRANSACTIONS | | | 400,928,641 | | | | 706,545,174 | | | | 21,001,513 | |
| NET INCREASE IN NET ASSETS RESULTING FROM OPERATIONS | | $ | 400,607,350 | | | $ | 710,865,604 | | | $ | 20,861,490 | |
See Notes to Financial Statements.
| Annual Report | April 30, 2021 | 75 |
| Grandeur Peak Emerging Markets Opportunities Fund | Statements of Changes in Net Assets |
| | | For the Year Ended April 30, 2021 | | | For the Year Ended April 30, 2020 | |
| OPERATIONS | | | | | | | | |
| Net investment income/(loss) | | $ | (1,404,176 | ) | | $ | 1,293,698 | |
| Net realized gain/(loss) | | | 46,750,517 | | | | (888,857 | ) |
| Net change in unrealized appreciation/(depreciation) | | | 182,572,895 | | | | (27,811,796 | ) |
| Net increase/(decrease) in net assets resulting from operations | | | 227,919,236 | | | | (27,406,955 | ) |
| | | | | | | | | |
| DISTRIBUTIONS TO SHAREHOLDERS (NOTE 3) | | | | | | | | |
| Investor Class | | | (2,571 | ) | | | (8,164 | ) |
| Institutional Class | | | (794,820 | ) | | | (986,840 | ) |
| Net decrease in net assets from distributions | | | (797,391 | ) | | | (995,004 | ) |
| | | | | | | | | |
| CAPITAL SHARE TRANSACTIONS (NOTE 5) | | | | | | | | |
| Investor Class | | | | | | | | |
| Proceeds from sales of shares | | | 1,984,236 | | | | 451,669 | |
| Distributions reinvested | | | 2,543 | | | | 8,003 | |
| Cost of shares redeemed | | | (2,636,891 | ) | | | (3,475,235 | ) |
| Redemption fees | | | 485 | | | | – | |
| Net decrease from capital shares transactions | | | (649,627 | ) | | | (3,015,563 | ) |
| | | | | | | | | |
| Institutional Class | | | | | | | | |
| Proceeds from sales of shares | | | 110,127,902 | | | | 67,811,609 | |
| Distributions reinvested | | | 730,183 | | | | 920,902 | |
| Cost of shares redeemed | | | (98,220,322 | ) | | | (104,284,799 | ) |
| Redemption fees | | | 9,739 | | | | 850 | |
| Net increase/(decrease) from capital shares transactions | | | 12,647,502 | | | | (35,551,438 | ) |
| | | | | | | | | |
| Net increase/(decrease) in net assets | | | 239,119,720 | | | | (66,968,960 | ) |
| | | | | | | | | |
| NET ASSETS | | | | | | | | |
| Beginning of year | | | 399,429,616 | | | | 466,398,576 | |
| End of year | | $ | 638,549,336 | | | $ | 399,429,616 | |
| | | | | | | | | |
| OTHER INFORMATION | | | | | | | | |
| Shares Transactions | | | | | | | | |
| Investor Class | | | | | | | | |
| Issued | | | 122,035 | | | | 40,303 | |
| Issued to shareholders in reinvestment of distributions | | | 156 | | | | 631 | |
| Redeemed | | | (182,150 | ) | | | (306,328 | ) |
| Net decrease in share transactions | | | (59,959 | ) | | | (265,394 | ) |
| | | | | | | | | |
| Institutional Class | | | | | | | | |
| Issued | | | 6,753,337 | | | | 5,981,655 | |
| Issued to shareholders in reinvestment of distributions | | | 44,496 | | | | 72,228 | |
| Redeemed | | | (6,761,873 | ) | | | (9,192,424 | ) |
| Net increase/(decrease) in share transactions | | | 35,960 | | | | (3,138,541 | ) |
See Notes to Financial Statements.
| 76 | 1.855.377.7325 | www.GrandeurPeakGlobal.com |
| Grandeur Peak Global Contrarian Fund | Statements of Changes in Net Assets |
| | | For the Year Ended April 30, 2021 | | | For the Period September 18, 2019 (Commencement of Operations) to April 30, 2020 | |
| OPERATIONS | | | | | | | | |
| Net investment income | | $ | 401,180 | | | $ | 43,887 | |
| Net realized gain/(loss) | | | 3,087,368 | | | | (524,050 | ) |
| Net change in unrealized appreciation/(depreciation) | | | 7,660,143 | | | | (1,000,272 | ) |
| Net increase/(decrease) in net assets resulting from operations | | | 11,148,691 | | | | (1,480,435 | ) |
| | | | | | | | | |
| DISTRIBUTIONS TO SHAREHOLDERS (NOTE 3) | | | | | | | | |
| Institutional Class | | | (409,394 | ) | | | (19,023 | ) |
| Net decrease in net assets from distributions | | | (409,394 | ) | | | (19,023 | ) |
| | | | | | | | | |
| CAPITAL SHARE TRANSACTIONS (NOTE 5) | | | | | | | | |
| Institutional Class | | | | | | | | |
| Proceeds from sales of shares | | | 31,456,092 | | | | 12,724,690 | |
| Distributions reinvested | | | 403,668 | | | | 18,940 | |
| Cost of shares redeemed | | | (2,063,549 | ) | | | (2,384,958 | ) |
| Redemption fees | | | 6,119 | | | | 2,203 | |
| Net increase from capital shares transactions | | | 29,802,330 | | | | 10,360,875 | |
| Net increase in net assets | | | 40,541,627 | | | | 8,861,417 | |
| | | | | | | | | |
| NET ASSETS | | | | | | | | |
| Beginning of year | | | 8,861,417 | | | | – | |
| End of year | | $ | 49,403,044 | | | $ | 8,861,417 | |
| | | | | | | | | |
| OTHER INFORMATION | | | | | | | | |
| Shares Transactions | | | | | | | | |
| Institutional Class | | | | | | | | |
| Issued | | | 2,350,442 | | | | 1,260,722 | |
| Issued to shareholders in reinvestment of distributions | | | 30,237 | | | | 1,747 | |
| Redeemed | | | (184,812 | ) | | | (253,144 | ) |
| Net increase in share transactions | | | 2,195,867 | | | | 1,009,325 | |
See Notes to Financial Statements.
| Annual Report | April 30, 2021 | 77 |
| Grandeur Peak Global Micro Cap Fund | Statements of Changes in Net Assets |
| | | For the Year Ended April 30, 2021 | | | For the Year Ended April 30, 2020 | |
| OPERATIONS | | | | | | | | |
| Net investment income/(loss) | | $ | (293,387 | ) | | $ | 29,619 | |
| Net realized gain | | | 8,082,924 | | | | 711,242 | |
| Net change in unrealized appreciation/(depreciation) | | | 23,350,176 | | | | (1,056,838 | ) |
| Net increase/(decrease) in net assets resulting from operations | | | 31,139,713 | | | | (315,977 | ) |
| | | | | | | | | |
| DISTRIBUTIONS TO SHAREHOLDERS (NOTE 3) | | | | | | | | |
| Institutional Class | | | (4,057,924 | ) | | | (250,282 | ) |
| Net decrease in net assets from distributions | | | (4,057,924 | ) | | | (250,282 | ) |
| | | | | | | | | |
| CAPITAL SHARE TRANSACTIONS (NOTE 5) | | | | | | | | |
| Institutional Class | | | | | | | | |
| Proceeds from sales of shares | | | 13,038,427 | | | | 2,296,880 | |
| Distributions reinvested | | | 3,771,469 | | | | 235,712 | |
| Cost of shares redeemed | | | (3,150,855 | ) | | | (7,986,889 | ) |
| Redemption fees | | | – | | | | 2 | |
| Net increase/(decrease) from capital shares transactions | | | 13,659,041 | | | | (5,454,295 | ) |
| | | | | | | | | |
| Net increase/(decrease) in net assets | | | 40,740,830 | | | | (6,020,554 | ) |
| | | | | | | | | |
| NET ASSETS | | | | | | | | |
| Beginning of year | | | 29,633,927 | | | | 35,654,481 | |
| End of year | | $ | 70,374,757 | | | $ | 29,633,927 | |
| | | | | | | | | |
| OTHER INFORMATION | | | | | | | | |
| Shares Transactions | | | | | | | | |
| Institutional Class | | | | | | | | |
| Issued | | | 706,934 | | | | 217,579 | |
| Issued to shareholders in reinvestment of distributions | | | 213,802 | | | | 18,872 | |
| Redeemed | | | (195,217 | ) | | | (706,293 | ) |
| Net increase/(decrease) in share transactions | | | 725,519 | | | | (469,842 | ) |
See Notes to Financial Statements.
| 78 | 1.855.377.7325 | www.GrandeurPeakGlobal.com |
| Grandeur Peak Global Opportunities Fund | Statements of Changes in Net Assets |
| | | For the Year Ended April 30, 2021 | | | For the Year Ended April 30, 2020 | |
| OPERATIONS | | | | | | | | |
| Net investment income/(loss) | | $ | (934,355 | ) | | $ | 78,438 | |
| Net realized gain | | | 168,229,592 | | | | 26,694,598 | |
| Net change in unrealized appreciation/(depreciation) | | | 299,109,843 | | | | (44,213,439 | ) |
| Net increase/(decrease) in net assets resulting from operations | | | 466,405,080 | | | | (17,440,403 | ) |
| | | | | | | | | |
| DISTRIBUTIONS TO SHAREHOLDERS (NOTE 3) | | | | | | | | |
| Investor Class | | | (9,200,642 | ) | | | (6,708,303 | ) |
| Institutional Class | | | (54,763,378 | ) | | | (30,103,204 | ) |
| Net decrease in net assets from distributions | | | (63,964,020 | ) | | | (36,811,507 | ) |
| | | | | | | | | |
| CAPITAL SHARE TRANSACTIONS (NOTE 5) | | | | | | | | |
| Investor Class | | | | | | | | |
| Proceeds from sales of shares | | | 13,573,747 | | | | 7,454,239 | |
| Distributions reinvested | | | 8,906,996 | | | | 6,371,304 | |
| Cost of shares redeemed | | | (43,809,498 | ) | | | (41,539,676 | ) |
| Redemption fees | | | 581 | | | | 754 | |
| Net decrease from capital shares transactions | | | (21,328,174 | ) | | | (27,713,379 | ) |
| | | | | | | | | |
| Institutional Class | | | | | | | | |
| Proceeds from sales of shares | | | 105,694,563 | | | | 65,579,216 | |
| Distributions reinvested | | | 50,942,882 | | | | 28,060,062 | |
| Cost of shares redeemed | | | (79,175,222 | ) | | | (103,299,952 | ) |
| Redemption fees | | | 1,131 | | | | 4,046 | |
| Net increase/(decrease) from capital shares transactions | | | 77,463,354 | | | | (9,656,628 | ) |
| | | | | | | | | |
| Net increase/(decrease) in net assets | | | 458,576,240 | | | | (91,621,917 | ) |
| | | | | | | | | |
| NET ASSETS | | | | | | | | |
| Beginning of year | | | 562,985,513 | | | | 654,607,430 | |
| End of year | | $ | 1,021,561,753 | | | $ | 562,985,513 | |
| | | | | | | | | |
| OTHER INFORMATION | | | | | | | | |
| Shares Transactions | | | | | | | | |
| Investor Class | | | | | | | | |
| Issued | | | 2,966,817 | | | | 2,224,286 | |
| Issued to shareholders in reinvestment of distributions | | | 1,840,288 | | | | 1,750,358 | |
| Redeemed | | | (9,575,738 | ) | | | (12,872,148 | ) |
| Net decrease in share transactions | | | (4,768,633 | ) | | | (8,897,504 | ) |
| | | | | | | | | |
| Institutional Class | | | | | | | | |
| Issued | | | 22,648,748 | | | | 19,482,616 | |
| Issued to shareholders in reinvestment of distributions | | | 10,333,242 | | | | 7,604,353 | |
| Redeemed | | | (17,308,856 | ) | | | (32,775,945 | ) |
| Net increase/(decrease) in share transactions | | | 15,673,134 | | | | (5,688,976 | ) |
See Notes to Financial Statements.
| Annual Report | April 30, 2021 | 79 |
| Grandeur Peak Global Reach Fund | Statements of Changes in Net Assets |
| | | For the Year Ended April 30, 2021 | | | For the Year Ended April 30, 2020 | |
| OPERATIONS | | | | | | | | |
| Net investment income/(loss) | | $ | (558,805 | ) | | $ | 490,829 | |
| Net realized gain | | | 61,926,416 | | | | 10,535,989 | |
| Net change in unrealized appreciation/(depreciation) | | | 109,192,289 | | | | (15,663,042 | ) |
| Net increase/(decrease) in net assets resulting from operations | | | 170,559,900 | | | | (4,636,224 | ) |
| | | | | | | | | |
| DISTRIBUTIONS TO SHAREHOLDERS (NOTE 3) | | | | | | | | |
| Investor Class | | | (4,512,695 | ) | | | (1,188,362 | ) |
| Institutional Class | | | (21,062,660 | ) | | | (6,944,162 | ) |
| Net decrease in net assets from distributions | | | (25,575,355 | ) | | | (8,132,524 | ) |
| | | | | | | | | |
| CAPITAL SHARE TRANSACTIONS (NOTE 5) | | | | | | | | |
| Investor Class | | | | | | | | |
| Proceeds from sales of shares | | | 5,613,392 | | | | 7,664,510 | |
| Distributions reinvested | | | 4,404,465 | | | | 1,160,085 | |
| Cost of shares redeemed | | | (15,781,767 | ) | | | (24,000,795 | ) |
| Redemption fees | | | 922 | | | | 243 | |
| Net decrease from capital shares transactions | | | (5,762,988 | ) | | | (15,175,957 | ) |
| | | | | | | | | |
| Institutional Class | | | | | | | | |
| Proceeds from sales of shares | | | 33,269,428 | | | | 30,887,024 | |
| Distributions reinvested | | | 17,988,818 | | | | 6,260,838 | |
| Cost of shares redeemed | | | (54,802,889 | ) | | | (96,958,918 | ) |
| Redemption fees | | | 20,130 | | | | 1,537 | |
| Net decrease from capital shares transactions | | | (3,524,513 | ) | | | (59,809,519 | ) |
| | | | | | | | | |
| Net increase/(decrease) in net assets | | | 135,697,044 | | | | (87,754,224 | ) |
| | | | | | | | | |
| NET ASSETS | | | | | | | | |
| Beginning of year | | | 241,295,647 | | | | 329,049,871 | |
| End of year | | $ | 376,992,691 | | | $ | 241,295,647 | |
| | | | | | | | | |
| OTHER INFORMATION | | | | | | | | |
| Shares Transactions | | | | | | | | |
| Investor Class | | | | | | | | |
| Issued | | | 274,610 | | | | 602,908 | |
| Issued to shareholders in reinvestment of distributions | | | 212,776 | | | | 72,733 | |
| Redeemed | | | (787,437 | ) | | | (1,579,288 | ) |
| Net decrease in share transactions | | | (300,051 | ) | | | (903,647 | ) |
| | | | | | | | | |
| Institutional Class | | | | | | | | |
| Issued | | | 1,595,452 | | | | 2,095,909 | |
| Issued to shareholders in reinvestment of distributions | | | 864,016 | | | | 391,058 | |
| Redeemed | | | (2,989,136 | ) | | | (6,457,674 | ) |
| Net decrease in share transactions | | | (529,668 | ) | | | (3,970,707 | ) |
See Notes to Financial Statements.
| 80 | 1.855.377.7325 | www.GrandeurPeakGlobal.com |
| | Statements of |
| Grandeur Peak Global Stalwarts Fund | Changes in Net Assets |
| | | For the
Year Ended
April 30, 2021 | | | For the
Year Ended
April 30, 2020 | |
| OPERATIONS | | | | | | |
| Net investment income/(loss) | | $ | (111,391 | ) | | $ | 97,454 | |
| Net realized gain/(loss) | | | 36,550,876 | | | | (253,222 | ) |
| Net change in unrealized appreciation/(depreciation) | | | 103,499,300 | | | | (1,536,586 | ) |
| Net increase/(decrease) in net assets resulting from operations | | | 139,938,785 | | | | (1,692,354 | ) |
| | | | | | | | | |
| DISTRIBUTIONS TO SHAREHOLDERS (NOTE 3) | | | | | | | | |
| Investor Class | | | (2,718,511 | ) | | | (1,469,313 | ) |
| Institutional Class | | | (6,931,888 | ) | | | (1,886,642 | ) |
| Net decrease in net assets from distributions | | | (9,650,399 | ) | | | (3,355,955 | ) |
| | | | | | | | | |
| CAPITAL SHARE TRANSACTIONS (NOTE 5) | | | | | | | | |
| Investor Class | | | | | | | | |
| Proceeds from sales of shares | | | 27,358,183 | | | | 18,760,212 | |
| Distributions reinvested | | | 2,592,184 | | | | 1,431,115 | |
| Cost of shares redeemed | | | (57,966,121 | ) | | | (22,089,480 | ) |
| Redemption fees | | | 6,566 | | | | 5,329 | |
| Net decrease from capital shares transactions | | | (28,009,188 | ) | | | (1,892,824 | ) |
| | | | | | | | | |
| Institutional Class | | | | | | | | |
| Proceeds from sales of shares | | | 94,505,187 | | | | 38,109,836 | |
| Distributions reinvested | | | 6,307,636 | | | | 1,647,207 | |
| Cost of shares redeemed | | | (40,407,995 | ) | | | (27,260,248 | ) |
| Redemption fees | | | 6,702 | | | | 20,718 | |
| Net increase from capital shares transactions | | | 60,411,530 | | | | 12,517,513 | |
| | | | | | | | | |
| Net increase in net assets | | | 162,690,728 | | | | 5,576,380 | |
| | | | | | | | | |
| NET ASSETS | | | | | | | | |
| Beginning of year | | | 204,910,467 | | | | 199,334,087 | |
| End of year | | $ | 367,601,195 | | | $ | 204,910,467 | |
| | | | | | | | | |
| OTHER INFORMATION | | | | | | | | |
| Shares Transactions | | | | | | | | |
| Investor Class | | | | | | | | |
| Issued | | | 1,379,187 | | | | 1,356,611 | |
| Issued to shareholders in reinvestment of distributions | | | 122,043 | | | | 90,922 | |
| Redeemed | | | (3,017,181 | ) | | | (1,559,169 | ) |
| Net decrease in share transactions | | | (1,515,951 | ) | | | (111,636 | ) |
| | | | | | | | | |
| Institutional Class | | | | | | | | |
| Issued | | | 4,690,459 | | | | 2,855,814 | |
| Issued to shareholders in reinvestment of distributions | | | 294,199 | | | | 103,990 | |
| Redeemed | | | (2,087,109 | ) | | | (1,932,732 | ) |
| Net increase in share transactions | | | 2,897,549 | | | | 1,027,072 | |
| See Notes to Financial Statements. | |
| Annual Report | April 30, 2021 | 81 |
| | Statements of |
| Grandeur Peak International Opportunities Fund | Changes in Net Assets |
| | | For the
Year Ended
April 30, 2021 | | | For the
Year Ended
April 30, 2020 | |
| OPERATIONS | | | | | | |
| Net investment income/(loss) | | $ | (321,291 | ) | | $ | 1,396,777 | |
| Net realized gain | | | 103,268,609 | | | | 18,565,541 | |
| Net change in unrealized appreciation/(depreciation) | | | 297,660,032 | | | | (59,862,701 | ) |
| Net increase/(decrease) in net assets resulting from operations | | | 400,607,350 | | | | (39,900,383 | ) |
| | | | | | | | | |
| DISTRIBUTIONS TO SHAREHOLDERS (NOTE 3) | | | | | | | | |
| Investor Class | | | (1,935,548 | ) | | | (1,839,214 | ) |
| Institutional Class | | | (27,434,147 | ) | | | (22,483,478 | ) |
| Net decrease in net assets from distributions | | | (29,369,695 | ) | | | (24,322,692 | ) |
| | | | | | | | | |
| CAPITAL SHARE TRANSACTIONS (NOTE 5) | | | | | | | | |
| Investor Class | | | | | | | | |
| Proceeds from sales of shares | | | 12,647,959 | | | | 4,655,083 | |
| Distributions reinvested | | | 1,833,688 | | | | 1,750,795 | |
| Cost of shares redeemed | | | (14,427,792 | ) | | | (17,993,458 | ) |
| Redemption fees | | | 3,332 | | | | 2,029 | |
| Net increase/(decrease) from capital shares transactions | | | 57,187 | | | | (11,585,551 | ) |
| | | | | | | | | |
| Institutional Class | | | | | | | | |
| Proceeds from sales of shares | | | 159,401,438 | | | | 66,126,881 | |
| Distributions reinvested | | | 25,008,654 | | | | 20,460,565 | |
| Cost of shares redeemed | | | (97,776,649 | ) | | | (206,920,088 | ) |
| Redemption fees | | | 740 | | | | 1,152 | |
| Net increase/(decrease) from capital shares transactions | | | 86,634,183 | | | | (120,331,490 | ) |
| | | | | | | | | |
| Net increase/(decrease) in net assets | | | 457,929,025 | | | | (196,140,116 | ) |
| | | | | | | | | |
| NET ASSETS | | | | | | | | |
| Beginning of year | | | 515,171,519 | | | | 711,311,635 | |
| End of year | | $ | 973,100,544 | | | $ | 515,171,519 | |
| | | | | | | | | |
| OTHER INFORMATION | | | | | | | | |
| Shares Transactions | | | | | | | | |
| Investor Class | | | | | | | | |
| Issued | | | 2,822,461 | | | | 1,502,144 | |
| Issued to shareholders in reinvestment of distributions | | | 395,191 | | | | 495,976 | |
| Redeemed | | | (3,455,829 | ) | | | (5,810,441 | ) |
| Net decrease in share transactions | | | (238,177 | ) | | | (3,812,321 | ) |
| | | | | | | | | |
| Institutional Class | | | | | | | | |
| Issued | | | 36,023,156 | | | | 21,300,368 | |
| Issued to shareholders in reinvestment of distributions | | | 5,355,172 | | | | 5,763,539 | |
| Redeemed | | | (22,601,463 | ) | | | (67,024,606 | ) |
| Net increase/(decrease) in share transactions | | | 18,776,865 | | | | (39,960,699 | ) |
| See Notes to Financial Statements. | |
| 82 | 1.855.377.7325 | www.GrandeurPeakGlobal.com |
| | Statements of |
| Grandeur Peak International Stalwarts Fund | Changes in Net Assets |
| | | For the
Year Ended
April 30, 2021 | | | For the
Year Ended
April 30, 2020 | |
| OPERATIONS | | | | | | |
| Net investment income | | $ | 4,320,430 | | | $ | 2,199,658 | |
| Net realized gain/(loss) | | | 78,044,169 | | | | (9,198,168 | ) |
| Net change in unrealized appreciation/(depreciation) | | | 628,501,005 | | | | (14,970,807 | ) |
| Net increase/(decrease) in net assets resulting from operations | | | 710,865,604 | | | | (21,969,317 | ) |
| | | | | | | | | |
| DISTRIBUTIONS TO SHAREHOLDERS (NOTE 3) | | | | | | | | |
| Investor Class | | | (134,760 | ) | | | (122,186 | ) |
| Institutional Class | | | (5,483,373 | ) | | | (1,992,693 | ) |
| Net decrease in net assets from distributions | | | (5,618,133 | ) | | | (2,114,879 | ) |
| | | | | | | | | |
| CAPITAL SHARE TRANSACTIONS (NOTE 5) | | | | | | | | |
| Investor Class | | | | | | | | |
| Proceeds from sales of shares | | | 25,400,324 | | | | 39,311,307 | |
| Distributions reinvested | | | 132,026 | | | | 60,668 | |
| Cost of shares redeemed | | | (84,393,412 | ) | | | (27,261,155 | ) |
| Redemption fees | | | 3,667 | | | | 6,267 | |
| Net increase/(decrease) from capital shares transactions | | | (58,857,395 | ) | | | 12,117,087 | |
| | | | | | | | | |
| Institutional Class | | | | | | | | |
| Proceeds from sales of shares | | | 682,871,722 | | | | 470,808,042 | |
| Distributions reinvested | | | 5,168,335 | | | | 1,834,446 | |
| Cost of shares redeemed | | | (253,915,683 | ) | | | (140,807,902 | ) |
| Redemption fees | | | 10,688 | | | | 34,124 | |
| Net increase from capital shares transactions | | | 434,135,062 | | | | 331,868,710 | |
| | | | | | | | | |
| Net increase in net assets | | | 1,080,525,138 | | | | 319,901,601 | |
| | | | | | | | | |
| NET ASSETS | | | | | | | | |
| Beginning of year | | | 953,205,694 | | | | 633,304,093 | |
| End of year | | $ | 2,033,730,832 | | | $ | 953,205,694 | |
| | | | | | | | | |
| OTHER INFORMATION | | | | | | | | |
| Shares Transactions | | | | | | | | |
| Investor Class | | | | | | | | |
| Issued | | | 1,403,607 | | | | 2,693,314 | |
| Issued to shareholders in reinvestment of distributions | | | 6,001 | | | | 3,778 | |
| Redeemed | | | (4,309,298 | ) | | | (1,896,118 | ) |
| Net increase/(decrease) in share transactions | | | (2,899,690 | ) | | | 800,974 | |
| | | | | | | | | |
| Institutional Class | | | | | | | | |
| Issued | | | 33,619,349 | | | | 31,956,402 | |
| Issued to shareholders in reinvestment of distributions | | | 233,756 | | | | 113,799 | |
| Redeemed | | | (12,798,649 | ) | | | (9,910,143 | ) |
| Net increase in share transactions | | | 21,054,456 | | | | 22,160,058 | |
| See Notes to Financial Statements. | |
| Annual Report | April 30, 2021 | 83 |
| | Statements of |
| Grandeur Peak US Stalwarts Fund | Changes in Net Assets |
| | | For the
Year Ended
April 30, 2021 | | | For the Period
March 20, 2020
(Commencement of
Operations) to
April 30, 2020 | |
| OPERATIONS | | | | | | |
| Net investment loss | | $ | (140,023 | ) | | $ | (3,383 | ) |
| Net realized gain | | | 2,016,352 | | | | 9,572 | |
| Net change in unrealized appreciation | | | 18,985,161 | | | | 1,481,238 | |
| Net increase in net assets resulting from operations | | | 20,861,490 | | | | 1,487,427 | |
| | | | | | | | | |
| DISTRIBUTIONS TO SHAREHOLDERS (NOTE 3) | | | | | | | | |
| Institutional Class | | | (267,844 | ) | | | – | |
| Net decrease in net assets from distributions | | | (267,844 | ) | | | – | |
| | | | | | | | | |
| CAPITAL SHARE TRANSACTIONS (NOTE 5) | | | | | | | | |
| Institutional Class | | | | | | | | |
| Proceeds from sales of shares | | | 100,478,541 | | | | 7,953,203 | |
| Distributions reinvested | | | 195,265 | | | | – | |
| Cost of shares redeemed | | | (4,590,003 | ) | | | (20,274 | ) |
| Redemption fees | | | 7,731 | | | | 405 | |
| Net increase from capital shares transactions | | | 96,091,534 | | | | 7,933,334 | |
| | | | | | | | | |
| Net increase in net assets | | | 116,685,180 | | | | 9,420,761 | |
| | | | | | | | | |
| NET ASSETS | | | | | | | | |
| Beginning of year | | | 9,420,761 | | | | – | |
| End of year | | $ | 126,105,941 | | | $ | 9,420,761 | |
| | | | | | | | | |
| OTHER INFORMATION | | | | | | | | |
| Shares Transactions | | | | | | | | |
| Institutional Class | | | | | | | | |
| Issued | | | 5,055,779 | | | | 718,380 | |
| Issued to shareholders in reinvestment of distributions | | | 9,700 | | | | – | |
| Redeemed | | | (228,376 | ) | | | (1,805 | ) |
| Net increase in share transactions | | | 4,837,103 | | | | 716,575 | |
| See Notes to Financial Statements. | |
| 84 | 1.855.377.7325 | www.GrandeurPeakGlobal.com |
| Grandeur Peak Emerging Markets Opportunities Fund | Financial Highlights |
| For a Share Outstanding Throughout the Years Presented |
| Investor Class | | Year Ended
April 30, 2021 | | | Year Ended
April 30, 2020 | | | Year Ended
April 30, 2019 | | | Year Ended
April 30, 2018 | | | Year Ended
April 30, 2017 | |
| NET ASSET VALUE, BEGINNING OF PERIOD | | $ | 11.07 | | | $ | 11.82 | | | $ | 13.05 | | | $ | 11.55 | | | $ | 9.82 | |
| | | | | | | | | | | | | | | | | | | | | |
| INCOME FROM INVESTMENT OPERATIONS | | | | | | | | | | | | | | | | | | | | |
| Net investment income/(loss)(a) | | | (0.08 | ) | | | 0.01 | | | | 0.01 | | | | 0.03 | | | | 0.02 | |
| Net realized and unrealized gain/(loss) on investments | | | 6.71 | | | | (0.75 | ) | | | (1.13 | ) | | | 1.47 | | | | 1.75 | |
| Total income/(loss) from investment operations | | | 6.63 | | | | (0.74 | ) | | | (1.12 | ) | | | 1.50 | | | | 1.77 | |
| | | | | | | | | | | | | | | | | | | | | |
| DISTRIBUTIONS | | | | | | | | | | | | | | | | | | | | |
| From net investment income | | | (0.00 | )(b) | | (0.01 | ) | | | (0.02 | ) | | | – | | | | (0.04 | ) |
| From net realized gain on investments | | | – | | | | – | | | | (0.09 | ) | | | – | | | | – | |
| Total distributions | | | 0.00 | | | | (0.01 | ) | | | (0.11 | ) | | | – | | | | (0.04 | ) |
| | | | | | | | | | | | | | | | | | | | | |
| REDEMPTION FEES ADDED TO PAID-IN CAPITAL | | | 0.00 | (b) | | | – | | | | 0.00 | (b) | | | – | | | | 0.00 | (b) |
| | | | | | | | | | | | | | | | | | | | | |
| INCREASE/DECREASE IN NET ASSET VALUE | | | 6.63 | | | | (0.75 | ) | | | (1.23 | ) | | | 1.50 | | | | 1.73 | |
| NET ASSET VALUE, END OF PERIOD | | $ | 17.70 | | | $ | 11.07 | | | $ | 11.82 | | | $ | 13.05 | | | $ | 11.55 | |
| | | | | | | | | | | | | | | | | | | | | |
| TOTAL RETURN | | | 59.92 | % | | | (6.29 | )% | | (8.48 | )% | | | 12.99 | % | | | 18.08 | % |
| | | | | | | | | | | | | | | | | | | | | |
| RATIOS AND SUPPLEMENTAL DATA | | | | | | | | | | | | | | | | | | | | |
| Net assets, end of period (in 000s) | | $ | 15,011 | | | $ | 10,056 | | | $ | 13,869 | | | $ | 18,668 | | | $ | 18,074 | |
| | | | | | | | | | | | | | | | | | | | | |
| RATIOS TO AVERAGE NET ASSETS | | | | | | | | | | | | | | | | | | | | |
| Expenses (excluding fees waived/reimbursed by investment advisor) | | | 1.75 | % | | | 1.76 | % | | | 1.77 | % | | | 1.79 | % | | | 1.76 | % |
| Expenses (including fees waived/reimbursed by investment advisor) | | | 1.68 | % | | | 1.74 | % | | | 1.76 | % | | | 1.78 | % | | | 1.76 | % |
| Net investment income/(loss) | | | (0.50 | )% | | 0.09 | % | | | 0.11 | % | | | 0.26 | % | | | 0.21 | % |
| | | | | | | | | | | | | | | | | | | | | |
| PORTFOLIO TURNOVER RATE | | | 35 | % | | | 24 | % | | | 34 | % | | | 33 | % | | | 42 | % |
| (a) | Per share numbers have been calculated using the average shares method. |
| (b) | Less than $0.005 or ($0.005) per share. |
| See Notes to Financial Statements. | |
| Annual Report | April 30, 2021 | 85 |
| Grandeur Peak Emerging Markets Opportunities Fund | Financial Highlights |
| For a Share Outstanding Throughout the Years Presented |
| Institutional Class | | Year Ended
April 30, 2021 | | | Year Ended
April 30, 2020 | | | Year Ended
April 30, 2019 | | | Year Ended
April 30, 2018 | | | Year Ended
April 30, 2017 | |
| NET ASSET VALUE, BEGINNING OF PERIOD | | $ | 11.14 | | | $ | 11.88 | | | $ | 13.12 | | | $ | 11.60 | | | $ | 9.85 | |
| | | | | | | | | | | | | | | | | | | | | |
| INCOME FROM INVESTMENT OPERATIONS | | | | | | | | | | | | | | | | | | | | |
| Net investment income/(loss)(a) | | | (0.04 | ) | | | 0.04 | | | | 0.03 | | | | 0.06 | | | | 0.04 | |
| Net realized and unrealized gain/(loss) on investments | | | 6.76 | | | | (0.75 | ) | | | (1.14 | ) | | | 1.48 | | | | 1.77 | |
| Total income/(loss) from investment operations | | | 6.72 | | | | (0.71 | ) | | | (1.11 | ) | | | 1.54 | | | | 1.81 | |
| | | | | | | | | | | | | | | | | | | | | |
| DISTRIBUTIONS | | | | | | | | | | | | | | | | | | | | |
| From net investment income | | | (0.01 | ) | | | (0.03 | ) | | | (0.04 | ) | | | (0.02 | ) | | | (0.06 | ) |
| From net realized gain on investments | | | (0.02 | ) | | | – | | | | (0.09 | ) | | | – | | | | – | |
| Total distributions | | | (0.03 | ) | | | (0.03 | ) | | | (0.13 | ) | | | (0.02 | ) | | | (0.06 | ) |
| | | | | | | | | | | | | | | | | | | | | |
| REDEMPTION FEES ADDED TO PAID-IN CAPITAL | | | 0.00 | (b) | | | 0.00 | (b) | | | 0.00 | (b) | | | 0.00 | (b) | | | 0.00 | (b) |
| | | | | | | | | | | | | | | | | | | | | |
| INCREASE/DECREASE IN NET ASSET VALUE | | | 6.69 | | | | (0.74 | ) | | | (1.24 | ) | | | 1.52 | | | | 1.75 | |
| NET ASSET VALUE, END OF PERIOD | | $ | 17.83 | | | $ | 11.14 | | | $ | 11.88 | | | $ | 13.12 | | | $ | 11.60 | |
| | | | | | | | | | | | | | | | | | | | | |
| TOTAL RETURN | | | 60.30 | % | | | (6.03 | )% | | (8.32 | )% | | 13.24 | % | | | 18.42 | % |
| | | | | | | | | | | | | | | | | | | | | |
| RATIOS AND SUPPLEMENTAL DATA | | | | | | | | | | | | | | | | | | | | |
| Net assets, end of period (in 000s) | | $ | 623,538 | | | $ | 389,373 | | | $ | 452,530 | | | $ | 471,260 | | | $ | 398,891 | |
| | | | | | | | | | | | | | | | | | | | | |
| RATIOS TO AVERAGE NET ASSETS | | | | | | | | | | | | | | | | | | | | |
| Expenses (excluding fees waived/reimbursed by investment advisor) | | | 1.52 | % | | | 1.53 | % | | | 1.53 | % | | | 1.55 | % | | | 1.55 | % |
| Expenses (including fees waived/reimbursed by investment advisor) | | | 1.45 | % | | | 1.51 | % | | | 1.52 | % | | | 1.54 | % | | | 1.55 | % |
| Net investment income/(loss) | | | (0.27 | )% | | 0.29 | % | | | 0.29 | % | | | 0.49 | % | | | 0.35 | % |
| | | | | | | | | | | | | | | | | | | | | |
| PORTFOLIO TURNOVER RATE | | | 35 | % | | | 24 | % | | | 34 | % | | | 33 | % | | | 42 | % |
| (a) | Per share numbers have been calculated using the average shares method. |
| (b) | Less than $0.005 or ($0.005) per share. |
| See Notes to Financial Statements. | |
| 86 | 1.855.377.7325 | www.GrandeurPeakGlobal.com |
| Grandeur Peak Global Contrarian Fund | Financial Highlights |
For a Share Outstanding Throughout the Year or Period Presented
| Institutional Class | | Year Ended
April 30, 2021 | | | For the Period
September 18, 2019
(Commencement of
Operations) to
April 30, 2020 | |
| NET ASSET VALUE, BEGINNING OF PERIOD | | $ | 8.78 | | | $ | 10.00 | |
| | | | | | | | | |
| INCOME FROM INVESTMENT OPERATIONS | | | | | | | | |
| Net investment income(a) | | | 0.25 | | | | 0.06 | |
| Net realized and unrealized gain/(loss) on investments | | | 6.61 | | | | (1.25 | ) |
| Total income/(loss) from investment operations | | | 6.86 | | | | (1.19 | ) |
| | | | | | | | | |
| DISTRIBUTIONS | | | | | | | | |
| From net investment income | | | (0.23 | ) | | | (0.01 | ) |
| From net realized gain on investments | | | – | | | | (0.02 | ) |
| Total distributions | | | (0.23 | ) | | | (0.03 | ) |
| | | | | | | | | |
| REDEMPTION FEES ADDED TO PAID-IN CAPITAL | | | 0.00 | (b) | | | 0.00 | (b) |
| | | | | | | | | |
| INCREASE/DECREASE IN NET ASSET VALUE | | | 6.63 | | | | (1.22 | ) |
| NET ASSET VALUE, END OF PERIOD | | $ | 15.41 | | | $ | 8.78 | |
| | | | | | | | | |
| TOTAL RETURN | | | 78.51 | % | | | (11.96 | )%(c) |
| | | | | | | | | |
| RATIOS AND SUPPLEMENTAL DATA | | | | | | | | |
| Net assets, end of period (in 000s) | | $ | 49,403 | | | $ | 8,861 | |
| | | | | | | | | |
| RATIOS TO AVERAGE NET ASSETS | | | | | | | | |
| Expenses (excluding fees waived/ reimbursed by investment advisor) | | | 1.87 | % | | | 4.69 | %(d)(e) |
| Expenses (including fees waived/ reimbursed by investment advisor) | | | 1.35 | % | | | 1.35 | %(d)(e) |
| Net investment income | | | 1.91 | % | | | 1.05 | %(d) |
| | | | | | | | | |
| PORTFOLIO TURNOVER RATE | | | 54 | % | | | 34 | %(c) |
| (a) | Per share numbers have been calculated using the average shares method. |
| (b) | Less than $0.005 or ($0.005) per share. |
| (e) | Expense ratios during startup periods may not be representative of longer term operating periods. |
| See Notes to Financial Statements. | |
| Annual Report | April 30, 2021 | 87 |
| Grandeur Peak Global Micro Cap Fund | Financial Highlights |
For a Share Outstanding Throughout the Years Presented
| Institutional Class | | Year Ended
April 30, 2021 | | | Year Ended
April 30, 2020 | | | Year Ended
April 30, 2019 | | | Year Ended
April 30, 2018 | | | Year Ended
April 30, 2017 | |
| NET ASSET VALUE, BEGINNING OF PERIOD | | $ | 11.05 | | | $ | 11.31 | | | $ | 13.12 | | | $ | 11.98 | | | $ | 10.38 | |
| | | | | | | | | | | | | | | | | | | | | |
| INCOME FROM INVESTMENT OPERATIONS | | | | | | | | | | | | | | | | | | | | |
| Net investment income/(loss)(a) | | | (0.10 | ) | | | 0.01 | | | | (0.01 | ) | | | (0.00 | )(b) | | 0.01 | |
| Net realized and unrealized gain/(loss) on investments | | | 11.17 | | | | (0.19 | ) | | | (1.08 | ) | | | 2.12 | | | | 1.72 | |
| Total income/(loss) from investment operations | | | 11.07 | | | | (0.18 | ) | | | (1.09 | ) | | | 2.12 | | | | 1.73 | |
| | | | | | | | | | | | | | | | | | | | | |
| DISTRIBUTIONS | | | | | | | | | | | | | | | | | | | | |
| From net investment income | | | (0.14 | ) | | | (0.03 | ) | | | – | | | | (0.06 | ) | | | (0.02 | ) |
| From net realized gain on investments | | | (1.33 | ) | | | (0.05 | ) | | | (0.72 | ) | | | (0.92 | ) | | | (0.11 | ) |
| Total distributions | | | (1.47 | ) | | | (0.08 | ) | | | (0.72 | ) | | | (0.98 | ) | | | (0.13 | ) |
| | | | | | | | | | | | | | | | | | | | | |
| REDEMPTION FEES ADDED TO PAID-IN CAPITAL | | | – | | | | 0.00 | (b) | | | 0.00 | (b) | | | 0.00 | (b) | | | 0.00 | (b) |
| | | | | | | | | | | | | | | | | | | | | |
| INCREASE/DECREASE IN NET ASSET VALUE | | | 9.60 | | | | (0.26 | ) | | | (1.81 | ) | | | 1.14 | | | | 1.60 | |
| NET ASSET VALUE, END OF PERIOD | | $ | 20.65 | | | $ | 11.05 | | | $ | 11.31 | | | $ | 13.12 | | | $ | 11.98 | |
| | | | | | | | | | | | | | | | | | | | | |
| TOTAL RETURN | | | 102.43 | % | | | (1.62 | )% | | | (7.67 | )% | | | 17.68 | % | | | 16.81 | % |
| | | | | | | | | | | | | | | | | | | | | |
| RATIOS AND SUPPLEMENTAL DATA | | | | | | | | | | | | | | | | | | | | |
| Net assets, end of period (in 000s) | | $ | 70,375 | | | $ | 29,634 | | | $ | 35,654 | | | $ | 41,709 | | | $ | 36,620 | |
| | | | | | | | | | | | | | | | | | | | | |
| RATIOS TO AVERAGE NET ASSETS | | | | | | | | | | | | | | | | | | | | |
| Expenses (excluding fees waived/ reimbursed by investment advisor) | | | 2.02 | % | | | 2.06 | % | | | 2.05 | % | | | 2.06 | % | | | 2.17 | % |
| Expenses (including fees waived/ reimbursed by investment advisor) | | | 2.00 | % | | | 2.00 | % | | | 2.00 | % | | | 2.00 | % | | | 2.00 | % |
| Net investment income/(loss) | | | (0.62 | )% | | 0.09 | % | | | (0.06 | )% | | 0.00 | %(c) | | 0.11 | % |
| | | | | | | | | | | | | | | | | | | | | |
| PORTFOLIO TURNOVER RATE | | | 36 | % | | | 33 | % | | | 37 | % | | | 46 | % | | | 37 | % |
| (a) | Per share numbers have been calculated using the average shares method. |
| (b) | Less than $0.005 or ($0.005) per share. |
| (c) | Less than 0.005% of average net assets. |
| See Notes to Financial Statements. | |
| 88 | 1.855.377.7325 | www.GrandeurPeakGlobal.com |
| Grandeur Peak Global Opportunities Fund | Financial Highlights |
For a Share Outstanding Throughout the Years Presented
| Investor Class | | Year Ended
April 30, 2021 | | | Year Ended
April 30, 2020 | | | Year Ended
April 30, 2019 | | | Year Ended
April 30, 2018 | | | Year Ended
April 30, 2017 | |
| NET ASSET VALUE, BEGINNING OF PERIOD | | $ | 3.24 | | | $ | 3.48 | | | $ | 3.95 | | | $ | 3.52 | | | $ | 3.01 | |
| | | | | | | | | | | | | | | | | | | | | |
| INCOME FROM INVESTMENT OPERATIONS | | | | | | | | | | | | | | | | | | | | |
| Net investment income/(loss)(a) | | | (0.02 | ) | | | (0.01 | )(b) | | (0.00 | )(c) | | 0.00 | (c) | | (0.00 | )(b)(c) |
| Net realized and unrealized gain/(loss) on investments | | | 2.66 | | | | (0.03 | ) | | | (0.14 | ) | | | 0.65 | | | | 0.51 | |
| Total income/(loss) from investment operations | | | 2.64 | | | | (0.04 | ) | | | (0.14 | ) | | | 0.65 | | | | 0.51 | |
| | | | | | | | | | | | | | | | | | | | | |
| DISTRIBUTIONS | | | | | | | | | | | | | | | | | | | | |
| From net investment income | | | (0.00 | )(c) | | – | | | | (0.00 | )(c) | | – | | | | – | |
| From net realized gain on investments | | | (0.37 | ) | | | (0.20 | ) | | | (0.33 | ) | | | (0.22 | ) | | | (0.00 | )(c) |
| Total distributions | | | (0.37 | ) | | | (0.20 | ) | | | (0.33 | ) | | | (0.22 | ) | | | (0.00 | )(c) |
| | | | | | | | | | | | | | | | | | | | | |
| REDEMPTION FEES ADDED TO PAID-IN CAPITAL | | | 0.00 | (c) | | 0.00 | (c) | | 0.00 | (c) | | | 0.00 | (c) | | 0.00 | (c) |
| | | | | | | | | | | | | | | | | | | | | |
| INCREASE/DECREASE IN NET ASSET VALUE | | | 2.27 | | | | (0.24 | ) | | | (0.47 | ) | | | 0.43 | | | | 0.51 | |
| NET ASSET VALUE, END OF PERIOD | | $ | 5.51 | | | $ | 3.24 | | | $ | 3.48 | | | $ | 3.95 | | | $ | 3.52 | |
| | | | | | | | | | | | | | | | | | | | | |
| TOTAL RETURN | | | 82.94 | % | | | (1.73 | )% | | (1.83 | )% | | 18.41 | % | | | 17.09 | % |
| | | | | | | | | | | | | | | | | | | | | |
| RATIOS AND SUPPLEMENTAL DATA | | | | | | | | | | | | | | | | | | | | |
| Net assets, end of period (in 000s) | | $ | 131,739 | | | $ | 92,843 | | | $ | 130,745 | | | $ | 188,379 | | | $ | 166,284 | |
| | | | | | | | | | | | | | | | | | | | | |
| RATIOS TO AVERAGE NET ASSETS | | | | | | | | | | | | | | | | | | | | |
| Expenses (excluding fees waived/ reimbursed by investment advisor) | | | 1.60 | % | | | 1.61 | % | | | 1.61 | % | | | 1.61 | % | | | 1.61 | % |
| Expenses (including fees waived/ reimbursed by investment advisor) | | | 1.51 | % | | | 1.57 | % | | | 1.57 | % | | | 1.55 | % | | | 1.59 | % |
| Net investment income/(loss) | | | (0.34 | )% | | (0.17 | )% | | (0.12 | )% | | 0.03 | % | | | (0.06 | )% |
| | | | | | | | | | | | | | | | | | | | | |
| PORTFOLIO TURNOVER RATE | | | 47 | % | | | 41 | % | | | 38 | % | | | 29 | % | | | 30 | % |
| (a) | Per share numbers have been calculated using the average shares method. |
| (b) | The per share amount does not correspond to activity reflected in the Statement of Operations due to class specific expenses during the period. |
| (c) | Less than $0.005 or ($0.005) per share. |
| See Notes to Financial Statements. | |
| Annual Report | April 30, 2021 | 89 |
| Grandeur Peak Global Opportunities Fund | Financial Highlights |
| For a Share Outstanding Throughout the Years Presented |
| Institutional Class | | Year Ended
April 30, 2021 | | | Year Ended
April 30, 2020 | | | Year Ended
April 30, 2019 | | | Year Ended
April 30, 2018 | | | Year Ended
April 30, 2017 | |
| NET ASSET VALUE, BEGINNING OF PERIOD | | $ | 3.29 | | | $ | 3.52 | | | $ | 4.00 | | | $ | 3.56 | | | $ | 3.03 | |
| | | | | | | | | | | | | | | | | | | | | |
| INCOME FROM INVESTMENT OPERATIONS | | | | | | | | | | | | | | | | | | | | |
| Net investment income/(loss)(a) | | | (0.00 | )(b) | | 0.00 | (b) | | | 0.00 | (b) | | | 0.01 | | | | 0.01 | |
| Net realized and unrealized gain/(loss) on investments | | | 2.70 | | | | (0.03 | ) | | | (0.14 | ) | | | 0.65 | | | | 0.52 | |
| Total income/(loss) from investment operations | | | 2.70 | | | | (0.03 | ) | | | (0.14 | ) | | | 0.66 | | | | 0.53 | |
| | | | | | | | | | | | | | | | | | | | | |
| DISTRIBUTIONS | | | | | | | | | | | | | | | | | | | | |
| From net investment income | | | (0.01 | ) | | | – | | | | (0.01 | ) | | | (0.00 | )(b) | | (0.00 | )(b) |
| From net realized gain on investments | | | (0.37 | ) | | | (0.20 | ) | | | (0.33 | ) | | | (0.22 | ) | | | (0.00 | )(b) |
| Total distributions | | | (0.38 | ) | | | (0.20 | ) | | | (0.34 | ) | | | (0.22 | ) | | | (0.01 | ) |
| | | | | | | | | | | | | | | | | | | | | |
| REDEMPTION FEES ADDED TO PAID-IN CAPITAL | | | 0.00 | (b) | | | 0.00 | (b) | | | 0.00 | (b) | | | 0.00 | (b) | | | 0.00 | (b) |
| | | | | | | | | | | | | | | | | | | | | |
| INCREASE/DECREASE IN NET ASSET VALUE | | | 2.32 | | | | (0.23 | ) | | | (0.48 | ) | | | 0.44 | | | | 0.53 | |
| NET ASSET VALUE, END OF PERIOD | | $ | 5.61 | | | $ | 3.29 | | | $ | 3.52 | | | $ | 4.00 | | | $ | 3.56 | |
| | | | | | | | | | | | | | | | | | | | | |
| TOTAL RETURN | | | 83.44 | % | | | (1.42 | )% | | (1.84 | )% | | 18.62 | % | | | 17.81 | % |
| | | | | | | | | | | | | | | | | | | | | |
| RATIOS AND SUPPLEMENTAL DATA | | | | | | | | | | | | | | | | | | | | |
| Net assets, end of period (in 000s) | | $ | 889,823 | | | $ | 470,142 | | | $ | 523,862 | | | $ | 591,470 | | | $ | 532,946 | |
| | | | | | | | | | | | | | | | | | | | | |
| RATIOS TO AVERAGE NET ASSETS | | | | | | | | | | | | | | | | | | | | |
| Expenses (excluding fees waived/ reimbursed by investment advisor) | | | 1.35 | % | | | 1.37 | % | | | 1.37 | % | | | 1.36 | % | | | 1.37 | % |
| Expenses (including fees waived/ reimbursed by investment advisor) | | | 1.27 | % | | | 1.33 | % | | | 1.33 | % | | | 1.31 | % | | | 1.35 | % |
| Net investment income/(loss) | | | (0.08 | )% | | 0.05 | % | | | 0.13 | % | | | 0.28 | % | | | 0.18 | % |
| | | | | | | | | | | | | | | | | | | | | |
| PORTFOLIO TURNOVER RATE | | | 47 | % | | | 41 | % | | | 38 | % | | | 29 | % | | | 30 | % |
| (a) | Per share numbers have been calculated using the average shares method. |
| (b) | Less than $0.005 or ($0.005) per share. |
| See Notes to Financial Statements. | |
| 90 | 1.855.377.7325 | www.GrandeurPeakGlobal.com |
| Grandeur Peak Global Reach Fund | Financial Highlights |
For a Share Outstanding Throughout the Years Presented
| Investor Class | | Year Ended
April 30, 2021 | | | Year Ended
April 30, 2020 | | | Year Ended
April 30, 2019 | | | Year Ended
April 30, 2018 | | | Year Ended
April 30, 2017 | |
| NET ASSET VALUE, BEGINNING OF PERIOD | | $ | 14.12 | | | $ | 14.98 | | | $ | 16.97 | | | $ | 14.52 | | | $ | 12.31 | |
| | | | | | | | | | | | | | | | | | | | | |
| INCOME FROM INVESTMENT OPERATIONS | | | | | | | | | | | | | | | | | | | | |
| Net investment income/(loss)(a) | | | (0.07 | ) | | | (0.01 | )(b) | | | 0.01 | | | | 0.01 | | | | 0.01 | |
| Net realized and unrealized gain/(loss) on investments | | | 10.79 | | | | (0.44 | ) | | | (0.58 | ) | | | 2.66 | | | | 2.22 | |
| Total income/(loss) from investment operations | | | 10.72 | | | | (0.45 | ) | | | (0.57 | ) | | | 2.67 | | | | 2.23 | |
| | | | | | | | | | | | | | | | | | | | | |
| DISTRIBUTIONS | | | | | | | | | | | | | | | | | | | | |
| From net investment income | | | (0.01 | ) | | | – | | | | (0.00 | )(c) | | | – | | | | (0.02 | ) |
| From net realized gain on investments | | | (1.67 | ) | | | (0.41 | ) | | | (1.42 | ) | | | (0.22 | ) | | | – | |
| Total distributions | | | (1.68 | ) | | | (0.41 | ) | | | (1.42 | ) | | | (0.22 | ) | | | (0.02 | ) |
| | | | | | | | | | | | | | | | | | | | | |
| REDEMPTION FEES ADDED TO PAID-IN CAPITAL | | | 0.00 | (c) | | | 0.00 | (c) | | | 0.00 | (c) | | | 0.00 | (c) | | | 0.00 | (c) |
| | | | | | | | | | | | | | | | | | | | | |
| INCREASE/DECREASE IN NET ASSET VALUE | | | 9.04 | | | | (0.86 | ) | | | (1.99 | ) | | | 2.45 | | | | 2.21 | |
| NET ASSET VALUE, END OF PERIOD | | $ | 23.16 | | | $ | 14.12 | | | $ | 14.98 | | | $ | 16.97 | | | $ | 14.52 | |
| | | | | | | | | | | | | | | | | | | | | |
| TOTAL RETURN | | | 77.38 | % | | | (3.31 | )% | | | (1.61 | )% | | | 18.44 | % | | | 18.11 | % |
| | | | | | | | | | | | | | | | | | | | | |
| RATIOS AND SUPPLEMENTAL DATA | | | | | | | | | | | | | | | | | | | | |
| Net assets, end of period (in 000s) | | $ | 59,164 | | | $ | 40,307 | | | $ | 56,307 | | | $ | 65,923 | | | $ | 67,574 | |
| | | | | | | | | | | | | | | | | | | | | |
| RATIOS TO AVERAGE NET ASSETS | | | | | | | | | | | | | | | | | | | | |
| Expenses (excluding fees waived/reimbursed by investment advisor) | | | 1.52 | % | | | 1.52 | % | | | 1.52 | % | | | 1.52 | % | | | 1.52 | % |
| Expenses (including fees waived/reimbursed by investment advisor) | | | 1.52 | % | | | 1.52 | % | | | 1.52 | % | | | 1.52 | % | | | 1.52 | % |
| Net investment income/(loss) | | | (0.38 | )% | | | (0.04 | )% | | | 0.05 | % | | | 0.06 | % | | | 0.07 | % |
| | | | | | | | | | | | | | | | | | | | | |
| PORTFOLIO TURNOVER RATE | | | 41 | % | | | 32 | % | | | 50 | % | | | 43 | % | | | 42 | % |
| (a) | Per share numbers have been calculated using the average shares method. |
| (b) | The per share amount does not correspond to activity reflected in the Statement of Operations due to class specific expenses during the period. |
| (c) | Less than $0.005 or ($0.005) per share. |
| See Notes to Financial Statements. | |
| Annual Report | April 30, 2021 | 91 |
| Grandeur Peak Global Reach Fund | Financial Highlights |
For a Share Outstanding Throughout the Years Presented
| Institutional Class | | Year Ended
April 30, 2021 | | | Year Ended
April 30, 2020 | | | Year Ended
April 30, 2019 | | | Year Ended
April 30, 2018 | | | Year Ended
April 30, 2017 | |
| NET ASSET VALUE, BEGINNING OF PERIOD | | $ | 14.19 | | | $ | 15.04 | | | $ | 17.02 | | | $ | 14.55 | | | $ | 12.33 | |
| | | | | | | | | | | | | | | | | | | | | |
| INCOME FROM INVESTMENT OPERATIONS | | | | | | | | | | | | | | | | | | | | |
| Net investment income/(loss)(a) | | | (0.03 | ) | | | 0.03 | | | | 0.05 | | | | 0.04 | | | | 0.04 | |
| Net realized and unrealized gain/(loss) on investments | | | 10.86 | | | | (0.45 | ) | | | (0.58 | ) | | | 2.67 | | | | 2.22 | |
| Total income/(loss) from investment operations | | | 10.83 | | | | (0.42 | ) | | | (0.53 | ) | | | 2.71 | | | | 2.26 | |
| | | | | | | | | | | | | | | | | | | | | |
| DISTRIBUTIONS | | | | | | | | | | | | | | | | | | | | |
| From net investment income | | | (0.04 | ) | | | (0.02 | ) | | | (0.03 | ) | | | (0.02 | ) | | | (0.04 | ) |
| From net realized gain on investments | | | (1.67 | ) | | | (0.41 | ) | | | (1.42 | ) | | | (0.22 | ) | | | – | |
| Total distributions | | | (1.71 | ) | | | (0.43 | ) | | | (1.45 | ) | | | (0.24 | ) | | | (0.04 | ) |
| | | | | | | | | | | | | | | | | | | | | |
| REDEMPTION FEES ADDED TO PAID-IN CAPITAL | | | 0.00 | (b) | | | 0.00 | (b) | | | 0.00 | (b) | | | 0.00 | (b) | | | 0.00 | (b) |
| | | | | | | | | | | | | | | | | | | | | |
| INCREASE/DECREASE IN NET ASSET VALUE | | | 9.12 | | | | (0.85 | ) | | | (1.98 | ) | | | 2.47 | | | | 2.22 | |
| NET ASSET VALUE, END OF PERIOD | | $ | 23.31 | | | $ | 14.19 | | | $ | 15.04 | | | $ | 17.02 | | | $ | 14.55 | |
| | | | | | | | | | | | | | | | | | | | | |
| TOTAL RETURN | | | 77.81 | % | | | (3.09 | )% | | | (1.33 | )% | | | 18.69 | % | | | 18.36 | % |
| | | | | | | | | | | | | | | | | | | | | |
| RATIOS AND SUPPLEMENTAL DATA | | | | | | | | | | | | | | | | | | | | |
| Net assets, end of period (in 000s) | | $ | 317,828 | | | $ | 200,988 | | | $ | 272,743 | | | $ | 302,269 | | | $ | 258,683 | |
| | | | | | | | | | | | | | | | | | | | | |
| RATIOS TO AVERAGE NET ASSETS | | | | | | | | | | | | | | | | | | | | |
| Expenses (excluding fees waived/reimbursed by investment advisor) | | | 1.27 | % | | | 1.27 | % | | | 1.27 | % | | | 1.28 | % | | | 1.29 | % |
| Expenses (including fees waived/reimbursed by investment advisor) | | | 1.27 | % | | | 1.27 | % | | | 1.27 | % | | | 1.28 | % | | | 1.29 | % |
| Net investment income/(loss) | | | (0.14 | )% | | | 0.21 | % | | | 0.29 | % | | | 0.27 | % | | | 0.28 | % |
| | | | | | | | | | | | | | | | | | | | | |
| PORTFOLIO TURNOVER RATE | | | 41 | % | | | 32 | % | | | 50 | % | | | 43 | % | | | 42 | % |
| (a) | Per share numbers have been calculated using the average shares method. |
| (b) | Less than $0.005 or ($0.005) per share. |
| See Notes to Financial Statements. | |
| 92 | 1.855.377.7325 | www.GrandeurPeakGlobal.com |
| Grandeur Peak Global Stalwarts Fund | Financial Highlights |
For a Share Outstanding Throughout the Years Presented
| Investor Class | | Year Ended
April 30, 2021 | | | Year Ended
April 30, 2020 | | | Year Ended
April 30, 2019 | | | Year Ended
April 30, 2018 | | | Year Ended
April 30, 2017 | |
| NET ASSET VALUE, BEGINNING OF PERIOD | | $ | 14.26 | | | $ | 14.83 | | | $ | 15.06 | | | $ | 12.76 | | | $ | 10.85 | |
| | | | | | | | | | | | | | | | | | | | | |
| INCOME FROM INVESTMENT OPERATIONS | | | | | | | | | | | | | | | | | | | | |
| Net investment income/(loss)(a) | | | (0.04 | ) | | | (0.01 | )(b) | | | 0.01 | | | | (0.00 | )(c) | | | (0.03 | ) |
| Net realized and unrealized gain/(loss) on investments | | | 9.72 | | | | (0.31 | ) | | | 0.16 | | | | 2.52 | | | | 1.95 | |
| Total income/(loss) from investment operations | | | 9.68 | | | | (0.32 | ) | | | 0.17 | | | | 2.52 | | | | 1.92 | |
| | | | | | | | | | | | | | | | | | | | | |
| DISTRIBUTIONS | | | | | | | | | | | | | | | | | | | | |
| From net investment income | | | – | | | | (0.00 | )(c) | | | – | | | | – | | | | (0.01 | ) |
| From net realized gain on investments | | | (0.68 | ) | | | (0.25 | ) | | | (0.40 | ) | | | (0.22 | ) | | | – | |
| Total distributions | | | (0.68 | ) | | | (0.25 | ) | | | (0.40 | ) | | | (0.22 | ) | | | (0.01 | ) |
| | | | | | | | | | | | | | | | | | | | | |
| REDEMPTION FEES ADDED TO PAID-IN CAPITAL | | | 0.00 | (c) | | | 0.00 | (c) | | | 0.00 | (c) | | | 0.00 | (c) | | | 0.00 | (c) |
| | | | | | | | | | | | | | | | | | | | | |
| INCREASE/DECREASE IN NET ASSET VALUE | | | 9.00 | | | | (0.57 | ) | | | (0.23 | ) | | | 2.30 | | | | 1.91 | |
| NET ASSET VALUE, END OF PERIOD | | $ | 23.26 | | | $ | 14.26 | | | $ | 14.83 | | | $ | 15.06 | | | $ | 12.76 | |
| | | | | | | | | | | | | | | | | | | | | |
| TOTAL RETURN | | | 68.36 | % | | | (2.22 | )% | | | 1.78 | % | | | 19.79 | % | | | 17.70 | % |
| | | | | | | | | | | | | | | | | | | | | |
| RATIOS AND SUPPLEMENTAL DATA | | | | | | | | | | | | | | | | | | | | |
| Net assets, end of period (in 000s) | | $ | 103,891 | | | $ | 85,310 | | | $ | 90,400 | | | $ | 92,552 | | | $ | 61,212 | |
| | | | | | | | | | | | | | | | | | | | | |
| RATIOS TO AVERAGE NET ASSETS | | | | | | | | | | | | | | | | | | | | |
| Expenses (excluding fees waived/ reimbursed by investment advisor) | | | 1.21 | % | | | 1.24 | % | | | 1.27 | % | | | 1.35 | % | | | 1.41 | % |
| Expenses (including fees waived/ reimbursed by investment advisor) | | | 1.21 | % | | | 1.24 | % | | | 1.27 | % | | | 1.35 | % | | | 1.35 | % |
| Net investment income/(loss) | | | (0.23 | )% | | | (0.10 | )% | | | 0.05 | % | | | (0.03 | )% | | | (0.23 | )% |
| | | | | | | | | | | | | | | | | | | | | |
| PORTFOLIO TURNOVER RATE | | | 50 | % | | | 50 | % | | | 52 | % | | | 30 | % | | | 32 | % |
| (a) | Per share numbers have been calculated using the average shares method. |
| (b) | The per share amount does not correspond to activity reflected in the Statement of Operations due to class specific expenses during the period. |
| (c) | Less than $0.005 or ($0.005) per share. |
| See Notes to Financial Statements. | |
| Annual Report | April 30, 2021 | 93 |
| Grandeur Peak Global Stalwarts Fund | Financial Highlights |
For a Share Outstanding Throughout the Years Presented
| Institutional Class | | Year Ended
April 30, 2021 | | | Year Ended
April 30, 2020 | | | Year Ended
April 30, 2019 | | | Year Ended
April 30, 2018 | | | Year Ended
April 30, 2017 | |
| NET ASSET VALUE, BEGINNING OF PERIOD | | $ | 14.37 | | | $ | 14.93 | | | $ | 15.14 | | | $ | 12.79 | | | $ | 10.87 | |
| | | | | | | | | | | | | | | | | | | | | |
| INCOME FROM INVESTMENT OPERATIONS | | | | | | | | | | | | | | | | | | | | |
| Net investment income(a) | | | 0.01 | | | | 0.03 | | | | 0.04 | | | | 0.03 | | | | 0.01 | (b) |
| Net realized and unrealized gain/(loss) on investments | | | 9.80 | | | | (0.31 | ) | | | 0.17 | | | | 2.54 | | | | 1.93 | |
| Total income/(loss) from investment operations | | | 9.81 | | | | (0.28 | ) | | | 0.21 | | | | 2.57 | | | | 1.94 | |
| | | | | | | | | | | | | | | | | | | | | |
| DISTRIBUTIONS | | | | | | | | | | | | | | | | | | | | |
| From net investment income | | | – | | | | (0.03 | ) | | | (0.02 | ) | | | – | | | | (0.02 | ) |
| From net realized gain on investments | | | (0.68 | ) | | | (0.25 | ) | | | (0.40 | ) | | | (0.22 | ) | | | – | |
| Total distributions | | | (0.68 | ) | | | (0.28 | ) | | | (0.42 | ) | | | (0.22 | ) | | | (0.02 | ) |
| | | | | | | | | | | | | | | | | | | | | |
| REDEMPTION FEES ADDED TO PAID-IN CAPITAL | | | 0.00 | (c) | | | 0.00 | (c) | | | 0.00 | (c) | | | 0.00 | (c) | | | 0.00 | (c) |
| | | | | | | | | | | | | | | | | | | | | |
| INCREASE/DECREASE IN NET ASSET VALUE | | | 9.13 | | | | (0.56 | ) | | | (0.21 | ) | | | 2.35 | | | | 1.92 | |
| NET ASSET VALUE, END OF PERIOD | | $ | 23.50 | | | $ | 14.37 | | | $ | 14.93 | | | $ | 15.14 | | | $ | 12.79 | |
| | | | | | | | | | | | | | | | | | | | | |
| TOTAL RETURN | | | 68.74 | % | | | (2.05 | )% | | | 2.08 | % | | | 20.14 | % | | | 17.92 | % |
| | | | | | | | | | | | | | | | | | | | | |
| RATIOS AND SUPPLEMENTAL DATA | | | | | | | | | | | | | | | | | | | | |
| Net assets, end of period (in 000s) | | $ | 263,711 | | | $ | 119,600 | | | $ | 108,934 | | | $ | 95,533 | | | $ | 47,811 | |
| | | | | | | | | | | | | | | | | | | | | |
| RATIOS TO AVERAGE NET ASSETS | | | | | | | | | | | | | | | | | | | | |
| Expenses (excluding fees waived/ reimbursed by investment advisor) | | | 0.96 | % | | | 0.99 | % | | | 1.02 | % | | | 1.10 | % | | | 1.17 | % |
| Expenses (including fees waived/ reimbursed by investment advisor) | | | 0.96 | % | | | 0.99 | % | | | 1.02 | % | | | 1.10 | % | | | 1.10 | % |
| Net investment income | | | 0.06 | % | | | 0.17 | % | | | 0.27 | % | | | 0.24 | % | | | 0.05 | % |
| | | | | | | | | | | | | | | | | | | | | |
| PORTFOLIO TURNOVER RATE | | | 50 | % | | | 50 | % | | | 52 | % | | | 30 | % | | | 32 | % |
| (a) | Per share numbers have been calculated using the average shares method. |
| (b) | The per share amount does not correspond to activity reflected in the Statement of Operations due to class specific expenses during the period. |
| (c) | Less than $0.005 or ($0.005) per share. |
| See Notes to Financial Statements. | |
| 94 | 1.855.377.7325 | www.GrandeurPeakGlobal.com |
| Grandeur Peak International Opportunities Fund | Financial Highlights |
For a Share Outstanding Throughout the Years Presented
| Investor Class | | Year Ended
April 30, 2021 | | | Year Ended
April 30, 2020 | | | Year Ended
April 30, 2019 | | | Year Ended
April 30, 2018 | | | Year Ended
April 30, 2017 | |
| NET ASSET VALUE, BEGINNING OF PERIOD | | $ | 3.04 | | | $ | 3.34 | | | $ | 4.10 | | | $ | 3.55 | | | $ | 3.09 | |
| | | | | | | | | | | | | | | | | | | | | |
| INCOME FROM INVESTMENT OPERATIONS | | | | | | | | | | | | | | | | | | | | |
| Net investment income/(loss)(a) | | | (0.01 | ) | | | 0.00 | (b) | | | 0.00 | (b) | | | 0.01 | | | | 0.01 | |
| Net realized and unrealized gain/(loss) on investments | | | 2.30 | | | | (0.18 | ) | | | (0.38 | ) | | | 0.68 | | | | 0.52 | |
| Total income/(loss) from investment operations | | | 2.29 | | | | (0.18 | ) | | | (0.38 | ) | | | 0.69 | | | | 0.53 | |
| | | | | | | | | | | | | | | | | | | | | |
| DISTRIBUTIONS | | | | | | | | | | | | | | | | | | | | |
| From net investment income | | | (0.01 | ) | | | (0.00 | )(b) | | | (0.01 | ) | | | (0.01 | ) | | | (0.02 | ) |
| From net realized gain on investments | | | (0.15 | ) | | | (0.12 | ) | | | (0.37 | ) | | | (0.13 | ) | | | (0.05 | ) |
| Total distributions | | | (0.16 | ) | | | (0.12 | ) | | | (0.38 | ) | | | (0.14 | ) | | | (0.07 | ) |
| | | | | | | | | | | | | | | | | | | | | |
| REDEMPTION FEES ADDED TO PAID-IN CAPITAL | | | 0.00 | (b) | | | 0.00 | (b) | | | 0.00 | (b) | | | 0.00 | (b) | | | 0.00 | (b) |
| | | | | | | | | | | | | | | | | | | | | |
| INCREASE/DECREASE IN NET ASSET VALUE | | | 2.13 | | | | (0.30 | ) | | | (0.76 | ) | | | 0.55 | | | | 0.46 | |
| NET ASSET VALUE, END OF PERIOD | | $ | 5.17 | | | $ | 3.04 | | | $ | 3.34 | | | $ | 4.10 | | | $ | 3.55 | |
| | | | | | | | | | | | | | | | | | | | | |
| TOTAL RETURN | | | 75.87 | % | | | (5.79 | )% | | | (7.40 | )% | | | 19.30 | % | | | 17.50 | % |
| | | | | | | | | | | | | | | | | | | | | |
| RATIOS AND SUPPLEMENTAL DATA | | | | | | | | | | | | | | | | | | | | |
| Net assets, end of period (in 000s) | | $ | 69,041 | | | $ | 41,351 | | | $ | 58,070 | | | $ | 78,686 | | | $ | 78,403 | |
| | | | | | | | | | | | | | | | | | | | | |
| RATIOS TO AVERAGE NET ASSETS | | | | | | | | | | | | | | | | | | | | |
| Expenses (excluding fees waived/ reimbursed by investment advisor) | | | 1.60 | % | | | 1.61 | % | | | 1.62 | % | | | 1.61 | % | | | 1.61 | % |
| Expenses (including fees waived/ reimbursed by investment advisor) | | | 1.53 | % | | | 1.58 | % | | | 1.57 | % | | | 1.55 | % | | | 1.58 | % |
| Net investment income/(loss) | | | (0.27 | )% | | | 0.01 | % | | | 0.11 | % | | | 0.31 | % | | | 0.16 | % |
| | | | | | | | | | | | | | | | | | | | | |
| PORTFOLIO TURNOVER RATE | | | 36 | % | | | 27 | % | | | 34 | % | | | 26 | % | | | 30 | % |
| (a) | Per share numbers have been calculated using the average shares method. |
| (b) | Less than $0.005 or ($0.005) per share. |
| See Notes to Financial Statements. | |
| Annual Report | April 30, 2021 | 95 |
| Grandeur Peak International Opportunities Fund | Financial Highlights |
For a Share Outstanding Throughout the Years Presented
| Institutional Class | | Year Ended
April 30, 2021 | | | Year Ended
April 30, 2020 | | | Year Ended
April 30, 2019 | | | Year Ended
April 30, 2018 | | | Year Ended
April 30, 2017 | |
| NET ASSET VALUE, BEGINNING OF PERIOD | | $ | 3.06 | | | $ | 3.36 | | | $ | 4.12 | | | $ | 3.57 | | | $ | 3.11 | |
| | | | | | | | | | | | | | | | | | | | | |
| INCOME FROM INVESTMENT OPERATIONS | | | | | | | | | | | | | | | | | | | | |
| Net investment income/(loss)(a) | | | (0.00 | )(b) | | | 0.01 | | | | 0.01 | | | | 0.02 | | | | 0.01 | |
| Net realized and unrealized gain/(loss) on investments | | | 2.31 | | | | (0.18 | ) | | | (0.38 | ) | | | 0.67 | | | | 0.52 | |
| Total income/(loss) from investment operations | | | 2.31 | | | | (0.17 | ) | | | (0.37 | ) | | | 0.69 | | | | 0.53 | |
| | | | | | | | | | | | | | | | | | | | | |
| DISTRIBUTIONS | | | | | | | | | | | | | | | | | | | | |
| From net investment income | | | (0.01 | ) | | | (0.01 | ) | | | (0.02 | ) | | | (0.01 | ) | | | (0.02 | ) |
| From net realized gain on investments | | | (0.15 | ) | | | (0.12 | ) | | | (0.37 | ) | | | (0.13 | ) | | | (0.05 | ) |
| Total distributions | | | (0.16 | ) | | | (0.13 | ) | | | (0.39 | ) | | | (0.14 | ) | | | (0.07 | ) |
| | | | | | | | | | | | | | | | | | | | | |
| REDEMPTION FEES ADDED TO PAID-IN CAPITAL | | | 0.00 | (b) | | | 0.00 | (b) | | | 0.00 | (b) | | | 0.00 | (b) | | | 0.00 | (b) |
| | | | | | | | | | | | | | | | | | | | | |
| INCREASE/DECREASE IN NET ASSET VALUE | | | 2.15 | | | | (0.30 | ) | | | (0.76 | ) | | | 0.55 | | | | 0.46 | |
| NET ASSET VALUE, END OF PERIOD | | $ | 5.21 | | | $ | 3.06 | | | $ | 3.36 | | | $ | 4.12 | | | $ | 3.57 | |
| | | | | | | | | | | | | | | | | | | | | |
| TOTAL RETURN | | | 76.29 | % | | | (5.60 | )% | | | (7.19 | )% | | | 19.38 | % | | | 17.59 | % |
| | | | | | | | | | | | | | | | | | | | | |
| RATIOS AND SUPPLEMENTAL DATA | | | | | | | | | | | | | | | | | | | | |
| Net assets, end of period (in 000s) | | $ | 904,059 | | | $ | 473,820 | | | $ | 653,241 | | | $ | 813,322 | | | $ | 698,504 | |
| | | | | | | | | | | | | | | | | | | | | |
| RATIOS TO AVERAGE NET ASSETS | | | | | | | | | | | | | | | | | | | | |
| Expenses (excluding fees waived/ reimbursed by investment advisor) | | | 1.36 | % | | | 1.37 | % | | | 1.37 | % | | | 1.37 | % | | | 1.37 | % |
| Expenses (including fees waived/ reimbursed by investment advisor) | | | 1.28 | % | | | 1.34 | % | | | 1.32 | % | | | 1.30 | % | | | 1.34 | % |
| Net investment income/(loss) | | | (0.02 | )% | | | 0.24 | % | | | 0.41 | % | | | 0.54 | % | | | 0.42 | % |
| | | | | | | | | | | | | | | | | | | | | |
| PORTFOLIO TURNOVER RATE | | | 36 | % | | | 27 | % | | | 34 | % | | | 26 | % | | | 30 | % |
| (a) | Per share numbers have been calculated using the average shares method. |
| (b) | Less than $0.005 or ($0.005) per share. |
See Notes to Financial Statements.
| 96 | 1.855.377.7325 | www.GrandeurPeakGlobal.com |
| Grandeur Peak International Stalwarts Fund | Financial Highlights |
For a Share Outstanding Throughout the Years Presented
| Investor Class | | Year Ended
April 30, 2021 | | | Year Ended
April 30, 2020 | | | Year Ended
April 30, 2019 | | | Year Ended
April 30, 2018 | | | Year Ended
April 30, 2017 | |
| NET ASSET VALUE, BEGINNING OF PERIOD | | $ | 14.40 | | | $ | 14.70 | | | $ | 15.53 | | | $ | 13.04 | | | $ | 11.02 | |
| | | | | | | | | | | | | | | | | | | | | |
| INCOME FROM INVESTMENT OPERATIONS | | | | | | | | | | | | | | | | | | | | |
| Net investment income/(loss)(a) | | | (0.00 | )(b) | | | 0.01 | | | | 0.04 | | | | 0.05 | | | | 0.02 | |
| Net realized and unrealized gain/(loss) on investments | | | 9.70 | | | | (0.29 | ) | | | (0.53 | ) | | | 2.62 | | | | 2.03 | |
| Total income/(loss) from investment operations | | | 9.70 | | | | (0.28 | ) | | | (0.49 | ) | | | 2.67 | | | | 2.05 | |
| | | | | | | | | | | | | | | | | | | | | |
| DISTRIBUTIONS | | | | | | | | | | | | | | | | | | | | |
| From net investment income | | | – | | | | (0.02 | ) | | | (0.05 | ) | | | – | | | | (0.03 | ) |
| From net realized gain on investments | | | (0.05 | ) | | | – | | | | (0.29 | ) | | | (0.18 | ) | | | – | |
| Total distributions | | | (0.05 | ) | | | (0.02 | ) | | | (0.34 | ) | | | (0.18 | ) | | | (0.03 | ) |
| | | | | | | | | | | | | | | | | | | | | |
| REDEMPTION FEES ADDED TO PAID-IN CAPITAL | | | 0.00 | (b) | | | 0.00 | (b) | | | 0.00 | (b) | | | 0.00 | (b) | | | 0.00 | (b) |
| | | | | | | | | | | | | | | | | | | | | |
| INCREASE/DECREASE IN NET ASSET VALUE | | | 9.65 | | | | (0.30 | ) | | | (0.83 | ) | | | 2.49 | | | | 2.02 | |
| NET ASSET VALUE, END OF PERIOD | | $ | 24.05 | | | $ | 14.40 | | | $ | 14.70 | | | $ | 15.53 | | | $ | 13.04 | |
| | | | | | | | | | | | | | | | | | | | | |
| TOTAL RETURN | | | 67.36 | % | | | (1.91 | )% | | | (2.69 | )% | | | 20.50 | % | | | 18.68 | % |
| | | | | | | | | | | | | | | | | | | | | |
| RATIOS AND SUPPLEMENTAL DATA | | | | | | | | | | | | | | | | | | | | |
| Net assets, end of period (in 000s) | | $ | 67,688 | | | $ | 82,289 | | | $ | 72,204 | | | $ | 52,478 | | | $ | 31,045 | |
| | | | | | | | | | | | | | | | | | | | | |
| RATIOS TO AVERAGE NET ASSETS | | | | | | | | | | | | | | | | | | | | |
| Expenses (excluding fees waived/ reimbursed by investment advisor) | | | 1.15 | % | | | 1.17 | % | | | 1.19 | % | | | 1.19 | % | | | 1.27 | % |
| Expenses (including fees waived/ reimbursed by investment advisor) | | | 1.15 | % | | | 1.17 | % | | | 1.19 | % | | | 1.19 | % | | | 1.27 | % |
| Net investment income/(loss) | | | (0.01 | )% | | | 0.04 | % | | | 0.26 | % | | | 0.33 | % | | | 0.19 | % |
| | | | | | | | | | | | | | | | | | | | | |
| PORTFOLIO TURNOVER RATE | | | 33 | % | | | 32 | % | | | 42 | % | | | 24 | % | | | 37 | % |
| (a) | Per share numbers have been calculated using the average shares method. |
| (b) | Less than $0.005 or ($0.005) per share. |
See Notes to Financial Statements.
| Annual Report | April 30, 2021 | 97 |
| Grandeur Peak International Stalwarts Fund | Financial Highlights |
For a Share Outstanding Throughout the Years Presented
| Institutional Class | | Year Ended
April 30, 2021 | | | Year Ended
April 30, 2020 | | | Year Ended
April 30, 2019 | | | Year Ended
April 30, 2018 | | | Year Ended
April 30, 2017 | |
| NET ASSET VALUE, BEGINNING OF PERIOD | | $ | 14.46 | | | $ | 14.74 | | | $ | 15.57 | | | $ | 13.06 | | | $ | 11.03 | |
| | | | | | | | | | | | | | | | | | | | | |
| INCOME FROM INVESTMENT OPERATIONS | | | | | | | | | | | | | | | | | | | | |
| Net investment income(a) | | | 0.06 | | | | 0.05 | | | | 0.07 | | | | 0.08 | | | | 0.04 | |
| Net realized and unrealized gain/(loss) on investments | | | 9.75 | | | | (0.29 | ) | | | (0.54 | ) | | | 2.63 | | | | 2.04 | |
| Total income/(loss) from investment operations | | | 9.81 | | | | (0.24 | ) | | | (0.47 | ) | | | 2.71 | | | | 2.08 | |
| | | | | | | | | | | | | | | | | | | | | |
| DISTRIBUTIONS | | | | | | | | | | | | | | | | | | | | |
| From net investment income | | | (0.03 | ) | | | (0.04 | ) | | | (0.07 | ) | | | (0.02 | ) | | | (0.05 | ) |
| From net realized gain on investments | | | (0.05 | ) | | | – | | | | (0.29 | ) | | | (0.18 | ) | | | – | |
| Total distributions | | | (0.08 | ) | | | (0.04 | ) | | | (0.36 | ) | | | (0.20 | ) | | | (0.05 | ) |
| | | | | | | | | | | | | | | | | | | | | |
| REDEMPTION FEES ADDED TO PAID-IN CAPITAL | | | 0.00 | (b) | | | 0.00 | (b) | | | 0.00 | (b) | | | 0.00 | (b) | | | 0.00 | (b) |
| | | | | | | | | | | | | | | | | | | | | |
| INCREASE/DECREASE IN NET ASSET VALUE | | | 9.73 | | | | (0.28 | ) | | | (0.83 | ) | | | 2.51 | | | | 2.03 | |
| NET ASSET VALUE, END OF PERIOD | | $ | 24.19 | | | $ | 14.46 | | | $ | 14.74 | | | $ | 15.57 | | | $ | 13.06 | |
| | | | | | | | | | | | | | | | | | | | | |
| TOTAL RETURN | | | 67.84 | % | | | (1.63 | )% | | | (2.50 | )% | | | 20.79 | % | | | 18.96 | % |
| | | | | | | | | | | | | | | | | | | | | |
| RATIOS AND SUPPLEMENTAL DATA | | | | | | | | | | | | | | | | | | | | |
| Net assets, end of period (in 000s) | | $ | 1,966,043 | | | $ | 870,916 | | | $ | 561,100 | | | $ | 496,358 | | | $ | 265,393 | |
| | | | | | | | | | | | | | | | | | | | | |
| RATIOS TO AVERAGE NET ASSETS | | | | | | | | | | | | | | | | | | | | |
| Expenses (excluding fees waived/ reimbursed by investment advisor) | | | 0.90 | % | | | 0.92 | % | | | 0.94 | % | | | 0.94 | % | | | 1.02 | % |
| Expenses (including fees waived/ reimbursed by investment advisor) | | | 0.90 | % | | | 0.92 | % | | | 0.94 | % | | | 0.94 | % | | | 1.02 | % |
| Net investment income | | | 0.31 | % | | | 0.32 | % | | | 0.51 | % | | | 0.57 | % | | | 0.37 | % |
| | | | | | | | | | | | | | | | | | | | | |
| PORTFOLIO TURNOVER RATE | | | 33 | % | | | 32 | % | | | 42 | % | | | 24 | % | | | 37 | % |
| (a) | Per share numbers have been calculated using the average shares method. |
| (b) | Less than $0.005 or ($0.005) per share. |
See Notes to Financial Statements.
| 98 | 1.855.377.7325 | www.GrandeurPeakGlobal.com |
| Grandeur Peak US Stalwarts Fund | Financial Highlights |
For a Share Outstanding Throughout the Year or Period Presented
| Institutional Class | | Year Ended
April 30, 2021 | | | For the Period
March 20, 2020 (Commencement of Operations) to
April 30, 2020 | |
| NET ASSET VALUE, BEGINNING OF PERIOD | | $ | 13.15 | | | $ | 10.00 | |
| | | | | | | | | |
| INCOME FROM INVESTMENT OPERATIONS | | | | | | | | |
| Net investment income/(loss)(a) | | | (0.06 | ) | | | (0.01 | ) |
| Net realized and unrealized gain on investments | | | 9.73 | | | | 3.16 | |
| Total income from investment operations | | | 9.67 | | | | 3.15 | |
| | | | | | | | | |
| DISTRIBUTIONS | | | | | | | | |
| From net investment income | | | (0.00 | )(b) | | | – | |
| From net realized gain on investments | | | (0.11 | ) | | | – | |
| Total distributions | | | (0.11 | ) | | | – | |
| | | | | | | | | |
| REDEMPTION FEES ADDED TO PAID-IN CAPITAL | | | 0.00 | (b) | | | 0.00 | (b) |
| | | | | | | | | |
| INCREASE IN NET ASSET VALUE | | | 9.56 | | | | 3.15 | |
| NET ASSET VALUE, END OF PERIOD | | $ | 22.71 | | | $ | 13.15 | |
| | | | | | | | | |
| TOTAL RETURN | | | 73.67 | % | | | 31.50 | %(c) |
| | | | | | | | | |
| RATIOS AND SUPPLEMENTAL DATA | | | | | | | | |
| Net assets, end of period (in 000s) | | $ | 126,106 | | | $ | 9,421 | |
| | | | | | | | | |
| RATIOS TO AVERAGE NET ASSETS | | | | | | | | |
| Expenses (excluding fees waived/ reimbursed by investment advisor) | | | 1.11 | % | | | 6.23 | %(d)(e) |
| Expenses (including fees waived/ reimbursed by investment advisor) | | | 1.00 | % | | | 1.00 | %(d)(e) |
| Net investment income/(loss) | | | (0.31 | )% | | | (0.53 | )%(d) |
| | | | | | | | | |
| PORTFOLIO TURNOVER RATE | | | 24 | % | | | 2 | %(c) |
| (a) | Per share numbers have been calculated using the average shares method. |
| (b) | Less than $0.005 or ($0.005) per share. |
| (e) | Expense ratios during startup periods may not be representative of longer term operating periods. |
See Notes to Financial Statements.
| Annual Report | April 30, 2021 | 99 |
| Grandeur Peak Funds® | Notes to Financial Statements |
April 30, 2021
1. ORGANIZATION
Financial Investors Trust (the “Trust”), a Delaware statutory trust, is an open-end management investment company registered under the Investment Company Act of 1940, as amended (“1940 Act”). As of April 30, 2021, the Trust consists of multiple separate portfolios or series. This annual report describes the Grandeur Peak Emerging Markets Opportunities Fund, Grandeur Peak Global Contrarian Fund, Grandeur Peak Global Micro Cap Fund, Grandeur Peak Global Opportunities Fund, Grandeur Peak Global Reach Fund, Grandeur Peak Global Stalwarts Fund, Grandeur Peak International Opportunities Fund, Grandeur Peak International Stalwarts Fund and Grandeur Peak US Stalwarts Fund (individually a “Fund” and collectively, the “Funds”). The Funds seek long-term growth of capital. The Funds offer Investor Class (except the Grandeur Peak Global Contrarian Fund, Grandeur Peak Global Micro Cap Fund and Grandeur Peak US Stalwarts Fund) and Institutional Class shares.
2. SIGNIFICANT ACCOUNTING POLICIES
The accompanying financial statements were prepared in accordance with accounting principles generally accepted in the United States of America (“U.S. GAAP”). The preparation of financial statements in conformity with U.S. GAAP requires management to make certain estimates and assumptions that affect the reported amounts of assets and liabilities and disclosures of contingent assets and liabilities at the date of the financial statements and the reported amounts of revenue and expenses during the period. Actual results could differ from those estimates. The Funds are considered an investment company for financial reporting purposes under U.S. GAAP and follows the accounting and reporting guidance applicable to investment companies in the Financial Accounting Standards Board Accounting Standards Codification Topic 946. The following is a summary of significant accounting policies consistently followed by the Funds in preparation of their financial statements.
Investment Valuation: The Funds generally value their securities based on market prices determined at the close of regular trading on the New York Stock Exchange (“NYSE”), normally 4:00 p.m. Eastern Time, on each day the NYSE is open for trading.
For equity securities and mutual funds that are traded on an exchange, the market price is usually the closing sale or official closing price on that exchange. In the case of equity securities not traded on an exchange, or if such closing prices are not otherwise available, the securities are valued at the mean of the most recent bid and ask prices on such day. Redeemable securities issued by open-end registered investment companies are valued at the investment company’s applicable net asset value, with the exception of exchange-traded open-end investment companies, which are priced as equity securities.
Equity securities that are primarily traded on foreign securities exchanges are valued at the closing values of such securities on their respective foreign exchanges, except when an event occurs subsequent to the close of the foreign exchange and the close of the NYSE that was likely to have changed such value. In such an event, the fair value of those securities are determined in good faith through consideration of other factors in accordance with procedures established by and under the general supervision of the Board of Trustees of the Trust (the “Board” or the “Trustees”). The Funds will use a fair valuation model provided by an independent pricing service, which is intended to reflect fair value when a security’s value or a meaningful portion of each Fund’s portfolio is believed to have been materially affected by a valuation event that has occurred between the close of the exchange or market on which the security is traded and the close of the regular trading day on the NYSE. The Funds’ valuation procedures set forth certain triggers which instruct when to use the fair valuation model.
Corporate bonds are valued using market models that consider trade data, quotations from dealers and active market makers, relevant yield curve and spread data, creditworthiness, trade data or market information on comparable securities, and other relevant security specific information.
Forward currency exchange contracts have a fair value determined by the prevailing foreign currency exchange daily rates and current foreign currency exchange forward rates. The foreign currency exchange forward rates are calculated using an automated system that estimates rates on the basis of the current day foreign currency exchange rates and forward foreign currency exchange rates supplied by a pricing service.
When such prices or quotations are not available, or when Grandeur Peak Global Advisors, LLC (the “Adviser” or “Grandeur Peak”) believes that they are unreliable, securities may be priced using fair value procedures approved by the Board.
Fair Value Measurements: The Funds disclose the classification of their fair value measurements following a three-tier hierarchy based on the inputs used to measure fair value. Inputs refer broadly to the assumptions that market participants would use in pricing the asset or liability, including assumptions about risk. Inputs may be observable or unobservable. Observable inputs reflect the assumptions market participants would use in pricing the asset or liability that are developed based on market data obtained from sources independent of the reporting entity. Unobservable inputs reflect the reporting entity’s own assumptions about the assumptions market participants would use in pricing the asset or liability that are developed based on the best information available.
| 100 | 1.855.377.7325 | www.GrandeurPeakGlobal.com |
| Grandeur Peak Funds® | Notes to Financial Statements |
April 30, 2021
Various inputs are used in determining the value of the Funds’ investments as of the end of the reporting period. When inputs used fall into different levels of the fair value hierarchy, the level in the hierarchy within which the fair value measurement falls is determined based on the lowest level input that is significant to the fair value measurement in its entirety. The designated input levels are not necessarily an indication of the risk or liquidity associated with these investments. These inputs are categorized in the following hierarchy under applicable financial accounting standards:
Level 1 – Unadjusted quoted prices in active markets for identical investments, unrestricted assets or liabilities that the Funds have the ability to access at the measurement date;
Level 2 – Quoted prices which are not active, quoted prices for similar assets or liabilities in active markets or inputs other than quoted prices that are observable (either directly or indirectly) for substantially the full term of the asset or liability; and
Level 3 – Significant unobservable prices or inputs (including the Funds’ own assumptions in determining the fair value of investments) where there is little or no market activity for the asset or liability at the measurement date.
The following is a summary of each Fund’s investments in the fair value hierarchy as of April 30, 2021:
| Investments in Securities at Value | | Level 1 - Quoted and Unadjusted Prices | | | Level 2 - Other Significant Observable Inputs | | | Level 3 - Significant Unobservable Inputs | | | Total | |
| Grandeur Peak Emerging Markets Opportunities Fund | | | | | | | | | | | | | |
| Common Stocks* | | $ | 619,889,078 | | | | – | | | | – | | | $ | 619,889,078 | |
| Total | | $ | 619,889,078 | | | $ | – | | | $ | – | | | $ | 619,889,078 | |
| * | For a detailed country breakdown, see the accompanying Portfolio of Investments. |
| Investments in Securities at Value | | Level 1 - Quoted and Unadjusted Prices | | | Level 2 - Other Significant Observable Inputs | | |
Level 3 - Significant Unobservable Inputs | | | Total | |
| Grandeur Peak Global Contrarian Fund | | | | | | | | | | | | | | | | |
| Common Stocks* | | $ | 47,985,217 | | | | – | | | | – | | | $ | 47,985,217 | |
| Total | | $ | 47,985,217 | | | $ | – | | | $ | – | | | $ | 47,985,217 | |
| * | For a detailed country breakdown, see the accompanying Portfolio of Investments. |
| Investments in Securities at Value | | Level 1 - Quoted and Unadjusted Prices | | | Level 2 - Other Significant Observable Inputs | | | Level 3 - Significant Unobservable Inputs | | | Total | |
| Grandeur Peak Global Micro Cap Fund | | | | | | | | | | | | | | | | |
| Common Stocks | | | | | | | | | | | | | | | | |
| New Zealand | | $ | 240,710 | | | $ | – | | | $ | – | | | $ | 240,710 | |
| Other* | | | 69,890,531 | | | | – | | | | – | | | | 69,890,531 | |
| Total | | $ | 70,131,241 | | | $ | – | | | $ | – | | | $ | 70,131,241 | |
| * | For a detailed country breakdown, see the accompanying Portfolio of Investments. |
| Investments in Securities at Value | | Level 1 - Quoted and Unadjusted Prices | | | Level 2 - Other Significant Observable Inputs | | | Level 3 - Significant Unobservable Inputs | | | Total | |
| Grandeur Peak Global Opportunities Fund | | | | | | | | | | | | | | | | |
| Common Stocks | | | | | | | | | | | | | | | | |
| New Zealand | | $ | – | | | $ | – | | | $ | 1 | | | $ | 1 | |
| Other* | | | 1,015,643,492 | | | | – | | | | – | | | | 1,015,643,492 | |
| Preferred Stocks* | | | – | | | | – | | | | 4,252,160 | | | | 4,252,160 | |
| Total | | $ | 1,015,643,492 | | | $ | – | | | $ | 4,252,161 | | | $ | 1,019,895,653 | |
| * | For a detailed country breakdown, see the accompanying Portfolio of Investments. |
| Annual Report | April 30, 2021 | 101 |
| Grandeur Peak Funds® | Notes to Financial Statements |
April 30, 2021
| Investments in Securities at Value | | Level 1 - Quoted and Unadjusted Prices | | | Level 2 - Other Significant Observable Inputs | | | Level 3 - Significant Unobservable Inputs | | | Total | |
| Grandeur Peak Global Reach Fund | | | | | | | | | | | | | | | | |
| Common Stocks | | | | | | | | | | | | | | | | |
| New Zealand | | $ | 1,568,742 | | | $ | – | | | $ | – | | | $ | 1,568,742 | |
| Spain | | | – | | | | – | | | | – | | | | – | |
| United States | | | 103,098,256 | | | | – | | | | 1,000,000 | | | | 104,098,256 | |
| Other* | | | 266,927,233 | | | | – | | | | – | | | | 266,927,233 | |
| Preferred Stocks* | | | – | | | | – | | | | 2,016,652 | | | | 2,016,652 | |
| Total | | $ | 371,594,231 | | | $ | – | | | $ | 3,016,652 | | | $ | 374,610,883 | |
| * | For a detailed country breakdown, see the accompanying Portfolio of Investments. |
| Investments in Securities at Value | | Level 1 - Quoted and Unadjusted Prices | | | Level 2 - Other Significant Observable Inputs | | | Level 3 -Significant Unobservable Inputs | | | Total |
| Grandeur Peak Global Stalwarts Fund | | | | | | | | | | | |
| Common Stocks | | | | | | | | | | | | | | | | |
| United States | | $ | 152,051,235 | | | $ | – | | | $ | 1,300,000 | | | $ | 153,351,235 | |
| Other* | | | 210,197,652 | | | | – | | | | – | | | | 210,197,652 | |
| Preferred Stocks* | | | – | | | | – | | | | 1,067,528 | | | | 1,067,528 | |
| Total | | $ | 362,248,887 | | | $ | – | | | $ | 2,367,528 | | | $ | 364,616,415 | |
| * | For a detailed country breakdown, see the accompanying Portfolio of Investments. |
| Investments in Securities at Value | | Level 1 - Quoted and Unadjusted Prices | | | Level 2 - Other Significant Observable Inputs | | | Level 3 - Significant Unobservable Inputs | | | Total | |
| Grandeur Peak International Opportunities Fund | | | | | | | | | | | | | | | | |
| Common Stocks | | | | | | | | | | | | | | | | |
| New Zealand | | $ | – | | | $ | – | | | $ | 1 | | | $ | 1 | |
| Other* | | | 944,384,144 | | | | – | | | | – | | | | 944,384,144 | |
| Total | | $ | 944,384,144 | | | $ | – | | | $ | 1 | | | $ | 944,384,145 | |
| * | For a detailed country breakdown, see the accompanying Portfolio of Investments. |
| Investments in Securities at Value | | Level 1 - Quoted and Unadjusted Prices | | | Level 2 - Other Significant Observable Inputs | | | Level 3 - Significant Unobservable Inputs | | | Total | |
| Grandeur Peak International Stalwarts Fund | | | | | | | | | | | | | | | | |
| Common Stocks* | | | 2,011,489,225 | | | | – | | | | – | | | | 2,011,489,225 | |
| Total | | $ | 2,011,489,225 | | | $ | – | | | $ | – | | | $ | 2,011,489,225 | |
| * | For a detailed country breakdown, see the accompanying Portfolio of Investments. |
| 102 | 1.855.377.7325 | www.GrandeurPeakGlobal.com |
| Grandeur Peak Funds® | Notes to Financial Statements |
April 30, 2021
| Investments in Securities at Value | | Level 1 - Quoted and Unadjusted Prices | | | Level 2 - Other Significant Observable Inputs | | | Level 3 - Significant Unobservable Inputs | | | Total | |
| Grandeur Peak US Stalwarts Fund | | | | | | | | | | | | | | | | |
| Common Stocks | | | | | | | | | | | | | | | | |
| United States | | $ | 109,871,553 | | | $ | – | | | $ | 700,000 | | | $ | 110,571,553 | |
| Other* | | | 13,961,413 | | | | – | | | | – | | | | 13,961,413 | |
| Total | | $ | 123,832,966 | | | $ | – | | | $ | 700,000 | | | $ | 124,532,966 | |
| * | For a detailed country breakdown, see the accompanying Portfolio of Investments. |
The following is a reconciliation of the investments in which significant unobservable inputs (Level 3) were used in determining fair value:
| Grandeur Peak Emerging Markets Opportunities Fund | | Common Stock | | | Total | |
| Balance as of April 30, 2020 | �� | $ | 7,060 | | | $ | 7,060 | |
| Accrued discount/ premium | | | – | | | | – | |
| Realized Gain/(Loss) | | | – | | | | – | |
| Change in Unrealized Appreciation/(Depreciation) | | | (7,060 | ) | | | (7,060 | ) |
| Purchases | | | – | | | | – | |
| Sales Proceeds | | | – | | | | – | |
| Transfer into Level 3 | | | – | | | | – | |
| Transfer out of Level 3 | | | – | | | | – | |
| Balance as of April 30, 2021 | | $ | – | | | $ | – | |
| Net change in unrealized appreciation/(depreciation) included in the Statements of Operations attributable to Level 3 investments held at April 30, 2021 | | $ | – | | | $ | – | |
| Grandeur Peak Global Micro Cap Fund | | | Common Stock | | | | Total | |
| Balance as of April 30, 2020 | | $ | – | | | $ | – | |
| Accrued discount/ premium | | | – | | | | – | |
| Realized Gain/(Loss) | | | – | | | | – | |
| Change in Unrealized Appreciation/(Depreciation) | | | – | | | | – | |
| Purchases | | | – | | | | – | |
| Sales Proceeds | | | – | | | | – | |
| Transfer into Level 3 | | | – | | | | – | |
| Transfer out of Level 3 | | | – | | | | | |
| Balance as of April 30, 2021 | | $ | – | | | $ | – | |
| Net change in unrealized appreciation/(depreciation) included in the Statements of Operations attributable to Level 3 investments held at April 30, 2021 | | $ | – | | | $ | – | |
| Annual Report | April 30, 2021 | 103 |
| Grandeur Peak Funds® | Notes to Financial Statements |
April 30, 2021
| Grandeur Peak Global Opportunities Fund | | Common Stock | | | Preferred Stocks | | | Total | |
| Balance as of April 30, 2020 | | $ | 1 | | | $ | 2,022,675 | | | $ | 2,022,676 | |
| Accrued discount/ premium | | | – | | | | – | | | | – | |
| Realized Gain/(Loss) | | | – | | | | – | | | | – | |
| Change in Unrealized Appreciation/(Depreciation) | | | – | | | | 2,229,485 | | | | 2,229,485 | |
| Purchases | | | – | | | | – | | | | – | |
| Sales Proceeds | | | – | | | | – | | | | – | |
| Transfer into Level 3 | | | – | | | | – | | | | – | |
| Transfer out of Level 3 | | | – | | | | – | | | | – | |
| Balance as of April 30, 2021 | | $ | 1 | | | $ | 4,252,160 | | | $ | 4,252,161 | |
| Net change in unrealized appreciation/(depreciation) included in the Statements of Operations attributable to Level 3 investments held at April 30, 2021 | | $ | – | | | $ | 2,329,024 | | | $ | 2,329,024 | |
| Grandeur Peak Global Reach Fund | | Common Stock | | | Preferred Stocks | | | Total | |
| Balance as of April 30, 2020 | | $ | – | | | $ | 959,285 | | | $ | 959,285 | |
| Accrued discount/ premium | | | – | | | | – | | | | – | |
| Realized Gain/(Loss) | | | – | | | | – | | | | – | |
| Change in Unrealized Appreciation/(Depreciation) | | | – | | | | 1,057,367 | | | | 1,057,367 | |
| Purchases | | | 1,000,000 | | | | – | | | | 1,000,000 | |
| Sales Proceeds | | | – | | | | – | | | | – | |
| Transfer into Level 3 | | | – | | | | – | | | | – | |
| Transfer out of Level 3 | | | – | | | | – | | | | – | |
| Balance as of April 30, 2021 | | $ | 1,000,000 | | | $ | 2,016,652 | | | $ | 3,016,652 | |
| Net change in unrealized appreciation/(depreciation) included in the Statements of Operations attributable to Level 3 investments held at April 30, 2021 | | $ | – | | | $ | 1,104,575 | | | $ | 1,104,575 | |
| Grandeur Peak Global Stalwarts Fund | | Common Stock | | | Preferred Stocks | | | Total | |
| Balance as of April 30, 2020 | | $ | – | | | $ | 507,803 | | | $ | 507,803 | |
| Accrued discount/ premium | | | – | | | | – | | | | – | |
| Realized Gain/(Loss) | | | – | | | | – | | | | – | |
| Change in Unrealized Appreciation/(Depreciation) | | | – | | | | 559,725 | | | | 559,725 | |
| Purchases | | | 1,300,000 | | | | – | | | | 1,300,000 | |
| Sales Proceeds | | | – | | | | – | | | | – | |
| Transfer into Level 3 | | | – | | | | – | | | | – | |
| Transfer out of Level 3 | | | – | | | | – | | | | – | |
| Balance as of April 30, 2021 | | $ | 1,300,000 | | | $ | 1,067,528 | | | $ | 2,367,528 | |
| Net change in unrealized appreciation/(depreciation) included in the Statements of Operations attributable to Level 3 investments held at April 30, 2021 | | $ | – | | | $ | 584,715 | | | $ | 584,715 | |
| 104 | 1.855.377.7325 | www.GrandeurPeakGlobal.com |
| Grandeur Peak Funds® | Notes to Financial Statements |
April 30, 2021
| Grandeur Peak International Opportunities Fund | | Common Stock | | | Total | |
| Balance as of April 30, 2020 | | $ | 1 | | | $ | 1 | |
| Accrued discount/ premium | | | – | | | | – | |
| Realized Gain/(Loss) | | | – | | | | – | |
| Change in Unrealized Appreciation/(Depreciation) | | | – | | | | – | |
| Purchases | | | – | | | | – | |
| Sales Proceeds | | | – | | | | – | |
| Transfer into Level 3 | | | – | | | | – | |
| Transfer out of Level 3 | | | – | | | | – | |
| Balance as of April 30, 2021 | | $ | 1 | | | $ | 1 | |
| Net change in unrealized appreciation/(depreciation) included in the Statements of Operations attributable to Level 3 investments held at April 30, 2021 | | $ | – | | | $ | – | |
| Grandeur Peak US Stalwarts Fund | | Common Stock | | | Total | |
| Balance as of April 30, 2020 | | $ | – | | | $ | – | |
| Accrued discount/ premium | | | – | | | | – | |
| Realized Gain/(Loss) | | | – | | | | – | |
| Change in Unrealized Appreciation/(Depreciation) | | | – | | | | – | |
| Purchases | | | 700,000 | | | | 700,000 | |
| Sales Proceeds | | | – | | | | – | |
| Transfer into Level 3 | | | – | | | | – | |
| Transfer out of Level 3 | | | – | | | | – | |
| Balance as of April 30, 2021 | | $ | 700,000 | | | $ | 700,000 | |
| Net change in unrealized appreciation/(depreciation) included in the Statements of Operations attributable to Level 3 investments held at April 30, 2021 | | $ | – | | | $ | – | |
Change in unrealized appreciation/depreciation on Level 3 securities is included on the Statements of Operations under Net change in unrealized appreciation/(depreciation) on investments. Realized gain/(loss) on Level 3 securities is included on the Statements of Operations under Net realized gain/(loss) on investments.
The table below provides additional information about the Level 3 Fair Value Measurements as of April 30, 2021:
Quantitative Information about Level 3 Fair Value Measurements
Grandeur Peak Global Opportunities Fund
| Asset Class | Fair Value (USD) at 04/30/2021 | Valuation Technique | Unobservable Inputs(a) | Value/Range |
| Preferred Stocks | $4,252,160 | Market Approach | Enterprise Value-to-Sales Multiple | 16.84x |
Grandeur Peak Global Reach Fund
| Asset Class | Fair Value (USD) at 04/30/2021 | Valuation Technique | Unobservable Inputs(a) | Value/Range |
| Private Investment Funds | $1,000,000 | Cost/Third-Party Valuation | Third-Party Valuation | Cost |
| Preferred Stocks | 2,016,652 | Market Approach | Enterprise Value-to-Sales Multiple | 16.84x |
Grandeur Peak Global Stalwarts Fund
| Asset Class | Fair Value (USD) at 04/30/2021 | Valuation Technique | Unobservable Inputs(a) | Value/Range |
| Private Investment Funds | $1,300,000 | Cost/Third-Party Valuation | Third-Party Valuation | Cost |
| Preferred Stocks | 1,067,528 | Market Approach | Enterprise Value-to-Sales Multiple | 16.84x |
| Annual Report | April 30, 2021 | 105 |
| Grandeur Peak Funds® | Notes to Financial Statements |
April 30, 2021
Grandeur Peak US Stalwarts Fund
| Asset Class | Fair Value (USD) at 04/30/2021 | Valuation Technique | Unobservable Inputs(a) | Value/Range |
| Private Investment Funds | $700,000 | Cost/Third-Party Valuation | Third-Party Valuation | Cost |
| (a) | A change to the unobservable input may result in a significant change to the value of the investment as follows: |
| Unobservable Input | Impact to Value if Input Increases | Impact to Value if Input Decreases |
| Enterprise Value-to-Sales Multiple | Increase | Decrease |
| Third-Party Valuation | Increase | Decrease |
Investment Transactions and Investment Income: Investment transactions are accounted for on the date the investments are purchased or sold (trade date). Realized gains and losses from investment transactions are reported on an identified cost which is the same basis the Fund uses for federal income tax purposes. Interest income, which includes accretion of discounts and amortization of premiums, is accrued and recorded as earned. Dividend income is recognized on the ex-dividend date or for certain foreign securities, as soon as information is available to the Funds. All of the realized and unrealized gains and losses and net investment income, are allocated daily to each class in proportion to its average daily net assets.
Cash Management Transactions: The Funds subscribe to the Brown Brothers Harriman & Co. (“BBH”) Cash Management Service (“CMS”), whereby cash balances are automatically swept into overnight offshore demand deposits with either the BBH Grand Cayman branch or a branch of a pre-approved commercial bank. This fully automated program allows the Funds to earn interest on cash balances. Excess cash with deposit institutions domiciled outside of the U.S. are subject to sovereign actions in the jurisdiction of the deposit institution including, but not limited to, freeze, seizure or diminution. Cash balances in the BBH CMS are included on the Statements of Assets and Liabilities under Cash and Foreign Cash, at Value. As of April 30, 2021, the Funds had the following cash balances participating in the BBH CMS:
| Fund | | | |
| Grandeur Peak Emerging Markets Opportunities Fund | | $ | 20,875,908 | |
| Grandeur Peak Global Contrarian Fund | | | 1,608,194 | |
| Grandeur Peak Global Micro Cap Fund | | | 432,695 | |
| Grandeur Peak Global Opportunities Fund | | | 3,436,884 | |
| Grandeur Peak Global Reach Fund | | | 2,684,912 | |
| Grandeur Peak Global Stalwarts Fund | | | 3,325,090 | |
| Grandeur Peak International Opportunities Fund | | | 28,656,864 | |
| Grandeur Peak International Stalwarts Fund | | | 23,845,122 | |
| Grandeur Peak US Stalwarts Fund | | | 1,778,493 | |
As of April 30, 2021, the Funds had the following foreign cash balances participating in the BBH CMS (cost and value of foreign cash balances are equal):
| Fund | | | |
| Grandeur Peak Emerging Markets Opportunities Fund | | $ | 1 | |
| Grandeur Peak Global Contrarian Fund | | | – | |
| Grandeur Peak Global Micro Cap Fund | | | 11,025 | |
| Grandeur Peak Global Opportunities Fund | | | 62,027 | |
| Grandeur Peak Global Reach Fund | | | 17,255 | |
| Grandeur Peak Global Stalwarts Fund | | | 11,333 | |
| Grandeur Peak International Opportunities Fund | | | 49,149 | |
| Grandeur Peak International Stalwarts Fund | | | 101,391 | |
| Grandeur Peak US Stalwarts Fund | | | – | |
Short Sales: The Funds may make short sales of securities consistent with their strategies. A short sale is a transaction in which a Fund sells a security it does not own in anticipation that the market price of that security will decline.
When a Fund makes a short sale, it must borrow the security sold short and deliver it to the broker dealer through which it made the short sale as collateral for its obligation to deliver the security upon conclusion of the sale. The Fund may have to pay a fee to borrow particular securities and is often obligated to pay over any accrued interest and dividends on such borrowed securities.
| 106 | 1.855.377.7325 | www.GrandeurPeakGlobal.com |
| Grandeur Peak Funds® | Notes to Financial Statements |
April 30, 2021
If the price of the security sold short increases between the time of the short sale and the time that a Fund replaces the borrowed security, the Fund will incur a loss; conversely, if the price declines, the Fund will realize a capital gain. Any gain will be decreased, and any loss increased, by the transaction costs described above. The successful use of short selling may be adversely affected by imperfect correlation between movements in the price of the security sold short and the securities being hedged.
To the extent that a Fund engages in short sales, it will provide collateral to the broker-dealer and (except in the case of short sales “against the box”) will maintain additional asset coverage in the form of segregated or “earmarked” assets determined to be liquid in accordance with procedures established by the Board and that is equal to the current market value of the securities sold short, or will ensure that such positions are covered by “offsetting” positions, until the Fund replaces the borrowed security. A short sale is “against the box” to the extent that the Fund contemporaneously owns, or has the right to obtain at no added cost, securities identical to those sold short. The Fund may engage in short selling to the extent permitted by the federal securities laws and rules and interpretations thereunder. To the extent a Fund engages in short selling in foreign (non-U.S.) jurisdictions, the Fund will do so to the extent permitted by the laws and regulations of such jurisdiction.
Foreign Securities: The Funds may directly purchase securities of foreign issuers. Investing in securities of foreign issuers involves special risks not typically associated with investing in securities of U.S. issuers. The risks include possible reevaluation of currencies, the inability to repatriate foreign currency, less complete financial information about companies and possible future adverse political and economic developments. Moreover, securities of many foreign issuers and their markets may be less liquid and their prices more volatile than those of securities of comparable U.S. issuers.
Foreign Currency Translation: The books and records of the Funds are maintained in U.S. dollars. Investment valuations and other assets and liabilities initially expressed in foreign currencies are converted each business day into U.S. dollars based upon current exchange rates. Prevailing foreign exchange rates may generally be obtained at the close of the NYSE (normally, 4:00 p.m. Eastern Time). The portion of realized and unrealized gains or losses on investments due to fluctuations in foreign currency exchange rates is not separately disclosed and is included in realized and unrealized gains or losses on investments, when applicable.
Foreign Currency Spot Contracts: The Funds may enter into foreign currency spot contracts to facilitate transactions in foreign securities or to convert foreign currency receipts into U.S. dollars. A foreign currency spot contract is an agreement between two parties to buy and sell currencies at the current market rate, for settlement generally within two business days. The U.S. dollar value of the contracts is determined using current currency exchange rates supplied by a pricing service.
The contract is marked-to-market daily for settlements beyond one day and any change in market value is recorded as an unrealized gain or loss. When the contract is closed, a realized gain or loss is recorded equal to the difference between the value on the open and close date. Losses may arise from changes in the value of the foreign currency, or if the counterparties do not perform under the contract’s terms. The maximum potential loss from such contracts is the aggregate face value in U.S. dollars at the time the contract was opened.
Special Purpose Vehicle: The Funds may invest in a Special Purpose Vehicle (a “SPV”). A SPV is a separate legal entity created by an organization. The SPV is a distinct company with its own assets and liabilities, as well as its own legal status. Usually, they are created for a specific objective, often to isolate financial risk. As it is a separate legal entity, if the parent company goes bankrupt, the special purpose vehicle can carry on.
Trust Expenses: Some expenses of the Trust can be directly attributed to the Funds. Expenses which cannot be directly attributed to the Funds are apportioned among all funds in the Trust based on average net assets of each fund.
Fund and Class Expenses: Expenses that are specific to a Fund or class of shares of a Fund, including distribution fees (Rule 12b-1 fees), are charged directly to that Fund or share class. Expenses that are common to all Funds generally are allocated among the Funds in proportion to their average daily net assets.
Federal Income Taxes: The Funds comply with the requirements under Subchapter M of the Internal Revenue Code of 1986, as amended, applicable to regulated investment companies and intend to distribute substantially all of their net taxable income and net capital gains, if any, each year so that it will not be subject to excise tax on undistributed income and gains. The Funds are not subject to income taxes to the extent such distributions are made.
As of and during the year ended April 30, 2021, the Funds had a liability for unrecognized capital gains tax. These amounts are disclosed as Foreign Capital Gains Tax on the Statements of Assets and Liabilities. The Funds file U.S. federal, state, and local tax returns as required. The Funds’ tax returns are subject to examination by the relevant tax authorities until expiration of the applicable statute of limitations, which is generally three years after the filing of the tax return for federal purposes and four years for most state returns. Tax returns for open years have incorporated no uncertain tax positions that require a provision for income taxes.
| Annual Report | April 30, 2021 | 107 |
| Grandeur Peak Funds® | Notes to Financial Statements |
April 30, 2021
Distributions to Shareholders: Each Fund normally pays dividends and distributes capital gains, if any, on an annual basis. Income dividend distributions are derived from dividends and other income each Fund receives from their investments, including short term capital gains. Long term capital gain distributions are derived from gains realized when each Fund sells a security it has owned for more than a year. Each Fund may make additional distributions and dividends at other times if the portfolio manager believes doing so may be necessary for each Fund to avoid or reduce taxes. The Funds intend to pass through foreign tax credits to shareholders.
Epidemic and Pandemic Risk: Certain countries have been susceptible to epidemics, most recently COVID-19, which has been designated as a pandemic by world health authorities. The outbreak of such epidemics, together with any resulting restrictions on travel or quarantines imposed, could have a negative impact on the economy and business activity globally (including in the countries in which we invest), and thereby could adversely affect the performance of our investments. Furthermore, the rapid development of epidemics could preclude prediction as to their ultimate adverse impact on economic and market conditions, and, as a result, present material uncertainty and risk with respect to us and the performance of our investments.
Libor Risk: In March 2020, the Financial Accounting Standards Board (FASB) issued Accounting Standards Update (“ASU”) No. 2020-04, Reference Rate Reform (Topic 848): Facilitation of the Effects of Reference Rate Reform on Financial Reporting. The Funds’ investments, payment obligations, and financing terms may be based on floating rates, such as the London Interbank Offered Rate, or “LIBOR,” which is the offered rate for short-term Eurodollar deposits between major international banks. On November 30, 2020, the administrator of LIBOR announced its intention to delay the phase out of the majority of the U.S. dollar LIBOR publications until June 30, 2023, with the remainder of LIBOR publications to still end at the end of 2020.
3. TAX BASIS INFORMATION
Reclassifications: As of April 30, 2021, permanent differences in book and tax accounting were reclassified. These differences had no effect on net assets and are primarily attributed to tax equalization. The reclassifications were as follows:
| Fund | | Paid-in Capital | | | Distributable earnings | |
| Grandeur Peak Emerging Markets Opportunities Fund | | $ | 908,610 | | | $ | (908,610 | ) |
| Grandeur Peak Global Contrarian Fund | | | 18,278 | | | | (18,278 | ) |
| Grandeur Peak Global Micro Cap Fund | | | 84,819 | | | | (84,819 | ) |
| Grandeur Peak Global Opportunities Fund | | | 6,259,692 | | | | (6,259,692 | ) |
| Grandeur Peak Global Reach Fund | | | 2,514,561 | | | | (2,514,561 | ) |
| Grandeur Peak Global Stalwarts Fund | | | 2,817,294 | | | | (2,817,294 | ) |
| Grandeur Peak International Opportunities Fund | | | 3,689,131 | | | | (3,689,131 | ) |
| Grandeur Peak International Stalwarts Fund | | | 3,804,035 | | | | (3,804,035 | ) |
| Grandeur Peak US Stalwarts Fund | | | 55,230 | | | | (55,230 | ) |
Tax Basis of Investments: As of April 30, 2021, the aggregate cost of investments, gross unrealized appreciation/(depreciation) and net unrealized appreciation/(depreciation) for Federal tax purposes was as follows:
| Fund | | Gross Appreciation (excess of value over tax cost) | | | Gross Depreciation (excess of tax cost over value) | | | Net Appreciation/ (Depreciation) of Foreign Currency | | | Net Unrealized Appreciation/ (Depreciation) | | | Cost of Investments for Income Tax Purposes | |
| Grandeur Peak Emerging Markets Opportunities Fund | | $ | 241,788,096 | | | $ | (24,738,694 | ) | | $ | (4,773,673 | ) | | $ | 212,275,729 | | | $ | 402,839,676 | |
| Grandeur Peak Global Contrarian Fund | | | 7,585,826 | | | | (866,694 | ) | | | (66,358 | ) | | | 6,652,774 | | | | 41,266,085 | |
| Grandeur Peak Global Micro Cap Fund | | | 28,286,039 | | | | (1,678,943 | ) | | | (292,592 | ) | | | 26,314,504 | | | | 43,524,145 | |
| Grandeur Peak Global Opportunities Fund | | | 421,928,259 | | | | (15,823,997 | ) | | | (2,273,634 | ) | | | 403,830,628 | | | | 613,791,391 | |
| Grandeur Peak Global Reach Fund | | | 163,965,101 | | | | (8,769,509 | ) | | | (758,981 | ) | | | 154,436,611 | | | | 219,415,291 | |
| Grandeur Peak Global Stalwarts Fund | | | 140,478,431 | | | | (5,298,522 | ) | | | (509,160 | ) | | | 134,670,749 | | | | 229,436,506 | |
| Grandeur Peak International Opportunities Fund | | | 397,023,499 | | | | (19,288,659 | ) | | | (2,110,972 | ) | | | 375,623,868 | | | | 566,649,305 | |
| Grandeur Peak International Stalwarts Fund | | | 731,441,927 | | | | (31,131,038 | ) | | | (3,696,596 | ) | | | 696,614,293 | | | | 1,311,178,336 | |
| Grandeur Peak US Stalwarts Fund | | | 22,236,197 | | | | (1,811,313 | ) | | | (5 | ) | | | 20,424,879 | | | | 104,108,082 | |
| 108 | 1.855.377.7325 | www.GrandeurPeakGlobal.com |
| Grandeur Peak Funds® | Notes to Financial Statements |
April 30, 2021
Components of Earnings: As of April 30, 2021, components of distributable earnings on a tax basis were as follows:
| Fund | | Undistributed Ordinary Income | | | Accumulated Capital Gains/(Losses) | | | Other Accumulated Gain/(Loss) | | | Net Unrealized Appreciation/ (Depreciation) on Investments and Foreign Currency | | | Total Distributable Earnings | |
| Grandeur Peak Emerging Markets Opportunities Fund | | $ | – | | | $ | 34,432,255 | | | $ | (88,462 | ) | | $ | 212,275,729 | | | $ | 246,619,522 | |
| Grandeur Peak Global Contrarian Fund | | | 1,686,392 | | | | 880,802 | | | | 1,593 | | | | 6,652,774 | | | | 9,221,561 | |
| Grandeur Peak Global Micro Cap Fund | | | 771,278 | | | | 3,381,427 | | | | – | | | | 26,314,504 | | | | 30,467,209 | |
| Grandeur Peak Global Opportunities Fund | | | 13,505,060 | | | | 90,794,975 | | | | 181 | | | | 403,830,628 | | | | 508,130,844 | |
| Grandeur Peak Global Reach Fund | | | 5,530,237 | | | | 31,516,413 | | | | 4,767 | | | | 154,436,611 | | | | 191,488,028 | |
| Grandeur Peak Global Stalwarts Fund | | | 4,870,113 | | | | 17,761,173 | | | | 1,880 | | | | 134,670,749 | | | | 157,303,915 | |
| Grandeur Peak International Opportunities Fund | | | 9,440,901 | | | | 59,100,445 | | | | 3,755 | | | | 375,623,868 | | | | 444,168,969 | |
| Grandeur Peak International Stalwarts Fund | | | 2,961,464 | | | | 62,138,698 | | | | 7,005 | | | | 696,614,293 | | | | 761,721,460 | |
| Grandeur Peak US Stalwarts Fund | | | 1,620,641 | | | | – | | | | – | | | | 20,424,879 | | | | 22,045,520 | |
Tax Basis of Distributions to Shareholders: The character of distributions made during the year from net investment income or net realized gains may differ from its ultimate characterization for federal income tax purposes. Also, due to the timing of dividend distributions, the fiscal year in which amounts are distributed may differ from the fiscal year in which the income or realized gain were recorded by the Funds.
The tax character of distributions paid by the Funds for the fiscal year ended April 30, 2021 were as follows:
| Fund | | Ordinary Income | | | Long-Term Capital Gain | |
| Grandeur Peak Emerging Markets Opportunities Fund | | $ | 208,905 | | | $ | 588,486 | |
| Grandeur Peak Global Contrarian Fund | | | 409,394 | | | | – | |
| Grandeur Peak Global Micro Cap Fund | | | 870,224 | | | | 3,187,700 | |
| Grandeur Peak Global Opportunities Fund | | | 7,761,520 | | | | 56,202,500 | |
| Grandeur Peak Global Reach Fund | | | 2,560,410 | | | | 23,014,944 | |
| Grandeur Peak Global Stalwarts Fund | | | 1,116,972 | | | | 8,533,427 | |
| Grandeur Peak International Opportunities Fund | | | 3,394,873 | | | | 25,974,822 | |
| Grandeur Peak International Stalwarts Fund | | | 2,036,831 | | | | 3,581,302 | |
| Grandeur Peak US Stalwarts Fund | | | 267,443 | | | | 401 | |
The tax character of distributions paid by the Funds for the fiscal year ended April 30, 2020 were as follows:
| Fund | | Ordinary Income | | | Long-Term Capital Gain | |
| Grandeur Peak Emerging Markets Opportunities Fund | | $ | 995,004 | | | $ | – | |
| Grandeur Peak Global Contrarian Fund | | | 19,023 | | | | – | |
| Grandeur Peak Global Micro Cap Fund | | | 25,741 | | | | 224,541 | |
| Grandeur Peak Global Opportunities Fund | | | – | | | | 36,811,507 | |
| Grandeur Peak Global Reach Fund | | | 805,795 | | | | 7,326,729 | |
| Grandeur Peak Global Stalwarts Fund | | | 179,533 | | | | 3,176,422 | |
| Grandeur Peak International Opportunities Fund | | | 1,679,453 | | | | 22,643,239 | |
| Grandeur Peak International Stalwarts Fund | | | 2,114,879 | | | | – | |
| Grandeur Peak US Stalwarts Fund | | | – | | | | – | |
| Annual Report | April 30, 2021 | 109 |
| Grandeur Peak Funds® | Notes to Financial Statements |
April 30, 2021
The following Funds utilized capital losses carried forward from the prior fiscal year during the year ending April 30, 2021, in the amounts as specified below:
| Fund | | Capital Losses Recognized | |
| Grandeur Peak Emerging Markets Opportunities Fund | | $ | 9,299,583 | |
| Grandeur Peak International Stalwarts Fund | | | 1,550,827 | |
The following Funds elect to defer to the period ending April 30, 2022, late year ordinary losses in the amount of:
| Fund | | Ordinary Losses Recognized | |
| Grandeur Peak Emerging Markets Opportunities Fund | | $ | 90,862 | |
4. SECURITIES TRANSACTIONS
The cost of purchases and proceeds from sales of securities (excluding short term securities) during the year ended April 30, 2021 were as follows:
| Fund | | Purchases of Securities | | | Proceeds From Sales of Securities | |
| Grandeur Peak Emerging Markets Opportunities Fund | | $ | 172,728,334 | | | $ | 182,442,719 | |
| Grandeur Peak Global Contrarian Fund | | | 39,768,491 | | | | 11,429,299 | |
| Grandeur Peak Global Micro Cap Fund | | | 26,529,378 | | | | 16,552,346 | |
| Grandeur Peak Global Opportunities Fund | | | 365,753,616 | | | | 370,512,393 | |
| Grandeur Peak Global Reach Fund | | | 122,937,328 | | | | 153,200,491 | |
| Grandeur Peak Global Stalwarts Fund | | | 161,498,988 | | | | 139,818,851 | |
| Grandeur Peak International Opportunities Fund | | | 290,263,968 | | | | 261,523,409 | |
| Grandeur Peak International Stalwarts Fund | | | 856,614,226 | | | | 478,791,827 | |
| Grandeur Peak US Stalwarts Fund | | | 105,243,527 | | | | 10,821,160 | |
5. SHARES OF BENEFICIAL INTEREST
The capitalization of the Trust consists of an unlimited number of shares of beneficial interest with no par value per share. Holders of the shares of the Funds of the Trust have one vote for each share held and a proportionate fraction of a vote for each fractional share. All shares issued and outstanding are fully paid and are transferable and redeemable at the option of the shareholder. Purchasers of the share do not have any obligation to make payments to the Trust or its creditors solely by reason of the purchasers’ ownership of the shares. Shares have no pre-emptive rights.
Shares redeemed within 60 days of purchase may incur a 2% short-term redemption fee deducted from the redemption amount. For the year ended April 30, 2021 and the year ended April 30, 2020, the redemption fees charged by the Funds are presented in the Statements of Changes in Net Assets.
| 110 | 1.855.377.7325 | www.GrandeurPeakGlobal.com |
| Grandeur Peak Funds® | Notes to Financial Statements |
April 30, 2021
6. MANAGEMENT AND RELATED-PARTY TRANSACTIONS
The Adviser, subject to the authority of the Board, is responsible for the overall management and administration of the Funds’ business affairs. The Adviser manages the investments of the Funds in accordance with the Funds’ investment objective, policies and limitations and investment guidelines established jointly by the Adviser and the Trustees. Pursuant to the Advisory Agreement, (the “Advisory Agreement”), each Fund pays the Adviser an annual management fee based on each Fund’s average daily net assets. The management fee is paid on a monthly basis. The following table reflects the Funds’ advisory fee rates.
| Fund | Advisory Fee |
| Grandeur Peak Emerging Markets Opportunities Fund | 1.35% |
| Grandeur Peak Global Contrarian Fund | 1.00% |
| Grandeur Peak Global Opportunities Fund | 1.25% |
| Grandeur Peak Global Micro Cap Fund | 1.50% |
| Grandeur Peak Global Reach Fund | 1.10% |
| Grandeur Peak Global Stalwarts Fund | 0.80% |
| Grandeur Peak International Opportunities Fund | 1.25% |
| Grandeur Peak International Stalwarts Fund | 0.80% |
| Grandeur Peak US Stalwarts Fund | 0.75% |
The Adviser has contractually agreed to limit certain of each Fund’s expenses (excluding acquired fund fees and expenses, brokerage expenses, interest expenses, taxes and extraordinary expenses). The following table reflects the Funds’ expense cap.
| Fund | Expense Cap | Term of Expense Limit Agreements |
Grandeur Peak Emerging Markets Opportunities Fund | | September 1, 2020 – August 31, 2021 / September 1, 2019 – August 31, 2020 |
| Investor Class | 1.95% | |
| Institutional Class | 1.70% | |
Grandeur Peak Global Contrarian Fund | | September 12, 2019 – August 31, 2021 |
| Institutional Class | 1.35% | |
Grandeur Peak Global Micro Cap Fund | | September 1, 2020 – August 31, 2021 / September 1, 2019 – August 31, 2020 |
| Institutional Class | 2.00% | |
Grandeur Peak Global Opportunities Fund | | September 1, 2020 – August 31, 2021 / September 1, 2019 – August 31, 2020 |
| Investor Class | 1.75% | |
| Institutional Class | 1.50% | |
| Grandeur Peak Global Reach Fund | | September 1, 2020 – August 31, 2021 / September 1, 2019 – August 31, 2020 |
| Investor Class | 1.60% | |
| Institutional Class | 1.35% | |
| Grandeur Peak Global Stalwarts Fund | | September 1, 2020 – August 31, 2021 / September 1, 2019 – August 31, 2020 |
| Investor Class | 1.35% | |
| Institutional Class | 1.10% | |
Grandeur Peak International Opportunities Fund | | September 1, 2020 – August 31, 2021 / September 1, 2019 – August 31, 2020 |
| Investor Class | 1.75% | |
| Institutional Class | 1.50% | |
Grandeur Peak International Stalwarts Fund | | September 1, 2020 – August 31, 2021 / September 1, 2019 – August 31, 2020 |
| Investor Class | 1.35% | |
| Institutional Class | 1.10% | |
| Grandeur Peak US Stalwarts Fund | | December 23, 2019 - August 31, 2021 |
| Institutional Class | 1.00% | |
| Annual Report | April 30, 2021 | 111 |
| Grandeur Peak Funds® | Notes to Financial Statements |
April 30, 2021
Pursuant to these agreements, each Fund will reimburse the Adviser for any previous fee waivers and expense reimbursements made by the Adviser, provided that any such reimbursements made by the Funds to the Adviser will not cause the Funds’ expense limitation to exceed expense limitations in existence at the time the expense was incurred, or at the time of the reimbursement, whichever is lower, and the reimbursement is made within three years after the expenses were incurred. Fees waived/reimbursed by the Adviser for the year ended April 30, 2021 are disclosed in the Statements of Operations.
In addition to the foregoing contractual arrangements, the Adviser has voluntarily agreed, effective September 1, 2020, to waive, with respect to the Grandeur Peak Global Opportunities Fund and the Grandeur Peak International Opportunities Fund, annual management fees to the extent such fees exceed 1.00% on assets above $500 million (the annual management fee rate with respect to such funds will remain 1.25% on the first $500 million in assets). Previously, the Adviser had voluntarily agreed, effective September 1, 2016, to waive, with respect to the Grandeur Peak Global Opportunities Fund and the Grandeur Peak International Opportunities Fund, annual management fees to the extent such fees exceed 1.10% on assets above $500 million (the annual management fee rate with respect to such funds will remain 1.25% on the first $500 million in assets). The Adviser has also voluntarily agreed, effective September 1, 2020, to waive, with respect to the Grandeur Peak Emerging Markets Opportunities Fund, annual management fees to the extent such fees exceed 1.00% on all assets above $400 million (the annual management fee rate with respect to the Fund will remain 1.35% on the first $400 million in assets). Previously, the Adviser had voluntarily agreed, effective January 1, 2018, to waive, with respect to the Grandeur Peak Emerging Markets Opportunities Fund, annual management fees to the extent such fees exceed 1.20% on all assets above $400 million (the annual management fee rate with respect to the Fund will remain 1.35% on the first $400 million in assets). These voluntary arrangements may be terminated at any time by the Adviser. Voluntary waivers are not subject to recoupment by the Adviser. Voluntary fees waived by the Adviser for the year ended April 30, 2021 are disclosed in the Statements of Operations.
For the year ended April 30, 2021, the fee waivers/reimbursements and/or recoupments, excluding voluntary waivers, were as follows:
| Fund | | Fees
Waived/Reimbursed
By Adviser | | | Recoupment of
Previously Waived
Fees By Adviser | |
| Grandeur Peak Emerging Markets Opportunities Fund | | | | | | |
| Investor Class | | $ | – | | | $ | – | |
| Institutional Class | | – | | | – | |
| Grandeur Peak Global Contrarian Fund | | | | | | |
| Institutional Class | | $ | 109,006 | | | $ | – | |
| Grandeur Peak Global Micro Cap Fund | | | | | | | | |
| Institutional Class | | $ | 7,343 | | | $ | 34,610 | |
| Grandeur Peak Global Opportunities Fund | | | | | | | | |
| Investor Class | | $ | – | | | $ | – | |
| Institutional Class | | | – | | | | – | |
| Grandeur Peak Global Reach Fund | | | | | | | | |
| Investor Class | | $ | – | | | $ | – | |
| Institutional Class | | | – | | | | – | |
| Grandeur Peak Global Stalwarts Fund | | | | | | | | |
| Investor Class | | $ | – | | | $ | – | |
| Institutional Class | | | – | | | | – | |
| Grandeur Peak International Opportunities Fund | | | | | | | | |
| Investor Class | | $ | – | | | $ | – | |
| Institutional Class | | | – | | | | – | |
| Grandeur Peak International Stalwarts Fund | | | | | | | | |
| Investor Class | | $ | – | | | $ | – | |
| Institutional Class | | | – | | | | – | |
| Grandeur Peak US Stalwarts Fund | | | | | | | | |
| Institutional Class | | $ | 49,676 | | | $ | – | |
| 112 | 1.855.377.7325 | www.GrandeurPeakGlobal.com |
| Grandeur Peak Funds® | Notes to Financial Statements |
April 30, 2021
As of April 30, 2021, the balances of recoupable expenses for each Fund were as follows:
| Fund | | Expires 2022 | | | Expires 2023 | | | Expires 2024 | | | Total | |
| Grandeur Peak Emerging Markets Opportunities Fund | | | | | | | | | | | | |
| Investor Class | | $ | – | | | $ | – | | | $ | – | | | $ | – | |
| Institutional Class | | – | | | – | | | – | | | – | |
| Grandeur Peak Global Contrarian Fund | | | | | | | | | | | | |
| Institutional Class | | $ | – | | | $ | 139,213 | | | $ | 109,006 | | | $ | 248,219 | |
| Grandeur Peak Global Micro Cap Fund | | | | | | | | | | | | | | | | |
| Institutional Class | | $ | – | | | $ | 14,526 | | | $ | 7,343 | | | $ | 21,869 | |
| Grandeur Peak Global Opportunities Fund | | | | | | | | | | | | | | | | |
| Investor Class | | $ | – | | | $ | – | | | $ | – | | | $ | – | |
| Institutional Class | | | – | | | | – | | | | – | | | | – | |
| Grandeur Peak Global Reach Fund | | | | | | | | | | | | | | | | |
| Investor Class | | $ | – | | | $ | – | | | $ | – | | | $ | – | |
| Institutional Class | | | – | | | | – | | | | – | | | | – | |
| Grandeur Peak Global Stalwarts Fund | | | | | | | | | | | | | | | | |
| Investor Class | | $ | – | | | $ | – | | | $ | – | | | $ | – | |
| Institutional Class | | | – | | | | – | | | | – | | | | – | |
| Grandeur Peak International Opportunities Fund | | | | | | | | | | | | | | | | |
| Investor Class | | $ | – | | | $ | – | | | $ | – | | | $ | – | |
| Institutional Class | | | – | | | | – | | | | – | | | | – | |
| Grandeur Peak International Stalwarts Fund | | | | | | | | | | | | | | | | |
| Investor Class | | $ | – | | | $ | – | | | $ | – | | | $ | – | |
| Institutional Class | | | – | | | | – | | | | – | | | | – | |
| Grandeur Peak US Stalwarts Fund | | | | | | | | | | | | | | | | |
| Institutional Class | | $ | – | | | $ | 33,383 | | | $ | 49,676 | | | $ | 83,059 | |
Administrator Fees and Expenses: ALPS Fund Services, Inc. (“ALPS”) serves as administrator to the Funds and the Funds have agreed to pay expenses incurred in connection with their administrative activities. Pursuant to an Administration Agreement, ALPS provides operational services to the Funds including, but not limited to, fund accounting and fund administration and generally assists in the Funds’ operations. Officers of the Trust are employees of ALPS. The Funds’ administration fee is accrued on a daily basis and paid monthly. Administration fees paid by the Funds for the year ended April 30, 2021 are disclosed in the Statements of Operations.
ALPS is reimbursed by the Funds for certain out-of-pocket expenses.
Transfer Agent: ALPS serves as transfer, dividend paying and shareholder servicing agent for the Funds. ALPS receives an annual minimum fee, a fee based upon the number of shareholder accounts, and is also reimbursed by the Funds for certain out-of-pocket expenses. Transfer agent fees paid by the Funds for the year ended April 30, 2021 are disclosed in the Statements of Operations.
Compliance Services: ALPS provides services that assist the Trust’s chief compliance officer in monitoring and testing the policies and procedures of the Trust in conjunction with requirements under Rule 38a-1 under the 1940 Act and receives an annual base fee. ALPS is reimbursed for certain out-of-pocket expenses by the Funds. Compliance service fees paid by the Funds for the year ended April 30, 2021 are disclosed in the Statements of Operations.
Principal Financial Officer: ALPS receives an annual fee for providing principal financial officer services to the Funds. Principal financial officer fees paid by the Fund for the year ended April 30, 2021 are disclosed in the Statements of Operations.
Trustees: The fees and expenses of the Trustees of the Board are presented in the Statements of Operations.
| Annual Report | April 30, 2021 | 113 |
| Grandeur Peak Funds® | Notes to Financial Statements |
April 30, 2021
Distributor: ALPS Distributors, Inc. (“ADI” or the “Distributor”) (an affiliate of ALPS) acts as the distributor of the Funds’ shares pursuant to a Distribution Agreement with the Trust. Shares are sold on a continuous basis by ADI as agent for the Funds, and ADI has agreed to use its best efforts to solicit orders for the sale of Funds’ shares, although it is not obliged to sell any particular amount of shares. ADI is not entitled to any compensation for its services as Distributor. ADI is registered as a broker-dealer with the U.S. Securities and Exchange Commission.
Each Fund has adopted a Distribution and Services (Rule 12b-1) Plan pursuant to Rule 12b-1 of the 1940 Act (the “Plan”) for its Investor Class shares. The Plan allows the Funds to use Investor Class assets to pay fees in connection with the distribution and marketing of Investor Class shares and/or the provision of shareholder services to Investor Class shareholders. The Plan permits payment for services in connection with the administration of plans or programs that use Investor Class shares of each Fund as their funding medium and for related expenses. The recipients of such payments may include the Distributor, other affiliates of the Adviser, broker-dealers, financial institutions, plan sponsors and administrators and other financial intermediaries through which investors may purchase shares of the Fund. The Plan permits the Funds to make total payments at an annual rate of up to 0.25% of each Fund’s average daily net assets attributable to its Investor Class shares. The expenses of the Plan are reflected as distribution and service fees in the Statements of Operations.
7. INDEMNIFICATIONS
Under the Trust’s organizational documents, its officers and Trustees are indemnified against certain liability arising out of the performance of their duties to the Trust. Additionally, in the normal course of business, the Trust enters into contracts with service providers that may contain general indemnification clauses, which may permit indemnification to the extent permissible under applicable law. The Trust’s maximum exposure under these arrangements is unknown, as this would involve future claims that may be made against the Trust that have not yet occurred.
| 114 | 1.855.377.7325 | www.GrandeurPeakGlobal.com |
Grandeur Peak Funds® | Report of Independent Registered
Public Accounting Firm |
To the shareholders and the Board of Trustees of Financial Investors Trust
Opinion on the Financial Statements and Financial Highlights
We have audited the accompanying statements of assets and liabilities of Grandeur Peak Emerging Markets Opportunities Fund, Grandeur Peak Global Contrarian Fund, Grandeur Peak Global Micro Cap Fund, Grandeur Peak Global Opportunities Fund, Grandeur Peak Global Reach Fund, Grandeur Peak Global Stalwarts Fund, Grandeur Peak International Opportunities Fund, Grandeur Peak International Stalwarts Fund, and Grandeur Peak US Stalwarts Fund (the “Funds”), nine of the funds constituting the Financial Investors Trust, including the portfolio of investments, as of April 30, 2021; the related statements of operations for the year then ended, the statements of changes in net assets for each of the two years in the period then ended, and the financial highlights for each of the five years in the period then ended for Grandeur Peak Emerging Markets Opportunities Fund, Grandeur Peak Global Opportunities Fund, Grandeur Peak Global Reach Fund, Grandeur Peak Global Micro Cap Fund, Grandeur Peak Global Stalwarts Fund, Grandeur Peak International Stalwarts Fund and Grandeur Peak International Opportunities Fund; the related statements of operations, changes in net assets, and the financial highlights for the periods indicated in the table below for Grandeur Peak Global Contrarian Fund and Grandeur Peak US Stalwarts Fund; and the related notes.
In our opinion, the financial statements and financial highlights present fairly, in all material respects, the financial position of each of the funds listed above constituting Financial Investors Trust as of April 30, 2021, and the results of their operations for the year then ended (or for the period listed in the table below), the changes in their net assets for each of the two years in the period then ended (or for the periods listed in the table below), and the financial highlights for each of the five years in the period then ended (or for the periods listed in the table below), in conformity with accounting principles generally accepted in the United States of America.
Individual Fund Comprising the
Financial Investors Trust | Statement of
Operations | Statements of Changes
in Net Assets | Financial Highlights |
| Grandeur Peak US Stalwarts Fund | For the year ended
April 30, 2021 | For the year ended April 30, 2021 and the period from March 20, 2020 (Commencement of operations) through April 30, 2020 | For the year ended April 30, 2021 and the period from March 20, 2020 (Commencement of operations) through April 30, 2020 |
| Grandeur Peak Global Contrarian Fund | For the year ended
April 30, 2021 | For the year ended April 30, 2021 and the period from September 18, 2019 (Commencement of operations) through April 30, 2020 | For the year ended April 30, 2021 and the period from September 18, 2019 (Commencement of operations) through April 30, 2020 |
Basis for Opinion
These financial statements and financial highlights are the responsibility of the Funds’ management. Our responsibility is to express an opinion on the Funds’ financial statements and financial highlights based on our audits. We are a public accounting firm registered with the Public Company Accounting Oversight Board (United States) (PCAOB) and are required to be independent with respect to the Funds in accordance with the U.S. federal securities laws and the applicable rules and regulations of the Securities and Exchange Commission and the PCAOB.
We conducted our audits in accordance with the standards of the PCAOB. Those standards require that we plan and perform the audit to obtain reasonable assurance about whether the financial statements and financial highlights are free of material misstatement, whether due to error or fraud. The Funds are not required to have, nor were we engaged to perform, an audit of their internal control over financial reporting. As part of our audits we are required to obtain an understanding of internal control over financial reporting but not for the purpose of expressing an opinion on the effectiveness of the Funds’ internal control over financial reporting. Accordingly, we express no such opinion.
Our audits included performing procedures to assess the risks of material misstatement of the financial statements and financial highlights, whether due to error or fraud, and performing procedures that respond to those risks. Such procedures included examining, on a test basis, evidence regarding the amounts and disclosures in the financial statements and financial highlights. Our audits also included evaluating the accounting principles used and significant estimates made by management, as well as evaluating the overall presentation of the financial statements and financial highlights. Our procedures included confirmation of securities owned as of April 30, 2021, by correspondence with the custodian and brokers; when replies were not received from brokers, we performed other auditing procedures. We believe that our audits provide a reasonable basis for our opinion.
DELOITTE & TOUCHE LLP
Denver, Colorado
June 28, 2021
We have served as the auditor of one or more investment companies advised by Grandeur Peak Global Advisors, LLC since 2012.
| Annual Report | April 30, 2021 | 115 |
| Grandeur Peak Funds® | Additional Information |
April 30, 2021 (Unaudited)
1. FUND HOLDINGS
The Funds file their complete schedule of portfolio holdings with the Securities and Exchange Commission (SEC) for the first and third quarters of each fiscal year as an exhibit to its reports on Form N-PORT. The Funds’ Form N-PORT reports are available on the SEC's Web site at http://www.sec.gov. The Funds’ Form N-PORT reports are also available upon request by calling 1-855-377-PEAK (7325).
2. FUND PROXY VOTING POLICIES, PROCEDURES AND SUMMARIES
The Funds’ policies and procedures used in determining how to vote proxies and information regarding how the Funds voted proxies relating to portfolio securities during the most recent prior 12-month period ending June 30 are available without charge, (1) upon request, by calling 1-855-377-PEAK (7325) and (2) on the SEC’s website at http://www.sec.gov.
3. TAX DESIGNATIONS
The Funds designate the following amounts for federal income tax purposes for the fiscal year ended April 30, 2021:
| | | Foreign Taxes Paid | | | Foreign Source Income | |
| Grandeur Peak Global Opportunities Fund | | $ | 2,077,264 | | | $ | 8,524,777 | |
| Grandeur Peak International Opportunities Fund | | | 1,592,105 | | | | 9,885,843 | |
| Grandeur Peak Global Reach Fund | | | 641,098 | | | | 3,105,498 | |
| Grandeur Peak Emerging Markets Opportunities Fund | | | 1,125,997 | | | | 7,086,930 | |
| Grandeur Peak Global Micro Cap Fund | | | 129,664 | | | | 620,587 | |
| Grandeur Peak Global Stalwarts Fund | | | 599,739 | | | | 2,151,782 | |
| Grandeur Peak International Stalwarts Fund | | | 3,457,339 | | | | 17,485,205 | |
| Grandeur Peak Global Contrarian Fund | | | 44,836 | | | | 552,601 | |
| Grandeur Peak US Stalwarts Fund | | | – | | | | – | |
Of the distributions paid by the Funds from ordinary income for the calendar year ended December 31, 2020, the following percentages met the requirements to be treated as qualifying for the corporate dividends received deduction and qualified dividend income:
| | | Dividend Received Deduction | | | Qualified Dividend Income | |
| Grandeur Peak Global Opportunities Fund | | | 20.29 | % | | | 75.13 | % |
| Grandeur Peak International Opportunities Fund | | | 0.00 | % | | | 100.00 | % |
| Grandeur Peak Global Reach Fund | | | 33.13 | % | | | 100.00 | % |
| Grandeur Peak Emerging Markets Opportunities Fund | | | 6.20 | % | | | 100.00 | % |
| Grandeur Peak Global Micro Cap Fund | | | 9.37 | % | | | 49.10 | % |
| Grandeur Peak Global Stalwarts Fund | | | 45.44 | % | | | 100.00 | % |
| Grandeur Peak International Stalwarts Fund | | | 8.09 | % | | | 100.00 | % |
| Grandeur Peak Global Contrarian Fund | | | 13.82 | % | | | 44.93 | % |
| Grandeur Peak US Stalwarts Fund | | | 43.29 | % | | | 43.89 | % |
In early 2021, if applicable, shareholders of record received this information for the distributions paid to them by the Funds during the calendar year 2020 via Form 1099. The Funds will notify shareholders in early 2022 of amounts paid to them by the Funds, if any, during the calendar year 2021.
Pursuant to Section 852(b)(3) of the Internal Revenue Code, the Funds designate the following as long-term capital gain dividends:
| Grandeur Peak Global Opportunities Fund | | $ | 56,202,500 | |
| Grandeur Peak International Opportunities Fund | | | 25,974,822 | |
| Grandeur Peak Global Reach Fund | | | 23,014,944 | |
| Grandeur Peak Emerging Markets Opportunities Fund | | | 588,486 | |
| Grandeur Peak Global Micro Cap Fund | | | 3,187,700 | |
| Grandeur Peak Global Stalwarts Fund | | | 8,533,427 | |
| Grandeur Peak International Stalwarts Fund | | | 3,581,302 | |
| Grandeur Peak Global Contrarian Fund | | | – | |
| Grandeur Peak US Stalwarts Fund | | | 401 | |
| 116 | 1.855.377.7325 | www.GrandeurPeakGlobal.com |
| Grandeur Peak Funds® | Additional Information |
April 30, 2021 (Unaudited)
For the fiscal year ended April 30, 2021, the following long term amounts were utilized as earnings and profits distributed to shareholders on redemptions:
| Grandeur Peak Global Opportunities Fund | | $ | 5,633,724 | |
| Grandeur Peak International Opportunities Fund | | | 3,320,219 | |
| Grandeur Peak Global Reach Fund | | | 2,252,725 | |
| Grandeur Peak Emerging Markets Opportunities Fund | | | 817,750 | |
| Grandeur Peak Global Micro Cap Fund | | | 76,337 | |
| Grandeur Peak Global Stalwarts Fund | | | 2,535,564 | |
| Grandeur Peak International Stalwarts Fund | | | 3,423,631 | |
| Grandeur Peak Global Contrarian Fund | | | 16,451 | |
| Grandeur Peak US Stalwarts Fund | | | 55,638 | |
| Annual Report | April 30, 2021 | 117 |
| Grandeur Peak Funds® | Liquidity Risk Management Program |
April 30, 2021 (Unaudited)
The Financial Investors Trust (the “Trust”) has established a liquidity risk management program (the “Program”) to govern the Trust’s approach to managing liquidity risk for each fund in the Trust (each a “Fund”). The Program is overseen by the Liquidity Committee (the “Committee”), a committee comprised of representatives of the Trust’s investment advisers, sub‐advisers, and Officers of the Trust. The Trust’s Board of Trustees (the “Board”) has approved the designation of the Committee to oversee the Program.
The Program’s principal objectives include supporting each Fund’s compliance with limits on investments in illiquid assets and mitigating the risk that a Fund will be unable to meet its redemption obligations in a timely manner. The Program also includes a number of elements that support the management and assessment of liquidity risk, including a periodic assessment of factors that influence a Fund’s liquidity and the periodic classification and re‐classification of the Fund’s investments into groupings that reflect the Committee’s assessment of their relative liquidity under current market conditions.
At a meeting of the Board held on March 10, 2021, the Trustees received a report from the Committee regarding the design and operational effectiveness of the Program during 2020. The Committee determined, and reported to the Board, that the Program is reasonably designed to assess and manage each Fund’s liquidity risk and has operated adequately and effectively to manage each Fund’s liquidity risk since implementation.
The Committee reported that during the period covered by the report, there were no liquidity events that impacted the Funds or their ability to timely meet redemptions without dilution to existing shareholders. Among other things, the Board noted that the Funds are not required to have a highly liquid investment minimum based on their liquidity classifications. The Board further noted that no material changes have been made to the Program since its implementation.
| 118 | 1.855.377.7325 | www.GrandeurPeakGlobal.com |
| Grandeur Peak Funds® | Trustees and Officers |
April 30, 2021 (Unaudited)
Additional information regarding the Fund’s trustees is included in the Statement of Additional Information, which can be obtained without charge by calling 1-855-377-PEAK (7325).
| INDEPENDENT TRUSTEES | | |
Name,
Address*
& Year
of Birth | Position(s)
Held with
Fund | Term of Office**
and Length of
Time Served | Principal Occupation(s)
During Past 5 Years*** | Number of
Funds in
Fund
Complex
Overseen
by Trustee**** | Other Directorships Held
by Trustee During
Past 5 Years*** |
Mary K. Anstine,
1940 | Trustee and Chairman | Ms. Anstine was elected at a special meeting of shareholders held on March 21, 1997 and re-elected at a special meeting of shareholders held on August 7, 2009. Ms. Anstine was appointed Chairman of the Board at the June 6, 2017 meeting of the Board of Trustees. | Ms. Anstine is Trustee/Director of AV Hunter Trust and Colorado Uplift Board. | 31 | Ms. Anstine is a Trustee of ALPS ETF Trust (17 funds); ALPS Variable Investment Trust (7 funds); Reaves Utility Income Fund (1 fund); and Segall Bryant & Hamill Trust through December 2020 (as of December 31, 2020 14 funds). |
Jeremy W. Deems,
1976 | Trustee | Mr. Deems was appointed as a Trustee at the March 11, 2008 meeting of the Board of Trustees and elected at a special meeting of shareholders held on August 7, 2009. | Mr. Deems is the Co-Founder and Chief Financial Officer of Green Alpha Advisors, LLC, a registered investment advisor, and Co-Portfolio Manager of the Shelton Green Alpha Fund. | 31 | Mr. Deems is a Trustee of ALPS ETF Trust (17 funds); ALPS Variable Investment Trust (7 funds); Clough Funds Trust (1 fund); and Reaves Utility Income Fund (1 fund). |
Jerry G. Rutledge,
1944 | Trustee | Mr. Rutledge was elected at a special meeting of shareholders held on August 7, 2009. | Mr. Rutledge is the President and owner of Rutledge’s Inc., a retail clothing business. | 31 | Mr. Rutledge is a Trustee of Clough Global Dividend and Income Fund (1 fund); Clough Global Equity Fund (1 fund); Clough Global Opportunities Fund (1 fund); and Principal Real Estate Income Fund (1 fund). |
| Annual Report | April 30, 2021 | 119 |
| Grandeur Peak Funds® | | Trustees and Officers |
April 30, 2021 (Unaudited)
| INDEPENDENT TRUSTEES |
Name,
Address*
& Year
of Birth | Position(s)
Held with
Fund | Term of Office**
and Length of
Time Served | Principal Occupation(s)
During Past 5 Years*** | Number of
Funds in
Fund
Complex
Overseen
by Trustee**** | Other Directorships Held
by Trustee During
Past 5 Years*** |
Michael “Ross” Shell,
1970 | Trustee | Mr. Shell was elected at a special meeting of shareholders held on August 7, 2009. | Mr. Shell is Founder and CEO of Red Idea, LLC, a strategic consulting/early stage venture firm (since June 2008). Mr. Shell serves on the Board of Directors of TalkBox, a phone/privacy booth company (since 2018) and DLVR, a package security company (since 2018). Mr. Shell served on the Advisory Board, St. Vrain School District Innovation Center (from 2015- 2018). Mr. Shell graduated with honors from Stanford University with a degree in Political Science. | 31 | None. |
INTERESTED TRUSTEE |
Name,
Address*
& Year
of Birth | Position(s)
Held with
Fund | Term of Office**
and Length of
Time Served | Principal Occupation(s)
During Past 5 Years*** | Number of
Funds in
Fund
Complex
Overseen by
Trustee**** | Other Directorships Held
by Trustee During
Past 5 Years*** |
Edmund J. Burke,
1961 | Trustee | Mr. Burke was elected as Trustee at a special meeting of shareholders held on August 7, 2009. | Mr. Burke joined ALPS in 1991 and served as the President and Director of ALPS Holdings, Inc., and ALPS Advisors, Inc., and Director of ALPS Distributors, Inc., ALPS Fund Services, Inc. (“ALPS”), and ALPS Portfolio Solutions Distributor, Inc. (collectively, the “ALPS Companies”). Mr. Burke retired from the ALPS Companies in June 2019. Mr. Burke is currently a partner at ETF Action, a web-based system that provides data and analytics to registered investment advisers, (since 2020) and a Director of Alliance Bioenergy Plus, Inc., echnology company focused on emerging technologies in the renewable energy, biofuels, and bioplastics technology sectors (since 2020). Mr. Burke is deemed an interested Trustee by virtue of his prior positions with the ALPS Companies. | 31 | Mr. Burke is a Trustee of ALPS ETF Trust (17 funds); Clough Global Dividend and Income Fund (1 fund); Clough Global Equity Fund (1 fund); Clough Global Opportunities Fund (1 fund); Clough Funds Trust (1 fund); Liberty All-Star Equity Fund (1 fund); and Director of the Liberty All-Star Growth Fund, Inc. (1 fund). |
| 120 | 1.855.377.7325 | www.GrandeurPeakGlobal.com |
| Grandeur Peak Funds® | | Trustees and Officers |
April 30, 2021 (Unaudited)
| OFFICERS |
Name, Address*
& Year of Birth | Position(s) Held
with Fund | Term of Office** and
Length of Time Served | Principal Occupation(s)
During Past 5 Years*** |
Bradley J. Swenson,
1972***** | President | Mr. Swenson was appointed President of the Trust at the June 11, 2019 meeting of the Board of Trustees. | Mr. Swenson joined ALPS in 2004 and has served as its President since June 2019. In this role, he serves as an officer to certain other closed-end and open-end investment companies. He previously served as the Chief Operating Officer of ALPS (2015-2019). Mr. Swenson also previously served as Chief Compliance Officer to ALPS, its affiliated entities, and to certain ETF, closed-end and open-end investment companies (2004-2015). Because of his position with ALPS, Mr. Swenson is deemed an affiliate of the Trust as defined under the 1940 Act. |
Dawn Cotten,
1977 | President | Ms. Cotten was appointed President of the Trust at the June 8-9, 2021 meeting of the Trustees. | Ms. Cotten joined ALPS in 2009 and is currently Senior Vice President of Fund Administration and Relationship Management of ALPS. She has served in that role since January 2020. Prior to that, Ms. Cotten served as Senior Vice President of Relationship Management (2017-2020). Ms. Cotten served as a VP in Relationship Management from 2013-2017. Ms. Cotten also serves as President of ALPS Series Trust, Clough Funds Trust, Clough Global Dividend and Income Fund, and Clough Global Equity Fund and Clough Global Opportunities Fund. |
Jennell Panella,
1974 | Treasurer | Ms. Panella was appointed Treasurer of the Trust at the September 15, 2020 meeting of the Board of Trustees. | Ms. Panella joined ALPS in June 2012 and is currently Vice President and Fund Controller of ALPS Fund Services, Inc. Prior to joining ALPS, Ms. Panella served as Financial Reporting Manager for Parker Global Strategies, LLC (2009-2012). Because of her position with ALPS, Ms. Panella is deemed an affiliate of the Trust as defined under the 1940 Act. Ms. Panella also serves as Assistant Treasurer of James Advantage Funds. |
Karen S. Gilomen,
1970***** | Secretary | Ms. Gilomen was appointed Secretary of the Trust at the December 13, 2016 meeting of the Board of Trustees. | Ms. Gilomen joined ALPS in August 2016 as Vice President and Senior Counsel. Prior to joining ALPS, Ms. Gilomen was Vice President - General Counsel & CCO of Monticello Associates, Inc. from 2010 to 2016. Because of her position with ALPS, Ms. Gilomen is deemed an affiliate of the Trust, as defined under the 1940 Act. Ms. Gilomen is also the Secretary of ALPS Variable Investment Trust and Reaves Utility Income Fund, and the Assistant Secretary of the WesMark Funds. |
Cara Owen,
1981 | Secretary | Ms. Owen was appointed Secretary of the Trust at the June 8-9, 2021 meeting of the Trustees. | Vice President and Principal Legal Counsel, ALPS Fund Services, Inc. Prior to joining ALPS, Ms. Owen was Senior Counsel, Corporate & Investments, Great-West Life & Annuity Insurance Company; Senior Counsel & Assistant Secretary, Great-West Funds, Inc., Great-West Capital Management, LLC, Great-West Trust Company, LLC, and Advised Assets Group, LLC (2014-2019). Ms. Owen also serves as Secretary of ALPS ETF Trust, Vice President and Secretary of Boulder Growth & Income Fund, and Assistant Secretary of James Advantage Funds. |
Ted Uhl,
1974 | Chief Compliance Officer (“CCO”) | Mr. Uhl was appointed CCO of the Trust at the June 8, 2010 meeting of the Board of Trustees. | Mr. Uhl joined ALPS in October 2006, and is currently Deputy Compliance Officer of ALPS. Prior to his current role, Mr. Uhl served as Senior Risk Manager for ALPS from October 2006 until June 2010. Before joining ALPS, Mr. Uhl served a Sr. Analyst with Enenbach and Associates (RIA), and a Sr. Financial Analyst at Sprint. Because of his position with ALPS, Mr. Uhl is deemed an affiliate of the Trust as defined under the 1940 Act. Mr. Uhl is also CCO of the Boulder Growth & Income Fund, Inc., Centre Funds, Index Funds, Reality Shares ETF Trust, Reaves Utility Income Fund and XAI Octagon Floating Rate & Alternative Income Term Trust. |
| Annual Report | April 30, 2021 | 121 |
| Grandeur Peak Funds® | Trustees and Officers |
April 30, 2021 (Unaudited)
| OFFICERS |
Name, Address* & Year of Birth | Position(s) Held with Fund | Term of Office** and Length of Time Served | Principal Occupation(s) During Past 5 Years*** |
Jennifer Craig, 1973 | Assistant Secretary | Ms. Craig was appointed Assistant Secretary of the Trust at the June 8, 2016 meeting of the Board of Trustees. | Ms. Craig joined ALPS in 2007 and is currently Assistant Vice President and Paralegal Manager of ALPS. Because of her position with ALPS, Ms. Craig is deemed an affiliate of the Trust as defined under the 1940 Act. Ms. Craig is also Secretary of Principal Real Estate Income Fund, Assistant Secretary of ALPS ETF Trust, Clough Global Dividend and Income Fund, Clough Global Equity Fund, Clough Global Opportunities Fund, Liberty All-Star Equity Fund and Liberty All-Star Growth Fund, Inc. and Clerk of Goehring & Rozencwajg Investment Funds. |
| * | All communications to Trustees and Officers may be directed to Financial Investors Trust c/o 1290 Broadway, Suite 1000, Denver, CO 80203. |
| ** | This is the period for which the Trustee or Officer began serving the Trust. Each Trustee serves an indefinite term, until such Trustees successor is elected and appointed, or such Trustee resigns or is deceased. Officers are elected on an annual basis. |
| *** | Except as otherwise indicated, each individual has held the office shown or other offices in the same company for the last five years. |
| **** | The Fund Complex includes all series of the Trust, currently 31, and any other investment companies for which any Trustee serves as trustee for and for which Grandeur Peak Global Advisors, LLC provides investment advisory services (currently none). |
| ***** | Mr. Swenson resigned his position as President of the Trust effective June 9, 2021 and Ms. Gilomen resigned her position as Secretary of the Trust effective June 4, 2021. |
| 122 | 1.855.377.7325 | www.GrandeurPeakGlobal.com |
| Grandeur Peak Funds® | Privacy Policy |
April 30, 2021 (Unaudited)
| Who We Are | |
| Who is providing this notice? | Grandeur Peak Global Opportunities Fund, Grandeur Peak International Opportunities Fund, Grandeur Peak Global Reach Fund, Grandeur Peak Emerging Markets Opportunities Fund, Grandeur Peak Global Micro Cap Fund, Grandeur Peak Global Stalwarts Fund, and Grandeur Peak International Stalwarts Fund. |
| What We Do | |
| How do the Funds protect my personal information? | To protect your personal information from unauthorized access and use, we use security measures that comply with federal law. These measures include computer safeguards and secured files and buildings. |
| How do the Funds collect my personal information? | We collect your personal information, for example, when you ● open an account ● provide account information or give us your contact information ● make a wire transfer or deposit money |
| Why can't I limit all sharing? | Federal law gives you the right to limit only ● sharing for affiliates’ everyday business purposes-information about your creditworthiness ● affiliates from using your information to market to you ● sharing for non-affiliates to market to you State laws and individual companies may give you additional rights to limit sharing. |
| Definitions | |
| Affiliates | Companies related by common ownership or control. They can be financial and nonfinancial companies. |
| Non-affiliates | Companies not related by common ownership or control. They can be financial and nonfinancial companies. ● The Funds does not share with non-affiliates so they can market to you. |
| Joint marketing | A formal agreement between non-affiliated financial companies that together market financial products or services to you. ● The Funds does not jointly market. |
| Other Important Information | |
| California Residents | If your account has a California home address, your personal information will not be disclosed to nonaffiliated third parties except as permitted by applicable California law, and we will limit sharing such personal information with our affiliates to comply with California privacy laws that apply to us. |
| Vermont Residents | The State of Vermont requires financial institutions to obtain your consent prior to sharing personal information that they collect about you with affiliated companies and nonaffiliated third parties other than in certain limited circumstances. Except as permitted by law, we will not share personal information we collect about you with nonaffiliated third parties or other affiliated companies unless you provide us with your written consent to share such information. |
| Annual Report | April 30, 2021 | 123 |
| Grandeur Peak Funds® | Privacy Policy |
April 30, 2021 (Unaudited)
| FACTS | WHAT DO THE FUNDS DO WITH YOUR PERSONAL INFORMATION? |
| Why? | Financial companies choose how they share your personal information. Federal law gives consumers the right to limit some but not all sharing. Federal law also requires us to tell you how we collect, share, and protect your personal information. Please read this notice carefully to understand what we do. |
| What? | The types of personal information we collect and share depend on the product or service you have with us. This information can include: ● Social Security number and account transactions ● Account balances and transaction history ● Wire transfer instructions |
| How? | All financial companies need to share customers’ personal information to run their everyday business. In the section below, we list the reasons financial companies can share their customers’ personal information; the reasons the Funds choose to share; and whether you can limit this sharing. |
| Reasons we can share your personal information | Do the Funds share: | Can you limit this sharing? |
| For our everyday business purposes — such as to process your transactions, maintain your account(s), respond to court orders and legal investigations, or report to credit bureaus | Yes | No |
| For our marketing purposes — to offer our products and services to you | No | We do not share. |
| For joint marketing with other financial companies | No | We do not share. |
| For our affiliates’ everyday business purposes — information about your transactions and experiences | Yes | No |
| For our affiliates’ everyday business purposes — information about your creditworthiness | No | We do not share. |
| For nonaffiliates to market to you | No | We do not share. |
| 124 | 1.855.377.7325 | www.GrandeurPeakGlobal.com |
Item 13. Exhibits.
| (a)(3) | Not applicable to the Registrant. |
| (a)(4) | Not applicable to the Registrant. |
SIGNATURES
Pursuant to the requirements of the Securities Exchange Act of 1934 and the Investment Company Act of 1940, the Registrant has duly caused this report to be signed on its behalf by the undersigned, thereunto duly authorized.
FINANCIAL INVESTORS TRUST
| By: | /s/ Dawn Cotten | |
| | Dawn Cotten (Principal Executive Officer) | |
| | President | |
| | | |
| Date: | July 9, 2021 | |
Pursuant to the requirements of the Securities Exchange Act of 1934 and the Investment Company Act of 1940, this report has been signed below by the following persons on behalf of the Registrant and in the capacities and on the dates indicated.
FINANCIAL INVESTORS TRUST
| By: | /s/ Dawn Cotten | |
| | Dawn Cotten (Principal Executive Officer) | |
| | President | |
| | | |
| Date: | July 9, 2021 | |
| | | |
| By: | /s/ Jennell Panella | |
| | Jennell Panella (Principal Financial Officer) | |
| | Treasurer | |
| | | |
| Date: | July 9, 2021 | |