UNITED STATES
SECURITIES AND EXCHANGE COMMISSION
Washington, D.C. 20549
FORM N-CSR
CERTIFIED SHAREHOLDER REPORT OF REGISTERED
MANAGEMENT INVESTMENT COMPANIES
Investment Company Act file number: 811-08194
FINANCIAL INVESTORS TRUST
(Exact name of registrant as specified in charter)
1290 Broadway, Suite 1000, Denver, Colorado 80203
(Address of principal executive offices) (Zip code)
Brendan Hamill, Esq., Secretary
Financial Investors Trust
1290 Broadway, Suite 1000
Denver, Colorado 80203
(Name and address of agent for service)
Registrant’s telephone number, including area code: 303-623-2577
Date of fiscal year end: October 31
Date of reporting period: November 1, 2020 - October 31, 2021
Item 1. Reports to Stockholders.
| (a) | Report to Stockholders |
Table of Contents
| Disclosure of Fund Expenses | 1 |
| ALPS | CoreCommodity Management CompleteCommodities® Strategy Fund | |
| Management Commentary | 7 |
| Performance Update | 9 |
| Consolidated Statement of Investments | 11 |
| Consolidated Statement of Assets and Liabilities | 17 |
| Consolidated Statement of Operations | 18 |
| Consolidated Statements of Changes in Net Assets | 19 |
| Consolidated Financial Highlights | 20 |
| ALPS | Kotak India Growth Fund | |
| Management Commentary | 24 |
| Performance Update | 27 |
| Statement of Investments | 29 |
| Statement of Assets and Liabilities | 32 |
| Statement of Operations | 33 |
| Statements of Changes in Net Assets | 34 |
| Financial Highlights | 35 |
| ALPS | Smith Funds | |
| Management Commentary | 40 |
| Performance Update | 45 |
| Statements of Investments | 53 |
| Statements of Assets and Liabilities | 103 |
| Statements of Operations | 105 |
| Statement of Changes in Net Assets | 106 |
| Financial Highlights | 110 |
| ALPS | Red Rocks Global Opportunity Fund | |
| Management Commentary | 126 |
| Performance Update | 128 |
| Statement of Investments | 131 |
| Statement of Assets and Liabilities | 133 |
| Statement of Operations | 134 |
| Statements of Changes in Net Assets | 135 |
| Financial Highlights | 136 |
| Clough China Fund | |
| Management Commentary | 141 |
| Performance Update | 143 |
| Statement of Investments | 145 |
| Statement of Assets and Liabilities | 148 |
| Statement of Operations | 149 |
| Statements of Changes in Net Assets | 150 |
| Financial Highlights | 151 |
| RiverFront Global Allocation Series | |
| Management Commentary | 155 |
| Performance Update | 157 |
| Statements of Investments | 163 |
| Statements of Assets and Liabilities | 166 |
| Statements of Operations | 168 |
| Statements of Changes in Net Assets | 169 |
| Financial Highlights | 172 |
| Notes to Financial Statements | 186 |
| Report of Independent Registered Public Accounting Firm | 217 |
| Additional Information | 219 |
| Trustees and Officers | 232 |
| Privacy Policy | 236 |
As permitted by regulations adopted by the U.S. Securities and Exchange Commission, paper copies of the Funds' annual and semiannual shareholder reports will no longer be sent by mail, unless you specifically request paper copies of the reports from your financial intermediary (such as a broker-dealer or bank). Instead, the reports will be made available on the Funds' website (www.alpsfunds.com), and you will be notified by mail each time a report is posted and provided with a website link to access the report.
If you already elected to receive shareholder reports electronically, you will not be affected by this change and you need not take any action. You may elect to receive shareholder reports and other communications from a Fund electronically anytime by contacting your financial intermediary.
You may elect to receive all future reports in paper free of charge. You can contact your financial intermediary to request that you continue to receive paper copies of your shareholder reports. Your election to receive reports in paper will apply to all funds held in your account with your financial intermediary.
alpsfunds.com
| Disclosure of Fund Expenses | |
| | October 31, 2021 (Unaudited) |
Board Examples. As a shareholder of the Funds, you incur two types of costs: (1) transaction costs, including applicable sales charges (loads) and redemption fees; and (2) ongoing costs, including management fees, distribution and service (12b-1) fees, shareholder service fees and other Fund expenses. The following examples are intended to help you understand your ongoing costs (in dollars) of investing in the Funds and to compare these costs with the ongoing costs of investing in other mutual funds. The examples are based on an investment of $1,000 invested on May 1, 2021 and held until October 31, 2021.
Actual Expenses. The first line under each class in the table below provides information about actual account values and actual expenses. You may use the information in this line, together with the amount you invested, to estimate the expenses that you paid over the period. Simply divide your account value by $1,000 (for example, an $8,600 account value divided by $1,000 = 8.6), then multiply the result by the number in the first line under the heading “Expenses Paid During Period May 1, 2021 – October 31, 2021” to estimate the expenses you paid on your account during this period.
Hypothetical Example for Comparison Purposes. The second line under each class in the table below provides information about hypothetical account values and hypothetical expenses based on the Fund’s actual expense ratio and an assumed rate of return of 5% per year before expenses, which is not the Fund’s actual return. The hypothetical account values and expenses may not be used to estimate the actual ending account balance or expenses you paid for the period. You may use this information to compare the ongoing costs of investing in the Funds and other mutual funds. To do so, compare these 5% hypothetical examples with the 5% hypothetical examples that appear in the shareholder reports of the other funds.
Please note that the expenses shown in the table are meant to highlight your ongoing costs only and do not reflect any transactional costs, such as sales charges or redemption fees. Therefore, the second line under each class in the table below is useful in comparing ongoing costs only, and will not help you determine the relative total costs of owning different funds. In addition, if these transactional costs were included, your costs would have been higher.
| Disclosure of Fund Expenses | |
| | October 31, 2021 (Unaudited) |
| | Beginning Account Value
May 1, 2021 | Ending Account Value
October 31, 2021 | Expense
Ratio(a) | Expenses Paid
During Period
May 1, 2021 -
October 31, 2021(b) |
| ALPS | CoreCommodity Management CompleteCommodities® Strategy Fund(c) | | | |
| Investor Class | | | | |
| Actual | $ 1,000.00 | $ 1,137.70 | 1.35% | $ 7.27 |
| Hypothetical (5% return before expenses) | $ 1,000.00 | $ 1,018.40 | 1.35% | $ 6.87 |
| Class A | | | | |
| Actual | $ 1,000.00 | $ 1,140.10 | 1.29% | $ 6.96 |
| Hypothetical (5% return before expenses) | $ 1,000.00 | $ 1,018.70 | 1.29% | $ 6.56 |
| Class C | | | | |
| Actual | $ 1,000.00 | $ 1,136.00 | 2.00% | $ 10.77 |
| Hypothetical (5% return before expenses) | $ 1,000.00 | $ 1,015.12 | 2.00% | $ 10.16 |
| Class I | | | | |
| Actual | $ 1,000.00 | $ 1,139.80 | 1.09% | $ 5.88 |
| Hypothetical (5% return before expenses) | $ 1,000.00 | $ 1,019.71 | 1.09% | $ 5.55 |
| ALPS | Kotak India Growth Fund | | | | |
| Investor Class | | | | |
| Actual | $ 1,000.00 | $ 1,183.50 | -1.22% | $ -6.71 |
| Hypothetical (5% return before expenses) | $ 1,000.00 | $ 1,031.36 | -1.22% | $ -6.25 |
| Class A | | | | |
| Actual | $ 1,000.00 | $ 1,185.20 | -1.02% | $ -5.62 |
| Hypothetical (5% return before expenses) | $ 1,000.00 | $ 1,030.35 | -1.02% | $ -5.22 |
| Class C | | | | |
| Actual | $ 1,000.00 | $ 1,179.90 | -1.88% | $ -10.33 |
| Hypothetical (5% return before expenses) | $ 1,000.00 | $ 1,034.68 | -1.88% | $ -9.64 |
| Class I | | | | |
| Actual | $ 1,000.00 | $ 1,185.70 | -1.67% | $ -9.20 |
| Hypothetical (5% return before expenses) | $ 1,000.00 | $ 1,033.62 | -1.67% | $ -8.56 |
| Class II | | | | |
| Actual | $ 1,000.00 | $ 1,187.40 | -0.48% | $ -2.65 |
| Hypothetical (5% return before expenses) | $ 1,000.00 | $ 1,027.63 | -0.48% | $ -2.45 |
| Disclosure of Fund Expenses | |
| | October 31, 2021 (Unaudited) |
| | Beginning Account Value
May 1, 2021 | Ending Account Value
October 31, 2021 | Expense
Ratio(a) | Expenses Paid
During Period
May 1, 2021 -
October 31, 2021(b) |
| ALPS | Smith Short Duration Bond Fund | | | |
| Investor Class | | | | |
| Actual | $ 1,000.00 | $ 999.70 | 0.75% | $ 3.78 |
| Hypothetical (5% return before expenses) | $ 1,000.00 | $ 1,021.42 | 0.75% | $ 3.82 |
| Class A | | | | |
| Actual | $ 1,000.00 | $ 999.70 | 0.75% | $ 3.78 |
| Hypothetical (5% return before expenses) | $ 1,000.00 | $ 1,021.42 | 0.75% | $ 3.82 |
| Class C | | | | |
| Actual | $ 1,000.00 | $ 995.40 | 1.49% | $ 7.49 |
| Hypothetical (5% return before expenses) | $ 1,000.00 | $ 1,017.69 | 1.49% | $ 7.58 |
| Class I | | | | |
| Actual | $ 1,000.00 | $ 1,001.00 | 0.49% | $ 2.47 |
| Hypothetical (5% return before expenses) | $ 1,000.00 | $ 1,022.74 | 0.49% | $ 2.50 |
| ALPS | Smith Total Return Bond Fund | | | | |
| Investor Class | | | | |
| Actual | $ 1,000.00 | $ 1,010.20 | 0.94% | $ 4.76 |
| Hypothetical (5% return before expenses) | $ 1,000.00 | $ 1,020.47 | 0.94% | $ 4.79 |
| Class A | | | | |
| Actual | $ 1,000.00 | $ 1,010.30 | 0.93% | $ 4.71 |
| Hypothetical (5% return before expenses) | $ 1,000.00 | $ 1,020.52 | 0.93% | $ 4.74 |
| Class C | | | | |
| Actual | $ 1,000.00 | $ 1,006.60 | 1.65% | $ 8.35 |
| Hypothetical (5% return before expenses) | $ 1,000.00 | $ 1,016.89 | 1.65% | $ 8.39 |
| Class I | | | | |
| Actual | $ 1,000.00 | $ 1,010.70 | 0.65% | $ 3.29 |
| Hypothetical (5% return before expenses) | $ 1,000.00 | $ 1,021.93 | 0.65% | $ 3.31 |
| Disclosure of Fund Expenses | |
| | October 31, 2021 (Unaudited) |
| | Beginning Account Value
May 1, 2021 | Ending Account Value
October 31, 2021 | Expense
Ratio(a) | Expenses Paid
During Period
September 16, 2020 - October 31, 2021(b) |
| ALPS | Smith Credit Opportunities Fund | | | |
| Investor Class | | | | |
| Actual | $ 1,000.00 | $ 1,018.20 | 1.18% | $ 6.00 |
| Hypothetical (5% return before expenses) | $ 1,000.00 | $ 1,019.26 | 1.18% | $ 6.01 |
| Class A | | | | |
| Actual | $ 1,000.00 | $ 1,018.40 | 1.15% | $ 5.85 |
| Hypothetical (5% return before expenses) | $ 1,000.00 | $ 1,019.41 | 1.15% | $ 5.85 |
| Class C | | | | |
| Actual | $ 1,000.00 | $ 1,014.70 | 1.90% | $ 9.65 |
| Hypothetical (5% return before expenses) | $ 1,000.00 | $ 1,015.63 | 1.90% | $ 9.65 |
| Class I | | | | |
| Actual | $ 1,000.00 | $ 1,018.70 | 0.90% | $ 4.58 |
| Hypothetical (5% return before expenses) | $ 1,000.00 | $ 1,020.67 | 0.90% | $ 4.58 |
| ALPS | Smith Balanced Opportunity Fund | | | | |
| Investor Class | | | | |
| Actual | $ 1,000.00 | $ 1,038.20 | 1.11% | $ 5.70 |
| Hypothetical (5% return before expenses) | $ 1,000.00 | $ 1,019.61 | 1.11% | $ 5.65 |
| Class A | | | | |
| Actual | $ 1,000.00 | $ 1,038.30 | 1.10% | $ 5.65 |
| Hypothetical (5% return before expenses) | $ 1,000.00 | $ 1,019.66 | 1.10% | $ 5.60 |
| Class C | | | | |
| Actual | $ 1,000.00 | $ 1,034.50 | 1.85% | $ 9.49 |
| Hypothetical (5% return before expenses) | $ 1,000.00 | $ 1,015.88 | 1.85% | $ 9.40 |
| Class I | | | | |
| Actual | $ 1,000.00 | $ 1,039.50 | 0.85% | $ 4.37 |
| Hypothetical (5% return before expenses) | $ 1,000.00 | $ 1,020.92 | 0.85% | $ 4.33 |
| Disclosure of Fund Expenses | |
| | October 31, 2021 (Unaudited) |
| | Beginning Account Value
May 1, 2021 | Ending Account Value
October 31, 2021 | Expense
Ratio(a) | Expenses Paid
During Period
May 1, 2021 -
October 31, 2021(b) |
| ALPS | Red Rocks Global Opportunity Fund | | | |
| Investor Class | | | | |
| Actual | $ 1,000.00 | $ 1,116.50 | 1.43% | $ 7.63 |
| Hypothetical (5% return before expenses) | $ 1,000.00 | $ 1,018.00 | 1.43% | $ 7.27 |
| Class A | | | | |
| Actual | $ 1,000.00 | $ 1,117.10 | 1.41% | $ 7.52 |
| Hypothetical (5% return before expenses) | $ 1,000.00 | $ 1,018.10 | 1.41% | $ 7.17 |
| Class C | | | | |
| Actual | $ 1,000.00 | $ 1,112.70 | 2.16% | $ 11.50 |
| Hypothetical (5% return before expenses) | $ 1,000.00 | $ 1,014.32 | 2.16% | $ 10.97 |
| Class I | | | | |
| Actual | $ 1,000.00 | $ 1,117.40 | 1.16% | $ 6.19 |
| Hypothetical (5% return before expenses) | $ 1,000.00 | $ 1,019.36 | 1.16% | $ 5.90 |
| Class R | | | | |
| Actual | $ 1,000.00 | $ 1,114.40 | 1.62% | $ 8.63 |
| Hypothetical (5% return before expenses) | $ 1,000.00 | $ 1,017.04 | 1.62% | $ 8.24 |
| Clough China Fund | | | | |
| Investor Class | | | | |
| Actual | $ 1,000.00 | $ 864.00 | 1.60% | $ 7.52 |
| Hypothetical (5% return before expenses) | $ 1,000.00 | $ 1,017.14 | 1.60% | $ 8.13 |
| Class A | | | | |
| Actual | $ 1,000.00 | $ 864.30 | 1.60% | $ 7.52 |
| Hypothetical (5% return before expenses) | $ 1,000.00 | $ 1,017.14 | 1.60% | $ 8.13 |
| Class C | | | | |
| Actual | $ 1,000.00 | $ 860.80 | 2.35% | $ 11.02 |
| Hypothetical (5% return before expenses) | $ 1,000.00 | $ 1,013.36 | 2.35% | $ 11.93 |
| Class I | | | | |
| Actual | $ 1,000.00 | $ 865.20 | 1.35% | $ 6.35 |
| Hypothetical (5% return before expenses) | $ 1,000.00 | $ 1,018.40 | 1.35% | $ 6.87 |
| Disclosure of Fund Expenses | |
| | October 31, 2021 (Unaudited) |
| | Beginning Account Value
May 1, 2021 | Ending Account Value
October 31, 2021 | Expense
Ratio(a) | Expenses Paid
During Period
May 1, 2021 -
October 31, 2021(b) |
| RiverFront Asset Allocation Moderate | | | | |
| Investor Class | | | | |
| Actual | $ 1,000.00 | $ 1,046.70 | 0.50% | $ 2.58 |
| Hypothetical (5% return before expenses) | $ 1,000.00 | $ 1,022.68 | 0.50% | $ 2.55 |
| Class A | | | | |
| Actual | $ 1,000.00 | $ 1,046.70 | 0.50% | $ 2.58 |
| Hypothetical (5% return before expenses) | $ 1,000.00 | $ 1,022.68 | 0.50% | $ 2.55 |
| Class C | | | | |
| Actual | $ 1,000.00 | $ 1,042.40 | 1.25% | $ 6.43 |
| Hypothetical (5% return before expenses) | $ 1,000.00 | $ 1,018.90 | 1.25% | $ 6.36 |
| Class I | | | | |
| Actual | $ 1,000.00 | $ 1,047.90 | 0.25% | $ 1.29 |
| Hypothetical (5% return before expenses) | $ 1,000.00 | $ 1,023.95 | 0.25% | $ 1.28 |
| RiverFront Asset Allocation Aggressive | | | | |
| Investor Class | | | | |
| Actual | $ 1,000.00 | $ 1,059.40 | 0.50% | $ 2.60 |
| Hypothetical (5% return before expenses) | $ 1,000.00 | $ 1,022.68 | 0.50% | $ 2.55 |
| Class A | | | | |
| Actual | $ 1,000.00 | $ 1,059.20 | 0.50% | $ 2.60 |
| Hypothetical (5% return before expenses) | $ 1,000.00 | $ 1,022.68 | 0.50% | $ 2.55 |
| Class C | | | | |
| Actual | $ 1,000.00 | $ 1,055.30 | 1.25% | $ 6.48 |
| Hypothetical (5% return before expenses) | $ 1,000.00 | $ 1,018.90 | 1.25% | $ 6.36 |
| Class I | | | | |
| Actual | $ 1,000.00 | $ 1,060.90 | 0.25% | $ 1.30 |
| Hypothetical (5% return before expenses) | $ 1,000.00 | $ 1,023.95 | 0.25% | $ 1.28 |
| Investor Class II | | | | |
| Actual | $ 1,000.00 | $ 1,059.20 | 0.50% | $ 2.60 |
| Hypothetical (5% return before expenses) | $ 1,000.00 | $ 1,022.68 | 0.50% | $ 2.55 |
| Class L | | | | |
| Actual | $ 1,000.00 | $ 1,061.00 | 0.25% | $ 1.30 |
| Hypothetical (5% return before expenses) | $ 1,000.00 | $ 1,023.95 | 0.25% | $ 1.28 |
| RiverFront Asset Allocation Growth & Income | | | | |
| Investor Class | | | | |
| Actual | $ 1,000.00 | $ 1,047.70 | 0.50% | $ 2.58 |
| Hypothetical (5% return before expenses) | $ 1,000.00 | $ 1,022.68 | 0.50% | $ 2.55 |
| Class A | | | | |
| Actual | $ 1,000.00 | $ 1,047.80 | 0.50% | $ 2.58 |
| Hypothetical (5% return before expenses) | $ 1,000.00 | $ 1,022.68 | 0.50% | $ 2.55 |
| Class C | | | | |
| Actual | $ 1,000.00 | $ 1,043.50 | 1.25% | $ 6.44 |
| Hypothetical (5% return before expenses) | $ 1,000.00 | $ 1,018.90 | 1.25% | $ 6.36 |
| Class I | | | | |
| Actual | $ 1,000.00 | $ 1,049.20 | 0.25% | $ 1.29 |
| Hypothetical (5% return before expenses) | $ 1,000.00 | $ 1,023.95 | 0.25% | $ 1.28 |
| (a) | Annualized, based on the Fund's most recent fiscal half year expenses. |
| (b) | Expenses are equal to the Fund's annualized expense ratio multiplied by the average account value over the period, multiplied by the number of days in the most recent fiscal half year (184), divided by 365. |
| (c) | Includes expenses of the CoreCommodity Management Cayman Commodity Fund Ltd. (wholly-owned subsidiary), exclusive of the subsidiary's management fee. |
| ALPS | CoreCommodity Management | |
| CompleteCommodities® Strategy Fund | |
| Management Commentary | October 31, 2021 (Unaudited) |
The twelve month period ending on October 31, 2021 produced positive returns for commodities as measured by the diversified Bloomberg Commodity Index Total Return (“BCOM”), up +43.94%. The ALPS CoreCommodity Complete Commodities Strategy Fund (“I” Shares – “JCRIX” or the “Fund”) delivered a net positive return of +57.74% (JCRAX was up +57.25%, JCCSX was up +48.75% at MOP and JCRCX was up +55.37% with CDSC).
The Fund outperformed its benchmark, BCOM, by 13.80% during the period. The Fund employs a strategy that combines an actively managed portfolio of commodity futures (collateralized by nominal and inflation-adjusted Treasuries), commodity equities, and physical commodity ETFs. On average, for the past twelve months, the Fund allocated approximately 68% of its assets toward commodity futures-related investments and approximately 32% of its assets toward commodity equities. The Fund was more than 99% invested at the end of the period.
The past one year period ending in October 2021 marked a tremendous rise in commodity prices across the board. The rapid introduction of multiple COVID-19 vaccines beginning in December 2020 became a launching point for economic re-engagement on a global scale. In addition to improvements from a vaccination standpoint, trillions of dollars in stimulus proved successful in promoting greater consumption and mobility. Despite a second wave of the Delta variant, most major economies re-opened to some semblance of normalcy. The asset class benefitted from a “v-shaped” recovery in demand and a seemingly benign recovery in supply. The imbalance has led to massive inventory drawdowns, worsening supply chain bottlenecks, and price spikes throughout the commodity spectrum.
During the timeframe under review, the Fund's largest sector underweight relative to the BCOM was in agriculture at -2.8%. The Fund’s agriculture sector outperformed that of the BCOM by +10%, +47.8% to +37.8%. A higher concentration of certain “luxury” commodities such as coffee (+95.4%), cotton (+66.6%), and sugar (+34.2%) added to the outperformance. Coffee in particular was bolstered by severe weather in top-producer Brazil, in addition to rising freight costs. An underweight to soybean oil (+82.3%) resulted in a slight drag on performance considering the recent supply issues faced by the vegetable oil market and heightened focus on biodiesel. Accounting for the underweight and positive performance among the agriculture producers (+52.5%), the sector contributed +1.8% to total alpha on a gross basis.
As the sector leader, energy prices advanced by a sizeable +83.5% as measured by the BCOM energy sub-index. In fact, the top five performing commodities over the prior year were in the energy sector – gasoil (+135.6%), gasoline (+134.6%), WTI crude oil (+133.5%), heating oil (+130.9%), and Brent crude oil (+125.3%). Fuels of all types benefited from disciplined supply and a rapid return to pre-COVID demand levels. The market was heavily supported by scheduled OPEC+ production cuts and a beleaguered US shale industry. Despite past tendencies to ramp up drilling at all costs, shale producers remained focused on returning capital to
shareholders and shoring up debt-laden balance sheets. The commodity futures in the Fund were further supported by strong performance by the energy equity holdings (+106.1%). Given the Fund’s mix of futures and equities, and a modest overweight to the sector, the Fund’s energy holdings added +6.1% to outperformance on a gross basis for the period.
Industrial metals represented the largest sector overweight within the Fund, boasting a position of 18.9% compared to 15.9% in the BCOM. The tactical overweight proved favorable as industrial metal prices rose nearly +40% over the year as measured by the BCOM industrial metals sub-index. The industry was supported by strong housing numbers, large year-over-year increases to GDP, the transition to low-carbon technologies, and historically low inventory levels. Similar to the oil markets, base metals faced a dramatic decrease in long-cycle capital expenditures following the Global Financial Crisis of 2021. As a consequence, the world is now reeling for materials that are deteriorating in ore quality and are massively underfunded. Fortunately, the industrial metals miners held within the Fund (+77.2% during the reported period) were able to capitalize on the underlying futures performance and helped provide nearly +6.9% in gross alpha to the annual tally.
Precious metals was the only sector to post negative performance over the twelve month period ending October 31, 2021, a return of -4.6% as measured by the BCOM precious metals sub-index total return. As the global economy roared back to life, the desire to hold safe-haven assets diminished. Additionally, while the US dollar continued its downward trend into year-end 2020, it managed to reverse course and rise thereafter through October month-end, up nearly +5% calendar year-to-date. Despite the poor beta move, the Fund’s inclusion of platinum (+20.3%) and tactical overweight to silver (+1.3%) added to outperformance. Accounting for the underweight the sector contributed nearly +0.9% in positive gross alpha on a gross basis. Both platinum and silver remain key ingredients to the world’s decarbonization efforts which we believe will only intensify following the recent United Nations gathering in Glasgow for COP26.
The Fund’s top equity holdings at the end of October 2021 included Tyson Foods Inc (TSN US) +43.23% YTD, CF Industries Holdings Inc (CF US) +111.72% YTD, Sanderson Farms Inc (SAFM US) +49.62% YTD, EOG Resources Inc (EOG US) +179.45% YTD, Inpex Corp (1605 JP) +102.29% YTD, Nutrien Ltd (NTR CN) +65.01% YTD, Evoqua Water Technologies Corp (AQUA US) +82.42% YTD, Boliden AB (BOL SS) +29.94% YTD, Lundin Energy AB (LUNE SS) +109.58% YTD, Fortuna Silver Mines Inc (FSM US) -26.59% YTD.
US Treasury Inflation Protected Securities (“TIPS”) and nominal US Treasuries are held by the Fund to invest excess cash and are used as collateral for commodity futures-related investments held in the Fund’s Cayman Island subsidiary. Over the previous calendar year, rates rose significantly due to inflationary pressure and the expectation for tapering by leading central banks. The yield on US 10-year notes rose from roughly 0.87% to 1.60% in twelve months’
| ALPS | CoreCommodity Management | |
| CompleteCommodities® Strategy Fund | |
| Management Commentary | October 31, 2021 (Unaudited) |
time. At the end of the period, the average maturity of the Fund’s collateral was approximately 0.3 years.
The previous fiscal year witnessed substantial appreciation in commodity prices; yet, despite the rally, we maintain a strong conviction that we are just now entering early innings of a larger structural bull market. In our view, many of the fundamental drivers that have pushed prices higher were in development well before the global pandemic, and many will likely take years more to find equilibrium. Most of the underlying markets accounted for within the Fund are now in deficit due to years of underinvestment in long-cycle projects. The supply-chain norm from years past of “just-in-time” inventories is now under tremendous strain and is prompting many to consider re-stocking campaigns. On the political front, the past decade was dedicated to achieving financial stability – the next decade will likely be dedicated to achieving social stability. With social reform come redistribution efforts, supply chain redundancies, de-globalization, and climate change initiatives – all of which would require massive spending and offset the low-cost efficiency gains of the 2000s. Together, we anticipate the levers pushing and pulling commodity markets into a new period of scarcity are due to persist until prices rise high enough to balance the market once again. With inflation for most leading economies now well above target and traditional asset valuations near all-time highs, we believe the commodity asset class is well-positioned for much greater participation among the investment community.
Bob Hyman
Portfolio Manager
CoreCommodity Management, LLC
Past performance if not indicative of future results. “Bloomberg®” and “Bloomberg Commodity IndexSM” are service marks of Bloomberg L.P. (“Bloomberg”) as the case may be. Source for all Index data: Bloomberg L.P. Global. Commodity Sectors and individual commodities are represented by the respective Bloomberg Commodity Sub-Index. This document does not constitute an offer of any commodities, securities or investment advisory services. Any such offer may be made only by means of a disclosure document or similar materials which contain a description of material terms and risks. All expressions of opinion are subject to change without notice in reaction to shifting market conditions. Data contained herein from third-party providers is obtained from what are considered reliable sources. However, its accuracy, completeness or reliability cannot be guaranteed. The economic statistics presented herein are subject to revision by the agencies that issue them. CoreCommodity Management assumes no obligation to provide this information in the future or to advise of changes in this information. Any indices and other financial benchmarks shown are provided for illustrative purposes only, are unmanaged, reflect reinvestment of income and do not reflect the impact of advisory fees. Investors cannot invest directly in an index. All investments are subject to risk.
The views of the authors and information discussed in this commentary are as of the date of publication, are subject to change, and may not reflect the writer's current views. The views expressed are those of the authors only, and represent an assessment of market conditions at a specific point in time, are opinions only and should not be relied upon as investment advice regarding a particular investment or markets in general. Such information does not constitute a recommendation to buy or sell specific securities or investment vehicles. It should not be assumed that any investment will be profitable or will equal the performance of the fund(s) or any securities or any sectors mentioned in this letter. The subject matter contained in this letter has been derived from several sources believed to be reliable and accurate at the time of compilation. Neither ALPS, Advisors, Inc., CoreCommodity Management, LLC, nor the Fund accepts any liability for losses either direct or consequential caused by the use of this information.
Indices do not reflect deductions for fees, expenses, or taxes.
An investor may not invest directly in an index.
Diversification cannot guarantee gain or prevent losses.
Bob Hyman is a registered representative of ALPS Distributors, Inc.
ALPS Portfolio Solutions Distributor, Inc., ALPS Distributors, Inc. and ALPS Advisors Inc. are affiliated.
ALPS | CoreCommodity Management
CompleteCommodities® Strategy Fund
| Performance Update | October 31, 2021 (Unaudited) |
Performance of $10,000 Initial Investment (as of October 31, 2021)
Comparison of change in value of a $10,000 investment

The chart above represents historical performance of a hypothetical investment of $10,000 in the Fund since inception. Past performance does not guarantee future results. This chart does not reflect the deduction of taxes that a shareholder would pay on Fund distributions or the redemption of Fund shares.
Average Annual Total Returns (as of October 31, 2021)
| | 1 Year | 3 Year | 5 Year | 10 Year | Since
Inception^ | Total Expense Ratio | What You
Pay* |
| Investor# (NAV) | 57.25% | 9.54% | 6.89% | -1.11% | 1.37% | 1.45% | 1.45% |
| Class A (NAV) | 57.33% | 9.62% | 6.93% | -1.09% | 1.39% | 1.45% | 1.45% |
| Class A (LOAD) | 48.75% | 7.57% | 5.74% | -1.65% | 0.89% |
| Class C (NAV) | 56.37% | 8.87% | 6.21% | -1.74% | 0.75% | 2.05% | 2.05% |
| Class C (LOAD) | 55.37% | 8.87% | 6.21% | -1.74% | 0.75% |
| Class I | 57.74% | 9.85% | 7.14% | -0.84% | 1.65% | 1.15% | 1.15% |
| Refinitiv/CoreCommodity CRB Commodity Total Return Index1 | 64.31% | 8.63% | 6.17% | -2.34% | -0.12% | | |
| Bloomberg Commodity TR Index1 | 43.94% | 8.56% | 5.17% | -3.04% | -1.07% | | |
Performance data quoted represents past performance. Past performance does not guarantee future results. Investment return and principal value of an investment will fluctuate so that an investor's shares, when sold or redeemed, may be worth more or less than the original cost. Current performance data may be higher or lower than actual data quoted. For the most current month-end performance data, please call 1-866-759-5679.
Maximum Offering Price (MOP) for Class A shares includes the Fund’s maximum sales charge of 5.50%. Performance shown at NAV does not include these sales charges and would have been lower had it been taken into account. If you invest $1 million or more, either as a lump sum or through the Fund’s accumulation or letter of intent programs, you can purchase Class A shares without an initial sales charge (load). A Contingent Deferred Sales Charge (“CDSC”) of 1.00% may apply to Class C shares redeemed within the first 12 months after a purchase, and on Class A shares redeemed within the first 18 months after a purchase in excess of $1 million. The Fund imposes a 2.00% redemption fee on shares held for less than 30 days.
Performance less than 1 year is cumulative.
ALPS | CoreCommodity Management
CompleteCommodities® Strategy Fund
| Performance Update | October 31, 2021 (Unaudited) |
Performance shown for Class A shares prior to June 12, 2018 reflects the historical performance of the Fund’s Investor shares, calculated using the fees and expenses of Class A shares.
| 1 | The Bloomberg Commodity TR Index (formerly the Dow Jones-UBS Commodity Index) and the Refinitiv/Core Commodity CRB Index are unmanaged indices used as a measurement of change in commodity market conditions based on the performance of a basket of different commodities. Each index is composed of a different basket of commodities, a different weighting of the commodities in the basket, and a different re-balancing schedule. The indices are not actively managed and do not reflect any deduction for fees, expenses or taxes. An investor may not invest directly in an index. |
| ^ | Fund Inception date of June 29, 2010 for Investor Class and Classes C and I; Fund Inception date of June 12, 2018 for Class A. |
| * | What You Pay reflects the Advisor’s decision to contractually limit expenses through February 28, 2022. Please see the prospectus dated February 28, 2021 for additional information. |
| # | Prior to December 1, 2017, Investor Class was known as Class A. |
Investments in securities of Master Limited Partnerships (MLPs) involve risks that differ from an investment in common stock. MLPs are controlled by their general partners, which generally have conflicts of interest and limited fiduciary duties to the MLP, which may permit the general partner to favor its own interests over the MLPs. The benefit you are expected to derive from the Fund’s investment in MLPs depends largely on the MLPs being treated as partnerships for federal income tax purposes. As a partnership, an MLP has no federal income tax liability at the entity level. Therefore, treatment of one or more MLPs as a corporation for federal income tax purposes could affect the Fund’s ability to meet its investment objective and would reduce the amount of cash available to pay or distribute to you. Legislative, judicial, or administrative changes and differing interpretations, possibly on a retroactive basis, could negatively impact the value of an investment in MLPs and therefore the value of your investment in the Fund.
Investing in commodity-related securities involves risk and considerations not present when investing in more conventional securities. The Fund may be more susceptible to high volatility of commodity markets.
Derivatives generally are more sensitive to changes in economic or market conditions than other types of investments; this could result in losses that significantly exceed the Fund's original investment.
The table does not reflect the deduction of taxes that a shareholder would pay on Fund distributions or the redemption of Fund shares.
This Fund is not suitable for all investors, and is subject to investment risks, including possible loss of the principal amount invested.
There is no guarantee that the Fund will continue to hold any one particular security or stay invested in any one particular company. The composition of the Fund's top holdings is subject to change. Performance figures are historical and reflect the change in share price, reinvested distributions, changes in net asset value, sales charges and capital gains distributions, if any.
Not FDIC Insured – No Bank Guarantee – May Lose Value
Asset Type Allocation (as a % of Net Assets)†
| Government Bonds | 60.12% |
| Common Stocks | 29.81% |
| Master Limited Partnerships | 0.04% |
| Cash, Cash Equivalents, & Other Net Assets | 10.03% |
| Total | 100.00% |
| † | Holdings are subject to change, and may not reflect the current or future position of the portfolio. Table presents approximate values only. |
Industry Sector Allocation (as a % of Net Assets) ^

| ^ | Notional Value of Derivative Exposure included |
ALPS | CoreCommodity Management
CompleteCommodities® Strategy Fund
| Consolidated Statement of Investments | October 31, 2021 |
| | | Shares | | | Value
(Note 2) | |
| COMMON STOCKS (29.81%) | | | | | | | | |
| Argentina (0.02%) | | | | | | | | |
| YPF SA, Sponsored ADR(a) | | | 73,592 | | | $ | 309,086 | |
| | | | | | | | | |
| Australia (1.75%) | | | | | | | | |
| Beach Energy, Ltd. | | | 1,202,200 | | | | 1,261,571 | |
| BHP Group, Ltd. | | | 57,246 | | | | 1,575,250 | |
| BlueScope Steel, Ltd. | | | 10,426 | | | | 161,721 | |
| Costa Group Holdings, Ltd. | | | 104,343 | | | | 229,196 | |
| Fortescue Metals Group, Ltd. | | | 303,039 | | | | 3,175,487 | |
| GrainCorp, Ltd., Class A | | | 85,256 | | | | 402,759 | |
| IGO, Ltd. | | | 132,309 | | | | 959,460 | |
| Iluka Resources, Ltd. | | | 195,693 | | | | 1,383,770 | |
| Incitec Pivot, Ltd. | | | 575,835 | | | | 1,295,179 | |
| Mineral Resources, Ltd. | | | 12,584 | | | | 365,304 | |
| Newcrest Mining, Ltd. | | | 63,097 | | | | 1,181,393 | |
| Northern Star Resources, Ltd. | | | 295,840 | | | | 2,056,314 | |
| Nufarm, Ltd.(a) | | | 147,504 | | | | 482,674 | |
| Oil Search, Ltd. | | | 73,894 | | | | 238,466 | |
| Orocobre, Ltd.(a) | | | 239,467 | | | | 1,603,232 | |
| Perseus Mining, Ltd.(a) | | | 532,660 | | | | 633,093 | |
| Sandfire Resources NL | | | 78,872 | | | | 329,882 | |
| Santos, Ltd. | | | 400,731 | | | | 2,104,113 | |
| South32, Ltd. | | | 823,504 | | | | 2,211,539 | |
| St Barbara, Ltd. | | | 162,515 | | | | 179,098 | |
| Woodside Petroleum, Ltd. | | | 18,740 | | | | 327,899 | |
| | | | | | | | 22,157,400 | |
| | | | | | | | | |
| Austria (0.09%) | | | | | | | | |
| OMV AG | | | 6,908 | | | | 418,449 | |
| voestalpine AG | | | 18,655 | | | | 708,202 | |
| | | | | | | | 1,126,651 | |
| | | | | | | | | |
| Brazil (0.71%) | | | | | | | | |
| BRF SA, ADR(a) | | | 193,584 | | | | 799,502 | |
| Cia de Saneamento Basico do Estado de Sao Paulo, ADR | | | 126,298 | | | | 793,151 | |
| Cia Siderurgica Nacional SA, Sponsored ADR | | | 267,613 | | | | 1,091,861 | |
| Gerdau SA, Sponsored ADR | | | 334,480 | | | | 1,582,090 | |
| Petroleo Brasileiro SA, Sponsored ADR | | | 270,198 | | | | 2,653,345 | |
| Vale SA, Sponsored ADR | | | 163,817 | | | | 2,085,391 | |
| | | | | | | | 9,005,340 | |
| | | | | | | | | |
| Canada (5.67%) | | | | | | | | |
| Agnico Eagle Mines, Ltd. | | | 19,374 | | | | 1,027,791 | |
| Alamos Gold, Inc., Class A | | | 218,074 | | | | 1,622,471 | |
| ARC Resources, Ltd. | | | 398,100 | | | | 3,818,234 | |
| B2Gold Corp. | | | 655,682 | | | | 2,714,523 | |
| Ballard Power Systems, Inc.(a) | | | 118,198 | | | | 2,141,748 | |
| Barrick Gold Corp. | | | 49,181 | | | | 903,455 | |
| Cameco Corp. | | | 63,522 | | | | 1,543,585 | |
| Canadian Solar, Inc.(a) | | | 71,489 | | | | 2,970,368 | |
| Canfor Corp.(a) | | | 28,900 | | | | 598,736 | |
| Centerra Gold, Inc. | | | 133,600 | | | | 1,001,784 | |
| Crescent Point Energy Corp. | | | 795,000 | | | | 3,995,556 | |
| | | Shares | | | Value
(Note 2) | |
| Canada (continued) | | | | | | | | |
| Dundee Precious Metals, Inc. | | | 137,800 | | | $ | 906,345 | |
| Eldorado Gold Corp.(a) | | | 135,739 | | | | 1,216,221 | |
| Endeavour Silver Corp.(a) | | | 231,350 | | | | 1,168,318 | |
| Enerplus Corp. | | | 44,048 | | | | 417,135 | |
| First Majestic Silver Corp. | | | 125,311 | | | | 1,587,690 | |
| First Quantum Minerals, Ltd. | | | 56,000 | | | | 1,325,792 | |
| Fortuna Silver Mines, Inc.(a) | | | 950,860 | | | | 4,621,180 | |
| Hudbay Minerals, Inc. | | | 180,500 | | | | 1,258,658 | |
| IAMGOLD Corp.(a) | | | 346,775 | | | | 960,567 | |
| Interfor Corp. | | | 59,000 | | | | 1,351,050 | |
| Ivanhoe Mines, Ltd., Class A(a) | | | 125,500 | | | | 984,652 | |
| Kinross Gold Corp. | | | 420,610 | | | | 2,527,866 | |
| Kirkland Lake Gold, Ltd. | | | 3,800 | | | | 160,186 | |
| Lundin Mining Corp. | | | 184,000 | | | | 1,601,228 | |
| Maple Leaf Foods, Inc. | | | 22,700 | | | | 494,866 | |
| MEG Energy Corp.(a) | | | 135,900 | | | | 1,217,785 | |
| Northland Power, Inc. | | | 40,900 | | | | 1,314,973 | |
| Nutrien, Ltd. | | | 77,400 | | | | 5,409,744 | |
| Pan American Silver Corp. | | | 151,713 | | | | 3,885,370 | |
| Parex Resources, Inc. | | | 85,000 | | | | 1,650,412 | |
| PrairieSky Royalty, Ltd. | | | 31,600 | | | | 388,872 | |
| Pretium Resources, Inc.(a) | | | 49,531 | | | | 598,334 | |
| Silvercorp Metals, Inc. | | | 168,876 | | | | 712,657 | |
| SSR Mining, Inc. | | | 144,286 | | | | 2,276,712 | |
| Suncor Energy, Inc. | | | 145,800 | | | | 3,834,672 | |
| Torex Gold Resources, Inc.(a) | | | 109,600 | | | | 1,274,357 | |
| Tourmaline Oil Corp. | | | 93,300 | | | | 3,372,098 | |
| Turquoise Hill Resources, Ltd.(a) | | | 10,049 | | | | 127,321 | |
| Vermilion Energy, Inc.(a) | | | 150,000 | | | | 1,626,535 | |
| Village Farms International, Inc.(a) | | | 148,148 | | | | 1,121,480 | |
| | | | | | | | 71,731,327 | |
| | | | | | | | | |
| Chile (0.29%) | | | | | | | | |
| Antofagasta PLC | | | 53,247 | | | | 1,038,779 | |
| Sociedad Quimica y Minera de Chile SA, Sponsored ADR | | | 47,357 | | | | 2,599,426 | |
| | | | | | | | 3,638,205 | |
| | | | | | | | | |
| China (0.23%) | | | | | | | | |
| China Petroleum & Chemical Corp., ADR | | | 5,780 | | | | 281,370 | |
| Daqo New Energy Corp., ADR(a) | | | 7,613 | | | | 592,215 | |
| JinkoSolar Holding Co., Ltd., ADR(a) | | | 27,133 | | | | 1,623,097 | |
| PetroChina Co., Ltd., ADR | | | 8,809 | | | | 425,122 | |
| | | | | | | | 2,921,804 | |
| | | | | | | | | |
| Colombia (0.07%) | | | | | | | | |
| Ecopetrol SA, Sponsored ADR | | | 56,879 | | | | 861,717 | |
| | | | | | | | | |
| Denmark (0.11%) | | | | | | | | |
| FLSmidth & Co. A/S | | | 14,347 | | | | 545,342 | |
| Orsted AS(b)(c) | | | 6,179 | | | | 871,878 | |
| | | | | | | | 1,417,220 | |
See Notes to Financial Statements.
ALPS | CoreCommodity Management
CompleteCommodities® Strategy Fund
| Consolidated Statement of Investments | October 31, 2021 |
| | | Shares | | | Value
(Note 2) | |
| Faroe Islands (0.05%) | | | | | | | | |
| Bakkafrost P/F | | | 6,869 | | | $ | 634,382 | |
| | | | | | | | | |
| Finland (0.18%) | | | | | | | | |
| Metso Outotec Oyj | | | 121,017 | | | | 1,214,297 | |
| Outokumpu Oyj(a) | | | 166,365 | | | | 1,038,519 | |
| | | | | | | | 2,252,816 | |
| | | | | | | | | |
| France (0.12%) | | | | | | | | |
| Constellium SE(a) | | | 34,942 | | | | 643,282 | |
| TotalEnergies SE, ADR | | | 16,315 | | | | 817,545 | |
| | | | | | | | 1,460,827 | |
| | | | | | | | | |
| Germany (0.18%) | | | | | | | | |
| K+S AG(a) | | | 70,154 | | | | 1,207,958 | |
| Nordex SE(a) | | | 10,156 | | | | 186,672 | |
| Salzgitter AG(a) | | | 10,429 | | | | 383,620 | |
| SMA Solar Technology AG | | | 3,703 | | | | 195,456 | |
| thyssenkrupp AG(a) | | | 17,747 | | | | 184,476 | |
| VERBIO Vereinigte BioEnergie AG | | | 2,122 | | | | 168,278 | |
| | | | | | | | 2,326,460 | |
| | | | | | | | | |
| Great Britain (1.45%) | | | | | | | | |
| Anglo American PLC | | | 24,783 | | | | 943,735 | |
| Atlantica Sustainable Infrastructure PLC | | | 49,229 | | | | 1,937,161 | |
| BP PLC, Sponsored ADR | | | 124,106 | | | | 3,573,012 | |
| CNH Industrial N.V. | | | 81,081 | | | | 1,387,296 | |
| Evraz PLC | | | 91,946 | | | | 782,176 | |
| Pennon Group PLC | | | 41,248 | | | | 658,207 | |
| Pentair PLC | | | 27,500 | | | | 2,034,175 | |
| Rio Tinto PLC, Sponsored ADR | | | 48,371 | | | | 3,060,433 | |
| Severn Trent PLC | | | 36,254 | | | | 1,358,471 | |
| Subsea 7 SA | | | 50,511 | | | | 452,978 | |
| TechnipFMC PLC | | | 74,155 | | | | 546,522 | |
| United Utilities Group PLC | | | 99,030 | | | | 1,407,454 | |
| Weir Group PLC | | | 6,090 | | | | 144,603 | |
| | | | | | | | 18,286,223 | |
| | | | | | | | | |
| Israel (0.19%) | | | | | | | | |
| SolarEdge Technologies, Inc.(a) | | | 6,820 | | | | 2,418,918 | |
| | | | | | | | | |
| Italy (0.07%) | | | | | | | | |
| Eni SpA, Sponsored ADR | | | 18,989 | | | | 546,694 | |
| ERG SpA | | | 10,237 | | | | 369,457 | |
| | | | | | | | 916,151 | |
| | | | | | | | | |
| Japan (1.63%) | | | | | | | | |
| AGC, Inc. | | | 69,700 | | | | 3,467,417 | |
| Daido Steel Co., Ltd. | | | 6,200 | | | | 237,447 | |
| Ezaki Glico Co., Ltd. | | | 4,600 | | | | 166,686 | |
| GS Yuasa Corp. | | | 21,600 | | | | 468,861 | |
| Hitachi Metals, Ltd.(a) | | | 34,000 | | | | 643,457 | |
| Inpex Corp. | | | 661,133 | | | | 5,522,251 | |
| JFE Holdings, Inc. | | | 35,900 | | | | 549,013 | |
| Kobe Steel, Ltd. | | | 77,200 | | | | 453,819 | |
| Kubota Corp. | | | 24,700 | | | | 524,990 | |
| | | Shares | | | Value
(Note 2) | |
| Japan (continued) | | | | | | | | |
| Kurita Water Industries, Ltd. | | | 25,716 | | | $ | 1,263,519 | |
| Morinaga Milk Industry Co., Ltd. | | | 6,500 | | | | 380,961 | |
| NGK Insulators, Ltd. | | | 34,800 | | | | 577,685 | |
| Nippon Light Metal Holdings Co., Ltd. | | | 23,800 | | | | 394,039 | |
| Nippon Steel Corp. | | | 102,590 | | | | 1,799,319 | |
| RENOVA, Inc.(a) | | | 24,800 | | | | 1,087,958 | |
| Sumitomo Forestry Co., Ltd. | | | 28,759 | | | | 547,550 | |
| Sumitomo Metal Mining Co., Ltd. | | | 51,300 | | | | 1,990,787 | |
| Tokyo Steel Manufacturing Co., Ltd. | | | 50,500 | | | | 560,939 | |
| | | | | | | | 20,636,698 | |
| | | | | | | | | |
| Luxembourg (0.27%) | | | | | | | | |
| APERAM SA | | | 14,100 | | | | 840,735 | |
| ArcelorMittal | | | 24,464 | | | | 835,935 | |
| ArcelorMittal SA | | | 5,056 | | | | 171,397 | |
| Tenaris SA, ADR | | | 27,417 | | | | 610,851 | |
| Ternium SA, Sponsored ADR | | | 19,564 | | | | 906,400 | |
| | | | | | | | 3,365,318 | |
| | | | | | | | | |
| Malaysia (0.07%) | | | | | | | | |
| Lynas Rare Earths, Ltd.(a) | | | 150,983 | | | | 832,516 | |
| | | | | | | | | |
| Mexico (0.15%) | | | | | | | | |
| Grupo Mexico SAB de CV, Series B | | 445,700 | | | | 1,953,131 | |
| | | | | | | | | |
| Netherlands (0.23%) | | | | | | | | |
| AMG Advanced Metallurgical Group NV | | | 9,059 | | | | 267,461 | |
| Core Laboratories N.V. | | | 48,394 | | | | 1,258,727 | |
| OCI N.V.(a) | | | 15,679 | | | | 444,062 | |
| Royal Dutch Shell PLC, Class A, Sponsored ADR | | | 8,932 | | | | 410,158 | |
| Royal Dutch Shell PLC, Class B | | | 2,551 | | | | 58,826 | |
| SBM Offshore N.V. | | | 27,872 | | | | 440,127 | |
| | | | | | | | 2,879,361 | |
| | | | | | | | | |
| Norway (1.34%) | | | | | | | | |
| Aker BP ASA | | | 75,504 | | | | 2,894,891 | |
| Aker Solutions ASA(a) | | | 61,939 | | | | 175,452 | |
| DNO ASA(a) | | | 516,958 | | | | 752,682 | |
| Equinor ASA | | | 130,031 | | | | 3,290,063 | |
| Leroy Seafood Group ASA | | | 70,514 | | | | 641,044 | |
| Mowi ASA | | | 80,496 | | | | 2,330,676 | |
| NEL ASA(a) | | | 476,921 | | | | 1,006,582 | |
| Salmar ASA | | | 12,666 | | | | 964,055 | |
| Scatec ASA(b)(c) | | | 52,789 | | | | 1,037,921 | |
| TGS ASA | | | 50,202 | | | | 461,854 | |
| Yara International ASA | | | 64,676 | | | | 3,374,706 | |
| | | | | | | | 16,929,926 | |
| | | | | | | | | |
| Peru (0.12%) | | | | | | | | |
| Cia de Minas Buenaventura SAA, ADR | | | 24,873 | | | | 195,999 | |
| Southern Copper Corp. | | | 22,386 | | | | 1,342,936 | |
| | | | | | | | 1,538,935 | |
See Notes to Financial Statements.
ALPS | CoreCommodity Management
CompleteCommodities® Strategy Fund
| Consolidated Statement of Investments | October 31, 2021 |
| | | Shares | | | Value
(Note 2) | |
| South Africa (0.61%) | | | | | | | | |
| African Rainbow Minerals, Ltd. | | | 36,752 | | | $ | 489,698 | |
| Anglo Platinum, Ltd. | | | 4,780 | | | | 482,976 | |
| AngloGold Ashanti, Ltd., Sponsored ADR | | | 68,785 | | | | 1,271,147 | |
| Gold Fields, Ltd., Sponsored ADR | | | 294,242 | | | | 2,730,565 | |
| Impala Platinum Holdings, Ltd. | | | 54,000 | | | | 699,932 | |
| Kumba Iron Ore, Ltd. | | | 15,133 | | | | 459,885 | |
| Sasol, Ltd.(a) | | | 77,701 | | | | 1,305,325 | |
| Sibanye Stillwater, Ltd., ADR | | | 23,619 | | | | 335,390 | |
| | | | | | | | 7,774,918 | |
| | | | | | | | | |
| Spain (0.34%) | | | | | | | | |
| Acerinox SA | | | 44,206 | | | | 615,016 | |
| Fluidra SA | | | 22,858 | | | | 873,310 | |
| Iberdrola SA | | | 122,968 | | | | 1,452,075 | |
| Repsol SA | | | 21,441 | | | | 274,032 | |
| Siemens Gamesa Renewable Energy SA(a) | | | 24,558 | | | | 665,157 | |
| Solaria Energia y Medio Ambiente SA | | | 18,123 | | | | 361,811 | |
| | | | | | | | 4,241,401 | |
| | | | | | | | | |
| Sweden (1.33%) | | | | | | | | |
| AAK AB | | | 17,147 | | | | 374,766 | |
| Boliden AB | | | 147,867 | | | | 5,215,291 | |
| Epiroc AB, Class A | | | 59,249 | | | | 1,474,326 | |
| Holmen AB, B Shares | | | 8,330 | | | | 369,360 | |
| Lundin Energy AB | | | 124,444 | | | | 4,915,161 | |
| SSAB AB, A Shares(a) | | | 190,388 | | | | 1,084,068 | |
| Svenska Cellulosa AB SCA, Class B | | 218,017 | | | | 3,399,217 | |
| | | | | | | | 16,832,189 | |
| | | | | | | | | |
| Switzerland (0.06%) | | | | | | | | |
| Bucher Industries AG | | | 799 | | | | 402,816 | |
| Ferrexpo PLC | | | 75,872 | | | | 323,964 | |
| | | | | | | | 726,780 | |
| | | | | | | | | |
| United States (12.48%) | | | | | | | | |
| Allegheny Technologies, Inc.(a) | | | 34,615 | | | | 557,302 | |
| American Water Works Co., Inc. | | | 10,923 | | | | 1,902,568 | |
| APA Corp. | | | 46,650 | | | | 1,222,697 | |
| Archer-Daniels-Midland Co. | | | 24,736 | | | | 1,589,041 | |
| Archrock, Inc. | | | 40,183 | | | | 329,099 | |
| Arconic, Inc.(a) | | | 11,241 | | | | 330,710 | |
| Array Technologies, Inc.(a) | | | 28,924 | | | | 617,527 | |
| Baker Hughes Co. | | | 54,605 | | | | 1,369,493 | |
| Beyond Meat, Inc.(a) | | | 36,822 | | | | 3,644,642 | |
| Bunge, Ltd. | | | 35,629 | | | | 3,300,671 | |
| Callon Petroleum Co.(a) | | | 35,045 | | | | 1,812,878 | |
| Cal-Maine Foods, Inc. | | | 14,471 | | | | 521,824 | |
| Centennial Resource Development, Inc., Class A(a) | | | 253,214 | | | | 1,823,141 | |
| Century Aluminum Co.(a) | | | 19,099 | | | | 252,298 | |
| CF Industries Holdings, Inc. | | | 128,383 | | | | 7,292,153 | |
| ChampionX Corp.(a) | | | 42,298 | | | | 1,109,477 | |
| Chemours Co. | | | 33,674 | | | | 943,545 | |
| Chevron Corp. | | | 16,947 | | | | 1,940,262 | |
| | | Shares | | | Value
(Note 2) | |
| United States (continued) | | | | | | | | |
| Cleveland-Cliffs, Inc.(a) | | | 35,956 | | | $ | 866,899 | |
| CNX Resources Corp.(a) | | | 64,935 | | | | 948,700 | |
| Commercial Metals Co. | | | 23,930 | | | | 770,067 | |
| Compass Minerals International, Inc. | | | 7,430 | | | | 487,408 | |
| Comstock Resources, Inc.(a) | | | 179,790 | | | | 1,774,527 | |
| ConocoPhillips | | | 55,244 | | | | 4,115,126 | |
| Continental Resources, Inc. | | | 17,307 | | | | 844,755 | |
| Corteva, Inc. | | | 62,955 | | | | 2,716,508 | |
| Coterra Energy, Inc. | | | 61,433 | | | | 1,309,752 | |
| Deere & Co. | | | 4,669 | | | | 1,598,245 | |
| Devon Energy Corp. | | | 43,208 | | | | 1,731,777 | |
| Diamondback Energy, Inc. | | | 36,615 | | | | 3,924,762 | |
| Enphase Energy, Inc.(a) | | | 10,981 | | | | 2,543,529 | |
| EOG Resources, Inc. | | | 63,868 | | | | 5,905,234 | |
| Essential Utilities, Inc. | | | 25,937 | | | | 1,220,855 | |
| Evoqua Water Technologies Corp.(a) | | | 126,349 | | | | 5,285,179 | |
| Exxon Mobil Corp. | | | 22,980 | | | | 1,481,521 | |
| First Solar, Inc.(a) | | | 10,918 | | | | 1,305,684 | |
| FMC Corp. | | | 3,036 | | | | 276,306 | |
| Freeport-McMoRan, Inc. | | | 29,192 | | | | 1,101,122 | |
| FuelCell Energy, Inc.(a) | | | 194,280 | | | | 1,552,297 | |
| Green Plains, Inc.(a) | | | 33,207 | | | | 1,260,206 | |
| Halliburton Co. | | | 82,737 | | | | 2,067,598 | |
| Hecla Mining Co. | | | 211,701 | | | | 1,223,632 | |
| Helix Energy Solutions Group, Inc.(a) | | | 302,387 | | | | 1,143,023 | |
| Helmerich & Payne, Inc. | | | 52,323 | | | | 1,624,106 | |
| Hess Corp. | | | 15,736 | | | | 1,299,322 | |
| HollyFrontier Corp. | | | 22,080 | | | | 746,304 | |
| Ingredion, Inc. | | | 24,933 | | | | 2,374,370 | |
| Kinder Morgan, Inc. | | | 5,763 | | | | 96,530 | |
| Kosmos Energy, Ltd.(a) | | | 351,823 | | | | 1,266,563 | |
| Laredo Petroleum, Inc.(a) | | | 3,530 | | | | 266,162 | |
| Liberty Oilfield Services, Inc., Class A(a) | | | 27,088 | | | | 349,977 | |
| Livent Corp.(a) | | | 39,051 | | | | 1,102,019 | |
| Magnolia Oil & Gas Corp., Class A | | | 91,528 | | | | 1,911,105 | |
| Marathon Oil Corp. | | | 157,414 | | | | 2,568,996 | |
| Marathon Petroleum Corp. | | | 24,420 | | | | 1,610,011 | |
| Matador Resources Co. | | | 9,992 | | | | 418,165 | |
| Mosaic Co. | | | 80,002 | | | | 3,325,683 | |
| Murphy Oil Corp. | | | 65,937 | | | | 1,835,027 | |
| National Oilwell Varco, Inc.(a) | | | 84,671 | | | | 1,187,087 | |
| New WEI, Inc.(a) | | | 68,768 | | | | 103 | |
| Newmont Corp. | | | 28,525 | | | | 1,540,350 | |
| Northern Oil and Gas, Inc.(a) | | | 13,153 | | | | 304,623 | |
| Occidental Petroleum Corp. | | | 69,074 | | | | 2,316,053 | |
| Oceaneering International, Inc.(a) | | | 69,252 | | | | 941,827 | |
| Ormat Technologies, Inc. | | | 50,064 | | | | 3,621,129 | |
| Ovintiv, Inc. | | | 57,283 | | | | 2,149,258 | |
| Patterson-UTI Energy, Inc. | | | 187,413 | | | | 1,604,255 | |
| PDC Energy, Inc. | | | 67,573 | | | | 3,534,744 | |
| Phillips 66 | | | 8,398 | | | | 628,002 | |
| Pilgrim's Pride Corp.(a) | | | 45,023 | | | | 1,267,848 | |
| Pioneer Natural Resources Co. | | | 12,603 | | | | 2,356,509 | |
| Plug Power, Inc.(a) | | | 21,677 | | | | 829,579 | |
| PotlatchDeltic Corp., REIT | | | 68,244 | | | | 3,567,114 | |
See Notes to Financial Statements.
ALPS | CoreCommodity Management
CompleteCommodities® Strategy Fund
| Consolidated Statement of Investments | October 31, 2021 |
| | | Shares | | | Value
(Note 2) | |
| United States (continued) | | | | | | | | |
| ProPetro Holding Corp.(a) | | | 114,066 | | | $ | 1,093,893 | |
| Rayonier, Inc., REIT | | | 22,544 | | | | 841,568 | |
| Reliance Steel & Aluminum Co. | | | 4,037 | | | | 590,048 | |
| Renewable Energy Group, Inc.(a) | | | 49,914 | | | | 3,194,496 | |
| Royal Gold, Inc. | | | 8,866 | | | | 877,911 | |
| RPC, Inc.(a) | | | 140,085 | | | | 755,058 | |
| Sanderson Farms, Inc. | | | 38,329 | | | | 7,261,428 | |
| Schlumberger NV | | | 29,651 | | | | 956,541 | |
| SM Energy Co. | | | 28,819 | | | | 989,068 | |
| SunPower Corp.(a) | | | 64,160 | | | | 2,159,626 | |
| Talos Energy, Inc.(a) | | | 84,365 | | | | 1,094,214 | |
| Tellurian, Inc.(a) | | | 84,139 | | | | 329,825 | |
| Transocean, Ltd.(a) | | | 327,020 | | | | 1,154,381 | |
| Tyson Foods, Inc., Class A | | | 113,035 | | | | 9,039,408 | |
| US Silica Holdings, Inc.(a) | | | 105,682 | | | | 1,023,002 | |
| Valero Energy Corp. | | | 15,840 | | | | 1,224,907 | |
| Warrior Met Coal, Inc. | | | 18,618 | | | | 446,273 | |
| Williams Cos., Inc. | | | 1,855 | | | | 52,107 | |
| | | | | | | | 157,740,615 | |
| | | | | | | | | |
| TOTAL COMMON STOCKS | | | | | | | | |
| (Cost $317,380,513) | | | | | | | 376,916,315 | |
| | | | | | | | | |
| MASTER LIMITED PARTNERSHIPS (0.04%) | | | | | | | | |
| United States (0.04%) | | | | | | | | |
| Energy Transfer LP | | | 4,974 | | | | 47,303 | |
| Enterprise Products Partners LP | | | 10,676 | | | | 242,131 | |
| Magellan Midstream Partners LP | | | 2,054 | | | | 100,646 | |
| MPLX LP | | | 1,555 | | | | 46,837 | |
| Plains All American Pipeline LP | | | 3,090 | | | | 31,271 | |
| | | | | | | | 468,188 | |
| | | | | | | | | |
| TOTAL MASTER LIMITED PARTNERSHIPS | | | | | | | | |
| (Cost $900,221) | | | | | | | 468,188 | |
| | | | | | | | | |
| | | Principal
Amount | | | Value
(Note 2) | |
| GOVERNMENT BONDS (60.12%) | | | | | | | | |
| U.S. Treasury Bonds (60.12%) | | | | | | | | |
| United States Treasury Bill | | | | | | | | |
| 0.002%, 11/4/21(d) | | $ | 345,400,000 | | | $ | 345,399,137 | |
| 0.049%, 1/27/22 | | | 27,000,000 | | | | 26,996,574 | |
| United States Treasury Inflation Indexed Bonds | | | | | | | | |
| 0.125%, 1/15/22(d) | | | 220,992,510 | | | | 222,973,942 | |
| 0.625%, 4/15/23 | | | 112,330,560 | | | | 118,137,777 | |
| United States Treasury Notes | | | | | | | | |
| 1.750%, 2/28/22(d) | | | 19,500,000 | | | | 19,607,912 | |
| 1.875%, 5/31/22 | | | 27,000,000 | | | | 27,279,227 | |
| | | | | | | | 760,394,569 | |
| TOTAL GOVERNMENT BONDS | | | | | | | | |
| (Cost $758,455,493) | | | | | | | 760,394,569 | |
| | | Value
(Note 2) | |
| TOTAL INVESTMENTS (89.97%) | | | | |
| (Cost $1,076,736,227) | | $ | 1,137,779,072 | |
| | | | | |
| Other Assets In Excess Of Liabilities (10.03%) | | | 126,781,355 | |
| NET ASSETS - 100.00% | | $ | 1,264,560,427 | |
| (a) | Non-Income Producing Security. |
| (b) | Security exempt from registration under rule 144A of the securities act of 1933. This Security may be resold in transactions exempt from registration, normally to qualified institutional buyers. As of October 31, 2021, the market value of those securities was $1,909,799 representing 0.15% of the Fund's net assets. |
| (c) | Securities were purchased pursuant to Regulation S under the Securities Act of 1933, which exempts securities offered and sold outside of the United States from registration. Such securities cannot be sold in the United States without either an effective registration statement filed pursuant to the Securities Act of 1933, or pursuant to an exemption from registration. These securities have been deemed liquid under guidelines approved by the Fund's Board of Trustees. As of October 31, 2021 the aggregate market value of those securities was $1,909,799 representing 0.15% of net assets. |
| (d) | Security, or portion of security, is being held as collateral for total return swap contracts and futures contracts aggregating a total market value of $80,130,017. |
For Fund compliance purposes, the Fund's industry and geographical classifications refer to any one or more of the industry sub-classifications used by one or more widely recognized market indexes or ratings group indexes, and/or as defined by Fund management. This definition may not apply for purposes of this report, which may combine sub-classifications for reporting ease. Industries and regions are shown as a percent of net assets.
See Notes to Financial Statements.
ALPS | CoreCommodity Management
CompleteCommodities® Strategy Fund
| Consolidated Statement of Investments | October 31, 2021 |
FUTURES CONTRACTS
| Description | | Counterparty | | Position | | Contracts | | Expiration Date | | Notional Amount/
Fair Value (Note 2) | | | Unrealized Appreciation | |
| Corn Future | | Morgan Stanley | | Long | | 297 | | 12/14/21 | | $ | 8,438,513 | | | $ | 89,228 | |
| Frzn Concentrated OJ | | Morgan Stanley | | Short | | (12) | | 01/10/22 | | | (221,490 | ) | | | 2,275 | |
| Gasoline RBOB Future | | Morgan Stanley | | Short | | (44) | | 11/30/21 | | | (4,379,206 | ) | | | 93,128 | |
| Gold Future | | Morgan Stanley | | Long | | 206 | | 12/29/21 | | | 36,748,340 | | | | 67,612 | |
| Hard Red Winter Wheat Future | | Morgan Stanley | | Long | | 64 | | 12/14/21 | | | 2,514,400 | | | | 224,642 | |
| Heating Oil Future | | Morgan Stanley | | Short | | (102) | | 11/30/21 | | | (10,618,751 | ) | | | 273,088 | |
| Lean Hogs Future | | Morgan Stanley | | Long | | 82 | | 12/14/21 | | | 2,495,260 | | | | 57,353 | |
| Live Cattle Future | | Morgan Stanley | | Short | | (202) | | 12/31/21 | | | (10,445,420 | ) | | | 337,410 | |
| LME Copper Future | | Morgan Stanley | | Long | | 300 | | 11/15/21 | | | 72,963,750 | | | | 2,734,677 | |
| LME Nickel Future | | Morgan Stanley | | Long | | 126 | | 11/15/21 | | | 14,761,656 | | | | 229,048 | |
| LME Zinc Future | | Morgan Stanley | | Long | | 267 | | 11/15/21 | | | 22,977,019 | | | | 1,926,563 | |
| Low Su Gasoil G Nov21 | | Morgan Stanley | | Long | | 332 | | 11/11/21 | | | 23,854,200 | | | | 512,505 | |
| Platinum Future | | Morgan Stanley | | Long | | 265 | | 01/27/22 | | | 13,524,275 | | | | 1,272,266 | |
| Silver Future | | Morgan Stanley | | Long | | 194 | | 12/29/21 | | | 23,230,530 | | | | 760,235 | |
| Sugar #11 (World) | | Morgan Stanley | | Short | | (229) | | 02/28/22 | | | (4,942,370 | ) | | | 335,510 | |
| Wheat Future | | Morgan Stanley | | Long | | 45 | | 12/14/21 | | | 1,738,688 | | | | 99,452 | |
| | | | | | | | | | | $ | 192,639,394 | | | $ | 9,014,992 | |
| Description | | Counterparty | | Position | | Contracts | | Expiration Date | | Notional Amount/
Fair Value (Note 2) | | | Unrealized Depreciation | |
| Brent Crude Future | | Morgan Stanley | | Long | | 908 | | 11/30/21 | | $ | 76,017,760 | | | $ | (364,470 | ) |
| Coffee 'C' Future | | Morgan Stanley | | Short | | (39) | | 12/20/21 | | | (2,982,769 | ) | | | (715,996 | ) |
| Copper Future | | Morgan Stanley | | Short | | (474) | | 03/29/22 | | | (51,429,000 | ) | | | (201,983 | ) |
| Cotton No.2 Future | | Morgan Stanley | | Short | | (166) | | 12/08/21 | | | (9,532,550 | ) | | | (2,484,128 | ) |
| LME Aluminum Future | | Morgan Stanley | | Long | | 164 | | 11/15/21 | | | 11,120,225 | | | | (88,223 | ) |
| LME Copper Future | | Morgan Stanley | | Short | | (36) | | 11/15/21 | | | (8,755,650 | ) | | | (93,489 | ) |
| Natural Gas Future | | Morgan Stanley | | Long | | 834 | | 11/26/21 | | | 45,252,840 | | | | (834,898 | ) |
| Soybean Future | | Morgan Stanley | | Long | | 93 | | 03/14/22 | | | 5,854,350 | | | | (23,480 | ) |
| Soybean Meal Future | | Morgan Stanley | | Long | | 349 | | 12/14/21 | | | 11,607,740 | | | | (883,952 | ) |
| WTI Crude Future | | Morgan Stanley | | Short | | (230) | | 01/20/22 | | | (18,395,400 | ) | | | (2,536,074 | ) |
| WTI Crude Future | | Morgan Stanley | | Short | | (1,008) | | 02/22/22 | | | (79,087,680 | ) | | | (2,710,583 | ) |
| | | | | | | | | | | $ | (20,330,134 | ) | | $ | (10,937,276 | ) |
See Notes to Financial Statements.
ALPS | CoreCommodity Management
CompleteCommodities® Strategy Fund
| Consolidated Statement of Investments | October 31, 2021 |
TOTAL RETURN SWAP CONTRACTS(a)
| Swap Counterparty | | Reference Obligation | | Notional Amount | | | Floating Rate/Fixed Amount Paid by Fund* | | Termination Date | | Value | | | Unrealized Appreciation | |
| Citibank | | CRB 3m Fwd TR Index** | | $ | 206,078,650 | | | USB3MTA + 24 bps | | 9/30/2022 | | $ | 206,078,655 | | | $ | 5 | |
| Goldman Sachs | | CRB 3m Fwd TR Index** | | | 15,852,885 | | | USB3MTA + 25 bps | | 9/30/2022 | | $ | 15,852,886 | | | | 1 | |
| Societe Generale | | CRB 3m Fwd TR Index** | | | 62,825,070 | | | USB3MTA + 28 bps | | 11/30/2021 | | $ | 62,825,073 | | | | 3 | |
| UBS Group AG | | CRB 3m Fwd TR Index** | | | 216,901,376 | | | USB3MTA + 25 bps | | 11/30/2021 | | $ | 216,901,377 | | | | 1 | |
| | | | | $ | 501,657,981 | | | | | | | $ | 501,657,991 | | | $ | 10 | |
| Swap Counterparty | | Reference Obligation | | Notional Amount | | | Floating Rate/Fixed Amount Paid by Fund* | | Termination Date | | Value | | | Unrealized Depreciation | |
| Merrill Lynch | | CRB 3m Fwd TR Index** | | $ | 203,368,817 | | | USB3MTA + 25 bps | | 6/29/2022 | | $ | 203,368,542 | | | $ | (275 | ) |
| | | | | $ | 203,368,817 | | | | | | | $ | 203,368,542 | | | $ | (275 | ) |
| (a) | For long positions in the total return swap, the Fund receives payments based on any positive return of the Reference Obligation less the rate paid by the Fund. The Fund makes payments on any negative return of such Reference Obligations plus the rate paid by the fund. For short positions in the total return swap, the Fund makes payments based on any positive return of the Reference Obligation less the rate paid by the Fund. The Fund receives payments on any negative return of such Reference Obligations plus the rate paid by the Fund. |
| * | United States Auction Results 3 Month Treasury Bill High Discount. Total return swap resets monthly. |
| ** | CRB - Commodity Research Bureau |
See Notes to Financial Statements.
ALPS | CoreCommodity Management
CompleteCommodities® Strategy Fund
| Consolidated Statement of Assets and Liabilities | October 31, 2021 |
| ASSETS | | | |
| Investments, at value | | $ | 1,137,779,072 | |
| Cash | | | 98,259,720 | |
| Foreign currency, at value (Cost $1,641,701) | | | 1,644,885 | |
| Unrealized appreciation on total return swap contracts | | | 10 | |
| Receivable for shares sold | | | 10,916,331 | |
| Receivable due from broker for total return swap contracts | | | 18,265,832 | |
| Receivable due from broker for futures contracts | | | 4,708,576 | |
| Dividends and interest receivable | | | 699,441 | |
| Prepaid expenses and other assets | | | 91,309 | |
| Total Assets | | | 1,272,365,176 | |
| LIABILITIES | | | | |
| Payable for investments purchased | | | 3,053,878 | |
| Payable for variation margin on futures contracts | | | 2,128,906 | |
| Payable for shares redeemed | | | 762,862 | |
| Unrealized depreciation on total return swap contracts | | | 275 | |
| Investment advisory fees payable | | | 891,156 | |
| Administration and transfer agency fees payable | | | 415,377 | |
| Distribution and services fees payable | | | 61,218 | |
| Trustees' fees and expenses payable | | | 12,936 | |
| Professional fees payable | | | 38,284 | |
| Accrued expenses and other liabilities | | | 439,857 | |
| Total Liabilities | | | 7,804,749 | |
| NET ASSETS | | $ | 1,264,560,427 | |
| NET ASSETS CONSIST OF | | | | |
| Paid-in capital | | $ | 1,046,287,514 | |
| Total distributable earnings | | | 218,272,913 | |
| NET ASSETS | | $ | 1,264,560,427 | |
| INVESTMENTS, AT COST | | $ | 1,076,736,227 | |
| | | | | |
| PRICING OF SHARES | | | | |
| Investor Class: | | | | |
| Net Asset Value, offering and redemption price per share | | $ | 9.50 | |
| Net Assets | | $ | 89,299,731 | |
| Shares of beneficial interest outstanding (unlimited number of shares, no par value common stock authorized) | | | 9,395,938 | |
| Class A: | | | | |
| Net Asset Value, offering and redemption price per share | | $ | 9.52 | |
| Net Assets | | $ | 7,348,589 | |
| Shares of beneficial interest outstanding (unlimited number of shares, no par value common stock authorized) | | | 772,219 | |
| Maximum offering price per share ((NAV/0.9450), based on maximum sales charge of 5.50% of the offering price) | | $ | 10.07 | |
| Class C: | | | | |
| Net Asset Value, offering and redemption price per share(a) | | $ | 8.94 | |
| Net Assets | | $ | 13,789,112 | |
| Shares of beneficial interest outstanding (unlimited number of shares, no par value common stock authorized) | | | 1,542,693 | |
| Class I: | | | | |
| Net Asset Value, offering and redemption price per share | | $ | 9.62 | |
| Net Assets | | $ | 1,154,122,995 | |
| Shares of beneficial interest outstanding (unlimited number of shares, no par value common stock authorized) | | | 119,981,495 | |
| (a) | Redemption price per share may be reduced for any applicable contingent deferred sales charge. For a description of a possible sales charge, please see the Fund's Prospectus. |
See Notes to Financial Statements.
ALPS | CoreCommodity Management
CompleteCommodities® Strategy Fund
| Consolidated Statement of Operations | For the Year Ended October 31, 2021 |
| | | | |
| INVESTMENT INCOME | | | |
| Dividends | | $ | 7,892,861 | |
| Foreign taxes withheld on dividends | | | (649,719 | ) |
| Interest and other income, net of premium amortization and accretion of discount | | | 16,433,815 | |
| Total Investment Income | | | 23,676,957 | |
| | | | | |
| EXPENSES | | | | |
| Investment advisory fees | | | 7,289,229 | |
| Investment advisory fees - subsidiary (Note 8) | | | 1,543,180 | |
| Administrative fees | | | 951,243 | |
| Transfer agency fees | | | 778,440 | |
| Distribution and service fees | | | | |
| Investor Class | | | 272,133 | |
| Class A | | | 12,877 | |
| Class C | | | 62,103 | |
| Professional fees | | | 43,546 | |
| Reports to shareholders and printing fees | | | 49,690 | |
| State registration fees | | | 80,922 | |
| Insurance fees | | | 6,683 | |
| Custody fees | | | 51,635 | |
| Trustees' fees and expenses | | | 44,159 | |
| Repayment of previously waived fees | | | | |
| Class C | | | 105 | |
| Miscellaneous expenses | | | 28,473 | |
| Total Expenses | | | 11,214,418 | |
| Less fees waived/reimbursed by investment advisor (Note 8) | | | | |
| Waiver of investment advisory fees - subsidiary | | | (1,543,180 | ) |
| Net Expenses | | | 9,671,238 | |
| Net Investment Income | | | 14,005,719 | |
| Net realized gain on investments | | | 38,200,917 | |
| Net realized gain on futures contracts | | | 18,559,386 | |
| Net realized gain on total return swap contracts | | | 190,103,040 | |
| Net realized gain on foreign currency transactions | | | 16,108 | |
| Net Realized Gain | | | 246,879,451 | |
| Net change in unrealized appreciation on investments | | | 72,253,407 | |
| Net change in unrealized appreciation on futures contracts | | | 3,713,079 | |
| Net change in unrealized appreciation on total return swap contracts | | | 65 | |
| Net change in unrealized depreciation on translation of assets and liabilities denominated in foreign currencies | | | (2,035 | ) |
| Net Change in Unrealized Appreciation | | | 75,964,516 | |
| NET REALIZED AND UNREALIZED GAIN ON INVESTMENTS | | | 322,843,967 | |
| NET INCREASE IN NET ASSETS RESULTING FROM OPERATIONS | | $ | 336,849,686 | |
See Notes to Financial Statements.
ALPS | CoreCommodity Management
CompleteCommodities® Strategy Fund
Consolidated Statements of Changes in Net Assets
| | | For the Year Ended October 31, 2021 | | | For the Year Ended October 31, 2020 | |
| OPERATIONS | | | | | | |
| Net investment income | | $ | 14,005,719 | | | $ | 2,937,921 | |
| Net realized gain/(loss) | | | 246,879,451 | | | | (53,797,734 | ) |
| Net change in unrealized appreciation | | | 75,964,516 | | | | 8,098,709 | |
| Net Increase/(Decrease) in Net Assets Resulting from Operations | | | 336,849,686 | | | | (42,761,104 | ) |
| | | | | | | | | |
| TOTAL DISTRIBUTIONS | | | | | | | | |
| From distributable earnings | | | | | | | | |
| Investor Class | | | (174,393 | ) | | | (375,275 | ) |
| Class A | | | (5,446 | ) | | | (7,077 | ) |
| Class C | | | (5,670 | ) | | | (53,444 | ) |
| Class I | | | (1,745,843 | ) | | | (4,950,473 | ) |
| Net Decrease in Net Assets from Distributions | | | (1,931,352 | ) | | | (5,386,269 | ) |
| | | | | | | | | |
| BENEFICIAL INTEREST TRANSACTIONS (NOTE 6) | | | | | | | | |
| Shares sold | | | | | | | | |
| Investor Class | | | 36,968,075 | | | | 21,811,745 | |
| Class A | | | 5,771,217 | | | | 856,402 | |
| Class C | | | 10,727,794 | | | | 336,823 | |
| Class I | | | 583,450,695 | | | | 187,684,821 | |
| Dividends reinvested | | | | | | | | |
| Investor Class | | | 167,790 | | | | 358,287 | |
| Class A | | | 2,437 | | | | 5,821 | |
| Class C | | | 4,530 | | | | 28,534 | |
| Class I | | | 1,555,689 | | | | 3,950,674 | |
| Shares redeemed, net of redemption fees | | | | | | | | |
| Investor Class | | | (27,008,696 | ) | | | (9,300,933 | ) |
| Class A | | | (1,052,463 | ) | | | (304,997 | ) |
| Class C | | | (1,304,792 | ) | | | (3,677,008 | ) |
| Class I | | | (171,560,901 | ) | | | (208,665,894 | ) |
| Net Increase/(Decrease) in Net Assets Derived from Beneficial Interest Transactions | | | 437,721,375 | | | | (6,915,725 | ) |
| | | | | | | | | |
| Net increase/(decrease) in net assets | | | 772,639,709 | | | | (55,063,098 | ) |
| | | | | | | | | |
| NET ASSETS | | | | | | | | |
| Beginning of year | | | 491,920,718 | | | | 546,983,816 | |
| End of year | | $ | 1,264,560,427 | | | $ | 491,920,718 | |
See Notes to Financial Statements.
ALPS | CoreCommodity Management
CompleteCommodities® Strategy Fund – Investor Class
Consolidated Financial Highlights
Selected data for a share of beneficial interest outstanding throughout the periods indicated:
| | | For the
Year Ended
October 31,
2021 | | | For the
Year Ended
October 31,
2020 | | | For the
Year Ended
October 31,
2019 | | | For the
Year Ended
October 31,
2018(a) | | | For the
Year Ended
October 31,
2017 | |
| Net asset value, beginning of period(b) | | $ | 6.06 | | | $ | 6.68 | | | $ | 7.54 | | | $ | 7.64 | | | $ | 7.29 | |
| INCOME/(LOSS) FROM INVESTMENT OPERATIONS: | | | | | | | | | | | | | | | | | | | | |
| Net investment income/(loss)(c) | | | 0.11 | | | | 0.02 | | | | 0.06 | | | | 0.05 | | | | (0.01 | )(d) |
| Net realized and unrealized gain/(loss) | | | 3.35 | | | | (0.58 | ) | | | (0.71 | ) | | | 0.04 | | | | 0.36 | |
| Total from investment operations | | | 3.46 | | | | (0.56 | ) | | | (0.65 | ) | | | 0.09 | | | | 0.35 | |
| DISTRIBUTIONS: | | | | | | | | | | | | | | | | | | | | |
| From net investment income | | | (0.02 | ) | | | (0.06 | ) | | | (0.21 | ) | | | (0.19 | ) | | | (0.00 | )(e) |
| Total distributions | | | (0.02 | ) | | | (0.06 | ) | | | (0.21 | ) | | | (0.19 | ) | | | (0.00 | )(e) |
| REDEMPTION FEES ADDED TO PAID-IN CAPITAL (NOTE 6) | | | 0.00 | (e) | | | 0.00 | (e) | | | 0.00 | (e) | | | 0.00 | (e) | | | 0.00 | (e) |
| Net increase/(decrease) in net asset value | | | 3.44 | | | | (0.62 | ) | | | (0.86 | ) | | | (0.10 | ) | | | 0.35 | |
| Net asset value, end of year | | $ | 9.50 | | | $ | 6.06 | | | $ | 6.68 | | | $ | 7.54 | | | $ | 7.64 | |
| TOTAL RETURN(f) | | | 57.25 | % | | | (8.44 | )% | | | (8.71 | )% | | | 1.23 | % | | | 4.85 | % |
| RATIOS/SUPPLEMENTAL DATA: | | | | | | | | | | | | | | | | | | | | |
| Net assets, end of year (000s) | | $ | 89,300 | | | $ | 49,060 | | | $ | 39,226 | | | $ | 48,728 | | | $ | 47,845 | |
| Ratio of expenses to average net assets excluding fee waivers and reimbursements | | | 1.37 | %(g) | | | 1.40 | %(g) | | | 1.39 | %(g) | | | 1.40 | %(g) | | | 1.38 | % |
| Ratio of expenses to average net assets including fee waivers and reimbursements | | | 1.37 | % | | | 1.40 | % | | | 1.39 | % | | | 1.40 | % | | | 1.38 | % |
| Ratio of net investment income/(loss) to average net assets | | | 1.36 | % | | | 0.40 | % | | | 0.82 | % | | | 0.66 | % | | | (0.10 | )% |
| Portfolio turnover rate(h) | | | 54 | % | | | 98 | % | | | 81 | % | | | 42 | % | | | 66 | % |
| (a) | Prior to December 1, 2017, Investor Class was known as Class A. |
| (b) | Per share amounts and ratios to average net assets include income and expenses of the CoreCommodity Management Cayman Commodity Fund Ltd. (wholly-owned subsidiary). |
| (c) | Calculated using the average shares method. |
| (d) | The per share amount does not correspond to activity reflected in the Statement of Operations due to class specific expenses during the period. |
| (e) | Less than $0.005 or ($0.005) per share. |
| (f) | Total returns are for the period indicated and have not been annualized. Total returns would have been lower had certain expenses not been waived during the period. Returns shown do not reflect the deduction of taxes that a shareholder would pay on Fund distributions or the redemption of Fund shares. |
| (g) | The ratio of operating expenses excluding fee waiver/reimbursements to average net assets is calculated excluding the waived Subsidiary management fee (see Note 8 for additional detail). The ratio inclusive of that fee would be for the years ended October 31, 2021, October 31, 2020, October 31, 2019 and October 31, 2018, respectively, 1.55%, 1.58%, 1.54% and 1.56%. |
| (h) | Portfolio turnover rate for periods less than one full year have not been annualized. |
See Notes to Financial Statements.
ALPS | CoreCommodity Management
CompleteCommodities® Strategy Fund – Class A
Consolidated Financial Highlights
Selected data for a share of beneficial interest outstanding throughout the periods indicated:
| | | For the
Year Ended
October 31,
2021 | | | For the Year Ended October 31, 2020 | | | For the Year Ended October 31, 2019 | | | For the Period June 12, 2018 (Commencement of Operations) to October 31, 2018 | |
| Net asset value, beginning of period(a) | | $ | 6.07 | | | $ | 6.68 | | | $ | 7.54 | | | $ | 8.16 | |
| | | | | | | | | | | | | | | | | |
| INCOME FROM INVESTMENT OPERATIONS: | | | | | | | | | | | | | | | | |
| Net investment income(b) | | | 0.13 | | | | 0.04 | | | | 0.07 | | | | (0.00 | )(c) |
| Net realized and unrealized gain/(loss) | | | 3.34 | | | | (0.59 | ) | | | (0.72 | ) | | | (0.62 | ) |
| Total from investment operations | | | 3.47 | | | | (0.55 | ) | | | (0.65 | ) | | | (0.62 | ) |
| | | | | | | | | | | | | | | | | |
| DISTRIBUTIONS: | | | | | | | | | | | | | | | | |
| From net investment income | | | (0.02 | ) | | | (0.06 | ) | | | (0.21 | ) | | | – | |
| Total distributions | | | (0.02 | ) | | | (0.06 | ) | | | (0.21 | ) | | | – | |
| | | | | | | | | | | | | | | | | |
| REDEMPTION FEES ADDED TO PAID-IN CAPITAL (NOTE 6) | | | – | | | | 0.00 | (c) | | | – | | | | – | |
| Net increase/(decrease) in net asset value | | | 3.45 | | | | (0.61 | ) | | | (0.86 | ) | | | (0.62 | ) |
| Net asset value, end of year | | $ | 9.52 | | | $ | 6.07 | | | $ | 6.68 | | | $ | 7.54 | |
| TOTAL RETURN(d) | | | 57.33 | % | | | (8.29 | )% | | | (8.71 | )% | | | (7.60 | )% |
| | | | | | | | | | | | | | | | | |
| RATIOS/SUPPLEMENTAL DATA: | | | | | | | | | | | | | | | | |
| Net assets, end of year (000s) | | $ | 7,349 | | | $ | 1,254 | | | $ | 751 | | | $ | 191 | |
| Ratio of expenses to average net assets excluding fee waivers and reimbursements | | | 1.32 | %(e) | | | 1.34 | %(e) | | | 1.40 | %(e) | | | 1.48 | %(e)(f) |
| Ratio of expenses to average net assets including fee waivers and reimbursements | | | 1.32 | % | | | 1.34 | % | | | 1.40 | % | | | 1.45 | %(f) |
| Ratio of net investment income/(loss) to average net assets | | | 1.56 | % | | | 0.62 | % | | | 0.99 | % | | | (0.10 | )%(f) |
| Portfolio turnover rate(g) | | | 54 | % | | | 98 | % | | | 81 | % | | | 42 | % |
| (a) | Per share amounts and ratios to average net assets include income and expenses of the CoreCommodity Management Cayman Commodity Fund Ltd. (wholly-owned subsidiary). |
| (b) | Calculated using the average shares method. |
| (c) | Less than $0.005 or ($0.005) per share. |
| (d) | Total returns are for the period indicated and have not been annualized. Total returns would have been lower had certain expenses not been waived during the period. Returns shown do not reflect the deduction of taxes that a shareholder would pay on Fund distributions or the redemption of Fund shares. Returns shown exclude any applicable sales charges. |
| (e) | The ratio of operating expenses excluding fee waiver/reimbursements to average net assets is calculated excluding the waived Subsidiary management fee (see Note 8 for additional detail). The ratio inclusive of that fee would be for the years ended October 31, 2021, October 31, 2020, October 31, 2019 and October 31, 2018, respectively, 1.50%, 1.52%, 1.55 % and 1.64%. |
| (g) | Portfolio turnover rate for periods less than one full year have not been annualized. |
See Notes to Financial Statements.
ALPS | CoreCommodity Management
CompleteCommodities® Strategy Fund – Class C
Consolidated Financial Highlights
Selected data for a share of beneficial interest outstanding throughout the periods indicated:
| | | For the
Year Ended
October 31,
2021 | | | For the
Year Ended
October 31,
2020 | | | For the
Year Ended
October 31,
2019 | | | For the
Year Ended
October 31,
2018 | | | For the
Year Ended
October 31,
2017 | |
| Net asset value, beginning of period(a) | | $ | 5.73 | | | $ | 6.35 | | | $ | 7.22 | | | $ | 7.36 | | | $ | 7.07 | |
| INCOME/(LOSS) FROM INVESTMENT OPERATIONS: | | | | | | | | | | | | | | | | | | | | |
| Net investment income/(loss)(b) | | | 0.07 | | | | (0.02 | )(c) | | | 0.01 | | | | (0.00 | )(c)(d) | | | (0.06 | )(c) |
| Net realized and unrealized gain/(loss) | | | 3.14 | | | | (0.54 | ) | | | (0.68 | ) | | | 0.04 | | | | 0.35 | |
| Total from investment operations | | | 3.21 | | | | (0.56 | ) | | | (0.67 | ) | | | 0.04 | | | | 0.29 | |
| DISTRIBUTIONS: | | | | | | | | | | | | | | | | | | | | |
| From net investment income | | | (0.01 | ) | | | (0.06 | ) | | | (0.20 | ) | | | (0.18 | ) | | | – | |
| Total distributions | | | (0.01 | ) | | | (0.06 | ) | | | (0.20 | ) | | | (0.18 | ) | | | – | |
| REDEMPTION FEES ADDED TO PAID-IN CAPITAL (NOTE 6) | | | 0.01 | | | | – | | | | 0.00 | (d) | | | – | | | | – | |
| Net increase/(decrease) in net asset value | | | 3.21 | | | | (0.62 | ) | | | (0.87 | ) | | | (0.14 | ) | | | 0.29 | |
| Net asset value, end of year | | $ | 8.94 | | | $ | 5.73 | | | $ | 6.35 | | | $ | 7.22 | | | $ | 7.36 | |
| TOTAL RETURN(e) | | | 56.37 | % | | | (8.97 | )% | | | (9.35 | )% | | | 0.62 | % | | | 4.10 | % |
| RATIOS/SUPPLEMENTAL DATA: | | | | | | | | | | | | | | | | | | | | |
| Net assets, end of year (000s) | | $ | 13,789 | | | $ | 2,354 | | | $ | 6,702 | | | $ | 9,510 | | | $ | 7,642 | |
| Ratio of expenses to average net assets excluding fee waivers and reimbursements | | | 2.00 | %(f) | | | 2.05 | %(f) | | | 2.05 | %(f) | | | 2.05 | %(f) | | | 2.05 | % |
| Ratio of expenses to average net assets including fee waivers and reimbursements | | | 2.00 | % | | | 2.05 | % | | | 2.05 | % | | | 2.05 | % | | | 2.05 | % |
| Ratio of net investment income/(loss) to average net assets | | | 0.84 | % | | | (0.28 | )% | | | 0.17 | % | | | (0.04 | )% | | | (0.81 | )% |
| Portfolio turnover rate(g) | | | 54 | % | | | 98 | % | | | 81 | % | | | 42 | % | | | 66 | % |
| (a) | Per share amounts and ratios to average net assets include income and expenses of the CoreCommodity Management Cayman Commodity Fund Ltd. (wholly-owned subsidiary). |
| (b) | Calculated using the average shares method. |
| (c) | The per share amount does not correspond to activity reflected in the Statement of Operations due to class specific expenses during the period. |
| (d) | Less than $0.005 or ($0.005) per share. |
| (e) | Total returns are for the period indicated and have not been annualized. Total returns would have been lower had certain expenses not been waived during the period. Returns shown do not reflect the deduction of taxes that a shareholder would pay on Fund distributions or the redemption of Fund shares. Returns shown exclude any applicable sales charges. |
| (f) | The ratio of operating expenses excluding fee waiver/reimbursements to average net assets is calculated excluding the waived Subsidiary management fee (see Note 8 for additional detail). The ratio inclusive of that fee would be for the years ended October 31, 2021, October 31, 2020, October 31, 2019 and October 31, 2018, respectively, 2.18%, 2.23%, 2.20% and 2.21%. |
| (g) | Portfolio turnover rate for periods less than one full year have not been annualized. |
See Notes to Financial Statements.
ALPS | CoreCommodity Management
CompleteCommodities® Strategy Fund – Class I
Consolidated Financial Highlights
Selected data for a share of beneficial interest outstanding throughout the periods indicated:
| | | For the
Year Ended
October 31,
2021 | | | For the
Year Ended
October 31,
2020 | | | For the
Year Ended
October 31,
2019 | | | For the
Year Ended
October 31,
2018 | | | For the
Year Ended
October 31,
2017 | |
| Net asset value, beginning of period(a) | | $ | 6.12 | | | $ | 6.73 | | | $ | 7.58 | | | $ | 7.67 | | | $ | 7.31 | |
| INCOME/(LOSS) FROM INVESTMENT OPERATIONS: | | | | | | | | | | | | | | | | | | | | |
| Net investment income(b) | | | 0.14 | | | | 0.04 | | | | 0.08 | | | | 0.07 | | | | 0.01 | |
| Net realized and unrealized gain/(loss) | | | 3.38 | | | | (0.58 | ) | | | (0.72 | ) | | | 0.03 | | | | 0.36 | |
| Total from investment operations | | | 3.52 | | | | (0.54 | ) | | | (0.64 | ) | | | 0.10 | | | | 0.37 | |
| DISTRIBUTIONS: | | | | | | | | | | | | | | | | | | | | |
| From net investment income | | | (0.02 | ) | | | (0.07 | ) | | | (0.21 | ) | | | (0.19 | ) | | | (0.01 | ) |
| Total distributions | | | (0.02 | ) | | | (0.07 | ) | | | (0.21 | ) | | | (0.19 | ) | | | (0.01 | ) |
| REDEMPTION FEES ADDED TO PAID-IN CAPITAL (NOTE 6) | | | 0.00 | (c) | | | 0.00 | (c) | | | 0.00 | (c) | | | 0.00 | (c) | | | 0.00 | (c) |
| Net increase/(decrease) in net asset value | | | 3.50 | | | | (0.61 | ) | | | (0.85 | ) | | | (0.09 | ) | | | 0.36 | |
| Net asset value, end of year | | $ | 9.62 | | | $ | 6.12 | | | $ | 6.73 | | | $ | 7.58 | | | $ | 7.67 | |
| TOTAL RETURN(d) | | | 57.74 | % | | | (8.18 | )% | | | (8.48 | )% | | | 1.42 | % | | | 5.03 | % |
| RATIOS/SUPPLEMENTAL DATA: | | | | | | | | | | | | | | | | | | | | |
| Net assets, end of year (000s) | | $ | 1,154,123 | | | $ | 439,254 | | | $ | 500,305 | | | $ | 647,195 | | | $ | 482,710 | |
| Ratio of expenses to average net assets excluding fee waivers and reimbursements | | | 1.09 | %(e) | | | 1.15 | %(e) | | | 1.14 | %(e) | | | 1.13 | %(e) | | | 1.15 | % |
| Ratio of expenses to average net assets including fee waivers and reimbursements | | | 1.09 | % | | | 1.15 | % | | | 1.14 | % | | | 1.13 | % | | | 1.15 | % |
| Ratio of net investment income to average net assets | | | 1.68 | % | | | 0.64 | % | | | 1.09 | % | | | 0.90 | % | | | 0.08 | % |
| Portfolio turnover rate(f) | | | 54 | % | | | 98 | % | | | 81 | % | | | 42 | % | | | 66 | % |
| (a) | Per share amounts and ratios to average net assets include income and expenses of the CoreCommodity Management Cayman Commodity Fund Ltd. (wholly-owned subsidiary). |
| (b) | Calculated using the average shares method. |
| (c) | Less than $0.005 or ($0.005) per share. |
| (d) | Total returns are for the period indicated and have not been annualized. Total returns would have been lower had certain expenses not been waived during the period. Returns shown do not reflect the deduction of taxes that a shareholder would pay on Fund distributions or the redemption of Fund shares. |
| (e) | The ratio of operating expenses excluding fee waiver/reimbursements to average net assets is calculated excluding the waived Subsidiary management fee (see Note 8 for additional detail). The ratio inclusive of that fee would be for the years ended October 31, 2021, October 31, 2020, October 31, 2019 and October 31, 2018, respectively, 1.27%, 1.33%, 1.29% and 1.29%. |
| (f) | Portfolio turnover rate for periods less than one full year have not been annualized. |
See Notes to Financial Statements.
ALPS | Kotak India Growth Fund
| Management Commentary | October 31, 2021 (Unaudited) |
Performance
For the 1-year period ending October 31, 2021, the ALPS/Kotak India Growth Fund returned 48.28% compared to its benchmark the NSE500 Index, which returned 56.04% over the same period (all in USD term).
Over the past year, global central banks have continued their quest on ultralow interest rates and the rapid expansion of their balance sheets, more so after the pandemic. Global liquidity is at an all-time high. The Indian Economy as well as the corporate sector are seeing a flush of optimism after a rather worrying tryst with the Covid-19 pandemic waves. Despite global equities taking a small hit due to growing global risk sentiments and uncertainty regarding China’s continued regulatory paradigm shift and push on “common prosperity”, as well as the spillovers from China’s Evergrande issue, these seemed to support the Indian markets. After the huge 2020 GDP contraction, Indian equity markets have seen steady gains, especially during the second half of 2021 with market reaching new highs.
While the frontline Nifty Index returned 51% during the period, the Nifty Midcap 100 Index returned 77.61% during the period (all in USD terms).
The chaos from social and economic uncertainties stemming from the Covid-19 pandemic continues into 2021. While the world still faces the uphill task of mitigating the challenge from the renewed surge of Covid-19 vaccine withstanding, there are signs of normalcy emerging in most facets of the economy. After witnessing a V-shaped recovery, global growth has lost momentum in the past couple of months amid (1) easing of pent-up demand from reopening, (2) fading fiscal stimulus, (3) surge in energy prices, and (4) impact of surging delta variant cases (although limited economic impact). Even as the momentum has slowed and growth remains uneven, the recovery overall remains intact. Economic data has generally been very strong.
Looking at some of the global policies: (1) US: The Federal Open Market Committee (FOMC) has already indicated its intention of tapering the asset purchases from November 2021. (2) Japan: The Bank of Japan (BOJ) kept monetary policy steady while reducing inflation and growth forecasts. It will maintain its accommodative policies after projections indicated that inflation will be below the 2% target for at least two more years. (3) Eurozone: The European Central Bank (ECB) left its key interest rates and stance unchanged in its October monetary policy meeting.
Looking back at India, Moody’s changed India’s sovereign rating outlook from ‘negative’ to ‘stable’. Fitch ratings cut India’s FY2022 (Financial year from April 2021 to March 2022) GDP forecast to 8.7% from 10%. International Monetary Fund (IMF) retained India’s GDP projections at 9.5% for the current fiscal year and 8.5% for the next year. The interest rates across markets have remained benign since the pandemic. While the fears of worsening fiscal health of the government weighed on bond markets initially, the Reserve Bank of India’s (RBI) aggressive policy response helped ease the nerves.
Though Covid second wave looked grim as the first quarter of 2021 started with more than 400k cases per day, situation improved tremendously as cases continued to head south to sub-20k per day towards October. Pace of vaccination continued to pick up, with India reaching the 1bn vaccination mark. The market movement thus far has been driven largely by 3 key factors: (1) Covid cases continuing to decline in India and pace of vaccination picking up, (2) upbeat corporate commentaries and (3) on expectations of strong medium-term growth.
Looking at economic numbers, the fiscal deficit for the April to September 2021 period (India fiscal year starts April) was at 35% of FY2021 Budget Estimate (Period from April 2021 to March 2022). Based on the Press Information Bureau (PIB) release, Gross GST collections for the April to October 2021 period stood at INR8.1tn (~US$109.5bn) — 45% higher over the same period last year. Current account registered a surplus in 1QFY22 (April to June 2021 quarter), rising to US$6.5bn against a deficit of US$8.2bn in 4QFY21 (September to December 2020) and surplus of US$19.1bn (3.7% of GDP) in 1QFY21 (April to June 2020). The capital account balance increased to US$25.8bn (3.7% of GDP, US$12.3bn in 4QFY21) led by high Foreign Direct Investment (FDI) inflows at US$11.9bn (US$3bn in 4QFY21). Overall, Balance of Payment (BOP) surplus in 1QFY22 was at US$31.9bn (US$3.4bn in 4QFY21, and US$19.8bn in 1QFY21).
Domestic economic activity has been normalizing rapidly since August as growth impulses gathered momentum amid opening up of the economy and scaling up of the vaccination drive. India’s October Services Purchasing Managers’ Index (PMI) surged to 58.4 (nearly 11-year high) from 55.2 in September, indicating substantial improvement in business activity. Composite PMI rose from 55.3 in September to 58.7 in October as growth improved in both manufacturing and services sector.
On a whole, as the global and domestic economic recovery continues, persistence of supply-side disruptions and commodity prices’ surges pose adverse risks to both growth and inflation. Central banks around the world have started reversing pandemic measures although most are still gradual. India’s economic recovery faces risks from supply disruptions and high commodity prices. The growth outlook looks promising for now with a quick rebound from the lows. However, the scarring in the bottom to middle of the consumer pyramid could have some medium-term impact on consumption even if it does not affect near-term consumption. Further, global demand will also normalize, which will be a drag on net exports.
ALPS | Kotak India Growth Fund
| Management Commentary | October 31, 2021 (Unaudited) |
Market Outlook and Valuation
October saw the markets steadily rising but then giving up its gains towards the end of the month. Valuations, oil prices, global uptick in bond yields all weighed on the Indian markets. However, the economy continued to see recovery and corporate India continued to deliver on earnings though the pace of upgrades have reduced.
The onset of the festive season coincides with the doing away with the most of the remaining Covid restrictions. Early indicators suggest record levels of sales in this ongoing festive season. Credit card spends were up 34% yoy in July-Sep quarter, with 57% yoy growth in the month of September 2021 and the momentum remain strong. One of the headwinds to consumer spends has been the steep rise in petroleum product prices over the past many months, driven by a combination of rising crude prices and higher taxes. The central government recently announced a sharp cut in fuel taxes leading to ~5% reduction in gasoline and a steep ~10% reduction in diesel prices. Some states have followed this by a further cut in state levies reducing the prices even lower. While this will definitely aid the consumption wallet and reduce inflation, such a steep cut will lead to some worries on fiscal deficit.
Retail participation in India has become a major driver of “stock prices” in the broader markets in the recent months. The key driving factor seems to be due to higher savings driven by lower consumption during the Covid period and the asset allocation shift. With the interest rates in traditional bank deposits falling, we see continued shift in allocations, both through direct participation and through mutual funds / insurance investment products. On the other side, with a very strong relative performance of Indian markets as against the other emerging markets, we have seen profit booking by foreign portfolio investors (FPIs) to the tune of $2.27bn in October.
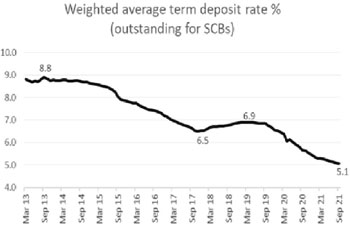
Source – Industry, Axis Capital

Source – Industry, Spark Capital
It is very visible that the “new economy” in India is gaining momentum. Funding remains strong for the “new economy” eco-system and now with some of the names being listed, the avenues of funding have widened. With some new listings in November, the markets will have some more choice of names across segments. Investors will have choice in Food delivery, E-Commerce, Marketplace, Fintech (multiple sub segments), SAAS, Gaming, Analytics, with Ed-Tech, Logistics, and the like close on the heels.
ALPS | Kotak India Growth Fund
| Management Commentary | October 31, 2021 (Unaudited) |
Funding for the “new economy” (USD mn)

Source: Economic Times, Inc42.com, VC Circle, Entrackr, Crunchbase, Yourstory, Morgan Stanley Research
We are now more constructive on the economic recovery over the next few quarters. Vaccination drive continues at elevated pace and the Covid cases continue to see further declines. The festive season has kicked off well and there are still some Covid restrictions specifically in the hospitality/ travel segment, which are now more or less removed. Housing cycle seems to have turned and Technology companies indicating record hiring along with wage pressures bodes well for the Indian real estate markets around these technology hubs. Corporate balance sheets are much healthier and with a clean of bad assets with highest ever Tier 1 capital ratios for many banks, risk appetite in banking is just around the corner. At current valuations, our view of market consolidation stays, but one should use the bouts of volatility driven by either the rate cycle or oil prices to add to India exposure as we see a longer term earnings cycle play out in corporate India.
Mr. Nitin Tejpal Jain
Fund Manager
Kotak Mahindra Asset Management (Singapore) Pte Ltd.
The views above are based on publicly available data, Kotak Group internal estimates and are based on the views of the research team at Kotak group.
The views of the author and information discussed in this commentary are as of the date of publication, are subject to change, and may not reflect the writer's current views. The views expressed are those of the author only, and represent an assessment of market conditions at a specific point in time, are opinions only and should not be relied upon as investment advice regarding a particular investment or markets in general. Such information does not constitute a recommendation to buy or sell specific securities or investment vehicles. It should not be assumed that any investment will be profitable or will equal the performance of the fund or any securities or any sectors mentioned in this letter. The subject matter contained in this letter has been derived from several sources believed to be reliable and accurate at the time of compilation. Neither ALPS Advisors, Inc., Kotak Mahindra Asset Management (Singapore) Pte Ltd., nor the Fund accepts any liability for losses either direct or consequential caused by the use of this information.
Diversification cannot guarantee gain or prevent losses.
Past performance is no guarantee of future results. Dividends are not guaranteed and are subject to change or elimination. Investments in international and emerging markets securities include exposure to risks such as currency fluctuations, foreign taxes and regulations, and the potential for illiquid markets and political instability.
ALPS Portfolio Solutions Distributor, Inc., ALPS Distributors, Inc. and ALPS Advisors Inc. are affiliated.
| ALPS | Kotak India Growth Fund | |
| Performance Update | October 31, 2021 (Unaudited) |
| | |
Performance of $10, 000 Initial Investment (as of October 31, 2021)
Comparison of change in value of a $10,000 investment

The chart above represents historical performance of a hypothetical investment of $10,000 in the Fund since inception. Past performance does not guarantee future results. This chart does not reflect the deduction of taxes that a shareholder would pay on Fund distributions or the redemption of Fund shares.
Average Annual Total Returns (as of October 31, 2021)
| | 1 Year | 3 Year | 5 Year | 10 Year | Since Inception^ | Total Expense Ratio | What You Pay* |
| Investor# (NAV) | 47.71% | 19.94% | 11.36% | 11.38% | 9.12% | 1.77% | 1.40% |
| Class A (NAV) | 47.90% | 19.81% | 11.26% | 11.33% | 9.08% | 1.76% | 1.40% |
| Class A (LOAD) | 39.79% | 17.58% | 10.01% | 10.71% | 8.50% |
| Class C (NAV) | 46.84% | 18.96% | 10.49% | 10.58% | 8.33% | 2.37% | 2.00% |
| Class C (LOAD) | 45.84% | 18.96% | 10.49% | 10.58% | 8.33% |
| Class I | 48.28% | 20.14% | 11.58% | 11.69% | 9.43% | 1.36% | 1.00% |
| Class II | 48.70% | 20.35% | 11.70% | 11.74% | 9.48% | 1.18% | 0.75% |
| Nifty 500 Index1 | 58.57% | 20.66% | 12.69% | 9.76% | 8.18% | | |
| Morningstar India Index2 | 56.04% | 21.50% | 14.12% | 9.95% | 8.30% | | |
Performance data quoted represents past performance. Past performance does not guarantee future results. Investment return and principal value of an investment will fluctuate so that an investor’s shares, when sold or redeemed, may be worth more or less than the original cost. Current performance data may be higher or lower than actual data quoted. For the most current month-end performance data, please call 1-866-759-5679.
Maximum Offering Price (MOP) for Class A shares includes the Fund’s maximum sales charge of 5.50%. Performance shown at NAV does not include these sales charges and would have been lower had it been taken into account. If you invest $1 million or more, either as a lump sum or through the Fund’s accumulation or letter of intent programs, you can purchase Class A shares without an initial sales charge (load). A Contingent Deferred Sales Charge (“CDSC”) of 1.00% may apply to Class C shares redeemed within the first 12 months after a purchase, and on Class A shares redeemed within the first 18 months after a purchase in excess of $1 million. The Fund imposes a 2.00% redemption fee on shares held for less than 30 days.
| ALPS | Kotak India Growth Fund | |
| Performance Update | October 31, 2021 (Unaudited) |
| | |
Performance shown for Class A shares prior to June 12, 2018 reflects the historical performance of the Fund’s Investor shares, calculated using the fees and expenses of Class A shares. Performance shown for Class II shares prior to December 19, 2019 reflects the historical performance of the Fund’s Class I shares, calculated using the fees and expenses of Class II shares.
| 1 | Nifty 500 Index (formerly the CNX 500 Index) - India's first broad based benchmark of the Indian capital market. The Nifty 500 companies are disaggregated into 72 industry indices. Industry weightages in the index reflect the industry weightages in the market. The index is not actively managed and does not reflect any deduction for fees, expenses or taxes. An investor may not invest directly in an index. |
| 2 | Morningstar India NR Index: measures the performance of India's equity markets targeting the top 97% of stocks by market capitalization. |
| ^ | Fund Inception date of February 14, 2011 for Investor Class and Classes C and I; Fund Inception date of June 12, 2018 for Class A; Fund Inception date of December 19, 2019 for Class II. |
| * | What You Pay reflects the Advisor's and Sub-Advisor’s decision to contractually limit expenses through February 28, 2022. Please see the prospectus dated February 28, 2021 for additional information. |
| # | Prior to December 1, 2017, Investor Class was known as Class A. |
The table does not reflect the deduction of taxes that a shareholder would pay on Fund distributions or the redemption of Fund shares.
This Fund is not suitable for all investors and is subject to investment risks, including possible loss of the principal amount invested.
There is no guarantee that the Fund will continue to hold any one particular security or stay invested in any one particular company. The composition of the Fund's top holdings is subject to change. Performance figures are historical and reflect the change in share price, reinvested distributions, changes in net asset value, sales charges and capital gains distributions, if any.
Not FDIC Insured – No Bank Guarantee – May Lose Value
Investing in India involves risk and considerations not present when investing in more established securities markets. The Fund may be more susceptible to economic, market, political and local risks of the region than a fund that is more geographically diversified. Investments in India are subject to a number of risks including, but not limited to, risk of losing some or all of the capital invested, high market volatility, variable market liquidity, geopolitical risks (including political instability), exchange rate fluctuations (between the currency of the fund’s share class and the Indian Rupee), changes in tax regime and restrictions on investment activities of foreign investors.
Top Ten Holdings (as a % of Net Assets) †
| Infosys, Ltd. | 8.04% |
| Reliance Industries, Ltd. | 6.17% |
| ICICI Bank, Ltd. | 5.79% |
| HDFC Bank, Ltd. | 4.78% |
| Tata Consultancy Services, Ltd. | 3.16% |
| Axis Bank, Ltd. | 3.03% |
| Tech Mahindra, Ltd. | 3.00% |
| Bharti Airtel, Ltd. | 2.60% |
| Housing Development Finance Corp., Ltd. | 2.59% |
| Aavas Financiers, Ltd. | 2.47% |
| Top Ten Holdings | 41.63% |
| † | Holdings are subject to change, and may not reflect the current or future position of the portfolio. Table presents approximate values only. |
Industry Sector Allocation (as a % of Net Assets)

| ALPS | Kotak India Growth Fund | |
| Statement of Investments | October 31, 2021 |
| | |
| | | Shares | | | Value
(Note 2) | |
| COMMON STOCKS (97.90%) | | | |
| Communication Services (3.88%) | | | |
| Entertainment (1.28%) | | | | | | | | |
| Nazara Technologies, Ltd.(a) | | | 87,275 | | | $ | 3,106,108 | |
| PVR, Ltd.(a) | | | 88,605 | | | | 1,995,205 | |
| | | | | | | | 5,101,313 | |
| | | | | | | | | |
| Wireless Telecommunication Services (2.60%) | | | |
| Bharti Airtel, Ltd.(a) | | | 1,104,802 | | | | 10,134,729 | |
| Bharti Airtel, Ltd. partly paid(a) | | | 78,914 | | | | 215,039 | |
| | | | | | | | | |
| TOTAL COMMUNICATION SERVICES | | | | | | | 15,451,081 | |
| | | | | | | | | |
| Consumer Discretionary (9.23%) | | | |
| Auto Components (1.71%) | | | | | | | | |
| MRF, Ltd. | | | 3,528 | | | | 3,647,958 | |
| Sansera Engineering, Ltd.(a)(b) | | | 159,037 | | | | 1,502,416 | |
| Varroc Engineering, Ltd.(a)(b)(c) | | | 414,020 | | | | 1,630,358 | |
| | | | | | | | 6,780,732 | |
| | | | | | | | | |
| Automobiles (2.30%) | | | | | | | | |
| Mahindra & Mahindra, Ltd. | | | 283,701 | | | | 3,361,295 | |
| Maruti Suzuki India, Ltd. | | | 57,917 | | | | 5,799,096 | |
| | | | | | | | 9,160,391 | |
| | | | | | | | | |
| Hotels, Restaurants & Leisure (0.94%) | | | |
| Jubilant Foodworks, Ltd. | | | 75,928 | | | | 3,752,652 | |
| | | | | | | | | |
| Household Durables (2.96%) | | | | | | | | |
| Crompton Greaves Consumer | | | | | | | | |
| Electricals, Ltd. | | | 1,249,999 | | | | 7,781,907 | |
| Orient Electric, Ltd. | | | 859,087 | | | | 3,980,682 | |
| | | | | | | | 11,762,589 | |
| | | | | | | | | |
| Internet & Direct Marketing Retail (0.20%) | | | |
| Cartrade Tech, Ltd.(a) | | | 49,606 | | | | 793,299 | |
| | | | | | | | | |
| Textiles, Apparel & Luxury Goods (1.12%) | | | |
| Titan Co., Ltd. | | | 139,661 | | | | 4,456,211 | |
| | | | | | | | | |
| TOTAL CONSUMER DISCRETIONARY | | | | | | | 36,705,874 | |
| | | | | | | | | |
| Consumer Staples (5.49%) | | | | | | | | |
| Food Products (0.77%) | | | | | | | | |
| Britannia Industries, Ltd. | | | 61,961 | | | | 3,048,105 | |
| | | | | | | | | |
| Household Products (2.15%) | | | | | | | | |
| Hindustan Unilever, Ltd. | | | 267,136 | | | | 8,550,253 | |
| | | | | | | | | |
| Personal Products (2.57%) | | | | | | | | |
| Dabur India, Ltd. | | | 628,592 | | | | 4,923,512 | |
| | | Shares | | | Value
(Note 2) | |
| Personal Products (continued) | | | | | | | | |
| Emami, Ltd. | | | 744,866 | | | $ | 5,296,194 | |
| | | | | | | | 10,219,706 | |
| | | | | | | | | |
| TOTAL CONSUMER STAPLES | | | | | | | 21,818,064 | |
| | | | | | | | | |
| Energy (6.54%) | | | | | | | | |
| Oil, Gas & Consumable Fuels (6.54%) | | | |
| Aegis Logistics, Ltd. | | | 521,967 | | | | 1,485,810 | |
| Reliance Industries, Ltd. partly paid | | | 89,770 | | | | 2,288,082 | |
| Reliance Industries, Ltd. | | | 655,360 | | | | 22,239,755 | |
| | | | | | | | 26,013,647 | |
| | | | | | | | | |
| TOTAL ENERGY | | | | | | | 26,013,647 | |
| | | | | | | | | |
| Financials (30.79%) | | | | | | | | |
| Banks (17.33%) | | | | | | | | |
| AU Small Finance Bank, Ltd.(a)(b)(c) | | | 400,568 | | | | 6,520,170 | |
| Axis Bank, Ltd.(a) | | | 1,212,660 | | | | 12,067,137 | |
| HDFC Bank, Ltd., ADR | | | 82,825 | | | | 5,955,946 | |
| HDFC Bank, Ltd. | | | 615,731 | | | | 13,043,548 | |
| ICICI Bank, Ltd., Sponsored ADR | | | 575,349 | | | | 12,168,631 | |
| ICICI Bank, Ltd. | | | 1,007,642 | | | | 10,849,393 | |
| State Bank of India | | | 1,241,706 | | | | 8,354,317 | |
| | | | | | | | 68,959,142 | |
| | | | | | | | | |
| Consumer Finance (4.80%) | | | | | | | | |
| Bajaj Finance, Ltd. | | | 98,485 | | | | 9,766,647 | |
| Muthoot Finance, Ltd. | | | 98,148 | | | | 1,927,437 | |
| SBI Cards & Payment Services, Ltd.(a) | | | 523,072 | | | | 7,386,421 | |
| | | | | | | | 19,080,505 | |
| | | | | | | | | |
| Insurance (3.60%) | | | | | | | | |
| HDFC Life Insurance Co., Ltd.(b)(c) | | | 405,891 | | | | 3,691,307 | |
| ICICI Lombard General Insurance Co., Ltd.(b)(c) | 249,479 | | | | 4,943,568 | |
| Max Financial Services, Ltd.(a) | | | 437,229 | | | | 5,693,387 | |
| | | | | | | | 14,328,262 | |
| | | | | | | | | |
| Thrifts & Mortgage Finance (5.06%) | | | |
| Aavas Financiers, Ltd.(a) | | | 261,674 | | | | 9,810,879 | |
| Housing Development Finance Corp., Ltd. | | | 270,463 | | | | 10,311,857 | |
| | | | | | | | 20,122,736 | |
| | | | | | | | | |
| TOTAL FINANCIALS | | | | | | | 122,490,645 | |
| | | | | | | | | |
| Health Care (7.05%) | | | | | | | | |
| Health Care Providers & Services (4.32%) | | | |
| Dr Lal PathLabs, Ltd.(b)(c) | | | 43,664 | | | | 2,050,917 | |
| Fortis Healthcare, Ltd.(a) | | | 1,095,761 | | | | 3,586,664 | |
| Max Healthcare Institute, Ltd.(a) | | | 1,815,978 | | | | 8,050,818 | |
See Notes to Financial Statements.
| ALPS | Kotak India Growth Fund | |
| Statement of Investments | October 31, 2021 |
| | |
| | | Shares | | | Value
(Note 2) | |
| Health Care Providers & Services (continued) | | | |
| Vijaya Diagnostic Centre Pvt, Ltd.(a) | | | 463,682 | | | $ | 3,495,514 | |
| | | | | | | | 17,183,913 | |
| | | | | | | | | |
| Pharmaceuticals (2.73%) | | | | | | | | |
| Alkem Laboratories, Ltd. | | | 77,590 | | | | 3,743,231 | |
| Aurobindo Pharma, Ltd. | | | 412,620 | | | | 3,804,207 | |
| Cipla, Ltd. | | | 273,413 | | | | 3,309,789 | |
| | | | | | | | 10,857,227 | |
| | | | | | | | | |
| TOTAL HEALTH CARE | | | | | | | 28,041,140 | |
| | | | | | | | | |
| Industrials (7.86%) | | | | | | | | |
| Air Freight & Logistics (0.78%) | | | | | | | | |
| Mahindra Logistics, Ltd.(b)(c) | | | 360,888 | | | | 3,121,017 | |
| | | | | | | | | |
| Airlines (0.58%) | | | | | | | | |
| InterGlobe Aviation, Ltd.(a)(b)(c) | | | 80,000 | | | | 2,323,893 | |
| | | | | | | | | |
| Building Products (1.42%) | | | | | | | | |
| Kajaria Ceramics, Ltd. | | | 345,759 | | | | 5,651,340 | |
| | | | | | | | | |
| Construction & Engineering (2.78%) | | | |
| Kalpataru Power Transmission, Ltd. | | | 654,000 | | | | 3,679,733 | |
| Larsen & Toubro, Ltd. | | | 310,649 | | | | 7,358,746 | |
| | | | | | | | 11,038,479 | |
| | | | | | | | | |
| Electrical Equipment (1.43%) | | | | | | | | |
| V-Guard Industries, Ltd. | | | 1,659,451 | | | | 5,704,305 | |
| | | | | | | | | |
| Trading Companies & Distributors (0.87%) | | | |
| IndiaMart InterMesh, Ltd.(b)(c) | | | 36,028 | | | | 3,446,717 | |
| | | | | | | | | |
| TOTAL INDUSTRIALS | | | | | | | 31,285,751 | |
| | | | | | | | | |
| Information Technology (16.32%) | | | | | | | | |
| IT Services (16.32%) | | | | | | | | |
| Infosys, Ltd., Sponsored ADR | | | 543,588 | | | | 12,111,140 | |
| Infosys, Ltd. | | | 887,568 | | | | 19,862,719 | |
| Persistent Systems, Ltd. | | | 161,667 | | | | 8,488,896 | |
| Tata Consultancy Services, Ltd. | | | 276,288 | | | | 12,558,535 | |
| Tech Mahindra, Ltd. | | | 602,119 | | | | 11,918,396 | |
| | | | | | | | 64,939,686 | |
| | | | | | | | | |
| TOTAL INFORMATION TECHNOLOGY | | | | | | | 64,939,686 | |
| | | | | | | | | |
| Materials (7.76%) | | | | | | | | |
| Chemicals (2.70%) | | | | | | | | |
| Kansai Nerolac Paints, Ltd. | | | 450,211 | | | | 3,285,530 | |
| SRF, Ltd. | | | 262,890 | | | | 7,444,858 | |
| | | | | | | | 10,730,388 | |
| | | | | | | | | |
| Construction Materials (4.50%) | | | | | | | | |
| JK Cement, Ltd. | | | 98,000 | | | | 4,346,059 | |
| | | Shares | | | Value
(Note 2) | |
| Construction Materials (continued) | | | | | | | | |
| Ramco Cements, Ltd. | | | 444,366 | | | $ | 6,341,601 | |
| Shree Cement, Ltd. | | | 18,806 | | | | 7,199,765 | |
| | | | | | | | 17,887,425 | |
| | | | | | | | | |
| Containers & Packaging (0.56%) | | | |
| Mold-Tek Packaging, Ltd. | | | 252,000 | | | | 2,245,874 | |
| | | | | | | | | |
| TOTAL MATERIALS | | | | | | | 30,863,687 | |
| | | | | | | | | |
| Real Estate (2.11%) | | | | | | | | |
| Real Estate Management & Development (2.11%) | | | |
| Brigade Enterprises, Ltd. | | | 737,001 | | | | 4,573,750 | |
| Oberoi Realty, Ltd.(a) | | | 316,231 | | | | 3,826,896 | |
| | | | | | | | 8,400,646 | |
| | | | | | | | | |
| TOTAL REAL ESTATE | | | | | | | 8,400,646 | |
| | | | | | | | | |
| Utilities (0.87%) | | | | | | | | |
| Gas Utilities (0.87%) | | | | | | | | |
| Indraprastha Gas, Ltd. | | | 547,248 | | | | 3,468,836 | |
| | | | | | | | | |
| TOTAL UTILITIES | | | | | | | 3,468,836 | |
| | | | | | | | | |
| TOTAL COMMON STOCKS | | | | | | | | |
| (Cost $282,876,573) | | | | | | | 389,479,057 | |
| | | | | | | | | |
| TOTAL INVESTMENTS (97.90%) | | | | | | | | |
| (Cost $282,876,573) | | | | | | $ | 389,479,057 | |
| | | | | | | | | |
| Other Assets In Excess Of Liabilities (2.10%) | | 8,353,668 | |
| | | | | | | | | |
| NET ASSETS (100.00%) | | | | | | $ | 397,832,724 | |
| (a) | Non-Income Producing Security. |
| (b) | Security exempt from registration under Rule 144A of the Securities Act of 1933. This security may be resold in transactions exempt from registration, normally to qualified institutional buyers. As of October 31, 2021, the aggregate market value of those securities was $29,230,363, representing 7.35% of net assets. |
| (c) | Securities were purchased pursuant to Regulation S under the Securities Act of 1933, which exempts securities offered and sold outside of the United States from registration. Such securities cannot be sold in the United States without either an effective registration statement filed pursuant to the Securities Act of 1933, or pursuant to an exemption from registration. These securities have been deemed liquid under guidelines approved by the Fund's Board of Trustees. As of October 31, 2021 the aggregate market value of those securities was 29,230,363 representing 7.35% of net assets. |
See Notes to Financial Statements.
| ALPS | Kotak India Growth Fund | |
| Statement of Investments | October 31, 2021 |
| | |
For Fund compliance purposes, the Fund's industry classifications refer to any one or more of the industry sub-classifications used by one or more widely recognized market indexes or ratings group indexes, and/or as defined by Fund management. This definition may not apply for purposes of this report, which may combine industry sub-classifications for reporting ease. Industries are shown as a percent of net assets.
See Notes to Financial Statements.
| ALPS | Kotak India Growth Fund | |
| Statement of Assets and Liabilities | October 31, 2021 |
| | |
| ASSETS | | | |
| Investments, at value | | $ | 389,479,057 | |
| Cash | | | 11,657,040 | |
| Foreign currency, at value (Cost $12,641,215) | | | 12,361,207 | |
| Receivable for shares sold | | | 104,053 | |
| Dividends and interest receivable | | | 298,678 | |
| Prepaid expenses and other assets | | | 13,305 | |
| Total Assets | | | 413,913,340 | |
| LIABILITIES | | | | |
| Payable for investments purchased | | | 1,121,561 | |
| Payable for shares redeemed | | | 13,893 | |
| Payable for foreign capital gains tax | | | 14,602,883 | |
| Investment advisory fees payable | | | 174,420 | |
| Administration and transfer agency fees payable | | | 72,578 | |
| Distribution and services fees payable | | | 3,735 | |
| Trustees' fees and expenses payable | | | 4,649 | |
| Professional fees payable | | | 23,631 | |
| Accrued expenses and other liabilities | | | 63,266 | |
| Total Liabilities | | | 16,080,616 | |
| NET ASSETS | | $ | 397,832,724 | |
| NET ASSETS CONSIST OF | | | | |
| Paid-in capital | | $ | 306,739,212 | |
| Total distributable earnings | | | 91,093,512 | |
| NET ASSETS | | $ | 397,832,724 | |
| INVESTMENTS, AT COST | | $ | 282,876,573 | |
| PRICING OF SHARES | | | | |
| Investor Class: | | | | |
| Net Asset Value, offering and redemption price per share | | $ | 18.70 | |
| Net Assets | | $ | 3,814,498 | |
| Shares of beneficial interest outstanding (unlimited number of shares, no par value common stock authorized) | | | 203,930 | |
| Class A: | | | | |
| Net Asset Value, offering and redemption price per share | | $ | 18.62 | |
| Net Assets | | $ | 762,495 | |
| Shares of beneficial interest outstanding (unlimited number of shares, no par value common stock authorized) | | | 40,955 | |
| Maximum offering price per share ((NAV/0.9450), based on maximum sales charge of 5.50% of the offering price) | | $ | 19.70 | |
| Class C: | | | | |
Net Asset Value, offering and redemption price per share(a) | | $ | 17.18 | |
| Net Assets | | $ | 1,597,547 | |
| Shares of beneficial interest outstanding (unlimited number of shares, no par value common stock authorized) | | | 92,986 | |
| Class I: | | | | |
| Net Asset Value, offering and redemption price per share | | $ | 19.35 | |
| Net Assets | | $ | 16,052,854 | |
| Shares of beneficial interest outstanding (unlimited number of shares, no par value common stock authorized) | | | 829,512 | |
| Class II: | | | | |
| Net Asset Value, offering and redemption price per share | | $ | 19.45 | |
| Net Assets | | $ | 375,605,330 | |
| Shares of beneficial interest outstanding (unlimited number of shares, no par value common stock authorized) | | | 19,311,883 | |
| (a) | Redemption price per share may be reduced for any applicable contingent deferred sales charge. For a description of a possible sales charge, please see the Fund's Prospectus. |
See Notes to Financial Statements.
| ALPS | Kotak India Growth Fund | |
| Statement of Operations | For the Year Ended October 31, 2021 |
| | |
| INVESTMENT INCOME | | | |
| Dividends | | $ | 2,604,690 | |
| Foreign taxes withheld on dividends | | | (636,056 | ) |
| Interest and other income | | | 75 | |
| Total Investment Income | | | 1,968,709 | |
| | | | | |
EXPENSES | | | | |
| Investment advisory fees | | | 2,027,302 | |
| Administrative fees | | | 498,923 | |
| Transfer agency fees | | | 3,462 | |
| Distribution and service fees | | | | |
| Investor Class | | | 11,075 | |
| Class A | | | 2,961 | |
| Class C | | | 15,347 | |
| Professional fees | | | 41,871 | |
| Reports to shareholders and printing fees | | | 10,290 | |
| State registration fees | | | 78,886 | |
| Insurance fees | | | 2,336 | |
| Custody fees | | | 151,361 | |
| Trustees' fees and expenses | | | 14,457 | |
| Repayment of previously waived fees | | | | |
| Investor Class | | | 2,548 | |
| Class A | | | 825 | |
| Class C | | | 1,149 | |
| Class I | | | 15,678 | |
| Miscellaneous expenses | | | 28,276 | |
| Total Expenses | | | 2,906,747 | |
| Less fees waived/reimbursed by investment advisor (Note 8) | | | | |
| Investor Class | | | (75 | ) |
| Class A | | | (4 | ) |
| Class C | | | (67 | ) |
| Class I | | | (641 | ) |
| Class II | | | (465,777 | ) |
| Net Expenses | | | 2,440,183 | |
| Net Investment Loss | | | (471,474 | ) |
| Net realized gain on investments | | | 24,951,485 | |
| Net realized loss on foreign currency transactions | | | (569,188 | ) |
| Net Realized Gain | | | 24,382,297 | |
| Net change in unrealized appreciation on investments | | | 89,914,318 | |
| Net change in unrealized depreciation on translation of assets and liabilities denominated in foreign currencies | | | (123,277 | ) |
| Net change in unrealized foreign capital gains tax | | | (13,895,754 | ) |
| Net Change in Unrealized Appreciation | | | 75,895,287 | |
| NET REALIZED AND UNREALIZED GAIN ON INVESTMENTS | | | 100,277,584 | |
| NET INCREASE IN NET ASSETS RESULTING FROM OPERATIONS | | $ | 99,806,110 | |
See Notes to Financial Statements.
| ALPS | Kotak India Growth Fund | |
| Statements of Changes in Net Assets | |
| | |
| | | For the Year
Ended October 31, 2021 | | | For the Year
Ended October 31, 2020 | |
| OPERATIONS | | | | | | |
| Net investment income/(loss) | | $ | (471,474 | ) | | $ | 124,008 | |
| Net realized gain/(loss) | | | 24,382,297 | | | | (24,490,375 | ) |
| Net change in unrealized appreciation | | | 75,895,287 | | | | 12,127,968 | |
| Net Increase/(Decrease) in Net Assets Resulting from Operations | | | 99,806,110 | | | | (12,238,399 | ) |
| | | | | | | | | |
| TOTAL DISTRIBUTIONS | | | | | | | | |
| From distributable earnings | | | | | | | | |
| Investor Class | | | – | | | | (59,531 | ) |
| Class A | | | – | | | | (1,250 | ) |
| Class C | | | – | | | | (30,127 | ) |
| Class I | | | – | | | | (272,204 | ) |
| Net Decrease in Net Assets from Distributions | | | – | | | | (363,112 | ) |
| | | | | | | | | |
| BENEFICIAL INTEREST TRANSACTIONS (NOTE 6) | | | | | | | | |
| Shares sold | | | | | | | | |
| Investor Class | | | 1,111,855 | | | | 14,097,079 | |
| Class A | | | 905,016 | | | | 17,539 | |
| Class C | | | 20,550 | | | | 87,547 | |
| Class I | | | 4,418,625 | | | | 5,770,524 | |
| Class II | | | 150,000,000 | | | | 175,000,000 | |
| Dividends reinvested | | | | | | | | |
| Investor Class | | | – | | | | 46,092 | |
| Class A | | | – | | | | 1,120 | |
| Class C | | | – | | | | 29,759 | |
| Class I | | | – | | | | 237,513 | |
| Shares redeemed, net of redemption fees | | | | | | | | |
| Investor Class | | | (1,190,945 | ) | | | (16,813,642 | ) |
| Class A | | | (573,775 | ) | | | (21,865 | ) |
| Class C | | | (877,201 | ) | | | (348,993 | ) |
| Class I | | | (18,425,509 | ) | | | (6,746,874 | ) |
| Class II | | | – | | | | (25,000,000 | ) |
| Net Increase in Net Assets Derived from Beneficial Interest Transactions | | | 135,388,616 | | | | 146,355,799 | |
| | | | | | | | | |
| Net increase in net assets | | | 235,194,726 | | | | 133,754,288 | |
| | | | | | | | | |
| NET ASSETS | | | | | | | | |
| Beginning of year | | | 162,637,998 | | | | 28,883,710 | |
| End of year | | $ | 397,832,724 | | | $ | 162,637,998 | |
See Notes to Financial Statements.
| ALPS | Kotak India Growth Fund – Investor Class |
Selected data for a share of beneficial interest outstanding throughout the periods indicated:
| | | For the Year Ended October 31,
2021 | | | For the Year Ended October 31,
2020 | | | For the Year Ended October 31,
2019 | | | For the Year Ended October 31, 2018(a) | | | For the Year Ended October 31,
2017 | |
| Net asset value, beginning of period | | $ | 12.66 | | | $ | 13.02 | (b) | | $ | 11.73 | (b) | | $ | 14.53 | (b) | | $ | 12.32 | (b) |
| INCOME/(LOSS) FROM INVESTMENT OPERATIONS: |
| Net investment loss(c) | | | (0.12 | ) | | | (0.07 | )(d) | | | (0.10 | ) | | | (0.13 | ) | | | (0.10 | ) |
| Net realized and unrealized gain/(loss) | | | 6.16 | | | | (0.93 | ) | | | 2.19 | | | | (2.26 | ) | | | 2.45 | |
| Total from investment operations | | | 6.04 | | | | (1.00 | ) | | | 2.09 | | | | (2.39 | ) | | | 2.35 | |
| DISTRIBUTIONS: | | | | | | | | | | | | | | | | | | | | |
| From net realized gains | | | 0.00 | | | | (0.17 | ) | | | (0.80 | ) | | | (0.41 | ) | | | (0.14 | ) |
| Total distributions | | | – | | | | (0.17 | ) | | | (0.80 | ) | | | (0.41 | ) | | | (0.14 | ) |
| REDEMPTION FEES ADDED TO PAID-IN CAPITAL (NOTE 6) | | | 0.00 | (e) | | | 0.81 | | | | 0.00 | (e) | | | 0.00 | (e) | | | 0.00 | (e) |
| Net increase/(decrease) in net asset value | | | 6.04 | | | | (0.36 | ) | | | 1.29 | | | | (2.80 | ) | | | 2.21 | |
| Net asset value, end of year | | $ | 18.70 | | | $ | 12.66 | | | $ | 13.02 | | | $ | 11.73 | | | $ | 14.53 | |
| TOTAL RETURN(f) | | | 47.71 | % | | | (1.48 | )% | | | 18.58 | % | | | (16.91 | )% | | | 19.45 | % |
| RATIOS/SUPPLEMENTAL DATA: | | | | | | | | | | | | | | | | | | | | |
| Net assets, end of year (000s) | | $ | 3,814 | | | $ | 2,704 | | | $ | 4,604 | | | $ | 5,821 | | | $ | 9,538 | |
| Ratio of expenses to average net assets excluding fee waivers and reimbursements | | | 1.35 | % | | | 1.72 | % | | | 3.27 | % | | | 2.80 | % | | | 2.95 | % |
| Ratio of expenses to average net assets including fee waivers and reimbursements | | | 1.35 | % | | | 1.40 | %(g) | | | 1.91 | % | | | 1.93 | % | | | 1.90 | % |
| Ratio of net investment loss to average net assets | | | (0.73 | )% | | | (0.64 | )% | | | (0.79 | )% | | | (0.91 | )% | | | (0.74 | )% |
| Portfolio turnover rate(h) | | | 29 | % | | | 90 | % | | | 56 | % | | | 24 | % | | | 30 | % |
| (a) | Prior to December 1, 2017, Investor Class was known as Class A. |
| (b) | Per share amounts and ratios to average net assets include income and expenses of the Kotak Mauritius Portfolio (wholly-owned subsidiary). |
| (c) | Calculated using the average shares method. |
| (d) | The per share amount does not correspond to activity reflected in the Statement of Operations due to class specific expenses during the period. |
| (e) | Less than $0.005 or ($0.005) per share. |
| (f) | Total returns are for the period indicated and have not been annualized. Total returns would have been lower had certain expenses not been waived during the period. Returns shown do not reflect the deduction of taxes that a shareholder would pay on Fund distributions or the redemption of Fund shares. |
| (g) | Effective December 2, 2019, the net expense limitation agreement changed from 1.60% to 1.00%, excluding, among other fees and expenses, 12b-1 fees and shareholder service fees. Refer to Note 8. |
| (h) | Portfolio turnover rate for periods less than one full year have not been annualized. |
See Notes to Financial Statements.
| ALPS | Kotak India Growth Fund – Class A |
Selected data for a share of beneficial interest outstanding throughout the periods indicated:
| | | For the Year Ended
October 31,
2021 | | | For the Year Ended
October 31,
2020 | | | For the Year Ended
October 31,
2019 | | | For the Period
June 12, 2018
(Commencement
of Operations) to
October 31, 2018 | |
| Net asset value, beginning of period | | $ | 12.59 | | | $ | 12.99 | (a) | | $ | 11.72 | (a) | | $ | 13.90 | (a) |
| | | | | | | | | | | | | | | | | |
| INCOME FROM INVESTMENT OPERATIONS: | | | | | | | | | | | | | | | | |
| Net investment loss(b) | | | (0.11 | ) | | | (0.07 | )(c) | | | (0.06 | ) | | | (0.04 | ) |
| Net realized and unrealized gain/(loss) | | | 6.14 | | | | (0.16 | ) | | | 2.13 | | | | (2.14 | ) |
| Total from investment operations | | | 6.03 | | | | (0.23 | ) | | | 2.07 | | | | (2.18 | ) |
| | | | | | | | | | | | | | | | | |
| DISTRIBUTIONS: | | | | | | | | | | | | | | | | |
| From net realized gains | | | – | | | | (0.17 | ) | | | (0.80 | ) | | | – | |
| Total distributions | | | – | | | | (0.17 | ) | | | (0.80 | ) | | | – | |
| | | | | | | | | | | | | | | | | |
| REDEMPTION FEES ADDED TO PAID-IN CAPITAL (NOTE 6) | | | 0.00 | (d) | | | – | | | | – | | | | – | |
| Net increase/(decrease) in net asset value | | | 6.03 | | | | (0.40 | ) | | | 1.27 | | | | (2.18 | ) |
| Net asset value, end of year | | $ | 18.62 | | | $ | 12.59 | | | $ | 12.99 | | | $ | 11.72 | |
| TOTAL RETURN(e) | | | 47.90 | % | | | (1.80 | )% | | | 18.41 | % | | | (15.68 | )% |
| | | | | | | | | | | | | | | | | |
| RATIOS/SUPPLEMENTAL DATA: | | | | | | | | | | | | | | | | |
| Net assets, end of year (000s) | | $ | 762 | | | $ | 89 | | | $ | 96 | | | $ | 8 | |
| Ratio of expenses to average net assets excluding fee waivers and reimbursements | | | 1.30 | % | | | 1.62 | % | | | 3.24 | % | | | 3.16 | %(f) |
| Ratio of expenses to average net assets including fee waivers and reimbursements | | | 1.30 | % | | | 1.31 | %(g) | | | 1.94 | % | | | 2.00 | %(f) |
| Ratio of net investment loss to average net assets | | | (0.68 | )% | | | (0.56 | )% | | | (0.52 | )% | | | (0.79 | )%(f) |
| Portfolio turnover rate(h) | | | 29 | % | | | 90 | % | | | 56 | % | | | 24 | % |
| (a) | Per share amounts and ratios to average net assets include income and expenses of the Kotak Mauritius Portfolio (wholly-owned subsidiary). |
| (b) | Calculated using the average shares method. |
| (c) | The per share amount does not correspond to activity reflected in the Statement of Operations due to class specific expenses during the period. |
| (d) | Less than $0.005 or ($0.005) per share. |
| (e) | Total returns are for the period indicated and have not been annualized. Total returns would have been lower had certain expenses not been waived during the period. Returns shown do not reflect the deduction of taxes that a shareholder would pay on Fund distributions or the redemption of Fund shares. Returns shown exclude any applicable sales charges. |
| (f) | Annualized. |
| (g) | Effective December 2, 2019, the net expense limitation agreement changed from 1.60% to 1.00%, excluding, among other fees and expenses, 12b-1 fees and shareholder service fees. Refer to Note 8. |
| (h) | Portfolio turnover rate for periods less than one full year have not been annualized. |
See Notes to Financial Statements.
| ALPS | Kotak India Growth Fund – Class C |
Selected data for a share of beneficial interest outstanding throughout the periods indicated:
| | | For the Year Ended October 31,
2021 | | | For the Year Ended October 31,
2020 | | | For the Year Ended October 31,
2019 | | | For the Year Ended October 31,
2018 | | | For the Year Ended October 31,
2017 | |
| Net asset value, beginning of period | | $ | 11.70 | | | $ | 12.18 | (a) | | $ | 11.10 | (a) | | $ | 13.87 | (a) | | $ | 11.85 | (a) |
| INCOME/(LOSS) FROM INVESTMENT OPERATIONS: |
| Net investment loss(b) | | | (0.21 | ) | | | (0.14 | )(c) | | | (0.17 | ) | | | (0.21 | ) | | | (0.18 | ) |
| Net realized and unrealized gain/(loss) | | | 5.69 | | | | (0.17 | ) | | | 2.05 | | | | (2.15 | ) | | | 2.34 | |
| Total from investment operations | | | 5.48 | | | | (0.31 | ) | | | 1.88 | | | | (2.36 | ) | | | 2.16 | |
| DISTRIBUTIONS: | | | | | | | | | | | | | | | | | | | | |
| From net realized gains | | | 0.00 | | | | (0.17 | ) | | | (0.80 | ) | | | (0.41 | ) | | | (0.14 | ) |
| Total distributions | | | – | | | | (0.17 | ) | | | (0.80 | ) | | | (0.41 | ) | | | (0.14 | ) |
| REDEMPTION FEES ADDED TO PAID-IN CAPITAL (NOTE 6) | | | – | | | | – | | | | 0.00 | (d) | | | – | | | | – | |
| Net increase/(decrease) in net asset value | | | 5.48 | | | | (0.48 | ) | | | 1.08 | | | | (2.77 | ) | | | 2.02 | |
| Net asset value, end of year | | $ | 17.18 | | | $ | 11.70 | | | $ | 12.18 | | | $ | 11.10 | | | $ | 13.87 | |
| TOTAL RETURN(e) | | | 46.84 | % | | | (2.58 | )% | | | 17.69 | % | | | (17.52 | )% | | | 18.60 | % |
| RATIOS/SUPPLEMENTAL DATA: | | | | | | | | | | | | | | | | | | | | |
| Net assets, end of year (000s) | | $ | 1,598 | | | $ | 1,868 | | | $ | 2,195 | | | $ | 2,024 | | | $ | 2,140 | |
| Ratio of expenses to average net assets excluding fee waivers and reimbursements | | | 2.00 | % | | | 2.37 | % | | | 3.97 | % | | | 3.51 | % | | | 3.69 | % |
| Ratio of expenses to average net assets including fee waivers and reimbursements | | | 2.00 | % | | | 2.06 | %(f) | | | 2.60 | % | | | 2.60 | % | | | 2.60 | % |
| Ratio of net investment loss to average net assets | | | (1.37 | )% | | | (1.29 | )% | | | (1.47 | )% | | | (1.57 | )% | | | (1.48 | )% |
| Portfolio turnover rate(g) | | | 29 | % | | | 90 | % | | | 56 | % | | | 24 | % | | | 30 | % |
| (a) | Per share amounts and ratios to average net assets include income and expenses of the Kotak Mauritius Portfolio (wholly-owned subsidiary). |
| (b) | Calculated using the average shares method. |
| (c) | The per share amount does not correspond to activity reflected in the Statement of Operations due to class specific expenses during the period. |
| (d) | Less than $0.005 or ($0.005) per share. |
| (e) | Total returns are for the period indicated and have not been annualized. Total returns would have been lower had certain expenses not been waived during the period. Returns shown do not reflect the deduction of taxes that a shareholder would pay on Fund distributions or the redemption of Fund shares. Returns shown exclude any applicable sales charges. |
| (f) | Effective December 2, 2019, the net expense limitation agreement changed from 1.60% to 1.00%, excluding, among other fees and expenses, 12b-1 fees and shareholder service fees. Refer to Note 8. |
| (g) | Portfolio turnover rate for periods less than one full year have not been annualized. |
See Notes to Financial Statements.
| ALPS | Kotak India Growth Fund – Class I |
Selected data for a share of beneficial interest outstanding throughout the periods indicated:
| | | For the Year Ended October 31,
2021 | | | For the Year Ended October 31,
2020 | | | For the Year Ended October 31,
2019 | | | For the Year Ended October 31,
2018 | | | For the Year Ended October 31,
2017 | |
| Net asset value, beginning of period | | $ | 13.05 | | | $ | 13.43 | (a) | | $ | 12.05 | (a) | | $ | 14.87 | (a) | | $ | 12.58 | (a) |
| INCOME/(LOSS) FROM INVESTMENT OPERATIONS: |
| Net investment loss(b) | | | (0.07 | ) | | | (0.03 | )(c) | | | (0.05 | ) | | | (0.08 | ) | | | (0.06 | ) |
| Net realized and unrealized gain/(loss) | | | 6.37 | | | | (0.18 | ) | | | 2.23 | | | | (2.33 | ) | | | 2.48 | |
| Total from investment operations | | | 6.30 | | | | (0.21 | ) | | | 2.18 | | | | (2.41 | ) | | | 2.42 | |
| DISTRIBUTIONS: | | | | | | | | | | | | | | | | | | | | |
| From net realized gains | | | 0.00 | | | | (0.17 | ) | | | (0.80 | ) | | | (0.41 | ) | | | (0.14 | ) |
| Total distributions | | | – | | | | (0.17 | ) | | | (0.80 | ) | | | (0.41 | ) | | | (0.14 | ) |
| REDEMPTION FEES ADDED TO PAID-IN CAPITAL (NOTE 6) | | | 0.00 | (d) | | | 0.00 | (d) | | | – | | | | 0.00 | (d) | | | 0.01 | |
| Net increase/(decrease) in net asset value | | | 6.30 | | | | (0.38 | ) | | | 1.38 | | | | (2.82 | ) | | | 2.29 | |
| Net asset value, end of year | | $ | 19.35 | | | $ | 13.05 | | | $ | 13.43 | | | $ | 12.05 | | | $ | 14.87 | |
| TOTAL RETURN(e) | | | 48.28 | % | | | (1.59 | )% | | | 18.85 | % | | | (16.66 | )% | | | 19.68 | % |
| RATIOS/SUPPLEMENTAL DATA: | | | | | | | | | | | | | | | | | | | | |
| Net assets, end of year (000s) | | $ | 16,053 | | | $ | 21,861 | | | $ | 21,989 | | | $ | 13,746 | | | $ | 19,891 | |
| Ratio of expenses to average net assets excluding fee waivers and reimbursements | | | 1.00 | % | | | 1.36 | % | | | 2.93 | % | | | 2.48 | % | | | 2.65 | % |
| Ratio of expenses to average net assets including fee waivers and reimbursements | | | 1.00 | % | | | 1.06 | %(f) | | | 1.60 | % | | | 1.60 | % | | | 1.60 | % |
| Ratio of net investment loss to average net assets | | | (0.45 | )% | | | (0.28 | )% | | | (0.39 | )% | | | (0.57 | )% | | | (0.45 | )% |
| Portfolio turnover rate(g) | | | 29 | % | | | 90 | % | | | 56 | % | | | 24 | % | | | 30 | % |
| (a) | Per share amounts and ratios to average net assets include income and expenses of the Kotak Mauritius Portfolio (wholly-owned subsidiary). |
| (b) | Calculated using the average shares method. |
| (c) | The per share amount does not correspond to activity reflected in the Statement of Operations due to class specific expenses during the period. |
| (d) | Less than $0.005 or ($0.005) per share. |
| (e) | Total returns are for the period indicated and have not been annualized. Total returns would have been lower had certain expenses not been waived during the period. Returns shown do not reflect the deduction of taxes that a shareholder would pay on Fund distributions or the redemption of Fund shares. |
| (f) | Effective December 2, 2019, the net expense limitation agreement changed from 1.60% to 1.00%, excluding, among other fees and expenses, 12b-1 fees and shareholder service fees. Refer to Note 8. |
| (g) | Portfolio turnover rate for periods less than one full year have not been annualized. |
See Notes to Financial Statements.
| ALPS | Kotak India Growth Fund – Class II |
Selected data for a share of beneficial interest outstanding throughout the periods indicated:
| | | For the Year Ended
October 31, 2021 | | | For the Period
December 19, 2019
(Commencement of
Operations) to
October 31, 2020 | |
| Net asset value, beginning of period | | $ | 13.08 | | | $ | 13.50 | (a) |
| | | | | | | | | |
| INCOME FROM INVESTMENT OPERATIONS: | | | | | | | | |
| Net investment income/(loss)(b) | | | (0.02 | ) | | | 0.02 | |
| Net realized and unrealized gain/(loss) | | | 6.39 | | | | (0.44 | ) |
| Total from investment operations | | | 6.37 | | | | (0.42 | ) |
| | | | | | | | | |
| Net increase/(decrease) in net asset value | | | 6.37 | | | | (0.42 | ) |
| Net asset value, end of year | | $ | 19.45 | | | $ | 13.08 | |
| TOTAL RETURN(c) | | | 48.70 | % | | | (3.11 | )% |
| | | | | | | | | |
| RATIOS/SUPPLEMENTAL DATA: | | | | | | | | |
| Net assets, end of year (000s) | | $ | 375,605 | | | $ | 136,115 | |
| Ratio of expenses to average net assets excluding fee waivers and reimbursements | | | 0.91 | % | | | 1.18 | %(d) |
| Ratio of expenses to average net assets including fee waivers and reimbursements | | | 0.75 | % | | | 0.75 | %(d) |
| Ratio of net investment income/(loss) to average net assets | | | (0.11 | )% | | | 0.24 | %(d) |
| Portfolio turnover rate(e) | | | 29 | % | | | 90 | % |
| (a) | Per share amounts and ratios to average net assets include income and expenses of the Kotak Mauritius Portfolio (wholly-owned subsidiary). |
| (b) | Calculated using the average shares method. |
| (c) | Total returns are for the period indicated and have not been annualized. Total returns would have been lower had certain expenses not been waived during the period. Returns shown do not reflect the deduction of taxes that a shareholder would pay on Fund distributions or the redemption of Fund shares. |
| (d) | Annualized. |
| (e) | Portfolio turnover rate for periods less than one full year have not been annualized. |
See Notes to Financial Statements.
| Management Commentary | October 31, 2021 (Unaudited) |
| | |
Dear Shareholder,
The ALPS | Smith Total Return Fund and ALPS | Smith Short Duration Fund were launched on June 29, 2018. We followed with the launch of The ALPS | Smith Balanced Opportunity Fund and ALPS | Smith Credit Opportunities Fund on September 15, 2020. We welcome you as a shareholder to the Funds and thank you for your trust. Our process is centered around performance, relationships and investing excellence. Our goal is to provide shareholders with consistent, risk-adjusted returns with a keen focus on capital preservation.
Total Return
The ALPS | Smith Total Return Bond Fund Class I marked a positive return of 147bps in the twelve-months ending October 31, 2021, while outperforming its benchmark, the Bloomberg U.S. Aggregate Index, by 195bps. The outperformance during the twelve-month period was attributed to duration management in Treasuries during the rapid sell-off in interest rates in the beginning of 2021 as well as the Fund’s continued overweight in corporate credit assets during the rally in spreads beginning in June 2020 through most of 2021. Risk asset performance was supported by continued Central Bank stimulus as well as a broad-based return to economic growth with reopening and vaccination efforts around the globe. The overall performance since inception through October 31, 2021 was achieved by focusing on active portfolio positioning, duration management, security selection and bottom-up fundamental credit analysis.
Short Duration
The ALPS | Smith Short Duration Bond Fund Class I marked a positive return of 105bps in the twelve-months ending October 31, 2021, outperforming its benchmark, the Bloomberg 1-3 Year U.S. Government/Credit Index, by 120bps. As a continuing theme, the Fund’s overallocation to corporate and securitized assets allowed the Fund to out-yield the Index. Additionally, individual security selection within corporate credit was a large component of the excess returns generated in the twelve-month period. With the overall flatness of the front-end U.S. Treasury curve, duration management has provided less relative outperformance given the muted moves in these front-end Treasury tenors. In this environment, the Fund maintained its focus on capital preservation. While being overweight on credit by a percentage basis vs. the benchmark, the Fund shortened its credit duration positioning as valuations continued to compress and aimed to shield investors from the relative losses associated with the interest rate sell-off more specific to the 3yr and 5yr tenors held by this Fund.
Credit Opportunities
The ALPS | Smith Credit Opportunities Fund Class I marked a positive return of 783bps in the twelve-month period ending October 31, 2021, while outperforming its benchmark, a 50/50 blend of the Bloomberg U.S. Aggregate Index and the Bloomberg U.S. Corporate High Yield Index, by 292bps. The Fund outperformed the Index by 286bps since the inception of the Fund on September 15, 2020. The outperformance of the Fund since inception was predominately driven by its overweight to corporate credit and security selection. Broadly, corporate credit as an asset class continued to recover from
the pandemic-induced sell-off, though with valuations compressing the importance of security selection and security avoidance increased significantly. Overall, positive security selection came from positions in both investment grade and high yield rating categories as well as across industry sectors.
Balanced Opportunity
The ALPS | Smith Balanced Opportunity Fund Class I marked a positive return of 2,428bps in the twelve-months ending October 31, 2021, while outperforming its benchmark, a blend of 55% Bloomberg U.S. 1000 TR Index / 45% Bloomberg U.S. Aggregate Bond Index, by 218bps. The Fund outperformed the Index by 289bps since the inception of the Fund on September 15, 2020. The performance within the Fixed Income sleeve during the twelve-month period ended October 31, 2021 was attributed to the Fund’s relative defensive duration positioning and an overweight in corporate credit assets, as well as corporate and securitized security selection during the recovery in risk asset valuations. Risk assets remain supported by Central Bank stimulus and the improving economic growth as the world continues to reopen. The Fund’s overall performance since inception was achieved by focusing on active portfolio positioning, duration management, security selection, bottom-up fundamental credit analysis and active asset allocation between the Fixed Income and Equity sleeves.
Macro Commentary
Though markets were optimistic that we were nearing the end of the pandemic, the November 2020 through October 31, 2021 reporting period was marked by short-lived highs as diverging recovery trends rippled throughout the economy. We spent much of the year on the path to normalization as the recovery continued albeit at a slower pace, as the market digested uneven and sector dependent economic data, elevated inflation levels that moved beyond “transitory” and the evolving dynamics surrounding the virus.
We started the reporting period with the Presidential win by Joe Biden in November 2020 which was met with the approval of multiple COVID-19 vaccines as well as the start of vaccine distribution. Market sentiment was optimistic, further reinforced by the “Blue Wave” election win in January 2021, another $1.9 trillion in relief via the American Rescue Plan in March 2021 and continued monetary support into increased vaccine distribution and pent-up demand. GDP estimates were revised higher, with the market reaction turning favorable for risk assets once again, driving both Treasury yields and inflation expectations up. At the tail end of the first quarter Biden proposed the American Jobs Plan, consisting of over $2 trillion allocated towards infrastructure, and the American Families Plan, consisting of $1.8 trillion to support families.
Manufacturing and Housing were initially bright spots in the beginning stages of the recovery but became more challenged as time passed. Housing was impacted by lack of supply and high pricing while manufacturing started to move sideways due to supply chain disruptions, increased costs, and lack of available employees. The hospitality industry - restaurants, travel, entertainment – as well
| Management Commentary | October 31, 2021 (Unaudited) |
| | |
as education and brick and mortar retailers, have struggled throughout the pandemic but marked improvement as increased vaccine distribution translated into reopening local economies. Confidence has fallen again post the expiration of unemployment benefits; though employment is finally starting to improve and consumers are spending – further enhanced by elevated savings and availability of credit. GDP averaged 4.9% a quarter between 4Q 2020 and 3Q 2021, losing steam as we entered the end of 2021.
Inflation has been on the market’s mind since the 2020 election results and expectations rose on the heels of the “Blue Wave” results in January. In our view, reopening an economy and unleashing pent-up demand with the combination of massive fiscal policy and a highly accommodative Federal Reserve is not only a great economic experiment, but one ripe with risks. The market spent much of the first quarter of 2021 assessing if the result of this experiment will end in significant inflation. What was initially sold as “transitory” due to rebasing, reopening, and bottlenecks proved to be sticky and the Fed has been forced to admit that not only is the data marking multi-decade highs in inflation - Core Consumer Price Index at 4.6% YoY and Core Personal Consumption Expenditures at 4.2% YoY as of October 2021 (both measure the changes in the price of goods and services, excluding food and energy) - but consumers are also feeling inflation in their everyday lives. Inflation expectations via the Fed’s 5yr-5yr forward inflation expectation rate (a measure of expected inflation over a five-year period) moved up to levels from 2014, The University of Michigan’s 1yr ahead inflation expectations are now at levels from 2008 and the 10yr breakeven rate touched levels from 2005.
We were somewhat surprised by the initial complacency at the Fed around the recent heightened inflation readings. It was as though the message of ‘transitory’ was so strongly anchored that they ignored the fact that the bargaining power of labor is improving, and wages are likely headed higher. There is story after story of wage increases on the horizon and, we believe, many more to follow. It will be very interesting to see how economists adjust their 2022 view of inflation falling back to pre-covid levels as time passes. The consensus has both growth and inflation turning over in 2022, returning to longer term averages. We are skeptical of the consensus, favoring better growth coinciding with stickier and higher inflation.
We are hard-pressed to argue with the four headed horsemen of disinflation (temporary slowing of the pace of price inflation) – Demographics, Technological Innovation, Globalization and now Debt Overhang (government incurs debt at such a high rate that they are unable to fund future projects) – but find ourselves a little concerned that both growth and inflation will settle out at levels higher than the consensus.
We have seen reopening largely occur however the progress has been sporadic given new variants of the virus. Economic data has improved and moved into a normalizing stage, though we continue to see the unleashing of pent-up demand. Going forward, fiscal and monetary policy will become less supportive, and inflation expectations remain elevated. Negative virus news continues to be
met with overall positive vaccine distribution, increasing wages and job availability, and economic reopening. The tone continues to mark two steps forward and one step back but overall, still making forward progress. The Federal Reserve announced tapering of bond purchases to offset rising inflationary pressures immediately following our reporting period. We expect to see the Fed raise interest rates in the 2022 calendar year.
Portfolio Positioning
As of October 31, 2021, with the rise in U.S. Treasury yields due to ramping concerns surrounding inflation and talk of a Fed taper, the Funds remained underweight duration versus their respective benchmarks and in our opinion, have been nimble in using longer duration securities within the Funds’ portfolios. Even with the increase in U.S. Treasury yields this fiscal year, real yields remain stubbornly negative throughout most of the year as concerns surrounding COVID variants, threats to emergent economic growth, the potential for Fed policy error and uncertainty about the stickiness of domestic inflation have left outright U.S. Treasury yields lower than would have been expected. We continue to focus on the combined impact of Fiscal and Monetary stimulus on both real inflation as well as changes in market expectations surrounding inflation. We are also focused on the shape of the curve as the later parts of this fiscal year showed the beginning of a flattening across the longer maturities of the yield curve. We remain proactive in managing our longer duration U.S. Treasury position.
Within our credit allocation we gradually reduced aggregate and risk exposure this year. Coming into 2021 we were optimistic around the potential for continued progress in the global reopening and economic recovery. Despite some fits and starts in this process, as of October 31, 2021, we remain positive on the improving tone of both the domestic as well as the global economy going forward. However, as part of this we witnessed risk asset spreads, be it investment grade or high yield credit, as well as agency and non-agency mortgage-backed securities (MBS) and commercial mortgage-backed securities (CMBS), quickly moving toward decade, if not all-time, lows given the wall of liquidity in the market and the prevailing stance on risk taking. As such we reduced both the overall credit weighting as well as the duration profile of certain Funds’ credit allocation during the period, specifically in both the ALPS | Smith Balanced Opportunity Fund and ALPS l Smith Total Return Fund. This reduction has allowed us to focus our exposure on where we see continued fundamental tailwinds to sector or individual company credit profiles. While we continue to like credit despite the massive tightening in spreads, as it remains one of the few asset classes within Fixed Income providing yield, we believe this decreased risk exposure will allow the portfolio to be more resilient and opportunistic when looking towards the potential for unexpected outcomes combined with stretched valuations. As of the date of this report, we continue to target investing in companies with executive teams who focus on managing through downside scenarios, giving themselves optionality as well as downside protection. We remain encouraged by the number of companies continuing to balance capital allocation actions that benefit both debt and equity holders, but absent another significant risk flare, we would expect this trend
| Management Commentary | October 31, 2021 (Unaudited) |
| | |
to continue to shift more in favor of equity holders. All these factors have continued to drive our disciplined process centered around risk-adjusted returns and capital preservation while seeking to balance the overall need for yield across all developed markets.
Short duration high yield continues to be a focus at Smith Capital Investors. This area of the market has much less forecasting error embedded in its analysis—it is predominately a liquidity analysis over a very short period vs. longer-term projections on industries, commodity prices, and competitive dynamics facing a sector/company. We also believe that incremental compensation to move out on the curve should be higher than observed in many capital structures and therefore many shorter-duration assets have resulted in extremely attractive risk-adjusted return profiles.
Within the Funds’ securitized allocations, we continue to allocate to Agency-mortgage-backed collateralized mortgage obligations (CMOs) and Agency CMBS where valuations are appropriate. In the previous six-month period, we witnessed spreads reaching new lows as the demand from the Federal Reserve and commercial banks overwhelmed the supply dynamic. While we still find that select CMOs and Agency CMBS provide better convexity, exhibit less change in duration given changes in interest rates and prepayment speeds, and provide higher option-adjusted spreads and yield, these opportunities have become harder to come by. As such, the Funds’ overall weightings to this asset class passively decreased during the period as we did not reinvest paydowns or allocate new money to this space given our unfavorable view of generic asset class risk- adjusted return potential. Additionally, with the significant rise in interest rates during the beginning of 2021, we witnessed a large-scale duration extension of the Agency MBS market, exactly at the time investors were searching for shorter duration options. We were aided in this volatility by our continued focus on seeking to select securities that perform well through a wide band of underlying assumptions rather than a specific directional view.
Fixed Income Themes
Investment Grade (IG) Credit – In a year where investment grade credit spreads quickly marched towards 10yr plus tights (investment grade corporate credit spreads reached a low of 80 OAS - option-adjusted spread - in June), three intertwined drivers were at the helm: stimulus—both monetary and fiscal, economic recovery, and the resulting strong technical backdrop or demand for corporate credit. Combined these factors were powerful inputs for both corporate economics and financial conditions.
This said, it was not unreasonable to expect the unprecedented times and unprecedented reactions taken the prior year to normalize over time and therefore expect these three drivers of the recovery to ebb. And while the pursuit of stability and predictability is often what the market seeks, our investment process forcibly questions us how to maximize our chances at adapting to and taking advantage of an unknown future. As valuations in the IG Credit market began to offer diminished compensation for possible unknowns, the Funds worked towards steadily reducing duration contribution in corporate credit from the prior year period.
In periods of time like these, where there becomes less room for error embedded in valuations, we have found the following items to be of acute importance:
Risk-Adjusted Carry – in this environment, carry (yield income) is of elevated importance. But as with most things not all carry is built the same. Fundamental analysis can unearth risk profiles that may compare more or less favorably when compared to their commensurate carry profiles. This brings us to the symbiotic nature of security selection and avoidance.
Security Selection – under the surface of the Investment Grade Corporate Credit Index there is constantly significant opportunity for individual security selection. No matter the inning of the credit cycle or the outlook, there are always undersurface-opportunities created by changing corporate credit risk profiles. We look for those that display higher probabilities for improving credit strength.
Security Avoidance – conversely, active management can purposefully choose to avoid owning certain credits and should do so. A credit that has a higher probability of going through a phase of deteriorating credit strength would be a prime example of a name to avoid.
It was these items that came to the forefront of our credit investment process over the past year and therefore influenced credit sleeve portfolio construction.
High Yield (HY) Credit – While valuations entered the year having tightened significantly from the pandemic driven selloff, we remained positive on corporate credit largely due to the three drivers mentioned above: stimulative policy, a continued economic rebound, and a supportive technical backdrop. As expected, the ongoing economic rebound drove improvement in the fundamentals of high yield issuers, with earnings largely demonstrating elevated demand trends, margin expansion, and balance sheet deleveraging. While we saw a shift in capital allocation priorities toward shareholder friendly activities, we would characterize the shift as credit neutral given an ongoing commitment to maintain healthy balance sheets and leverage ratios. Alongside improving fundamentals, we observed a transition away from the rating agency downgrade cycle of 2020 to an upgrade cycle, with J.P. Morgan reporting a year-to-date upgrade -to-downgrade ratio of 2.3 to 1. On the technical side, the steady inflows we saw into high yield funds in 2020 reversed to modest outflows in 2021. Gross new issuance activity has remained elevated, but supply has been more muted on a net basis given high levels of refinancing activity. Lackluster asset class flows were not enough to offset the improving fundamental picture, with the Bloomberg U.S. Corporate High Yield Index returning 435bps YTD through October 2021.
| Management Commentary | October 31, 2021 (Unaudited) |
| | |
Looking forward, data sources have indicated that while high yield issuer fundamentals are very healthy, investor enthusiasm is also high and valuations remain tight relative to historical levels. Recently observed supply chain disruption and cost inflation are headwinds to the margin and earnings story that has helped drive valuations lower. However, in our view, further reopening and continued strong consumption trends could help issuers weather the storm. We continue to favor investments in short duration high yield bonds, which we believe offer attractive risk-adjusted carry. With strong balance sheets, healthy free cash flow profiles, and supportive capital markets there is ample flexibility for issuers to refinance shorter-dated maturities, and with the average coupon on the Bloomberg U.S. Corporate High Yield Index well in the money, the economics of refinancing continue to make sense. Although the overall outlook may be murky, it seems likely that the investing environment for corporate credit will remain extremely dynamic. We believe that the crosscurrents of rapidly shifting macroeconomic policy and fundamentals combined with changing capital allocation priorities and consumer behaviors create a target rich investing environment for active managers focused on security selection in improving credit stories.
MBS – MBS highlighted an area of opportunity entering 2021 given its short duration profile and support from Federal Reserve asset purchases. However, given the rapid move higher from interest rates in the beginning of the year and the persistent pick up in interest rate volatility we have witnessed MBS underperform thus far in 2021. Ending October 31, 2021, the Bloomberg U.S. MBS Index (MBS) had nominal returns of -86bps YTD. However, this does not tell the entire story as the MBS Index started the year with a duration that averaged ~2yrs YTD while the duration of the Bloomberg U.S. Aggregate Bond Index (the “Agg”) was ~6yrs. From an excess return perspective, which adjusts for this duration differential, the Bloomberg MBS Index underperformed the Agg by 44bps. Despite the initial short duration profile of the MBS Index, the increase in interest rates and the embedded negative convexity (duration increases in conjunction with an increase in yield) of mortgages resulted in the MBS Index duration increasing to ~4.6yrs as of October 31, 2021; occurring at the same time interest rates were rising and contributing to the negative returns experienced by the asset class. Also, comparing the MBS Index to broad fixed income market indices with a similar short duration, MBS underperformed the Bloomberg 1-5 Year U.S. Credit Index (with a duration of 2.8yrs) by 90bps YTD.
Looking forward we see the case for continued MBS outperformance to be tricky at best. MBS OAS has risen throughout the year from lows near 10bps to mid-30bps, while the nominal spread (which does not account for the option MBS investors are short) has increased by ~35bps to mid-60bps. Both measures are closer to historical averages (40-50bps historical OAS range) but with the Fed beginning to taper purchases new buyers will need to emerge at valuation levels that are still below historical norms to maintain current valuations. We find this assumption suspect as the continued elevated interest rate volatility will leave some MBS investors leery of taking the negative convexity risk embedded in
MBS. Any further interest rate sell-off will continue pushing MBS durations higher, increasing the negative return potential from higher rates. As of October 31, 2021, with relatively unattractive valuations and elevated convexity risk levels, we do not see the path for substantial outperformance being likely. As is often with markets, peeling back the variables affecting performance, especially relative performance, can tell a different story than a headline.
Interest Rates – In the first six months of the year, price action from Treasuries provided a little something for everyone. Treasuries are traditionally an excellent indicator for future economic expectations, and we have once again lived through various mini-cycles. U.S. Treasury yields moved higher in a fast and furious manner, starting with the “Blue Wave” results in January. This was further supported by the efficacy of the vaccine, additional fiscal stimulus, and prospects of economic reopening—all pointing to improving growth and inflation expectations. The street upgraded growth forecasts, inflation expectations rose, and the market challenged the Fed’s view that they would be able to control inflation. March brought us into a narrow trading range for approximately 16 weeks. While the Treasury market waited for validation from the data, the Funds moved between reopening/vaccine enthusiasm and economic data disappointment. In June, the Fed’s action was the catalyst to break the 30yr U.S. Treasury out of the long-running range. This, coupled with increased COVID-19 cases from the Delta variant, thin summer volumes, pension buying, a short squeeze, lackluster economic results, global yield differentials and strong seasonals (regular and predictable pattern every year), pushed 30yr yields close to levels registered in January 2021. While our team entered 2021 extremely optimistic around the recovery, the Treasury market quickly reminded us that much remained out of our control and the Funds must remain active in the rates market.
The Smith Capital Team has observed investment cycles getting shorter, we have watched a collision of factors move the market dramatically in both directions, and we are frequently reminded that interest rates are a key risk factor in the fixed income market given outright low yields. Sentiment moves quickly based on the ebb and flow of case counts and new variants. Muscle memory quickly reacts to negative virus news; higher cases equal lower yields and vice versa. Outright yield levels matter, seasonals are important, pension buying moves the market, and investor positioning can tip the scales. Throw in global yield differentials and the economic outlook, and once again, there are competing factors and thus volatility. The Fed is moving from highly accommodative to less accommodative, the stimulus injection is fading, and pandemic benefits have expired. The market moved past the downturn and subsequent recovery and into a period of normalized economic activity. These elements impact the shape of the curve as the front-end contends with the Fed removing policy, and the long-end reflects growth and inflation expectations. The Team has been surprised by the lack of liftoff from the long-end given record high levels of inflation. This suggests that the market believes there will be policy error in the future. As we look to the end of the year and into 2022, we believe competing factors will keep volatility high in the interest rate market. The market is not lacking for event-driven risk over the next year, and we
| Management Commentary | October 31, 2021 (Unaudited) |
| | |
see the possibility of both positive and negative catalysts in the marketplace. One thing is clear - the bond market reminds us that uncertainty remains.
Conclusion – After what has been an unprecedented and long pandemic, the last twelve months have signaled that the economy is making significant progress towards a full recovery with the support of both fiscal and monetary policy. This did however lead to a period of complacency in the marketplace and we know complacency is historically followed by volatility. While it is always dangerous to draw strong conclusions from past experiences, it feels like we should expect greater volatility into year-end and 2022, especially in rates and the yield curve. Competing forces including inflation/deflation, the virus, removal of monetary policy, and potential growth/recovery will keep volatility front and center, suggesting that long duration assets are vulnerable. The market’s transition from Fed supported to self-sustaining has historically proven to be one littered with speed bumps versus a relaxed straight line. As a reminder, with volatility comes opportunity and active management – both in regard to security selection and avoidance – allowing for better outcomes in a dynamic market environment.
As always, our three pillars remain front and center – Investment Excellence, Relationships/People and Intentional Culture.
With great appreciation and gratitude,
 |  |
| | |
| R. Gibson Smith | Eric C. Bernum, CFA |
| Portfolio Manager | Portfolio Manager |
| | |
 |  |
| | |
| Jonathan Aal | Garrett Olson |
| Portfolio Manager | Portfolio Manager |
Past performance is no guarantee of future results. Dividends are not guaranteed and are subject to change or elimination. Investments in international and emerging markets securities include exposure to risks such as currency fluctuations, foreign taxes and regulations, and the potential for illiquid markets and political instability.
The views of the author and information discussed in this commentary are as of the date of publication, are subject to change, and may not reflect the writer's current views. The views expressed are those of the author only, and represent an assessment of market conditions at a specific point in time, are opinions only and should not be relied upon as investment advice regarding a particular investment or markets in general. Such information does not constitute a recommendation to buy or sell specific securities or investment vehicles. It should not be assumed that any investment will be profitable or will equal the performance of the fund(s) or any securities or any sectors mentioned in this letter. The subject matter contained in this letter has been derived from several sources believed to be reliable and accurate at the time of compilation. Neither ALPS Advisors, Inc., Smith Capital Investors, LLC, nor the Funds accepts any liability for losses either direct or consequential caused by the use of this information.
Indices do not reflect deductions for fees, expenses, or taxes.
An investor may not invest directly in an index.
Diversification cannot guarantee gain or prevent losses.
Gibson Smith is a registered representative of ALPS Distributors, Inc.
Eric Bernum is a registered representative of ALPS Distributors, Inc.
ALPS Portfolio Solutions Distributor, Inc., ALPS Distributors, Inc. and ALPS Advisors Inc. are affiliated.
ALPS | Smith Short Duration Bond Fund
| Performance Update | October 31, 2021 (Unaudited) |
Performance of $100,000 Initial Investment (as of October 31, 2021)
Comparison of change in value of a $100,000 investment

The chart above represents historical performance of a hypothetical investment of $100,000 in the Fund since inception. Past performance does not guarantee future results. This chart does not reflect the deduction of taxes that a shareholder would pay on Fund distributions or the redemption of Fund shares.
Average Annual Total Returns (as of October 31, 2021)
| | 1 Year | 3 Year | Since Inception^ | Total Expense Ratio | What You Pay* |
| Class I | 1.05% | 4.10% | 3.83% | 0.70% | 0.49% |
| Investor (NAV) | 0.77% | 3.86% | 3.54% | 0.96% | 0.79% |
| Class A (NAV) | 0.77% | 3.83% | 3.52% | 0.96% | 0.79% |
| Class A (MOP) | -1.46% | 1.89% | 1.79% |
| Class C (NAV) | -0.01% | 3.07% | 2.78% | 1.67% | 1.49% |
| Class C (CDSC) | -1.00% | 3.07% | 2.78% |
| Bloomberg U.S. Government/Credit Bond Index¹ | -0.48% | 6.27% | 5.35% | | |
| Bloomberg 1-3 Year Government/Credit Bond Index² | -0.05% | 2.72% | 2.58% | | |
Performance data quoted represents past performance. Past performance does not guarantee future results. Investment return and principal value of an investment will fluctuate so that an investor's shares, when sold or redeemed, may be worth more or less than the original cost. Current performance data may be higher or lower than actual data quoted. For the most current month-end performance data, please call 1-866-759-5679.
Effective September 1, 2020 the Maximum Offering Price (MOP) for Class A shares includes the Fund’s maximum sales charge of 2.25%. Prior to September 1, 2020 the sales charge was 5.50%. Performance shown at NAV does not include these sales charges and would have been lower had it been taken into account. If you invest $500 thousand or more, either as a lump sum or through the Fund’s accumulation or letter of intent programs, you can purchase Class A shares without an initial sales charge (load). A Contingent Deferred Sales Charge (“CDSC”) of 1.00% may apply to Class C shares redeemed within the first 12 months after a purchase, and on Class A shares redeemed within the first 18 months after a purchase in excess of $1 million.
Performance less than 1 year is cumulative.
ALPS | Smith Short Duration Bond Fund
| Performance Update | October 31, 2021 (Unaudited) |
| 1 | The Bloomberg US Government/Credit Index: composed of all publicly issued, fixed-rate, nonconvertible, investment-grade corporate debt. Issues are rated at least Baa by Moody's Investors Service or BBB by Standard & Poor's, if unrated by Moody's. Collateralized Mortgage Obligations (CMOs) are not included. Total return comprises price appreciation/depreciation and income as a percentage of the original investment. The index is not actively managed and does not reflect any deductions for fees, expenses or taxes. An investor may not invest directly in an index. |
| 2 | The Bloomberg 1-3 Yr US Gov/Credit TR Index Unhedged: an index that includes all medium and larger issues of U.S. government, investment-grade corporate, and investment-grade international dollar-denominated bonds that have maturities of between 1 and 3 years and are publicly issued. The index is not actively managed and does not reflect any deductions for fees, expenses or taxes. An investor may not invest directly in an index. |
| ^ | Fund Inception date of June 29, 2018. |
| * | What You Pay reflects the Advisor’s decision to contractually limit expenses through February 28, 2022. Please see the prospectus dated February 28, 2021 for additional information. |
The table does not reflect the deduction of taxes that a shareholder would pay on Fund distributions or the redemption of Fund shares.
This Fund is not suitable for all investors, and is subject to investment risks, including possible loss of the principal amount invested.
There is no guarantee that the Fund will continue to hold any one particular security or stay invested in any one particular company. The composition of the Fund's top holdings is subject to change. Performance figures are historical and reflect the change in share price, reinvested distributions, changes in net asset value, sales charges and capital gains distributions, if any.
Not FDIC Insured – No Bank Guarantee – May Lose Value
Asset Type Allocation (as a % of Net Assets) †
| Corporate Bond | 79.69% |
| Government Bond | 15.87% |
| Mortgage-Backed Securities | 2.26% |
| Collateralized Mortgage Obligations | 0.37% |
| Commercial Mortgage-Backed Securities | 0.19% |
| Municipal Bond | 0.18% |
| Cash, Cash Equivalents, & Other Net Assets | 1.44% |
| Total | 100.00% |
| † | Holdings are subject to change, and may not reflect the current or future position of the portfolio. Table presents approximate values only. |
Top Ten Holdings (as a % of Net Assets) †
| U.S. Treasury Note 0.125% 08/31/2023 | 3.21% |
| U.S. Treasury Note 0.25% 09/30/2023 | 2.86% |
| U.S. Treasury Note 0.25% 06/15/2023 | 2.14% |
| U.S. Treasury Note 0.125% 07/31/2023 | 1.86% |
| U.S. Treasury Note 0.125% 06/30/2023 | 1.82% |
| U.S. Treasury Note 0.125% 05/31/2023 | 1.81% |
| Huntington Ingalls Industries, Inc. 0.67% 08/16/2023 | 1.43% |
| Martin Marietta Materials, Inc. 0.65% 07/15/2023 | 1.25% |
| Midwest Connector Capital Co. LLC 3.625% 04/01/2022 | 1.20% |
| U.S. Treasury Note 0.125% 03/31/2023 | 1.18% |
| Top Ten Holdings | 18.76% |
| † | Holdings are subject to change, and may not reflect the current or future position of the portfolio. Table presents approximate values only. |
Industry Sector Allocation (as a % of Net Assets)
| Banks | 20.29% |
| Sovereign | 15.86% |
| Auto Manufacturers | 6.72% |
| Diversified Finan Serv | 6.69% |
| Electric | 4.49% |
| Pipelines | 4.15% |
| Pharmaceuticals | 3.75% |
| Aerospace/Defense | 2.82% |
| Commercial Services | 2.80% |
| Mortgage Securities | 2.53% |
| Retail | 2.34% |
| Telecommunications | 2.21% |
| Semiconductors | 1.85% |
| Oil & Gas | 1.81% |
| Software | 1.79% |
| Healthcare-Services | 1.75% |
| Healthcare-Products | 1.72% |
| Shipbuilding | 1.43% |
| Building Materials | 1.25% |
| Gas | 1.20% |
| Iron/Steel | 1.10% |
| Food | 1.10% |
| Media | 1.04% |
| Other Industries (each less than 1%) | 7.86%* |
| Cash Equivalents & Other Net Assets | 1.45% |
| Total | 100.00% |
| * | See Statement of Investments for detailed breakout of other industries. |
ALPS | Smith Total Return Bond Fund
| Performance Update | October 31, 2021 (Unaudited) |
Performance of $100,000 Initial Investment (as of October 31, 2021)
Comparison of change in value of a $100,000 investment

The chart above represents historical performance of a hypothetical investment of $100,000 in the Fund since inception. Past performance does not guarantee future results. This chart does not reflect the deduction of taxes that a shareholder would pay on Fund distributions or the redemption of Fund shares.
Average Annual Total Returns (as of October 31, 2021)
| | 1 Year | 3 Year | Since Inception^ | Total Expense Ratio | What You Pay* |
| Class I | 1.47% | 6.88% | 6.50% | 0.72% | 0.67% |
| Investor (NAV) | 1.26% | 6.57% | 6.20% | 1.02% | 0.97% |
| Class A (NAV) | 1.27% | 6.59% | 6.22% | 1.01% | 0.97% |
| Class A (MOP) | -0.98% | 4.61% | 4.45% |
| Class C (NAV) | 0.55% | 5.83% | 5.47% | 1.72% | 1.67% |
| Class C (CDSC) | -0.43% | 5.83% | 5.47% |
| Bloomberg US Aggregate Bond Index1 | -0.48% | 5.63% | 4.80% | | |
Performance data quoted represents past performance. Past performance does not guarantee future results. Investment return and principal value of an investment will fluctuate so that an investor's shares, when sold or redeemed, may be worth more or less than the original cost. Current performance data may be higher or lower than actual data quoted. For the most current month-end performance data, please call 1-866-759-5679.
Effective September 1, 2020 the Maximum Offering Price (MOP) for Class A shares includes the Fund’s maximum sales charge of 2.25%. Prior to September 1, 2020 the sales charge was 5.50%. Performance shown at NAV does not include these sales charges and would have been lower had it been taken into account. If you invest $500 thousand or more, either as a lump sum or through the Fund’s accumulation or letter of intent programs, you can purchase Class A shares without an initial sales charge (load). A Contingent Deferred Sales Charge (“CDSC”) of 1.00% may apply to Class C shares redeemed within the first 12 months after a purchase, and on Class A shares redeemed within the first 18 months after a purchase in excess of $1 million.
Performance less than 1 year is cumulative.
ALPS | Smith Total Return Bond Fund
| Performance Update | October 31, 2021 (Unaudited) |
| 1 | The Bloomberg U.S. Aggregate Bond Index provides a measure of the performance of the U.S. dollar denominated investment grade bond market, which includes investment grade government bonds, investment grade corporate bonds, mortgage pass through securities, commercial mortgage backed securities and asset backed securities that are publicly for sale in the United States. The index is not actively managed and does not reflect any deductions for fees, expenses or taxes. An investor may not invest directly in an index. |
| ^ | Fund Inception date of June 29, 2018. |
| * | What You Pay reflects the Advisor’s decision to contractually limit expenses through February 28, 2022. Please see the prospectus dated February 28, 2021 for additional information. |
The table does not reflect the deduction of taxes that a shareholder would pay on Fund distributions or the redemption of Fund shares.
This Fund is not suitable for all investors, and is subject to investment risks, including possible loss of the principal amount invested.
There is no guarantee that the Fund will continue to hold any one particular security or stay invested in any one particular company. The composition of the Fund's top holdings is subject to change. Performance figures are historical and reflect the change in share price, reinvested distributions, changes in net asset value, sales charges and capital gains distributions, if any.
Not FDIC Insured – No Bank Guarantee – May Lose Value
Asset Type Allocation (as a % of Net Assets) †
| Corporate Bond | 56.25% |
| Government Bond | 26.75% |
| Collateralized Mortgage Obligations | 7.15% |
| Mortgage-Backed Securities | 5.66% |
| Commercial Mortgage-Backed Securities | 2.53% |
| Preferred Stock | 1.14% |
| Cash, Cash Equivalents, & Other Net Assets | 0.52% |
| Total | 100.00% |
| † | Holdings are subject to change, and may not reflect the current or future position of the portfolio. Table presents approximate values only. |
Top Ten Holdings (as a % of Net Assets) †
| U.S. Treasury Bond 1.75% 08/15/2041 | 4.87% |
| U.S. Treasury Note 1.625% 05/15/2031 | 2.41% |
| U.S. Treasury Note 0.5% 02/28/2026 | 2.27% |
| U.S. Treasury Bond 1.25% 08/15/2031 | 2.20% |
| U.S. Treasury Bond 1.125% 02/15/2031 | 2.11% |
| U.S. Treasury Note 0.75% 03/31/2026 | 2.06% |
| U.S. Treasury Bond 2% 08/15/2051 | 1.99% |
| U.S. Treasury Note 0.125% 12/15/2023 | 1.85% |
| U.S. Treasury Note 0.25% 09/30/2023 | 1.55% |
| Morgan Stanley 1D US SOFR + 1.36% 09/16/2036 | 1.23% |
| Top Ten Holdings | 22.54% |
| † | Holdings are subject to change, and may not reflect the current or future position of the portfolio. Table presents approximate values only. |
Industry Sector Allocation (as a % of Net Assets)
| Sovereign | 26.76% |
| Banks | 15.50% |
| Mortgage Securities | 14.16% |
| Diversified Finan Serv | 5.89% |
| Pipelines | 4.74% |
| Electric | 3.25% |
| Auto Manufacturers | 3.18% |
| Pharmaceuticals | 3.09% |
| Aerospace/Defense | 2.44% |
| Media | 2.23% |
| Healthcare-Services | 1.80% |
| Retail | 1.65% |
| Airlines | 1.64% |
| Commercial Services | 1.49% |
| Oil & Gas | 1.16% |
| Other Industries (each less than 1%) | 10.51%* |
| Cash Equivalents & Other Net Assets | 0.51% |
| Total | 100.00% |
| * | See Statement of Investments for detailed breakout of other industries. |
ALPS | Smith Credit Opportunities Fund
| Performance Update | October 31, 2021 (Unaudited) |
Performance of $100,000 Initial Investment (as of October 31, 2021)
Comparison of change in value of a $100,000 investment
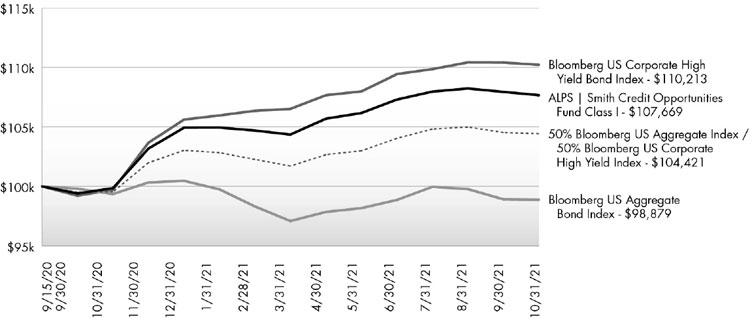
The chart above represents historical performance of a hypothetical investment of $100,000 in the Fund since inception. Past performance does not guarantee future results. This chart does not reflect the deduction of taxes that a shareholder would pay on Fund distributions or the redemption of Fund shares.
Average Annual Total Returns (as of October 31, 2021)
| | 1 Year | Since Inception^ | Total Expense Ratio | What You Pay* |
| Class I | 7.83% | 6.78% | 1.02% | 0.90% |
| Investor (NAV) | 7.63% | 6.53% | 1.32% | 1.20% |
| Class A (NAV) | 7.65% | 6.55% | 1.32% | 1.20% |
| Class A (MOP) | 5.22% | 4.42% |
| Class C (NAV) | 6.88% | 5.80% | 2.02% | 1.90% |
| Class C (CDSC) | 5.88% | 5.80% |
| 50% Bloomberg US Aggregate Index / 50% Bloomberg US Corporate High Yield Index1,2 | 4.91% | 3.93% | | |
| Bloomberg US Aggregate Bond Index | -0.48% | -1.00% | | |
| Bloomberg US Corporate High Yield Bond Index | 10.53% | 9.02% | | |
Performance data quoted represents past performance. Past performance does not guarantee future results. Investment return and principal value of an investment will fluctuate so that an investor's shares, when sold or redeemed, may be worth more or less than the original cost. Current performance data may be higher or lower than actual data quoted. For the most current month-end performance data, please call 1-866-759-5679.
Maximum Offering Price (MOP) for Class A shares includes the Fund’s maximum sales charge of 2.25%. Performance shown at NAV does not include these sales charges and would have been lower had it been taken into account. If you invest $500 thousand or more, either as a lump sum or through the Fund’s accumulation or letter of intent programs, you can purchase Class A shares without an initial sales charge (load). A Contingent Deferred Sales Charge (“CDSC”) of 1.00% may apply to Class C shares redeemed within the first 12 months after a purchase, and on Class A shares redeemed within the first 18 months after a purchase in excess of $1 million.
Performance less than 1 year is cumulative.
ALPS | Smith Credit Opportunities Fund
| Performance Update | October 31, 2021 (Unaudited) |
| 1 | Bloomberg US Aggregate Bond Index: provides a measure of the performance of the U.S. dollar denominated investment grade bond market, which includes investment grade government bonds, investment grade corporate bonds, mortgage pass through securities, commercial mortgage backed securities and asset backed securities that are publicly for sale in the United States. The index is not actively managed and does not reflect any deduction for fees, expenses or taxes. An investor may not invest directly in an index. |
| 2 | Bloomberg US Corporate High Yield Index measures the USD-denominated, high yield, fixed-rate corporate bond market. The index is not actively managed and does not reflect any deduction for fees, expenses or taxes. An investor may not invest directly in an index. |
| ^ | Fund Inception date of September 15, 2020. The Fund has limited operating history. |
| * | What You Pay reflects the Advisor’s decision to contractually limit expenses through February 28, 2022. Please see the prospectus dated February 28, 2021 for additional information. |
The table does not reflect the deduction of taxes that a shareholder would pay on Fund distributions or the redemption of Fund shares.
This Fund is not suitable for all investors, and is subject to investment risks, including possible loss of the principal amount invested.
There is no guarantee that the Fund will continue to hold any one particular security or stay invested in any one particular company. The composition of the Fund's top holdings is subject to change. Performance figures are historical and reflect the change in share price, reinvested distributions, changes in net asset value, sales charges and capital gains distributions, if any.
Not FDIC Insured – No Bank Guarantee – May Lose Value
Asset Type Allocation (as a % of Net Assets) †
| Corporate Bond | 86.74% |
| Government Bond | 3.73% |
| Preferred Stock | 3.65% |
| Exchange Traded Funds | 2.25% |
| Common Stock | 1.25% |
| Mortgage-Backed Securities | 0.79% |
| Collateralized Mortgage Obligations | 0.23% |
| Cash, Cash Equivalents, & Other Net Assets | 1.36% |
| Total | 100.00% |
| † | Holdings are subject to change, and may not reflect the current or future position of the portfolio. Table presents approximate values only. |
Top Ten Holdings (as a % of Net Assets) †
| U.S. Treasury Bond 1.75% 08/15/2041 | 3.21% |
| Invesco Senior Loan ETF | 2.25% |
| SVB Financial Group 10Y US TI + 3.064% 12/31/2049 | 2.15% |
| Bausch Health Cos., Inc. 6.125% 04/15/2025 | 1.97% |
| Scripps Escrow II, Inc. 5.375% 01/15/2031 | 1.69% |
| Qurate Retail, Inc. 8% 03/15/2031 | 1.53% |
| Nissan Motor Co., Ltd. 4.81% 09/17/2030 | 1.52% |
| Ford Motor Co. 9% 04/22/2025 | 1.47% |
| ROBLOX Corp. 3.875% 05/01/2030 | 1.46% |
| OWL Rock Core Income Corp. 3.125% 09/23/2026 | 1.43% |
| Top Ten Holdings | 18.68% |
| † | Holdings are subject to change, and may not reflect the current or future position of the portfolio. Table presents approximate values only. |
Industry Sector Allocation (as a % of Net Assets)
| Banks | 11.91% |
| Diversified Finan Serv | 9.84% |
| Retail | 6.52% |
| Pipelines | 5.97% |
| Commercial Services | 4.91% |
| Auto Manufacturers | 4.82% |
| Media | 4.55% |
| Real Estate | 3.89% |
| Sovereign | 3.73% |
| Investment Companies | 2.97% |
| Lodging | 2.93% |
| Airlines | 2.87% |
| Software | 2.72% |
| Pharmaceuticals | 2.65% |
| Home Builders | 2.54% |
| Integrated Utilities | 2.25% |
| REITS | 2.25% |
| Aerospace/Defense | 2.02% |
| Electric | 1.93% |
| Oil & Gas | 1.91% |
| Food | 1.55% |
| Advertising | 1.30% |
| Engineering & Construction | 1.16% |
| Machinery-Diversified | 1.12% |
| Other Industries (each less than 1%) | 10.33%* |
| Cash Equivalents & Other Net Assets | 1.36% |
| Total | 100.00% |
| * | See Statement of Investments for detailed breakout of other industries. |
ALPS | Smith Balanced Opportunity Fund
| Performance Update | October 31, 2021 (Unaudited) |
Performance of $100,000 Initial Investment (as of October 31, 2021)
Comparison of change in value of a $100,000 investment
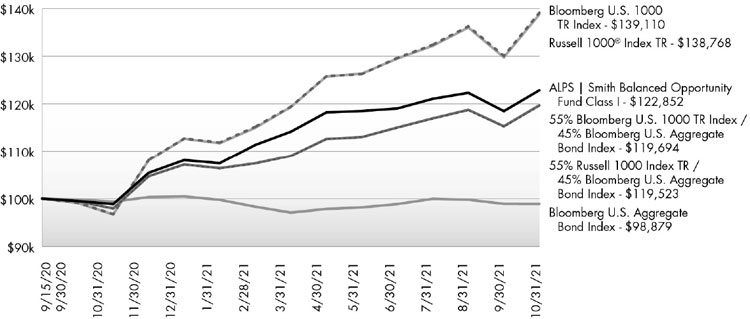
The chart above represents historical performance of a hypothetical investment of $100,000 in the Fund since inception. Past performance does not guarantee future results. This chart does not reflect the deduction of taxes that a shareholder would pay on Fund distributions or the redemption of Fund shares.
Average Annual Total Returns (as of October 31, 2021)
| | 1 Year | Since Inception^ | Total Expense Ratio | What You Pay* |
| Class I | 24.28% | 20.05% | 1.03% | 0.85% |
| Investor (NAV) | 23.95% | 19.74% | 1.33% | 1.15% |
| Class A (NAV) | 23.96% | 19.77% | 1.33% | 1.15% |
| Class A (MOP) | 19.95% | 16.26% |
| Class C (NAV) | 22.93% | 18.93%+ | 2.03% | 1.85% |
| Class C (CDSC) | 21.93% | 18.93% |
| 55% Bloomberg U.S. 1000 TR Index / 45% Bloomberg U.S. Aggregate Bond Index1,3 | 22.20% | 17.31% | | |
| 55% Russell 1000 Index TR / 45% Bloomberg U.S. Aggregate Bond Index2,3 | 22.10% | 17.16% | | |
| Bloomberg U.S. Aggregate Bond Index | -0.48% | -1.00% | | |
| Russell 1000® Index TR | 43.51% | 33.77% | | |
| Bloomberg U.S. 1000 TR Index | 43.72% | 34.06% | | |
Performance data quoted represents past performance. Past performance does not guarantee future results. Investment return and principal value of an investment will fluctuate so that an investor's shares, when sold or redeemed, may be worth more or less than the original cost. Current performance data may be higher or lower than actual data quoted. For the most current month-end performance data, please call 1-866-759-5679.
Maximum Offering Price (MOP) for Class A shares includes the Fund’s maximum sales charge of 3.25%. Performance shown at NAV does not include these sales charges and would have been lower had it been taken into account. If you invest $500 thousand or more, either as a lump sum or through the Fund’s accumulation or letter of intent programs, you can purchase Class A shares without an initial sales charge (load). A Contingent Deferred Sales Charge (“CDSC”) of 1.00% may apply to Class C shares redeemed within the first 12 months after a purchase, and on Class A shares redeemed within the first 18 months after a purchase in excess of $1 million.
Performance less than 1 year is cumulative.
ALPS | Smith Balanced Opportunity Fund
| Performance Update | October 31, 2021 (Unaudited) |
| 1 | Effective February 1, 2021, the Bloomberg U.S. 1000 TR Index replaced the Russell 1000 Index TR component. The Bloomberg U.S. 1000 Total Return Index is a float market-cap weighted benchmark of the 1000 most highly capitalized US companies. The index is not actively managed and does not reflect any deduction for fees, expenses or taxes. An investor may not invest directly in an index. |
| 2 | The Russell 1000 Index Total Return is a stock market index that tracks the highest-ranking 1,000 stocks in the Russell 3000 Index, which represent about 90% of the total market capitalization of the index. The index is not actively managed and does not reflect any deduction for fees, expenses or taxes. An investor may not invest directly in an index. |
| 3 | Bloomberg U.S. Aggregate Bond Index: provides a measure of the performance of the U.S. dollar denominated investment grade bond market, which includes investment grade government bonds, investment grade corporate bonds, mortgage pass through securities, commercial mortgage backed securities and asset backed securities that are publicly for sale in the United States. The index is not actively managed and does not reflect any deduction for fees, expenses or taxes. An investor may not invest directly in an index. |
| ^ | Fund Inception date of September 15, 2020. The Fund has limited operating history. |
| * | What You Pay reflects the Advisor’s decision to contractually limit expenses through February 28, 2022. Please see the prospectus dated February 28, 2021 for additional information. |
| + | Excludes adjustments in accordance with accounting principles generally accepted in the United States of America and as such, the net asset value and total return for shareholder transactions reported to the market may differ from the net asset value for financial reporting purposes. |
The table does not reflect the deduction of taxes that a shareholder would pay on Fund distributions or the redemption of Fund shares.
This Fund is not suitable for all investors, and is subject to investment risks, including possible loss of the principal amount invested.
There is no guarantee that the Fund will continue to hold any one particular security or stay invested in any one particular company. The composition of the Fund's top holdings is subject to change. Performance figures are historical and reflect the change in share price, reinvested distributions, changes in net asset value, sales charges and capital gains distributions, if any.
Not FDIC Insured – No Bank Guarantee – May Lose Value
Asset Type Allocation (as a % of Net Assets) †
| Common Stock | 60.49% |
| Corporate Bond | 14.73% |
| Government Bond | 13.44% |
| Collateralized Mortgage Obligations | 3.66% |
| Mortgage-Backed Securities | 2.41% |
| Preferred Stock | 0.33% |
| Commercial Mortgage-Backed Securities | 0.06% |
| Cash, Cash Equivalents, & Other Net Assets | 4.88% |
| Total | 100.00% |
| † | Holdings are subject to change, and may not reflect the current or future position of the portfolio. Table presents approximate values only. |
Top Ten Holdings (as a % of Net Assets) †
| Microsoft Corp. | 2.85% |
| JPMorgan Chase & Co. | 2.64% |
| Alphabet, Inc. | 2.57% |
| UnitedHealth Group, Inc. | 2.54% |
| Apple, Inc. | 2.46% |
| U.S. Treasury Bond 1.75% 08/15/2041 | 2.05% |
| Costco Wholesale Corp. | 1.66% |
| Amazon.com, Inc. | 1.51% |
| Enbridge, Inc. | 1.47% |
| Prudential Financial, Inc. | 1.34% |
| Top Ten Holdings | 21.09% |
| † | Holdings are subject to change, and may not reflect the current or future position of the portfolio. Table presents approximate values only. |
Industry Sector Allocation (as a % of Net Assets)
| Sovereign | 13.45% |
| Banks | 8.00% |
| Retail | 6.67% |
| Diversified Finan Serv | 6.07% |
| Internet | 5.55% |
| Software | 5.53% |
| Mortgage Securities | 5.14% |
| Healthcare-Services | 4.81% |
| Semiconductors | 3.53% |
| Healthcare-Products | 3.41% |
| Pipelines | 2.81% |
| Computers | 2.55% |
| Transportation | 2.28% |
| Pharmaceuticals | 1.91% |
| Auto Manufacturers | 1.76% |
| Oil&Gas | 1.60% |
| Chemicals | 1.51% |
| Media | 1.36% |
| Leisure Time | 1.35% |
| Insurance | 1.34% |
| Electric | 1.26% |
| Aerospace/Defense | 1.26% |
| Machinery-Diversified | 1.23% |
| REITS | 1.21% |
| Commercial Services | 1.07% |
| Other Industries (each less than 1%) | 8.46%* |
| Cash Equivalents & Other Net Assets | 4.88% |
| Total | 100.00% |
| * | See Statement of Investments for detailed breakout of other industries. |
ALPS | Smith Short Duration Bond Fund
| Statement of Investments | October 31, 2021 |
| | | Principal
Amount | | | Value
(Note 2) | |
| COLLATERALIZED MORTGAGE OBLIGATIONS (0.37%) | | |
| Fannie Mae | | | | | | | | |
| Series 1992-180, Class F, | | | | | | | | |
| 1M US L + 1.15%, 10/25/2022(a) | | $ | 3,477 | | | $ | 3,490 | |
| Series 1992-49, Class L, | | | | | | | | |
| 7.000%, 04/25/2022 | | | 5,003 | | | | 5,045 | |
| Series 1992-52, Class FD, | | | | | | | | |
| 1M US L + 0.02%, 09/25/2022(a) | | | 1,179 | | | | 1,175 | |
| Series 1992-62, Class FA, | | | | | | | | |
| 1M US L + 0.90%, 10/25/2022(a) | | | 8,724 | | | | 8,712 | |
| Series 1992-73, Class FC, | | | | | | | | |
| 1M US L + 0.75%, 05/25/2022(a) | | | 373 | | | | 373 | |
| Series 1992-89, Class FB, | | | | | | | | |
| 1M US L + 0.50%, 06/25/2022(a) | | | 310 | | | | 310 | |
| Series 1993-184, Class M, | | | | | | | | |
| –%, 09/25/2023(b) | | | 7,315 | | | | 7,232 | |
| Series 1993-189, Class FB, | | | | | | | | |
| 10Y US TI + -0.65%, 10/25/2023(a) | | | 4,217 | | | | 4,170 | |
| Series 1993-230, Class FA, | | | | | | | | |
| 1M US L + 0.60%, 12/25/2023(a) | | | 24,251 | | | | 24,184 | |
| Series 1993-255, Class E, | | | | | | | | |
| 7.100%, 12/25/2023 | | | 29,552 | | | | 31,060 | |
| Series 1993-27, Class FC, | | | | | | | | |
| 1M US L + 0.90%, 08/25/2023(a) | | | 1,490 | | | | 1,489 | |
| Series 1993-31, Class PN, | | | | | | | | |
| 7.000%, 09/25/2023 | | | 61,749 | | | | 64,270 | |
| Series 1993-97, Class FA, | | | | | | | | |
| 1M US L + 1.25%, 05/25/2023(a) | | | 3,887 | | | | 3,872 | |
| Series 1994-18, Class FA, | | | | | | | | |
| 1M US L + 0.60%, 02/25/2024(a) | | | 9,332 | | | | 9,360 | |
| Series 1994-22, Class F, | | | | | | | | |
| 1M US L + 1.20%, 01/25/2024(a) | | | 60,091 | | | | 60,557 | |
| Series 1994-3, Class FA, | | | | | | | | |
| 1M US L + 0.65%, 03/25/2024(a) | | | 3,660 | | | | 3,671 | |
| Series 1994-3, Class FB, | | | | | | | | |
| 1M US L + 0.65%, 01/25/2024(a) | | | 21,356 | | | | 21,428 | |
| Series 1994-61, Class E, | | | | | | | | |
| 7.500%, 04/25/2024 | | | 27,445 | | | | 28,868 | |
| Series 1994-75, Class K, | | | | | | | | |
| 7.000%, 04/25/2024 | | | 17,924 | | | | 18,974 | |
| Series 1994-77, Class FB, | | | | | | | | |
| 1M US L + 1.50%, 04/25/2024(a) | | | 63,428 | | | | 64,141 | |
| Series 1997-12, Class FA, | | | | | | | | |
| 1M US L + 1.00%, 04/18/2027(a) | | | 24,148 | | | | 24,475 | |
| Series 1997-49, Class F, | | | | | | | | |
| 1M US L + 0.50%, 06/17/2027(a) | | | 33,447 | | | | 33,579 | |
| Series 2003-39, Class PG, | | | | | | | | |
| 5.500%, 05/25/2023 | | | 21,056 | | | | 21,550 | |
| Series 2003-49, Class YC, | | | | | | | | |
| 4.000%, 06/25/2023 | | | 11,303 | | | | 11,485 | |
| Series 2004-53, Class NC, | | | | | | | | |
| 5.500%, 07/25/2024 | | | 9,275 | | | | 9,571 | |
| Series 2004-95, Class AK, | | | | | | | | |
| 5.500%, 01/25/2025 | | | 16,140 | | | | 17,001 | |
| | | Principal
Amount | | | Value
(Note 2) | |
| Series 2005-121, Class DY, | | | | | | | | |
| 5.500%, 01/25/2026 | | $ | 16,501 | | | $ | 17,438 | |
| Series 2006-22, Class CE, | | | | | | | | |
| 4.500%, 08/25/2023 | | | 12,052 | | | | 12,364 | |
| Series 2011-141, Class CA, | | | | | | | | |
| 2.000%, 12/25/2025 | | | 1,087 | | | | 1,087 | |
| Series 2011-40, Class KA, | | | | | | | | |
| 3.500%, 03/25/2026 | | | 76,321 | | | | 79,632 | |
| Series 2011-44, Class EB, | | | | | | | | |
| 3.000%, 05/25/2026 | | | 29,399 | | | | 30,473 | |
| Series 2011-61, Class B, | | | | | | | | |
| 3.000%, 07/25/2026 | | | 49,475 | | | | 51,351 | |
| Series 2011-80, Class KB, | | | | | | | | |
| 3.500%, 08/25/2026 | | | 57,333 | | | | 60,207 | |
| Series 2012-1, Class GB, | | | | | | | | |
| 2.000%, 02/25/2022 | | | 74 | | | | 74 | |
| Series 2012-22, Class ND, | | | | | | | | |
| 2.000%, 12/25/2026 | | | 95,570 | | | | 97,382 | |
| Series 2012-47, Class HA, | | | | | | | | |
| 1.500%, 05/25/2027 | | | 66,093 | | | | 66,777 | |
| | | | | | | | 896,827 | |
| Freddie Mac | | | | | | | | |
| Series 1992-1242, Class C, | | | | | | | | |
| 1M US L + 0.55%, 04/15/2022(a) | | | 622 | | | | 622 | |
| Series 1993-1487, Class O, | | | | | | | | |
| 1M US L + 0.75%, 03/15/2023(a) | | | 6,256 | | | | 6,273 | |
| Series 1993-1534, Class J, | | | | | | | | |
| 1M US L + 0.90%, 06/15/2023(a) | | | 9,039 | | | | 9,077 | |
| Series 1993-1560, Class Z, | | | | | | | | |
| 7.000%, 08/15/2023 | | | 10,077 | | | | 10,445 | |
| Series 1993-1567, Class A, | | | | | | | | |
| 1M US L + 0.40%, 08/15/2023(a) | | | 36,547 | | | | 36,523 | |
| Series 1993-1584, Class L, | | | | | | | | |
| 6.500%, 09/15/2023 | | | 16,849 | | | | 17,617 | |
| Series 1993-1602, Class PJ, | | | | | | | | |
| 6.500%, 10/15/2023 | | | 19,969 | | | | 20,749 | |
| Series 1993-1611, Class Z, | | | | | | | | |
| 6.500%, 11/15/2023 | | | 10,449 | | | | 10,986 | |
| Series 1993-1628, Class LZ, | | | | | | | | |
| 6.500%, 12/15/2023 | | | 6,317 | | | | 6,625 | |
| Series 1993-1630, Class PK, | | | | | | | | |
| 6.000%, 11/15/2023 | | | 11,699 | | | | 12,227 | |
| Series 1993-1632, Class FB, | | | | | | | | |
| 1M US L + 1.20%, 11/15/2023(a) | | | 14,269 | | | | 14,371 | |
| Series 1993-1636, Class F, | | | | | | | | |
| 1M US L + 0.65%, 11/15/2023(a) | | | 11,281 | | | | 11,316 | |
| Series 1993-21, Class F, | | | | | | | | |
| 1M US L + 0.50%, 10/25/2023(a) | | | 13,672 | | | | 13,696 | |
| Series 1993-24, Class FJ, | | | | | | | | |
| 1M US L + 0.50%, 11/25/2023(a) | | | 61,950 | | | | 62,057 | |
| Series 1994-1673, Class FB, | | | | | | | | |
| 10Y US TI + -0.50%, 02/15/2024(a) | | | 5,059 | | | | 5,026 | |
| Series 1994-1699, Class FB, | | | | | | | | |
| 1M US L + 1.00%, 03/15/2024(a) | | | 8,297 | | | | 8,305 | |
See Notes to Financial Statements.
ALPS | Smith Short Duration Bond Fund
| Statement of Investments | October 31, 2021 |
| | | Principal
Amount | | | Value
(Note 2) | |
| Series 1994-1707, Class F, | | | | | | | | |
| 1M US L + 0.70%, 03/15/2024(a) | | $ | 12,366 | | | $ | 12,411 | |
| Series 1994-1730, Class Z, | | | | | | | | |
| 7.000%, 05/15/2024 | | | 28,955 | | | | 30,746 | |
| Series 1994-1744, Class FD, | | | | | | | | |
| 1M US L + 1.98%, 08/15/2024(a) | | | 35,057 | | | | 35,716 | |
| Series 1994-32, Class PN, | | | | | | | | |
| 7.500%, 04/25/2024 | | | 102,857 | | | | 108,183 | |
| Series 1994-43, Class PH, | | | | | | | | |
| 6.500%, 10/17/2024 | | | 38,311 | | | | 40,139 | |
| Series 1996-1810, Class D, | | | | | | | | |
| 6.000%, 02/15/2026 | | | 18,153 | | | | 19,277 | |
| Series 1996-1885, Class FA, | | | | | | | | |
| 1M US L + 0.45%, 09/15/2026(a) | | | 6,716 | | | | 6,734 | |
| Series 1997-1983, Class Z, | | | | | | | | |
| 6.500%, 12/15/2023 | | | 10,626 | | | | 11,168 | |
| Series 2002-2528, Class KM, | | | | | | | | |
| 5.500%, 11/15/2022 | | | 17,452 | | | | 17,752 | |
| Series 2003-2595, Class GC, | | | | | | | | |
| 5.500%, 04/15/2023 | | | 23,441 | | | | 23,980 | |
| Series 2003-2634, Class PT, | | | | | | | | |
| 5.000%, 06/15/2023 | | | 7,204 | | | | 7,340 | |
| Series 2004-2877, Class AL, | | | | | | | | |
| 5.000%, 10/15/2024 | | | 3,441 | | | | 3,566 | |
| Series 2005-3005, Class ED, | | | | | | | | |
| 5.000%, 07/15/2025 | | | 64,466 | | | | 67,880 | |
| Series 2006-3104, Class DH, | | | | | | | | |
| 5.000%, 01/15/2026 | | | 34,672 | | | | 36,736 | |
| Series 2009-3575, Class EB, | | | | | | | | |
| 4.000%, 09/15/2024 | | | 13,241 | | | | 13,644 | |
| Series 2010-3661, Class B, | | | | | | | | |
| 4.000%, 04/15/2025 | | | 31,234 | | | | 32,390 | |
| Series 2010-3710, Class MG, | | | | | | | | |
| 4.000%, 08/15/2025(c) | | | 23,401 | | | | 25,052 | |
| Series 2010-3779, Class KJ, | | | | | | | | |
| 2.750%, 11/15/2025 | | | 40,058 | | | | 41,151 | |
| Series 2011-3822, Class VE, | | | | | | | | |
| 4.000%, 05/15/2022 | | | 81,605 | | | | 82,253 | |
| Series 2011-3829, Class BE, | | | | | | | | |
| 3.500%, 03/15/2026 | | | 20,296 | | | | 21,250 | |
| Series 2011-3845, Class FQ, | | | | | | | | |
| 1M US L + 0.25%, 02/15/2026(a) | | | 3,136 | | | | 3,134 | |
| Series 2011-3872, Class ND, | | | | | | | | |
| 2.000%, 12/15/2021 | | | 0 | | | | 0 | |
| Series 2011-3907, Class FM, | | | | | | | | |
| 1M US L + 0.35%, 05/15/2026(a) | | | 11,732 | | | | 11,738 | |
| Series 2011-3945, Class BJ, | | | | | | | | |
| 2.000%, 03/15/2026 | | | 14,968 | | | | 15,026 | |
| Series 2012-4003, Class BG, | | | | | | | | |
| 2.000%, 10/15/2026 | | | 56,197 | | | | 57,363 | |
| Series 2013-4177, Class NB, | | | | | | | | |
| 1.500%, 03/15/2028 | | | 30,170 | | | | 30,464 | |
| | | | | | | | 1,001,008 | |
| | | Principal
Amount | | | Value
(Note 2) | |
| Ginnie Mae | | | | | | | | |
| Series 2010-101, Class GU, | | | | | | | | |
| 4.000%, 08/20/2025(c) | | $ | 25,380 | | | $ | 26,631 | |
| Series 2013-53, Class KN, | | | | | | | | |
| 1.500%, 08/20/2025 | | | 27,165 | | | | 27,488 | |
| | | | | | | | 54,119 | |
| TOTAL COLLATERALIZED MORTGAGE OBLIGATIONS | | | | | | | | |
| (Cost $1,929,801) | | | | | | | 1,951,954 | |
| | | | Principal
Amount | | | | Value
(Note 2) | |
| COMMERCIAL MORTGAGE-BACKED SECURITIES (0.19%) | |
| | | | | | | | | |
| Fannie Mae-Aces | | | | | | | | |
| Series 2012-M10, Class AFL, | | | | | | | | |
| 1M US L + 0.45%, 09/25/2022(a) | | | 42,140 | | | | 42,146 | |
| Series 2013-M14, Class APT, | | | | | | | | |
| 2.553%, 04/25/2023(a) | | | 19,471 | | | | 19,822 | |
| Series 2013-M3, Class A2, | | | | | | | | |
| 2.509%, 11/25/2022(a) | | | 264,793 | | | | 267,924 | |
| Series 2016-M13, Class FA, | | | | | | | | |
| 1M US L + 0.67%, 11/25/2023(a) | | | 17,786 | | | | 17,834 | |
| Series 2016-M6, Class A1, | | | | | | | | |
| 2.137%, 05/25/2026 | | | 87,983 | | | | 89,617 | |
| | | | | | | | 437,343 | |
| Freddie Mac Multifamily Structured Pass Through Certificates | | | | | | | | |
| Series 2012-K023, Class X1, | | | | | | | | |
| 1.203%, 08/25/2022(a) | | | 3,601,595 | | | | 26,905 | |
| Series 2013-K026, Class X1, | | | | | | | | |
| 0.938%, 11/25/2022(a) | | | 5,479,961 | | | | 43,054 | |
| Series 2015-KF07, Class A, | | | | | | | | |
| 1M US L + 0.29%, 02/25/2025(a) | | | 9,596 | | | | 9,561 | |
| Series 2016-KF14, Class A, | | | | | | | | |
| 1M US L + 0.65%, 01/25/2023(a) | | | 110,939 | | | | 111,051 | |
| Series 2016-KJ08, Class A2, | | | | | | | | |
| 2.356%, 08/25/2022 | | | 239,174 | | | | 240,506 | |
| Series 2017-K725, Class A1, | | | | | | | | |
| 2.666%, 05/25/2023 | | | 15,979 | | | | 16,133 | |
| Series 2017-K728, Class A2, | | | | | | | | |
| 3.064%, 08/25/2024(a) | | | 117,000 | | | | 122,555 | |
| | | | | | | | 569,765 | |
| TOTAL COMMERCIAL MORTGAGE-BACKED SECURITIES | | | | | |
| (Cost $991,210) | | | | | | | 1,007,108 | |
| | | | | | | | | |
| | | | Principal
Amount | | | | Value
(Note 2) | |
| MORTGAGE-BACKED SECURITIES (2.26%) | | |
| | |
| Fannie Mae Pool | | | | | | | | |
| Series 2009-958485, | | | | | | | | |
| 5.500%, 03/01/2024 | | | 2,425,596 | | | | 2,602,111 | |
See Notes to Financial Statements.
ALPS | Smith Short Duration Bond Fund
| Statement of Investments | October 31, 2021 |
| | | Principal
Amount | | | Value
(Note 2) | |
| Series 2011-MA0717, | | | | | | | | |
| 3.500%, 04/01/2026 | | $ | 24,969 | | | $ | 26,220 | |
| Series 2012-471513, | | | | | | | | |
| 2.900%, 06/01/2022 | | | 625,418 | | | | 628,108 | |
| Series 2012-471690, | | | | | | | | |
| 2.790%, 07/01/2022 | | | 154,236 | | | | 155,187 | |
| Series 2012-AM1076, | | | | | | | | |
| 2.920%, 10/01/2024 | | | 234,439 | | | | 234,437 | |
| Series 2013-, | | | | | | | | |
| 2.490%, 03/01/2023 | | | 218,434 | | | | 222,227 | |
| Series 2013-AM4125, | | | | | | | | |
| 3.740%, 08/01/2023 | | | 230,000 | | | | 238,913 | |
| Series 2015-AM9288, | | | | | | | | |
| 2.930%, 07/01/2025 | | | 1,345,597 | | | | 1,370,623 | |
| Series 2016-, | | | | | | | | |
| 2.910%, 07/01/2026 | | | 36,329 | | | | 38,069 | |
| 3.210%, 01/01/2026 | | | 65,000 | | | | 67,296 | |
| Series 2016-AL8938, | | | | | | | | |
| 2.480%, 04/01/2022(a) | | | 11,033 | | | | 11,042 | |
| Series 2016-AL8941, | | | | | | | | |
| 2.819%, 01/01/2024(a) | | | 60,052 | | | | 61,643 | |
| Series 2016-AN1413, | | | | | | | | |
| 2.490%, 05/01/2026 | | | 143,741 | | | | 150,891 | |
| Series 2017-AN5196, | | | | | | | | |
| 2.910%, 04/01/2024 | | | 150,000 | | | | 151,233 | |
| Series 2017-AN6645, | | | | | | | | |
| 2.600%, 09/01/2024 | | | 250,000 | | | | 253,776 | |
| Series 2018-AN8096, | | | | | | | | |
| 3.020%, 06/01/2024 | | | 305,000 | | | | 305,065 | |
| Series 2018-AN8203, | | | | | | | | |
| 2.950%, 01/01/2025 | | | 2,916,503 | | | | 3,002,344 | |
| Series 2018-BL0760, | | | | | | | | |
| 3.790%, 12/01/2025 | | | 590,000 | | | | 624,015 | |
| Series 2019-BL2539, | | | | | | | | |
| 3.050%, 05/01/2024 | | | 140,124 | | | | 143,415 | |
| | | | | | | | 10,286,615 | |
| Freddie Mac Gold Pool | | | | | | | | |
| Series 2012-T40090, | | | | | | | | |
| 3.000%, 05/01/2027 | | | 105,085 | | | | 110,192 | |
| | | | | | | | | |
| Freddie Mac Pool | | | | | | | | |
| Series 2017-WN2000, | | | | | | | | |
| 2.700%, 08/01/2023 | | | 1,395,915 | | | | 1,400,415 | |
| | | | | | | | | |
| TOTAL MORTGAGE-BACKED SECURITIES |
| (Cost $11,910,236) | | | | | | | 11,797,222 | |
| | | | | | | | | |
| CORPORATE BONDS (79.69%) | | | | | | | | |
| | | | | | | | | |
| Aerospace & Defense (4.25%) | | | | | | | | |
| Boeing Co. | | | | | | | | |
| 2.20%, 02/04/2026 | | | 5,000,000 | | | | 5,010,040 | |
| Huntington Ingalls Industries, Inc. | | | | | | | | |
| 0.67%, 08/16/2023(d) | | | 7,500,000 | | | | 7,479,137 | |
| | | Principal
Amount | | | Value
(Note 2) | |
| Teledyne Technologies, Inc. | | | | | | | | |
| 0.65%, 04/01/2023 | | $ | 3,000,000 | $ | | | 2,993,579 | |
| 0.95%, 04/01/2024 | | | 3,000,000 | | | | 2,998,524 | |
| TransDigm, Inc. | | | | | | | | |
| 8.00%, 12/15/2025(d) | | | 3,500,000 | | | | 3,727,500 | |
| Total Aerospace & Defense | | | | | | | 22,208,780 | |
| Airlines (0.55%) | | | | | | | | |
| Delta Air Lines, Inc. | | | | | | | | |
| 7.00%, 05/01/2025(d) | | | 2,000,000 | | | | 2,334,466 | |
| Southwest Airlines Co. | | | | | | | | |
| 4.75%, 05/04/2023 | | | 500,000 | | | | 529,288 | |
| Total Airlines | | | | | | | 2,863,754 | |
| Apparel & Textile Products (0.84%) | | | | | | | | |
| Hanesbrands, Inc. | | | | | | | | |
| 5.38%, 05/15/2025(d) | | | 3,300,000 | | | | 3,436,125 | |
| Ralph Lauren Corp. | | | | | | | | |
| 1.70%, 06/15/2022 | | | 925,000 | | | | 932,794 | |
| Total Apparel & Textile Products | | | | | | | 4,368,919 | |
| Automobiles Manufacturing (6.33%) | | | | | |
| American Honda Finance Corp. | | | | | | | | |
| 0.65%, 09/08/2023 | | | 1,500,000 | | | | 1,500,831 | |
| Ford Motor Co. | | | | | | | | |
| 8.50%, 04/21/2023 | | | 2,695,000 | | | | 2,958,436 | |
| Ford Motor Credit Co. LLC | | | | | | | | |
| 3.38%, 11/13/2025 | | | 465,000 | | | | 478,369 | |
| 3M US L + 1.27%, 03/28/2022(a) | | | 1,090,000 | | | | 1,090,843 | |
| General Motors Co. | | | | | | | | |
| 5.40%, 10/02/2023 | | | 2,250,000 | | | | 2,435,651 | |
| General Motors Financial Co., Inc. | | | | | | | | |
| 1.05%, 03/08/2024 | | | 3,750,000 | | | | 3,742,973 | |
| 5.10%, 01/17/2024 | | | 1,200,000 | | | | 1,296,732 | |
| Hyundai Capital America | | | | | | | | |
| 0.88%, 06/14/2024(d) | | | 4,000,000 | | | | 3,956,704 | |
| Kia Corp. | | | | | | | | |
| 1.00%, 04/16/2024(d) | | | 2,850,000 | | | | 2,839,957 | |
| Nissan Motor Acceptance Co. LLC | | | | |
| 1.05%, 03/08/2024(d) | | | 2,000,000 | | | | 1,987,334 | |
| 1.13%, 09/16/2024(d) | | | 1,000,000 | | | | 992,420 | |
| 1.85%, 09/16/2026(d) | | | 1,000,000 | | | | 976,495 | |
| Nissan Motor Co., Ltd. | | | | | | | | |
| 3.04%, 09/15/2023(d) | | | 4,685,000 | | | | 4,847,112 | |
| Volkswagen Group of America Finance LLC | | | | |
| 0.75%, 11/23/2022(d) | | | 1,500,000 | | | | 1,501,382 | |
| 0.88%, 11/22/2023(d) | | | 2,500,000 | | | | 2,499,354 | |
| Total Automobiles Manufacturing | | | | | | | 33,104,593 | |
| | | | | | | | | |
| Banks (5.01%) | | | | | | | | |
| CIT Group, Inc. | | | | | | | | |
| 1D US SOFR + 3.83%, | | | | | | | | |
| 06/19/2024(a) | | | 3,855,000 | | | | 4,008,872 | |
| Citizens Financial Group, Inc. | | | | | | | | |
| 4.15%, 09/28/2022(d) | | | 400,000 | | | | 412,045 | |
| Cooperatieve Rabobank UA | | | | | | | | |
| 3.95%, 11/09/2022 | | | 2,686,000 | | | | 2,776,643 | |
See Notes to Financial Statements.
ALPS | Smith Short Duration Bond Fund
| Statement of Investments | October 31, 2021 |
| | | Principal
Amount | | | Value
(Note 2) | |
| Danske Bank A/S | | | | | | |
| 5.00%, 01/12/2022(d) | | $ | 950,000 | | | $ | 958,076 | |
| 5.38%, 01/12/2024(d) | | | 250,000 | | | | 272,383 | |
| 1Y US TI + 1.03%, 12/08/2023(a)(d) | | | 1,000,000 | | | | 1,003,092 | |
| Discover Bank | | | | | | | | |
| 3.35%, 02/06/2023 | | | 2,110,000 | | | | 2,176,203 | |
| First Horizon Corp. | | | | | | | | |
| 3.55%, 05/26/2023 | | | 500,000 | | | | 519,205 | |
| FNB Corp. | | | | | | | | |
| 2.20%, 02/24/2023 | | | 200,000 | | | | 202,355 | |
| Lloyds Banking Group PLC | | | | | | | | |
| 1Y US TI + 0.55%, 05/11/2024(a) | | | 2,000,000 | | | | 1,998,084 | |
| National Bank of Canada | | | | | | | | |
| 1Y US TI + 0.40%, 11/15/2024(a) | | | 3,000,000 | | | | 2,981,054 | |
| NatWest Markets PLC | | | | | | | | |
| 0.80%, 08/12/2024(d) | | | 1,000,000 | | | | 990,572 | |
| Synchrony Bank | | | | | | | | |
| 3.00%, 06/15/2022 | | | 2,770,000 | | | | 2,805,822 | |
| Synovus Bank/Columbus GA | | | | | | | | |
| 1D US SOFR + 0.95%, | | | | | | | | |
| 02/10/2023(a) | | | 2,750,000 | | | | 2,759,685 | |
| Truist Financial Corp. | | | | | | | | |
| 1D US SOFR + 0.40%, | | | | | | | | |
| 06/09/2025(a) | | | 2,000,000 | | | | 2,002,874 | |
| Wells Fargo & Co. | | | | | | | | |
| 4.13%, 08/15/2023 | | | 300,000 | | | | 317,487 | |
| Total Banks | | | | | | | 26,184,452 | |
| Biotechnology (0.19%) | | | | | | | | |
| Roche Holdings, Inc. | | | | | | | | |
| 1D US SOFR + 0.24%, | | | | | | | | |
| 03/05/2024(a)(d) | | | 1,000,000 | | | | 1,003,050 | |
| | | | | | | | | |
| Cable & Satellite (0.69%) | | | | | | | | |
| Charter Communications Operating LLC / Charter Communications Operating Capital | | | | | | | | |
| 3M US L + 1.65%, 02/01/2024(a) | | | 3,530,000 | | | | 3,618,941 | |
| | | | | | | | | |
| Casinos & Gaming (0.23%) | | | | | | | | |
| MGM Resorts International | | | | | | | | |
| 7.75%, 03/15/2022 | | | 1,186,000 | | | | 1,214,168 | |
| | | | | | | | | |
| Chemicals (1.04%) | | | | | | | | |
| Avient Corp. | | | | | | | | |
| 5.75%, 05/15/2025(d) | | | 3,300,000 | | | | 3,452,625 | |
| International Flavors & Fragrances, Inc. | | | | | | | | |
| 0.70%, 09/15/2022(d) | | | 1,500,000 | | | | 1,501,590 | |
| Westlake Chemical Corp. | | | | | | | | |
| 0.88%, 08/15/2024 | | | 500,000 | | | | 500,032 | |
| Total Chemicals | | | | | | | 5,454,247 | |
| | | Principal
Amount | | | Value
(Note 2) | |
| Commercial Finance (3.29%) | | | | | | | | |
| AerCap Ireland Capital DAC / AerCap Global Aviation Trust | | | | | | | | |
| 1.65%, 10/29/2024 | | $ | 3,000,000 | | | $ | 3,007,578 | |
| 6.50%, 07/15/2025 | | | 3,500,000 | | | | 4,056,462 | |
| 1D US SOFR + 0.68%, | | | | | | | | |
| 09/29/2023(a) | | | 2,000,000 | | | | 2,004,037 | |
| Series 3NC1 | | | | | | | | |
| 1.75%, 10/29/2024 | | | 5,000,000 | | | | 5,005,512 | |
| Avolon Holdings Funding, Ltd. | | | | | | | | |
| 2.53%, 11/18/2027(d) | | | 2,343,000 | | | | 2,301,696 | |
| 3.63%, 05/01/2022(d) | | | 730,000 | | | | 738,146 | |
| Park Aerospace Holdings, Ltd. | | | | | | | | |
| 4.50%, 03/15/2023(d) | | | 100,000 | | | | 104,186 | |
| Total Commercial Finance | | | | | | | 17,217,617 | |
| | | | | | | | | |
| Construction Materials Manufacturing (1.45%) | | | | | | | | |
| Carlisle Cos., Inc. | | | | | | | | |
| 0.55%, 09/01/2023 | | | 1,000,000 | | | | 996,727 | |
| Martin Marietta Materials, Inc. | | | | | | | | |
| 0.65%, 07/15/2023 | | | 6,540,000 | | | | 6,541,510 | |
| Total Construction Materials Manufacturing | | | | | | | 7,538,237 | |
| | | | | | | | | |
| Consumer Finance (3.67%) | | | | | | | | |
| Ally Financial, Inc. | | | | | | | | |
| 1.45%, 10/02/2023 | | | 4,730,000 | | | | 4,777,926 | |
| Capital One Bank USA NA | | | | | | | | |
| 1D US SOFR + 0.616%, | | | | | | | | |
| 01/27/2023(a) | | | 300,000 | | | | 301,069 | |
| Capital One Financial Corp. | | | | | | | | |
| 2.60%, 05/11/2023 | | | 400,000 | | | | 411,281 | |
| Fidelity National Information Services, Inc. | | | | | | | | |
| 0.38%, 03/01/2023 | | | 2,000,000 | | | | 1,994,357 | |
| 0.60%, 03/01/2024 | | | 2,000,000 | | | | 1,983,181 | |
| OneMain Finance Corp. | | | | | | | | |
| 6.13%, 05/15/2022 | | | 2,000,000 | | | | 2,047,500 | |
| 8.88%, 06/01/2025 | | | 3,802,000 | | | | 4,115,665 | |
| PayPal Holdings, Inc. | | | | | | | | |
| 1.35%, 06/01/2023 | | | 1,000,000 | | | | 1,013,075 | |
| Square, Inc. | | | | | | | | |
| 2.75%, 06/01/2026(d) | | | 2,500,000 | | | | 2,530,611 | |
| Total Consumer Finance | | | | | | | 19,174,665 | |
| Consumer Products (0.09%) | | | | | | | | |
| Unilever Capital Corp. | | | | | | | | |
| 0.63%, 08/12/2024 | | | 500,000 | | | | 495,610 | |
| | | | | | | | | |
| Department Stores (0.97%) | | | | | | | | |
| Nordstrom, Inc. Series WI | | | | | | | | |
| 2.30%, 04/08/2024 | | | 5,000,000 | | | | 5,030,750 | |
See Notes to Financial Statements.
ALPS | Smith Short Duration Bond Fund
| Statement of Investments | October 31, 2021 |
| | | Principal
Amount | | | Value
(Note 2) | |
| Design, Manufacturing & Distribution (0.57%) | | | | | | | | |
| SYNNEX Corp. | | | | | | | | |
| 1.25%, 08/09/2024(d) | | $ | 3,000,000 | | | $ | 2,992,118 | |
| | | | | | | | | |
| Diversified Banks (7.34%) | | | | | | | | |
| Banco Santander SA | | | | | | | | |
| 1Y US TI + 0.45%, 06/30/2024(a) | | | 1,000,000 | | | | 997,373 | |
| Bank of America Corp. | | | | | | | | |
| 1D US SOFR + 0.69%, | | | | | | | | |
| 04/22/2025(a) | | | 4,000,000 | | | | 4,031,921 | |
| 3M BSBY + 0.43%, 05/28/2024(a) | | | 3,000,000 | | | | 3,008,280 | |
| 3M US L + 1.021%, 04/24/2023(a) | | | 1,550,000 | | | | 1,566,854 | |
| Barclays PLC | | | | | | | | |
| 1Y US TI + 0.80%, 12/10/2024(a) | | | 3,000,000 | | | | 3,001,564 | |
| Citigroup, Inc. | | | | | | | | |
| 4.30%, 11/20/2026 | | | 3,268,000 | | | | 3,628,170 | |
| 1D US SOFR + 0.669%, | | | | | | | | |
| 05/01/2025(a) | | | 3,000,000 | | | | 2,987,575 | |
| HSBC Holdings PLC | | | | | | | | |
| 1D US SOFR + 0.534%, | | | | | | | | |
| 08/17/2024(a) | | | 2,000,000 | | | | 1,992,300 | |
| 1D US SOFR + 0.7075%, | | | | | | | | |
| 05/24/2025(a) | | | 4,000,000 | | | | 3,968,040 | |
| JPMorgan Chase & Co. | | | | | | | | |
| 1D US SOFR + 0.535%, | | | | | | | | |
| 06/01/2025(a) | | | 2,000,000 | | | | 2,009,312 | |
| 1D US SOFR + 0.60%, | | | | | | | | |
| 09/16/2024(a) | | | 2,500,000 | | | | 2,494,638 | |
| 1D US SOFR + 1.46%, | | | | | | | | |
| 06/01/2024(a) | | | 1,500,000 | | | | 1,519,243 | |
| Series FRN | | | | | | | | |
| 1D US SOFR + 0.58%, | | | | | | | | |
| 06/23/2025(a) | | | 2,000,000 | | | | 2,009,101 | |
| Mizuho Financial Group, Inc. | | | | | | | | |
| 0.87% - 1D US SOFR, | | | | | | | | |
| 09/08/2024(a) | | | 1,000,000 | | | | 1,000,044 | |
| 1.25% - 1D US SOFR, | | | | | | | | |
| 07/10/2024(a) | | | 1,000,000 | | | | 1,006,984 | |
| NatWest Group PLC | | | | | | | | |
| 6.10%, 06/10/2023 | | | 200,000 | | | | 215,745 | |
| 1Y US TI + 2.15%, 05/22/2024(a) | | | 1,000,000 | | | | 1,023,171 | |
| Sumitomo Mitsui Financial Group, Inc. | | | | | | | | |
| 1.40%, 09/17/2026 | | | 2,000,000 | | | | 1,963,521 | |
| Total Diversified Banks | | | | | | | 38,423,836 | |
| Electrical Equipment Manufacturing (0.21%) | | | | | | | | |
| Otis Worldwide Corp. | | | | | | | | |
| 3M US L + 0.45%, 04/05/2023(a) | | | 100,000 | | | | 100,008 | |
| Siemens Financieringsmaatschappij NV | | | | | | | | |
| 0.40%, 03/11/2023(d) | | | 1,000,000 | | | | 1,000,225 | |
| Total Electrical Equipment Manufacturing | | | | | | | 1,100,233 | |
| | | | | | | | | |
| | | Principal
Amount | | | Value
(Note 2) | |
| Entertainment Content (0.05%) | | | | | | | | |
| Fox Corp. | | | | | | | | |
| 3.67%, 01/25/2022 | | $ | 250,000 | | | $ | 251,933 | |
| | | | | | | | | |
| Exploration & Production (0.86%) | | | | | | | | |
| Diamondback Energy, Inc. | | | | | | | | |
| 0.90%, 03/24/2023 | | | 3,516,000 | | | | 3,515,999 | |
| Pioneer Natural Resources Co. | | | | | | | | |
| 0.55%, 05/15/2023 | | | 1,000,000 | | | | 997,229 | |
| Total Exploration & Production | | | | | | | 4,513,228 | |
| Financial Services (9.15%) | | | | | | | | |
| Ameriprise Financial, Inc. | | | | | | | | |
| 3.00%, 03/22/2022 | | | 250,000 | | | | 252,578 | |
| Bank of New York Mellon Corp. Series J | | | | | | | | |
| 1D US SOFR + 0.20%, | | | | | | | | |
| 10/25/2024(a) | | | 5,000,000 | | | | 4,997,304 | |
| Credit Suisse Group AG | | | | | | | | |
| 3.57%, 01/09/2023(d) | | | 4,038,000 | | | | 4,060,327 | |
| 1D US SOFR + 2.044%, | | | | | | | | |
| 06/05/2026(a)(d) | | | 4,000,000 | | | | 4,049,831 | |
| Goldman Sachs Group, Inc. | | | | | | | | |
| 0.52%, 03/08/2023 | | | 2,000,000 | | | | 1,997,031 | |
| 1D US SOFR + 0.49%, | | | | | | | | |
| 10/21/2024(a) | | | 3,000,000 | | | | 3,000,962 | |
| 1D US SOFR + 0.50%, | | | | | | | | |
| 09/10/2024(a) | | | 2,500,000 | | | | 2,504,418 | |
| 3M US L + 1.053%, 06/05/2023(a) | | | 800,000 | | | | 810,617 | |
| Series VAR | | | | | | | | |
| 1D US SOFR + 0.538%, | | | | | | | | |
| 11/17/2023(a) | | | 1,865,000 | | | | 1,863,367 | |
| Series FXD | | | | | | | | |
| 0.48%, 01/27/2023 | | | 3,000,000 | | | | 2,992,813 | |
| Intercontinental Exchange, Inc. | | | | | | | | |
| 0.70%, 06/15/2023 | | | 1,350,000 | | | | 1,351,531 | |
| Morgan Stanley | | | | | | | | |
| 4.88%, 11/01/2022 | | | 500,000 | | | | 521,278 | |
| 1D US SOFR + 0.525%, | | | | | | | | |
| 05/30/2025(a) | | | 3,000,000 | | | | 2,968,600 | |
| 1D US SOFR + 0.616%, | | | | | | | | |
| 04/05/2024(a) | | | 2,000,000 | | | | 1,998,380 | |
| Series GMTN | | | | | | | | |
| 1D US SOFR + 0.509%, | | | | | | | | |
| 01/22/2025(a) | | | 5,000,000 | | | | 4,972,187 | |
| Nasdaq, Inc. | | | | | | | | |
| 0.45%, 12/21/2022 | | | 2,000,000 | | | | 1,998,045 | |
| National Securities Clearing Corp. | | | | | | | | |
| 0.40%, 12/07/2023(d) | | | 1,980,000 | | | | 1,970,581 | |
| TD Ameritrade Holding Corp. | | | | | | | | |
| 3M US L + 0.43%, 11/01/2021(a) | | | 200,000 | | | | 200,000 | |
| UBS AG/London | | | | | | | | |
| 1.75%, 04/21/2022(d) | | | 700,000 | | | | 703,661 | |
| 1D US SOFR + 0.32%, | | | | | | | | |
| 06/01/2023(a)(d) | | | 1,000,000 | | | | 1,003,185 | |
See Notes to Financial Statements.
ALPS | Smith Short Duration Bond Fund
| Statement of Investments | October 31, 2021 |
| | | Principal
Amount | | | Value
(Note 2) | |
| UBS Group AG | | | | | | | | |
| 1Y US TI + 0.83%, 07/30/2024(a)(d) | | $ | 1,000,000 | | | $ | 1,001,539 | |
| USAA Capital Corp. | | | | | | | | |
| 0.50%, 05/01/2024(d) | | | 2,000,000 | | | | 1,985,393 | |
| 1.50%, 05/01/2023(d) | | | 500,000 | | | | 507,617 | |
| Total Financial Services | | | | | | | 47,711,245 | |
| | | | | | | | | |
| Food & Beverage (1.48%) | | | | | | | | |
| Conagra Brands, Inc. | | | | | | | | |
| 0.50%, 08/11/2023 | | | 2,000,000 | | | | 1,992,068 | |
| Hormel Foods Corp. | | | | | | | | |
| 0.65%, 06/03/2024 | | | 2,000,000 | | | | 1,994,043 | |
| JDE Peet's NV | | | | | | | | |
| 0.80%, 09/24/2024(d) | | | 1,000,000 | | | | 988,986 | |
| Keurig Dr Pepper, Inc. | | | | | | | | |
| 0.75%, 03/15/2024 | | | 1,000,000 | | | | 995,644 | |
| Lamb Weston Holdings, Inc. | | | | | | | | |
| 4.63%, 11/01/2024(d) | | | 1,723,000 | | | | 1,767,195 | |
| Total Food & Beverage | | | | | | | 7,737,936 | |
| Forest & Paper Products Manufacturing (0.33%) |
| Georgia-Pacific LLC | | | | | | | | |
| 0.63%, 05/15/2024(d) | | | 1,750,000 | | | | 1,738,748 | |
| | | | | | | | | |
| Hardware (0.19%) | | | | | | | | |
| Dell International LLC / EMC Corp. | | | | | | | | |
| 7.13%, 06/15/2024 | | | 1,000,000 | | | | 1,017,900 | |
| | | | | | | | | |
| Health Care Facilities & Services (3.15%) | | | | | | | | |
| AmerisourceBergen Corp. | | | | | | | | |
| 0.74%, 03/15/2023 | | | 2,000,000 | | | | 2,001,301 | |
| Cigna Corp. | | | | | | | | |
| 0.61%, 03/15/2024 | | | 2,000,000 | | | | 1,987,773 | |
| HCA, Inc. | | | | | | | | |
| 4.75%, 05/01/2023 | | | 2,387,000 | | | | 2,523,762 | |
| 5.00%, 03/15/2024 | | | 500,000 | | | | 544,291 | |
| Series 1 | | | | | | | | |
| 5.88%, 05/01/2023 | | | 1,000,000 | | | | 1,070,000 | |
| Jaguar Holding Co. II / PPD Development LP | | | | | | | | |
| 4.63%, 06/15/2025(d) | | | 5,170,000 | | | | 5,376,800 | |
| PRA Health Sciences, Inc. | | | | | | | | |
| 2.88%, 07/15/2026(d) | | | 2,950,000 | | | | 2,972,214 | |
| Total Health Care Facilities & Services | | | | | | | 16,476,141 | |
| Homebuilders (0.35%) | | | | | | | | |
| Forestar Group, Inc. | | | | | | | | |
| 3.85%, 05/15/2026(d) | | | 1,835,000 | | | | 1,837,285 | |
| | | | | | | | | |
| Industrial Other (0.66%) | | | | | | | | |
| Element Fleet Management Corp. | | | | | | | | |
| 1.60%, 04/06/2024(d) | | | 1,470,000 | | | | 1,480,460 | |
| Quanta Services, Inc. | | | | | | | | |
| 0.95%, 10/01/2024 | | | 2,000,000 | | | | 1,984,489 | |
| Total Industrial Other | | | | | | | 3,464,949 | |
| | | | | | | | | |
| | | Principal
Amount | | | Value
(Note 2) | |
| Leisure Products Manufacturing (0.77%) | | | | | | | | |
| Brunswick Corp. | | | | | | | | |
| 0.85%, 08/18/2024 | | $ | 2,000,000 | | | $ | 1,981,882 | |
| Mattel, Inc. | | | | | | | | |
| 3.15%, 03/15/2023 | | | 2,000,000 | | | | 2,050,700 | |
| Total Leisure Products Manufacturing | | | | | | | 4,032,582 | |
| Life Insurance (0.19%) | | | | | | | | |
| Security Benefit Global Funding | | | | | | | | |
| 1.25%, 05/17/2024(d) | | | 1,000,000 | | | | 1,000,792 | |
| | | | | | | | | |
| Managed Care (0.77%) | | | | | | | | |
| Anthem, Inc. | | | | | | | | |
| 0.45%, 03/15/2023 | | | 1,000,000 | | | | 998,448 | |
| Humana, Inc. | | | | | | | | |
| 0.65%, 08/03/2023 | | | 2,000,000 | | | | 1,998,762 | |
| UnitedHealth Group, Inc. | | | | | | | | |
| 0.55%, 05/15/2024 | | | 1,000,000 | | | | 993,124 | |
| Total Managed Care | | | | | | | 3,990,334 | |
| Medical Equipment & Devices Manufacturing (2.10%) | | | | | | | | |
| Illumina, Inc. | | | | | | | | |
| 0.55%, 03/23/2023 | | | 2,000,000 | | | | 1,994,778 | |
| PerkinElmer, Inc. | | | | | | | | |
| 0.55%, 09/15/2023 | | | 2,000,000 | | | | 1,994,612 | |
| Thermo Fisher Scientific, Inc. | | | | | | | | |
| 0.80%, 10/18/2023 | | | 5,000,000 | | | | 5,002,860 | |
| 1D US SOFR + 0.53%, | | | | | | | | |
| 10/18/2024(a) | | | 2,000,000 | | | | 2,003,371 | |
| Total Medical Equipment & Devices Manufacturing | | | | | | | 10,995,621 | |
| Metals & Mining (1.10%) | | | | | | | | |
| Steel Dynamics, Inc. | | | | | | | | |
| 5.00%, 12/15/2026 | | | 5,592,000 | | | | 5,762,503 | |
| | | | | | | | | |
| Pharmaceuticals (2.41%) | | | | | | | | |
| AbbVie, Inc. | | | | | | | | |
| 2.15%, 11/19/2021 | | | 500,000 | | | | 500,435 | |
| 2.30%, 11/21/2022 | | | 1,286,000 | | | | 1,308,647 | |
| Bausch Health Cos., Inc. | | | | | | | | |
| 6.13%, 04/15/2025(d) | | | 5,056,000 | | | | 5,155,957 | |
| Viatris, Inc. | | | | | | | | |
| 1.13%, 06/22/2022(d) | | | 5,635,000 | | | | 5,655,455 | |
| Total Pharmaceuticals | | | | | | | 12,620,494 | |
| | | | | | | | | |
| Pipeline (4.15%) | | | | | | | | |
| Buckeye Partners LP | | | | | | | | |
| 4.15%, 07/01/2023 | | | 2,897,000 | | | | 3,001,002 | |
| 4.35%, 10/15/2024 | | | 750,000 | | | | 785,453 | |
| Energy Transfer LP | | | | | | | | |
| 3.45%, 01/15/2023 | | | 1,500,000 | | | | 1,535,347 | |
| 4.50%, 04/15/2024 | | | 900,000 | | | | 966,277 | |
| 5.20%, 02/01/2022 | | | 1,524,000 | | | | 1,524,000 | |
| Energy Transfer LP / Regency Energy Finance Corp. | | | | | | | | |
| 5.88%, 03/01/2022 | | | 1,390,000 | | | | 1,395,973 | |
See Notes to Financial Statements.
ALPS | Smith Short Duration Bond Fund
| Statement of Investments | October 31, 2021 |
| | | Principal
Amount | | | Value
(Note 2) | |
| Gray Oak Pipeline LLC | | | | | | | | |
| 2.00%, 09/15/2023(d) | | $ | 1,749,000 | | | $ | 1,777,784 | |
| Midwest Connector Capital Co. LLC | | | | | | | | |
| 3.63%, 04/01/2022(d) | | | 6,228,000 | | | | 6,291,254 | |
| 3.90%, 04/01/2024(d) | | | 775,000 | | | | 807,640 | |
| TransCanada PipeLines, Ltd. | | | | | | | | |
| 1.00%, 10/12/2024 | | | 1,500,000 | | | | 1,494,420 | |
| Western Midstream Operating LP | | | | | | | | |
| 4.35%, 02/01/2025 | | | 250,000 | | | | 262,188 | |
| 3M US L + 2.10%, 01/13/2023(a) | | | 1,849,000 | | | | 1,835,458 | |
| Total Pipeline | | | | | | | 21,676,796 | |
| Power Generation (0.75%) | | | | | | | | |
| Alexander Funding Trust | | | | | | | | |
| 1.84%, 11/15/2023(d) | | | 3,369,000 | | | | 3,423,781 | |
| NRG Energy, Inc. | | | | | | | | |
| 2.00%, 12/02/2025(d) | | | 500,000 | | | | 505,922 | |
| Total Power Generation | | | | | | | 3,929,703 | |
| Publishing & Broadcasting (0.30%) | | | | | | | | |
| Nexstar Media, Inc. | | | | | | | | |
| 5.63%, 07/15/2027(d) | | | 1,500,000 | | | | 1,584,375 | |
| | | | | | | | | |
| Real Estate (0.63%) | | | | | | | | |
| GLP Capital LP / GLP Financing II, Inc. | | | | | | | | |
| 5.38%, 11/01/2023 | | | 1,220,000 | | | | 1,310,738 | |
| Public Storage | | | | | | | | |
| 1D US SOFR + 0.47%, | | | | | | | | |
| 04/23/2024(a) | | | 2,000,000 | | | | 2,001,804 | |
| Total Real Estate | | | | | | | 3,312,542 | |
| Refining & Marketing (0.95%) | | | | | | | | |
| HollyFrontier Corp. | | | | | | | | |
| 2.63%, 10/01/2023 | | | 3,009,000 | | | | 3,096,606 | |
| Phillips 66 | | | | | | | | |
| 3M US L + 0.62%, 02/15/2024(a) | | | 1,865,000 | | | | 1,865,427 | |
| Total Refining & Marketing | | | | | | | 4,962,033 | |
| Restaurants (0.25%) | | | | | | | | |
| Yum! Brands, Inc. | | | | | | | | |
| 7.75%, 04/01/2025(d) | | | 1,250,000 | | | | 1,330,875 | |
| | | | | | | | | |
| Retail - Consumer Discretionary (0.25%) | | | | | | | | |
| QVC, Inc. | | | | | | | | |
| 4.38%, 03/15/2023 | | | 1,250,000 | | | | 1,298,438 | |
| | | | | | | | | |
| Semiconductors (1.85%) | | | | | | | | |
| Analog Devices, Inc. | | | | | | | | |
| 1D US SOFR + 0.25%, | | | | | | | | |
| 10/01/2024(a) | | | 2,000,000 | | | | 2,002,916 | |
| Marvell Technology, Inc. | | | | | | | | |
| 4.20%, 06/22/2023(d) | | | 2,000,000 | | | | 2,100,951 | |
| Microchip Technology, Inc. | | | | | | | | |
| 0.97%, 02/15/2024(d) | | | 1,000,000 | | | | 994,243 | |
| Skyworks Solutions, Inc. | | | | | | | | |
| 0.90%, 06/01/2023 | | | 2,000,000 | | | | 2,000,583 | |
| | | Principal
Amount | | | Value
(Note 2) | |
| TSMC Arizona Corp. | | | | | | | | |
| 1.75%, 10/25/2026 | | $ | 2,550,000 | | | $ | 2,565,287 | |
| Total Semiconductors | | | | | | | 9,663,980 | |
| Software & Services (1.46%) | | | | | | | | |
| Intuit, Inc. | | | | | | | | |
| 0.65%, 07/15/2023 | | | 1,000,000 | | | | 1,001,354 | |
| Nielsen Co. Luxembourg SARL | | | | | | | | |
| 5.00%, 02/01/2025(d) | | | 2,185,000 | | | | 2,227,334 | |
| Roper Technologies, Inc. | | | | | | | | |
| 0.45%, 08/15/2022 | | | 1,365,000 | | | | 1,365,286 | |
| salesforce.com, Inc. | | | | | | | | |
| 0.63%, 07/15/2024 | | | 1,000,000 | | | | 998,405 | |
| VMware, Inc. | | | | | | | | |
| 0.60%, 08/15/2023 | | | 2,000,000 | | | | 1,997,015 | |
| Total Software & Services | | | | | | | 7,589,394 | |
| Supermarkets & Pharmacies (0.88%) | | | | | | | | |
| 7-Eleven, Inc. | | | | | | | | |
| 0.63%, 02/10/2023(d) | | | 500,000 | | | | 499,325 | |
| 0.80%, 02/10/2024(d) | | | 3,350,000 | | | | 3,327,736 | |
| 3M US L + 0.45%, 08/10/2022(a)(d) | | | 750,000 | | | | 750,160 | |
| Total Supermarkets & Pharmacies | | | | | | | 4,577,221 | |
| Transportation & Logistics (0.38%) | | | | | | | | |
| PACCAR Financial Corp. | | | | | | | | |
| 0.35%, 08/11/2023 | | | 1,000,000 | | | | 996,091 | |
| 0.80%, 06/08/2023 | | | 1,000,000 | | | | 1,002,962 | |
| Total Transportation & Logistics | | | | | | | 1,999,053 | |
| Utilities (4.95%) | | | | | | | | |
| Atmos Energy Corp. | | | | | | | | |
| 3M US L + 0.38%, 03/09/2023(a) | | | 1,795,000 | | | | 1,795,358 | |
| Black Hills Corp. | | | | | | | | |
| 1.04%, 08/23/2024 | | | 3,000,000 | | | | 2,993,666 | |
| CenterPoint Energy Resources Corp. | | | | | | | | |
| 0.70%, 03/02/2023 | | | 500,000 | | | | 498,778 | |
| Duke Energy Progress LLC | | | | | | | | |
| Series A | | | | | | | | |
| 3M US L + 0.18%, 02/18/2022(a) | | | 500,000 | | | | 499,964 | |
| Exelon Corp. | | | | | | | | |
| 3.50%, 06/01/2022 | | | 435,000 | | | | 441,224 | |
| NextEra Energy Capital Holdings, Inc. | | | | | | | | |
| 0.65%, 03/01/2023 | | | 5,000,000 | | | | 5,007,391 | |
| ONE Gas, Inc. | | | | | | | | |
| 0.85%, 03/11/2023 | | | 3,000,000 | | | | 3,000,829 | |
| 1.10%, 03/11/2024 | | | 1,000,000 | | | | 996,270 | |
| Pacific Gas and Electric Co. | | | | | | | | |
| 1.37%, 03/10/2023 | | | 1,000,000 | | | | 996,974 | |
| 3M US L + 1.38%, 11/15/2021(a) | | | 4,635,000 | | | | 4,635,469 | |
| Southern California Edison Co. | | | | | | | | |
| Series J | | | | | | | | |
| 0.70%, 08/01/2023 | | | 2,000,000 | | | | 1,995,916 | |
| WEC Energy Group, Inc. | | | | | | | | |
| 0.80%, 03/15/2024 | | | 3,000,000 | | | | 2,990,327 | |
| Total Utilities | | | | | | | 25,852,166 | |
See Notes to Financial Statements.
ALPS | Smith Short Duration Bond Fund
| Statement of Investments | October 31, 2021 |
| | | Principal
Amount | | | Value
(Note 2) | |
| Waste & Environment Services & Equipment (0.40%) | | | | | | | | |
| GFL Environmental, Inc. | | | | | | | | |
| 5.13%, 12/15/2026(d) | | $ | 1,991,000 | | | $ | 2,083,084 | |
| | | | | | | | | |
| Wireless Telecommunications Services (0.86%) | | | | | | | | |
| AT&T, Inc. | | | | | | | | |
| 0.90%, 03/25/2024 | | | 2,000,000 | | | | 2,000,395 | |
| Sprint Corp. | | | | | | | | |
| 7.88%, 09/15/2023 | | | 2,239,000 | | | | 2,485,290 | |
| Total Wireless Telecommunications Services | | | | 4,485,685 | |
| Wireline Telecommunications Services (1.35%) | | | | | | | | |
| Lumen Technologies, Inc. | | | | | | | | |
| Series T | | | | | | | | |
| 5.80%, 03/15/2022 | | | 5,000,000 | | | | 5,063,149 | |
| NTT Finance Corp. | | | | | | | | |
| 0.37%, 03/03/2023(d) | | | 2,000,000 | | | | 1,998,250 | |
| Total Wireline Telecommunications Services | | | | 7,061,399 | |
| TOTAL CORPORATE BONDS | | | | | | | | |
| (Cost $416,050,081) | | | | | | | 416,552,405 | |
| | | | | | | | | |
| GOVERNMENT BONDS (15.87%) | | | | | | | | |
| | | | | | | | | |
| U.S. Treasury Bonds (15.87%) | | | | | | | | |
| United States Treasury Notes | | | | | | | | |
| 0.13%, 03/31/2023 | | | 6,206,000 | | | | 6,189,637 | |
| 0.13%, 05/31/2023 | | | 9,473,000 | | | | 9,437,291 | |
| 0.13%, 06/30/2023 | | | 9,534,000 | | | | 9,493,592 | |
| 0.13%, 07/31/2023 | | | 9,747,000 | | | | 9,697,504 | |
| 0.13%, 08/31/2023 | | | 16,874,000 | | | | 16,778,424 | |
| 0.25%, 06/15/2023 | | | 11,214,000 | | | | 11,191,441 | |
| 0.25%, 09/30/2023 | | | 15,000,000 | | | | 14,940,234 | |
| 0.63%, 10/15/2024 | | | 5,200,000 | | | | 5,180,500 | |
| Total U.S. Treasury Bonds | | | | | | | 82,908,623 | |
| | | | | | | | | |
| TOTAL GOVERNMENT BONDS | | | | | |
| (Cost $83,130,260) | | | | | | | 82,908,623 | |
| | | | | | | | | |
| MUNICIPAL BONDS (0.18%) | | | | | | | | |
| | | | | | | | | |
| City & County of San Francisco CA | | | | | | | | |
| 1.55%, 06/15/2022 | | | 150,000 | | | | 151,118 | |
| New York State Dormitory Authority | | | | | | | | |
| 0.17%, 03/15/2022 | | | 510,000 | | | | 509,995 | |
| 2.81%, 02/15/2022 | | | 150,000 | | | | 151,128 | |
| New York State Urban Development Corp. | | | | | | | | |
| 2.10%, 03/15/2022 | | | 150,000 | | | | 151,052 | |
| Total General Government | | | | | | | 963,293 | |
| | | | | | | | | |
| TOTAL MUNICIPAL BONDS | | | | | | | | |
| (Cost $962,235) | | | | | | | 963,293 | |
| | | | | | | | | | | | | |
| | | 7-Day
Yield | | | Shares | | | Value
(Note 2) | |
| SHORT TERM INVESTMENTS (0.11%) | |
| Money Market Fund (0.11%) | | | | | | | | | |
| Morgan Stanley | | | | | | | | | | | | |
| Institutional Liquidity Funds - Government Portfolio | | | 0.030 | % | | | 594,676 | | | $ | 594,676 | | |
| | | | | | | | | | | | | |
| TOTAL SHORT TERM INVESTMENTS |
| (Cost $594,676) | | | | | | | | | | | 594,676 | | |
| | | | | | | | | | | | | |
| TOTAL INVESTMENTS (98.67%) |
| (Cost $515,568,499) | | | | | | | | | | $ | 515,775,281 | |
| | | | | | | | | | | | | |
| Other Assets In Excess Of Liabilities (1.33%) | | | 6,973,631 | | |
| | | | | | | | | | | | | |
| NET ASSETS (100.00%) | | | | | | | | | | $ | 522,748,912 | |
Investment Abbreviations:
BSBY - Bloomberg Short-Term Bank Yield
LIBOR - London Interbank Offered Rate
SOFR - Secured Overnight Financing Rate
TI – Treasury Index
Reference Rates:
1M US L - 1 Month LIBOR as of October 31, 2021 was 0.09%
3M US L - 3 Month LIBOR as of October 31, 2021 was 0.13%
1D US SOFR - 1 Day SOFR as of October 31, 2021 was 0.05%
3M BSBY - 3 Month BSBY as of October 31, 2021 was 0.16%
1Y US TI - 1 Year US Treasury Bill as of October 31, 2021 was 0.15%
10Y US TI - 10 Year US Treasury Index as of October 31, 2021 was 1.55%
| (a) | Floating or variable rate security. The reference rate is described above. The rate in effect as of October 31, 2021 is based on the reference rate plus the displayed spread as of the security's last reset date. |
| (b) | Issued with zero coupon. |
| (c) | Step bond. Coupon changes periodically based upon a predetermined schedule. Interest rate disclosed is that which is in effect as of October 31, 2021. |
| (d) | Security exempt from registration under Rule 144A of the Securities Act of 1933. This security may be resold in transactions exempt from registration, normally to qualified institutional buyers. As of October 31, 2021, the aggregate market value of those securities was $128,797,141, representing 24.64% of net assets. |
See Notes to Financial Statements.
ALPS | Smith Total Return Bond Fund
| Statement of Investments | October 31, 2021 |
| | | Principal Amount | | | Value (Note 2) | |
| COLLATERALIZED MORTGAGE OBLIGATIONS (7.15%) | | | | | | | | |
| Fannie Mae | | | | | | | | |
| Series 1993-31, Class PN, | | | | | | | | |
| 7.000%, 09/25/2023 | | $ | 123,498 | | | $ | 128,539 | |
| Series 1997-22, Class F, | | | | | | | | |
| 0.636%, 03/25/2027(a) | | | 10,232 | | | | 10,241 | |
| Series 1997-76, Class FO, | | | | | | | | |
| 1M US L + 0.50%, | | | | | | | | |
| 09/17/2027(a) | | | 19,368 | | | | 19,430 | |
| Series 1999-58, Class F, | | | | | | | | |
| 1M US L + 0.40%, | | | | | | | | |
| 11/18/2029(a) | | | 55,502 | | | | 55,668 | |
| Series 2000-40, Class FA, | | | | | | | | |
| 1M US L + 0.50%, | | | | | | | | |
| 07/25/2030(a) | | | 19,199 | | | | 19,092 | |
| Series 2000-45, Class F, | | | | | | | | |
| 1M US L + 0.45%, | | | | | | | | |
| 12/25/2030(a) | | | 21,830 | | | | 21,931 | |
| Series 2001-27, Class F, | | | | | | | | |
| 1M US L + 0.50%, | | | | | | | | |
| 06/25/2031(a) | | | 15,342 | | | | 15,416 | |
| Series 2001-29, Class Z, | | | | | | | | |
| 6.500%, 07/25/2031 | | | 57,275 | | | | 65,230 | |
| Series 2001-51, Class OD, | | | | | | | | |
| 6.500%, 10/25/2031 | | | 38,618 | | | | 40,723 | |
| Series 2001-52, Class XZ, | | | | | | | | |
| 6.500%, 10/25/2031 | | | 33,743 | | | | 39,088 | |
| Series 2001-59, Class F, | | | | | | | | |
| 1M US L + 0.60%, | | | | | | | | |
| 11/25/2031(a) | | | 124,247 | | | | 125,725 | |
| Series 2001-60, Class OF, | | | | | | | | |
| 1M US L + 0.95%, | | | | | | | | |
| 10/25/2031(a) | | | 15,667 | | | | 16,042 | |
| Series 2001-63, Class FD, | | | | | | | | |
| 1M US L + 0.60%, | | | | | | | | |
| 12/18/2031(a) | | | 17,529 | | | | 17,667 | |
| Series 2001-63, Class TC, | | | | | | | | |
| 6.000%, 12/25/2031 | | | 25,108 | | | | 28,544 | |
| Series 2001-68, Class PH, | | | | | | | | |
| 6.000%, 12/25/2031 | | | 21,614 | | | | 24,521 | |
| Series 2001-71, Class FE, | | | | | | | | |
| 1M US L + 0.65%, | | | | | | | | |
| 11/25/2031(a) | | | 86,828 | | | | 87,928 | |
| Series 2001-71, Class FS, | | | | | | | | |
| 1M US L + 0.60%, | | | | | | | | |
| 11/25/2031(a) | | | 71,008 | | | | 70,308 | |
| Series 2001-81, Class GE, | | | | | | | | |
| 6.000%, 01/25/2032 | | | 17,851 | | | | 20,341 | |
| Series 2002-11, Class JF, | | | | | | | | |
| 1M US L + 0.73%, | | | | | | | | |
| 03/25/2032(a) | | | 55,518 | | | | 56,377 | |
| Series 2002-12, Class FH, | | | | | | | | |
| 1M US L + 1.05%, | | | | | | | | |
| 01/25/2032(a) | | | 61,937 | | | | 63,415 | |
| | | Principal Amount | | | Value (Note 2) | |
| Series 2002-13, Class FE, | | | | | | | | |
| 1M US L + 0.90%, | | | | | | | | |
| 03/25/2032(a) | | $ | 64,900 | | | $ | 65,983 | |
| Series 2002-16, Class TM, | | | | | | | | |
| 7.000%, 04/25/2032 | | | 14,899 | | | | 17,305 | |
| Series 2002-17, Class JF, | | | | | | | | |
| 1M US L + 1.00%, | | | | | | | | |
| 04/25/2032(a) | | | 33,688 | | | | 34,463 | |
| Series 2002-18, Class FD, | | | | | | | | |
| 1M US L + 0.80%, | | | | | | | | |
| 02/25/2032(a) | | | 58,188 | | | | 59,280 | |
| Series 2002-23, Class FA, | | | | | | | | |
| 1M US L + 0.90%, | | | | | | | | |
| 04/25/2032(a) | | | 52,144 | | | | 53,391 | |
| Series 2002-34, Class EO, | | | | | | | | |
| –%, 05/18/2032(b) | | | 60,913 | | | | 58,955 | |
| Series 2002-36, Class FS, | | | | | | | | |
| 1M US L + 0.50%, | | | | | | | | |
| 06/25/2032(a) | | | 45,338 | | | | 45,493 | |
| Series 2002-44, Class FJ, | | | | | | | | |
| 1M US L + 1.00%, | | | | | | | | |
| 04/25/2032(a) | | | 92,026 | | | | 94,158 | |
| Series 2002-47, Class FC, | | | | | | | | |
| 1M US L + 0.60%, | | | | | | | | |
| 11/25/2031(a) | | | 16,960 | | | | 17,126 | |
| Series 2002-48, Class F, | | | | | | | | |
| 1M US L + 1.00%, | | | | | | | | |
| 07/25/2032(a) | | | 57,184 | | | | 58,520 | |
| Series 2002-49, Class FC, | | | | | | | | |
| 1M US L + 1.00%, | | | | | | | | |
| 11/18/2031(a) | | | 35,130 | | | | 35,958 | |
| Series 2002-60, Class FV, | | | | | | | | |
| 1M US L + 1.00%, | | | | | | | | |
| 04/25/2032(a) | | | 125,047 | | | | 127,956 | |
| Series 2002-63, Class EZ, | | | | | | | | |
| 6.000%, 10/25/2032 | | | 10,798 | | | | 12,551 | |
| Series 2002-68, Class AF, | | | | | | | | |
| 1M US L + 1.00%, | | | | | | | | |
| 10/25/2032(a) | | | 25,194 | | | | 25,782 | |
| Series 2002-7, Class FC, | | | | | | | | |
| 1M US L + 0.75%, | | | | | | | | |
| 01/25/2032(a) | | | 72,227 | | | | 73,443 | |
| Series 2002-71, Class AQ, | | | | | | | | |
| 4.000%, 11/25/2032 | | | 61,853 | | | | 65,886 | |
| Series 2002-8, Class FA, | | | | | | | | |
| 1M US L + 0.75%, | | | | | | | | |
| 03/18/2032(a) | | | 21,210 | | | | 21,628 | |
| Series 2002-80, Class CZ, | | | | | | | | |
| 4.500%, 09/25/2032 | | | 93,905 | | | | 107,736 | |
| Series 2002-9, Class FW, | | | | | | | | |
| 1M US L + 0.55%, | | | | | | | | |
| 03/25/2032(a) | | | 17,627 | | | | 17,590 | |
| Series 2002-91, Class F, | | | | | | | | |
| 1M US L + 0.55%, | | | | | | | | |
| 01/25/2033(a) | | | 26,178 | | | | 26,414 | |
See Notes to Financial Statements.
ALPS | Smith Total Return Bond Fund
| Statement of Investments | October 31, 2021 |
| | | Principal Amount | | | Value (Note 2) | |
| Series 2003-107, Class FD, | | | | | | | | |
| 1M US L + 0.50%, | | | | | | | | |
| 11/25/2033(a) | | $ | 16,539 | | | $ | 16,677 | |
| Series 2003-110, Class CK, | | | | | | | | |
| 3.000%, 11/25/2033 | | | 31,436 | | | | 32,898 | |
| Series 2003-116, Class FA, | | | | | | | | |
| 1M US L + 0.40%, | | | | | | | | |
| 11/25/2033(a) | | | 36,403 | | | | 36,602 | |
| Series 2003-119, Class FH, | | | | | | | | |
| 1M US L + 0.50%, | | | | | | | | |
| 12/25/2033(a) | | | 43,817 | | | | 43,974 | |
| Series 2003-119, Class ZP, | | | | | | | | |
| 4.000%, 12/25/2033 | | | 61,355 | | | | 65,708 | |
| Series 2003-128, Class MF, | | | | | | | | |
| 1M US L + 0.60%, | | | | | | | | |
| 01/25/2034(a) | | | 72,220 | | | | 73,290 | |
| Series 2003-131, Class CH, | | | | | | | | |
| 5.500%, 01/25/2034 | | | 100,600 | | | | 113,453 | |
| Series 2003-134, Class FC, | | | | | | | | |
| 1M US L + 0.60%, | | | | | | | | |
| 12/25/2032(a) | | | 38,572 | | | | 39,221 | |
| Series 2003-14, Class AP, | | | | | | | | |
| 4.000%, 03/25/2033 | | | 127,242 | | | | 132,086 | |
| Series 2003-14, Class AN, | | | | | | | | |
| 3.500%, 03/25/2033 | | | 84,828 | | | | 88,072 | |
| Series 2003-19, Class MB, | | | | | | | | |
| 4.000%, 05/25/2031 | | | 48,224 | | | | 52,185 | |
| Series 2003-21, Class OG, | | | | | | | | |
| 4.000%, 01/25/2033 | | | 42,782 | | | | 45,383 | |
| Series 2003-22, Class BZ, | | | | | | | | |
| 6.000%, 04/25/2033 | | | 27,337 | | | | 31,011 | |
| Series 2003-27, Class EK, | | | | | | | | |
| 5.000%, 04/25/2033 | | | 35,384 | | | | 40,117 | |
| Series 2003-30, Class JQ, | | | | | | | | |
| 5.500%, 04/25/2033 | | | 36,188 | | | | 40,687 | |
| Series 2003-32, Class UJ, | | | | | | | | |
| 5.500%, 05/25/2033 | | | 52,062 | | | | 58,073 | |
| Series 2003-41, Class OZ, | | | | | | | | |
| 3.750%, 05/25/2033 | | | 124,940 | | | | 132,970 | |
| Series 2003-42, Class JH, | | | | | | | | |
| 5.500%, 05/25/2033 | | | 99,562 | | | | 110,142 | |
| Series 2003-46, Class PJ, | | | | | | | | |
| 5.500%, 06/25/2033 | | | 42,770 | | | | 48,470 | |
| Series 2003-47, Class PE, | | | | | | | | |
| 5.750%, 06/25/2033 | | | 52,552 | | | | 59,371 | |
| Series 2003-64, Class ZC, | | | | | | | | |
| 5.000%, 07/25/2033 | | | 38,364 | | | | 42,811 | |
| Series 2003-64, Class JK, | | | | | | | | |
| 3.500%, 07/25/2033 | | | 61,040 | | | | 65,759 | |
| Series 2003-71, Class HD, | | | | | | | | |
| 5.500%, 08/25/2033 | | | 202,532 | | | | 225,136 | |
| Series 2003-76, Class EZ, | | | | | | | | |
| 5.000%, 08/25/2033 | | | 177,317 | | | | 197,786 | |
| Series 2003-94, Class CE, | | | | | | | | |
| 5.000%, 10/25/2033 | | | 14,868 | | | | 15,966 | |
| | | Principal Amount | | | Value (Note 2) | |
| Series 2004-101, Class TB, | | | | | | | | |
| 5.500%, 01/25/2035 | | $ | 149,676 | | | $ | 169,691 | |
| Series 2004-14, Class QB, | | | | | | | | |
| 5.250%, 03/25/2034 | | | 192,000 | | | | 217,232 | |
| Series 2004-17, Class BA, | | | | | | | | |
| 6.000%, 04/25/2034 | | | 118,388 | | | | 146,127 | |
| Series 2004-17, Class DZ, | | | | | | | | |
| 5.500%, 04/25/2034 | | | 32,284 | | | | 35,502 | |
| Series 2004-26, Class CG, | | | | | | | | |
| 4.500%, 08/25/2033 | | | 12,878 | | | | 13,245 | |
| Series 2004-36, Class CB, | | | | | | | | |
| 5.000%, 05/25/2034 | | | 137,422 | | | | 152,076 | |
| Series 2004-36, Class FA, | | | | | | | | |
| 1M US L + 0.40%, | | | | | | | | |
| 05/25/2034(a) | | | 36,765 | | | | 36,968 | |
| Series 2004-53, Class FC, | | | | | | | | |
| 1M US L + 0.45%, | | | | | | | | |
| 07/25/2034(a) | | | 240,015 | | | | 241,527 | |
| Series 2004-54, Class FL, | | | | | | | | |
| 1M US L + 0.40%, | | | | | | | | |
| 07/25/2034(a) | | | 170,148 | | | | 171,619 | |
| Series 2004-60, Class AC, | | | | | | | | |
| 5.500%, 04/25/2034 | | | 108,000 | | | | 119,677 | |
| Series 2004-68, Class LC, | | | | | | | | |
| 5.000%, 09/25/2029 | | | 51,676 | | | | 57,000 | |
| Series 2004-77, Class AY, | | | | | | | | |
| 4.500%, 10/25/2034 | | | 22,682 | | | | 24,986 | |
| Series 2004-82, Class HK, | | | | | | | | |
| 5.500%, 11/25/2034 | | | 64,347 | | | | 73,666 | |
| Series 2004-92, Class TB, | | | | | | | | |
| 5.500%, 12/25/2034 | | | 106,380 | | | | 120,921 | |
| Series 2005-110, Class MP, | | | | | | | | |
| 5.500%, 12/25/2035 | | | 29,560 | | | | 32,804 | |
| Series 2005-120, Class FE, | | | | | | | | |
| 1M US L + 0.52%, | | | | | | | | |
| 01/25/2036(a) | | | 30,147 | | | | 30,642 | |
| Series 2005-122, Class PY, | | | | | | | | |
| 6.000%, 01/25/2036 | | | 324,000 | | | | 373,653 | |
| Series 2005-17, Class EX, | | | | | | | | |
| 5.250%, 03/25/2035 | | | 25,000 | | | | 28,401 | |
| Series 2005-17, Class EZ, | | | | | | | | |
| 4.500%, 03/25/2035 | | | 147,982 | | | | 155,237 | |
| Series 2005-29, Class ZA, | | | | | | | | |
| 5.500%, 04/25/2035 | | | 82,115 | | | | 93,533 | |
| Series 2005-3, Class CH, | | | | | | | | |
| 5.250%, 02/25/2035 | | | 94,255 | | | | 106,222 | |
| Series 2005-35, Class DZ, | | | | | | | | |
| 5.000%, 04/25/2035 | | | 180,727 | | | | 201,799 | |
| Series 2005-48, Class TD, | | | | | | | | |
| 5.500%, 06/25/2035 | | | 154,642 | | | | 176,013 | |
| Series 2005-59, Class DF, | | | | | | | | |
| 1M US L + 0.20%, | | | | | | | | |
| 05/25/2035(a) | | | 2,864 | | | | 2,869 | |
| Series 2005-62, Class JE, | | | | | | | | |
| 5.000%, 06/25/2035 | | | 53,329 | | | | 54,594 | |
See Notes to Financial Statements.
ALPS | Smith Total Return Bond Fund
| Statement of Investments | October 31, 2021 |
| | | Principal Amount | | | Value (Note 2) | |
| Series 2005-62, Class ZD, | | | | | | | | |
| 5.000%, 06/25/2035 | | $ | 112,955 | | | $ | 118,391 | |
| Series 2005-62, Class GZ, | | | | | | | | |
| 5.750%, 07/25/2035 | | | 495,946 | | | | 575,975 | |
| Series 2005-62, Class JC, | | | | | | | | |
| 5.000%, 05/25/2035 | | | 5,804 | | | | 5,933 | |
| Series 2005-64, Class PL, | | | | | | | | |
| 5.500%, 07/25/2035 | | | 115,091 | | | | 128,582 | |
| Series 2005-68, Class PG, | | | | | | | | |
| 5.500%, 08/25/2035 | | | 40,698 | | | | 45,865 | |
| Series 2005-68, Class BE, | | | | | | | | |
| 5.250%, 08/25/2035 | | | 97,000 | | | | 108,619 | |
| Series 2005-68, Class CZ, | | | | | | | | |
| 5.500%, 08/25/2035 | | | 414,479 | | | | 465,761 | |
| Series 2005-69, Class GZ, | | | | | | | | |
| 4.500%, 08/25/2035 | | | 52,864 | | | | 55,185 | |
| Series 2005-7, Class MZ, | | | | | | | | |
| 4.750%, 02/25/2035 | | | 77,887 | | | | 82,800 | |
| Series 2005-70, Class KP, | | | | | | | | |
| 5.000%, 06/25/2035 | | | 65,703 | | | | 74,359 | |
| Series 2005-70, Class NA, | | | | | | | | |
| 5.500%, 08/25/2035 | | | 17,341 | | | | 19,520 | |
| Series 2005-72, Class FB, | | | | | | | | |
| 1M US L + 0.25%, | | | | | | | | |
| 08/25/2035(a) | | | 22,141 | | | | 22,090 | |
| Series 2005-79, Class DB, | | | | | | | | |
| 5.500%, 09/25/2035 | | | 96,978 | | | | 108,046 | |
| Series 2005-83, Class QP, | | | | | | | | |
| 17.394% - 1M US L, | | | | | | | | |
| 11/25/2034(a) | | | 248,499 | | | | 280,895 | |
| Series 2005-84, Class XM, | | | | | | | | |
| 5.750%, 10/25/2035 | | | 71,183 | | | | 79,693 | |
| Series 2005-89, Class F, | | | | | | | | |
| 1M US L + 0.30%, | | | | | | | | |
| 10/25/2035(a) | | | 28,295 | | | | 28,515 | |
| Series 2005-99, Class FA, | | | | | | | | |
| 1M US L + 0.30%, | | | | | | | | |
| 11/25/2035(a) | | | 42,193 | | | | 42,301 | |
| Series 2005-99, Class ZA, | | | | | | | | |
| 5.500%, 12/25/2035 | | | 107,779 | | | | 138,152 | |
| Series 2006-112, Class QC, | | | | | | | | |
| 5.500%, 11/25/2036 | | | 26,765 | | | | 30,807 | |
| Series 2006-114, Class HE, | | | | | | | | |
| 5.500%, 12/25/2036 | | | 118,874 | | | | 136,592 | |
| Series 2006-115, Class EF, | | | | | | | | |
| 1M US L + 0.36%, | | | | | | | | |
| 12/25/2036(a) | | | 20,977 | | | | 21,173 | |
| Series 2006-16, Class HZ, | | | | | | | | |
| 5.500%, 03/25/2036 | | | 445,421 | | | | 504,555 | |
| Series 2006-39, Class EF, | | | | | | | | |
| 1M US L + 0.40%, | | | | | | | | |
| 05/25/2036(a) | | | 20,586 | | | | 20,733 | |
| Series 2006-46, Class UD, | | | | | | | | |
| 5.500%, 06/25/2036 | | | 33,000 | | | | 38,965 | |
| | | Principal Amount | | | Value (Note 2) | |
| Series 2006-48, Class TF, | | | | | | | | |
| 1M US L + 0.40%, | | | | | | | | |
| 06/25/2036(a) | | $ | 46,790 | | | $ | 47,268 | |
| Series 2006-48, Class DZ, | | | | | | | | |
| 6.000%, 06/25/2036 | | | 80,514 | | | | 114,790 | |
| Series 2006-56, Class F, | | | | | | | | |
| 1M US L + 0.30%, | | | | | | | | |
| 07/25/2036(a) | | | 16,559 | | | | 16,636 | |
| Series 2006-63, Class QH, | | | | | | | | |
| 5.500%, 07/25/2036 | | | 39,398 | | | | 44,362 | |
| Series 2006-71, Class ZH, | | | | | | | | |
| 6.000%, 07/25/2036 | | | 55,716 | | | | 64,815 | |
| Series 2006-95, Class FH, | | | | | | | | |
| 1M US L + 0.45%, | | | | | | | | |
| 10/25/2036(a) | | | 37,668 | | | | 38,166 | |
| Series 2007-100, Class YF, | | | | | | | | |
| 1M US L + 0.55%, | | | | | | | | |
| 10/25/2037(a) | | | 21,186 | | | | 21,606 | |
| Series 2007-109, Class GF, | | | | | | | | |
| 1M US L + 0.68%, | | | | | | | | |
| 12/25/2037(a) | | | 63,883 | | | | 65,473 | |
| Series 2007-111, Class FC, | | | | | | | | |
| 1M US L + 0.60%, | | | | | | | | |
| 12/25/2037(a) | | | 43,873 | | | | 44,605 | |
| Series 2007-117, Class FM, | | | | | | | | |
| 1M US L + 0.70%, | | | | | | | | |
| 01/25/2038(a) | | | 64,909 | | | | 66,587 | |
| Series 2007-12, Class ZA, | | | | | | | | |
| 6.000%, 03/25/2037 | | | 145,942 | | | | 177,095 | |
| Series 2007-14, Class GZ, | | | | | | | | |
| 5.500%, 03/25/2037 | | | 314,827 | | | | 360,049 | |
| Series 2007-30, Class MB, | | | | | | | | |
| 4.250%, 04/25/2037 | | | 84,666 | | | | 89,318 | |
| Series 2007-33, Class HE, | | | | | | | | |
| 5.500%, 04/25/2037 | | | 53,656 | | | | 61,303 | |
| Series 2007-34, Class F, | | | | | | | | |
| 1M US L + 0.39%, | | | | | | | | |
| 04/25/2037(a) | | | 34,494 | | | | 34,847 | |
| Series 2007-41, Class FA, | | | | | | | | |
| 1M US L + 0.40%, | | | | | | | | |
| 05/25/2037(a) | | | 25,965 | | | | 26,196 | |
| Series 2007-5, Class PD, | | | | | | | | |
| 02/25/2037 | | | 344,206 | | | | 355,431 | |
| Series 2007-51, Class PB, | | | | | | | | |
| 5.500%, 06/25/2037 | | | 32,000 | | | | 35,556 | |
| Series 2007-51, Class CP, | | | | | | | | |
| 5.500%, 06/25/2037 | | | 36,808 | | | | 41,802 | |
| Series 2007-55, Class PH, | | | | | | | | |
| 6.000%, 06/25/2047 | | | 496,107 | | | | 584,657 | |
| Series 2007-57, Class FA, | | | | | | | | |
| 1M US L + 0.23%, | | | | | | | | |
| 06/25/2037(a) | | | 32,044 | | | | 32,127 | |
| Series 2007-6, Class FC, | | | | | | | | |
| 1M US L + 0.42%, | | | | | | | | |
| 02/25/2037(a) | | | 48,663 | | | | 49,138 | |
See Notes to Financial Statements.
ALPS | Smith Total Return Bond Fund
| Statement of Investments | October 31, 2021 |
| | | Principal Amount | | | Value (Note 2) | |
| Series 2007-63, Class FC, | | | | | | | | |
| 1M US L + 0.35%, | | | | | | | | |
| 07/25/2037(a) | | $ | 28,326 | | | $ | 28,517 | |
| Series 2007-65, Class KF, | | | | | | | | |
| 1M US L + 0.38%, | | | | | | | | |
| 07/25/2037(a) | | | 53,580 | | | | 54,126 | |
| Series 2007-65, Class ZE, | | | | | | | | |
| 5.500%, 07/25/2037 | | | 175,873 | | | | 195,040 | |
| Series 2007-70, Class FA, | | | | | | | | |
| 1M US L + 0.35%, | | | | | | | | |
| 07/25/2037(a) | | | 35,781 | | | | 36,011 | |
| Series 2007-77, Class JE, | | | | | | | | |
| 6.000%, 08/25/2037 | | | 477,224 | | | | 535,090 | |
| Series 2007-85, Class FC, | | | | | | | | |
| 1M US L + 0.54%, | | | | | | | | |
| 09/25/2037(a) | | | 128,636 | | | | 130,467 | |
| Series 2007-85, Class FL, | | | | | | | | |
| 1M US L + 0.54%, | | | | | | | | |
| 09/25/2037(a) | | | 44,895 | | | | 45,752 | |
| Series 2007-86, Class FA, | | | | | | | | |
| 1M US L + 0.45%, | | | | | | | | |
| 09/25/2037(a) | | | 40,868 | | | | 41,226 | |
| Series 2007-9, Class FB, | | | | | | | | |
| 1M US L + 0.35%, | | | | | | | | |
| 03/25/2037(a) | | | 32,639 | | | | 33,055 | |
| Series 2008-18, Class FA, | | | | | | | | |
| 1M US L + 0.90%, | | | | | | | | |
| 03/25/2038(a) | | | 175,629 | | | | 179,979 | |
| Series 2008-24, Class WD, | | | | | | | | |
| 5.500%, 02/25/2038 | | | 124,095 | | | | 146,233 | |
| Series 2008-25, Class EF, | | | | | | | | |
| 1M US L + 0.95%, | | | | | | | | |
| 04/25/2038(a) | | | 56,783 | | | | 58,367 | |
| Series 2008-46, Class LA, | | | | | | | | |
| 5.500%, 06/25/2038 | | | 12,961 | | | | 14,737 | |
| Series 2008-66, Class FT, | | | | | | | | |
| 1M US L + 0.95%, | | | | | | | | |
| 08/25/2038(a) | | | 31,476 | | | | 32,285 | |
| Series 2008-86, Class FC, | | | | | | | | |
| 1M US L + 1.10%, | | | | | | | | |
| 12/25/2038(a) | | | 297,351 | | | | 298,179 | |
| Series 2009-10, Class AB, | | | | | | | | |
| 5.000%, 03/25/2024 | | | 48,364 | | | | 49,530 | |
| Series 2009-103, Class FM, | | | | | | | | |
| 1M US L + 0.70%, | | | | | | | | |
| 11/25/2039(a) | | | 56,391 | | | | 57,229 | |
| Series 2009-104, Class FA, | | | | | | | | |
| 1M US L + 0.80%, | | | | | | | | |
| 12/25/2039(a) | | | 52,183 | | | | 52,024 | |
| Series 2009-11, Class MP, | | | | | | | | |
| 7.000%, 03/25/2049 | | | 164,969 | | | | 197,770 | |
| Series 2009-110, Class FG, | | | | | | | | |
| 1M US L + 0.75%, | | | | | | | | |
| 01/25/2040(a) | | | 140,093 | | | | 143,035 | |
| Series 2009-111, Class CY, | | | | | | | | |
| 5.000%, 03/25/2038 | | | 133,000 | | | | 150,013 | |
| | Principal Amount | | | Value (Note 2) | |
| Series 2009-36, Class MX, | | | | | | | | |
| 5.000%, 06/25/2039 | | $ | 58,000 | | | $ | 67,069 | |
| Series 2009-47, Class BN, | | | | | | | | |
| 4.500%, 07/25/2039 | | | 48,362 | | | | 53,361 | |
| Series 2009-62, Class WA, | | | | | | | | |
| 5.577%, 08/25/2039(a) | | | 84,847 | | | | 94,097 | |
| Series 2009-68, Class FD, | | | | | | | | |
| 1M US L + 1.25%, | | | | | | | | |
| 09/25/2039(a) | | | 58,689 | | | | 59,838 | |
| Series 2009-70, Class CO, | | | | | | | | |
| –%, 01/25/2037(b) | | | 101,519 | | | | 93,441 | |
| Series 2009-70, Class FA, | | | | | | | | |
| 1M US L + 1.20%, | | | | | | | | |
| 09/25/2039(a) | | | 42,344 | | | | 42,853 | |
| Series 2009-86, Class OT, | | | | | | | | |
| –%, 10/25/2037(b) | | | 44,031 | | | | 40,093 | |
| Series 2009-87, Class FG, | | | | | | | | |
| 1M US L + 0.75%, | | | | | | | | |
| 11/25/2039(a) | | | 62,407 | | | | 63,520 | |
| Series 2009-90, Class UZ, | | | | | | | | |
| 4.500%, 11/25/2039 | | | 599,996 | | | | 687,286 | |
| Series 2010-1, Class WA, | | | | | | | | |
| 6.244%, 02/25/2040(a) | | | 25,943 | | | | 29,251 | |
| Series 2010-1, Class EL, | | | | | | | | |
| 4.500%, 02/25/2040 | | | 342,451 | | | | 360,211 | |
| Series 2010-102, Class HA, | | | | | | | | |
| 4.000%, 09/25/2050 | | | 67,083 | | | | 72,265 | |
| Series 2010-103, Class DZ, | | | | | | | | |
| 4.500%, 09/25/2040 | | | 201,458 | | | | 238,607 | |
| Series 2010-103, Class PJ, | | | | | | | | |
| 4.500%, 09/25/2040 | | | 45,590 | | | | 50,218 | |
| Series 2010-111, Class FC, | | | | | | | | |
| 1M US L + 0.52%, | | | | | | | | |
| 10/25/2040(a) | | | 67,022 | | | | 67,935 | |
| Series 2010-118, Class LZ, | | | | | | | | |
| 4.750%, 10/25/2040 | | | 45,242 | | | | 50,924 | |
| Series 2010-118, Class GF, | | | | | | | | |
| 1M US L + 0.55%, | | | | | | | | |
| 10/25/2039(a) | | | 58,427 | | | | 58,650 | |
| Series 2010-122, Class JA, | | | | | | | | |
| 7.000%, 07/25/2040 | | | 33,418 | | | | 37,580 | |
| Series 2010-123, Class FL, | | | | | | | | |
| 1M US L + 0.43%, | | | | | | | | |
| 11/25/2040(a) | | | 27,158 | | | | 27,419 | |
| Series 2010-123, Class KU, | | | | | | | | |
| 4.500%, 11/25/2040 | | | 177,497 | | | | 199,886 | |
| Series 2010-129, Class PZ, | | | | | | | | |
| 4.500%, 11/25/2040 | | | 52,931 | | | | 56,401 | |
| Series 2010-130, Class BZ, | | | | | | | | |
| 4.500%, 11/25/2040 | | | 1,782,848 | | | | 1,877,744 | |
| Series 2010-137, Class XP, | | | | | | | | |
| 4.500%, 10/25/2040 | | | 29,428 | | | | 30,223 | |
| Series 2010-14, Class FJ, | | | | | | | | |
| 1M US L + 0.60%, | | | | | | | | |
| 03/25/2040(a) | | | 55,824 | | | | 56,358 | |
See Notes to Financial Statements.
ALPS | Smith Total Return Bond Fund
| Statement of Investments | October 31, 2021 |
| | | Principal Amount | | | Value (Note 2) | |
| Series 2010-141, Class FB, | | | | | | | | |
| 1M US L + 0.47%, | | | | | | | | |
| 12/25/2040(a) | | $ | 53,287 | | | $ | 54,046 | |
| Series 2010-141, Class MN, | | | | | | | | |
| 4.000%, 12/25/2040 | | | 90,000 | | | | 101,097 | |
| Series 2010-141, Class AL, | | | | | | | | |
| 4.000%, 12/25/2040 | | | 72,150 | | | | 77,118 | |
| Series 2010-142, Class FM, | | | | | | | | |
| 1M US L + 0.47%, | | | | | | | | |
| 12/25/2040(a) | | | 20,435 | | | | 20,770 | |
| Series 2010-154, Class JA, | | | | | | | | |
| 3.000%, 11/25/2040 | | | 427,419 | | | | 440,812 | |
| Series 2010-158, Class KF, | | | | | | | | |
| 1M US L + 0.50%, | | | | | | | | |
| 04/25/2040(a) | | | 26,378 | | | | 26,438 | |
| Series 2010-16, Class PL, | | | | | | | | |
| 5.000%, 03/25/2040 | | | 71,000 | | | | 85,481 | |
| Series 2010-19, Class PY, | | | | | | | | |
| 5.000%, 03/25/2040 | | | 436,350 | | | | 465,817 | |
| Series 2010-33, Class KN, | | | | | | | | |
| 4.500%, 03/25/2040 | | | 72,394 | | | | 76,376 | |
| Series 2010-37, Class CY, | | | | | | | | |
| 5.000%, 04/25/2040 | | | 48,578 | | | | 54,456 | |
| Series 2010-38, Class KD, | | | | | | | | |
| 4.500%, 09/25/2039 | | | 6,585 | | | | 6,726 | |
| Series 2010-39, Class EF, | | | | | | | | |
| 1M US L + 0.52%, | | | | | | | | |
| 06/25/2037(a) | | | 51,130 | | | | 51,939 | |
| Series 2010-45, Class WD, | | | | | | | | |
| 5.000%, 05/25/2040 | | | 180,000 | | | | 214,010 | |
| Series 2010-54, Class LX, | | | | | | | | |
| 5.000%, 06/25/2040 | | | 272,000 | | | | 318,359 | |
| Series 2010-57, Class HA, | | | | | | | | |
| 3.500%, 02/25/2040 | | | 86,997 | | | | 90,254 | |
| Series 2010-58, Class FY, | | | | | | | | |
| 1M US L + 0.73%, | | | | | | | | |
| 06/25/2040(a) | | | 63,070 | | | | 64,632 | |
| Series 2010-64, Class DM, | | | | | | | | |
| 5.000%, 06/25/2040 | | | 61,684 | | | | 68,722 | |
| Series 2010-67, Class BD, | | | | | | | | |
| 4.500%, 06/25/2040 | | | 578,922 | | | | 659,574 | |
| Series 2010-68, Class WB, | | | | | | | | |
| 4.500%, 07/25/2040 | | | 85,000 | | | | 96,494 | |
| Series 2010-82, Class WZ, | | | | | | | | |
| 5.000%, 08/25/2040 | | | 350,601 | | | | 408,248 | |
| Series 2010-9, Class ME, | | | | | | | | |
| 5.000%, 02/25/2040 | | | 1,167,000 | | | | 1,338,366 | |
| Series 2011-104, Class KH, | | | | | | | | |
| 2.000%, 03/25/2039 | | | 5,256 | | | | 5,295 | |
| Series 2011-114, Class B, | | | | | | | | |
| 3.500%, 11/25/2041 | | | 221,708 | | | | 242,139 | |
| Series 2011-121, Class JP, | | | | | | | | |
| 4.500%, 12/25/2041 | | | 149,474 | | | | 158,728 | |
| Series 2011-130, Class KB, | | | | | | | | |
| 4.000%, 12/25/2041 | | | 62,099 | | | | 66,698 | |
| | | Principal Amount | | | Value (Note 2) | |
| Series 2011-132, Class PE, | | | | | | | | |
| 4.500%, 12/25/2041 | | $ | 35,611 | | | $ | 39,576 | |
| Series 2011-145, Class JA, | | | | | | | | |
| 4.500%, 12/25/2041 | | | 10,555 | | | | 10,807 | |
| Series 2011-15, Class AF, | | | | | | | | |
| 1M US L + 0.51%, | | | | | | | | |
| 03/25/2041(a) | | | 31,626 | | | | 31,711 | |
| Series 2011-17, Class PD, | | | | | | | | |
| 4.000%, 03/25/2041 | | | 9,154 | | | | 9,439 | |
| Series 2011-26, Class PA, | | | | | | | | |
| 4.500%, 04/25/2041 | | | 138,346 | | | | 150,651 | |
| Series 2011-27, Class ZD, | | | | | | | | |
| 2.500%, 09/25/2040 | | | 158,909 | | | | 160,245 | |
| Series 2011-3, Class FA, | | | | | | | | |
| 1M US L + 0.68%, | | | | | | | | |
| 02/25/2041(a) | | | 208,640 | | | | 212,028 | |
| Series 2011-43, Class B, | | | | | | | | |
| 3.500%, 05/25/2031 | | | 28,469 | | | | 30,486 | |
| Series 2011-45, Class ZA, | | | | | | | | |
| 4.000%, 05/25/2031 | | | 27,997 | | | | 29,998 | |
| Series 2011-47, Class GF, | | | | | | | | |
| 1M US L + 0.57%, | | | | | | | | |
| 06/25/2041(a) | | | 137,000 | | | | 139,320 | |
| Series 2011-5, Class PO, | | | | | | | | |
| –%, 09/25/2040(b) | | | 12,429 | | | | 10,263 | |
| Series 2011-55, Class BZ, | | | | | | | | |
| 3.500%, 06/25/2041 | | | 280,254 | | | | 301,707 | |
| Series 2011-74, Class UB, | | | | | | | | |
| 4.000%, 07/25/2040 | | | 187,600 | | | | 198,957 | |
| Series 2011-75, Class HP, | | | | | | | | |
| 2.500%, 07/25/2040 | | | 20,888 | | | | 21,158 | |
| Series 2011-86, Class AF, | | | | | | | | |
| 1M US L + 0.50%, | | | | | | | | |
| 02/25/2040(a) | | | 42,297 | | | | 42,257 | |
| Series 2011-86, Class NF, | | | | | | | | |
| 1M US L + 0.55%, | | | | | | | | |
| 09/25/2041(a) | | | 56,834 | | | | 57,818 | |
| Series 2011-93, Class GA, | | | | | | | | |
| 4.000%, 04/25/2039 | | | 32,024 | | | | 33,603 | |
| Series 2011-93, Class ST, | | | | | | | | |
| 4.000%, 09/25/2041 | | | 27,749 | | | | 30,522 | |
| Series 2012-100, Class DB, | | | | | | | | |
| 3.000%, 09/25/2042 | | | 150,000 | | | | 155,716 | |
| Series 2012-106, Class QN, | | | | | | | | |
| 3.500%, 10/25/2042 | | | 75,979 | | | | 78,616 | |
| Series 2012-111, Class B, | | | | | | | | |
| 7.000%, 10/25/2042 | | | 112,476 | | | | 134,137 | |
| Series 2012-120, Class AH, | | | | | | | | |
| 2.500%, 02/25/2032 | | | 57,346 | | | | 58,596 | |
| Series 2012-128, Class NP, | | | | | | | | |
| 2.500%, 11/25/2042 | | | 16,561 | | | | 16,731 | |
| Series 2012-129, Class HT, | | | | | | | | |
| 2.000%, 12/25/2032 | | | 54,914 | | | | 55,109 | |
| Series 2012-13, Class JP, | | | | | | | | |
| 4.500%, 02/25/2042 | | | 672,705 | | | | 699,576 | |
See Notes to Financial Statements.
ALPS | Smith Total Return Bond Fund
| Statement of Investments | October 31, 2021 |
| | | Principal Amount | | | Value (Note 2) | |
| Series 2012-131, Class FG, | | | | | | | | |
| 1M US L + 0.35%, | | | | | | | | |
| 09/25/2042(a) | | $ | 17,752 | | | $ | 17,787 | |
| Series 2012-137, Class CF, | | | | | | | | |
| 1M US L + 0.30%, | | | | | | | | |
| 08/25/2041(a) | | | 37,103 | | | | 37,078 | |
| Series 2012-139, Class GB, | | | | | | | | |
| 2.500%, 12/25/2042 | | | 210,538 | | | | 190,442 | |
| Series 2012-14, Class FL, | | | | | | | | |
| 1M US L + 0.45%, | | | | | | | | |
| 12/25/2040(a) | | | 9,915 | | | | 9,954 | |
| Series 2012-14, Class MH, | | | | | | | | |
| 2.000%, 12/25/2040 | | | 30,582 | | | | 30,900 | |
| Series 2012-149, Class ZA, | | | | | | | | |
| 3.000%, 01/25/2041 | | | 162,522 | | | | 166,073 | |
| Series 2012-149, Class KB, | | | | | | | | |
| 3.000%, 01/25/2043 | | | 144,000 | | | | 146,391 | |
| Series 2012-149, Class DA, | | | | | | | | |
| 1.750%, 01/25/2043 | | | 41,812 | | | | 41,998 | |
| Series 2012-152, Class PB, | | | | | | | | |
| 3.500%, 01/25/2043 | | | 55,000 | | | | 59,255 | |
| Series 2012-17, Class JA, | | | | | | | | |
| 3.500%, 12/25/2041 | | | 226,045 | | | | 228,793 | |
| Series 2012-20, Class TD, | | | | | | | | |
| 4.500%, 02/25/2042 | | | 82,965 | | | | 85,572 | |
| Series 2012-26, Class MA, | | | | | | | | |
| 3.500%, 03/25/2042 | | | 190,570 | | | | 202,895 | |
| Series 2012-33, Class F, | | | | | | | | |
| 1M US L + 0.52%, | | | | | | | | |
| 04/25/2042(a) | | | 45,528 | | | | 46,076 | |
| Series 2012-37, Class BF, | | | | | | | | |
| 1M US L + 0.50%, | | | | | | | | |
| 12/25/2035(a) | | | 68,728 | | | | 69,777 | |
| Series 2012-46, Class YB, | | | | | | | | |
| 3.500%, 05/25/2042 | | | 79,240 | | | | 79,657 | |
| Series 2012-47, Class HF, | | | | | | | | |
| 1M US L + 0.40%, | | | | | | | | |
| 05/25/2027(a) | | | 89,978 | | | | 89,781 | |
| Series 2012-49, Class TG, | | | | | | | | |
| 2.000%, 07/25/2041 | | | 185,146 | | | | 188,261 | |
| Series 2012-50, Class HC, | | | | | | | | |
| 2.000%, 03/25/2042 | | | 54,523 | | | | 55,223 | |
| Series 2012-51, Class ZX, | | | | | | | | |
| 3.500%, 05/25/2042 | | | 1,879,460 | | | | 2,007,311 | |
| Series 2012-53, Class AP, | | | | | | | | |
| 2.000%, 04/25/2041 | | | 161,546 | | | | 163,948 | |
| Series 2012-56, Class UB, | | | | | | | | |
| 4.000%, 06/25/2042 | | | 416,000 | | | | 450,728 | |
| Series 2012-56, Class WB, | | | | | | | | |
| 3.500%, 05/25/2042 | | | 96,067 | | | | 100,934 | |
| Series 2012-64, Class NA, | | | | | | | | |
| 3.000%, 08/25/2041 | | | 127,889 | | | | 129,722 | |
| Series 2012-69, Class PL, | | | | | | | | |
| 3.000%, 01/25/2042 | | | 214,819 | | | | 223,758 | |
| | | Principal Amount | | | Value (Note 2) | |
| Series 2012-70, Class WC, | | | | | | | | |
| 3.000%, 07/25/2042 | | $ | 122,000 | | | $ | 120,671 | |
| Series 2012-80, Class GZ, | | | | | | | | |
| 3.000%, 08/25/2042 | | | 570,452 | | | | 585,048 | |
| Series 2012-82, Class E, | | | | | | | | |
| 2.000%, 04/25/2042 | | | 41,903 | | | | 42,829 | |
| Series 2012-83, Class AC, | | | | | | | | |
| 3.000%, 08/25/2042 | | | 50,000 | | | | 52,562 | |
| Series 2012-83, Class LD, | | | | | | | | |
| 2.000%, 04/25/2041 | | | 88,363 | | | | 88,699 | |
| Series 2012-90, Class PB, | | | | | | | | |
| 2.500%, 01/25/2042 | | | 125,374 | | | | 129,571 | |
| Series 2012-90, Class PH, | | | | | | | | |
| 3.000%, 01/25/2042 | | | 125,374 | | | | 129,888 | |
| Series 2012-94, Class KF, | | | | | | | | |
| 1M US L + 0.35%, | | | | | | | | |
| 05/25/2038(a) | | | 10,667 | | | | 10,679 | |
| Series 2012-98, Class ZP, | | | | | | | | |
| 6.000%, 09/25/2042 | | | 605,808 | | | | 831,853 | |
| Series 2013-100, Class DH, | | | | | | | | |
| 3.000%, 09/25/2031 | | | 69,703 | | | | 70,961 | |
| Series 2013-104, Class CY, | | | | | | | | |
| 5.000%, 10/25/2043 | | | 50,000 | | | | 60,159 | |
| Series 2013-108, Class GU, | | | | | | | | |
| 3.000%, 10/25/2033 | | | 55,000 | | | | 58,463 | |
| Series 2013-111, Class PA, | | | | | | | | |
| 2.000%, 12/25/2042 | | | 1,869 | | | | 1,868 | |
| Series 2013-114, Class LM, | | | | | | | | |
| 4.000%, 03/25/2042 | | | 300,000 | | | | 326,052 | |
| Series 2013-127, Class NA, | | | | | | | | |
| 2.000%, 09/25/2039 | | | 64,609 | | | | 65,474 | |
| Series 2013-129, Class WL, | | | | | | | | |
| 2.000%, 12/25/2027 | | | 11,515 | | | | 11,660 | |
| Series 2013-130, Class FB, | | | | | | | | |
| 1M US L + 0.45%, | | | | | | | | |
| 01/25/2044(a) | | | 52,274 | | | | 52,823 | |
| Series 2013-136, Class QB, | | | | | | | | |
| 3.500%, 03/25/2042 | | | 259,835 | | | | 277,595 | |
| Series 2013-17, Class YM, | | | | | | | | |
| 4.000%, 03/25/2033 | | | 19,421 | | | | 21,188 | |
| Series 2013-2, Class QF, | | | | | | | | |
| 1M US L + 0.50%, | | | | | | | | |
| 02/25/2043(a) | | | 21,986 | | | | 22,207 | |
| Series 2013-35, Class CV, | | | | | | | | |
| 3.000%, 02/25/2043 | | | 100,000 | | | | 105,313 | |
| Series 2013-40, Class KD, | | | | | | | | |
| 1.750%, 04/25/2042 | | | 11,646 | | | | 11,728 | |
| Series 2013-52, Class GM, | | | | | | | | |
| 5.000%, 06/25/2043 | | | 89,000 | | | | 103,279 | |
| Series 2013-53, Class CV, | | | | | | | | |
| 3.500%, 05/25/2030 | | | 123,296 | | | | 128,375 | |
| Series 2013-68, Class P, | | | | | | | | |
| 3.500%, 10/25/2042 | | | 266,828 | | | | 275,472 | |
| Series 2013-68, Class LE, | | | | | | | | |
| 2.000%, 04/25/2043 | | | 140,914 | | | | 142,447 | |
See Notes to Financial Statements.
ALPS | Smith Total Return Bond Fund
| Statement of Investments | October 31, 2021 |
| | | Principal Amount | | | Value (Note 2) | |
| Series 2013-72, Class AF, | | | | | | | | |
| 1M US L + 0.25%, | | | | | | | | |
| 11/25/2042(a) | | $ | 15,119 | | | $ | 15,145 | |
| Series 2013-72, Class YA, | | | | | | | | |
| 3.000%, 06/25/2033 | | | 7,377 | | | | 7,506 | |
| Series 2013-9, Class CB, | | | | | | | | |
| 5.500%, 04/25/2042 | | | 16,142 | | | | 18,300 | |
| Series 2013-91, Class PB, | | | | | | | | |
| 4.000%, 09/25/2043 | | | 100,000 | | | | 108,568 | |
| Series 2013-94, Class BA, | | | | | | | | |
| 3.000%, 03/25/2031 | | | 442,600 | | | | 446,486 | |
| Series 2013-98, Class CJ, | | | | | | | | |
| 2.500%, 07/25/2030 | | | 24,989 | | | | 25,086 | |
| Series 2014-12, Class GV, | | | | | | | | |
| 3.500%, 03/25/2027 | | | 115,796 | | | | 117,322 | |
| Series 2014-14, Class LA, | | | | | | | | |
| 2.500%, 04/25/2031 | | | 89,470 | | | | 89,632 | |
| Series 2014-20, Class AC, | | | | | | | | |
| 3.000%, 08/25/2036 | | | 147,603 | | | | 152,427 | |
| Series 2014-21, Class MA, | | | | | | | | |
| 2.000%, 09/25/2041 | | | 129,923 | | | | 133,078 | |
| Series 2014-26, Class YW, | | | | | | | | |
| 3.500%, 04/25/2044 | | | 50,538 | | | | 54,262 | |
| Series 2014-3, Class BM, | | | | | | | | |
| 2.500%, 06/25/2043 | | | 50,000 | | | | 50,720 | |
| Series 2014-49, Class CA, | | | | | | | | |
| 3.000%, 08/25/2044 | | | 137,745 | | | | 144,184 | |
| Series 2014-73, Class FA, | | | | | | | | |
| 1M US L + 0.35%, | | | | | | | | |
| 11/25/2044(a) | | | 19,173 | | | | 19,305 | |
| Series 2014-81, Class GC, | | | | | | | | |
| 3.000%, 03/25/2038 | | | 55,474 | | | | 57,419 | |
| Series 2014-88, Class ER, | | | | | | | | |
| 2.500%, 02/25/2036 | | | 43,660 | | | | 45,341 | |
| Series 2015-44, Class J, | | | | | | | | |
| 3.500%, 12/25/2040 | | | 78,124 | | | | 78,583 | |
| Series 2015-48, Class DB, | | | | | | | | |
| 3.000%, 08/25/2038 | | | 2,247 | | | | 2,246 | |
| Series 2015-51, Class CD, | | | | | | | | |
| 3.000%, 07/25/2044 | | | 184,926 | | | | 190,782 | |
| Series 2016-14, Class NC, | | | | | | | | |
| 2.500%, 03/25/2046 | | | 809,875 | | | | 826,755 | |
| Series 2016-27, Class HK, | | | | | | | | |
| 3.000%, 01/25/2041 | | | 399,533 | | | | 420,521 | |
| Series 2016-33, Class LE, | | | | | | | | |
| 2.500%, 11/25/2033 | | | 58,439 | | | | 60,435 | |
| Series 2016-48, Class UF, | | | | | | | | |
| 1M US L + 0.40%, | | | | | | | | |
| 08/25/2046(a) | | | 98,109 | | | | 98,828 | |
| Series 2016-55, Class EA, | | | | | | | | |
| 1.750%, 07/25/2043 | | | 1,016,670 | | | | 1,010,908 | |
| Series 2016-75, Class FC, | | | | | | | | |
| 1M US L + 0.40%, | | | | | | | | |
| 10/25/2046(a) | | | 36,866 | | | | 37,225 | |
| | Principal Amount | | | Value (Note 2) | |
| Series 2016-8, Class CB, | | | | | | | | |
| 3.500%, 03/25/2046 | | $ | 733,000 | | | $ | 805,753 | |
| Series 2016-85, Class BA, | | | | | | | | |
| 2.500%, 11/25/2046 | | | 13,156 | | | | 13,699 | |
| Series 2016-9, Class D, | | | | | | | | |
| 3.000%, 03/25/2046 | | | 44,421 | | | | 46,245 | |
| Series 2016-9, Class PA, | | | | | | | | |
| 2.500%, 06/25/2045 | | | 312,524 | | | | 321,113 | |
| Series 2017-1, Class JP, | | | | | | | | |
| 3.500%, 04/25/2045 | | | 192,533 | | | | 194,455 | |
| Series 2017-1, Class AP, | | | | | | | | |
| 3.500%, 05/25/2043 | | | 10,939 | | | | 10,934 | |
| Series 2017-10, Class FA, | | | | | | | | |
| 1M US L + 0.40%, | | | | | | | | |
| 03/25/2047(a) | | | 43,051 | | | | 43,411 | |
| Series 2017-107, Class GA, | | | | | | | | |
| 3.000%, 08/25/2045 | | | 101,336 | | | | 102,301 | |
| Series 2017-15, Class PE, | | | | | | | | |
| 3.500%, 04/25/2046 | | | 74,286 | | | | 77,457 | |
| Series 2017-19, Class B, | | | | | | | | |
| 3.000%, 01/25/2047 | | | 95,184 | | | | 97,750 | |
| Series 2017-22, Class DA, | | | | | | | | |
| 4.000%, 08/25/2044 | | | 52,206 | | | | 53,282 | |
| Series 2017-24, Class H, | | | | | | | | |
| 3.000%, 08/25/2043 | | | 252,811 | | | | 259,221 | |
| Series 2017-35, Class AH, | | | | | | | | |
| 3.500%, 04/25/2053 | | | 28,663 | | | | 29,366 | |
| Series 2017-38, Class JA, | | | | | | | | |
| 3.000%, 03/25/2047 | | | 174,473 | | | | 179,938 | |
| Series 2017-40, Class GL, | | | | | | | | |
| 3.500%, 03/25/2043 | | | 13,850 | | | | 14,055 | |
| Series 2017-45, Class KD, | | | | | | | | |
| 3.500%, 02/25/2044 | | | 6,012 | | | | 6,015 | |
| Series 2017-46, Class AB, | | | | | | | | |
| 3.500%, 07/25/2049 | | | 42,336 | | | | 42,852 | |
| Series 2017-56, Class BA, | | | | | | | | |
| 3.000%, 03/25/2045 | | | 150,912 | | | | 155,161 | |
| Series 2017-68, Class HQ, | | | | | | | | |
| 3.000%, 07/25/2046 | | | 167,457 | | | | 173,017 | |
| Series 2017-96, Class PA, | | | | | | | | |
| 3.000%, 12/25/2054 | | | 219,169 | | | | 228,202 | |
| Series 2018-1, Class TE, | | | | | | | | |
| 3.500%, 03/25/2044 | | | 337,924 | | | | 344,307 | |
| Series 2018-16, Class HA, | | | | | | | | |
| 3.000%, 07/25/2043 | | | 29,938 | | | | 30,159 | |
| Series 2018-18, Class P, | | | | | | | | |
| 3.500%, 04/25/2043 | | | 132,101 | | | | 133,216 | |
| Series 2018-19, Class KB, | | | | | | | | |
| 3.000%, 04/25/2046 | | | 125,072 | | | | 128,539 | |
| Series 2018-2, Class HD, | | | | | | | | |
| 3.000%, 02/25/2047 | | | 65,909 | | | | 67,189 | |
| Series 2018-24, Class BA, | | | | | | | | |
| 3.500%, 09/25/2045 | | | 103,384 | | | | 105,711 | |
| Series 2018-38, Class PA, | | | | | | | | |
| 3.500%, 06/25/2047 | | | 30,214 | | | | 31,216 | |
See Notes to Financial Statements.
ALPS | Smith Total Return Bond Fund
| Statement of Investments | October 31, 2021 |
| | | Principal Amount | | | Value (Note 2) | |
| Series 2018-39, Class FG, | | | | | | | | |
| 1M US L + 0.25%, | | | | | | | | |
| 11/25/2033(a) | | $ | 142,011 | | | $ | 142,750 | |
| Series 2018-41, Class PZ, | | | | | | | | |
| 4.000%, 06/25/2048 | | | 895,171 | | | | 1,020,681 | |
| Series 2018-43, Class FE, | | | | | | | | |
| 1M US L + 0.25%, | | | | | | | | |
| 09/25/2038(a) | | | 48,531 | | | | 48,727 | |
| Series 2018-45, Class GA, | | | | | | | | |
| 3.000%, 06/25/2048 | | | 59,814 | | | | 61,897 | |
| Series 2018-5, Class JP, | | | | | | | | |
| 3.000%, 09/25/2047 | | | 76,116 | | | | 77,134 | |
| Series 2018-56, Class CH, | | | | | | | | |
| 3.000%, 08/25/2048 | | | 48,815 | | | | 50,514 | |
| Series 2018-60, Class KL, | | | | | | | | |
| 4.000%, 08/25/2048 | | | 96,000 | | | | 110,031 | |
| Series 2018-67, Class DY, | | | | | | | | |
| 4.000%, 09/25/2048 | | | 304,029 | | | | 349,169 | |
| Series 2018-83, Class LH, | | | | | | | | |
| 4.000%, 11/25/2048 | | | 39,327 | | | | 40,988 | |
| Series 2018-94, Class KD, | | | | | | | | |
| 3.500%, 12/25/2048 | | | 77,022 | | | | 80,044 | |
| Series 2019-10, Class MA, | | | | | | | | |
| 3.000%, 03/25/2049 | | | 129,942 | | | | 132,882 | |
| Series 2019-13, Class MH, | | | | | | | | |
| 3.000%, 03/25/2049 | | | 697,789 | | | | 725,097 | |
| Series 2019-55, Class MQ, | | | | | | | | |
| 3.500%, 10/25/2049 | | | 1,097,167 | | | | 1,149,509 | |
| Series 2019-60, Class BF, | | | | | | | | |
| 1M US L + 0.45%, | | | | | | | | |
| 10/25/2049(a) | | | 19,849 | | | | 19,993 | |
| Series 2019-65, Class HA, | | | | | | | | |
| 2.500%, 11/25/2049 | | | 197,522 | | | | 201,736 | |
| Series 2020-10, Class B, | | | | | | | | |
| 3.000%, 03/25/2050 | | | 414,287 | | | | 420,914 | |
| | | | | | | | 47,977,419 | |
| Freddie Mac | | | | | | | | |
| Series 1994-1665, Class KZ, | | | | | | | | |
| 6.500%, 01/15/2024 | | | 4,451 | | | | 4,698 | |
| Series 1996-1863, Class Z, | | | | | | | | |
| 6.500%, 07/15/2026 | | | 8,463 | | | | 8,909 | |
| Series 1997-1935, Class FK, | | | | | | | | |
| 1M US L + 0.70%, | | | | | | | | |
| 02/15/2027(a) | | | 15,275 | | | | 15,388 | |
| Series 1997-1980, Class Z, | | | | | | | | |
| 7.000%, 07/15/2027 | | | 16,600 | | | | 18,651 | |
| Series 1998-2034, Class Z, | | | | | | | | |
| 6.500%, 02/15/2028 | | | 34,476 | | | | 38,258 | |
| Series 1998-2035, Class PC, | | | | | | | | |
| 6.950%, 03/15/2028 | | | 6,399 | | | | 7,153 | |
| Series 1998-2053, Class Z, | | | | | | | | |
| 6.500%, 04/15/2028 | | | 17,541 | | | | 19,850 | |
| Series 1998-2060, Class Z, | | | | | | | | |
| 6.500%, 05/15/2028 | | | 12,104 | | | | 13,584 | |
| | | Principal Amount | | | Value (Note 2) | |
| Series 1998-2079, Class FA, | | | | | | | | |
| 1M US L + 0.50%, | | | | | | | | |
| 07/17/2028(a) | | $ | 4,680 | | | $ | 4,689 | |
| Series 1998-2095, Class PE, | | | | | | | | |
| 6.000%, 11/15/2028 | | | 20,263 | | | | 22,578 | |
| Series 1998-2102, Class Z, | | | | | | | | |
| 6.000%, 12/15/2028 | | | 66,772 | | | | 74,337 | |
| Series 1999-2115, Class FB, | | | | | | | | |
| 1M US L + 0.45%, | | | | | | | | |
| 01/15/2029(a) | | | 40,275 | | | | 40,396 | |
| Series 1999-2126, Class CB, | | | | | | | | |
| 6.250%, 02/15/2029 | | | 30,867 | | | | 34,015 | |
| Series 1999-2137, Class TH, | | | | | | | | |
| 6.500%, 03/15/2029 | | | 7,179 | | | | 8,085 | |
| Series 1999-2154, Class PL, | | | | | | | | |
| 6.500%, 05/15/2029 | | | 41,819 | | | | 47,307 | |
| Series 2000-2224, Class CB, | | | | | | | | |
| 8.000%, 03/15/2030 | | | 8,972 | | | | 10,572 | |
| Series 2001-2274, Class ZM, | | | | | | | | |
| 6.500%, 01/15/2031 | | | 13,740 | | | | 15,334 | |
| Series 2001-2279, Class Z, | | | | | | | | |
| 6.000%, 01/15/2031 | | | 13,784 | | | | 15,273 | |
| Series 2001-2320, Class FI, | | | | | | | | |
| 1M US L + 0.50%, | | | | | | | | |
| 09/15/2029(a) | | | 39,498 | | | | 39,721 | |
| Series 2001-2322, Class FV, | | | | | | | | |
| 1M US L + 0.50%, | | | | | | | | |
| 06/15/2030(a) | | | 32,738 | | | | 32,308 | |
| Series 2001-2324, Class PZ, | | | | | | | | |
| 6.500%, 06/15/2031 | | | 157,797 | | | | 183,170 | |
| Series 2001-2334, Class KB, | | | | | | | | |
| 6.500%, 05/15/2028 | | | 109,100 | | | | 121,444 | |
| Series 2001-2341, Class FP, | | | | | | | | |
| 1M US L + 0.90%, | | | | | | | | |
| 07/15/2031(a) | | | 36,275 | | | | 37,056 | |
| Series 2001-2367, Class FA, | | | | | | | | |
| 1M US L + 0.525%, | | | | | | | | |
| 06/15/2031(a) | | | 34,967 | | | | 35,221 | |
| Series 2001-2372, Class F, | | | | | | | | |
| 1M US L + 0.50%, | | | | | | | | |
| 10/15/2031(a) | | | 31,783 | | | | 31,940 | |
| Series 2001-2388, Class FR, | | | | | | | | |
| 1M US L + 0.65%, | | | | | | | | |
| 06/15/2031(a) | | | 23,266 | | | | 23,525 | |
| Series 2001-2388, Class FB, | | | | | | | | |
| 1M US L + 0.60%, | | | | | | | | |
| 01/15/2029(a) | | | 27,028 | | | | 27,242 | |
| Series 2001-2391, Class HF, | | | | | | | | |
| 1M US L + 0.55%, | | | | | | | | |
| 06/15/2031(a) | | | 11,999 | | | | 12,095 | |
| Series 2001-2396, Class FM, | | | | | | | | |
| 1M US L + 0.45%, | | | | | | | | |
| 12/15/2031(a) | | | 43,491 | | | | 43,628 | |
| Series 2001-2396, Class FN, | | | | | | | | |
| 1M US L + 0.65%, | | | | | | | | |
| 12/15/2031(a) | | | 120,890 | | | | 122,794 | |
See Notes to Financial Statements.
ALPS | Smith Total Return Bond Fund
| Statement of Investments | October 31, 2021 |
| | | Principal Amount | | | Value (Note 2) | |
| Series 2002-2411, Class F, | | | | | | | | |
| 1M US L + 0.55%, | | | | | | | | |
| 02/15/2032(a) | | $ | 30,172 | | | $ | 30,461 | |
| Series 2002-2412, Class OF, | | | | | | | | |
| 1M US L + 0.95%, | | | | | | | | |
| 12/15/2031(a) | | | 37,676 | | | | 38,554 | |
| Series 2002-2417, Class FY, | | | | | | | | |
| 1M US L + 0.60%, | | | | | | | | |
| 12/15/2031(a) | | | 12,439 | | | | 12,565 | |
| Series 2002-2424, Class FY, | | | | | | | | |
| 1M US L + 0.45%, | | | | | | | | |
| 03/15/2032(a) | | | 60,927 | | | | 61,110 | |
| Series 2002-2430, Class WF, | | | | | | | | |
| 6.500%, 03/15/2032 | | | 10,534 | | | | 12,267 | |
| Series 2002-2433, Class FA, | | | | | | | | |
| 1M US L + 0.95%, | | | | | | | | |
| 02/15/2032(a) | | | 40,774 | | | | 41,704 | |
| Series 2002-2460, Class FA, | | | | | | | | |
| 1M US L + 1.00%, | | | | | | | | |
| 03/15/2032(a) | | | 82,404 | | | | 84,284 | |
| Series 2002-2466, Class FV, | | | | | | | | |
| 1M US L + 0.55%, | | | | | | | | |
| 03/15/2032(a) | | | 76,874 | | | | 77,539 | |
| Series 2002-2470, Class EF, | | | | | | | | |
| 1M US L + 1.00%, | | | | | | | | |
| 03/15/2032(a) | | | 88,341 | | | | 89,976 | |
| Series 2002-2478, Class FD, | | | | | | | | |
| 1M US L + 1.00%, | | | | | | | | |
| 02/15/2032(a) | | | 25,005 | | | | 25,099 | |
| Series 2002-2481, Class FE, | | | | | | | | |
| 1M US L + 1.00%, | | | | | | | | |
| 03/15/2032(a) | | | 24,962 | | | | 25,531 | |
| Series 2002-2488, Class FU, | | | | | | | | |
| 1M US L + 0.60%, | | | | | | | | |
| 03/15/2032(a) | | | 74,965 | | | | 74,689 | |
| Series 2002-2494, Class F, | | | | | | | | |
| 1M US L + 1.05%, | | | | | | | | |
| 06/15/2031(a) | | | 46,452 | | | | 47,519 | |
| Series 2002-2495, Class ZB, | | | | | | | | |
| 4.500%, 09/15/2032 | | | 45,757 | | | | 49,664 | |
| Series 2002-2510, Class FE, | | | | | | | | |
| 1M US L + 0.40%, | | | | | | | | |
| 10/15/2032(a) | | | 34,479 | | | | 34,536 | |
| Series 2002-2513, Class AF, | | | | | | | | |
| 1M US L + 1.00%, | | | | | | | | |
| 02/15/2032(a) | | | 66,838 | | | | 68,367 | |
| Series 2002-2516, Class FD, | | | | | | | | |
| 1M US L + 1.00%, | | | | | | | | |
| 02/15/2032(a) | | | 63,518 | | | | 65,005 | |
| Series 2002-2517, Class FR, | | | | | | | | |
| 1M US L + 0.35%, | | | | | | | | |
| 10/15/2032(a) | | | 18,845 | | | | 18,880 | |
| Series 2002-2524, Class DH, | | | | | | | | |
| 6.000%, 11/15/2032 | | | 33,000 | | | | 37,892 | |
| Series 2002-2525, Class NU, | | | | | | | | |
| 5.000%, 04/15/2032 | | | 100,351 | | | | 110,783 | |
| | | Principal Amount | | | Value (Note 2) | |
| Series 2002-2535, Class AW, | | | | | | | | |
| 5.500%, 12/15/2032 | | $ | 13,938 | | | $ | 15,612 | |
| Series 2002-2538, Class F, | | | | | | | | |
| 1M US L + 0.60%, | | | | | | | | |
| 12/15/2032(a) | | | 185,643 | | | | 188,958 | |
| Series 2002-2541, Class BL, | | | | | | | | |
| 5.500%, 12/15/2032 | | | 55,087 | | | | 61,605 | |
| Series 2003-2554, Class MN, | | | | | | | | |
| 5.500%, 01/15/2033 | | | 58,987 | | | | 66,380 | |
| Series 2003-2557, Class HL, | | | | | | | | |
| 5.300%, 01/15/2033 | | | 123,402 | | | | 140,229 | |
| Series 2003-2557, Class NU, | | | | | | | | |
| 5.250%, 03/15/2032 | | | 73,423 | | | | 82,889 | |
| Series 2003-2557, Class WF, | | | | | | | | |
| 1M US L + 0.40%, | | | | | | | | |
| 01/15/2033(a) | | | 44,902 | | | | 45,068 | |
| Series 2003-2568, Class D, | | | | | | | | |
| 5.500%, 02/15/2033 | | | 40,383 | | | | 45,566 | |
| Series 2003-2571, Class FY, | | | | | | | | |
| 1M US L + 0.75%, | | | | | | | | |
| 12/15/2032(a) | | | 27,247 | | | | 27,808 | |
| Series 2003-2587, Class FW, | | | | | | | | |
| 1M US L + 0.47%, | | | | | | | | |
| 03/15/2033(a) | | | 51,959 | | | | 51,862 | |
| Series 2003-2590, Class QY, | | | | | | | | |
| 3.750%, 04/15/2028 | | | 14,213 | | | | 14,720 | |
| Series 2003-2590, Class OZ, | | | | | | | | |
| 4.000%, 03/15/2033 | | | 241,539 | | | | 261,643 | |
| Series 2003-2614, Class FV, | | | | | | | | |
| 1M US L + 1.50%, | | | | | | | | |
| 05/15/2033(a) | | | 283,348 | | | | 292,956 | |
| Series 2003-2624, Class QH, | | | | | | | | |
| 5.000%, 06/15/2033 | | | 16,496 | | | | 18,667 | |
| Series 2003-2626, Class ZX, | | | | | | | | |
| 5.000%, 06/15/2033 | | | 188,469 | | | | 213,992 | |
| Series 2003-2627, Class CN, | | | | | | | | |
| 5.000%, 06/15/2033 | | | 47,979 | | | | 54,335 | |
| Series 2003-2631, Class DB, | | | | | | | | |
| 5.000%, 06/15/2033 | | | 148,000 | | | | 168,409 | |
| Series 2003-2647, Class A, | | | | | | | | |
| 3.250%, 04/15/2032 | | | 82,000 | | | | 86,637 | |
| Series 2003-2648, Class WZ, | | | | | | | | |
| 5.000%, 07/15/2033 | | | 248,582 | | | | 284,604 | |
| Series 2003-2668, Class LH, | | | | | | | | |
| 5.000%, 09/15/2033 | | | 31,284 | | | | 34,979 | |
| Series 2003-2707, Class FH, | | | | | | | | |
| 1M US L + 0.65%, | | | | | | | | |
| 04/15/2032(a) | | | 46,952 | | | | 47,639 | |
| Series 2003-2717, Class LH, | | | | | | | | |
| 5.500%, 12/15/2033 | | | 7,736 | | | | 8,605 | |
| Series 2003-2725, Class TA, | | | | | | | | |
| 4.500%, 12/15/2033 | | | 97,000 | | | | 109,287 | |
| Series 2004-2750, Class TC, | | | | | | | | |
| 5.250%, 02/15/2034 | | | 10,756 | | | | 11,760 | |
See Notes to Financial Statements.
ALPS | Smith Total Return Bond Fund
| Statement of Investments | October 31, 2021 |
| | | Principal Amount | | | Value (Note 2) | |
| Series 2004-2768, Class PW, | | | | | | | | |
| 4.250%, 03/15/2034 | | $ | 165,367 | | | $ | 177,721 | |
| Series 2004-2802, Class OH, | | | | | | | | |
| 6.000%, 05/15/2034 | | | 26,748 | | | | 29,660 | |
| Series 2004-2835, Class TB, | | | | | | | | |
| 4.500%, 08/15/2034 | | | 428,333 | | | | 462,538 | |
| Series 2004-2835, Class KZ, | | | | | | | | |
| 5.500%, 08/15/2034 | | | 50,470 | | | | 57,749 | |
| Series 2004-2893, Class PE, | | | | | | | | |
| 5.000%, 11/15/2034 | | | 16,752 | | | | 18,761 | |
| Series 2004-2896, Class BZ, | | | | | | | | |
| 5.000%, 11/15/2034 | | | 97,457 | | | | 109,173 | |
| Series 2004-2901, Class KB, | | | | | | | | |
| 5.000%, 12/15/2034 | | | 46,031 | | | | 51,642 | |
| Series 2005-2927, Class EZ, | | | | | | | | |
| 5.500%, 02/15/2035 | | | 34,404 | | | | 37,042 | |
| Series 2005-2929, Class PG, | | | | | | | | |
| 5.000%, 02/15/2035 | | | 34,385 | | | | 38,672 | |
| Series 2005-2933, Class HD, | | | | | | | | |
| 5.500%, 02/15/2035 | | | 41,814 | | | | 46,657 | |
| Series 2005-2953, Class PG, | | | | | | | | |
| 5.500%, 03/15/2035 | | | 22,942 | | | | 26,326 | |
| Series 2005-2962, Class KF, | | | | | | | | |
| 1M US L + 0.20%, | | | | | | | | |
| 04/15/2035(a) | | | 22,554 | | | | 22,581 | |
| Series 2005-2980, Class QA, | | | | | | | | |
| 6.000%, 05/15/2035 | | | 48,134 | | | | 54,281 | |
| Series 2005-2996, Class GX, | | | | | | | | |
| 5.500%, 06/15/2035 | | | 72,000 | | | | 85,102 | |
| Series 2005-3012, Class ZE, | | | | | | | | |
| 5.750%, 08/15/2035 | | | 59,922 | | | | 66,982 | |
| Series 2005-3028, Class FM, | | | | | | | | |
| 1M US L + 0.25%, | | | | | | | | |
| 09/15/2035(a) | | | 16,035 | | | | 16,074 | |
| Series 2005-3028, Class PG, | | | | | | | | |
| 5.500%, 09/15/2035 | | | 44,222 | | | | 49,495 | |
| Series 2005-3028, Class ZE, | | | | | | | | |
| 5.500%, 09/15/2035 | | | 798,538 | | | | 875,984 | |
| Series 2005-3033, Class WY, | | | | | | | | |
| 5.500%, 09/15/2035 | | | 64,413 | | | | 73,421 | |
| Series 2005-3036, Class NE, | | | | | | | | |
| 5.000%, 09/15/2035 | | | 118,615 | | | | 133,546 | |
| Series 2005-3042, Class PZ, | | | | | | | | |
| 5.750%, 09/15/2035 | | | 143,399 | | | | 189,382 | |
| Series 2005-3052, Class WH, | | | | | | | | |
| 5.500%, 10/15/2035 | | | 14,975 | | | | 16,792 | |
| Series 2005-3059, Class ZM, | | | | | | | | |
| 5.000%, 02/15/2035 | | | 120,455 | | | | 133,459 | |
| Series 2005-3062, Class DE, | | | | | | | | |
| 5.500%, 11/15/2035 | | | 171,214 | | | | 191,602 | |
| Series 2005-3068, Class Z, | | | | | | | | |
| 5.500%, 11/15/2035 | | | 220,826 | | | | 255,762 | |
| Series 2005-3070, Class FT, | | | | | | | | |
| 1M US L + 0.35%, | | | | | | | | |
| 11/15/2035(a) | | | 24,648 | | | | 24,834 | |
| | | Principal Amount | | | Value (Note 2) | |
| Series 2005-3072, Class NF, | | | | | | | | |
| 1M US L + 0.50%, | | | | | | | | |
| 11/15/2035(a) | | $ | 47,752 | | | $ | 48,446 | |
| Series 2005-3085, Class FE, | | | | | | | | |
| 1M US L + 0.80%, | | | | | | | | |
| 08/15/2035(a) | | | 57,578 | | | | 58,954 | |
| Series 2006-3098, Class PG, | | | | | | | | |
| 5.000%, 01/15/2036 | | | 87,031 | | | | 97,927 | |
| Series 2006-3122, Class OH, | | | | | | | | |
| –%, 03/15/2036(b) | | | 16,683 | | | | 15,467 | |
| Series 2006-3123, Class HT, | | | | | | | | |
| 5.000%, 03/15/2026 | | | 37,379 | | | | 39,585 | |
| Series 2006-3136, Class KF, | | | | | | | | |
| 1M US L + 0.30%, | | | | | | | | |
| 04/15/2036(a) | | | 30,180 | | | | 30,303 | |
| Series 2006-3137, Class XP, | | | | | | | | |
| 6.000%, 04/15/2036 | | | 24,577 | | | | 28,668 | |
| Series 2006-3143, Class BC, | | | | | | | | |
| 5.500%, 02/15/2036 | | | 121,184 | | | | 139,058 | |
| Series 2006-3145, Class FN, | | | | | | | | |
| 1M US L + 0.43%, | | | | | | | | |
| 04/15/2036(a) | | | 15,401 | | | | 15,564 | |
| Series 2006-3148, Class CY, | | | | | | | | |
| 6.000%, 04/15/2036 | | | 26,114 | | | | 29,538 | |
| Series 2006-3153, Class UG, | | | | | | | | |
| 1M US L + 0.45%, | | | | | | | | |
| 05/15/2036(a) | | | 28,448 | | | | 28,719 | |
| Series 2006-3154, Class PN, | | | | | | | | |
| 5.500%, 05/15/2036 | | | 76,089 | | | | 86,241 | |
| Series 2006-3201, Class FL, | | | | | | | | |
| 1M US L + 0.60%, | | | | | | | | |
| 08/15/2036(a) | | | 106,481 | | | | 108,368 | |
| Series 2006-3202, Class HF, | | | | | | | | |
| 1M US L + 0.35%, | | | | | | | | |
| 08/15/2036(a) | | | 55,914 | | | | 56,293 | |
| Series 2006-3203, Class ZM, | | | | | | | | |
| 5.000%, 08/15/2036 | | | 148,924 | | | | 166,364 | |
| Series 2006-3204, Class ZM, | | | | | | | | |
| 5.000%, 08/15/2034 | | | 125,202 | | | | 140,213 | |
| Series 2006-3206, Class FE, | | | | | | | | |
| 1M US L + 0.40%, | | | | | | | | |
| 08/15/2036(a) | | | 61,479 | | | | 62,205 | |
| Series 2006-3236, Class EF, | | | | | | | | |
| 1M US L + 0.30%, | | | | | | | | |
| 11/15/2036(a) | | | 15,996 | | | | 16,101 | |
| Series 2006-3237, Class CD, | | | | | | | | |
| 5.500%, 09/15/2036 | | | 198,000 | | | | 216,978 | |
| Series 2006-3237, Class CE, | | | | | | | | |
| 5.500%, 11/15/2036 | | | 59,000 | | | | 70,375 | |
| Series 2006-3249, Class CB, | | | | | | | | |
| 4.250%, 12/15/2036 | | | 418,084 | | | | 455,005 | |
| Series 2007-3262, Class FT, | | | | | | | | |
| 1M US L + 0.27%, | | | | | | | | |
| 01/15/2037(a) | | | 94,921 | | | | 95,211 | |
See Notes to Financial Statements.
ALPS | Smith Total Return Bond Fund
| Statement of Investments | October 31, 2021 |
| | | Principal Amount | | | Value (Note 2) | |
| Series 2007-3279, Class FB, | | | | | | | | |
| 1M US L + 0.32%, | | | | | | | | |
| 02/15/2037(a) | | $ | 92,911 | | | $ | 93,536 | |
| Series 2007-3284, Class AZ, | | | | | | | | |
| 4.500%, 03/15/2037 | | | 93,683 | | | | 101,150 | |
| Series 2007-3301, Class FY, | | | | | | | | |
| 1M US L + 0.42%, | | | | | | | | |
| 04/15/2037(a) | | | 22,527 | | | | 22,794 | |
| Series 2007-3311, Class DF, | | | | | | | | |
| 1M US L + 0.34%, | | | | | | | | |
| 05/15/2037(a) | | | 140,519 | | | | 141,516 | |
| Series 2007-3312, Class PA, | | | | | | | | |
| 5.500%, 05/15/2037 | | | 22,466 | | | | 25,667 | |
| Series 2007-3316, Class FB, | | | | | | | | |
| 1M US L + 0.30%, | | | | | | | | |
| 08/15/2035(a) | | | 40,830 | | | | 41,158 | |
| Series 2007-3349, Class HG, | | | | | | | | |
| 5.500%, 07/15/2037 | | | 22,890 | | | | 26,085 | |
| Series 2007-3361, Class AF, | | | | | | | | |
| 1M US L + 0.35%, | | | | | | | | |
| 11/15/2036(a) | | | 92,468 | | | | 93,225 | |
| Series 2007-3367, Class YF, | | | | | | | | |
| 1M US L + 0.55%, | | | | | | | | |
| 09/15/2037(a) | | | 21,615 | | | | 21,995 | |
| Series 2007-3368, Class AF, | | | | | | | | |
| 1M US L + 0.72%, | | | | | | | | |
| 09/15/2037(a) | | | 80,468 | | | | 81,963 | |
| Series 2007-3378, Class FA, | | | | | | | | |
| 1M US L + 0.58%, | | | | | | | | |
| 06/15/2037(a) | | | 38,733 | | | | 39,416 | |
| Series 2007-3380, Class FM, | | | | | | | | |
| 1M US L + 0.59%, | | | | | | | | |
| 10/15/2037(a) | | | 27,133 | | | | 27,609 | |
| Series 2007-3382, Class FG, | | | | | | | | |
| 1M US L + 0.60%, | | | | | | | | |
| 11/15/2037(a) | | | 45,387 | | | | 46,155 | |
| Series 2007-3382, Class FL, | | | | | | | | |
| 1M US L + 0.70%, | | | | | | | | |
| 11/15/2037(a) | | | 100,846 | | | | 100,318 | |
| Series 2007-3387, Class PF, | | | | | | | | |
| 1M US L + 0.42%, | | | | | | | | |
| 11/15/2037(a) | | | 34,812 | | | | 35,213 | |
| Series 2007-3388, Class FJ, | | | | | | | | |
| 1M US L + 0.70%, | | | | | | | | |
| 11/15/2037(a) | | | 137,399 | | | | 140,174 | |
| Series 2008-3404, Class DC, | | | | | | | | |
| 5.500%, 01/15/2038 | | | 122,000 | | | | 143,903 | |
| Series 2008-3405, Class PE, | | | | | | | | |
| 5.000%, 01/15/2038 | | | 62,559 | | | | 68,950 | |
| Series 2008-3409, Class DB, | | | | | | | | |
| 6.000%, 01/15/2038 | | | 194,319 | | | | 225,720 | |
| Series 2008-3411, Class FL, | | | | | | | | |
| 1M US L + 0.70%, | | | | | | | | |
| 02/15/2038(a) | | | 26,811 | | | | 27,490 | |
| | | Principal Amount | | | Value (Note 2) | |
| Series 2008-3415, Class DF, | | | | | | | | |
| 1M US L + 0.70%, | | | | | | | | |
| 08/15/2035(a) | | $ | 119,521 | | | $ | 121,940 | |
| Series 2008-3415, Class PC, | | | | | | | | |
| 5.000%, 12/15/2037 | | | 42,423 | | | | 47,259 | |
| Series 2008-3415, Class TF, | | | | | | | | |
| 1M US L + 0.74%, | | | | | | | | |
| 08/15/2035(a) | | | 59,198 | | | | 60,521 | |
| Series 2008-3450, Class PE, | | | | | | | | |
| 5.000%, 05/15/2038 | | | 99,011 | | | | 107,576 | |
| Series 2008-3469, Class CF, | | | | | | | | |
| 1M US L + 0.79%, | | | | | | | | |
| 07/15/2038(a) | | | 102,946 | | | | 102,947 | |
| Series 2009-3536, Class FM, | | | | | | | | |
| 1M US L + 1.00%, | | | | | | | | |
| 05/15/2039(a) | | | 28,831 | | | | 29,698 | |
| Series 2009-3539, Class B, | | | | | | | | |
| 4.500%, 06/15/2029 | | | 44,000 | | | | 49,069 | |
| Series 2009-3545, Class FA, | | | | | | | | |
| 1M US L + 0.85%, | | | | | | | | |
| 06/15/2039(a) | | | 94,182 | | | | 96,524 | |
| Series 2009-3548, Class ZE, | | | | | | | | |
| 5.500%, 12/15/2032 | | | 218,689 | | | | 249,246 | |
| Series 2009-3549, Class FA, | | | | | | | | |
| 1M US L + 1.20%, | | | | | | | | |
| 07/15/2039(a) | | | 42,361 | | | | 43,248 | |
| Series 2009-3564, Class NB, | | | | | | | | |
| 5.000%, 08/15/2039 | | | 349,000 | | | | 396,234 | |
| Series 2009-3574, Class D, | | | | | | | | |
| 5.000%, 09/15/2039 | | | 99,602 | | | | 111,672 | |
| Series 2009-3584, Class FA, | | | | | | | | |
| 1M US L + 0.70%, | | | | | | | | |
| 12/15/2036(a) | | | 33,963 | | | | 34,621 | |
| Series 2009-3587, Class DA, | | | | | | | | |
| 4.500%, 10/15/2039 | | | 170,616 | | | | 183,965 | |
| Series 2009-3604, Class PO, | | | | | | | | |
| –%, 05/15/2036(b) | | | 85,721 | | | | 77,138 | |
| Series 2009-3605, Class BF, | | | | | | | | |
| 1M US L + 0.86%, | | | | | | | | |
| 11/15/2039(a) | | | 166,661 | | | | 171,062 | |
| Series 2009-3611, Class FH, | | | | | | | | |
| 1M US L + 0.75%, | | | | | | | | |
| 07/15/2034(a) | | | 15,501 | | | | 15,838 | |
| Series 2010-3620, Class EL, | | | | | | | | |
| 4.000%, 01/15/2030 | | | 31,705 | | | | 34,052 | |
| Series 2010-3626, Class ME, | | | | | | | | |
| 5.000%, 01/15/2040 | | | 402,954 | | | | 450,871 | |
| Series 2010-3631, Class PA, | | | | | | | | |
| 4.000%, 02/15/2040 | | | 163,105 | | | | 178,406 | |
| Series 2010-3653, Class B, | | | | | | | | |
| 4.500%, 04/15/2030 | | | 91,618 | | | | 99,469 | |
| Series 2010-3662, Class PJ, | | | | | | | | |
| 5.000%, 04/15/2040 | | | 100,300 | | | | 112,331 | |
| Series 2010-3664, Class DA, | | | | | | | | |
| 4.000%, 11/15/2037 | | | 124,114 | | | | 129,982 | |
See Notes to Financial Statements.
ALPS | Smith Total Return Bond Fund
| Statement of Investments | October 31, 2021 |
| | | Principal Amount | | | Value (Note 2) | |
| Series 2010-3704, Class DC, | | | | | | | | |
| 4.000%, 11/15/2036 | | $ | 122,437 | | | $ | 125,902 | |
| Series 2010-3737, Class GB, | | | | | | | | |
| 4.500%, 04/15/2039 | | | 33,701 | | | | 34,304 | |
| Series 2010-3747, Class CY, | | | | | | | | |
| 4.500%, 10/15/2040 | | | 400,000 | | | | 445,805 | |
| Series 2010-3753, Class PA, | | | | | | | | |
| 3.500%, 09/15/2039 | | | 78,229 | | | | 79,109 | |
| Series 2010-3762, Class WP, | | | | | | | | |
| 4.000%, 12/15/2039 | | | 24,066 | | | | 25,022 | |
| Series 2010-3770, Class GA, | | | | | | | | |
| 4.500%, 10/15/2040 | | | 351,576 | | | | 398,657 | |
| Series 2010-3770, Class JZ, | | | | | | | | |
| 4.000%, 12/15/2040 | | | 10,758,129 | | | | 11,694,795 | |
| Series 2011-3792, Class DF, | | | | | | | | |
| 1M US L + 0.40%, | | | | | | | | |
| 11/15/2040(a) | | | 24,709 | | | | 24,611 | |
| Series 2011-3798, Class PJ, | | | | | | | | |
| 4.000%, 01/15/2041 | | | 76,939 | | | | 84,288 | |
| Series 2011-3800, Class AF, | | | | | | | | |
| 1M US L + 0.50%, | | | | | | | | |
| 02/15/2041(a) | | | 25,612 | | | | 26,005 | |
| Series 2011-3819, Class ZQ, | | | | | | | | |
| 6.000%, 04/15/2036 | | | 20,818 | | | | 24,292 | |
| Series 2011-3822, Class FY, | | | | | | | | |
| 1M US L + 0.40%, | | | | | | | | |
| 02/15/2033(a) | | | 18,839 | | | | 19,012 | |
| Series 2011-3825, Class BP, | | | | | | | | |
| 4.000%, 03/15/2041 | | | 126,187 | | | | 133,709 | |
| Series 2011-3830, Class NB, | | | | | | | | |
| 4.500%, 02/15/2039 | | | 77,669 | | | | 80,192 | |
| Series 2011-3843, Class FE, | | | | | | | | |
| 1M US L + 0.55%, | | | | | | | | |
| 04/15/2041(a) | | | 56,908 | | | | 57,935 | |
| Series 2011-3843, Class PZ, | | | | | | | | |
| 5.000%, 04/15/2041 | | | 641,674 | | | | 737,944 | |
| Series 2011-3852, Class QN, | | | | | | | | |
| 27.21053% - 1M US L, | | | | | | | | |
| 05/15/2041(a) | | | 62,748 | | | | 67,936 | |
| Series 2011-3852, Class TP, | | | | | | | | |
| 27.50% - 1M US L, | | | | | | | | |
| 05/15/2041(a) | | | 33,777 | | | | 36,726 | |
| Series 2011-3857, Class ZP, | | | | | | | | |
| 5.000%, 05/15/2041 | | | 938,240 | | | | 1,100,638 | |
| Series 2011-3862, Class MA, | | | | | | | | |
| 5.000%, 04/15/2041 | | | 141,033 | | | | 154,240 | |
| Series 2011-3891, Class BF, | | | | | | | | |
| 1M US L + 0.55%, | | | | | | | | |
| 07/15/2041(a) | | | 53,776 | | | | 54,628 | |
| Series 2011-3894, Class ZA, | | | | | | | | |
| 4.500%, 07/15/2041 | | | 86,192 | | | | 95,929 | |
| Series 2011-3905, Class BZ, | | | | | | | | |
| 3.000%, 08/15/2041 | | | 162,733 | | | | 169,212 | |
| Series 2011-3910, Class JG, | | | | | | | | |
| 2.750%, 12/15/2037 | | | 298 | | | | 297 | |
| | | Principal Amount | | | Value (Note 2) | |
| Series 2011-3919, Class DL, | | | | | | | | |
| 4.000%, 08/15/2030 | | $ | 298,000 | | | $ | 333,125 | |
| Series 2011-3923, Class GK, | | | | | | | | |
| 3.000%, 05/15/2040 | | | 75,754 | | | | 76,288 | |
| Series 2011-3935, Class JZ, | | | | | | | | |
| 4.500%, 10/15/2041 | | | 1,001,308 | | | | 1,139,923 | |
| Series 2011-3939, Class AZ, | | | | | | | | |
| 4.000%, 03/15/2041 | | | 213,379 | | | | 223,847 | |
| Series 2011-3939, Class BZ, | | | | | | | | |
| 4.500%, 06/15/2041 | | | 1,042,134 | | | | 1,098,586 | |
| Series 2011-3951, Class JB, | | | | | | | | |
| 4.000%, 08/15/2041 | | | 6,760 | | | | 6,796 | |
| Series 2011-3957, Class HZ, | | | | | | | | |
| 4.000%, 11/15/2041 | | | 876,582 | | | | 903,578 | |
| Series 2011-3958, Class PJ, | | | | | | | | |
| 4.500%, 09/15/2041 | | | 201,517 | | | | 208,048 | |
| Series 2011-3959, Class MB, | | | | | | | | |
| 4.500%, 11/15/2041 | | | 44,199 | | | | 52,366 | |
| Series 2011-3963, Class JB, | | | | | | | | |
| 4.500%, 11/15/2041 | | | 129,644 | | | | 142,969 | |
| Series 2011-3969, Class JP, | | | | | | | | |
| 4.500%, 09/15/2041 | | | 57,939 | | | | 61,054 | |
| Series 2012-3984, Class DF, | | | | | | | | |
| 1M US L + 0.55%, | | | | | | | | |
| 01/15/2042(a) | | | 48,764 | | | | 49,511 | |
| Series 2012-3989, Class JW, | | | | | | | | |
| 3.500%, 01/15/2042 | | | 255,000 | | | | 271,989 | |
| Series 2012-3997, Class EC, | | | | | | | | |
| 3.500%, 02/15/2042 | | | 105,972 | | | | 112,665 | |
| Series 2012-3997, Class FQ, | | | | | | | | |
| 1M US L + 0.50%, | | | | | | | | |
| 02/15/2042(a) | | | 54,347 | | | | 54,919 | |
| Series 2012-3998, Class KG, | | | | | | | | |
| 2.000%, 11/15/2026 | | | 115,728 | | | | 117,905 | |
| Series 2012-4001, Class FM, | | | | | | | | |
| 1M US L + 0.50%, | | | | | | | | |
| 02/15/2042(a) | | | 35,554 | | | | 35,961 | |
| Series 2012-4011, Class DB, | | | | | | | | |
| 4.000%, 09/15/2041 | | | 232,113 | | | | 250,377 | |
| Series 2012-4012, Class GC, | | | | | | | | |
| 3.500%, 06/15/2040 | | | 59,968 | | | | 62,093 | |
| Series 2012-4012, Class NF, | | | | | | | | |
| 1M US L + 0.45%, | | | | | | | | |
| 12/15/2038(a) | | | 4,249 | | | | 4,252 | |
| Series 2012-4020, Class PG, | | | | | | | | |
| 2.500%, 03/15/2027 | | | 14,129 | | | | 14,599 | |
| Series 2012-4037, Class CA, | | | | | | | | |
| 3.000%, 04/15/2027 | | | 48,112 | | | | 51,132 | |
| Series 2012-4039, Class LT, | | | | | | | | |
| 3.500%, 05/15/2042 | | | 113,000 | | | | 119,882 | |
| Series 2012-4050, Class ND, | | | | | | | | |
| 2.500%, 09/15/2041 | | | 40,682 | | | | 41,252 | |
| Series 2012-4062, Class MZ, | | | | | | | | |
| 3.500%, 06/15/2042 | | | 137,487 | | | | 144,512 | |
See Notes to Financial Statements.
ALPS | Smith Total Return Bond Fund
| Statement of Investments | October 31, 2021 |
| | | Principal Amount | | | Value (Note 2) | |
| Series 2012-4064, Class AY, | | | | | | | | |
| 3.000%, 06/15/2027 | | $ | 48,000 | | | $ | 50,829 | |
| Series 2012-4068, Class PE, | | | | | | | | |
| 3.000%, 06/15/2042 | | | 224,000 | | | | 234,518 | |
| Series 2012-4075, Class PB, | | | | | | | | |
| 3.000%, 07/15/2042 | | | 42,000 | | | | 44,939 | |
| Series 2012-4076, Class MV, | | | | | | | | |
| 3.000%, 04/15/2031 | | | 69,000 | | | | 71,722 | |
| Series 2012-4077, Class MA, | | | | | | | | |
| 2.000%, 08/15/2040 | | | 253,652 | | | | 256,817 | |
| Series 2012-4088, Class PB, | | | | | | | | |
| 3.000%, 08/15/2042 | | | 110,279 | | | | 113,511 | |
| Series 2012-4094, Class CW, | | | | | | | | |
| 2.000%, 08/15/2042 | | | 331,040 | | | | 335,790 | |
| Series 2012-4097, Class CU, | | | | | | | | |
| 1.500%, 08/15/2027 | | | 25,000 | | | | 24,853 | |
| Series 2012-4097, Class UF, | | | | | | | | |
| 1M US L + 0.35%, | | | | | | | | |
| 08/15/2032(a) | | | 72,465 | | | | 72,287 | |
| Series 2012-4101, Class QN, | | | | | | | | |
| 3.500%, 09/15/2042 | | | 277,227 | | | | 295,287 | |
| Series 2012-4104, Class AJ, | | | | | | | | |
| 1.500%, 09/15/2027 | | | 34,239 | | | | 34,762 | |
| Series 2012-4120, Class TC, | | | | | | | | |
| 1.500%, 10/15/2027 | | | 12,918 | | | | 13,025 | |
| Series 2012-4122, Class BA, | | | | | | | | |
| 3.054%, 05/15/2040(c) | | | 205,916 | | | | 217,251 | |
| Series 2012-4133, Class TA, | | | | | | | | |
| 3.000%, 11/15/2042 | | | 385,392 | | | | 359,358 | |
| Series 2012-4141, Class PL, | | | | | | | | |
| 2.500%, 12/15/2042 | | | 100,000 | | | | 100,279 | |
| Series 2013-4160, Class HB, | | | | | | | | |
| 2.500%, 12/15/2032 | | | 20,379 | | | | 20,477 | |
| Series 2013-4170, Class FW, | | | | | | | | |
| 1M US L + 0.95%, | | | | | | | | |
| 01/15/2033(a) | | | 29,100 | | | | 29,448 | |
| Series 2013-4176, Class YD, | | | | | | | | |
| 3.000%, 03/15/2043 | | | 50,000 | | | | 52,467 | |
| Series 2013-4183, Class ME, | | | | | | | | |
| 2.000%, 02/15/2042 | | | 177,336 | | | | 180,953 | |
| Series 2013-4185, Class PB, | | | | | | | | |
| 3.000%, 03/15/2043 | | | 450,000 | | | | 457,484 | |
| Series 2013-4203, Class DJ, | | | | | | | | |
| 2.500%, 04/15/2033 | | | 70,358 | | | | 72,827 | |
| Series 2013-4218, Class DG, | | | | | | | | |
| 2.500%, 07/15/2042 | | | 179,466 | | | | 184,377 | |
| Series 2013-4220, Class EH, | | | | | | | | |
| 2.500%, 06/15/2028 | | | 54,979 | | | | 56,673 | |
| Series 2013-4231, Class FD, | | | | | | | | |
| 1M US L + 0.35%, | | | | | | | | |
| 10/15/2032(a) | | | 19,470 | | | | 19,241 | |
| Series 2013-4246, Class PB, | | | | | | | | |
| 4.000%, 09/15/2043 | | | 493,003 | | | | 544,379 | |
| Series 2013-4257, Class A, | | | | | | | | |
| 2.500%, 10/15/2027 | | | 39,432 | | | | 40,249 | |
| | | Principal Amount | | | Value (Note 2) | |
| Series 2013-4259, Class MG, | | | | | | | | |
| 3.000%, 08/15/2041 | | $ | 11,475 | | | $ | 11,535 | |
| Series 2013-4265, Class FD, | | | | | | | | |
| 1M US L + 0.40%, | | | | | | | | |
| 01/15/2035(a) | | | 77,495 | | | | 78,139 | |
| Series 2014-4293, Class NM, | | | | | | | | |
| 4.500%, 06/15/2043 | | | 41,403 | | | | 44,176 | |
| Series 2014-4294, Class PF, | | | | | | | | |
| 1M US L + 0.40%, | | | | | | | | |
| 01/15/2044(a) | | | 17,865 | | | | 18,011 | |
| Series 2014-4301, Class U, | | | | | | | | |
| 3.500%, 07/15/2032 | | | 57,928 | | | | 59,270 | |
| Series 2014-4319, Class PM, | | | | | | | | |
| 3.000%, 03/15/2043 | | | 120,138 | | | | 123,512 | |
| Series 2014-4320, Class AP, | | | | | | | | |
| 3.500%, 07/15/2039 | | | 155,055 | | | | 164,165 | |
| Series 2014-4324, Class AY, | | | | | | | | |
| 3.000%, 04/15/2029 | | | 568,738 | | | | 599,852 | |
| Series 2014-4333, Class PB, | | | | | | | | |
| 2.500%, 10/15/2043 | | | 32,130 | | | | 32,312 | |
| Series 2014-4337, Class VJ, | | | | | | | | |
| 3.500%, 06/15/2027 | | | 29,148 | | | | 30,170 | |
| Series 2014-4370, Class PC, | | | | | | | | |
| 2.500%, 09/15/2041 | | | 52,226 | | | | 52,958 | |
| Series 2015-4459, Class CA, | | | | | | | | |
| 5.000%, 12/15/2034 | | | 31,677 | | | | 34,646 | |
| Series 2015-4461, Class EA, | | | | | | | | |
| 2.000%, 07/15/2037 | | | 128,275 | | | | 130,562 | |
| Series 2015-4470, Class AQ, | | | | | | | | |
| 3.000%, 06/15/2041 | | | 103,348 | | | | 103,929 | |
| Series 2015-4498, Class JA, | | | | | | | | |
| 2.500%, 04/15/2037 | | | 164,880 | | | | 166,008 | |
| Series 2015-4531, Class PA, | | | | | | | | |
| 3.500%, 05/15/2043 | | | 75,959 | | | | 77,763 | |
| Series 2016-4554, Class MD, | | | | | | | | |
| 3.000%, 10/15/2044 | | | 40,133 | | | | 40,860 | |
| Series 2016-4555, Class CP, | | | | | | | | |
| 3.000%, 04/15/2045 | | | 760,828 | | | | 783,904 | |
| Series 2016-4564, Class QA, | | | | | | | | |
| 3.000%, 07/15/2029 | | | 71,325 | | | | 73,476 | |
| Series 2016-4590, Class AK, | | | | | | | | |
| 3.500%, 08/15/2027 | | | 110,569 | | | | 115,123 | |
| Series 2016-4619, Class BE, | | | | | | | | |
| 2.500%, 12/15/2047 | | | 217,251 | | | | 220,931 | |
| Series 2016-4630, Class EA, | | | | | | | | |
| 3.000%, 09/15/2041 | | | 147,550 | | | | 149,180 | |
| Series 2016-4639, Class HZ, | | | | | | | | |
| 3.250%, 04/15/2053(d) | | | 654,453 | | | | 709,208 | |
| Series 2017-4664, Class UE, | | | | | | | | |
| 3.000%, 05/15/2043 | | | 232,872 | | | | 237,433 | |
| Series 2017-4672, Class QD, | | | | | | | | |
| 3.000%, 08/15/2045 | | | 117,890 | | | | 119,711 | |
| Series 2017-4705, Class A, | | | | | | | | |
| 4.500%, 09/15/2042 | | | 39,941 | | | | 40,373 | |
See Notes to Financial Statements.
ALPS | Smith Total Return Bond Fund
| Statement of Investments | October 31, 2021 |
| | | Principal Amount | | | Value (Note 2) | |
| Series 2017-4710, Class PA, | | | | | | | | |
| 3.000%, 04/15/2045 | | $ | 213,989 | | | $ | 219,689 | |
| Series 2017-4748, Class GA, | | | | | | | | |
| 3.000%, 01/15/2045 | | | 133,793 | | | | 136,688 | |
| Series 2018-4767, Class CA, | | | | | | | | |
| 4.000%, 11/15/2045 | | | 66,591 | | | | 67,682 | |
| Series 2018-4767, Class Z, | | | | | | | | |
| 3.000%, 12/15/2047 | | | 34,600 | | | | 33,951 | |
| Series 2018-4787, Class PY, | | | | | | | | |
| 4.000%, 05/15/2048 | | | 72,102 | | | | 76,204 | |
| Series 2018-4795, Class JA, | | | | | | | | |
| 5.000%, 11/15/2045 | | | 28,114 | | | | 28,131 | |
| Series 2018-4800, Class JA, | | | | | | | | |
| 3.500%, 03/15/2047 | | | 191,839 | | | | 193,946 | |
| Series 2018-4821, Class VA, | | | | | | | | |
| 4.000%, 10/15/2029 | | | 113,969 | | | | 118,350 | |
| Series 2018-4839, Class AE, | | | | | | | | |
| 4.000%, 04/15/2051 | | | 356,501 | | | | 384,544 | |
| Series 2018-4840, Class BK, | | | | | | | | |
| 4.500%, 09/15/2046 | | | 66,041 | | | | 67,232 | |
| Series 2018-4843, Class PH, | | | | | | | | |
| 4.000%, 07/15/2046 | | | 455,057 | | | | 455,978 | |
| Series 2018-4846, Class PA, | | | | | | | | |
| 4.000%, 06/15/2047 | | | 22,740 | | | | 23,368 | |
| Series 2018-4857, Class HM, | | | | | | | | |
| 3.500%, 11/15/2046 | | | 331,617 | | | | 338,915 | |
| Series 2019-4863, Class AJ, | | | | | | | | |
| 3.500%, 07/15/2038 | | | 69,183 | | | | 74,530 | |
| Series 2019-4927, Class GA, | | | | | | | | |
| 3.000%, 12/25/2043 | | | 39,614 | | | | 39,611 | |
| Series 2020-4949, Class EA, | | | | | | | | |
| 3.000%, 08/25/2035 | | | 260,551 | | | | 261,713 | |
| Series 2020-5049, Class JZ, | | | | | | | | |
| 2.000%, 11/25/2050 | | | 399,673 | | | | 323,006 | |
| Series 2021-5092, Class BC, | | | | | | | | |
| 2.500%, 06/25/2036 | | | 87,216 | | | | 88,662 | |
| Series 2021-5118, Class DZ, | | | | | | | | |
| 1.000%, 04/25/2051 | | | 907,986 | | | | 907,402 | |
| Series 3588, Class CW, | | | | | | | | |
| 2.540%, 10/25/2037(a) | | | 448,095 | | | | 452,259 | |
| | | | | | | | 47,750,071 | |
| Freddie Mac Whole Loan | | | | | | | | |
| Securities Trust 2017-SC02 | | | | | | | | |
| Series 2017-SC02, Class 1A1, | | | | | | | | |
| 3.000%, 05/25/2047 | | | 13,123 | | | | 13,122 | |
| | | | | | | | | |
| Ginnie Mae | | | | | | | | |
| Series 2002-72, Class FB, | | | | | | | | |
| 1M US L + 0.40%, | | | | | | | | |
| 10/20/2032(a) | | | 37,571 | | | | 37,558 | |
| Series 2003-25, Class FC, | | | | | | | | |
| 1M US L + 0.40%, | | | | | | | | |
| 08/26/2023(a) | | | 79,917 | | | | 80,043 | |
| | | Principal Amount | | | Value (Note 2) | |
| Series 2003-98, Class FY, | | | | | | | | |
| 1M US L + 0.35%, | | | | | | | | |
| 09/20/2033(a) | | $ | 52,131 | | | $ | 52,245 | |
| Series 2004-1, Class TE, | | | | | | | | |
| 5.000%, 06/20/2033 | | | 32,804 | | | | 35,414 | |
| Series 2004-15, Class AY, | | | | | | | | |
| 5.500%, 02/20/2034 | | | 117,940 | | | | 129,851 | |
| Series 2004-26, Class ED, | | | | | | | | |
| 5.500%, 04/16/2034 | | | 92,977 | | | | 103,406 | |
| Series 2004-34, Class QL, | | | | | | | | |
| 5.500%, 05/16/2034 | | | 89,000 | | | | 101,557 | |
| Series 2004-55, Class MC, | | | | | | | | |
| 5.500%, 07/20/2034 | | | 41,882 | | | | 46,812 | |
| Series 2004-7, Class Z, | | | | | | | | |
| 5.500%, 01/16/2034 | | | 1,324,285 | | | | 1,502,902 | |
| Series 2004-87, Class BC, | | | | | | | | |
| 4.500%, 10/20/2034 | | | 19,059 | | | | 20,341 | |
| Series 2005-11, Class PL, | | | | | | | | |
| 5.000%, 02/20/2035 | | | 43,653 | | | | 48,612 | |
| Series 2005-13, Class NB, | | | | | | | | |
| 5.000%, 02/20/2035 | | | 16,205 | | | | 18,001 | |
| Series 2005-13, Class BG, | | | | | | | | |
| 5.000%, 02/20/2035 | | | 213,272 | | | | 237,095 | |
| Series 2005-3, Class OC, | | | | | | | | |
| 5.000%, 01/20/2035 | | | 234,827 | | | | 258,450 | |
| Series 2005-3, Class QB, | | | | | | | | |
| 5.000%, 01/16/2035 | | | 111,611 | | | | 122,133 | |
| Series 2005-3, Class JL, | | | | | | | | |
| 5.000%, 12/16/2034 | | | 100,000 | | | | 109,683 | |
| Series 2005-3, Class JM, | | | | | | | | |
| 4.750%, 01/20/2035 | | | 77,461 | | | | 84,594 | |
| Series 2005-45, Class BF, | | | | | | | | |
| 1M US L + 0.30%, | | | | | | | | |
| 06/20/2035(a) | | | 47,820 | | | | 47,934 | |
| Series 2005-49, Class B, | | | | | | | | |
| 5.500%, 06/20/2035 | | | 110,642 | | | | 124,439 | |
| Series 2005-51, Class DC, | | | | | | | | |
| 5.000%, 07/20/2035 | | | 159,849 | | | | 175,504 | |
| Series 2005-56, Class BD, | | | | | | | | |
| 5.000%, 07/20/2035 | | | 58,124 | | | | 64,832 | |
| Series 2005-56, Class JA, | | | | | | | | |
| 5.000%, 05/17/2035 | | | 18,017 | | | | 19,702 | |
| Series 2005-69, Class WD, | | | | | | | | |
| 5.000%, 05/18/2035 | | | 61,336 | | | | 67,082 | |
| Series 2005-73, Class PH, | | | | | | | | |
| 5.000%, 09/20/2035 | | | 157,853 | | | | 170,215 | |
| Series 2005-92, Class PB, | | | | | | | | |
| 6.000%, 12/20/2035 | | | 52,949 | | | | 60,419 | |
| Series 2006-10, Class PB, | | | | | | | | |
| 5.500%, 03/20/2036 | | | 58,588 | | | | 66,165 | |
| Series 2006-38, Class OH, | | | | | | | | |
| 6.500%, 08/20/2036 | | | 28,000 | | | | 32,153 | |
| Series 2007-18, Class PH, | | | | | | | | |
| 5.500%, 03/20/2035 | | | 137,000 | | | | 159,496 | |
See Notes to Financial Statements.
ALPS | Smith Total Return Bond Fund
| Statement of Investments | October 31, 2021 |
| | | Principal Amount | | | Value (Note 2) | |
| Series 2007-18, Class B, | | | | | | | | |
| 5.500%, 05/20/2035 | | $ | 108,588 | | | $ | 120,408 | |
| Series 2007-35, Class TE, | | | | | | | | |
| 6.000%, 06/20/2037 | | | 140,570 | | | | 158,871 | |
| Series 2007-35, Class NE, | | | | | | | | |
| 6.000%, 06/16/2037 | | | 65,190 | | | | 74,051 | |
| Series 2007-40, Class FY, | | | | | | | | |
| 1M US L + 0.33%, | | | | | | | | |
| 07/16/2037(a) | | | 48,914 | | | | 48,513 | |
| Series 2007-44, Class PH, | | | | | | | | |
| 6.000%, 07/20/2037 | | | 115,699 | | | | 133,170 | |
| Series 2007-57, Class Z, | | | | | | | | |
| 5.500%, 10/20/2037 | | | 560,552 | | | | 671,825 | |
| Series 2007-6, Class LE, | | | | | | | | |
| 5.500%, 02/20/2037 | | | 84,435 | | | | 93,423 | |
| Series 2007-7, Class PG, | | | | | | | | |
| 5.000%, 02/16/2037 | | | 35,874 | | | | 39,884 | |
| Series 2007-79, Class FC, | | | | | | | | |
| 1M US L + 0.44%, | | | | | | | | |
| 12/20/2037(a) | | | 159,131 | | | | 160,151 | |
| Series 2008-13, Class FB, | | | | | | | | |
| 1M US L + 0.50%, | | | | | | | | |
| 02/20/2038(a) | | | 32,472 | | | | 32,815 | |
| Series 2008-20, Class CE, | | | | | | | | |
| 5.500%, 06/16/2037 | | | 94,111 | | | | 104,325 | |
| Series 2008-31, Class PC, | | | | | | | | |
| 5.500%, 04/20/2038 | | | 68,552 | | | | 76,146 | |
| Series 2008-33, Class PB, | | | | | | | | |
| 5.500%, 04/20/2038 | | | 81,247 | | | | 90,576 | |
| Series 2008-37, Class L, | | | | | | | | |
| 6.000%, 04/20/2038 | | | 50,237 | | | | 55,919 | |
| Series 2008-38, Class PL, | | | | | | | | |
| 5.500%, 05/20/2038 | | | 75,373 | | | | 84,316 | |
| Series 2008-38, Class PN, | | | | | | | | |
| 5.500%, 05/20/2038 | | | 53,717 | | | | 60,003 | |
| Series 2008-38, Class BG, | | | | | | | | |
| 5.000%, 05/16/2038 | | | 83,603 | | | | 92,104 | |
| Series 2008-40, Class PL, | | | | | | | | |
| 5.250%, 05/16/2038 | | | 100,000 | | | | 120,391 | |
| Series 2008-41, Class PE, | | | | | | | | |
| 5.500%, 05/20/2038 | | | 90,918 | | | | 101,878 | |
| Series 2008-47, Class ML, | | | | | | | | |
| 5.250%, 06/16/2038 | | | 36,908 | | | | 41,552 | |
| Series 2008-49, Class PB, | | | | | | | | |
| 4.750%, 06/20/2038 | | | 36,545 | | | | 39,594 | |
| Series 2008-50, Class KB, | | | | | | | | |
| 6.000%, 06/20/2038 | | | 242,619 | | | | 275,905 | |
| Series 2008-51, Class PH, | | | | | | | | |
| 5.250%, 06/20/2038 | | | 58,970 | | | | 64,777 | |
| Series 2008-51, Class FG, | | | | | | | | |
| 1M US L + 0.77%, | | | | | | | | |
| 06/16/2038(a) | | | 79,296 | | | | 80,666 | |
| Series 2008-55, Class PL, | | | | | | | | |
| 5.500%, 06/20/2038 | | | 40,641 | | | | 45,500 | |
| | | Principal Amount | | | Value (Note 2) | |
| Series 2008-58, Class PE, | | | | | | | | |
| 5.500%, 07/16/2038 | | $ | 114,337 | | | $ | 128,406 | |
| Series 2008-60, Class JN, | | | | | | | | |
| 5.500%, 07/20/2038 | | | 151,522 | | | | 167,173 | |
| Series 2008-60, Class JP, | | | | | | | | |
| 5.500%, 07/20/2038 | | | 78,000 | | | | 87,988 | |
| Series 2008-65, Class PG, | | | | | | | | |
| 6.000%, 08/20/2038 | | | 203,313 | | | | 228,028 | |
| Series 2008-66, Class FN, | | | | | | | | |
| 1M US L + 0.95%, | | | | | | | | |
| 08/20/2038(a) | | | 63,709 | | | | 64,734 | |
| Series 2008-7, Class PQ, | | | | | | | | |
| 5.000%, 02/20/2038 | | | 101,162 | | | | 108,940 | |
| Series 2008-76, Class QE, | | | | | | | | |
| 5.750%, 09/20/2038 | | | 58,000 | | | | 67,069 | |
| Series 2008-77, Class FC, | | | | | | | | |
| 1M US L + 0.70%, | | | | | | | | |
| 09/20/2038(a) | | | 65,361 | | | | 66,045 | |
| Series 2008-85, Class PG, | | | | | | | | |
| 5.250%, 10/20/2038 | | | 43,945 | | | | 44,036 | |
| Series 2008-89, Class JC, | | | | | | | | |
| 5.500%, 08/20/2038 | | | 55,294 | | | | 59,621 | |
| Series 2008-89, Class JD, | | | | | | | | |
| 6.000%, 08/20/2038 | | | 21,692 | | | | 23,595 | |
| Series 2008-9, Class FA, | | | | | | | | |
| 1M US L + 0.50%, | | | | | | | | |
| 02/20/2038(a) | | | 22,450 | | | | 22,643 | |
| Series 2009-1, Class FA, | | | | | | | | |
| 1M US L + 1.05%, | | | | | | | | |
| 01/20/2039(a) | | | 93,437 | | | | 95,303 | |
| Series 2009-10, Class PH, | | | | | | | | |
| 4.500%, 02/20/2039 | | | 30,000 | | | | 33,504 | |
| Series 2009-10, Class NB, | | | | | | | | |
| 5.000%, 02/16/2039 | | | 99,802 | | | | 112,030 | |
| Series 2009-118, Class PY, | | | | | | | | |
| 5.000%, 12/16/2039 | | | 29,044 | | | | 32,596 | |
| Series 2009-12, Class NB, | | | | | | | | |
| 5.000%, 03/20/2039 | | | 74,432 | | | | 80,996 | |
| Series 2009-13, Class E, | | | | | | | | |
| 4.500%, 03/16/2039 | | | 123,037 | | | | 134,579 | |
| Series 2009-15, Class FM, | | | | | | | | |
| 1M US L + 1.04%, | | | | | | | | |
| 03/20/2039(a) | | | 76,314 | | | | 77,531 | |
| Series 2009-24, Class WB, | | | | | | | | |
| 5.000%, 03/20/2039 | | | 140,594 | | | | 152,944 | |
| Series 2009-40, Class AD, | | | | | | | | |
| 4.500%, 06/20/2039 | | | 309,000 | | | | 351,565 | |
| Series 2009-47, Class LT, | | | | | | | | |
| 5.000%, 06/20/2039 | | | 137,686 | | | | 152,499 | |
| Series 2009-55, Class FN, | | | | | | | | |
| 1M US L + 1.00%, | | | | | | | | |
| 07/20/2039(a) | | | 31,748 | | | | 32,308 | |
| Series 2009-58, Class PA, | | | | | | | | |
| 4.500%, 07/20/2039 | | | 113,683 | | | | 123,675 | |
See Notes to Financial Statements.
ALPS | Smith Total Return Bond Fund
| Statement of Investments | October 31, 2021 |
| | | Principal Amount | | | Value (Note 2) | |
| Series 2009-61, Class MP, | | | | | | | | |
| 5.000%, 08/20/2039 | | $ | 50,131 | | | $ | 54,788 | |
| Series 2009-61, Class AP, | | | | | | | | |
| 4.000%, 08/20/2039 | | | 55,084 | | | | 58,732 | |
| Series 2009-65, Class QM, | | | | | | | | |
| 3.500%, 12/20/2038 | | | 10,339 | | | | 10,471 | |
| Series 2009-69, Class PH, | | | | | | | | |
| 5.500%, 08/16/2039 | | | 92,000 | | | | 108,608 | |
| Series 2009-75, Class GZ, | | | | | | | | |
| 4.500%, 09/20/2039 | | | 130,466 | | | | 141,430 | |
| Series 2009-76, Class JB, | | | | | | | | |
| 4.500%, 07/20/2039 | | | 37,307 | | | | 38,548 | |
| Series 2009-83, Class TF, | | | | | | | | |
| 1M US L + 0.90%, | | | | | | | | |
| 08/20/2039(a) | | | 38,224 | | | | 38,914 | |
| Series 2009-94, Class FA, | | | | | | | | |
| 1M US L + 0.70%, | | | | | | | | |
| 10/16/2039(a) | | | 95,126 | | | | 96,788 | |
| Series 2010-111, Class FA, | | | | | | | | |
| 1M US L + 0.35%, | | | | | | | | |
| 09/20/2040(a) | | | 60,452 | | | | 60,743 | |
| Series 2010-116, Class GY, | | | | | | | | |
| 3.500%, 12/20/2039 | | | 114,745 | | | | 116,400 | |
| Series 2010-116, Class PD, | | | | | | | | |
| 4.000%, 12/20/2039 | | | 42,017 | | | | 42,464 | |
| Series 2010-14, Class A, | | | | | | | | |
| 4.500%, 06/16/2039 | | | 69,277 | | | | 71,855 | |
| Series 2010-14, Class HA, | | | | | | | | |
| 4.500%, 02/16/2040 | | | 187,316 | | | | 205,491 | |
| Series 2010-147, Class PG, | | | | | | | | |
| 3.500%, 05/20/2040 | | | 111,308 | | | | 115,742 | |
| Series 2010-157, Class OP, | | | | | | | | |
| –%, 12/20/2040(b) | | | 12,671 | | | | 11,966 | |
| Series 2010-167, Class WL, | | | | | | | | |
| 4.500%, 09/20/2040 | | | 305,000 | | | | 341,793 | |
| Series 2010-169, Class JZ, | | | | | | | | |
| 4.000%, 12/20/2040 | | | 296,843 | | | | 313,626 | |
| Series 2010-19, Class GW, | | | | | | | | |
| 4.750%, 02/20/2040 | | | 108,305 | | | | 119,196 | |
| Series 2010-25, Class BL, | | | | | | | | |
| 4.250%, 10/16/2039 | | | 38,735 | | | | 39,521 | |
| Series 2010-62, Class AF, | | | | | | | | |
| 1M US L + 0.45%, | | | | | | | | |
| 04/16/2034(a) | | | 35,321 | | | | 35,430 | |
| Series 2010-76, Class NC, | | | | | | | | |
| 4.500%, 06/20/2040 | | | 156,000 | | | | 172,219 | |
| Series 2010-84, Class YB, | | | | | | | | |
| 4.000%, 07/20/2040 | | | 21,254 | | | | 22,923 | |
| Series 2010-H01, Class FA, | | | | | | | | |
| 1M US L + 0.82%, | | | | | | | | |
| 01/20/2060(a) | | | 44,000 | | | | 44,397 | |
| Series 2010-H10, Class FC, | | | | | | | | |
| 1M US L + 1.00%, | | | | | | | | |
| 05/20/2060(a) | | | 214,334 | | | | 217,127 | |
| | | Principal Amount | | | Value (Note 2) | |
| Series 2010-H20, Class AF, | | | | | | | | |
| 1M US L + 0.33%, | | | | | | | | |
| 10/20/2060(a) | | $ | 238,195 | | | $ | 238,150 | |
| Series 2010-H22, Class FE, | | | | | | | | |
| 1M US L + 0.35%, | | | | | | | | |
| 05/20/2059(a) | | | 7,819 | | | | 7,820 | |
| Series 2010-H27, Class FA, | | | | | | | | |
| 1M US L + 0.38%, | | | | | | | | |
| 12/20/2060(a) | | | 63,349 | | | | 63,412 | |
| Series 2011-100, Class MY, | | | | | | | | |
| 4.000%, 07/20/2041 | | | 128,808 | | | | 139,712 | |
| Series 2011-128, Class MD, | | | | | | | | |
| 4.000%, 10/20/2040 | | | 140,000 | | | | 148,256 | |
| Series 2011-19, Class MG, | | | | | | | | |
| 3.000%, 06/16/2040 | | | 287 | | | | 287 | |
| Series 2011-43, Class ZQ, | | | | | | | | |
| 5.500%, 01/16/2033 | | | 84,659 | | | | 89,019 | |
| Series 2011-59, Class QC, | | | | | | | | |
| 4.000%, 12/20/2040 | | | 116,867 | | | | 123,040 | |
| Series 2011-66, Class UA, | | | | | | | | |
| 4.000%, 05/16/2041 | | | 164,549 | | | | 177,782 | |
| Series 2011-71, Class ZC, | | | | | | | | |
| 5.500%, 07/16/2034 | | | 189,986 | | | | 210,233 | |
| Series 2011-97, Class WA, | | | | | | | | |
| 6.129%, 11/20/2038(a) | | | 54,957 | | | | 63,524 | |
| Series 2011-H01, Class AF, | | | | | | | | |
| 1M US L + 0.45%, | | | | | | | | |
| 11/20/2060(a) | | | 240,628 | | | | 241,211 | |
| Series 2011-H02, Class BA, | | | | | | | | |
| 4.241%, 02/20/2061(a) | | | 9,469 | | | | 9,602 | |
| Series 2011-H11, Class FB, | | | | | | | | |
| 1M US L + 0.50%, | | | | | | | | |
| 04/20/2061(a) | | | 130,211 | | | | 130,626 | |
| Series 2011-H11, Class FA, | | | | | | | | |
| 1M US L + 0.50%, | | | | | | | | |
| 03/20/2061(a) | | | 87,115 | | | | 87,427 | |
| Series 2011-H15, Class FA, | | | | | | | | |
| 1M US L + 0.45%, | | | | | | | | |
| 06/20/2061(a) | | | 57,086 | | | | 57,227 | |
| Series 2012-32, Class PE, | | | | | | | | |
| 3.500%, 03/16/2042 | | | 89,000 | | | | 99,943 | |
| Series 2012-38, Class PL, | | | | | | | | |
| 3.250%, 01/20/2041 | | | 100,000 | | | | 102,624 | |
| Series 2012-51, Class VM, | | | | | | | | |
| 3.500%, 04/16/2025 | | | 94,482 | | | | 98,185 | |
| Series 2012-68, Class GE, | | | | | | | | |
| 3.000%, 05/20/2042 | | | 5,373 | | | | 5,545 | |
| Series 2012-76, Class GF, | | | | | | | | |
| 1M US L + 0.30%, | | | | | | | | |
| 06/16/2042(a) | | | 16,632 | | | | 16,742 | |
| Series 2012-H08, Class FC, | | | | | | | | |
| 1M US L + 0.57%, | | | | | | | | |
| 04/20/2062(a) | | | 627,843 | | | | 630,671 | |
| Series 2012-H14, Class FK, | | | | | | | | |
| 1M US L + 0.58%, | | | | | | | | |
| 07/20/2062(a) | | | 175,380 | | | | 176,175 | |
See Notes to Financial Statements.
ALPS | Smith Total Return Bond Fund
| Statement of Investments | October 31, 2021 |
| | | Principal Amount | | | Value (Note 2) | |
| Series 2012-H20, Class PT, | | | | | | | | |
| 0.899%, 07/20/2062(a) | | $ | 94,559 | | | $ | 94,432 | |
| Series 2012-H24, Class FE, | | | | | | | | |
| 1M US L + 0.60%, | | | | | | | | |
| 10/20/2062(a) | | | 3,501 | | | | 3,524 | |
| Series 2013-100, Class MA, | | | | | | | | |
| 3.500%, 02/20/2043 | | | 69,663 | | | | 72,577 | |
| Series 2013-115, Class PM, | | | | | | | | |
| 4.000%, 08/20/2043 | | | 400,000 | | | | 437,032 | |
| Series 2013-22, Class GB, | | | | | | | | |
| 2.500%, 08/20/2042 | | | 120,000 | | | | 123,710 | |
| Series 2013-69, Class NA, | | | | | | | | |
| 2.000%, 09/20/2042 | | | 182,501 | | | | 186,861 | |
| Series 2013-98, Class KF, | | | | | | | | |
| 1M US L + 0.30%, | | | | | | | | |
| 11/20/2041(a) | | | 22,176 | | | | 22,202 | |
| Series 2013-99, Class MF, | | | | | | | | |
| 1M US L + 0.30%, | | | | | | | | |
| 07/20/2043(a) | | | 88,635 | | | | 89,093 | |
| Series 2013-H01, Class FA, | | | | | | | | |
| 1.650%, 01/20/2063 | | | 1,703 | | | | 1,720 | |
| Series 2013-H04, Class BA, | | | | | | | | |
| 1.650%, 02/20/2063 | | | 7,487 | | | | 7,576 | |
| Series 2013-H07, Class GA, | | | | | | | | |
| 1M US L + 0.47%, | | | | | | | | |
| 03/20/2063(a) | | | 216,338 | | | | 216,838 | |
| Series 2013-H09, Class HA, | | | | | | | | |
| 1.650%, 04/20/2063 | | | 23,782 | | | | 23,867 | |
| Series 2013-H18, Class EA, | | | | | | | | |
| 1M US L + 0.50%, | | | | | | | | |
| 07/20/2063(a) | | | 98,732 | | | | 98,967 | |
| Series 2014-53, Class JM, | | | | | | | | |
| 7.058%, 04/20/2039(a) | | | 306,491 | | | | 355,079 | |
| Series 2014-98, Class HE, | | | | | | | | |
| 3.000%, 07/20/2044 | | | 53,984 | | | | 55,695 | |
| Series 2014-H10, Class TA, | | | | | | | | |
| 1M US L + 0.60%, | | | | | | | | |
| 04/20/2064(a) | | | 373,633 | | | | 376,813 | |
| Series 2014-H15, Class FA, | | | | | | | | |
| 1M US L + 0.50%, | | | | | | | | |
| 07/20/2064(a) | | | 25,756 | | | | 25,893 | |
| Series 2014-H16, Class FL, | | | | | | | | |
| 1M US L + 0.47%, | | | | | | | | |
| 07/20/2064(a) | | | 459,146 | | | | 460,593 | |
| Series 2015-190, Class LE, | | | | | | | | |
| 3.500%, 06/20/2045 | | | 45,899 | | | | 47,371 | |
| Series 2015-63, Class KA, | | | | | | | | |
| 3.000%, 04/20/2040 | | | 33,494 | | | | 34,584 | |
| Series 2015-84, Class QA, | | | | | | | | |
| 3.500%, 06/20/2045 | | | 350,933 | | | | 376,652 | |
| Series 2015-H09, Class FA, | | | | | | | | |
| 1M US L + 0.62%, | | | | | | | | |
| 04/20/2065(a) | | | 260,053 | | | | 262,209 | |
| Series 2015-H12, Class FB, | | | | | | | | |
| 1M US L + 0.60%, | | | | | | | | |
| 05/20/2065(a) | | | 102,415 | | | | 103,144 | |
| | | Principal Amount | | | Value (Note 2) | |
| Series 2015-H15, Class FC, | | | | | | | | |
| 1M US L + 0.58%, | | | | | | | | |
| 06/20/2065(a) | | $ | 137,337 | | | $ | 138,369 | |
| Series 2015-H22, Class FC, | | | | | | | | |
| 1M US L + 0.60%, | | | | | | | | |
| 09/20/2065(a) | | | 59,225 | | | | 59,699 | |
| Series 2015-H26, Class FA, | | | | | | | | |
| 1M US L + 0.52%, | | | | | | | | |
| 10/20/2065(a) | | | 63,756 | | | | 64,140 | |
| Series 2015-H26, Class FG, | | | | | | | | |
| 1M US L + 0.52%, | | | | | | | | |
| 10/20/2065(a) | | | 311,216 | | | | 312,874 | |
| Series 2015-H29, Class FA, | | | | | | | | |
| 1M US L + 0.70%, | | | | | | | | |
| 10/20/2065(a) | | | 5,769 | | | | 5,808 | |
| Series 2015-H30, Class FE, | | | | | | | | |
| 1M US L + 0.60%, | | | | | | | | |
| 11/20/2065(a) | | | 64,126 | | | | 64,687 | |
| Series 2015-H31, Class FT, | | | | | | | | |
| 1M US L + 0.65%, | | | | | | | | |
| 11/20/2065(a) | | | 101,863 | | | | 102,355 | |
| Series 2015-H32, Class FH, | | | | | | | | |
| 1M US L + 0.66%, | | | | | | | | |
| 12/20/2065(a) | | | 221,779 | | | | 224,065 | |
| Series 2016-116, Class GV, | | | | | | | | |
| 3.000%, 05/20/2026 | | | 50,690 | | | | 52,768 | |
| Series 2016-120, Class KA, | | | | | | | | |
| 2.000%, 09/20/2046 | | | 9,605 | | | | 9,865 | |
| Series 2016-82, Class BA, | | | | | | | | |
| 3.000%, 09/20/2045 | | | 133,898 | | | | 135,610 | |
| Series 2016-H06, Class FC, | | | | | | | | |
| 1M US L + 0.92%, | | | | | | | | |
| 02/20/2066(a) | | | 186,560 | | | | 189,574 | |
| Series 2016-H08, Class FT, | | | | | | | | |
| 1M US L + 0.72%, | | | | | | | | |
| 02/20/2066(a) | | | 451,107 | | | | 453,705 | |
| Series 2016-H11, Class F, | | | | | | | | |
| 1M US L + 0.80%, | | | | | | | | |
| 05/20/2066(a) | | | 638,777 | | | | 647,759 | |
| Series 2016-H13, Class FT, | | | | | | | | |
| 1M US L + 0.58%, | | | | | | | | |
| 05/20/2066(a) | | | 33,094 | | | | 33,188 | |
| Series 2016-H14, Class FA, | | | | | | | | |
| 1M US L + 0.80%, | | | | | | | | |
| 06/20/2066(a) | | | 159,059 | | | | 161,290 | |
| Series 2016-H15, Class FA, | | | | | | | | |
| 1M US L + 0.80%, | | | | | | | | |
| 07/20/2066(a) | | | 702,765 | | | | 712,073 | |
| Series 2016-H17, Class FK, | | | | | | | | |
| 1M US L + 0.85%, | | | | | | | | |
| 07/20/2066(a) | | | 94,644 | | | | 96,171 | |
| Series 2016-H17, Class FC, | | | | | | | | |
| 1M US L + 0.83%, | | | | | | | | |
| 08/20/2066(a) | | | 200,920 | | | | 204,066 | |
| Series 2016-H20, Class PT, | | | | | | | | |
| 2.804%, 09/20/2066(a) | | | 645,347 | | | | 681,571 | |
See Notes to Financial Statements.
ALPS | Smith Total Return Bond Fund
| Statement of Investments | October 31, 2021 |
| | | Principal Amount | | | Value (Note 2) | |
| Series 2016-H23, Class F, | | | | | | | | |
| 1M US L + 0.75%, | | | | | | | | |
| 10/20/2066(a) | | $ | 250,184 | | | $ | 253,394 | |
| Series 2016-H24, Class FG, | | | | | | | | |
| 1M US L + 0.75%, | | | | | | | | |
| 10/20/2066(a) | | | 367,588 | | | | 372,273 | |
| Series 2017-150, Class JE, | | | | | | | | |
| 3.000%, 07/20/2047 | | | 116,155 | | | | 118,797 | |
| Series 2017-165, Class VE, | | | | | | | | |
| 3.500%, 11/20/2030 | | | 110,968 | | | | 113,244 | |
| Series 2017-170, Class MC, | | | | | | | | |
| 2.500%, 10/20/2047 | | | 124,761 | | | | 124,158 | |
| Series 2017-36, Class MJ, | | | | | | | | |
| 3.000%, 03/20/2047 | | | 60,308 | | | | 62,672 | |
| Series 2017-56, Class AZ, | | | | | | | | |
| 3.000%, 04/20/2047 | | | 109,323 | | | | 116,207 | |
| Series 2017-73, Class JT, | | | | | | | | |
| 2.750%, 09/20/2046 | | | 38,242 | | | | 39,075 | |
| Series 2017-80, Class BJ, | | | | | | | | |
| 3.000%, 03/20/2047 | | | 179,450 | | | | 186,276 | |
| Series 2017-H06, Class FE, | | | | | | | | |
| 1M US L + 0.55%, | | | | | | | | |
| 02/20/2067(a) | | | 108,010 | | | | 108,666 | |
| Series 2017-H15, Class FC, | | | | | | | | |
| 1M US L + 0.47%, | | | | | | | | |
| 06/20/2067(a) | | | 296,152 | | | | 297,280 | |
| Series 2017-H16, Class PT, | | | | | | | | |
| 4.696%, 05/20/2066(a) | | | 85,469 | | | | 88,945 | |
| Series 2017-H17, Class FG, | | | | | | | | |
| 1M US L + 0.50%, | | | | | | | | |
| 08/20/2067(a) | | | 46,839 | | | | 47,009 | |
| Series 2018-160, Class AD, | | | | | | | | |
| 3.500%, 02/20/2048 | | | 379,329 | | | | 397,450 | |
| Series 2018-36, Class CZ, | | | | | | | | |
| 4.000%, 03/20/2048 | | | 256,402 | | | | 284,379 | |
| Series 2018-37, Class C, | | | | | | | | |
| 2.500%, 01/20/2046 | | | 253,622 | | | | 264,437 | |
| Series 2019-111, Class TE, | | | | | | | | |
| 2.000%, 09/20/2049 | | | 108,373 | | | | 109,946 | |
| Series 2019-61, Class K, | | | | | | | | |
| 3.500%, 07/20/2048 | | | 115,073 | | | | 115,825 | |
| Series 2020-125, Class GA, | | | | | | | | |
| 2.500%, 03/20/2050 | | | 480,609 | | | | 493,166 | |
| Series 2020-125, Class GC, | | | | | | | | |
| 2.500%, 08/20/2050 | | | 103,512 | | | | 103,417 | |
| Series 2020-32, Class UM, | | | | | | | | |
| 2.500%, 03/20/2050 | | | 1,748,742 | | | | 1,798,211 | |
| Series 2020-5, Class LC, | | | | | | | | |
| 3.500%, 10/20/2049 | | | 335,313 | | | | 342,924 | |
| Series 2020-61, Class AB, | | | | | | | | |
| 3.000%, 05/20/2048 | | | 286,540 | | | | 292,638 | |
| Series 2020-62, Class PD, | | | | | | | | |
| 3.000%, 05/20/2050 | | | 701,714 | | | | 712,936 | |
| Series 2020-83, Class ML, | | | | | | | | |
| 3.000%, 06/20/2050 | | | 176,672 | | | | 182,011 | |
| | | Principal Amount | | | Value (Note 2) | |
| Series 2020-98, Class CE, | | | | | | | | |
| 3.000%, 07/20/2050 | | $ | 2,197,292 | | | $ | 2,249,034 | |
| | | | | | | | 31,788,033 | |
| TOTAL COLLATERALIZED MORTGAGE OBLIGATIONS | | | | | | | | |
| (Cost $126,567,219) | | | | | | | 127,528,645 | |
| | | Principal Amount | | | Value (Note 2) | |
| COMMERCIAL MORTGAGE-BACKED SECURITIES (2.53%) | | | | | | | | |
| Fannie Mae-Aces | | | | | | | | |
| Series 2006-M2, Class A3F, | | | | | | | | |
| 5.345%, 09/25/2031(a) | | | 362,941 | | | | 392,063 | |
| Series 2013-M6, Class 1AC, | | | | | | | | |
| 3.303%, 02/25/2043(a) | | | 12,694,241 | | | | 14,040,245 | |
| Series 2016-M11, Class AL, | | | | | | | | |
| 2.944%, 07/25/2039 | | | 188,053 | | | | 191,285 | |
| Series 2016-M3, Class ASQ2, | | | | | | | | |
| 2.263%, 02/25/2023 | | | 57,893 | | | | 58,060 | |
| Series 2017-M15, Class A1, | | | | | | | | |
| 2.959%, 09/25/2027(a) | | | 4,211,950 | | | | 4,434,128 | |
| Series 2018-M12, Class A1, | | | | | | | | |
| 3.546%, 08/25/2030 | | | 4,577,247 | | | | 5,029,130 | |
| Series 2018-M13, Class A1, | | | | | | | | |
| 3.695%, 03/25/2030(a) | | | 2,143,743 | | | | 2,363,996 | |
| Series 2018-M8, Class A1, | | | | | | | | |
| 3.325%, 06/25/2028(a) | | | 7,114,219 | | | | 7,691,799 | |
| Series 2019-M10, Class A1, | | | | | | | | |
| 2.000%, 04/25/2030 | | | 1,648,328 | | | | 1,687,554 | |
| Series 2019-M14, Class A1, | | | | | | | | |
| 2.304%, 06/25/2029 | | | 152,793 | | | | 158,465 | |
| Series 2019-M24, Class 2XA, | | | | | | | | |
| 1.149%, 03/25/2031(a)(c) | | | 2,346,532 | | | | 207,011 | |
| Series 2020-M10, Class X1, | | | | | | | | |
| 1.794%, 12/25/2030(a)(c) | | | 804,502 | | | | 103,128 | |
| Series 2020-M10, Class X4, | | | | | | | | |
| 0.865%, 07/25/2032(a)(c) | | | 55,914,323 | | | | 3,996,722 | |
| Series 2020-M13, Class X2, | | | | | | | | |
| 1.287%, 09/25/2030(a)(c) | | | 2,320,744 | | | | 187,487 | |
| | | | | | | | 40,541,073 | |
| Freddie Mac Multifamily | | | | | | | | |
| Structured Pass Through | | | | | | | | |
| Certificates | | | | | | | | |
| Series 2018-J19L, Class AFL, | | | | | | | | |
| 1M US L + 0.23%, | | | | | | | | |
| 11/25/2027(a) | | | 135,310 | | | | 134,649 | |
| Series 2019-KL4F, | | | | | | | | |
| Class A2AS, | | | | | | | | |
| 3.683%, 10/25/2025(a) | | | 256,000 | | | | 272,500 | |
See Notes to Financial Statements.
ALPS | Smith Total Return Bond Fund
| Statement of Investments | October 31, 2021 |
| | | Principal Amount | | | Value (Note 2) | |
| Series 2019-KLU2, Class X1, | | | | | | | | |
| 1.036%, 08/25/2029(a)(c) | | $ | 63,307,051 | | | $ | 4,150,841 | |
| | | | | | | | 4,557,990 | |
| | | | | | | | | |
| TOTAL COMMERCIAL MORTGAGE- BACKED SECURITIES | | | | | | | | |
| (Cost $45,395,306) | | | | | | | 45,099,063 | |
| | | Principal Amount | | | Value (Note 2) | |
| MORTGAGE-BACKED SECURITIES (5.66%) | | | |
| Fannie Mae Grantor Trust | | | | | | | | |
| Series 2002-T12, Class A1, | | | | | | | | |
| 05/25/2042 | | | 225,852 | | | | 256,507 | |
| | | | | | | | | |
| Fannie Mae Pool | | | | | | | | |
| Series 2003-386375, | | | | | | | | |
| 4.790%, 08/01/2028 | | | 848,246 | | | | 847,875 | |
| Series 2005-843080, | | | | | | | | |
| 6.000%, 12/01/2034 | | | 129,069 | | | | 139,002 | |
| Series 2007-943003, | | | | | | | | |
| 5.500%, 08/01/2047 | | | 92,928 | | | | 101,097 | |
| Series 2009-, | | | | | | | | |
| 4.500%, 06/01/2039 | | | 121,058 | | | | 130,393 | |
| Series 2009-463331, | | | | | | | | |
| 5.250%, 08/01/2029 | | | 626,726 | | | | 705,853 | |
| Series 2009-930895, | | | | | | | | |
| 4.500%, 03/01/2039 | | | 179,814 | | | | 191,309 | |
| Series 2009-931707, | | | | | | | | |
| 4.500%, 08/01/2039 | | | 117,377 | | | | 126,413 | |
| Series 2009-958348, | | | | | | | | |
| 5.440%, 04/01/2027 | | | 138,487 | | | | 150,444 | |
| Series 2009-958878, | | | | | | | | |
| 5.750%, 07/01/2027 | | | 1,368,398 | | | | 1,501,165 | |
| Series 2011-467068, | | | | | | | | |
| 6.130%, 01/01/2026 | | | 1,552,707 | | | | 1,782,768 | |
| Series 2011-468477, | | | | | | | | |
| 4.590%, 08/01/2026 | | | 411,517 | | | | 466,249 | |
| Series 2011-469013, | | | | | | | | |
| 5.470%, 08/01/2026 | | | 1,025,906 | | | | 1,158,848 | |
| Series 2011-AH9290, | | | | | | | | |
| 4.000%, 04/01/2041 | | | 49,181 | | | | 51,965 | |
| Series 2012-, | | | | | | | | |
| 3.500%, 04/01/2042 | | | 85,756 | | | | 89,700 | |
| Series 2012-470020, | | | | | | | | |
| 4.200%, 01/01/2030 | | | 1,593,019 | | | | 1,825,741 | |
| Series 2012-AM0279, | | | | | | | | |
| 3.210%, 08/01/2027 | | | 300,549 | | | | 306,367 | |
| Series 2012-AM1387, | | | | | | | | |
| 3.260%, 11/01/2032 | | | 120,099 | | | | 130,381 | |
| Series 2012-MA1214, | | | | | | | | |
| 3.000%, 10/01/2042 | | | 840,826 | | | | 868,689 | |
| Series 2013-, | | | | | | | | |
| 3.380%, 05/01/2028 | | | 279,426 | | | | 288,625 | |
| | | Principal Amount | | | Value (Note 2) | |
| Series 2013-AM 4236, | | | | | | | | |
| 3.940%, 08/01/2025 | | $ | 222,454 | | | $ | 241,985 | |
| Series 2013-AM3154, | | | | | | | | |
| 3.250%, 05/01/2028 | | | 366,329 | | | | 388,896 | |
| Series 2013-AM3162, | | | | | | | | |
| 3.000%, 04/01/2025 | | | 760,761 | | | | 778,428 | |
| Series 2013-AM4329, | | | | | | | | |
| 3.870%, 10/01/2025 | | | 199,511 | | | | 217,798 | |
| Series 2013-AM4781, | | | | | | | | |
| 4.180%, 11/01/2028 | | | 1,233,605 | | | | 1,412,959 | |
| Series 2013-AM4991, | | | | | | | | |
| 3.970%, 12/01/2025 | | | 164,130 | | | | 179,905 | |
| Series 2013-AR2289, | | | | | | | | |
| 3.000%, 02/01/2033 | | | 287,436 | | | | 302,915 | |
| Series 2013-AT9663, | | | | | | | | |
| 2.500%, 07/01/2043 | | | 557,231 | | | | 572,037 | |
| Series 2013-MA1586, | | | | | | | | |
| 3.000%, 08/01/2043 | | | 202,861 | | | | 216,823 | |
| Series 2014-AM4198, | | | | | | | | |
| 3.550%, 03/01/2024 | | | 96,904 | | | | 101,631 | |
| Series 2014-AM5473, | | | | | | | | |
| 3.760%, 03/01/2024 | | | 545,000 | | | | 574,031 | |
| Series 2014-AM7274, | | | | | | | | |
| 3.000%, 12/01/2024 | | | 1,200,000 | | | | 1,205,196 | |
| Series 2015-, | | | | | | | | |
| 3.100%, 09/01/2025 | | | 158,950 | | | | 169,564 | |
| Series 2015-AM8666, | | | | | | | | |
| 2.960%, 06/01/2030 | | | 180,713 | | | | 194,932 | |
| Series 2015-AM8918, | | | | | | | | |
| 3.250%, 09/01/2030 | | | 731,000 | | | | 811,003 | |
| Series 2015-AM9173, | | | | | | | | |
| 3.110%, 06/01/2027 | | | 244,561 | | | | 245,956 | |
| Series 2015-AM9830, | | | | | | | | |
| 3.190%, 09/01/2027 | | | 585,786 | | | | 638,344 | |
| Series 2016-AL8405, | | | | | | | | |
| 4.500%, 05/01/2041 | | | 236,845 | | | | 255,418 | |
| Series 2016-AN0665, | | | | | | | | |
| 3.070%, 02/01/2026 | | | 196,594 | | | | 209,281 | |
| Series 2016-AN0774, | | | | | | | | |
| 3.210%, 01/01/2026 | | | 178,642 | | | | 191,676 | |
| Series 2016-AN2228, | | | | | | | | |
| 2.520%, 08/01/2026 | | | 189,472 | | | | 197,433 | |
| Series 2016-AN3542, | | | | | | | | |
| 3.410%, 11/01/2046 | | | 365,936 | | | | 407,328 | |
| Series 2016-AN3749, | | | | | | | | |
| 2.520%, 12/01/2026 | | | 464,560 | | | | 482,114 | |
| Series 2016-BC0943, | | | | | | | | |
| 3.500%, 05/01/2046 | | | 461,491 | | | | 498,613 | |
| Series 2017-, | | | | | | | | |
| 3.010%, 07/01/2027 | | | 268,832 | | | | 289,196 | |
| 3.160%, 07/01/2027 | | | 150,000 | | | | 159,241 | |
| 3.500%, 06/01/2047 | | | 449,509 | | | | 469,332 | |
| Series 2017-AN4431, | | | | | | | | |
| 3.220%, 01/01/2027 | | | 85,000 | | | | 92,542 | |
See Notes to Financial Statements.
ALPS | Smith Total Return Bond Fund
| Statement of Investments | October 31, 2021 |
| | | Principal Amount | | | Value (Note 2) | |
| Series 2017-AN4469, | | | | | | | | |
| 3.640%, 01/01/2029 | | $ | 695,646 | | | $ | 776,390 | |
| Series 2017-AN4529, | | | | | | | | |
| 3.620%, 01/01/2027 | | | 835,560 | | | | 919,738 | |
| Series 2017-AN4606, | | | | | | | | |
| 3.510%, 02/01/2027 | | | 798,259 | | | | 855,475 | |
| Series 2017-AN4833, | | | | | | | | |
| 3.320%, 04/01/2027 | | | 95,000 | | | | 103,927 | |
| Series 2017-AN5279, | | | | | | | | |
| 3.340%, 04/01/2029 | | | 463,001 | | | | 465,839 | |
| Series 2017-AN5742, | | | | | | | | |
| 3.190%, 05/01/2030 | | | 139,737 | | | | 153,715 | |
| Series 2017-AN5796, | | | | | | | | |
| 3.030%, 06/01/2027 | | | 218,890 | | | | 231,251 | |
| Series 2017-AN6304, | | | | | | | | |
| 3.100%, 10/01/2027 | | | 275,000 | | | | 299,377 | |
| Series 2017-AN6670, | | | | | | | | |
| 3.210%, 09/01/2027 | | | 1,937,385 | | | | 2,030,924 | |
| Series 2017-AN7060, | | | | | | | | |
| 2.930%, 10/01/2027 | | | 1,780,000 | | | | 1,886,042 | |
| Series 2017-AN7234, | | | | | | | | |
| 3.010%, 12/01/2027 | | | 1,000,000 | | | | 1,045,723 | |
| Series 2017-AN7384, | | | | | | | | |
| 2.880%, 12/01/2027 | | | 49,294 | | | | 52,974 | |
| Series 2017-AN7547, | | | | | | | | |
| 3.370%, 11/01/2027 | | | 1,118,295 | | | | 1,172,296 | |
| Series 2017-AN7823, | | | | | | | | |
| 2.890%, 12/01/2027 | | | 235,000 | | | | 253,230 | |
| Series 2017-CA0522, | | | | | | | | |
| 3.000%, 10/01/2047 | | | 339,468 | | | | 349,022 | |
| Series 2018-, | | | | | | | | |
| 4.500%, 08/01/2041 | | | 466,516 | | | | 521,565 | |
| Series 2018-109435, | | | | | | | | |
| 3.890%, 08/01/2028 | | | 1,912,205 | | | | 2,090,766 | |
| Series 2018-109741, | | | | | | | | |
| 3.730%, 11/01/2025 | | | 11,350,000 | | | | 11,967,488 | |
| Series 2018-387770, | | | | | | | | |
| 3.625%, 07/01/2028 | | | 2,570,000 | | | | 2,807,610 | |
| Series 2018-387853, | | | | | | | | |
| 3.455%, 08/01/2025 | | | 175,000 | | | | 181,032 | |
| Series 2018-387904, | | | | | | | | |
| 3.840%, 08/01/2028 | | | 680,994 | | | | 771,177 | |
| Series 2018-387983, | | | | | | | | |
| 3.630%, 08/01/2028 | | | 2,000,000 | | | | 2,180,761 | |
| Series 2018-AN8198, | | | | | | | | |
| 3.140%, 01/01/2028 | | | 300,000 | | | | 314,288 | |
| Series 2018-AN8272, | | | | | | | | |
| 3.170%, 02/01/2028 | | | 100,000 | | | | 106,701 | |
| Series 2018-AN8486, | | | | | | | | |
| 3.330%, 04/01/2030 | | | 330,625 | | | | 368,806 | |
| Series 2018-AN8493, | | | | | | | | |
| 3.300%, 02/01/2030 | | | 430,965 | | | | 468,953 | |
| Series 2018-AN8982, | | | | | | | | |
| 3.440%, 05/01/2028 | | | 1,000,000 | | | | 1,075,968 | |
| | | Principal Amount | | | Value (Note 2) | |
| Series 2018-AN9038, | | | | | | | | |
| 3.460%, 05/01/2028 | | $ | 135,000 | | | $ | 145,896 | |
| Series 2018-AN924, | | | | | | | | |
| 4.210%, 05/01/2033 | | | 621,475 | | | | 700,739 | |
| Series 2018-AN9354, | | | | | | | | |
| 3.640%, 06/01/2028 | | | 1,565,000 | | | | 1,703,133 | |
| Series 2018-AN9976, | | | | | | | | |
| 3.960%, 02/01/2030 | | | 470,000 | | | | 542,826 | |
| Series 2018-BI0404, | | | | | | | | |
| 4.100%, 11/01/2028 | | | 3,944,903 | | | | 4,374,786 | |
| Series 2018-BL0119, | | | | | | | | |
| 4.090%, 11/01/2026 | | | 787,145 | | | | 880,255 | |
| Series 2018-BL0212, | | | | | | | | |
| 3.820%, 07/01/2027 | | | 44,371 | | | | 47,997 | |
| Series 2018-BL0550, | | | | | | | | |
| 3.770%, 11/01/2028 | | | 660,000 | | | | 747,459 | |
| Series 2018-BL0907, | | | | | | | | |
| 3.880%, 12/01/2028 | | | 450,000 | | | | 513,558 | |
| Series 2019-BI2928, | | | | | | | | |
| 3.410%, 07/01/2027 | | | 829,474 | | | | 910,074 | |
| Series 2019-BL1188, | | | | | | | | |
| 3.480%, 02/01/2026 | | | 200,000 | | | | 216,426 | |
| Series 2019-BL1300, | | | | | | | | |
| 4.200%, 01/01/2029 | | | 1,375,000 | | | | 1,542,465 | |
| Series 2019-BL1451, | | | | | | | | |
| 3.760%, 02/01/2029 | | | 685,000 | | | | 748,031 | |
| Series 2019-BL1567, | | | | | | | | |
| 3.590%, 02/01/2029 | | | 1,775,000 | | | | 1,941,362 | |
| Series 2019-BL1596, | | | | | | | | |
| 3.480%, 03/01/2029 | | | 167,850 | | | | 187,519 | |
| Series 2019-BL2236, | | | | | | | | |
| 3.640%, 10/01/2029 | | | 1,100,000 | | | | 1,231,470 | |
| Series 2019-BL2356, | | | | | | | | |
| 3.020%, 05/01/2026 | | | 165,000 | | | | 173,716 | |
| Series 2019-BL2460, | | | | | | | | |
| 3.400%, 05/01/2029 | | | 588,071 | | | | 634,865 | |
| Series 2019-BL3182, | | | | | | | | |
| 2.980%, 07/01/2029 | | | 255,077 | | | | 272,091 | |
| Series 2019-BM6011, | | | | | | | | |
| 3.348%, 11/01/2026(a) | | | 137,499 | | | | 148,449 | |
| Series 2019-BM6152, | | | | | | | | |
| 3.500%, 06/01/2044 | | | 1,485,046 | | | | 1,604,649 | |
| Series 2019-MA3784, | | | | | | | | |
| 3.500%, 09/01/2049 | | | 3,960,144 | | | | 4,114,495 | |
| Series 2020-, | | | | | | | | |
| 3.500%, 04/01/2050 | | | 332,424 | | | | 345,496 | |
| | | | | | | | 79,546,256 | |
| Freddie Mac Gold Pool | | | | | | | | |
| Series 2006-, | | | | | | | | |
| 6.000%, 01/01/2036 | | | 81,328 | | | | 87,330 | |
| Series 2007-, | | | | | | | | |
| 5.500%, 11/01/2037 | | | 70,699 | | | | 77,721 | |
| Series 2012-, | | | | | | | | |
| 3.500%, 08/01/2042 | | | 107,316 | | | | 112,486 | |
See Notes to Financial Statements.
ALPS | Smith Total Return Bond Fund
| Statement of Investments | October 31, 2021 |
| | | Principal Amount | | | Value (Note 2) | |
| Series 2013-G80393, | | | | | | | | |
| 5.000%, 08/20/2036 | | $ | 176,676 | | | $ | 193,781 | |
| Series 2013-T65180, | | | | | | | | |
| 3.000%, 11/01/2043 | | | 159,407 | | | | 164,951 | |
| Series 2015-U49046, | | | | | | | | |
| 4.000%, 02/01/2029 | | | 91,723 | | | | 98,098 | |
| | | | | | | | 734,367 | |
| Freddie Mac Pool | | | | | | | | |
| Series 2005-002936, | | | | | | | | |
| Class FC, | | | | | | | | |
| 1M US L + 0.40%, | | | | | | | | |
| 03/15/2029(a) | | | 26,413 | | | | 26,564 | |
| Series 2017-WN2000, | | | | | | | | |
| 2.700%, 08/01/2023 | | | 10,668,776 | | | | 10,703,170 | |
| Series 2018-, | | | | | | | | |
| 3.500%, 12/01/2045 | | | 99,101 | | | | 103,466 | |
| | | | | | | | 10,833,200 | |
| Ginnie Mae II Pool | | | | | | | | |
| Series 2010-, | | | | | | | | |
| 4.000%, 09/20/2040 | | | 109,465 | | | | 116,715 | |
| 4.000%, 11/20/2040 | | | 111,021 | | | | 118,359 | |
| 1M US L + 2.034%, | | | | | | | | |
| 08/20/2060(a) | | | 443,697 | | | | 469,212 | |
| Series 2012-, | | | | | | | | |
| 3.500%, 03/20/2042 | | | 446,339 | | | | 463,184 | |
| 3.500%, 04/20/2042 | | | 108,524 | | | | 112,633 | |
| 3.500%, 05/20/2042 | | | 179,374 | | | | 186,152 | |
| 3.500%, 06/20/2042 | | | 107,940 | | | | 112,039 | |
| 3.500%, 08/20/2042 | | | 123,313 | | | | 127,995 | |
| 3.500%, 09/20/2042 | | | 94,226 | | | | 97,797 | |
| 3.500%, 10/20/2042 | | | 127,609 | | | | 132,444 | |
| 3.500%, 12/20/2042 | | | 120,696 | | | | 125,246 | |
| 4.000%, 02/20/2042 | | | 50,633 | | | | 53,985 | |
| 4.000%, 04/20/2042 | | | 152,592 | | | | 162,639 | |
| 4.000%, 09/20/2042 | | | 98,276 | | | | 104,783 | |
| Series 2012-5302+, | | | | | | | | |
| 3.500%, 02/20/2042 | | | 331,685 | | | | 344,186 | |
| Series 2013-, | | | | | | | | |
| 3.250%, 04/20/2033 | | | 405,242 | | | | 423,739 | |
| 3.500%, 04/20/2043 | | | 320,358 | | | | 332,470 | |
| Series 2013-MA1149, | | | | | | | | |
| 3.000%, 07/20/2043 | | | 16,332 | | | | 16,790 | |
| Series 2016-MA3588, | | | | | | | | |
| 3.500%, 04/20/2046 | | | 428,506 | | | | 442,158 | |
| Series 2016-MA3793, | | | | | | | | |
| 3.500%, 07/20/2046 | | | 1,094,961 | | | | 1,129,858 | |
| Series 2016-MA3865, | | | | | | | | |
| 3.500%, 08/20/2046 | | | 903,422 | | | | 932,234 | |
| Series 2019-, | | | | | | | | |
| 3.500%, 12/20/2049 | | | 270,899 | | | | 276,885 | |
| Series 2019-784688, | | | | | | | | |
| 5.000%, 02/20/2049 | | | 2,787,583 | | | | 3,029,258 | |
| Series 2019-MA5864, | | | | | | | | |
| 3.000%, 04/20/2049 | | | 63,920 | | | | 65,499 | |
| Series 2019-MA5920, | | | | | | | | |
| 3.000%, 05/20/2049 | | | 30,852 | | | | 31,614 | |
| | | Principal Amount | | | Value (Note 2) | |
| Series 2019-MA5936, | | | | | | | | |
| 6.500%, 05/20/2049 | | $ | 77,342 | | | $ | 89,416 | |
| | | | | | | | 9,497,290 | |
| TOTAL MORTGAGE-BACKED SECURITIES | | | | | | | | |
| (Cost $100,903,237) | | | | | | | 100,867,620 | |
| | | | | | | | | |
| CORPORATE BONDS (56.25%) | | | | | | | | |
| Aerospace & Defense (2.44%) | | | | | | | | |
| Boeing Co. | | | | | | | | |
| 2.20%, 02/04/2026 | | | 7,030,000 | | | | 7,044,118 | |
| Teledyne Technologies, Inc. | | | | | | | | |
| 0.95%, 04/01/2024 | | | 4,985,000 | | | | 4,982,548 | |
| 1.60%, 04/01/2026 | | | 7,975,000 | | | | 7,969,018 | |
| 2.25%, 04/01/2028 | | | 9,970,000 | | | | 10,032,918 | |
| 2.75%, 04/01/2031 | | | 3,969,000 | | | | 4,049,397 | |
| TransDigm, Inc. | | | | | | | | |
| 6.25%, 03/15/2026(e) | | | 5,000,000 | | | | 5,225,000 | |
| 8.00%, 12/15/2025(e) | | | 3,940,000 | | | | 4,196,100 | |
| Total Aerospace & Defense | | | | | | | 43,499,099 | |
| Airlines (1.64%) | | | | | | | | |
| Alaska Airlines 2020-1 Class A Pass | | | | | | | | |
| Through Trust | | | | | | | | |
| 4.80%, 08/15/2027(e) | | | 5,804,311 | | | | 6,456,612 | |
| Alaska Airlines 2020-1 Class B Pass | | | | | | | | |
| Through Trust | | | | | | | | |
| 8.00%, 08/15/2025(e) | | | 5,272,416 | | | | 5,953,605 | |
| British Airways 2020-1 Class A | | | | | | | | |
| Pass Through Trust | | | | | | | | |
| 4.25%, 11/15/2032(e) | | | 1,306,895 | | | | 1,412,507 | |
| Delta Air Lines, Inc. | | | | | | | | |
| 7.00%, 05/01/2025(e) | | | 1,993,000 | | | | 2,326,295 | |
| Southwest Airlines Co. | | | | | | | | |
| 5.25%, 05/04/2025 | | | 7,540,000 | | | | 8,455,677 | |
| United Airlines 2020-1 Class A Pass | | | | | | | | |
| Through Trust | | | | | | | | |
| Series 20-1 | | | | | | | | |
| 5.88%, 10/15/2027 | | | 4,132,598 | | | | 4,631,858 | |
| Total Airlines | | | | | | | 29,236,554 | |
| Apparel & Textile Products (0.20%) | | | | | | | | |
| Hanesbrands, Inc. | | | | | | | | |
| 5.38%, 05/15/2025(e) | | | 3,500,000 | | | | 3,644,375 | |
| | | | | | | | | |
| Automobiles Manufacturing (3.19%) | | | | | | | | |
| Ford Motor Co. | | | | | | | | |
| 5.29%, 12/08/2046 | | | 4,910,000 | | | | 5,640,092 | |
| 8.50%, 04/21/2023 | | | 500,000 | | | | 548,875 | |
| 9.00%, 04/22/2025 | | | 8,500,000 | | | | 10,231,875 | |
| Ford Motor Credit Co. LLC | | | | | | | | |
| 3.38%, 11/13/2025 | | | 6,500,000 | | | | 6,686,875 | |
| 4.00%, 11/13/2030 | | | 6,965,000 | | | | 7,278,425 | |
| 3M US L + 1.27%, | | | | | | | | |
| 03/28/2022(a) | | | 1,000,000 | | | | 1,000,773 | |
See Notes to Financial Statements.
ALPS | Smith Total Return Bond Fund
| Statement of Investments | October 31, 2021 |
| | | Principal Amount | | | Value (Note 2) | |
| General Motors Co. | | | | | | | | |
| 5.00%, 04/01/2035 | | $ | 5,348,000 | | | $ | 6,344,641 | |
| Nissan Motor Co., Ltd. | | | | | | | | |
| 4.81%, 09/17/2030(e) | | | 15,300,000 | | | | 17,016,231 | |
| Volkswagen Group of America | | | | | | | | |
| Finance LLC | | | | | | | | |
| 0.75%, 11/23/2022(e) | | | 995,000 | | | | 995,917 | |
| 0.88%, 11/22/2023(e) | | | 995,000 | | | | 994,743 | |
| Total Automobiles Manufacturing | | | | | | | 56,738,447 | |
| Banks (5.24%) | | | | | | | | |
| Associated Bank NA/Green Bay WI | | | | | | | | |
| 4.25%, 01/15/2025 | | | 934,000 | | | | 998,179 | |
| Bank of New Zealand | | | | | | | | |
| 2.00%, 02/21/2025(e) | | | 7,375,000 | | | | 7,538,334 | |
| CIT Group, Inc. | | | | | | | | |
| 1D US SOFR + 3.83%, | | | | | | | | |
| 06/19/2024(a) | | | 12,890,000 | | | | 13,404,503 | |
| Citizens Financial Group, Inc. | | | | | | | | |
| Series F | | | | | | | | |
| 5Y US TI + 5.313%(a)(f) | | | 1,314,000 | | | | 1,443,758 | |
| Cooperatieve Rabobank UA | | | | | | | | |
| 3.75%, 07/21/2026 | | | 4,500,000 | | | | 4,894,013 | |
| 3.95%, 11/09/2022 | | | 675,000 | | | | 697,779 | |
| Danske Bank A/S | | | | | | | | |
| 5.00%, 01/12/2022(e) | | | 4,625,000 | | | | 4,664,317 | |
| 5.38%, 01/12/2024(e) | | | 1,000,000 | | | | 1,089,533 | |
| 1Y US TI + 1.03%, | | | | | | | | |
| 12/08/2023(a)(e) | | | 2,000,000 | | | | 2,006,183 | |
| 1Y US TI + 1.35%, | | | | | | | | |
| 09/11/2026(a)(e) | | | 6,500,000 | | | | 6,457,497 | |
| First Horizon Corp. | | | | | | | | |
| 3.55%, 05/26/2023 | | | 2,500,000 | | | | 2,596,026 | |
| FNB Corp. | | | | | | | | |
| 2.20%, 02/24/2023 | | | 1,800,000 | | | | 1,821,195 | |
| Intesa Sanpaolo SpA | | | | | | | | |
| 4.20%, 06/01/2032(e) | | | 1,800,000 | | | | 1,816,250 | |
| 4.95%, 06/01/2042(e) | | | 1,800,000 | | | | 1,861,304 | |
| PNC Financial Services Group, Inc. | | | | | | | | |
| Series O | | | | | | | | |
| 3M US L + 3.678%(a)(f) | | | 17,387,000 | | | | 17,492,631 | |
| Synovus Bank/Columbus GA | | | | | | | | |
| 1D US SOFR + 0.95%, | | | | | | | | |
| 02/10/2023(a) | | | 6,235,000 | | | | 6,256,958 | |
| Truist Bank | | | | | | | | |
| 5Y US TI + 1.15%, | | | | | | | | |
| 09/17/2029(a) | | | 4,750,000 | | | | 4,923,332 | |
| UniCredit SpA | | | | | | | | |
| 1Y US TI + 2.30%, | | | | | | | | |
| 09/22/2026(a)(e) | | | 8,500,000 | | | | 8,551,285 | |
| US Bancorp | | | | | | | | |
| 5Y US TI + 0.95%, | | | | | | | | |
| 11/03/2036(a) | | | 4,961,000 | | | | 4,942,565 | |
| Total Banks | | | | | | | 93,455,642 | |
| | | Principal Amount | | | Value (Note 2) | |
| Cable & Satellite (1.21%) | | | | | | | | |
| CCO Holdings LLC / CCO Holdings | | | | | | | | |
| Capital Corp. | | | | | | | | |
| 4.25%, 02/01/2031(e) | | $ | 8,427,000 | | | $ | 8,400,708 | |
| 4.25%, 01/15/2034(e) | | | 1,984,000 | | | | 1,926,772 | |
| 4.50%, 06/01/2033(e) | | | 5,978,000 | | | | 5,970,737 | |
| Charter Communications | | | | | | | | |
| Operating LLC / Charter | | | | | | | | |
| Communications Operating | | | | | | | | |
| Capital | | | | | | | | |
| 3.85%, 04/01/2061 | | | 4,980,000 | | | | 4,823,263 | |
| 3M US L + 1.65%, | | | | | | | | |
| 02/01/2024(a) | | | 500,000 | | | | 512,598 | |
| Total Cable & Satellite | | | | | | | 21,634,078 | |
| Casinos & Gaming (0.87%) | | | | | | | | |
| MGM Resorts International | | | | | | | | |
| 5.50%, 04/15/2027 | | | 3,985,000 | | | | 4,298,819 | |
| 7.75%, 03/15/2022 | | | 3,348,000 | | | | 3,427,515 | |
| Penn National Gaming, Inc. | | | | | | | | |
| 5.63%, 01/15/2027(e) | | | 7,595,000 | | | | 7,851,331 | |
| Total Casinos & Gaming | | | | | | | 15,577,665 | |
| Chemicals (0.21%) | | | | | | | | |
| Kraton Polymers LLC / Kraton | | | | | | | | |
| Polymers Capital Corp. | | | | | | | | |
| 4.25%, 12/15/2025(e) | | | 3,685,000 | | | | 3,813,975 | |
| | | | | | | | | |
| Commercial Finance (2.58%) | | | | | | | | |
| AerCap Ireland Capital DAC / | | | | | | | | |
| AerCap Global Aviation Trust | | | | | | | | |
| 2.45%, 10/29/2026 | | | 11,906,000 | | | | 12,023,682 | |
| 3.30%, 01/30/2032 | | | 2,976,000 | | | | 3,031,547 | |
| 3.85%, 10/29/2041 | | | 4,960,000 | | | | 5,143,304 | |
| 6.50%, 07/15/2025 | | | 11,053,000 | | | | 12,810,306 | |
| Air Lease Corp. | | | | | | | | |
| Series C | | | | | | | | |
| 5Y US TI + 3.149%(a)(f) | | | 4,960,000 | | | | 4,898,000 | |
| Avolon Holdings Funding, Ltd. | | | | | | | | |
| 2.53%, 11/18/2027(e) | | | 2,830,000 | | | | 2,780,110 | |
| 4.25%, 04/15/2026(e) | | | 3,100,000 | | | | 3,332,332 | |
| Park Aerospace Holdings, Ltd. | | | | | | | | |
| 4.50%, 03/15/2023(e) | | | 1,850,000 | | | | 1,927,441 | |
| Total Commercial Finance | | | | | | | 45,946,722 | |
| Construction Materials Manufacturing (0.11%) | | | | | | | | |
| Martin Marietta Materials, Inc. | | | | | | | | |
| 2.40%, 07/15/2031 | | | 1,988,000 | | | | 1,988,227 | |
| | | | | | | | | |
| Consumer Finance (2.55%) | | | | | | | | |
| Ally Financial, Inc. | | | | | | | | |
| 1.45%, 10/02/2023 | | | 990,000 | | | | 1,000,031 | |
| Series C | | | | | | | | |
| 7Y US TI + 3.481%(a)(f) | | | 2,982,000 | | | | 3,041,640 | |
| American Express Co. | | | | | | | | |
| Series B | | | | | | | | |
| 3M US L + 3.43%(a)(f) | | | 8,530,000 | | | | 8,530,088 | |
See Notes to Financial Statements.
ALPS | Smith Total Return Bond Fund
| Statement of Investments | October 31, 2021 |
| | | Principal Amount | | | Value (Note 2) | |
| Discover Financial Services | | | | | | | | |
| Series D | | | | | | | | |
| 5Y US TI + 5.78%(a)(f) | | $ | 5,000,000 | | | $ | 5,567,500 | |
| OneMain Finance Corp. | | | | | | | | |
| 5.38%, 11/15/2029 | | | 3,500,000 | | | | 3,740,625 | |
| 8.88%, 06/01/2025 | | | 15,142,000 | | | | 16,391,214 | |
| Rocket Mortgage LLC | | | | | | | | |
| 3.88%, 03/01/2031(e) | | | 2,000,000 | | | | 1,978,142 | |
| Synchrony Financial | | | | | | | | |
| 3.70%, 08/04/2026 | | | 3,192,000 | | | | 3,427,402 | |
| 4.25%, 08/15/2024 | | | 1,700,000 | | | | 1,824,793 | |
| Total Consumer Finance | | | | | | | 45,501,435 | |
| | | | | | | | | |
| Department Stores (0.71%) | | | | | | | | |
| Nordstrom, Inc. | | | | | | | | |
| 4.25%, 08/01/2031 | | | 12,484,000 | | | | 12,497,420 | |
| | | | | | | | | |
| Diversified Banks (4.91%) | | | | | | | | |
| Bank of America Corp. | | | | | | | | |
| 1D US SOFR + 0.96%, | | | | | | | | |
| 07/22/2027(a) | | | 12,344,000 | | | | 12,268,632 | |
| 1D US SOFR + 1.21%, | | | | | | | | |
| 10/20/2032(a) | | | 2,976,000 | | | | 2,984,600 | |
| 1D US SOFR + 1.37%, | | | | | | | | |
| 10/24/2031(a) | | | 15,418,000 | | | | 14,715,780 | |
| 5Y US TI + 1.20%, | | | | | | | | |
| 09/21/2036(a) | | | 9,486,000 | | | | 9,231,254 | |
| Citigroup, Inc. | | | | | | | | |
| 4.30%, 11/20/2026 | | | 12,545,000 | | | | 13,927,599 | |
| 1D US SOFR + 1.17%, | | | | | | | | |
| 05/01/2032(a) | | | 1,993,000 | | | | 2,002,981 | |
| JPMorgan Chase & Co. | | | | | | | | |
| 1D US SOFR + 0.535%, | | | | | | | | |
| 06/01/2025(a) | | | 2,982,000 | | | | 2,995,885 | |
| 1D US SOFR + 1.25%, | | | | | | | | |
| 04/22/2032(a) | | | 7,140,000 | | | | 7,199,896 | |
| 1D US SOFR + 1.46%, | | | | | | | | |
| 04/22/2042(a) | | | 10,509,000 | | | | 10,981,470 | |
| 1D US SOFR + 2.04%, | | | | | | | | |
| 04/22/2031(a) | | | 4,000,000 | | | | 4,050,926 | |
| NatWest Group PLC | | | | | | | | |
| 1Y US TI + 2.55%, | | | | | | | | |
| 05/22/2028(a) | | | 2,000,000 | | | | 2,096,881 | |
| Sumitomo Mitsui Financial Group, | | | | | | | | |
| Inc. | | | | | | | | |
| 1.40%, 09/17/2026 | | | 2,977,000 | | | | 2,922,701 | |
| 1.90%, 09/17/2028 | | | 1,984,000 | | | | 1,935,381 | |
| Total Diversified Banks | | | | | | | 87,313,986 | |
| | | | | | | | | |
| Electrical Equipment Manufacturing (0.25%) | | |
| Otis Worldwide Corp. | | | | | | | | |
| 3M US L + 0.45%, | | | | | | | | |
| 04/05/2023(a) | | | 900,000 | | | | 900,071 | |
| Trimble, Inc. | | | | | | | | |
| 4.75%, 12/01/2024 | | | 3,254,000 | | | | 3,566,856 | |
| Total Electrical Equipment Manufacturing | | | | | | | 4,466,927 | |
| | | Principal Amount | | | Value (Note 2) | |
| Exploration & Production (0.52%) | | | | | | | | |
| Diamondback Energy, Inc. | | | | | | | | |
| 0.90%, 03/24/2023 | | $ | 2,040,000 | | | $ | 2,040,000 | |
| 4.40%, 03/24/2051 | | | 2,990,000 | | | | 3,452,774 | |
| Hilcorp Energy I LP / Hilcorp | | | | | | | | |
| Finance Co. | | | | | | | | |
| 6.25%, 11/01/2028(e) | | | 3,852,000 | | | | 3,958,527 | |
| Total Exploration & Production | | | | | | | 9,451,301 | |
| Financial Services (5.59%) | | | | | | | | |
| Carlyle Finance Subsidiary LLC | | | | | | | | |
| 3.50%, 09/19/2029(e) | | | 2,000,000 | | | | 2,149,444 | |
| Credit Suisse Group AG | | | | | | | | |
| 3.57%, 01/09/2023(e) | | | 9,021,000 | | | | 9,070,876 | |
| 1D US SOFR + 1.73%, | | | | | | | | |
| 05/14/2032(a)(e) | | | 8,575,000 | | | | 8,737,310 | |
| 1D US SOFR + 2.044%, | | | | | | | | |
| 06/05/2026(a)(e) | | | 3,000,000 | | | | 3,037,373 | |
| 5Y US TI + 4.82%(a)(e)(f) | | | 7,875,000 | | | | 8,593,594 | |
| Goldman Sachs Group, Inc. | | | | | | | | |
| 3.50%, 04/01/2025 | | | 7,006,000 | | | | 7,482,891 | |
| 1D US SOFR + 0.50%, | | | | | | | | |
| 09/10/2024(a) | | | 3,976,000 | | | | 3,983,027 | |
| 1D US SOFR + 0.913%, | | | | | | | | |
| 10/21/2027(a) | | | 2,976,000 | | | | 2,980,003 | |
| Series DMTN | | | | | | | | |
| 1D US SOFR + 1.248%, | | | | | | | | |
| 07/21/2032(a) | | | 2,978,000 | | | | 2,929,369 | |
| Morgan Stanley | | | | | | | | |
| Series GMTN | | | | | | | | |
| 1D US SOFR + 0.858%, | | | | | | | | |
| 07/20/2027(a) | | | 8,915,000 | | | | 8,772,095 | |
| 1D US SOFR + 0.88%, | | | | | | | | |
| 05/04/2027(a) | | | 3,986,000 | | | | 3,950,051 | |
| 1D US SOFR + 1.36%, | | | | | | | | |
| 09/16/2036(a) | | | 22,583,000 | | | | 21,957,211 | |
| Nasdaq, Inc. | | | | | | | | |
| 0.45%, 12/21/2022 | | | 2,990,000 | | | | 2,987,077 | |
| Raymond James Financial, Inc. | | | | | | | | |
| 4.65%, 04/01/2030 | | | 9,000,000 | | | | 10,579,288 | |
| UBS AG/London | | | | | | | | |
| 1.75%, 04/21/2022(e) | | | 1,500,000 | | | | 1,507,845 | |
| UBS Group AG | | | | | | | | |
| 1Y US TI + 0.83%, | | | | | | | | |
| 07/30/2024(a)(e) | | | 1,000,000 | | | | 1,001,539 | |
| Total Financial Services | | | | | | | 99,718,993 | |
| Food & Beverage (0.63%) | | | | | | | | |
| Becle SAB de CV | | | | | | | | |
| 2.50%, 10/14/2031(e) | | | 7,000,000 | | | | 6,901,509 | |
| JDE Peet's NV | | | | | | | | |
| 0.80%, 09/24/2024(e) | | | 1,984,000 | | | | 1,962,149 | |
| Lamb Weston Holdings, Inc. | | | | | | | | |
| 4.63%, 11/01/2024(e) | | | 2,490,000 | | | | 2,553,869 | |
| Total Food & Beverage | | | | | | | 11,417,527 | |
See Notes to Financial Statements.
ALPS | Smith Total Return Bond Fund
| Statement of Investments | October 31, 2021 |
| | | Principal Amount | | | Value (Note 2) | |
| Hardware (0.25%) | | | | | | |
| Dell, Inc. | | | | | | | | |
| 5.40%, 09/10/2040 | | $ | 3,720,000 | | | $ | 4,480,814 | |
| | | | | | | | | |
| Health Care Facilities & Services (2.28%) | | | | | | | | |
| HCA, Inc. | | | | | | | | |
| 2.38%, 07/15/2031 | | | 11,927,000 | | | | 11,664,071 | |
| 3.50%, 07/15/2051 | | | 6,958,000 | | | | 7,062,275 | |
| 4.13%, 06/15/2029 | | | 3,000,000 | | | | 3,324,535 | |
| 4.50%, 02/15/2027 | | | 3,680,000 | | | | 4,085,012 | |
| 5.25%, 04/15/2025 | | | 1,737,000 | | | | 1,948,330 | |
| 5.25%, 06/15/2049 | | | 3,110,000 | | | | 4,037,782 | |
| Jaguar Holding Co. II / PPD | | | | | | | | |
| Development LP | | | | | | | | |
| 4.63%, 06/15/2025(e) | | | 8,300,000 | | | | 8,632,000 | |
| Total Health Care Facilities & Services | | | | | | | 40,754,005 | |
| | | | | | | | | |
| Homebuilders (0.50%) | | | | | | | | |
| Shea Homes LP / Shea Homes | | | | | | | | |
| Funding Corp. | | | | | | | | |
| 4.75%, 04/01/2029(e) | | | 3,500,000 | | | | 3,521,875 | |
| Tri Pointe Homes, Inc. | | | | | | | | |
| 5.70%, 06/15/2028 | | | 5,000,000 | | | | 5,443,750 | |
| Total Homebuilders | | | | | | | 8,965,625 | |
| | | | | | | | | |
| Industrial Other (0.11%) | | | | | | | | |
| Quanta Services, Inc. | | | | | | | | |
| 0.95%, 10/01/2024 | | | 1,984,000 | | | | 1,968,613 | |
| | | | | | | | | |
| Life Insurance (0.27%) | | | | | | | | |
| Nippon Life Insurance Co. | | | | | | | | |
| 5Y US TI + 2.60%, | | | | | | | | |
| 09/16/2051(a)(e) | | | 5,000,000 | | | | 4,865,413 | |
| | | | | | | | | |
| Medical Equipment & Devices Manufacturing (0.17%) | | | | | | | | |
| PerkinElmer, Inc. | | | | | | | | |
| 0.85%, 09/15/2024 | | | 2,977,000 | | | | 2,955,185 | |
| | | | | | | | | |
| Metals & Mining (0.57%) | | | | | | | | |
| Steel Dynamics, Inc. | | | | | | | | |
| 5.00%, 12/15/2026 | | | 9,805,000 | | | | 10,103,960 | |
| | | | | | | | | |
| Pharmaceuticals (3.09%) | | | | | | | | |
| AbbVie, Inc. | | | | | | | | |
| 2.15%, 11/19/2021 | | | 3,250,000 | | | | 3,252,828 | |
| Bausch Health Cos., Inc. | | | | | | | | |
| 6.13%, 04/15/2025(e) | | | 17,504,000 | | | | 17,850,055 | |
| Organon & Co. / Organon Foreign | | | | | | | | |
| Debt Co-Issuer BV | | | | | | | | |
| 4.13%, 04/30/2028(e) | | | 9,180,000 | | | | 9,317,700 | |
| 5.13%, 04/30/2031(e) | | | 7,574,000 | | | | 7,821,518 | |
| Viatris, Inc. | | | | | | | | |
| 1.13%, 06/22/2022(e) | | | 16,829,000 | | | | 16,890,092 | |
| Total Pharmaceuticals | | | | | | | 55,132,193 | |
| | | Principal Amount | | | Value (Note 2) | |
| Pipeline (4.74%) | | | | | | |
| Buckeye Partners LP | | | | | | | | |
| 4.13%, 12/01/2027 | | $ | 3,064,000 | | | $ | 3,090,810 | |
| 4.15%, 07/01/2023 | | | 3,800,000 | | | | 3,936,420 | |
| 4.35%, 10/15/2024 | | | 2,440,000 | | | | 2,555,339 | |
| 4.50%, 03/01/2028(e) | | | 6,935,000 | | | | 6,856,981 | |
| 5.60%, 10/15/2044 | | | 2,828,000 | | | | 2,746,865 | |
| Energy Transfer LP | | | | | | | | |
| 3.45%, 01/15/2023 | | | 2,027,000 | | | | 2,074,765 | |
| 4.20%, 04/15/2027 | | | 2,215,000 | | | | 2,416,946 | |
| Series B | | | | | | | | |
| 3M US L + 4.16%(a)(f) | | | 2,506,000 | | | | 2,437,085 | |
| Series F | | | | | | | | |
| 5Y US TI + 5.134%(a)(f) | | | 2,985,000 | | | | 3,070,819 | |
| Flex Intermediate Holdco LLC | | | | | | | | |
| 3.36%, 06/30/2031(e) | | | 12,936,000 | | | | 13,103,308 | |
| 4.32%, 12/30/2039(e) | | | 8,561,000 | | | | 8,972,314 | |
| Midwest Connector Capital Co. | | | | | | | | |
| LLC | | | | | | | | |
| 3.63%, 04/01/2022(e) | | | 11,522,000 | | | | 11,639,023 | |
| 3.90%, 04/01/2024(e) | | | 4,975,000 | | | | 5,184,525 | |
| 4.63%, 04/01/2029(e) | | | 2,001,000 | | | | 2,137,660 | |
| Targa Resources Partners LP / | | | | | | | | |
| Targa Resources Partners | | | | | | | | |
| Finance Corp. | | | | | | | | |
| 6.88%, 01/15/2029 | | | 3,763,000 | | | | 4,219,264 | |
| Western Midstream Operating LP | | | | | | | | |
| 4.35%, 02/01/2025 | | | 7,165,000 | | | | 7,514,294 | |
| 3M US L + 2.10%, | | | | | | | | |
| 01/13/2023(a) | | | 2,630,000 | | | | 2,610,738 | |
| Total Pipeline | | | | | | | 84,567,156 | |
| Power Generation (1.41%) | | | | | | | | |
| Alexander Funding Trust | | | | | | | | |
| 1.84%, 11/15/2023(e) | | | 5,975,000 | | | | 6,072,155 | |
| NRG Energy, Inc. | | | | | | | | |
| 2.00%, 12/02/2025(e) | | | 4,530,000 | | | | 4,583,655 | |
| 2.45%, 12/02/2027(e) | | | 5,455,000 | | | | 5,459,796 | |
| Vistra Operations Co. LLC | | | | | | | | |
| 5.50%, 09/01/2026(e) | | | 8,626,000 | | | | 8,892,975 | |
| Total Power Generation | | | | | | | 25,008,581 | |
| Property & Casualty Insurance (0.12%) | | | | | |
| Fairfax US, Inc. | | | | | | | | |
| 4.88%, 08/13/2024(e) | | | 2,000,000 | | | | 2,162,639 | |
| | | | | | | | | |
| Publishing & Broadcasting (1.02%) | | | | | | | | |
| Nexstar Media, Inc. | | | | | | | | |
| 4.75%, 11/01/2028(e) | | | 8,000,000 | | | | 8,183,200 | |
| Scripps Escrow II, Inc. | | | | | | | | |
| 3.88%, 01/15/2029(e) | | | 9,960,000 | | | | 9,922,699 | |
| Total Publishing & Broadcasting | | | | | | | 18,105,899 | |
See Notes to Financial Statements.
ALPS | Smith Total Return Bond Fund
| Statement of Investments | October 31, 2021 |
| | | Principal Amount | | | Value (Note 2) | |
| Railroad (0.21%) | | | | | | |
| Westinghouse Air Brake | | | | | | | | |
| Technologies Corp. | | | | | | | | |
| 4.95%, 09/15/2028 | | $ | 3,304,000 | | | $ | 3,802,750 | |
| | | | | | | | | |
| Real Estate (0.67%) | | | | | | | | |
| Cushman & Wakefield US | | | | | | | | |
| Borrower LLC | | | | | | | | |
| 6.75%, 05/15/2028(e) | | | 2,000,000 | | | | 2,137,500 | |
| Howard Hughes Corp. | | | | | | | | |
| 4.13%, 02/01/2029(e) | | | 3,840,000 | | | | 3,848,909 | |
| MGM Growth Properties | | | | | | | | |
| Operating Partnership LP / | | | | | | | | |
| MGP Finance Co.-Issuer, Inc. | | | | | | | | |
| 4.63%, 06/15/2025(e) | | | 5,500,000 | | | | 5,919,375 | |
| Total Real Estate | | | | | | | 11,905,784 | |
| Refining & Marketing (0.64%) | | | | | | | | |
| HollyFrontier Corp. | | | | | | | | |
| 4.50%, 10/01/2030 | | | 4,975,000 | | | | 5,425,993 | |
| 5.88%, 04/01/2026 | | | 5,044,000 | | | | 5,749,990 | |
| Total Refining & Marketing | | | | | | | 11,175,983 | |
| Restaurants (0.44%) | | | | | | | | |
| Yum! Brands, Inc. | | | | | | | | |
| 7.75%, 04/01/2025(e) | | | 7,437,000 | | | | 7,918,174 | |
| | | | | | | | | |
| Semiconductors (0.95%) | | | | | | | | |
| Microchip Technology, Inc. | | | | | | | | |
| 0.97%, 02/15/2024(e) | | | 3,985,000 | | | | 3,962,058 | |
| Micron Technology, Inc. | | | | | | | | |
| 3.48%, 11/01/2051 | | | 992,000 | | | | 993,161 | |
| TSMC Arizona Corp. | | | | | | | | |
| 1.75%, 10/25/2026 | | | 2,431,000 | | | | 2,445,573 | |
| 2.50%, 10/25/2031 | | | 1,984,000 | | | | 2,010,483 | |
| 3.13%, 10/25/2041 | | | 3,165,000 | | | | 3,305,535 | |
| 3.25%, 10/25/2051 | | | 3,972,000 | | | | 4,195,293 | |
| Total Semiconductors | | | | | | | 16,912,103 | |
| Software & Services (1.54%) | | | | | | | | |
| Black Knight InfoServ LLC | | | | | | | | |
| 3.63%, 09/01/2028(e) | | | 7,931,000 | | | | 7,901,259 | |
| CoStar Group, Inc. | | | | | | | | |
| 2.80%, 07/15/2030(e) | | | 10,000,000 | | | | 10,139,671 | |
| Nielsen Finance LLC / Nielsen | | | | | | | | |
| Finance Co. | | | | | | | | |
| 4.50%, 07/15/2029(e) | | | 1,988,000 | | | | 1,946,252 | |
| 4.75%, 07/15/2031(e) | | | 3,976,000 | | | | 3,879,980 | |
| Roper Technologies, Inc. | | | | | | | | |
| 0.45%, 08/15/2022 | | | 1,635,000 | | | | 1,635,343 | |
| VMware, Inc. | | | | | | | | |
| 2.20%, 08/15/2031 | | | 1,990,000 | | | | 1,937,940 | |
| Total Software & Services | | | | | | | 27,440,445 | |
| | | Principal Amount | | | Value (Note 2) | |
| Supermarkets & Pharmacies (0.35%) | | | | | | | | |
| Albertsons Cos. Inc / Safeway, Inc. | | | | | | | | |
| / New Albertsons LP / | | | | | | | | |
| Albertsons LLC | | | | | | | | |
| 4.63%, 01/15/2027(e) | | $ | 2,990,000 | | | $ | 3,132,922 | |
| Kroger Co. | | | | | | | | |
| 2.65%, 10/15/2026 | | | 2,860,000 | | | | 2,997,030 | |
| Total Supermarkets & Pharmacies | | | | | | | 6,129,952 | |
| Transportation & Logistics (0.42%) | | | | | | | | |
| FedEx Corp. 2020-1 Class AA Pass | | | | | | | | |
| Through Trust | | | | | | | | |
| 1.88%, 02/20/2034 | | | 7,483,245 | | | | 7,414,037 | |
| | | | | | | | | |
| Utilities (2.49%) | | | | | | | | |
| Atmos Energy Corp. | | | | | | | | |
| 3M US L + 0.38%, | | | | | | | | |
| 03/09/2023(a) | | | 1,993,000 | | | | 1,993,398 | |
| Dominion Energy, Inc. | | | | | | | | |
| 3.07%, 08/15/2024(d) | | | 1,500,000 | | | | 1,574,751 | |
| Duke Energy Corp. | | | | | | | | |
| 5Y US TI + 2.321%, | | | | | | | | |
| 01/15/2082(a) | | | 1,984,000 | | | | 1,971,815 | |
| Edison International | | | | | | | | |
| Series A | | | | | | | | |
| 5Y US TI + 4.70%(a)(f) | | | 2,638,000 | | | | 2,727,033 | |
| Exelon Corp. | | | | | | | | |
| 3.50%, 06/01/2022 | | | 2,673,000 | | | | 2,711,245 | |
| ONE Gas, Inc. | | | | | | | | |
| 0.85%, 03/11/2023 | | | 6,975,000 | | | | 6,976,928 | |
| 1.10%, 03/11/2024 | | | 2,610,000 | | | | 2,600,264 | |
| Pacific Gas and Electric Co. | | | | | | | | |
| 1.37%, 03/10/2023 | | | 3,990,000 | | | | 3,977,925 | |
| 3M US L + 1.38%, | | | | | | | | |
| 11/15/2021(a) | | | 16,968,000 | | | | 16,969,717 | |
| Southern California Edison Co. | | | | | | | | |
| 1.10%, 04/01/2024 | | | 2,990,000 | | | | 2,997,795 | |
| Total Utilities | | | | | | | 44,500,871 | |
| | | | | | | | | |
| Waste & Environment Services & Equipment (0.33%) | | | | | | | | |
| GFL Environmental, Inc. | | | | | | | | |
| 5.13%, 12/15/2026(e) | | | 5,570,000 | | | | 5,827,613 | |
| | | | | | | | | |
| Wireless Telecommunications Services (0.53%) | | | | | | | | |
| AT&T, Inc. | | | | | | | | |
| 1.70%, 03/25/2026 | | | 1,995,000 | | | | 2,004,115 | |
| Sprint Corp. | | | | | | | | |
| 7.88%, 09/15/2023 | | | 6,792,000 | | | | 7,539,120 | |
| Total Wireless Telecommunications Services | | | | | | | 9,543,235 | |
| Wireline Telecommunications Services (0.30%) | | | | | | | | |
| Lumen Technologies, Inc. | | | | | | | | |
| Series T | | | | | | | | |
| 5.80%, 03/15/2022 | | | 4,265,000 | | | | 4,318,867 | |
See Notes to Financial Statements.
ALPS | Smith Total Return Bond Fund
| Statement of Investments | October 31, 2021 |
| | | Principal Amount | | | Value (Note 2) | |
| NTT Finance Corp. | | | | | | | | |
| 0.37%, 03/03/2023(e) | | $ | 996,000 | | | $ | 995,128 | |
| Total Wireline Telecommunications Services | | | | | | | 5,313,995 | |
| | | | | | | | | |
| TOTAL CORPORATE BONDS | | | | | | | | |
| (Cost $985,301,132) | | | | | | | 1,002,857,398 | |
| | | | | | | | | |
| GOVERNMENT BONDS (26.75%) | | | | | | | | |
| | | | | | | | | |
| U.S. Treasury Bonds (26.75%) | | | | | | | | |
| United States Treasury Bonds | | | | | | | | |
| 1.13%, 02/15/2031 | | | 39,018,000 | | | | 37,640,177 | |
| 1.25%, 08/15/2031 | | | 40,302,000 | | | | 39,168,506 | |
| 1.75%, 08/15/2041 | | | 90,244,000 | | | | 86,902,151 | |
| 2.00%, 08/15/2051 | | | 34,913,000 | | | | 35,420,330 | |
| 2.38%, 05/15/2051 | | | 19,373,000 | | | | 21,298,192 | |
| United States Treasury Notes | | | | | | | | |
| 0.13%, 12/15/2023 | | | 33,353,000 | | | | 33,060,510 | |
| 0.25%, 09/30/2023 | | | 27,689,000 | | | | 27,578,677 | |
| 0.50%, 02/28/2026 | | | 41,454,000 | | | | 40,393,360 | |
| 0.63%, 07/31/2026 | | | 20,380,000 | | | | 19,866,520 | |
| 0.75%, 03/31/2026 | | | 37,305,000 | | | | 36,706,080 | |
| 0.75%, 04/30/2026 | | | 17,345,000 | | | | 17,055,352 | |
| 0.75%, 08/31/2026 | | | 17,671,000 | | | | 17,318,270 | |
| 1.25%, 09/30/2028 | | | 21,910,000 | | | | 21,610,449 | |
| 1.63%, 05/15/2031 | | | 42,647,000 | | | | 42,956,857 | |
| Total U.S. Treasury Bonds | | | | | | | 476,975,431 | |
| | | | | | | | | |
| TOTAL GOVERNMENT BONDS | | | | | | | | |
| (Cost $477,737,334) | | | | | | | 476,975,431 | |
| | | Shares | | | Value (Note 2) | |
| PREFERRED STOCK (1.14%) | | | | | | | | |
| Consumer Discretionary (0.51%) | | | | | | | | |
| Retail - Consumer Discretionary (0.51%) | | | | | | | | |
| Qurate Retail, Inc. | | | 83,200 | | | | 9,083,776 | |
| | | | | | | | | |
| TOTAL Consumer Discretionary | | | | | | | 9,083,776 | |
| | | | | | | | | |
| Financials (0.63%) | | | | | | | | |
| Banks (0.63%) | | | | | | | | |
| Bank of Hawaii, Series A(f)(g) | | | 354,302 | | | | 9,211,852 | |
| First Republic Bank(f) | | | 86,350 | | | | 2,105,213 | |
| | | | | | | | 11,317,065 | |
| | | | | | | | | |
| TOTAL Financials | | | | | | | 11,317,065 | |
| | | | | | | | | |
| TOTAL PREFERRED STOCK | | | | | | | | |
| (Cost $19,330,900) | | | | | | | 20,400,841 | |
| | | 7-Day Yield | | Shares | | | Value (Note 2) | |
| SHORT TERM INVESTMENTS (0.27%) | | | | | | | | | | | |
| Money Market Fund (0.27%) | | | | | | | | |
| Morgan Stanley Institutional Liquidity Funds - Government Portfolio | | | 0.030 | % | | 4,746,609 | | | $ | 4,746,609 | |
| | | | | | | | | |
| TOTAL SHORT TERM INVESTMENTS | | | | | | | | |
| (Cost $4,746,609) | | | | | | | 4,746,609 | |
| | | Value (Note 2) | |
| TOTAL INVESTMENTS (99.75%) | | | | |
| (Cost $1,759,981,737) | | $ | 1,778,475,607 | |
| | | | | |
| Other Assets In Excess Of Liabilities (0.25%) | | | 4,401,317 | |
| | | | | |
| NET ASSETS (100.00%) | | $ | 1,782,876,924 | |
Investment Abbreviations:
LIBOR - London Interbank Offered Rate
SOFR - Secured Overnight Financing Rate
TI – Treasury Index
Reference Rates:
1M US L - 1 Month LIBOR as of October 31, 2021 was 0.09%
3M US L - 3 Month LIBOR as of October 31, 2021 was 0.13%
7Y US TI - 7 Year US Treasury Index as of October 31, 2021 was 1.44%
1D US SOFR - 1 Day SOFR as of October 31, 2021 was 0.05%
1Y US TI - 1 Year US Treasury Bill as of October 31, 2021 was 0.15%
5Y US TI - 5 Year US Treasury Index as of October 31, 2021 was 1.18%
| (a) | Floating or variable rate security. The reference rate is described above. The rate in effect as of October 31, 2021 is based on the reference rate plus the displayed spread as of the security's last reset date. |
| (b) | Issued with zero coupon. |
| (c) | Interest only security. |
| (d) | Step bond. Coupon changes periodically based upon a predetermined schedule. Interest rate disclosed is that which is in effect as of October 31, 2021. |
| (e) | Security exempt from registration under Rule 144A of the Securities Act of 1933. This security may be resold in transactions exempt from registration, normally to qualified institutional buyers. As of October 31, 2021, the aggregate market value of those securities was $389,340,095, representing 21.84% of net assets. |
| (f) | Perpetual maturity. This security has no contractual maturity date, is not redeemable and contractually pays an indefinite stream of interest. |
| (g) | Non-Income Producing Security. |
See Notes to Financial Statements.
ALPS | Smith Credit Opportunities Fund
Statement of Investments | October 31, 2021 |
| | | Shares | | | Value
(Note 2) | |
| COMMON STOCKS (1.25%) | | | | | | | | |
| Energy (0.48%) | | | | | | | | |
| Oil & Gas (0.48%) | | | | | | | | |
| Cheniere Energy Partners LP | | | 16,500 | | | $ | 726,825 | |
| Western Midstream Partners LP | | | 35,200 | | | | 748,000 | |
| | | | | | | | 1,474,825 | |
| | | | | | | | | |
| TOTAL Energy | | | | | | | 1,474,825 | |
| | | | | | | | | |
| Financials (0.49%) | | | | | | | | |
| Financial Services (0.49%) | | | | | | | | |
| OneMain Holdings, Inc. | | | 28,550 | | | | 1,507,725 | |
| | | | | | | | | |
| TOTAL Financials | | | | | | | 1,507,725 | |
| | | | | | | | | |
| Utilities (0.28%) | | | | | | | | |
| Utilities (0.28%) | | | | | | | | |
| Vistra Corp. | | | 44,420 | | | | 870,188 | |
| | | | | | | | | |
| TOTAL Utilities | | | | | | | 870,188 | |
| | | | | | | | | |
| TOTAL COMMON STOCKS | | | | | | | | |
| (Cost $3,856,224) | | | | | | | 3,852,738 | |
| | | Shares | | | (Note 2) | |
| EXCHANGE TRADED FUNDS (2.25%) | | | | | | | | |
| Invesco Senior Loan ETF | | | 313,762 | | | | 6,927,865 | |
| | | | | | | | | |
| TOTAL EXCHANGE TRADED FUNDS | | | | | | | | |
| (Cost $6,939,938) | | | | | | | 6,927,865 | |
| | | Principal
Amount | | | Value
(Note 2) | |
| COLLATERALIZED MORTGAGE OBLIGATIONS (0.23%) | | | |
| Ginnie Mae | | | | | | | | |
| Series 2011-H05, Class FB, | | | | | | | | |
| 1M US L + 0.50%, | | | | | | | | |
| 12/20/2060(a) | | $ | 33,746 | | | $ | 33,877 | |
| Series 2011-H14, Class FC, | | | | | | | | |
| 1M US L + 0.50%, | | | | | | | | |
| 05/20/2061(a) | | | 75,139 | | | | 75,398 | |
| Series 2012-H20, Class BA, | | | | | | | | |
| 1M US L + 0.56%, | | | | | | | | |
| 09/20/2062(a) | | | 58,374 | | | | 58,579 | |
| Series 2012-H29, Class SA, | | | | | | | | |
| 1M US L + 0.515%, | | | | | | | | |
| 10/20/2062(a) | | | 58,949 | | | | 59,233 | |
| Series 2013-H07, Class GA, | | | | | | | | |
| 1M US L + 0.47%, | | | | | | | | |
| 03/20/2063(a) | | | 49,924 | | | | 50,039 | |
| | | Principal
Amount | | | Value
(Note 2) | |
| Series 2013-H10, Class FA, | | | | | | | | |
| 1M US L + 0.40%, | | | | | | | | |
| 03/20/2063(a) | | $ | 26,196 | | | $ | 26,229 | |
| Series 2013-H22, Class FT, | | | | | | | | |
| 1Y US TI + 0.65%, | | | | | | | | |
| 04/20/2063(a) | | | 35,343 | | | | 35,221 | |
| Series 2013-H23, Class FA, | | | | | | | | |
| 1M US L + 1.30%, | | | | | | | | |
| 09/20/2063(a) | | | 42,995 | | | | 43,610 | |
| Series 2014-H03, Class FA, | | | | | | | | |
| 1M US L + 0.60%, | | | | | | | | |
| 01/20/2064(a) | | | 29,244 | | | | 29,376 | |
| Series 2015-H29, Class FL, | | | | | | | | |
| 1M US L + 0.60%, | | | | | | | | |
| 11/20/2065(a) | | | 70,431 | | | | 70,990 | |
| Series 2016-H09, Class FA, | | | | | | | | |
| 1M US L + 0.65%, | | | | | | | | |
| 03/20/2066(a) | | | 55,221 | | | | 55,772 | |
| Series 2018-H07, Class FE, | | | | | | | | |
| 1M US L + 0.35%, | | | | | | | | |
| 02/20/2068(a) | | | 99,871 | | | | 99,887 | |
| Series 2020-H09, Class NF, | | | | | | | | |
| 1M US L + 1.25%, | | | | | | | | |
| 04/20/2070(a) | | | 76,829 | | | | 79,143 | |
| | | | | | | | 717,354 | |
| TOTAL COLLATERALIZED MORTGAGE OBLIGATIONS | | | |
| (Cost $697,237) | | | | | | | 717,354 | |
| | | Principal
Amount | | | Value
(Note 2) | |
| MORTGAGE-BACKED SECURITIES (0.79%) | | | | | | | | |
| Fannie Mae Pool | | | | | | | | |
| Series 1998-, | | | | | | | | |
| 6.500%, 08/01/2028 | | | 42,882 | | | | 48,284 | |
| 7.500%, 08/01/2028 | | | 29,504 | | | | 29,832 | |
| 8.500%, 06/01/2027 | | | 29,638 | | | | 30,140 | |
| Series 1999-, | | | | | | | | |
| 6.000%, 04/01/2029 | | | 43,708 | | | | 49,067 | |
| 8.000%, 04/01/2029 | | | 29,541 | | | | 29,857 | |
| Series 2001-, | | | | | | | | |
| 7.000%, 06/01/2031 | | | 30,577 | | | | 31,510 | |
| Series 2002-, | | | | | | | | |
| 6.000%, 12/01/2032 | | | 46,447 | | | | 51,582 | |
| Series 2003-, | | | | | | | | |
| 4.500%, 09/01/2028 | | | 71,815 | | | | 74,894 | |
| 4.750%, 09/01/2033 | | | 45,819 | | | | 49,995 | |
| 5.500%, 10/01/2033 | | | 33,444 | | | | 35,931 | |
| 5.500%, 12/01/2033 | | | 42,647 | | | | 47,871 | |
| Series 2005-, | | | | | | | | |
| 4.500%, 05/01/2035 | | | 21,497 | | | | 22,676 | |
| Series 2006-, | | | | | | | | |
| 4.500%, 01/01/2036 | | | 32,107 | | | | 33,356 | |
See Notes to Financial Statements.
ALPS | Smith Credit Opportunities Fund
Statement of Investments | October 31, 2021 |
| | | Principal
Amount | | | Value
(Note 2) | |
| Series 2007-, | | | | | | | | |
| 5.500%, 07/01/2037 | | $ | 22,796 | | | $ | 24,738 | |
| 6.000%, 07/01/2037 | | | 39,844 | | | | 43,070 | |
| 6.000%, 09/01/2037 | | | 48,485 | | | | 54,605 | |
| 6.500%, 11/01/2037 | | | 47,371 | | | | 53,326 | |
| Series 2008-, | | | | | | | | |
| 5.000%, 06/01/2037 | | | 54,691 | | | | 59,731 | |
| 5.500%, 04/01/2038 | | | 24,884 | | | | 27,302 | |
| 5.500%, 08/01/2038 | | | 31,071 | | | | 34,468 | |
| 6.500%, 07/01/2038 | | | 48,659 | | | | 54,774 | |
| Series 2009-, | | | | | | | | |
| 5.000%, 04/01/2039 | | | 57,226 | | | | 61,730 | |
| Series 2010-, | | | | | | | | |
| 4.000%, 05/01/2040 | | | 15,466 | | | | 16,158 | |
| 5.500%, 02/01/2038 | | | 54,272 | | | | 59,445 | |
| Series 2015-, | | | | | | | | |
| 5.000%, 07/01/2044 | | | 29,764 | | | | 33,620 | |
| Series 2016-, | | | | | | | | |
| 3.500%, 06/01/2046 | | | 62,073 | | | | 64,873 | |
| | | | | | | | 1,122,835 | |
| Freddie Mac Gold Pool | | | | | | | | |
| 04/01/2040 | | | 56,180 | | | | 63,485 | |
| Series 2004-, | | | | | | | | |
| 5.500%, 01/01/2034 | | | 31,517 | | | | 33,127 | |
| Series 2006-, | | | | | | | | |
| 4.500%, 01/01/2036 | | | 15,250 | | | | 16,655 | |
| 5.500%, 12/01/2034 | | | 35,566 | | | | 39,311 | |
| 5.500%, 08/01/2036 | | | 21,058 | | | | 22,794 | |
| 6.000%, 05/01/2036 | | | 60,919 | | | | 68,461 | |
| Series 2007-, | | | | | | | | |
| 5.500%, 10/01/2037 | | | 10,727 | | | | 11,996 | |
| Series 2008-, | | | | | | | | |
| 4.500%, 05/01/2038 | | | 64,814 | | | | 67,387 | |
| 6.000%, 08/01/2038 | | | 45,495 | | | | 53,575 | |
| Series 2014-, | | | | | | | | |
| 3.500%, 10/01/2044 | | | 64,300 | | | | 67,209 | |
| Series 2015-, | | | | | | | | |
| 4.000%, 03/01/2044 | | | 45,993 | | | | 50,113 | |
| | | | | | | | 494,113 | |
| Freddie Mac Pool | | | | | | | | |
| Series 2018-, | | | | | | | | |
| 4.500%, 01/01/2036 | | | 87,641 | | | | 96,277 | |
| | | | | | | | 96,277 | |
| Ginnie Mae I Pool | | | | | | | | |
| Series 2003-, | | | | | | | | |
| 5.500%, 10/15/2033 | | | 76,250 | | | | 89,426 | |
| Series 2010-, | | | | | | | | |
| 5.000%, 05/15/2040 | | | 43,218 | | | | 49,026 | |
| | | | | | | | 138,452 | |
| Ginnie Mae II Pool | | | | | | | | |
| Series 2009-, | | | | | | | | |
| 6.000%, 11/20/2039 | | | 40,270 | | | | 47,253 | |
| Series 2011-, | | | | | | | | |
| 4.000%, 02/20/2041 | | | 38,501 | | | | 41,048 | |
| 4.000%, 05/20/2041 | | | 37,014 | | | | 39,477 | |
| | | Principal
Amount | | | Value
(Note 2) | |
| 4.000%, 10/20/2041 | | $ | 20,600 | | | $ | 21,961 | |
| Series 2012-, | | | | | | | | |
| 3.500%, 05/20/2042 | | | 86,582 | | | | 92,473 | |
| Series 2013-, | | | | | | | | |
| 5.500%, 11/20/2035 | | | 104,342 | | | | 119,869 | |
| Series 2014-, | | | | | | | | |
| 3.750%, 04/20/2044 | | | 81,610 | | | | 89,334 | |
| 4.000%, 05/20/2044 | | | 71,285 | | | | 75,650 | |
| Series 2016-, | | | | | | | | |
| 3.500%, 09/20/2046 | | | 51,625 | | | | 52,621 | |
| | | | | | | | 579,686 | |
| TOTAL MORTGAGE-BACKED SECURITIES | | | | | | | | |
| (Cost $2,398,728) | | | | | | | 2,431,363 | |
| | | Shares | | | Value
(Note 2) | |
| CORPORATE BONDS (86.74%) | | | | | | | | |
| | | | | | | | | |
| Advertising & Marketing (1.30%) | | | | | | | | |
| Outfront Media Capital LLC / Outfront Media Capital Corp. | | | | | | | | |
| 4.25%, 01/15/2029(b) | | | 900,000 | | | | 883,125 | |
| 5.00%, 08/15/2027(b) | | | 3,052,000 | | | | 3,116,855 | |
| Total Advertising & Marketing | | | | | | | 3,999,980 | |
| Aerospace & Defense (2.03%) | | | | | | | | |
| Boeing Co. | | | | | | | | |
| 2.20%, 02/04/2026 | | | 3,850,000 | | | | 3,857,731 | |
| TransDigm, Inc. | | | | | | | | |
| 6.25%, 03/15/2026(b) | | | 2,250,000 | | | | 2,351,250 | |
| Total Aerospace & Defense | | | | | | | 6,208,981 | |
| Airlines (2.87%) | | | | | | | | |
| Alaska Airlines 2020-1 Class A Pass Through Trust | | | | | | | | |
| 4.80%, 08/15/2027(b) | | | 691,209 | | | | 768,888 | |
| Alaska Airlines 2020-1 Class B Pass Through Trust | | | | | | | | |
| 8.00%, 08/15/2025(b) | | | 1,339,116 | | | | 1,512,128 | |
| British Airways 2020-1 Class A Pass Through Trust | | | | | | | | |
| 4.25%, 11/15/2032(b) | | | 1,441,669 | | | | 1,558,172 | |
| Delta Air Lines, Inc. | | | | | | | | |
| 7.00%, 05/01/2025(b) | | | 2,500,000 | | | | 2,918,083 | |
| United Airlines 2020-1 Class A Pass Through Trust | | | | | | | | |
| Series 20-1 | | | | | | | | |
| 5.88%, 10/15/2027 | | | 1,851,765 | | | | 2,075,478 | |
| Total Airlines | | | | | | | 8,832,749 | |
| Apparel & Textile Products (0.68%) | | | | | | | | |
| Hanesbrands, Inc. | | | | | | | | |
| 5.38%, 05/15/2025(b) | | | 2,000,000 | | | | 2,082,500 | |
See Notes to Financial Statements.
ALPS | Smith Credit Opportunities Fund
Statement of Investments | October 31, 2021 |
| | | Shares | | | Value
(Note 2) | |
| Automobiles Manufacturing (4.83%) | | | | | | | | |
| Ford Motor Co. | | | | | | | | |
| 5.29%, 12/08/2046 | | $ | 1,300,000 | | | $ | 1,493,304 | |
| 9.00%, 04/22/2025 | | | 3,750,000 | | | | 4,514,062 | |
| Ford Motor Credit Co. LLC | | | | | | | | |
| 4.00%, 11/13/2030 | | | 450,000 | | | | 470,250 | |
| General Motors Co. | | | | | | | | |
| 5.00%, 04/01/2035 | | | 905,000 | | | | 1,073,654 | |
| 5.40%, 10/02/2023 | | | 1,000,000 | | | | 1,082,512 | |
| Nissan Motor Co., Ltd. | | | | | | | | |
| 4.35%, 09/17/2027(b) | | | 1,400,000 | | | | 1,519,141 | |
| 4.81%, 09/17/2030(b) | | | 4,200,000 | | | | 4,671,121 | |
| Total Automobiles Manufacturing | | | | | | | 14,824,044 | |
| Banks (5.08%) | | | | | | | | |
| Danske Bank A/S | | | | | | | | |
| 5.38%, 01/12/2024(b) | | | 1,500,000 | | | | 1,634,300 | |
| PNC Financial Services Group, Inc. | | | | | | | | |
| Series O | | | | | | | | |
| 3M US L + 3.678%(a)(c) | | | 2,349,000 | | | | 2,363,271 | |
| SVB Financial Group | | | | | | | | |
| Series E | | | | | | | | |
| 10Y US TI + 3.064%(a)(c) | | | 6,500,000 | | | | 6,617,812 | |
| Synovus Bank/Columbus GA | | | | | | | | |
| 5Y US TI + 3.63%, | | | | | | | | |
| 10/29/2030(a) | | | 1,774,000 | | | | 1,847,577 | |
| UniCredit SpA | | | | | | | | |
| 5Y US TI + 4.75%, | | | | | | | | |
| 06/30/2035(a)(b) | | | 2,850,000 | | | | 3,120,020 | |
| Total Banks | | | | | | | 15,582,980 | |
| Cable & Satellite (0.64%) | | | | | | | | |
| CCO Holdings LLC / CCO Holdings | | | | | | | | |
| Capital Corp. | | | | | | | | |
| 4.50%, 05/01/2032 | | | 1,950,000 | | | | 1,961,710 | |
| Casinos & Gaming (3.79%) | | | | | | | | |
| Boyd Gaming Corp. | | | | | | | | |
| 4.75%, 12/01/2027 | | | 3,750,000 | | | | 3,868,312 | |
| 8.63%, 06/01/2025(b) | | | 575,000 | | | | 620,281 | |
| International Game Technology PLC | | | | | | | | |
| 4.13%, 04/15/2026(b) | | | 1,000,000 | | | | 1,028,750 | |
| MGM Resorts International | | | | | | | | |
| 4.75%, 10/15/2028 | | | 2,150,000 | | | | 2,237,524 | |
| Penn National Gaming, Inc. | | | | | | | | |
| 5.63%, 01/15/2027(b) | | | 1,574,000 | | | | 1,627,123 | |
| Station Casinos LLC | | | | | | | | |
| 4.50%, 02/15/2028(b) | | | 2,266,000 | | | | 2,285,828 | |
| Total Casinos & Gaming | | | | | | | 11,667,818 | |
| Chemicals (0.54%) | | | | | | | | |
| Kraton Polymers LLC / Kraton | | | | | | | | |
| Polymers Capital Corp. | | | | | | | | |
| 4.25%, 12/15/2025(b) | | | 1,600,000 | | | | 1,656,000 | |
| | | Shares | | | Value
(Note 2) | |
| Commercial Finance (5.02%) | | | | | | | | |
| AerCap Holdings NV | | | | | | | | |
| 5Y US TI + 4.535%, | | | | | | | | |
| 10/10/2079(a) | | $ | 2,519,000 | | | $ | 2,631,700 | |
| AerCap Ireland Capital DAC / AerCap Global Aviation Trust | | | | | | | | |
| 3.00%, 10/29/2028 | | | 2,000,000 | | | | 2,029,238 | |
| Air Lease Corp. | | | | | | | | |
| Series C | | | | | | | | |
| 5Y US TI + 3.149%(a)(c) | | | 3,000,000 | | | | 2,962,500 | |
| Aircastle, Ltd. | | | | | | | | |
| 2.85%, 01/26/2028(b) | | | 1,625,000 | | | | 1,637,258 | |
| Antares Holdings LP | | | | | | | | |
| 2.75%, 01/15/2027(b) | | | 500,000 | | | | 495,247 | |
| 3.95%, 07/15/2026(b) | | | 2,500,000 | | | | 2,607,225 | |
| Avolon Holdings Funding, Ltd. | | | | | | | | |
| 2.53%, 11/18/2027(b) | | | 1,500,000 | | | | 1,473,557 | |
| 2.75%, 02/21/2028(b) | | | 1,625,000 | | | | 1,609,657 | |
| Total Commercial Finance | | | | | | | 15,446,382 | |
| Communications Equipment (0.32%) | | | | | | | | |
| CommScope, Inc. | | | | | | | | |
| 4.75%, 09/01/2029(b) | | | 1,000,000 | | | | 982,450 | |
| | | | | | | | | |
| Consumer Finance (3.92%) | | | | | | | | |
| American Express Co. | | | | | | | | |
| Series B | | | | | | | | |
| 3M US L + 3.43%(a)(c) | | | 1,450,000 | | | | 1,450,015 | |
| Apollo Commercial Real Estate Finance, Inc. | | | | | | | | |
| 4.63%, 06/15/2029(b) | | | 1,500,000 | | | | 1,445,625 | |
| Ladder Capital Finance Holdings | | | | | | | | |
| LLLP / Ladder Capital Finance Corp. | | | | | | | | |
| 4.75%, 06/15/2029(b) | | | 2,250,000 | | | | 2,269,688 | |
| LD Holdings Group LLC | | | | | | | | |
| 6.50%, 11/01/2025(b) | | | 3,000,000 | | | | 2,945,355 | |
| OneMain Finance Corp. | | | | | | | | |
| 8.88%, 06/01/2025 | | | 3,625,000 | | | | 3,924,062 | |
| Total Consumer Finance | | | | | | | 12,034,745 | |
| Consumer Services (2.40%) | | | | | | | | |
| Allied Universal Holdco LLC/Allied Universal Finance Corp./Atlas Luxco 4 Sarl 4.63%, 06/01/2028(b) | | | 3,600,000 | | | | 3,574,830 | |
| GXO Logistics, Inc. | | | | | | | | |
| 1.65%, 07/15/2026(b) | | | 1,500,000 | | | | 1,475,723 | |
| WASH Multifamily Acquisition, Inc. | | | | | | | | |
| 5.75%, 04/15/2026(b) | | | 2,250,000 | | | | 2,328,750 | |
| Total Consumer Services | | | | | | | 7,379,303 | |
| Containers & Packaging (0.97%) | | | | | | | | |
| Canpack SA / Canpack US LLC | | | | | | | | |
| 3.88%, 11/15/2029(b) | | | 3,000,000 | | | | 2,981,250 | |
See Notes to Financial Statements.
ALPS | Smith Credit Opportunities Fund
Statement of Investments | October 31, 2021 |
| | | Shares | | | Value
(Note 2) | |
| Department Stores (1.35%) | | | | | | | | |
| NMG Holding Co. Inc / Neiman | | | | | | | | |
| Marcus Group LLC | | | | | | | | |
| 7.13%, 04/01/2026(b) | | $ | 2,200,000 | | | $ | 2,313,409 | |
| Nordstrom, Inc. | | | | | | | | |
| 4.25%, 08/01/2031 | | | 1,802,000 | | | | 1,803,937 | |
| Total Department Stores | | | | | | | 4,117,346 | |
| Diversified Banks (1.78%) | | | | | | | | |
| Bank of America Corp. | | | | | | | | |
| 5Y US TI + 1.20%, | | | | | | | | |
| 09/21/2036(a) | | | 3,050,000 | | | | 2,968,093 | |
| Citigroup, Inc. | | | | | | | | |
| 4.30%, 11/20/2026 | | | 2,250,000 | | | | 2,497,975 | |
| Total Diversified Banks | | | | | | | 5,466,068 | |
| Exploration & Production (1.52%) | | | | | | | | |
| Hilcorp Energy I LP / Hilcorp Finance Co. | | | | | | | | |
| 5.75%, 02/01/2029(b) | | | 3,050,000 | | | | 3,099,563 | |
| 6.25%, 11/01/2028(b) | | | 501,000 | | | | 514,855 | |
| Murphy Oil Corp. | | | | | | | | |
| 6.38%, 07/15/2028 | | | 1,000,000 | | | | 1,057,600 | |
| Total Exploration & Production | | | | | | | 4,672,018 | |
| Financial Services (5.89%) | | | | | | | | |
| Credit Suisse Group AG | | | | | | | | |
| 3.57%, 01/09/2023(b) | | | 300,000 | | | | 301,659 | |
| 1D US SOFR + 1.73%, | | | | | | | | |
| 05/14/2032(a)(b) | | | 2,000,000 | | | | 2,037,857 | |
| 5Y US TI + 3.55%(a)(b)(c) | | | 1,275,000 | | | | 1,242,743 | |
| 5Y US TI + 4.82%(a)(b)(c) | | | 2,200,000 | | | | 2,400,750 | |
| Golub Capital BDC, Inc. | | | | | | | | |
| 2.50%, 08/24/2026 | | | 3,750,000 | | | | 3,726,211 | |
| 3.38%, 04/15/2024 | | | 950,000 | | | | 984,457 | |
| Morgan Stanley | | | | | | | | |
| 1D US SOFR + 1.36%, | | | | | | | | |
| 09/16/2036(a) | | | 3,100,000 | | | | 3,014,097 | |
| OWL Rock Core Income Corp. | | | | | | | | |
| 3.13%, 09/23/2026(b) | | | 4,500,000 | | | | 4,400,851 | |
| Total Financial Services | | | | | | | 18,108,625 | |
| Food & Beverage (0.66%) | | | | | | | | |
| Lamb Weston Holdings, Inc. | | | | | | | | |
| 4.13%, 01/31/2030(b) | | | 1,000,000 | | | | 1,002,200 | |
| 4.38%, 01/31/2032(b) | | | 1,000,000 | | | | 1,002,735 | |
| Total Food & Beverage | | | | | | | 2,004,935 | |
| Forest & Paper Products Manufacturing (0.68%) | | | | | | | | |
| Resolute Forest Products, Inc. | | | | | | | | |
| 4.88%, 03/01/2026(b) | | | 2,050,000 | | | | 2,088,438 | |
| Funds & Trusts (1.61%) | | | | | | | | |
| Blackstone Private Credit Fund | | | | | | | | |
| 1.75%, 09/15/2024(b) | | | 3,000,000 | | | | 2,973,199 | |
| 2.63%, 12/15/2026(b) | | | 2,000,000 | | | | 1,963,230 | |
| Total Funds & Trusts | | | | | | | 4,936,429 | |
| | | Shares | | | Value
(Note 2) | |
| Hardware (0.33%) | | | | | | | | |
| NCR Corp. | | | | | | | | |
| 5.13%, 04/15/2029(b) | | $ | 1,000,000 | | | $ | 1,023,830 | |
| Homebuilders (2.54%) | | | | | | | | |
| Forestar Group, Inc. | | | | | | | | |
| 3.85%, 05/15/2026(b) | | | 4,103,000 | | | | 4,108,108 | |
| Shea Homes LP / Shea Homes Funding Corp. | | | | | | | | |
| 4.75%, 02/15/2028(b) | | | 125,000 | | | | 126,094 | |
| 4.75%, 04/01/2029(b) | | | 1,375,000 | | | | 1,383,594 | |
| Tri Pointe Homes, Inc. | | | | | | | | |
| 5.70%, 06/15/2028 | | | 2,000,000 | | | | 2,177,500 | |
| Total Homebuilders | | | | | | | 7,795,296 | |
| Industrial Other (1.66%) | | | | | | | | |
| Dycom Industries, Inc. | | | | | | | | |
| 4.50%, 04/15/2029(b) | | | 3,500,000 | | | | 3,556,875 | |
| Element Fleet Management Corp. | | | | | | | | |
| 1.60%, 04/06/2024(b) | | | 1,530,000 | | | | 1,540,887 | |
| Total Industrial Other | | | | | | | 5,097,762 | |
| Internet Media (0.65%) | | | | | | | | |
| Endure Digital, Inc. | | | | | | | | |
| 6.00%, 02/15/2029(b) | | | 1,000,000 | | | | 921,710 | |
| Uber Technologies, Inc. | | | | | | | | |
| 8.00%, 11/01/2026(b) | | | 1,000,000 | | | | 1,065,650 | |
| Total Internet Media | | | | | | | 1,987,360 | |
| Leisure Products Manufacturing (0.76%) | | | | | | | | |
| Vista Outdoor, Inc. | | | | | | | | |
| 4.50%, 03/15/2029(b) | | | 2,315,000 | | | | 2,320,788 | |
| Metals & Mining (1.66%) | | | | | | | | |
| SunCoke Energy, Inc. | | | | | | | | |
| 4.88%, 06/30/2029(b) | | | 3,000,000 | | | | 2,981,250 | |
| TMS International Corp. | | | | | | | | |
| 6.25%, 04/15/2029(b) | | | 500,000 | | | | 516,875 | |
| United States Steel Corp. | | | | | | | | |
| 6.88%, 03/01/2029 | | | 1,500,000 | | | | 1,606,875 | |
| Total Metals & Mining | | | | | | | 5,105,000 | |
| Pharmaceuticals (2.65%) | | | | | | | | |
| Bausch Health Cos., Inc. | | | | | | | | |
| 6.13%, 04/15/2025(b) | | | 5,941,000 | | | | 6,058,454 | |
| Organon & Co. / Organon Foreign | | | | | | | | |
| Debt Co-Issuer BV | | | | | | | | |
| 5.13%, 04/30/2031(b) | | | 2,030,000 | | | | 2,096,340 | |
| Total Pharmaceuticals | | | | | | | 8,154,794 | |
| Pipeline (5.49%) | | | | | | | | |
| Buckeye Partners LP | | | | | | | | |
| 4.13%, 12/01/2027 | | | 505,000 | | | | 509,419 | |
| 4.50%, 03/01/2028(b) | | | 3,275,000 | | | | 3,238,155 | |
| 5.60%, 10/15/2044 | | | 660,000 | | | | 641,065 | |
| Energy Transfer LP | | | | | | | | |
| 4.20%, 04/15/2027 | | | 750,000 | | | | 818,379 | |
See Notes to Financial Statements.
ALPS | Smith Credit Opportunities Fund
Statement of Investments | October 31, 2021 |
| | | Shares | | | Value
(Note 2) | |
| Series B | | | | | | | | |
| 3M US L + 4.16%(a)(c) | | $ | 875,000 | | | $ | 850,938 | |
| Flex Intermediate Holdco LLC | | | | | | | | |
| 3.36%, 06/30/2031(b) | | | 3,071,000 | | | | 3,110,718 | |
| 4.32%, 12/30/2039(b) | | | 1,733,000 | | | | 1,816,262 | |
| Genesis Energy LP / Genesis Energy Finance Corp. | | | | | | | | |
| 8.00%, 01/15/2027 | | | 2,200,000 | | | | 2,213,794 | |
| Midwest Connector Capital Co. LLC | | | | | | | | |
| 3.90%, 04/01/2024(b) | | | 275,000 | | | | 286,582 | |
| 4.63%, 04/01/2029(b) | | | 934,000 | | | | 997,788 | |
| Targa Resources Partners LP / Targa | | | | | | | | |
| Resources Partners Finance Corp. | | | | | | | | |
| 6.88%, 01/15/2029 | | | 1,014,000 | | | | 1,136,948 | |
| Western Midstream Operating LP | | | | | | | | |
| 4.35%, 02/01/2025 | | | 525,000 | | | | 550,594 | |
| 3M US L + 2.10%, | | | | | | | | |
| 01/13/2023(a) | | | 700,000 | | | | 694,873 | |
| Total Pipeline | | | | | | | 16,865,515 | |
| Power Generation (0.89%) | | | | | | | | |
| Alexander Funding Trust | | | | | | | | |
| 1.84%, 11/15/2023(b) | | | 1,350,000 | | | | 1,371,951 | |
| Vistra Operations Co. LLC | | | | | | | | |
| 5.50%, 09/01/2026(b) | | | 1,325,000 | | | | 1,366,009 | |
| Total Power Generation | | | | | | | 2,737,960 | |
| Publishing & Broadcasting (3.91%) | | | | | | | | |
| Gray Escrow II, Inc. | | | | | | | | |
| 5.38%, 11/15/2031(b) | | | 2,000,000 | | | | 2,022,500 | |
| Gray Television, Inc. | | | | | | | | |
| 4.75%, 10/15/2030(b) | | | 2,000,000 | | | | 1,975,315 | |
| Nexstar Media, Inc. | | | | | | | | |
| 4.75%, 11/01/2028(b) | | | 700,000 | | | | 716,030 | |
| 5.63%, 07/15/2027(b) | | | 2,000,000 | | | | 2,112,500 | |
| Scripps Escrow II, Inc. | | | | | | | | |
| 5.38%, 01/15/2031(b) | | | 5,300,000 | | | | 5,194,158 | |
| Total Publishing & Broadcasting | | | | | | | 12,020,503 | |
| Railroad (1.12%) | | | | | | | | |
| Westinghouse Air Brake Technologies Corp. | | | | | | | | |
| 4.95%, 09/15/2028 | | | 3,000,000 | | | | 3,452,860 | |
| | | | | | | | | |
| Real Estate (4.93%) | | | | | | | | |
| Cushman & Wakefield US Borrower LLC | | | | | | | | |
| 6.75%, 05/15/2028(b) | | | 2,975,000 | | | | 3,179,531 | |
| GLP Capital LP / GLP Financing II, Inc. | | | | | | | | |
| 5.30%, 01/15/2029 | | | 2,600,000 | | | | 2,977,806 | |
| Howard Hughes Corp. | | | | | | | | |
| 4.13%, 02/01/2029(b) | | | 1,475,000 | | | | 1,478,422 | |
| 4.38%, 02/01/2031(b) | | | 160,000 | | | | 160,258 | |
| Kennedy-Wilson, Inc. | | | | | | | | |
| 4.75%, 02/01/2030 | | | 3,184,000 | | | | 3,207,880 | |
| | | Shares | | | Value
(Note 2) | |
| MGM Growth Properties Operating | | | | | | | | |
Partnership LP / MGP Finance Co.-Issuer, Inc. | | | | | | | | |
| 4.63%, 06/15/2025(b) | | $ | 200,000 | | | $ | 215,250 | |
| Realogy Group LLC / Realogy Co.- Issuer Corp. | | | | | | | | |
| 5.75%, 01/15/2029(b) | | | 2,900,000 | | | | 3,008,750 | |
| 9.38%, 04/01/2027(b) | | | 850,000 | | | | 930,750 | |
| Total Real Estate | | | | | | | 15,158,647 | |
| Refining & Marketing (0.39%) | | | | | | | | |
| HollyFrontier Corp. | | | | | | | | |
| 4.50%, 10/01/2030 | | | 750,000 | | | | 817,989 | |
| 5.88%, 04/01/2026 | | | 325,000 | | | | 370,489 | |
| Total Refining & Marketing | | | | | | | 1,188,478 | |
| Retail - Consumer Discretionary (1.70%) | | | | | | | | |
| Carvana Co. | | | | | | | | |
| 5.50%, 04/15/2027(b) | | | 1,500,000 | | | | 1,513,125 | |
| Foot Locker, Inc. | | | | | | | | |
| 4.00%, 10/01/2029(b) | | | 1,250,000 | | | | 1,240,838 | |
| Gap, Inc. | | | | | | | | |
| 3.63%, 10/01/2029(b) | | | 1,200,000 | | | | 1,177,500 | |
| Victoria’s Secret & Co. | | | | | | | | |
| 4.63%, 07/15/2029(b) | | | 1,325,000 | | | | 1,332,486 | |
| Total Retail - Consumer Discretionary | | | | | | | 5,263,949 | |
| Retail - Consumer Staples (0.39%) | | | | | | | | |
| United Natural Foods, Inc. | | | | | | | | |
| 6.75%, 10/15/2028(b) | | | 1,100,000 | | | | 1,192,125 | |
| Software & Services (4.74%) | | | | | | | | |
| Black Knight InfoServ LLC | | | | | | | | |
| 3.63%, 09/01/2028(b) | | | 1,175,000 | | | | 1,170,594 | |
| HealthEquity, Inc. | | | | | | | | |
| 4.50%, 10/01/2029(b) | | | 1,750,000 | | | | 1,771,875 | |
| Nielsen Finance LLC / Nielsen Finance Co. | | | | | | | | |
| 4.50%, 07/15/2029(b) | | | 3,500,000 | | | | 3,426,500 | |
| 4.75%, 07/15/2031(b) | | | 1,000,000 | | | | 975,850 | |
| Playtika Holding Corp. | | | | | | | | |
| 4.25%, 03/15/2029(b) | | | 2,700,000 | | | | 2,710,935 | |
| ROBLOX Corp. | | | | | | | | |
| 3.88%, 05/01/2030(b) | | | 4,500,000 | | | | 4,488,750 | |
| Total Software & Services | | | | | | | 14,544,504 | |
| Supermarkets & Pharmacies (1.46%) | | | | | | | | |
| Albertsons Cos. Inc / Safeway, Inc. / New Albertsons LP / Albertsons LLC | | | | | | | | |
| 4.63%, 01/15/2027(b) | | | 1,500,000 | | | | 1,571,700 | |
| Arko Corp. | | | | | | | | |
| 5.13%, 11/15/2029(b) | | | 3,000,000 | | | | 2,932,050 | |
| Total Supermarkets & Pharmacies | | | | | | | 4,503,750 | |
See Notes to Financial Statements.
ALPS | Smith Credit Opportunities Fund
Statement of Investments | October 31, 2021 |
| | | Shares | | | Value
(Note 2) | |
| Transportation & Logistics (0.37%) | | | | | | | | |
| Meritor, Inc. | | | | | | | | |
| 4.50%, 12/15/2028(b) | | $ | 1,150,000 | | | $ | 1,145,688 | |
| | | | | | | | | |
| Utilities (1.74%) | | | | | | | | |
| Edison International | | | | | | | | |
| Series A | | | | | | | | |
| 5Y US TI + 4.70%(a)(c) | | | 477,000 | | | | 493,099 | |
| Pacific Gas and Electric Co. | | | | | | | | |
| 3M US L + 1.38%, | | | | | | | | |
| 11/15/2021(a) | | | 1,840,000 | | | | 1,840,186 | |
| Suburban Propane Partners | | | | | | | | |
| LP/Suburban Energy Finance Corp. | | | | | | | | |
| 5.00%, 06/01/2031(b) | | | 2,037,000 | | | | 2,090,471 | |
| Superior Plus LP / Superior General Partner, Inc. | | | | | | | | |
| 4.50%, 03/15/2029(b) | | | 900,000 | | | | 921,555 | |
| Total Utilities | | | | | | | 5,345,311 | |
| Waste & Environment Services & Equipment (0.99%) | | | | | | | | |
| GFL Environmental, Inc. | | | | | | | | |
| 4.00%, 08/01/2028(b) | | | 2,700,000 | | | | 2,635,875 | |
| 5.13%, 12/15/2026(b) | | | 399,000 | | | | 417,454 | |
| Total Waste & Environment Services & Equipment | | | | | | | 3,053,329 | |
| Wireline Telecommunications Services (0.49%) | | | | | | | | |
| Consolidated Communications, Inc. | | | | | | | | |
| 5.00%, 10/02/2028(b) | | | 1,500,000 | | | | 1,516,883 | |
| | | | | | | | | |
| TOTAL CORPORATE BONDS | | | | | | | | |
| (Cost $265,987,596) | | | | | | | 266,509,083 | |
| | | Shares | | | | Value
(Note 2) | |
| GOVERNMENT BONDS (3.73%) | | | | | | | | |
| U.S. Treasury Bonds (3.73%) | | | | | | | | |
| United States Treasury Bonds | | | | | | | | |
| 1.75%, 08/15/2041 | | | 10,258,000 | | | | 9,878,133 | |
| 2.00%, 08/15/2051 | | | 1,573,000 | | | | 1,595,858 | |
| Total U.S. Treasury Bonds | | | | 11,473,991 | |
| TOTAL GOVERNMENT BONDS | | | | | |
| (Cost $11,375,694) | | | | 11,473,991 | |
| | | Shares | | | Value
(Note 2) | |
| PREFERRED STOCK (3.65%) | | | | | | | | |
| Consumer Discretionary (1.53%) | | | | | | | | |
| Retail - Consumer Discretionary (1.53%) | | | | | | | | |
| Qurate Retail, Inc. | | | 43,000 | | | | 4,694,740 | |
| TOTAL Consumer Discretionary | | | | | | | 4,694,740 | |
| | | Shares | | | Value
(Note 2) | |
| Financials (2.12%) | | | | | | | | |
| Banks (1.30%) | | | | | | | | |
| Bank of Hawaii, Series A(c)(d) | | | 106,350 | | | $ | 2,765,100 | |
| First Republic Bank(c) | | | 33,000 | | | | 804,540 | |
| US Bancorp(c) | | | 17,200 | | | | 430,172 | |
| | | | | | | | 3,999,812 | |
| Financial Services (0.82%) | | | | | | | | |
| Morgan Stanley(c)(d) | | | 100,000 | | | | 2,508,000 | |
| | | | | | | | | |
| TOTAL Financials | | | | | | | 6,507,812 | |
| | | | | | | | | |
| TOTAL PREFERRED STOCK | | | | | | | | |
| (Cost $10,971,434) | | | | | | | 11,202,552 | |
| | | 7-Day
Yield | | | Shares | | | Value
(Note 2) | |
| SHORT TERM INVESTMENTS (0.66%) | | | | | | | | | | | | |
| Money Market Fund (0.66%) | | | | | | | | | | | | |
| Morgan Stanley Institutional Liquidity Funds - Government Portfolio | | | 0.030% | | | | 2,035,407 | | | | 2,035,407 | |
| TOTAL SHORT TERM INVESTMENTS | | | |
| (Cost $2,035,407) | | 2,035,407 | |
| TOTAL INVESTMENTS (99.30%) | | | | | | |
| (Cost $304,262,258) | $ | 305,150,353 | |
| Other Assets In Excess Of Liabilities (0.70%) | | 2,151,945 | |
| | | | | | | | | | | | | |
| NET ASSETS (100.00%) | $ | 307,302,298 | |
Investment Abbreviations:
LIBOR - London Interbank Offered Rate
SOFR - Secured Overnight Financing Rate
TI – Treasury Index
Reference Rates:
1M US L - 1 Month LIBOR as of October 31, 2021 was 0.09%
3M US L - 3 Month LIBOR as of October 31, 2021 was 0.13%
1D US SOFR - 1 Day SOFR as of October 31, 2021 was 0.05%
1Y US TI - 1 Year US Treasury Bill as of October 31, 2021 was 0.15%
5Y US TI - 5 Year US Treasury Index as of October 31, 2021 was 1.18%
10Y US TI - 10 Year US Treasury Index as of October 31, 2021 was 1.55%
See Notes to Financial Statements.
ALPS | Smith Credit Opportunities Fund
Statement of Investments | October 31, 2021 |
| (a) | Floating or variable rate security. The reference rate is described above. The rate in effect as of October 31, 2021 is based on the reference rate plus the displayed spread as of the security’s last reset date. |
| (b) | Security exempt from registration under Rule 144A of the Securities Act of 1933. This security may be resold in transactions exempt from registration, normally to qualified institutional buyers. As of October 31, 2021, the aggregate market value of those securities was $179,635,307, representing 58.46% of net assets. |
| (c) | Perpetual maturity. This security has no contractual maturity date, is not redeemable and contractually pays an indefinite stream of interest. |
| (d) | Non-Income Producing Security. |
See Notes to Financial Statements.
| ALPS | Smith Balanced Opportunity Fund | |
| Statement of Investments | October 31, 2021 |
| | | | | Value |
| | | Shares | | (Note 2) |
| COMMON STOCKS (60.49%) | | | | | | | | |
| | | | | | | | | |
| Communications (4.95%) | | | | | | | | |
| Media (4.95%) | | | | | | | | |
| Alphabet, Inc., Class A(a) | | | 347 | | | $ | 1,027,438 | |
| IAC/InterActiveCorp(a) | | | 865 | | | | 131,800 | |
| Meta Platforms, Inc., Class A(a) | | | 1,419 | | | | 459,146 | |
| ViacomCBS, Inc., Class B | | | 3,347 | | | | 121,228 | |
| Walt Disney Co.(a) | | | 1,424 | | | | 240,756 | |
| | | | | | | | 1,980,368 | |
| | | | | | | | | |
| TOTAL Communications | | | | | | | 1,980,368 | |
| | | | | | | | | |
| Consumer Discretionary (6.87%) | | | | | | | | |
| Consumer Discretionary Products (2.11%) | | | | | | | | |
| Bayerische Motoren Werke AG, ADR | | | 6,920 | | | | 233,896 | |
| Brunswick Corp. | | | 1,827 | | | | 170,075 | |
| Lennar Corp., Class A | | | 2,421 | | | | 241,931 | |
| YETI Holdings, Inc.(a) | | | 2,048 | | | | 201,380 | |
| | | | | | | | 847,282 | |
| | | | | | | | | |
| Consumer Discretionary Services (1.98%) | | | | | | | | |
| Carnival Corp.(a) | | | 7,675 | | | | 170,078 | |
| Marriott International, Inc., Class A(a) | | | 1,329 | | | | 212,667 | |
| McDonald's Corp. | | | 1,682 | | | | 413,015 | |
| | | | | | | | 795,760 | |
| | | | | | | | | |
| Retail & Whsle - Discretionary (2.78%) | | | | | | | | |
| Amazon.com, Inc.(a) | | | 179 | | | | 603,665 | |
| Lowe's Cos., Inc. | | | 1,626 | | | | 380,191 | |
| O'Reilly Automotive, Inc.(a) | | | 205 | | | | 127,576 | |
| | | | | | | | 1,111,432 | |
| | | | | | | | | |
| TOTAL Consumer Discretionary | | | | | | | 2,754,474 | |
| | | | | | | | | |
| Consumer Staples (5.29%) | | | | | | | | |
| Consumer Staple Products (0.71%) | | | | | | | | |
| Estee Lauder Cos., Inc., Class A | | | 877 | | | | 284,437 | |
| | | | | | | | | |
| Retail & Wholesale - Staples (4.58%) | | | | | | | | |
| Costco Wholesale Corp. | | | 1,355 | | | | 666,036 | |
| ITOCHU Corp., ADR | | | 3,707 | | | | 211,114 | |
| Target Corp. | | | 1,696 | | | | 440,316 | |
| Walmart, Inc. | | | 3,420 | | | | 511,016 | |
| | | | | | | | 1,828,482 | |
| | | | | | | | | |
| TOTAL Consumer Staples | | | | | | | 2,112,919 | |
| | | | | | | | | |
| Energy (2.77%) | | | | | | | | |
| Oil & Gas (2.77%) | | | | | | | | |
| ConocoPhillips | | | 6,970 | | | | 519,195 | |
| | | | | Value |
| | | Shares | | (Note 2) |
| Enbridge, Inc. | | | 14,042 | | | $ | 587,798 | |
| | | | | | | | 1,106,993 | |
| | | | | | | | | |
| TOTAL Energy | | | | | | | 1,106,993 | |
| | | | | | | | | |
| Financials (8.80%) | | | | | | | | |
| Banking (3.77%) | | | | | | | | |
| JPMorgan Chase & Co. | | | 6,215 | | | | 1,055,867 | |
| Wells Fargo & Co. | | | 8,870 | | | | 453,789 | |
| | | | | | | | 1,509,656 | |
| | | | | | | | | |
| Financial Services (3.69%) | | | | | | | | |
| Ally Financial, Inc. | | | 6,580 | | | | 314,129 | |
| Intercontinental Exchange, Inc. | | | 2,818 | | | | 390,180 | |
| LPL Financial Holdings, Inc. | | | 2,275 | | | | 373,146 | |
| T Rowe Price Group, Inc. | | | 1,828 | | | | 396,457 | |
| | | | | | | | 1,473,912 | |
| | | | | | | | | |
| Insurance (1.34%) | | | | | | | | |
| Prudential Financial, Inc. | | | 4,855 | | | | 534,293 | |
| | | | | | | | | |
| TOTAL Financials | | | | | | | 3,517,861 | |
| | | | | | | | | |
| Health Care (8.83%) | | | | | | | | |
| Health Care (8.83%) | | | | | | | | |
| Danaher Corp. | | | 1,427 | | | | 444,896 | |
| HCA Healthcare, Inc. | | | 1,510 | | | | 378,195 | |
| IQVIA Holdings, Inc.(a) | | | 1,250 | | | | 326,775 | |
| Medtronic PLC | | | 3,138 | | | | 376,121 | |
| Thermo Fisher Scientific, Inc. | | | 825 | | | | 522,283 | |
| UnitedHealth Group, Inc. | | | 2,204 | | | | 1,014,875 | |
| Zoetis, Inc. | | | 2,162 | | | | 467,424 | |
| | | | | | | | 3,530,569 | |
| | | | | | | | | |
| TOTAL Health Care | | | | | | | 3,530,569 | |
| | | | | | | | | |
| Industrials (6.17%) | | | | | | | | |
| Industrial Products (3.66%) | | | | | | | | |
| Boeing Co.(a) | | | 662 | | | | 137,054 | |
| Caterpillar, Inc. | | | 1,324 | | | | 270,109 | |
| Deere & Co. | | | 925 | | | | 316,637 | |
| ITT, Inc. | | | 2,466 | | | | 231,977 | |
| Middleby Corp.(a) | | | 877 | | | | 160,000 | |
| TE Connectivity, Ltd. | | | 2,425 | | | | 354,050 | |
| | | | | | | | 1,469,827 | |
| | | | | | | | | |
| Industrial Services (2.51%) | | | | | | | | |
| Norfolk Southern Corp. | | | 1,542 | | | | 451,883 | |
| Old Dominion Freight Line, Inc. | | | 1,215 | | | | 414,740 | |
| Southwest Airlines Co.(a) | | | 2,874 | | | | 135,883 | |
| | | | | | | | 1,002,506 | |
| | | | | | | | | |
| TOTAL Industrials | | | | | | | 2,472,333 | |
See Notes to Financial Statements.
| ALPS | Smith Balanced Opportunity Fund | |
| Statement of Investments | October 31, 2021 |
| | | | | Value |
| | | Shares | | (Note 2) |
| Materials (2.18%) | | | | |
| Materials (2.18%) | | | | |
| Anglo American PLC, ADR | | | 7,120 | | | $ | 136,348 | |
| Freeport-McMoRan, Inc. | | | 3,960 | | | | 149,371 | |
| Linde PLC | | | 1,170 | | | | 373,464 | |
| LyondellBasell Industries NV, Class A | | | 2,330 | | | | 216,271 | |
| | | | | | | | 875,454 | |
| | | | | | | | | |
| TOTAL Materials | | | | | | | 875,454 | |
| | | | | | | | | |
| Real Estate (1.21%) | | | | | | | | |
| Real Estate (1.21%) | | | | | | | | |
| Equity LifeStyle Properties, Inc. | | | 5,736 | | | | 484,749 | |
| | | | | | | | | |
| TOTAL Real Estate | | | | | | | 484,749 | |
| | | | | | | | | |
| Technology (13.14%) | | | | | | | | |
| Software & Tech Services (6.98%) | | | | | | | | |
| Mastercard, Inc., Class A | | | 981 | | | | 329,145 | |
| Microsoft Corp. | | | 3,439 | | | | 1,140,440 | |
| PayPal Holdings, Inc.(a) | | | 1,140 | | | | 265,153 | |
| SPS Commerce, Inc.(a) | | | 2,100 | | | | 320,733 | |
| Synopsys, Inc.(a) | | | 1,018 | | | | 339,177 | |
| Tyler Technologies, Inc.(a) | | | 740 | | | | 401,983 | |
| | �� | | | | | | 2,796,631 | |
| | | | | | | | | |
| Tech Hardware & Semiconductors (6.16%) | | | | | | | | |
| Advanced Micro Devices, Inc.(a) | | | 2,654 | | | | 319,090 | |
| Apple, Inc. | | | 6,562 | | | | 982,988 | |
| Lam Research Corp. | | | 302 | | | | 170,198 | |
| Motorola Solutions, Inc. | | | 735 | | | | 182,714 | |
| Taiwan Semiconductor Manufacturing Co., Ltd., ADR | | | 3,391 | | | | 385,557 | |
| Texas Instruments, Inc. | | | 2,263 | | | | 424,268 | |
| | | | | | | | 2,464,815 | |
| | | | | | | | | |
| TOTAL Technology | | | | | | | 5,261,446 | |
| | | | | | | | | |
| Utilities (0.28%) | | | | | | | | |
| Utilities (0.28%) | | | | | | | | |
| Alliant Energy Corp. | | | 2,000 | | | | 113,140 | |
| | | | | | | | | |
| TOTAL Utilities | | | | | | | 113,140 | |
| | | | | | | | | |
| TOTAL COMMON STOCKS | | | | | | | | |
| (Cost $19,899,549) | | | | | | | 24,210,306 | |
| | | | Principal | | | | Value | |
| | | | Amount | | | | (Note 2) | |
| COLLATERALIZED MORTGAGE OBLIGATIONS (3.66%) | | | | | | | | |
| | | Principal | | Value |
| | | Amount | | (Note 2) |
| Fannie Mae | | | | | | | | |
| Series 1997-10, Class FA, | | | | | | | | |
| 1M US L + 0.60%, | | | | | | | | |
| 03/18/2027(b) | | $ | 10,247 | | | $ | 10,294 | |
| Series 1999-52, Class NF, | | | | | | | | |
| 1M US L + 1.15%, | | | | | | | | |
| 10/25/2023(b) | | | 7,041 | | | | 7,091 | |
| Series 2002-21, Class FD, | | | | | | | | |
| 1M US L + 0.90%, | | | | | | | | |
| 04/25/2032(b) | | | 13,818 | | | | 13,980 | |
| Series 2002-22, Class GC, | | | | | | | | |
| 6.500%, 04/25/2032 | | | 9,868 | | | | 11,548 | |
| Series 2002-58, Class PG, | | | | | | | | |
| 6.000%, 09/25/2032 | | | 23,937 | | | | 27,725 | |
| Series 2002-58, Class FG, | | | | | | | | |
| 1M US L + 1.00%, | | | | | | | | |
| 08/25/2032(b) | | | 8,538 | | | | 8,607 | |
| Series 2003-117, Class KB, | | | | | | | | |
| 6.000%, 12/25/2033 | | | 20,919 | | | | 24,208 | |
| Series 2003-87, Class SL, | | | | | | | | |
| 9.10% -1M US L, 07/25/2033(b) | | | 50,343 | | | | 57,172 | |
| Series 2004-60, Class JC, | | | | | | | | |
| 5.500%, 04/25/2034 | | | 18,484 | | | | 20,241 | |
| Series 2005-27, Class GH, | | | | | | | | |
| 5.500%, 04/25/2035 | | | 90,000 | | | | 105,303 | |
| Series 2007-104, Class ZE, | | | | | | | | |
| 6.000%, 08/25/2037 | | | 21,689 | | | | 24,976 | |
| Series 2007-22, Class A, | | | | | | | | |
| 5.500%, 03/25/2037 | | | 10,734 | | | | 12,318 | |
| Series 2007-55, Class PH, | | | | | | | | |
| 6.000%, 06/25/2047 | | | 34,038 | | | | 40,114 | |
| Series 2007-76, Class ZG, | | | | | | | | |
| 6.000%, 08/25/2037 | | | 43,434 | | | | 50,313 | |
| Series 2008-1, Class LF, | | | | | | | | |
| 1M US L + 0.70%, | | | | | | | | |
| 05/25/2037(b) | | | 23,288 | | | | 23,651 | |
| Series 2008-22, Class DB, | | | | | | | | |
| 5.000%, 04/25/2048 | | | 18,800 | | | | 21,413 | |
| Series 2009-12, Class LC, | | | | | | | | |
| 8.977%, 06/25/2037(b) | | | 18,876 | | | | 23,698 | |
| Series 2009-51, Class BZ, | | | | | | | | |
| 4.500%, 07/25/2039 | | | 28,655 | | | | 31,533 | |
| Series 2010-61, Class WA, | | | | | | | | |
| 6.011%, 06/25/2040(b) | | | 22,415 | | | | 25,642 | |
| Series 2010-98, Class BH, | | | | | | | | |
| 5.500%, 09/25/2040 | | | 36,080 | | | | 41,054 | |
| Series 2012-30, Class EH, | | | | | | | | |
| 2.000%, 04/25/2022 | | | 4,428 | | | | 4,437 | |
| Series 2012-64, Class NA, | | | | | | | | |
| 3.000%, 08/25/2041 | | | 7,282 | | | | 7,386 | |
| Series 2013-18, Class MY, | | | | | | | | |
| 3.000%, 03/25/2033 | | | 15,000 | | | | 15,844 | |
| Series 2013-61, Class NY, | | | | | | | | |
| 3.000%, 06/25/2033 | | | 35,000 | | | | 37,483 | |
See Notes to Financial Statements.
| ALPS | Smith Balanced Opportunity Fund | |
| Statement of Investments | October 31, 2021 |
| | | Principal | | Value |
| | | Amount | | (Note 2) |
| Series 2013-9, Class AE, | | | | | | | | |
| 1.750%, 03/25/2039 | | $ | 21,257 | | | $ | 21,429 | |
| Series 2014-21, Class MA, | | | | | | | | |
| 2.000%, 09/25/2041 | | | 18,299 | | | | 18,743 | |
| | | | | | | | 686,203 | |
| Freddie Mac | | | | | | | | |
| Series 1996-1843, Class Z, | | | | | | | | |
| 7.000%, 04/15/2026 | | | 8,264 | | | | 8,723 | |
| Series 1999-2123, Class L, | | | | | | | | |
| 6.500%, 01/15/2029 | | | 30,735 | | | | 34,444 | |
| Series 2002-2538, Class FB, | | | | | | | | |
| 1M US L + 0.40%, | | | | | | | | |
| 12/15/2032(b) | | | 7,539 | | | | 7,559 | |
| Series 2003-2626, Class FQ, | | | | | | | | |
| 1M US L + 1.00%, | | | | | | | | |
| 06/15/2023(b) | | | 5,434 | | | | 5,446 | |
| Series 2005-2977, Class AT, | | | | | | | | |
| 4.500%, 05/15/2025 | | | 13,782 | | | | 14,359 | |
| Series 2005-2990, Class LB, | | | | | | | | |
| 16.94569% - 1M US L, | | | | | | | | |
| 06/15/2034(b) | | | 6,844 | | | | 7,732 | |
| Series 2005-2993, Class TF, | | | | | | | | |
| 1M US L + 0.35%, | | | | | | | | |
| 06/15/2025(b) | | | 6,671 | | | | 6,665 | |
| Series 2006-3174, Class LF, | | | | | | | | |
| 1M US L + 0.35%, | | | | | | | | |
| 05/15/2036(b) | | | 14,362 | | | | 14,437 | |
| Series 2006-3239, Class EF, | | | | | | | | |
| 1M US L + 0.35%, | | | | | | | | |
| 11/15/2036(b) | | | 11,368 | | | | 11,462 | |
| Series 2007-3298, Class Z, | | | | | | | | |
| 6.000%, 04/15/2037 | | | 36,406 | | | | 42,176 | |
| Series 2008-3409, Class DB, | | | | | | | | |
| 6.000%, 01/15/2038 | | | 19,070 | | | | 22,151 | |
| Series 2009-3572, Class KT, | | | | | | | | |
| 4.500%, 09/15/2039 | | | 18,320 | | | | 19,892 | |
| Series 2010-3645, Class WD, | | | | | | | | |
| 4.500%, 02/15/2040 | | | 26,000 | | | | 27,677 | |
| Series 2010-3699, Class LC, | | | | | | | | |
| 4.000%, 03/15/2040 | | | 16,544 | | | | 17,754 | |
| Series 2010-3721, Class FB, | | | | | | | | |
| 1M US L + 0.50%, | | | | | | | | |
| 09/15/2040(b) | | | 13,978 | | | | 14,200 | |
| Series 2010-3759, Class PY, | | | | | | | | |
| 4.000%, 11/15/2040 | | | 25,000 | | | | 27,087 | |
| Series 2010-3770, Class JZ, | | | | | | | | |
| 4.000%, 12/15/2040 | | | 30,826 | | | | 33,509 | |
| Series 2011-3786, Class HL, | | | | | | | | |
| 3.500%, 03/15/2038 | | | 5,706 | | | | 5,719 | |
| Series 2011-3954, Class PG, | | | | | | | | |
| 2.500%, 07/15/2041 | | | 34,154 | | | | 35,193 | |
| Series 2012-3987, Class LP, | | | | | | | | |
| 3.500%, 01/15/2042 | | | 26,000 | | | | 28,230 | |
| Series 2012-4032, Class AD, | | | | | | | | |
| 2.000%, 10/15/2041 | | | 19,426 | | | | 19,725 | |
| | | Principal | | Value |
| | | Amount | | (Note 2) |
| Series 2012-4043, Class PB, | | | | | | | | |
| 1.500%, 05/15/2027 | | $ | 17,174 | | | $ | 17,365 | |
| Series 2012-4064, Class TL, | | | | | | | | |
| 4.000%, 03/15/2042 | | | 5,746 | | | | 5,887 | |
| Series 2013-4226, Class GZ, | | | | | | | | |
| 3.000%, 07/15/2043 | | | 17,258 | | | | 17,838 | |
| Series 2013-4251, Class KE, | | | | | | | | |
| 2.500%, 04/15/2028 | | | 14,134 | | | | 14,198 | |
| Series 2015-4498, Class JA, | | | | | | | | |
| 2.500%, 04/15/2037 | | | 43,371 | | | | 43,668 | |
| | | | | | | | 503,096 | |
| Ginnie Mae | | | | | | | | |
| Series 2004-86, Class C, | | | | | | | | |
| 5.500%, 10/20/2034 | | | 16,000 | | | | 18,163 | |
| Series 2005-91, Class PD, | | | | | | | | |
| 5.500%, 12/20/2035 | | | 13,309 | | | | 14,916 | |
| Series 2007-70, Class FC, | | | | | | | | |
| 1M US L + 0.47%, | | | | | | | | |
| 11/20/2037(b) | | | 21,217 | | | | 21,376 | |
| Series 2008-2, Class PC, | | | | | | | | |
| 4.750%, 01/20/2038 | | | 9,159 | | | | 10,091 | |
| Series 2008-46, Class FA, | | | | | | | | |
| 1M US L + 0.60%, | | | | | | | | |
| 05/20/2038(b) | | | 8,800 | | | | 8,844 | |
| Series 2008-60, Class JP, | | | | | | | | |
| 5.500%, 07/20/2038 | | | 31,000 | | | | 34,969 | |
| Series 2009-104, Class KA, | | | | | | | | |
| 4.500%, 08/16/2039 | | | 16,192 | | | | 16,751 | |
| Series 2010-151, Class KA, | | | | | | | | |
| 3.000%, 09/16/2039 | | | 27,929 | | | | 28,195 | |
| Series 2010-98, Class MG, | | | | | | | | |
| 3.000%, 08/20/2039 | | | 6,597 | | | | 6,706 | |
| Series 2011-H23, Class HA, | | | | | | | | |
| 3.000%, 12/20/2061 | | | 6,881 | | | | 7,147 | |
| Series 2012-39, Class GA, | | | | | | | | |
| 3.000%, 10/16/2040 | | | 9,633 | | | | 9,964 | |
| Series 2013-149, Class BP, | | | | | | | | |
| 3.500%, 10/20/2043 | | | 50,000 | | | | 55,237 | |
| Series 2013-98, Class DM, | | | | | | | | |
| 3.500%, 07/20/2042 | | | 16,327 | | | | 16,811 | |
| Series 2019-162, Class GA, | | | | | | | | |
| 3.000%, 10/20/2049 | | | 11,168 | | | | 11,345 | |
| Series 2020-140, Class PA, | | | | | | | | |
| 4.500%, 09/20/2050 | | | 7,289 | | | | 7,715 | |
| Series 2020-5, Class LC, | | | | | | | | |
| 3.500%, 10/20/2049 | | | 6,843 | | | | 6,998 | |
| | | | | | | | 275,228 | |
| TOTAL COLLATERALIZED MORTGAGE OBLIGATIONS | | | | | | | | |
| (Cost $1,454,769) | | | | | | | 1,464,527 | |
| | | | Principal | | | Value |
| | | | Amount | | | (Note 2) |
| COMMERCIAL MORTGAGE-BACKED SECURITIES (0.06%) |
See Notes to Financial Statements.
| ALPS | Smith Balanced Opportunity Fund | |
| Statement of Investments | October 31, 2021 |
| | | Principal | | Value |
| | | Amount | | (Note 2) |
| Fannie Mae-Aces | | | | | | | | |
| Series 2014-M9, Class A2, | | | | | | | | |
| 3.103%, 07/25/2024(b) | | $ | 21,652 | | | $ | 22,726 | |
| | | | | | | | | |
| TOTAL COMMERCIAL MORTGAGE-BACKED SECURITIES | | | | | | | | |
| (Cost $22,636) | | | | | | | 22,726 | |
| | | Principal | | Value |
| | | Amount | | (Note 2) |
| MORTGAGE-BACKED SECURITIES (2.41%) | | | | | | | | |
| Fannie Mae Pool | | | | | | | | |
| Series 2004-, | | | | | | | | |
| 5.500%, 08/01/2034 | | | 43,571 | | | | 47,392 | |
| 5.500%, 11/01/2034 | | | 42,255 | | | | 45,585 | |
| Series 2005-, | | | | | | | | |
| 7.677%, 06/15/2034 | | | 17,806 | | | | 20,224 | |
| Series 2007-, | | | | | | | | |
| 5.500%, 08/01/2037 | | | 34,239 | | | | 36,906 | |
| 1Y US TI + 2.398%, | | | | | | | | |
| 10/01/2035(b) | | | 27,053 | | | | 26,997 | |
| Series 2008-, | | | | | | | | |
| 5.500%, 03/01/2038 | | | 44,024 | | | | 49,311 | |
| 5.500%, 05/01/2038 | | | 34,861 | | | | 39,082 | |
| Series 2009-, | | | | | | | | |
| 5.500%, 11/01/2039 | | | 29,320 | | | | 32,284 | |
| Series 2012-AM0762, | | | | | | | | |
| 3.290%, 09/01/2032 | | | 8,374 | | | | 9,274 | |
| Series 2012-AM1671, | | | | | | | | |
| 2.100%, 12/01/2027 | | | 33,364 | | | | 34,316 | |
| Series 2014-, | | | | | | | | |
| 3.500%, 11/01/2033 | | | 34,469 | | | | 37,172 | |
| Series 2015-AM8645, | | | | | | | | |
| 2.690%, 05/01/2027 | | | 21,668 | | | | 22,989 | |
| Series 2015-AM8674, | | | | | | | | |
| 2.810%, 04/01/2025 | | | 20,000 | | | | 21,076 | |
| Series 2017-AN6670, | | | | | | | | |
| 3.210%, 09/01/2027 | | | 29,503 | | | | 30,928 | |
| Series 2018-109741, | | | | | | | | |
| 3.730%, 11/01/2025 | | | 50,000 | | | | 52,720 | |
| Series 2018-BL0212, | | | | | | | | |
| 3.820%, 07/01/2027 | | | 34,510 | | | | 37,331 | |
| Series 2019-, | | | | | | | | |
| 3.340%, 05/01/2031 | | | 24,835 | | | | 27,655 | |
| | | | | | | | 571,242 | |
| Freddie Mac Gold Pool | | | | | | | | |
| Series 2008-, | | | | | | | | |
| 6.000%, 05/01/2038 | | | 30,180 | | | | 32,046 | |
| Series 2012-, | | | | | | | | |
| 3.000%, 05/01/2032 | | | 42,722 | | | | 45,074 | |
| | | | | | | | 77,120 | |
| Ginnie Mae II Pool | | | | | | | | |
| Series 2009-, | | | | | | | | |
| 5.000%, 10/20/2039 | | | 11,912 | | | | 12,939 | |
| | | Principal | | Value |
| | | Amount | | (Note 2) |
| 5.500%, 02/20/2039 | | $ | 35,552 | | | $ | 39,815 | |
| Series 2010-, | | | | | | | | |
| 4.000%, 12/20/2040 | | | 34,074 | | | | 36,323 | |
| 4.500%, 04/20/2040 | | | 33,400 | | | | 35,896 | |
| 4.500%, 08/20/2040 | | | 37,821 | | | | 40,618 | |
| Series 2011-, | | | | | | | | |
| 5.000%, 04/20/2041 | | | 27,928 | | | | 30,291 | |
| Series 2012-, | | | | | | | | |
| 3.500%, 05/20/2042 | | | 51,638 | | | | 53,589 | |
| 4.000%, 08/20/2042 | | | 65,338 | | | | 68,589 | |
| | | | | | | | 318,060 | |
| TOTAL MORTGAGE-BACKED SECURITIES | | | | | | | | |
| (Cost $957,481) | | | | | | | 966,422 | |
| | | | | | | | | |
| CORPORATE BONDS (14.73%) | | | | | | | | |
| | | | | | | | | |
| Aerospace & Defense (0.92%) | | | | | | | | |
| Boeing Co. | | | | | | | | |
| 2.20%, 02/04/2026 | | | 70,000 | | | | 70,141 | |
| Teledyne Technologies, Inc. | | | | | | | | |
| 0.95%, 04/01/2024 | | | 80,000 | | | | 79,961 | |
| 1.60%, 04/01/2026 | | | 25,000 | | | | 24,981 | |
| 2.25%, 04/01/2028 | | | 95,000 | | | | 95,599 | |
| 2.75%, 04/01/2031 | | | 31,000 | | | | 31,628 | |
| TransDigm, Inc. | | | | | | | | |
| 8.00%, 12/15/2025(c) | | | 60,000 | | | | 63,900 | |
| Total Aerospace & Defense | | | | | | | 366,210 | |
| | | | | | | | | |
| Airlines (0.46%) | | | | | | | | |
| Alaska Airlines 2020-1 Class A Pass Through Trust | | | | | | | | |
| 4.80%, 08/15/2027(c) | | | 47,924 | | | | 53,310 | |
| Alaska Airlines 2020-1 Class B Pass Through Trust | | | | | | | | |
| 8.00%, 08/15/2025(c) | | | 25,053 | | | | 28,290 | |
| British Airways 2020-1 Class A Pass Through Trust | | | | | | | | |
| 4.25%, 11/15/2032(c) | | | 5,834 | | | | 6,306 | |
| Delta Air Lines, Inc. | | | | | | | | |
| 7.00%, 05/01/2025(c) | | | 7,000 | | | | 8,171 | |
| Southwest Airlines Co. | | | | | | | | |
| 5.25%, 05/04/2025 | | | 55,000 | | | | 61,678 | |
| United Airlines 2020-1 Class A Pass | | | | | | | | |
| Through Trust | | | | | | | | |
| Series 20-1 | | | | | | | | |
| 5.88%, 10/15/2027 | | | 22,583 | | | | 25,311 | |
| Total Airlines | | | | | | | 183,066 | |
| | | | | | | | | |
| Apparel & Textile Products (0.07%) | | | | | | | | |
| Hanesbrands, Inc. | | | | | | | | |
| 5.38%, 05/15/2025(c) | | | 28,000 | | | | 29,155 | |
See Notes to Financial Statements.
| ALPS | Smith Balanced Opportunity Fund | |
| Statement of Investments | October 31, 2021 |
| | | Principal | | Value |
| | | Amount | | (Note 2) |
| Automobiles Manufacturing (1.17%) | | | | | | | | |
| Ford Motor Co. | | | | | | | | |
| 5.29%, 12/08/2046 | | $ | 20,000 | | | $ | 22,974 | |
| 8.50%, 04/21/2023 | | | 20,000 | | | | 21,955 | |
| 9.00%, 04/22/2025 | | | 80,000 | | | | 96,299 | |
| Ford Motor Credit Co. LLC | | | | | | | | |
| 3.38%, 11/13/2025 | | | 35,000 | | | | 36,006 | |
| 4.00%, 11/13/2030 | | | 35,000 | | | �� | 36,575 | |
| General Motors Co. | | | | | | | | |
| 5.00%, 04/01/2035 | | | 22,000 | | | | 26,100 | |
| Nissan Motor Co., Ltd. | | | | | | | | |
| 4.81%, 09/17/2030(c) | | | 200,000 | | | | 222,434 | |
| Volkswagen Group of America | | | | | | | | |
| Finance LLC | | | | | | | | |
| 0.75%, 11/23/2022(c) | | | 5,000 | | | | 5,005 | |
| 0.88%, 11/22/2023(c) | | | 5,000 | | | | 4,999 | |
| Total Automobiles Manufacturing | | | | | | | 472,347 | |
| | | | | | | | | |
| Banks (0.79%) | | | | | | | | |
| CIT Group, Inc. | | | | | | | | |
| 1D US SOFR + 3.83%, 06/19/2024(b) | | | 67,000 | | | | 69,674 | |
| Citizens Financial Group, Inc. | | | | | | | | |
| 4.15%, 09/28/2022(c) | | | 30,000 | | | | 30,903 | |
| PNC Financial Services Group, Inc. | | | | | | | | |
| Series O | | | | | | | | |
| 3M US L + 3.678%(b)(d) | | | 133,000 | | | | 133,808 | |
| Synovus Bank/Columbus GA | | | | | | | | |
| 1D US SOFR + 0.95%, 02/10/2023(b) | | | 15,000 | | | | 15,053 | |
| Truist Bank | | | | | | | | |
| 5Y US TI + 1.15%, 09/17/2029(b) | | | 25,000 | | | | 25,912 | |
| US Bancorp | | | | | | | | |
| 5Y US TI + 0.95%, 11/03/2036(b) | | | 39,000 | | | | 38,855 | |
| Total Banks | | | | | | | 314,205 | |
| | | | | | | | | |
| Cable & Satellite (0.30%) | | | | | | | | |
| CCO Holdings LLC / CCO Holdings Capital Corp. | | | | | | | | |
| 4.25%, 02/01/2031(c) | | | 60,000 | | | | 59,813 | |
| 4.25%, 01/15/2034(c) | | | 16,000 | | | | 15,538 | |
| 4.50%, 06/01/2033(c) | | | 22,000 | | | | 21,973 | |
| Charter Communications Operating LLC / Charter Communications Operating Capital | | | | | | | | |
| 3.85%, 04/01/2061 | | | 20,000 | | | | 19,371 | |
| Total Cable & Satellite | | | | | | | 116,695 | |
| | | | | | | | | |
| Casinos & Gaming (0.23%) | | | | | | | | |
| MGM Resorts International | | | | | | | | |
| 5.50%, 04/15/2027 | | | 15,000 | | | | 16,181 | |
| 7.75%, 03/15/2022 | | | 10,000 | | | | 10,238 | |
| Penn National Gaming, Inc. | | | | | | | | |
| 5.63%, 01/15/2027(c) | | | 61,000 | | | | 63,059 | |
| Total Casinos & Gaming | | | | | | | 89,478 | |
| | | Principal | | Value |
| | | Amount | | (Note 2) |
| Chemicals (0.04%) | | | | |
| Kraton Polymers LLC / Kraton Polymers Capital Corp. | | | | | | | | |
| 4.25%, 12/15/2025(c) | | $ | 15,000 | | | $ | 15,525 | |
| | | | | | | | | |
| Commercial Finance (0.84%) | | | | | | | | |
| AerCap Ireland Capital DAC / AerCap Global Aviation Trust | | | | | | | | |
| 2.45%, 10/29/2026 | | | 94,000 | | | | 94,929 | |
| 3.30%, 01/30/2032 | | | 24,000 | | | | 24,448 | |
| 3.85%, 10/29/2041 | | | 40,000 | | | | 41,478 | |
| 6.50%, 07/15/2025 | | | 65,000 | | | | 75,334 | |
| Air Lease Corp. | | | | | | | | |
| Series C | | | | | | | | |
| 5Y US TI + 3.149%(b)(d) | | | 40,000 | | | | 39,500 | |
| Avolon Holdings Funding, Ltd. | | | | | | | | |
| 2.53%, 11/18/2027(c) | | | 14,000 | | | | 13,753 | |
| 3.63%, 05/01/2022(c) | | | 20,000 | | | | 20,223 | |
| 4.25%, 04/15/2026(c) | | | 25,000 | | | | 26,874 | |
| Total Commercial Finance | | | | | | | 336,539 | |
| Construction Materials Manufacturing (0.03%) | | | | | | | | |
| Martin Marietta Materials, Inc. | | | | | | | | |
| 2.40%, 07/15/2031 | | | 12,000 | | | | 12,001 | |
| | | | | | | | | |
| Consumer Finance (0.55%) | | | | | | | | |
| Ally Financial, Inc. | | | | | | | | |
| 1.45%, 10/02/2023 | | | 10,000 | | | | 10,101 | |
| Series C | | | | | | | | |
| 7Y US TI + 3.481%(b)(d) | | | 18,000 | | | | 18,360 | |
| American Express Co. | | | | | | | | |
| Series B | | | | | | | | |
| 3M US L + 3.43%(b)(d) | | | 50,000 | | | | 50,001 | |
| Discover Financial Services | | | | | | | | |
| Series D | | | | | | | | |
| 5Y US TI + 5.78%(b)(d) | | | 15,000 | | | | 16,703 | |
| OneMain Finance Corp. | | | | | | | | |
| 8.88%, 06/01/2025 | | | 116,000 | | | | 125,569 | |
| Total Consumer Finance | | | | | | | 220,734 | |
| | | | | | | | | |
| Department Stores (0.19%) | | | | | | | | |
| Nordstrom, Inc. | | | | | | | | |
| 4.25%, 08/01/2031 | | | 74,000 | | | | 74,080 | |
| | | | | | | | | |
| Diversified Banks (1.50%) | | | | | | | | |
| Bank of America Corp. | | | | | | | | |
| 1D US SOFR + 0.96%, 07/22/2027(b) | | | 56,000 | | | | 55,658 | |
| 1D US SOFR + 1.21%, 10/20/2032(b) | | | 24,000 | | | | 24,069 | |
| 1D US SOFR + 1.37%, 10/24/2031(b) | | | 119,000 | | | | 113,580 | |
| 5Y US TI + 1.20%, 09/21/2036(b) | | | 74,000 | | | | 72,013 | |
See Notes to Financial Statements.
| ALPS | Smith Balanced Opportunity Fund | |
| Statement of Investments | October 31, 2021 |
| | | Principal | | Value |
| | | Amount | | (Note 2) |
| Citigroup, Inc. | | | | | | | | |
| 4.30%, 11/20/2026 | | $ | 96,000 | | | $ | 106,580 | |
| 1D US SOFR + 1.17%, 05/01/2032(b) | | | 7,000 | | | | 7,035 | |
| JPMorgan Chase & Co. | | | | | | | | |
| 1D US SOFR + 0.535%, 06/01/2025(b) | | | 18,000 | | | | 18,084 | |
| 1D US SOFR + 1.25%, 04/22/2032(b) | | | 60,000 | | | | 60,503 | |
| 1D US SOFR + 1.46%, 06/01/2024(b) | | | 30,000 | | | | 30,385 | |
| 1D US SOFR + 1.46%, 04/22/2042(b) | | | 41,000 | | | | 42,843 | |
| 1D US SOFR + 2.04%, 04/22/2031(b) | | | 25,000 | | | | 25,318 | |
| Sumitomo Mitsui Financial Group, Inc. | | | | | | | | |
| 1.40%, 09/17/2026 | | | 23,000 | | | | 22,580 | |
| 1.90%, 09/17/2028 | | | 16,000 | | | | 15,608 | |
| Total Diversified Banks | | | | | | | 594,256 | |
| | | | | | | | | |
| Exploration & Production (0.13%) | | | | | | | | |
| Diamondback Energy, Inc. | | | | | | | | |
| 0.90%, 03/24/2023 | | | 10,000 | | | | 10,000 | |
| 4.40%, 03/24/2051 | | | 10,000 | | | | 11,548 | |
| Hilcorp Energy I LP / Hilcorp Finance Co. | | | | | | | | |
| 6.25%, 11/01/2028(c) | | | 32,000 | | | | 32,885 | |
| Total Exploration & Production | | | | | | | 54,433 | |
| | | | | | | | | |
| Financial Services (1.89%) | | | | | | | | |
| Credit Suisse Group AG | | | | | | | | |
| 3.57%, 01/09/2023(c) | | | 37,000 | | | | 37,205 | |
| 5Y US TI + 4.82%(b)(c)(d) | | | 200,000 | | | | 218,250 | |
| Goldman Sachs Group, Inc. | | | | | | | | |
| 3.50%, 04/01/2025 | | | 60,000 | | | | 64,084 | |
| 1D US SOFR + 0.50%, 09/10/2024(b) | | | 24,000 | | | | 24,042 | |
| 1D US SOFR + 0.913%, 10/21/2027(b) | | | 24,000 | | | | 24,032 | |
| Series DMTN | | | | | | | | |
| 1D US SOFR + 1.248%, 07/21/2032(b) | | | 22,000 | | | | 21,641 | |
| Morgan Stanley | | | | | | | | |
| Series I | | | | | | | | |
| 1D US SOFR + 0.75%, 10/21/2025(b) | | | 10,000 | | | | 9,900 | |
| Series GMTN | | | | | | | | |
| 1D US SOFR + 0.858%, 07/20/2027(b) | | | 85,000 | | | | 83,637 | |
| 1D US SOFR + 0.88%, 05/04/2027(b) | | | 14,000 | | | | 13,874 | |
| 1D US SOFR + 1.36%, 09/16/2036(b) | | | 177,000 | | | | 172,096 | |
| Nasdaq, Inc. | | | | | | | | |
| 0.45%, 12/21/2022 | | | 10,000 | | | | 9,990 | |
| | | Principal | | Value |
| | | Amount | | (Note 2) |
| National Securities Clearing Corp. | | | | | | | | |
| 0.40%, 12/07/2023(c) | | $ | 20,000 | | | $ | 19,905 | |
| Raymond James Financial, Inc. | | | | | | | | |
| 4.65%, 04/01/2030 | | | 50,000 | | | | 58,774 | |
| Total Financial Services | | | | | | | 757,430 | |
| | | | | | | | | |
| Food & Beverage (0.07%) | | | | | | | | |
| JDE Peet's NV | | | | | | | | |
| 0.80%, 09/24/2024(c) | | | 16,000 | | | | 15,824 | |
| Lamb Weston Holdings, Inc. | | | | | | | | |
| 4.63%, 11/01/2024(c) | | | 10,000 | | | | 10,257 | |
| Total Food & Beverage | | | | | | | 26,081 | |
| | | | | | | | | |
| Hardware (0.09%) | | | | | | | | |
| Dell, Inc. | | | | | | | | |
| 5.40%, 09/10/2040 | | | 30,000 | | | | 36,136 | |
| | | | | | | | | |
| Health Care Facilities & Services (0.64%) | | | | | | | | |
| HCA, Inc. | | | | | | | | |
| 2.38%, 07/15/2031 | | | 73,000 | | | | 71,392 | |
| 3.50%, 07/15/2051 | | | 42,000 | | | | 42,629 | |
| 4.13%, 06/15/2029 | | | 40,000 | | | | 44,327 | |
| 4.50%, 02/15/2027 | | | 25,000 | | | | 27,751 | |
| 5.25%, 06/15/2049 | | | 15,000 | | | | 19,475 | |
| Jaguar Holding Co. II / PPD Development LP | | | | | | | | |
| 4.63%, 06/15/2025(c) | | | 50,000 | | | | 52,000 | |
| Total Health Care Facilities & Services | | | | | | | 257,574 | |
| | | | | | | | | |
| Industrial Other (0.05%) | | | | | | | | |
| Honeywell International, Inc. | | | | | | | | |
| 0.48%, 08/19/2022 | | | 5,000 | | | | 5,001 | |
| Quanta Services, Inc. | | | | | | | | |
| 0.95%, 10/01/2024 | | | 16,000 | | | | 15,876 | |
| Total Industrial Other | | | | | | | 20,877 | |
| | | | | | | | | |
| Medical Equipment & Devices Manufacturing (0.06%) | | | | | | | | |
| PerkinElmer, Inc. | | | | | | | | |
| 0.85%, 09/15/2024 | | | 23,000 | | | | 22,831 | |
| | | | | | | | | |
| Metals & Mining (0.19%) | | | | | | | | |
| Steel Dynamics, Inc. | | | | | | | | |
| 5.00%, 12/15/2026 | | | 75,000 | | | | 77,287 | |
| | | | | | | | | |
| Pharmaceuticals (0.74%) | | | | | | | | |
| Bausch Health Cos., Inc. | | | | | | | | |
| 6.13%, 04/15/2025(c) | | | 136,000 | | | | 138,689 | |
| Organon & Co. / Organon Foreign Debt Co-Issuer BV | | | | | | | | |
| 4.13%, 04/30/2028(c) | | | 45,000 | | | | 45,675 | |
| 5.13%, 04/30/2031(c) | | | 26,000 | | | | 26,850 | |
| Viatris, Inc. | | | | | | | | |
| 1.13%, 06/22/2022(c) | | | 86,000 | | | | 86,312 | |
| Total Pharmaceuticals | | | | | | | 297,526 | |
See Notes to Financial Statements.
| ALPS | Smith Balanced Opportunity Fund | |
| Statement of Investments | October 31, 2021 |
| | | Principal | | Value |
| | | Amount | | (Note 2) |
| Pipeline (1.34%) | | | | |
| Buckeye Partners LP | | | | | | | | |
| 4.13%, 12/01/2027 | | $ | 53,000 | | | $ | 53,464 | |
| 4.35%, 10/15/2024 | | | 10,000 | | | | 10,473 | |
| 4.50%, 03/01/2028(c) | | | 55,000 | | | | 54,381 | |
| 5.60%, 10/15/2044 | | | 12,000 | | | | 11,656 | |
| Energy Transfer LP | | | | | | | | |
| 3.45%, 01/15/2023 | | | 10,000 | | | | 10,236 | |
| 4.20%, 04/15/2027 | | | 25,000 | | | | 27,279 | |
| Series F | | | | | | | | |
| 5Y US TI + 5.134%(b)(d) | | | 15,000 | | | | 15,431 | |
| Flex Intermediate Holdco LLC | | | | | | | | |
| 3.36%, 06/30/2031(c) | | | 93,000 | | | | 94,202 | |
| 4.32%, 12/30/2039(c) | | | 62,000 | | | | 64,979 | |
| Midwest Connector Capital Co. LLC | | | | | | | | |
| 3.63%, 04/01/2022(c) | | | 93,000 | | | | 93,944 | |
| 3.90%, 04/01/2024(c) | | | 25,000 | | | | 26,053 | |
| 4.63%, 04/01/2029(c) | | | 5,000 | | | | 5,341 | |
| Targa Resources Partners LP / Targa Resources Partners Finance Corp. | | | | | | | | |
| 6.88%, 01/15/2029 | | | 23,000 | | | | 25,789 | |
| Western Midstream Operating LP | | | | | | | | |
| 4.35%, 02/01/2025 | | | 40,000 | | | | 41,950 | |
| Total Pipeline | | | | | | | 535,178 | |
| | | | | | | | | |
| Power Generation (0.37%) | | | | | | | | |
| Alexander Funding Trust | | | | | | | | |
| 1.84%, 11/15/2023(c) | | | 75,000 | | | | 76,219 | |
| NRG Energy, Inc. | | | | | | | | |
| 2.00%, 12/02/2025(c) | | | 20,000 | | | | 20,237 | |
| 2.45%, 12/02/2027(c) | | | 25,000 | | | | 25,022 | |
| Vistra Operations Co. LLC | | | | | | | | |
| 5.50%, 09/01/2026(c) | | | 29,000 | | | | 29,898 | |
| Total Power Generation | | | | | | | 151,376 | |
| | | | | | | | | |
| Publishing & Broadcasting (0.16%) | | | | | | | | |
| Nexstar Media, Inc. | | | | | | | | |
| 4.75%, 11/01/2028(c) | | | 25,000 | | | | 25,573 | |
| Scripps Escrow II, Inc. | | | | | | | | |
| 3.88%, 01/15/2029(c) | | | 40,000 | | | | 39,850 | |
| Total Publishing & Broadcasting | | | | | | | 65,423 | |
| | | | | | | | | |
| Railroad (0.04%) | | | | | | | | |
| Westinghouse Air Brake Technologies Corp. | | | | | | | | |
| 4.95%, 09/15/2028 | | | 15,000 | | | | 17,264 | |
| | | | | | | | | |
| Refining & Marketing (0.17%) | | | | | | | | |
| HollyFrontier Corp. | | | | | | | | |
| 4.50%, 10/01/2030 | | | 25,000 | | | | 27,266 | |
| 5.88%, 04/01/2026 | | | 35,000 | | | | 39,899 | |
| Total Refining & Marketing | | | | | | | 67,165 | |
| | | | Principal | | | | Value | |
| | | | Amount | | | | (Note 2) | |
| Restaurants (0.03%) | | | | | | | | |
| Yum! Brands, Inc. | | | | | | | | |
| 7.75%, 04/01/2025(c) | | $ | 13,000 | | | $ | 13,841 | |
| | | | | | | | | |
| Semiconductors (0.28%) | | | | | | | | |
| Microchip Technology, Inc. | | | | | | | | |
| 0.97%, 02/15/2024(c) | | | 15,000 | | | | 14,914 | |
| Micron Technology, Inc. | | | | | | | | |
| 3.48%, 11/01/2051 | | | 8,000 | | | | 8,009 | |
| TSMC Arizona Corp. | | | | | | | | |
| 1.75%, 10/25/2026 | | | 19,000 | | | | 19,114 | |
| 2.50%, 10/25/2031 | | | 16,000 | | | | 16,214 | |
| 3.13%, 10/25/2041 | | | 25,000 | | | | 26,110 | |
| 3.25%, 10/25/2051 | | | 28,000 | | | | 29,574 | |
| Total Semiconductors | | | | | | | 113,935 | |
| | | | | | | | | |
| Software & Services (0.26%) | | | | | | | | |
| CoStar Group, Inc. | | | | | | | | |
| 2.80%, 07/15/2030(c) | | | 60,000 | | | | 60,838 | |
| Nielsen Finance LLC / Nielsen Finance Co. | | | | | | | | |
| 4.50%, 07/15/2029(c) | | | 12,000 | | | | 11,748 | |
| 4.75%, 07/15/2031(c) | | | 24,000 | | | | 23,420 | |
| VMware, Inc. | | | | | | | | |
| 2.20%, 08/15/2031 | | | 10,000 | | | | 9,738 | |
| Total Software & Services | | | | | | | 105,744 | |
| | | | | | | | | |
| Supermarkets & Pharmacies (0.02%) | | | | | | | | |
| Albertsons Cos. Inc / Safeway, Inc. / New Albertsons LP / Albertsons LLC | | | | | | | | |
| 4.63%, 01/15/2027(c) | | | 10,000 | | | | 10,478 | |
| | | | | | | | | |
| Transportation & Logistics (0.12%) | | | | | | | | |
| FedEx Corp. 2020-1 Class AA Pass Through Trust | | | | | | | | |
| 1.88%, 02/20/2034 | | | 47,326 | | | | 46,889 | |
| | | | | | | | | |
| Utilities (0.73%) | | | | | | | | |
| Atmos Energy Corp. | | | | | | | | |
| 3M US L + 0.38%, 03/09/2023(b) | | | 7,000 | | | | 7,001 | |
| Dominion Energy, Inc. | | | | | | | | |
| 3.07%, 08/15/2024(e) | | | 25,000 | | | | 26,246 | |
| Duke Energy Corp. | | | | | | | | |
| 5Y US TI + 2.321%, 01/15/2082(b) | | | 16,000 | | | | 15,902 | |
| Edison International | | | | | | | | |
| Series A | | | | | | | | |
| 5Y US TI + 4.70%(b)(d) | | | 5,000 | | | | 5,169 | |
| ONE Gas, Inc. | | | | | | | | |
| 0.85%, 03/11/2023 | | | 25,000 | | | | 25,007 | |
| 1.10%, 03/11/2024 | | | 15,000 | | | | 14,944 | |
See Notes to Financial Statements.
| ALPS | Smith Balanced Opportunity Fund | |
| Statement of Investments | October 31, 2021 |
| | | Principal | | Value |
| | | Amount | | (Note 2) |
| Pacific Gas and Electric Co. | | | | | | | | |
| 1.37%, 03/10/2023 | | $ | 46,000 | | | $ | 45,861 | |
| 3M US L + 1.38%, 11/15/2021(b) | | | 138,000 | | | | 138,013 | |
| Southern California Edison Co. | | | | | | | | |
| 1.10%, 04/01/2024 | | | 10,000 | | | | 10,026 | |
| Total Utilities | | | | | | | 288,169 | |
| | | | | | | | | |
| Waste & Environment Services & Equipment (0.08%) | | | | | | | | |
| GFL Environmental, Inc. | | | | | | | | |
| 5.13%, 12/15/2026(c) | | | 30,000 | | | | 31,388 | |
| | | | | | | | | |
| Wireless Telecommunications Services (0.08%) | | | | | | | | |
| AT&T, Inc. | | | | | | | | |
| 1.70%, 03/25/2026 | | | 5,000 | | | | 5,023 | |
| Sprint Corp. | | | | | | | | |
| 7.88%, 09/15/2023 | | | 25,000 | | | | 27,750 | |
| Total Wireless Telecommunications Services | | | | | | | 32,773 | |
| | | | | | | | | |
| Wireline Telecommunications Services (0.10%) | | | | | | | | |
| Lumen Technologies, Inc. | | | | | | | | |
| Series T | | | | | | | | |
| 5.80%, 03/15/2022 | | | 35,000 | | | | 35,442 | |
| NTT Finance Corp. | | | | | | | | |
| 0.37%, 03/03/2023(c) | | | 4,000 | | | | 3,997 | |
| Total Wireline Telecommunications Services | | | | | | | 39,439 | |
| | | | | | | | | |
| TOTAL CORPORATE BONDS | | | | | | | | |
| (Cost $5,876,241) | | | | | | | 5,893,528 | |
| | | | | | | | | |
| GOVERNMENT BONDS (13.44%) | | | | | | | | |
| | | | | | | | | |
| U.S. Treasury Bonds (13.44%) | | | | | | | | |
| United States Treasury Bonds | | | | | | | | |
| 1.13%, 02/15/2031 | | | 237,000 | | | | 228,631 | |
| 1.25%, 08/15/2031 | | | 415,000 | | | | 403,328 | |
| 1.75%, 08/15/2041 | | | 852,000 | | | | 820,449 | |
| 2.00%, 08/15/2051 | | | 71,000 | | | | 72,032 | |
| 2.38%, 05/15/2051 | | | 348,000 | | | | 382,583 | |
| United States Treasury Notes | | | | | | | | |
| 0.13%, 07/31/2023 | | | 240,000 | | | | 238,781 | |
| 0.13%, 12/15/2023 | | | 450,000 | | | | 446,054 | |
| 0.13%, 02/15/2024 | | | 320,000 | | | | 316,731 | |
| 0.25%, 09/30/2023 | | | 352,000 | | | | 350,598 | |
| 0.25%, 03/15/2024 | | | 284,000 | | | | 281,565 | |
| 0.25%, 05/15/2024 | | | 320,000 | | | | 316,688 | |
| 0.38%, 08/15/2024 | | | 251,000 | | | | 248,666 | |
| 0.63%, 07/31/2026 | | | 204,000 | | | | 198,860 | |
| 0.75%, 03/31/2026 | | | 307,000 | | | | 302,071 | |
| 0.75%, 04/30/2026 | | | 310,000 | | | | 304,823 | |
| 0.75%, 08/31/2026 | | | 210,000 | | | | 205,808 | |
| 1.25%, 09/30/2028 | | | 128,000 | | | | 126,250 | |
| 1.63%, 05/15/2031 | | | 132,000 | | | | 132,959 | |
| Total U.S. Treasury Bonds | | | | | | | 5,376,877 | |
| | | | | | | | | |
| TOTAL GOVERNMENT BONDS | | | | | | | | |
| (Cost $5,400,670) | | | | | | | 5,376,877 | |
| | | | | Value |
| | | Shares | | (Note 2) |
| PREFERRED STOCK (0.33%) | | | | |
| Consumer Discretionary (0.11%) | | | | |
| Retail - Consumer Discretionary (0.11%) | | | | | | | | |
| Qurate Retail, Inc. | | | 400 | | | $ | 43,672 | |
| | | | | | | | | |
| TOTAL Consumer Discretionary | | | | | | | 43,672 | |
| | | | | | | | | |
| Financials (0.22%) | | | | | | | | |
| Banks (0.22%) | | | | | | | | |
| Bank of Hawaii, Series A(a)(d) | | | 2,855 | | | | 74,230 | |
| First Republic Bank(d) | | | 650 | | | | 15,847 | |
| | | | | | | | 90,077 | |
| | | | | | | | | |
| TOTAL Financials | | | | | | | 90,077 | |
| | | | | | | | | |
| TOTAL PREFERRED STOCK | | | | | | | | |
| (Cost $129,987) | | | | | | | 133,749 | |
| | | 7-Day | | | | Value |
| | | Yield | | Shares | | (Note 2) |
| SHORT TERM INVESTMENTS (5.15%) | | | | | | | | | | | | |
| | | | | | | | | | | | | |
| Money Market Fund (5.15%) | | | | | | | | | | | | |
| Morgan Stanley Institutional Liquidity Funds - Government Portfolio | | | 0.030 | % | | | 125,666 | | | | 125,666 | |
| State Street Institutional Treasury Plus Money Market Fund | | | 0.010 | % | | | 1,935,113 | | | | 1,935,113 | |
| | | | | | | | | | | | 2,060,779 | |
| | | | | | | | | | | | | |
| TOTAL SHORT TERM INVESTMENTS | | | | | | | | | | | | |
| (Cost $2,060,779) | | | | | | | | | | | 2,060,779 | |
| | | | | | | | | | | | | |
| TOTAL INVESTMENTS (100.27%) | | | | | | | | | | | | |
| (Cost $35,802,112) | | | | | | | | | | $ | 40,128,914 | |
| | | | | | | | | | | | | |
| Liabilities In Excess Of Other Assets (-0.27%) | | | | | | | | | | | (108,582 | ) |
| | | | | | | | | | | | | |
| NET ASSETS (100.00%) | | | | | | | | | | $ | 40,020,332 | |
See Notes to Financial Statements.
| ALPS | Smith Balanced Opportunity Fund | |
| Statement of Investments | October 31, 2021 |
Investment Abbreviations:
LIBOR - London Interbank Offered Rate
SOFR - Secured Overnight Financing Rate
TI – Treasury Index
Reference Rates:
1M US L - 1 Month LIBOR as of October 31, 2021 was 0.09%
3M US L - 3 Month LIBOR as of October 31, 2021 was 0.13%
7Y US TI - 7 Year US Treasury Index as of October 31, 2021 was 1.44%
1D US SOFR - 1 Day SOFR as of October 31, 2021 was 0.05%
1Y US TI - 1 Year US Treasury Bill as of October 31, 2021 was 0.15%
5Y US TI - 5 Year US Treasury Index as of October 31, 2021 was 1.18%
| (a) | Non-Income Producing Security. |
| (b) | Floating or variable rate security. The reference rate is described above. The rate in effect as of October 31, 2021 is based on the reference rate plus the displayed spread as of the security's last reset date. |
| (c) | Security exempt from registration under Rule 144A of the Securities Act of 1933. This security may be resold in transactions exempt from registration, normally to qualified institutional buyers. As of October 31, 2021, the aggregate market value of those securities was $2,099,406, representing 5.25% of net assets. |
| (d) | Perpetual maturity. This security has no contractual maturity date, is not redeemable and contractually pays an indefinite stream of interest. |
| (e) | Step bond. Coupon changes periodically based upon a predetermined schedule. Interest rate disclosed is that which is in effect as of October 31, 2021. |
See Notes to Financial Statements.
ALPS | Smith Funds
| Statements of Assets and Liabilities | October 31, 2021 |
| | | ALPS | Smith Short Duration Bond Fund | | | ALPS | Smith Total Return Bond Fund | | | ALPS | Smith Credit Opportunities Fund | | | ALPS | Smith Balanced Opportunity Fund | |
| ASSETS | | | | | | | | | | | | |
| Investments, at value | | $ | 515,775,281 | | | $ | 1,778,475,607 | | | $ | 305,150,353 | | | $ | 40,128,914 | |
| Cash | | | – | | | | 465,506 | | | | 54,331 | | | | 8,808 | |
| Receivable for investments sold | | | 7,481,370 | | | | 43,098,737 | | | | 8,360,879 | | | | 1,066,575 | |
| Receivable for shares sold | | | 1,914,438 | | | | 3,311,714 | | | | 220,901 | | | | 4,004 | |
| Deposit with broker for futures contracts | | | – | | | | – | | | | – | | | | 25,572 | |
| Interest receivable | | | 2,480,959 | | | | 10,651,579 | | | | 2,792,069 | | | | 81,964 | |
| Receivable due from advisor | | | – | | | | – | | | | – | | | | 6,541 | |
| Prepaid expenses and other assets | | | 39,137 | | | | 58,490 | | | | 49,595 | | | | 33,286 | |
| Total Assets | | | 527,691,185 | | | | 1,836,061,633 | | | | 316,628,128 | | | | 41,355,664 | |
| LIABILITIES | | | | | | | | | | | | | | | | |
| Payable for investments purchased | | | 3,316,279 | | | | 49,988,065 | | | | 8,870,872 | | | | 1,226,523 | |
| Payable for shares redeemed | | | 1,241,442 | | | | 1,657,211 | | | | 164,166 | | | | – | |
| Investment advisory fees payable | | | 107,838 | | | | 613,050 | | | | 135,430 | | | | – | |
| Administration and transfer agency fees payable | | | 169,540 | | | | 686,058 | | | | 91,426 | | | | 58,406 | |
| Distribution and services fees payable | | | 11,644 | | | | 19,165 | | | | 4,037 | | | | 1,262 | |
| Trustees' fees and expenses payable | | | 5,733 | | | | 18,506 | | | | 3,685 | | | | 690 | |
| Professional fees payable | | | 31,371 | | | | 49,279 | | | | 26,993 | | | | 25,002 | |
| Custody fees payable | | | 11,683 | | | | 45,096 | | | | 6,764 | | | | 15,301 | |
| Accrued expenses and other liabilities | | | 46,743 | | | | 108,279 | | | | 22,457 | | | | 8,148 | |
| Total Liabilities | | | 4,942,273 | | | | 53,184,709 | | | | 9,325,830 | | | | 1,335,332 | |
| NET ASSETS | | $ | 522,748,912 | | | $ | 1,782,876,924 | | | $ | 307,302,298 | | | $ | 40,020,332 | |
| NET ASSETS CONSIST OF | | | | | | | | | | | | | | | | |
| Paid-in capital | | $ | 521,226,517 | | | $ | 1,767,106,085 | | | $ | 305,401,732 | | | $ | 35,760,175 | |
| Total distributable earnings | | | 1,522,395 | | | | 15,770,839 | | | | 1,900,566 | | | | 4,260,157 | |
| NET ASSETS | | $ | 522,748,912 | | | $ | 1,782,876,924 | | | $ | 307,302,298 | | | $ | 40,020,332 | |
| INVESTMENTS, AT COST | | $ | 515,568,499 | | | $ | 1,759,981,737 | | | $ | 304,262,258 | | | $ | 35,802,112 | |
See Notes to Financial Statements.
ALPS | Smith Funds
| Statements of Assets and Liabilities | October 31, 2021 |
| | | ALPS | Smith Short Duration Bond Fund | | | ALPS | Smith Total Return Bond Fund | | | ALPS | Smith Credit Opportunities Fund | | | ALPS | Smith Balanced Opportunity Fund | |
| PRICING OF SHARES | | | | | | | | | | | | |
| Investor Class: | | | | | | | | | | | | | | | | |
| Net Asset Value, offering and redemption price per share | | $ | 10.57 | | | $ | 11.23 | | | $ | 10.45 | | | $ | 12.19 | |
| Net Assets | | $ | 10,193,977 | | | $ | 9,604,938 | | | $ | 6,868,506 | | | $ | 783,971 | |
| Shares of beneficial interest outstanding (unlimited number of shares, no par value common stock authorized) | | | 964,720 | | | | 855,466 | | | | 657,552 | | | | 64,308 | |
| Class A: | | | | | | | | | | | | | | | | |
| Net Asset Value, offering and redemption price per share | | $ | 10.56 | | | $ | 11.23 | | | $ | 10.45 | | | $ | 12.19 | |
| Net Assets | | $ | 16,867,559 | | | $ | 27,342,016 | | | $ | 1,217,047 | | | $ | 1,218,849 | |
| Shares of beneficial interest outstanding (unlimited number of shares, no par value common stock authorized) | | | 1,596,731 | | | | 2,434,394 | | | | 116,495 | | | | 100,000 | |
| Maximum offering price per share | | $ | 10.80 | (a) | | $ | 11.49 | (a) | | $ | 10.69 | (a) | | $ | 12.60 | (b) |
| Class C: | | | | | | | | | | | | | | | | |
| Net Asset Value, offering and redemption price per share(c) | | $ | 10.53 | | | $ | 11.21 | | | $ | 10.45 | | | $ | 12.14 | |
| Net Assets | | $ | 3,472,452 | | | $ | 7,183,950 | | | $ | 681,860 | | | $ | 607,223 | |
| Shares of beneficial interest outstanding (unlimited number of shares, no par value common stock authorized) | | | 329,728 | | | | 641,040 | | | | 65,281 | | | | 50,000 | |
| Class I: | | | | | | | | | | | | | | | | |
| Net Asset Value, offering and redemption price per share | | $ | 10.57 | | | $ | 11.22 | | | $ | 10.45 | | | $ | 12.19 | |
| Net Assets | | $ | 492,214,924 | | | $ | 1,738,746,020 | | | $ | 298,534,885 | | | $ | 37,410,289 | |
| Shares of beneficial interest outstanding (unlimited number of shares, no par value common stock authorized) | | | 46,557,267 | | | | 154,910,856 | | | | 28,555,745 | | | | 3,068,935 | |
| (a) | (NAV/0.9775), based on maximum sales charge of 2.25% of the offering price. |
| (b) | (NAV/0.9675), based on maximum sales charge of 3.25% of the offering price. |
| (c) | Redemption price per share may be reduced for any applicable contingent deferred sales charge. For a description of a possible sales charge, please see the Fund's Prospectus. |
See Notes to Financial Statements.
ALPS | Smith Funds
| Statement of Operations | For the Year Ended October 31, 2021 |
| | | ALPS | Smith Short Duration Bond Fund | | | ALPS | Smith Total Return Bond Fund | | | ALPS | Smith Credit Opportunities Fund(a) | | | ALPS | Smith Balanced Opportunity Fund(a) | |
| INVESTMENT INCOME | | | | | | | | | | | | |
| Dividends | | $ | 201,068 | | | $ | 1,323,030 | | | $ | 359,110 | | | $ | 254,877 | |
| Foreign taxes withheld on dividends | | | (4,826 | ) | | | (13,654 | ) | | | (3,028 | ) | | | (5,790 | ) |
| Interest | | | 4,616,287 | | | | 40,701,443 | | | | 4,195,267 | | | | 164,296 | |
| Total Investment Income | | | 4,812,529 | | | | 42,010,819 | | | | 4,551,349 | | | | 413,383 | |
| | | | | | | | | | | | | | | | | |
| EXPENSES | | | | | | | | | | | | | | | | |
| Investment advisory fees | | | 1,390,628 | | | | 9,172,011 | | | | 953,407 | | | | 190,452 | |
| Administrative fees | | | 374,481 | | | | 1,680,837 | | | | 142,956 | | | | 71,767 | |
| Transfer agency fees | | | 248,015 | | | | 932,203 | | | | 76,021 | | | | 22,866 | |
| Distribution and service fees | | | | | | | | | | | | | | | | |
| Investor Class | | | 32,917 | | | | 28,373 | | | | 14,230 | | | | 1,932 | |
| Class A | | | 30,267 | | | | 54,684 | | | | 3,077 | | | | 3,015 | |
| Class C | | | 30,087 | | | | 77,055 | | | | 5,775 | | | | 5,723 | |
| Professional fees | | | 37,443 | | | | 77,437 | | | | 29,452 | | | | 26,716 | |
| Reports to shareholders and printing fees | | | 17,320 | | | | 84,488 | | | | 5,688 | | | | 1,583 | |
| State registration fees | | | 105,214 | | | | 150,306 | | | | 83,691 | | | | 34,677 | |
| Insurance fees | | | 2,405 | | | | 18,842 | | | | 329 | | | | 204 | |
| Custody fees | | | 15,140 | | | | 60,394 | | | | 8,177 | | | | 20,489 | |
| Trustees’ fees and expenses | | | 17,010 | | | | 80,927 | | | | 5,929 | | | | 1,245 | |
| Repayment of previously waived fees | | | | | | | | | | | | | | | | |
| Investor Class | | | – | | | | 895 | | | | 59 | | | | – | |
| Class A | | | – | | | | 3 | | | | 10 | | | | – | |
| Class C | | | – | | | | – | | | | 4 | | | | – | |
| Class I | | | – | | | | – | | | | 3 | | | | – | |
| Miscellaneous expenses | | | 13,061 | | | | 33,383 | | | | 8,761 | | | | 9,752 | |
| Total Expenses | | | 2,313,988 | | | | 12,451,838 | | | | 1,337,569 | | | | 390,421 | |
| Less fees waived/reimbursed by investment advisor (Note 8) | | | | | | | | | | | | | | | | |
| Investor Class | | | (16,881 | ) | | | (2,940 | ) | | | (3,188 | ) | | | (3,910 | ) |
| Class A | | | (9,476 | ) | | | (5,556 | ) | | | (1,196 | ) | | | (6,318 | ) |
| Class C | | | (1,817 | ) | | | (4,192 | ) | | | (594 | ) | | | (3,152 | ) |
| Class I | | | (320,901 | ) | | | (1,175,366 | ) | | | (158,423 | ) | | | (134,501 | ) |
| Net Expenses | | | 1,964,913 | | | | 11,263,784 | | | | 1,174,168 | | | | 242,540 | |
| Net Investment Income | | | 2,847,616 | | | | 30,747,035 | | | | 3,377,181 | | | | 170,843 | |
| Net realized gain/(loss) on investments | | | 1,366,915 | | | | 3,499,336 | | | | 1,092,257 | | | | (47,462 | ) |
| Net realized gain on futures contracts | | | – | | | | – | | | | – | | | | 23,960 | |
| Net realized gain on foreign currency transactions | | | – | | | | – | | | | – | | | | 38 | |
| Net Realized Gain/(Loss) | | | 1,366,915 | | | | 3,499,336 | | | | 1,092,257 | | | | (23,464 | ) |
| Net change in unrealized appreciation/(depreciation) on investments | | | (1,863,510 | ) | | | (12,866,274 | ) | | | 1,003,450 | | | | 4,462,821 | |
| Net Change in Unrealized Appreciation/(Depreciation) | | | (1,863,510 | ) | | | (12,866,274 | ) | | | 1,003,450 | | | | 4,462,821 | |
| NET REALIZED AND UNREALIZED GAIN/(LOSS) ON INVESTMENTS | | | (496,595 | ) | | | (9,366,938 | ) | | | 2,095,707 | | | | 4,439,357 | |
| NET INCREASE IN NET ASSETS RESULTING FROM OPERATIONS | | $ | 2,351,021 | | | $ | 21,380,097 | | | $ | 5,472,888 | | | $ | 4,610,200 | |
| (a) | For the period September 16, 2020 (Inception) to April 30, 2021. |
See Notes to Financial Statements.
ALPS | Smith Short Duration Bond Fund
Statement of Changes in Net Assets
| | | For the Year Ended October 31, 2021 | | | For the Year Ended October 31, 2020 | |
| OPERATIONS | | | | | | |
| Net investment income | | $ | 2,847,616 | | | $ | 1,369,569 | |
| Net realized gain | | | 1,366,915 | | | | 1,602,831 | |
| Net change in unrealized appreciation/(depreciation) | | | (1,863,510 | ) | | | 1,684,442 | |
| Net Increase in Net Assets Resulting from Operations | | | 2,351,021 | | | | 4,656,842 | |
| | | | | | | | | |
| DISTRIBUTIONS | | | | | | | | |
| From distributable earnings | | | | | | | | |
| Investor Class | | | (155,128 | ) | | | (21,527 | ) |
| Class A | | | (122,168 | ) | | | (21,429 | ) |
| Class C | | | (17,715 | ) | | | (9,016 | ) |
| Class I | | | (4,175,818 | ) | | | (1,765,667 | ) |
| Net Decrease in Net Assets from Distributions | | | (4,470,829 | ) | | | (1,817,639 | ) |
| | | | | | | | | |
| BENEFICIAL INTEREST TRANSACTIONS (NOTE 6) | | | | | | | | |
| Shares sold | | | | | | | | |
| Investor Class | | | 15,055,603 | | | | 8,786,055 | |
| Class A | | | 13,671,339 | | | | 3,316,195 | |
| Class C | | | 1,574,934 | | | | 1,845,022 | |
| Class I | | | 481,182,792 | | | | 159,410,823 | |
| Dividends reinvested | | | | | | | | |
| Investor Class | | | 103,471 | | | | 16,577 | |
| Class A | | | 107,066 | | | | 18,236 | |
| Class C | | | 17,232 | | | | 8,286 | |
| Class I | | | 2,516,150 | | | | 1,187,091 | |
| Shares redeemed, net of redemption fees | | | | | | | | |
| Investor Class | | | (13,992,876 | ) | | | (230,669 | ) |
| Class A | | | (530,992 | ) | | | (148,329 | ) |
| Class C | | | (289,750 | ) | | | (185,508 | ) |
| Class I | | | (156,359,324 | ) | | | (41,453,423 | ) |
| Net Increase in Net Assets Derived from Beneficial Interest Transactions | | | 343,055,645 | | | | 132,570,356 | |
| | | | | | | | | |
| Net increase in net assets | | | 340,935,837 | | | | 135,409,559 | |
| | | | | | | | | |
| NET ASSETS | | | | | | | | |
| Beginning of year | | | 181,813,075 | | | | 46,403,516 | |
| End of year | | $ | 522,748,912 | | | $ | 181,813,075 | |
See Notes to Financial Statements.
ALPS | Smith Total Return Bond Fund
Statement of Changes in Net Assets
| | | For the Year Ended October 31, 2021 | | | For the Year Ended October 31, 2020 | |
| OPERATIONS | | | | | | |
| Net investment income | | $ | 30,747,035 | | | $ | 17,728,925 | |
| Net realized gain | | | 3,499,336 | | | | 20,708,790 | |
| Net change in unrealized appreciation/(depreciation) | | | (12,866,274 | ) | | | 24,830,792 | |
| Net Increase in Net Assets Resulting from Operations | | | 21,380,097 | | | | 63,268,507 | |
| | | | | | | | | |
| DISTRIBUTIONS | | | | | | | | |
| From distributable earnings | | | | | | | | |
| Investor Class | | | (336,421 | ) | | | (136,099 | ) |
| Class A | | | (584,781 | ) | | | (252,408 | ) |
| Class C | | | (198,520 | ) | | | (59,370 | ) |
| Class I | | | (55,637,740 | ) | | | (22,139,600 | ) |
| Net Decrease in Net Assets from Distributions | | | (56,757,462 | ) | | | (22,587,477 | ) |
| | | | | | | | | |
| BENEFICIAL INTEREST TRANSACTIONS (NOTE 6) | | | | | | | | |
| Shares sold | | | | | | | | |
| Investor Class | | | 4,281,016 | | | | 9,570,405 | |
| Class A | | | 19,688,892 | | | | 7,720,559 | |
| Class C | | | 2,181,358 | | | | 5,311,853 | |
| Class I | | | 874,175,506 | | | | 1,096,771,120 | |
| Dividends reinvested | | | | | | | | |
| Investor Class | | | 280,200 | | | | 120,845 | |
| Class A | | | 530,643 | | | | 240,768 | |
| Class C | | | 153,422 | | | | 55,429 | |
| Class I | | | 37,592,642 | | | | 15,005,297 | |
| Shares redeemed, net of redemption fees | | | | | | | | |
| Investor Class | | | (4,826,938 | ) | | | (3,975,002 | ) |
| Class A | | | (7,467,466 | ) | | | (1,264,314 | ) |
| Class C | | | (1,481,119 | ) | | | (733,489 | ) |
| Class I | | | (470,271,790 | ) | | | (185,793,976 | ) |
| Net Increase in Net Assets Derived from Beneficial Interest Transactions | | | 454,836,366 | | | | 943,029,495 | |
| | | | | | | | | |
| Net increase in net assets | | | 419,459,001 | | | | 983,710,525 | |
| | | | | | | | | |
| NET ASSETS | | | | | | | | |
| Beginning of year | | | 1,363,417,923 | | | | 379,707,398 | |
| End of year | | $ | 1,782,876,924 | | | $ | 1,363,417,923 | |
See Notes to Financial Statements.
ALPS | Smith Credit Opportunities Fund
Statement of Changes in Net Assets
| | | For the Year Ended October 31, 2021 | | | For the Period September 16, 2020 (Commencement of Operations) to October 31, 2020 | |
| OPERATIONS | | | | | | |
| Net investment income | | $ | 3,377,181 | | | $ | 42,824 | |
| Net realized gain | | | 1,092,257 | | | | 43,945 | |
| Net change in unrealized appreciation/(depreciation) | | | 1,003,450 | | | | (115,355 | ) |
| Net Increase/(Decrease) in Net Assets Resulting from Operations | | | 5,472,888 | | | | (28,586 | ) |
| | | | | | | | | |
| DISTRIBUTIONS | | | | | | | | |
| From distributable earnings | | | | | | | | |
| Investor Class | | | (116,811 | ) | | | (1,183 | ) |
| Class A | | | (30,109 | ) | | | (1,780 | ) |
| Class C | | | (10,784 | ) | | | (450 | ) |
| Class I | | | (3,347,171 | ) | | | (37,948 | ) |
| Net Decrease in Net Assets from Distributions | | | (3,504,875 | ) | | | (41,361 | ) |
| | | | | | | | | |
| BENEFICIAL INTEREST TRANSACTIONS (NOTE 6) | | | | | | | | |
| Shares sold | | | | | | | | |
| Investor Class | | | 7,838,750 | | | | 701,936 | |
| Class A | | | 166,565 | | | | 1,000,000 | |
| Class C | | | 160,000 | | | | 500,000 | |
| Class I | | | 310,405,806 | | | | 25,436,680 | |
| Dividends reinvested | | | | | | | | |
| Investor Class | | | 108,253 | | | | – | |
| Class A | | | 3,391 | | | | – | |
| Class C | | | 58 | | | | – | |
| Class I | | | 2,190,246 | | | | 1,273 | |
| Shares redeemed | | | | | | | | |
| Investor Class | | | (1,873,870 | ) | | | (175 | ) |
| Class I | | | (40,909,390 | ) | | | (325,291 | ) |
| Net Increase in Net Assets Derived from Beneficial Interest Transactions | | | 278,089,809 | | | | 27,314,423 | |
| | | | | | | | | |
| Net increase in net assets | | | 280,057,822 | | | | 27,244,476 | |
| | | | | | | | | |
| NET ASSETS | | | | | | | | |
| Beginning of year | | | 27,244,476 | | | | – | |
| End of year | | $ | 307,302,298 | | | $ | 27,244,476 | |
See Notes to Financial Statements.
ALPS | Smith Balanced Opportunity Fund
Statement of Changes in Net Assets
| | | For the Year Ended October 31, 2021 | | | For the Period September 16, 2020 (Commencement of Operations) to October 31, 2020 | |
| OPERATIONS | | | | | | |
| Net investment income | | $ | 170,843 | | | $ | 8,275 | |
| Net realized loss | | | (23,464 | ) | | | (23,561 | ) |
| Net change in unrealized appreciation/(depreciation) | | | 4,462,821 | | | | (136,019 | ) |
| Net Increase/(Decrease) in Net Assets Resulting from Operations | | | 4,610,200 | | | | (151,305 | ) |
| | | | | | | | | |
| DISTRIBUTIONS | | | | | | | | |
| From distributable earnings | | | | | | | | |
| Investor Class | | | (3,280 | ) | | | (116 | ) |
| Class A | | | (5,331 | ) | | | (415 | ) |
| Class C | | | (268 | ) | | | – | |
| Class I | | | (184,448 | ) | | | (6,578 | ) |
| Net Decrease in Net Assets from Distributions | | | (193,327 | ) | | | (7,109 | ) |
| | | | | | | | | |
| BENEFICIAL INTEREST TRANSACTIONS (NOTE 6) | | | | | | | | |
| Shares sold | | | | | | | | |
| Investor Class | | | 45,545 | | | | 610,109 | |
| Class A | | | – | | | | 1,000,000 | |
| Class C | | | – | | | | 500,000 | |
| Class I | | | 22,130,170 | | | | 12,420,000 | |
| Dividends reinvested | | | | | | | | |
| Investor Class | | | 510 | | | | – | |
| Class I | | | 103,203 | | | | 692 | |
| Shares redeemed | | | | | | | | |
| Investor Class | | | (5,641 | ) | | | – | |
| Class I | | | (1,042,715 | ) | | | – | |
| Net Increase in Net Assets Derived from Beneficial Interest Transactions | | | 21,231,072 | | | | 14,530,801 | |
| | | | | | | | | |
| Net increase in net assets | | | 25,647,945 | | | | 14,372,387 | |
| | | | | | | | | |
| NET ASSETS | | | | | | | | |
| Beginning of year | | | 14,372,387 | | | | – | |
| End of year | | $ | 40,020,332 | | | $ | 14,372,387 | |
See Notes to Financial Statements.
ALPS | Smith Short Duration Bond Fund – Investor Class
Financial Highlights
Selected data for a share of beneficial interest outstanding throughout the periods indicated:
| | | For the Year Ended October 31, 2021 | | | For the Year Ended October 31, 2020 | | | For the Year Ended October 31, 2019 | | | For the Period July 2, 2018 (Commencement of Operations) to October 31, 2018 | |
| Net asset value, beginning of period | | $ | 10.62 | | | $ | 10.25 | | | $ | 9.98 | | | $ | 10.00 | |
| | | | | | | | | | | | | | | | | |
| INCOME FROM INVESTMENT OPERATIONS: | | | | | | | | | | | | | | | | |
| Net investment income(a) | | | 0.05 | | | | 0.11 | | | | 0.23 | | | | 0.07 | |
| Net realized and unrealized gain/(loss) | | | 0.03 | | | | 0.48 | | | | 0.27 | | | | (0.04 | ) |
| Total from investment operations | | | 0.08 | | | | 0.59 | | | | 0.50 | | | | 0.03 | |
| | | | | | | | | | | | | | | | | |
| DISTRIBUTIONS: | | | | | | | | | | | | | | | | |
| From net investment income | | | (0.05 | ) | | | (0.14 | ) | | | (0.22 | ) | | | (0.05 | ) |
| From net realized gains | | | (0.08 | ) | | | (0.08 | ) | | | (0.01 | ) | | | – | |
| Total distributions | | | (0.13 | ) | | | (0.22 | ) | | | (0.23 | ) | | | (0.05 | ) |
| | | | | | | | | | | | | | | | | |
| Net increase/(decrease) in net asset value | | | (0.05 | ) | | | 0.37 | | | | 0.27 | | | | (0.02 | ) |
| Net asset value, end of year | | $ | 10.57 | | | $ | 10.62 | | | $ | 10.25 | | | $ | 9.98 | |
| TOTAL RETURN(b) | | | 0.77 | % | | | 5.85 | % | | | 5.04 | % | | | 0.25 | % |
| | | | | | | | | | | | | | | | | |
| RATIOS/SUPPLEMENTAL DATA: | | | | | | | | | | | | | | | | |
| Net assets, end of year (000s) | | $ | 10,194 | | | $ | 9,100 | | | $ | 519 | | | $ | 491 | |
| Ratio of expenses to average net assets excluding fee waivers and reimbursements | | | 0.90 | % | | | 0.95 | % | | | 1.10 | % | | | 2.79 | %(c) |
| Ratio of expenses to average net assets including fee waivers and reimbursements | | | 0.76 | % | | | 0.78 | % | | | 0.76 | % | | | 0.89 | %(c) |
| Ratio of net investment income to average net assets | | | 0.51 | % | | | 1.02 | % | | | 2.22 | % | | | 1.93 | %(c) |
| Portfolio turnover rate(d) | | | 165 | % | | | 457 | % | | | 639 | % | | | 266 | % |
| (a) | Calculated using the average shares method. |
| (b) | Total returns are for the period indicated and have not been annualized. Total returns would have been lower had certain expenses not been waived during the period. Returns shown do not reflect the deduction of taxes that a shareholder would pay on Fund distributions or the redemption of Fund shares. |
| (d) | Portfolio turnover rate for periods less than one full year have not been annualized. |
See Notes to Financial Statements.
ALPS | Smith Short Duration Bond Fund – Class A
Financial Highlights
Selected data for a share of beneficial interest outstanding throughout the periods indicated:
| | | For the Year Ended October 31, 2021 | | | For the Year Ended October 31, 2020 | | | For the Year Ended October 31, 2019 | | | For the Period July 2, 2018 (Commencement of Operations) to October 31, 2018 | |
| Net asset value, beginning of period | | $ | 10.61 | | | $ | 10.24 | | | $ | 9.98 | | | $ | 10.00 | |
| | | | | | | | | | | | | | | | | |
| INCOME FROM INVESTMENT OPERATIONS: | | | | | | | | | | | | | | | | |
| Net investment income(a) | | | 0.05 | | | | 0.12 | | | | 0.22 | | | | 0.06 | |
| Net realized and unrealized gain/(loss) | | | 0.03 | | | | 0.47 | | | | 0.27 | | | | (0.03 | ) |
| Total from investment operations | | | 0.08 | | | | 0.59 | | | | 0.49 | | | | 0.03 | |
| | | | | | | | | | | | | | | | | |
| DISTRIBUTIONS: | | | | | | | | | | | | | | | | |
| From net investment income | | | (0.05 | ) | | | (0.14 | ) | | | (0.22 | ) | | | (0.05 | ) |
| From net realized gains | | | (0.08 | ) | | | (0.08 | ) | | | (0.01 | ) | | | – | |
| Total distributions | | | (0.13 | ) | | | (0.22 | ) | | | (0.23 | ) | | | (0.05 | ) |
| | | | | | | | | | | | | | | | | |
| REDEMPTION FEES ADDED TO PAID-IN CAPITAL (NOTE 6) | | | – | | | | – | | | | 0.00 | (b) | | | – | |
| Net increase/(decrease) in net asset value | | | (0.05 | ) | | | 0.37 | | | | 0.26 | | | | (0.02 | ) |
| Net asset value, end of year | | $ | 10.56 | | | $ | 10.61 | | | $ | 10.24 | | | $ | 9.98 | |
| TOTAL RETURN(c) | | | 0.77 | % | | | 5.84 | % | | | 4.96 | % | | | 0.27 | % |
| | | | | | | | | | | | | | | | | |
| RATIOS/SUPPLEMENTAL DATA: | | | | | | | | | | | | | | | | |
| Net assets, end of year (000s) | | $ | 16,868 | | | $ | 3,702 | | | $ | 471 | | | $ | 110 | |
| Ratio of expenses to average net assets excluding fee waivers and reimbursements | | | 0.84 | % | | | 0.94 | % | | | 1.09 | % | | | 4.28 | %(d) |
| Ratio of expenses to average net assets including fee waivers and reimbursements | | | 0.76 | % | | | 0.77 | % | | | 0.74 | % | | | 0.89 | %(d) |
| Ratio of net investment income to average net assets | | | 0.51 | % | | | 1.10 | % | | | 2.17 | % | | | 1.86 | %(d) |
| Portfolio turnover rate(e) | | | 165 | % | | | 457 | % | | | 639 | % | | | 266 | % |
| (a) | Calculated using the average shares method. |
| (b) | Less than $0.005 or ($0.005) per share. |
| (c) | Total returns are for the period indicated and have not been annualized. Total returns would have been lower had certain expenses not been waived during the period. Returns shown do not reflect the deduction of taxes that a shareholder would pay on Fund distributions or the redemption of Fund shares. Returns shown exclude any applicable sales charges. |
| (e) | Portfolio turnover rate for periods less than one full year have not been annualized. |
See Notes to Financial Statements.
ALPS | Smith Short Duration Bond Fund – Class C
Financial Highlights
Selected data for a share of beneficial interest outstanding throughout the periods indicated:
| | | For the Year Ended October 31, 2021 | | | For the Year Ended October 31, 2020 | | | For the Year Ended October 31, 2019 | | | For the Period July 2, 2018 (Commencement of Operations) to October 31, 2018 | |
| Net asset value, beginning of period | | $ | 10.61 | | | $ | 10.24 | | | $ | 9.98 | | | $ | 10.00 | |
| | | | | | | | | | | | | | | | | |
| INCOME FROM INVESTMENT OPERATIONS: | | | | | | | | | | | | | | | | |
| Net investment income/(loss)(a) | | | (0.02 | ) | | | 0.05 | | | | 0.15 | | | | 0.05 | |
| Net realized and unrealized gain/(loss) | | | 0.02 | | | | 0.47 | | | | 0.27 | | | | (0.04 | ) |
| Total from investment operations | | | – | | | | 0.52 | | | | 0.42 | | | | 0.01 | |
| | | | | | | | | | | | | | | | | |
| DISTRIBUTIONS: | | | | | | | | | | | | | | | | |
| From net investment income | | | (0.00 | )(b) | | | (0.07 | ) | | | (0.15 | ) | | | (0.03 | ) |
| From net realized gains | | | (0.08 | ) | | | (0.08 | ) | | | (0.01 | ) | | | – | |
| Total distributions | | | (0.08 | ) | | | (0.15 | ) | | | (0.16 | ) | | | (0.03 | ) |
| | | | | | | | | | | | | | | | | |
| Net increase/(decrease) in net asset value | | | (0.08 | ) | | | 0.37 | | | | 0.26 | | | | (0.02 | ) |
| Net asset value, end of year | | $ | 10.53 | | | $ | 10.61 | | | $ | 10.24 | | | $ | 9.98 | |
| TOTAL RETURN(c) | | | (0.01 | )% | | | 5.10 | % | | | 4.19 | % | | | 0.09 | % |
| | | | | | | | | | | | | | | | | |
| RATIOS/SUPPLEMENTAL DATA: | | | | | | | | | | | | | | | | |
| Net assets, end of year (000s) | | $ | 3,472 | | �� | $ | 2,193 | | | $ | 497 | | | $ | 370 | |
| Ratio of expenses to average net assets excluding fee waivers and reimbursements | | | 1.55 | % | | | 1.67 | % | | | 1.83 | % | | | 3.54 | %(d) |
| Ratio of expenses to average net assets including fee waivers and reimbursements | | | 1.49 | % | | | 1.49 | % | | | 1.49 | % | | | 1.48 | %(d) |
| Ratio of net investment income/(loss) to average net assets | | | (0.22 | )% | | | 0.46 | % | | | 1.48 | % | | | 1.35 | %(d) |
| Portfolio turnover rate(e) | | | 165 | % | | | 457 | % | | | 639 | % | | | 266 | % |
| (a) | Calculated using the average shares method. |
| (b) | Less than $0.005 or ($0.005) per share. |
| (c) | Total returns are for the period indicated and have not been annualized. Total returns would have been lower had certain expenses not been waived during the period. Returns shown do not reflect the deduction of taxes that a shareholder would pay on Fund distributions or the redemption of Fund shares. Returns shown exclude any applicable sales charges. |
| (e) | Portfolio turnover rate for periods less than one full year have not been annualized. |
See Notes to Financial Statements.
ALPS | Smith Short Duration Bond Fund – Class I
Financial Highlights
Selected data for a share of beneficial interest outstanding throughout the periods indicated:
| | | For the Year Ended October 31, 2021 | | | For the Year Ended October 31, 2020 | | | For the Year Ended October 31, 2019 | | | For the Period July 2, 2018 (Commencement of Operations) to October 31, 2018 | |
| Net asset value, beginning of period | | $ | 10.62 | | | $ | 10.25 | | | $ | 9.99 | | | $ | 10.00 | |
| | | | | | | | | | | | | | | | | |
| INCOME FROM INVESTMENT OPERATIONS: | | | | | | | | | | | | | | | | |
| Net investment income(a) | | | 0.08 | | | | 0.16 | | | | 0.25 | | | | 0.08 | |
| Net realized and unrealized gain/(loss) | | | 0.03 | | | | 0.46 | | | | 0.26 | | | | (0.03 | ) |
| Total from investment operations | | | 0.11 | | | | 0.62 | | | | 0.51 | | | | 0.05 | |
| | | | | | | | | | | | | | | | | |
| DISTRIBUTIONS: | | | | | | | | | | | | | | | | |
| From net investment income | | | (0.08 | ) | | | (0.17 | ) | | | (0.25 | ) | | | (0.06 | ) |
| From net realized gains | | | (0.08 | ) | | | (0.08 | ) | | | (0.01 | ) | | | – | |
| Total distributions | | | (0.16 | ) | | | (0.25 | ) | | | (0.26 | ) | | | (0.06 | ) |
| | | | | | | | | | | | | | | | | |
| REDEMPTION FEES ADDED TO PAID-IN CAPITAL (NOTE 6) | | | – | | | | 0.00 | (b) | | | 0.01 | | | | 0.00 | (b) |
| Net increase/(decrease) in net asset value | | | (0.05 | ) | | | 0.37 | | | | 0.26 | | | | (0.01 | ) |
| Net asset value, end of year | | $ | 10.57 | | | $ | 10.62 | | | $ | 10.25 | | | $ | 9.99 | |
| TOTAL RETURN(c) | | | 1.05 | % | | | 6.12 | % | | | 5.21 | % | | | 0.50 | % |
| | | | | | | | | | | | | | | | | |
| RATIOS/SUPPLEMENTAL DATA: | | | | | | | | | | | | | | | | |
| Net assets, end of year (000s) | | $ | 492,215 | | | $ | 166,817 | | | $ | 44,916 | | | $ | 13,601 | |
| Ratio of expenses to average net assets excluding fee waivers and reimbursements | | | 0.58 | % | | | 0.70 | % | | | 0.82 | % | | | 1.70 | %(d) |
| Ratio of expenses to average net assets including fee waivers and reimbursements | | | 0.49 | % | | | 0.49 | % | | | 0.49 | % | | | 0.49 | %(d) |
| Ratio of net investment income to average net assets | | | 0.77 | % | | | 1.52 | % | | | 2.46 | % | | | 2.36 | %(d) |
| Portfolio turnover rate(e) | | | 165 | % | | | 457 | % | | | 639 | % | | | 266 | % |
| (a) | Calculated using the average shares method. |
| (b) | Less than $0.005 or ($0.005) per share. |
| (c) | Total returns are for the period indicated and have not been annualized. Total returns would have been lower had certain expenses not been waived during the period. Returns shown do not reflect the deduction of taxes that a shareholder would pay on Fund distributions or the redemption of Fund shares. |
| (e) | Portfolio turnover rate for periods less than one full year have not been annualized. |
See Notes to Financial Statements.
ALPS | Smith Total Return Bond Fund – Investor Class
Financial Highlights
Selected data for a share of beneficial interest outstanding throughout the periods indicated:
| | | For the Year Ended October 31, 2021 | | | For the Year Ended October 31, 2020 | | | For the Year Ended October 31, 2019 | | | For the Period July 2, 2018 (Commencement of Operations) to October 31, 2018 | |
| Net asset value, beginning of period | | $ | 11.46 | | | $ | 10.99 | | | $ | 10.05 | | | $ | 10.00 | |
| | | | | | | | | | | | | | | | | |
| INCOME FROM INVESTMENT OPERATIONS: | | | | | | | | | | | | | | | | |
| Net investment income(a) | | | 0.18 | | | | 0.19 | | | | 0.22 | | | | 0.07 | |
| Net realized and unrealized gain/(loss) | | | (0.03 | ) | | | 0.57 | | | | 0.95 | | | | 0.03 | |
| Total from investment operations | | | 0.15 | | | | 0.76 | | | | 1.17 | | | | 0.10 | |
| | | | | | | | | | | | | | | | | |
| DISTRIBUTIONS: | | | | | | | | | | | | | | | | |
| From net investment income | | | (0.19 | ) | | | (0.19 | ) | | | (0.21 | ) | | | (0.05 | ) |
| From net realized gains | | | (0.19 | ) | | | (0.10 | ) | | | (0.02 | ) | | | – | |
| Total distributions | | | (0.38 | ) | | | (0.29 | ) | | | (0.23 | ) | | | (0.05 | ) |
| | | | | | | | | | | | | | | | | |
| REDEMPTION FEES ADDED TO PAID-IN CAPITAL (NOTE 6) | | | – | | | | 0.00 | (b) | | | 0.00 | (b) | | | – | |
| Net increase/(decrease) in net asset value | | | (0.23 | ) | | | 0.47 | | | | 0.94 | | | | 0.05 | |
| Net asset value, end of year | | $ | 11.23 | | | $ | 11.46 | | | $ | 10.99 | | | $ | 10.05 | |
| TOTAL RETURN(c) | | | 1.26 | % | | | 6.95 | % | | | 11.77 | % | | | 1.00 | % |
| | | | | | | | | | | | | | | | | |
| RATIOS/SUPPLEMENTAL DATA: | | | | | | | | | | | | | | | | |
| Net assets, end of year (000s) | | $ | 9,605 | | | $ | 10,109 | | | $ | 4,121 | | | $ | 345 | |
| Ratio of expenses to average net assets excluding fee waivers and reimbursements | | | 0.98 | % | | | 1.01 | % | | | 1.07 | % | | | 2.97 | %(d) |
| Ratio of expenses to average net assets including fee waivers and reimbursements | | | 0.95 | % | | | 0.96 | % | | | 0.96 | % | | | 1.07 | %(d) |
| Ratio of net investment income to average net assets | | | 1.55 | % | | | 1.66 | % | | | 2.05 | % | | | 2.20 | %(d) |
| Portfolio turnover rate(e) | | | 178 | % | | | 360 | % | | | 489 | % | | | 345 | % |
| (a) | Calculated using the average shares method. |
| (b) | Less than $0.005 or ($0.005) per share. |
| (c) | Total returns are for the period indicated and have not been annualized. Total returns would have been lower had certain expenses not been waived during the period. Returns shown do not reflect the deduction of taxes that a shareholder would pay on Fund distributions or the redemption of Fund shares. |
| (e) | Portfolio turnover rate for periods less than one full year have not been annualized. |
See Notes to Financial Statements.
ALPS | Smith Total Return Bond Fund – Class A
Financial Highlights
Selected data for a share of beneficial interest outstanding throughout the periods indicated:
| | | For the Year Ended October 31, 2021 | | | For the Year Ended October 31, 2020 | | | For the Year Ended October 31, 2019 | | | For the Period July 2, 2018 (Commencement of Operations) to October 31, 2018 | |
| Net asset value, beginning of period | | $ | 11.46 | | | $ | 10.99 | | | $ | 10.05 | | | $ | 10.00 | |
| | | | | | | | | | | | | | | | | |
| INCOME FROM INVESTMENT OPERATIONS: | | | | | | | | | | | | | | | | |
| Net investment income(a) | | | 0.18 | | | | 0.19 | | | | 0.21 | | | | 0.07 | |
| Net realized and unrealized gain/(loss) | | | (0.03 | ) | | | 0.57 | | | | 0.97 | | | | 0.03 | |
| Total from investment operations | | | 0.15 | | | | 0.76 | | | | 1.18 | | | | 0.10 | |
| | | | | | | | | | | | | | | | | |
| DISTRIBUTIONS: | | | | | | | | | | | | | | | | |
| From net investment income | | | (0.19 | ) | | | (0.19 | ) | | | (0.22 | ) | | | (0.05 | ) |
| From net realized gains | | | (0.19 | ) | | | (0.10 | ) | | | (0.02 | ) | | | – | |
| Total distributions | | | (0.38 | ) | | | (0.29 | ) | | | (0.24 | ) | | | (0.05 | ) |
| | | | | | | | | | | | | | | | | |
| REDEMPTION FEES ADDED TO PAID-IN CAPITAL (NOTE 6) | | | – | | | | 0.00 | (b) | | | 0.00 | (b) | | | – | |
| Net increase/(decrease) in net asset value | | | (0.23 | ) | | | 0.47 | | | | 0.94 | | | | 0.05 | |
| Net asset value, end of year | | $ | 11.23 | | | $ | 11.46 | | | $ | 10.99 | | | $ | 10.05 | |
| TOTAL RETURN(c) | | | 1.27 | % | | | 6.96 | % | | | 11.79 | % | | | 1.04 | % |
| | | | | | | | | | | | | | | | | |
| RATIOS/SUPPLEMENTAL DATA: | | | | | | | | | | | | | | | | |
| Net assets, end of year (000s) | | $ | 27,342 | | | $ | 15,016 | | | $ | 7,929 | | | $ | 136 | |
| Ratio of expenses to average net assets excluding fee waivers and reimbursements | | | 0.97 | % | | | 0.99 | % | | | 1.05 | % | | | 3.96 | %(d) |
| Ratio of expenses to average net assets including fee waivers and reimbursements | | | 0.94 | % | | | 0.95 | % | | | 0.95 | % | | | 1.07 | %(d) |
| Ratio of net investment income to average net assets | | | 1.57 | % | | | 1.66 | % | | | 1.91 | % | | | 2.10 | %(d) |
| Portfolio turnover rate(e) | | | 178 | % | | | 360 | % | | | 489 | % | | | 345 | % |
| (a) | Calculated using the average shares method. |
| (b) | Less than $0.005 or ($0.005) per share. |
| (c) | Total returns are for the period indicated and have not been annualized. Total returns would have been lower had certain expenses not been waived during the period. Returns shown do not reflect the deduction of taxes that a shareholder would pay on Fund distributions or the redemption of Fund shares. Returns shown exclude any applicable sales charges. |
| (e) | Portfolio turnover rate for periods less than one full year have not been annualized. |
See Notes to Financial Statements.
ALPS | Smith Total Return Bond Fund – Class C
Financial Highlights
Selected data for a share of beneficial interest outstanding throughout the periods indicated:
| | | For the Year Ended October 31, 2021 | | | For the Year Ended October 31, 2020 | | | For the Year Ended October 31, 2019 | | | For the Period July 2, 2018 (Commencement of Operations) to October 31, 2018 | |
| Net asset value, beginning of period | | $ | 11.44 | | | $ | 10.97 | | | $ | 10.04 | | | $ | 10.00 | |
| | | | | | | | | | | | | | | | | |
| INCOME FROM INVESTMENT OPERATIONS: | | | | | | | | | | | | | | | | |
| Net investment income(a) | | | 0.09 | | | | 0.11 | | | | 0.13 | | | | 0.05 | |
| Net realized and unrealized gain/(loss) | | | (0.02 | ) | | | 0.57 | | | | 0.97 | | | | 0.03 | |
| Total from investment operations | | | 0.07 | | | | 0.68 | | | | 1.10 | | | | 0.08 | |
| | | | | | | | | | | | | | | | | |
| DISTRIBUTIONS: | | | | | | | | | | | | | | | | |
| From net investment income | | | (0.11 | ) | | | (0.11 | ) | | | (0.15 | ) | | | (0.04 | ) |
| From net realized gains | | | (0.19 | ) | | | (0.10 | ) | | | (0.02 | ) | | | – | |
| Total distributions | | | (0.30 | ) | | | (0.21 | ) | | | (0.17 | ) | | | (0.04 | ) |
| | | | | | | | | | | | | | | | | |
| Net increase/(decrease) in net asset value | | | (0.23 | ) | | | 0.47 | | | | 0.93 | | | | 0.04 | |
| Net asset value, end of year | | $ | 11.21 | | | $ | 11.44 | | | $ | 10.97 | | | $ | 10.04 | |
| TOTAL RETURN(b) | | | 0.55 | % | | | 6.23 | % | | | 10.98 | % | | | 0.79 | % |
| | | | | | | | | | | | | | | | | |
| RATIOS/SUPPLEMENTAL DATA: | | | | | | | | | | | | | | | | |
| Net assets, end of year (000s) | | $ | 7,184 | | | $ | 6,508 | | | $ | 1,727 | | | $ | 121 | |
| Ratio of expenses to average net assets excluding fee waivers and reimbursements | | | 1.71 | % | | | 1.72 | % | | | 1.79 | % | | | 4.69 | %(c) |
| Ratio of expenses to average net assets including fee waivers and reimbursements | | | 1.66 | % | | | 1.67 | % | | | 1.67 | % | | | 1.67 | %(c) |
| Ratio of net investment income to average net assets | | | 0.83 | % | | | 0.94 | % | | | 1.20 | % | | | 1.49 | %(c) |
| Portfolio turnover rate(d) | | | 178 | % | | | 360 | % | | | 489 | % | | | 345 | % |
| (a) | Calculated using the average shares method. |
| (b) | Total returns are for the period indicated and have not been annualized. Total returns would have been lower had certain expenses not been waived during the period. Returns shown do not reflect the deduction of taxes that a shareholder would pay on Fund distributions or the redemption of Fund shares. Returns shown exclude any applicable sales charges. |
| (d) | Portfolio turnover rate for periods less than one full year have not been annualized. |
See Notes to Financial Statements.
ALPS | Smith Total Return Bond Fund – Class I
Financial Highlights
Selected data for a share of beneficial interest outstanding throughout the periods indicated:
| | | For the Year Ended October 31, 2021 | | | For the Year Ended October 31, 2020 | | | For the Year Ended October 31, 2019 | | | For the Period July 2, 2018 (Commencement of Operations) to October 31, 2018 | |
| Net asset value, beginning of period | | $ | 11.46 | | | $ | 10.99 | | | $ | 10.04 | | | $ | 10.00 | |
| | | | | | | | | | | | | | | | | |
| INCOME FROM INVESTMENT OPERATIONS: | | | | | | | | | | | | | | | | |
| Net investment income(a) | | | 0.21 | | | | 0.22 | | | | 0.24 | | | | 0.09 | |
| Net realized and unrealized gain/(loss) | | | (0.04 | ) | | | 0.57 | | | | 0.97 | | | | 0.02 | |
| Total from investment operations | | | 0.17 | | | | 0.79 | | | | 1.21 | | | | 0.11 | |
| | | | | | | | | | | | | | | | | |
| DISTRIBUTIONS: | | | | | | | | | | | | | | | | |
| From net investment income | | | (0.22 | ) | | | (0.22 | ) | | | (0.24 | ) | | | (0.07 | ) |
| From net realized gains | | | (0.19 | ) | | | (0.10 | ) | | | (0.02 | ) | | | – | |
| Total distributions | | | (0.41 | ) | | | (0.32 | ) | | | (0.26 | ) | | | (0.07 | ) |
| | | | | | | | | | | | | | | | | |
| REDEMPTION FEES ADDED TO PAID-IN CAPITAL (NOTE 6) | | | – | | | | 0.00 | (b) | | | 0.00 | (b) | | | – | |
| Net increase/(decrease) in net asset value | | | (0.24 | ) | | | 0.47 | | | | 0.95 | | | | 0.04 | |
| Net asset value, end of year | | $ | 11.22 | | | $ | 11.46 | | | $ | 10.99 | | | $ | 10.04 | |
| TOTAL RETURN(c) | | | 1.47 | % | | | 7.26 | % | | | 12.19 | % | | | 1.09 | % |
| | | | | | | | | | | | | | | | | |
| RATIOS/SUPPLEMENTAL DATA: | | | | | | | | | | | | | | | | |
| Net assets, end of year (000s) | | $ | 1,738,746 | | | $ | 1,331,786 | | | $ | 365,930 | | | $ | 10,495 | |
| Ratio of expenses to average net assets excluding fee waivers and reimbursements | | | 0.73 | % | | | 0.72 | % | | | 0.76 | % | | | 2.18 | %(d) |
| Ratio of expenses to average net assets including fee waivers and reimbursements | | | 0.66 | % | | | 0.67 | % | | | 0.67 | % | | | 0.67 | %(d) |
| Ratio of net investment income to average net assets | | | 1.84 | % | | | 1.94 | % | | | 2.22 | % | | | 2.64 | %(d) |
| Portfolio turnover rate(e) | | | 178 | % | | | 360 | % | | | 489 | % | | | 345 | % |
| (a) | Calculated using the average shares method. |
| (b) | Less than $0.005 or ($0.005) per share. |
| (c) | Total returns are for the period indicated and have not been annualized. Total returns would have been lower had certain expenses not been waived during the period. Returns shown do not reflect the deduction of taxes that a shareholder would pay on Fund distributions or the redemption of Fund shares. |
| (e) | Portfolio turnover rate for periods less than one full year have not been annualized. |
See Notes to Financial Statements.
| ALPS | Smith Credit Opportunities Fund – Investor Class |
Selected data for a share of beneficial interest outstanding throughout the periods indicated:
| | | | | For the Period | |
| | | | | September 16, 2020 | |
| | | | | (Commencement of | |
| | | For the Year Ended | | | Operations) to | |
| | | October 31, 2021 | | | October 31, 2020 | |
| Net asset value, beginning of period | | $ | 9.96 | | | $ | 10.00 | |
| | | | | | | | | |
| INCOME FROM INVESTMENT OPERATIONS: | | | | | | | | |
| Net investment income(a) | | | 0.25 | | | | 0.02 | |
| Net realized and unrealized gain/(loss) | | | 0.51 | | | | (0.04 | ) |
| Total from investment operations | | | 0.76 | | | | (0.02 | ) |
| | | | | | | | | |
| DISTRIBUTIONS: | | | | | | | | |
| From net investment income | | | (0.25 | ) | | | (0.02 | ) |
| From net realized gains | | | (0.02 | ) | | | – | |
| Total distributions | | | (0.27 | ) | | | (0.02 | ) |
| | | | | | | | | |
| Net increase/(decrease) in net asset value | | | 0.49 | | | | (0.04 | ) |
| Net asset value, end of year | | $ | 10.45 | | | $ | 9.96 | |
| TOTAL RETURN(b) | | | 7.63 | % | | | (0.23 | )% |
| | | | | | | | | |
| RATIOS/SUPPLEMENTAL DATA: | | | | | | | | |
| Net assets, end of year (000s) | | $ | 6,869 | | | $ | 699 | |
| Ratio of expenses to average net assets excluding fee waivers and reimbursements | | | 1.25 | % | | | 2.36 | %(c) |
| Ratio of expenses to average net assets including fee waivers and reimbursements | | | 1.19 | % | | | 1.20 | %(c) |
| Ratio of net investment income to average net assets | | | 2.35 | % | | | 1.37 | %(c) |
| Portfolio turnover rate(d) | | | 211 | % | | | 66 | % |
| (a) | Calculated using the average shares method. |
| (b) | Total returns are for the period indicated and have not been annualized. Total returns would have been lower had certain expenses not been waived during the period. Returns shown do not reflect the deduction of taxes that a shareholder would pay on Fund distributions or the redemption of Fund shares. |
| (c) | Annualized. |
| (d) | Portfolio turnover rate for periods less than one full year have not been annualized. |
See Notes to Financial Statements.
ALPS | Smith Credit Opportunities Fund – Class A
Financial Highlights
Selected data for a share of beneficial interest outstanding throughout the periods indicated:
| | | | | For the Period | |
| | | | | September 16, 2020 | |
| | | | | (Commencement of | |
| | | For the Year Ended | | | Operations) to | |
| | | October 31, 2021 | | | October 31, 2020 | |
| Net asset value, beginning of period | | $ | 9.96 | | | $ | 10.00 | |
| | | | | | | | | |
| INCOME FROM INVESTMENT OPERATIONS: | | | | | | | | |
| Net investment income(a) | | | 0.25 | | | | 0.02 | |
| Net realized and unrealized gain/(loss) | | | 0.51 | | | | (0.04 | ) |
| Total from investment operations | | | 0.76 | | | | (0.02 | ) |
| | | | | | | | | |
| DISTRIBUTIONS: | | | | | | | | |
| From net investment income | | | (0.25 | ) | | | (0.02 | ) |
| From net realized gains | | | (0.02 | ) | | | – | |
| Total distributions | | | (0.27 | ) | | | (0.02 | ) |
| | | | | | | | | |
| Net increase/(decrease) in net asset value | | | 0.49 | | | | (0.04 | ) |
| Net asset value, end of year | | $ | 10.45 | | | $ | 9.96 | |
| TOTAL RETURN(b) | | | 7.65 | % | | | (0.22 | )% |
| | | | | | | | | |
| RATIOS/SUPPLEMENTAL DATA: | | | | | | | | |
| Net assets, end of year (000s) | | $ | 1,217 | | | $ | 996 | |
| Ratio of expenses to average net assets excluding fee waivers and reimbursements | | | 1.26 | % | | | 2.38 | %(c) |
| Ratio of expenses to average net assets including fee waivers and reimbursements | | | 1.16 | % | | | 1.20 | %(c) |
| Ratio of net investment income to average net assets | | | 2.41 | % | | | 1.33 | %(c) |
| Portfolio turnover rate(d) | | | 211 | % | | | 66 | % |
| (a) | Calculated using the average shares method. |
| (b) | Total returns are for the period indicated and have not been annualized. Total returns would have been lower had certain expenses not been waived during the period. Returns shown do not reflect the deduction of taxes that a shareholder would pay on Fund distributions or the redemption of Fund shares. Returns shown exclude any applicable sales charges. |
| (c) | Annualized. |
| (d) | Portfolio turnover rate for periods less than one full year have not been annualized. |
See Notes to Financial Statements.
ALPS | Smith Credit Opportunities Fund – Class C
Financial Highlights
Selected data for a share of beneficial interest outstanding throughout the periods indicated:
| | | | For the Period | |
| | | | September 16, 2020 | |
| | | | (Commencement of | |
| | | For the Year Ended | | Operations) to | |
| | | October 31, 2021 | | October 31, 2020 | |
| Net asset value, beginning of period | | $ | 9.96 | | | $ | 10.00 | |
| | | | | | | | | |
| INCOME FROM INVESTMENT OPERATIONS: | | | | | | | | |
| Net investment income(a) | | | 0.17 | | | | 0.01 | |
| Net realized and unrealized gain/(loss) | | | 0.52 | | | | (0.04 | ) |
| Total from investment operations | | | 0.69 | | | | (0.03 | ) |
| | | | | | | | | |
| DISTRIBUTIONS: | | | | | | | | |
| From net investment income | | | (0.18 | ) | | | (0.01 | ) |
| From net realized gains | | | (0.02 | ) | | | – | |
| Total distributions | | | (0.20 | ) | | | (0.01 | ) |
| | | | | | | | | |
| Net increase/(decrease) in net asset value | | | 0.49 | | | | (0.04 | ) |
| Net asset value, end of year | | $ | 10.45 | | | $ | 9.96 | |
| TOTAL RETURN(b) | | | 6.88 | % | | | (0.31 | )% |
| | | | | | | | | |
| RATIOS/SUPPLEMENTAL DATA: | | | | | | | | |
| Net assets, end of year (000s) | | $ | 682 | | | $ | 498 | |
| Ratio of expenses to average net assets excluding fee waivers and reimbursements | | | 2.00 | % | | | 3.09 | %(c) |
| Ratio of expenses to average net assets including fee waivers and reimbursements | | | 1.90 | % | | | 1.90 | %(c) |
| Ratio of net investment income to average net assets | | | 1.67 | % | | | 0.63 | %(c) |
| Portfolio turnover rate(d) | | | 211 | % | | | 66 | % |
| (a) | Calculated using the average shares method. |
| (b) | Total returns are for the period indicated and have not been annualized. Total returns would have been lower had certain expenses not been waived during the period. Returns shown do not reflect the deduction of taxes that a shareholder would pay on Fund distributions or the redemption of Fund shares. Returns shown exclude any applicable sales charges. |
| (c) | Annualized. |
| (d) | Portfolio turnover rate for periods less than one full year have not been annualized. |
See Notes to Financial Statements.
ALPS | Smith Credit Opportunities Fund – Class I
Financial Highlights
Selected data for a share of beneficial interest outstanding throughout the periods indicated:
| | | | For the Period | |
| | | | September 16, 2020 | |
| | | | (Commencement of | |
| | | For the Year Ended | | Operations) to | |
| | | October 31, 2021 | | October 31, 2020 | |
| Net asset value, beginning of period | | $ | 9.97 | | | $ | 10.00 | |
| | | | | | | | | |
| INCOME FROM INVESTMENT OPERATIONS: | | | | | | | | |
| Net investment income(a) | | | 0.28 | | | | 0.02 | |
| Net realized and unrealized gain/(loss) | | | 0.50 | | | | (0.03 | ) |
| Total from investment operations | | | 0.78 | | | | (0.01 | ) |
| | | | | | | | | |
| DISTRIBUTIONS: | | | | | | | | |
| From net investment income | | | (0.28 | ) | | | (0.02 | ) |
| From net realized gains | | | (0.02 | ) | | | – | |
| Total distributions | | | (0.30 | ) | | | (0.02 | ) |
| | | | | | | | | |
| Net increase/(decrease) in net asset value | | | 0.48 | | | | (0.03 | ) |
| Net asset value, end of year | | $ | 10.45 | | | $ | 9.97 | |
| TOTAL RETURN(b) | | | 7.83 | % | | | (0.15 | )% |
| | | | | | | | | |
| RATIOS/SUPPLEMENTAL DATA: | | | | | | | | |
| Net assets, end of year (000s) | | $ | 298,535 | | | $ | 25,051 | |
| Ratio of expenses to average net assets excluding fee waivers and reimbursements | | | 1.03 | % | | | 1.86 | %(c) |
| Ratio of expenses to average net assets including fee waivers and reimbursements | | | 0.90 | % | | | 0.90 | %(c) |
| Ratio of net investment income to average net assets | | | 2.66 | % | | | 1.79 | %(c) |
| Portfolio turnover rate(d) | | | 211 | % | | | 66 | % |
| (a) | Calculated using the average shares method. |
| (b) | Total returns are for the period indicated and have not been annualized. Total returns would have been lower had certain expenses not been waived during the period. Returns shown do not reflect the deduction of taxes that a shareholder would pay on Fund distributions or the redemption of Fund shares. |
| (c) | Annualized. |
| (d) | Portfolio turnover rate for periods less than one full year have not been annualized. |
See Notes to Financial Statements.
ALPS | Smith Balanced Opportunity Fund – Investor Class
Financial Highlights
Selected data for a share of beneficial interest outstanding throughout the periods indicated:
| | | | | For the Period | |
| | | | | September 16, 2020 | |
| | | | | (Commencement of | |
| | | For the Year Ended | | | Operations) to | |
| | | October 31, 2021 | | | October 31, 2020 | |
| Net asset value, beginning of period | | $ | 9.88 | | | $ | 10.00 | |
| | | | | | | | | |
| INCOME FROM INVESTMENT OPERATIONS: | | | | | | | | |
| Net investment income(a) | | | 0.04 | | | | 0.00 | (b) |
| Net realized and unrealized gain/(loss) | | | 2.32 | | | | (0.12 | ) |
| Total from investment operations | | | 2.36 | | | | (0.12 | ) |
| | | | | | | | | |
| DISTRIBUTIONS: | | | | | | | | |
| From net investment income | | | (0.05 | ) | | | (0.00 | )(b) |
| Total distributions | | | (0.05 | ) | | | (0.00 | )(b) |
| | | | | | | | | |
| Net increase/(decrease) in net asset value | | | 2.31 | | | | (0.12 | ) |
| Net asset value, end of year | | $ | 12.19 | | | $ | 9.88 | |
| TOTAL RETURN(c) | | | 23.95 | % | | | (1.18 | )% |
| | | | | | | | | |
| RATIOS/SUPPLEMENTAL DATA: | | | | | | | | |
| Net assets, end of year (000s) | | $ | 784 | | | $ | 601 | |
| Ratio of expenses to average net assets excluding fee waivers and reimbursements | | | 1.67 | % | | | 3.00 | %(d) |
| Ratio of expenses to average net assets including fee waivers and reimbursements | | | 1.12 | % | | | 1.15 | %(d) |
| Ratio of net investment income to average net assets | | | 0.38 | % | | | 0.25 | %(d) |
| Portfolio turnover rate(e) | | | 126 | % | | | 26 | % |
| (a) | Calculated using the average shares method. |
| (b) | Less than $0.005 or ($0.005) per share. |
| (c) | Total returns are for the period indicated and have not been annualized. Total returns would have been lower had certain expenses not been waived during the period. Returns shown do not reflect the deduction of taxes that a shareholder would pay on Fund distributions or the redemption of Fund shares. |
| (d) | Annualized. |
| (e) | Portfolio turnover rate for periods less than one full year have not been annualized. |
See Notes to Financial Statements.
ALPS | Smith Balanced Opportunity Fund – Class A
Financial Highlights
Selected data for a share of beneficial interest outstanding throughout the periods indicated:
| | | | | For the Period | |
| | | | | September 16, 2020 | |
| | | | | (Commencement of | |
| | | For the Year Ended | | | Operations) to | |
| | | October 31, 2021 | | | October 31, 2020 | |
| Net asset value, beginning of period | | $ | 9.88 | | | $ | 10.00 | |
| | | | | | | | | |
| INCOME FROM INVESTMENT OPERATIONS: | | | | | | | | |
| Net investment income(a) | | | 0.04 | | | | 0.00 | (b) |
| Net realized and unrealized gain/(loss) | | | 2.32 | | | | (0.12 | ) |
| Total from investment operations | | | 2.36 | | | | (0.12 | ) |
| | | | | | | | | |
| DISTRIBUTIONS: | | | | | | | | |
| From net investment income | | | (0.05 | ) | | | (0.00 | )(b) |
| Total distributions | | | (0.05 | ) | | | (0.00 | )(b) |
| | | | | | | | | |
| Net increase/(decrease) in net asset value | | | 2.31 | | | | (0.12 | ) |
| Net asset value, end of year | | $ | 12.19 | | | $ | 9.88 | |
| TOTAL RETURN(c) | | | 23.96 | % | | | (1.16 | )% |
| | | | | | | | | |
| RATIOS/SUPPLEMENTAL DATA: | | | | | | | | |
| Net assets, end of year (000s) | | $ | 1,219 | | | $ | 988 | |
| Ratio of expenses to average net assets excluding fee waivers and reimbursements | | | 1.66 | % | | | 3.03 | %(d) |
| Ratio of expenses to average net assets including fee waivers and reimbursements | | | 1.11 | % | | | 1.15 | %(d) |
| Ratio of net investment income to average net assets | | | 0.39 | % | | | 0.26 | %(d) |
| Portfolio turnover rate(e) | | | 126 | % | | | 26 | % |
| (a) | Calculated using the average shares method. |
| (b) | Less than $0.005 or ($0.005) per share. |
| (c) | Total returns are for the period indicated and have not been annualized. Total returns would have been lower had certain expenses not been waived during the period. Returns shown do not reflect the deduction of taxes that a shareholder would pay on Fund distributions or the redemption of Fund shares. Returns shown exclude any applicable sales charges. |
| (d) | Annualized. |
| (e) | Portfolio turnover rate for periods less than one full year have not been annualized. |
See Notes to Financial Statements.
ALPS | Smith Balanced Opportunity Fund – Class C
Financial Highlights
Selected data for a share of beneficial interest outstanding throughout the periods indicated:
| | | | | For the Period | |
| | | | | September 16, 2020 | |
| | | | | (Commencement of | |
| | | For the Year Ended | | | Operations) to | |
| | | October 31, 2021 | | | October 31, 2020 | |
| Net asset value, beginning of period | | $ | 9.88 | | | $ | 10.00 | |
| | | | | | | | | |
| INCOME FROM INVESTMENT OPERATIONS: | | | | | | | | |
| Net investment loss(a) | | | (0.04 | ) | | | (0.01 | ) |
| Net realized and unrealized gain/(loss) | | | 2.31 | | | | (0.11 | ) |
| Total from investment operations | | | 2.27 | | | | (0.12 | ) |
| | | | | | | | | |
| DISTRIBUTIONS: | | | | | | | | |
| From net investment income | | | (0.01 | ) | | | – | |
| Total distributions | | | (0.01 | ) | | | – | |
| | | | | | | | | |
| Net increase/(decrease) in net asset value | | | 2.26 | | | | (0.12 | ) |
| Net asset value, end of year | | $ | 12.14 | | | $ | 9.88 | |
| TOTAL RETURN(b) | | | 22.93 | % | | | (1.20 | )% |
| | | | | | | | | |
| RATIOS/SUPPLEMENTAL DATA: | | | | | | | | |
| Net assets, end of year (000s) | | $ | 607 | | | $ | 494 | |
| Ratio of expenses to average net assets excluding fee waivers and reimbursements | | | 2.40 | % | | | 3.73 | %(c) |
| Ratio of expenses to average net assets including fee waivers and reimbursements | | | 1.85 | % | | | 1.85 | %(c) |
| Ratio of net investment loss to average net assets | | | (0.35 | )% | | | (0.44 | )%(c) |
| Portfolio turnover rate(d) | | | 126 | % | | | 26 | % |
| (a) | Calculated using the average shares method. |
| (b) | Total returns are for the period indicated and have not been annualized. Total returns would have been lower had certain expenses not been waived during the period. Returns shown do not reflect the deduction of taxes that a shareholder would pay on Fund distributions or the redemption of Fund shares. Returns shown exclude any applicable sales charges. |
| (c) | Annualized. |
| (d) | Portfolio turnover rate for periods less than one full year have not been annualized. |
See Notes to Financial Statements.
ALPS | Smith Balanced Opportunity Fund – Class I
Financial Highlights
Selected data for a share of beneficial interest outstanding throughout the periods indicated:
| | | | | For the Period | |
| | | | | September 16, 2020 | |
| | | | | (Commencement of | |
| | | For the Year Ended | | | Operations) to | |
| | | October 31, 2021 | | | October 31, 2020 | |
| Net asset value, beginning of period | | $ | 9.88 | | | $ | 10.00 | |
| | | | | | | | | |
| INCOME FROM INVESTMENT OPERATIONS: | | | | | | | | |
| Net investment income(a) | | | 0.08 | | | | 0.01 | |
| Net realized and unrealized gain/(loss) | | | 2.31 | | | | (0.12 | ) |
| Total from investment operations | | | 2.39 | | | | (0.11 | ) |
| | | | | | | | | |
| DISTRIBUTIONS: | | | | | | | | |
| From net investment income | | | (0.08 | ) | | | (0.01 | ) |
| Total distributions | | | (0.08 | ) | | | (0.01 | ) |
| | | | | | | | | |
| Net increase/(decrease) in net asset value | | | 2.31 | | | | (0.12 | ) |
| Net asset value, end of year | | $ | 12.19 | | | $ | 9.88 | |
| TOTAL RETURN(b) | | | 24.28 | % | | | (1.15 | )% |
| | | | | | | | | |
| RATIOS/SUPPLEMENTAL DATA: | | | | | | | | |
| Net assets, end of year (000s) | | $ | 37,410 | | | $ | 12,289 | |
| Ratio of expenses to average net assets excluding fee waivers and reimbursements | | | 1.39 | % | | | 2.69 | %(c) |
| Ratio of expenses to average net assets including fee waivers and reimbursements | | | 0.85 | % | | | 0.85 | %(c) |
| Ratio of net investment income to average net assets | | | 0.67 | % | | | 0.57 | %(c) |
| Portfolio turnover rate(d) | | | 126 | % | | | 26 | % |
| (a) | Calculated using the average shares method. |
| (b) | Total returns are for the period indicated and have not been annualized. Total returns would have been lower had certain expenses not been waived during the period. Returns shown do not reflect the deduction of taxes that a shareholder would pay on Fund distributions or the redemption of Fund shares. |
| (c) | Annualized. |
| (d) | Portfolio turnover rate for periods less than one full year have not been annualized. |
See Notes to Financial Statements.
ALPS | Red Rocks Global Opportunity Fund
| Management Commentary | October 31, 2021 (Unaudited) |
What a Difference a Year Makes
As of the Fund’s fiscal year ending October 31, 2021, we are about 18 months on from the serious dislocation caused by the Covid-19 pandemic. Its effect was to shut down the global supply chain almost completely for 2-3 months in March-May of 2020 followed by a tentative but steady recovery since. This disruption in the availability of goods (i.e. semiconductor chips) and services has been a central cause of rising inflation especially in the U.S.
Many sectors will continue to be negatively affected for some time as inventories remain incomplete. Small businesses in particular have struggled with labor availability and the return of their pre-pandemic customers. Other sectors such as global air travel and almost every business that needs to meet a production schedule, will be paying higher prices for what is available. It looks like it will take some time until the global supply chain returns to normal or what might be considered the new normal.
In almost a complete contrast to persistent global supply chain difficulties is the performance of anything having to do with money. The abundant supply of cash available for almost any purpose in the corporate world is fueling a record year in the markets. All-time records for mergers and acquisitions, venture capital deals, initial public offerings (IPO’s), and private equity deals have already been set with two months left in the calendar year. In addition, the S&P 500 has produced one of the best years in history (up slightly above 40% year over year October) for stock market returns. Corporate earnings reports have been close to spectacular and corporate bond issuance has been robust. Everyone wants to raise capital while rates are still low.
To use a generalization, equities are valued at historically high levels but balance sheets are arguably in about the best position they have ever been. What has not changed is our focus on fundamental valuations and the effectiveness of capital allocation programs for the management teams we value, operational improvement initiatives, and shareholder value-creation within our portfolio companies.
What a difference a year makes!
Fiscal Year October 2021 Market Review
Stocks rose strongly in the start of FY 2021 October and were up 20% by mid-February 2021. The clear leaders were those somewhat cyclical companies (value) that had been beaten down in the March-April 2020 downdraft from Covid-19. Markets paused from Mid-February to the end of March as early signs of rising inflation began to be felt. April was very a strong month as the S&P 500 rose about 10% on the back of very good corporate earnings reports but comparisons were quite easy vs. the first calendar quarter of 2020. May and June 2021 was a consolidation period for stocks with a slight growth bias.
From mid-July to end of August the S&P 500 rose another 10% as earnings were very strong (still vs. an easy comparison in 2020) and the market had a distinct growth flavor. At the end of August, the markets were up 40% or better. September was a mild correction
period as stocks were down approximately 7-8% with inflation worries and impending action from the Fed about beginning a measured form of tightening. October was another very strong earnings report period against slightly tougher comparisons in 3Q 2020. Financials and Tech were the big winners in FY 2021.
Consumer spending was quite strong throughout most of the year yet still a bit tepid relative to pre-pandemic levels. Consumer savings were consistently good even with spending on big-ticket items like housing and autos. Job growth was good and wages are clearly rising, giving some concern to corporations/employers about inflation.
So this recovery continues to be uneven but more and more activity is approaching 2019 levels. There is much more improvement to come if the pandemic will leave us alone. Our view is that the pandemic will be with us for some time and we are still waiting for herd immunity to kick in at about 80% vaccinated.
Fiscal Year October 2021 Portfolio Review
For the 12 months ending October 31, 2021, the Fund’s Investor shares (LPEFX) returned 51.18%, compared with 40.19% and 66.78% for the Morningstar Developed Markets Index (the fund’s primary benchmark) and the Red Rocks Global Listed Private Equity Index, respectively. These returns are some of the best we have seen since the end of the global financial crisis.
The fund added 20 names, sold out of 17 names, sold 4 names received from corporate actions (spin offs), and ended with 50 names.
Net contributors to performance included:
Net detractors from performance included:
Companies in the portfolio experience value creation when their underlying companies are sold typically 20% to 30% higher than most recent valuation estimates. The primary driver to performance this fiscal year is the significant increase in global M&A. M&A deal count and volume has been running approximately 45% higher than the same period in 2020.
We are heartened to see the bounce back in performance of the fund. The portfolio’s largest contributors were by and large Investment-related entities who own private assets and manage large sums for global Institutions. Many of these companies have been building large and diversified businesses for well over a decade and benefit by the search for yield or more likely, the search for higher returns from private assets when they are sold.
ALPS | Red Rocks Global Opportunity Fund
| Management Commentary | October 31, 2021 (Unaudited) |
Outlook
While the equity market has been robust this past year, nothing goes to the moon forever and we are seeing issues that could constrain future returns. Those issues are: Will inflation continue to exist at elevated levels? How much and how fast will U.S. real interest rates rise? Can the S&P 500 keep going up at a relatively rapid pace? Will the Federal Reserve keep to its measured pace toward interest rates rises? Will the European Central Bank continue with stimulus? Will the dollar have another strong year? Value or growth-which will outperform? How will China’s governmental actions affect global trade?
Our outlook continues to be one of cautious optimism. The backdrop for global equities remains quite healthy with lots of liquidity, still very low interest rates that are just beginning to rise and corporate demand for growth and internal improvements. There will be more stimulus from developed market central banks still to come, especially in Europe. Capital is readily available for corporations in the form of late stage venture capital, IPO’s, and direct lending from a plethora of non-bank sources, not to mention the ability to raise both debt and equity in the market place. We are mindful of getting too cyclical, because heightened volatility and rapid corrections may be likely when looking to the future. We currently see more value in Europe in general but we also see more difficulty there with uneven economies and a more cautious consumer and higher regulation. Valuations are historically high and this makes it difficult for us to refresh and replenish our portfolio but that is normal for us.
We continue to focus on long term compounders with good track records in centralized asset allocation, good and rising internal returns, and de-centralized operational controls of their various businesses. Along with these tenets we also value good cash flow businesses, strong balance sheets and the proven ability to create value for their shareholders. These characteristics have worked for us over the last decade plus years of experience and believe they will work over the long term ahead.
We thank you for your confidence.
| Andrew Drummond | Kirk McCown |
| Portfolio Manager | Portfolio Manager |
The views of the authors and information discussed in this commentary are as of the date of publication, are subject to change, and may not reflect the writer’s current views. The views expressed are those of the authors only, and represent an assessment of market conditions at a specific point in time, are opinions only and should not be relied upon as investment advice regarding a particular investment or markets in general. Such information does not constitute a recommendation to buy or sell specific securities or investment vehicles. It should not be assumed that any investment will be profitable or will equal the performance of the fund(s) or any securities or any sectors mentioned in this letter. The subject matter
contained in this letter has been derived from several sources believed to be reliable and accurate at the time of compilation. Neither ALPS, Advisors, Inc., Red Rocks Capital, LLC, nor the Fund accepts any liability for losses either direct or consequential caused by the use of this information.
Diversification cannot guarantee gain or prevent losses.
Past performance is no guarantee of future results. Dividends are not guaranteed and are subject to change or elimination. Investments in international and emerging markets securities include exposure to risks such as currency fluctuations, foreign taxes and regulations, and the potential for illiquid markets and political instability.
ALPS Portfolio Solutions Distributor, Inc., ALPS Distributors, Inc. and ALPS Advisors Inc. are affiliated.
ALPS | Red Rocks Global Opportunity Fund
| Performance Update | October 31, 2021 (Unaudited) |
Performance of $10,000 Initial Investment (as of October 31, 2021)
Comparison of change in value of a $10,000 investment

The chart above represents historical performance of a hypothetical investment of $10,000 in the Fund. Past performance does not guarantee future results. This chart does not reflect the deduction of taxes that a shareholder would pay on Fund distributions or the redemption of Fund shares.
Average Annual Total Returns (as of October 31, 2021)
| | 1 Year | 3 Year | 5 Year | 10 Year | Total Expense
Ratio | What
You Pay* |
| Investor# (NAV) | 51.18% | 20.23% | 16.69% | 14.06% | 2.45% | 2.45% |
| Class A (NAV) | 51.02% | 20.27% | 16.71% | 14.07% | 2.49% | 2.49% |
| Class A (MOP) | 42.62% | 17.99% | 15.38% | 13.42% |
| Class C (NAV) | 50.14% | 19.30% | 15.78% | 13.24% | 3.11% | 3.11% |
| Class C (CDSC) | 49.14% | 19.30% | 15.78% | 13.24% |
| Class I | 51.31% | 20.45% | 16.92% | 14.36% | 2.11% | 2.11% |
| Class R | 50.86%+ | 19.90% | 16.39% | 13.92% | 2.57% | 2.57% |
| Morningstar Developed Markets Index1 | 40.19% | 17.76% | 15.13% | 12.16% | | |
| Red Rocks Global Listed Private Equity Index2 | 66.78% | 22.41% | 18.15% | 14.80% | | |
Performance data quoted represents past performance. Past performance does not guarantee future results. Investment return and principal value of an investment will fluctuate so that an investor’s shares, when sold or redeemed, may be worth more or less than the original cost. Current performance data may be higher or lower than actual data quoted. For the most current month-end performance data, please call 1-866-759-5679.
Maximum Offering Price (MOP) for Class A shares includes the Fund’s maximum sales charge of 5.50%. Performance shown at NAV does not include these sales charges and would have been lower had it been taken into account. If you invest $1 million or more, either as a lump sum or through the Fund’s accumulation or letter of intent programs, you can purchase Class A shares without an initial sales charge (load). A Contingent Deferred Sales Charge (“CDSC”) of 1.00% may apply to Class C shares redeemed within the first 12 months after a purchase, and on Class A shares redeemed within the first 18 months after a purchase in excess of $1 million. The Fund imposes a 2.00% redemption fee on shares held for less than 90 days.
ALPS | Red Rocks Global Opportunity Fund
| Performance Update | October 31, 2021 (Unaudited) |
Performance shown for Class A shares prior to June 12, 2018 reflects the historical performance of the Fund’s Investor shares, calculated using the fees and expenses of Class A shares.
Fund Inception date of December 31, 2007 for Investor Class, Class I, and Class R; Fund Inception date June 30, 2010 for Class C; Fund Inception date June 12, 2018 for Class A.
| 1 | The Morningstar Developed Market Index measures the performance of developed regional markets targeting the top 97% of stocks by market capitalization. The index is not actively managed and does not reflect any deduction for fees, expenses or taxes. An investor may not invest directly in an index. |
| 2 | The Red Rocks Global Listed Private Equity Index includes securities, ADRs and GDRs of 40 to 75 private equity companies, including business development companies, master limited partnerships and other vehicles whose principal business is to invest in, lend capital to or provide services to privately held companies. The Red Rocks Global Listed Private Equity Index is managed by the Fund’s Sub-Advisor. An investor may not invest directly in an index. |
| * | What You Pay reflects the Advisor’s and Sub-Advisor’s decision to contractually limit expenses through February 28, 2022, and Acquired Fund Fees and Expenses of 0.79%. Please see the current prospectus dated February 28, 2021 for additional information. |
| # | Prior to December 1, 2017, Investor Class was known as Class A. |
| + | Excludes adjustments in accordance with accounting principles generally accepted in the United States of America and as such, the net asset value and total return for shareholder transactions reported to the market may differ from the net asset value for financial reporting purposes. |
Prior to March 31, 2020, the ALPS | Red Rocks Global Opportunity Fund was known as the ALPS | Red Rocks Listed Private Equity Fund.
The table does not reflect the deduction of taxes that a shareholder would pay on Fund distributions or the redemption of Fund shares.
This Fund is not suitable for all investors and is subject to investment risks, including possible loss of the principal amount invested.
Listed Private Equity Companies are subject to various risks depending on their underlying investments, which could include, but are not limited to, additional liquidity risk, industry risk, non-U.S. security risk, currency risk, credit risk, managed portfolio risk and derivatives risk (derivatives risk is the risk that the value of the Listed Private Equity Companies’ derivative investments will fall because of pricing difficulties or lack of correlation with the underlying investment).
There are inherent risks in investing in private equity companies, which encompass financial institutions or vehicles whose principal business is to invest in and lend capital to privately held companies. Generally, little public information exists for private and thinly traded companies, and there is a risk that investors may not be able to make a fully informed investment decision.
Listed Private Equity Companies may have relatively concentrated investment portfolios, consisting of a relatively small number of holdings. A consequence of this limited number of investments is that the aggregate returns realized may be adversely impacted by the poor performance of a small number of investments, or even a single investment, particularly if a company experiences the need to write down the value of an investment.
Certain of the Fund’s investments may be exposed to liquidity risk due to low trading volume, lack of a market maker or legal restrictions limiting the ability of the Fund to sell particular securities at an advantageous price and/or time. As a result, these securities may be more difficult to value. Foreign investing involves special risks, such as currency fluctuations and political uncertainty. The Fund invests in derivatives and is subject to the risk that the value of those derivative investments will fall because of pricing difficulties or lack of correlation with the underlying investment.
There is no guarantee that the Fund will continue to hold any one particular security or stay invested in any one particular company. The composition of the Fund’s top holdings is subject to change. Performance figures are historical and reflect the change in share price, reinvested distributions, changes in net asset value, sales charges and capital gains distributions, if any.
Not FDIC Insured – No Bank Guarantee – May Lose Value
ALPS | Red Rocks Global Opportunity Fund
| Performance Update | October 31, 2021 (Unaudited) |
Top Ten Holdings (as a % of Net Assets) †
| KKR & Co., Inc. | 5.25% |
| Blackstone, Inc. | 5.16% |
| Partners Group Holding AG | 4.44% |
| HarbourVest Global Private Equity, Ltd. | 4.19% |
| Brederode SA | 4.17% |
| 3i Group PLC | 3.55% |
| HgCapital Trust PLC | 3.32% |
| HBM Healthcare Investments AG | 3.05% |
| IAC/InterActiveCorp | 2.89% |
| Intermediate Capital Group PLC | 2.78% |
| Top Ten Holdings | 38.80% |
| † | Holdings are subject to change and my not reflect the current or future position of the portfolio. Table presents indicative values only. |
Industry Sector Allocation (as a % of Net Assets)

ALPS | Red Rocks Global Opportunity Fund
| Statement of Investments | October 31, 2021 |
| | | Shares | | | Value
(Note 2) | |
| CLOSED-END FUNDS (19.30%) | | | | | | | | |
| Apax Global Alpha, Ltd.(a)(b) | | | 365,000 | | | $ | 1,066,477 | |
| HarbourVest Global Private Equity, Ltd.(c) | | | 138,500 | | | | 4,699,288 | |
| HBM Healthcare Investments AG, Class A | | | 9,000 | | | | 3,423,328 | |
| HgCapital Trust PLC | | | 705,000 | | | | 3,724,237 | |
| ICG Enterprise Trust PLC | | | 95,000 | | | | 1,621,624 | |
| Oakley Capital Investments, Ltd.(c) | | | 235,000 | | | | 1,237,899 | |
| Pantheon International PLC Fund(c) | | | 59,696 | | | | 2,516,268 | |
| Princess Private Equity Holding, Ltd. | | | 97,775 | | | | 1,548,486 | |
| Standard Life Private Equity Trust PLC | | | 268,000 | | | | 1,815,519 | |
| TOTAL CLOSED-END FUNDS | | | | | | | | |
| (Cost $12,710,835) | | | | | | | 21,653,126 | |
| | | | | | | | | |
| COMMON STOCKS (77.66%) | | | | | | | | |
| Communications (8.27%) | | | | | | | | |
| Internet (0.76%) | | | | | | | | |
| Vimeo, Inc.(c) | | | 25,300 | | | | 853,369 | |
| | | | | | | | | |
| Media (7.51%) | | | | | | | | |
| IAC/InterActiveCorp(c) | | | 21,290 | | | | 3,243,957 | |
| Liberty Broadband Corp., Class C(c) | | | 15,600 | | | | 2,534,220 | |
| Liberty Media Corp.-Liberty SiriusXM, Class A(c) | | | 53,200 | | | | 2,648,296 | |
| | | | | | | | 8,426,473 | |
| | | | | | | | | |
| TOTAL COMMUNICATIONS | | | | | | | 9,279,842 | |
| | | | | | | | | |
| Consumer, Cyclical (5.10%) | | | | | | | | |
| Entertainment (3.46%) | | | | | | | | |
| Betsson AB | | | 96,500 | | | | 673,572 | |
| Entain PLC(c) | | | 62,000 | | | | 1,737,311 | |
| Kindred Group PLC | | | 104,500 | | | | 1,468,462 | |
| | | | | | | | 3,879,345 | |
| | | | | | | | | |
| Retail (1.64%) | | | | | | | | |
| Costco Wholesale Corp. | | | 3,750 | | | | 1,843,275 | |
| | | | | | | | | |
| TOTAL CONSUMER, CYCLICAL | | | | | | | 5,722,620 | |
| | | | | | | | | |
| Consumer, Non-Cyclical (6.89%) | | | | | | | | |
| Healthcare-Products (4.88%) | | | | | | | | |
| Hologic, Inc.(c) | | | 19,000 | | | | 1,392,890 | |
| Stryker Corp. | | | 5,100 | | | | 1,356,957 | |
| Thermo Fisher Scientific, Inc. | | | 4,300 | | | | 2,722,201 | |
| | | | | | | | 5,472,048 | |
| | | Shares | | | Value
(Note 2) | |
| Healthcare-Services (2.01%) | | | | | | |
| Chemed Corp. | | | 4,685 | | | $ | 2,259,341 | |
| | | | | | | | | |
| TOTAL CONSUMER, NON-CYCLICAL | | | | | | | 7,731,389 | |
| | | | | | | | | |
| Diversified (0.79%) | | | | | | | | |
| Holding Companies - Diversified Operations (0.79%) |
| Schouw & Co. A/S | | | 9,100 | | | | 885,110 | |
| | | | | | | | | |
| TOTAL DIVERSIFIED | | | | | | | 885,110 | |
| | | | | | | | | |
| Financials (49.52%) | | | | | | | | |
| Diversified Financial Services (22.52%) | | | | | | | | |
| Apollo Global Management, Inc. | | | 24,100 | | | | 1,854,495 | |
| Ares Management LP, Class A | | | 21,300 | | | | 1,804,962 | |
| Cannae Holdings, Inc.(c) | | | 71,400 | | | | 2,434,740 | |
| Carlyle Group, Inc. | | | 46,000 | | | | 2,582,900 | |
| Intermediate Capital Group PLC | | | 104,000 | | | | 3,119,478 | |
| KKR & Co., Inc., Class A | | | 73,900 | | | | 5,887,613 | |
| Mastercard, Inc., Class A | | | 3,600 | | | | 1,207,872 | |
| Partners Group Holding AG | | | 2,850 | | | | 4,978,822 | |
| StepStone Group, Inc., Class A | | | 29,600 | | | | 1,390,608 | |
| | | | | | | | 25,261,490 | |
| | | | | | | | | |
| Investment Companies (10.74%) | | | | | | | | |
| 3i Group PLC | | | 213,000 | | | | 3,977,780 | |
| Chrysalis Investments, Ltd.(c) | | | 362,000 | | | | 1,245,470 | |
| Eurazeo SE | | | 15,100 | | | | 1,415,385 | |
| FS KKR Capital Corp. | | | 84,500 | | | | 1,855,620 | |
| Investor AB, B Shares | | | 126,000 | | | | 2,907,317 | |
| Mutares SE & Co. KGaA | | | 24,266 | | | | 653,601 | |
| | | | | | | | 12,055,173 | |
| | | | | | | | | |
| Private Equity (14.31%) | | | | | | | | |
| Altamir | | | 38,500 | | | | 1,091,289 | |
| Blackstone, Inc. | | | 41,800 | | | | 5,785,956 | |
| Brederode SA | | | 33,180 | | | | 4,677,035 | |
| Clairvest Group, Inc. | | | 12,700 | | | | 611,552 | |
| Draper Esprit PLC(c) | | | 41,200 | | | | 543,673 | |
| Ratos AB, B Shares | | | 262,000 | | | | 1,508,390 | |
| SuRo Capital Corp. | | | 128,011 | | | | 1,835,678 | |
| | | | | | | | 16,053,573 | |
| | | | | | | | | |
| Real Estate (1.95%) | | | | | | | | |
| Brookfield Asset Management, | | | | | | | | |
| Inc., Class A | | | 36,300 | | | | 2,192,157 | |
| | | | | | | | | |
| TOTAL FINANCIALS | | | | | | | 55,562,393 | |
See Notes to Financial Statements.
ALPS | Red Rocks Global Opportunity Fund
| Statement of Investments | October 31, 2021 |
| | | Shares | | | Value
(Note 2) | |
| Industrials (1.60%) | | | | | | |
| Miscellaneous Manufacturers (1.60%) | | | | | | | | |
| Danaher Corp. | | | 5,750 | | | $ | 1,792,678 | |
| | | | | | | | | |
| TOTAL INDUSTRIALS | | | | | | | 1,792,678 | |
| | | | | | | | | |
| Technology (3.95%) | | | | | | | | |
| Electronics (1.01%) | | | | | | | | |
| Lagercrantz Group AB, B Shares | | | 85,000 | | | | 1,138,216 | |
| | | | | | | | | |
| Software (2.94%) | | | | | | | | |
| Constellation Software, Inc. | | | 1,030 | | | | 1,810,149 | |
| Fidelity National Information Services, Inc. | | | 13,400 | | | | 1,483,916 | |
| | | | | | | | 3,294,065 | |
| | | | | | | | | |
| TOTAL TECHNOLOGY | | | | | | | 4,432,281 | |
| | | | | | | | | |
| Utilities (1.54%) | | | | | | | | |
| Electric (1.54%) | | | | | | | | |
| Brookfield Infrastructure Partners LP | | | 29,500 | | | | 1,735,485 | |
| | | | | | | | | |
| TOTAL UTILITIES | | | | | | | 1,735,485 | |
| | | | | | | | | |
| TOTAL COMMON STOCKS | | | | | | | | |
| (Cost $57,448,839) | | | | | | | 87,141,798 | |
| | | 7-Day
Yield | | | Shares | | | Value
(Note 2) | |
| SHORT-TERM INVESTMENTS (2.79%) | | |
| Money Market Fund (2.79%) | | | | |
| State Street Institutional Treasury Plus Money Market Fund | | | 0.010 | % | | | 3,128,390 | | | | 3,128,390 | |
| | | | | | | | | | | | | |
| TOTAL MONEY MARKET FUND | | | 3,128,390 | |
| | | | | | | | | | | | | |
| TOTAL SHORT-TERM INVESTMENTS | | | | |
| (Cost $3,128,390) | | | | | | | | | | | 3,128,390 | |
| | | | | | | | | | | | | |
| TOTAL INVESTMENTS (99.75%) | | | | |
| (Cost $73,288,064) | | | | | | | | | | $ | 111,923,314 | |
| | | | | | | | | | | | | |
| Other Assets In Excess Of Liabilities (0.25%) | | | 278,730 | |
| | | | | | | | | | | | | |
| NET ASSETS (100.00%) | | | | | $ | 112,202,044 | |
| (a) | Security exempt from registration under Rule 144A of the Securities Act of 1933. This security may be resold in transactions exempt from registration, normally to qualified institutional buyers. As of October 31, 2021, the aggregate market value of those securities was $1,066,477, representing 0.95% of net assets. |
| (b) | Securities were purchased pursuant to Regulation S under the Securities Act of 1933, which exempts securities offered and sold outside of the United States from registration. Such securities cannot be sold in the United States without either an effective registration statement filed pursuant to the Securities Act of 1933, or pursuant to an exemption from registration. These securities have been deemed liquid under guidelines approved by the Fund’s Board of Trustees. As of October 31, 2021 the aggregate market value of those securities was 1,066,477 representing 0.95% of net assets. |
| (c) | Non-Income Producing Security. |
For Fund compliance purposes, the Fund’s industry classifications refer to any one or more of the industry sub-classifications used by one or more widely recognized market indexes or ratings group indexes, and/or as defined by Fund management. This definition may not apply for purposes of this report, which may combine industry sub-classifications for reporting ease. Industries are shown as a percent of net assets.
See Notes to Financial Statements.
ALPS | Red Rocks Global Opportunity Fund
| Statement of Assets and Liabilities | October 31, 2021 |
| ASSETS | | | |
| Investments, at value | | $ | 111,923,314 | |
| Foreign currency, at value (Cost $12,470) | | | 12,470 | |
| Receivable for investments sold | | | 62 | |
| Receivable for shares sold | | | 23,865 | |
| Dividends receivable | | | 458,809 | |
| Prepaid expenses and other assets | | | 11,212 | |
| Total Assets | | | 112,429,732 | |
| LIABILITIES | | | | |
| Payable for shares redeemed | | | 28,588 | |
| Investment advisory fees payable | | | 77,984 | |
| Administration and transfer agency fees payable | | | 25,008 | |
| Distribution and services fees payable | | | 30,792 | |
| Trustees’ fees and expenses payable | | | 1,070 | |
| Professional fees payable | | | 30,987 | |
| Custody fees payable | | | 17,720 | |
| Accrued expenses and other liabilities | | | 15,539 | |
| Total Liabilities | | | 227,688 | |
| NET ASSETS | | $ | 112,202,044 | |
| NET ASSETS CONSIST OF | | | | |
| Paid-in capital | | $ | 66,055,947 | |
| Total distributable earnings | | | 46,146,097 | |
| NET ASSETS | | $ | 112,202,044 | |
| INVESTMENTS, AT COST | | $ | 73,288,064 | |
| PRICING OF SHARES | | | | |
| Investor Class: | | | | |
| Net Asset Value, offering and redemption price per share | | $ | 9.39 | |
| Net Assets | | $ | 20,967,272 | |
| Shares of beneficial interest outstanding (unlimited number of shares, no par value common stock authorized) | | | 2,234,115 | |
| Class A: | | | | |
| Net Asset Value, offering and redemption price per share | | $ | 9.35 | |
| Net Assets | | $ | 4,188,417 | |
| Shares of beneficial interest outstanding (unlimited number of shares, no par value common stock authorized) | | | 448,195 | |
| Maximum offering price per share ((NAV/0.9450), based on maximum sales charge of 5.50% of the offering price) | | $ | 9.89 | |
| Class C: | | | | |
| Net Asset Value, offering and redemption price per share(a) | | $ | 8.59 | |
| Net Assets | | $ | 10,883,003 | |
| Shares of beneficial interest outstanding (unlimited number of shares, no par value common stock authorized) | | | 1,267,565 | |
| Class I: | | | | |
| Net Asset Value, offering and redemption price per share | | $ | 9.61 | |
| Net Assets | | $ | 69,176,035 | |
| Shares of beneficial interest outstanding (unlimited number of shares, no par value common stock authorized) | | | 7,195,944 | |
| Class R: | | | | |
| Net Asset Value, offering and redemption price per share | | $ | 7.50 | |
| Net Assets | | $ | 6,987,317 | |
| Shares of beneficial interest outstanding (unlimited number of shares, no par value common stock authorized) | | | 931,321 | |
| (a) | Redemption price per share may be reduced for any applicable contingent deferred sales charge. For a description of a possible sales charge, please see the Fund’s Prospectus. |
See Notes to Financial Statements.
ALPS | Red Rocks Global Opportunity Fund
| Statement of Operations | For the Year Ended October 31, 2021 |
| INVESTMENT INCOME | | | |
| Dividends | | $ | 1,635,383 | |
| Foreign taxes withheld on dividends | | | (79,658 | ) |
| Total Investment Income | | | 1,555,725 | |
| | | | | |
| EXPENSES | | | | |
| Investment advisory fees | | | 888,320 | |
| Administrative fees | | | 104,284 | |
| Transfer agency fees | | | 91,229 | |
| Distribution and service fees | | | | |
| Investor Class | | | 65,027 | |
| Class A | | | 11,228 | |
| Class C | | | 104,881 | |
| Class R | | | 32,270 | |
| Professional fees | | | 31,958 | |
| Reports to shareholders and printing fees | | | 13,109 | |
| State registration fees | | | 68,369 | |
| Insurance fees | | | 1,193 | |
| Custody fees | | | 19,829 | |
| Trustees’ fees and expenses | | | 5,450 | |
| Miscellaneous expenses | | | 16,791 | |
| Total Expenses | | | 1,453,938 | |
| Net Investment Income | | | 101,787 | |
| Net realized gain on investments | | | 14,195,799 | |
| Net realized loss on foreign currency transactions | | | (8,046 | ) |
| Net Realized Gain | | | 14,187,753 | |
| Net change in unrealized appreciation on investments | | | 27,437,445 | |
| Net change in unrealized appreciation on translation of assets and liabilities denominated in foreign currencies | | | 1,357 | |
| Net Change in Unrealized Appreciation | | | 27,438,802 | |
| NET REALIZED AND UNREALIZED GAIN ON INVESTMENTS | | | 41,626,555 | |
| NET INCREASE IN NET ASSETS RESULTING FROM OPERATIONS | | $ | 41,728,342 | |
See Notes to Financial Statements.
ALPS | Red Rocks Global Opportunity Fund
Statements of Changes in Net Assets
| | | For the Year
Ended
October 31, 2021 | | | For the Year
Ended
October 31,
2020(a) | |
| OPERATIONS | | | | | | | | |
| Net investment income | | $ | 101,787 | | | $ | 1,283,746 | |
| Net realized gain | | | 14,187,753 | | | | 10,777,543 | |
| Net change in unrealized appreciation/(depreciation) | | | 27,438,802 | | | | (22,128,678 | ) |
| Net Increase/(Decrease) in Net Assets Resulting from Operations | | | 41,728,342 | | | | (10,067,389 | ) |
| | | | | | | | | |
| TOTAL DISTRIBUTIONS | | | | | | | | |
| From distributable earnings | | | | | | | | |
| Investor Class | | | (718,013 | ) | | | (3,586,004 | ) |
| Class A | | | (119,340 | ) | | | (115,589 | ) |
| Class C | | | (439,224 | ) | | | (2,358,134 | ) |
| Class I | | | (2,461,061 | ) | | | (19,020,392 | ) |
| Class R | | | (291,941 | ) | | | (961,289 | ) |
| Net Decrease in Net Assets from Distributions | | | (4,029,579 | ) | | | (26,041,408 | ) |
| | | | | | | | | |
| BENEFICIAL INTEREST TRANSACTIONS (NOTE 6) | | | | | | | | |
| Shares sold | | | | | | | | |
| Investor Class | | | 911,265 | | | | 5,255,428 | |
| Class A | | | 1,284,789 | | | | 3,213,948 | |
| Class C | | | 77,972 | | | | 641,538 | |
| Class I | | | 7,576,741 | | | | 26,449,314 | |
| Class R | | | 465,230 | | | | 883,978 | |
| Dividends reinvested | | | | | | | | |
| Investor Class | | | 569,108 | | | | 2,760,858 | |
| Class A | | | 83,596 | | | | 79,919 | |
| Class C | | | 367,738 | | | | 1,803,296 | |
| Class I | | | 2,258,632 | | | | 15,657,972 | |
| Class R | | | 291,941 | | | | 959,137 | |
| Shares redeemed, net of redemption fees | | | | | | | | |
| Investor Class | | | (2,882,725 | ) | | | (12,347,153 | ) |
| Class A | | | (919,915 | ) | | | (1,413,331 | ) |
| Class C | | | (2,330,963 | ) | | | (6,439,102 | ) |
| Class I | | | (20,380,620 | ) | | | (100,944,449 | ) |
| Class R | | | (1,236,068 | ) | | | (1,261,496 | ) |
| Net Decrease in Net Assets Derived from Beneficial Interest Transactions | | | (13,863,279 | ) | | | (64,700,143 | ) |
| | | | | | | | | |
| Net increase/(decrease) in net assets | | | 23,835,484 | | | | (100,808,940 | ) |
| | | | | | | | | |
| NET ASSETS | | | | | | | | |
| Beginning of year | | | 88,366,560 | | | | 189,175,500 | |
| End of year | | $ | 112,202,044 | | | $ | 88,366,560 | |
| (a) | Prior to March 31, 2020, the ALPS/Red Rocks Global Opportunity Fund was known as the ALPS/Red Rocks Listed Private Equity Fund. |
See Notes to Financial Statements.
ALPS | Red Rocks Global Opportunity Fund – Investor Class
Financial Highlights
Selected data for a share of beneficial interest outstanding throughout the periods indicated:
| | | For the Year
Ended
October 31,
2021 | | | For the Year
Ended
October 31,
2020(a) | | | For the Year
Ended
October 31,
2019 | | | For the Year
Ended
October 31,
2018(b) | | | For the Year
Ended
October 31,
2017 | |
| Net asset value, beginning of period | | $ | 6.47 | | | $ | 7.71 | | | $ | 6.79 | | | $ | 8.05 | | | $ | 6.29 | |
| INCOME/(LOSS) FROM INVESTMENT OPERATIONS: | | | | | | | | | | | | | | | | | | | | |
| Net investment income(c) | | | 0.00 | (d) | | | 0.06 | | | | 0.12 | | | | 0.06 | | | | 0.12 | |
| Net realized and unrealized gain/(loss) | | | 3.22 | | | | (0.23 | ) | | | 1.09 | | | | (0.37 | ) | | | 1.74 | |
| Total from investment operations | | | 3.22 | | | | (0.17 | ) | | | 1.21 | | | | (0.31 | ) | | | 1.86 | |
| DISTRIBUTIONS: | | | | | | | | | | | | | | | | | | | | |
| From net investment income | | | – | | | | (0.60 | ) | | | (0.06 | ) | | | (0.70 | ) | | | (0.10 | ) |
| From net realized gains | | | (0.30 | ) | | | (0.47 | ) | | | (0.23 | ) | | | (0.25 | ) | | | – | |
| Total distributions | | | (0.30 | ) | | | (1.07 | ) | | | (0.28 | ) | | | (0.95 | ) | | | (0.10 | ) |
| REDEMPTION FEES ADDED TO PAID-IN CAPITAL (NOTE 6) | | | 0.00 | (d) | | | 0.00 | (d) | | | 0.00 | (d) | | | 0.00 | (d) | | | 0.00 | (d) |
| Net increase/(decrease) in net asset value | | | 2.92 | | | | (1.24 | ) | | | 0.92 | | | | (1.26 | ) | | | 1.76 | |
| Net asset value, end of year | | $ | 9.39 | | | $ | 6.47 | | | $ | 7.71 | | | $ | 6.79 | | | $ | 8.05 | |
| TOTAL RETURN(e) | | | 51.18 | % | | | (3.20 | )% | | | 18.77 | % | | | (4.23 | )% | | | 29.97 | % |
| | | | | | | | | | | | | | | | | | | | | |
| RATIOS/SUPPLEMENTAL DATA: | | | | | | | | | | | | | | | | | | | | |
| Net assets, end of year (000s) | | $ | 20,967 | | | $ | 15,580 | | | $ | 25,061 | | | $ | 35,775 | | | $ | 55,538 | |
| Ratio of expenses to average net assets excluding fee waivers and reimbursements(f) | | | 1.49 | % | | | 1.47 | % | | | 1.44 | % | | | 1.40 | % | | | 1.38 | % |
| Ratio of expenses to average net assets including fee waivers and reimbursements(f) | | | 1.49 | % | | | 1.47 | % | | | 1.44 | % | | | 1.40 | % | | | 1.38 | % |
| Ratio of net investment income to average net assets(f) | | | 0.01 | % | | | 0.86 | % | | | 1.71 | % | | | 0.86 | % | | | 1.63 | % |
| Portfolio turnover rate(g) | | | 43 | % | | | 41 | % | | | 28 | % | | | 29 | % | | | 31 | % |
| (a) | Prior to March 31, 2020, the ALPS/Red Rocks Global Opportunity Fund was known as the ALPS/Red Rocks Listed Private Equity Fund. |
| (b) | Prior to December 1, 2017, Investor Class was known as Class A. |
| (c) | Calculated using the average shares method. |
| (d) | Less than $0.005 or ($0.005) per share. |
| (e) | Total returns are for the period indicated and have not been annualized. Total returns would have been lower had certain expenses not been waived during the period. Returns shown do not reflect the deduction of taxes that a shareholder would pay on Fund distributions or the redemption of Fund shares. |
| (f) | The ratios exclude the impact of expenses of the underlying funds in which the Fund invests as represented in the Statement of Investments. |
| (g) | Portfolio turnover rate for periods less than one full year have not been annualized. |
See Notes to Financial Statements.
ALPS | Red Rocks Global Opportunity Fund – Class A
Financial Highlights
Selected data for a share of beneficial interest outstanding throughout the periods indicated:
| | | For the Year
Ended
October 31,
2021 | | | For the Year
Ended
October 31,
2020(a) | | | For the Year
Ended
October 31,
2019 | | | For the Period
June 12, 2018
(Commencement
of Operations) to
October 31, 2018 | |
| Net asset value, beginning of period | | $ | 6.45 | | | $ | 7.67 | | | $ | 6.79 | | | $ | 7.23 | |
| | | | | | | | | | | | | | | | | |
| INCOME FROM INVESTMENT OPERATIONS: | | | | | | | | | | | | | | | | |
| Net investment income(b) | | | 0.00 | (c) | | | 0.04 | | | | 0.20 | | | | 0.01 | |
| Net realized and unrealized gain/(loss) | | | 3.20 | | | | (0.20 | ) | | | 0.99 | | | | (0.45 | ) |
| Total from investment operations | | | 3.20 | | | | (0.16 | ) | | | 1.19 | | | | (0.44 | ) |
| | | | | | | | | | | | | | | | | |
| DISTRIBUTIONS: | | | | | | | | | | | | | | | | |
| From net investment income | | | – | | | | (0.60 | ) | | | (0.08 | ) | | | – | |
| From net realized gains | | | (0.30 | ) | | | (0.47 | ) | | | (0.23 | ) | | | – | |
| Total distributions | | | (0.30 | ) | | | (1.07 | ) | | | (0.31 | ) | | | – | |
| | | | | | | | | | | | | | | | | |
| REDEMPTION FEES ADDED TO PAID-IN CAPITAL (NOTE 6) | | | 0.00 | (c) | | | 0.01 | | | | – | | | | – | |
| Net increase/(decrease) in net asset value | | | 2.90 | | | | (1.22 | ) | | | 0.88 | | | | (0.44 | ) |
| Net asset value, end of year | | $ | 9.35 | | | $ | 6.45 | | | $ | 7.67 | | | $ | 6.79 | |
| TOTAL RETURN(d) | | | 51.02 | % | | | (2.92 | )% | | | 18.64 | % | | | (6.09 | )% |
| | | | | | | | | | | | | | | | | |
| RATIOS/SUPPLEMENTAL DATA: | | | | | | | | | | | | | | | | |
| Net assets, end of year (000s) | | $ | 4,188 | | | $ | 2,544 | | | $ | 790 | | | $ | 9 | |
| Ratio of expenses to average net assets excluding fee waivers and reimbursements(e) | | | 1.47 | % | | | 1.51 | % | | | 1.48 | % | | | 1.48 | %(f) |
| Ratio of expenses to average net assets including fee waivers and reimbursements(e) | | | 1.47 | % | | | 1.51 | % | | | 1.48 | % | | | 1.48 | %(f) |
| Ratio of net investment income to average net assets(e) | | | 0.05 | % | | | 0.62 | % | | | 2.74 | % | | | 0.37 | %(f) |
| Portfolio turnover rate(g) | | | 43 | % | | | 41 | % | | | 28 | % | | | 29 | % |
| (a) | Prior to March 31, 2020, the ALPS/Red Rocks Global Opportunity Fund was known as the ALPS/Red Rocks Listed Private Equity Fund. |
| (b) | Calculated using the average shares method. |
| (c) | Less than $0.005 or ($0.005) per share. |
| (d) | Total returns are for the period indicated and have not been annualized. Total returns would have been lower had certain expenses not been waived during the period. Returns shown do not reflect the deduction of taxes that a shareholder would pay on Fund distributions or the redemption of Fund shares. Returns shown exclude any applicable sales charges. |
| (e) | The ratios exclude the impact of expenses of the underlying funds in which the Fund invests as represented in the Statement of Investments. |
| (g) | Portfolio turnover rate for periods less than one full year have not been annualized. |
See Notes to Financial Statements.
ALPS | Red Rocks Global Opportunity Fund – Class C
Financial Highlights
Selected data for a share of beneficial interest outstanding throughout the periods indicated:
| | | For the Year
Ended
October 31,
2021 | | | For the Year
Ended
October 31,
2020(a) | | | For the Year
Ended
October 31,
2019 | | | For the Year
Ended
October 31,
2018 | | | For the Year
Ended
October 31,
2017 | |
| Net asset value, beginning of period | | $ | 5.98 | | | $ | 7.25 | | | $ | 6.41 | | | $ | 7.66 | | | $ | 6.04 | |
| INCOME/(LOSS) FROM INVESTMENT OPERATIONS: | | | | | | | | | | | | | | | | | | | | |
| Net investment income/(loss)(b) | | | (0.06 | ) | | | 0.01 | | | | 0.06 | | | | 0.01 | | | | 0.06 | |
| Net realized and unrealized gain/(loss) | | | 2.97 | | | | (0.22 | ) | | | 1.03 | | | | (0.34 | ) | | | 1.65 | |
| Total from investment operations | | | 2.91 | | | | (0.21 | ) | | | 1.09 | | | | (0.33 | ) | | | 1.71 | |
| DISTRIBUTIONS: | | | | | | | | | | | | | | | | | | | | |
| From net investment income | | | – | | | | (0.59 | ) | | | (0.02 | ) | | | (0.67 | ) | | | (0.09 | ) |
| From net realized gains | | | (0.30 | ) | | | (0.47 | ) | | | (0.23 | ) | | | (0.25 | ) | | | – | |
| Total distributions | | | (0.30 | ) | | | (1.06 | ) | | | (0.25 | ) | | | (0.92 | ) | | | (0.09 | ) |
| REDEMPTION FEES ADDED TO PAID-IN CAPITAL (NOTE 6) | | | – | | | | 0.00 | (c) | | | 0.00 | (c) | | | – | | | | 0.00 | (c) |
| Net increase/(decrease) in net asset value | | | 2.61 | | | | (1.27 | ) | | | 0.84 | | | | (1.25 | ) | | | 1.62 | |
| Net asset value, end of year | | $ | 8.59 | | | $ | 5.98 | | | $ | 7.25 | | | $ | 6.41 | | | $ | 7.66 | |
| TOTAL RETURN(d) | | | 50.14 | % | | | (4.01 | )% | | | 17.83 | % | | | (4.88 | )% | | | 28.79 | % |
| | | | | | | | | | | | | | | | | | | | | |
| RATIOS/SUPPLEMENTAL DATA: | | | | | | | | | | | | | | | | | | | | |
| Net assets, end of year (000s) | | $ | 10,883 | | | $ | 9,061 | | | $ | 16,256 | | | $ | 18,847 | | | $ | 18,981 | |
| Ratio of expenses to average net assets excluding fee waivers and reimbursements(e) | | | 2.20 | % | | | 2.22 | % | | | 2.16 | % | | | 2.12 | % | | | 2.13 | % |
| Ratio of expenses to average net assets including fee waivers and reimbursements(e) | | | 2.20 | % | | | 2.22 | % | | | 2.16 | % | | | 2.12 | % | | | 2.13 | % |
| Ratio of net investment income/(loss) to average net assets(e) | | | (0.73 | )% | | | 0.12 | % | | | 0.86 | % | | | 0.15 | % | | | 0.83 | % |
| Portfolio turnover rate(f) | | | 43 | % | | | 41 | % | | | 28 | % | | | 29 | % | | | 31 | % |
| (a) | Prior to March 31, 2020, the ALPS/Red Rocks Global Opportunity Fund was known as the ALPS/Red Rocks Listed Private Equity Fund. |
| (b) | Calculated using the average shares method. |
| (c) | Less than $0.005 or ($0.005) per share. |
| (d) | Total returns are for the period indicated and have not been annualized. Total returns would have been lower had certain expenses not been waived during the period. Returns shown do not reflect the deduction of taxes that a shareholder would pay on Fund distributions or the redemption of Fund shares. Returns shown exclude any applicable sales charges. |
| (e) | The ratios exclude the impact of expenses of the underlying funds in which the Fund invests as represented in the Statement of Investments. |
| (f) | Portfolio turnover rate for periods less than one full year have not been annualized. |
See Notes to Financial Statements.
ALPS | Red Rocks Global Opportunity Fund – Class I
Financial Highlights
Selected data for a share of beneficial interest outstanding throughout the periods indicated:
| | | For the Year
Ended
October 31,
2021 | | | For the Year
Ended
October 31,
2020(a) | | | For the Year
Ended
October 31,
2019 | | | For the Year
Ended
October 31,
2018 | | | For the Year
Ended
October 31,
2017 | |
| Net asset value, beginning of period | | $ | 6.61 | | | $ | 7.84 | | | $ | 6.92 | | | $ | 8.18 | | | $ | 6.39 | |
| INCOME/(LOSS) FROM INVESTMENT OPERATIONS: | | | | | | | | | | | | | | | | | | | | |
| Net investment income(b) | | | 0.02 | | | | 0.07 | | | | 0.13 | | | | 0.09 | | | | 0.13 | |
| Net realized and unrealized gain/(loss) | | | 3.28 | | | | (0.23 | ) | | | 1.10 | | | | (0.37 | ) | | | 1.76 | |
| Total from investment operations | | | 3.30 | | | | (0.16 | ) | | | 1.23 | | | | (0.28 | ) | | | 1.89 | |
| DISTRIBUTIONS: | | | | | | | | | | | | | | | | | | | | |
| From net investment income | | | – | | | | (0.60 | ) | | | (0.08 | ) | | | (0.73 | ) | | | (0.10 | ) |
| From net realized gains | | | (0.30 | ) | | | (0.47 | ) | | | (0.23 | ) | | | (0.25 | ) | | | – | |
| Total distributions | | | (0.30 | ) | | | (1.07 | ) | | | (0.31 | ) | | | (0.98 | ) | | | (0.10 | ) |
| REDEMPTION FEES ADDED TO PAID-IN CAPITAL (NOTE 6) | | | 0.00 | (c) | | | 0.00 | (c) | | | 0.00 | (c) | | | 0.00 | (c) | | | 0.00 | (c) |
| Net increase/(decrease) in net asset value | | | 3.00 | | | | (1.23 | ) | | | 0.92 | | | | (1.26 | ) | | | 1.79 | |
| Net asset value, end of year | | $ | 9.61 | | | $ | 6.61 | | | $ | 7.84 | | | $ | 6.92 | | | $ | 8.18 | |
| TOTAL RETURN(d) | | | 51.31 | % | | | (2.93 | )% | | | 18.98 | % | | | (3.87 | )% | | | 30.09 | % |
| RATIOS/SUPPLEMENTAL DATA: | | | | | | | | | | | | | | | | | | | | |
| Net assets, end of year (000s) | | $ | 69,176 | | | $ | 55,950 | | | $ | 141,286 | | | $ | 174,034 | | | $ | 138,572 | |
| Ratio of expenses to average net assets excluding fee waivers and reimbursements(e) | | | 1.20 | % | | | 1.22 | % | | | 1.19 | % | | | 1.15 | % | | | 1.16 | % |
| Ratio of expenses to average net assets including fee waivers and reimbursements(e) | | | 1.20 | % | | | 1.22 | % | | | 1.19 | % | | | 1.15 | % | | | 1.16 | % |
| Ratio of net investment income to average net assets(e) | | | 0.29 | % | | | 1.08 | % | | | 1.80 | % | | | 1.15 | % | | | 1.85 | % |
| Portfolio turnover rate(f) | | | 43 | % | | | 41 | % | | | 28 | % | | | 29 | % | | | 31 | % |
| (a) | Prior to March 31, 2020, the ALPS/Red Rocks Global Opportunity Fund was known as the ALPS/Red Rocks Listed Private Equity Fund. |
| (b) | Calculated using the average shares method. |
| (c) | Less than $0.005 or ($0.005) per share. |
| (d) | Total returns are for the period indicated and have not been annualized. Total returns would have been lower had certain expenses not been waived during the period. Returns shown do not reflect the deduction of taxes that a shareholder would pay on Fund distributions or the redemption of Fund shares. Returns shown exclude any applicable sales charges. |
| (e) | The ratios exclude the impact of expenses of the underlying funds in which the Fund invests as represented in the Statement of Investments. |
| (f) | Portfolio turnover rate for periods less than one full year have not been annualized. |
See Notes to Financial Statements.
ALPS | Red Rocks Global Opportunity Fund – Class R
Financial Highlights
Selected data for a share of beneficial interest outstanding throughout the periods indicated:
| | | For the Year
Ended
October 31,
2021 | | | For the Year
Ended
October 31,
2020(a) | | | For the Year
Ended
October 31,
2019 | | | For the Year
Ended
October 31,
2018 | | | For the Year
Ended
October 31,
2017 | |
| Net asset value, beginning of period | | $ | 5.23 | | | $ | 6.45 | | | $ | 5.75 | | | $ | 6.97 | | | $ | 5.48 | |
| INCOME/(LOSS) FROM INVESTMENT OPERATIONS: | | | | | | | | | | | | | | | | | | | | |
| Net investment income/(loss)(b) | | | (0.01 | ) | | | 0.03 | | | | 0.09 | | | | 0.04 | | | | 0.09 | |
| Net realized and unrealized gain/(loss) | | | 2.58 | | | | (0.18 | ) | | | 0.90 | | | | (0.30 | ) | | | 1.50 | |
| Total from investment operations | | | 2.57 | | | | (0.15 | ) | | | 0.99 | | | | (0.26 | ) | | | 1.59 | |
| DISTRIBUTIONS: | | | | | | | | | | | | | | | | | | | | |
| From net investment income | | | – | | | | (0.60 | ) | | | (0.06 | ) | | | (0.71 | ) | | | (0.10 | ) |
| From net realized gains | | | (0.30 | ) | | | (0.47 | ) | | | (0.23 | ) | | | (0.25 | ) | | | – | |
| Total distributions | | | (0.30 | ) | | | (1.07 | ) | | | (0.29 | ) | | | (0.96 | ) | | | (0.10 | ) |
| Net increase/(decrease) in net asset value | | | 2.27 | | | | (1.22 | ) | | | 0.70 | | | | (1.22 | ) | | | 1.49 | |
| Net asset value, end of year | | $ | 7.50 | | | $ | 5.23 | | | $ | 6.45 | | | $ | 5.75 | | | $ | 6.97 | |
| TOTAL RETURN(c) | | | 50.86 | % | | | (3.56 | )% | | | 18.47 | % | | | (4.31 | )% | | | 29.51 | % |
| | | | | | | | | | | | | | | | | | | | | |
| RATIOS/SUPPLEMENTAL DATA: | | | | | | | | | | | | | | | | | | | | |
| Net assets, end of year (000s) | | $ | 6,987 | | | $ | 5,231 | | | $ | 5,782 | | | $ | 4,684 | | | $ | 4,236 | |
| Ratio of expenses to average net assets excluding fee waivers and reimbursements(d) | | | 1.65 | % | | | 1.68 | % | | | 1.61 | % | | | 1.57 | % | | | 1.56 | % |
| Ratio of expenses to average net assets including fee waivers and reimbursements(d) | | | 1.65 | % | | | 1.68 | % | | | 1.61 | % | | | 1.57 | % | | | 1.56 | % |
| Ratio of net investment income/(loss) to average net assets(d) | | | (0.17 | )% | | | 0.61 | % | | | 1.51 | % | | | 0.70 | % | | | 1.43 | % |
| Portfolio turnover rate(e) | | | 43 | % | | | 41 | % | | | 28 | % | | | 29 | % | | | 31 | % |
| (a) | Prior to March 31, 2020, the ALPS/Red Rocks Global Opportunity Fund was known as the ALPS/Red Rocks Listed Private Equity Fund. |
| (b) | Calculated using the average shares method. |
| (c) | Total returns are for the period indicated and have not been annualized. Total returns would have been lower had certain expenses not been waived during the period. Returns shown do not reflect the deduction of taxes that a shareholder would pay on Fund distributions or the redemption of Fund shares. Returns shown exclude any applicable sales charges. |
| (d) | The ratios exclude the impact of expenses of the underlying funds in which the Fund invests as represented in the Statement of Investments. |
| (e) | Portfolio turnover rate for periods less than one full year have not been annualized. |
See Notes to Financial Statements.
| Management Commentary | October 31, 2021 (Unaudited) |
The Clough China Fund (the “Fund”) had a net return of 1.41% for Class I, compared to -8.01% for the broad based Morningstar China Index, the Fund’s benchmark, for the fiscal year ended on October 31, 2021. From an individual stock perspective, over the fiscal year Tesla Inc. (“Tesla”), Contemporary Amperex Technology Co Ltd. (“CATL”), Bilibili Inc. (“BILI”), Moderna Inc. (“Moderna”)and Wuxi Biologics Cayman Inc. (“Wuxi Bio”) were the top contributors to performance, while Alibaba Group Holding Ltd. (“Alibaba”), Tencent Holdings Ltd. (“Tencent”), Meituan Dianping Class B (“Meituan”), Baidu Inc. (“Baidu”) and JD.com Inc. (“JD”) were the top detractors from performance during the period.
This past fiscal year has been very volatile. As the economy has battled through the COVID pandemic, the Chinese government also cracked down on the internet sector leading to sharp declines in the sector. On the other hand, the government supported sectors of the economy like electric vehicles (“EVs”) which did very well. These trends are reflected in the top and bottom performers of the year.
Our top contributors for the year:
| 1. | Tesla is one of the biggest beneficiaries of the move towards EVs. China is key for Tesla both from a demand and supply standpoint. Currently, 25-30% of Tesla’s cars are sold in China and this market is key to Tesla’s success going forward. We believe China will be one of the biggest EV markets over the next few years and maintaining/growing market share here is extremely important. On the supply side, Tesla is rapidly scaling up its factory in Shanghai which is being used as an export hub in addition to producing cars which will be sold in China. |
| 2. | CATL, like Tesla, is another beneficiary of the transition to EVs. It is one of the largest battery makers in the world today and, we think, is poised to benefit from the explosion in demand for batteries from both electric vehicles and other industries. |
| 3. | BILI is an online social media and video platform (similar to Instagram) which is popular with the younger demographic in China. To the best of our knowledge, it is the only company to have been invested in by Alibaba, Tencent and Sony. The stock has performed well despite the crackdown on the internet sector. |
| 4. | Moderna has been one of the leading vaccine innovators and was one of the first to develop a vaccine to combat the coronavirus, thereby helping global economies to reopen and recover. |
| 5. | Wuxi Bio is a core position in the Fund. It has been a beneficiary of two long-term trends: 1) providing contract research organization facilities for the growing domestic Chinese drug development industry and 2) global pharmaceutical companies increasingly conducting drug trials in China. |
Our top detractors for the year:
| 1. | Alibaba has been one of the hardest hit by the Chinese government’s regulation of the internet sector. It started with the unsuccessful attempt to conduct an initial public offering of the Ant Financial business but has since expanded to include the slowdown in their core e-commerce business as well. While the stock is cheap, it is unclear if and when the fundamentals of the business will turn. |
| 2. | Tencent is China’s largest gaming and social networking platform and has historically been one of the Fund’s larger positions, as the company continued to deliver consistent revenue growth on the back of its dominant position as a gaming and social media giant. Tencent had a very strong pipeline of new games being released this year, and has been a beneficiary of its customers working from home. However, Tencent has also been caught up in the regulatory crackdown in the internet sector. While we continue to believe that Tencent remains very well positioned within the sector, the stock will not likely perform until there is clarity on further regulation in the space. |
| 3. | Like Tencent, Meituan, a web-based shopping platform for consumer products and retail services, is also well positioned as the impact of new government regulation is limited and quantifiable (e.g., increased compensation for their delivery workers). However, for the stock to perform, there needs to be clarity on further regulation. |
| 4. | Baidu’s core search business has slowed especially with the economic slowdown in China. However, it has strong intellectual property in autonomous vehicles that we believe is currently underappreciated by the market. |
| 5. | JD is one of the most interesting stocks in China internet. Like others, it has been affected by the crackdown, but this has also presented the opportunity to gain market share from Alibaba, which could be very important for JD moving forward. |
We think there is a tremendous opportunity for active investing in China right now. We believe the biggest companies in China in the next decade will be created in EVs, semiconductors, robotics and “hard tech”, while the indices are backward-looking and focused more on large internet companies and state-owned enterprises. Furthermore, if the trade tensions between the U.S. and China resolve, and if the pandemic subsides, there is some potential for Chinese markets to start to outperform the global markets again.
Anupam Bose, Portfolio Manager
Chuck Clough, Portfolio Manager
| Management Commentary | October 31, 2021 (Unaudited) |
Investments in international and emerging markets securities include exposure to risks such as currency fluctuations, foreign taxes and regulations, and the potential for illiquid markets and political instability.
The views of the authors and information discussed in this commentary are as of the date of publication, are subject to change, and may not reflect the writer's current views. The views expressed are those of the authors only, and represent an assessment of market conditions at a specific point in time, are opinions only and should not be relied upon as investment advice regarding a particular investment or markets in general. Such information does not constitute a recommendation to buy or sell specific securities or investment vehicles. It should not be assumed that any investment will be profitable or will equal the performance of the fund(s) or any securities or any sectors mentioned in this letter. The subject matter contained in this letter has been derived from several sources believed to be reliable and accurate at the time of compilation. Neither ALPS, Advisors, Inc., Clough Capital Partners, LP, nor the Fund accepts any liability for losses either direct or consequential caused by the use of this information.
Past performance is no guarantee of future results. Dividends are not guaranteed and are subject to change or elimination. Investments in international and emerging markets securities include exposure to risks such as currency fluctuations, foreign taxes and regulations, and the potential for illiquid markets and political instability.
ALPS Portfolio Solutions Distributor, Inc., ALPS Distributors, Inc. and ALPS Advisors Inc. are affiliated.
| Performance Update | October 31, 2021 (Unaudited) |
Performance of $100,000 Initial Investment (as of October 31, 2021)
Comparison of change in value of a $100,000 investment over 10 years

The chart above represents historical performance of a hypothetical investment of $100,000 in the Fund. Past performance does not guarantee future results. This chart does not reflect the deduction of taxes that a shareholder would pay on Fund distributions or the redemption of Fund shares.
Average Annual Total Returns (as of October 31, 2021)
| | 1 Year5 | 3 Year | 5 Year | 10 Year | Since
Inception1 | Total
Expense
Ratio | What You
Pay2 |
| Class I (NAV) | 1.41% | 12.57% | 7.83% | 6.86% | 9.82% | 1.66% | 1.35% |
| Investor 3 (NAV) | 1.13% | 12.26% | 7.56% | 6.55% | 9.42% | 1.89% | 1.60% |
| Class A (NAV) | 1.17% | 12.25% | 7.55% | 6.54% | 9.42% | 1.82% | 1.60% |
| Class A (MOP) | -4.39% | 10.16% | 6.33% | 5.94% | 9.03% |
| Class C (NAV) | 0.43% | 11.45% | 6.76% | 5.74% | 8.61% | 2.69% | 2.35% |
| Class C (CDSC) | -0.53% | 11.45% | 6.76% | 5.74% | 8.61% |
| Morningstar China Index4 | -8.01% | 12.69% | 10.46% | 7.67% | 10.46% | | |
| MSCI China NR USD | -9.21% | 11.49% | 10.23% | 7.49% | 10.03% | | |
Performance data quoted represents past performance. Past performance does not guarantee future results and current performance may be lower or higher than the performance quoted. Investment return and principal value of an investment will fluctuate so that an investor’s shares, when sold, may be worth more or less than the original cost. Performance reflects the deduction of management fees and other applicable expenses and includes reinvested distributions and capital gains. The Fund imposes a 2.00% redemption fee on shares held for less than 30 days. Performance shown does not include the redemption fee, which, if reflected, would reduce the performance quoted. For the most current month-end performance data please call 1.866.759.5679.
Maximum Offering Price (MOP) for Class A shares includes the Fund’s maximum sales charge of 5.50%. Contingent Deferred Sales Charge (CDSC) performance for Class C shares includes a 1.00% CDSC on Class C shares redeemed within 12 months of purchase. Performance shown at Net Asset Value (NAV) does not include these sales charges and would have been lower had it been taken into account.
On January 15, 2010, the Old Mutual China Fund (the “Predecessor Fund”) was reorganized into the Clough China Fund (the “Fund”). The historical performance shown for periods prior to January 15, 2010 reflects the historical information for the Predecessor Fund. Clough Capital Partners L.P. did not serve as investment advisor or sub-advisor to the Predecessor Fund.
| Performance Update | October 31, 2021 (Unaudited) |
Performance for Class A shares prior to June 12, 2018 reflects the historical performance of the respective Fund’s Investor Class shares, calculated using the fees and expenses of Class A shares.
| 1 | Predecessor Fund Inception date of December 30, 2005. |
| 2 | What You Pay reflects the Advisor’s decision to contractually limit expenses through February 28, 2022. Please see the prospectus dated February 28, 2021 for additional information. |
| 3 | Prior to December 1, 2017, Investor Class was known as Class A. |
| 4 | The Morningstar China Index measures the performance of China's equity markets targeting the top 97% of stocks by market capitalization. The index is not actively managed and does not reflect any deduction for fees, expenses or taxes. One may not invest directly in an index. |
| 5 | Excludes adjustments in accordance with accounting principles generally accepted in the United States of America and as such, the net asset value and total return for shareholder transactions reported to the market may differ from the net asset value for financial reporting purposes. |
The Fund is “non-diversified” and will generally be more volatile than diversified funds.
The table does not reflect the deduction of taxes that a shareholder would pay on Fund distributions or the redemption of Fund shares.
This Fund is not suitable for all investors and is subject to investment risks, including possible loss of the principal amount invested.
There is no guarantee that the Fund will continue to hold any one particular security or stay invested in any one particular company. The composition of the Fund's top holdings is subject to change. Performance figures are historical and reflect the change in share price, reinvested distributions, changes in net asset value, sales charges and capital gains distributions, if any.
Not FDIC Insured – No Bank Guarantee – May Lose Value
Investing in China and Hong Kong involves risk and considerations not present when investing in more established securities markets. The Fund may be more susceptible to the economic, market, political and local risks of these regions than a fund that is more geographically diversified.
Top Ten Holdings (as a % of Net Assets) †
| Tencent Holdings, Ltd. | 11.54% |
| Alibaba Group Holding, Ltd. | 9.39% |
| Contemporary Amperex Technology Co., Ltd. | 6.66% |
| Tesla, Inc. | 5.25% |
| BYD Co., Ltd. | 4.42% |
| Postal Savings Bank of China Co., Ltd. | 4.29% |
| Wuxi Biologics Cayman, Inc. | 4.25% |
| Shenzhou International Group Holdings, Ltd. | 2.97% |
| Sea, Ltd. | 2.83% |
| Li Ning Co., Ltd. | 2.83% |
| Top Ten Holdings | 54.43% |
| † | Holdings are subject to change. Calculated as a percent of net assets. Exposure figures reported include the notional value of total return swaps and exclude cash and cash equivalents. |
Sector Allocation^ (as a % of Net Assets)
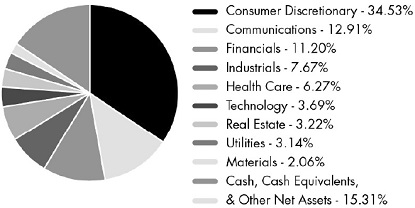
| ^ | Holdings are subject to change. Calculated as a percent of net assets. Exposure figures reported include the notional value of total return swaps. |
| Statement of Investments | October 31, 2021 |
| | | Shares | | | Value
(Note 2) | |
| COMMON STOCKS (84.69%) | | | | | | | | |
| Communications (12.91%) | | | | | | | | |
| Internet Media & Services (12.91%) | | | | | | | | |
| Baidu, Inc., Sponsored ADR(a)(b) | | | 2,700 | | | $ | 438,048 | |
| Meituan, Class B(a) | | | 2,100 | | | | 71,460 | |
| Tencent Holdings, Ltd. | | | 70,600 | | | | 4,294,584 | |
| | | | | | | | 4,804,092 | |
| | | | | | | | | |
| TOTAL COMMUNICATIONS | | | | | | | 4,804,092 | |
| | | | | | | | | |
| Consumer Discretionary (34.53%) | | | | | | | | |
| Apparel & Textile Products (2.97%) | | | | | | | | |
| Shenzhou International Group Holdings, Ltd. | | | 51,300 | | | | 1,105,218 | |
| | | | | | | | | |
| Automotive (10.16%) | | | | | | | | |
| BYD Co., Ltd., Class H | | | 43,000 | | | | 1,644,646 | |
| Great Wall Motor Co., Ltd., Class H | | | 40,000 | | | | 179,982 | |
| Tesla, Inc.(a)(b) | | | 1,755 | | | | 1,955,070 | |
| | | | | | | | 3,779,698 | |
| | | | | | | | | |
| E-Commerce Discretionary (14.72%) | | | | | | | | |
| Alibaba Group Holding, Ltd., Sponsored ADR(a)(b) | | | 21,191 | | | | 3,495,244 | |
| Hong Kong Technology Venture Co., Ltd. | | | 570,000 | | | | 857,886 | |
| Pinduoduo, Inc., ADR(a) | | | 800 | | | | 71,136 | |
| Sea, Ltd., ADR(a)(b) | | | 3,070 | | | | 1,054,760 | |
| | | | | | | | 5,479,026 | |
| | | | | | | | | |
| Leisure Facilities & Services (1.46%) | | | | | | | | |
| Shangri-La Asia, Ltd.(a) | | | 126,000 | | | | 102,672 | |
| Yum China Holdings, Inc. | | | 7,500 | | | | 439,973 | |
| | | | | | | | 542,645 | |
| | | | | | | | | |
| Retail - Discretionary (5.22%) | | | | | | | | |
| ANTA Sports Products, Ltd. | | | 33,000 | | | | 511,293 | |
| China Yongda Automobiles Services Holdings, Ltd. | | | 137,500 | | | | 218,773 | |
| Giordano International, Ltd. | | | 828,000 | | | | 161,554 | |
| Li Ning Co., Ltd. | | | 95,343 | | | | 1,052,116 | |
| | | | | | | | 1,943,736 | |
| | | | | | | | | |
| TOTAL CONSUMER DISCRETIONARY | | | | | | | 12,850,323 | |
| | | | | | | | | |
| Financials (11.20%) | | | | | | | | |
| Banking (7.71%) | | | | | | | | |
| China Construction Bank Corp., Class H | | | 751,080 | | | | 511,171 | |
| China Merchants Bank Co., Ltd., Class H | | | 91,000 | | | | 762,593 | |
| | | Shares | | | Value
(Note 2) | |
| Postal Savings Bank of China Co., Ltd., Class H | | | 2,198,000 | | | $ | 1,597,492 | |
| | | | | | | | 2,871,256 | |
| | | | | | | | | |
| Institutional Financial Services (1.25%) | | | | | | | | |
| Hong Kong Exchanges and Clearing, Ltd. | | | 7,700 | | | | 463,861 | |
| | | | | | | | | |
| Insurance (2.24%) | | | | | | | | |
| AIA Group, Ltd. | | | 74,392 | | | | 833,712 | |
| | | | | | | | | |
| TOTAL FINANCIALS | | | | | | | 4,168,829 | |
| | | | | | | | | |
| Health Care (6.27%) | | | | | | | | |
| Health Care Facilities & Services (5.08%) | | | | | | | | |
| WuXi AppTec Co., Ltd., Class H | | | 14,300 | | | | 305,322 | |
| Wuxi Biologics Cayman, Inc.(a) | | | 104,500 | | | | 1,582,858 | |
| | | | | | | | 1,888,180 | |
| | | | | | | | | |
| Medical Equipment & Devices (1.19%) | | | | | | | | |
| Modern Dental Group, Ltd. | | | 523,000 | | | | 443,610 | |
| | | | | | | | | |
| TOTAL HEALTH CARE | | | | | | | 2,331,790 | |
| | | | | | | | | |
| Industrials (7.67%) | | | | | | | | |
| Engineering & Construction (0.68%) | | | | | | | | |
| China State Construction International Holdings, Ltd. | | | 248,000 | | | | 254,093 | |
| | | | | | | | | |
| Machinery (4.40%) | | | | | | | | |
| LK Technology Holdings, Ltd. | | | 339,000 | | | | 845,917 | |
| Techtronic Industries Co., Ltd. | | | 38,500 | | | | 790,992 | |
| | | | | | | | 1,636,909 | |
| | | | | | | | | |
| Transportation & Logistics (2.59%) | | | | | | | | |
| China Merchants Port Holdings Co., Ltd. | | | 578,000 | | | | 963,630 | |
| | | | | | | | | |
| TOTAL INDUSTRIALS | | | | | | | 2,854,632 | |
| | | | | | | | | |
| Materials (2.06%) | | | | | | | | |
| Chemicals (0.56%) | | | | | | | | |
| Sinopec Shanghai Petrochemical Co., Ltd., Class H | | | 892,000 | | | | 208,135 | |
| | | | | | | | | |
| Construction Materials (0.77%) | | | | | | | | |
| Anhui Conch Cement Co., Ltd., Class H | | | 58,000 | | | | 286,805 | |
| Statement of Investments | October 31, 2021 |
| | | Shares | | | Value
(Note 2) | |
| Metals & Mining (0.73%) | | | | | | | | |
| Aluminum Corp. of China, Ltd., Class H(a) | | | 451,000 | | | $ | 271,408 | |
| | | | | | | | | |
| TOTAL MATERIALS | | | | | | | 766,348 | |
| | | | | | | | | |
| Real Estate (3.22%) | | | | | | | | |
| Real Estate Owners & Developers (2.27%) | | | | | | | | |
| China Overseas Grand Oceans Group, Ltd. | | | 597,000 | | | | 286,231 | |
| KWG Group Holdings, Ltd. | | | 246,228 | | | | 214,640 | |
| Wharf Real Estate Investment Co., Ltd. | | | 61,000 | | | | 344,544 | |
| | | | | | | | 845,415 | |
| | | | | | | | | |
| Real Estate Services (0.95%) | | | | | | | | |
| Country Garden Services Holdings Co., Ltd. | | | 46,000 | | | | 354,130 | |
| | | | | | | | | |
| TOTAL REAL ESTATE | | | | | | | 1,199,545 | |
| | | | | | | | | |
| Technology (3.69%) | | | | | | | | |
| Technology Hardware (2.00%) | | | | | | | | |
| Silergy Corp. | | | 4,500 | | | | 743,423 | |
| | | | | | | | | |
| Technology Services (1.69%) | | | | | | | | |
| Chinasoft International, Ltd.(a) | | | 378,000 | | | | 631,158 | |
| | | | | | | | | |
| TOTAL TECHNOLOGY | | | | | | | 1,374,581 | |
| | | | | | | | | |
| Utilities (3.14%) | | | | | | | | |
| Electric Utilities (0.69%) | | | | | | | | |
| China Everbright International, Ltd. | | | 372,000 | | | | 255,547 | |
| | | | | | | | | |
| Gas & Water Utilities (2.45%) | | | | | | | | |
| China Everbright Water, Ltd. | | | 410,000 | | | | 94,182 | |
| Hong Kong & China Gas Co., Ltd. | | | 141,750 | | | | 220,213 | |
| Kunlun Energy Co., Ltd. | | | 282,000 | | | | 256,840 | |
| Towngas China Co., Ltd.(a) | | | 498,000 | | | | 341,886 | |
| | | | | | | | 913,121 | |
| | | | | | | | | |
| TOTAL UTILITIES | | | | | | | 1,168,668 | |
| | | | | | | | | |
| TOTAL COMMON STOCKS | | | | | | | | |
| (Cost $25,528,754) | | | | | | | 31,518,808 | |
| | | | Shares | | | Value
(Note 2) | |
| SHORT TERM INVESTMENTS (12.93%) | | | | | | | | | |
| Money Market Fund (12.93%) | | | | | | | | | |
| Blackrock Liquidity Funds, T-Fund | | | 0.010 | % | | | 4,809,969 | | | $ | 4,809,969 | |
| | | | | | | | | |
| TOTAL SHORT TERM INVESTMENTS | | | | | | | | |
| (Cost $4,809,969) | | | | | | | 4,809,969 | |
| | | | | | | | | |
| TOTAL INVESTMENTS (97.62%) | | | | | | | | |
| (Cost $30,338,723) | | | | | | $ | 36,328,777 | |
| | | | | | | | | |
| Other Assets In Excess Of Liabilities (2.38%)(c) | | | | | | | 886,907 | |
| | | | | | | | | |
| NET ASSETS (100.00%) | | | | | | $ | 37,215,684 | |
| (a) | Non-Income Producing Security. |
| (b) | Security, or a portion of security, is being held as collateral for total return swap contracts and futures contracts aggregating a total market value of $5,555,682. |
| (c) | Includes cash which is being held as collateral for total return swap contracts in the amount of $(71,771). |
| Statement of Investments | October 31, 2021 |
TOTAL RETURN SWAP CONTRACTS(a)
Swap Counterparty | | Reference Obligation | | Notional
Amount | | | Floating Rate/Fixed Amount
Paid by Fund* | | Termination
Date | | Value | | | Unrealized
Appreciation | |
| Morgan Stanley | | Contemporary Amperex Technology Co., Ltd. | | $ | 1,600,502 | | | 1D FEDEF + 250 BPS | | 1/6/2022 | | $ | 2,477,248 | | | $ | 876,746 | |
| Morgan Stanley | | Shenzhen Inovance Technology Co., Ltd. | | | 779,080 | | | 1D FEDEF + 250 BPS | | 1/6/2022 | | | 810,877 | | | | 31,797 | |
| Morgan Stanley | | Shenzhen Mindray Bio-Med Electronics Co., Ltd. | | | 587,975 | | | 1D FEDEF + 250 BPS | | 1/6/2022 | | | 605,336 | | | | 17,361 | |
| Morgan Stanley | | Sungrow Power Supply Co., Ltd. | | | 515,573 | | | 1D FEDEF + 250 BPS | | 1/6/2022 | | | 582,106 | | | | 66,533 | |
| | | | | $ | 3,483,130 | | | | | | | $ | 4,475,567 | | | $ | 992,437 | |
Swap
Counterparty | | Reference Obligation | | Notional
Amount | | | Floating Rate/Fixed Amount
Paid by Fund* | | Termination
Date | | Value | | | Unrealized
Depreciation | |
| Morgan Stanley | | Estun | | $ | 187,298 | | | 1D FEDEF + 250 BPS | | 1/6/2022 | | $ | 150,451 | | | $ | (36,847 | ) |
| Morgan Stanley | | Goetrek, Inc. | | | 686,721 | | | 1D FEDEF + 255 BPS | | 1/6/2022 | | | 685,830 | | | | (891 | ) |
| Morgan Stanley | | Kweichow Moutai Co., Ltd. | | | 260,914 | | | 1D FEDEF + 250 BPS | | 1/6/2022 | | | 210,308 | | | | (50,606 | ) |
| Morgan Stanley | | Ping An Bank Co., Ltd. | | | 415,317 | | | 1D FEDEF + 250 BPS | | 1/6/2022 | | | 335,802 | | | | (79,515 | ) |
| Morgan Stanley | | Sany Heavy Industry Co., Ltd. | | | 179,421 | | | 1D FEDEF + 250 BPS | | 1/6/2022 | | | 133,828 | | | | (45,593 | ) |
| Morgan Stanley | | Wuliangye Yibin Co., Ltd. | | | 296,376 | | | 1D FEDEF + 255 BPS | | 1/6/2022 | | | 253,751 | | | | (42,625 | ) |
| Morgan Stanley | | Zoomlion Heavy Industry Science & Tech, Ltd. | | | 293,739 | | | 1D FEDEF + 255 BPS | | 1/6/2022 | | | 260,247 | | | | (33,492 | ) |
| Morgan Stanley | | Zoomlion Heavy Industry Science & Tech, Ltd. | | | 361,318 | | | 1D FEDEF + 250 BPS | | 1/6/2022 | | | 239,002 | | | | (122,316 | ) |
| | | | | $ | 2,681,104 | | | | | | | $ | 2,269,219 | | | $ | (411,885 | ) |
| (a) | For long positions in the total return swap, the Fund receives payments based on any positive return of the Reference Obligation less the rate paid by the Fund. The Fund makes payments on any negative return of such Reference Obligations plus the rate paid by the Fund. For the short positions in the total return swap, the Fund makes payments based on any positive return of the Reference Obligation less the rate received by the Fund. The Fund receives payments on any negative return of such Reference Obligations plus the rate received by the Fund. |
| * | Payments made when swap contract closes. |
Investment Abbreviations:
1D FEDEF - Federal Funds Effective Rate (Daily)
For Fund compliance purposes, the Fund's industry classifications refer to any one or more of the industry sub-classifications used by one or more widely recognized market indexes or ratings group indexes, and/or as defined by Fund management. This definition may not apply for purposes of this report, which may combine industry sub-classifications for reporting ease. Industries are shown as a percent of net assets.
See Notes to Financial Statements.
| Statement of Assets and Liabilities | October 31, 2021 |
| ASSETS | | | | |
| Investments, at value | | $ | 36,328,777 | |
| Foreign currency, at value (Cost $1) | | | 1 | |
| Unrealized appreciation on total return swap contracts | | | 992,437 | |
| Receivable for investments sold | | | 429,016 | |
| Receivable for shares sold | | | 1,069 | |
| Dividends receivable | | | 32,713 | |
| Prepaid expenses and other assets | | | 9,849 | |
| Total Assets | | | 37,793,862 | |
| LIABILITIES | | | | |
| Payable for shares redeemed | | | 1 | |
| collateral due to broker for total return swap contracts | | | 71,771 | |
| Unrealized depreciation on total return swap contracts | | | 411,885 | |
| Investment advisory fees payable | | | 19,109 | |
| Administration and transfer agency fees payable | | | 21,152 | |
| Distribution and services fees payable | | | 3,104 | |
| Trustees' fees and expenses payable | | | 436 | |
| Professional fees payable | | | 26,451 | |
| Accrued expenses and other liabilities | | | 24,269 | |
| Total Liabilities | | | 578,178 | |
| NET ASSETS | | $ | 37,215,684 | |
| NET ASSETS CONSIST OF | | | | |
| Paid-in capital | | $ | 24,822,327 | |
| Total distributable earnings | | | 12,393,357 | |
| NET ASSETS | | $ | 37,215,684 | |
| INVESTMENTS, AT COST | | $ | 30,338,723 | |
| PRICING OF SHARES | | | | |
| Investor Class: | | | | |
| Net Asset Value, offering and redemption price per share | | $ | 24.33 | |
| Net Assets | | $ | 9,257,802 | |
| Shares of beneficial interest outstanding (unlimited number of shares, no par value common stock authorized) | | | 380,439 | |
| Class A: | | | | |
| Net Asset Value, offering and redemption price per share | | $ | 24.32 | |
| Net Assets | | $ | 1,538,463 | |
| Shares of beneficial interest outstanding (unlimited number of shares, no par value common stock authorized) | | | 63,255 | |
| Maximum offering price per share ((NAV/0.9450), based on maximum sales charge of 5.50% of the offering price) | | $ | 25.74 | |
| Class C: | | | | |
| Net Asset Value, offering and redemption price per share(a) | | $ | 22.14 | |
| Net Assets | | $ | 903,112 | |
| Shares of beneficial interest outstanding (unlimited number of shares, no par value common stock authorized) | | | 40,793 | |
| Class I: | | | | |
| Net Asset Value, offering and redemption price per share | | $ | 25.29 | |
| Net Assets | | $ | 25,516,307 | |
| Shares of beneficial interest outstanding (unlimited number of shares, no par value common stock authorized) | | | 1,008,957 | |
| (a) | Redemption price per share may be reduced for any applicable contingent deferred sales charge. For a description of a possible sales charge, please see the Fund's Prospectus. |
See Notes to Financial Statements.
| Statement of Operations | For the Year Ended October 31, 2021 |
| INVESTMENT INCOME | | | |
| Dividends | | $ | 816,302 | |
| Foreign taxes withheld on dividends | | | (32,036 | ) |
| Total Investment Income | | | 784,266 | |
| | | | | |
| EXPENSES | | | | |
| Investment advisory fees | | | 444,871 | |
| Administrative fees | | | 93,476 | |
| Transfer agency fees | | | 28,335 | |
| Distribution and service fees | | | | |
| Investor Class | | | 29,095 | |
| Class A | | | 5,224 | |
| Class C | | | 10,956 | |
| Professional fees | | | 29,825 | |
| Reports to shareholders and printing fees | | | 4,149 | |
| State registration fees | | | 52,747 | |
| Insurance fees | | | 530 | |
| Custody fees | | | 18,255 | |
| Trustees' fees and expenses | | | 2,334 | |
| Miscellaneous expenses | | | 16,627 | |
| Total Expenses | | | 736,424 | |
| Less fees waived/reimbursed by investment advisor (Note 8) | | | | |
| Investor Class | | | (21,792 | ) |
| Class A | | | (3,022 | ) |
| Class C | | | (2,175 | ) |
| Class I | | | (63,719 | ) |
| Net Expenses | | | 645,716 | |
| Net Investment Income | | | 138,550 | |
| Net realized gain on investments | | | 5,345,323 | |
| Net realized gain on total return swap contracts | | | 1,557,598 | |
| Net realized loss on foreign currency transactions | | | (13,731 | ) |
| Net Realized Gain | | | 6,889,190 | |
| Net change in unrealized depreciation on investments | | | (6,154,253 | ) |
| Net change in unrealized depreciation on total return swap contracts | | | (262,328 | ) |
| Net change in unrealized depreciation on translation of assets and liabilities denominated in foreign currencies | | | (220 | ) |
| Net Change in Unrealized Depreciation | | | (6,416,801 | ) |
| NET REALIZED AND UNREALIZED GAIN ON INVESTMENTS | | | 472,389 | |
| NET INCREASE IN NET ASSETS RESULTING FROM OPERATIONS | | $ | 610,939 | |
See Notes to Financial Statements.
Clough China Fund
Statements of Changes in Net Assets
| | | For the Year
Ended
October 31, 2021 | | | For the Year
Ended
October 31, 2020 | |
| OPERATIONS | | | | | | |
| Net investment income/(loss) | | $ | 138,550 | | | $ | (217,890 | ) |
| Net realized gain | | | 6,889,190 | | | | 1,565,731 | |
| Net change in unrealized appreciation/(depreciation) | | | (6,416,801 | ) | | | 8,719,672 | |
| Net Increase in Net Assets Resulting from Operations | | | 610,939 | | | | 10,067,513 | |
| | | | | | | | | |
| TOTAL DISTRIBUTIONS | | | | | | | | |
| From distributable earnings | | | | | | | | |
| Investor Class | | | (478,797 | ) | | | (1,009,421 | ) |
| Class A | | | (85,029 | ) | | | (138,883 | ) |
| Class C | | | (50,620 | ) | | | (187,446 | ) |
| Class I | | | (1,175,252 | ) | | | (2,056,110 | ) |
| Net Decrease in Net Assets from Distributions | | | (1,789,698 | ) | | | (3,391,860 | ) |
| | | | | | | | | |
| BENEFICIAL INTEREST TRANSACTIONS (NOTE 6) | | | | | | | | |
| Shares sold | | | | | | | | |
| Investor Class | | | 1,566,903 | | | | 566,840 | |
| Class A | | | 177,446 | | | | 660,972 | |
| Class C | | | 34,114 | | | | 41,193 | |
| Class I | | | 674,045 | | | | 960,060 | |
| Dividends reinvested | | | | | | | | |
| Investor Class | | | 293,923 | | | | 566,209 | |
| Class A | | | 35,673 | | | | 74,412 | |
| Class C | | | 45,912 | | | | 107,944 | |
| Class I | | | 1,131,783 | | | | 1,967,974 | |
| Shares redeemed, net of redemption fees | | | | | | | | |
| Investor Class | | | (2,949,109 | ) | | | (2,835,340 | ) |
| Class A | | | (681,517 | ) | | | (354,229 | ) |
| Class C | | | (265,685 | ) | | | (1,207,676 | ) |
| Class I | | | (2,119,913 | ) | | | (2,972,486 | ) |
| Net Decrease in Net Assets Derived from Beneficial Interest Transactions | | | (2,056,425 | ) | | | (2,424,127 | ) |
| | | | | | | | | |
| Net increase/(decrease) in net assets | | | (3,235,184 | ) | | | 4,251,526 | |
| | | | | | | | | |
| NET ASSETS | | | | | | | | |
| Beginning of year | | | 40,450,868 | | | | 36,199,342 | |
| End of year | | $ | 37,215,684 | | | $ | 40,450,868 | |
See Notes to Financial Statements.
Clough China Fund – Investor Class
Financial Highlights
Selected data for a share of beneficial interest outstanding throughout the periods indicated:
| | | For the Year
Ended
October 31,
2021 | | | For the Year
Ended
October 31,
2020 | | | For the Year
Ended
October 31,
2019 | | | For the Year
Ended
October 31,
2018(a) | | | For the Year
Ended
October 31,
2017 | |
| Net asset value, beginning of period | | $ | 25.09 | | | $ | 20.96 | | | $ | 21.36 | | | $ | 27.22 | | | $ | 21.07 | |
| INCOME/(LOSS) FROM INVESTMENT OPERATIONS: | | | | | | | | | | | | | | | | | | | | |
| Net investment income/(loss)(b) | | | 0.04 | | | | (0.16 | ) | | | 0.13 | | | | (0.08 | ) | | | 0.08 | |
| Net realized and unrealized gain/(loss) | | | 0.33 | | | | 6.30 | | | | 1.16 | | | | (5.71 | ) | | | 6.09 | |
| Total from investment operations | | | 0.37 | | | | 6.14 | | | | 1.29 | | | | (5.79 | ) | | | 6.17 | |
| DISTRIBUTIONS: | | | | | | | | | | | | | | | | | | | | |
| From net investment income | | | (0.22 | ) | | | (0.38 | ) | | | – | | | | (0.07 | ) | | | (0.02 | ) |
| From net realized gains | | | (0.91 | ) | | | (1.63 | ) | | | (1.69 | ) | | | – | | | | – | |
| Total distributions | | | (1.13 | ) | | | (2.01 | ) | | | (1.69 | ) | | | (0.07 | ) | | | (0.02 | ) |
| REDEMPTION FEES ADDED TO PAID-IN CAPITAL (NOTE 6) | | | 0.00 | (c) | | | 0.00 | (c) | | | – | | | | 0.00 | (c) | | | – | |
| Net increase/(decrease) in net asset value | | | (0.76 | ) | | | 4.13 | | | | (0.40 | ) | | | (5.86 | ) | | | 6.15 | |
| Net asset value, end of year | | $ | 24.33 | | | $ | 25.09 | | | $ | 20.96 | | | $ | 21.36 | | | $ | 27.22 | |
| TOTAL RETURN(d) | | | 1.13 | % | | | 31.24 | % | | | 6.61 | % | | | (21.32 | )% | | | 29.32 | % |
| RATIOS/SUPPLEMENTAL DATA: | | | | | | | | | | | | | | | | | | | | |
| Net assets, end of year (000s) | | $ | 9,258 | | | $ | 10,626 | | | $ | 10,633 | | | $ | 11,879 | | | $ | 17,523 | |
| Ratio of expenses to average net assets excluding fee waivers and reimbursements | | | 1.79 | % | | | 2.16 | % | | | 2.23 | % | | | 2.10 | % | | | 2.05 | % |
| Ratio of expenses to average net assets including fee waivers and reimbursements | | | 1.60 | % | | | 1.87 | %(e) | | | 1.95 | % | | | 1.95 | % | | | 1.95 | % |
| Ratio of net investment income/(loss) to average net assets | | | 0.16 | % | | | (0.74 | )% | | | 0.61 | % | | | (0.30 | )% | | | 0.34 | % |
| Portfolio turnover rate(f) | | | 114 | % | | | 120 | % | | | 344 | % | | | 131 | % | | | 71 | % |
| (a) | Prior to December 1, 2017, Investor Class was known as Class A. |
| (b) | Calculated using the average shares method. |
| (c) | Less than $0.005 or ($0.005) per share. |
| (d) | Total returns are for the period indicated and have not been annualized. Total returns would have been lower had certain expenses not been waived during the period. Returns shown do not reflect the deduction of taxes that a shareholder would pay on Fund distributions or the redemption of Fund shares. |
| (e) | Effective August 18, 2020, the net expense limitation agreement changed from 1.95% to 1.60%. Refer to Note 8. |
| (f) | Portfolio turnover rate for periods less than one full year have not been annualized. |
See Notes to Financial Statements.
Clough China Fund – Class A
Financial Highlights
Selected data for a share of beneficial interest outstanding throughout the periods indicated:
| | | For the Year
Ended
October 31,
2021 | | | For the Year
Ended
October 31,
2020 | | | For the Year
Ended
October 31,
2019 | | | For the Period
June 12, 2018
(Commencement
of Operations) to
October 31, 2018 | |
| Net asset value, beginning of period | | $ | 25.07 | | | $ | 20.95 | | | $ | 21.36 | | | $ | 29.95 | |
| | | | | | | | | | | | | | | | | |
| INCOME FROM INVESTMENT OPERATIONS: | | | | | | | | | | | | | | | | |
| Net investment income/(loss)(a) | | | 0.04 | | | | (0.17 | ) | | | 0.56 | | | | 0.14 | |
| Net realized and unrealized gain/(loss) | | | 0.34 | | | | 6.30 | | | | 0.72 | | | | (8.73 | ) |
| Total from investment operations | | | 0.38 | | | | 6.13 | | | | 1.28 | | | | (8.59 | ) |
| | | | | | | | | | | | | | | | | |
| DISTRIBUTIONS: | | | | | | | | | | | | | | | | |
| From net investment income | | | (0.22 | ) | | | (0.38 | ) | | | – | | | | – | |
| From net realized gains | | | (0.91 | ) | | | (1.63 | ) | | | (1.69 | ) | | | – | |
| Total distributions | | | (1.13 | ) | | | (2.01 | ) | | | (1.69 | ) | | | – | |
| | | | | | | | | | | | | | | | | |
| Net increase/(decrease) in net asset value | | | (0.75 | ) | | | 4.12 | | | | (0.41 | ) | | | (8.59 | ) |
| Net asset value, end of year | | $ | 24.32 | | | $ | 25.07 | | | $ | 20.95 | | | $ | 21.36 | |
| TOTAL RETURN(c) | | | 1.17 | % | | | 31.20 | % | | | 6.56 | % | | | (28.68 | )% |
| | | | | | | | | | | | | | | | | |
| RATIOS/SUPPLEMENTAL DATA: | | | | | | | | | | | | | | | | |
| Net assets, end of year (000s) | | $ | 1,538 | | | $ | 2,044 | | | $ | 1,404 | | | $ | 7 | |
| Ratio of expenses to average net assets excluding fee waivers and reimbursements | | | 1.74 | % | | | 2.09 | % | | | 2.22 | % | | | 2.22 | %(d) |
| Ratio of expenses to average net assets including fee waivers and reimbursements | | | 1.60 | % | | | 1.85 | %(e) | | | 1.95 | % | | | 1.95 | %(d) |
| Ratio of net investment income/(loss) to average net assets | | | 0.15 | % | | | (0.77 | )% | | | 2.68 | % | | | 1.47 | %(d) |
| Portfolio turnover rate(f) | | | 114 | % | | | 120 | % | | | 344 | % | | | 131 | % |
| (a) | Calculated using the average shares method. |
| (b) | Less than $0.005 or ($0.005) per share. |
| (c) | Total returns are for the period indicated and have not been annualized. Total returns would have been lower had certain expenses not been waived during the period. Returns shown do not reflect the deduction of taxes that a shareholder would pay on Fund distributions or the redemption of Fund shares. Returns shown exclude any applicable sales charges. |
| (e) | Effective August 18, 2020, the net expense limitation agreement changed from 1.95% to 1.60%. Refer to Note 8. |
| (f) | Portfolio turnover rate for periods less than one full year have not been annualized. |
See Notes to Financial Statements.
Clough China Fund – Class C
Financial Highlights
Selected data for a share of beneficial interest outstanding throughout the periods indicated:
| | | For the Year
Ended
October 31,
2021 | | | For the Year Ended
October 31,
2020 | | | For the Year
Ended
October 31,
2019 | | | For the Year
Ended
October 31,
2018 | | | For the Year
Ended
October 31,
2017 | |
| Net asset value, beginning of period | | $ | 23.05 | | | $ | 19.52 | | | $ | 20.14 | | | $ | 25.80 | | | $ | 20.10 | |
| INCOME/(LOSS) FROM INVESTMENT OPERATIONS: | | | | | | | | | | | | | | | | | | | | |
| Net investment loss(a) | | | (0.17 | ) | | | (0.29 | ) | | | (0.14 | ) | | | (0.28 | ) | | | (0.12 | )(b) |
| Net realized and unrealized gain/(loss) | | | 0.36 | | | | 5.80 | | | | 1.21 | | | | (5.38 | ) | | | 5.82 | |
| Total from investment operations | | | 0.19 | | | | 5.51 | | | | 1.07 | | | | (5.66 | ) | | | 5.70 | |
| DISTRIBUTIONS: | | | | | | | | | | | | | | | | | | | | |
| From net investment income | | | (0.19 | ) | | | (0.35 | ) | | | – | | | | – | | | | – | |
| From net realized gains | | | (0.91 | ) | | | (1.63 | ) | | | (1.69 | ) | | | – | | | | – | |
| Total distributions | | | (1.10 | ) | | | (1.98 | ) | | | (1.69 | ) | | | – | | | | – | |
| REDEMPTION FEES ADDED TO PAID-IN CAPITAL (NOTE 6) | | | – | | | | 0.00 | (c) | | | – | | | | – | | | | 0.00 | (c) |
| Net increase/(decrease) in net asset value | | | (0.91 | ) | | | 3.53 | | | | (0.62 | ) | | | (5.66 | ) | | | 5.70 | |
| Net asset value, end of year | | $ | 22.14 | | | $ | 23.05 | | | $ | 19.52 | | | $ | 20.14 | | | $ | 25.80 | |
| TOTAL RETURN(d) | | | 0.43 | % | | | 30.22 | % | | | 5.85 | % | | | (21.94 | )% | | | 28.36 | % |
| RATIOS/SUPPLEMENTAL DATA: | | | | | | | | | | | | | | | | | | | | |
| Net assets, end of year (000s) | | $ | 903 | | | $ | 1,113 | | | $ | 1,968 | | | $ | 4,245 | | | $ | 6,610 | |
| Ratio of expenses to average net assets excluding fee waivers and reimbursements | | | 2.55 | % | | | 2.96 | % | | | 2.98 | % | | | 2.85 | % | | | 2.85 | % |
| Ratio of expenses to average net assets including fee waivers and reimbursements | | | 2.35 | % | | | 2.65 | %(e) | | | 2.70 | % | | | 2.70 | % | | | 2.70 | % |
| Ratio of net investment loss to average net assets | | | (0.66 | )% | | | (1.49 | )% | | | (0.69 | )% | | | (1.07 | )% | | | (0.54 | )% |
| Portfolio turnover rate(f) | | | 114 | % | | | 120 | % | | | 344 | % | | | 131 | % | | | 71 | % |
| (a) | Calculated using the average shares method. |
| (b) | The per share amount does not correspond to activity reflected in the Statement of Operations due to class specific expenses during the period. |
| (c) | Less than $0.005 or ($0.005) per share. |
| (d) | Total returns are for the period indicated and have not been annualized. Total returns would have been lower had certain expenses not been waived during the period. Returns shown do not reflect the deduction of taxes that a shareholder would pay on Fund distributions or the redemption of Fund shares. Returns shown exclude any applicable sales charges. |
| (e) | Effective August 18, 2020, the net expense limitation agreement changed from 2.70% to 2.35%. Refer to Note 8. |
| (f) | Portfolio turnover rate for periods less than one full year have not been annualized. |
See Notes to Financial Statements.
Clough China Fund – Class I
Financial Highlights
Selected data for a share of beneficial interest outstanding throughout the periods indicated:
| | | For the Year
Ended
October 31,
2021 | | | For the Year
Ended
October 31,
2020 | | | For the Year
Ended
October 31,
2019 | | | For the Year
Ended
October 31,
2018 | | | For the Year
Ended
October 31,
2017 | |
| Net asset value, beginning of period | | $ | 25.98 | | | $ | 21.59 | | | $ | 21.90 | | | $ | 27.92 | | | $ | 21.60 | |
| INCOME/(LOSS) FROM INVESTMENT OPERATIONS: | | | | | | | | | | | | | | | | | | | | |
| Net investment income/(loss)(a) | | | 0.12 | | | | (0.10 | ) | | | 0.20 | | | | (0.05 | ) | | | 0.15 | |
| Net realized and unrealized gain/(loss) | | | 0.33 | | | | 6.51 | | | | 1.18 | | | | (5.83 | ) | | | 6.23 | |
| Total from investment operations | | | 0.45 | | | | 6.41 | | | | 1.38 | | | | (5.88 | ) | | | 6.38 | |
| DISTRIBUTIONS: | | | | | | | | | | | | | | | | | | | | |
| From net investment income | | | (0.23 | ) | | | (0.39 | ) | | | – | | | | (0.14 | ) | | | (0.06 | ) |
| From net realized gains | | | (0.91 | ) | | | (1.63 | ) | | | (1.69 | ) | | | – | | | | – | |
| Total distributions | | | (1.14 | ) | | | (2.02 | ) | | | (1.69 | ) | | | (0.14 | ) | | | (0.06 | ) |
| REDEMPTION FEES ADDED TO PAID-IN CAPITAL (NOTE 6) | | | – | | | | – | | | | – | | | | – | | | | 0.00 | (b) |
| Net increase/(decrease) in net asset value | | | (0.69 | ) | | | 4.39 | | | | (0.31 | ) | | | (6.02 | ) | | | 6.32 | |
| Net asset value, end of year | | $ | 25.29 | | | $ | 25.98 | | | $ | 21.59 | | | $ | 21.90 | | | $ | 27.92 | |
| TOTAL RETURN(c) | | | 1.41 | % | | | 31.60 | % | | | 6.87 | % | | | (21.17 | )% | | | 29.64 | % |
| RATIOS/SUPPLEMENTAL DATA: | | | | | | | | | | | | | | | | | | | | |
| Net assets, end of year (000s) | | $ | 25,516 | | | $ | 26,668 | | | $ | 22,195 | | | $ | 21,655 | | | $ | 35,191 | |
| Ratio of expenses to average net assets excluding fee waivers and reimbursements | | | 1.56 | % | | | 1.93 | % | | | 1.99 | % | | | 1.86 | % | | | 1.83 | % |
| Ratio of expenses to average net assets including fee waivers and reimbursements | | | 1.35 | % | | | 1.62 | %(d) | | | 1.70 | % | | | 1.70 | % | | | 1.70 | % |
| Ratio of net investment income/(loss) to average net assets | | | 0.42 | % | | | (0.46 | )% | | | 0.93 | % | | | (0.17 | )% | | | 0.61 | % |
| Portfolio turnover rate(e) | | | 114 | % | | | 120 | % | | | 344 | % | | | 131 | % | | | 71 | % |
| (a) | Calculated using the average shares method. |
| (b) | Less than $0.005 or ($0.005) per share. |
| (c) | Total returns are for the period indicated and have not been annualized. Total returns would have been lower had certain expenses not been waived during the period. Returns shown do not reflect the deduction of taxes that a shareholder would pay on Fund distributions or the redemption of Fund shares. |
| (d) | Effective August 18, 2020, the net expense limitation agreement changed from 1.70% to 1.35%. Refer to Note 8. |
| (e) | Portfolio turnover rate for periods less than one full year have not been annualized. |
See Notes to Financial Statements.
| RiverFront Global Allocation Series | |
| Management Commentary | October 31, 2021 (Unaudited) |
Year in Review (November 2020 – October 2021):
The fiscal year from 11/01/2020 to 10/31/2021 was a year of recovery for the global equity markets. Early into the first month of the year, the release of COVID-19 vaccines caused a global equity rally, led by value stocks. Both developed international equities and emerging international equities outperformed US equities during this rally but began to lose their momentum halfway through February 2021. Emerging markets, specifically, saw a large draw down from mid-February through March; this drawdown was caused in large part due to concerns surrounding China’s growth prospects. These concerns, amplified by political questions surrounding China, would continue to affect performance in the fiscal year, with Emerging markets posting negative performance from June through the end of October.
In the developed world, the United States was able to outperform developed international on an annual basis (S&P 500 for US markets and MSCI EAFE for developed international). While US value stocks led the first half of the fiscal year, US growth stocks began an uptrend in March that eventually surpassed value and led the way for broad US. For developed international stocks, the value rotation slowed, but never stopped, with growth stock pacing the broad developed international market throughout the fiscal year.
Outlook:
While Riverfront understands and partially shares the worries surrounding rising debt and inflation that contributed to a flat to negative global stock market in the third calendar quarter, we believe that stocks and commodities will remain the highest performing asset classes. These assets provide more potential for capital appreciation to offset inflation and higher taxes than ‘stable assets’ like cash, CDs, and bonds.
Within the RiverFront sub-advised ETF building blocks to the mutual funds:
In the US, RiverFront prefers to play the equity markets using a barbell approach to growth and value. We favor growth, mega-cap stocks, specifically those that lean towards software and services, while also selectively investing in more cyclical, value stocks. This approach allows our portfolios to have proper exposures to both sides of the growth versus value trade, while not overexposing us to low-quality, value names or telecommunication stocks, which we believe at the aggregate are over-valued.
Internationally, RiverFront believes that the potential for a reacceleration in global growth lends itself to value investing. However, we believe that this excludes developed international energy stocks. It is our view that these stocks are less positioned to take advantage of high oil prices than their US or emerging counterparts. From a country standpoint, RiverFront prefers the United Kingdom, France, Germany, and Japan, with a partially hedged position in yen and euro denominated assets. In Emerging markets, RiverFront’s highest conviction is an underweight to China. We believe that the communist party’s recent actions have signaled an aversion to free market economics that we believe are required
to be a viable investment. As such, Riverfront has allocated capital away from Chinese equites toward South Korea and Saudi Arabian energy equities.
On the currency front, we view the yen and euro as slightly overvalued.
TTM Attribution
RiverFront Asset Allocation Moderate
The top themes that contributed to and detracted from performance over the last twelve months are listed below:
Contributors:
| ● | Overweight allocation to US equities |
| ● | Underweight allocation to core fixed income |
| ● | Selection within broad fixed income |
Detractors:
| ● | Selection within US equities |
| ● | Overweight allocation to high yield bonds |
| ● | Overweight allocation to cash |
RiverFront Asset Allocation Growth and Income
The top themes that contributed to and detracted from performance over the last twelve months are listed below:
Contributors:
| ● | Overweight allocation to US equities |
| ● | Underweight allocation to core fixed income |
| ● | Selection within broad fixed income |
Detractors:
| ● | Selection within US equities |
| ● | Overweight allocation to high yield bonds |
| ● | Selection within international equities |
RiverFront Asset Allocation Aggressive
The top themes that contributed to and detracted from performance over the last twelve months are listed below:
Contributors:
| ● | None at the asset class level |
Detractors:
| ● | Selection within developed international equities |
| ● | Selection within emerging market equities |
| ● | Overweight allocation to cash |
Scott Hays, CFA
Senior Portfolio Manager
| RiverFront Global Allocation Series | |
| Management Commentary | October 31, 2021 (Unaudited) |
Past performance is no guarantee of future results. Dividends are not guaranteed and are subject to change or elimination. Investments in international and emerging markets securities include exposure to risks such as currency fluctuations, foreign taxes and regulations, and the potential for illiquid markets and political instability.
The views of the author and information discussed in this commentary are as of the date of publication, are subject to change, and may not reflect the writer's current views. The views expressed are those of the author only, and represent an assessment of market conditions at a specific point in time, are opinions only and should not be relied upon as investment advice regarding a particular investment or markets in general. Such information does not constitute a recommendation to buy or sell specific securities or investment vehicles. It should not be assumed that any investment will be profitable or will equal the performance of the fund(s) or any securities or any sectors mentioned in this letter. The subject matter contained in this letter has been derived from several sources believed to be reliable and accurate at the time of compilation. Neither ALPS Advisors, Inc., RiverFront Investment Group, LLC, nor the Funds accepts any liability for losses either direct or consequential caused by the use of this information.
Indices do not reflect deductions for fees, expenses, or taxes.
An investor may not invest directly in an index.
Diversification cannot guarantee gain or prevent losses.
ALPS Portfolio Solutions Distributor, Inc., ALPS Distributors, Inc. and ALPS Advisors Inc. are affiliated.
| RiverFront Asset Allocation Aggressive | |
| Performance Update | October 31, 2021 (Unaudited) |
Performance of $10,000 Initial Investment (as of October 31, 2021)
Comparison of change in value of a $10,000 investment
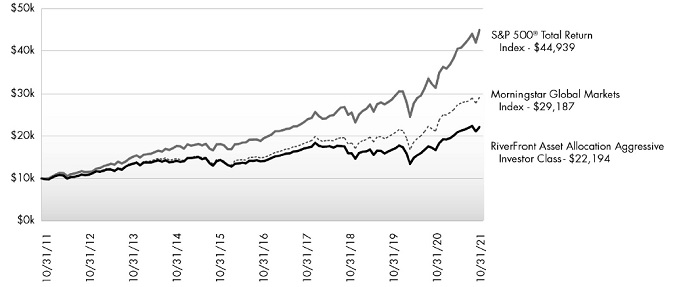
The chart above represents historical performance of a hypothetical investment of $10,000 in the Fund since inception.
Past performance does not guarantee future results. This chart does not reflect the deduction of taxes that a shareholder would pay on Fund distributions or the redemption of Fund shares.
Average Annual Total Returns (as of October 31, 2021)
|
1 Year |
3 Years |
5 Years |
10 Years |
Since
Inception^ | Total
Expense
Ratio |
What You
Pay* |
| Investor# (NAV) | 32.58% | 11.55% | 9.56% | 8.30% | 9.05% | 1.15% | 1.15% |
| Class A (NAV) | 32.59% | 11.54% | 9.56% | 8.30% | 9.04% | 1.15% | 1.15% |
| Class A (MOP) | 25.33% | 9.47% | 8.33% | 7.69% | 8.57% |
| Class C (NAV) | 31.58% | 10.72% | 8.76% | 7.51% | 8.25% | 1.90% | 1.90% |
| Class C (CDSC) | 30.58% | 10.72% | 8.76% | 7.51% | 8.25% |
| Class I (NAV) | 32.90% | 11.84% | 9.85% | 8.57% | 9.32% | 0.90% | 0.90% |
| Investor II (NAV) | 32.62% | 11.55% | 9.55% | 8.29% | 9.03% | 1.15% | 1.15% |
| Class L1 (NAV) | 32.98% | 11.84% | 9.85% | 8.58% | 9.32% | 0.90% | 0.90% |
| Morningstar Global Markets Index2 | 37.43% | 17.15% | 14.48% | 11.31% | 12.42% | | |
| S&P 500® Total Return Index3 | 42.91% | 21.48% | 18.93% | 16.21% | 15.34% | | |
Performance data quoted represents past performance. Past performance does not guarantee future results. Investment return and principal value of an investment will fluctuate so that an investor's shares, when sold or redeemed, may be worth more or less than the original cost. Current performance data may be higher or lower than actual data quoted. For the most current month-end performance data, please call 1-866-759-5679.
Maximum Offering Price (MOP) for Class A shares includes the Fund’s maximum sales charge of 5.50%. Performance shown at NAV does not include these sales charges and would have been lower had it been taken into account. If you invest $1 million or more, either as a lump sum or through the Fund’s accumulation or letter of intent programs, you can purchase Class A shares without an initial sales charge (load). A Contingent Deferred Sales Charge (“CDSC”) of 1.00% may apply to Class C shares redeemed within the first 12 months after a purchase, and on Class A shares redeemed within the first 18 months after a purchase in excess of $1 million.
Performance less than 1 year is cumulative.
| RiverFront Asset Allocation Aggressive | |
| Performance Update | October 31, 2021 (Unaudited) |
Performance shown for Class A shares prior to June 12, 2018 reflects the historical performance of the Fund’s Investor shares, calculated using the fees and expenses of Class A shares.
The Investor Class, Class A, Class C, I and L shares performance shown for periods prior to September 27, 2010 reflects the performance of the Baird Funds, Inc. – RiverFront Long-Term Growth Fund’s Institutional Class shares (as result of the reorganization of the Baird Funds, Inc. – RiverFront Long-Term Growth Fund into the Fund).
The Investor II Class performance shown for periods prior to September 27, 2010 reflects the performance of the Baird Funds, Inc. – RiverFront Long-Term Growth Fund’s Investor Class shares (as result of the reorganization of the Baird Funds, Inc. – RiverFront Long-Term Growth Fund into the Fund).
| 1 | Prior to close of business on September 24, 2010, Class L was known as Institutional Class of the Baird Funds, Inc. - RiverFront Long-Term Growth Fund. |
| 2 | The Morningstar Global Market Index measures the performance of performance of the stocks located in the developed and emerging countries across the world. Stocks in the index are weighted by their float capital, which removes corporate cross ownership, government holdings and other locked-in shares. The index is not actively managed and does not reflect any deduction for fees, expenses or taxes. An investor may not invest directly in an index. |
| 3 | S&P 500® Total Return Index is the Standard & Poor's composite index of 500 stocks, a widely recognized, unmanaged index of common stock prices. The index is not actively managed and does not reflect any deduction for fees, expenses or taxes. An investor may not invest directly in an index. |
| ^ | Fund Inception date of October 28, 2008 for Investor Class II and Class L; Fund Inception date September 27, 2010 for Investor Class and Classes C and I; Fund Inception date June 12, 2018 for Class A. |
| * | What You Pay reflects Acquired Fund Fees and Expenses of 0.65%. Please see the prospectus dated February 28, 2021 for additional information. |
| # | Prior to December 1, 2017, Investor Class was known as Class A. |
Prior to February 28, 2018, the RiverFront Asset Allocation Aggressive was known as the RiverFront Global Growth Fund.
The table does not reflect the deduction of taxes that a shareholder would pay on Fund distributions or the redemption of Fund shares.
This Fund is not suitable for all investors and is subject to investment risks, including possible loss of the principal amount invested.
There is no guarantee that the Fund will continue to hold any one particular security or stay invested in any one particular company. The composition of the Fund's top holdings is subject to change. Performance figures are historical and reflect the change in share price, reinvested distributions, changes in net asset value, sales charges and capital gains distributions, if any.
Not FDIC Insured – No Bank Guarantee – May Lose Value
Top Ten Holdings (as a % of Net Assets) †
| RiverFront Dynamic US Dividend Advantage ETF | 31.42% |
| RiverFront Dynamic US Flex-Cap ETF | 30.11% |
| First Trust RiverFront Dynamic Developed International ETF | 19.09% |
| First Trust RiverFront Dynamic Emerging Markets ETF | 9.91% |
| First Trust RiverFront Dynamic Europe ETF | 6.52% |
| Top Ten Holdings | 97.05% |
| † | Holdings are subject to change, and may not reflect the current or future position of the portfolio. Table presents indicative values only. Excludes cash & cash equivalents. |
Portfolio Composition (as a % of Net Assets)

| RiverFront Asset Allocation Growth & Income | |
| Performance Update | October 31, 2021 (Unaudited) |
Performance of $10,000 Initial Investment (as of October 31, 2021)
Comparison of change in value of a $10,000 investment
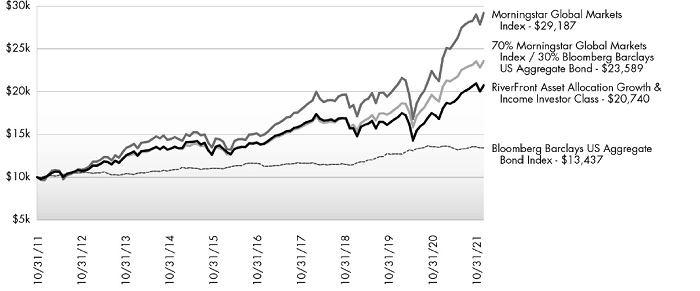
The chart above represents historical performance of a hypothetical investment of $10,000 in the Fund since inception. Past performance does not guarantee future results. This chart does not reflect the deduction of taxes that a shareholder would pay on Fund distributions or the redemption of Fund shares.
Average Annual Total Returns (as of October 31, 2021)
|
1 Year |
3 Years |
5 Years |
10 Years |
Since
Inception^ | Total
Expense
Ratio |
What You
Pay* |
| Investor# (NAV) | 23.40% | 9.71% | 8.45% | 7.57% | 7.42% | 1.10% | 1.10% |
| Class A (NAV) | 23.34% | 9.71% | 8.44% | 7.56% | 7.42% | | |
| Class A (MOP) | 16.55% | 7.66% | 7.22% | 6.96% | 6.88% | 1.10% | 1.10% |
| Class C (NAV) | 22.44% | 8.89% | 7.64% | 6.76% | 6.61% | | |
| Class C (CDSC) | 21.44% | 8.89% | 7.64% | 6.76% | 6.61% | 1.85% | 1.85% |
| Class I (NAV) | 23.79% | 10.01% | 8.73% | 7.84% | 7.69% | 0.85% | 0.85% |
| Morningstar Global Markets Index1 | 37.43% | 17.15% | 14.48% | 11.31% | 10.76% | | |
| Bloomberg Barclays US Aggregate Bond Index2 | -0.48% | 5.63% | 3.10% | 3.00% | 3.29% | | |
| 70% Morningstar Global Markets Index / 30% Bloomberg Barclays US Aggregate Bond1,2 | 25.04% | 13.97% | 11.21% | 8.96% | 8.71% | | |
Performance data quoted represents past performance. Past performance does not guarantee future results. Investment return and principal value of an investment will fluctuate so that an investor's shares, when sold or redeemed, may be worth more or less than the original cost. Current performance data may be higher or lower than actual data quoted. For the most current month-end performance data, please call 1-866-759-5679.
Maximum Offering Price (MOP) for Class A shares includes the Fund’s maximum sales charge of 5.50%. Performance shown at NAV does not include these sales charges and would have been lower had it been taken into account. If you invest $1 million or more, either as a lump sum or through the Fund’s accumulation or letter of intent programs, you can purchase Class A shares without an initial sales charge (load). A Contingent Deferred Sales Charge (“CDSC”) of 1.00% may apply to Class C shares redeemed within the first 12 months after a purchase, and on Class A shares redeemed within the first 18 months after a purchase in excess of $1 million.
| RiverFront Asset Allocation Growth & Income | |
| Performance Update | October 31, 2021 (Unaudited) |
Performance shown for Class A shares prior to June 12, 2018 reflects the historical performance of the Fund’s Investor shares, calculated using the fees and expenses of Class A shares.
| 1 | The Morningstar Global Market Index measures the performance of performance of the stocks located in the developed and emerging countries across the world. Stocks in the index are weighted by their float capital, which removes corporate cross ownership, government holdings and other locked-in shares. The index is not actively managed and does not reflect any deduction for fees, expenses or taxes. An investor may not invest directly in an index. |
| 2 | The Barclays U.S. Aggregate Bond Index is a broad-based benchmark that measures the investment grade, U.S. dollar-denominated, fixed-rate taxable bond market, including Treasuries, government-related and corporate securities, MBS (agency fixed-rate and hybrid ARM passthroughs), ABS, and CMBS. The index is not actively managed and does not reflect any deductions for fees, expenses or taxes. An investor may not invest directly in an index. |
| ^ | Fund Inception date of August 2, 2010 for Investor Class and Classes C and I; Fund Inception date of June 12, 2018 for Class A. |
| * | What You Pay reflects Acquired Fund Fees and Expenses of 0.60%. Please see the prospectus dated February 28, 2021 for additional information. |
| # | Prior to December 1, 2017, Investor Class was known as Class A. |
Prior to February 28, 2018, the RiverFront Asset Allocation Growth & Income was known as the RiverFront Dynamic Equity Income Fund.
The table does not reflect the deduction of taxes that a shareholder would pay on Fund distributions or the redemption of Fund shares.
This Fund is not suitable for all investors and is subject to investment risks, including possible loss of the principal amount invested.
There is no guarantee that the Fund will continue to hold any one particular security or stay invested in any one particular company. The composition of the Fund's top holdings is subject to change. Performance figures are historical and reflect the change in share price, reinvested distributions, changes in net asset value, sales charges and capital gains distributions, if any.
Not FDIC Insured – No Bank Guarantee – May Lose Value
Top Ten Holdings (as a % of Net Assets) †
| RiverFront Dynamic US Dividend Advantage ETF | 31.44% |
| RiverFront Dynamic Core Income ETF | 23.23% |
| First Trust RiverFront Dynamic Developed International ETF | 22.28% |
| RiverFront Dynamic US Flex-Cap ETF | 11.78% |
| First Trust RiverFront Dynamic Emerging Markets ETF | 6.52% |
| Riverfront Strategic Income Fund | 3.26% |
| Top Ten Holdings | 98.52% |
| † | Holdings are subject to change, and may not reflect the current or future position of the portfolio. Table presents indicative values only. Excludes cash & cash equivalents. |
Portfolio Composition (as a % of Net Assets)
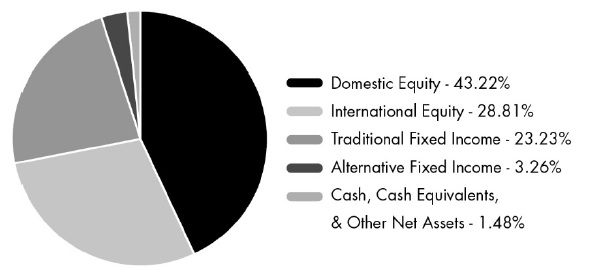
| RiverFront Asset Allocation Moderate | |
| Performance Update | October 31, 2021 (Unaudited) |
Performance of $10,000 Initial Investment (as of October 31, 2021)
Comparison of change in value of a $10,000 investment
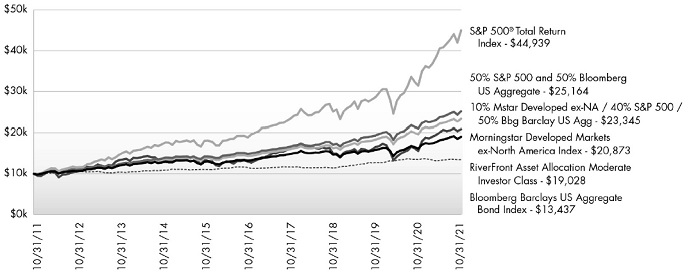
The chart above represents historical performance of a hypothetical investment of $10,000 in the Fund since inception. Past performance does not guarantee future results. This chart does not reflect the deduction of taxes that a shareholder would pay on Fund distributions or the redemption of Fund shares.
Average Annual Total Returns (as of October 31, 2021)
| | 1 Year | 3 Years | 5 Years | 10 Years | Since
Inception^ | Total
Expense
Ratio | What You
Pay* |
| Investor# (NAV) | 17.89% | 9.08% | 7.61% | 6.64% | 6.47% | 1.02% | 1.02% |
| Class A (NAV) | 17.91% | 9.12% | 7.62% | 6.65% | 6.47% | 1.02% | 1.02% |
| Class A (MOP) | 11.43% | 7.09% | 6.41% | 6.05% | 5.94% |
| Class C (NAV) | 17.02% | 8.30% | 6.82% | 5.84% | 5.68% | 1.77% | 1.77% |
| Class C (CDSC) | 16.02% | 8.30% | 6.82% | 5.84% | 5.68% |
| Class I (NAV) | 18.14% | 9.37% | 7.89% | 6.91% | 6.73% | 0.77% | 0.77% |
| S&P 500® Total Return Index1 | 42.91% | 21.48% | 18.93% | 16.21% | 15.65% | | |
| Bloomberg Barclays US Aggregate Bond Index2 | -0.48% | 5.63% | 3.10% | 3.00% | 3.29% | | |
| Morningstar Developed Markets ex-North America Index3 | 34.03% | 11.77% | 9.93% | 7.64% | 7.09% | | |
| 10% Mstar Developed ex-NA / 40% S&P 500 / 50%Bbg Barclay US Agg1,2,3 | 18.88% | 12.84% | 10.22% | 8.85% | 8.76% | | |
Performance data quoted represents past performance. Past performance does not guarantee future results. Investment return and principal value of an investment will fluctuate so that an investor's shares, when sold or redeemed, may be worth more or less than the original cost. Current performance data may be higher or lower than actual data quoted. For the most current month-end performance data, please call 1-866-759-5679.
Maximum Offering Price (MOP) for Class A shares includes the Fund’s maximum sales charge of 5.50%. Performance shown at NAV does not include these sales charges and would have been lower had it been taken into account. If you invest $1 million or more, either as a lump sum or through the Fund’s accumulation or letter of intent programs, you can purchase Class A shares without an initial sales charge (load). A Contingent Deferred Sales Charge (“CDSC”) of 1.00% may apply to Class C shares redeemed within the first 12 months after a purchase, and on Class A shares redeemed within the first 18 months after a purchase in excess of $1 million.
| RiverFront Asset Allocation Moderate | |
| Performance Update | October 31, 2021 (Unaudited) |
Performance shown for Class A shares prior to June 12, 2018 reflects the historical performance of the Fund’s Investor shares, calculated using the fees and expenses of Class A shares.
| 1 | S&P 500® Total Return Index is the Standard & Poor's composite index of 500 stocks, a widely recognized, unmanaged index of common stock prices. The index is not actively managed and does not reflect any deduction for fees, expenses or taxes. An investor may not invest directly in an index. |
| 2 | The Barclays U.S. Aggregate Bond Index is a broad-based benchmark that measures the investment grade, U.S. dollar-denominated, fixed-rate taxable bond market, including Treasuries, government-related and corporate securities, MBS (agency fixed-rate and hybrid ARM passthroughs), ABS, and CMBS. The index is not actively managed and does not reflect any deductions for fees, expenses or taxes. An investor may not invest directly in an index. |
| 3 | The Morningstar Developed Markets ex-North America Index measures the performance of companies in developed markets ex-North America. It covers approximately 97% of the full market capitalization in the Developed Markets ex-North America. The index is not actively managed and does not reflect any deductions for fees, expenses or taxes. An investor may not invest directly in an index. |
| ^ | Fund Inception date of August 2, 2010 for Investor Class and Classes C and I; Fund Inception date of June 12, 2018 for Class A. |
| * | What You Pay reflects Acquired Fund Fees and Expenses of 0.52%. Please see the prospectus dated February 28, 2021 for additional information. |
| # | Prior to December 1, 2017, Investor Class was known as Class A. |
Prior to February 28, 2018, the RiverFront Asset Allocation Moderate was known as the RiverFront Moderate Growth & Income Fund.
The table does not reflect the deduction of taxes that a shareholder would pay on Fund distributions or the redemption of Fund shares.
This Fund is not suitable for all investors and is subject to investment risks, including possible loss of the principal amount invested.
There is no guarantee that the Fund will continue to hold any one particular security or stay invested in any one particular company. The composition of the Fund's top holdings is subject to change. Performance figures are historical and reflect the change in share price, reinvested distributions, changes in net asset value, sales charges and capital gains distributions, if any.
Not FDIC Insured – No Bank Guarantee – May Lose Value
Top Ten Holdings (as a % of Net Assets) †
| RiverFront Dynamic Core Income ETF | 43.22% |
| RiverFront Dynamic US Dividend Advantage ETF | 34.63% |
| First Trust RiverFront Dynamic Developed International ETF | 11.78% |
| RiverFront Dynamic US Flex-Cap ETF | 5.92% |
| Riverfront Strategic Income Fund | 3.16% |
| Top Ten Holdings | 98.71% |
| † | Holdings are subject to change, and may not reflect the current or future position of the portfolio. Table presents indicative values only. Excludes cash & cash equivalents. |
Portfolio Composition (as a % of Net Assets)

| RiverFront Asset Allocation Aggressive | |
| Statement of Investments | October 31, 2021 |
| | | Shares | | | Value
(Note 2) | |
| EXCHANGE TRADED FUNDS (97.05%) | | | | | | | | |
| Equity (97.05%) | | | | | | | | |
| First Trust RiverFront Dynamic Developed International ETF(a) | | | 72,601 | | | $ | 5,296,243 | |
| First Trust RiverFront Dynamic Emerging Markets ETF(a) | | | 41,016 | | | | 2,749,303 | |
| First Trust RiverFront Dynamic Europe ETF(a) | | | 23,548 | | | | 1,808,056 | |
| RiverFront Dynamic US Dividend Advantage ETF(a) | | | 191,898 | | | | 8,718,041 | |
| RiverFront Dynamic US Flex-Cap ETF(a) | | | 178,087 | | | | 8,353,954 | |
| | | | | | | | 26,925,597 | |
| TOTAL EXCHANGE TRADED FUNDS | | | | | | | | |
| (Cost $19,922,292) | | | | | | | 26,925,597 | |
| | | 7-Day
Yield | | | Shares | | | Value
(Note 2) | |
| SHORT-TERM INVESTMENTS (3.00%) | | | | | | | | | | | | |
| Money Market Fund (3.00%) | | | | | | | | | | | | |
| State Street Institutional Treasury Plus Money Market Fund | | | 0.010 | % | | | 834,056 | | | | 834,056 | |
| TOTAL MONEY MARKET FUND | | | | | | | | | | | 834,056 | |
| | | | | | | | | | | | | |
| TOTAL SHORT-TERM INVESTMENTS | | | | | | | | | | | | |
| (Cost $834,056) | | | | | | | | | | | 834,056 | |
| | | | | | | | | | | | | |
| TOTAL INVESTMENTS (100.05%) | | | | | | | | | | | | |
| (Cost $20,714,771) | | | | | | | | | | $ | 27,759,653 | |
| | | | | | | | | | | | | |
| Liabilities In Excess Of Other Assets (-0.05%) | | | | | | | | | | | (14,699 | ) |
| NET ASSETS (100.00%) | | | | | | | | | | $ | 27,744,954 | |
| (a) | Affiliated Company. See Note 7 in Notes to Financial Statements. |
For Fund compliance purposes, the Fund's industry classifications refer to any one or more of the industry sub-classifications used by one or more widely recognized market indexes or ratings group indexes, and/or as defined by Fund management. This definition may not apply for purposes of this report, which may combine industry sub-classifications for reporting ease. Industries are shown as a percent of net assets.
See Notes to Financial Statements.
| RiverFront Asset Allocation Growth & Income | |
| Statement of Investments | October 31, 2021 |
|
|
Shares |
|
| Value
(Note 2) |
|
| EXCHANGE TRADED FUNDS (98.52%) | | | | | | | | |
| Debt (26.49%) | | | | | | | | |
| RiverFront Dynamic Core Income ETF(a) | | | 588,706 | | | $ | 14,918,870 | |
| Riverfront Strategic Income Fund(a) | | | 84,929 | | | | 2,096,048 | |
| | | | | | | | 17,014,918 | |
| Equity (72.03%) | | | | | | | | |
| First Trust RiverFront Dynamic Developed International ETF(a) | | | 196,159 | | | | 14,309,799 | |
| First Trust RiverFront Dynamic Emerging Markets ETF(a) | | | 62,494 | | | | 4,188,973 | |
| RiverFront Dynamic US Dividend Advantage ETF(a) | | | 444,407 | | | | 20,189,676 | |
| RiverFront Dynamic US Flex-Cap ETF(a) | | | 161,273 | | | | 7,565,220 | |
| | | | | | | | 46,253,668 | |
| TOTAL EXCHANGE TRADED FUNDS | | | | | | | | |
| (Cost $49,730,187) | | | | | | | 63,268,586 | |
|
| 7-Day
Yield |
|
|
Shares |
|
| Value
(Note 2) |
|
| SHORT-TERM INVESTMENTS (1.53%) | | | | | | | | | | | | |
| Money Market Fund (1.53%) | | | | | | | | | | | | |
| State Street Institutional Treasury Plus Money Market Fund | | | 0.010 | % | | | 981,362 | | | | 981,362 | |
| TOTAL MONEY MARKET FUND | | | | | | | | | | | 981,362 | |
| | | | | | | | | | | | | |
| TOTAL SHORT-TERM INVESTMENTS | | | | | | | | | | | | |
| (Cost $981,362) | | | | | | | | | | | 981,362 | |
| | | | | | | | | | | | | |
| TOTAL INVESTMENTS (100.05%) | | | | | | | | | | | | |
| (Cost $50,672,417) | | | | | | | | | | $ | 64,249,948 | |
| | | | | | | | | | | | | |
| Liabilities In Excess Of Other Assets (-0.05%) | | | | | | | | | | | (35,212 | ) |
| | | | | | | | | | | | | |
| NET ASSETS (100.00%) | | | | | | | | | | $ | 64,214,736 | |
| (a) | Affiliated Company. See Note 7 in Notes to Financial Statements. |
For Fund compliance purposes, the Fund's industry classifications refer to any one or more of the industry sub-classifications used by one or more widely recognized market indexes or ratings group indexes, and/or as defined by Fund management. This definition may not apply for purposes of this report, which may combine industry sub-classifications for reporting ease. Industries are shown as a percent of net assets.
See Notes to Financial Statements.
| RiverFront Asset Allocation Moderate | |
| Statement of Investments | October 31, 2021 |
| | | Shares | | | Value
(Note 2) | |
| EXCHANGE TRADED FUNDS (98.71%) | | | | | | | | |
| Debt (46.38%) | | | | | | | | |
| RiverFront Dynamic Core Income ETF(a) | | | 832,985 | | | $ | 21,109,339 | |
| Riverfront Strategic Income Fund(a) | | | 62,528 | | | | 1,543,191 | |
| | | | | | | | 22,652,530 | |
| Equity (52.33%) | | | | | | | | |
| First Trust RiverFront Dynamic Developed International ETF(a) | | | 78,887 | | | | 5,754,807 | |
| RiverFront Dynamic US Dividend Advantage ETF(a) | | | 372,353 | | | | 16,916,220 | |
| RiverFront Dynamic US Flex-Cap ETF(a) | | | 61,619 | | | | 2,890,510 | |
| | | | | | | | 25,561,537 | |
| TOTAL EXCHANGE TRADED FUNDS | | | | | | | | |
| (Cost $39,886,791) | | | | | | | 48,214,067 | |
| | | 7-Day
Yield | | | Shares | | | Value
(Note 2) | |
| SHORT-TERM INVESTMENTS (1.46%) | | | | | | | | | | | | |
| Money Market Fund (1.46%) | | | | | | | | | | | | |
| State Street Institutional Treasury Plus Money Market Fund | | | 0.010 | % | | | 713,426 | | | | 713,426 | |
| TOTAL MONEY MARKET FUND | | | | | | | | | | | 713,426 | |
| | | | | | | | | | | | | |
| TOTAL SHORT-TERM INVESTMENTS | | | | | | | | | | | | |
| (Cost $713,426) | | | | | | | | | | | 713,426 | |
| | | | | | | | | | | | | |
| TOTAL INVESTMENTS (100.17%) | | | | | | | | | | | | |
| (Cost $40,600,109) | | | | | | | | | | $ | 48,927,493 | |
| | | | | | | | | | | | | |
| Liabilities In Excess Of Other Assets (-0.17%) | | | | | | | | | | | (82,726 | ) |
| | | | | | | | | | | | | |
| NET ASSETS (100.00%) | | | | | | | | | | $ | 48,844,767 | |
| (a) | Affiliated Company. See Note 7 in Notes to Financial Statements. |
For Fund compliance purposes, the Fund's industry classifications refer to any one or more of the industry sub-classifications used by one or more widely recognized market indexes or ratings group indexes, and/or as defined by Fund management. This definition may not apply for purposes of this report, which may combine industry sub-classifications for reporting ease. Industries are shown as a percent of net assets.
See Notes to Financial Statements.
| RiverFront Global Allocation Series | |
| Statements of Assets and Liabilities | October 31, 2021 |
| | |
RiverFront Asset
Allocation
Aggressive | | | RiverFront Asset
Allocation
Growth &
Income | | |
RiverFront Asset
Allocation
Moderate | |
| ASSETS | | | | | | | | | |
| Investments, at value | | $ | 834,056 | | | $ | 981,362 | | | $ | 713,426 | |
| Investments in affiliates, at value | | | 26,925,597 | | | | 63,268,586 | | | | 48,214,067 | |
| Receivable for shares sold | | | – | | | | 36,171 | | | | – | |
| Dividends and interest receivable | | | 5 | | | | 13 | | | | 6 | |
| Total Assets | | | 27,759,658 | | | | 64,286,132 | | | | 48,927,499 | |
| LIABILITIES | | | | | | | | | | | | |
| Payable for shares redeemed | | | 205 | | | | 32,475 | | | | 48,538 | |
| Unitary administrative fees payable | | | 11,356 | | | | 26,719 | | | | 20,505 | |
| Distribution and services fees payable | | | 3,143 | | | | 12,202 | | | | 13,689 | |
| Total Liabilities | | | 14,704 | | | | 71,396 | | | | 82,732 | |
| NET ASSETS | | $ | 27,744,954 | | | $ | 64,214,736 | | | $ | 48,844,767 | |
| NET ASSETS CONSIST OF | | | | | | | | | | | | |
| Paid-in capital | | $ | 23,603,218 | | | $ | 55,899,092 | | | $ | 40,517,079 | |
| Total distributable earnings | | | 4,141,736 | | | | 8,315,644 | | | | 8,327,688 | |
| NET ASSETS | | $ | 27,744,954 | | | $ | 64,214,736 | | | $ | 48,844,767 | |
| INVESTMENTS, AT COST | | $ | 834,056 | | | $ | 981,362 | | | $ | 713,426 | |
| INVESTMENTS IN AFFILIATES, AT COST | | $ | 19,880,715 | | | $ | 49,691,055 | | | $ | 39,886,683 | |
See Notes to Financial Statements.
| RiverFront Global Allocation Series | |
| Statements of Assets and Liabilities (continued) | October 31, 2021 |
| | |
RiverFront Asset
Allocation
Aggressive | | | RiverFront Asset
Allocation
Growth &
Income | | |
RiverFront Asset
Allocation
Moderate | |
| PRICING OF SHARES | | | | | | | | | |
| Investor Class: | | | | | | | | | | | | |
| Net Asset Value, offering and redemption price per share | | $ | 14.80 | | | $ | 14.45 | | | $ | 12.23 | |
| Net Assets | | $ | 1,828,120 | | | $ | 6,920,888 | | | $ | 4,275,290 | |
| Shares of beneficial interest outstanding (unlimited number of shares, no par value common stock authorized) | | | 123,503 | | | | 478,991 | | | | 349,546 | |
| Class A: | | | | | | | | | | | | |
| Net Asset Value, offering and redemption price per share | | $ | 14.68 | | | $ | 14.43 | | | $ | 12.22 | |
| Net Assets | | $ | 1,565,943 | | | $ | 6,139,120 | | | $ | 10,997,816 | |
| Shares of beneficial interest outstanding (unlimited number of shares, no par value common stock authorized) | | | 106,638 | | | | 425,337 | | | | 900,313 | |
| Maximum offering price per share ((NAV/0.9450), based on maximum sales charge of 5.50% of the offering price) | | $ | 15.53 | | | $ | 15.27 | | | $ | 12.93 | |
| Class C: | | | | | | | | | | | | |
| Net Asset Value, offering and redemption price per share(a) | | $ | 13.73 | | | $ | 13.94 | | | $ | 12.04 | |
| Net Assets | | $ | 2,691,237 | | | $ | 11,048,575 | | | $ | 12,232,338 | |
| Shares of beneficial interest outstanding (unlimited number of shares, no par value common stock authorized) | | | 196,000 | | | | 792,584 | | | | 1,016,332 | |
| Class I: | | | | | | | | | | | | |
| Net Asset Value, offering and redemption price per share | | $ | 15.16 | | | $ | 14.40 | | | $ | 12.24 | |
| Net Assets | | $ | 3,255,992 | | | $ | 40,106,153 | | | $ | 21,339,323 | |
| Shares of beneficial interest outstanding (unlimited number of shares, no par value common stock authorized) | | | 214,785 | | | | 2,785,898 | | | | 1,743,600 | |
| Investor Class II: | | | | | | | | | | | | |
| Net Asset Value, offering and redemption price per share | | $ | 14.67 | | | | N/A | | | | N/A | |
| Net Assets | | $ | 880,778 | | | | N/A | | | | N/A | |
| Shares of beneficial interest outstanding (unlimited number of shares, no par value common stock authorized) | | | 60,029 | | | | N/A | | | | N/A | |
| Class L: | | | | | | | | | | | | |
| Net Asset Value, offering and redemption price per share | | $ | 15.13 | | | | N/A | | | | N/A | |
| Net Assets | | $ | 17,522,884 | | | | N/A | | | | N/A | |
| Shares of beneficial interest outstanding (unlimited number of shares, no par value common stock authorized) | | | 1,158,246 | | | | N/A | | | | N/A | |
| (a) | Redemption price per share may be reduced for any applicable contingent deferred sales charge. For a description of a possible sales charge, please see the Fund's Prospectus. |
See Notes to Financial Statements.
| RiverFront Global Allocation Series | |
| Statements of Operations | For the Year Ended October 31, 2021 |
| | |
RiverFront Asset
Allocation
Aggressive | | | RiverFront Asset
Allocation
Growth &
Income | | |
RiverFront Asset
Allocation
Moderate | |
| INVESTMENT INCOME | | | | | | | | | |
| Dividends | | $ | 100 | | | $ | 198 | | | $ | 169 | |
| Dividends from affiliated securities | | | 348,386 | | | | 970,296 | | | | 815,132 | |
| Total Investment Income | | | 348,486 | | | | 970,494 | | | | 815,301 | |
| | | | | | | | | | | | | |
| EXPENSES | | | | | | | | | | | | |
| Unitary administrative fees | | | 65,919 | | | | 157,329 | | | | 123,002 | |
| Distribution and service fees | | | | | | | | | | | | |
| Investor Class | | | 4,527 | | | | 17,804 | | | | 10,572 | |
| Class A | | | 3,609 | | | | 14,302 | | | | 24,456 | |
| Class C | | | 29,243 | | | | 122,964 | | | | 146,013 | |
| Investor Class II | | | 2,213 | | | | – | | | | – | |
| Total Expenses | | | 105,511 | | | | 312,399 | | | | 304,043 | |
| Net Expenses | | | 105,511 | | | | 312,399 | | | | 304,043 | |
| Net Investment Income | | | 242,975 | | | | 658,095 | | | | 511,258 | |
| Net realized gain on investments - affiliated securities | | | 341,157 | | | | 2,069,528 | | | | 1,895,480 | |
| Net realized gain | | | 341,157 | | | | 2,069,528 | | | | 1,895,480 | |
| Net change in unrealized appreciation on investments - affiliated securities | | | 6,583,112 | | | | 10,328,520 | | | | 5,547,451 | |
| Net change in unrealized appreciation | | | 6,583,112 | | | | 10,328,520 | | | | 5,547,451 | |
| NET REALIZED AND UNREALIZED GAIN ON INVESTMENTS | | | 6,924,269 | | | | 12,398,048 | | | | 7,442,931 | |
| NET INCREASE IN NET ASSETS RESULTING FROM OPERATIONS | | $ | 7,167,244 | | | $ | 13,056,143 | | | $ | 7,954,189 | |
See Notes to Financial Statements.
| RiverFront Asset Allocation Aggressive |
| Statements of Changes in Net Assets |
| | | For the Year
Ended
October 31, 2021 | | | For the Year
Ended
October 31, 2020 | |
| OPERATIONS | | | | | | |
| Net investment income | | $ | 242,975 | | | $ | 416,786 | |
| Net realized gain/(loss) | | | 341,157 | | | | (1,857,082 | ) |
| Net change in unrealized appreciation | | | 6,583,112 | | | | 842,445 | |
| Net Increase/(Decrease) in Net Assets Resulting from Operations | | | 7,167,244 | | | | (597,851 | ) |
| TOTAL DISTRIBUTIONS | | | | | | | | |
| From distributable earnings | | | | | | | | |
| Investor Class | | | (21,922 | ) | | | (79,044 | ) |
| Class A | | | (14,110 | ) | | | (16,860 | ) |
| Class C | | | (42,875 | ) | | | (89,159 | ) |
| Class I | | | (40,375 | ) | | | (101,058 | ) |
| Investor Class II | | | (11,166 | ) | | | (24,038 | ) |
| Class L | | | (191,732 | ) | | | (358,372 | ) |
| Net Decrease in Net Assets from Distributions | | | (322,180 | ) | | | (668,531 | ) |
| BENEFICIAL INTEREST TRANSACTIONS (NOTE 6) | | | | | | | | |
| Shares sold | | | | | | | | |
| Investor Class | | | 97,098 | | | | 27,937 | |
| Class A | | | 664,052 | | | | 414,965 | |
| Class C | | | 181,363 | | | | 112,219 | |
| Class I | | | 219,854 | | | | 475,259 | |
| Investor Class II | | | 7,763 | | | | 31,382 | |
| Class L | | | 1,804,038 | | | | 1,329,923 | |
| Dividends reinvested | | | | | | | | |
| Investor Class | | | 21,114 | | | | 76,357 | |
| Class A | | | 14,110 | | | | 16,860 | |
| Class C | | | 42,795 | | | | 88,963 | |
| Class I | | | 38,987 | | | | 99,066 | |
| Investor Class II | | | 11,024 | | | | 17,702 | |
| Class L | | | 190,865 | | | | 357,175 | |
| Shares redeemed | | | | | | | | |
| Investor Class | | | (654,855 | ) | | | (1,877,602 | ) |
| Class A | | | (434,099 | ) | | | (199,699 | ) |
| Class C | | | (1,494,435 | ) | | | (1,664,423 | ) |
| Class I | | | (787,434 | ) | | | (4,411,082 | ) |
| Investor Class II | | | (105,517 | ) | | | (524,176 | ) |
| Class L | | | (1,877,913 | ) | | | (5,856,097 | ) |
| Net Decrease in Net Assets Derived from Beneficial Interest Transactions | | | (2,061,190 | ) | | | (11,485,271 | ) |
| Net increase/(decrease) in net assets | | | 4,783,874 | | | | (12,751,653 | ) |
| NET ASSETS | | | | | | | | |
| Beginning of year | | | 22,961,080 | | | | 35,712,733 | |
| End of year | | $ | 27,744,954 | | | $ | 22,961,080 | |
See Notes to Financial Statements.
| RiverFront Asset Allocation Growth & Income |
| Statements of Changes in Net Assets |
| | | For the Year
Ended
October 31, 2021 | | | For the Year
Ended
October 31, 2020 | |
| OPERATIONS | | | | | | |
| Net investment income | | $ | 658,095 | | | $ | 1,044,927 | |
| Net realized gain/(loss) | | | 2,069,528 | | | | (3,546,085 | ) |
| Net change in unrealized appreciation | | | 10,328,520 | | | | 1,850,356 | |
| Net Increase/(Decrease) in Net Assets Resulting from Operations | | | 13,056,143 | | | | (650,802 | ) |
| TOTAL DISTRIBUTIONS | | | | | | | | |
| From distributable earnings | | | | | | | | |
| Investor Class | | | (72,153 | ) | | | (134,202 | ) |
| Class A | | | (57,142 | ) | | | (67,887 | ) |
| Class C | | | (64,156 | ) | | | (213,573 | ) |
| Class I | | | (464,644 | ) | | | (767,779 | ) |
| Dividends to shareholders from tax return of capital | | | | | | | | |
| Investor Class | | | (5,188 | ) | | | – | |
| Class A | | | (6,322 | ) | | | – | |
| Class C | | | (5,710 | ) | | | – | |
| Class I | | | (41,353 | ) | | | – | |
| Net Decrease in Net Assets from Distributions | | | (716,668 | ) | | | (1,183,441 | ) |
| BENEFICIAL INTEREST TRANSACTIONS (NOTE 6) | | | | | | | | |
| Shares sold | | | | | | | | |
| Investor Class | | | 65,799 | | | | 123,506 | |
| Class A | | | 1,777,632 | | | | 1,864,486 | |
| Class C | | | 548,945 | | | | 798,015 | |
| Class I | | | 4,128,228 | | | | 4,243,529 | |
| Dividends reinvested | | | | | | | | |
| Investor Class | | | 74,189 | | | | 129,440 | |
| Class A | | | 62,714 | | | | 67,753 | |
| Class C | | | 69,066 | | | | 211,358 | |
| Class I | | | 498,442 | | | | 755,180 | |
| Shares redeemed | | | | | | | | |
| Investor Class | | | (1,441,166 | ) | | | (2,188,662 | ) |
| Class A | | | (1,241,333 | ) | | | (1,243,469 | ) |
| Class C | | | (5,788,861 | ) | | | (6,701,534 | ) |
| Class I | | | (6,339,619 | ) | | | (18,874,405 | ) |
| Net Decrease in Net Assets Derived from Beneficial Interest Transactions | | | (7,585,964 | ) | | | (20,814,803 | ) |
| Net increase/(decrease) in net assets | | | 4,753,511 | | | | (22,649,046 | ) |
| NET ASSETS | | | | | | | | |
| Beginning of year | | | 59,461,225 | | | | 82,110,271 | |
| End of year | | $ | 64,214,736 | | | $ | 59,461,225 | |
See Notes to Financial Statements.
| RiverFront Asset Allocation Moderate |
| Statements of Changes in Net Assets |
| | | For the Year
Ended
October 31, 2021 | | | For the Year
Ended
October 31, 2020 | |
| OPERATIONS | | | | | | |
| Net investment income | | $ | 511,258 | | | $ | 691,629 | |
| Net realized gain/(loss) | | | 1,895,480 | | | | (102,437 | ) |
| Net change in unrealized appreciation | | | 5,547,451 | | | | 453,892 | |
| Net Increase in Net Assets Resulting from Operations | | | 7,954,189 | | | | 1,043,084 | |
| TOTAL DISTRIBUTIONS | | | | | | | | |
| From distributable earnings | | | | | | | | |
| Investor Class | | | (50,893 | ) | | | (66,700 | ) |
| Class A | | | (119,500 | ) | | | (101,776 | ) |
| Class C | | | (72,344 | ) | | | (168,779 | ) |
| Class I | | | (293,897 | ) | | | (381,939 | ) |
| Net Decrease in Net Assets from Distributions | | | (536,634 | ) | | | (719,194 | ) |
| BENEFICIAL INTEREST TRANSACTIONS (NOTE 6) | | | | | | | | |
| Shares sold | | | | | | | | |
| Investor Class | | | 382,910 | | | | 167,869 | |
| Class A | | | 3,474,722 | | | | 3,641,533 | |
| Class C | | | 106,117 | | | | 455,274 | |
| Class I | | | 2,720,744 | | | | 2,685,022 | |
| Dividends reinvested | | | | | | | | |
| Investor Class | | | 50,673 | | | | 66,302 | |
| Class A | | | 118,413 | | | | 100,652 | |
| Class C | | | 68,445 | | | | 162,523 | |
| Class I | | | 277,578 | | | | 365,144 | |
| Shares redeemed | | | | | | | | |
| Investor Class | | | (673,882 | ) | | | (1,546,495 | ) |
| Class A | | | (1,658,992 | ) | | | (2,067,955 | ) |
| Class C | | | (6,636,989 | ) | | | (11,137,381 | ) |
| Class I | | | (3,748,718 | ) | | | (9,739,924 | ) |
| Net Decrease in Net Assets Derived from Beneficial Interest Transactions | | | (5,518,979 | ) | | | (16,847,436 | ) |
| Net increase/(decrease) in net assets | | | 1,898,576 | | | | (16,523,546 | ) |
| NET ASSETS | | | | | | | | |
| Beginning of year | | | 46,946,191 | | | | 63,469,737 | |
| End of year | | $ | 48,844,767 | | | $ | 46,946,191 | |
See Notes to Financial Statements.
RiverFront Asset Allocation Aggressive – Investor Class
Financial Highlights
Selected data for a share of beneficial interest outstanding throughout the periods indicated:
| | | For the Year
Ended
October 31,
2021 | | | For the Year
Ended
October 31,
2020 | | | For the Year
Ended
October 31,
2019 | | | For the Year
Ended
October 31,
2018(a)(b) | | | For the Year
Ended
October 31,
2017 | |
| Net asset value, beginning of period | | $ | 11.31 | | | $ | 11.57 | | | $ | 14.59 | | | $ | 16.27 | | | $ | 13.54 | |
| INCOME/(LOSS) FROM INVESTMENT OPERATIONS: | | | | | | | | |
| Net investment income(c) | | | 0.12 | | | | 0.17 | | | | 0.17 | | | | 0.25 | | | | 0.16 | |
| Net realized and unrealized gain/(loss) | | | 3.54 | | | | (0.19 | ) | | | 0.08 | | | | (1.27 | ) | | | 2.76 | |
| Total from investment operations | | | 3.66 | | | | (0.02 | ) | | | 0.25 | | | | (1.02 | ) | | | 2.92 | |
| DISTRIBUTIONS: | | | | | | | | | |
| From net investment income | | | (0.17 | ) | | | (0.24 | ) | | | (0.19 | ) | | | (0.21 | ) | | | (0.19 | ) |
| From net realized gains | | | – | | | | – | | | | (3.08 | ) | | | (0.45 | ) | | | – | |
| Total distributions | | | (0.17 | ) | | | (0.24 | ) | | | (3.27 | ) | | | (0.66 | ) | | | (0.19 | ) |
| Net increase/(decrease) in net asset value | | | 3.49 | | | | (0.26 | ) | | | (3.02 | ) | | | (1.68 | ) | | | 2.73 | |
| Net asset value, end of year | | $ | 14.80 | | | $ | 11.31 | | | $ | 11.57 | | | $ | 14.59 | | | $ | 16.27 | |
| TOTAL RETURN(d) | | | 32.58 | % | | | (0.33 | )% | | | 5.05 | % | | | (6.62 | )% | | | 21.81 | % |
| RATIOS/SUPPLEMENTAL DATA: | | | | | | | | | |
| Net assets, end of year (000s) | | $ | 1,828 | | | $ | 1,862 | | | $ | 3,914 | | | $ | 4,491 | | | $ | 8,935 | |
| Ratio of expenses to average net assets excluding fee waivers and reimbursements | | | 0.50 | % | | | 0.50 | % | | | 0.50 | % | | | 0.93 | % | | | 1.45 | % |
| Ratio of expenses to average net assets including fee waivers and reimbursements | | | 0.50 | % | | | 0.50 | % | | | 0.50 | % | | | 0.75 | %(e) | | | 1.15 | % |
| Ratio of net investment income to average net assets | | | 0.84 | % | | | 1.47 | % | | | 1.47 | % | | | 1.56 | % | | | 1.09 | % |
| Portfolio turnover rate(f) | | | 5 | % | | | 22 | % | | | 18 | % | | | 200 | % | | | 60 | % |
| (a) | Prior to December 1, 2017, Investor Class was known as Class A. |
| (b) | Prior to February 28, 2018, the RiverFront Asset Allocation Aggressive was known as the RiverFront Global Growth Fund. |
| (c) | Calculated using the average shares method. |
| (d) | Total returns are for the period indicated and have not been annualized. Total returns would have been lower had certain expenses not been waived during the period. Returns shown do not reflect the deduction of taxes that a shareholder would pay on Fund distributions or the redemption of Fund shares. |
| (e) | Effective February 28, 2018, pursuant to the Administrative Services Agreement, the Fund pays an annual unitary administrative fee, which is based on the Fund’s average daily net assets, and will no longer pay a management fee or contractually limit the Fund’s total annual expenses. Refer to Note 8. |
| (f) | Portfolio turnover rate for periods less than one full year have not been annualized. |
See Notes to Financial Statements.
RiverFront Asset Allocation Aggressive – Class A
Financial Highlights
Selected data for a share of beneficial interest outstanding throughout the periods indicated:
| | |
For the Year
Ended
October 31,
2021 | | |
For the Year
Ended
October 31,
2020 | | |
For the Year
Ended
October 31,
2019 | | | For the Period
June 12, 2018
(Commencement
of Operations) to
October 31, 2018 | |
| Net asset value, beginning of period | | $ | 11.22 | | | $ | 11.48 | | | $ | 14.51 | | | $ | 16.35 | |
| | | | | | | | | | | | | | | | | |
| INCOME FROM INVESTMENT OPERATIONS: | | | | | | | | | | | | | | | | |
| Net investment income(a) | | | 0.11 | | | | 0.15 | | | | 0.21 | | | | 0.16 | |
| Net realized and unrealized gain/(loss) | | | 3.52 | | | | (0.17 | ) | | | 0.03 | | | | (2.00 | ) |
| Total from investment operations | | | 3.63 | | | | (0.02 | ) | | | 0.24 | | | | (1.84 | ) |
| | | | | | | | | | | | | | | | | |
| DISTRIBUTIONS: | | | | | | | | | | | | | | | | |
| From net investment income | | | (0.17 | ) | | | (0.24 | ) | | | (0.19 | ) | | | – | |
| From net realized gains | | | – | | | | – | | | | (3.08 | ) | | | – | |
| Total distributions | | | (0.17 | ) | | | (0.24 | ) | | | (3.27 | ) | | | – | |
| | | | | | | | | | | | | | | | | |
| Net increase/(decrease) in net asset value | | | 3.46 | | | | (0.26 | ) | | | (3.03 | ) | | | (1.84 | ) |
| Net asset value, end of year | | $ | 14.68 | | | $ | 11.22 | | | $ | 11.48 | | | $ | 14.51 | |
| TOTAL RETURN(b) | | | 32.59 | % | | | (0.33 | )% | | | 5.01 | % | | | (11.25 | )% |
| | | | | | | | | | | | | | | | | |
| RATIOS/SUPPLEMENTAL DATA: | | | | | | | | | | | | | | | | |
| Net assets, end of year (000s) | | $ | 1,566 | | | $ | 989 | | | $ | 756 | | | $ | 9 | |
| Ratio of expenses to average net assets excluding fee waivers and reimbursements | | | 0.50 | % | | | 0.50 | % | | | 0.50 | % | | | 0.50 | %(c) |
| Ratio of expenses to average net assets including fee waivers and reimbursements | | | 0.50 | % | | | 0.50 | % | | | 0.50 | % | | | 0.50 | %(c) |
| Ratio of net investment income to average net assets | | | 0.79 | % | | | 1.38 | % | | | 1.88 | % | | | 2.66 | %(c) |
| Portfolio turnover rate(d) | | | 5 | % | | | 22 | % | | | 18 | % | | | 200 | % |
| (a) | Calculated using the average shares method. |
| (b) | Total returns are for the period indicated and have not been annualized. Total returns would have been lower had certain expenses not been waived during the period. Returns shown do not reflect the deduction of taxes that a shareholder would pay on Fund distributions or the redemption of Fund shares. Returns shown exclude any applicable sales charges. |
| (d) | Portfolio turnover rate for periods less than one full year have not been annualized. |
See Notes to Financial Statements.
RiverFront Asset Allocation Aggressive – Class C
Financial Highlights
Selected data for a share of beneficial interest outstanding throughout the periods indicated:
| | | For the Year
Ended
October 31,
2021 | | | For the Year
Ended
October 31,
2020 | | | For the Year
Ended
October 31,
2019 | | | For the Year
Ended
October 31,
2018(a) | | | For the Year
Ended
October 31,
2017 | |
| Net asset value, beginning of period | | $ | 10.57 | | | $ | 10.89 | | | $ | 14.01 | | | $ | 15.73 | | | $ | 13.18 | |
| INCOME/(LOSS) FROM INVESTMENT OPERATIONS: | | | | | | | | | | | | | | | | | | | | |
| Net investment income(b) | | | 0.01 | | | | 0.07 | | | | 0.08 | | | | 0.12 | | | | 0.04 | |
| Net realized and unrealized gain/(loss) | | | 3.30 | | | | (0.17 | ) | | | 0.05 | | | | (1.20 | ) | | | 2.68 | |
| Total from investment operations | | | 3.31 | | | | (0.10 | ) | | | 0.13 | | | | (1.08 | ) | | | 2.72 | |
| DISTRIBUTIONS: | | | | | | | | | | | | | | | | | | | | |
| From net investment income | | | (0.15 | ) | | | (0.22 | ) | | | (0.17 | ) | | | (0.19 | ) | | | (0.17 | ) |
| From net realized gains | | | – | | | | – | | | | (3.08 | ) | | | (0.45 | ) | | | – | |
| Total distributions | | | (0.15 | ) | | | (0.22 | ) | | | (3.25 | ) | | | (0.64 | ) | | | (0.17 | ) |
| Net increase/(decrease) in net asset value | | | 3.16 | | | | (0.32 | ) | | | (3.12 | ) | | | (1.72 | ) | | | 2.55 | |
| Net asset value, end of year | | $ | 13.73 | | | $ | 10.57 | | | $ | 10.89 | | | $ | 14.01 | | | $ | 15.73 | |
| TOTAL RETURN(c) | | | 31.58 | % | | | (1.04 | )% | | | 4.23 | % | | | (7.24 | )% | | | 20.87 | % |
| RATIOS/SUPPLEMENTAL DATA: | | | | | | | | | | | | | | | | | | | | |
| Net assets, end of year (000s) | | $ | 2,691 | | | $ | 3,147 | | | $ | 4,758 | | | $ | 8,597 | | | $ | 10,408 | |
| Ratio of expenses to average net assets excluding fee waivers and reimbursements | | | 1.25 | % | | | 1.25 | % | | | 1.25 | % | | | 1.63 | % | | | 2.20 | % |
| Ratio of expenses to average net assets including fee waivers and reimbursements | | | 1.25 | % | | | 1.25 | % | | | 1.25 | % | | | 1.47 | %(d) | | | 1.90 | % |
| Ratio of net investment income to average net assets | | | 0.09 | % | | | 0.69 | % | | | 0.71 | % | | | 0.80 | % | | | 0.29 | % |
| Portfolio turnover rate(e) | | | 5 | % | | | 22 | % | | | 18 | % | | | 200 | % | | | 60 | % |
| (a) | Prior to February 28, 2018, the RiverFront Asset Allocation Aggressive was known as the RiverFront Global Growth Fund. |
| (b) | Calculated using the average shares method. |
| (c) | Total returns are for the period indicated and have not been annualized. Total returns would have been lower had certain expenses not been waived during the period. Returns shown do not reflect the deduction of taxes that a shareholder would pay on Fund distributions or the redemption of Fund shares. Returns shown exclude any applicable sales charges. |
| (d) | Effective February 28, 2018, pursuant to the Administrative Services Agreement, the Fund pays an annual unitary administrative fee, which is based on the Fund’s average daily net assets, and will no longer pay a management fee or contractually limit the Fund’s total annual expenses. Refer to Note 8. |
| (e) | Portfolio turnover rate for periods less than one full year have not been annualized. |
See Notes to Financial Statements.
RiverFront Asset Allocation Aggressive – Class I
Financial Highlights
Selected data for a share of beneficial interest outstanding throughout the periods indicated:
| | | For the Year
Ended
October 31,
2021 | | | For the Year
Ended
October 31,
2020 | | | For the Year
Ended
October 31,
2019 | | | For the Year
Ended
October 31,
2018(a) | | | For the Year
Ended
October 31,
2017 | |
| Net asset value, beginning of period | | $ | 11.56 | | | $ | 11.79 | | | $ | 14.78 | | | $ | 16.43 | | | $ | 13.65 | |
| INCOME/(LOSS) FROM INVESTMENT OPERATIONS: | | | | | | | | | | | | | | | | | | | | |
| Net investment income(b) | | | 0.15 | | | | 0.20 | | | | 0.21 | | | | 0.29 | | | | 0.19 | |
| Net realized and unrealized gain/(loss) | | | 3.62 | | | | (0.19 | ) | | | 0.07 | | | | (1.27 | ) | | | 2.78 | |
| Total from investment operations | | | 3.77 | | | | 0.01 | | | | 0.28 | | | | (0.98 | ) | | | 2.97 | |
| DISTRIBUTIONS: | | | | | | | | | | | | | | | | | | | | |
| From net investment income | | | (0.17 | ) | | | (0.24 | ) | | | (0.19 | ) | | | (0.22 | ) | | | (0.19 | ) |
| From net realized gains | | | – | | | | – | | | | (3.08 | ) | | | (0.45 | ) | | | – | |
| Total distributions | | | (0.17 | ) | | | (0.24 | ) | | | (3.27 | ) | | | (0.67 | ) | | | (0.19 | ) |
| Net increase/(decrease) in net asset value | | | 3.60 | | | | (0.23 | ) | | | (2.99 | ) | | | (1.65 | ) | | | 2.78 | |
| Net asset value, end of year | | $ | 15.16 | | | $ | 11.56 | | | $ | 11.79 | | | $ | 14.78 | | | $ | 16.43 | |
| TOTAL RETURN(c) | | | 32.90 | % | | | (0.02 | )% | | | 5.29 | % | | | (6.33 | )% | | | 22.05 | % |
| RATIOS/SUPPLEMENTAL DATA: | | | | | | | | | | | | | | | | | | | | |
| Net assets, end of year (000s) | | $ | 3,256 | | | $ | 2,945 | | | $ | 7,003 | | | $ | 12,701 | | | $ | 13,873 | |
| Ratio of expenses to average net assets excluding fee waivers and reimbursements | | | 0.25 | % | | | 0.25 | % | | | 0.25 | % | | | 0.62 | % | | | 1.20 | % |
| Ratio of expenses to average net assets including fee waivers and reimbursements | | | 0.25 | % | | | 0.25 | % | | | 0.25 | % | | | 0.46 | %(d) | | | 0.90 | % |
| Ratio of net investment income to average net assets | | | 1.08 | % | | | 1.73 | % | | | 1.77 | % | | | 1.79 | % | | | 1.29 | % |
| Portfolio turnover rate(e) | | | 5 | % | | | 22 | % | | | 18 | % | | | 200 | % | | | 60 | % |
| (a) | Prior to February 28, 2018, the RiverFront Asset Allocation Aggressive was known as the RiverFront Global Growth Fund. |
| (b) | Calculated using the average shares method. |
| (c) | Total returns are for the period indicated and have not been annualized. Total returns would have been lower had certain expenses not been waived during the period. Returns shown do not reflect the deduction of taxes that a shareholder would pay on Fund distributions or the redemption of Fund shares. |
| (d) | Effective February 28, 2018, pursuant to the Administrative Services Agreement, the Fund pays an annual unitary administrative fee, which is based on the Fund’s average daily net assets, and will no longer pay a management fee or contractually limit the Fund’s total annual expenses. Refer to Note 8. |
| (e) | Portfolio turnover rate for periods less than one full year have not been annualized. |
See Notes to Financial Statements.
RiverFront Asset Allocation Aggressive – Investor Class II
Financial Highlights
Selected data for a share of beneficial interest outstanding throughout the periods indicated:
| | | For the Year
Ended
October 31,
2021 | | | For the Year
Ended
October 31,
2020 | | | For the Year
Ended
October 31,
2019 | | | For the Year
Ended
October 31,
2018(a)(b) | | | For the Year
Ended
October 31,
2017 | |
| Net asset value, beginning of period | | $ | 11.21 | | | $ | 11.47 | | | $ | 14.50 | | | $ | 16.18 | | | $ | 13.47 | |
| INCOME/(LOSS) FROM INVESTMENT OPERATIONS: | | | | | | | | | | | | | | | | | | | | |
| Net investment income(c) | | | 0.11 | | | | 0.16 | | | | 0.18 | | | | 0.25 | | | | 0.15 | |
| Net realized and unrealized gain/(loss) | | | 3.52 | | | | (0.18 | ) | | | 0.06 | | | | (1.27 | ) | | | 2.75 | |
| Total from investment operations | | | 3.63 | | | | (0.02 | ) | | | 0.24 | | | | (1.02 | ) | | | 2.90 | |
| DISTRIBUTIONS: | | | | | | | | | | | | | | | | | | | | |
| From net investment income | | | (0.17 | ) | | | (0.24 | ) | | | (0.19 | ) | | | (0.21 | ) | | | (0.19 | ) |
| From net realized gains | | | – | | | | – | | | | (3.08 | ) | | | (0.45 | ) | | | – | |
| Total distributions | | | (0.17 | ) | | | (0.24 | ) | | | (3.27 | ) | | | (0.66 | ) | | | (0.19 | ) |
| Net increase/(decrease) in net asset value | | | 3.46 | | | | (0.26 | ) | | | (3.03 | ) | | | (1.68 | ) | | | 2.71 | |
| Net asset value, end of year | | $ | 14.67 | | | $ | 11.21 | | | $ | 11.47 | | | $ | 14.50 | | | $ | 16.18 | |
| TOTAL RETURN(d) | | | 32.62 | % | | | (0.33 | )% | | | 5.02 | % | | | (6.66 | )% | | | 21.77 | % |
| RATIOS/SUPPLEMENTAL DATA: | | | | | | | | | | | | | | | | | | | | |
| Net assets, end of year (000s) | | $ | 881 | | | $ | 741 | | | $ | 1,255 | | | $ | 2,043 | | | $ | 3,451 | |
| Ratio of expenses to average net assets excluding fee waivers and reimbursements | | | 0.50 | % | | | 0.50 | % | | | 0.50 | % | | | 0.91 | % | | | 1.45 | % |
| Ratio of expenses to average net assets including fee waivers and reimbursements | | | 0.50 | % | | | 0.50 | % | | | 0.50 | % | | | 0.74 | %(e) | | | 1.15 | % |
| Ratio of net investment income to average net assets | | | 0.82 | % | | | 1.41 | % | | | 1.53 | % | | | 1.58 | % | | | 1.04 | % |
| Portfolio turnover rate(f) | | | 5 | % | | | 22 | % | | | 18 | % | | | 200 | % | | | 60 | % |
| (a) | Prior to February 28, 2018, the RiverFront Asset Allocation Aggressive was known as the RiverFront Global Growth Fund. |
| (b) | Prior to December 1, 2017, Investor Class II was known as Investor Class. |
| (c) | Calculated using the average shares method. |
| (d) | Total returns are for the period indicated and have not been annualized. Total returns would have been lower had certain expenses not been waived during the period. Returns shown do not reflect the deduction of taxes that a shareholder would pay on Fund distributions or the redemption of Fund shares. |
| (e) | Effective February 28, 2018, pursuant to the Administrative Services Agreement, the Fund pays an annual unitary administrative fee, which is based on the Fund’s average daily net assets, and will no longer pay a management fee or contractually limit the Fund’s total annual expenses. Refer to Note 8. |
| (f) | Portfolio turnover rate for periods less than one full year have not been annualized. |
See Notes to Financial Statements.
RiverFront Asset Allocation Aggressive – Class L
Financial Highlights
Selected data for a share of beneficial interest outstanding throughout the periods indicated:
| | | For the Year
Ended
October 31,
2021 | | | For the Year
Ended
October 31,
2020 | | | For the Year
Ended
October 31,
2019 | | | For the Year
Ended
October 31,
2018(a) | | | For the Year
Ended
October 31,
2017 | |
| Net asset value, beginning of period | | $ | 11.53 | | | $ | 11.77 | | | $ | 14.76 | | | $ | 16.41 | | | $ | 13.63 | |
| INCOME/(LOSS) FROM INVESTMENT OPERATIONS: | | | | | | | | | | | | | | | | | | | | |
| Net investment income(b) | | | 0.15 | | | | 0.19 | | | | 0.21 | | | | 0.30 | | | | 0.19 | |
| Net realized and unrealized gain/(loss) | | | 3.62 | | | | (0.19 | ) | | | 0.07 | | | | (1.28 | ) | | | 2.78 | |
| Total from investment operations | | | 3.77 | | | | – | | | | 0.28 | | | | (0.98 | ) | | | 2.97 | |
| DISTRIBUTIONS: | | | | | | | | | | | | | | | | | | | | |
| From net investment income | | | (0.17 | ) | | | (0.24 | ) | | | (0.19 | ) | | | (0.22 | ) | | | (0.19 | ) |
| From net realized gains | | | – | | | | – | | | | (3.08 | ) | | | (0.45 | ) | | | – | |
| Total distributions | | | (0.17 | ) | | | (0.24 | ) | | | (3.27 | ) | | | (0.67 | ) | | | (0.19 | ) |
| Net increase/(decrease) in net asset value | | | 3.60 | | | | (0.24 | ) | | | (2.99 | ) | | | (1.65 | ) | | | 2.78 | |
| Net asset value, end of year | | $ | 15.13 | | | $ | 11.53 | | | $ | 11.77 | | | $ | 14.76 | | | $ | 16.41 | |
| TOTAL RETURN(c) | | | 32.98 | % | | | (0.11 | )% | | | 5.30 | % | | | (6.34 | )% | | | 22.08 | % |
| RATIOS/SUPPLEMENTAL DATA: | | | | | | | | | | | | | | | | | | | | |
| Net assets, end of year (000s) | | $ | 17,523 | | | $ | 13,277 | | | $ | 18,026 | | | $ | 19,449 | | | $ | 25,309 | |
| Ratio of expenses to average net assets excluding fee waivers and reimbursements | | | 0.25 | % | | | 0.25 | % | | | 0.25 | % | | | 0.63 | % | | | 1.20 | % |
| Ratio of expenses to average net assets including fee waivers and reimbursements | | | 0.25 | % | | | 0.25 | % | | | 0.25 | % | | | 0.47 | %(d) | | | 0.90 | % |
| Ratio of net investment income to average net assets | | | 1.07 | % | | | 1.68 | % | | | 1.77 | % | | | 1.82 | % | | | 1.27 | % |
| Portfolio turnover rate(e) | | | 5 | % | | | 22 | % | | | 18 | % | | | 200 | % | | | 60 | % |
| (a) | Prior to February 28, 2018, the RiverFront Asset Allocation Aggressive was known as the RiverFront Global Growth Fund. |
| (b) | Calculated using the average shares method. |
| (c) | Total returns are for the period indicated and have not been annualized. Total returns would have been lower had certain expenses not been waived during the period. Returns shown do not reflect the deduction of taxes that a shareholder would pay on Fund distributions or the redemption of Fund shares. |
| (d) | Effective February 28, 2018, pursuant to the Administrative Services Agreement, the Fund pays an annual unitary administrative fee, which is based on the Fund’s average daily net assets, and will no longer pay a management fee or contractually limit the Fund’s total annual expenses. Refer to Note 8. |
| (e) | Portfolio turnover rate for periods less than one full year have not been annualized. |
See Notes to Financial Statements.
RiverFront Asset Allocation Growth & Income – Investor Class
Financial Highlights
Selected data for a share of beneficial interest outstanding throughout the periods indicated:
| | | For the Year
Ended
October 31,
2021 | | | For the Year
Ended
October 31,
2020 | | | For the Year
Ended
October 31,
2019 | | | For the Year
Ended
October 31,
2018(a)(b) | | | For the Year
Ended
October 31,
2017 | |
| Net asset value, beginning of period | | $ | 11.84 | | | $ | 12.02 | | | $ | 13.37 | | | $ | 14.48 | | | $ | 12.38 | |
| INCOME/(LOSS) FROM INVESTMENT OPERATIONS: | | | | | | | | |
| Net investment income(c) | | | 0.14 | | | | 0.18 | | | | 0.23 | | | | 0.25 | | | | 0.17 | |
| Net realized and unrealized gain/(loss) | | | 2.62 | | | | (0.16 | ) | | | 0.41 | | | | (0.80 | ) | | | 2.09 | |
| Total from investment operations | | | 2.76 | | | | 0.02 | | | | 0.64 | | | | (0.55 | ) | | | 2.26 | |
| DISTRIBUTIONS: | | | | | | | | | | | | | | | | | | | | |
| From net investment income | | | (0.14 | ) | | | (0.20 | ) | | | (0.21 | ) | | | (0.24 | ) | | | (0.16 | ) |
| From net realized gains | | | – | | | | – | | | | (1.78 | ) | | | (0.32 | ) | | | – | |
| Tax return of capital | | | (0.01 | ) | | | – | | | | – | | | | – | | | | – | |
| Total distributions | | | (0.15 | ) | | | (0.20 | ) | | | (1.99 | ) | | | (0.56 | ) | | | (0.16 | ) |
| Net increase/(decrease) in net asset value | | | 2.61 | | | | (0.18 | ) | | | (1.35 | ) | | | (1.11 | ) | | | 2.10 | |
| Net asset value, end of year | | $ | 14.45 | | | $ | 11.84 | | | $ | 12.02 | | | $ | 13.37 | | | $ | 14.48 | |
| TOTAL RETURN(d) | | | 23.40 | % | | | 0.27 | % | | | 6.71 | % | | | (4.03 | )% | | | 18.37 | % |
| RATIOS/SUPPLEMENTAL DATA: | | | | | | | | |
| Net assets, end of year (000s) | | $ | 6,921 | | | $ | 6,802 | | | $ | 8,864 | | | $ | 9,062 | | | $ | 19,123 | |
| Ratio of expenses to average net assets excluding fee waivers and reimbursements | | | 0.50 | % | | | 0.50 | % | | | 0.50 | % | | | 0.85 | % | | | 1.37 | % |
| Ratio of expenses to average net assets including fee waivers and reimbursements | | | 0.50 | % | | | 0.50 | % | | | 0.50 | % | | | 0.74 | %(e) | | | 1.15 | % |
| Ratio of net investment income to average net assets | | | 1.04 | % | | | 1.57 | % | | | 1.91 | % | | | 1.70 | % | | | 1.24 | % |
| Portfolio turnover rate(f) | | | 13 | % | | | 33 | % | | | 62 | % | | | 224 | % | | | 63 | % |
| (a) | Prior to December 1, 2017, Investor Class was known as Class A. |
| (b) | Prior to February 28, 2018, the RiverFront Asset Allocation Growth & Income was known as the RiverFront Dynamic Equity Income Fund. |
| (c) | Calculated using the average shares method. |
| (d) | Total returns are for the period indicated and have not been annualized. Total returns would have been lower had certain expenses not been waived during the period. Returns shown do not reflect the deduction of taxes that a shareholder would pay on Fund distributions or the redemption of Fund shares. |
| (e) | Effective February 28, 2018, pursuant to the Administrative Services Agreement, the Fund pays an annual unitary administrative fee, which is based on the Fund’s average daily net assets, and will no longer pay a management fee or contractually limit the Fund’s total annual expenses. Refer to Note 8. |
| (f) | Portfolio turnover rate for periods less than one full year have not been annualized. |
See Notes to Financial Statements.
RiverFront Asset Allocation Growth & Income – Class A
Financial Highlights
Selected data for a share of beneficial interest outstanding throughout the periods indicated:
| | | For the Year
Ended
October 31,
2021 | | | For the Year
Ended
October 31,
2020 | | | For the Year
Ended
October 31,
2019 | | | For the Period
June 12, 2018
(Commencement
of Operations) to
October 31, 2018 | |
| Net asset value, beginning of period | | $ | 11.83 | | | $ | 12.01 | | | $ | 13.36 | | | $ | 14.70 | |
| | | | | | | | | | | | | | | | | |
| INCOME FROM INVESTMENT OPERATIONS: | | | | | | | | | | | | | | | | |
| Net investment income(a) | | | 0.14 | | | | 0.18 | | | | 0.25 | | | | 0.15 | |
| Net realized and unrealized gain/(loss) | | | 2.61 | | | | (0.16 | ) | | | 0.39 | | | | (1.34 | ) |
| Total from investment operations | | | 2.75 | | | | 0.02 | | | | 0.64 | | | | (1.19 | ) |
| | | | | | | | | | | | | | | | | |
| DISTRIBUTIONS: | | | | | | | | | | | | | | | | |
| From net investment income | | | (0.14 | ) | | | (0.20 | ) | | | (0.21 | ) | | | (0.15 | ) |
| From net realized gains | | | – | | | | – | | | | (1.78 | ) | | | – | |
| From tax return of capital | | | (0.01 | ) | | | – | | | | – | | | | – | |
| Total distributions | | | (0.15 | ) | | | (0.20 | ) | | | (1.99 | ) | | | (0.15 | ) |
| | | | | | | | | | | | | | | | | |
| Net increase/(decrease) in net asset value | | | 2.60 | | | | (0.18 | ) | | | (1.35 | ) | | | (1.34 | ) |
| Net asset value, end of year | | $ | 14.43 | | | $ | 11.83 | | | $ | 12.01 | | | $ | 13.36 | |
| TOTAL RETURN(b) | | | 23.34 | % | | | 0.28 | % | | | 6.78 | % | | | (8.13 | )% |
| | | | | | | | | | | | | | | | | |
| RATIOS/SUPPLEMENTAL DATA: | | | | | | | | | | | | | | | | |
| Net assets, end of year (000s) | | $ | 6,139 | | | $ | 4,489 | | | $ | 3,839 | | | $ | 13 | |
| Ratio of expenses to average net assets excluding fee waivers and reimbursements | | | 0.50 | % | | | 0.50 | % | | | 0.50 | % | | | 0.50 | %(c) |
| Ratio of expenses to average net assets including fee waivers and reimbursements | | | 0.50 | % | | | 0.50 | % | | | 0.50 | % | | | 0.50 | %(c) |
| Ratio of net investment income to average net assets | | | 1.05 | % | | | 1.52 | % | | | 2.13 | % | | | 2.65 | %(c) |
| Portfolio turnover rate(d) | | | 13 | % | | | 33 | % | | | 62 | % | | | 224 | % |
| (a) | Calculated using the average shares method. |
| (b) | Total returns are for the period indicated and have not been annualized. Total returns would have been lower had certain expenses not been waived during the period. Returns shown do not reflect the deduction of taxes that a shareholder would pay on Fund distributions or the redemption of Fund shares. Returns shown exclude any applicable sales charges. |
| (d) | Portfolio turnover rate for periods less than one full year have not been annualized. |
See Notes to Financial Statements.
RiverFront Asset Allocation Growth & Income – Class C
Financial Highlights
Selected data for a share of beneficial interest outstanding throughout the periods indicated:
| | | For the Year
Ended
October 31,
2021 | | | For the Year
Ended
October 31,
2020 | | | For the Year
Ended
October 31,
2019 | | | For the Year
Ended
October 31,
2018(a) | | | For the Year
Ended
October 31,
2017 | |
| Net asset value, beginning of period | | $ | 11.45 | | | $ | 11.65 | | | $ | 13.03 | | | $ | 14.16 | | | $ | 12.15 | |
| INCOME/(LOSS) FROM INVESTMENT OPERATIONS: | | | | | | | | | | | | | | | | | | | | |
| Net investment income(b) | | | 0.04 | | | | 0.09 | | | | 0.13 | | | | 0.14 | | | | 0.07 | |
| Net realized and unrealized gain/(loss) | | | 2.52 | | | | (0.15 | ) | | | 0.40 | | | | (0.78 | ) | | | 2.05 | |
| Total from investment operations | | | 2.56 | | | | (0.06 | ) | | | 0.53 | | | | (0.64 | ) | | | 2.12 | |
| DISTRIBUTIONS: | | | | | | | | | | | | | | | | | | | | |
| From net investment income | | | (0.06 | ) | | | (0.14 | ) | | | (0.13 | ) | | | (0.17 | ) | | | (0.11 | ) |
| From net realized gains | | | – | | | | – | | | | (1.78 | ) | | | (0.32 | ) | | | – | |
| Tax return of capital | | | (0.01 | ) | | | – | | | | – | | | | – | | | | – | |
| Total distributions | | | (0.07 | ) | | | (0.14 | ) | | | (1.91 | ) | | | (0.49 | ) | | | (0.11 | ) |
| Net increase/(decrease) in net asset value | | | 2.49 | | | | (0.20 | ) | | | (1.38 | ) | | | (1.13 | ) | | | 2.01 | |
| Net asset value, end of year | | $ | 13.94 | | | $ | 11.45 | | | $ | 11.65 | | | $ | 13.03 | | | $ | 14.16 | |
| TOTAL RETURN(c) | | | 22.44 | % | | | (0.44 | )% | | | 5.91 | % | | | (4.74 | )% | | | 17.53 | % |
| RATIOS/SUPPLEMENTAL DATA: | | | | | | | | | | | | | | | | | | | | |
| Net assets, end of year (000s) | | $ | 11,049 | | | $ | 13,642 | | | $ | 19,798 | | | $ | 23,111 | | | $ | 26,514 | |
| Ratio of expenses to average net assets excluding fee waivers and reimbursements | | | 1.25 | % | | | 1.25 | % | | | 1.25 | % | | | 1.57 | % | | | 2.12 | % |
| Ratio of expenses to average net assets including fee waivers and reimbursements | | | 1.25 | % | | | 1.25 | % | | | 1.25 | % | | | 1.47 | %(d) | | | 1.90 | % |
| Ratio of net investment income to average net assets | | | 0.29 | % | | | 0.82 | % | | | 1.15 | % | | | 1.01 | % | | | 0.51 | % |
| Portfolio turnover rate(e) | | | 13 | % | | | 33 | % | | | 62 | % | | | 224 | % | | | 63 | % |
| (a) | Prior to February 28, 2018, the RiverFront Asset Allocation Growth & Income was known as the RiverFront Dynamic Equity Income Fund. |
| (b) | Calculated using the average shares method. |
| (c) | Total returns are for the period indicated and have not been annualized. Total returns would have been lower had certain expenses not been waived during the period. Returns shown do not reflect the deduction of taxes that a shareholder would pay on Fund distributions or the redemption of Fund shares. Returns shown exclude any applicable sales charges. |
| (d) | Effective February 28, 2018, pursuant to the Administrative Services Agreement, the Fund pays an annual unitary administrative fee, which is based on the Fund’s average daily net assets, and will no longer pay a management fee or contractually limit the Fund’s total annual expenses. Refer to Note 8. |
| (e) | Portfolio turnover rate for periods less than one full year have not been annualized. |
See Notes to Financial Statements.
RiverFront Asset Allocation Growth & Income – Class I
Financial Highlights
Selected data for a share of beneficial interest outstanding throughout the periods indicated:
| | | For the Year
Ended
October 31,
2021 | | | For the Year
Ended
October 31,
2020 | | | For the Year
Ended
October 31,
2019 | | | For the Year
Ended
October 31,
2018(a) | | | For the Year
Ended
October 31,
2017 | |
| Net asset value, beginning of period | | $ | 11.79 | | | $ | 11.97 | | | $ | 13.31 | | | $ | 14.42 | | | $ | 12.31 | |
| INCOME/(LOSS) FROM INVESTMENT OPERATIONS: | | | | | | | | | | | | | | | | | | | | |
| Net investment income(b) | | | 0.18 | | | | 0.22 | | | | 0.26 | | | | 0.29 | | | | 0.20 | |
| Net realized and unrealized gain/(loss) | | | 2.61 | | | | (0.18 | ) | | | 0.41 | | | | (0.82 | ) | | | 2.09 | |
| Total from investment operations | | | 2.79 | | | | 0.04 | | | | 0.67 | | | | (0.53 | ) | | | 2.29 | |
| DISTRIBUTIONS: | | | | | | | | | | | | | | | | | | | | |
| From net investment income | | | (0.16 | ) | | | (0.22 | ) | | | (0.23 | ) | | | (0.26 | ) | | | (0.18 | ) |
| From net realized gains | | | – | | | | – | | | | (1.78 | ) | | | (0.32 | ) | | | – | |
| Tax return of capital | | | (0.02 | ) | | �� | – | | | | – | | | | – | | | | – | |
| Total distributions | | | (0.18 | ) | | | (0.22 | ) | | | (2.01 | ) | | | (0.58 | ) | | | (0.18 | ) |
| Net increase/(decrease) in net asset value | | | 2.61 | | | | (0.18 | ) | | | (1.34 | ) | | | (1.11 | ) | | | 2.11 | |
| Net asset value, end of year | | $ | 14.40 | | | $ | 11.79 | | | $ | 11.97 | | | $ | 13.31 | | | $ | 14.42 | |
| TOTAL RETURN(c) | | | 23.79 | % | | | 0.46 | % | | | 7.07 | % | | | (3.88 | )% | | | 18.75 | % |
| RATIOS/SUPPLEMENTAL DATA: | | | | | | | | | | | | | | | | | | | | |
| Net assets, end of year (000s) | | $ | 40,106 | | | $ | 34,529 | | | $ | 49,610 | | | $ | 51,749 | | | $ | 33,484 | |
| Ratio of expenses to average net assets excluding fee waivers and reimbursements | | | 0.25 | % | | | 0.25 | % | | | 0.25 | % | | | 0.53 | % | | | 1.12 | % |
| Ratio of expenses to average net assets including fee waivers and reimbursements | | | 0.25 | % | | | 0.25 | % | | | 0.25 | % | | | 0.44 | %(d) | | | 0.90 | % |
| Ratio of net investment income to average net assets | | | 1.29 | % | | | 1.83 | % | | | 2.17 | % | | | 2.04 | % | | | 1.50 | % |
| Portfolio turnover rate(e) | | | 13 | % | | | 33 | % | | | 62 | % | | | 224 | % | | | 63 | % |
| (a) | Prior to February 28, 2018, the RiverFront Asset Allocation Growth & Income was known as the RiverFront Dynamic Equity Income Fund. |
| (b) | Calculated using the average shares method. |
| (c) | Total returns are for the period indicated and have not been annualized. Total returns would have been lower had certain expenses not been waived during the period. Returns shown do not reflect the deduction of taxes that a shareholder would pay on Fund distributions or the redemption of Fund shares. |
| (d) | Effective February 28, 2018, pursuant to the Administrative Services Agreement, the Fund pays an annual unitary administrative fee, which is based on the Fund’s average daily net assets, and will no longer pay a management fee or contractually limit the Fund’s total annual expenses. Refer to Note 8. |
| (e) | Portfolio turnover rate for periods less than one full year have not been annualized. |
See Notes to Financial Statements.
RiverFront Asset Allocation Moderate – Investor Class
Financial Highlights
Selected data for a share of beneficial interest outstanding throughout the periods indicated:
| | | For the Year
Ended
October 31,
2021 | | | For the Year
Ended
October 31,
2020 | | | For the Year
Ended
October 31,
2019 | | | For the Year
Ended
October 31,
2018(a)(b) | | | For the Year
Ended
October 31,
2017 | |
| Net asset value, beginning of period | | $ | 10.50 | | | $ | 10.46 | | | $ | 11.54 | | | $ | 12.47 | | | $ | 11.22 | |
| INCOME/(LOSS) FROM INVESTMENT OPERATIONS: | | | | | | | | | | | | | | | | | | | | |
| Net investment income(c) | | | 0.14 | | | | 0.15 | | | | 0.21 | | | | 0.22 | | | | 0.18 | |
| Net realized and unrealized gain/(loss) | | | 1.73 | | | | 0.05 | | | | 0.49 | | | | (0.36 | ) | | | 1.23 | |
| Total from investment operations | | | 1.87 | | | | 0.20 | | | | 0.70 | | | | (0.14 | ) | | | 1.41 | |
| DISTRIBUTIONS: | | | | | | | | | | | | | | | | | | | | |
| From net investment income | | | (0.14 | ) | | | (0.16 | ) | | | (0.20 | ) | | | (0.22 | ) | | | (0.16 | ) |
| From net realized gains | | | (0.00 | )(d) | | | – | | | | (1.58 | ) | | | (0.57 | ) | | | – | |
| Total distributions | | | (0.14 | ) | | | (0.16 | ) | | | (1.78 | ) | | | (0.79 | ) | | | (0.16 | ) |
| Net increase/(decrease) in net asset value | | | 1.73 | | | | 0.04 | | | | (1.08 | ) | | | (0.93 | ) | | | 1.25 | |
| Net asset value, end of year | | $ | 12.23 | | | $ | 10.50 | | | $ | 10.46 | | | $ | 11.54 | | | $ | 12.47 | |
| TOTAL RETURN(e) | | | 17.89 | % | | | 1.95 | % | | | 7.99 | % | | | (1.32 | )% | | | 12.67 | % |
| RATIOS/SUPPLEMENTAL DATA: | | | | | | | | | | | | | | | | | | | | |
| Net assets, end of year (000s) | | $ | 4,275 | | | $ | 3,883 | | | $ | 5,162 | | | $ | 8,244 | | | $ | 13,311 | |
| Ratio of expenses to average net assets excluding fee waivers and reimbursements | | | 0.50 | % | | | 0.50 | % | | | 0.50 | % | | | 0.84 | % | | | 1.33 | % |
| Ratio of expenses to average net assets including fee waivers and reimbursements | | | 0.50 | % | | | 0.50 | % | | | 0.50 | % | | | 0.74 | %(f) | | | 1.15 | % |
| Ratio of net investment income to average net assets | | | 1.16 | % | | | 1.46 | % | | | 2.00 | % | | | 1.78 | % | | | 1.49 | % |
| Portfolio turnover rate(g) | | | 16 | % | | | 20 | % | | | 41 | % | | | 209 | % | | | 56 | % |
| (a) | Prior to December 1, 2017, Investor Class was known as Class A. |
| (b) | Prior to February 28, 2018, the RiverFront Asset Allocation Moderate was known as the RiverFront Moderate Growth & Income Fund. |
| (c) | Calculated using the average shares method. (d) Less than $0.005 or ($0.005) per share. |
| (e) | Total returns are for the period indicated and have not been annualized. Total returns would have been lower had certain expenses not been waived during the period. Returns shown do not reflect the deduction of taxes that a shareholder would pay on Fund distributions or the redemption of Fund shares. |
| (f) | Effective February 28, 2018, pursuant to the Administrative Services Agreement, the Fund pays an annual unitary administrative fee, which is based on the Fund’s average daily net assets, and will no longer pay a management fee or contractually limit the Fund’s total annual expenses. Refer to Note 8. |
| (g) | Portfolio turnover rate for periods less than one full year have not been annualized. |
See Notes to Financial Statements.
RiverFront Asset Allocation Moderate – Class A
Financial Highlights
Selected data for a share of beneficial interest outstanding throughout the periods indicated:
| | | For the Year
Ended
October 31,
2021 | | | For the Year
Ended
October 31,
2020 | | | For the Year
Ended
October 31,
2019 | | | For the Period
June 12, 2018
(Commencement
of Operations) to
October 31, 2018 | |
| Net asset value, beginning of period | | $ | 10.49 | | | $ | 10.45 | | | $ | 11.53 | | | $ | 12.28 | |
| | | | | | | | | | | | | | | | | |
| INCOME FROM INVESTMENT OPERATIONS: | | | | | | | | | | | | | | | | |
| Net investment income(a) | | | 0.13 | | | | 0.15 | | | | 0.20 | | | | 0.11 | |
| Net realized and unrealized gain/(loss) | | | 1.74 | | | | 0.05 | | | | 0.51 | | | | (0.74 | ) |
| Total from investment operations | | | 1.87 | | | | 0.20 | | | | 0.71 | | | | (0.63 | ) |
| | | | | | | | | | | | | | | | | |
| DISTRIBUTIONS: | | | | | | | | | | | | | | | | |
| From net investment income | | | (0.14 | ) | | | (0.16 | ) | | | (0.21 | ) | | | (0.12 | ) |
| From net realized gains | | | (0.00 | )(b) | | | – | | | | (1.58 | ) | | | – | |
| Total distributions | | | (0.14 | ) | | | (0.16 | ) | | | (1.79 | ) | | | (0.12 | ) |
| | | | | | | | | | | | | | | | | |
| Net increase/(decrease) in net asset value | | | 1.73 | | | | 0.04 | | | | (1.08 | ) | | | (0.75 | ) |
| Net asset value, end of year | | $ | 12.22 | | | $ | 10.49 | | | $ | 10.45 | | | $ | 11.53 | |
| TOTAL RETURN(c) | | | 17.91 | % | | | 1.96 | % | | | 8.07 | % | | | (5.15 | )% |
| | | | | | | | | | | | | | | | | |
| RATIOS/SUPPLEMENTAL DATA: | | | | | | | | | | | | | | | | |
| Net assets, end of year (000s) | | $ | 10,998 | | | $ | 7,680 | | | $ | 5,933 | | | $ | 9 | |
| Ratio of expenses to average net assets excluding fee waivers and reimbursements | | | 0.50 | % | | | 0.50 | % | | | 0.50 | % | | | 0.50 | %(d) |
| Ratio of expenses to average net assets including fee waivers and reimbursements | | | 0.50 | % | | | 0.50 | % | | | 0.50 | % | | | 0.50 | %(d) |
| Ratio of net investment income to average net assets | | | 1.15 | % | | | 1.43 | % | | | 1.92 | % | | | 2.44 | %(d) |
| Portfolio turnover rate(e) | | | 16 | % | | | 20 | % | | | 41 | % | | | 209 | % |
| (a) | Calculated using the average shares method. |
| (b) | Less than $0.005 or ($0.005) per share. |
| (c) | Total returns are for the period indicated and have not been annualized. Total returns would have been lower had certain expenses not been waived during the period. Returns shown do not reflect the deduction of taxes that a shareholder would pay on Fund distributions or the redemption of Fund shares. Returns shown exclude any applicable sales charges. |
| (e) | Portfolio turnover rate for periods less than one full year have not been annualized. |
See Notes to Financial Statements.
RiverFront Asset Allocation Moderate – Class C
Financial Highlights
Selected data for a share of beneficial interest outstanding throughout the periods indicated:
| | | For the Year
Ended
October 31,
2021 | | | For the Year
Ended
October 31,
2020 | | | For the Year
Ended
October 31,
2019 | | | For the Year
Ended
October 31,
2018(a) | | | For the Year
Ended
October 31, 2017 | |
| Net asset value, beginning of period | | $ | 10.34 | | | $ | 10.30 | | | $ | 11.39 | | | $ | 12.34 | | | $ | 11.12 | |
| INCOME/(LOSS) FROM INVESTMENT OPERATIONS: | | | | | | | | | | | | | | | | | | | | |
| Net investment income(b) | | | 0.05 | | | | 0.07 | | | | 0.13 | | | | 0.12 | | | | 0.08 | |
| Net realized and unrealized gain/(loss) | | | 1.71 | | | | 0.05 | | | | 0.49 | | | | (0.36 | ) | | | 1.24 | |
| Total from investment operations | | | 1.76 | | | | 0.12 | | | | 0.62 | | | | (0.24 | ) | | | 1.32 | |
| DISTRIBUTIONS: | | | | | | | | | | | | | | | | | | | | |
| From net investment income | | | (0.06 | ) | | | (0.08 | ) | | | (0.13 | ) | | | (0.14 | ) | | | (0.10 | ) |
| From net realized gains | | | (0.00 | )(c) | | | – | | | | (1.58 | ) | | | (0.57 | ) | | | – | |
| Total distributions | | | (0.06 | ) | | | (0.08 | ) | | | (1.71 | ) | | | (0.71 | ) | | | (0.10 | ) |
| Net increase/(decrease) in net asset value | | | 1.70 | | | | 0.04 | | | | (1.09 | ) | | | (0.95 | ) | | | 1.22 | |
| Net asset value, end of year | | $ | 12.04 | | | $ | 10.34 | | | $ | 10.30 | | | $ | 11.39 | | | $ | 12.34 | |
| TOTAL RETURN(d) | | | 17.02 | % | | | 1.21 | % | | | 7.23 | % | | | (2.16 | )% | | | 11.94 | % |
| RATIOS/SUPPLEMENTAL DATA: | | | | | | | | | | | | | | | | | | | | |
| Net assets, end of year (000s) | | $ | 12,232 | | | $ | 16,353 | | | $ | 26,831 | | | $ | 40,792 | | | $ | 51,231 | |
| Ratio of expenses to average net assets excluding fee waivers and reimbursements | | | 1.25 | % | | | 1.25 | % | | | 1.25 | % | | | 1.56 | % | | | 2.08 | % |
| Ratio of expenses to average net assets including fee waivers and reimbursements | | | 1.25 | % | | | 1.25 | % | | | 1.25 | % | | | 1.47 | %(e) | | | 1.90 | % |
| Ratio of net investment income to average net assets | | | 0.41 | % | | | 0.72 | % | | | 1.27 | % | | | 1.03 | % | | | 0.70 | % |
| Portfolio turnover rate(f) | | | 16 | % | | | 20 | % | | | 41 | % | | | 209 | % | | | 56 | % |
| (a) | Prior to February 28, 2018, the RiverFront Asset Allocation Moderate was known as the RiverFront Moderate Growth & Income Fund. |
| (b) | Calculated using the average shares method. |
| (c) | Less than $0.005 or ($0.005) per share. |
| (d) | Total returns are for the period indicated and have not been annualized. Total returns would have been lower had certain expenses not been waived during the period. Returns shown do not reflect the deduction of taxes that a shareholder would pay on Fund distributions or the redemption of Fund shares. Returns shown exclude any applicable sales charges. |
| (e) | Effective February 28, 2018, pursuant to the Administrative Services Agreement, the Fund pays an annual unitary administrative fee, which is based on the Fund’s average daily net assets, and will no longer pay a management fee or contractually limit the Fund’s total annual expenses. Refer to Note 8. |
| (f) | Portfolio turnover rate for periods less than one full year have not been annualized. |
See Notes to Financial Statements.
RiverFront Asset Allocation Moderate – Class I
Financial Highlights
Selected data for a share of beneficial interest outstanding throughout the periods indicated:
| | | For the Year
Ended
October 31,
2021 | | | For the Year
Ended
October 31,
2020 | | | For the Year
Ended
October 31,
2019 | | | For the Year
Ended
October 31,
2018(a) | | | For the Year
Ended
October 31, 2017 | |
| Net asset value, beginning of period | | $ | 10.51 | | | $ | 10.47 | | | $ | 11.54 | | | $ | 12.48 | | | $ | 11.21 | |
| INCOME/(LOSS) FROM INVESTMENT OPERATIONS: | | | | | | | | | | | | | | | | | | | | |
| Net investment income(b) | | | 0.16 | | | | 0.18 | | | | 0.23 | | | | 0.25 | | | | 0.20 | |
| Net realized and unrealized gain/(loss) | | | 1.74 | | | | 0.04 | | | | 0.50 | | | | (0.37 | ) | | | 1.25 | |
| Total from investment operations | | | 1.90 | | | | 0.22 | | | | 0.73 | | | | (0.12 | ) | | | 1.45 | |
| DISTRIBUTIONS: | | | | | | | | | | | | | | | | | | | | |
| From net investment income | | | (0.17 | ) | | | (0.18 | ) | | | (0.22 | ) | | | (0.25 | ) | | | (0.18 | ) |
| From net realized gains | | | (0.00 | )(c) | | | – | | | | (1.58 | ) | | | (0.57 | ) | | | – | |
| Total distributions | | | (0.17 | ) | | | (0.18 | ) | | | (1.80 | ) | | | (0.82 | ) | | | (0.18 | ) |
| Net increase/(decrease) in net asset value | | | 1.73 | | | | 0.04 | | | | (1.07 | ) | | | (0.94 | ) | | | 1.27 | |
| Net asset value, end of year | | $ | 12.24 | | | $ | 10.51 | | | $ | 10.47 | | | $ | 11.54 | | | $ | 12.48 | |
| TOTAL RETURN(d) | | | 18.14 | % | | | 2.19 | % | | | 8.36 | % | | | (1.16 | )% | | | 13.05 | % |
| RATIOS/SUPPLEMENTAL DATA: | | | | | | | | | | | | | | | | | | | | |
| Net assets, end of year (000s) | | $ | 21,339 | | | $ | 19,030 | | | $ | 25,544 | | | $ | 28,228 | | | $ | 30,913 | |
| Ratio of expenses to average net assets excluding fee waivers and reimbursements | | | 0.25 | % | | | 0.25 | % | | | 0.25 | % | | | 0.56 | % | | | 1.08 | % |
| Ratio of expenses to average net assets including fee waivers and reimbursements | | | 0.25 | % | | | 0.25 | % | | | 0.25 | % | | | 0.47 | %(e) | | | 0.90 | % |
| Ratio of net investment income to average net assets | | | 1.40 | % | | | 1.71 | % | | | 2.25 | % | | | 2.02 | % | | | 1.71 | % |
| Portfolio turnover rate(f) | | | 16 | % | | | 20 | % | | | 41 | % | | | 209 | % | | | 56 | % |
| (a) | Prior to February 28, 2018, the RiverFront Asset Allocation Moderate was known as the RiverFront Moderate Growth & Income Fund. |
| (b) | Calculated using the average shares method. |
| (c) | Less than $0.005 or ($0.005) per share. |
| (d) | Total returns are for the period indicated and have not been annualized. Total returns would have been lower had certain expenses not been waived during the period. Returns shown do not reflect the deduction of taxes that a shareholder would pay on Fund distributions or the redemption of Fund shares. |
| (e) | Effective February 28, 2018, pursuant to the Administrative Services Agreement, the Fund pays an annual unitary administrative fee, which is based on the Fund’s average daily net assets, and will no longer pay a management fee or contractually limit the Fund’s total annual expenses. Refer to Note 8. |
| (f) | Portfolio turnover rate for periods less than one full year have not been annualized. |
See Notes to Financial Statements.
| Notes to Financial Statements | |
1. ORGANIZATION
Financial Investors Trust (the “Trust”), a Delaware statutory trust, is an open-end management investment company registered under the Investment Company Act of 1940, as amended (“1940 Act”). The Trust consists of multiple separate portfolios or series. This annual report includes the financial statements and financial highlights of the following 11 funds: ALPS | CoreCommodity Management CompleteCommodities® Strategy Fund, ALPS | Kotak India Growth Fund, ALPS | Red Rocks Global Opportunity Fund, Clough China Fund, RiverFront Asset Allocation Aggressive, RiverFront Asset Allocation Growth & Income, RiverFront Asset Allocation Moderate, ALPS | Smith Total Return Bond Fund, ALPS | Smith Short Duration Bond Fund, ALPS | Smith Balanced Opportunity Fund, and ALPS | Smith Credit Opportunities Fund (each, a “Fund” and collectively, the “Funds”). Prior to March 31, 2020, the ALPS | Red Rocks Global Opportunity Fund was known as the ALPS | Red Rocks Listed Private Equity Fund.
The ALPS | CoreCommodity Management CompleteCommodities® Strategy Fund seeks to maximize real returns (returns after inflation), consistent with prudent investment management. ALPS | Kotak India Growth Fund’s investment goal is long-term capital appreciation. The ALPS | Red Rocks Global Opportunity Fund seeks to maximize total return, which consists of appreciation on its investments and a variable income stream. The Clough China Fund seeks to provide investors with long-term capital appreciation. Effective February 28, 2018, the RiverFront Asset Allocation Aggressive seeks to achieve long-term capital appreciation, RiverFront Asset Allocation Growth & Income seeks to achieve long-term growth and income, the RiverFront Asset Allocation Moderate has two primary investment objectives- it seeks (1) to provide a level of current income that exceeds the average yield on U.S. stocks, and (2) growth of capital. The ALPS | Smith Total Return Bond Fund capital seeks to obtain maximum total return, consistent with preservation of capital. The ALPS | Smith Short Duration Bond Fund seeks as high a level of current income as is consistent with preservation of capital. The ALPS | Smith Balanced Opportunity Fund seeks long-term capital growth, consistent with presercation of capital and balanced by current income. The ALPS | Smith Credit Opportunities Fund seeks to obtain maximum risk-adjusted return with a secondary focus on high current income.
The classes of each Fund differ principally in the applicable distribution and shareholder service fees. Shareholders of each class also bear certain expenses that pertain to that particular class. All shareholders bear the common expenses of the Fund and earn income and realized gains/losses from the Fund pro rata based on the average daily net assets of each class, without distinction between share classes. Dividends to shareholders are determined separately for each class based on income and expenses allocable to each class. Realized gain distributions to shareholders are allocated to each class pro rata based on the shares outstanding of each class on the date of distribution. Differences in per share dividend rates generally result from differences in separate class expenses, including distribution and shareholder service fees, if applicable.
Basis of Consolidation for the ALPS | CoreCommodity Management CompleteCommodities® Strategy Fund
CoreCommodity Management Cayman Commodity Fund Ltd. (the “Subsidiary”), a Cayman Islands exempted company, was incorporated on April 23, 2010 and is a wholly owned subsidiary of the ALPS | CoreCommodity Management CompleteCommodities® Strategy Fund (the “CoreCommodity Fund”). All intercompany transactions have been eliminated upon consolidation. The Subsidiary acts as an investment vehicle for the CoreCommodity Fund in order to effect certain commodity-related investments on behalf of the CoreCommodity Fund. CoreCommodity Fund is the sole shareholder of the Subsidiary pursuant to a subscription agreement dated as of June 14, 2010, and it is intended that the CoreCommodity Fund will remain the sole shareholder and will continue to wholly own and control the Subsidiary. Under the Articles of Association of the Subsidiary, shares issued by the Subsidiary confer upon a shareholder the right to vote at general meetings of the Subsidiary and certain rights in connection with any winding-up or repayment of capital, as well as the right to participate in the profits or assets of the Subsidiary. The CoreCommodity Fund may invest up to 25% of its total assets in shares of the Subsidiary. As a wholly owned subsidiary of the CoreCommodity Fund, the financial statements of the Subsidiary are included in the consolidated financial statements and financial highlights of the CoreCommodity Fund. All investments held by the Subsidiary are disclosed in the accounts of the CoreCommodity Fund. As of October 31, 2021, net assets of the CoreCommodity Fund were $1,264,560,427 of which $269,606,210 or 21.32%, represented the CoreCommodity Fund’s ownership of all issued shares and voting rights of the Subsidiary.
2. SIGNIFICANT ACCOUNTING POLICIES
The following is a summary of significant accounting policies consistently followed by each Fund in the preparation of its financial statements. Each Fund is considered an investment company for financial reporting purposes, and follows accounting policies in conformity with accounting principles generally accepted in the United States of America (“U.S. GAAP”), including policies specific to investment companies. The preparation of financial statements in conformity with U.S. GAAP requires management to make certain estimates and assumptions that affect the reported amounts of assets and liabilities and disclosures of contingent assets and liabilities at the date of the financial statements and the reported amounts of revenue and expenses during the period. Actual results could differ from those estimates. The following is a summary of significant accounting policies consistently followed by the Funds and subsidiaries, as applicable, in preparation of their financial statements. The Funds are considered investment companies under U.S. GAAP and follows the accounting and reporting guidance applicable to investment companies in the Financial Accounting Standards Board Accounting Standards Codification Topic 946.
| Notes to Financial Statements | |
Investment Valuation: The Funds generally value their securities based on market prices determined at the close of regular trading on the New York Stock Exchange (“NYSE”), normally 4:00 p.m. Eastern Time, on each day the NYSE is open for trading. For equity securities and mutual funds that are traded on an exchange, the market price is usually the closing sale or official closing price on that exchange.
The market price for debt obligations is generally the price supplied by an independent third-party pricing service approved by the Board, which may use a matrix, formula or other objective method that takes into consideration quotations from dealers, market transactions in comparable investments, market indices and yield curves. If vendors are unable to supply a price, or if the price supplied is deemed to be unreliable, the market price may be determined using quotations received from one or more brokers-dealers that make a market in the security. Investments in non-exchange traded funds are fair valued at their respective net asset values. Bonds may be purchased and held as odd lots. Pricing vendors generally value securities assuming orderly transactions of institutional round lot sizes, but a Fund may hold or transact in such securities in smaller, odd lot sizes. Special valuation considerations may apply with respect to a Fund’s odd-lot positions, as the Fund may receive different prices when it sells such positions than it would receive for sales of institutional round lot positions. The ALPS | Smith Total Return Bond Fund, the ALPS | Smith Short Duration Bond Fund, ALPS | Smith Balanced Opportunity Fund, and ALPS | Smith Credit Opportunities Fund have odd lot pricing policies it employs to value odd lot securities.
Futures contracts that are listed or traded on a national securities exchange, commodities exchange, contract market or comparable over the counter market, and that are freely transferable, are valued at their closing settlement price on the exchange on which they are primarily traded or based upon the current settlement price for a like instrument acquired on the day on which the instrument is being valued. A settlement price may not be used if the market makes a limit move with respect to a particular commodity. Over-the-counter swap contracts are valued based on quotes received from independent pricing services or one or more dealers that make markets in such investments.
Option contracts are valued using the National Best Bid and Offer price (“NBBO”). In the event there is no NBBO price available, option contracts are valued at the mean between the last bid and ask.
For ALPS | Kotak India Growth Fund, ALPS | Red Rocks Global Opportunity Fund, and Clough China Fund, who hold equity securities that are primarily traded on foreign securities exchanges, such securities are valued at the closing values of such securities on their respective foreign exchanges, except when an event occurs subsequent to the close of the foreign exchange and the close of the NYSE that was likely to have changed such value. In such an event, the fair value of those securities are determined in good faith through consideration of other factors in accordance with procedures established by and under the general supervision of the Board. The Funds will use a fair valuation model provided by an independent pricing service, which is intended to reflect fair value when a security’s value or a meaningful portion of the Fund’s portfolio is believed to have been materially affected by an valuation event that has occurred between the close of the exchange or market on which the security is traded and the close of the regular trading day on the NYSE.
Forward currency exchange contracts have a value determined by the current foreign currency exchange forward rates. The foreign currency exchange forward rates are calculated using an automated system that estimates rates on the basis of the current day foreign currency exchange rates and forward foreign currency exchange rates supplied by a pricing service. Foreign exchange rates and forward foreign currency exchange rates may generally be obtained at the close of the NYSE, normally 4:00 p.m. Eastern Time.
When such prices or quotations are not available, or when the Fair Value Committee appointed by the Board believes that they are unreliable, securities may be priced using fair value procedures approved by the Board. The fair valuation policies and procedures (“FV Procedures”) have been adopted by the Board for the fair valuation of portfolio assets held by the Fund(s) in the event that (1) market quotations for the current price of a portfolio security or asset are not readily available, or (2) available market quotations that would otherwise be used to value a portfolio security or asset in accordance with the Fund’s Pricing Procedures appear to be unreliable. The Pricing Procedures reflect certain pricing methodologies (or “logics”) that are not “readily available market quotations” and thus are viewed and treated as fair valuations. The Fair Value Committee routinely meets to discuss fair valuations of portfolio securities and other instruments held by the Fund(s).
| Notes to Financial Statements | |
Fair Value Measurements: The Funds disclose the classification of their fair value measurements following a three-tier hierarchy based on the inputs used to measure fair value. Inputs refer broadly to the assumptions that market participants would use in pricing the asset or liability, including assumptions about risk. Inputs may be observable or unobservable. Observable inputs reflect the assumptions market participants would use in pricing the asset or liability that are developed based on market data obtained from sources independent of the reporting entity. Unobservable inputs reflect the reporting entity’s own assumptions about the assumptions market participants would use in pricing the asset or liability that are developed based on the best information available.
Various inputs are used in determining the value of each Fund’s investments as of the end of the reporting period. When inputs used fall into different levels of the fair value hierarchy, the level in the hierarchy within which the fair value measurement falls is determined based on the lowest level input that is significant to the fair value measurement in its entirety. The designated input levels are not necessarily an indication of the risk or liquidity associated with these investments. These inputs are categorized in the following hierarchy under applicable financial accounting standards:
| Level 1 – | Unadjusted quoted prices in active markets for identical investments, unrestricted assets or liabilities that a Fund has the ability to access at the measurement date; |
| Level 2 – | Quoted prices which are not active, quoted prices for similar assets or liabilities in active markets or inputs other than quoted prices that are observable (either directly or indirectly) for substantially the full term of the asset or liability; and |
| Level 3 – | Significant unobservable prices or inputs (including the Fund’s own assumptions in determining the fair value of investments) where there is little or no market activity for the asset or liability at the measurement date. |
The following is a summary of each Fund’s investments/financial instruments in the fair value hierarchy as of October 31, 2021:
| Investments in Securities at Value | | Level 1 - Unadjusted
Quoted Prices | | | Level 2 - Other Significant Observable Inputs | | | Level 3 - Significant
Unobservable Inputs | | | Total | |
| ALPS | CoreCommodity Management CompleteCommodities® Strategy Fund | |
| Common Stocks(a) | | | | | | | | | | | | | | | | |
| United States | | $ | 157,740,512 | | | $ | 103 | | | $ | – | | | $ | 157,740,615 | |
| Other | | | 219,175,700 | | | | – | | | | – | | | | 219,175,700 | |
| Master Limited Partnerships(a) | | | 468,188 | | | | – | | | | – | | | | 468,188 | |
| Government Bonds | | | – | | | | 760,394,569 | | | | – | | | | 760,394,569 | |
| Total | | $ | 377,384,400 | | | $ | 760,394,672 | | | $ | – | | | $ | 1,137,779,072 | |
| Other Financial Instruments | | | | | | | | | | | | | | | | |
| Assets | | | | | | | | | | | | | | | | |
| Futures Contracts | | $ | 9,014,992 | | | $ | – | | | $ | – | | | $ | 9,014,992 | |
| Total Return Swap Contracts | | | – | | | | 10 | | | | – | | �� | | 10 | |
| Liabilities | | | | | | | | | | | | | | | | |
| Futures Contracts | | $ | (10,937,276 | ) | | $ | – | | | $ | – | | | $ | (10,937,276 | ) |
| Total Return Swap Contracts | | $ | – | | | $ | (275 | ) | | $ | – | | | $ | (275 | ) |
| Total | | $ | (1,922,284 | ) | | $ | (265 | ) | | $ | – | | | $ | (1,922,549 | ) |
| Notes to Financial Statements | |
| Investments in Securities at Value | | Level 1 - Unadjusted
Quoted Prices | | | Level 2 - Other Significant
Observable Inputs | | | Level 3 - Significant
Unobservable Inputs | | | Total | |
| ALPS | Kotak India Growth Fund | | | | | |
| Common Stocks | | | | | | | | | | | | | | | | |
| Communication Services | | $ | 215,039 | | | $ | 15,236,042 | | | $ | – | | | $ | 15,451,081 | |
| Consumer Discretionary | | | 2,295,715 | | | | 34,410,159 | | | | – | | | | 36,705,874 | |
| Consumer Staples | | | – | | | | 21,818,064 | | | | – | | | | 21,818,064 | |
| Energy | | | – | | | | 26,013,647 | | | | – | | | | 26,013,647 | |
| Financials | | | 18,124,577 | | | | 104,366,068 | | | | – | | | | 122,490,645 | |
| Health Care | | | 3,495,514 | | | | 24,545,626 | | | | – | | | | 28,041,140 | |
| Industrials | | | 2,323,893 | | | | 28,961,858 | | | | – | | | | 31,285,751 | |
| Information Technology | | | 12,111,140 | | | | 52,828,546 | | | | – | | | | 64,939,686 | |
| Materials | | | – | | | | 30,863,687 | | | | – | | | | 30,863,687 | |
| Real Estate | | | – | | | | 8,400,646 | | | | – | | | | 8,400,646 | |
| Utilities | | | – | | | | 3,468,836 | | | | – | | | | 3,468,836 | |
| Total | | $ | 38,565,878 | | | $ | 350,913,179 | | | $ | – | | | $ | 389,479,057 | |
| Investments in Securities at Value | | Level 1 - Unadjusted
Quoted Prices | | | Level 2 - Other Significant
Observable Inputs | | | Level 3 - Significant
Unobservable Inputs | | | Total | |
| ALPS | Smith Short Duration Bond Fund | | | | | |
| Collateralized Mortgage Obligations | | $ | – | | | $ | 1,951,954 | | | $ | – | | | $ | 1,951,954 | |
| Commercial Mortgage-Backed Securities | | | – | | | | 1,007,108 | | | | – | | | | 1,007,108 | |
| Mortgage-Backed Securities | | | – | | | | 11,797,222 | | | | – | | | | 11,797,222 | |
| Corporate Bonds | | | – | | | | 416,552,405 | | | | – | | | | 416,552,405 | |
| Government Bonds | | | – | | | | 82,908,623 | | | | – | | | | 82,908,623 | |
| Municipal Bonds | | | – | | | | 963,293 | | | | – | | | | 963,293 | |
| Short Term Investments | | | 594,676 | | | | – | | | | – | | | | 594,676 | |
| Total | | $ | 594,676 | | | $ | 515,180,605 | | | $ | – | | | $ | 515,775,281 | |
| Investments in Securities at Value | | Level 1 - Unadjusted
Quoted Prices | | | Level 2 - Other Significant
Observable Inputs | | | Level 3 - Significant
Unobservable Inputs | | | Total | |
| ALPS | Smith Total Return Bond Fund | | |
| Collateralized Mortgage Obligations | | $ | – | | | $ | 127,528,645 | | | $ | – | | | $ | 127,528,645 | |
| Commercial Mortgage-Backed Securities | | | – | | | | 45,099,063 | | | | – | | | | 45,099,063 | |
| Mortgage-Backed Securities | | | – | | | | 100,867,620 | | | | – | | | | 100,867,620 | |
| Corporate Bonds | | | – | | | | 1,002,857,398 | | | | – | | | | 1,002,857,398 | |
| Government Bonds | | | – | | | | 476,975,431 | | | | – | | | | 476,975,431 | |
| Preferred Stock | | | 20,400,841 | | | | – | | | | – | | | | 20,400,841 | |
| Short Term Investments | | | 4,746,609 | | | | – | | | | – | | | | 4,746,609 | |
| Total | | $ | 25,147,450 | | | $ | 1,753,328,157 | | | $ | – | | | $ | 1,778,475,607 | |
| Investments in Securities at Value | | Level 1 - Unadjusted
Quoted Prices | | | Level 2 - Other Significant
Observable Inputs | | | Level 3 - Significant
Unobservable Inputs | | | Total | |
| ALPS | Smith Credit Opportunities Fund | | | | | |
| Common Stocks(a) | | $ | 3,852,738 | | | $ | – | | | $ | – | | | $ | 3,852,738 | |
| Exchange Traded Funds | | | 6,927,865 | | | | – | | | | – | | | | 6,927,865 | |
| Collateralized Mortgage Obligations | | | – | | | | 717,354 | | | | – | | | | 717,354 | |
| Mortgage-Backed Securities | | | – | | | | 2,431,363 | | | | – | | | | 2,431,363 | |
| Corporate Bonds | | | – | | | | 266,509,083 | | | | – | | | | 266,509,083 | |
| Government Bonds | | | – | | | | 11,473,991 | | | | – | | | | 11,473,991 | |
| Preferred Stock | | | 11,202,552 | | | | – | | | | – | | | | 11,202,552 | |
| Short Term Investments | | | 2,035,407 | | | | – | | | | – | | | | 2,035,407 | |
| Total | | $ | 24,018,562 | | | $ | 281,131,791 | | | $ | – | | | $ | 305,150,353 | |
| Notes to Financial Statements | |
| Investments in Securities at Value | | Level 1 - Unadjusted
Quoted Prices | | | Level 2 - Other Significant
Observable Inputs | | | Level 3 - Significant
Unobservable Inputs | | | Total | |
| ALPS | Smith Balanced Opportunity Fund | | | | | |
| Common Stocks(a) | | $ | 24,210,306 | | | $ | – | | | $ | – | | | $ | 24,210,306 | |
| Collateralized Mortgage Obligations | | | – | | | | 1,464,527 | | | | – | | | | 1,464,527 | |
| Commercial Mortgage-Backed Securities | | | – | | | | 22,726 | | | | – | | | | 22,726 | |
| Mortgage-Backed Securities | | | – | | | | 966,422 | | | | – | | | | 966,422 | |
| Corporate Bonds | | | – | | | | 5,893,528 | | | | – | | | | 5,893,528 | |
| Government Bonds | | | – | | | | 5,376,877 | | | | – | | | | 5,376,877 | |
| Preferred Stock | | | 133,749 | | | | – | | | | – | | | | 133,749 | |
| Short Term Investments | | | 2,060,779 | | | | – | | | | – | | | | 2,060,779 | |
| Total | | $ | 26,404,834 | | | $ | 13,724,080 | | | $ | – | | | $ | 40,128,914 | |
| Investments in Securities at Value | | Level 1 - Unadjusted
Quoted Prices | | | Level 2 - Other Significant
Observable Inputs | | | Level 3 - Significant
Unobservable Inputs | | | Total | |
| ALPS | Red Rocks Global Opportunity Fund | | | | | |
| Closed-End Funds | | $ | 10,670,987 | | | $ | 10,982,139 | | | $ | – | | | $ | 21,653,126 | |
| Common Stocks | | | | | | | | | | | | | | | | |
| Communications | | | 9,279,842 | | | | – | | | | – | | | | 9,279,842 | |
| Consumer, Cyclical | | | 1,843,275 | | | | 3,879,345 | | | | – | | | | 5,722,620 | |
| Consumer, Non-Cyclical | | | 7,731,389 | | | | – | | | | – | | | | 7,731,389 | |
| Diversified | | | – | | | | 885,110 | | | | – | | | | 885,110 | |
| Financials | | | 31,189,043 | | | | 24,373,350 | | | | – | | | | 55,562,393 | |
| Industrials | | | 1,792,678 | | | | – | | | | – | | | | 1,792,678 | |
| Technology | | | 4,432,281 | | | | – | | | | – | | | | 4,432,281 | |
| Utilities | | | 1,735,485 | | | | – | | | | – | | | | 1,735,485 | |
| Short-Term Investments | | | 3,128,390 | | | | – | | | | – | | | | 3,128,390 | |
| Total | | $ | 71,803,370 | | | $ | 40,119,944 | | | $ | – | | | $ | 111,923,314 | |
| Investments in Securities at Value | | Level 1 - Unadjusted
Quoted Prices | | | Level 2 - Other Significant Observable Inputs | | | Level 3 - Significant
Unobservable Inputs | | | Total | |
| Clough China Fund | | | | |
| Common Stocks | | | | | | | | | | | | | | | | |
| Communications | | $ | 438,048 | | | $ | 4,366,044 | | | $ | – | | | $ | 4,804,092 | |
| Consumer Discretionary | | | 6,678,882 | | | | 6,171,441 | | | | – | | | | 12,850,323 | |
| Financials | | | – | | | | 4,168,829 | | | | – | | | | 4,168,829 | |
| Health Care | | | – | | | | 2,331,790 | | | | – | | | | 2,331,790 | |
| Industrials | | | – | | | | 2,854,632 | | | | – | | | | 2,854,632 | |
| Materials | | | – | | | | 766,348 | | | | – | | | | 766,348 | |
| Real Estate | | | – | | | | 1,199,545 | | | | – | | | | 1,199,545 | |
| Technology | | | – | | | | 1,374,581 | | | | – | | | | 1,374,581 | |
| Utilities | | | – | | | | 1,168,668 | | | | – | | | | 1,168,668 | |
| Short Term Investments | | | 4,809,969 | | | | – | | | | – | | | | 4,809,969 | |
| Total | | $ | 11,926,899 | | | $ | 24,401,878 | | | $ | – | | | $ | 36,328,777 | |
| Other Financial Instruments | | | | | | | | | | | | | | | | |
| Assets: | | | | | | | | | | | | | | | | |
| Total Return Swap Contracts | | $ | – | | | $ | 992,437 | | | $ | – | | | $ | 992,437 | |
| Liabilities: | | | | | | | | | | | | | | | | |
| Total Return Swap Contracts | | | – | | | | (411,885 | ) | | | – | | | | (411,885 | ) |
| Total | | $ | – | | | $ | 580,552 | | | $ | – | | | $ | 580,552 | |
| Notes to Financial Statements | |
| Investments in Securities at Value | | Level 1 - Unadjusted
Quoted Prices | | | Level 2 - Other Significant
Observable Inputs | | | Level 3 - Significant
Unobservable Inputs | | | Total | |
| RiverFront Asset Allocation Aggressive | | | | | | |
| Exchange Traded Funds | | $ | 26,925,597 | | | $ | – | | | $ | – | | | $ | 26,925,597 | |
| Short-Term Investments | | | 834,056 | | | | – | | | | – | | | | 834,056 | |
| Total | | $ | 27,759,653 | | | $ | – | | | $ | – | | | $ | 27,759,653 | |
| Investments in Securities at Value | | Level 1 - Unadjusted
Quoted Prices | | | Level 2 -
Other Significant
Observable Inputs | | | Level 3 - Significant
Unobservable Inputs | | | Total | |
| RiverFront Asset Allocation Growth & Income | | | | | | | | | |
| Exchange Traded Funds | | $ | 63,268,586 | | | $ | – | | | $ | – | | | $ | 63,268,586 | |
| Short-Term Investments | | | 981,362 | | | | – | | | | – | | | | 981,362 | |
| Total | | $ | 64,249,948 | | | $ | – | | | $ | – | | | $ | 64,249,948 | |
| Investments in Securities at Value | | Level 1 - Unadjusted
Quoted Prices | | | Level 2 -
Other Significant
Observable Inputs | | | Level 3 - Significant
Unobservable Inputs | | | Total | |
| RiverFront Asset Allocation Moderate | | | | | | | | | |
| Exchange Traded Funds | | $ | 48,214,067 | | | $ | – | | | $ | – | | | $ | 48,214,067 | |
| Short-Term Investments | | | 713,426 | | | | – | | | | – | | | | 713,426 | |
| Total | | $ | 48,927,493 | | | $ | – | | | $ | – | | | $ | 48,927,493 | |
| (a) | For detailed descriptions of country, sector and/or industry, see the accompanying Statement of Investments or Consolidated Statement of Investments. |
Fund and Class Expenses: Some expenses of the Trust can be directly attributed to a Fund or a specific share class of a Fund. Expenses which cannot be directly attributed are apportioned among all Funds in the Trust based on average net assets of each share class within a Fund.
Federal Income Taxes: The Funds comply with the requirements under Subchapter M of the Internal Revenue Code of 1986, as amended (the “Code”) applicable to regulated investment companies and intend to distribute substantially all of their net taxable income and net capital gains, if any, each year. The Funds are not subject to income taxes to the extent such distributions are made.
The Funds file U.S. federal, state, and local tax returns as required. The Funds’ tax returns are subject to examination by the relevant tax authorities until expiration of the applicable statute of limitations which is generally three years after the filing of the tax return, but may extend to four years in certain jurisdictions. Tax returns for open years have incorporated no uncertain tax positions that require a provision for income taxes.
Distributions to Shareholders: Each Fund, except, RiverFront Asset Allocation Growth & Income, RiverFront Asset Allocation Moderate, ALPS | Smith Total Return Bond Fund, ALPS | Smith Short Duration Bond Fund, ALPS | Smith Balanced Opportunity Fund, and ALPS | Smith Credit Opportunities Fund, normally pays dividends and distributes capital gains, if any, on an annual basis. RiverFront Asset Allocation Growth & Income and RiverFront Asset Allocation Moderate normally pay dividends, if any, on a quarterly basis and distribute capital gains annually. ALPS | Smith Total Return Bond Fund, ALPS | Smith Short Duration Bond Fund, ALPS | Smith Balanced Opportunity Fund, and ALPS | Smith Credit Opportunities Fund declare and distribute dividends, if any, on a monthly basis and capital gains, if any, on at least an annual basis. Income dividend distributions are derived from interest, dividends, and other income a Fund receives from its investments, including distributions of short-term capital gains. Capital gain distributions are derived from gains realized when a Fund sells a security it has owned for more than a year or from long-term capital gain distributions from underlying investments. Each Fund may make additional distributions and dividends at other times if its portfolio manager or managers believe doing so may be necessary for the Fund to avoid or reduce taxes.
Commodity-Linked Notes: The ALPS | CoreCommodity Management CompleteCommodities® Strategy Fund may invest in commodity-linked notes which are derivative instruments that have characteristics of a debt security and of a commodity-linked derivative. A commodity-linked note typically provides for interest payments and a principal payment at maturity linked to the price movement of the underlying commodity, commodity index or commodity futures or option contract. Commodity-linked notes may be principal protected, partially protected, or offer no principal protection. The value of these notes will rise and fall in response to changes in the underlying commodity or related index or investment. These notes are often leveraged, increasing the volatility of each note’s value relative to the change in the underlying linked index. Commodity index-linked investments may be more volatile and less liquid than the underlying index and their value may be affected by the performance of the commodities as well as other factors, including liquidity, quality, maturity and other economic variables. Commodity-linked notes are typically
| Notes to Financial Statements | |
issued by a bank or other financial institution and are sometimes referred to as structured notes because the terms of the notes may be structured by the issuer and the purchaser of the notes to accommodate the specific investment requirements of the purchaser.
Exchange Traded Funds (ETFs): Each Fund may invest in shares of ETFs and other similar instruments if the investment manager chooses to adjust a Fund’s exposure to the general market or industry sectors and to manage a Fund’s risk exposure. ETFs differ from traditional index funds in that their shares are listed on a securities exchange and can be traded intraday. ETF shares are shares of exchange traded investment companies that are registered under the 1940 Act and hold a portfolio of common stocks designed to track the performance of a particular index. Limitations of the 1940 Act may prohibit a Fund from acquiring more than 3% of the outstanding shares of certain ETFs. Instruments that are similar to ETFs represent beneficial ownership interests in specific “baskets” of stocks of companies within a particular industry sector or group. These securities may also be exchange traded, but unlike ETFs, the issuers of these securities are not registered as investment companies.
The portfolio manager may decide to purchase or sell short ETF shares or options on ETF shares for the same reasons it would purchase or sell (and as an alternative to purchasing or selling) futures contracts – to obtain exposure to the stock market or a particular segment of the stock market, or to hedge a Fund’s portfolio against such exposures. Depending on the market, the holding period and other factors, the use of ETF shares and options thereon can be less costly than the use of index options or stock index futures. In addition, ETF shares and options thereon can typically be purchased in smaller amounts than are available for futures contracts and can offer exposure to market sectors and styles for which there is no suitable or liquid futures contract.
Investment Transactions and Investment Income: Investment transactions are accounted for on the date the investments are purchased or sold (trade date basis). Net realized gains and losses from investment transactions are reported on an identified cost basis. Interest income, which includes accretion of discounts and amortization of premiums, is accrued and recorded as earned. Dividend income is recognized on the ex-dividend date or for certain foreign securities, as soon as information is available to each Fund.
Cash Management Transactions: ALPS/ Kotak India Growth Fund subscribes to the Brown Brothers Harriman & Co. (“BBH”) Cash Management Service (“CMS”), whereby cash balances are automatically swept into overnight offshore demand deposits with either the BBH Grand Cayman branch or a branch of a pre-approved commercial bank. This fully automated program allows the Fund to earn interest on cash balances. Excess cash with deposit institutions domiciled outside of the U.S. are subject to sovereign actions in the jurisdiction of the deposit institution including, but not limited to, freeze, seizure or diminution. Cash balances in the BBH CMS are included on the Statement of Assets and Liabilities under Cash and Foreign currency, at value.
As of October 31, 2021, the Fund has the following cash balances participating in the BBH CMS:
Fund
ALPS/ Kotak India Growth Fund $11,657,040
As of October 31, 2021, the Fund did not have any foreign cash balances participating in the BBH CMS.
Foreign Securities: Each Fund may directly purchase securities of foreign issuers. Investing in securities of foreign issuers involves special risks not typically associated with investing in securities of U.S. issuers. The risks include possible reevaluation of currencies, the inability to repatriate foreign currency, less complete financial information about companies and possible future adverse political and economic developments.
Moreover, securities of many foreign issuers and their markets may be less liquid and their prices more volatile than those of securities of comparable U.S. issuers.
Foreign Currency Translation: The books and records of the Funds are maintained in U.S. dollars. Investment valuations and other assets and liabilities initially expressed in foreign currencies are converted each business day into U.S. dollars based upon current exchange rates. The portion of realized and unrealized gains or losses on investments due to fluctuations in foreign currency exchange rates is not separately disclosed and is included in realized and unrealized gains or losses on investments, when applicable.
Foreign Currency Spot Contracts: The Funds may enter into foreign currency spot contracts to facilitate transactions in foreign securities or to convert foreign currency receipts into U.S. dollars. A foreign currency spot contract is an agreement between two parties to buy and sell currencies at the current market rate, for settlement generally within two business days. The U.S. dollar value of the contracts is determined using current currency exchange rates supplied by a pricing service. The contract is marked-to-market daily for settlements beyond one day and any change in market value is recorded as an unrealized gain or loss. When the contract is closed, the Fund records a realized gain or loss equal to the difference between the value on the open and close date. Losses may arise from changes in the value of the foreign currency, or if the counterparties do not
| Notes to Financial Statements | |
perform under the contract’s terms. The maximum potential loss from such contracts is the aggregate face value in U.S. dollars at the time the contract was opened.
Real Estate Investment Trusts (“REITs”): The Funds may invest a portion of their assets in REITs and are subject to certain risks associated with direct investment in REITs. REITs may be affected by changes in the value of their underlying properties and by defaults by borrowers or tenants. REITs depend generally on their ability to generate cash flow to make distributions to shareowners, and certain REITs have self-liquidation provisions by which mortgages held may be paid in full and distributions of capital returns may be made at any time. In addition, the performance of a REIT may be affected by its failure to qualify for tax-free pass-through of income under the Code, or its failure to maintain exemption from registration under the 1940 Act. Distributions that the Fund receives from REITs can be classified as ordinary income, capital gain income or return of capital by the REITs that make these distributions to the Fund. However, it is not possible for the Fund to characterize distributions received from REITs during interim periods because the REIT issuers do not report their tax characterizations until subsequent to year end. During interim periods, the REIT distributions are accounted for as ordinary income until the re characterizations are made subsequent to year end.
Treasury Inflation Protected-Securities (“TIPS”): The Funds may invest in TIPS, including structured bonds in which the principal amount is adjusted daily to keep pace with inflation, as measured by the U.S. Consumer Pricing Index for Urban Consumers. The adjustments to principal due to inflation/deflation are reflected as increases/decreases to interest income with a corresponding adjustment to cost. Such adjustments may have a significant impact on a Fund’s distributions and may result in a return of capital to shareholders. The repayment of the original bond principal upon maturity is guaranteed by the full faith and credit of the U.S. Government.
Loan Participations and Assignments: Certain Funds may invest in loan participations and assignments. The Fund considers loan participations and assignments to be investments in debt securities. Loan participations typically will result in the Fund having a contractual relationship only with the lender, not with the borrower. The Fund will have the right to receive payments of principal, interest and any fees to which it is entitled only from the lender selling the participation and only upon receipt by the lender of the payments from the borrower. Under a loan participation, the Fund generally will have no right to enforce compliance by the borrower with the terms of the loan agreement relating to the loan, nor any rights of set-off against the borrower, and the Fund may not benefit directly from any collateral supporting the loan in which it has purchased the participation. As a result, the Fund will assume the credit risk of both the borrower and the lender that is selling the participation. In the event of the insolvency of the lender selling a participation, the Fund may be treated as a general creditor of the lender and may not benefit from any set-off between the lender and the borrower. When the Fund purchases assignments of loans from lenders, the Fund will acquire direct rights against the borrower on the loan, except that under certain circumstances such rights may be more limited than those held by the assigning lender.
Master Limited Partnerships: Certain Funds may invest in MLPs, which are publicly traded partnerships engaged in the transportation, storage and processing of minerals and natural resources. By confining their operations to these specific activities, their interests, or units, are able to trade on public securities exchanges exactly like the shares of a corporation, without entity level taxation. To qualify as a MLP and to not be taxed as a corporation, a partnership must receive at least 90% of its income from qualifying sources as set forth in Section 7704(d) of the Code. These qualifying sources include natural resource based activities such as the processing, transportation and storage of mineral or natural resources. MLPs generally have two classes of owners, the general partner and limited partners. The general partner of an MLP is typically owned by a major energy company, an investment fund, the direct management of the MLP, or is an entity owned by one or more of such parties. The general partner may be structured as a private or publicly traded corporation or other entity. The general partner typically controls the operations and management of the MLP through an up to 2% equity interest in the MLP plus, in many cases, ownership of common units and subordinated units. Limited partners typically own the remainder of the partnership, through ownership of common units, and have a limited role in the partnership’s operations and management. MLPs are typically structured such that common units and general partner interests have first priority to receive quarterly cash distributions up to an established minimum amount (“minimum quarterly distributions” or “MQD”). Common and general partner interests also accrue arrearages in distributions to the extent the MQD is not paid. Once common and general partner interests have been paid, subordinated units receive distributions of up to the MQD; however, subordinated units do not accrue arrearages. Distributable cash in excess of the MQD is paid to both common and subordinated units and is distributed to both common and subordinated units generally on a pro rata basis. The general partner is also eligible to receive incentive distributions if the general partner operates the business in a manner which results in distributions paid per common unit surpassing specified target levels. As the general partner increases cash distributions to the limited partners, the general partner receives an increasingly higher percentage of the incremental cash distributions.
Libor Risk: In March 2020, the FASB issued ASU No. 2020-04, Reference Rate Reform (Topic 848): Facilitation of the Effects of Reference Rate Reform on Financial Reporting. The Fund’ investments, payment obligations, and financing terms may be based on floating rates, such as the London Interbank Offered Rate, or “LIBOR,” which is the offered rate for short-term Eurodollar deposits between major international banks. On November 30, 2020, the administrator of LIBOR announced its intention to delay the phase out of the majority of the U.S. dollar LIBOR publications until June 30, 2023, with the remainder of LIBOR publications to still end at the end of 2020. There remains uncertainty regarding the nature of any replacement rate and the impact of the transition from LIBOR on the Funds’ transactions and the financial markets generally. As such, the potential effect of a transition away from LIBOR on the Funds or the Funds’ investments cannot yet be determined.
| Notes to Financial Statements | |
COVID-19 Risks: A recent outbreak of respiratory disease caused by a novel coronavirus was first detected in December 2019 and has now been detected internationally. This coronavirus has resulted in closing borders, enhanced health screenings, healthcare service preparation and delivery, quarantines, cancellations, disruptions to supply chains and customer activity, as well as general concern and uncertainty. The impact of this coronavirus, and other epidemics and pandemics that may arise in the future, could affect the economies of many nations, individual companies, their securities (including equity and debt), and the market in general in ways that cannot necessarily be foreseen at the present time. In addition, the impact of infectious diseases in developing or emerging market countries may be greater due to less established health care systems. Health crises caused by the recent coronavirus outbreak may exacerbate other pre-existing political, social and economic risks in certain countries. The impact of the outbreak may be short term or may last for an extended period of time.
3. DERIVATIVE INSTRUMENTS
As a part of their investment strategy, the Funds are permitted to enter in various types of derivatives contracts. In doing so, the Funds employ strategies in differing combinations to permit them to increase, decrease, or change the level or types of exposure to market factors. Central to those strategies are features inherent in derivatives that make them more attractive for this purpose than equity or debt securities; they require little or no initial cash investment, they focus exposure on only certain selected risk factors, and they may not require the ultimate receipt or delivery of the underlying security (or securities) to the contract. This may allow the Funds to pursue their objectives more quickly and efficiently than if they were to make direct purchases or sales of securities capable of affecting a similar response to market factors.
Cash collateral is being pledged to cover derivative obligations of the Funds and cash collateral received from the counterparty, if any, is reported separately on the Statements of Assets and Liabilities as cash pledged as collateral and cash received as collateral, respectively. Non-cash collateral pledged by the Funds, if any, is noted in the Statements of Investments.
Risk of Investing in Derivatives: The Funds’ use of derivatives can result in losses due to unanticipated changes in the market risk factors and the overall market. In instances where the Funds are using derivatives to decrease, or hedge, exposures to market risk factors for securities held by the Funds, there are also risks that those derivatives may not perform as expected resulting in losses for the combined or hedged positions.
Derivatives may have little or no initial cash investment relative to their market value exposure and therefore can produce significant gains or losses in excess of their cost. This use of embedded leverage allows the Fund to increase its market value exposure relative to its net assets and can substantially increase the volatility of the Funds’ performance.
Additional associated risks from investing in derivatives also exist and potentially could have significant effects on the valuation of the derivative and the Funds. Typically, the associated risks are not the risks that the Funds are attempting to increase or decrease exposure to, per their investment objectives, but are the additional risks from investing in derivatives.
Examples of these associated risks are liquidity risk, which is the risk that the Funds will not be able to sell or close out the derivative in a timely manner, and counterparty credit risk, which is the risk that the counterparty will not fulfill its obligation to the Funds. In addition, use of derivatives may increase or decrease exposure to the following risk factors:
Equity Risk: Equity risk relates to the change in value of equity securities as they relate to increases or decreases in the general market. Associated risks can be different for each type of derivative and are discussed by each derivative type in the notes that follow.
Commodity Risk: Exposure to the commodities markets may subject the Funds to greater volatility than investments in traditional securities. Prices of various commodities may also be affected by factors, such as drought, floods, weather, livestock disease, embargoes, tariffs and other regulatory developments, which are unpredictable. The prices of commodities can also fluctuate widely due to supply and demand disruptions in major producing or consuming regions.
Foreign Currency Risk: Currency trading involves significant risks, including market risk, interest rate risk, country risk, counterparty credit risk and short sale risk. Market risk results from the price movement of foreign currency values in response to shifting market supply and demand. Interest rate risk arises whenever a country changes its stated interest rate target associated with its currency. Country risk arises because virtually every country has interfered with international transactions in its currency.
Interest Rate Risk: Interest rate risk is the risk that fixed income securities will decline in value because of changes in interest rates. As nominal interest rates rise, the value of fixed income securities held by the Funds are likely to decrease. Securities with longer durations tend to be more sensitive to changes in interest rates, and are usually more volatile than securities.
| Notes to Financial Statements | |
Swap Contracts: Each Fund may enter into swap transactions for hedging purposes or to seek to increase total return. At the present time, the CoreCommodity Fund and Clough China Fund primarily enter into swap transactions for the purpose of increasing total return. Swap agreements may be executed in a multilateral or other trade facility program, such as a registered exchange (“centrally cleared swaps”) or may be privately negotiated in the over-the counter market. The duration of a swap agreement typically ranges from a few weeks to more than one year. In a centrally cleared swap, immediately following execution of the swap agreement, the swap agreement is novated to a central counterparty (the “CCP”) and the Fund’s counterparty on the swap agreement becomes the CCP. Risks may arise as a result of the failure of the counterparty to the swap contract to comply with the terms of the swap contract. The loss incurred by the failure of a counterparty is generally limited to the net payment to be received by the Funds and/or the termination value at the end of the contract. Therefore, the Funds consider the creditworthiness of each counterparty to a contract in evaluating potential credit risk. Although centrally cleared swaps typically present less counterparty risk than non-centrally cleared swaps, a Fund that has entered into centrally cleared swaps is subject to the risk of the failure of the CCP.
Additionally, risks may arise from unanticipated movements in interest rates or in the value of the underlying reference asset or index. Entering into these agreements involves, to varying degrees, market risk, liquidity risk and elements of credit, legal and documentation risk that are not directly reflected in the amounts recognized in the Statements of Assets and Liabilities.
The Funds may pay or receive cash as collateral on these contracts which may be recorded as an asset and/or liability. The Funds must set aside liquid assets, or engage in other appropriate measures, to cover its obligations under these contracts. Swaps are marked to market daily using either pricing vendor quotations, counterparty prices or model prices and the change in value, if any, is recorded as an unrealized gain or loss. Upfront payments made and/or received by the Funds are recorded as an asset and/or liability and realized gains or losses are recognized ratably over the contract’s term/event, with the exception of forward starting interest rate swaps, whose realized gains or losses are recognized ratably from the effective start date. Periodic payments received or made on swap contracts are recorded as realized gains or losses. Gains or losses are realized upon termination of a swap contract and are recorded on the Statement of Operations.
Total return swaps are agreements in which there is an exchange of cash flows whereby one party commits to make payments based on the total return (coupons plus capital gains/losses) of an underlying instrument in exchange for fixed or floating rate interest payments. To the extent the total return of the instrument or index underlying the transaction exceeds or falls short of the offsetting interest rate obligation, the Fund will receive a payment from or make a payment to the counterparty. Credit default swaps are a type of swap agreement in which the protection “buyer” is generally obligated to pay the protection “seller” an upfront and/ or a periodic stream of payments over the term of the contract provided that no credit event, such as a default, on a reference obligation has occurred. Credit default swaps (“CDS”) are typically two-party financial contracts that transfer credit exposure between the two parties. Under a typical CDS, one party (the “seller”) receives pre-determined periodic payments from the other party (the “buyer”). The seller agrees to make compensating specific payments to the buyer if a negative credit event occurs, such as the bankruptcy or default by the issuer of the underlying debt instrument. Swap agreements held at October 31, 2021 are disclosed after the Statement of Investments.
The average notional amount of the swap positions held in the ALPS | CoreCommodity Management CompleteCommodities® Strategy Fund for the fiscal year ended October 31, 2021 was $446,869,122. The average notional amount of the swap positions held in the Clough China Fund for the fiscal year ended October 31, 2021 was $4,393,155.
Futures: Each Fund may invest in futures contracts in accordance with their investment objectives. Each Fund does so for a variety of reasons including for cash management, hedging or non-hedging purposes in an attempt to achieve the Fund’s investment objective. A futures contract provides for the future sale by one party and purchase by another party of a specified quantity of the security or other financial instrument at a specified price and time. A futures contract on an index is an agreement pursuant to which two parties agree to take or make delivery of an amount of cash equal to the difference between the value of the index at the close of the last trading day of the contract and the price at which the index contract was originally written. Futures transactions may result in losses in excess of the amount invested in the futures contract. There can be no guarantee that there will be a correlation between price movements in the hedging vehicle and in the portfolio securities being hedged. An incorrect correlation could result in a loss on both the hedged securities in a Fund and the hedging vehicle so that the portfolio return might have been greater had hedging not been attempted. There can be no assurance that a liquid market will exist at a time when a Fund seeks to close out a futures contract or a futures option position. Lack of a liquid market for any reason may prevent a Fund from liquidating an unfavorable position, and the Fund would remain obligated to meet margin requirements until the position is closed. In addition, a Fund could be exposed to risk if the counterparties to the contracts are unable to meet the terms of their contracts. With exchange traded futures, there is minimal counterparty credit risk to the Funds since futures are exchange traded and the exchange’s clearinghouse, as counterparty to all exchange traded futures, guarantees the futures against default.
When a purchase or sale of a futures contract is made by a Fund, the Fund is required to deposit with its custodian (or broker, if legally permitted) a specified amount of liquid assets (“initial margin”). The margin required for a futures contract is set by the exchange on which the contract is traded and may be modified during the term of the contract. The initial margin is in the nature of a performance bond or good faith deposit on the futures
| Notes to Financial Statements | |
contract that is returned to a Fund upon termination of the contract, assuming all contractual obligations have been satisfied. These amounts are included in Deposit with broker for futures contracts on the Statement of Assets and Liabilities. Each day a Fund may pay or receive cash, called “variation margin,” equal to the daily change in value of the futures contract. Such payments or receipts are recorded for financial statement purposes as unrealized gains or losses by a Fund. Variation margin does not represent a borrowing or loan by a Fund but is instead a settlement between a Fund and the broker of the amount one would owe the other if the futures contract expired. When the contract is closed, a Fund records a realized gain or loss equal to the difference between the value of the contract at the time it was opened and the value at the time it was closed.
The average value of futures contracts held in the ALPS | CoreCommodity Management CompleteCommodities® Strategy Fund for the fiscal year Ended October 31, 2021 was $277,225,880 for long futures and $133,289,689 for short futures. The average value of futures contracts held in Smith Balanced Opportunity Fund for the fiscal year ended October 31, 2021 was $164,814 for long futures.
Option Contracts: Each Fund may enter into options transactions for hedging purposes and for non-hedging purposes such as seeking to enhance return. Each Fund may write covered put and call options on any stocks or stock indices, currencies traded on domestic and foreign securities exchanges, or futures contracts on stock indices, interest rates and currencies traded on domestic and, to the extent permitted by the CFTC, foreign exchanges. A call option on an asset written by a Fund obligates the Fund to sell the specified asset to the holder (purchaser) at a stated price (the exercise price) if the option is exercised before a specified date (the expiration date). A put option on an asset written by a Fund obligates the Fund to buy the specified asset from the purchaser at the exercise price if the option is exercised before the expiration date. Premiums received when writing options are recorded as liabilities and are subsequently adjusted to the current value of the options written. Premiums received from writing options that expire are treated as realized gains. Premiums received from writing options, which are either exercised or closed, are offset against the proceeds received or amount paid on the transaction to determine realized gains or losses which are recorded on the Statement of Operations.
Derivatives Instruments: The following tables disclose the amounts related to each Fund’s use of derivative instruments.
The effect of derivatives instruments on the Statement of Assets and Liabilities for the Fiscal Year Ended October 31, 2021:
| Risk Exposure | | Asset Location | | Fair Value | | | Liability Location | | Fair Value | |
| ALPS | CoreCommodity Management CompleteCommodities® Strategy Fund(a) | | | | |
| Commodity Contracts (Futures Contracts) | | Unrealized appreciation on futures contracts(b) | | $ | 9,014,992 | | | Unrealized depreciation on futures contracts(b) | | $ | (10,937,276 | ) |
| Commodity Contracts (Total Return Swap Contracts) | | Unrealized appreciation on total return swap contracts | | | 10 | | | Unrealized depreciation on total return swap contracts | | | (275 | ) |
| Total | | | | $ | 9,015,002 | | | | | $ | (10,937,551 | ) |
| Risk Exposure | | Asset Location | | Fair Value | | | Liability Location | | Fair Value | |
| Clough China Fund | | | | | | | | | | |
| Equity Contracts (Total Return Swap Contracts) | | Unrealized appreciation on total return swap contracts | | $ | 992,437 | | | Unrealized depreciation on total return swap contracts | | $ | (411,885 | ) |
| Total | | | | $ | 992,437 | | | | | $ | (411,885 | ) |
| (a) | The ALPS | CoreCommodity Management CompleteCommodities® Strategy Fund consolidates the statements of assets and liabilities. |
| (b) | Represents cumulative appreciation (depreciation) of futures contracts as reported in the Consolidated Statement of Investments. Only the current day's net variation margin is reported within the Consolidated Statement of Assets and Liabilities. |
| Notes to Financial Statements | |
The effect of derivatives instruments on the Statement of Operations for the Fiscal Year Ended October 31, 2021:
| Risk Exposure | | Statement of Operations Location | | Realized
Gain/(Loss)
on Derivatives
Recognized
in Income | | | Change in Unrealized Appreciation/ (Depreciation) on Derivatives Recognized in Income | |
| ALPS | CoreCommodity Management CompleteCommodities® Strategy Fund(a) | |
| Equity and Commodity Contracts (Futures Contracts) | | Net realized gain on futures contracts/ Net change in unrealized appreciation on futures contracts | | $ | 18,559,386 | | | $ | 3,713,079 | |
| Commodity Contracts (Total Return Swap Contracts) | | Net realized loss on total return swap contracts/Net change in unrealized appreciation on total return swap contracts | | | 190,103,040 | | | | 65 | |
| Total | | | | $ | 208,662,426 | | | $ | 3,713,144 | |
| ALPS | Smith Balanced Opportunity Fund | | | | | |
| Equity and Commodity Contracts (Futures Contracts) | | Net realized gain on futures contracts/ Net change in unrealized appreciation on futures contracts | | $ | 23,960 | | | | – | |
| Total | | | | $ | 23,960 | | | | – | |
| Clough China Fund | | | | | | | | |
| Equity Contracts (Total Return Swap Contracts) | | Net realized gain on total return swap contracts/Net change in unrealized depreciation on total return swap contracts | | $ | 1,557,598 | | | $ | (262,328 | ) |
| Total | | | | $ | 1,557,598 | | | $ | (262,328 | ) |
| (a) | The ALPS | CoreCommodity Management CompleteCommodities® Strategy Fund consolidates the statements of operations. |
| Notes to Financial Statements | |
Certain derivative contracts are executed under either standardized netting agreements or, for exchange-traded derivatives, the relevant contracts for a particular exchange which contain enforceable netting provisions. A derivative netting arrangement creates an enforceable right of set-off that becomes effective, and affects the realization of settlement on individual assets, liabilities and collateral amounts, only following a specified event of default or early termination. Default events may include the failure to make payments or deliver securities timely, material adverse changes in financial condition or insolvency, the breach of minimum regulatory capital requirements, or loss of license, charter or other legal authorization necessary to perform under the contract.
The following table presents financial instruments that are subject to enforceable netting arrangements or other similar agreements as of October 31, 2021:
| Offsetting of Derivatives Asset | | | | | | | | | | | | | | | | | | |
| October 31, 2021 | | | | | | | | | | | | | | | | | | |
| | | | | | | | | | | | Gross Amounts Not
Offset in the
Statement of
Financial Position | |
| | | Gross Amounts of
Recognized Assets | | | Gross Amounts
Offset in the
Statement of
Assets and
Liabilities | | | Net Amounts
Presented in the
Statement of Assets
and Liabilities | | | Financial
Instruments | | | Cash Collateral
Received(a) | | | Net Amount | |
| ALPS | CoreCommodity Management CompleteCommodities® Strategy Fund |
| Total Return Swap Contracts | | $ | 10 | | | $ | – | | | $ | 10 | | | $ | – | | | $ | – | | | $ | 10 | |
| Total | | $ | 10 | | | $ | – | | | $ | 10 | | | $ | – | | | $ | – | | | $ | 10 | |
| | | | | | | | | | | | | | | | | | | | | | | | | |
| Clough China Fund | | | | | | | | | | | | | | | | | | | | | | | | |
| Total Return Swap Contracts | | $ | 992,437 | | | $ | – | | | $ | 992,437 | | | $ | (411,885 | ) | | $ | – | | | $ | 580,552 | |
| Total | | $ | 992,437 | | | $ | – | | | $ | 992,437 | | | $ | (411,885 | ) | | $ | – | | | $ | 580,552 | |
| Offsetting of Derivatives Liability | | | | | | | | | | | | | | | | | | |
| October 31, 2021 | | | | | | | | | | | | | | | | | | |
| | | | | | | | | | | | Gross Amounts Not
Offset in the
Statement of
Financial Position | |
| | | Gross Amounts of
Recognized
Liabilities | | | Gross Amounts
Offset in the
Statement of
Assets and
Liabilities | | | Net Amounts
Presented in the
Statement of Assets
and Liabilities | | | Financial
Instruments(a) | | | Cash Collateral
Pledged(a) | | | Net Amount | |
| ALPS | CoreCommodity Management CompleteCommodities® Strategy Fund | | | | |
| Total Return Swap Contracts | | $ | 275 | | | $ | – | | | $ | 275 | | | $ | – | | | $ | – | | | $ | (275 | ) |
| Total | | $ | 275 | | | $ | – | | | $ | 275 | | | $ | – | | | $ | – | | | $ | (275 | ) |
| | | | | | | | | | | | | | | | | | | | | | | | | |
| Clough China Fund | | | | | | | | | | | | | | | | | | | | | | | | |
| Total Return Swap Contracts | | $ | 411,885 | | | $ | – | | | $ | 411,885 | | | $ | 411,885 | | | $ | – | | | $ | – | |
| Total | | $ | 411,885 | | | $ | – | | | $ | 411,885 | | | $ | 411,885 | | | $ | – | | | $ | – | |
| (a) | These amounts are limited to the derivative asset/liability balance and, accordingly, do not include excess collateral received/pledged. |
Notes to Financial Statements
October 31, 2021
4. TAX BASIS INFORMATION
Tax Basis of Distributions to Shareholders: The character of distributions made during the year from net investment income or net realized gains may differ from its ultimate characterization for federal income tax purposes. Also, due to the timing of dividend distributions, the fiscal year in which amounts are distributed may differ from the fiscal year in which the income or realized gain were recorded by a Fund. The amounts and characteristics of tax basis distributions and composition of distributable earnings/ (accumulated losses) are finalized at fiscal year-end.
The tax character of distributions paid by the Funds for the Fiscal Year Ended October 31, 2021 were as follows:
| Fund | | Ordinary Income | | Long-Term Capital Gain | | Return of Capital |
| ALPS | CoreCommodity Management CompleteCommodities® Strategy Fund | | $ | 1,931,352 | | | $ | – | | | | – | |
| ALPS | Kotak India Growth Fund | | | – | | | | – | | | | – | |
| ALPS | Smith Short Duration Bond Fund | | | 4,435,534 | | | | 35,295 | | | | – | |
| ALPS | Smith Total Return Bond Fund | | | 54,766,363 | | | | 1,991,099 | | | | – | |
| ALPS | Smith Credit Opportunities Fund | | | 3,504,875 | | | | – | | | | – | |
| ALPS | Smith Balanced Opportunity Fund | | | 193,327 | | | | – | | | | – | |
| ALPS | Red Rocks Global Opportunity Fund | | | – | | | | 4,029,579 | | | | – | |
| Clough China Fund | | | 1,140,281 | | | | 649,417 | | | | – | |
| RiverFront Asset Allocation Moderate | | | 522,281 | | | | 14,353 | | | | – | |
| RiverFront Asset Allocation Aggressive | | | 322,181 | | | | – | | | | – | |
| RiverFront Asset Allocation Growth & Income | | | 658,095 | | | | – | | | | 58,573 | |
The tax character of distributions paid by the Funds for the Fiscal Year Ended October 31, 2020 were as follows:
| Fund | | Ordinary Income | | Long-Term Capital Gain |
| ALPS | CoreCommodity Management CompleteCommodities® Strategy Fund | | $ | 5,386,269 | | | $ | – | |
| ALPS | Kotak India Growth Fund | | | – | | | | 363,112 | |
| ALPS | Smith Short Duration Bond Fund | | | 1,810,242 | | | | 7,397 | |
| ALPS | Smith Total Return Bond Fund | | | 22,579,307 | | | | 8,170 | |
| ALPS | Red Rocks Global Opportunity Fund | | | 14,647,308 | | | | 11,394,100 | |
| Clough China Fund | | | 648,314 | | | | 2,743,546 | |
| RiverFront Asset Allocation Moderate | | | 719,194 | | | | – | |
| RiverFront Asset Allocation Aggressive | | | 668,533 | | | | – | |
| RiverFront Asset Allocation Growth & Income | | | 1,183,441 | | | | – | |
Components of Distributable Earnings on a Tax Basis: At October 31, 2021, permanent differences in book and tax accounting were reclassified. These differences had no effect on net assets and were primarily attributed to differences in the treatment of commodity related controlled foreign corporations, the differing tax treatment of foreign currency, investments in partnerships, Passive Foreign Investment Companies (“PFICs”) and certain other investments.
For the fiscal year ended October 31, 2021, the following reclassifications, which had no impact on results of operations or net assets, were recorded to reflect tax character:
| Fund | | Paid-in Capital | | Distributable earnings |
| ALPS | CoreCommodity Management CompleteCommodities® Strategy Fund | | $ | 2,817,461 | | | $ | (2,817,461 | ) |
| ALPS | Smith Credit Opportunities Fund | | | (1,402 | ) | | | 1,402 | |
| ALPS | Smith Balanced Opportunity Fund | | | (1,097 | ) | | | 1,097 | |
| ALPS | Red Rocks Global Opportunity Fund | | | 115,496 | | | | (115,496 | ) |
| RiverFront Asset Allocation Growth & Income | | | 14,441 | | | | (14,441 | ) |
Notes to Financial Statements
October 31, 2021
As of October 31, 2021, the components of distributable earnings on a tax basis were as follows:
| | | Undistributed net investment income | | Accumulated net realized gain/(loss) on investments | | Other cumulative effect of timing differences | | Net unrealized appreciation/(depreciation) on investments | | Total |
| ALPS | CoreCommodity Management CompleteCommodities® Strategy Fund | | $ | 219,135,047 | | | $ | (56,126,695 | ) | | $ | – | | | $ | 55,264,561 | | | $ | 218,272,913 | |
| ALPS | Kotak India Growth Fund | | | 12,591,343 | | | | 7,883,641 | | | | – | | | | 70,618,528 | | | | 91,093,512 | |
| ALPS | Smith Short Duration Bond Fund | | | 869,810 | | | | 461,598 | | | | – | | | | 190,987 | | | | 1,522,395 | |
| ALPS | Smith Total Return Bond Fund | | | 788,555 | | | | (1,226,011 | ) | | | – | | | | 16,208,295 | | | | 15,770,839 | |
| ALPS | Smith Credit Opportunities Fund | | | 1,116,583 | | | | 15,464 | | | | – | | | | 768,519 | | | | 1,900,566 | |
| ALPS | Smith Balanced Opportunity Fund | | | 65,410 | | | | 13,856 | | | | – | | | | 4,180,891 | | | | 4,260,157 | |
| ALPS | Red Rocks Global Opportunity Fund | | | 17,344,176 | | | | 6,474,611 | | | | – | | | | 22,327,310 | | | | 46,146,097 | |
| Clough China Fund | | | 1,868,461 | | | | 4,702,062 | | | | – | | | | 5,822,834 | | | | 12,393,357 | |
| RiverFront Asset Allocation Moderate | | | – | | | | 755,616 | | | | – | | | | 7,572,072 | | | | 8,327,688 | |
| RiverFront Asset Allocation Aggressive | | | 144,516 | | | | (2,720,640 | ) | | | – | | | | 6,717,860 | | | | 4,141,736 | |
| RiverFront Asset Allocation Growth & Income | | | – | | | | (4,643,756 | ) | | | – | | | | 12,959,400 | | | | 8,315,644 | |
Capital loss carryovers used during the year ended October 31, 2021 for ALPS | Kotak India Growth Fund, were $11,497,372.
Capital loss carryovers used during the year ended October 31, 2021 for ALPS | Smith Balanced Opportunity Fund, were $3,353.
Capital loss carryovers used during the year ended October 31, 2021 for ALPS | CoreCommodity Management CompleteCommodities Strategy Fund, were $39,474,256.
Capital loss carryovers used during the year ended October 31, 2021 for RiverFront Asset Allocation Aggressive Fund, were $340,122.
Capital loss carryovers used during the year ended October 31, 2021 for RiverFront Asset Allocation Growth & Income Fund, were $2,060,601.
Capital loss carryovers used during the year ended October 31, 2021 for RiverFront Asset Allocation Moderate Fund, were $1,116,975.
Capital Losses: Under current law, capital losses maintain their character as short-term or long-term and are carried forward to the next tax year without expiration. As of October 31, 2021 the following amounts are available as carry forwards to the next tax year:
Capital losses deferred to next tax year were as follows:
| Fund | | Short-Term | | Long-Term |
| ALPS | CoreCommodity Management CompleteCommodities® Strategy Fund | | $ | 15,233,635 | | | $ | 40,893,060 | |
| ALPS | Smith Total Return Bond Fund | | | 1,226,011 | | | | – | |
| RiverFront Asset Allocation Aggressive | | | 1,243,526 | | | | 1,477,114 | |
| RiverFront Asset Allocation Growth & Income* | | | 2,861,458 | | | | 1,782,298 | |
| * | May be subject to §382 limitation resulting from mergers. |
Notes to Financial Statements
October 31, 2021
Unrealized Appreciation and Depreciation on Investments: As of October 31, 2021, the costs of investments for federal income tax purposes and accumulated net unrealized appreciation/(depreciation) on investments were as follows:
| Fund | | Gross Appreciation (excess of value over tax cost) | | Gross Depreciation (excess of tax cost over value) | | Net Appreciation of Foreign Currency | | Net Unrealized Appreciation/ (Depreciation) | | Cost of Investments for Income Tax Purposes |
| ALPS | CoreCommodity Management CompleteCommodities® Strategy Fund | | $ | 793,917,976 | | | $ | (738,651,492 | ) | | $ | (1,923 | ) | | $ | 55,264,561 | | | $ | 1,080,590,039 | |
| ALPS | Kotak India Growth Fund | | | 91,143,113 | | | | (20,243,977 | ) | | | (280,608 | ) | | | 70,618,528 | | | | 303,977,038 | |
| ALPS | Smith Short Duration Bond Fund | | | 1,361,494 | | | | (1,170,507 | ) | | | – | | | | 190,987 | | | | 515,584,294 | |
| ALPS | Smith Total Return Bond Fund | | | 26,638,407 | | | | (10,430,112 | ) | | | – | | | | 16,208,295 | | | | 1,762,267,312 | |
| ALPS | Smith Credit Opportunities Fund | | | 2,430,828 | | | | (1,662,309 | ) | | | – | | | | 768,519 | | | | 304,381,834 | |
| ALPS | Smith Balanced Opportunity Fund | | | 4,418,378 | | | | (237,487 | ) | | | – | | | | 4,180,891 | | | | 35,948,023 | |
| ALPS | Red Rocks Global Opportunity Fund | | | 23,904,196 | | | | (1,566,208 | ) | | | (10,678 | ) | | | 22,327,310 | | | | 89,585,326 | |
| Clough China Fund | | | 13,050,915 | | | | (7,228,146 | ) | | | 65 | | | | 5,822,834 | | | | 31,086,559 | |
| RiverFront Asset Allocation Moderate | | | 7,927,954 | | | | (33,695 | ) | | | (322,079 | ) | | | 7,572,180 | | | | 41,033,234 | |
| RiverFront Asset Allocation Aggressive | | | 6,752,919 | | | | (35,059 | ) | | | – | | | | 6,717,860 | | | | 21,041,796 | |
| RiverFront Asset Allocation Growth & Income | | | 12,878,061 | | | | (34,784 | ) | | | 116,123 | | | | 12,959,400 | | | | 51,406,671 | |
5. SECURITIES TRANSACTIONS
Purchases and sales of securities, excluding short-term securities and U.S. Government Obligations during the Fiscal Year Ended October 31, 2021 were as follows:
Fund |
| Purchases of Securities |
| Proceeds from Sales of Securities |
| ALPS | CoreCommodity Management CompleteCommodities® Strategy Fund(a) | | $ | 278,536,936 | | | $ | 156,080,661 | |
| ALPS | Kotak India Growth Fund | | | 199,076,059 | | | | 86,233,350 | |
| ALPS | Smith Short Duration Bond Fund | | | 684,411,207 | | | | 383,834,865 | |
| ALPS | Smith Total Return Bond Fund | | | 1,666,342,090 | | | | 1,489,937,389 | |
| ALPS | Smith Credit Opportunities Fund | | | 426,658,087 | | | | 161,094,955 | |
| ALPS | Smith Balanced Opportunity Fund | | | 37,152,137 | | | | 20,049,949 | |
| ALPS | Red Rocks Global Opportunity Fund | | | 43,714,418 | | | | 61,129,060 | |
| Clough China Fund | | | 44,350,088 | | | | 48,692,376 | |
| RiverFront Asset Allocation Moderate | | | 7,815,380 | | | | 12,808,966 | |
| RiverFront Asset Allocation Aggressive | | | 1,201,532 | | | | 3,546,755 | |
| RiverFront Asset Allocation Growth & Income | | | 7,750,357 | | | | 14,941,518 | |
Purchases and sales of U.S. Government Obligations during the fiscal year ended October 31, 2021 were as follows:
| Fund | | Purchases of Securities | | Proceeds from Sales of Securities |
| ALPS | CoreCommodity Management CompleteCommodities® Strategy Fund(a) | | $ | 256,882,909 | | | $ | 195,820,614 | |
| ALPS | Smith Short Duration Bond Fund | | | 276,284,635 | | | | 235,802,543 | |
| ALPS | Smith Total Return Bond Fund | | | 1,732,745,394 | | | | 1,445,872,116 | |
| ALPS | Smith Credit Opportunities Fund | | | 106,000,785 | | | | 96,682,216 | |
| ALPS | Smith Balanced Opportunity Fund | | | 15,911,222 | | | | 12,796,805 | |
| (a) | Purchases and sales for ALPS | CoreCommodity Management CompleteCommodities® Strategy Fund are consolidated and include the balances of CoreCommodity Management Cayman Commodity Fund, Ltd. (wholly owned subsidiary). |
Notes to Financial Statements
October 31, 2021
6. BENEFICIAL INTEREST TRANSACTIONS
Shares redeemed within 90 days of purchase for ALPS | Red Rocks Global Opportunity Fund and 30 days of purchase for ALPS | CoreCommodity Management CompleteCommodities® Strategy Fund, ALPS | Kotak India Growth Fund, and Clough China Fund, may incur a 2% short-term redemption fee deducted from the redemption amount. RiverFront Asset Allocation Aggressive Fund, RiverFront Asset Allocation Growth & Income Fund, RiverFront Asset Allocation Moderate Fund, ALPS | Smith Short Duration Bond, ALPS | Smith Total Return Bond Fund, ALPS | Smith Credit Opportunities Fund and ALPS | Smith Balanced Opportunity Fund do not incur redemption fees.
Effective December 1, 2017, Class A shares were renamed Investor Class shares for all Funds. Such shares will be offered without an initial sales charge or a contingent deferred sales charge. The RiverFront Asset Allocation Aggressive existing Investor shares were renamed Investor Class II shares.
For the fiscal year ended October 31, 2021, the amounts listed below were retained by the Funds. These amounts are reflected in “Shares redeemed” in the Statements of Changes in Net Assets.
| | | Redemption Fee Retained | |
| Fund | | For the
Year Ended
October 31, 2021 | | | For the
Year Ended
October 31, 2020 | |
| ALPS | CoreCommodity Management CompleteCommodities® Strategy Fund - Investor Class | | $ | 4,276 | | | $ | 3,872 | |
| ALPS | CoreCommodity Management CompleteCommodities® Strategy Fund - Class A | | | – | | | | 38 | |
| ALPS | CoreCommodity Management CompleteCommodities® Strategy Fund - Class C | | | 3,899 | | | | – | |
| ALPS | CoreCommodity Management CompleteCommodities® Strategy Fund - Class I | | | 3,215 | | | | 6,370 | |
| ALPS | Kotak India Growth Fund - Investor Class | | | 90 | | | | 286,145 | |
| ALPS | Kotak India Growth Fund - Class I | | | 924 | | | | 550 | |
| ALPS | Smith Short Duration Bond Fund - Class I | | | – | | | | 2,157 | |
| ALPS | Smith Total Return Bond Fund - Investor Class | | | – | | | | 20 | |
| ALPS | Smith Total Return Bond Fund - Class A | | | – | | | | 4,313 | |
| ALPS | Smith Total Return Bond Fund - Class I | | | – | | | | 29,289 | |
| ALPS | Red Rocks Global Opportunity Fund - Investor Class | | | 170 | | | | 12,646 | |
| ALPS | Red Rocks Global Opportunity Fund - Class A | | | 21 | | | | 1,933 | |
| ALPS | Red Rocks Global Opportunity Fund - Class C | | | – | | | | 367 | |
| ALPS | Red Rocks Global Opportunity Fund - Class I | | | 49 | | | | 16,589 | |
| Clough China Fund - Investor Class | | | 268 | | | | 133 | |
| Clough China Fund - Class C | | | – | | | | 1 | |
Notes to Financial Statements
October 31, 2021
Transactions in shares of capital stock were as follows:
| | | ALPS | CoreCommodity Management CompleteCommodities® Strategy Fund |
| | | For the
Year Ended
October 31, 2021 | | For the
Year Ended
October 31, 2020 |
| Investor Class | | | | | | | | |
| Shares sold | | | 4,497,779 | | | | 3,723,036 | |
| Dividends reinvested | | | 24,142 | | | | 52,689 | |
| Shares redeemed | | | (3,219,508 | ) | | | (1,557,348 | ) |
| Net increase in shares outstanding | | | 1,302,413 | | | | 2,218,377 | |
| Class A | | | | | | | | |
| Shares sold | | | 692,899 | | | | 141,752 | |
| Dividends reinvested | | | 351 | | | | 855 | |
| Shares redeemed | | | (127,691 | ) | | | (48,458 | ) |
| Net increase in shares outstanding | | | 565,559 | | | | 94,149 | |
| Class C | | | | | | | | |
| Shares sold | | | 1,306,524 | | | | 55,316 | |
| Dividends reinvested | | | 689 | | | | 4,410 | |
| Shares redeemed | | | (175,391 | ) | | | (704,431 | ) |
| Net increase/(decrease) in shares outstanding | | | 1,131,822 | | | | (644,705 | ) |
| Class I | | | | | | | | |
| Shares sold | | | 68,562,911 | | | | 31,313,307 | |
| Dividends reinvested | | | 221,924 | | | | 575,900 | |
| Shares redeemed | | | (20,567,458 | ) | | | (34,485,123 | ) |
| Net increase/(decrease) in shares outstanding | | | 48,217,377 | | | | (2,595,916 | ) |
| | | ALPS | Kotak India Growth Fund | |
| | | For the
Year Ended
October 31, 2021 | | | For the
Year Ended
October 31, 2020 | |
| Investor Class | | | | | | | | |
| Shares sold | | | 63,673 | | | | 1,469,294 | |
| Dividends reinvested | | | – | | | | 3,593 | |
| Shares redeemed | | | (73,427 | ) | | | (1,612,826 | ) |
| Net decrease in shares outstanding | | | (9,754 | ) | | | (139,939 | ) |
| Class A | | | | | | | | |
| Shares sold | | | 64,783 | | | | 1,521 | |
| Dividends reinvested | | | – | | | | 88 | |
| Shares redeemed | | | (30,913 | ) | | | (1,914 | ) |
| Net increase/(decrease) in shares outstanding | | | 33,870 | | | | (305 | ) |
| Class C | | | | | | | | |
| Shares sold | | | 1,363 | | | | 7,894 | |
| Dividends reinvested | | | – | | | | 2,484 | |
| Shares redeemed | | | (68,076 | ) | | | (30,928 | ) |
| Net decrease in shares outstanding | | | (66,713 | ) | | | (20,550 | ) |
| Class I | | | | | | | | |
| Shares sold | | | 282,712 | | | | 547,548 | |
| Dividends reinvested | | | – | | | | 17,939 | |
| Shares redeemed | | | (1,128,704 | ) | | | (527,423 | ) |
| Net increase/(decrease) in shares outstanding | | | (845,992 | ) | | | 38,064 | |
| Class II(a) | | | | | | | | |
| Shares sold | | | 8,906,165 | | | | 13,368,943 | |
| Shares redeemed | | | – | | | | (2,963,226 | ) |
| Net increase in shares outstanding | | | 8,906,165 | | | | 10,405,717 | |
| (a) | Class II commenced operations on December 19, 2019. |
Notes to Financial Statements
October 31, 2021
| | | ALPS | Smith Short Duration Bond Fund | |
| | | For the
Year Ended
October 31, 2021 | | | For the
Year Ended
October 31, 2020 | |
| Investor Class | | | | | | | | |
| Shares sold | | | 1,418,224 | | | | 826,795 | |
| Dividends reinvested | | | 9,762 | | | | 1,587 | |
| Shares redeemed | | | (1,320,142 | ) | | | (22,188 | ) |
| Net increase in shares outstanding | | | 107,844 | | | | 806,194 | |
| Class A | | | | | | | | |
| Shares sold | | | 1,287,932 | | | | 315,200 | |
| Dividends reinvested | | | 10,103 | | | | 1,745 | |
| Shares redeemed | | | (50,104 | ) | | | (14,094 | ) |
| Net increase in shares outstanding | | | 1,247,931 | | | | 302,851 | |
| Class C | | | | | | | | |
| Shares sold | | | 148,738 | | | | 175,014 | |
| Dividends reinvested | | | 1,627 | | | | 806 | |
| Shares redeemed | | | (27,409 | ) | | | (17,601 | ) |
| Net increase in shares outstanding | | | 122,956 | | | | 158,219 | |
| Class I | | | | | | | | |
| Shares sold | | | 45,356,032 | | | | 15,201,725 | |
| Dividends reinvested | | | 237,360 | | | | 114,292 | |
| Shares redeemed | | | (14,736,635 | ) | | | (3,995,650 | ) |
| Net increase in shares outstanding | | | 30,856,757 | | | | 11,320,367 | |
| | | ALPS | Smith Total Return Bond Fund | |
| | | For the
Year Ended
October 31, 2021 | | | For the
Year Ended
October 31, 2020 | |
| Investor Class | | | | | | | | |
| Shares sold | | | 378,299 | | | | 851,183 | |
| Dividends reinvested | | | 24,595 | | | | 10,771 | |
| Shares redeemed | | | (429,475 | ) | | | (354,961 | ) |
| Net increase/(decrease) in shares outstanding | | | (26,581 | ) | | | 506,993 | |
| Class A | | | | | | | | |
| Shares sold | | | 1,736,874 | | | | 680,483 | |
| Dividends reinvested | | | 46,631 | | | | 21,602 | |
| Shares redeemed | | | (658,819 | ) | | | (114,005 | ) |
| Net increase in shares outstanding | | | 1,124,686 | | | | 588,080 | |
| Class C | | | | | | | | |
| Shares sold | | | 190,280 | | | | 470,809 | |
| Dividends reinvested | | | 13,473 | | | | 4,985 | |
| Shares redeemed | | | (131,492 | ) | | | (64,416 | ) |
| Net increase in shares outstanding | | | 72,261 | | | | 411,378 | |
| Class I | | | | | | | | |
| Shares sold | | | 76,976,319 | | | | 98,260,437 | |
| Dividends reinvested | | | 3,305,889 | | | | 1,340,528 | |
| Shares redeemed | | | (41,598,507 | ) | | | (16,682,072 | ) |
| Net increase in shares outstanding | | | 38,683,701 | | | | 82,918,893 | |
Notes to Financial Statements
October 31, 2021
| | | ALPS | Smith Credit Opportunities Fund | |
| | | For the
Year Ended
October 31, 2021 | | | For the Period September 16, 2020 (Commencement) to October 31, 2020 | |
| Investor Class | | | | | | | | |
| Shares sold | | | 756,557 | | | | 70,203 | |
| Dividends reinvested | | | 10,359 | | | | – | |
| Shares redeemed | | | (179,550 | ) | | | (17 | ) |
| Net increase in shares outstanding | | | 587,366 | | | | 70,186 | |
| Class A | | | | | | | | |
| Shares sold | | | 16,170 | | | | 100,000 | |
| Dividends reinvested | | | 325 | | | | – | |
| Net increase in shares outstanding | | | 16,495 | | | | 100,000 | |
| Class C | | | | | | | | |
| Shares sold | | | 15,276 | | | | 50,000 | |
| Dividends reinvested | | | 5 | | | | – | |
| Net increase in shares outstanding | | | 15,281 | | | | 50,000 | |
| Class I | | | | | | | | |
| Shares sold | | | 29,742,719 | | | | 2,545,943 | |
| Dividends reinvested | | | 209,349 | | | | 128 | |
| Shares redeemed | | | (3,909,843 | ) | | | (32,551 | ) |
| Net increase in shares outstanding | | | 26,042,225 | | | | 2,513,520 | |
| | | ALPS | Smith Balanced Opportunity Fund | |
| | | For the
Year Ended
October 31, 2021 | | For the Period September 16, 2020 (Commencement) to October 31, 2020 | |
| Investor Class | | | | | | | | |
| Shares sold | | | 3,882 | | | | 60,855 | |
| Dividends reinvested | | | 43 | | | | – | |
| Shares redeemed | | | (472 | ) | | | – | |
| Net increase in shares outstanding | | | 3,453 | | | | 60,855 | |
| Class A | | | | | | | | |
| Shares sold | | | – | | | | 100,000 | |
| Net increase in shares outstanding | | | – | | | | 100,000 | |
| Class C | | | | | | | | |
| Shares sold | | | – | | | | 50,000 | |
| Net increase in shares outstanding | | | – | | | | 50,000 | |
| Class I | | | | | | | | |
| Shares sold | | | 1,903,951 | | | | 1,243,550 | |
| Dividends reinvested | | | 8,755 | | | | 70 | |
| Shares redeemed | | | (87,391 | ) | | | – | |
| Net increase in shares outstanding | | | 1,825,315 | | | | 1,243,620 | |
Notes to Financial Statements
October 31, 2021
| | | ALPS | Red Rocks Global
Opportunity Fund | |
| | | For the
Year Ended
October 31, 2021 | | | For the
Year Ended
October 31, 2020 | |
| Investor Class | | | | | | | | |
| Shares sold | | | 117,250 | | | | 746,089 | |
| Dividends reinvested | | | 78,824 | | | | 396,106 | |
| Shares redeemed | | | (368,930 | ) | | | (1,986,245 | ) |
| Net decrease in shares outstanding | | | (172,856 | ) | | | (844,050 | ) |
| Class A | | | | | | | | |
| Shares sold | | | 154,377 | | | | 502,233 | |
| Dividends reinvested | | | 11,627 | | | | 11,532 | |
| Shares redeemed | | | (112,441 | ) | | | (222,154 | ) |
| Net increase in shares outstanding | | | 53,563 | | | | 291,611 | |
| Class C | | | | | | | | |
| Shares sold | | | 10,415 | | | | 100,932 | |
| Dividends reinvested | | | 55,299 | | | | 277,858 | |
| Shares redeemed | | | (312,234 | ) | | | (1,107,493 | ) |
| Net decrease in shares outstanding | | | (246,520 | ) | | | (728,703 | ) |
| Class I | | | | | | | | |
| Shares sold | | | 911,179 | | | | 3,948,906 | |
| Dividends reinvested | | | 306,048 | | | | 2,205,348 | |
| Shares redeemed | | | (2,490,837 | ) | | | (15,717,303 | ) |
| Net decrease in shares outstanding | | | (1,273,610 | ) | | | (9,563,049 | ) |
| Class R | | | | | | | | |
| Shares sold | | | 69,257 | | | | 172,726 | |
| Dividends reinvested | | | 50,509 | | | | 169,759 | |
| Shares redeemed | | | (187,716 | ) | | | (240,276 | ) |
| Net increase/(decrease) in shares outstanding | | | (67,950 | ) | | | 102,209 | |
| | | Clough China Fund |
| | | For the
Year Ended
October 31, 2021 | | For the
Year Ended
October 31, 2020 |
| Investor Class | | | | | | | | |
| Shares sold | | | 59,497 | | | | 26,030 | |
| Dividends reinvested | | | 11,125 | | | | 27,169 | |
| Shares redeemed | | | (113,752 | ) | | | (136,999 | ) |
| Net decrease in shares outstanding | | | (43,130 | ) | | | (83,800 | ) |
| Class A | | | | | | | | |
| Shares sold | | | 6,356 | | | | 28,884 | |
| Dividends reinvested | | | 1,351 | | | | 3,571 | |
| Shares redeemed | | | (25,976 | ) | | | (17,923 | ) |
| Net increase/(decrease) in shares outstanding | | | (18,269 | ) | | | 14,532 | |
| Class C | | | | | | | | |
| Shares sold | | | 1,198 | | | | 2,134 | |
| Dividends reinvested | | | 1,898 | | | | 5,599 | |
| Shares redeemed | | | (10,569 | ) | | | (60,290 | ) |
| Net decrease in shares outstanding | | | (7,473 | ) | | | (52,557 | ) |
| Class I | | | | | | | | |
| Shares sold | | | 22,157 | | | | 45,424 | |
| Dividends reinvested | | | 41,321 | | | | 91,364 | |
| Shares redeemed | | | (81,063 | ) | | | (138,066 | ) |
| Net decrease in shares outstanding | | | (17,585 | ) | | | (1,278 | ) |
Notes to Financial Statements
October 31, 2021
| | | RiverFront Asset Allocation Aggressive | |
| | | For the
Year Ended
October 31, 2021 | | | For the
Year Ended
October 31, 2020 | |
| Investor Class | | | | | | | | |
| Shares sold | | | 7,538 | | | | 2,440 | |
| Dividends reinvested | | | 1,657 | | | | 6,342 | |
| Shares redeemed | | | (50,285 | ) | | | (182,440 | ) |
| Net decrease in shares outstanding | | | (41,090 | ) | | | (173,658 | ) |
| Class A | | | | | | | | |
| Shares sold | | | 49,291 | | | | 38,409 | |
| Dividends reinvested | | | 1,116 | | | | 1,412 | |
| Shares redeemed | | | (31,885 | ) | | | (17,567 | ) |
| Net increase in shares outstanding | | | 18,522 | | | | 22,254 | |
| Class C | | | | | | | | |
| Shares sold | | | 14,286 | | | | 10,908 | |
| Dividends reinvested | | | 3,599 | | | | 7,859 | |
| Shares redeemed | | | (119,615 | ) | | | (157,814 | ) |
| Net decrease in shares outstanding | | | (101,730 | ) | | | (139,047 | ) |
| Class I | | | | | | | | |
| Shares sold | | | 15,228 | | | | 42,140 | |
| Dividends reinvested | | | 2,994 | | | | 8,074 | |
| Shares redeemed | | | (58,254 | ) | | | (389,251 | ) |
| Net decrease in shares outstanding | | | (40,032 | ) | | | (339,037 | ) |
| Investor II | | | | | | | | |
| Shares sold | | | 578 | | | | 2,707 | |
| Dividends reinvested | | | 873 | | | | 1,484 | |
| Shares redeemed | | | (7,512 | ) | | | (47,500 | ) |
| Net decrease in shares outstanding | | | (6,061 | ) | | | (43,309 | ) |
| Class L | | | | | | | | |
| Shares sold | | | 130,874 | | | | 113,431 | |
| Dividends reinvested | | | 14,693 | | | | 29,157 | |
| Shares redeemed | | | (138,364 | ) | | | (522,923 | ) |
| Net increase/(decrease) in shares outstanding | | | 7,203 | | | | (380,335 | ) |
Notes to Financial Statements
October 31, 2021
| | | RiverFront Asset Allocation
Growth & Income | |
| | | For the
Year Ended
October 31, 2021 | | | For the
Year Ended
October 31, 2020 | |
| Investor Class | | | | | | | | |
| Shares sold | | | 4,868 | | | | 10,492 | |
| Dividends reinvested | | | 5,415 | | | | 11,414 | |
| Shares redeemed | | | (105,864 | ) | | | (184,808 | ) |
| Net decrease in shares outstanding | | | (95,581 | ) | | | (162,902 | ) |
| Class A | | | | | | | | |
| Shares sold | | | 131,569 | | | | 159,284 | |
| Dividends reinvested | | | 4,570 | | | | 5,987 | |
| Shares redeemed | | | (90,345 | ) | | | (105,466 | ) |
| Net increase in shares outstanding | | | 45,794 | | | | 59,805 | |
| Class C | | | | | | | | |
| Shares sold | | | 41,292 | | | | 69,052 | |
| Dividends reinvested | | | 5,251 | | | | 19,111 | |
| Shares redeemed | | | (445,845 | ) | | | (595,631 | ) |
| Net decrease in shares outstanding | | | (399,302 | ) | | | (507,468 | ) |
| Class I | | | | | | | | |
| Shares sold | | | 298,873 | | | | 356,030 | |
| Dividends reinvested | | | 36,431 | | | | 66,670 | |
| Shares redeemed | | | (477,178 | ) | | | (1,640,532 | ) |
| Net decrease in shares outstanding | | | (141,874 | ) | | | (1,217,832 | ) |
| | | RiverFront Asset Allocation Moderate | |
| | | For the
Year Ended
October 31, 2021 | | | For the
Year Ended
October 31, 2020 | |
| Investor Class | | | | | | | | |
| Shares sold | | | 32,931 | | | | 15,746 | |
| Dividends reinvested | | | 4,339 | | | | 6,563 | |
| Shares redeemed | | | (57,397 | ) | | | (145,967 | ) |
| Net decrease in shares outstanding | | | (20,127 | ) | | | (123,658 | ) |
| Class A | | | | | | | | |
| Shares sold | | | 299,957 | | | | 351,122 | |
| Dividends reinvested | | | 10,123 | | | | 9,942 | |
| Shares redeemed | | | (141,799 | ) | | | (196,595 | ) |
| Net increase in shares outstanding | | | 168,281 | | | | 164,469 | |
| Class C | | | | | | | | |
| Shares sold | | | 9,535 | | | | 44,622 | |
| Dividends reinvested | | | 5,978 | | | | 16,302 | |
| Shares redeemed | | | (580,590 | ) | | | (1,083,506 | ) |
| Net decrease in shares outstanding | | | (565,077 | ) | | | (1,022,582 | ) |
| Class I | | | | | | | | |
| Shares sold | | | 233,421 | | | | 254,684 | |
| Dividends reinvested | | | 23,749 | | | | 36,154 | |
| Shares redeemed | | | (324,575 | ) | | | (920,184 | ) |
| Net decrease in shares outstanding | | | (67,405 | ) | | | (629,346 | ) |
Notes to Financial Statements
October 31, 2021
7. AFFILIATED COMPANIES
Funds may invest in certain securities that are considered securities issued by affiliated companies. As defined by the Investment Company Act of 1940, an affiliated person, including an affiliated company, is one in which a Fund owns 5% or more of the outstanding voting securities, or a company which is under common ownership or control with the Fund. The purchases, sales, dividend income, realized gains or losses, change in unrealized gains or losses, shares and value of investments in affiliated companies for the year ended October 31, 2021 were as follows:
RiverFront Asset
Allocation Aggressive | | Market Value as of October 31, 2020 | | Purchases | | Sales | | Merger | | Market Value as of October 31, 2021 | | Share Balance as of October 31, 2021 | | Dividends | | Change in Unrealized Gain (Loss) | | Realized
Gain/Loss |
| First Trust RiverFront Dynamic Asia Pacific ETF | | $ | 783,725 | | | $ | – | | | $ | (59,782 | ) | | $ | (840,957 | ) | | $ | – | | | | – | | | $ | 22,072 | | | $ | 122,115 | | | $ | (5,101 | ) |
| First Trust RiverFront Dynamic Developed International ETF | | | 3,394,461 | | | | 360,575 | | | | (434,525 | ) | | | 840,957 | | | | 5,296,243 | | | | 72,601 | | | | 77,262 | | | | 1,133,591 | | | | 1,184 | |
| First Trust RiverFront Dynamic Emerging Markets ETF | | | 2,753,585 | | | | – | | | | (323,061 | ) | | | – | | | | 2,749,303 | | | | 41,016 | | | | 12,971 | | | | 283,586 | | | | 35,193 | |
| First Trust RiverFront Dynamic Europe ETF | | | 1,451,594 | | | | – | | | | (172,594 | ) | | | – | | | | 1,808,056 | | | | 23,548 | | | | 36,300 | | | | 524,137 | | | | 4,919 | |
| RiverFront Dynamic US Dividend Advantage ETF | | | 7,066,248 | | | | – | | | | (744,431 | ) | | | – | | | | 8,718,041 | | | | 191,898 | | | | 121,101 | | | | 2,268,567 | | | | 127,657 | |
| RiverFront Dynamic US Flex-Cap ETF | | | 6,940,799 | | | | – | | | | (1,015,266 | ) | | | – | | | | 8,353,954 | | | | 178,087 | | | | 78,680 | | | | 2,251,116 | | | | 177,305 | |
| | | | 22,390,412 | | | | 360,575 | | | | (2,749,659 | ) | | | – | | | | 26,925,597 | | | | | | | | 348,386 | | | | 6,583,112 | | | | 341,157 | |
RiverFront Asset Allocation
Growth & Income | | Market Value as of October 31, 2020 | | Purchases | | Sales | | Liquidation/
Reverse
Stock Split | | Market Value as of October 31, 2021 | | Share Balance as of October 31, 2021 | | Dividends | | Change in Unrealized Gain (Loss) | | Realized
Gain/Loss |
| RiverFront Dynamic Core Income ETF | | $ | 13,323,893 | | | $ | 3,380,129 | | | $ | (1,442,362 | ) | | $ | – | | | $ | 14,918,870 | | | | 588,706 | | | $ | 237,047 | | | $ | (403,245 | ) | | $ | 60,455 | |
| RiverFront Dynamic Unconstrained Income ETF | | | 1,120,785 | | | | – | | | | (129,183 | ) | | | (1,016,014 | ) | | | – | | | | – | | | | 39,013 | | | | (3,308 | ) | | | 27,720 | |
| Riverfront Strategic Income Fund | | | 1,752,818 | | | | 1,204,428 | | | | (868,872 | ) | | | – | | | | 2,096,048 | | | | 84,929 | | | | 30,927 | | | | (733 | ) | | | 8,407 | |
| First Trust RiverFront Dynamic Developed International ETF | | | 9,191,264 | | | | 3,165,800 | | | | (1,381,371 | ) | | | – | | | | 14,309,799 | | | | 196,159 | | | | 226,871 | | | | 3,258,186 | | | | 75,920 | |
| First Trust RiverFront Dynamic Emerging Markets ETF | | | 5,062,398 | | | | – | | | | (1,482,969 | ) | | | – | | | | 4,188,973 | | | | 62,494 | | | | 51,540 | | | | 339,948 | | | | 269,596 | |
| RiverFront Dynamic US Dividend Advantage ETF | | | 20,058,777 | | | | – | | | | (5,998,288 | ) | | | – | | | | 20,189,676 | | | | 444,407 | | | | 301,832 | | | | 5,133,986 | | | | 995,201 | |
| RiverFront Dynamic US Flex-Cap ETF | | | 7,594,579 | | | | – | | | | (2,665,274 | ) | | | – | | | | 7,565,220 | | | | 161,273 | | | | 83,066 | | | | 2,003,686 | | | | 632,229 | |
| | | | 58,104,514 | | | | 7,750,357 | | | | (13,968,319 | ) | | | (1,016,014 | ) | | | 63,268,586 | | | | | | | | 970,296 | | | | 10,328,520 | | | | 2,069,528 | |
| Notes to Financial Statements | |
RiverFront Asset
Allocation Moderate | | Market Value as of October 31, 2020 | | Purchases | | Sales | | Liquidation/
Reverse
Stock Split | | Market Value as of October 31, 2021 | | Share Balance as of October 31, 2021 | | Dividends | | Change in Unrealized Gain (Loss) | | Realized
Gain/Loss |
| RiverFront Dynamic Core Income ETF | | $ | 19,601,582 | | | $ | 4,271,356 | | | $ | (2,259,828 | ) | | $ | – | | | $ | 21,109,339 | | | | 832,985 | | | $ | 356,888 | | | $ | (583,333 | ) | | $ | 79,561 | |
| RiverFront Dynamic Unconstrained Income ETF | | | 858,377 | | | | – | | | | (98,571 | ) | | | (778,537 | ) | | | – | | | | – | | | | 31,122 | | | | 5,125 | | | | 13,714 | |
| Riverfront Strategic Income Fund | | | 1,394,780 | | | | 864,940 | | | | (722,435 | ) | | | – | | | | 1,543,191 | | | | 62,528 | | | | 24,792 | | | | (914 | ) | | | 6,820 | |
| First Trust RiverFront Dynamic Developed International ETF | | | 2,499,730 | | | | 2,679,083 | | | | (571,363 | ) | | | – | | | | 5,754,807 | | | | 78,887 | | | | 91,660 | | | | 1,104,057 | | | | 43,300 | |
| RiverFront Dynamic US Dividend Advantage ETF | | | 16,246,515 | | | | – | | | | (4,462,603 | ) | | | – | | | | 16,916,220 | | | | 372,353 | | | | 256,506 | | | | 4,317,248 | | | | 815,060 | |
| RiverFront Dynamic US Flex-Cap ETF | | | 5,163,846 | | | | – | | | | (3,915,629 | ) | | | – | | | | 2,890,510 | | | | 61,619 | | | | 54,164 | | | | 705,268 | | | | 937,025 | |
| | | | 45,764,830 | | | | 7,815,379 | | | | (12,030,429 | ) | | | (778,537 | ) | | | 48,214,067 | | | | | | | | 815,132 | | | | 5,547,451 | | | | 1,895,480 | |
8. MANAGEMENT AND RELATED-PARTY TRANSACTIONS
ALPS Advisors, Inc. (the “AAI”) acts as the Funds’ investment adviser. AAI is an indirect wholly owned subsidiary of DST Systems, Inc. (“DST”). DST is a wholly-owned subsidiary of SS&C Technologies Holdings, Inc. (“SS&C”), a publicly traded company listed on the NASDAQ Global Select Market.
AAI has delegated daily management of the Funds listed below to the corresponding Sub-Advisor(s) listed in the table below. Each Sub-Advisor manages the investments of the Fund in accordance with its investment objective, policies and limitations and investment guidelines established jointly by AAI and the Board.
| Fund | Sub-Advisor(s) |
| ALPS | CoreCommodity Management CompleteCommodities® Strategy Fund | CoreCommodity Management, LLC |
| ALPS | Kotak India Growth Fund | Kotak Mahindra Asset Management (Singapore) Pte. Ltd |
| ALPS | Smith Short Duration Bond Fund | Smith Capital Investors, LLC |
| ALPS | Smith Total Return Bond Fund | Smith Capital Investors, LLC |
| ALPS | Smith Credit Opportunities Fund | Smith Capital Investors, LLC |
| ALPS | Smith Balanced Opportunity Bond Fund | Smith Capital Investors, LLC |
| ALPS | Red Rocks Global Opportunity Fund | Red Rocks Capital, LLC(a) |
| Clough China Fund | Clough Capital Partners, LP |
| RiverFront Asset Allocation Aggressive | RiverFront Investment Group, LLC |
| RiverFront Asset Allocation Growth & Income | RiverFront Investment Group, LLC |
| RiverFront Asset Allocation Moderate | RiverFront Investment Group, LLC |
| (a) | Red Rocks Capital, LLC is a subsidiary of ALPS Advisors, Inc. |
Notes to Financial Statements
October 31, 2021
Pursuant to the Investment Advisory Agreement (the “Advisory Agreement”), the Funds listed below pay AAI an annual management fee which is based on each Fund’s average daily net assets. The management fee is paid on a monthly basis. The following table reflects the Funds’ contractual management fee rates (expressed as an annual rate).
| Fund | Contractual Management Fee |
| ALPS | CoreCommodity Management CompleteCommodities® Strategy Fund | 0.85% |
| ALPS | Kotak India Growth Fund | 0.65% |
| ALPS | Smith Short Duration Bond Fund | 0.37% |
| ALPS | Smith Total Return Bond Fund | 0.55% |
| ALPS | Smith Credit Opportunities Fund | 0.75% |
| ALPS | Smith Balanced Opportunity Bond Fund | 0.70% |
| ALPS | Red Rocks Global Opportunity Fund | 0.85% |
| Clough China Fund | 1.00% |
Pursuant to the Administrative Services Agreement, the Riverfront Funds listed below pay an annual unitary administrative fee which is based on each Fund’s average daily net assets. The unitary administrative fee is paid on a monthly basis. The following table reflects the Funds’ contractual unitary administrative fee rates (expressed as an annual rate).
| Fund | Contractual Unitary Fee |
| RiverFront Asset Allocation Aggressive | 0.25% |
| RiverFront Asset Allocation Growth & Income | 0.25% |
| RiverFront Asset Allocation Moderate | 0.25% |
Pursuant to an Investment Sub-advisory Agreement, AAI pays the Sub-Advisors of the Funds listed below an annual sub-advisory management fee which is based on each Fund’s average daily assets. AAI is required to pay all fees due to each Sub-Advisor out of the management fee AAI receives from each Fund listed below. The following table reflects the Funds’ contractual sub-advisory fee rates.
Fund | Average Daily Net Assets
of the Fund |
Contractual Sub-Advisory Fee |
| ALPS | CoreCommodity Management CompleteCommodities® Strategy Fund | All Asset Levels | 0.75% |
| ALPS | Kotak India Growth Fund | All Asset Levels | 0.56% |
| ALPS | Smith Short Duration Bond Fund | All Asset Levels | 0.29% |
| ALPS | Smith Total Return Bond Fund | All Asset Levels | 0.42% |
| ALPS | Smith Credit Opportunities Fund | All Asset Levels | 0.50% |
| ALPS | Smith Balanced Opportunity Bond Fund | All Asset Levels | 0.37% |
| ALPS | Red Rocks Global Opportunity Fund | All Asset Levels | 0.57% |
| Clough China Fund | All Asset Levels | 0.67% |
Notes to Financial Statements
October 31, 2021
ALPS | CoreCommodity Management CompleteCommodities® Strategy Fund
AAI and CoreCommodity Management LLC have contractually agreed to limit the amount of the Fund’s total annual expenses, exclusive of distribution and service (12b-1) fees, shareholder services fees, acquired fund fees and expenses, brokerage commissions, interest expense, taxes and extraordinary expenses that exceed the following annual rates below.
ALPS | Kotak India Growth Fund
Prior to April 1, 2017, AAI and Kotak Mahindra (UK) Limited have contractually agreed to limit the amount of the Fund’s total annual expenses, exclusive of distribution and service (12b-1) fees, shareholder services fees, acquired fund fees and expenses, brokerage expenses, interest expenses, taxes and extraordinary expenses that exceed the following annual rates below. Effective April 1, 2017, Kotak entered into a Novation Agreement with the Fund, AAI and Kotak Mahindra Asset Management (Singapore) Pte. Ltd. (“KMAMS”), another wholly owned subsidiary of Kotak Mahindra Bank Limited, whereby KMAMS will assume all of Kotak’s rights and obligations under the current Sub-Advisory Agreement.
ALPS | Smith Short Duration Bond Fund
AAI and Smith Capital Investors, LLC have agreed contractually to limit the amount of the Fund’s total annual expenses, exclusive of distribution and service (12b-1) fees, shareholder service fees, acquired fund fees and expenses, brokerage expenses, interest expenses, taxes and extraordinary expenses that exceed the following annual rates below.
ALPS | Smith Total Return Bond Fund
AAI and Smith Capital Investors, LLC have agreed contractually to limit the amount of the Fund’s total annual expenses, exclusive of distribution and service (12b-1) fees, shareholder service fees, acquired fund fees and expenses, brokerage expenses, interest expenses, taxes and extraordinary expenses that exceed the following annual rates below.
ALPS | Smith Credit Opportunities Fund
AAI and Smith Capital Investors, LLC have agreed contractually to limit the amount of the Fund’s total annual expenses, exclusive of distribution and service (12b-1) fees, shareholder service fees, acquired fund fees and expenses, brokerage expenses, interest expenses, taxes and extraordinary expenses that exceed the following annual rates below.
ALPS | Smith Balanced Opportunity Bond Fund
AAI and Smith Capital Investors, LLC have agreed contractually to limit the amount of the Fund’s total annual expenses, exclusive of distribution and service (12b-1) fees, shareholder service fees, acquired fund fees and expenses, brokerage expenses, interest expenses, taxes and extraordinary expenses that exceed the following annual rates below.
ALPS | Red Rocks Global Opportunity Fund
AAI and Red Rocks Capital LLC have contractually agreed to limit the amount of the Fund’s total annual expenses, exclusive of distribution and service (12b-1) fees, acquired fund fees and expenses, shareholder service fees, brokerage expenses, interest expense, taxes and extraordinary expenses that exceed the following annual rates below.
Clough China Fund
AAI has contractually agreed to limit the amount of the Fund’s total annual expenses, exclusive of acquired fund fees and expenses, interest, taxes, brokerage costs and commissions, dividend and interest expense on short sales, litigation, indemnification and extraordinary expenses as determined under generally accepted accounting principles that exceed the following annual rates below.
Notes to Financial Statements
October 31, 2021
These agreements are reevaluated on an annual basis. Expense limitation ratios from the current agreements are listed below. Fees waived or reimbursed for the Fiscal Year Ended October 31, 2021 are disclosed on the Statement of Operations or Consolidated Statement of Operations.
| Fund* | Investor Class | Class A | Class C | Class I | Class II | Class R |
| ALPS | CoreCommodity Management CompleteCommodities® Strategy Fund | 1.05% | 1.05% | 1.05% | 1.15% | N/A | N/A |
| ALPS | Kotak India Growth Fund | 1.00%(a) | 1.00%(a) | 1.00%(a) | 1.00%(a) | 0.75% | N/A |
| ALPS | Smith Short Duration Bond Fund | 0.49% | 0.49% | 0.49% | 0.49% | N/A | N/A |
| ALPS | Smith Total Return Bond Fund | 0.64%(b) | 0.64%(b) | 0.64%(b) | 0.64%(b) | N/A | N/A |
| ALPS | Smith Credit Opportunities Fund | 0.90% | 0.90% | 0.90% | 0.90% | N/A | N/A |
| ALPS | Smith Balanced Opportunity Bond Fund | 0.85% | 0.85% | 0.85% | 0.85% | N/A | N/A |
| ALPS | Red Rocks Global Opportunity Fund | 1.25% | 1.25% | 1.25% | 1.25% | N/A | 1.25% |
| Clough China Fund(c) | 1.60% | 1.60% | 2.35% | 1.35% | N/A | N/A |
| * | See each Fund’s Performance Update section for Expense Limitation agreement expiration dates |
| (a) | Effective December 2, 2019, the expense limitation changed from 1.60% to 1.00%, ecluding, among other fees and expenses, 12b-1 fees and shareholder service fees. |
| (b) | Effective June 30, 2021, the expense limitation changed from 0.67% to 0.64%, excluding, among other fees and expenses, 12b-1 fees and shareholder service fees. |
| (c) | Effecive August 18, 2020, the Clough China Fund changed their expense limitation ratios. Prior to August 18, 2020, Clough China’s expense limitation ratios for Investor Class, Class A, Class C, and Class I were 1.95%, 1.95%, 2.70%, and 1.70%, respectively. |
Notes to Financial Statements
October 31, 2021
The Advisor(s) and each Sub-Advisor are permitted to recover expenses they have waived or reimbursed, on a class-by-class basis, through the agreements described above to the extent that expenses in later periods fall below the annual limits set forth in these agreements. The ALPS | CoreCommodity Management CompleteCommodities® Strategy Fund, ALPS | Kotak India Growth Fund, ALPS | Smith Short Duration Bond Fund, ALPS | Smith Total Return Bond Fund, ALPS | Smith Balanced Opportunity Fund, ALPS | Smith Credit Opportunities Fund, ALPS | Red Rocks Global Opportunity Fund, and Clough China Fund are not obligated to pay any deferred fees and expenses more than thirty-six months after the date on which the fees was waived or expenses were deferred, as calculated on a monthly basis. As of the Fiscal Year Ended October 31, 2021, the Advisor and Sub-Advisor(s) may seek reimbursement of previously waived and reimbursed fees as follows:
| Fund | Expires 10/31/22 | Expires 10/31/23 | Expires 10/31/24 | Total |
| ALPS | Kotak India Growth Fund - Investor Class | 74,841 | 12,723 | 75 | 87,639 |
| ALPS | Kotak India Growth Fund - Class A | N/A | N/A | 0 | 0 |
| ALPS | Kotak India Growth Fund - Class C | 29,495 | 5,803 | 67 | 35,365 |
| ALPS | Kotak India Growth Fund - Class I | 228,024 | 60,338 | 641 | 289,003 |
| ALPS | Kotak India Growth Fund - Class II | N/A | 411,967 | 465,777 | 877,744 |
| ALPS | Smith Short Duration Bond Fund - Investor Class | 1,603 | 2,510 | 16,881 | 20,994 |
| ALPS | Smith Short Duration Bond Fund - Class A | 752 | 2,600 | 9,476 | 12,828 |
| ALPS | Smith Short Duration Bond Fund - Class C | 1,398 | 1,915 | 1,817 | 5,130 |
| ALPS | Smith Short Duration Bond Fund - Class I | 105,940 | 184,309 | 320,901 | 611,150 |
| ALPS | Smith Total Return Bond Fund - Investor Class | 2,913 | 3,483 | 2,940 | 9,336 |
| ALPS | Smith Total Return Bond Fund - Class A | 1,933 | 4,094 | 5,556 | 11,583 |
| ALPS | Smith Total Return Bond Fund - Class C | 458 | 2,094 | 4,192 | 6,744 |
| ALPS | Smith Total Return Bond Fund - Class I | 128,360 | 461,477 | 1,175,366 | 1,765,203 |
| ALPS | Smith Credit Opportunities Fund - Investor Class | N/A | 914 | 3,188 | 4,102 |
| ALPS | Smith Credit Opportunities Fund - Class A | N/A | 1,477 | 1,196 | 2,673 |
| ALPS | Smith Credit Opportunities Fund - Class C | N/A | 739 | 594 | 1,333 |
| ALPS | Smith Credit Opportunities Fund - Class I | N/A | 21,264 | 158,423 | 179,687 |
| ALPS | Smith Balanced Opportunity Fund - Investor Class | N/A | 1,277 | 3,910 | 5,187 |
| ALPS | Smith Balanced Opportunity Fund - Class A | N/A | 2,362 | 6,318 | 8,680 |
| ALPS | Smith Balanced Opportunity Fund - Class C | N/A | 1,181 | 3,152 | 4,333 |
| ALPS | Smith Balanced Opportunity Fund - Class I | N/A | 26,090 | 134,501 | 160,591 |
| Clough China Fund - Investor Class | 31,929 | 28,455 | 21,792 | 82,176 |
| Clough China Fund - Class A | 1,835 | 3,601 | 3,022 | 8,458 |
| Clough China Fund - Class C | 8,760 | 4,818 | 2,175 | 15,753 |
| Clough China Fund - Class I | 66,102 | 73,774 | 63,719 | 203,595 |
The CoreCommodity Management Cayman Commodity Fund Ltd. (the “Subsidiary”) has each entered into a separate advisory agreement (the “Subsidiary Advisory Agreement”) with CoreCommodity Management, LLC for the management of the Subsidiary’s portfolio pursuant to which the Subsidiary is obligated to pay the CoreCommodity Management, LLC a management fee at the same rate that the Fund pays AAI for investment advisory services provided to the Funds. CoreCommodity Management, LLC has agreed to waive the advisory fee it receives from the Fund in an amount equal to the management fee paid by the Subsidiary. This agreement may be terminated based on the terms of the Subsidiary Advisory Agreement. For the year ended October 31, 2021, this amount equaled $1,543,180 and is disclosed in the Consolidated Statements of Operations. These waivers are not subject to reimbursement/recoupment.
ALPS | CoreCommodity Management CompleteCommodities® Strategy Fund reimbursed $105 of expenses, ALPS | Kotak India Growth Fund reimbursed $20,200 of expenses, ALPS | Smith Total Return Bond Fund reimbursed $5,374 of expenses, and ALPS | Smith Credit Opportunities Fund reimbursed $75 of expenses during the fiscal year ended October 31, 2021.
The Riverfront Funds do not pay a management fee or contractually limit the amount of each Fund’s total annual expenses.
Notes to Financial Statements
October 31, 2021
Kotak Mahindra Asset Management (Singapore) Pte. Ltd. executed purchase and sale trades in the ALPS | Kotak India Growth Fund with the subadviser’s affiliated broker-dealer, Kotak Securities, (the “affiliate broker”). Fund commissions paid to the affiliate broker were $32,260 during the year ended October 31, 2021.
ALPS Portfolio Solutions Distributor, Inc. (the “Distributor”) acts as the distributor of the Funds’ shares pursuant to a Distribution Agreement with the Trust. Shares are sold on a continuous basis by the Distributor, as agent for the Funds, and the Distributor has agreed to use its best efforts to solicit orders for the sale of Funds’ shares, although it is not obliged to sell any particular amount of shares. The Distributor is not entitled to any compensation for its services. The Distributor is registered as a broker -dealer with the Securities and Exchange Commission.
Distribution and Services (12b-1) Plans
Each Fund has adopted Distribution and Services Plans (the “Plans”) pursuant to Rule 12b-1 of the 1940 Act for its Investor Class, Class A, Class C and Class R (ALPS | Red Rocks Global Opportunity Fund only) and Investor Class II (Asset Allocation Aggressive only) shares. The Plans allows a Fund to use Investor Class, Class A, Class C, Class R and Investor Class II assets to pay fees in connection with the distribution and marketing of Investor Class, Class A, Class C, Class R and Investor Class II shares and/or the provision of shareholder services to Investor Class, Class A, Class C, Class R and Investor Class II shareholders. The Plans permit payment for services in connection with the administration of plans or programs that use Investor Class, Class A, Class C, Class R and Investor Class II shares of a Fund, if any, as their funding medium and for related expenses. The Plans permit a Fund to make total payments at an annual rate of up to 0.25% of a Fund’s average daily net assets attributable to its Investor Class, Class A and Investor Class II shares, 0.75% of a Fund’s average daily net assets attributable to its Class C shares and 0.50% of the ALPS | Red Rocks Global Opportunity Fund’s average daily net assets attributable to its Class R shares.
Under the terms of the Plans, the Trust is authorized to make payments to the Distributor for remittance to financial intermediaries, as compensation for distribution and/or shareholder ongoing services performed by such entities for beneficial shareholders of the Fund. The Distributor is entitled to retain some or all fees payable under the Plans in certain circumstances, including when there is no broker of record or when certain qualification standards have not been met by the broker of record.
Shareholder Services Plans
Each Fund has adopted a shareholder services plan with respect to their Investor Class shares (the “Investor Class Shareholder Services Plan”). Under the Investor Class Shareholder Services Plan, the Funds are authorized to compensate certain financial intermediaries, including broker dealers and Fund affiliates (“Participating Organizations”), an aggregate fee in an amount not to exceed on an annual basis 0.15% of the average daily net asset value of Investor Class shares of the Funds attributable to or held in the name of the Participating Organizations pursuant to an agreement with a such Participating Organizations (the “Agreement”). Each Agreement will set forth the non-distribution related shareholder services to be performed by the Participating Organizations for the benefit of a Fund’s shareholders who have elected to have such Participating Organizations service their accounts. Any amount of such payment not paid to Participating Organizations during a Fund’s fiscal year for such service activities shall be reimbursed to the Fund as soon as practicable. Shareholder Services Plan fees are included with distribution and service fees in the Statements of Operations. Investor Class Shareholder Services Plan fees recaptured pursuant to the Services Plan for the year ended October 31, 2021 are included as an offset to distribution and service fees as disclosed in the Statements of Operations.
Each Fund has adopted a shareholder services plan with respect to their Class A shares (the “Class A Shareholder Services Plan”). Under the Class A Shareholder Services Plan, the Funds are authorized to compensate certain financial intermediaries, including broker dealers and Fund affiliates, an aggregate fee in an amount not to exceed on an annual basis 0.15% of the average daily net asset value of Class A shares of the Funds attributable to or held in the name of the Participating Organizations pursuant to an agreement with a such Participating Organizations. Each Agreement will set forth the non-distribution related shareholder services to be performed by the Participating Organizations for the benefit of a Fund’s shareholders who have elected to have such Participating Organizations service their accounts. Any amount of such payment not paid to Participating Organizations during a Fund’s fiscal year for such service activities shall be reimbursed to the Fund as soon as practicable. Shareholder Services Plan fees are included with distribution and service fees in the Statements of Operations. Class A Shareholder Services Plan fees recaptured pursuant to the Services Plan for the year ended October 31, 2021 are included as an offset to distribution and service fees as disclosed in the Statements of Operations.
Each Fund has adopted a shareholder services plan with respect to its Class C shares (the “Class C Shareholder Services Plan”). Under the Class C Shareholder Services Plan, the Funds are authorized to pay banks and their affiliates and other institutions, including broker-dealers and Fund affiliates (“Participating Organizations”), an aggregate fee in an amount not to exceed on an annual basis 0.25% for Class C shares of the average daily net asset value of the Class C shares attributable to or held in the name of a Participating Organization for its clients as compensation for providing shareholder service activities, which do not include distribution services, pursuant to an agreement with a Participating Organization. Any amount of such payment not paid to Participating Organizations during a Fund’s fiscal year for such service activities shall be reimbursed to the Fund as soon as practicable after the end of the fiscal year. Class C Shareholder Services Plan fees are included with distribution and service fees on the Statements of Operations.
Notes to Financial Statements
October 31, 2021
Certain intermediaries may charge networking, omnibus account or other administrative fees with respect to transactions in shares of each Fund. Transactions may be processed through the National Securities Clearing Corporation or similar systems or processed on a manual basis. These fees generally are paid by the Fund to the Distributor, which uses such fees to reimburse intermediaries. In the event an intermediary receiving payments from the Distributor on behalf of the Fund converts from a networking structure to an omnibus account structure or otherwise experiences increased costs, fees borne by the Fund may increase. Networking fees are shown in the Statements of Operations, if applicable to the Fund.
ALPS Fund Services, Inc. (“ALPS”) serves as administrator to the Funds and the Funds have agreed to pay expenses incurred in connection with their administrative activities. Pursuant to an Administrative Agreement, ALPS provides operational services to the Funds including, but not limited to, fund accounting and fund administration and generally assists in the Funds’ operations. Officers of the Trust are employees of ALPS. The Funds’ administration fee is accrued on a daily basis and paid monthly. Administration fees paid by the Funds for the Fiscal Year Ended October 31, 2021 are disclosed in the Statement of Operations.
ALPS is reimbursed by the Funds for certain out-of-pocket expenses.
Trustees
The fees and expenses of the independent trustees of the Board are presented in the Statements of Operations.
9. INDEMNIFICATIONS
Under the Trust’s organizational documents, its officers and Trustees are indemnified against certain liability arising out of the performance of their duties to the Trust. Additionally, in the normal course of business, the Trust enters into contracts with service providers that may contain general indemnification clauses which may permit indemnification to the extent permissible under applicable law. The Trust’s maximum exposure under these arrangements is unknown, as this would involve future claims that may be made against the Trust that have not yet occurred.
10. SUBSEQUENT EVENTS
Riverfront Asset Allocation Aggressive and RiverFront Asset Allocation Moderate are merging into RiverFront Asset Allocation Growth & Income Fund and is expected to close on January 21, 2022.
Report of Independent Registered Public Accounting Firm
To the shareholders and the Board of Trustees of Financial Investors Trust
Opinion on the Financial Statements and Financial Highlights
We have audited the accompanying statements of assets and liabilities of Financial Investors Trust (the "Trust") comprising the funds listed in Appendix A, including the statements of investments as of October 31, 2021, the related statements of operations, statements of changes in net assets, and financial highlights for the periods indicated in Appendix A, and the related notes. In our opinion, the financial statements present fairly, in all material respects, the financial position of each of the Funds constituting the Financial Investors Trust as of October 31, 2021, the results of their operations, changes in their net assets, and financial highlights for each of the periods indicated in Appendix A, in conformity with accounting principles generally accepted in the United States of America.
Basis for Opinion
These financial statements and financial highlights are the responsibility of the Funds’ management. Our responsibility is to express an opinion on the Funds’ financial statements and financial highlights based on our audits. We are a public accounting firm registered with the Public Company Accounting Oversight Board (United States) (PCAOB) and are required to be independent with respect to the Funds in accordance with the U.S. federal securities laws and the applicable rules and regulations of the Securities and Exchange Commission and the PCAOB.
We conducted our audits in accordance with the standards of the PCAOB. Those standards require that we plan and perform the audit to obtain reasonable assurance about whether the financial statements and financial highlights are free of material misstatement, whether due to error or fraud. The Funds are not required to have, nor were we engaged to perform, an audit of their internal control over financial reporting. As part of our audits we are required to obtain an understanding of internal control over financial reporting but not for the purpose of expressing an opinion on the effectiveness of the Funds’ internal control over financial reporting. Accordingly, we express no such opinion.
Our audits included performing procedures to assess the risks of material misstatement of the financial statements and financial highlights, whether due to error or fraud, and performing procedures that respond to those risks. Such procedures included examining, on a test basis, evidence regarding the amounts and disclosures in the financial statements and financial highlights. Our audits also included evaluating the accounting principles used and significant estimates made by management, as well as evaluating the overall presentation of the financial statements and financial highlights. Our procedures included confirmation of securities owned as of October 31, 2021, by correspondence with the custodian and brokers; when replies were not received from brokers, we performed other auditing procedures. We believe that our audits provide a reasonable basis for our opinion.
DELOITTE & TOUCHE LLP
Denver, Colorado
December 30, 2021
We have served as the auditor of one or more investment companies advised by ALPS Advisors, Inc. since 2007.
Report of Independent Registered Public Accounting Firm
Appendix A
| Fund | Statements of Assets and Liabilities, including the Statement of Investments | Statements of Operations, For the Year Ended | Statements of Changes in Net Assets for each of the Years in the Period Then Ended | Financial Highlights for each of the Years in the Period Then Ended |
| ALPS | Red Rocks Global Opportunity Fund1 | 10/31/2021 | 10/31/2021 | 10/31/2021, Two Years | 10/31/2021, Five Years |
| Clough China Fund | 10/31/2021 | 10/31/2021 | 10/31/2021, Two Years | 10/31/2021, Five Years |
| RiverFront Asset Allocation Aggressive | 10/31/2021 | 10/31/2021 | 10/31/2021, Two Years | 10/31/2021, Five Years |
| RiverFront Asset Allocation Growth & Income | 10/31/2021 | 10/31/2021 | 10/31/2021, Two Years | 10/31/2021, Five Years |
| RiverFront Asset Allocation Moderate | 10/31/2021 | 10/31/2021 | 10/31/2021, Two Years | 10/31/2021, Five Years |
| ALPS | Smith Short Duration Bond Fund2 | 10/31/2021 | 10/31/2021 | 10/31/2021, Two Years | 10/31/20212 |
| ALPS | Smith Total Return Bond Fund2 | 10/31/2021 | 10/31/2021 | 10/31/2021, Two Years | 10/31/20212 |
| ALPS | Smith Balanced Opportunity Fund3 | 10/31/2021 | 10/31/2021 | 10/31/20213, Two Years | 10/31/20213 |
| ALPS | Smith Credit Opportunities Fund3 | 10/31/2021 | 10/31/2021 | 10/31/20213, Two Years | 10/31/20213 |
| ALPS | Kotak India Growth Fund | 10/31/2021 | 10/31/2021 | 10/31/2021, Two Years | 10/31/2021, Five Years |
| ALPS | CoreCommodity Management CompleteCommodities® Strategy Fund4 | 10/31/2021 | 10/31/2021 | 10/31/2021, Two Years | 10/31/2021, Five Years |
| 1 | Formerly ALPS | Red Rocks Listed Private Equity Fund. |
| 2 | Financial Highlights for each of the three years in the period ending October 31, 2021 and for the period July 2, 2018 (commencement of operations) to October 31, 2018. |
| 3 | Statements of Changes in Net Assets and Financial Highlights for the period ending October 31, 2021 and for the period September 16, 2020 (commencement of operations) to October 31, 2020. |
| 4 | Consolidated Statements of Assets and Liabilities, including the Consolidated Statements of Investments, related Consolidated Statements of Operations, the Consolidated Statements of Changes in Net Assets, and the Consolidated Financial Highlights. |
Additional Information
October 31, 2021 (Unaudited)
1. FUND HOLDINGS
The Funds’ portfolio holdings are made available semi-annually in shareholder reports within 60 days after the close of the period for which the report is being made, as required by federal securities laws. The Funds also file monthly portfolio holdings on Form N-PORT on a quarterly basis, with the schedule of portfolio holdings filed on Form N-PORT for the third month of each Fund’s fiscal quarter made publicly available 60 days after the end of the Funds’ fiscal quarter.
2. FUND PROXY VOTING POLICIES, PROCEDURES AND SUMMARIES
Fund policies and procedures used in determining how to vote proxies and information regarding how each of the Funds voted proxies relating to portfolio securities during the most recent prior 12-month period ending June 30 are available without charge, (1) upon request, by calling (toll-free) (866) 759-5679 and (2) on the SEC’s website at http://www.sec.gov.
3. TAX DESIGNATIONS
Of the distributions paid by the Funds from ordinary income for the calendar year ended December 31, 2019, the following percentages met the requirements to be treated as qualifying for qualified dividend income and the corporate dividends received deduction:
| | QDI | DRD |
| ALPS|Core Commodity Management Complete Commodities® Strategy Fund | 70.67% | 20.53% |
| ALPS|Kotak India Growth Fund | N/A | N/A |
| ALPS Smith Total Return Bond Fund | 0.61% | 0.61% |
| ALPS Smith Short Duration Bond Fund | N/A | N/A |
| ALPS|Red Rocks Global Opportunity Fund | 15.50% | 2.69% |
| Clough China Fund | 59.68% | 1.66% |
| RiverFront Asset Allocation Growth & Income Fund | 80.40% | 37.62% |
| RiverFront Asset Allocation Moderate Fund | 61.52% | 49.49% |
| RiverFront Asset Allocation Aggressive Fund | 100% | 47.03% |
In early 2021, if applicable, shareholders of record received this information for the distribution paid to them by the Funds during the calendar year 2020 via Form 1099. The Funds will notify shareholders in early 2022 of amounts paid to them by the Funds, if any, during the calendar year 2021.
Pursuant to Section 852(b)(3) of the Internal Revenue Code the Funds designate the following amounts as long-term capital gain dividends:
| ALPS|Core Commodity Management Complete Commodities® Strategy Fund | | $ | – | |
| ALPS|Kotak India Growth Fund | | $ | 363,112 | |
| ALPS Smith Total Return Bond Fund | | $ | 8,170 | |
| ALPS Smith Short Duration Bond Fund | | $ | 7,397 | |
| ALPS|Red Rocks Global Opportunity Fund | | $ | 11,394,100 | |
| Clough China Fund | | $ | 2,743,546 | |
| RiverFront Asset Allocation Growth & Income Fund | | $ | – | |
| RiverFront Asset Allocation Moderate Fund | | $ | – | |
| RiverFront Asset Allocation Aggressive Fund | | $ | – | |
The Funds below designate the following amounts for federal income tax purposes for the fiscal year ended October 31, 2021:
| | | Foreign Taxes Paid | | | Foreign Source Income | |
| ALPS l Kotak India Growth Fund | | $ | 1,796,374 | | | $ | 2,503,721 | |
4. DISCLOSURE REGARDING APPROVAL OF FUND ADVISORY AND SUB-ADVISORY AGREEMENTS
CoreCommodity Fund
On June 17, 2020, the Trustees met via electronic means (videoconference)1 to discuss, among other things, the approval of the Investment Advisory Agreement between Financial Investors Trust (the “Trust”), with respect to the ALPS/CoreCommodity Management CompleteCommodities Strategy Fund (the “CoreCommodity Fund”) and ALPS Advisors, Inc. (“AAI”), and the Sub-Advisory Agreement among the Trust, with respect to the CoreCommodity Fund, CoreCommodity Management, LLC (“CoreCommodity”), and AAI, in accordance with Section 15(c) of the 1940 Act. The Independent Trustees met with independent legal counsel during executive session and discussed the Investment Advisory Agreement and Sub-Advisory Agreement and other related materials. In renewing and approving the Investment Advisory Agreement and the
Additional Information
October 31, 2021 (Unaudited)
Investment Sub-Advisory Agreement, the Trustees, including the Independent Trustees, considered the following factors with respect to the CoreCommodity Fund:
Investment Advisory and Sub-Advisory Fee Rates: The Trustees reviewed and considered the contractual annual advisory fee rate paid by the Trust, on behalf of the CoreCommodity Fund, to AAI, of 0.85% of the CoreCommodity Fund’s daily average net assets, in light of the extent and quality of the advisory services provided by AAI to the CoreCommodity Fund. The Trustees also reviewed and considered the contractual annual sub-advisory fee rate paid by AAI to CoreCommodity of 0.75% of the CoreCommodity Fund’s daily average net assets, in light of the extent and quality of the advisory services provided by CoreCommodity to the CoreCommodity Fund. The Trustees also considered information regarding compensation paid to affiliates of AAI under other agreements, such as the Fund Accounting and Administration Agreement with ALPS.
The Board received and considered information including a comparison of the CoreCommodity Fund’s contractual and gross advisory fee rates with those of funds in the peer group as selected by an independent provider of investment company data (the “Data Provider”). The Trustees noted that the contractual and gross advisory fee rate for each class of the CoreCommodity Fund was above the respective Data Provider peer group median rate.
Total Net Expense Ratios: The Trustees further reviewed and considered the total net expense ratios of 1.40%, 2.05%, 1.14%, and 1.39% for the Class A, Class C, Class I, and Investor Class shares, respectively, of the CoreCommodity Fund. The Trustees noted that the total net expense ratio of each class of the CoreCommodity Fund was above the respective Data Provider peer group median ratio.
Nature, Extent, and Quality of the Services under the Investment Advisory and Sub-Advisory Agreements: The Trustees received and considered information regarding the nature, extent, and quality of services provided to the CoreCommodity Fund under the Investment Advisory and Sub-Advisory Agreements. The Trustees reviewed certain background materials supplied by AAI and CoreCommodity in their presentations, including their Forms ADV.
The Trustees reviewed and considered AAI’s and CoreCommodity’s investment advisory personnel, their history as asset managers, and their performance and the amount of assets currently under management by AAI and CoreCommodity and their affiliated entities. The Trustees also reviewed the research and decision-making processes utilized by AAI and CoreCommodity, including the methods adopted to seek to achieve compliance with the investment objectives, policies, and restrictions of the CoreCommodity Fund.
The Trustees considered the background and experience of AAI’s and CoreCommodity’s management in connection with the CoreCommodity Fund, including reviewing the qualifications, backgrounds, and responsibilities of the management team primarily responsible for the day-to-day portfolio management of the CoreCommodity Fund and the extent of the resources devoted to research and analysis of actual and potential investments.
The Trustees also reviewed, among other things, AAI’s and CoreCommodity’s insider trading policies and procedures and their Codes of Ethics.
Performance: The Trustees reviewed performance information for the CoreCommodity Fund, which included a comparison of the CoreCommodity Fund’s performance to the performance of a universe of comparable funds selected by the Data Provider. The Trustees noted that the performance of each class of the CoreCommodity Fund, for the period ended March 31, 2020, was generally below the respective Data Provider peer group median performance for the three month, one year, three year, and five year periods, as applicable, and generally above the respective Data Provider peer group median performance for the since inception period. The Trustees also considered CoreCommodity’s investment performance and reputation generally and its investment techniques, risk management controls, and decision-making processes.
Comparable Accounts: The Trustees noted certain information provided by CoreCommodity regarding fees charged to its other clients utilizing a strategy similar to that employed by the CoreCommodity Fund. The Trustees also noted that AAI indicated that it had no other clients utilizing a strategy similar to that employed by the CoreCommodity Fund.
Profitability: The Trustees received and considered the profitability analyses prepared by AAI and CoreCommodity based on the fees payable under the Investment Advisory Agreement with AAI and the Investment Sub-Advisory Agreement with CoreCommodity with respect to the CoreCommodity Fund, respectively. The Trustees considered the profits, if any, realized by AAI and CoreCommodity in connection with the operation of the CoreCommodity Fund.
Economies of Scale: The Trustees considered whether economies of scale in the provision of services to the CoreCommodity Fund will be passed along to the shareholders under the agreements.
Other Benefits to the Adviser and Sub-Adviser: The Trustees reviewed and considered any other incidental benefits derived or to be derived by AAI and CoreCommodity from their relationship with the CoreCommodity Fund, including whether soft dollar arrangements were used.
Additional Information
October 31, 2021 (Unaudited)
The Trustees, including all of the Independent Trustees, concluded that:
| ● | the contractual and gross advisory fee rate for each class of the CoreCommodity Fund was above the respective Data Provider peer group median rate; |
| ● | CoreCommodity’s fees under its sub-advisory agreements are paid directly by AAI; |
| ● | the total net expense ratio of each class of the CoreCommodity Fund was above the respective Data Provider peer group median ratio; |
| ● | the nature, extent, and quality of services rendered by AAI and CoreCommodity under the Investment Advisory and Sub-Advisory Agreements, respectively, with respect to the CoreCommodity Fund were adequate; |
| ● | the performance of each class of the CoreCommodity Fund, for the period ended March 31, 2020, was generally below the respective Data Provider peer group median performance for the three month, one year, three year, and give year periods, as applicable, and generally above the respective Data Provider peer group median performance for the since inception period; |
| ● | that (a) AAI had no other clients utilizing a strategy similar to that employed by the CoreCommodity Fund, and (b) bearing in mind the limitations of comparing different types of managed accounts and the different levels of service typically associated with such accounts, the fee structures applicable to CoreCommodity’s other clients employing a comparable strategy to the CoreCommodity Fund was not indicative of any unreasonableness with respect to the advisory and sub-advisory fees proposed to be payable by the CoreCommodity Fund; |
| ● | the profit, if any, realized by AAI and CoreCommodity in connection with the operation of the CoreCommodity Fund is not unreasonable to the CoreCommodity Fund; and |
| ● | there were no material economies of scale or other incidental benefits accruing to AAI and CoreCommodity in connection with their relationship with the CoreCommodity Fund. |
Based on the Trustees’ deliberations and their evaluation of the information described above, the Trustees, including all of the Independent Trustees, concluded that AAI’s and CoreCommodity’s compensation for investment advisory and sub-advisory services is consistent with the best interests of the CoreCommodity Fund and its shareholders.
RiverFront Funds
On June 17, 2020, the Trustees met via electronic means (videoconference)1 to discuss, among other things, the approval of the Investment Advisory Agreement between Financial Investors Trust (the “Trust”), with respect to RiverFront Asset Allocation Aggressive, RiverFront Asset Allocation Growth, RiverFront Asset Allocation Growth & Income, RiverFront Asset Allocation Moderate, and RiverFront Asset Allocation Income & Growth (collectively, the “RiverFront Funds”) and ALPS Advisors, Inc. (“AAI”), and the Sub-Advisory Agreement among the Trust, with respect to the RiverFront Funds, RiverFront Investment Group, LLC (“RiverFront”), and AAI, in accordance with Section 15(c) of the 1940 Act. The Independent Trustees met with independent legal counsel during executive session and discussed the Investment Advisory Agreement and Sub-Advisory Agreement and other related materials. In renewing and approving the Investment Advisory Agreement and the Investment Sub-Advisory Agreement, the Trustees, including the Independent Trustees, considered the following factors with respect to the RiverFront Funds:
Investment Advisory and Sub-Advisory Fee Rates: There are no investment advisory or sub-advisory fees paid with respect to the RiverFront Funds. The Trustees also considered information regarding compensation to be paid to affiliates of AAI under other agreements, such as the Fund Accounting and Administration Agreement with ALPS.
Total Net Expense Ratios: The Trustees reviewed and considered the total net expense ratios of the Class A, Class C, Class I, Investor Class, Investor Class II, and Class L shares of the RiverFront Funds. The Trustees noted that for RiverFront Asset Allocation Aggressive, the total net expense ratio was generally higher than the peer group median ratio for each class of shares, and for RiverFront Asset Allocation Growth & Income and RiverFront Asset Allocation Moderate, the total net expense ratio was generally lower than the peer group median ratio for each class of shares.
Nature, Extent, and Quality of the Services under the Investment Advisory and Sub-Advisory Agreements: The Trustees received and considered information regarding the nature, extent, and quality of services provided to the RiverFront Funds under the Investment Advisory and Sub-Advisory Agreements. The Trustees reviewed certain background materials supplied by AAI and RiverFront in their presentations, including their Forms ADV.
Additional Information
October 31, 2021 (Unaudited)
The Trustees reviewed and considered AAI’s and RiverFront’s investment advisory personnel, their history as asset managers and their performance and the amount of assets currently under management by AAI and RiverFront and their affiliated entities. The Trustees also reviewed the research and decision-making processes utilized by AAI and RiverFront, including the methods adopted to seek to achieve compliance with the investment objectives, policies, and restrictions of the RiverFront Funds.
The Trustees considered the background and experience of AAI’s and RiverFront’s management in connection with the RiverFront Funds, including reviewing the qualifications, backgrounds, and responsibilities of the management team primarily responsible for the day-to-day portfolio management of the RiverFront Funds and the extent of the resources devoted to research and analysis of actual and potential investments.
The Trustees also reviewed, among other things, AAI’s and RiverFront’s insider trading policies and procedures and their Codes of Ethics.
Performance: The Trustees reviewed performance information for the RiverFront Funds, which included a comparison of each Fund’s performance to the performance of a group of comparable funds selected by the Data Provider. The Trustees noted that the performance of each class of each of the RiverFront Funds was generally below the respective Data Provider peer group median performance for the three month, one year, three year, five year, ten year, and since inception periods ended March 31, 2020, as applicable, except for Class C shares of RiverFront Asset Allocation Moderate. The Trustees also considered RiverFront’s investment performance and reputation generally and its investment techniques, risk management controls, and decision-making processes.
Comparable Accounts: The Trustees noted certain information provided by RiverFront and AAI regarding fees charged to their other clients utilizing a strategy similar to that employed by the RiverFront Funds.
Profitability: The Trustees received and considered the profitability analyses prepared by AAI and RiverFront based on the fees payable under the Investment Advisory Agreement with AAI and the Investment Sub-Advisory Agreement with RiverFront with respect to the RiverFront Funds, respectively. The Trustees considered the profits, if any, realized by AAI and RiverFront in connection with the operation of each RiverFront Fund.
Economies of Scale: The Trustees considered whether economies of scale in the provision of services to the RiverFront Funds will be passed along to the shareholders under the agreements.
Other Benefits to the Adviser and Sub-Adviser: The Trustees reviewed and considered any other incidental benefits derived or to be derived by AAI and RiverFront from their relationship with the RiverFront Funds, including whether soft dollar arrangements were used.
The Trustees, including all of the Independent Trustees, concluded that:
| ● | there are no investment advisory or sub-advisory fees paid with respect to the RiverFront Funds; |
| ● | for RiverFront Asset Allocation Aggressive, the total net expense ratio was generally higher than the peer group median ratio for each class of shares, and for RiverFront Asset Allocation Growth & Income and RiverFront Asset Allocation Moderate, the total net expense ratios were generally lower than the peer group median ratios for each class of shares; |
| ● | the nature, extent, and quality of services rendered by AAI and RiverFront under the Investment Advisory and Sub-Advisory Agreements, respectively, with respect to the RiverFront Funds, as applicable, were adequate; |
| ● | that the performance of each class of each of the RiverFront Funds was generally below the respective Data Provider peer group median performance for the three month, one year, three year, five year, ten year, and since inception periods ended March 31, 2020, as applicable, except for Class C shares of RiverFront Asset Allocation Moderate; |
| ● | bearing in mind the limitations of comparing different types of managed accounts and the different levels of service typically associated with such accounts, the fee structures applicable to AAI’s and RiverFront’s other clients employing a comparable strategy to one or more of the RiverFront Funds were not indicative of any unreasonableness with respect to the advisory and sub-advisory fees proposed to be payable by the RiverFront Funds; |
| ● | the profit, if any, realized by AAI and RiverFront in connection with the operation of the RiverFront Funds, as applicable, is not unreasonable to the RiverFront Funds; and |
Additional Information
October 31, 2021 (Unaudited)
| ● | there were no material economies of scale or other incidental benefits accruing to AAI and RiverFront in connection with their relationship with the RiverFront Funds. |
Based on the Trustees’ deliberations and their evaluation of the information described above, the Trustees, including all of the Independent Trustees, concluded that AAI’s and RiverFront’s compensation for investment advisory and sub-advisory services is consistent with the best interests of the RiverFront Funds and their shareholders.
Kotak Fund
On June 17, 2020, the Trustees met via electronic means (videoconference)1 to discuss, among other things, the approval of the Investment Advisory Agreement between Financial Investors Trust (the “Trust”), with respect to the ALPS/Kotak India Growth Fund (the “Kotak Fund”) and ALPS Advisors, Inc. (“AAI”), and the Sub-Advisory Agreement among the Trust, with respect to the Kotak Fund, Kotak Mahindra Asset Management (Singapore) Pte. Ltd. (“Kotak”), and AAI, in accordance with Section 15(c) of the 1940 Act. The Independent Trustees met with independent legal counsel during executive session and discussed the Investment Advisory Agreement and Sub-Advisory Agreement and other related materials. In renewing and approving the Investment Advisory Agreement and the Investment Sub-Advisory Agreement, the Trustees, including the Independent Trustees, considered the following factors with respect to the Kotak Fund:
Investment Advisory and Sub-Advisory Fee Rates: The Trustees reviewed and considered the contractual annual advisory fee rate paid by the Trust, on behalf of the Kotak Fund, to AAI, of 0.65% of the Kotak Fund’s daily average net assets, in light of the extent and quality of the advisory services provided by AAI to the Kotak Fund. The Trustees also reviewed and considered the contractual annual sub-advisory fee rate paid by AAI to Kotak of 0.56% of the Kotak Fund’s daily average net assets, in light of the extent and quality of the advisory services provided by Kotak to the Kotak Fund. The Trustees also considered information regarding compensation to be paid to affiliates of AAI under other agreements, such as the Fund Accounting and Administration Agreement with ALPS.
The Board received and considered information including a comparison of the Kotak Fund’s contractual and gross advisory fee rates with those of funds in the peer group as selected by an independent provider of investment company data (the “Data Provider”). The Trustees noted that the contractual and gross advisory fee rate for each class of the Kotak Fund was below the respective Data Provider peer group median rate.
Total Net Expense Ratios: The Trustees further reviewed and considered the total net expense ratios of 1.40%, 2.00%, 1.00%, 0.75%, and 1.40% for the Class A, Class C, Class I, Class II, and Investor Class shares, respectively, of the Kotak Fund. The Trustees noted that the total net expense ratio of each class of the Kotak Fund was below the respective Data Provider peer group median ratio.
Nature, Extent, and Quality of the Services under the Investment Advisory and Sub-Advisory Agreements: The Trustees received and considered information regarding the nature, extent, and quality of services to be provided to the Kotak Fund under the Investment Advisory and Sub-Advisory Agreements. The Trustees reviewed certain background materials supplied by AAI and Kotak in their presentations, including their Forms ADV.
The Trustees reviewed and considered AAI’s and Kotak’s investment advisory personnel, their history as asset managers and their performance and the amount of assets currently under management by AAI and Kotak and their affiliated entities. The Trustees also reviewed the research and decision-making processes utilized by AAI and Kotak, including the methods adopted to seek to achieve compliance with the investment objectives, policies, and restrictions of the Kotak Fund.
The Trustees considered the background and experience of AAI’s and Kotak’s management in connection with the Kotak Fund, including reviewing the qualifications, backgrounds, and responsibilities of the management team primarily responsible for the day-to-day portfolio management of the Kotak Fund and the extent of the resources devoted to research and analysis of actual and potential investments.
The Trustees also reviewed, among other things, AAI’s and Kotak’s insider trading policies and procedures and their Codes of Ethics.
Performance: The Trustees reviewed performance information for the Kotak Fund, which included a comparison of the Kotak Fund’s performance to the performance of a group of comparable funds selected by the Data Provider. The Trustees noted that the performance of each class of the Kotak Fund was generally below the respective Data Provider peer group median performance for the three month, one year, three year, and five year periods ended March 31, 2020, as applicable. The Trustees also considered Kotak’s investment performance and reputation generally and its investment techniques, risk management controls, and decision-making processes.
Comparable Accounts: The Trustees noted certain information provided by Kotak regarding fees charged to its other clients utilizing a strategy similar to that employed by the Kotak Fund. The Trustees also noted that AAI indicated that it had no other clients utilizing a strategy similar to that employed by the Kotak Fund.
Additional Information
October 31, 2021 (Unaudited)
Profitability: The Trustees received and considered the profitability analyses prepared by AAI and Kotak based on the fees payable under the Investment Advisory Agreement with AAI and the Investment Sub-Advisory Agreement with Kotak, with respect to the Kotak Fund, respectively. The Trustees considered the profits, if any, realized by AAI and Kotak in connection with the operation of the Kotak Fund.
Economies of Scale: The Trustees considered whether economies of scale in the provision of services to the Kotak Fund will be passed along to the shareholders under the agreements.
Other Benefits to the Adviser and Sub-Adviser: The Trustees reviewed and considered any other incidental benefits derived or to be derived by AAI and Kotak from their relationship with the Kotak Fund, including whether soft dollar arrangements were used.
The Trustees, including all of the Independent Trustees, concluded that:
| ● | the contractual and gross advisory fee rate for each class of the Kotak Fund was below the respective Data Provider peer group median rate; |
| ● | Kotak’s fees under its sub-advisory agreements are paid directly by AAI; |
| ● | the total net expense ratio of each class of the Kotak Fund was below the respective Data Provider peer group median ratio; |
| ● | the nature, extent, and quality of services rendered by AAI and Kotak under the Investment Advisory and Sub-Advisory Agreements, respectively, with respect to the Kotak Fund were adequate; |
| ● | the performance of each class of the Kotak Fund was generally below the respective Data Provider peer group median performance for the three month, one year, three year, and five year periods ended March 31, 2020, as applicable; |
| ● | that (a) AAI had no other clients utilizing a strategy similar to that employed by the Kotak Fund, and (b) bearing in mind the limitations of comparing different types of managed accounts and the different levels of service typically associated with such accounts, the fee structures applicable to Kotak’s other clients employing a comparable strategy to the Kotak Fund was not indicative of any unreasonableness with respect to the advisory and sub-advisory fees proposed to be payable by the Kotak Fund; |
| ● | the profit, if any, realized by AAI and Kotak in connection with the operation of the Kotak Fund is not unreasonable to the Kotak Fund; and |
| ● | there were no material economies of scale or other incidental benefits accruing to AAI and Kotak in connection with their relationship with the Kotak Fund. |
Based on the Trustees’ deliberations and their evaluation of the information described above, the Trustees, including all of the Independent Trustees, concluded that AAI’s and Kotak’s compensation for investment advisory and sub-advisory services is consistent with the best interests of the Kotak Fund and its shareholders.
Red Rocks Fund
On June 17, 2020, the Trustees met via electronic means (videoconference)1 to discuss, among other things, the approval of the Investment Advisory Agreement between Financial Investors Trust (the “Trust”), with respect to the ALPS/Red Rocks Global Opportunity Fund (the “Red Rocks Fund”) and ALPS Advisors, Inc. (“AAI”), and the Sub-Advisory Agreement among the Trust, with respect to the Red Rocks Fund, Red Rocks Capital LLC (“Red Rocks”), and AAI, in accordance with Section 15(c) of the 1940 Act. The Independent Trustees met with independent legal counsel during executive session and discussed the Investment Advisory Agreement and Sub-Advisory Agreement and other related materials. In renewing and approving the Investment Advisory Agreement and the Investment Sub-Advisory Agreement, the Trustees, including the Independent Trustees, considered the following factors with respect to the Red Rocks Fund:
Investment Advisory and Sub-Advisory Fee Rates: The Trustees reviewed and considered the contractual annual advisory fee rate paid by the Trust, on behalf of the Red Rocks Fund, to AAI, of 0.85% of the Red Rocks Fund’s daily average net assets, in light of the extent and quality of the advisory services provided by AAI to the Red Rocks Fund. The Trustees also reviewed and considered the contractual annual sub-advisory fee rate paid by AAI to Red Rocks of 2/3 of the contractual annual advisory fee paid by the Trust to AAI, in light of the extent and quality of the advisory services provided by Red Rocks to the Red Rocks Fund. The Trustees also considered information regarding compensation paid to affiliates of AAI under other agreements, such as the Fund Accounting and Administration Agreement with ALPS.
The Board received and considered information including a comparison of the Red Rocks Fund’s contractual and gross advisory fee rates with those of funds in the peer group as selected by an independent provider of investment company data (the “Data Provider”). The Trustees noted that the
Additional Information
October 31, 2021 (Unaudited)
contractual and gross advisory fee rates for the Red Rocks Fund were generally above the respective Data Provider peer group median rate for Class A and Class C and below the respective Data Provider peer group median rate for Class I, Investor Class, and Class R.
Total Net Expense Ratios: The Trustees further reviewed and considered the total net expense ratios of 1.48%, 2.16%, 1.19%, 1.44%, and 1.61% for the Class A, Class C, Class I, Investor Class, and Class R shares, respectively, of the Red Rocks Fund. The Trustees noted that the total net expense ratios for the Red Rocks Fund were above the respective Data Provider peer group median ratios for Class A and Class C and below the respective Data Provider peer group median ratios for Class I, Investor Class, and Class R.
Nature, Extent, and Quality of the Services under the Investment Advisory and Sub-Advisory Agreements: The Trustees received and considered information regarding the nature, extent, and quality of services to be provided to the Red Rocks Fund under the Investment Advisory and Sub-Advisory Agreements. The Trustees reviewed certain background materials supplied by AAI and Red Rocks in their presentations, including their Forms ADV.
The Trustees reviewed and considered AAI’s and Red Rocks’ investment advisory personnel, their history as asset managers and their performance and the amount of assets currently under management by AAI and Red Rocks and their affiliated entities. The Trustees also reviewed the research and decision-making processes utilized by AAI and Red Rocks, including the methods adopted to seek to achieve compliance with the investment objectives, policies, and restrictions of the Red Rocks Fund.
The Trustees considered the background and experience of AAI’s and Red Rocks’ management in connection with the Red Rocks Fund, including reviewing the qualifications, backgrounds, and responsibilities of the management team primarily responsible for the day-to-day portfolio management of the Red Rocks Fund and the extent of the resources devoted to research and analysis of actual and potential investments.
The Trustees also reviewed, among other things, AAI’s and Red Rocks’ insider trading policies and procedures and their Codes of Ethics.
Performance: The Trustees reviewed performance information for the Red Rocks Fund, which included a comparison of the Red Rocks Fund’s performance to the performance of a peer group selected by the Data Provider. The Trustees noted that the performance of each class of the Red Rocks Fund was below the respective Data Provider peer group median performance for the three month period ended March 31, 2020, and generally above the respective Data Provider peer group median performance for the one year, three year, five year, ten year, and since inception periods, as applicable, ended March 31, 2020, except for Class R, which generally had performance below the Data Provider peer group median performance for all applicable periods. The Trustees also considered Red Rocks’ investment performance and reputation generally and its investment techniques, risk management controls, and decision-making processes.
Comparable Accounts: The Trustees noted certain information provided by Red Rocks and AAI regarding fees charged to their other clients utilizing a strategy similar to that employed by the Red Rocks Fund.
Profitability: The Trustees received and considered a combined profitability analysis prepared by AAI for AAI and Red Rocks based on the fees payable under the Investment Advisory Agreement with AAI and the Sub-Advisory Agreement with Red Rocks, with respect to the Red Rocks Fund.
Economies of Scale: The Trustees considered whether economies of scale in the provision of services to the Red Rocks Fund will be passed along to the shareholders under the agreements.
Other Benefits to the Adviser and Sub-Adviser: The Trustees reviewed and considered any other incidental benefits derived or to be derived by AAI and Red Rocks from their relationship with the Red Rocks Fund, including whether soft dollar arrangements were used.
The Trustees, including all of the Independent Trustees, concluded that:
| ● | the contractual and gross advisory fee rates for the Red Rocks Fund were generally above the respective Data Provider peer group median rates for Class A and Class C and below the respective Data Provider peer group median rates for Class I, Investor Class, and Class R; |
| ● | Red Rocks’ fees under its sub-advisory agreements are paid directly by AAI; |
| ● | the total net expense ratios for the Red Rocks Fund were above the respective Data Provider peer group median ratios for Class A and Class C and below the respective Data Provider peer group median ratios for Class I, Investor Class, and Class R; |
| ● | the nature, extent, and quality of services rendered by AAI and Red Rocks under the Investment Advisory and Sub-Advisory Agreements, respectively, with respect to the Red Rocks Fund were adequate; |
Additional Information
October 31, 2021 (Unaudited)
| ● | the performance of each class of the Red Rocks Fund was below the respective Data Provider peer group median performance for the three month period ended March 31, 2020, and generally above the respective Data Provider peer group median performance for the one year, three year, five year, ten year, and since inception periods, as applicable, ended March 31, 2020, except for Class R, which generally had performance below the Data Provider peer group median performance for all applicable periods; |
| ● | bearing in mind the limitations of comparing different types of managed accounts and the different levels of service typically associated with such accounts, the fee structures applicable to AAI’s and Red Rocks’ other clients employing a comparable strategy to the Red Rocks Fund was not indicative of any unreasonableness with respect to the advisory and sub-advisory fees proposed to be payable by the Red Rocks Fund; |
| ● | the profit, if any, realized by AAI and Red Rocks in connection with the operation of the Red Rocks Fund is not unreasonable to the Red Rocks Fund; and |
| ● | there were no material economies of scale or other incidental benefits accruing to AAI and Red Rocks in connection with their relationship with the Red Rocks Fund. |
Based on the Trustees’ deliberations and their evaluation of the information described above, the Trustees, including all of the Independent Trustees, concluded that AAI’s and Red Rocks’ compensation for investment advisory and sub-advisory services is consistent with the best interests of the Red Rocks Fund and its shareholders.
Clough Fund
On June 17, 2020, the Trustees met via electronic means (videoconference)1 to discuss, among other things, the approval of the Investment Advisory Agreement between Financial Investors Trust (the “Trust”), with respect to the Clough China Fund (the “Clough Fund”) and ALPS Advisors, Inc. (“AAI”), and the Sub-Advisory Agreement among the Trust, with respect to the Clough Fund, Clough Capital Partners LP (“Clough Capital”), and AAI, in accordance with Section 15(c) of the 1940 Act. The Independent Trustees met with independent legal counsel during executive session and discussed the Investment Advisory Agreement and Sub-Advisory Agreement and other related materials. In renewing and approving the Investment Advisory Agreement and the Investment Sub-Advisory Agreement, the Trustees, including the Independent Trustees, considered the following factors with respect to the Clough Fund:
Investment Advisory and Sub-Advisory Fee Rates: The Trustees reviewed and considered the contractual annual advisory fee rate paid by the Trust, on behalf of the Clough Fund, to AAI of 1.35% of the Clough Fund’s daily average net assets, in light of the extent and quality of the advisory services provided by AAI to the Clough Fund. The Trustees also reviewed and considered the contractual annual sub-advisory fee rate paid by AAI to Clough Capital of 0.90% of the Clough Fund’s daily average net assets, in light of the extent and quality of the advisory services provided by Clough Capital to the Clough Fund. The Trustees also considered information regarding compensation paid to affiliates of AAI under other agreements, such as the Fund Accounting and Administration Agreement with ALPS.
The Board received and considered information including a comparison of the Clough Fund’s contractual and gross advisory fee rates with those of funds in the peer group as selected by an independent provider of investment company data (the “Data Provider”). The Trustees noted that the contractual and advisory fee rate for each class of the Clough Fund was above the respective Data Provider peer group median rate. In considering the advisory fee rates of the Clough Fund, the Trustees considered Clough Capital’s statements regarding potential proposed reductions in such fees.
Total Net Expense Ratios: The Trustees further reviewed and considered the total net expense ratios of 1.95%, 2.70%, 1.70%, and 1.95% for the Class A, Class C, Class I, and Investor Class shares, respectively, of the Clough Fund. The Trustees noted that the total net expense ratio of each class of the Clough Fund was above the respective Data Provider peer group median ratio.
Nature, Extent, and Quality of the Services under the Investment Advisory and Sub-Advisory Agreements: The Trustees received and considered information regarding the nature, extent, and quality of services to be provided to the Clough Fund under the Investment Advisory and Sub-Advisory Agreements. The Trustees reviewed certain background materials supplied by AAI and Clough Capital in their presentations, including their Forms ADV.
The Trustees reviewed and considered AAI’s and Clough Capital’s investment advisory personnel, their history as asset managers and their performance and the amount of assets currently under management by AAI and Clough Capital and their affiliated entities. The Trustees also reviewed the research and decision-making processes utilized by AAI and Clough Capital, including the methods adopted to seek to achieve compliance with the investment objectives, policies, and restrictions of the Clough Fund.
Additional Information
October 31, 2021 (Unaudited)
The Trustees considered the background and experience of AAI’s and Clough Capital’s management in connection with the Clough Fund, including reviewing the qualifications, backgrounds, and responsibilities of the management team primarily responsible for the day-to-day portfolio management of the Clough Fund and the extent of the resources devoted to research and analysis of actual and potential investments.
The Trustees also reviewed, among other things, AAI’s and Clough Capital’s insider trading policies and procedures and their Codes of Ethics.
Performance: The Trustees reviewed performance information for the Clough Fund, which included a comparison of the Clough Fund’s performance to the performance of a group of comparable funds selected by the Data Provider. The Trustees noted that the performance of each class of the Clough Fund was below the respective Data Provider peer group median performance for the three month, one year, three year, five year, ten year, and since inception periods ended March 31, 2020, as applicable. In considering the recent performance of the Clough Fund, the Trustees considered Clough Capital’s statements regarding its expectations for performance in the near term and regarding recent personnel changes at the firm. The Trustees also considered Clough Capital’s investment performance and reputation generally and its investment techniques, risk management controls and decision-making processes.
Comparable Accounts: The Trustees noted certain information provided by Clough Capital regarding fees charged to its other clients utilizing a strategy similar to that employed by the Clough Fund. The Trustees also noted that AAI indicated that it had no other clients utilizing a strategy similar to that employed by the Clough Fund.
Profitability: The Trustees received and considered the profitability analyses prepared by AAI and Clough Capital based on the fees payable under the Investment Advisory Agreement with AAI and the Investment Sub-Advisory Agreement with Clough Capital with respect to the Clough Fund, respectively. The Trustees considered the profits, if any, realized by AAI and Clough Capital in connection with the operation of the Clough Fund.
Economies of Scale: The Trustees considered whether economies of scale in the provision of services to the Clough Fund will be passed along to the shareholders under the agreements.
Other Benefits to the Adviser and Sub-Adviser: The Trustees reviewed and considered any other incidental benefits derived or to be derived by AAI and Clough Capital from their relationship with the Clough Fund, including whether soft dollar arrangements were used.
In renewing AAI as the Clough Fund’s investment adviser and Clough Capital as the Clough Fund’s sub-adviser and the fees charged under the Investment Advisory and Sub-Advisory Agreements, the Trustees concluded that no single factor reviewed by the Trustees was identified by the Trustees to be determinative as the principal factor in whether to renew the Investment Advisory and Sub-Advisory Agreements. Further, the Independent Trustees were advised by separate independent legal counsel throughout the process. The Trustees, including all of the Independent Trustees, concluded that:
| ● | the contractual and advisory fee rate for each class of the Clough Fund was above the respective Data Provider peer group median rate; |
| ● | Clough Capital’s fees under its sub-advisory agreements are paid directly by AAI; |
| ● | the total net expense ratio of each class of the Clough Fund was above the respective Data Provider peer group median ratio; |
| ● | the nature, extent, and quality of services rendered by AAI and Clough Capital under the Investment Advisory and Sub-Advisory Agreements, respectively, with respect to the Clough Fund were adequate; |
| ● | the performance of each class of the Clough Fund was below the respective Data Provider peer group median performance for the three month, one year, three year, five year, ten year, and since inception periods ended March 31, 2020, as applicable; |
| ● | that (a) AAI had no other clients utilizing a strategy similar to that employed by the Clough Fund, and (b) bearing in mind the limitations of comparing different types of managed accounts and the different levels of service typically associated with such accounts, the fee structures applicable to Clough Capital’s other clients employing a comparable strategy to the Clough Fund was not indicative of any unreasonableness with respect to the advisory and sub-advisory fees proposed to be payable by the Clough Fund; |
| ● | the profit, if any, realized by AAI and Clough Capital in connection with the operation of the Clough Fund is not unreasonable to the Clough Fund; and |
| ● | there were no material economies of scale or other incidental benefits accruing to AAI and Clough Capital in connection with their relationship with the Clough Fund. |
Additional Information
October 31, 2021 (Unaudited)
Based on the Trustees’ deliberations and their evaluation of the information described above, the Trustees, including all of the Independent Trustees, concluded that AAI’s and Clough Capital’s compensation for investment advisory and sub-advisory services is consistent with the best interests of the Clough Fund and its shareholders.
Smith Funds
On June 17, 20120, the Trustees met via electronic means (videoconference)1 to discuss, among other things, the approval of the Investment Advisory Agreement between Financial Investors Trust (the “Trust”), with respect to the ALPS/Smith Total Return Bond Fund and the ALPS/Smith Short Duration Bond Fund (collectively, the “Smith Funds”) and ALPS Advisors, Inc. (“AAI”), and the Sub-Advisory Agreement among the Trust, with respect to the Smith Funds, Smith Capital Investors, LLC (“Smith Capital”), and AAI, in accordance with Section 15(c) of the 1940 Act. The Independent Trustees met with independent legal counsel during executive session and discussed the Investment Advisory Agreement and SubAdvisory Agreement and other related materials. In renewing and approving the Investment Advisory Agreement and the Investment Sub-Advisory Agreement, the Trustees, including the Independent Trustees, considered the following factors with respect to the Smith Funds:
Investment Advisory and Sub-Advisory Fee Rates: The Trustees reviewed and considered the contractual annual advisory fee rates paid by the Trust, on behalf of the Smith Funds, to AAI, of 0.37% of the daily average net assets of the ALPS/Smith Short Duration Bond (the “Short Duration Bond Fund”) and 0.55% of the daily average net assets of the ALPS/Smith Total Return Bond Fund (the “Total Return Bond Fund,”) in light of the extent and quality of the advisory services provided by AAI to the Smith Funds. The Trustees also reviewed and considered the contractual annual sub-advisory fee rates paid by AAI to Smith Capital of 0.29% of the Short Duration Bond Fund’s daily average net assets and 0.42% of the Total Return Bond Fund’s daily average daily ne assets, in light of the extent and quality of the advisory services provided by Smith Capital to the Smith Funds. The Trustees also considered information regarding compensation to be paid to affiliates of AAI under other agreements, such as the Fund Accounting and Administration Agreement with ALPS.
The Board received and considered information including a comparison of each Smith Fund’s contractual and gross advisory fee rates with those of funds in the peer group as selected by an independent provider of investment company data (the “Data Provider”). The Trustees noted that the contractual and gross advisory fee rate for each class of each Smith Fund was generally above the respective Data Provider peer group median rate.
Total Net Expense Ratios: The Trustees further reviewed and considered the total net expense ratios of 0.95%, 1.67%, 0.67%, and 0.96% for the Class A, Class C, Class I, and Investor Class shares, respectively, of the Total Return Bond Fund and 0.74%, 1.49%, 0.49%, and 0.76% for the Class A, Class C, Class I, and Investor Class shares, respectively, of the Short Duration Bond Fund. The Trustees noted that the total net expense ratio of each class of each Smith Fund was generally above the respective Data Provider peer group median ratio.
Nature, Extent, and Quality of the Services under the Investment Advisory and Sub-Advisory Agreements: The Trustees received and considered information regarding the nature, extent, and quality of services to be provided to the Smith Funds under the Investment Advisory and Sub-Advisory Agreements. The Trustees reviewed certain background materials supplied by AAI and Smith Capital in their presentations, including their Forms ADV.
The Trustees reviewed and considered AAI’s and Smith Capital’s investment advisory personnel, their history as asset managers and their performance and the amount of assets currently under management by AAI and Smith Capital and their affiliated entities. The Trustees also reviewed the research and decision-making processes utilized by AAI and Smith Capital, including the methods adopted to seek to achieve compliance with the investment objectives, policies and restrictions of the Smith Funds.
The Trustees considered the background and experience of AAI’s and Smith Capital’s management in connection with the Smith Funds, including reviewing the qualifications, backgrounds and responsibilities of the management team primarily responsible for the day-to-day portfolio management of the Smith Funds and the extent of the resources devoted to research and analysis of actual and potential investments.
The Trustees also reviewed, among other things, AAI’s and Smith Capital’s insider trading policies and procedures and their Codes of Ethics.
Performance: The Trustees reviewed performance information for each Smith Fund, which included a comparison of each Smith Fund’s performance to the performance of a group of comparable funds selected by the Data Provider. The Trustees noted that the performance of each class of each Smith Fund was above the respective Data Provider peer group median performance for the three month, one year, and since inception periods ended March 31, 2020. The Trustees also considered Smith Capital’s investment performance and reputation generally and its investment techniques, risk management controls, and decision-making processes.
Comparable Accounts: The Trustees noted that neither Smith Capital nor AAI currently manages any other accounts with similar strategies to the Smith Funds.
Additional Information
October 31, 2021 (Unaudited)
Profitability: The Trustees received and considered the profitability analyses prepared by AAI and Smith Capital based on the fees payable under the Investment Advisory Agreement with AAI and the Investment Sub-Advisory Agreement with Smith Capital, with respect to the Smith Funds, respectively. The Trustees considered the profits, if any, realized by AAI and Smith Capital in connection with the operation of the Smith Funds.
Economies of Scale: The Trustees considered whether economies of scale in the provision of services to the Smith Funds will be passed along to the shareholders under the agreements.
Other Benefits to the Adviser and Sub-Adviser: The Trustees reviewed and considered any other incidental benefits derived or to be derived by AAI and Smith Capital from their relationship with the Smith Funds, including whether soft dollar arrangements were used.
The Trustees, including all of the Independent Trustees, concluded that:
| ● | the contractual and gross advisory fee rates for each class of each Smith Fund were generally above the respective Data Provider peer group median rates; |
| ● | Smith Capital’s fees under its sub-advisory agreement are paid directly by AAI; |
| ● | the total net expense ratio of each class of each Smith Fund was generally above the Data Provider peer group median ratio; |
| ● | the nature, extent, and quality of services rendered by AAI and Smith Capital under the Investment Advisory and Sub-Advisory Agreements, respectively, with respect to the Smith Funds were adequate; |
| ● | the performance of each class of each Smith Fund was above the respective Data Provider peer group median performance for the three month, one year, and since inception periods ended March 31, 2020; |
| ● | that neither AAI nor Smith Capital currently manages any other accounts with similar investment strategies to the Smith Funds; |
| ● | the profit, if any, realized by AAI and Smith Capital in connection with the operation of the Smith Funds is not unreasonable to the Smith Funds; and |
| ● | there were no material economies of scale or other incidental benefits accruing to AAI and Smith Capital in connection with their relationship with the Smith Funds. |
Based on the Trustees’ deliberations and their evaluation of the information described above, the Trustees, including all of the Independent Trustees, concluded that AAI’s and Smith Capital’s compensation for investment advisory and sub-advisory services is consistent with the best interests of each of the Smith Funds and its shareholders.
New Smith Funds
On June 17, 20120, the Trustees met via electronic means (videoconference)1 to discuss, among other things, the approval of the Investment Advisory Agreement between Financial Investors Trust (the “Trust”), with respect to the ALPS/Smith Balanced Opportunity Fund and the ALPS/Smith Credit Opportunities Fund (collectively, the “New Smith Funds”) and ALPS Advisors, Inc. (“AAI”), and the Sub-Advisory Agreement among the Trust, with respect to the New Smith Funds, Smith Capital Investors, LLC (“Smith Capital”), and AAI, in accordance with Section 15(c) of the 1940 Act. The Independent Trustees met with independent legal counsel during executive session and discussed the Investment Advisory Agreement and Sub-Advisory Agreement and other related materials. In approving the Investment Advisory Agreement and the Investment SubAdvisory Agreement, the Trustees, including the Independent Trustees, considered the following factors with respect to the New Smith Funds:
Investment Advisory and Sub-Advisory Fee Rates: The Trustees reviewed and considered the contractual annual advisory fee rate to be paid by the Trust, on behalf of the ALPS/Smith Balanced Opportunity Fund (the “Balanced Opportunity Fund”), of 0.70% of such Fund’s daily average net assets, and on behalf of the of the ALPS/Smith Credit Opportunities Fund (the “Credit Opportunities Fund”), of 0.75% of such Fund’s daily average net assets, to AAI, in light of the extent and quality of the advisory services to be provided by AAI to the New Smith Funds. The Trustees also reviewed and considered the contractual annual sub-advisory fee rate to be paid by AAI to Smith Capital of 0.37% of the Balanced Opportunity Fund’s daily average net assets and of 0.50% of the Credit Opportunities Fund’s daily average net assets, in light of the extent and quality of the advisory services to be provided by Smith Capital to the New Smith Funds. The Trustees also considered information regarding compensation to be paid to affiliates of AAI under other agreements, such as the Fund Accounting and Administration Agreement with ALPS.
Additional Information
October 31, 2021 (Unaudited)
The Board received and considered information including a comparison of each New Smith Fund’s contractual advisory fee rate with those of funds in the peer group as selected by an independent provider of investment company data (the “Data Provider”). The Trustees noted that the contractual advisory fee rate of the Balanced Opportunity Fund was below the Data Provider peer group median rate, and the contractual advisory fee rate of the Credit Opportunities Fund was above the Data Provider peer group median rate.
Total Net Expense Ratios: The Trustees further reviewed and considered the total net expense ratios of 0.85% and 0.90% for the Class I shares of the Balanced Opportunity Fund and Credit Opportunities Fund, respectively. The Trustees noted that the total net expense ratio of Class I of the Balanced Opportunity Fund was below the Data Provider peer group median ratio and the total net expense ratio of Class I of the Credit Opportunities Fund was above the Data Provider peer group median ratio.
Nature, Extent, and Quality of the Services under the Investment Advisory and Sub-Advisory Agreements: The Trustees received and considered information regarding the nature, extent, and quality of services to be provided to the New Smith Funds under the Investment Advisory and Sub-Advisory Agreements. The Trustees reviewed certain background materials supplied by AAI and Smith Capital in their presentations, including their Forms ADV.
The Trustees reviewed and considered AAI’s and Smith Capital’s investment advisory personnel, their history as asset managers and their performance, and the amount of assets currently under management by AAI and Smith Capital and their affiliated entities. The Trustees also reviewed the research and decision-making processes utilized by AAI and Smith Capital, including the proposed methods adopted to seek to achieve compliance with the proposed investment objectives, policies, and restrictions of the New Smith Funds.
The Trustees considered the background and experience of AAI’s and Smith Capital’s management in connection with the New Smith Funds, including reviewing the qualifications, backgrounds, and responsibilities of the management team that would be primarily responsible for the dayto-day portfolio management of the New Smith Funds and the extent of the resources that would be devoted to research and analysis of actual and potential investments.
The Trustees also reviewed, among other things, AAI’s and Smith Capital’s insider trading policies and procedures and their Codes of Ethics.
Performance: The Trustees noted that since the New Smith Funds have not yet begun operations, there is no performance to be reviewed or analyzed at this time. The Trustees further considered the reputation of Smith Capital’s personnel generally and its investment techniques, risk management controls, and decision-making processes.
Comparable Accounts: The Trustees noted that neither AAI nor Smith Capital currently manages any other accounts with similar investment strategies to the New Smith Funds.
Profitability: The Trustees received and considered the projected profitability analyses prepared by AAI and Smith Capital based on the fees to be paid under the Investment Advisory Agreement with AAI and the Investment Sub-Advisory Agreement with Smith Capital, with respect to the New Smith Funds. The Trustees considered the profits, if any, anticipated to be realized by AAI and Smith Capital in connection with the operation of the New Smith Funds.
Economies of Scale: The Trustees considered whether economies of scale in the provision of services to the New Smith Funds would be passed along to the shareholders under the agreements.
Other Benefits to the Adviser and Sub-Adviser: The Trustees reviewed and considered any other incidental benefits to be derived by Smith Capital or AAI from their relationship with the New Smith Funds, including whether soft dollar arrangements would be used.
The Trustees, including all of the Independent Trustees, concluded that:
| ● | the contractual advisory fee rate of the Balanced Opportunity Fund was below the Data Provider peer group median rate, and the contractual advisory fee rate of the Credit Opportunities Fund was above the Data Provider peer group median rate; |
| ● | Smith Capital’s fees under its sub-advisory agreements are to be paid directly by AAI; |
| ● | the total net expense ratio of Class I of the Balanced Opportunity Fund was below the Data Provider peer group median ratio and the total net expense ratio of Class I of the Credit Opportunities Fund was above the Data Provider peer group median ratio; |
Additional Information
October 31, 2021 (Unaudited)
| ● | the nature, extent, and quality of services to be rendered by AAI and Smith Capital under the Investment Advisory and Sub-Advisory Agreements, respectively, with respect to the New Smith Funds were adequate; |
| ● | since the New Smith Funds had not yet begun operations, there was no performance to be reviewed or analyzed at this time; |
| ● | that neither AAI nor Smith Capital currently manages any other accounts with similar investment strategies to the New Smith Funds; |
| ● | since the New Smith Funds were not yet in existence, no profit had been realized by AAI or Smith Capital in connection with the operation of the New Smith Funds; and |
| ● | there were no material economies of scale or other incidental benefits accruing to AAI and Smith Capital in connection with their relationship with the New Smith Funds. |
Based on the Trustees’ deliberations and their evaluation of the information described above, the Trustees, including all of the Independent Trustees, concluded that AAI’s and Smith Capital’s compensation for investment advisory and sub-advisory services is consistent with the best interests of the New Smith Funds and its shareholders.
| 1 | This meeting was intended to qualify as an "in-person" meeting of the Board pursuant to relief granted by the SEC in response to the COVID-19 outbreak for the purposes of fulfilling the in-person investment advisory agreement approval requirements under Section 15(c) of the 1940 Act (see Investment Company Act Release No. 33817 (Mar. 13, 2020), Investment Company Act Release No. 33824 (Mar. 25, 2020)). |
Trustees and Officers
October 31, 2021 (Unaudited)
Additional information regarding the Funds’ trustees is included in the Statement of Additional Information, which can be obtained without charge by calling (toll-free) (866) 759-5679.
INDEPENDENT TRUSTEES
Name,
Address* &
Year of Birth | Position(s) Held with
Fund | Term of Office**
and Length of
Time Served | Principal Occupation(s) During Past 5 Years*** | Number of
Funds in Fund
Complex
Overseen by
Trustee**** | Other
Directorships
Held by
Trustee During
Past 5 Years*** |
Mary K.
Anstine,
1940 | Trustee and Chairman | Ms. Anstine was elected at a special meeting of shareholders held on March 21, 1997 and re-elected at a special meeting of shareholders held on August 7, 2009. Ms. Anstine was appointed Chairman of the Board at the June 6, 2017 meeting of the Board of Trustees. | Ms. Anstine was formerly an Executive Vice President of First Interstate Bank of Denver until 1994, President/Chief Executive Officer of HealthONE Alliance, Denver, Colorado, from 1994 to 2004, and has been retired since 2004. Ms. Anstine is also Trustee/Director of AV Hunter Trust and Colorado Uplift Board. Ms. Anstine was formerly a Director of the Trust Bank of Colorado (later purchased and now known as Northern Trust Bank), HealthONE and Denver Area Council of the Boy Scouts of America, and a member of the American Bankers Association Trust Executive Committee. | 58 | Ms. Anstine is a Trustee of ALPS ETF Trust (18 funds); ALPS Variable Investment Trust (7 funds); Reaves Utility Income Fund (1 fund); and Segall Bryant & Hamill Trust (14 funds). |
Jeremy W. Deems,
1976 | Trustee | Mr. Deems was appointed as a Trustee at the March 11, 2008 meeting of the Board of Trustees and elected at a special meeting of shareholders held on August 7, 2009. | Mr. Deems is the Co-Founder, Chief Operations Officer and Chief Financial Officer of Green Alpha Advisors, LLC, a registered investment advisor, and Co-Portfolio Manager of the Shelton Green Alpha Fund. Prior to joining Green Alpha Advisors, Mr. Deems was CFO and Treasurer of Forward Management, LLC, ReFlow Management Co., LLC, ReFlow Fund, LLC, a private investment fund, and Sutton Place Management, LLC, an administrative services company, from 1998 to June 2007. From 2004 to 2005, Mr. Deems also served as Treasurer of the Forward Funds and the Sierra Club Funds. | 59 | Mr. Deems is a Trustee of ALPS ETF Trust (18 funds); ALPS Variable Investment Trust (7 funds); Clough Funds Trust (1 fund); and Reaves Utility Income Fund (1 fund). |
| * | All communications to Trustees and Officers may be directed to Financial Investors Trust c/o 1290 Broadway, Suite 1000, Denver, CO 80203. |
| ** | This is the period for which the Trustee or Officer began serving the Trust. Each Trustee serves an indefinite term, until such Trustees successor is elected and appointed, or such Trustee resigns or is deceased. Officers are elected on an annual basis. |
| *** | Except as otherwise indicated, each individual has held the office shown or other offices in the same company for the last five years. |
| **** | The Fund Complex includes all series of the Trust, currently 32, and any other investment companies for which any Trustee serves as trustee for and for which ALPS Advisors, Red Rocks, Clough Capital, RiverFront, Kotak or Smith Capital provides investment advisory services (currently 29 funds, 1 fund, 4 funds, 4 funds, 0 funds, and 0 funds, respectively). |
Trustees and Officers
October 31, 2021 (Unaudited)
INDEPENDENT TRUSTEES (continued)
Name,
Address* &
Year of Birth | Position(s) Held with
Fund | Term of Office**
and Length of
Time Served | Principal Occupation(s) During Past 5 Years*** | Number of
Funds in Fund
Complex
Overseen by
Trustee**** | Other
Directorships
Held by
Trustee During
Past 5 Years*** |
Jerry G. Rutledge, 1944 | Trustee | Mr. Rutledge was elected at a special meeting of shareholders held on August 7, 2009. | Mr. Rutledge is the President and owner of Rutledge’s Inc., a retail clothing business. Mr. Rutledge is currently Director of the American National Bank. He was from 1994 to 2007 a Regent of the University of Colorado. | 36 | Mr. Rutledge is a Trustee of Clough Global Dividend and Income Fund (1 fund), Clough Global Equity Fund (1 fund), Clough Global Opportunities Fund (1 fund) and Principal Real Estate Income Fund (1 fund). |
Michael “Ross” Shell, 1970 | Trustee | Mr. Shell was elected at a special meeting of shareholders held on August 7, 2009. | Mr. Shell is Founder and CEO of Red Idea, LLC, a strategic consulting/early stage venture firm (since June 2008). From 1999 to 2009, he was a part-owner and Director of Tesser, Inc., a brand agency. From December 2005 to May 2008, he was Director, Marketing and Investor Relations, of Woodbourne, a REIT/real estate hedge fund and private equity firm. Prior to this, from May 2004 to November 2005, he worked as a business strategy consultant; from June 2003 to April 2004, he was on the Global Client Services team of IDEO, a product design/innovation firm; and from 1999 to 2003, he was President of Tesser, Inc. Mr. Shell graduated with honors from Stanford University with a degree in Political Science. | 32 | None. |
| * | All communications to Trustees and Officers may be directed to Financial Investors Trust c/o 1290 Broadway, Suite 1000, Denver, CO 80203. |
| ** | This is the period for which the Trustee or Officer began serving the Trust. Each Trustee serves an indefinite term, until such Trustees successor is elected and appointed, or such Trustee resigns or is deceased. Officers are elected on an annual basis. |
| *** | Except as otherwise indicated, each individual has held the office shown or other offices in the same company for the last five years. |
| **** | The Fund Complex includes all series of the Trust, currently 32, and any other investment companies for which any Trustee serves as trustee for and for which ALPS Advisors, Red Rocks, Clough Capital, RiverFront, Kotak or Smith Capital provides investment advisory services (currently 29 funds, 1 fund, 4 funds, 4 funds, 0 funds, and 0 funds, respectively). |
Trustees and Officers
October 31, 2021 (Unaudited)
INTERESTED TRUSTEE
Name,
Address* &
Year of Birth | Position(s)
Held with
Fund | Term of Office**
and Length of
Time Served | Principal Occupation(s) During Past 5 Years*** | Number of
Funds in Fund
Complex
Overseen by
Trustee**** | Other
Directorships
Held by
Trustee During
Past 5 Years*** |
Edmund J. Burke, 1961 | Trustee | Mr. Burke was elected as Trustee at a special meeting of shareholders held on August 7, 2009. | Mr. Burke joined ALPS in 1991 and served as the President and Director of ALPS Holdings, Inc., and ALPS Advisors, Inc., and Director of ALPS Distributors, Inc., ALPS Fund Services, Inc., and ALPS Portfolio Solutions Distributor, Inc. Mr. Burke retired from ALPS in June 2019. Mr. Burke is deemed an affiliate of the Fund as defined under the 1940 Act. | 55 | Mr. Burke is a Trustee of Clough Global Dividend and Income Fund (1 fund); Clough Global Equity Fund (1 fund); Clough Global Opportunities Fund (1 fund); Clough Funds Trust (1 fund); Liberty All-Star Equity Fund (1 fund); and Director of the Liberty All-Star Growth Fund, Inc. (1 fund); and Trustee of ALPS ETF Trust (18 funds). |
| * | All communications to Trustees and Officers may be directed to Financial Investors Trust c/o 1290 Broadway, Suite 1000, Denver, CO 80203. |
| ** | This is the period for which the Trustee or Officer began serving the Trust. Each Trustee serves an indefinite term, until such Trustees successor is elected and appointed, or such Trustee resigns or is deceased. Officers are elected on an annual basis. |
| *** | Except as otherwise indicated, each individual has held the office shown or other offices in the same company for the last five years. |
| **** | The Fund Complex includes all series of the Trust, currently 32, and any other investment companies for which any Trustee serves as trustee for and for which ALPS Advisors, Red Rocks, Clough Capital, RiverFront, Kotak or Smith Capital provides investment advisory services (currently 29 funds, 1 fund, 4 funds, 4 funds, 0 funds, and 0 funds, respectively). |
Trustees and Officers
October 31, 2021 (Unaudited)
OFFICERS
Name, Address* & Year of Birth | Position(s) Held
with Fund | Term of Office** and
Length of Time Served | Principal Occupation(s)
During Past 5 Years*** |
Dawn Cotten, 1977 | President | Ms. Cotten was appointed President of the Trust at the June 8-9, 2021, meeting of the Board of Trustees. | Ms. Cotten joined ALPS in 2009 and is currently Senior Vice President of Fund Administration and Relationship Management of ALPS. She has served in that role since January 2020. Prior to that, Ms. Cotten served as Senior Vice President of Relationship Management (2017-2020). Ms. Cotten served as a Vice President in Relationship Management from 2013-2017. Ms. Cotten also serves as President of ALPS Series Trust, Clough Funds Trust, Clough Global Dividend and Income Fund, Clough Global Equity Fund, and Clough Global Opportunities Fund. |
Jennell Panella, 1974 | Treasurer | Ms. Panella was elected Treasurer of the Trust at the September 15, 2020 meeting of the Board of Trustees | Ms. Panella joined ALPS in June 2012 and is currently Fund Controller of ALPS Fund Services, Inc. Prior to joining ALPS, Ms. Panella served as Financial Reporting Manager for Parker Global Strategies, LLC (2009-2012). Because of her position with ALPS, Ms. Panella is deemed an affiliate of the Trust as defined under the 1940 Act. Ms. Panella also serves as Assistant Treasurer of James Advantage Funds. |
Brendan Hamill, 1986 | Secretary | Mr. Hamill was elected Secretary of the Trust at the September 14, 2021 meeting of the Board of Trustees. | Mr. Hamill joined ALPS in August 2021, and is currently Vice President and Principal Legal Counsel. Prior to joining ALPS, Mr. Hamill was an attorney at Lewis Brisbois Bisgaard & Smith, LLP (law firm) (December 2018-August 2021) and Vedder Price, P.C. (law firm) (August 2015-December 2018). Mr. Hamill also serves as Secretary of ALPS ETF Trust, Secretary of ALPS Variable Investment Trust, Secretary of Principal Real Estate Income Fund, and Assistant Secretary of James Advantage Funds. |
Ted Uhl, 1974 | Chief Compliance Officer (“CCO”) | Mr. Uhl was elected CCO of the Trust at the June 8, 2010 meeting of the Board of Trustees. | Mr. Uhl joined ALPS in October 2006, and is currently Deputy Compliance Officer of ALPS. Prior to his current role, Mr. Uhl served as Senior Risk Manager for ALPS from October 2006 until June 2010. Before joining ALPS, Mr. Uhl served a Sr. Analyst with Enenbach and Associates (RIA), and a Sr. Financial Analyst at Sprint. Because of his position with ALPS, Mr. Uhl is deemed an affiliate of the Trust as defined under the 1940 Act. Mr. Uhl is also CCO of Centre Funds, Index Funds, Reality Shares ETF Trust, Reaves Utility Income Fund and XAI Octagon Floating Rate & Alternative Income Term Trust. Mr. Uhl formerly served as CCO of the Boulder Growth & Income Fund, Inc. |
| * | All communications to Trustees and Officers may be directed to Financial Investors Trust c/o 1290 Broadway, Suite 1000, Denver, CO 80203. |
| ** | This is the period for which the Trustee or Officer began serving the Trust. Each Trustee serves an indefinite term, until such Trustees successor is elected and appointed, or such Trustee resigns or is deceased. Officers are elected on an annual basis. |
| *** | Except as otherwise indicated, each individual has held the office shown or other offices in the same company for the last five years. |
| **** | The Fund Complex includes all series of the Trust, currently 32, and any other investment companies for which any Trustee serves as trustee for and for which ALPS Advisors, Red Rocks, Clough Capital, RiverFront, Kotak or Smith Capital provides investment advisory services (currently 29 funds, 1 fund, 4 funds, 4 funds, 0 funds, and 0 funds, respectively). |
Privacy Policy
October 31, 2021 (Unaudited)
| FACTS | WHAT DO THE FUNDS DO WITH YOUR PERSONAL INFORMATION? |
| WHY? | Financial companies choose how they share your personal information. Federal law gives consumers the right to limit some but not all sharing. Federal law also requires us to tell you how we collect, share, and protect your personal information. Please read this notice carefully to understand what we do. |
| WHAT? | The types of personal information we collect and share depend on the product or service you have with us. This information can include: ● Social Security number and account transactions ● Account balances and transaction history ● Wire transfer instructions |
| HOW? | All financial companies need to share customers’ personal information to run their everyday business. In the section below, we list the reasons financial companies can share their customers’ personal information; the reasons the Funds choose to share; and whether you can limit this sharing. |
| REASONS WE CAN SHARE YOUR PERSONAL INFORMATION | DO THE FUNDS SHARE: | CAN YOU LIMIT
THIS SHARING? |
For our everyday business purposes – such as to process your transactions, maintain your account(s), respond to court orders and legal investigations, or report to credit bureaus | Yes | No |
For our marketing purposes – to offer our products and services to you | No | We do not share. |
| For joint marketing with other financial companies | No | We do not share. |
For our affiliates’ everyday business purposes – information about your transactions and experiences | Yes | No |
For our affiliates’ everyday business purposes – information about your creditworthiness | No | We do not share. |
| For non-affiliates to market to you | No | We do not share. |
Privacy Policy
October 31, 2021 (Unaudited)
| WHO WE ARE |
| Who is providing this notice? | Financial Investors Trust |
| WHAT WE DO |
| How do the Funds protect my personal information? | To protect your personal information from unauthorized access and use, we use security measures that comply with federal law. These measures include computer safeguards and secured files and buildings. |
| How do the Funds collect my personal information? | We collect your personal information, for example, when you ● open an account ● provide account information or give us your contact information ● make a wire transfer or deposit money |
| Why can’t I limit all sharing? | Federal law gives you the right to limit only ● sharing for affiliates’ everyday business purposes-information about your creditworthiness ● affiliates from using your information to market to you ● sharing for non-affiliates to market to you State laws and individual companies may give you additional rights to limit sharing. |
| DEFINITIONS |
| Affiliates | Companies related by common ownership or control. They can be financial and nonfinancial companies. |
| Non-affiliates | Companies not related by common ownership or control. They can be financial and nonfinancial companies. ● The Funds do not share with non-affiliates so they can market to you. |
| Joint marketing | A formal agreement between non-affiliated financial companies that together market financial products or services to you. ● The Funds do not jointly market. |
OTHER IMPORTANT INFORMATION |
| California Residents | If your account has a California home address, your personal information will not be disclosed to nonaffiliated third parties except as permitted by applicable California law, and we will limit sharing such personal information with our affiliates to comply with California privacy laws that apply to us. |
Vermont Residents | The State of Vermont requires financial institutions to obtain your consent prior to sharing personal information that they collect about you with affiliated companies and nonaffiliated third parties other than in certain limited circumstances. Except as permitted by law, we will not share personal information we collect about you with nonaffiliated third parties or other affiliated companies unless you provide us with your written consent to share such information. |
| QUESTIONS? | Call 1-866-759-5679 or go to www.alpsfunds.com |

Must be accompanied or preceded by a prospectus. Investors are reminded to read the
prospectus carefully before investing.
ALPS Portfolio Solutions Distributor, Inc., distributor.
APS001870
alpsfunds.com 1-866-759-5679 |  |
Item 2. Code of Ethics.
| (a) | The Registrant, as of the end of the period covered by this report, has adopted a code of ethics that applies to the Registrant’s principal executive officer, principal financial officer, principal accounting officer or controller or any persons performing similar functions on behalf of the Registrant. |
| (c) | During the period covered by this report, no amendments to the provisions of the code of ethics described in Item 2(a) above were made. |
| (d) | During the period covered by this report, no implicit or explicit waivers to the provisions of the code of ethics described in Item 2(a) above were granted. |
| (f) | The Registrant’s Code of Ethics is attached as an Exhibit to this report. |
Item 3. Audit Committee Financial Expert.
The Board of Trustees of the Registrant has determined that the Registrant has at least one Audit Committee Financial Expert serving on its audit committee. The Board of Trustees of the Registrant has designated Jeremy W. Deems as the Registrant’s “Audit Committee Financial Expert.” Mr. Deems is “independent” as defined in paragraph (a)(2) of Item 3 to Form N-CSR.
Item 4. Principal Accountant Fees and Services.
| (a) | Audit Fees: For the Registrant’s fiscal years ended October 31, 2021 and October 31, 2020, the aggregate fees billed for professional services rendered by the principal accountant for the audit of the Registrant’s annual financial statements were $184,000 and $218,625, respectively. |
| (b) | Audit-Related Fees: For the Registrant’s fiscal years ended October 31, 2021 and October 31, 2020, the aggregate fees billed for assurance and related services by the principal accountant that were reasonably related to the performance of the audit of the Registrant’s financial statements and are not reported under paragraph (a) of this Item were $0 and $7,500, respectively. |
| (c) | Tax Fees: For the Registrant’s fiscal years ended October 31, 2021 and October 31, 2020, the aggregate fees billed for professional services rendered by the principal accountant for tax compliance, tax advice and tax planning were $59,015 and $50,895, respectively. The fiscal year 2021 and 2020 tax fees were for services for dividend calculation, excise tax preparation and tax return preparation. |
| (d) | All Other Fees: For the Registrant’s fiscal years ended October 31, 2021 and October 31, 2020, no fees were billed to Registrant by the principal accountant for services other than the services reported in paragraphs (a) through (c) of this Item. |
| (e)(1) | Audit Committee Pre-Approval Policies and Procedures: All services to be performed by the Registrant’s principal accountant must be pre-approved by the Registrant’s audit committee. The Chairman of the Audit Committee may pre-approve non-audit services to be performed by the Registrant’s principal accountant on an interim basis, subject to ratification by the Audit Committee at its next regularly scheduled meeting. |
| (e)(2) | No services described in paragraphs (b) through (d) of this Item were approved by the Registrant’s audit committee pursuant to paragraph (c)(7)(i)(C) of Rule 2-01 of Regulation S-X. |
| (g) | The aggregate non-audit fees billed by the Registrant’s accountant for services rendered to the Registrant, and rendered to the Registrant’s investment adviser (not including any sub-adviser whose role is primarily portfolio management and is subcontracted with or overseen by another investment adviser), and any entity controlling, controlled by, or under common control with the adviser that provides ongoing services to the Registrant, were $59,015 in the fiscal year ended October 31, 2021 and $50,895 in the fiscal year ended October 31, 2020. These fees consisted of non-audit fees billed to (i) the Registrant of $59,015 in the fiscal year ended October 31, 2021 and $50,895 in the fiscal year ended October 31, 2020 as described in response to paragraph (c) above and (ii) to ALPS Fund Services, Inc. (“AFS”), an entity under common control with ALPS Advisors, Inc., the Registrant’s investment adviser, of $0 in the fiscal year ended October 31, 2021 and $0 in the fiscal year ended October 31, 2020. The non-audit fees billed to AFS related to SSAE 16 services and other compliance-related matters. |
| (h) | The Registrant’s audit committee has considered whether the provision of non-audit services that were rendered to the Registrant’s investment adviser (not including any sub-adviser whose role is primarily portfolio management and is subcontracted with or overseen by another investment adviser), and any entity controlling, controlled by, or under common control with the investment adviser that provides ongoing services to the Registrant that were not pre-approved pursuant to paragraph (c)(7)(ii) of Rule 2-01 of Regulation S-X, is compatible |
| | with maintaining the principal accountant’s independence. The Registrant’s audit committee determined that the provision of such non-audit services is compatible with maintaining the principal accountant’s independence. |
Item 5. Audit Committee of Listed Registrants.
Not applicable to the Registrant.
Item 6. Investments.
| (a) | Schedule of Investments is included as part of the Reports to Stockholders filed under Item 1 of this Form N-CSR. |
Item 7. Disclosure of Proxy Voting Policies and Procedures for Closed-End Management Investment Companies.
Not applicable to the Registrant.
Item 8. Portfolio Managers of Closed-End Management Investment Companies.
Not applicable to the Registrant.
Item 9. Purchases of Equity Securities by Closed-End Management Investment Company and Affiliated Purchasers.
Not applicable to the Registrant.
Item 10. Submission of Matters to a Vote of Security Holders.
There have been no material changes to the procedures by which shareholders may recommend nominees to the Registrant’s Board of Trustees, where those changes were implemented after the Registrant last provided disclosure in response to the requirements of Item 407(c)(2)(iv) of Regulation S-K, or this Item.
Item 11. Controls and Procedures.
| (a) | The Registrant’s principal executive officer and principal financial officer have concluded that the Registrant’s disclosure controls and procedures (as defined in Rule 30a-3(c) under the Investment Company Act of 1940, as amended) are effective based on their evaluation of these controls and procedures as of a date within 90 days of the filing date of this report. |
| (b) | There was no change in the Registrant’s internal control over financial reporting (as defined in Rule 30a-3(d) under the Investment Company Act of 1940, as |
| | amended) during the period covered by this report that has materially affected, or is reasonably likely to materially affect, the Registrant’s internal control over financial reporting. |
| Item 12. | Disclosure of Securities Lending Activities for Closed-End Management Investment Companies. |
Not applicable to the Registrant.
Item 13. Exhibits.
| (a)(4) | Not applicable to the Registrant. |
SIGNATURES
Pursuant to the requirements of the Securities Exchange Act of 1934 and the Investment Company Act of 1940, the Registrant has duly caused this report to be signed on its behalf by the undersigned, thereunto duly authorized.
| FINANCIAL INVESTORS TRUST | |
| | | |
| By: | /s/ Dawn Cotten | |
| | Dawn Cotten (Principal Executive Officer) | |
| | President | |
| | | |
| Date: | January 7, 2022 | |
Pursuant to the requirements of the Securities Exchange Act of 1934 and the Investment Company Act of 1940, this report has been signed below by the following persons on behalf of the Registrant and in the capacities and on the dates indicated.
| FINANCIAL INVESTORS TRUST | |
| | | |
| By: | /s/ Dawn Cotten | |
| | Dawn Cotten (Principal Executive Officer) | |
| | President | |
| | | |
| Date: | January 7, 2022 | |
| | | |
| By: | /s/ Jennell Panella | |
| | Jennell Panella (Principal Financial Officer) | |
| | Treasurer | |
| | | |
| Date: | January 7, 2022 | |
6