UNITED STATES
SECURITIES AND EXCHANGE COMMISSION
Washington, D.C. 20549
FORM N-CSR
CERTIFIED SHAREHOLDER REPORT OF REGISTERED
MANAGEMENT INVESTMENT COMPANIES
Investment Company Act file number: 811-08194
FINANCIAL INVESTORS TRUST
(Exact name of registrant as specified in charter)
1290 Broadway, Suite 1000, Denver, Colorado 80203
(Address of principal executive offices) (Zip code)
Cara Owen, Esq., Secretary
Financial Investors Trust
1290 Broadway, Suite 1000
Denver, Colorado 80203
(Name and address of agent for service)
Registrant’s telephone number, including area code: 303-623-2577
Date of fiscal year end: April 30
Date of reporting period: April 30, 2021
Item 1. Reports to Stockholders.
(a)
 |
TABLE OF CONTENTS
ANNUAL REPORT
| SHAREHOLDER LETTER | 1 |
| PERFORMANCE UPDATE | 5 |
| DISCLOSURE OF FUND EXPENSES | 7 |
| PORTFOLIO OF INVESTMENTS | 8 |
| STATEMENT OF ASSETS AND LIABILITIES | 19 |
| STATEMENT OF OPERATIONS | 20 |
| STATEMENTS OF CHANGES IN NET ASSETS | 21 |
| FINANCIAL HIGHLIGHTS | 22 |
| NOTES TO FINANCIAL STATEMENTS | 24 |
| REPORT OF INDEPENDENT REGISTERED PUBLIC ACCOUNTING FIRM | 31 |
| ADDITIONAL INFORMATION | 32 |
| DISCLOSURE REGARDING APPROVAL OF FUND ADVISORY AGREEMENTS | 33 |
| LIQUIDITY RISK MANAGEMENT PROGRAM | 35 |
| TRUSTEES AND OFFICERS | 36 |
| PRIVACY POLICY | 41 |
As permitted by regulations adopted by the U.S. Securities and Exchange Commission, paper copies of the Fund’s annual and semi-annual shareholder reports will no longer be sent by mail, unless you specifically request paper copies of the reports. Instead, the reports will be made available on the Fund’s website at www.dgifund.com, and you will be notified by mail each time a report is posted and provided with a website link to access the report.
You may, notwithstanding the availability of shareholder reports online, elect to receive all future shareholder reports in paper free of charge. If you invest through a financial intermediary, you can contact your financial intermediary to request that you continue to receive paper copies of your shareholder reports. If you invest directly with the Fund, you can call 1.855.DGI. FUND (1-855-344-3863) to let the Fund know you wish to continue receiving paper copies of your shareholder reports.
If you already elected to receive shareholder reports electronically, you will not be affected by this change and you need not take any action. You may elect to receive shareholder reports and other communications from the Fund electronically anytime by contacting your financial intermediary (such as a broker-dealer or bank) or, if you are a direct investor, by enrolling at www.dgifund.com.
Disciplined Growth Investors’ goal is to communicate clearly and transparently with our clients and mutual fund shareholders. It is mutually beneficial when our shareholders understand how we invest, what we are currently thinking and forecasting, and the specific investment decisions we have made. Our views and opinions regarding the investment prospects of our portfolio holdings and the Fund are “forward looking statements” which may or may not be accurate over the long term. While we believe we have a reasonable basis for these forecasts and have confidence in our investment team’s views, actual results may differ materially from those we anticipate. Information provided in this report should not be considered a recommendation to purchase or sell any particular security.
You can identify forward looking statements as those including words such as “believe”, “expect”, “anticipate”, “forecast”, and similar statement. We cannot assure future performance. These forward-looking statements are made only as-of the date of this report. Following the publication of this report, we will not update any of the forward-looking statements included here.
This material must be preceded or accompanied by a prospectus. Please read the prospectus carefully before investing.
| APRIL 30, 2021 | DGINV.COM |
| The Disciplined Growth Investors Fund | Shareholder Letter |
April 30, 2021 (Unaudited)
Fund Performance and Asset Mix:
For The DGI Fund’s fiscal year (5/1/20-4/30/21), The DGI Fund returned 47.00%. Stocks in the Fund increased by 67.51% and bonds increased 6.89%. As of 4/30/21, the Fund’s asset mix was 70.8% stocks and 29.2% bonds and cash.
In the last year, The DGI Fund outperformed the S&P 500 index (the Fund’s benchmark), which increased 45.98%. During this time, the DGI Fund held 52 stocks that increased in value and 3 stocks that declined in value. The ten largest equity holdings in The DGI Fund combined to add 20.19% to the Fund’s total performance.
The Fund’s bond portfolio outperformed the Barclays Government & Corporate Credit index, which declined by 0.46%.1
The story of this fiscal year for The DGI Fund’s investments was reaction and response to the COVID-19 pandemic. Some of The DGI Fund holdings were near the economic epicenter of the crisis. As we undertook a rigorous reevaluation of every stock in the Fund, it was clear that companies like JetBlue Airways, Royal Caribbean Cruises, Nordstom, and TJX Companies (owners of TJ Maxx, Marshall’s, and HomeGoods) had a difficult path ahead. While prudence called for trimming the allocation toward some of these types of stocks, conversations with the management teams left us mostly impressed with how each company was responding to their unique circumstances. For example, Royal Caribbean Cruises was able to renegotiate with its lenders and investors to give the company financial flexibility to survive an extended no-sail environment. As the time passed and the pandemic’s future gained some clarity, Royal Caribbean was even able to increase bookings and prices for future cruises as their raving fan base of cruise customers responded to the company’s efforts to return to sailing. To be sure, these companies faced short-term setbacks and, in some cases, substantial losses on their income statements. However, we believe what allowed them to stand out was their astute, future-oriented decisions at a time when many competitors did not seem to think beyond simply staying in business.
In our company-by-company review, some companies were also potential clear winners during this period as a result of consumers and businesses rapidly and drastically shifting to online purchasing and interaction, as in-person gatherings were largely not an option. Many of the stocks in this category had significant price increases during the year. Sleep Number, Ubiquiti, Garmin, Dolby, Manhattan Associates, Align Technology, and Alarm.com are some of the stocks that benefitted greatly from the pandemic and other disruptions of 2020. In many cases, these stocks increased in valuation so dramatically that they warranted trims or complete sales.
Yet another group of stocks in the Fund surprised us upon our review; namely, the stocks of natural gas producers. As demand for oil dropped with stay-at-home orders put in place, domestic oil production was curtailed. When domestic oil producers lift oil, they also lift natural gas as a by-product. As oil is their primary product, these producers do not seek premium prices for their natural gas, rather they sell at discount rates while increasing the natural gas supply. As this slowed, those companies that primarily produce natural gas had their outlooks improve. Meanwhile, energy consumption for residential purposes and demand for exported natural gas increased. Southwestern Energy and Core Laboratories saw their stock prices appreciate during the year.
We point out these examples as illustrations of the impact of each company’s ability to assess the situation and respond in a time of crisis. Our job is, in turn, to evaluate each company’s plan, execution, and outlook as they impact the stock’s future potential. In a year with high volatility and dramatic differences in stock performance by economic sector, we responded by reconfiguring the
| Annual Report | April 30, 2021 | 1 |
| The Disciplined Growth Investors Fund | Shareholder Letter |
April 30, 2021 (Unaudited)
Fund’s holdings more than in a typical year.2 In October of 2020, we sold stocks we believed had a decreased outlook for expected returns and allocated the proceeds toward stocks we believe, at the time of the investment decisions, have more robust long-term growth potential.
This restructuring of the Fund portfolio resulted in the largest capital gains distribution the Fund has generated in its nine-year history. For those of you with taxable accounts, we know there may have been an element of sticker shock on your 1099 forms early this year. However, we believe the underlying reason for these capital gains is a good one – long-held positions that increased in value over time primarily because of solid business execution and fundamental performance. Trees do not grow to the sky though, and with the increased clustering of high valuations into pockets of the stock market, it did lead to gains being more concentrated than we would normally expect.
The result of this increased turnover in the Fund is that it is now allocated more heavily toward what we believe are “sweet spot” companies – growing business in which we were able to invest at reasonable stock prices.
In the last year, we have repositioned the portfolio, allocating away from companies with lower expected returns in our valuation model and toward those with higher expected returns. To us, this is a necessary and ongoing process to preserve the forward return potential of the Fund and occasionally extreme circumstances may allow us to make these allocation changes more rapidly. Our process is not only the same, but we believe it is thriving in this environment and that the portfolio is positioned well for the future.
You can find additional performance information and a full list of the Fund’s holdings in this Annual report and at www.dgifund.com.
Portfolio Activity
New Stocks & Additions to Existing Holdings:
Since we last wrote to you last (10/31/20), the investment team added one new stock, InterDigital Inc., to The DGI Fund.
InterDigital, Inc. (IDCC) designs and sells wireless and video intellectual property. They utilize a standards-based approach to efficiently access and license their technological blueprints to most manufacturers worldwide in cellular, while also selling into consumer electronics and several other niche categories. We believe they can grow their licensing business and add new licensing sales in the “Internet-of-Things” as that market expands over time. Given the lack of market recognition for these future opportunities, we took an initial position.
In the last six months, we also added to the existing allocations of 12 stocks: Akamai Technology, Alarm.com, Arista Networks, Dolby Laboratories, Garmin, Gentex, Paychex, Stitch Fix, Strategic Education, Under Armour, and Viasat.
Complete Sales and Trims to Existing Positions:
We sold the remaining position in Edwards Lifesciences, RealPage, TCF Financial, TripAdvisor, Ubiquiti Networks, and Varian Medical Systems.
Edwards Lifesciences (EW) develops revolutionary heart valves and monitoring systems for use in cardiac surgery. The company has successfully captured a large share of the market versus its competitors; however, we believe the company is fully valued with limited upside from the current
| 2 | 1-855-DGI-FUND (344-3863) | www.DGIfund.com |
| The Disciplined Growth Investors Fund | Shareholder Letter |
April 30, 2021 (Unaudited)
stock price. We sold the remaining position to fund other stock purchases with what we believe to be much higher expected returns.
RealPage, Inc (RP), a maker of property management software, announced late in 2020 that it would be acquired by Thoma Bravo. We sold the position to fund other opportunities.
TCF Financial Corporation (TCF) is a regional banking institution focused on consumer and commercial lending. When we initiated a position in TCF in 2012 in the aftermath of the 2008 financial crisis, the company boasted a clean loan book and a clear strategy for growing its business while navigating the new bank regulatory paradigm. Over the last two years, TCF has been involved in two mergers, which introduced new risks and complicated the ability of the stock and company to perform in line with our original investment thesis. The investment team believed there were better opportunities for the portfolio, so we exited the position.
TripAdvisor, Inc. (TRIP) is an online travel company which owns and operates a portfolio of online travel brands. When we took an initial position in TripAdvisor five years ago, the company was in the early stages of transitioning its business model which we believed would enable it to leverage its hundreds of millions of proprietary user-generated reviews and eventually set the company up for reaccelerating revenue growth. Unfortunately, as sometimes happens with our investments, that investment thesis did not materialize as we would have liked. We completely sold the stock due to increased competition from Google and other online travel agencies and the resulting erosion of TRIP’s market share.
Ubiquiti Inc. (UI) designs and sells networking equipment and software products that are well-known in the industry for being low-cost and highly capable, uniquely relying on a passionate group of users as their sales and technical support channel. The company has limited its communication with investors because the founder holds a dominant and growing position in the company, which in turn would limit our ability to evaluate the company over time. The stock price has also appreciated nicely over the last several years, thereby decreasing the expected return in our forecast model. Given these factors, we sold the entire position during the quarter to fund other opportunities.
Varian Medical Systems, Inc. (VAR), a medical device and software maker, announced in August of 2020 that it would be acquired by Siemens Healthineers. Prior to the final closure of that deal, we sold the remaining position and used the proceeds towards other investment opportunities.
In this time we also reduced the Fund’s allocation towards 11 stocks: Align Technologies, Intuit, Intuitive Surgical, Jetblue Airways, Manhattan Associates, Middleby Corp, Open Text, Power Integrations, Proto Labs, Sleep Number, and TJX Companies.
Purchase and Sale:
Two stocks - Stamps.com and Stich Fix – experienced such unusual volatility in the last six months that we both added to and trimmed the positions in as a result.
Sincerely,

Frederick K. Martin, CFA -- Portfolio Manager
| Annual Report | April 30, 2021 | 3 |
| The Disciplined Growth Investors Fund | Shareholder Letter |
April 30, 2021 (Unaudited)
| * | Asset class-specific performance is before fees. The Fund’s single fee – the management fee – is paid from the Fund’s holding of cash. Total Fund net-of-fees performance is presented in this letter, later in this annual report, and is updated monthly on the Fund’s website, www.dgifund.com. |
| 1 | The Barclay’s Government & Corporate Credit index is not a benchmark for the Fund. It is referenced here simply to compare the Fixed Income holdings’ performance within the Fund against a broad bond market index. |
| 2 | The Fund’s reported turnover did not change materially from past years. Turnover is typically calculated as dollar turnover which is impacted by investor-based inflows to the Fund and outflows from the Fund. The activity we reference here are the investment decisions within the Fund. |
The Barclay’s Government & Corporate Credit index includes both corporate (publicly-issued, fixed-rate, nonconvertible, investment grade, dollar-denominated, SEC-registered, corporate dept.) and government (Treasury Bond index, Agency Bond index, 1-3 Year Government index, and the 20+-Year treasury) indexes, including bonds with maturities up to ten years.
The S&P 500® Total Return Index is an unmanaged index of 500 common stocks chosen for market size, liquidity and industry group representation. It is a market-value weighted index. The Index is not actively managed and does not reflect any deductions for fees, expenses or taxes. An investor may not invest directly in the Index.
Asset class-specific performance is before fees. The Fund’s single fee – the management fee – is paid from the Fund’s holding of cash. Total Fund net-of-fees performance is presented in this letter, later in this annual report, and is updated monthly on the Fund’s website, www.dgifund.com.
The views of Disciplined Growth Investors, Inc. and information discussed in this commentary are as of the date of publication, are subject to change, and may not reflect the writers’ current views.
The views expressed are those of the Fund’s adviser only, and represent an assessment of market conditions at a specific point in time, are opinions only and should not be relied upon as investment advice regarding a particular investment or markets in general. Such information does not constitute a recommendation to buy or sell specific securities or investment vehicles. It should not be assumed that any investment will be profitable or will equal the performance of the portfolios or any securities or any sectors mentioned in this letter. The subject matter contained in this letter has been derived from several sources believed to be reliable and accurate at the time of compilation. Neither Disciplined Growth Investors, Inc. nor the Fund accepts any liability for losses either direct or consequential caused by the use of this information.
The Fund is distributed by ALPS Distributors, Inc.
The Fund is subject to investment risks, including possible loss of the principal amount invested and therefore is not suitable for all investors. The Fund may not achieve its objectives.
Diversification does not eliminate the risk of experiencing investment losses.
Fred Martin is a registered representative of ALPS Distributors, Inc. CFA Institute Marks are trademarks owned by the CFA Institute.
| 4 | 1-855-DGI-FUND (344-3863) | www.DGIfund.com |
| The Disciplined Growth Investors Fund | Performance Update |
April 30, 2021 (Unaudited)
Annualized Total Return Performance (for the period ended April 30, 2021)
| Since | |||||
| 6 month | 1 Year | 3 Year | 5 Year | Inception* | |
| The Disciplined Growth Investors Fund | 27.44% | 47.00% | 17.11% | 15.17% | 13.58% |
| S&P 500® Total Return Index(1) | 28.86% | 45.98% | 18.67% | 17.42% | 16.27% |
Performance data quoted represents past performance. Past performance does not guarantee future results. Investment return and principal value of an investment will fluctuate so that an investor’s shares, when sold or redeemed, may be worth more or less than the original cost. Current performance data may be higher or lower than actual data quoted. For the most current month-end performance data please call 1.855.DGI.FUND.
The table does not reflect the deductions of taxes a shareholder would pay on Fund distributions or redemptions of Fund shares.
Subject to investment risks, including possible loss of the principal amount invested.
Returns for periods less than 1 year are cumulative.
| * | Fund Inception date of August 12, 2011. |
| (1) | The S&P 500® Total Return Index is an unmanaged index of 500 common stocks chosen for market size, liquidity and industry group representation. It is a market-value weighted index. The Index is not actively managed and does not reflect any deductions for fees, expenses or taxes. An investor may not invest directly in the Index. |
| Annual Report | April 30, 2021 | 5 |
| The Disciplined Growth Investors Fund | Performance Update |
April 30, 2021 (Unaudited)
Growth of $10,000 Investment in the Fund (for the period ended April 30, 2021)
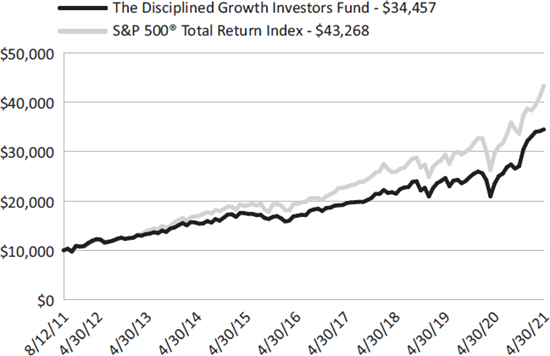
The chart above represents historical performance of a hypothetical investment of $10,000 in the Fund since inception. Past performance does not guarantee future results. This chart does not reflect the deduction of taxes that a shareholder would pay on Fund distributions or the redemption of Fund shares.
Investing in the Fund is subject to investment risks, including possible loss of the principal amount invested.
| Industry Sector Allocation | |
| (as a % of Net Assets)* | |
| Technology | 32.74% |
| Consumer Discretionary | 14.83% |
| Industrials | 11.06% |
| Health Care | 5.62% |
| Energy | 2.93% |
| Communications | 2.22% |
| Financials | 0.81% |
| Consumer, Cyclical | 0.53% |
| Corporate Bonds | 17.93% |
| Foreign Corporate Bonds | 0.87% |
| Foreign Government Bonds | 0.22% |
| Government & Agency Obligations | 9.29% |
| Other Assets in Excess of Liabilities | 0.95% |
| Top Ten Holdings | |
| (as a % of Net Assets)* | |
| U.S. Treasury Note | 5.79% |
| Akamai Technologies, Inc. | 3.14% |
| Gentex Corp. | 3.04% |
| Align Technology, Inc. | 2.96% |
| Garmin, Ltd. | 2.90% |
| Dolby Laboratories, Inc. | 2.75% |
| Autodesk, Inc. | 2.59% |
| Cognex Corp. | 2.54% |
| Sleep Number Corp. | 2.34% |
| Super Micro Computer, Inc. | 2.25% |
| Top Ten Holdings | 30.30% |
| * | Holdings are subject to change, and may not reflect the current or future position of the portfolio. |
| 6 | 1-855-DGI-FUND (344-3863) | www.DGIfund.com |
| The Disciplined Growth Investors Fund | Disclosure of Fund Expenses |
April 30, 2021 (Unaudited)
As a shareholder of the Fund, you incur two types of costs: (1) transaction costs, including sales charges (loads) on purchase payments, reinvested dividends, or other distributions; redemption fees; and exchange fees; and (2) ongoing costs, including management fees; distribution and/or service (12b-1) fees; and other fund operating expenses. This example is intended to help you understand your ongoing costs (in dollars), of investing in the Fund and to compare these costs with the ongoing costs of investing in other mutual funds.
This example is based on an investment of $1,000 invested at the beginning of the period and held for the entire six-month period of November 1, 2020 through April 30, 2021.
Actual Expenses The first line of the table below provides information about actual account values and actual expenses. You may use the information in this line, together with the amount you invested, to estimate the expenses that you paid over the period. Simply divide your account value by $1,000 (for example, an $8,600 account value divided by $1,000 = 8.6), then multiply the result by the number in the first line under the heading “Expenses Paid During Period” to estimate the expenses you paid on your account during this period.
Hypothetical Example for Comparison Purposes The second line of the table below provides information about hypothetical account values and hypothetical expenses based on the Fund’s actual expense ratio and an assumed rate of return of 5% per year before expenses, which is not the Fund’s actual return. The hypothetical account values and expenses may not be used to estimate the actual ending account balance or expenses you paid for the period. You may use this information to compare the ongoing costs of investing in the Fund and other mutual funds. To do so, compare this 5% hypothetical example with the 5% hypothetical examples that appear in the shareholder reports of the other funds.
Please note that the expenses shown in the table are meant to highlight your ongoing costs only and do not reflect transactional costs, such as sales charges (loads), redemption fees or exchange fees. Therefore, the second line of the table is useful in comparing ongoing costs only and will not help you determine the relative total costs of owning different funds. In addition, if these transactional costs were included, your costs would have been higher.
| Beginning Account Value 11/1/2020 | Ending Account Value 4/30/2021 | Expense Ratio(a) | Expenses Paid During period 11/1/2020 - 4/30/2021(b) | |
| Actual | $1,000.00 | $1,274.40 | 0.78% | $ 4.40 |
| Hypothetical (5% return before expenses) | $1,000.00 | $1,020.93 | 0.78% | $ 3.91 |
| (a) | The Fund’s expense ratios have been annualized based on the Fund’s most recent fiscal half-year expenses. |
| (b) | Expenses are equal to the Fund’s annualized expense ratio, multiplied by the average account value over the period, multiplied by the number of days in the most recent fiscal half-year (181)/365 (to reflect the half-year period). |
| Annual Report | April 30, 2021 | 7 |
| The Disciplined Growth Investors Fund | Portfolio of Investments |
April 30, 2021
| Shares | Value (Note 2) | |||||||
| COMMON STOCKS (70.74%) | ||||||||
| COMMUNICATIONS (2.22%) | ||||||||
| Media (2.22%) | ||||||||
| Stamps.com, Inc. (a) | 37,274 | $ | 7,654,961 | |||||
| TOTAL COMMUNICATIONS | 7,654,961 | |||||||
| CONSUMER DISCRETIONARY (14.83%) | ||||||||
| Consumer Discretionary Products (6.32%) | ||||||||
| Gentex Corp. | 298,676 | 10,507,422 | ||||||
| Gentherm, Inc. (a) | 35,826 | 2,550,811 | ||||||
| LGI Homes, Inc. (a) | 17,005 | 2,819,089 | ||||||
| Under Armour, Inc., Class A(a) | 244,444 | 5,942,434 | ||||||
| 21,819,756 | ||||||||
| Consumer Discretionary Services (2.23%) | ||||||||
| Royal Caribbean Cruises, Ltd. (a) | 58,077 | 5,049,795 | ||||||
| Strategic Education, Inc. | 35,214 | 2,643,163 | ||||||
| 7,692,958 | ||||||||
| Retail & Whsle - Discretionary (6.28%) | ||||||||
| Nordstrom, Inc. (a) | 71,346 | 2,616,971 | ||||||
| Sleep Number Corp. (a) | 72,325 | 8,092,444 | ||||||
| Stitch Fix, Inc., Class A(a) | 100,309 | 4,345,386 | ||||||
| TJX Cos., Inc. | 93,742 | 6,655,682 | ||||||
| 21,710,483 | ||||||||
| TOTAL CONSUMER DISCRETIONARY | 51,223,197 | |||||||
| CONSUMER, CYCLICAL (0.53%) | ||||||||
| Retail (0.53%) | ||||||||
| MSC Industrial Direct Co., Inc., Class A | 20,443 | 1,843,141 | ||||||
| TOTAL CONSUMER, CYCLICAL | 1,843,141 | |||||||
| 8 | 1-855-DGI-FUND (344-3863) | www.DGIfund.com |
| The Disciplined Growth Investors Fund | Portfolio of Investments |
April 30, 2021
| Shares | Value (Note 2) | |||||||
| ENERGY (2.93%) | ||||||||
| Oil & Gas (2.93%) | ||||||||
| Cabot Oil & Gas Corp. | 322,602 | $ | 5,377,775 | |||||
| Core Laboratories NV | 28,475 | 802,426 | ||||||
| Southwestern Energy Co. (a) | 924,720 | 3,948,554 | ||||||
| 10,128,755 | ||||||||
| TOTAL ENERGY | 10,128,755 | |||||||
| FINANCIALS (0.81%) | ||||||||
| Banking (0.25%) | ||||||||
| Cullen/Frost Bankers, Inc. | 7,215 | 866,233 | ||||||
| Specialty Finance (0.56%) | ||||||||
| Deluxe Corp. | 44,206 | 1,945,948 | ||||||
| TOTAL FINANCIALS | 2,812,181 | |||||||
| HEALTH CARE (5.62%) | ||||||||
| Health Care (5.62%) | ||||||||
| Align Technology, Inc. (a) | 17,156 | 10,216,913 | ||||||
| Intuitive Surgical, Inc. (a) | 7,037 | 6,087,005 | ||||||
| Myriad Genetics, Inc. (a) | 102,968 | 3,111,693 | ||||||
| 19,415,611 | ||||||||
| TOTAL HEALTH CARE | 19,415,611 | |||||||
| INDUSTRIALS (11.06%) | ||||||||
| Industrial Products (6.78%) | ||||||||
| Cognex Corp. | 101,947 | 8,779,676 | ||||||
| Graco, Inc. | 43,386 | 3,332,045 | ||||||
| Middleby Corp. (a) | 33,444 | 6,064,066 | ||||||
| Proto Labs, Inc. (a) | 20,313 | 2,276,275 | ||||||
| Snap-on, Inc. | 12,480 | 2,965,248 | ||||||
| 23,417,310 | ||||||||
| Industrial Services (4.28%) | ||||||||
| Alarm.com Holdings, Inc. (a) | 64,433 | 5,783,506 | ||||||
| JetBlue Airways Corp. (a) | 180,992 | 3,684,997 | ||||||
| Landstar System, Inc. | 30,964 | 5,334,478 | ||||||
| 14,802,981 | ||||||||
| TOTAL INDUSTRIALS | 38,220,291 | |||||||
| Annual Report | April 30, 2021 | 9 |
| The Disciplined Growth Investors Fund | Portfolio of Investments |
April 30, 2021
| Shares | Value (Note 2) | |||||||
| TECHNOLOGY (32.74%) | ||||||||
| Software & Tech Services (11.96%) | ||||||||
| Akamai Technologies, Inc. (a) | 99,689 | $ | 10,836,194 | |||||
| Autodesk, Inc. (a) | 30,657 | 8,949,085 | ||||||
| FactSet Research Systems, Inc. | 4,034 | 1,356,312 | ||||||
| IHS Markit, Ltd. | 27,705 | 2,980,504 | ||||||
| Intuit, Inc. | 17,496 | 7,211,151 | ||||||
| Manhattan Associates, Inc. (a) | 10,806 | 1,483,015 | ||||||
| Open Text Corp. | 92,927 | 4,376,862 | ||||||
| Paychex, Inc. | 42,125 | 4,106,766 | ||||||
| 41,299,889 | ||||||||
| Tech Hardware & Semiconductors (20.78%) | ||||||||
| Arista Networks, Inc. (a) | 12,584 | 3,966,099 | ||||||
| Dolby Laboratories, Inc., Class A | 93,629 | 9,500,535 | ||||||
| Garmin, Ltd. | 72,972 | 10,014,677 | ||||||
| InterDigital, Inc. | 37,608 | 2,610,747 | ||||||
| IPG Photonics Corp. (a) | 12,927 | 2,806,581 | ||||||
| Microchip Technology, Inc. | 31,555 | 4,742,401 | ||||||
| Plantronics, Inc. (a) | 114,633 | 4,584,174 | ||||||
| Plexus Corp. (a) | 84,029 | 7,767,641 | ||||||
| Power Integrations, Inc. | 91,650 | 7,589,536 | ||||||
| Pure Storage, Inc., Class A(a) | 228,017 | 4,610,504 | ||||||
| Super Micro Computer, Inc. (a) | 209,943 | 7,772,090 | ||||||
| Viasat, Inc. (a) | 112,319 | 5,817,001 | ||||||
| 71,781,986 | ||||||||
| TOTAL TECHNOLOGY | 113,081,875 | |||||||
| TOTAL COMMON STOCKS | ||||||||
| (Cost $139,079,741) | $ | 244,380,012 | ||||||
Principal Amount | Value (Note 2) | |||||||
| CORPORATE BONDS (17.93%) | ||||||||
| COMMUNICATIONS (1.14%) | ||||||||
| Cable & Satellite (0.28%) | ||||||||
| Comcast Corp. | ||||||||
| 4.150% 10/15/2028 | $ | 840,000 | $ | 967,117 | ||||
| Entertainment Content (0.29%) | ||||||||
| ViacomCBS, Inc. | ||||||||
| 3.700% 06/01/2028 | 910,000 | 996,019 | ||||||
| 10 | 1-855-DGI-FUND (344-3863) | www.DGIfund.com |
| The Disciplined Growth Investors Fund | Portfolio of Investments |
April 30, 2021
Principal Amount | Value (Note 2) | |||||||
| COMMUNICATIONS (continued) | ||||||||
| Wireless Telecommunications Services (0.57%) | ||||||||
| AT&T, Inc. | ||||||||
| 4.350% 03/01/2029 | $ | 890,000 | $ | 1,010,868 | ||||
| 4.450%04/01/2024 | 4,000 | 4,403 | ||||||
| Verizon Communications, Inc. | ||||||||
| 4.329% 09/21/2028 | 840,000 | 969,032 | ||||||
| 1,984,303 | ||||||||
| TOTAL COMMUNICATIONS | 3,947,439 | |||||||
| CONSUMER DISCRETIONARY (1.94%) | ||||||||
| Airlines (0.24%) | ||||||||
| Southwest Airlines Co. | ||||||||
| 3.000% 11/15/2026 | 756,000 | 809,805 | ||||||
| Automobiles Manufacturing (0.23%) | ||||||||
| General Motors Financial Co., Inc. | ||||||||
| 5.250% 03/01/2026 | 695,000 | 801,268 | ||||||
| Consumer Services (0.29%) | ||||||||
| Cintas Corp. No 2 | ||||||||
| 3.700% 04/01/2027 | 900,000 | 1,006,704 | ||||||
| Restaurants (0.29%) | ||||||||
| McDonald’s Corp., Series MTN | ||||||||
| 6.300% 03/01/2038 | 715,000 | 1,005,263 | ||||||
| Retail - Consumer Discretionary (0.89%) | ||||||||
| Advance Auto Parts, Inc. | ||||||||
| 1.750% 10/01/2027 | 1,010,000 | 1,001,422 | ||||||
| Amazon.com, Inc. | ||||||||
| 5.200% 12/03/2025 | 885,000 | 1,047,554 | ||||||
| Lowe’s Cos., Inc. | ||||||||
| 3.650% 04/05/2029 | 925,000 | 1,023,169 | ||||||
| 3,072,145 | ||||||||
| TOTAL CONSUMER DISCRETIONARY | 6,695,185 | |||||||
| CONSUMER STAPLES (0.53%) | ||||||||
| Food & Beverage (0.29%) | ||||||||
| Anheuser-Busch InBev Worldwide, Inc. | ||||||||
| 4.000% 04/13/2028 | 900,000 | 1,011,299 | ||||||
| Annual Report | April 30, 2021 | 11 |
| The Disciplined Growth Investors Fund | Portfolio of Investments |
April 30, 2021
Principal Amount | Value (Note 2) | |||||||
| CONSUMER STAPLES (continued) | ||||||||
| Mass Merchants (0.24%) | ||||||||
| Costco Wholesale Corp. | ||||||||
| 2.750% 05/18/2024 | $ | 760,000 | $ | 811,400 | ||||
| TOTAL CONSUMER STAPLES | 1,822,699 | |||||||
| CONSUMER, NON-CYCLICAL (0.58%) | ||||||||
| Pharmaceuticals (0.58%) | ||||||||
| AbbVie, Inc. | ||||||||
| 4.250% 11/14/2028 | 880,000 | 1,007,289 | ||||||
| CVS Health Corp. | ||||||||
| 4.300% 03/25/2028 | 890,000 | 1,013,400 | ||||||
| 2,020,689 | ||||||||
| TOTAL CONSUMER, NON-CYCLICAL | 2,020,689 | |||||||
| ENERGY (1.54%) | ||||||||
| Exploration & Production (0.29%) | ||||||||
| Burlington Resources LLC | ||||||||
| 7.400% 12/01/2031 | 700,000 | 1,006,765 | ||||||
| Pipeline (1.25%) | ||||||||
| Boardwalk Pipelines LP | ||||||||
| 5.950% 06/01/2026 | 670,000 | 791,619 | ||||||
| Enbridge Energy Partners LP | ||||||||
| 4.200% 09/15/2021 | 4,000 | 4,018 | ||||||
| 5.875% 10/15/2025 | 643,000 | 762,502 | ||||||
| Enterprise Products Operating LLC | ||||||||
| 3.125% 07/31/2029 | 955,000 | 1,011,992 | ||||||
| MPLX LP | ||||||||
| 2.650% 08/15/2030 | 965,000 | 953,734 | ||||||
| ONEOK, Inc. | ||||||||
| 4.550% 07/15/2028 | 694,000 | 775,192 | ||||||
| 4,299,057 | ||||||||
| TOTAL ENERGY | 5,305,822 | |||||||
| FINANCIALS (3.64%) | ||||||||
| Banks (0.87%) | ||||||||
| Truist Financial Corp., Series MTN | ||||||||
| 3.875% 03/19/2029 | 895,000 | 1,000,738 | ||||||
| US Bancorp, Series DMTN | ||||||||
| 3.000% 07/30/2029 | 950,000 | 1,009,340 | ||||||
| 12 | 1-855-DGI-FUND (344-3863) | www.DGIfund.com |
| The Disciplined Growth Investors Fund | Portfolio of Investments |
April 30, 2021
Principal Amount | Value (Note 2) | |||||||
| FINANCIALS (continued) | ||||||||
| Banks (continued) | ||||||||
| Wells Fargo & Co., Series GMTN | ||||||||
| 4.300% 07/22/2027 | $ | 885,000 | $ | 1,004,224 | ||||
| 3,014,302 | ||||||||
| Consumer Finance (0.29%) | ||||||||
| American Express Co. | ||||||||
| 3.125% 05/20/2026 | 925,000 | 1,005,834 | ||||||
| Diversified Banks (0.79%) | ||||||||
| Bank of America Corp., Series L | ||||||||
| 4.183% 11/25/2027 | 715,000 | 800,350 | ||||||
| Citigroup, Inc. | ||||||||
| 4.300% 11/20/2026 | 860,000 | 969,254 | ||||||
| JPMorgan Chase & Co. | ||||||||
| 4.125% 12/15/2026 | 860,000 | 974,329 | ||||||
| 2,743,933 | ||||||||
| Financial Services (0.58%) | ||||||||
| Morgan Stanley, Series GMTN | ||||||||
| 3.700% 10/23/2024 | 900,000 | 984,980 | ||||||
| Northern Trust Corp. | ||||||||
| 3M US L + 1.131% 05/08/2032 (b) | 930,000 | 1,003,929 | ||||||
| 1,988,909 | ||||||||
| Life Insurance (0.23%) | ||||||||
| Principal Financial Group, Inc. | ||||||||
| 3.100% 11/15/2026 | 726,000 | 786,006 | ||||||
| Property & Casualty Insurance (0.29%) | ||||||||
| American International Group, Inc. | ||||||||
| 4.250% 03/15/2029 | 890,000 | 1,005,927 | ||||||
| Real Estate (0.59%) | ||||||||
| Simon Property Group LP | ||||||||
| 2.450% 09/13/2029 | 1,010,000 | 1,019,025 | ||||||
| Welltower, Inc. | ||||||||
| 4.125% 03/15/2029 | 905,000 | 1,020,004 | ||||||
| 2,039,029 | ||||||||
| TOTAL FINANCIALS | 12,583,940 | |||||||
| Annual Report | April 30, 2021 | 13 |
| The Disciplined Growth Investors Fund | Portfolio of Investments |
April 30, 2021
Principal Amount | Value (Note 2) | |||||||
| HEALTH CARE (0.51%) | ||||||||
| Managed Care (0.51%) | ||||||||
| Anthem, Inc. | ||||||||
| 3.650% 12/01/2027 | $ | 900,000 | $ | 1,000,471 | ||||
| UnitedHealth Group, Inc. | ||||||||
| 3.750% 07/15/2025 | 691,000 | 769,985 | ||||||
| 1,770,456 | ||||||||
| TOTAL HEALTH CARE | 1,770,456 | |||||||
| INDUSTRIALS (2.62%) | ||||||||
| Aerospace & Defense (0.50%) | ||||||||
| Lockheed Martin Corp. | ||||||||
| 3.100% 01/15/2023 | 680,000 | 708,427 | ||||||
| Raytheon Technologies Corp. | ||||||||
| 4.125% 11/16/2028 | 885,000 | 1,005,318 | ||||||
| 1,713,745 | ||||||||
| Engineering & Construction (0.22%) | ||||||||
| Fluor Corp. | ||||||||
| 4.250% 09/15/2028 | 725,000 | 748,417 | ||||||
| Industrial Other (0.30%) | ||||||||
| General Electric Co., Series MTN | ||||||||
| 5.875% 01/14/2038 | 790,000 | 1,035,148 | ||||||
| Railroad (0.48%) | ||||||||
| Burlington Northern Santa Fe LLC | ||||||||
| 3.000% 03/15/2023 | 2,000 | 2,088 | ||||||
| 3.400% 09/01/2024 | 875,000 | 950,445 | ||||||
| Union Pacific Corp. | ||||||||
| 3.950% 09/10/2028 | 637,000 | 725,527 | ||||||
| 1,678,060 | ||||||||
| Transportation & Logistics (0.54%) | ||||||||
| FedEx Corp. | ||||||||
| 3.300% 03/15/2027 | 756,000 | 842,749 | ||||||
| United Parcel Service, Inc. | ||||||||
| 6.200% 01/15/2038 | 715,000 | 1,029,089 | ||||||
| 1,871,838 | ||||||||
| Waste & Environment Services & Equipment (0.58%) | ||||||||
| Republic Services, Inc. | ||||||||
| 3.375% 11/15/2027 | 910,000 | 999,230 | ||||||
| 14 | 1-855-DGI-FUND (344-3863) | www.DGIfund.com |
| The Disciplined Growth Investors Fund | Portfolio of Investments |
| April 30, 2021 |
| Principal Amount | Value (Note 2) | |||||||
| INDUSTRIALS (continued) | ||||||||
| Waste & Environment Services & Equipment (continued) | ||||||||
| Waste Management, Inc. | ||||||||
| 3.150% 11/15/2027 | $ | 915,000 | $ | 996,399 | ||||
| 1,995,629 | ||||||||
| TOTAL INDUSTRIALS | 9,042,837 | |||||||
| MATERIALS (0.29%) | ||||||||
| Chemicals (0.29%) | ||||||||
| DuPont de Nemours, Inc. | ||||||||
| 4.725% 11/15/2028 | 860,000 | 1,008,857 | ||||||
| TOTAL MATERIALS | 1,008,857 | |||||||
| TECHNOLOGY (0.23%) | ||||||||
| Semiconductors (0.23%) | ||||||||
| Analog Devices, Inc. | ||||||||
| 3.900% 12/15/2025 | 711,000 | 792,201 | ||||||
| TOTAL TECHNOLOGY | 792,201 | |||||||
| UTILITIES (4.91%) | ||||||||
| Utilities (4.91%) | ||||||||
| Ameren Corp. | ||||||||
| 1.750% 03/15/2028 | 1,020,000 | 999,890 | ||||||
| American Electric Power Co., Inc. | ||||||||
| 3.200% 11/13/2027 | 931,000 | 1,007,123 | ||||||
| Black Hills Corp. | ||||||||
| 3.150% 01/15/2027 | 700,000 | 750,111 | ||||||
| CenterPoint Energy, Inc. | ||||||||
| 4.250% 11/01/2028 | 895,000 | 1,012,809 | ||||||
| CMS Energy Corp. | ||||||||
| 3.450% 08/15/2027 | 910,000 | 1,005,301 | ||||||
| DTE Energy Co. | ||||||||
| 3.800% 03/15/2027 | 905,000 | 1,000,774 | ||||||
| Duke Energy Corp. | ||||||||
| 3.400% 06/15/2029 | 940,000 | 1,014,609 | ||||||
| Eastern Energy Gas Holdings LLC, Series B | ||||||||
| 3.000% 11/15/2029 | 915,000 | 960,513 | ||||||
| Edison International | ||||||||
| 2.400% 09/15/2022 | 745,000 | 760,115 | ||||||
| Interstate Power and Light Co. | ||||||||
| 3.400% 08/15/2025 | 723,000 | 783,337 | ||||||
| Annual Report | April 30, 2021 | 15 |
| The Disciplined Growth Investors Fund | Portfolio of Investments |
| April 30, 2021 |
| Principal Amount | Value (Note 2) | |||||||
| UTILITIES (continued) | ||||||||
| Utilities (continued) | ||||||||
| ITC Holdings Corp. | ||||||||
| 4.050% 07/01/2023 | $ | 540,000 | $ | 574,700 | ||||
| National Rural Utilities Cooperative Finance Corp. | ||||||||
| 3.400% 02/07/2028 | 930,000 | 1,008,841 | ||||||
| NiSource, Inc. | ||||||||
| 2.950% 09/01/2029 | 960,000 | 999,389 | ||||||
| PacifiCorp | ||||||||
| 5.250% 06/15/2035 | 592,000 | 763,525 | ||||||
| Potomac Electric Power Co. | ||||||||
| 3.600% 03/15/2024 | 698,000 | 752,074 | ||||||
| PPL Capital Funding, Inc. | ||||||||
| 4.125% 04/15/2030 | 885,000 | 1,004,747 | ||||||
| Puget Energy, Inc. | ||||||||
| 3.650% 05/15/2025 | 725,000 | 783,032 | ||||||
| Sempra Energy | ||||||||
| 3.750% 11/15/2025 | 699,000 | 770,761 | ||||||
| WEC Energy Group, Inc. | ||||||||
| 1.375% 10/15/2027 | 1,030,000 | 1,002,565 | ||||||
| 16,954,216 | ||||||||
| TOTAL UTILITIES | 16,954,216 | |||||||
| TOTAL CORPORATE BONDS | ||||||||
| (Cost $59,220,998) | $ | 61,944,341 | ||||||
| FOREIGN CORPORATE BONDS (0.87%) | ||||||||
| ENERGY (0.59%) | ||||||||
| Exploration & Production (0.29%) | ||||||||
| Canadian Natural Resources, Ltd. | ||||||||
| 3.850% 06/01/2027 | 925,000 | 1,012,441 | ||||||
| Pipeline (0.30%) | ||||||||
| TransCanada PipeLines, Ltd. | ||||||||
| 7.250% 08/15/2038 | 695,000 | 1,015,147 | ||||||
| TOTAL ENERGY | 2,027,588 | |||||||
| 16 | 1-855-DGI-FUND (344-3863) | www.DGIfund.com |
| The Disciplined Growth Investors Fund | Portfolio of Investments |
| April 30, 2021 |
| Principal Amount | Value (Note 2) | |||||||
| FINANCIALS (0.28%) | ||||||||
| Diversified Banks (0.28%) | ||||||||
| Royal Bank of Canada, Series GMTN | ||||||||
| 4.650% 01/27/2026 | $ | 850,000 | $ | 974,996 | ||||
| TOTAL FINANCIALS | 974,996 | |||||||
| TOTAL FOREIGN CORPORATE BONDS | ||||||||
| (Cost $2,903,723) | $ | 3,002,584 | ||||||
| FOREIGN GOVERNMENT BONDS (0.22%) | ||||||||
| Corp Andina de Fomento | ||||||||
| 4.375% 06/15/2022 | 712,000 | 744,278 | ||||||
| TOTAL FOREIGN GOVERNMENT BONDS | ||||||||
| (Cost $725,525) | $ | 744,278 | ||||||
| GOVERNMENT & AGENCY OBLIGATIONS (9.29%) | ||||||||
| U.S. Treasury Notes | ||||||||
| 0.125% 04/30/2022 | 6,000,000 | 6,004,111 | ||||||
| 0.125% 12/31/2022 | 20,000,000 | 19,997,656 | ||||||
| 2.000% 12/31/2021 | 6,000,000 | 6,077,745 | ||||||
| 32,079,512 | ||||||||
| TOTAL GOVERNMENT & AGENCY OBLIGATIONS | ||||||||
| (Cost $32,092,525) | $ | 32,079,512 | ||||||
| Yield | Shares | Value (Note 2) | ||||||||||
| SHORT TERM INVESTMENTS (0.68%) | ||||||||||||
| MONEY MARKET FUND (0.68%) | ||||||||||||
| Fidelity Investments Money Market Government Portfolio - Class I | 0.010 | %(c) | 2,361,168 | 2,361,168 | ||||||||
| TOTAL SHORT TERM INVESTMENTS | ||||||||||||
| (Cost $2,361,168) | $ | 2,361,168 | ||||||||||
| TOTAL INVESTMENTS (99.73%) | ||||||||||||
| (Cost $236,383,680) | $ | 344,511,895 | ||||||||||
| Other Assets In Excess Of Liabilities (0.27%) | 937,862 | |||||||||||
| NET ASSETS (100.00%) | $ | 345,449,757 | ||||||||||
| Annual Report | April 30, 2021 | 17 |
| The Disciplined Growth Investors Fund | Portfolio of Investments |
| April 30, 2021 |
| (a) | Non-Income Producing Security. |
| (b) | Floating or variable rate security. The reference rate is described below. The rate in effect as of April 30, 2021 is based on the reference rate plus the displayed spread as of the securities last reset date. |
| (c) | Represents the 7-day yield. |
Common Abbreviations:
LIBOR - London Interbank Offered Rate
LLC - Limited Liability Company
LP - Limited Partnership
Ltd. - Limited
Libor Rates:
3M US L - 3 Month LIBOR as of April 30, 2021 was 0.17%
For Fund compliance purposes, the Fund’s industry classifications refer to any one or more of the industry sub-classifications used by one or more widely recognized market indexes or ratings group indexes, and/or as defined by Fund management. This definition may not apply for purposes of this report, which may combine industry sub-classifications for reporting ease. Industries are shown as a percent of net assets.
See Notes to Financial Statements.
| 18 | 1-855-DGI-FUND (344-3863) | www.DGIfund.com |
| The Disciplined Growth Investors Fund | Statement of Assets and Liabilities |
| April 30, 2021 |
| ASSETS | ||||
| Investments, at value | $ | 344,511,895 | ||
| Receivable for shares sold | 480,932 | |||
| Dividends and interest receivable | 684,658 | |||
| Total assets | 345,677,485 | |||
| LIABILITIES | ||||
| Payable for shares redeemed | 6,100 | |||
| Payable to adviser | 221,628 | |||
| Total liabilities | 227,728 | |||
| NET ASSETS | $ | 345,449,757 | ||
| NET ASSETS CONSIST OF | �� | |||
| Paid-in capital (Note 5) | $ | 215,405,886 | ||
| Distributable Earnings | 130,043,871 | |||
| NET ASSETS | $ | 345,449,757 | ||
| INVESTMENTS, AT COST | $ | 236,383,680 | ||
| PRICING OF SHARES | ||||
| Net Asset Value, offering and redemption price per share | $ | 25.94 | ||
| Shares of beneficial interest outstanding | 13,316,536 | |||
See Notes to Financial Statements.
| Annual Report | April 30, 2021 | 19 |
| The Disciplined Growth Investors Fund | Statement of Operations |
| For the Year Ended April 30, 2021 | ||||
| INVESTMENT INCOME | ||||
| Dividends | $ | 1,527,000 | ||
| Foreign taxes withheld | (11,726 | ) | ||
| Interest | 1,787,257 | |||
| Total investment income | 3,302,531 | |||
| EXPENSES | ||||
| Investment advisory fees (Note 6) | 2,202,993 | |||
| Total expenses | 2,202,993 | |||
| NET INVESTMENT INCOME | 1,099,538 | |||
| REALIZED AND UNREALIZED GAIN ON INVESTMENTS | ||||
| Net realized gain on investments | 33,593,363 | |||
| Net change in unrealized appreciation on investments | 69,698,127 | |||
| NET REALIZED AND UNREALIZED GAIN ON INVESTMENTS | 103,291,490 | |||
| NET INCREASE IN NET ASSETS RESULTING FROM OPERATIONS | $ | 104,391,028 | ||
See Notes to Financial Statements.
| 20 | 1-855-DGI-FUND (344-3863) | www.DGIfund.com |
| The Disciplined Growth Investors Fund | Statements of Changes in Net Assets |
| For the Year Ended April 30, 2021 | For the Year Ended April 30, 2020 | |||||||
| OPERATIONS | ||||||||
| Net investment income | $ | 1,099,538 | $ | 2,036,023 | ||||
| Net realized gain | 33,593,363 | 18,009,670 | ||||||
| Net change in unrealized appreciation/(depreciation) | 69,698,127 | (31,274,719 | ) | |||||
| Net increase/(decrease) in net assets resulting from operations | 104,391,028 | (11,229,026 | ) | |||||
| DISTRIBUTIONS (Note 3) | ||||||||
| From distributable earnings | (27,178,282 | ) | (8,714,331 | ) | ||||
| Net decrease in net assets from distributions | (27,178,282 | ) | (8,714,331 | ) | ||||
| CAPITAL SHARE TRANSACTIONS (Note 5) | ||||||||
| Proceeds from sales of shares | 40,251,816 | 16,029,109 | ||||||
| Issued to shareholders in reinvestment of distributions | 26,486,925 | 8,634,679 | ||||||
| Cost of shares redeemed | (25,092,730 | ) | (18,300,955 | ) | ||||
| Net increase from capital share transactions | 41,646,011 | 6,362,833 | ||||||
| Net increase/(decrease) in net assets | 118,858,757 | (13,580,524 | ) | |||||
| NET ASSETS | ||||||||
| Beginning of period | 226,591,000 | 240,171,524 | ||||||
| End of period | $ | 345,449,757 | $ | 226,591,000 | ||||
| OTHER INFORMATION | ||||||||
| Share Transactions | ||||||||
| Issued | 1,671,944 | 786,466 | ||||||
| Issued to shareholders in reinvestment of distributions | 1,105,859 | 411,132 | ||||||
| Redeemed | (1,129,855 | ) | (882,364 | ) | ||||
| Net increase in share transactions | 1,647,948 | 315,234 | ||||||
See Notes to Financial Statements.
| Annual Report | April 30, 2021 | 21 |
The Disciplined Growth Investors Fund
| NET ASSET VALUE, BEGINNING OF PERIOD |
| INCOME FROM OPERATIONS |
| Net investment income(a) |
| Net realized and unrealized gain/(loss) on investments |
| Total from investment operations |
| DISTRIBUTIONS |
| From net investment income |
| From net realized gain on investments |
| Total distributions |
| INCREASE/(DECREASE) IN NET ASSET VALUE |
| NET ASSET VALUE, END OF PERIOD |
| TOTAL RETURN |
| RATIOS AND SUPPLEMENTAL DATA |
| Net assets, end of period (000’s) |
| RATIOS TO AVERAGE NET ASSETS |
| Expenses |
| Net investment income |
| PORTFOLIO TURNOVER RATE |
| (a) | Per share numbers have been calculated using the average shares method. |
| (b) | In 2018 the Fund’s total return consists of a voluntary reimbursement by the advisor for a realized investment loss. Excluding this item, total return would not have been impacted. |
See Notes to Financial Statements.
| 22 | 1-855-DGI-FUND (344-3863) | www.DGIfund.com |
| Financial Highlights |
| For a share outstanding during the years presented |
| For the Year Ended April 30, 2021 | For the Year Ended April 30, 2020 | For the Year Ended April 30, 2019 | For the Year Ended April 30, 2018 | For the Year Ended April 30, 2017 | ||||||||||||||
| $ | 19.42 | $ | 21.15 | $ | 19.12 | $ | 18.20 | $ | 15.96 | |||||||||
| 0.09 | 0.18 | 0.16 | 0.12 | 0.09 | ||||||||||||||
| 8.83 | (1.14 | ) | 2.55 | 1.64 | 2.29 | |||||||||||||
| 8.92 | (0.96 | ) | 2.71 | 1.76 | 2.38 | |||||||||||||
| (0.10 | ) | (0.17 | ) | (0.12 | ) | (0.12 | ) | (0.09 | ) | |||||||||
| (2.30 | ) | (0.60 | ) | (0.56 | ) | (0.72 | ) | (0.05 | ) | |||||||||
| (2.40 | ) | (0.77 | ) | (0.68 | ) | (0.84 | ) | (0.14 | ) | |||||||||
| 6.52 | (1.73 | ) | 2.03 | 0.92 | 2.24 | |||||||||||||
| $ | 25.94 | $ | 19.42 | $ | 21.15 | $ | 19.12 | $ | 18.20 | |||||||||
| 47.00 | % | (4.79 | %) | 14.74 | % | 9.75 | %(b) | 14.96 | % | |||||||||
| $ | 345,450 | $ | 226,591 | $ | 240,172 | $ | 204,068 | $ | 159,774 | |||||||||
| 0.78 | % | 0.78 | % | 0.78 | % | 0.78 | % | 0.78 | % | |||||||||
| 0.39 | % | 0.86 | % | 0.80 | % | 0.64 | % | 0.50 | % | |||||||||
| 31 | % | 29 | % | 22 | % | 18 | % | 16 | % | |||||||||
| Annual Report | April 30, 2021 | 23 |
| The Disciplined Growth Investors Fund | Notes to Financial Statements |
| April 30, 2021 |
1. ORGANIZATION
Financial Investors Trust (the “Trust”), a Delaware statutory trust, is an open-end management investment company registered under the Investment Company Act of 1940, as amended (“1940 Act”). The Trust consists of multiple separate portfolios or series. This annual report describes The Disciplined Growth Investors Fund (the “Fund”). The Fund seeks long-term capital growth and as a secondary objective, modest income with reasonable risk.
2. SIGNIFICANT ACCOUNTING POLICIES
The accompanying financial statements were prepared in accordance with accounting principles generally accepted in the United States of America (“U.S. GAAP”). The preparation of financial statements in conformity with U.S. GAAP requires management to make certain estimates and assumptions that affect the reported amounts of assets and liabilities and disclosures of contingent assets and liabilities at the date of the financial statements and the reported amounts of revenue and expenses during the period. Actual results could differ from those estimates. The Fund is considered an investment company for financial reporting purposes under U.S. GAAP and follows the accounting and reporting guidance applicable to investment companies in the Financial Accounting Standards Board Accounting Standards Codification Topic 946. The following is a summary of significant accounting policies consistently followed by the Fund in preparation of its financial statements.
Investment Valuation: The Fund generally values its securities based on market prices determined at the close of regular trading on the New York Stock Exchange (“NYSE”), normally 4:00 p.m. Eastern Time, on each day the NYSE is open for trading.
For equity securities and mutual funds that are traded on an exchange, the market price is usually the closing sale or official closing price on that exchange. In the case of equity securities not traded on an exchange, or if such closing prices are not otherwise available, the securities are valued at the mean of the most recent bid and ask prices on such day. Redeemable securities issued by open-end registered investment companies are valued at the investment company’s applicable net asset value, with the exception of exchange-traded open-end investment companies, which are priced as equity securities.
The market price for debt obligations is generally the price supplied by an independent third-party pricing service approved by the Board of Trustees of the Trust (the “Board” or the “Trustees”), which may use a matrix, formula or other objective method that takes into consideration quotations from dealers, market transactions in comparable investments, market indices and yield curves. If vendors are unable to supply a price, or if the price supplied is deemed to be unreliable, the market price may be determined using quotations received from one or more broker–dealers that make a market in the security. Fixed-income obligations, excluding municipal securities, having a remaining maturity of greater than 60 days, are typically valued at the mean between the evaluated bid and ask prices formulated by an independent pricing service. Corporate Bonds, U.S. Government & Agency, and U.S. Treasury Bonds & Notes are valued using market models that consider trade data, quotations from dealers and active market makers, relevant yield curve and spread data, creditworthiness, trade data or market information on comparable securities, and other relevant security specific information. Publicly traded Foreign Government Debt securities and Foreign Corporate Bonds are typically traded
| 24 | 1-855-DGI-FUND (344-3863) | www.DGIfund.com |
| The Disciplined Growth Investors Fund | Notes to Financial Statements |
| April 30, 2021 |
internationally in the over-the-counter market and are valued at the mean between the bid and asked prices as of the close of business of that market. Mortgage-related and asset-backed securities are valued based on models that consider trade data, prepayment and default projections, benchmark yield and spread data and estimated cash flows of each tranche of the issuer. Publicly traded foreign government debt securities are typically traded internationally in the over-the-counter market and are valued at the mean between the bid and asked prices as of the close of business of that market.
When such prices or quotations are not available, or when Disciplined Growth Investors, Inc. (the “Adviser”) believes that they are unreliable, securities may be priced using fair value procedures approved by the Board.
Fair Value Measurements: The Fund discloses the classification of its fair value measurements following a three-tier hierarchy based on the inputs used to measure fair value. Inputs refer broadly to the assumptions that market participants would use in pricing the asset or liability, including assumptions about risk. Inputs may be observable or unobservable. Observable inputs reflect the assumptions market participants would use in pricing the asset or liability that are developed based on market data obtained from sources independent of the reporting entity. Unobservable inputs reflect the reporting entity’s own assumptions about the assumptions market participants would use in pricing the asset or liability that are developed based on the best information available.
Various inputs are used in determining the value of the Fund’s investments as of the end of the reporting period. When inputs used fall into different levels of the fair value hierarchy, the level in the hierarchy within which the fair value measurement falls is determined based on the lowest level input that is significant to the fair value measurement in its entirety. The designated input levels are not necessarily an indication of the risk or liquidity associated with these investments. These inputs are categorized in the following hierarchy under applicable financial accounting standards:
| Level 1 – | Unadjusted quoted prices in active markets for identical investments, unrestricted assets or liabilities that the Fund has the ability to access at the measurement date; |
| Level 2 – | Quoted prices which are not active, quoted prices for similar assets or liabilities in active markets or inputs other than quoted prices that are observable (either directly or indirectly) for substantially the full term of the asset or liability; and |
| Level 3 – | Significant unobservable prices or inputs (including the Fund’s own assumptions in determining the fair value of investments) where there is little or no market activity for the asset or liability at the measurement date. |
| Annual Report | April 30, 2021 | 25 |
| The Disciplined Growth Investors Fund | Notes to Financial Statements |
| April 30, 2021 |
The following is a summary of each input used to value the Fund as of April 30, 2021:
| Investments in Securities at Value | Level 1 - Unadjusted Quoted Prices | Level 2 - Other Significant Observable Inputs | Level 3 - Significant Unobservable Inputs | Total | ||||||||||||
| Common Stocks(a) | $ | 244,380,012 | $ | – | $ | – | $ | 244,380,012 | ||||||||
| Corporate Bonds(a) | – | 61,944,341 | – | 61,944,341 | ||||||||||||
| Foreign Corporate Bonds(a) | – | 3,002,584 | – | 3,002,584 | ||||||||||||
| Foreign Government Bonds | – | 744,278 | – | 744,278 | ||||||||||||
| Government & Agency Obligations | – | 32,079,512 | – | 32,079,512 | ||||||||||||
| Short Term Investments | 2,361,168 | – | – | 2,361,168 | ||||||||||||
| TOTAL | $ | 246,741,180 | $ | 97,770,715 | $ | – | $ | 344,511,895 | ||||||||
| (a) | For detailed descriptions of the underlying industries, see the accompanying Portfolio of Investments. |
For the year ended April 30, 2021 the Fund did not have any securities that used significant unobservable inputs (Level 3) in determining fair value.
Investment Transactions and Investment Income: Investment transactions are accounted for on the date the investments are purchased or sold (trade date). Realized gains and losses from investment transactions are reported on an identified cost basis, which is the same basis the Fund uses for federal income tax purposes. Interest income, which includes accretion of discounts, is accrued and recorded as earned. Dividend income is recognized on the ex-dividend date or for certain foreign securities, as soon as information is available to the Fund.
Trust Expenses: Some expenses of the Trust can be directly attributed to the Fund. Expenses which cannot be directly attributed to the Fund are apportioned among all funds in the Trust based on average net assets of each fund.
Fund Expenses: Expenses that are specific to the Fund are charged directly to the Fund.
Federal Income Taxes: The Fund complies with the requirements under Subchapter M of the Internal Revenue Code of 1986, as amended, applicable to regulated investment companies and intends to distribute substantially all of their net taxable income and net capital gains, if any, each year so that it will not be subject to excise tax on undistributed income and gains. The Fund is not subject to income taxes to the extent such distributions are made.
As of and during the year ended April 30, 2021, the Fund did not have a liability for any unrecognized tax benefits. The Fund files U.S. federal, state, and local tax returns as required. The Fund’s tax returns are subject to examination by the relevant tax authorities until expiration of the applicable statute of limitations, which is generally three years after the filing of the tax return for federal purposes and four years for most state returns. Tax returns for open years have incorporated no uncertain tax positions that require a provision for income taxes.
| 26 | 1-855-DGI-FUND (344-3863) | www.DGIfund.com |
| The Disciplined Growth Investors Fund | Notes to Financial Statements |
| April 30, 2021 |
Distributions to Shareholders: The Fund normally pays dividends, if any, quarterly and distributes capital gains, if any, on an annual basis. Income dividend distributions are derived from dividends and other income the Fund receives from its investments, including short term capital gains. Long term capital gain distributions are derived from gains realized when the Fund sells a security it has owned for more than a year. The Fund may make additional distributions and dividends at other times if the portfolio manager believes doing so may be necessary for the Fund to avoid or reduce taxes.
Epidemic and Pandemic Risk: Certain countries have been susceptible to epidemics, most recently COVID-19, which has been designated as a pandemic by world health authorities. The outbreak of such epidemics, together with any resulting restrictions on travel or quarantines imposed, could have a negative impact on the economy and business activity globally (including in the countries in which we invest), and thereby could adversely affect the performance of our investments. Furthermore, the rapid development of epidemics could preclude prediction as to their ultimate adverse impact on economic and market conditions, and, as a result, present material uncertainty and risk with respect to us and the performance of our investments.
Libor Risk: In March 2020, the Financial Accounting Standards Board (FASB) issued Accounting Standards Update (“ASU”) No. 2020-04, Reference Rate Reform (Topic 848): Facilitation of the Effects of Reference Rate Reform on Financial Reporting. The Fund’s investments, payment obligations, and financing terms may be based on floating rates, such as the London Interbank Offered Rate, or “LIBOR,” which is the offered rate for short-term Eurodollar deposits between major international banks. On November 30, 2020, the administrator of LIBOR announced its intention to delay the phase out of the majority of the U.S. dollar LIBOR publications until June 30, 2023, with the remainder of LIBOR publications to still end at the end of 2021. There remains uncertainty regarding the nature of any replacement rate and the impact of the transition from LIBOR on the Fund’s transactions and the financial markets generally. As such, the potential effect of a transition away from LIBOR on the Fund or the Fund’s investments cannot yet be determined.
3. TAX BASIS INFORMATION
Reclassifications: As of April 30, 2021, permanent differences in book and tax accounting were reclassified. These differences had no effect on net assets. The Fund did not have any reclassifications.
| Annual Report | April 30, 2021 | 27 |
| The Disciplined Growth Investors Fund | Notes to Financial Statements |
| April 30, 2021 |
Tax Basis of Investments: As of April 30, 2021, the aggregate cost of investments, gross unrealized appreciation/ (depreciation) and net unrealized appreciation for Federal tax purposes was as follows:
| The Disciplined Growth Investors Fund | ||||
| Gross appreciation (excess of value over tax cost) | $ | 113,428,283 | ||
| Gross depreciation (excess of tax cost over value) | (5,300,068 | ) | ||
| Net unrealized appreciation | $ | 108,128,215 | ||
| Cost of investments for income tax purposes | $ | 236,383,680 | ||
Components of Earnings: As of April 30, 2021, components of distributable earnings were as follows:
| Undistributed ordinary income | $ | 2,668,761 | ||
| Accumulated capital gains | 19,262,464 | |||
| Net unrealized appreciation on investments | 108,128,215 | |||
| Other cumulative effect of timing differences | (15,569 | ) | ||
| Total | $ | 130,043,871 |
Tax Basis of Distributions to Shareholders: The character of distributions made during the year from net investment income or net realized gains may differ from its ultimate characterization for federal income tax purposes. Also, due to the timing of dividend distributions, the fiscal year in which amounts are distributed may differ from the fiscal year in which the income or realized gain was recorded by the Fund.
The tax character of distributions paid during the year ended April 30, 2021, were as follows:
| Ordinary Income | Long-Term Capital Gain | |||||||
| The Disciplined Growth Investors Fund | $ | 1,466,185 | $ | 25,712,097 | ||||
The tax character of distributions paid during the year ended April 30, 2020, were as follows:
| Ordinary Income | Long-Term Capital Gain | |||||||
| The Disciplined Growth Investors Fund | $ | 2,197,979 | $ | 6,516,352 | ||||
| 28 | 1-855-DGI-FUND (344-3863) | www.DGIfund.com |
| The Disciplined Growth Investors Fund | Notes to Financial Statements |
| April 30, 2021 |
4. SECURITIES TRANSACTIONS
The cost of purchases and proceeds from sales of securities (excluding short-term securities, and U.S. Government Obligations) during the year ended April 30, 2021, were as follows:
| Fund | Purchases of Securities | Proceeds From Sales of Securities | ||||||
| The Disciplined Growth Investors Fund | $ | 66,637,332 | $ | 72,182,582 | ||||
Investment transactions in U.S. Government Obligations during the year ended April 30, 2021 were as follows:
| Fund | Purchases of Securities | Proceeds From Sales of Securities | ||||||
| The Disciplined Growth Investors Fund | $ | 36,776,872 | $ | 12,470,458 | ||||
5. SHARES OF BENEFICIAL INTEREST
The capitalization of the Trust consists of an unlimited number of shares of beneficial interest with no par value per share. Holders of the shares of the Fund of the Trust have one vote for each share held and a proportionate fraction of a vote for each fractional share. All shares issued and outstanding are fully paid and are transferable and redeemable at the option of the shareholder. Purchasers of the shares do not have any obligation to make payments to the Trust or its creditors (other than the purchase price for the shares or make contributions to the Trust or its creditors solely by reason of the purchasers’ ownership of the shares. Shares have no pre-emptive rights.
6. MANAGEMENT AND RELATED-PARTY TRANSACTIONS
The Adviser, subject to the authority of the Board, is responsible for the overall management and administration of the Fund’s business affairs. The Adviser manages the investments of the Fund in accordance with the Fund’s investment objective, policies and limitations and investment guidelines established jointly by the Adviser and the Trustees. Pursuant to the Advisory Agreement, the Fund pays the Adviser a unitary management fee for the services and facilities it provides payable on a monthly basis at the annual rate of 0.78% of the Fund’s average daily net assets. The management fee is paid on a monthly basis.
Out of the unitary management fee, the Adviser pays substantially all expenses of the Fund, including the cost of transfer agency, custody, fund administration, bookkeeping and pricing services, legal, audit and other services, except for interest expenses, brokerage expenses, taxes and extraordinary expenses not incurred in the ordinary course of the Fund’s business. Also included are Trustee fees which were $16,975 for the year ended April 30, 2021.
Fund Administrator Fees and Expenses
ALPS Fund Services, Inc. (“ALPS”) serves as administrator to the Fund. Pursuant to an Administration Agreement, ALPS provides operational services to the Fund including, but not limited to, fund accounting and fund administration and generally assists in the Fund’s operations. Officers of the
| Annual Report | April 30, 2021 | 29 |
| The Disciplined Growth Investors Fund | Notes to Financial Statements |
| April 30, 2021 |
Trust are employees of ALPS. The Fund’s administration fee is accrued on a daily basis and paid monthly. The Administrator is also reimbursed for certain out-of-pocket expenses. The administrative fee and out-of-pocket expenses are included in the unitary management fee paid to the Adviser.
Transfer Agent
ALPS serves as transfer, dividend paying and shareholder servicing agent for the Fund. ALPS receives an annual minimum fee, a fee based upon the number of shareholder accounts, and is also reimbursed for certain out-of-pocket expenses. The fee and out-of-pocket expenses are included in the unitary management fee paid to the Adviser.
Compliance Services
ALPS provides services that assist the Trust’s chief compliance officer in monitoring and testing the policies and procedures of the Trust in conjunction with requirements under Rule 38a-1 under the 1940 Act and receives an annual base fee. ALPS is reimbursed for certain out-of-pocket expenses. The fee and out-of-pocket expenses are included in the unitary management fee paid to the Adviser.
Principal Financial Officer
ALPS receives an annual fee for providing principal financial officer services to the Fund. The fee is included in the unitary management fee paid to the Adviser.
Distributor
ALPS Distributors, Inc. (“ADI” or the “Distributor”) (an affiliate of ALPS) acts as the distributor of the Fund’s shares pursuant to a Distribution Agreement with the Trust. Shares are sold on a continuous basis by ADI as agent for the Fund, and ADI has agreed to use its best efforts to solicit orders for the sale of the Fund’s shares, although it is not obliged to sell any particular amount of shares. ADI is not entitled to any compensation for its services as Distributor. ADI is registered as a broker-dealer with the Securities and Exchange Commission.
7. INDEMNIFICATIONS
Under the Trust’s organizational documents, its officers and Trustees are indemnified against certain liability arising out of the performance of their duties to the Trust. Additionally, in the normal course of business, the Trust enters into contracts with service providers that may contain general indemnification clauses, which may permit indemnification to the extent permissible under applicable law. The Trust’s maximum exposure under these arrangements is unknown, as this would involve future claims that may be made against the Trust that have not yet occurred.
| 30 | 1-855-DGI-FUND (344-3863) | www.DGIfund.com |
| Report of Independent Registered | |
| The Disciplined Growth Investors Fund | Public Accounting Firm |
To the shareholders and the Board of Trustees of Financial Investors Trust
Opinion on the Financial Statements and Financial Highlights
We have audited the accompanying statement of assets and liabilities of The Disciplined Growth Investors Fund (the “Fund”), one of the funds constituting the Financial Investors Trust, including the portfolio of investments, as of April 30, 2021, the related statement of operations for the year then ended, the statements of changes in net assets for each of the two years in the period then ended, the financial highlights for each of the five years in the period then ended, and the related notes. In our opinion, the financial statements and financial highlights present fairly, in all material respects, the financial position of the Disciplined Growth Investors Fund of Financial Investors Trust as of April 30, 2021, and the results of its operations for the year then ended, the changes in its net assets for each of the two years in the period then ended, and the financial highlights for each of the five years in the period then ended, in conformity with accounting principles generally accepted in the United States of America.
Basis for Opinion
These financial statements and financial highlights are the responsibility of the Fund’s management. Our responsibility is to express an opinion on the Fund’s financial statements and financial highlights based on our audits. We are a public accounting firm registered with the Public Company Accounting Oversight Board (United States) (PCAOB) and are required to be independent with respect to the Fund in accordance with the U.S. federal securities laws and the applicable rules and regulations of the Securities and Exchange Commission and the PCAOB.
We conducted our audits in accordance with the standards of the PCAOB. Those standards require that we plan and perform the audit to obtain reasonable assurance about whether the financial statements and financial highlights are free of material misstatement, whether due to error or fraud. The Fund is not required to have, nor were we engaged to perform, an audit of its internal control over financial reporting. As part of our audits we are required to obtain an understanding of internal control over financial reporting but not for the purpose of expressing an opinion on the effectiveness of the Fund’s internal control over financial reporting. Accordingly, we express no such opinion.
Our audits included performing procedures to assess the risks of material misstatement of the financial statements and financial highlights, whether due to error or fraud, and performing procedures that respond to those risks. Such procedures included examining, on a test basis, evidence regarding the amounts and disclosures in the financial statements and financial highlights. Our audits also included evaluating the accounting principles used and significant estimates made by management, as well as evaluating the overall presentation of the financial statements and financial highlights. Our procedures included confirmation of securities owned as of April 30, 2021, by correspondence with the custodian and brokers; when replies were not received from brokers, we performed other auditing procedures. We believe that our audits provide a reasonable basis for our opinion.
DELOITTE & TOUCHE LLP
Denver, Colorado
June 28, 2021
We have served as the auditor of one or more investment companies advised by Disciplined Growth Investors, Inc. since 2012.
| Annual Report | April 30, 2021 | 31 |
| The Disciplined Growth Investors Fund | Additional Information |
| April 30, 2021 (Unaudited) |
1. FUND HOLDINGS
The Fund files its complete schedule of portfolio holdings with the Securities and Exchange Commission (SEC) for the first and third quarters of each fiscal year as an exhibit to its reports on Form N-PORT. The Fund’s Form N-PORT reports are available on the SEC’s Web site at http://www.sec.gov. The Fund’s Form N-PORT reports are also available upon request by calling toll-free (855) 344-3863.
2. FUND PROXY VOTING POLICIES, PROCEDURES AND SUMMARIES
The Fund’s policies and procedures used in determining how to vote proxies and information regarding how the Fund voted proxies relating to portfolio securities during the most recent prior 12-month period ending June 30 are available without charge, (1) upon request, by calling (toll-free) 855-DGI-Fund and (2) on the SEC’s website at http://www.sec.gov.
3. TAX DESIGNATIONS
The Fund designates the following for federal income tax purposes for distributions made during the calendar year ended December 31, 2020:
| Dividend Received Deduction | 70.03% |
| Qualified Dividend Income | 81.09% |
Pursuant to Section 852(b)(3) of the Internal Revenue Code, the Disciplined Growth Investors Fund designated $25,712,097 as long-term capital gain dividends.
In early 2021, if applicable, shareholders of record received this information for the distributions paid to them by the Fund during the calendar year 2020 via Form 1099. The Fund will notify shareholders in early 2022 of amounts paid to them by the Fund, if any, during the calendar year 2021.
| 32 | 1-855-DGI-FUND (344-3863) | www.DGIfund.com |
| The Disciplined Growth Investors Fund | Disclosure Regarding Approval of Fund Advisory Agreements |
| April 30, 2021 (Unaudited) |
On December 8, 2020, the Trustees met via Zoom video conference to discuss, among other things, the renewal of the Investment Advisory Agreement between Disciplined Growth Investors, Inc. (“DGI”) and the Trust, with respect to The Disciplined Growth Investors Fund (the “DGI Fund”), dated February 12, 2018 (the “DGI Investment Advisory Agreement”), in accordance with Section 15(c) of the 1940 Act. In renewing and approving the DGI Investment Advisory Agreement with DGI, the Trustees, including the Independent Trustees, considered the following factors with respect to the DGI Fund:
Investment Advisory Fee Rate: The Trustees reviewed and considered the contractual annual advisory fee paid by the Trust, on behalf of the DGI Fund, to DGI, of 0.78%, in light of the extent and quality of the advisory services provided by DGI to the DGI Fund.
The Board received and considered information including a comparison of the DGI Fund’s contractual advisory fee rate with those of funds in the peer group of funds provided by an independent provider of investment company data (the “Data Provider”). The Trustees noted that the contractual advisory fee rate of the DGI Fund was higher than the Data Provider peer group median at least in part attributable to the unitary fee arrangement with DGI.
Total Net Expense Ratios: The Trustees further reviewed and considered that the total net expense ratio of the DGI Fund was lower than the Data Provider peer group median, and that because of the unitary fee, the comparison with the peer group at the level of the total net expense ratio yielded more useful comparative data than the level of the investment advisory rate.
Nature, Extent, and Quality of the Services under the Investment Advisory Agreement: The Trustees received and considered information regarding the nature, extent, and quality of services provided to the DGI Fund under the DGI Investment Advisory Agreement. The Trustees reviewed certain background materials supplied by DGI in its presentation, including its Form ADV.
The Trustees reviewed and considered DGI’s investment advisory personnel, its history as an asset manager, and its performance and the amount of assets currently under management by DGI. The Trustees also reviewed the research and decision-making processes utilized by DGI, including the methods adopted to seek to achieve compliance with the investment objectives, policies, and restrictions of the DGI Fund.
The Trustees considered the background and experience of DGI’s management in connection with the DGI Fund, including reviewing the qualifications, backgrounds, and responsibilities of the management team primarily responsible for the day-to-day portfolio management of the Fund and the extent of the resources devoted to research and analysis of actual and potential investments.
The Trustees also reviewed, among other things, DGI’s insider trading policies and procedures and its Code of Ethics.
Performance: The Trustees reviewed performance information of the DGI Fund for the 3-month, 1-year, 3-year, 5-year, and since inception periods, as applicable, ended September 30, 2020. That review included a comparison of the DGI Fund’s performance to the performance of a group of comparable funds selected by the Data Provider. The Trustees noted that the DGI Fund outperformed
| Annual Report | April 30, 2021 | 33 |
| The Disciplined Growth Investors Fund | Disclosure Regarding Approval of Fund Advisory Agreements |
| April 30, 2021 (Unaudited) |
its peer group for the 1-year, 3-year, 5-year, and since inception periods, and underperformed its peer group for the 3-month period.
The Trustees also considered DGI’s discussion of its reputation generally and its investment techniques, risk management controls, and decision-making processes.
Comparable Accounts: The Trustees noted certain information provided by DGI regarding fees charged to its other clients utilizing a strategy similar to that employed by the DGI Fund.
Profitability: The Trustees received and considered a profitability analysis prepared by DGI based on the fees payable under the DGI Investment Advisory Agreement.
Economies of Scale: The Trustees considered whether economies of scale in the provision of services to the DGI Fund would be passed along to shareholders.
Other Benefits to the Adviser: The Trustees reviewed and considered any other incidental benefits derived or to be derived by DGI from its relationship with the DGI Fund, including whether soft dollar arrangements were used.
The Trustees, including all of the Independent Trustees, concluded that:
| ● | the contractual advisory fee rate of the DGI Fund was higher than the Data Provider peer group median at least in part attributable to the unitary fee arrangement with DGI; |
| ● | the total net expense ratio of the DGI Fund was lower than the Data Provider peer group median, and that because of the unitary fee, the comparison with the peer group at the level of the total net expense ratio yielded more useful comparative data than the level of the investment advisory fee rate; |
| ● | the nature, extent, and quality of services rendered by DGI under the DGI Investment Advisory Agreement were adequate; |
| ● | for the period ended September 30, 2020, the DGI Fund outperformed its Data Provider peer group for the 1-year, 3-year, 5-year, and since inception periods, and underperformed its peer group for the 3-month period; |
| ● | bearing in mind the limitations of comparing different types of managed accounts and the different levels of service typically associated with such accounts, the fee structures applicable to DGI’s other clients employing a comparable strategy to the DGI Fund were not indicative of any unreasonableness with respect to the advisory fee payable to DGI by the DGI Fund; |
| ● | the profit, if any, realized by DGI in connection with the operation of the DGI Fund is not unreasonable; and |
| ● | there were no material economies of scale or other incidental benefits accruing to DGI in connection with its relationship with the DGI Fund. |
Based on the Trustees’ deliberations and their evaluation of the information described above, the Trustees, including all of the Independent Trustees, concluded that DGI’s compensation for investment advisory services is consistent with the best interests of the DGI Fund and its shareholders.
| 34 | 1-855-DGI-FUND (344-3863) | www.DGIfund.com |
| Liquidity Risk | |
| The Disciplined Growth Investors Fund | Management Program |
| April 30, 2021 (Unaudited) |
The Financial Investors Trust (the “Trust”) has established a liquidity risk management program (the “Program”) to govern the Trust’s approach to managing liquidity risk for each fund in the Trust (each a “Fund”). The Program is overseen by the Liquidity Committee (the “Committee”), a committee comprised of representatives of the Trust’s investment advisers, sub-advisers, and Officers of the Trust. The Trust’s Board of Trustees (the “Board”) has approved the designation of the Committee to oversee the Program.
The Program’s principal objectives include supporting each Fund’s compliance with limits on investments in illiquid assets and mitigating the risk that a Fund will be unable to meet its redemption obligations in a timely manner. The Program also includes a number of elements that support the management and assessment of liquidity risk, including a periodic assessment of factors that influence a Fund’s liquidity and the periodic classification and re-classification of the Fund’s investments into groupings that reflect the Committee’s assessment of their relative liquidity under current market conditions.
At a meeting of the Board held on March 10, 2021, the Trustees received a report from the Committee regarding the design and operational effectiveness of the Program during 2020. The Committee determined, and reported to the Board, that the Program is reasonably designed to assess and manage each Fund’s liquidity risk and has operated adequately and effectively to manage each Fund’s liquidity risk since implementation.
The Committee reported that during the period covered by the report, there were no liquidity events that impacted the Funds or their ability to timely meet redemptions without dilution to existing shareholders. Among other things, the Board noted that the Funds are not required to have a highly liquid investment minimum based on their liquidity classifications. The Board further noted that no material changes have been made to the Program since its implementation.
| Annual Report | April 30, 2021 | 35 |
| The Disciplined Growth Investors Fund | Trustees and Officers |
| April 30, 2021 (Unaudited) |
Additional information regarding the Fund’s trustees is included in the Statement of Additional Information, which can be obtained without charge by calling 855-344-3863.
INDEPENDENT TRUSTEES
| Name, Address* & Year of Birth | Position(s) Held with Fund | Term of Office** and Length of Time Served | Principal Occupation(s) During Past 5 Years*** | Number of Funds in Fund Complex Overseen by Trustee**** | Other Directorships Held by Trustee During Past 5 Years*** |
Mary K. Anstine, 1940 | Trustee and Chairman | Ms. Anstine was elected at a special meeting of shareholders held on March 21, 1997 and re-elected at a special meeting of shareholders held on August 7, 2009. Ms. Anstine was appointed Chairman of the Board at the June 6, 2017 meeting of the Board of Trustees. | Ms. Anstine is Trustee/Director of AV Hunter Trust and Colorado Uplift Board. | 31 | Ms. Anstine is a Trustee of ALPS ETF Trust (17 funds); ALPS Variable Investment Trust (7 funds); Reaves Utility Income Fund (1 fund); and Segall Bryant & Hamill Trust through December 2020 (14 funds as of December 2020). |
| Jeremy W. Deems, 1976 | Trustee | Mr. Deems was appointed as a Trustee at the March 11, 2008 meeting of the Board of Trustees and elected at a special meeting of shareholders held on August 7, 2009. | Mr. Deems is the Co-Founder and Chief Financial Officer of Green Alpha Advisors, LLC, a registered investment advisor, and Co-Portfolio Manager of the Shelton Green Alpha Fund. | 31 | Mr. Deems is a Trustee of ALPS ETF Trust (17 funds); ALPS Variable Investment Trust (7 funds); Clough Funds Trust (1 fund); and Reaves Utility Income Fund (1 fund). |
| Jerry G. Rutledge, 1944 | Trustee | Mr. Rutledge was elected at a special meeting of shareholders held on August 7, 2009. | Mr. Rutledge is the President and owner of Rutledge’s Inc., a retail clothing business. | 31 | Mr. Rutledge is a Trustee of Clough Global Dividend and Income Fund (1 fund); Clough Global Equity Fund (1 fund); Clough Global Opportunities Fund (1 fund); and Principal Real Estate Income Fund (1 fund). |
| 36 | 1-855-DGI-FUND (344-3863) | www.DGIfund.com |
| The Disciplined Growth Investors Fund | Trustees and Officers |
| April 30, 2021 (Unaudited) |
INDEPENDENT TRUSTEES (continued)
| Name, Address* & Year of Birth | Position(s) Held with Fund | Term of Office** and Length of Time Served | Principal Occupation(s) During Past 5 Years*** | Number of Funds in Fund Complex Overseen by Trustee**** | Other Directorships Held by Trustee During Past 5 Years*** |
| Michael “Ross” Shell, 1970 | Trustee | Mr. Shell was elected at a special meeting of shareholders held on August 7, 2009. | Mr. Shell is Founder and CEO of Red Idea, LLC, a strategic consulting/early stage venture firm (since June 2008). Mr. Shell serves on the Board of Directors of TalkBox, a phone/privacy booth company (since 2018) and DLVR, a package security company (since 2018). Mr. Shell served on the Advisory Board, St. Vrain School District Innovation Center (from 2015-2018). Mr. Shell graduated with honors from Stanford University with a degree in Political Science. | 31 | None. |
| Annual Report | April 30, 2021 | 37 |
| The Disciplined Growth Investors Fund | Trustees and Officers |
April 30, 2021 (Unaudited)
INTERESTED TRUSTEE
| Name, Address* & Year of Birth | Position(s) Held with Fund | Term of Office** and Length of Time Served | Principal Occupation(s) During Past 5 Years*** | Number of Funds in Fund Complex Overseen by Trustee**** | Other Directorships Held by Trustee During Past 5 Years*** |
Edmund J. Burke, 1961
| Trustee | Mr. Burke was elected as Trustee at a special meeting of shareholders held on August 7, 2009. | Mr. Burke joined ALPS in 1991 and served as the President and Director of ALPS Holdings, Inc., and ALPS Advisors, Inc., and Director of ALPS Distributors, Inc., ALPS Fund Services, Inc. (“ALPS”), and ALPS Portfolio Solutions Distributor, Inc. (collectively, the “ALPS Companies”). Mr. Burke retired from the ALPS Companies in June 2019. Mr. Burke is currently a partner at ETF Action, a web-based system that provides data and analytics to registered investment advisers, (since 2020) and a Director of Alliance Bioenergy Plus, Inc., a technology company focused on emerging technologies in the renewable energy, biofuels, and bioplastics technology sectors (since 2020). Mr. Burke is deemed an interested Trustee by virtue of his prior positions with the ALPS Companies. | 31 | Mr. Burke is a Trustee of ALPS ETF Trust (17 funds); Clough Global Dividend and Income Fund (1 fund); Clough Global Equity Fund (1 fund); Clough Global Opportunities Fund (1 fund); Clough Funds Trust (1 fund); Liberty All-Star Equity Fund (1 fund); and Director of the Liberty All-Star Growth Fund, Inc. (1 fund). |
| 38 | 1-855-DGI-FUND (344-3863) | www.DGIfund.com |
| The Disciplined Growth Investors Fund | Trustees and Officers |
April 30, 2021 (Unaudited)
OFFICERS
| Name, Address* & Year of Birth | Position(s) Held with Fund | Term of Office** and Length of Time Served | Principal Occupation(s) During Past 5 Years*** |
Bradley J. Swenson, 1972***** | President | Mr. Swenson was appointed President of the Trust at the June 11, 2019 meeting of the Board of Trustees. | Mr. Swenson joined ALPS in 2004 and has served as its President since June 2019. In this role, he serves as an officer to certain other closed-end and open-end investment companies. He previously served as the Chief Operating Officer of ALPS (2015-2019). Mr. Swenson also previously served as Chief Compliance Officer to ALPS, its affiliated entities, and to certain ETF, closed-end and open- end investment companies (2004-2015). Because of his position with ALPS, Mr. Swenson is deemed an affiliate of the Trust as defined under the 1940 Act. |
Dawn Cotten, 1977 | President | Ms. Cotten was appointed President of the Trust at the June 8-9, 2021 meeting of the Trustees. | Ms. Cotten joined ALPS in 2009 and is currently Senior Vice President of Fund Administration and Relationship Management of ALPS. She has served in that role since January 2020. Prior to that, Ms. Cotten served as Senior Vice President of Relationship Management (2017-2020). Ms. Cotten served as a VP in Relationship Management from 2013-2017. Ms. Cotten also serves as President of ALPS Series Trust, Clough Funds Trust, Clough Global Dividend and Income Fund, and Clough Global Equity Fund and Clough Global Opportunities Fund. |
Jennell Panella, 1974 | Treasurer | Ms. Panella was appointed Treasurer of the Trust at the September 15, 2020 meeting of the Board of Trustees | Ms. Panella joined ALPS in June 2012 and is currently Vice President and Fund Controller of ALPS Fund Services, Inc. Prior to joining ALPS, Ms. Panella served as Financial Reporting Manager for Parker Global Strategies, LLC (2009-2012). Because of her position with ALPS, Ms. Panella is deemed an affiliate of the Trust as defined under the 1940 Act. |
Karen S. Gilomen, 1970***** | Secretary | Ms. Gilomen was appointed Secretary of the Trust at the December 13, 2016 meeting of the Board of Trustees. | Ms. Gilomen joined ALPS in August 2016 as Vice President and Senior Counsel. Prior to joining ALPS, Ms. Gilomen was Vice President - General Counsel & CCO of Monticello Associates, Inc. from 2010 to 2016. Because of her position with ALPS, Ms. Gilomen is deemed an affiliate of the Trust, as defined under the 1940 Act. Ms. Gilomen is also the Secretary of ALPS Variable Investment Trust and Reaves Utility Income Fund, and the Assistant Secretary of the WesMark Funds. |
Cara Owen, 1981 | Secretary | Ms. Owen was appointed Secretary of the Trust at the June 8-9, 2021 meeting of the Board of Trustees. | Vice President and Principal Legal Counsel, ALPS Fund Services, Inc. Prior to joining ALPS, Ms. Owen was Senior Counsel, Corporate & Investments, Great-West Life & Annuity Insurance Company; Senior Counsel & Assistant Secretary, Great-West Funds, Inc., Great-West Capital Management, LLC, Great-West Trust Company, LLC, and Advised Assets Group, LLC (2014-2019). Ms. Owen also serves as Secretary of ALPS ETF Trust, Vice President and Secretary of Boulder Growth & Income Fund, and Assistant Secretary of James Advantage Funds. |
| Annual Report | April 30, 2021 | 39 |
| The Disciplined Growth Investors Fund | Trustees and Officers |
April 30, 2021 (Unaudited)
OFFICERS (continued)
| Name, Address* & Year of Birth | Position(s) Held with Fund | Term of Office** and Length of Time Served | Principal Occupation(s) During Past 5 Years*** |
Ted Uhl, 1974 | Chief Compliance Officer (“CCO”) | Mr. Uhl was appointed CCO of the Trust at the June 8, 2010 meeting of the Board of Trustees. | Mr. Uhl joined ALPS in October 2006, and is currently Deputy Compliance Officer of ALPS. Prior to his current role, Mr. Uhl served as Senior Risk Manager for ALPS from October 2006 until June 2010. Before joining ALPS, Mr. Uhl served a Sr. Analyst with Enenbach and Associates (RIA), and a Sr. Financial Analyst at Sprint. Because of his position with ALPS, Mr. Uhl is deemed an affiliate of the Trust as defined under the 1940 Act. Mr. Uhl is also CCO of the Boulder Growth & Income Fund, Inc., Centre Funds, Index Funds, Reality Shares ETF Trust, Reaves Utility Income Fund and XAI Octagon Floating Rate & Alternative Income Term Trust. |
Jennifer Craig, 1973 | Assistant Secretary | Ms. Craig was appointed Assistant Secretary of the Trust at the June 8, 2016 meeting of the Board of Trustees. | Ms. Craig joined ALPS in 2007 and is currently Assistant Vice President and Paralegal Manager of ALPS. Because of her position with ALPS, Ms. Craig is deemed an affiliate of the Trust as defined under the 1940 Act. Ms. Craig is also Secretary of Principal Real Estate Income Fund, Assistant Secretary of ALPS ETF Trust, Clough Global Dividend and Income Fund, Clough Global Equity Fund, Clough Global Opportunities Fund, Liberty All-Star Equity Fund and Liberty All-Star Growth Fund, Inc. and Clerk of Goehring & Rozencwajg Investment Funds. |
| * | All communications to Trustees and Officers may be directed to Financial Investors Trust c/o 1290 Broadway, Suite 1000, Denver, CO 80203. |
| ** | This is the period for which the Trustee or Officer began serving the Trust. Each Trustee serves an indefinite term, until such Trustees successor is elected and appointed, or such Trustee resigns or is deceased. Officers are elected on an annual basis. |
| *** | Except as otherwise indicated, each individual has held the office shown or other offices in the same company for the last five years. |
| **** | The Fund Complex includes all series of the Trust, currently 31, and any other investment companies for which any Trustee serves as trustee for and for which Disciplined Growth Investors, Inc. provides investment advisory services (currently none). |
| ***** | Mr. Swenson resigned his position as President of the Trust effective June 9, 2021 and effective June 4, 2021, Karen Gilomen resigned her position as Secretary of the Trust. |
| 40 | 1-855-DGI-FUND (344-3863) | www.DGIfund.com |
| The Disciplined Growth Investors Fund | Privacy Policy |
| WHO WE ARE | |
| Who is providing this notice? | The Disciplined Growth Investors Fund |
| WHAT WE DO | |
| How does the Fund protect my personal information? | To protect your personal information from unauthorized access and use, we use security measures that comply with federal law. These measures include computer safeguards and secured files and buildings. |
| How does the Fund collect my personal information? | We collect your personal information, for example, when you
• open an account • provide account information or give us your contact information • make a wire transfer or deposit money |
| Why can’t I limit all sharing? | Federal law gives you the right to limit only
• sharing for affiliates’ everyday business purposes-information about your creditworthiness • affiliates from using your information to market to you • sharing for non-affiliates to market to you
State laws and individual companies may give you additional rights to limit sharing. |
| DEFINITIONS | |
| Affiliates | Companies related by common ownership or control. They can be financial and nonfinancial companies. |
| Non-affiliates | Companies not related by common ownership or control. They can be financial and nonfinancial companies.
• The Fund does not share with non-affiliates so they can market to you. |
| Joint marketing | A formal agreement between non-affiliated financial companies that together market financial products or services to you.
• The Fund does not jointly market. |
| Annual Report | April 30, 2021 | 41 |
| The Disciplined Growth Investors Fund | Privacy Policy |
| FACTS | WHAT DOES THE FUND DO WITH YOUR PERSONAL INFORMATION? | ||
| WHY? | Financial companies choose how they share your personal information. Federal law gives consumers the right to limit some but not all sharing. Federal law also requires us to tell you how we collect, share, and protect your personal information. Please read this notice carefully to understand what we do. | ||
| WHAT? | The types of personal information we collect and share depend on the product or service you have with us. This information can include:
• Social Security number and account transactions • Account balances and transaction history • Wire transfer instructions | ||
| HOW? | All financial companies need to share customers’ personal information to run their everyday business. In the section below, we list the reasons financial companies can share their customers’ personal information; the reasons the Fund chooses to share; and whether you can limit this sharing. | ||
| REASONS WE CAN SHARE YOUR PERSONAL INFORMATION | DOES THE FUND SHARE: | CAN YOU LIMIT THIS SHARING? | |
| For our everyday business purposes – such as to process your transactions, maintain your account(s), respond to court orders and legal investigations, or report to credit bureaus | Yes | No | |
For our marketing purposes – to offer our products and services to you | No | We do not share. | |
| For joint marketing with other financial companies | No | We do not share. | |
For our affiliates’ everyday business purposes – information about your transactions and experiences | Yes | No | |
For our affiliates’ everyday business purposes – information about your creditworthiness | No | We do not share. | |
| For non-affiliates to market to you | No | We do not share. | |
| 42 | 1-855-DGI-FUND (344-3863) | www.DGIfund.com |
| The Disciplined Growth Investors Fund | Privacy Policy |
| OTHER IMPORTANT INFORMATION | |
| California Residents | If your account has a California home address, your personal information will not be disclosed to nonaffiliated third parties except as permitted by applicable California law, and we will limit sharing such personal information with our affiliates to comply with California privacy laws that apply to us. |
| Vermont Residents | The State of Vermont requires financial institutions to obtain your consent prior to sharing personal information that they collect about you with affiliated companies and nonaffiliated third parties other than in certain limited circumstances. Except as permitted by law, we will not share personal information we collect about you with nonaffiliated third parties or other affiliated companies unless you provide us with your written consent to share such information. |
| Annual Report | April 30, 2021 | 43 |

THIS MATERIAL MUST BE PRECEDED OR ACCOMPANIED BY A PROSPECTUS.
THE DISCIPLINED GROWTH INVESTORS FUND IS DISTRIBUTED BY ALPS DISTRIBUTORS, INC.

TABLE OF CONTENTS
| Manager Commentary | |
| Emerald Growth Fund | 1 |
| Emerald Insights Fund | 6 |
| Emerald Banking and Finance Fund | 10 |
| Disclosure of Fund Expenses | 17 |
| Schedule of Investments | |
| Emerald Growth Fund | 19 |
| Emerald Insights Fund | 21 |
| Emerald Banking and Finance Fund | 23 |
| Statements of Assets and Liabilities | 25 |
| Statements of Operations | 26 |
| Statements of Changes in Net Assets | |
| Emerald Growth Fund | 27 |
| Emerald Insights Fund | 29 |
| Emerald Banking and Finance Fund | 31 |
| Financial Highlights | |
| Emerald Growth Fund | 32 |
| Emerald Insights Fund | 36 |
| Emerald Banking and Finance Fund | 40 |
| Notes to Financial Statements | 44 |
| Report of Independent Registered Public Accounting Firm | 51 |
| Additional Information | 52 |
| Disclosure Regarding Approval of Fund Advisory Agreement | 53 |
| Liquidity Risk Management Program | 55 |
| Trustees and Officers | 56 |
| Privacy Policy | 60 |
| Emerald Growth Fund | Manager Commentary |
April 30, 2021 (Unaudited)
April 30, 2021
Dear Shareholder:
Investment Results
The performance of the Emerald Growth Fund’s Class A shares (without sales load), for the twelve months ended April 30, 2021, advanced by 70.77% outpacing its benchmark, the Russell 2000 Growth Index which gained 69.15%.
The events of the last 12 months have been nothing less than extraordinary, as society and the market navigated the COVID-19 pandemic. While the headwinds were extraordinary, so was the response. The implementation of an unprecedented level of fiscal and monetary stimulus and the historic mobilization of research and development resources to develop and bring to market a COVID vaccine in record setting time have coalesced to catalyze what we believe will likely prove to be the fastest and most aggressive economic/market recovery in modern times.
Positive upward revisions to both economic and earnings growth drove strong gains across all of the broad market equity indices for the trailing period. Small capitalization stocks led the rally with Russell 2000 gaining 74.91% and far outpacing the Russell 1000 which gained 49.48% for the period.
From a style perspective, while growth stocks led the market through September of 2020, the strengthening economic backdrop and rising interest rates drove a rotation into value, with cyclicals surging and long duration secular growth equities lagging. These factors resulted in a meaningful bifurcation in performance amongst the style indices, with the Russell 2000 Value advancing 78.96%, while the Russell 2000 Growth gained 69.15% for the trailing period.
These shifting preferences for growth had a meaningful impact on sector leadership within the Russell 2000 Growth benchmark, with the Energy (347.46), Consumer Discretionary (127.06%) and Basic Materials (84.60%) sectors posting the strongest absolute returns.
Investment Analysis
On a relative basis the Fund outpaced the Russell 2000 Growth benchmark for the trailing period driven by a combination of stock selection and allocation effect. At the sector level, the Fund experienced relative outperformance within the consumer staples, consumer discretionary, financials and industrials sectors. The positive contribution from the aforementioned, was offset by relative underperformance within the healthcare, real estate and basic materials sectors.
The consumer staples sector was the largest relative contributor to return driven by stock selection within the food products and beverage industries. Holdings within the consumer discretionary sector also contributed positively to return driven by relative outperformance within the education services, home building, recreational services and specialty retail industries. Also contributing to the Fund's relative outperformance were holdings within the financial and industrial sectors. At the industry level, the most notable contributors to return included: banks, insurance, investment services, machinery, and building materials.
Partially offsetting the aforementioned weakness, was relative underperformance within healthcare, real estate and basic materials sectors. The healthcare sector was the largest detractor to return for trailing twelve month period driven by stock selection within the biotechnology and health care services industries.
As of April 30, 2021, the Fund's held the largest active exposures in the financial services, consumer discretionary, technology, industrial, and consumer staples sectors. Thoughts on those sectors and other notable areas of exposure are highlighted below.
| · | The financial services sector, comprised of holdings within the bank, full line insurance, investment services, property and casualty insurance and life industries, was the portfolio’s largest relative overweight position at period-end. Emerald has been adding to the Fund's exposure to holdings within the banking industry as we anticipate the steepening of the yield curve and a better credit backdrop with the aid of stimulus should be beneficial to earnings growth. In addition, Emerald has placed specific emphasis on those banks that are positioned to drive a meaningful improvement in their efficiency ratios. |
| · | Emerald also held an overweight position within the consumer discretionary sector at period-end. The overweight is comprised of a diverse subset of holdings within the educational services, specialty retail, recreational services, recreational products, restaurants, casinos and gambling, and auto parts industries among others. With the economy poised for a full reopening upon the successful distribution and uptake of COVID-19 vaccines, we believe the outlook for consumer spending in 2021 remains particularly attractive and believe there remains meaningful opportunity for share gains for those companies offering differentiated products/services with strong value propositions amidst a consolidating retail, restaurant and leisure backdrop. |
| Annual Report | April 30, 2021 | 1 |
| Emerald Growth Fund | Manager Commentary |
April 30, 2021 (Unaudited)
| · | As of April 30, 2021, the Fund's portfolio had an overweight position to the technology sector. Within the sector, the computer software industry remains the portfolio’s largest total and active exposure. Emerald continues to believe that secular themes such as digital transformation and cybersecurity will remain spending priorities. Outside of software, we also continue to be optimistic regarding select opportunities within the semiconductor industry in those companies poised to benefit from the rebound in industrial and automotive production, and the growing penetration of 5G and industrial IoT (internet of things) applications. In addition, Emerald has become increasingly optimistic regarding the outlook for the semiconductor capital equipment industry which we believe will benefit from a broad acceleration in capacity investment, given the high-profile supply shortages and the shift toward advanced packaging, as well as on a long-term basis Intel’s decision to re-focus its efforts on advanced node technology, which we believe should lead to increasing capital intensity for the next several years. |
| · | As of April 30, 2021, the Fund's portfolio had an overweight position to the industrial sector. The overweight was comprised of a diverse subset of holdings with the building materials, professional business support services, defense, industrial machinery, engineering and contracting services, freight transportation and transaction processing services industries, among others that Emerald believes are poised to benefit from a combination of the cyclical recovery in the economy and company specific business initiatives that we believe will collectively translate to industry leading growth in revenue and earnings. |
| · | As of April 30, 2021, the Fund's portfolio exited the period with an overweight position to the consumer staples sector. As of the same date, the overweight primarily consists of select niche opportunities in disruptive category leaders with innovative product offerings and above average growth prospects that are aligned with emerging consumer trends in the food and beverage industries. Specific areas include pet food, nutritional snacking, and active nutrition. |
| · | As of April 30, 2021, the healthcare sector, while underweight relative to the benchmark, also remains an area of considerable exposure within the portfolio. At the industry level, the biotechnology industry remains an area of considerable nominal exposure. We continue to look for innovative therapeutics that can command premium pricing, driven by their unequivocal clinical data. Rounding out the portfolio’s healthcare sector exposure are niche opportunities within the pharmaceutical, medical equipment, medical services, health care services and medical supplies industries. There were 14 new drugs approved during the second quarter of 2021. As of April 30, 2021, on average the FDA has approved 13 drugs per quarter dating back to 2017. |
Market Outlook:
2021 is shaping up to be one the strongest years for domestic economic growth in recent history. The ISM (Institute for Supply Management) services survey for the month of March surged to a historic high, with new orders and business activity both demonstrating an acceleration. The ISM manufacturing survey was similarly strong, hitting the highest level for that survey since 2010. The March Nonfarm Payroll report also surprised to the upside with 916,000 jobs added. Consumer confidence is building and as states further ease their COVID related restrictions we believe the unemployment rate will continue to decline, confidence will rise and spending should accelerate as excess savings currently residing in saving accounts gets redeployed into services and goods. We are similarly optimistic regarding the trajectory of business investment which we anticipate will accelerate as 2021 progresses. Given the aforementioned, Emerald believes that 2021 GDP growth estimates are biased to the upside from the current 6.4% Factset Consensus and expect economic growth will continue to gain momentum as the economy reopens.
A strong domestic economic backdrop, in our view, is particularly favorable for the trajectory of small capitalization earnings growth. As of early April, Russell 2000 earnings growth ex-energy was estimated to grow by more than 17.8% over the 2019 earnings level, representing a more than 500 bps delta to its large capitalization counterpart, according to an April report from Steve DeSanctis of Jeffries. As of April 30, 2021, valuations of small caps also remain supportive, as the Russell 2000 continues to trade at a discount to the Russell 1000.
Although we remain enthusiastic regarding the prospect for upward revisions to economic growth, the prospect for a near-term inflation overshoot remains plausible as the economy reopens. Consumer confidence surveys are flashing warning signs with concerns rising regarding the prospect for price inflation and while Chairman Powell and the Federal Reserve continue to reiterate the committee’s unified commitment to the lower for longer rates strategy, any meaningful uptick in inflation will likely fuel concerns of a Federal Reserve policy misstep. We believe the interplay between yields and inflation is likely to remain a source of equity market volatility as these dynamics continue to unfold. Additionally, while we do not yet know how strong 2021 domestic growth will ultimately be, the market has already baked above trend growth into expectations given the current consensus for 2021 domestic GDP growth standing at 6.4%. As we move through the balance of the year however, we believe the market will begin to focus on the outlook for 2022 and the sustainability of above trend GDP growth. In our opinion, key considerations include the direction of Federal Reserve Policy, extreme deficit spending, the ultimate structure of the Biden administration’s tax proposal and to a lesser degree foreign policy initiatives, specifically as it relates to China and Iran, and the amount of new primary and secondary stock sales including IPO’s and SPAC’s.
| 2 | www.emeraldmutualfunds.com |
| Emerald Growth Fund | Manager Commentary |
April 30, 2021 (Unaudited)
Emerald, as always, remains vigilant and focused on utilizing our fundamental bottom up research process to seek to identify the most attractive growth opportunities within the small capitalization universe.
| Top Contributors | Top Detractors | |
| Chegg Inc. | Karyopharm Therapeutics Inc. | |
| Freshpet Inc. | Tabula Rasa Healthcare Inc. | |
| Horizon Therapeutics | Applied Therapeutics Inc. | |
| Chart Industries Inc. | Mercury Systems Inc. | |
| Varonis Systems Inc. | Haemonetics Corporation | |
| Kenneth G. Mertz II, CFA | Stacey L. Sears | Joseph W. Garner |
| Chief Investment Officer | Portfolio Manager | Portfolio Manager |
| Portfolio Manager |
Emerald Mutual Fund Advisers Trust
Past performance does not guarantee future results. Fund prices fluctuate as the underlying assets have exposure to market fluctuations and other risks, as described in the Fund’s prospectus. Please visit www.emeraldmutualfunds.com to obtain current performance information and for the current prospectus and statement of additional information. This material must be preceded or accompanied by a prospectus. Please read the prospectus carefully before investing.
The views of Emerald Mutual Fund Advisers Trust and information discussed in this commentary are as of the date of publication, are subject to change, and may not reflect the writer's current views. The views expressed are those of the author only, and represent an assessment of market conditions at a specific point in time, are opinions only and should not be relied upon as investment advice regarding a particular investment or markets in general. Such information does not constitute a recommendation to buy or sell specific securities or investment vehicles. It should not be assumed that any investment will be profitable or will equal the performance of the Fund or any securities or any sectors mentioned in this letter. The subject matter contained in this letter has been derived from several sources believed to be reliable and accurate at the time of compilation. Neither Emerald Mutual Fund Advisers Trust nor the Fund accepts any liability for losses either direct or consequential caused by the use of this information.
The Emerald Growth Fund is distributed by ALPS Distributors, Inc.
The Fund is subject to investment risks, including possible loss of the principal amount invested and therefore is not suitable for all investors. The Fund may not achieve its objectives.
Diversification does not eliminate the risk of experiencing investment losses.
The Russell 2000® Growth Index measures the performance of the small-cap growth segment of the U.S. equity universe. It includes those Russell 2000® Index companies with higher price-to-value ratios and higher forecasted growth values. The Index is not actively managed and does not reflect any deductions for fees, expenses or taxes. An investor may not invest directly into the Index.
The Russell 2000® Value Index measures the performance of small-cap value segment of the U.S. equity universe. It includes those Russell 2000 companies with lower price-to-book ratios (A ratio used to compare a stock's market value to its book value. It is calculated by dividing the current closing price of the stock by the latest quarter's book value per share.) and lower forecasted growth values. The Index is not actively managed and does not reflect any deductions for fees, expenses or taxes. An investor may not invest directly into the Index.
Basis points refers to a common unit of measure for interest rates and other percentages in finance. One basis point is equal to 1/100th of 1%, or 0.01%, or 0.0001, and is used to denote the percentage change in a financial instrument. The relationship between percentage changes and basis points can be summarized as follows: 1% change = 100 basis points and 0.01% = 1 basis point.
The S&P 500® Total Return Index is an unmanaged index of 500 common stocks chosen for market size, liquidity and industry group representation. It is a market-value weighted index. The Index is not actively managed and does not reflect any deductions for fees, expenses or taxes. An investor may not invest directly in the Index.
| Annual Report | April 30, 2021 | 3 |
| Emerald Growth Fund | Manager Commentary |
April 30, 2021 (Unaudited)
| TOP TEN HOLDINGS | ||
| (as a % of Net Assets)* | ||
| Freshpet, Inc. | 2.70% | |
| Chart Industries, Inc. | 2.13% | |
| MACOM Technology Solutions Holdings, Inc. | 1.87% | |
| Rapid7, Inc. | 1.85% | |
| Varonis Systems, Inc. | 1.81% | |
| NeoGenomics, Inc. | 1.69% | |
| Chegg, Inc. | 1.65% | |
| Churchill Downs, Inc. | 1.65% | |
| Jack in the Box, Inc. | 1.56% | |
| Pacific Premier Bancorp, Inc. | 1.55% | |
| Top Ten Holdings | 18.46% | |
| INDUSTRY SECTOR ALLOCATION | ||
| (as a % of Net Assets) | ||
| Health Care | 22.06% | |
| Technology | 19.89% | |
| Consumer Discretionary | 18.92% | |
| Industrials | 16.64% | |
| Financial Services | 12.34% | |
| Consumer Staples | 5.21% | |
| Telecommunications | 1.65% | |
| Basic Materials | 1.40% | |
| Real Estate | 0.70% | |
| Energy | 0.27% | |
| Cash, Cash Equivalents, & Other Net Assets | 0.92% | |
| Total | 100.00% | |
| * | Holdings are subject to change, and may not reflect the current or future position of the portfolio. |
ANNUALIZED TOTAL RETURN (for the period ended April 30, 2021)
| 6 Month | 1 Year | 3 Year | 5 Year | 10 Year | Since Inception(1) | Expense Gross(2) | Ratio Net(2) | |
| Class A (NAV) | 33.95% | 70.77% | 19.77% | 20.58% | 14.21% | 12.24% | 1.02% | 1.02% |
| Class A (LOAD) | 27.57% | 62.66% | 17.84% | 19.41% | 13.65% | 12.05% | 1.02% | 1.02% |
| Russell 2000® Growth Index(3) | 37.84% | 69.15% | 17.97% | 18.89% | 12.86% | 9.44% | ||
| Class C (NAV) | 33.50% | 69.60% | 18.99% | 19.81% | 13.47% | 8.14% | 1.67% | 1.67% |
| Class C (LOAD) | 32.50% | 68.60% | 18.99% | 19.81% | 13.47% | 8.14% | 1.67% | 1.67% |
| Russell 2000® Growth Index(3) | 37.84% | 69.15% | 17.97% | 18.89% | 12.86% | 9.44% | ||
| Investor Class | 33.93% | 70.71% | 19.74% | 20.54% | – | 14.33% | 1.07% | 1.07% |
| Russell 2000® Growth Index(3) | 37.84% | 69.15% | 17.97% | 18.89% | 12.86% | 9.44% | ||
| Institutional Class | 34.15% | 71.27% | 20.15% | 20.95% | 14.56% | 16.79% | 0.72% | 0.72% |
| Russell 2000® Growth Index(3) | 37.84% | 69.15% | 17.97% | 18.89% | 12.86% | 9.44% |
Performance quoted represents past performance, does not guarantee future results and current performance may be lower or higher than the data quoted. The investment return and principal value of an investment will fluctuate so that shares, when redeemed, may be worth more or less than their original cost. Performance data current to the most recent month end may be obtained at www.emeraldmutualfunds.com.
Performance shown for periods prior to March 16, 2012, reflects the performance of the Forward Growth Fund, a series of Forward Funds (as a result of a reorganization of the Forward Growth Fund into the Emerald Growth Fund).
Returns for periods less than 1 year are cumulative.
The table does not reflect the deduction of taxes that a shareholder would pay on Fund distributions or the redemption of Fund shares.
Subject to investment risks, including possible loss of the principal amount invested.
Maximum Offering Price (MOP) for Class A shares includes the Fund's maximum sales charge of 4.75%. Performance shown at NAV does not include these sales charges and would have been lower had it been taken into account.
A Contingent Deferred Sales Charge (CDSC) of 1.00% may apply to Class C shares redeemed within the first 12 months after a purchase.
| (1) | Inception Dates - Class A: 10/01/1992, Class C: 07/01/2000, Institutional Class: 10/21/2008, Investor Class: 05/01/2011 |
| (2) | Emerald Mutual Fund Advisers Trust ("Emerald" or the "Adviser") has agreed contractually to waive a portion of its fees and reimburse other expenses until August 31, 2021 in amounts necessary to limit the Fund's operating expenses (exclusive of Acquired Fund Fees and Expenses, brokerage expenses, interest expenses, taxes and extraordinary expense) for Class A, Class C, Institutional Class, and Investor Class shares to an annual rate (as percentage of the Fund's average daily net assets) of 1.29%, 1.94%, 0.99% and 1.34% respectively. The Adviser will be permitted to recover, on a class-by-class basis, expenses it has borne through the agreement described above to the extent that the Fund's expenses in later periods fall below the annual rates set forth in the relevant agreement. The Fund will not be obligated to pay any such deferred fees and expenses more than three years after the year(s) in which the fees and expense were incurred. The Adviser may not discontinue this waiver prior to August 31, 2021, without the approval by the Fund's Board of Trustees. Ratios as of the Prospectus dated August 31, 2020 and may differ from the ratios presented in the Financial Highlights. |
| (3) | The Russell 2000® Growth Index measures the performance of the small-cap growth segment of the U.S. equity universe. It includes those Russell 2000® Index companies with higher price-to-value ratios and higher forecasted growth values. The Index is not actively managed and does not reflect any deduction for fees, expenses or taxes. An investor may not invest directly into the Index. |
| 4 | www.emeraldmutualfunds.com |
| Emerald Growth Fund | Manager Commentary |
April 30, 2021 (Unaudited)
GROWTH OF $10,000 INVESTMENT IN THE FUND (for the period ended April 30, 2021)
Comparison of change in value of a $10,000 investment (includes applicable sales loads)
The chart represents historical performance of a hypothetical investment of $10,000 in the Fund since inception. Past performance does not guarantee future results. This chart does not reflect the deduction of taxes that a shareholder would pay on Fund distributions or the redemption of Fund shares.
Investing in the Fund is subject to investment risks, including possible loss of the principal amount invested.
| Annual Report | April 30, 2021 | 5 |
| Emerald Insights Fund | Manager Commentary |
April 30, 2021 (Unaudited)
April 30, 2021
Dear Shareholder:
Investment Results
The performance of the Emerald Insights Fund Class A Shares (without the sales load) for the 12 months ended 4/30/2021 reflected a return of 82.17%, surpassing the Russell 3000 Growth Index benchmark return of 52.41% by 2,976 basis points. Performance was driven by strength in the Healthcare, Financial Services, Energy, Producer Durables, and Consumer sectors, offset by weakness in the Technology sector.
Investment Analysis
Somehow, referring to the past 12 months as “unprecedented” seems insufficient, given the level of uncertainty the market was forced to digest. Investors struggled with the realities of lockdowns, quarantines, travel restrictions, work furloughs, and working from home while simultaneously seeing reports of improving economic activity, positive virus trends, a dovish Fed, and multiple rounds of economic stimulus.
Throughout the reporting period, the Insights Fund continued to benefit from our “Flexible Barbell” approach to portfolio construction, which kept the portfolio modestly underweight the FAANGM (“FAANG” is an acronym that refers to the stocks of five prominent American technology companies: Facebook (FB), Amazon (AMZN), Apple (AAPL), Netflix (NFLX); and Alphabet (GOOG) (formerly known as Google)) names while simultaneously overweighting a specific group of our favorite small- and mid-cap names, and dynamically adjusting the portfolio’s exposure between “stay-at-home” names and those stocks leveraged to an economic recovery.
The Insights the Fund's portfolio continues to trade at, or below, the benchmark index on every valuation metric that we track including Price/Earnings, Price/Sales, and Price/Book with a materially higher estimated 3-5 year EPS growth rate of 21.7% vs 19.03% for the index (all statistics from FactSet as of April 30, 2021).
Market Outlook
As of April 30, 2021, we enter the spring/summer of 2021, equities remain near record levels, while the economy as a whole continues to struggle with mixed messages regarding the vaccination rate, virus variants, the pace of economic recovery and employment, and volatility surrounding taxation, the U.S. Federal Reserve (the “Fed”) response to inflation expectations, political discord, cyber vulnerabilities, and the emergence of social-media driven investing. While the visceral fear experienced during 2020 has subsided, the level of economic uncertainty remains very high.
Not to sound like a broken record, but the core of the Fund’s “Flexible Barbell” strategy is the flexibility it gives us as portfolio managers in constructing seeking to construct portfolios that can do well under most investment/economic environments; while remaining true to our style as a growth manager. The flexibility to adjust between large vs. small names, cyclical vs. secular and bond proxies, names with more or less overseas exposure and lower earners vs. higher quality earners, has served us well in the past few years. This dynamic adjustment allows us to seek to take advantage of some of the broader economic themes presented to us without being dogmatically tied to a specific style category, apart from growth.
All in, we believe active managers have the opportunity to shine in the current liquidity-rich trading environment. We believe reasonably high stock dispersions, lower correlations and at least some focus on valuations in light of growth, should benefit managers possessing a strong research-based investment approach. We certainly think Emerald fits the bill as a manager with a deep, rigorous research focus and feel confident about our ability to identify and invest in some of the most exciting, innovative themes and companies in the domestic equity universe. As always Emerald will stick to our time-tested portfolio construction approach regardless of the inevitable changes in policy, interest rates and investor preferences seeking to take advantage of the price dislocations caused by these events.
| 6 | www.emeraldmutualfunds.com |
| Emerald Insights Fund | Manager Commentary |
April 30, 2021 (Unaudited)
| Top Contributors | Top Detractors | |
| Apple Inc. | Karyopharm Therapeutics, Inc. | |
| Chart Industries, Inc. | Tabula Rasa Healthcare, Inc. | |
| Voyager Digital Ltd. | EverQuote, Inc. Class A | |
| Horizon Therapeutics Public Limited Company | American Well Corporation Class A | |
| New Fortress Energy Inc. Class A | Ebix, Inc. | |
| Chegg, Inc. | Varex Imaging Corporation | |
| NVIDIA Corporation | Rocket Companies Inc Class A | |
| Amazon.com, Inc. | Regeneron Pharmaceuticals, Inc. | |
| Microsoft Corporation | Applied Therapeutics, Inc. | |
| Varonis Systems, Inc. | Western Alliance Bancorp | |
| David A. Volpe, CFA | Stephen L. Amsterdam | Joseph Hovorka |
| Deputy Chief Investment Officer | Associate Portfolio Manager | Associate Portfolio Manager |
| Portfolio Manager |
Emerald Mutual Fund Advisers Trust
Past performance does not guarantee future results. Fund prices fluctuate as the underlying assets have exposure to market fluctuations and other risks, as described in the Fund’s prospectus. Please visit www.emeraldmutualfunds.com to obtain current performance information and for the current prospectus and statement of additional information. This material must be preceded or accompanied by a prospectus. Please read the prospectus carefully before investing.
The views of Emerald Mutual Fund Advisers Trust and information discussed in this commentary are as of the date of publication, are subject to change, and may not reflect the writer's current views. The views expressed are those of the author only, and represent an assessment of market conditions at a specific point in time, are opinions only and should not be relied upon as investment advice regarding a particular investment or markets in general. Such information does not constitute a recommendation to buy or sell specific securities or investment vehicles. It should not be assumed that any investment will be profitable or will equal the performance of the Fund or any securities or any sectors mentioned in this letter. The subject matter contained in this letter has been derived from several sources believed to be reliable and accurate at the time of compilation. Neither Emerald Mutual Fund Advisers Trust nor the Fund accepts any liability for losses either direct or consequential caused by the use of this information.
The Emerald Insights Fund is distributed by ALPS Distributors, Inc.
The Fund is subject to investment risks, including possible loss of the principal amount invested and therefore is not suitable for all investors. The Fund may not achieve its objectives.
Diversification does not eliminate the risk of experiencing investment losses.
The Russell 3000® Growth Index is a market capitalization weighted index based on the Russell 3000® index. The Russell 3000® Growth Index includes companies that display signs of above average growth. The index is used to provide a gauge of the performance of growth stocks in the United States. The Index is not actively managed and does not reflect any deductions for fees, expenses or taxes. An investor may not invest directly into the Index.
Basis points refers to a common unit of measure for interest rates and other percentages in finance. One basis point is equal to 1/100th of 1%, or 0.01%, or 0.0001, and is used to denote the percentage change in a financial instrument.
| Annual Report | April 30, 2021 | 7 |
| Emerald Insights Fund | Manager Commentary |
April 30, 2021 (Unaudited)
| TOP TEN HOLDINGS | ||
| (as a % of Net Assets)* | ||
| Apple, Inc. | 7.84% | |
| Microsoft Corp. | 6.90% | |
| Amazon.com, Inc. | 5.70% | |
| Alphabet, Inc. | 4.06% | |
| Facebook, Inc. | 3.76% | |
| NVIDIA Corp. | 3.21% | |
| Voyager Digital, Ltd. | 3.14% | |
| United Therapeutics Corp. | 2.44% | |
| PayPal Holdings, Inc. | 2.37% | |
| Chart Industries, Inc. | 2.19% | |
| Top Ten Holdings | 41.61% | |
| INDUSTRY SECTOR ALLOCATION | ||
| (as a % of Net Assets) | ||
| Technology | 36.05% | |
| Consumer Discretionary | 24.25% | |
| Health Care | 12.16% | |
| Industrials | 11.89% | |
| Financial Services | 5.93% | |
| Energy | 4.25% | |
| Consumer Staples | 1.99% | |
| Basic Materials | 1.73% | |
| Real Estate | 0.72% | |
| Telecommunications | 0.47% | |
| Cash, Cash Equivalents, & Other Net Assets | 0.56% | |
| Total | 100.00% | |
| * | Holdings are subject to change, and may not reflect the current or future position of the portfolio. |
ANNUALIZED TOTAL RETURN (for the period ended April 30, 2021)
| 6 Month | 1 Year | 3 Year | 5 Year | Since Inception(1) | Expense Gross(2) | Ratio Net(2) | |
| Class A (NAV) | 40.84% | 82.17% | 28.90% | 23.68% | 16.51% | 2.25% | 1.35% |
| Class A (LOAD) | 34.17% | 73.59% | 26.84% | 22.49% | 15.67% | 2.25% | 1.35% |
| Russell MidCap® Growth Index(3) | 24.84% | 53.97% | 21.99% | 19.70% | 15.70% | ||
| Russell 3000® Growth Index(4) | 25.08% | 52.41% | 24.84% | 22.59% | 18.50% | ||
| Class C (NAV) | 40.30% | 80.92% | 28.04% | 22.88% | 15.73% | 2.90% | 2.00% |
| Class C (LOAD) | 39.30% | 79.92% | 28.04% | 22.88% | 15.73% | 2.90% | 2.00% |
| Russell MidCap® Growth Index(3) | 24.84% | 53.97% | 21.99% | 19.70% | 15.70% | ||
| Russell 3000® Growth Index(4) | 25.08% | 52.41% | 24.84% | 22.59% | 18.50% | ||
| Investor Class | 40.79% | 82.08% | 28.85% | 23.62% | 16.44% | 2.30% | 1.40% |
| Russell MidCap® Growth Index(3) | 24.84% | 53.97% | 21.99% | 19.70% | 15.70% | ||
| Russell 3000® Growth Index(4) | 25.08% | 52.41% | 24.84% | 22.59% | 18.50% | ||
| Institutional Class | 41.01% | 82.62% | 29.29% | 24.04% | 16.84% | 1.95% | 1.05% |
| Russell MidCap® Growth Index(3) | 24.84% | 53.97% | 21.99% | 19.70% | 15.70% | ||
| Russell 3000® Growth Index(4) | 25.08% | 52.41% | 24.84% | 22.59% | 18.50% |
The performance quoted represents past performance, does not guarantee future results and current performance may be lower or higher than the data quoted. The investment return and principal value of an investment will fluctuate so that shares, when redeemed, may be worth more or less than their original cost. Performance data current to the most recent month end may be obtained at www.emeraldmutualfunds.com.
Returns for periods less than 1 year are cumulative.
The table does not reflect the deduction of taxes that a shareholder would pay on Fund distributions or the redemption of Fund shares.
Subject to investment risks, including possible loss of the principal amount invested.
Maximum Offering Price (MOP) for Class A shares includes the Fund's maximum sales charge of 4.75%. Performance shown at NAV does not include these sales charges and would have been lower had it been taken into account.
A Contingent Deferred Sales Charge (CDSC) of 1.00% may apply to Class C shares redeemed within the first 12 months after a purchase.
| (1) | Inception Date – August 1, 2014. |
| (2) | Emerald Mutual Fund Advisers Trust ("Emerald" or the "Adviser") has agreed contractually to waive a portion of its fees and reimburse other expenses until August 31, 2021 in amounts necessary to limit the Fund's operating expenses (exclusive of Acquired Fund Fees and Expenses, brokerage expenses, interest expenses, taxes and extraordinary expense) for Class A, Class C, Institutional Class, and Investor Class shares to an annual rate (as percentage of the Fund's average daily net assets) of 1.35%, 2.00%, 1.05% and 1.40% respectively. The Adviser will be permitted to recover, on a class-by-class basis, expenses it has borne through the agreement described above to the extent that the Fund's expenses in later periods fall below the annual rates set forth in the relevant agreement. The Fund will not be obligated to pay any such deferred fees and expenses more than three years after the year(s) in which the fees and expense were incurred. The Adviser may not discontinue this waiver prior to August 31, 2021, without the approval by the Fund's Board of Trustees. Ratios as of the Prospectus dated August 31, 2020 and may differ from the ratios presented in the Financial Highlights. |
| (3) | The Russell MidCap® Growth Index measures the performance of the mid-cap growth segment of the U.S. equity universe. It includes those Russell Midcap Index companies with higher price-to-book ratios and higher forecasted growth values. The Index is not actively managed and does not reflect any deductions for fees, expenses or taxes. An investor may not invest directly into the Index. |
| (4) | The Russell 3000® Growth Index is a market capitalization weighted index based on the Russell 3000® index. The Russell 3000® Growth Index includes companies that display signs of above average growth. The index is used to provide a gauge of the performance of growth stocks in the United States. The Index is not actively managed and does not reflect any deductions for fees, expenses or taxes. An investor may not invest directly into the Index. |
Important Risks
Investing in smaller companies generally will present greater investment risks, including: greater price volatility, greater sensitivity to changing economic conditions and less liquidity than the securities of larger, more mature companies.
| 8 | www.emeraldmutualfunds.com |
| Emerald Insights Fund | Manager Commentary |
April 30, 2021 (Unaudited)
GROWTH OF $10,000 INVESTMENT IN THE FUND (for the period ended April 30, 2021)
Comparison of change in value of a $10,000 investment (includes applicable sales loads)

The chart represents historical performance of a hypothetical investment of $10,000 in the Fund since inception. Past performance does not guarantee future results. This chart does not reflect the deduction of taxes that a shareholder would pay on Fund distributions or the redemption of Fund shares.
Investing in the Fund is subject to investment risks, including possible loss of the principal amount invested.
| Annual Report | April 30, 2021 | 9 |
| Emerald Banking and Finance Fund | Manager Commentary |
April 30, 2021 (Unaudited)
April 30, 2021
Dear Shareholder:
Investment Results
The Emerald Bank & Finance Fund Class A shares (without sales load) outperformed the Fund's benchmark, the Russell 2000 Index, for the twelve months ended April 30, 2021, returning 125.21% vs. 74.91% for the Index. During the twelve months ended April 30, 2021, the Russell 2000 Financial Services Index returned 68.25%.
As we peak our head out from the “foxhole” we believe it is time to sound the “all clear”. Over the last fiscal year, we believe the coronavirus pandemic turned the operating environment for community banks upside down, threatening heightened credit losses while putting pressure on net interest margins, credit quality and bank earnings. Facing a potentially severe recession, community bank management teams were uncertain as to the severity of the credit deterioration to come and the potential credit risk in their loan portfolios. The Banking sector received its second “bail-out” in the last twelve years by way of the Paycheck Protection Program or PPP. While marketed to the U.S. public as a program to support workers and small business, the program was essential to maintain credit quality at banks, eliminated the typical requirements to recognize deferred loan, and modified loans as non-performing loans. Under PPP, banks offered borrowers relief through forbearance programs and loans while pocketing fees from the government to provide what essentially were grants to their borrowers. The U.S. government’s economic response to the pandemic was swift as well. Congress approved trillions of dollars of stimulus and the ability for banks to offer borrowers deferrals on loan payments through the Coronavirus Aid, Relief, and Economic Security Act, passed in late March 2020. The Fed moved quickly too, slashing short-term interest rates while launching quantitative easing and various lending facilities aimed at calming the credit markets. The efforts to soften the blow of the pandemic significantly reduced credit risk but caused excess cash to fill the coffers of many banks. Government actions effectively propped up borrowers and lowered the prospect of heightened credit losses but in turn led to pressures on net interest margins.
In fact, in our second quarter 2020 commentary we stated:
As we await Q2 earnings season we remain cautious on the fate of banks moving forward in 2020 given the uncertainty of credit given the industry wide practice of forbearance as well as the “artificial” strength of the consumer resulting from the government transfer payments that have supported the economy. For now, many businesses and households are awash in federal pandemic relief payments. Personal income surged 11% from March to April as a 90% spike in direct government transfers, mostly reflecting relief checks and expanded unemployment insurance, more than offset an 8% decline in employee compensation. Despite the support of a myriad of government programs, we believe the U.S. banking industry could see earnings drop by more than 50% in 2020 as net interest margins contract and credit costs increase.
Our expectation for the U.S. banking industry earnings to drop by more than 50% in 2020 was “off the mark” as credit cost increase did not come to fruition as we expected. Community bank returns on average equity in 2020 remained in the double digits for the third year in a row despite a drop in net interest margins for the industry. Community bank provisions for loan losses rose in 2020 but still represented only a modest headwind to earnings as credit quality deterioration to date has been minimal. Most community banks have not adopted the Current Expected Credit Loss accounting standard or CECL, which we believe would have led to far larger increases in reserves during the height of the pandemic. CECL requires banks to reserve for estimated losses over the life of a loan based on an economic forecast, as opposed to reserving when losses are probable. Economic forecasts were quite dire in the summer of 2020, prompting CECL-compliant banks to record sizable provisions for loan losses. Since community banks avoided the large increase in reserves, their returns outperformed larger institutions last year. While reserve builds were modest, deposit growth was just the opposite, with funds surging into community banks driven in part by the PPP program and “free money” to consumers from the U.S. government. Many institutions simply had too much cash and few attractive yield opportunities to put the funds to work. Loan growth outside the government’s Paycheck Protection Program remained hard to come by amid tightening underwriting standards and weak borrower demand.
Here is what we said about deposits in our second quarter 2020 commentary:
While we believe that deposit pricing in the second quarter has continued to adjust downward and loan yields have stabilized, thus putting less pressure on net interest margins, we believe that net interest margins will continue their downward trend as banks are now “flush” with deposits that banks have been unable to use to fund loans as loan growth has slowed in the second quarter of 2020.
According to S&P Global, through the fourth quarter of 2020, deposits jumped 12.6% from a year earlier. Loan balances rose 4.6% year over year as community banks participated heavily in the PPP program, originating close to 45% of the loans issued through the program in 2020. Excluding PPP, community bank loans actually dropped more than 7% from year-ago levels. According to the Federal Reserve H.8 data, excess liquidity continues to build in the first quarter of 2021. Since the end of the fourth quarter, the Federal Reserve’s H.8 report, which tracks commercial bank balances, shows that deposits at small domestically chartered banks continued to grow through the week ending March 31, 2021, at a nearly 21%
| 10 | www.emeraldmutualfunds.com |
| Emerald Banking and Finance Fund | Manager Commentary |
April 30, 2021 (Unaudited)
annualized rate. Deposit growth has been supported by the Fed’s efforts to flood the markets with liquidity through quantitative easing, which in turn has increased the level of reserves in the banking system. The Fed has maintained that it will continue asset purchases until its employment and inflation goals are met. Government stimulus has provided even greater support for deposits in recent months, with the second and third rounds sending U.S. savings rates back to historic levels. Since the pandemic began, U.S. savings rates have remained above 12% in every month. Before March 2020, the monthly savings rate exceeded 10% just once since January 2000. We believe deposit growth also benefited as PPP borrowers and corporates that drew on existing lines of credit early in the pandemic parked the funds they received. In fact, a long-term trend in the industry has been loan growth failing to keep pace with deposit growth. In the last year, deposits are up 17.0%, while loans have fallen 1.2%. Going back to the first quarter of 2008, deposits have more than doubled compared to just 35.9% growth for loans. As a result, the loans-to-deposits ratio declined to 58.6% at March 31 from 69.5% a year ago and 93.0% in 2008 according to S&P Global.
In the fourth quarter of 2020, it became somewhat apparent that community banks might have come through the pandemic with less damage to credit quality than we had previously expected.
We stated the following in our fourth quarter commentary:
We implemented an approach that viewed the pandemic banking environment as having four stages. We believe that four-stage process includes the original lockdown, pre-therapy/vaccine, post-therapy/vaccine, and the rebuilding of the economy. As previously stated, no one knows the “actual” timing of phases three and four, but what we do know is that the community banking sector has transitioned beyond the first two stages in better shape than even the most optimistic investors have and management teams could have expected. We believe that the plethora of government aid and transfer payments have been beneficial to the community banking sector to date. In our third quarter note, we stated that, “we remain cautious as we move forward into stage three, post-therapy/vaccine.” Our caution centered on credit quality migration and the low interest rate environment. At the time, the ten-year yield was sub 90 basis points.
As of April 30, 2021, as 38.4% of the U.S. population aged 18 or older are fully vaccinated and we have entered the “rebuilding of the economy” phase we have seen the ten-year yield remain above 1.55% for a significant period of time in 2021 and credit seems to have remained unblemished, for the most part. Community banks have offered borrowers historic levels of forbearance through loan payment deferrals. According to S&P Global, community bank deferrals peaked in the summer of 2020 at an estimated $330.6 billion, or 17.00% of the industry’s loans, excluding loans made through the PPP. Deferrals have fallen steadily since then, decreasing to $116.0 billion, or 5.99% of the industry’s ex-PPP loans at the end of the third quarter of 2020, and down further to $53.8 billion, or 2.77% of the industry’s loans, excluding PPP loans, at the end of the fourth quarter of 2020. Banks have said many borrowers resumed normal payments once their deferral period expired. The CARES Act permitted financial institutions to avoid classifying loan deferrals related to the COVID-19 pandemic as troubled debt restructurings. Since deferrals were not classified as TDRs, banks were not required to test for impairment. That provision was originally set to expire Dec. 31, 2020, but was extended to Jan. 1, 2022, in the stimulus package passed late in 2020. Several trillion dollars in government stimulus and more than $500 billion in government guaranteed loans through the PPP no doubt propped up many borrowers during 2020 as well. As relief efforts spread, community bank credit quality performed much better than the investment community had expected in the early days of the pandemic. Nonaccruals rose to 0.69% of loans in 2020 from 0.63% in 2019, while net charge-offs held steady at just 0.20% of average loans.
As a result of the sustained credit quality and after a spike in the first half of 2020, the provision for credit losses declined in the second half of the year and then dove to negative $13.38 billion in the quarter ended March 31, 2021, according to S&P Global. Year-over-year provisions were down about $66 billion. According to S&P Global, the first quarter of 2021 represents the only quarter with a negative provision during the last 30 years. Even in the eight-quarter period following the massive reserve builds during 2008 to 2010, provisioning across the industry remained above $14 billion.
With lower provisioning across the banking industry, net income was $76.72 billion, up more than fourfold year over year in the first quarter of 2021 and 21.1% higher than the previous record set in the second quarter of 2019. Excluding the provision, profitability has not dramatically fluctuated during the last three years. Pre-provision revenue has ranged from $75.34 billion to $91.96 billion on a quarterly basis. The first-quarter value was $81.54 billion, which was 8.2% higher than the year-ago period but below the 13-quarter average according to S&P.
Given the aforementioned growth in deposits and slower loan growth, we do expect net interest margins to remain under pressure in the second half of 2021. Banks are offsetting the slower loan growth with securities and cash and equivalents, which were up 30.2% and 40.2%, respectively, on a year-over-year basis. At March 31, the combination of those categories comprised 42.9% of total assets, relative to just 35.6% a year ago according to S&P.
We believe a greater reliance on lower-yielding assets will cause margin compression. The net interest margin on a taxable equivalent basis was 2.53% in the first quarter of 2021, down 10 basis points from the fourth quarter of 2020 and 63 basis points from a year ago. Lower margins are offsetting all the net interest income growth from a bigger balance sheet. First-quarter 2021 net interest income was approximately the same level
| Annual Report | April 30, 2021 | 11 |
| Emerald Banking and Finance Fund | Manager Commentary |
April 30, 2021 (Unaudited)
as in the fourth quarter of 2017, when total assets were more than $5 billion lower. Carrying a smaller percentage of loans acts as a profitability anchor, but we believe it also provides banks with a tremendous amount of flexibility going forward.
Now that the “smoke” has cleared, we also believe that bank M&A activity will return to the bank industry. According to S&P Global, U.S. bank M&A surged in April 2021 with 19 announced deals, the most deals in a month since January 2020, before the onset of the COVID-19 pandemic. The activity brought the total number of deal announcements up to 53 in 2021, year-to-date, compared to 43 during the same period in 2020.
Total deal value for the 2021 deals increased to $24.83 billion from $6.53 billion during the same period in 2020, with April alone accounting for $13.56 billion of the total deal value according to S&P. The median deal value-to-tangible book value for deals announced in 2021 increased to 149.9%, compared to 134.2% for all of 2020.
Banks stock have performed well year-to-date as of April 30, 2021 with the SNL Small Cap U.S. Bank Index up about 28.06% and the SNL Mid Cap Bank Index up about 28.54%. While banks have had a great run compared to the broader market in the first quarter of 2021, we do not believe the “strength” in the sector has run its course. While banks have outperformed the S&P 500 by over 50% since the election in 2020, we believe valuations remain attractive. Based on S&P Global data, we believe bank price-to-tangible book values (TBV) look most attractive for small cap banks. At the end of first quarter 2021, the SNL Large Cap U.S. Bank & Thrift Index traded at 196% of TBV while the SNL Mid Cap U.S. Bank & Thrift Index trades at 195% of TBV but only 148% of TBV for the SNL Small Cap U.S. Bank & Thrift Index. These valuation discrepancies hold true if we were to examine the same indices on a price-to-earnings ratio (P/E). On a P/E basis, the SNL Large Cap U.S. Bank & Thrift Index traded at an 18.8x P/E (LTM) while the SNL Mid Cap U.S. Bank & Thrift Index traded at 10x P/E (LTM) and the SNL Small Cap U.S. Bank & Thrift Index at 5.8x P/E (LTM).
We continue to favor banks with differentiated business models such as banking-as-a-service or those focused on payment services. Additionally, we would anticipate that banks with outsized exposure to SBA lending to outperform as the government SBA 7a program has increased the government guarantee from 75% to 90% and have waived fees for borrowers on both the 7a and 504 programs.
| Top Contributors | Top Detractors |
| Silvergate Capital Corp. Class A | Esquire Financial Holdings, Inc. |
| Voyager Digital Ltd. | Marathon Digital Holdings Inc |
| Bancorp Inc | Meta Financial Group, Inc. |
| Open Lending Corporation Class A | FinTech Acquisition Corp. V Class A |
| Live Oak Bancshares, Inc. | Bank7 Corp. |
| Triumph Bancorp, Inc. | Spartan Acquisition Corp. II Units Cons of 1 Sh A + 1/2 Wt |
| ECN Capital Corp. | VPC Impact Acquisition Holdings Class A |
| OneMain Holdings, Inc. | Lemonade Inc |
| Colony Capital, Inc. Class A | Amerant Bancorp Inc. Class A |
| PennyMac Financial Services, Inc. | DeFi Technologies Inc. |
| Kenneth G. Mertz II, CFA | Steven E. Russell, Esq. |
| Chief Investment Officer | Portfolio Manager |
| Portfolio Manager |
Emerald Mutual Fund Advisers Trust
Past performance does not guarantee future results. Fund prices fluctuate as the underlying assets have exposure to market fluctuations and other risks, as described in the Fund’s prospectus. Please visit www.emeraldmutualfunds.com to obtain current performance information and for the current prospectus and statement of additional information. This material must be preceded or accompanied by a prospectus. Please read the prospectus carefully before investing.
The views of Emerald Mutual Fund Advisers Trust and information discussed in this commentary are as of the date of publication, are subject to change, and may not reflect the writer's current views. The views expressed are those of the author only, and represent an assessment of market conditions at a specific point in time, are opinions only and should not be relied upon as investment advice regarding a particular investment or markets in general. Such information does not constitute a recommendation to buy or sell specific securities or investment vehicles. It should not be assumed that any investment will be profitable or will equal the performance of the Fund or any securities or any sectors mentioned in this letter. The subject matter contained in this letter has been derived from several sources believed to be reliable and accurate at the time of compilation. Neither Emerald Mutual Fund Advisers Trust nor the Fund accepts any liability for losses either direct or consequential caused by the use of this information.
| 12 | www.emeraldmutualfunds.com |
| Emerald Banking and Finance Fund | Manager Commentary |
April 30, 2021 (Unaudited)
The Emerald Banking and Finance Fund is distributed by ALPS Distributors, Inc.
The Fund is subject to investment risks, including possible loss of the principal amount invested and therefore is not suitable for all investors. The Fund may not achieve its objectives.
Diversification does not eliminate the risk of experiencing investment losses.
The Russell 2000® Index measures the performance of the small-cap segment of the U.S. equity universe. The Russell 2000® Index is a subset of the Russell 3000® Index representing approximately 10% of the total market capitalization of that index. It includes approximately 2000 of the smallest securities based on a combination of their market cap and current index membership. The Index is not actively managed and does not reflect any deduction of fees, expenses or taxes. An investor may not invest directly into the Index.
The Russell 2000® Financial Services Index – is comprised of the smallest financial services companies in the Russell 3000 Index. The Index is not actively managed and does not reflect any deductions for fees, expense, or taxes. An investor may not invest directly in the Index.
SNL Small Cap Bank & Thrift Index: Includes all publicly traded (NYSE, NYSE Amex, NASDAQ, OTC BB, Pink Sheets) Banks and Thrifts in SNL's coverage universe with $250M to $1B Total Common Market Capitalization as of most recent pricing data. Source: SNL Financial, data as of April 30, 2019.
The Standard & Poor’s 500® Index is an unmanaged index of 500 common stocks chosen for the market size, liquidity and industry group representation. It is a market-value weighted index. The Index is not actively managed and does not reflect any deduction for fees, expenses or taxes. An investor may not invest directly into the Index
The Russell 2000® Value Index measures the performance of small-cap value segment of the U.S. equity universe. It includes those Russell 2000 companies with lower price-to-book ratios (A ratio used to compare a stock's market value to its book value. It is calculated by dividing the current closing price of the stock by the latest quarter's book value per share.) and lower forecasted growth values. The Index is not actively managed and does not reflect any deductions for fees, expenses or taxes. An investor may not invest directly into the Index.
| Annual Report | April 30, 2021 | 13 |
| Emerald Banking and Finance Fund | Manager Commentary |
April 30, 2021 (Unaudited)
| TOP TEN HOLDINGS | ||
| (as a % of Net Assets)* | ||
| Voyager Digital, Ltd. | 5.41% | |
| Galaxy Digital Holdings, Ltd. | 4.79% | |
| Triumph Bancorp, Inc. | 4.21% | |
| Bancorp, Inc. | 4.07% | |
| LendingClub Corp. | 3.92% | |
| Signature Bank/New York NY | 3.79% | |
| Colony Capital, Inc. | 3.63% | |
| Social Capital Hedosophia | 3.28% | |
| Holdings Corp. V ECN Capital Corp. | 3.17% | |
| Power REIT | 2.89% | |
| Top Ten Holdings | 39.16% | |
| INDUSTRY SECTOR ALLOCATION | ||
| (as a % of Net Assets) | ||
| Banks | 34.02% | |
| Diversified Real Estate Activities | 12.17% | |
| Securities Brokerage & Services | 10.20% | |
| Asset Managers And Custodians | 7.78% | |
| Transaction Processing Services | 5.70% | |
| Investment Services | 5.13% | |
| Other Specialty REITs | 3.95% | |
| Consumer Lending | 3.92% | |
| Diversified REITs | 3.64% | |
| Consumer Finance & Mortgage Companies | 3.17% | |
| Mortgage REITs: Commercial | 1.76% | |
| Consumer Digital Services | 1.58% | |
| Financial Data Providers | 1.52% | |
| Property And Casualty Insurance | 1.45% | |
| Diversified Financial Services | 1.39% | |
| Infrastructure REITs | 0.58% | |
| Warrant | 0.11% | |
| Cash, Cash Equivalents, & Other Net Assets | 1.93% | |
| Total | 100.00% | |
| * | Holdings are subject to change, and may not reflect the current or future position of the portfolio. |
ANNUALIZED TOTAL RETURN (for the period ended April 30, 2021)
| 6 Month | 1 Year | 3 Year | 5 Year | 10 Year | Since Inception(1) | Expense Gross(2) | Ratio Net(2) | |
| Class A (NAV) | 84.83% | 125.21% | 12.09% | 16.31% | 15.14% | 10.01% | 1.48% | 1.48% |
| Class A (LOAD) | 76.06% | 114.52% | 10.29% | 15.18% | 14.58% | 9.79% | 1.48% | 1.48% |
| Russell 2000® Index(3) | 48.06% | 74.91% | 15.23% | 16.48% | 11.63% | 9.21% | ||
| Russell 2000® Financial Services Index(4) | 50.86% | 68.25% | 9.87% | 12.44% | 11.38% | 8.93% | ||
| Class C (NAV) | 84.23% | 123.68% | 11.36% | 15.56% | 14.41% | 10.18% | 2.13% | 2.13% |
| Class C (LOAD) | 83.23% | 122.68% | 11.36% | 15.56% | 14.41% | 10.18% | 2.13% | 2.13% |
| Russell 2000® Index(3) | 48.06% | 74.91% | 15.23% | 16.48% | 11.63% | 9.21% | ||
| Russell 2000® Financial Services Index(4) | 50.86% | 68.25% | 9.87% | 12.44% | 11.38% | 8.93% | ||
| Investor Class | 84.80% | 125.07% | 12.06% | 16.31% | 15.18% | 13.99% | 1.53% | 1.53% |
| Russell 2000® Index(3) | 48.06% | 74.91% | 15.23% | 16.48% | 11.63% | 9.21% | ||
| Russell 2000® Financial Services Index(4) | 50.86% | 68.25% | 9.87% | 12.44% | 11.38% | 8.93% | ||
| Institutional Class | 85.18% | 125.94% | 12.49% | 16.71% | – | 16.66% | 1.18% | 1.18% |
| Russell 2000® Index(3) | 48.06% | 74.91% | 15.23% | 16.48% | 11.63% | 9.21% | ||
| Russell 2000® Financial Services Index(4) | 50.86% | 68.25% | 9.87% | 12.44% | 11.38% | 8.93% |
The performance quoted represents past performance, does not guarantee future results and current performance may be lower or higher than the data quoted. The investment return and principal value of an investment will fluctuate so that shares, when redeemed, may be worth more or less than their original cost. Performance data current to the most recent month end may be obtained at www.emeraldmutualfunds.com.
Performance shown for periods prior to March 16, 2012, reflects the performance of the Forward Banking & Finance Fund, a series of Forward Funds (as a result of a reorganization of the Forward Banking & Finance Fund into the Emerald Banking & Finance Fund).
Returns for periods less than 1 year are cumulative.
The table does not reflect the deduction of taxes that a shareholder would pay on Fund distributions or the redemption of Fund shares.
Subject to investment risks, including possible loss of the principal amount invested.
Maximum Offering Price (MOP) for Class A shares includes the Fund's maximum sales charge of 4.75%. Performance shown at NAV does not include these sales charges and would have been lower had it been taken into account.
A Contingent Deferred Sales Charge (CDSC) of 1.00% may apply to Class C shares redeemed within the first 12 months after a purchase.
| (1) | Inception Dates - Class A: 02/18/1997, Class C: 07/01/2000, Institutional Class: 03/19/2012, Investor Class: 03/16/2010 |
| (2) | Emerald Mutual Fund Advisers Trust ("Emerald" or the "Adviser") has agreed contractually to waive a portion of its fees and reimburse other expenses until August 31, 2021 in amounts necessary to limit the Fund's operating expenses (exclusive of Acquired Fund Fees and Expenses, brokerage expenses, interest expenses, taxes and extraordinary expense) for Class A, Class C, Institutional Class, and Investor Class shares to an annual rate (as percentage of the Fund's average daily net assets) of 1.84%, 2.49%, 1.54% and 1.89% respectively. The Adviser will be permitted to recover, on a class-by-class basis, expenses it has borne through the agreement described above to the extent that the Fund's expenses in later periods fall below the annual rates |
| 14 | www.emeraldmutualfunds.com |
| Emerald Banking and Finance Fund | Manager Commentary |
April 30, 2021 (Unaudited)
set forth in the relevant agreement. The Fund will not be obligated to pay any such deferred fees and expenses more than three years after the year(s) in which the fees and expense were incurred. The Adviser may not discontinue this waiver prior to August 31, 2021, without the approval by the Fund's Board of Trustees. Ratios as of the Prospectus dated August 31, 2020 and may differ from the ratios presented in the Financial Highlights.
| (3) | The Russell 2000® Index measures the performance of the small-cap segment of the U.S. equity universe. The Russell 2000® is a subset of the Russell 3000® Index representing approximately 8% of the total market capitalization of that index. It includes approximately 2000 of the smallest securities based on a combination of their market cap and current index membership. The index is not actively managed and does not reflect any deductions for fees, expenses or taxes. An investor may not invest directly into an index. |
| (4) | The Russell 2000® Financial Services Index is an additional index, and is comprised of the smallest financial services companies in the Russell 3000® Index. The Index is not actively managed and does not reflect any deductions for fees, expense, or taxes. An investor may not invest directly in the Index. |
Important Risks
A fund that concentrates in a particular industry will involve a greater degree of risk than a fund with a more diversified portfolio. Investing in smaller companies generally will present greater investment risks, including: greater price volatility, greater sensitivity to changing economic conditions and less liquidity than the securities of larger, more mature companies.
| Annual Report | April 30, 2021 | 15 |
| Emerald Banking and Finance Fund | Manager Commentary |
April 30, 2021 (Unaudited)
GROWTH OF $10,000 INVESTMENT IN THE FUND (for the period ended April 30, 2021)
Comparison of change in value of a $10,000 investment (includes applicable sales loads)

The chart represents historical performance of a hypothetical investment of $10,000 in the Fund since inception. Past performance does not guarantee future results. This chart does not reflect the deduction of taxes that a shareholder would pay on Fund distributions or the redemption of Fund shares.
Investing in the Fund is subject to investment risks, including possible loss of the principal amount invested.
| 16 | www.emeraldmutualfunds.com |
| Emerald Funds | Disclosure of Fund Expenses |
April 30, 2021 (Unaudited)
As a shareholder of the Funds, you incur two types of costs: (1) transaction costs, including applicable sales charges (loads); and (2) ongoing costs, including management fees, distribution and service (12b-1) fees, shareholder services fees and other Fund expenses. This example is intended to help you understand your ongoing costs (in dollars) of investing in the Funds and to compare these costs with the ongoing costs of investing in other mutual funds. The example is based on an investment of $1,000 invested at the beginning of the (six-month) period and held for the entire period November 1, 2020 through April 30, 2021.
Actual Expenses
The first line for each share class of the Fund in the table below provides information about actual account values and actual expenses. You may use this information, together with the amount you invested, to estimate the expenses that you paid over the period. Simply divide your account value by $1,000 (for example, an $8,600 account value divided by $1,000 = 8.6), then multiply the result by the number in the applicable line under the heading titled “Expenses Paid During Period” to estimate the expenses you paid on your account during this period.
Hypothetical Example For Comparison Purposes
The second line for each share class of each Fund in the table below provides information about hypothetical account values and hypothetical expenses based on the Fund’s actual expense ratio and an assumed rate of return of 5% per year before expenses, which is not the Fund’s actual return. The hypothetical account values and expenses may not be used to estimate the actual ending account balance or expenses you paid for the period. You may use this information to compare the ongoing costs of investing in the Funds and other funds. To do so, compare this 5% hypothetical example with the 5% hypothetical examples that appear in the shareholder reports of other mutual funds.
Please note that the expenses shown in the table below are meant to highlight your ongoing costs only and do not reflect any transactional costs, such as sales charges (loads), redemption fees or exchange fees. Therefore, the second line for each share class of the Fund within the table is useful in comparing ongoing costs only, and will not help you determine the relative total costs of owning different funds. If these transactional costs were included, your costs would have been higher.
| Beginning Account Value 11/01/20 | Ending Account Value 04/30/21 | Expense Ratio(a) | Expense Paid During Period 11/01/20 - 4/30/21(b) | |
| Emerald Growth Fund | ||||
| Class A | ||||
| Actual | $ 1,000.00 | $ 1,339.80 | 0.99% | $ 5.74 |
| Hypothetical (5% return before expenses) | $ 1,000.00 | $ 1,019.89 | 0.99% | $ 4.96 |
| Class C | ||||
| Actual | $ 1,000.00 | $ 1,335.40 | 1.65% | $ 9.55 |
| Hypothetical (5% return before expenses) | $ 1,000.00 | $ 1,016.61 | 1.65% | $ 8.25 |
| Institutional Class | ||||
| Actual | $ 1,000.00 | $ 1,341.90 | 0.68% | $ 3.95 |
| Hypothetical (5% return before expenses) | $ 1,000.00 | $ 1,021.42 | 0.68% | $ 3.41 |
| Investor Class | ||||
| Actual | $ 1,000.00 | $ 1,339.60 | 1.03% | $ 5.97 |
| Hypothetical (5% return before expenses) | $ 1,000.00 | $ 1,019.69 | 1.03% | $ 5.16 |
| Annual Report | April 30, 2021 | 17 |
| Emerald Funds | Disclosure of Fund Expenses |
April 30, 2021 (Unaudited)
| Beginning Account Value 11/01/20 | Ending Account Value 04/30/21 | Expense Ratio(a) | Expense Paid During Period 11/01/20 - 4/30/21(b) | |
| Emerald Insights Fund | ||||
| Class A | ||||
| Actual | $ 1,000.00 | $ 1,408.40 | 1.35% | $ 8.06 |
| Hypothetical (5% return before expenses) | $ 1,000.00 | $ 1,018.10 | 1.35% | $ 6.76 |
| Class C | ||||
| Actual | $ 1,000.00 | $ 1,403.00 | 2.00% | $ 11.92 |
| Hypothetical (5% return before expenses) | $ 1,000.00 | $ 1,014.88 | 2.00% | $ 9.99 |
| Institutional Class | ||||
| Actual | $ 1,000.00 | $ 1,410.10 | 1.05% | $ 6.27 |
| Hypothetical (5% return before expenses) | $ 1,000.00 | $ 1,019.59 | 1.05% | $ 5.26 |
| Investor Class | ||||
| Actual | $ 1,000.00 | $ 1,407.90 | 1.40% | $ 8.36 |
| Hypothetical (5% return before expenses) | $ 1,000.00 | $ 1,017.85 | 1.40% | $ 7.00 |
| Emerald Banking and Finance Fund | ||||
| Class A | ||||
| Actual | $ 1,000.00 | $ 1,848.70 | 1.47% | $ 10.38 |
| Hypothetical (5% return before expenses) | $ 1,000.00 | $ 1,017.50 | 1.47% | $ 7.35 |
| Class C | ||||
| Actual | $ 1,000.00 | $ 1,842.30 | 2.11% | $ 14.87 |
| Hypothetical (5% return before expenses) | $ 1,000.00 | $ 1,014.33 | 2.11% | $ 10.54 |
| Institutional Class | ||||
| Actual | $ 1,000.00 | $ 1,851.80 | 1.12% | $ 7.92 |
| Hypothetical (5% return before expenses) | $ 1,000.00 | $ 1,019.24 | 1.12% | $ 5.61 |
| Investor Class | ||||
| Actual | $ 1,000.00 | $ 1,848.40 | 1.50% | $ 10.59 |
| Hypothetical (5% return before expenses) | $ 1,000.00 | $ 1,017.36 | 1.50% | $ 7.50 |
| (a) | The Fund's expense ratios have been based on the Fund's most recent fiscal half-year expenses. |
| (b) | Expenses are equal to the Fund's annualized expense ratio multiplied by the average account value over the period, multiplied by the number of days in the most recent fiscal half-year (181)/365 (to reflect the half-year period). |
| 18 | www.emeraldmutualfunds.com |
| Emerald Growth Fund | Schedule of Investments |
April 30, 2021
| Shares | Value (Note 2) | |||||||
| COMMON STOCKS: 99.08% | ||||||||
| Basic Materials: 1.40% | ||||||||
| 460,545 | Avient Corp. | $ | 23,381,870 | |||||
| Consumer Discretionary: 18.92% | ||||||||
| 200,300 | BJ's Restaurants, Inc.(a) | 12,216,297 | ||||||
| 304,570 | Chegg, Inc.(a) | 27,511,808 | ||||||
| 130,024 | Churchill Downs, Inc. | 27,500,076 | ||||||
| 262,829 | Chuy's Holdings, Inc.(a) | 12,841,825 | ||||||
| 387,820 | Cinemark Holdings, Inc.(a) | 8,221,784 | ||||||
| 205,890 | Dick's Sporting Goods, Inc. | 17,002,396 | ||||||
| 1,021,639 | Everi Holdings, Inc.(a) | 18,062,578 | ||||||
| 92,734 | Five Below, Inc.(a) | 18,664,572 | ||||||
| 216,082 | Jack in the Box, Inc. | 26,070,293 | ||||||
| 295,189 | Latham Group, Inc.(a) | 7,674,914 | ||||||
| 399,149 | Lindblad Expeditions Holdings, Inc.(a) | 6,542,052 | ||||||
| 400,758 | National Vision Holdings, Inc.(a) | 20,202,211 | ||||||
| 576,604 | Noodles & Co.(a) | 6,968,259 | ||||||
| 368,254 | Petco Health & Wellness Company(a) | 8,698,159 | ||||||
| 199,002 | Planet Fitness, Inc., Class A(a) | 16,714,178 | ||||||
| 614,270 | PlayAGS, Inc.(a) | 5,497,717 | ||||||
| 299,211 | SeaWorld Entertainment, Inc.(a) | 16,384,794 | ||||||
| 28,783 | Stamps.com, Inc.(a) | 5,911,165 | ||||||
| 126,127 | Sun Country Airlines Holdings, Inc.(a) | 5,133,369 | ||||||
| 400,257 | Tilly's, Inc., Class A(a) | 4,827,099 | ||||||
| 95,311 | Visteon Corp.(a) | 11,609,833 | ||||||
| 156,910 | Winnebago Industries, Inc. | 12,544,955 | ||||||
| 224,096 | YETI Holdings, Inc.(a) | 19,142,280 | ||||||
| 315,942,614 | ||||||||
| Consumer Staples: 5.21% | ||||||||
| 731,750 | BellRing Brands, Inc., Class A(a) | 18,871,833 | ||||||
| 243,555 | Freshpet, Inc.(a) | 45,013,835 | ||||||
| 670,104 | Simply Good Foods Co.(a) | 23,152,093 | ||||||
| 87,037,761 | ||||||||
| Energy: 0.27% | ||||||||
| 272,010 | American Superconductor Corp.(a) | 4,480,005 | ||||||
| Financial Services: 12.34% | ||||||||
| 730,176 | BRP Group, Inc., Class A(a) | 21,189,707 | ||||||
| 70,000 | Cannae Holdings, Inc.(a) | 2,779,000 | ||||||
| 9,000 | CNB Financial Corp. | 229,140 | ||||||
| 1,182,409 | Eastern Bankshares, Inc. | 25,220,784 | ||||||
| 131,419 | First Choice Bancorp | 4,208,036 | ||||||
| 176,547 | Houlihan Lokey, Inc. | 11,699,770 | ||||||
| 222,855 | Live Oak Bancshares, Inc. | 14,253,806 | ||||||
| 180,500 | Mid Penn Bancorp, Inc.(a) | 4,871,695 | ||||||
| 54,234 | Midwest Holding, Inc.(a) | 2,604,317 | ||||||
| 406,204 | Moelis & Co., Class A | 22,048,753 | ||||||
| 399,096 | OceanFirst Financial Corp. | 9,123,335 | ||||||
| 586,542 | Pacific Premier Bancorp, Inc. | 25,825,444 | ||||||
| 251,212 | Palomar Holdings, Inc.(a) | 17,675,276 | ||||||
| 587,773 | Paya Holdings, Inc., Class A(a) | 6,559,547 | ||||||
| Shares | Value (Note 2) | |||||||
| Financial Services (continued) | ||||||||
| 73,752 | Silvergate Capital Corp., Class A(a) | $ | 7,907,689 | |||||
| 150,344 | South State Corp. | 12,677,006 | ||||||
| 311,670 | Trinity Capital, Inc. | 4,537,915 | ||||||
| 17,863 | Triumph Bancorp, Inc.(a) | 1,583,198 | ||||||
| 488,510 | Voyager Digital, Ltd.(a) | 10,991,475 | ||||||
| 205,985,893 | ||||||||
| Health Care: 22.06% | ||||||||
| 436,473 | AdaptHealth Corp.(a) | 12,683,905 | ||||||
| 103,010 | Addus HomeCare Corp.(a) | 10,898,458 | ||||||
| 376,850 | Applied Therapeutics, Inc.(a) | 6,979,262 | ||||||
| 144,350 | Arena Pharmaceuticals, Inc.(a) | 9,906,741 | ||||||
| 157,050 | Arvinas, Inc.(a) | 10,827,027 | ||||||
| 304,060 | AtriCure, Inc.(a) | 23,433,904 | ||||||
| 424,291 | Avrobio, Inc.(a) | 4,955,719 | ||||||
| 132,058 | Blueprint Medicines Corp.(a) | 12,719,827 | ||||||
| 166,235 | ChemoCentryx, Inc.(a) | 8,034,138 | ||||||
| 445,807 | Collegium Pharmaceutical, Inc.(a) | 9,941,496 | ||||||
| 1,166,175 | Curis, Inc.(a) | 12,618,014 | ||||||
| 181,234 | Deciphera Pharmaceuticals, Inc.(a) | 8,403,821 | ||||||
| 60,000 | DermTech, Inc.(a) | 2,523,000 | ||||||
| 223,213 | Dicerna Pharmaceuticals, Inc.(a) | 6,962,013 | ||||||
| 200,000 | Evolus, Inc.(a) | 1,822,000 | ||||||
| 509,975 | Gossamer Bio, Inc.(a) | 4,406,184 | ||||||
| 100,867 | Integer Holdings Corp.(a) | 9,469,394 | ||||||
| 234,922 | KalVista Pharmaceuticals, Inc.(a) | 5,866,002 | ||||||
| 113,006 | Karuna Therapeutics, Inc.(a) | 12,544,796 | ||||||
| 945,533 | MannKind Corp.(a) | 4,321,086 | ||||||
| 96,859 | Merit Medical Systems, Inc.(a) | 6,160,232 | ||||||
| 575,523 | NeoGenomics, Inc.(a) | 28,194,872 | ||||||
| 779,732 | Ocular Therapeutix, Inc.(a) | 14,331,474 | ||||||
| 1,144,940 | Organogenesis Holdings, Inc.(a) | 25,600,858 | ||||||
| 347,433 | ORIC Pharmaceuticals, Inc.(a) | 8,383,558 | ||||||
| 74,929 | Passage Bio, Inc.(a) | 1,405,668 | ||||||
| 113,584 | Privia Health Group, Inc.(a) | 4,125,371 | ||||||
| 151,759 | Reata Pharmaceuticals, Inc., Class A(a) | 15,388,363 | ||||||
| 429,603 | Replimune Group, Inc.(a) | 15,719,174 | ||||||
| 374,383 | SeaSpine Holdings Corp.(a) | 7,790,910 | ||||||
| 116,726 | Seer, Inc.(a) | 5,944,855 | ||||||
| 226,253 | TransMedics Group, Inc.(a) | 6,495,724 | ||||||
| 118,078 | Treace Medical Concepts, Inc.(a) | 3,702,926 | ||||||
| 72,775 | Turning Point Therapeutics, Inc.(a) | 5,547,638 | ||||||
| 26,698 | Twist Bioscience Corp.(a) | 3,582,605 | ||||||
| 137,146 | Ultragenyx Pharmaceutical, Inc.(a) | 15,310,979 | ||||||
| 106,024 | United Therapeutics Corp.(a) | 21,370,197 | ||||||
| 368,372,191 | ||||||||
| Industrials: 16.64% | ||||||||
| 190,070 | Altra Industrial Motion Corp. | 11,216,031 | ||||||
| 83,407 | Ameresco, Inc., Class A(a) | 4,403,055 | ||||||
| 405,634 | AZEK Co., Inc.(a) | 19,584,009 | ||||||
| 175,000 | Babcock & Wilcox Enterprises, Inc.(a) | 1,578,500 | ||||||
| Annual Report | April 30, 2021 | 19 |
| Emerald Growth Fund | Schedule of Investments |
April 30, 2021
| Shares | Value (Note 2) | |||||||
| Industrials (continued) | ||||||||
| 221,062 | Chart Industries, Inc.(a) | $ | 35,509,189 | |||||
| 353,518 | Echo Global Logistics, Inc.(a) | 11,560,039 | ||||||
| 138,548 | FARO Technologies, Inc.(a) | 10,508,173 | ||||||
| 132,719 | Forward Air Corp. | 11,717,760 | ||||||
| 154,544 | H&E Equipment Services, Inc. | 6,011,762 | ||||||
| 97,285 | Hayward Holdings, Inc.(a) | 1,943,754 | ||||||
| 73,435 | Hydrofarm Holdings Group, Inc.(a) | 4,824,679 | ||||||
| 112,058 | Installed Building Products, Inc. | 15,088,610 | ||||||
| 878,394 | Kratos Defense & Security Solutions, Inc.(a) | 23,488,256 | ||||||
| 112,502 | Masonite International Corp.(a) | 14,207,878 | ||||||
| 313,591 | Montrose Environmental Group, Inc.(a) | 16,999,768 | ||||||
| 69,041 | NV5 Global, Inc.(a) | 6,222,665 | ||||||
| 359,234 | Repay Holdings Corp.(a) | 8,208,497 | ||||||
| 189,335 | Summit Materials, Inc., Class A(a) | 5,450,955 | ||||||
| 200,489 | Tetra Tech, Inc. | 25,588,411 | ||||||
| 231,021 | Trex Co., Inc.(a) | 24,947,958 | ||||||
| 239,913 | TriNet Group, Inc.(a) | 18,883,552 | ||||||
| 277,943,501 | ||||||||
| Real Estate: 0.70% | ||||||||
| 105,470 | Hannon Armstrong Sustainable Infrastructure Capital, Inc. | 5,526,628 | ||||||
| 78,761 | Ryman Hospitality Properties, Inc.(a) | 6,194,553 | ||||||
| 11,721,181 | ||||||||
| Technology: 19.89% | ||||||||
| 429,604 | Allegro MicroSystems, Inc.(a) | 10,602,627 | ||||||
| 446,516 | Cantaloupe, Inc.(a) | 4,621,441 | ||||||
| 361,446 | Cohu, Inc.(a) | 14,461,454 | ||||||
| 320,400 | Covetrus, Inc.(a) | 9,179,460 | ||||||
| 157,341 | Diodes, Inc.(a) | 12,085,362 | ||||||
| 176,990 | DoubleVerify Holdings, Inc.(a) | 6,231,818 | ||||||
| 352,753 | EverQuote, Inc., Class A(a) | 11,947,744 | ||||||
| 222,850 | FormFactor, Inc.(a) | 8,724,578 | ||||||
| 165,657 | Jamf Holding Corp.(a) | 6,049,794 | ||||||
| 288,663 | Lattice Semiconductor Corp.(a) | 14,522,636 | ||||||
| 200,000 | Leaf Group, Ltd.(a) | 1,772,000 | ||||||
| 212,034 | LiveRamp Holdings, Inc.(a) | 10,385,425 | ||||||
| 551,483 | MACOM Technology Solutions Holdings, Inc.(a) | 31,219,453 | ||||||
| 380,904 | MediaAlpha, Inc., Class A(a) | 16,855,002 | ||||||
| 351,203 | Model N, Inc.(a) | 13,970,855 | ||||||
| 287,099 | Onto Innovation, Inc.(a) | 19,672,023 | ||||||
| 242,004 | Perficient, Inc.(a) | 15,877,882 | ||||||
| 212,061 | Ping Identity Holding Corp.(a) | 5,148,841 | ||||||
| 125,839 | Q2 Holdings, Inc.(a) | 13,089,773 | ||||||
| 379,905 | Rapid7, Inc.(a) | 30,867,281 | ||||||
| 393,329 | Sailpoint Technologies Holdings, Inc.(a) | 19,206,255 | ||||||
| 182,487 | Semtech Corp.(a) | 12,361,669 | ||||||
| 149,996 | SkyWater Technology, Inc.(a) | 3,119,917 | ||||||
| Shares | Value (Note 2) | |||||||
| Technology (continued) | ||||||||
| 270,603 | Super Micro Computer, Inc.(a) | $ | 10,017,723 | |||||
| 570,225 | Varonis Systems, Inc.(a) | 30,193,414 | ||||||
| 332,184,427 | ||||||||
| Telecommunications: 1.65% | ||||||||
| 194,296 | Cogent Communications Holdings, Inc. | 14,671,291 | ||||||
| 92,917 | Shenandoah Telecommunications Co. | 4,391,257 | ||||||
| 514,835 | Viavi Solutions, Inc.(a) | 8,422,701 | ||||||
| 27,485,249 | ||||||||
| Total Common Stocks | ||||||||
| (Cost $999,835,119) | 1,654,534,692 | |||||||
| SHORT TERM INVESTMENTS: 1.44% | ||||||||
| 23,969,071 | Dreyfus Government Cash Management Fund - Institutional Class 0.030% (7-Day Yield) | 23,969,071 | ||||||
| Total Short Term Investments | ||||||||
| (Cost $23,969,071) | 23,969,071 | |||||||
| Total Investments: 100.52% | ||||||||
| (Cost $1,023,804,190) | 1,678,503,763 | |||||||
| Liabilities In Excess Of Other Assets: (0.52)% | (8,643,673 | ) | ||||||
| Net Assets: 100.00% | $ | 1,669,860,090 | ||||||
| (a) | Non-income producing security. |
For Fund compliance purposes, the Fund's industry classifications refer to any one or more of the industry sub-classifications used by one or more widely recognized market indexes or ratings group indexes, and/or as defined by Fund management. This definition may not apply for purposes of this report, which may combine industry sub-classifications for reporting ease. Industries are shown as a percentage of net assets.
See Notes to Financial Statements.
| 20 | www.emeraldmutualfunds.com |
| Emerald Insights Fund | Schedule of Investments |
April 30, 2021
| Shares | Value (Note 2) | |||||||
| COMMON STOCKS: 99.44% | ||||||||
| Basic Materials: 1.73% | ||||||||
| 1,661 | Scotts Miracle-Gro Co. | $ | 383,957 | |||||
| Consumer Discretionary: 24.25% | ||||||||
| 364 | Amazon.com, Inc.(a) | 1,262,141 | ||||||
| 107 | Booking Holdings, Inc.(a) | 263,870 | ||||||
| 2,431 | Camping World Holdings, Inc., Class A | 105,846 | ||||||
| 5,002 | Chegg, Inc.(a) | 451,831 | ||||||
| 428 | Churchill Downs, Inc. | 90,522 | ||||||
| 15,577 | Cinemark Holdings, Inc.(a) | 330,232 | ||||||
| 4,122 | Dick's Sporting Goods, Inc. | 340,395 | ||||||
| 16,337 | Everi Holdings, Inc.(a) | 288,838 | ||||||
| 504 | Home Depot, Inc. | 163,130 | ||||||
| 3,172 | Overstock.com, Inc.(a) | 258,518 | ||||||
| 11,581 | Petco Health & Wellness Company(a) | 273,543 | ||||||
| 27,065 | PlayAGS, Inc.(a) | 242,232 | ||||||
| 2,345 | Polaris, Inc. | 328,370 | ||||||
| 7,880 | SeaWorld Entertainment, Inc.(a) | 431,509 | ||||||
| 695 | Williams-Sonoma, Inc. | 118,671 | ||||||
| 5,303 | Winnebago Industries, Inc. | 423,975 | ||||||
| 5,373,623 | ||||||||
| Consumer Staples: 1.99% | ||||||||
| 741 | Freshpet, Inc.(a) | 136,951 | ||||||
| 6,252 | National Beverage Corp. | 303,785 | ||||||
| 440,736 | ||||||||
| Energy: 4.25% | ||||||||
| 4,803 | Cheniere Energy, Inc.(a) | 372,328 | ||||||
| 5,557 | New Fortress Energy, Inc. | 236,284 | ||||||
| 27,168 | TechnipFMC PLC(a) | 201,043 | ||||||
| 52,441 | TETRA Technologies, Inc.(a) | 131,627 | ||||||
| 941,282 | ||||||||
| Financial Services: 5.93% | ||||||||
| 1,814 | Blackstone Group, Inc., Class A | 160,521 | ||||||
| 364 | S&P Global, Inc. | 142,102 | ||||||
| 1,643 | Silvergate Capital Corp., Class A(a) | 176,163 | ||||||
| 30,926 | Voyager Digital, Ltd.(a) | 695,835 | ||||||
| 1,319 | Western Alliance Bancorp | 138,587 | ||||||
| 1,313,208 | ||||||||
| Health Care: 12.16% | ||||||||
| 11,883 | Avrobio, Inc.(a) | 138,793 | ||||||
| 3,038 | Cantel Medical Corp.(a) | 267,071 | ||||||
| 4,519 | Collegium Pharmaceutical, Inc.(a) | 100,774 | ||||||
| 8,396 | Dicerna Pharmaceuticals, Inc.(a) | 261,871 | ||||||
| 3,967 | Horizon Therapeutics PLC(a) | 375,358 | ||||||
| 2,851 | Integer Holdings Corp.(a) | 267,652 | ||||||
| 11,145 | Karyopharm Therapeutics, Inc.(a) | 104,094 | ||||||
| 1,242 | Reata Pharmaceuticals, Inc., Class A(a) | 125,939 | ||||||
| 7,069 | SeaSpine Holdings Corp.(a) | 147,106 | ||||||
| 3,197 | TransMedics Group, Inc.(a) | 91,786 | ||||||
| Shares | Value (Note 2) | |||||||
| Health Care (continued) | ||||||||
| 1,079 | Turning Point Therapeutics, Inc.(a) | $ | 82,252 | |||||
| 2,681 | United Therapeutics Corp.(a) | 540,382 | ||||||
| 677 | Veeva Systems, Inc., Class A(a) | 191,219 | ||||||
| 2,694,297 | ||||||||
| Industrials: 11.89% | ||||||||
| 3,044 | Ameresco, Inc., Class A(a) | 160,693 | ||||||
| 36,217 | Babcock & Wilcox Enterprises, Inc.(a) | 326,677 | ||||||
| 3,026 | Chart Industries, Inc.(a) | 486,066 | ||||||
| 400 | Generac Holdings, Inc.(a) | 129,580 | ||||||
| 8,196 | Hayward Holdings, Inc.(a) | 163,756 | ||||||
| 1,451 | Installed Building Products, Inc. | 195,377 | ||||||
| 6,228 | Kratos Defense & Security Solutions, Inc.(a) | 166,537 | ||||||
| 2,081 | Mercury Systems, Inc.(a) | 156,575 | ||||||
| 560 | Paylocity Holding Corp.(a) | 108,214 | ||||||
| 2,005 | PayPal Holdings, Inc.(a) | 525,892 | ||||||
| 923 | Visa, Inc., Class A | 215,576 | ||||||
| 2,634,943 | ||||||||
| Real Estate: 0.72% | ||||||||
| 186 | CoStar Group, Inc.(a) | 158,924 | ||||||
| Technology: 36.05% | ||||||||
| 255 | Adobe, Inc.(a) | 129,627 | ||||||
| 382 | Alphabet, Inc., Class A(a) | 899,037 | ||||||
| 2,209 | Anaplan, Inc.(a) | 131,767 | ||||||
| 13,220 | Apple, Inc. | 1,737,901 | ||||||
| 6,451 | Cohu, Inc.(a) | 258,104 | ||||||
| 628 | Crowdstrike Holdings, Inc., Class A(a) | 130,944 | ||||||
| 7,421 | Ebix, Inc. | 223,446 | ||||||
| 5,078 | EverQuote, Inc., Class A(a) | 171,992 | ||||||
| 2,562 | Facebook, Inc., Class A(a) | 832,855 | ||||||
| 457 | HubSpot, Inc.(a) | 240,588 | ||||||
| 6,065 | Microsoft Corp. | 1,529,472 | ||||||
| 1,186 | NVIDIA Corp. | 712,051 | ||||||
| 1,299 | Proofpoint, Inc.(a) | 223,571 | ||||||
| 4,273 | SkyWater Technology, Inc.(a) | 88,878 | ||||||
| 1,020 | Teradyne, Inc. | 127,582 | ||||||
| 1,900 | UiPath, Inc.(a) | 136,800 | ||||||
| 7,833 | Varonis Systems, Inc.(a) | 414,757 | ||||||
| 7,989,372 | ||||||||
| Telecommunications: 0.47% | ||||||||
| 1,227 | Lumentum Holdings, Inc.(a) | 104,356 | ||||||
| Total Common Stocks | ||||||||
| (Cost $13,206,561) | 22,034,698 | |||||||
| Annual Report | April 30, 2021 | 21 |
| Emerald Insights Fund | Schedule of Investments |
April 30, 2021
| Shares | Value (Note 2) | |||||||
| SHORT TERM INVESTMENTS: 0.45% | ||||||||
| 100,752 | Dreyfus Government Cash Management Fund - Institutional Class 0.030% (7-Day Yield) | $ | 100,752 | |||||
| Total Short Term Investments | ||||||||
| (Cost $100,752) | 100,752 | |||||||
| Total Investments: 99.89% | ||||||||
| (Cost $13,307,313) | 22,135,450 | |||||||
| Other Assets In Excess Of Liabilities: 0.11% | 24,306 | |||||||
| Net Assets: 100.00% | $ | 22,159,756 | ||||||
| (a) | Non-income producing security. |
For Fund compliance purposes, the Fund's industry classifications refer to any one or more of the industry sub-classifications used by one or more widely recognized market indexes or ratings group indexes, and/or as defined by Fund management. This definition may not apply for purposes of this report, which may combine industry sub-classifications for reporting ease. Industries are shown as a percentage of net assets.
See Notes to Financial Statements.
| 22 | www.emeraldmutualfunds.com |
| Emerald Banking and Finance Fund | Schedule of Investments |
April 30, 2021
| Shares | Value (Note 2) | |||||||
| COMMON STOCKS: 93.59% | ||||||||
| Financial Services: 78.14% | ||||||||
| Asset Managers And Custodians: 6.35% | ||||||||
| 328,500 | Altimar Acquisition Corp.(a) | $ | 3,445,965 | |||||
| 165,280 | Diginex, Ltd.(a) | 1,031,347 | ||||||
| 387,930 | Ether Capital Corp.(a) | 1,210,342 | ||||||
| 400,680 | Figure Acquisition Corp. I(a) | 4,153,048 | ||||||
| 80,840 | Riot Blockchain Inc(a) | 3,381,537 | ||||||
| 32,300 | Trinity Capital, Inc. | 470,288 | ||||||
| 240,170 | VPC Impact Acquisition Holdings, Class A(a) | 2,627,460 | ||||||
| 16,319,987 | ||||||||
| Banks: 34.02% | ||||||||
| 41,390 | Axos Financial, Inc.(a) | 1,868,759 | ||||||
| 471,696 | Bancorp, Inc.(a) | 10,474,010 | ||||||
| 26,842 | Community Heritage Financial, Inc. | 601,261 | ||||||
| 62,093 | Customers Bancorp, Inc.(a) | 2,143,450 | ||||||
| 98,840 | Eastern Bankshares, Inc. | 2,108,257 | ||||||
| 51,560 | Fifth Third Bancorp | 2,090,243 | ||||||
| 40,740 | First Financial Bankshares, Inc. | 1,999,519 | ||||||
| 80,030 | First Foundation, Inc. | 1,904,714 | ||||||
| 22,295 | First Republic Bank | 4,085,336 | ||||||
| 107,294 | Live Oak Bancshares, Inc. | 6,862,524 | ||||||
| 53 | Mechanics Bank/Walnut Creek CA(a) | 1,510,500 | ||||||
| 22,175 | Metropolitan Bank Holding Corp.(a) | 1,393,699 | ||||||
| 342,570 | New York Community Bancorp, Inc. | 4,097,137 | ||||||
| 17,270 | Pacific Premier Bancorp, Inc. | 760,398 | ||||||
| 83,618 | ServisFirst Bancshares, Inc. | 5,288,002 | ||||||
| 38,785 | Signature Bank/New York NY | 9,754,815 | ||||||
| 69,138 | Silvergate Capital Corp., Class A(a) | 7,412,976 | ||||||
| 8,426 | SVB Financial Group(a) | 4,818,240 | ||||||
| 88,145 | TriState Capital Holdings, Inc.(a) | 2,104,021 | ||||||
| 122,206 | Triumph Bancorp, Inc.(a) | 10,831,118 | ||||||
| 194,830 | VersaBank | 2,382,374 | ||||||
| 28,400 | Western Alliance Bancorp | 2,983,988 | ||||||
| 87,475,341 | ||||||||
| Consumer Finance & Mortgage Companies: 3.17% | ||||||||
| 1,216,580 | ECN Capital Corp. | 8,155,733 | ||||||
| Consumer Lending: 3.92% | ||||||||
| 654,810 | LendingClub Corp.(a) | 10,077,526 | ||||||
| Diversified Financial Services: 1.39% | ||||||||
| 61,750 | Cannae Holdings, Inc.(a) | 2,451,475 | ||||||
| 1,046,260 | DeFi Technologies, Inc.(a) | 1,129,961 | ||||||
| 3,581,436 | ||||||||
| Diversified Real Estate Activities: 12.17% | ||||||||
| 171,741 | FG New America Acquisition Corp.(a) | 1,927,793 | ||||||
| 620,957 | Fintech Acquisition Corp. V, Class A(a) | 7,097,538 | ||||||
| 683,720 | Good Works Acquisition Corp.(a) | 6,905,572 | ||||||
| 268,409 | Paysafe, Ltd.(a) | 3,704,044 | ||||||
| Shares | Value (Note 2) | |||||||
| Diversified Real Estate Activities (continued) | ||||||||
| 35,469 | Reinvent Technology Partners Z(a) | $ | 362,493 | |||||
| 463,267 | Social Capital Hedosophia Holdings Corp. V(a) | 8,426,827 | ||||||
| 267,126 | Spartan Acquisition Corp. II(a) | 2,873,608 | ||||||
| 31,297,875 | ||||||||
| Financial Data Providers: 1.52% | ||||||||
| 55,020 | Nuvei Corp.(a) | 3,898,128 | ||||||
| Investment Services: 2.19% | ||||||||
| 12,754 | Coinbase Global, Inc., Class A(a) | 3,796,100 | ||||||
| 138,780 | Porch Group, Inc.(a) | 1,847,162 | ||||||
| 5,643,262 | ||||||||
| Mortgage REITs: Commercial: 1.76% | ||||||||
| 199,560 | AFC Gamma, Inc.(a) | 4,534,003 | ||||||
| Property And Casualty Insurance: 1.45% | ||||||||
| 18,648 | James River Group Holdings, Ltd. | 878,507 | ||||||
| 6,153 | Kinsale Capital Group, Inc. | 1,070,684 | ||||||
| 16,740 | Trisura Group, Ltd.(a) | 1,781,477 | ||||||
| 3,730,668 | ||||||||
| Securities Brokerage & Services: 10.20% | ||||||||
| 431,020 | Galaxy Digital Holdings, Ltd.(a) | 12,305,621 | ||||||
| 618,737 | Voyager Digital, Ltd.(a) | 13,921,583 | ||||||
| 26,227,204 | ||||||||
| Industrials: 5.70% | ||||||||
| Transaction Processing Services: 5.70% | ||||||||
| 11,300 | Bill.com Holdings, Inc.(a) | 1,747,319 | ||||||
| 167,820 | Marathon Digital Holdings, Inc.(a) | 6,172,420 | ||||||
| 9,164 | PayPal Holdings, Inc.(a) | 2,403,626 | ||||||
| 83,631 | Repay Holdings Corp.(a) | 1,910,968 | ||||||
| 9,875 | Square, Inc., Class A(a) | 2,417,597 | ||||||
| 14,651,930 | ||||||||
| Real Estate: 8.17% | ||||||||
| Diversified REITs: 3.64% | ||||||||
| 1,335,125 | Colony Capital, Inc.(a) | 9,345,875 | ||||||
| Infrastructure REITs: 0.58% | ||||||||
| 28,680 | Hannon Armstrong Sustainable Infrastructure Capital, Inc. | 1,502,832 | ||||||
| Other Specialty REITs: 3.95% | ||||||||
| 14,920 | Innovative Industrial Properties, Inc. | 2,732,300 | ||||||
| 164,638 | Power REIT(a) | 7,418,588 | ||||||
| 10,150,888 | ||||||||
| Annual Report | April 30, 2021 | 23 |
| Emerald Banking and Finance Fund | Schedule of Investments |
April 30, 2021
| Shares | Value (Note 2) | |||||||
| Technology: 1.58% | ||||||||
| Consumer Digital Services: 1.58% | ||||||||
| 103,957 | Open Lending Corp., Class A(a) | $ | 4,059,521 | |||||
| Total Common Stocks | ||||||||
| (Cost $164,488,805) | 240,652,209 | |||||||
| MUTUAL FUNDS: 4.37% | ||||||||
| Financial Services: 3.19% | ||||||||
| Asset Managers And Custodians: 1.43% | ||||||||
| 78,090 | Bitcoin Investment Trust(a) | 3,658,516 | ||||||
| Investment Services: 1.76% | ||||||||
| 16,920 | Bitwise 10 Crypto Index Fund(a) | 1,370,520 | ||||||
| 114,120 | Grayscale Ethereum Trust(a) | 3,161,695 | ||||||
| 4,532,215 | ||||||||
| MUTUAL FUNDS/ETFS - OTHER: 1.18% | ||||||||
| Investment Services: 1.18% | ||||||||
| 43,520 | Bitcoin ETF(a) | 953,959 | ||||||
| 192,020 | Purpose Bitcoin ETF(a) | 2,083,417 | ||||||
| 3,037,376 | ||||||||
| Total Mutual Funds | ||||||||
| (Cost $5,935,417) | 11,228,107 | |||||||
| WARRANT: 0.11% | ||||||||
| 62,749 | Paysafe, Ltd., Strike Price $11.50, Expiration Date 12/31/2028(a) | $ | 286,763 | |||||
| Total Warrant | ||||||||
| (Cost $211,219) | 286,763 | |||||||
| SHORT TERM INVESTMENTS: 2.66% | ||||||||
| 6,846,133 | Dreyfus Government Cash Management Fund - Institutional Class 0.030% (7-Day Yield) | 6,846,133 | ||||||
| Total Short Term Investments | ||||||||
| (Cost $6,846,133) | 6,846,133 | |||||||
| Total Investments: 100.73% | ||||||||
| (Cost $177,481,574) | 259,013,212 | |||||||
| Liabilities In Excess Of Other Assets: (0.73)% | (1,874,384 | ) | ||||||
| Net Assets: 100.00% | $ | 257,138,828 | ||||||
| (a) | Non-income producing security. |
For Fund compliance purposes, the Fund's industry classifications refer to any one or more of the industry sub-classifications used by one or more widely recognized market indexes or ratings group indexes, and/or as defined by Fund management. This definition may not apply for purposes of this report, which may combine industry sub-classifications for reporting ease. Industries are shown as a percentage of net assets.
See Notes to Financial Statements.
| 24 | www.emeraldmutualfunds.com |
| Emerald Funds | Statements of Assets and Liabilities |
April 30, 2021
| Emerald Growth Fund | Emerald Insights Fund | Emerald Banking and Finance Fund | ||||||||||
| ASSETS: | ||||||||||||
| Investments, at value | $ | 1,678,503,763 | $ | 22,135,450 | $ | 259,013,212 | ||||||
| Receivable for investments sold | 2,477,385 | 307,532 | 632,179 | |||||||||
| Receivable for shares sold | 1,389,697 | 32,494 | 296,672 | |||||||||
| Interest and dividends receivable | 20 | 1,898 | 31,072 | |||||||||
| Other assets | 24,747 | 6,679 | 9,128 | |||||||||
| Total Assets | 1,682,395,612 | 22,484,053 | 259,982,263 | |||||||||
| LIABILITIES: | ||||||||||||
| Payable for investments purchased | 10,148,749 | 267,995 | 2,194,878 | |||||||||
| Payable for shares redeemed | 909,776 | – | 226,302 | |||||||||
| Investment advisory fees payable | 735,468 | 1,413 | 199,021 | |||||||||
| Payable to fund accounting and administration | 167,482 | 14,849 | 34,121 | |||||||||
| Payable for distribution and service fees | 261,887 | 6,046 | 101,864 | |||||||||
| Payable for trustee fees and expenses | 45,535 | 570 | 6,592 | |||||||||
| Payable for transfer agency fees | 65,655 | 9,655 | 27,800 | |||||||||
| Payable for chief compliance officer fee | 15,678 | 196 | 2,270 | |||||||||
| Payable for principal financial officer fee | 3,321 | 42 | 481 | |||||||||
| Payable for professional fees | 33,617 | 16,456 | 22,272 | |||||||||
| Accrued expenses and other liabilities | 148,354 | 7,075 | 27,834 | |||||||||
| Total Liabilities | 12,535,522 | 324,297 | 2,843,435 | |||||||||
| NET ASSETS | $ | 1,669,860,090 | $ | 22,159,756 | $ | 257,138,828 | ||||||
| NET ASSETS CONSIST OF: | ||||||||||||
| Paid-in capital (Note 5) | $ | 799,056,245 | $ | 11,327,332 | $ | 173,192,536 | ||||||
| Total distributable earnings | 870,803,845 | 10,832,424 | 83,946,292 | |||||||||
| NET ASSETS | $ | 1,669,860,090 | $ | 22,159,756 | $ | 257,138,828 | ||||||
| INVESTMENTS, AT COST | $ | 1,023,804,190 | $ | 13,307,313 | $ | 177,481,574 | ||||||
| PRICING OF SHARES | ||||||||||||
| Class A: (a) | ||||||||||||
| Net Asset Value, offering and redemption price per share | $ | 36.29 | $ | 20.18 | $ | 51.56 | ||||||
| Net Assets | $ | 168,322,483 | $ | 17,617,615 | $ | 68,777,566 | ||||||
| Shares of beneficial interest outstanding | 4,638,409 | 873,072 | 1,334,045 | |||||||||
| Maximum offering price per share (NAV/.9525, based on maximum sales charge of 4.75% of the offering price) | $ | 38.10 | $ | 21.19 | $ | 54.13 | ||||||
| Class C: (a) | ||||||||||||
| Net Asset Value, offering and redemption price per share | $ | 29.09 | $ | 19.02 | $ | 43.35 | ||||||
| Net Assets | $ | 22,447,375 | $ | 246,241 | $ | 22,447,340 | ||||||
| Shares of beneficial interest outstanding | 771,704 | 12,944 | 517,783 | |||||||||
| Institutional Class: | ||||||||||||
| Net Asset Value, offering and redemption price per share | $ | 38.32 | $ | 20.67 | $ | 53.48 | ||||||
| Net Assets | $ | 1,375,764,632 | $ | 3,658,360 | $ | 134,767,237 | ||||||
| Shares of beneficial interest outstanding | 35,898,465 | 176,993 | 2,519,859 | |||||||||
| Investor Class: | ||||||||||||
| Net Asset Value, offering and redemption price per share | $ | 36.07 | $ | 20.06 | $ | 48.76 | ||||||
| Net Assets | $ | 103,325,600 | $ | 637,540 | $ | 31,146,685 | ||||||
| Shares of beneficial interest outstanding | 2,864,822 | 31,785 | 638,811 | |||||||||
| (a) | Redemption price per share may be reduced for any applicable contingent deferred sales charge. For a description of a possible sales charge, please see the Funds' Prospectus. |
See Notes to Financial Statements
| Annual Report | April 30, 2021 | 25 |
| Emerald Funds | Statements of Operations |
For the Year Ended April 30, 2021
| Emerald Growth Fund | Emerald Insights Fund | Emerald Banking and Finance Fund | ||||||||||
| INVESTMENT INCOME: | ||||||||||||
| Dividends | $ | 4,135,272 | $ | 83,520 | $ | 2,617,717 | ||||||
| Foreign taxes withheld | – | – | (16,144 | ) | ||||||||
| Total Investment Income | 4,135,272 | 83,520 | 2,601,573 | |||||||||
| EXPENSES: | ||||||||||||
| Investment advisory fee (Note 6) | 7,928,700 | 127,742 | 1,513,897 | |||||||||
| Administration fee | 599,476 | 29,623 | 86,764 | |||||||||
| Custodian fee | 119,864 | 5,014 | 18,431 | |||||||||
| Professional fees | 62,714 | 19,799 | 27,304 | |||||||||
| Transfer agent fee | 213,157 | 32,683 | 97,911 | |||||||||
| Delegated transfer agent equivalent services fees | ||||||||||||
| Class A | 2,670 | 10 | 2,674 | |||||||||
| Class C | 1,234 | – | 455 | |||||||||
| Institutional Class | 981 | – | 1,146 | |||||||||
| Investor Class | 697 | – | 8 | |||||||||
| Trustee fees and expenses | 83,998 | 1,009 | 9,848 | |||||||||
| Registration/filing fees | 73,523 | 38,582 | 55,060 | |||||||||
| Reports to shareholder and printing fees | 146,759 | 2,042 | 14,208 | |||||||||
| Distribution and service fees | ||||||||||||
| Class A | 562,805 | 49,061 | 173,297 | |||||||||
| Class C | 209,069 | 1,960 | 178,836 | |||||||||
| Institutional Class | 489,401 | 979 | 5,430 | |||||||||
| Investor Class | 361,178 | 1,163 | 72,188 | |||||||||
| Chief compliance officer fee | 65,618 | 775 | 7,091 | |||||||||
| Principal financial officer fee | 13,673 | 162 | 1,459 | |||||||||
| Other | 52,520 | 10,623 | 15,225 | |||||||||
| Total expenses before waiver | 10,988,037 | 321,227 | 2,281,232 | |||||||||
| Less fees waived/reimbursed by investment advisor (Note 6) | – | (96,677 | ) | – | ||||||||
| Total Net Expenses | 10,988,037 | 224,550 | 2,281,232 | |||||||||
| NET INVESTMENT INCOME/(LOSS): | (6,852,765 | ) | (141,030 | ) | 320,341 | |||||||
| REALIZED AND UNREALIZED GAIN/(LOSS) | ||||||||||||
| Net realized gain | 296,899,426 | 3,762,905 | 39,052,840 | |||||||||
| Net realized loss on foreign currency transactions | – | – | (813 | ) | ||||||||
| Net change in unrealized appreciation | 444,268,855 | 6,280,656 | 84,018,127 | |||||||||
| NET REALIZED AND UNREALIZED GAIN | 741,168,281 | 10,043,561 | 123,070,154 | |||||||||
| NET INCREASE IN NET ASSETS RESULTING FROM OPERATIONS | $ | 734,315,516 | $ | 9,902,531 | $ | 123,390,495 | ||||||
See Notes to Financial Statements.
| 26 | www.emeraldmutualfunds.com |
| Emerald Growth Fund | Statements of Changes in Net Assets |
| Year Ended April 30, 2021 | Year Ended April 30, 2020 | |||||||
| OPERATIONS: | ||||||||
| Net investment loss | $ | (6,852,765 | ) | $ | (5,075,445 | ) | ||
| Net realized gain | 296,899,426 | 52,160,088 | ||||||
| Net change in unrealized appreciation/(depreciation) | 444,268,855 | (170,182,635 | ) | |||||
| Net increase/(decrease) in net assets resulting from operations | 734,315,516 | (123,097,992 | ) | |||||
| DISTRIBUTIONS TO SHAREHOLDERS (NOTE 3): | ||||||||
| Total distributable earnings | ||||||||
| Class A | (13,666,137 | ) | (2,412,695 | ) | ||||
| Class C | (2,194,199 | ) | (414,806 | ) | ||||
| Institutional Class | (96,602,401 | ) | (14,304,031 | ) | ||||
| Investor Class | (8,118,942 | ) | (1,302,690 | ) | ||||
| Net decrease in net assets from distributions | (120,581,679 | ) | (18,434,222 | ) | ||||
| SHARE TRANSACTIONS (NOTE 5): | ||||||||
| Class A | ||||||||
| Proceeds from sale of shares | 19,352,881 | 18,378,097 | ||||||
| Issued to shareholders in reinvestment of distributions | 12,626,754 | 2,248,340 | ||||||
| Cost of shares redeemed | (69,910,425 | ) | (56,197,235 | ) | ||||
| Net decrease from share transactions | (37,930,790 | ) | (35,570,798 | ) | ||||
| Class C | ||||||||
| Proceeds from sale of shares | 864,961 | 210,912 | ||||||
| Issued to shareholders in reinvestment of distributions | 2,054,599 | 371,070 | ||||||
| Cost of shares redeemed | (6,483,354 | ) | (10,036,851 | ) | ||||
| Net decrease from share transactions | (3,563,794 | ) | (9,454,869 | ) | ||||
| Institutional Class | ||||||||
| Proceeds from sale of shares | 274,404,200 | 179,007,496 | ||||||
| Issued to shareholders in reinvestment of distributions | 85,932,473 | 12,854,869 | ||||||
| Cost of shares redeemed | (341,152,693 | ) | (268,196,365 | ) | ||||
| Net increase/(decrease) from share transactions | 19,183,980 | (76,334,000 | ) | |||||
| Investor Class | ||||||||
| Proceeds from sale of shares | 31,009,012 | 32,115,129 | ||||||
| Issued to shareholders in reinvestment of distributions | 2,575,557 | 421,168 | ||||||
| Cost of shares redeemed | (51,437,226 | ) | (47,153,166 | ) | ||||
| Net decrease from share transactions | (17,852,657 | ) | (14,616,869 | ) | ||||
| Net increase/(decrease) in net assets | $ | 573,570,576 | $ | (277,508,750 | ) | |||
| NET ASSETS: | ||||||||
| Beginning of year | 1,096,289,514 | 1,373,798,264 | ||||||
| End of year | $ | 1,669,860,090 | $ | 1,096,289,514 | ||||
| Annual Report | April 30, 2021 | 27 |
| Emerald Growth Fund | Statements of Changes in Net Assets |
| Year Ended April 30, 2021 | Year Ended April 30, 2020 | |||||||
| Other Information: | ||||||||
| SHARE TRANSACTIONS: | ||||||||
| Class A | ||||||||
| Sold | 605,025 | 759,108 | ||||||
| Distributions reinvested | 378,160 | 86,708 | ||||||
| Redeemed | (2,187,314 | ) | (2,267,968 | ) | ||||
| Net decrease in shares outstanding | (1,204,129 | ) | (1,422,152 | ) | ||||
| Class C | ||||||||
| Sold | 32,566 | 10,641 | ||||||
| Distributions reinvested | 76,578 | 17,356 | ||||||
| Redeemed | (256,636 | ) | (497,436 | ) | ||||
| Net decrease in shares outstanding | (147,492 | ) | (469,439 | ) | ||||
| Institutional Class | ||||||||
| Sold | 8,102,545 | 7,079,612 | ||||||
| Distributions reinvested | 2,439,877 | 473,301 | ||||||
| Redeemed | (10,344,813 | ) | (10,537,250 | ) | ||||
| Net increase/(decrease) in shares outstanding | 197,609 | (2,984,337 | ) | |||||
| Investor Class | ||||||||
| Sold | 970,483 | 1,422,635 | ||||||
| Distributions reinvested | 77,600 | 16,324 | ||||||
| Redeemed | (1,702,349 | ) | (1,954,727 | ) | ||||
| Net decrease in shares outstanding | (654,266 | ) | (515,768 | ) | ||||
See Notes to Financial Statements.
| 28 | www.emeraldmutualfunds.com |
| Emerald Insights Fund | Statements of Changes in Net Assets |
| Year Ended April 30, 2021 | Year Ended April 30, 2020 | |||||||
| OPERATIONS: | ||||||||
| Net investment loss | $ | (141,030 | ) | $ | (91,605 | ) | ||
| Net realized gain | 3,762,905 | 364,684 | ||||||
| Net change in unrealized appreciation | 6,280,656 | 362,126 | ||||||
| Net increase in net assets resulting from operations | 9,902,531 | 635,205 | ||||||
| DISTRIBUTIONS TO SHAREHOLDERS (NOTE 3): | ||||||||
| Total distributable earnings | ||||||||
| Class A | (1,316,553 | ) | (3,964 | ) | ||||
| Class C | (19,060 | ) | (58 | ) | ||||
| Institutional Class | (242,920 | ) | (533 | ) | ||||
| Investor Class | (39,637 | ) | (23 | ) | ||||
| Net decrease in net assets from distributions | (1,618,170 | ) | (4,578 | ) | ||||
| SHARE TRANSACTIONS (NOTE 5): | ||||||||
| Class A | ||||||||
| Proceeds from sale of shares | 618,119 | 1,751,000 | ||||||
| Issued to shareholders in reinvestment of distributions | 1,312,730 | 3,951 | ||||||
| Cost of shares redeemed | (1,327,067 | ) | (1,534,181 | ) | ||||
| Net increase from share transactions | 603,782 | 220,770 | ||||||
| Class C | ||||||||
| Proceeds from sale of shares | 5,190 | 5,000 | ||||||
| Issued to shareholders in reinvestment of distributions | 19,060 | 58 | ||||||
| Cost of shares redeemed | (8,947 | ) | (14,558 | ) | ||||
| Net increase/(decrease) from share transactions | 15,303 | (9,500 | ) | |||||
| Institutional Class | ||||||||
| Proceeds from sale of shares | 948,567 | 91,854 | ||||||
| Issued to shareholders in reinvestment of distributions | 242,920 | 533 | ||||||
| Cost of shares redeemed | (148,881 | ) | (95,563 | ) | ||||
| Net increase/(decrease) from share transactions | 1,042,606 | (3,176 | ) | |||||
| Investor Class | ||||||||
| Proceeds from sale of shares | 145,128 | 230,200 | ||||||
| Issued to shareholders in reinvestment of distributions | 39,637 | 23 | ||||||
| Cost of shares redeemed | (19,070 | ) | (117,483 | ) | ||||
| Net increase from share transactions | 165,695 | 112,740 | ||||||
| Net increase in net assets | $ | 10,111,747 | $ | 951,461 | ||||
| NET ASSETS: | ||||||||
| Beginning of year | 12,048,009 | 11,096,548 | ||||||
| End of year | $ | 22,159,756 | $ | 12,048,009 | ||||
| Annual Report | April 30, 2021 | 29 |
| Emerald Insights Fund | Statements of Changes in Net Assets |
| Year Ended April 30, 2021 | Year Ended April 30, 2020 | |||||||
| Other Information: | ||||||||
| SHARE TRANSACTIONS: | ||||||||
| Class A | ||||||||
| Sold | 36,650 | 154,193 | ||||||
| Distributions reinvested | 77,630 | 320 | ||||||
| Redeemed | (79,668 | ) | (132,867 | ) | ||||
| Net increase in shares outstanding | 34,612 | 21,646 | ||||||
| Class C | ||||||||
| Sold | 408 | 457 | ||||||
| Distributions reinvested | 1,193 | 5 | ||||||
| Redeemed | (564 | ) | (1,352 | ) | ||||
| Net increase/(decrease) in shares outstanding | 1,037 | (890 | ) | |||||
| Institutional Class | ||||||||
| Sold | 54,085 | 7,672 | ||||||
| Distributions reinvested | 14,042 | 42 | ||||||
| Redeemed | (9,331 | ) | (7,842 | ) | ||||
| Net increase/(decrease) in shares outstanding | 58,796 | (128 | ) | |||||
| Investor Class | ||||||||
| Sold | 7,913 | 17,898 | ||||||
| Distributions reinvested | 2,358 | 2 | ||||||
| Redeemed | (1,166 | ) | (10,453 | ) | ||||
| Net increase in shares outstanding | 9,105 | 7,447 | ||||||
See Notes to Financial Statements.
| 30 | www.emeraldmutualfunds.com |
| Emerald Banking and Finance Fund | Statements of Changes in Net Assets |
| Year Ended April 30, 2021 | Year Ended April 30, 2020 | |||||||
| OPERATIONS: | ||||||||
| Net investment income | $ | 320,341 | $ | 10 | ||||
| Net realized gain/(loss) | 39,052,840 | (28,209,958 | ) | |||||
| Net realized gain/(loss) on foreign currency transactions | (813 | ) | 359 | |||||
| Net change in unrealized appreciation/(depreciation) | 84,018,127 | (43,340,341 | ) | |||||
| Net increase/(decrease) in net assets resulting from operations | 123,390,495 | (71,549,930 | ) | |||||
| SHARE TRANSACTIONS (NOTE 5): | ||||||||
| Class A | ||||||||
| Proceeds from sale of shares | 19,739,265 | 9,924,216 | ||||||
| Cost of shares redeemed | (28,351,210 | ) | (43,496,877 | ) | ||||
| Net decrease from share transactions | (8,611,945 | ) | (33,572,661 | ) | ||||
| Class C | ||||||||
| Proceeds from sale of shares | 1,144,104 | 848,614 | ||||||
| Cost of shares redeemed | (9,871,670 | ) | (23,404,122 | ) | ||||
| Net decrease from share transactions | (8,727,566 | ) | (22,555,508 | ) | ||||
| Institutional Class | ||||||||
| Proceeds from sale of shares | 56,961,177 | 18,571,845 | ||||||
| Cost of shares redeemed | (45,515,680 | ) | (76,465,031 | ) | ||||
| Net increase/(decrease) from share transactions | 11,445,497 | (57,893,186 | ) | |||||
| Investor Class | ||||||||
| Proceeds from sale of shares | 18,972,772 | 2,109,542 | ||||||
| Cost of shares redeemed | (16,898,004 | ) | (20,635,594 | ) | ||||
| Net increase/(decrease) from share transactions | 2,074,768 | (18,526,052 | ) | |||||
| Net increase/(decrease) in net assets | $ | 119,571,249 | $ | (204,097,337 | ) | |||
| NET ASSETS: | ||||||||
| Beginning of year | 137,567,579 | 341,664,916 | ||||||
| End of year | $ | 257,138,828 | $ | 137,567,579 | ||||
| Other Information: | ||||||||
| SHARE TRANSACTIONS: | ||||||||
| Class A | ||||||||
| Sold | 461,760 | 381,365 | ||||||
| Redeemed | (784,736 | ) | (1,392,033 | ) | ||||
| Net decrease in shares outstanding | (322,976 | ) | (1,010,668 | ) | ||||
| Class C | ||||||||
| Sold | 33,095 | 33,899 | ||||||
| Redeemed | (382,608 | ) | (963,709 | ) | ||||
| Net decrease in shares outstanding | (349,513 | ) | (929,810 | ) | ||||
| Institutional Class | ||||||||
| Sold | 1,239,715 | 578,457 | ||||||
| Redeemed | (1,565,944 | ) | (2,567,059 | ) | ||||
| Net decrease in shares outstanding | (326,229 | ) | (1,988,602 | ) | ||||
| Investor Class | ||||||||
| Sold | 413,529 | 75,069 | ||||||
| Redeemed | (489,082 | ) | (698,446 | ) | ||||
| Net decrease in shares outstanding | (75,553 | ) | (623,377 | ) | ||||
See Notes to Financial Statements.
| Annual Report | April 30, 2021 | 31 |
| Emerald Growth Fund | Financial Highlights |
For a share outstanding throughout the years presented
| CLASS A | ||||||||||||||||||||
| Year Ended April 30, 2021 | Year Ended April 30, 2020 | Year Ended April 30, 2019 | Year Ended April 30, 2018 | Year Ended April 30, 2017 | ||||||||||||||||
| NET ASSET VALUE, BEGINNING OF PERIOD | $ | 23.06 | $ | 26.00 | $ | 25.99 | $ | 21.83 | $ | 17.52 | ||||||||||
| INCOME/(LOSS) FROM OPERATIONS: | ||||||||||||||||||||
| Net investment loss(a) | (0.22 | ) | (0.16 | ) | (0.13 | ) | (0.16 | ) | (0.11 | ) | ||||||||||
| Net realized and unrealized gain/(loss) on investments | 16.30 | (2.40 | ) | 2.61 | 4.32 | 4.42 | ||||||||||||||
| Total from Investment Operations | 16.08 | (2.56 | ) | 2.48 | 4.16 | 4.31 | ||||||||||||||
| LESS DISTRIBUTIONS: | ||||||||||||||||||||
| From capital gains | (2.85 | ) | (0.38 | ) | (2.47 | ) | – | – | ||||||||||||
| Total Distributions | (2.85 | ) | (0.38 | ) | (2.47 | ) | – | – | ||||||||||||
| NET INCREASE/(DECREASE) IN NET ASSET VALUE | 13.23 | (2.94 | ) | 0.01 | 4.16 | 4.31 | ||||||||||||||
| NET ASSET VALUE, END OF PERIOD | $ | 36.29 | $ | 23.06 | $ | 26.00 | $ | 25.99 | $ | 21.83 | ||||||||||
| TOTAL RETURN(b) | 70.77 | % | (10.00 | )% | 11.79 | % | 19.06 | % | 24.60 | % | ||||||||||
| RATIOS/SUPPLEMENTAL DATA: | ||||||||||||||||||||
| Net Assets, End of Period (000s) | $ | 168,322 | $ | 134,755 | $ | 188,883 | $ | 239,316 | $ | 270,389 | ||||||||||
| RATIOS TO AVERAGE NET ASSETS: | ||||||||||||||||||||
| Net Investment loss | (0.72 | )% | (0.64 | )% | (0.50 | )% | (0.64 | )% | (0.57 | )% | ||||||||||
| Operating expenses excluding reimbursement/waiver | 1.01 | % | 1.02 | % | 1.01 | % | 1.03 | % | 1.08 | % | ||||||||||
| Operating expenses including reimbursement/waiver | 1.01 | % | 1.02 | % | 1.01 | % | 1.03 | % | 1.08 | % | ||||||||||
| PORTFOLIO TURNOVER RATE | 66 | % | 48 | % | 64 | % | 66 | % | 54 | % | ||||||||||
| (a) | Per share amounts are based upon average shares outstanding. |
| (b) | Total return does not reflect the effect of sales charges. |
See Notes to Financial Statements.
| 32 | www.emeraldmutualfunds.com |
| Emerald Growth Fund | Financial Highlights |
For a share outstanding throughout the years presented
| CLASS C | ||||||||||||||||||||
| Year Ended April 30, 2021 | Year Ended April 30, 2020 | Year Ended April 30, 2019 | Year Ended April 30, 2018 | Year Ended April 30, 2017 | ||||||||||||||||
| NET ASSET VALUE, BEGINNING OF PERIOD | $ | 18.97 | $ | 21.59 | $ | 22.18 | $ | 18.75 | $ | 15.14 | ||||||||||
| INCOME/(LOSS) FROM OPERATIONS: | ||||||||||||||||||||
| Net investment loss(a) | (0.35 | ) | (0.27 | ) | (0.26 | ) | (0.27 | ) | (0.21 | ) | ||||||||||
| Net realized and unrealized gain/(loss) on investments | 13.32 | (1.97 | ) | 2.14 | 3.70 | 3.82 | ||||||||||||||
| Total from Investment Operations | 12.97 | (2.24 | ) | 1.88 | 3.43 | 3.61 | ||||||||||||||
| LESS DISTRIBUTIONS: | ||||||||||||||||||||
| From capital gains | (2.85 | ) | (0.38 | ) | (2.47 | ) | – | – | ||||||||||||
| Total Distributions | (2.85 | ) | (0.38 | ) | (2.47 | ) | – | – | ||||||||||||
| NET INCREASE/(DECREASE) IN NET ASSET VALUE | 10.12 | (2.62 | ) | (0.59 | ) | 3.43 | 3.61 | |||||||||||||
| NET ASSET VALUE, END OF PERIOD | $ | 29.09 | $ | 18.97 | $ | 21.59 | $ | 22.18 | $ | 18.75 | ||||||||||
| TOTAL RETURN(b) | 69.60 | % | (10.57 | )% | 11.08 | % | 18.29 | % | 23.84 | % | ||||||||||
| RATIOS/SUPPLEMENTAL DATA: | ||||||||||||||||||||
| Net Assets, End of Period (000s) | $ | 22,447 | $ | 17,434 | $ | 29,975 | $ | 33,197 | $ | 34,642 | ||||||||||
| RATIOS TO AVERAGE NET ASSETS: | ||||||||||||||||||||
| Net Investment loss | (1.37 | )% | (1.29 | )% | (1.15 | )% | (1.30 | )% | (1.22 | )% | ||||||||||
| Operating expenses excluding reimbursement/waiver | 1.66 | % | 1.68 | % | 1.66 | % | 1.68 | % | 1.73 | % | ||||||||||
| Operating expenses including reimbursement/waiver | 1.66 | % | 1.68 | % | 1.66 | % | 1.68 | % | 1.73 | % | ||||||||||
| PORTFOLIO TURNOVER RATE | 66 | % | 48 | % | 64 | % | 66 | % | 54 | % | ||||||||||
| (a) | Per share amounts are based upon average shares outstanding. |
| (b) | Total return does not reflect the effect of sales charges. |
See Notes to Financial Statements.
| Annual Report | April 30, 2021 | 33 |
| Emerald Growth Fund | Financial Highlights |
For a share outstanding throughout the years presented
| INSTITUTIONAL CLASS | ||||||||||||||||||||
| Year Ended April 30, 2021 | Year Ended April 30, 2020 | Year Ended April 30, 2019 | Year Ended April 30, 2018 | Year Ended April 30, 2017 | ||||||||||||||||
| NET ASSET VALUE, BEGINNING OF PERIOD | $ | 24.18 | $ | 27.16 | $ | 26.94 | $ | 22.56 | $ | 18.04 | ||||||||||
| INCOME/(LOSS) FROM OPERATIONS: | ||||||||||||||||||||
| Net investment loss(a) | (0.13 | ) | (0.08 | ) | (0.05 | ) | (0.09 | ) | (0.05 | ) | ||||||||||
| Net realized and unrealized gain/(loss) on investments | 17.12 | (2.52 | ) | 2.74 | 4.47 | 4.57 | ||||||||||||||
| Total from Investment Operations | 16.99 | (2.60 | ) | 2.69 | 4.38 | 4.52 | ||||||||||||||
| LESS DISTRIBUTIONS: | ||||||||||||||||||||
| From capital gains | (2.85 | ) | (0.38 | ) | (2.47 | ) | – | – | ||||||||||||
| Total Distributions | (2.85 | ) | (0.38 | ) | (2.47 | ) | – | – | ||||||||||||
| NET INCREASE/(DECREASE) IN NET ASSET VALUE | 14.14 | (2.98 | ) | 0.22 | 4.38 | 4.52 | ||||||||||||||
| NET ASSET VALUE, END OF PERIOD | $ | 38.32 | $ | 24.18 | $ | 27.16 | $ | 26.94 | $ | 22.56 | ||||||||||
| TOTAL RETURN | 71.27 | % | (9.72 | )% | 12.17 | % | 19.41 | % | 25.06 | % | ||||||||||
| RATIOS/SUPPLEMENTAL DATA: | ||||||||||||||||||||
| Net Assets, End of Period (000s) | $ | 1,375,765 | $ | 863,360 | $ | 1,050,538 | $ | 839,076 | $ | 596,550 | ||||||||||
| RATIOS TO AVERAGE NET ASSETS: | ||||||||||||||||||||
| Net Investment loss | (0.41 | )% | (0.32 | )% | (0.18 | )% | (0.33 | )% | (0.26 | )% | ||||||||||
| Operating expenses excluding reimbursement/waiver | 0.70 | % | 0.70 | % | 0.69 | % | 0.72 | % | 0.77 | % | ||||||||||
| Operating expenses including reimbursement/waiver | 0.70 | % | 0.70 | % | 0.69 | % | 0.72 | % | 0.77 | % | ||||||||||
| PORTFOLIO TURNOVER RATE | 66 | % | 48 | % | 64 | % | 66 | % | 54 | % | ||||||||||
| (a) | Per share amounts are based upon average shares outstanding. |
See Notes to Financial Statements.
| 34 | www.emeraldmutualfunds.com |
| Emerald Growth Fund | Financial Highlights |
For a share outstanding throughout the years presented
| INVESTOR CLASS | ||||||||||||||||||||
| Year Ended April 30, 2021 | Year Ended April 30, 2020 | Year Ended April 30, 2019 | Year Ended April 30, 2018 | Year Ended April 30, 2017 | ||||||||||||||||
| NET ASSET VALUE, BEGINNING OF PERIOD | $ | 22.94 | $ | 25.88 | $ | 25.88 | $ | 21.75 | $ | 17.46 | ||||||||||
| INCOME/(LOSS) FROM OPERATIONS: | ||||||||||||||||||||
| Net investment loss(a) | (0.23 | ) | (0.17 | ) | (0.14 | ) | (0.17 | ) | (0.12 | ) | ||||||||||
| Net realized and unrealized gain/(loss) on investments | 16.21 | (2.39 | ) | 2.61 | 4.30 | 4.41 | ||||||||||||||
| Total from Investment Operations | 15.98 | (2.56 | ) | 2.47 | 4.13 | 4.29 | ||||||||||||||
| LESS DISTRIBUTIONS: | ||||||||||||||||||||
| From capital gains | (2.85 | ) | (0.38 | ) | (2.47 | ) | – | – | ||||||||||||
| Total Distributions | (2.85 | ) | (0.38 | ) | (2.47 | ) | – | – | ||||||||||||
| NET INCREASE/(DECREASE) IN NET ASSET VALUE | 13.13 | (2.94 | ) | 0.00 | 4.13 | 4.29 | ||||||||||||||
| NET ASSET VALUE, END OF PERIOD | $ | 36.07 | $ | 22.94 | $ | 25.88 | $ | 25.88 | $ | 21.75 | ||||||||||
| TOTAL RETURN | 70.71 | % | (10.05 | )% | 11.81 | % | 18.99 | % | 24.57 | % | ||||||||||
| RATIOS/SUPPLEMENTAL DATA: | ||||||||||||||||||||
| Net Assets, End of Period (000s) | $ | 103,326 | $ | 80,740 | $ | 104,403 | $ | 107,629 | $ | 114,033 | ||||||||||
| RATIOS TO AVERAGE NET ASSETS: | ||||||||||||||||||||
| Net Investment loss | (0.75 | )% | (0.68 | )% | (0.53 | )% | (0.68 | )% | (0.61 | )% | ||||||||||
| Operating expenses excluding reimbursement/waiver | 1.05 | % | 1.06 | % | 1.04 | % | 1.07 | % | 1.12 | % | ||||||||||
| Operating expenses including reimbursement/waiver | 1.05 | % | 1.06 | % | 1.04 | % | 1.07 | % | 1.12 | % | ||||||||||
| PORTFOLIO TURNOVER RATE | 66 | % | 48 | % | 64 | % | 66 | % | 54 | % | ||||||||||
| (a) | Per share amounts are based upon average shares outstanding. |
See Notes to Financial Statements.
| Annual Report | April 30, 2021 | 35 |
| Emerald Insights Fund | Financial Highlights |
For a share outstanding throughout the years presented
| CLASS A | ||||||||||||||||||||
| Year Ended April 30, 2021 | Year Ended April 30, 2020 | Year Ended April 30, 2019 | Year Ended April 30, 2018 | Year Ended April 30, 2017 | ||||||||||||||||
| NET ASSET VALUE, BEGINNING OF PERIOD | $ | 12.13 | $ | 11.51 | $ | 13.09 | $ | 11.33 | $ | 9.69 | ||||||||||
| INCOME/(LOSS) FROM OPERATIONS: | ||||||||||||||||||||
| Net investment loss(a) | (0.14 | ) | (0.10 | ) | (0.09 | ) | (0.07 | ) | (0.06 | ) | ||||||||||
| Net realized and unrealized gain on investments | 9.80 | 0.72 | 1.04 | 1.83 | 1.70 | |||||||||||||||
| Total from Investment Operations | 9.66 | 0.62 | 0.95 | 1.76 | 1.64 | |||||||||||||||
| LESS DISTRIBUTIONS: | ||||||||||||||||||||
| From capital gains | (1.61 | ) | 0.00 | (b) | (2.53 | ) | – | – | ||||||||||||
| Total Distributions | (1.61 | ) | – | (2.53 | ) | – | – | |||||||||||||
| NET INCREASE/(DECREASE) IN NET ASSET VALUE | 8.05 | 0.62 | (1.58 | ) | 1.76 | 1.64 | ||||||||||||||
| NET ASSET VALUE, END OF PERIOD | $ | 20.18 | $ | 12.13 | $ | 11.51 | $ | 13.09 | $ | 11.33 | ||||||||||
| TOTAL RETURN(c) | 82.17 | % | 5.43 | % | 11.53 | % | 15.53 | % | 16.92 | % | ||||||||||
| RATIOS/SUPPLEMENTAL DATA: | ||||||||||||||||||||
| Net Assets, End of Period (000s) | $ | 17,618 | $ | 10,174 | $ | 9,397 | $ | 9,321 | $ | 10,127 | ||||||||||
| RATIOS TO AVERAGE NET ASSETS: | ||||||||||||||||||||
| Net Investment loss | (0.86 | %) | (0.83 | %) | (0.71 | %) | (0.58 | %) | (0.57 | %) | ||||||||||
| Operating expenses excluding reimbursement/waiver | 1.92 | % | 2.25 | % | 2.18 | % | 2.10 | % | 2.10 | % | ||||||||||
| Operating expenses including reimbursement/waiver | 1.35 | % | 1.35 | % | 1.35 | % | 1.35 | % | 1.35 | % | ||||||||||
| PORTFOLIO TURNOVER RATE | 89 | % | 94 | % | 63 | % | 138 | % | 75 | % | ||||||||||
| (a) | Per share amounts are based upon average shares outstanding. |
| (b) | Less than $(0.005) per share. |
| (c) | Total return does not reflect the effect of sales charges. |
See Notes to Financial Statements.
| 36 | www.emeraldmutualfunds.com |
| Emerald Insights Fund | Financial Highlights |
For a share outstanding throughout the years presented
| CLASS C | ||||||||||||||||||||
| Year Ended April 30, 2021 | Year Ended April 30, 2020 | Year Ended April 30, 2019 | Year Ended April 30, 2018 | Year Ended April 30, 2017 | ||||||||||||||||
| NET ASSET VALUE, BEGINNING OF PERIOD | $ | 11.57 | $ | 11.04 | $ | 12.75 | $ | 11.11 | $ | 9.56 | ||||||||||
| INCOME/(LOSS) FROM OPERATIONS: | ||||||||||||||||||||
| Net investment loss(a) | (0.24 | ) | (0.16 | ) | (0.16 | ) | (0.15 | ) | (0.13 | ) | ||||||||||
| Net realized and unrealized gain on investments | 9.30 | 0.69 | 0.98 | 1.79 | 1.68 | |||||||||||||||
| Total from Investment Operations | 9.06 | 0.53 | 0.82 | 1.64 | 1.55 | |||||||||||||||
| LESS DISTRIBUTIONS: | ||||||||||||||||||||
| From capital gains | (1.61 | ) | 0.00 | (b) | (2.53 | ) | – | – | ||||||||||||
| Total Distributions | (1.61 | ) | – | (2.53 | ) | – | – | |||||||||||||
| NET INCREASE/(DECREASE) IN NET ASSET VALUE | 7.45 | 0.53 | (1.71 | ) | 1.64 | 1.55 | ||||||||||||||
| NET ASSET VALUE, END OF PERIOD | $ | 19.02 | $ | 11.57 | $ | 11.04 | $ | 12.75 | $ | 11.11 | ||||||||||
| TOTAL RETURN(c) | 80.92 | % | 4.84 | % | 10.75 | % | 14.76 | % | 16.21 | % | ||||||||||
| RATIOS/SUPPLEMENTAL DATA: | ||||||||||||||||||||
| Net Assets, End of Period (000s) | $ | 246 | $ | 138 | $ | 141 | $ | 129 | $ | 112 | ||||||||||
| RATIOS TO AVERAGE NET ASSETS: | ||||||||||||||||||||
| Net Investment loss | (1.51 | %) | (1.48 | %) | (1.36 | %) | (1.24 | %) | (1.22 | %) | ||||||||||
| Operating expenses excluding reimbursement/waiver | 2.57 | % | 2.90 | % | 2.84 | % | 2.75 | % | 2.76 | % | ||||||||||
| Operating expenses including reimbursement/waiver | 2.00 | % | 2.00 | % | 2.00 | % | 2.00 | % | 2.00 | % | ||||||||||
| PORTFOLIO TURNOVER RATE | 89 | % | 94 | % | 63 | % | 138 | % | 75 | % | ||||||||||
| (a) | Per share amounts are based upon average shares outstanding. |
| (b) | Less than $(0.005) per share. |
| (c) | Total return does not reflect the effect of sales charges. |
See Notes to Financial Statements.
| Annual Report | April 30, 2021 | 37 |
| Emerald Insights Fund | Financial Highlights |
For a share outstanding throughout the years presented
| INSTITUTIONAL CLASS | ||||||||||||||||||||
| Year Ended April 30, 2021 | Year Ended April 30, 2020 | Year Ended April 30, 2019 | Year Ended April 30, 2018 | Year Ended April 30, 2017 | ||||||||||||||||
| NET ASSET VALUE, BEGINNING OF PERIOD | $ | 12.37 | $ | 11.69 | $ | 13.22 | $ | 11.41 | $ | 9.73 | ||||||||||
| INCOME/(LOSS) FROM OPERATIONS: | ||||||||||||||||||||
| Net investment loss(a) | (0.10 | ) | (0.06 | ) | (0.05 | ) | (0.04 | ) | (0.03 | ) | ||||||||||
| Net realized and unrealized gain on investments | 10.01 | 0.74 | 1.05 | 1.85 | 1.71 | |||||||||||||||
| Total from Investment Operations | 9.91 | 0.68 | 1.00 | 1.81 | 1.68 | |||||||||||||||
| LESS DISTRIBUTIONS: | ||||||||||||||||||||
| From capital gains | (1.61 | ) | 0.00 | (b) | (2.53 | ) | – | – | ||||||||||||
| Total Distributions | (1.61 | ) | – | (2.53 | ) | – | – | |||||||||||||
| NET INCREASE/(DECREASE) IN NET ASSET VALUE | 8.30 | 0.68 | (1.53 | ) | 1.81 | 1.68 | ||||||||||||||
| NET ASSET VALUE, END OF PERIOD | $ | 20.67 | $ | 12.37 | $ | 11.69 | $ | 13.22 | $ | 11.41 | ||||||||||
| TOTAL RETURN | 82.62 | % | 5.85 | % | 11.81 | % | 15.86 | % | 17.27 | % | ||||||||||
| RATIOS/SUPPLEMENTAL DATA: | ||||||||||||||||||||
| Net Assets, End of Period (000s) | $ | 3,658 | $ | 1,462 | $ | 1,383 | $ | 1,228 | $ | 1,048 | ||||||||||
| RATIOS TO AVERAGE NET ASSETS: | ||||||||||||||||||||
| Net Investment loss | (0.57 | %) | (0.53 | %) | (0.41 | %) | (0.29 | %) | (0.28 | %) | ||||||||||
| Operating expenses excluding reimbursement/waiver | 1.60 | % | 1.93 | % | 1.87 | % | 1.77 | % | 1.78 | % | ||||||||||
| Operating expenses including reimbursement/waiver | 1.05 | % | 1.05 | % | 1.05 | % | 1.05 | % | 1.05 | % | ||||||||||
| PORTFOLIO TURNOVER RATE | 89 | % | 94 | % | 63 | % | 138 | % | 75 | % | ||||||||||
| (a) | Per share amounts are based upon average shares outstanding. |
| (b) | Less than $(0.005) per share. |
See Notes to Financial Statements.
| 38 | www.emeraldmutualfunds.com |
| Emerald Insights Fund | Financial Highlights |
For a share outstanding throughout the years presented
| INVESTOR CLASS | ||||||||||||||||||||
| Year Ended April 30, 2021 | Year Ended April 30, 2020 | Year Ended April 30, 2019 | Year Ended April 30, 2018 | Year Ended April 30, 2017 | ||||||||||||||||
| NET ASSET VALUE, BEGINNING OF PERIOD | $ | 12.07 | $ | 11.45 | $ | 13.05 | $ | 11.29 | $ | 9.67 | ||||||||||
| INCOME/(LOSS) FROM OPERATIONS: | ||||||||||||||||||||
| Net investment loss(a) | (0.15 | ) | (0.09 | ) | (0.10 | ) | (0.08 | ) | (0.07 | ) | ||||||||||
| Net realized and unrealized gain on investments | 9.75 | 0.71 | 1.03 | 1.84 | 1.69 | |||||||||||||||
| Total from Investment Operations | 9.60 | 0.62 | 0.93 | 1.76 | 1.62 | |||||||||||||||
| LESS DISTRIBUTIONS: | ||||||||||||||||||||
| From capital gains | (1.61 | ) | 0.00 | (b) | (2.53 | ) | – | – | ||||||||||||
| Total Distributions | (1.61 | ) | – | (2.53 | ) | – | – | |||||||||||||
| NET INCREASE/(DECREASE) IN NET ASSET VALUE | 7.99 | 0.62 | (1.60 | ) | 1.76 | 1.62 | ||||||||||||||
| NET ASSET VALUE, END OF PERIOD | $ | 20.06 | $ | 12.07 | $ | 11.45 | $ | 13.05 | $ | 11.29 | ||||||||||
| TOTAL RETURN | 82.08 | % | 5.45 | % | 11.41 | % | 15.59 | % | 16.75 | % | ||||||||||
| RATIOS/SUPPLEMENTAL DATA: | ||||||||||||||||||||
| Net Assets, End of Period (000s) | $ | 638 | $ | 274 | $ | 174 | $ | 126 | $ | 88 | ||||||||||
| RATIOS TO AVERAGE NET ASSETS: | ||||||||||||||||||||
| Net Investment loss | (0.91 | %) | (0.82 | %) | (0.77 | %) | (0.65 | %) | (0.63 | %) | ||||||||||
| Operating expenses excluding reimbursement/waiver | 1.86 | % | 2.17 | % | 2.08 | % | 2.07 | % | 2.09 | % | ||||||||||
| Operating expenses including reimbursement/waiver | 1.40 | % | 1.40 | % | 1.40 | % | 1.40 | % | 1.40 | % | ||||||||||
| PORTFOLIO TURNOVER RATE | 89 | % | 94 | % | 63 | % | 138 | % | 75 | % | ||||||||||
| (a) | Per share amounts are based upon average shares outstanding. |
| (b) | Less than $(0.005) per share. |
See Notes to Financial Statements.
| Annual Report | April 30, 2021 | 39 |
| Emerald Banking and Finance Fund | Financial Highlights |
For a share outstanding throughout the years presented
| CLASS A | ||||||||||||||||||||
| Year Ended April 30, 2021 | Year Ended April 30, 2020 | Year Ended April 30, 2019 | Year Ended April 30, 2018 | Year Ended April 30, 2017 | ||||||||||||||||
| NET ASSET VALUE, BEGINNING OF PERIOD | $ | 22.89 | $ | 32.71 | $ | 46.01 | $ | 41.61 | $ | 31.27 | ||||||||||
| INCOME/(LOSS) FROM OPERATIONS: | ||||||||||||||||||||
| Net investment income/(loss)(a) | 0.06 | (0.03 | ) | (0.24 | ) | (0.29 | ) | (0.17 | ) | |||||||||||
| Net realized and unrealized gain/(loss) on investments | 28.61 | (9.79 | ) | (5.35 | ) | 5.98 | 10.51 | |||||||||||||
| Total from Investment Operations | 28.67 | (9.82 | ) | (5.59 | ) | 5.69 | 10.34 | |||||||||||||
| LESS DISTRIBUTIONS: | ||||||||||||||||||||
| From capital gains | – | – | (7.71 | ) | (1.29 | ) | – | |||||||||||||
| Total Distributions | – | – | (7.71 | ) | (1.29 | ) | – | |||||||||||||
| NET INCREASE/(DECREASE) IN NET ASSET VALUE | 28.67 | (9.82 | ) | (13.30 | ) | 4.40 | 10.34 | |||||||||||||
| NET ASSET VALUE, END OF PERIOD | $ | 51.56 | $ | 22.89 | $ | 32.71 | $ | 46.01 | $ | 41.61 | ||||||||||
| TOTAL RETURN(b) | 125.21 | % | (30.02 | )% | (10.65 | )% | 13.59 | % | 33.07 | % | ||||||||||
| RATIOS/SUPPLEMENTAL DATA: | ||||||||||||||||||||
| Net Assets, End of Period (000s) | $ | 68,778 | $ | 37,933 | $ | 87,267 | $ | 172,338 | $ | 172,106 | ||||||||||
| RATIOS TO AVERAGE NET ASSETS: | ||||||||||||||||||||
| Net Investment income/(loss) | 0.18 | % | (0.10 | )% | (0.58 | )% | (0.65 | )% | (0.46 | )% | ||||||||||
| Operating expenses excluding reimbursement/waiver | 1.53 | % | 1.48 | % | 1.42 | % | 1.41 | % | 1.43 | % | ||||||||||
| Operating expenses including reimbursement/waiver | 1.53 | % | 1.48 | % | 1.42 | % | 1.41 | % | 1.43 | % | ||||||||||
| PORTFOLIO TURNOVER RATE | 171 | % | 46 | % | 55 | % | 62 | % | 36 | % | ||||||||||
| (a) | Per share amounts are based upon average shares outstanding. |
| (b) | Total return does not reflect the effect of sales charges. |
See Notes to Financial Statements.
| 40 | www.emeraldmutualfunds.com |
| Emerald Banking and Finance Fund | Financial Highlights |
For a share outstanding throughout the years presented
| CLASS C | ||||||||||||||||||||
| Year Ended April 30, 2021 | Year Ended April 30, 2020 | Year Ended April 30, 2019 | Year Ended April 30, 2018 | Year Ended April 30, 2017 | ||||||||||||||||
| NET ASSET VALUE, BEGINNING OF PERIOD | $ | 19.38 | $ | 27.87 | $ | 40.83 | $ | 37.29 | $ | 28.20 | ||||||||||
| INCOME/(LOSS) FROM OPERATIONS: | ||||||||||||||||||||
| Net investment loss(a) | (0.11 | ) | (0.20 | ) | (0.44 | ) | (0.51 | ) | (0.36 | ) | ||||||||||
| Net realized and unrealized gain/(loss) on investments | 24.08 | (8.29 | ) | (4.81 | ) | 5.34 | 9.45 | |||||||||||||
| Total from Investment Operations | 23.97 | (8.49 | ) | (5.25 | ) | 4.83 | 9.09 | |||||||||||||
| LESS DISTRIBUTIONS: | ||||||||||||||||||||
| From capital gains | – | – | (7.71 | ) | (1.29 | ) | – | |||||||||||||
| Total Distributions | – | – | (7.71 | ) | (1.29 | ) | – | |||||||||||||
| NET INCREASE/(DECREASE) IN NET ASSET VALUE | 23.97 | (8.49 | ) | (12.96 | ) | 3.54 | 9.09 | |||||||||||||
| NET ASSET VALUE, END OF PERIOD | $ | 43.35 | $ | 19.38 | $ | 27.87 | $ | 40.83 | $ | 37.29 | ||||||||||
| TOTAL RETURN(b) | 123.68 | % | (30.46 | )% | (11.21 | )% | 12.85 | % | 32.23 | % | ||||||||||
| RATIOS/SUPPLEMENTAL DATA: | ||||||||||||||||||||
| Net Assets, End of Period (000s) | $ | 22,447 | $ | 16,804 | $ | 50,079 | $ | 78,988 | $ | 76,072 | ||||||||||
| RATIOS TO AVERAGE NET ASSETS: | ||||||||||||||||||||
| Net Investment loss | (0.40 | )% | (0.73 | )% | (1.23 | )% | (1.30 | )% | (1.11 | )% | ||||||||||
| Operating expenses excluding reimbursement/waiver | 2.18 | % | 2.13 | % | 2.07 | % | 2.06 | % | 2.08 | % | ||||||||||
| Operating expenses including reimbursement/waiver | 2.18 | % | 2.13 | % | 2.07 | % | 2.06 | % | 2.08 | % | ||||||||||
| PORTFOLIO TURNOVER RATE | 171 | % | 46 | % | 55 | % | 62 | % | 36 | % | ||||||||||
| (a) | Per share amounts are based upon average shares outstanding. |
| (b) | Total return does not reflect the effect of sales charges. |
See Notes to Financial Statements.
| Annual Report | April 30, 2021 | 41 |
| Emerald Banking and Finance Fund | Financial Highlights |
For a share outstanding throughout the years presented
| INSTITUTIONAL CLASS | ||||||||||||||||||||
| Year Ended April 30, 2021 | Year Ended April 30, 2020 | Year Ended April 30, 2019 | Year Ended April 30, 2018 | Year Ended April 30, 2017 | ||||||||||||||||
| NET ASSET VALUE, BEGINNING OF PERIOD | $ | 23.67 | $ | 33.70 | $ | 46.95 | $ | 42.30 | $ | 31.69 | ||||||||||
| INCOME/(LOSS) FROM OPERATIONS: | ||||||||||||||||||||
| Net investment income/(loss)(a) | 0.14 | 0.09 | (0.09 | ) | (0.15 | ) | (0.05 | ) | ||||||||||||
| Net realized and unrealized gain/(loss) on investments | 29.67 | (10.12 | ) | (5.45 | ) | 6.09 | 10.66 | |||||||||||||
| Total from Investment Operations | 29.81 | (10.03 | ) | (5.54 | ) | 5.94 | 10.61 | |||||||||||||
| LESS DISTRIBUTIONS: | ||||||||||||||||||||
| From capital gains | – | – | (7.71 | ) | (1.29 | ) | – | |||||||||||||
| Total Distributions | – | – | (7.71 | ) | (1.29 | ) | – | |||||||||||||
| NET INCREASE/(DECREASE) IN NET ASSET VALUE | 29.81 | (10.03 | ) | (13.25 | ) | 4.65 | 10.61 | |||||||||||||
| NET ASSET VALUE, END OF PERIOD | $ | 53.48 | $ | 23.67 | $ | 33.70 | $ | 46.95 | $ | 42.30 | ||||||||||
| TOTAL RETURN | 125.94 | % | (29.76 | )% | (10.30 | )% | 13.97 | % | 33.48 | % | ||||||||||
| RATIOS/SUPPLEMENTAL DATA: | ||||||||||||||||||||
| Net Assets, End of Period (000s) | $ | 134,767 | $ | 67,358 | $ | 162,910 | $ | 221,638 | $ | 134,027 | ||||||||||
| RATIOS TO AVERAGE NET ASSETS: | ||||||||||||||||||||
| Net Investment income/(loss) | 0.39 | % | 0.28 | % | (0.23 | )% | (0.34 | )% | (0.14 | )% | ||||||||||
| Operating expenses excluding reimbursement/waiver | 1.18 | % | 1.13 | % | 1.06 | % | 1.09 | % | 1.11 | % | ||||||||||
| Operating expenses including reimbursement/waiver | 1.18 | % | 1.13 | % | 1.06 | % | 1.09 | % | 1.11 | % | ||||||||||
| PORTFOLIO TURNOVER RATE | 171 | % | 46 | % | 55 | % | 62 | % | 36 | % | ||||||||||
| (a) | Per share amounts are based upon average shares outstanding. |
See Notes to Financial Statements.
| 42 | www.emeraldmutualfunds.com |
| Emerald Banking and Finance Fund | Financial Highlights |
For a share outstanding throughout the years presented
| INVESTOR CLASS | ||||||||||||||||||||
| Year Ended April 30, 2021 | Year Ended April 30, 2020 | Year Ended April 30, 2019 | Year Ended April 30, 2018 | Year Ended April 30, 2017 | ||||||||||||||||
| NET ASSET VALUE, BEGINNING OF PERIOD | $ | 21.66 | $ | 30.96 | $ | 44.05 | $ | 39.86 | $ | 29.95 | ||||||||||
| INCOME/(LOSS) FROM OPERATIONS: | ||||||||||||||||||||
| Net investment income/(loss)(a) | 0.03 | (0.04 | ) | (0.23 | ) | (0.25 | ) | (0.16 | ) | |||||||||||
| Net realized and unrealized gain/(loss) on investments | 27.07 | (9.26 | ) | (5.15 | ) | 5.73 | 10.07 | |||||||||||||
| Total from Investment Operations | 27.10 | (9.30 | ) | (5.38 | ) | 5.48 | 9.91 | |||||||||||||
| LESS DISTRIBUTIONS: | ||||||||||||||||||||
| From capital gains | – | – | (7.71 | ) | (1.29 | ) | – | |||||||||||||
| Total Distributions | – | – | (7.71 | ) | (1.29 | ) | – | |||||||||||||
| NET INCREASE/(DECREASE) IN NET ASSET VALUE | 27.10 | (9.30 | ) | (13.09 | ) | 4.19 | 9.91 | |||||||||||||
| NET ASSET VALUE, END OF PERIOD | $ | 48.76 | $ | 21.66 | $ | 30.96 | $ | 44.05 | $ | 39.86 | ||||||||||
| TOTAL RETURN | 125.07 | % | (30.04 | )% | (10.64 | )% | 13.67 | % | 33.09 | % | ||||||||||
| RATIOS/SUPPLEMENTAL DATA: | ||||||||||||||||||||
| Net Assets, End of Period (000s) | $ | 31,147 | $ | 15,472 | $ | 41,410 | $ | 71,236 | $ | 85,557 | ||||||||||
| RATIOS TO AVERAGE NET ASSETS: | ||||||||||||||||||||
| Net Investment income/(loss) | 0.11 | % | (0.12 | )% | (0.60 | )% | (0.60 | )% | (0.46 | )% | ||||||||||
| Operating expenses excluding reimbursement/waiver | 1.56 | % | 1.51 | % | 1.43 | % | 1.37 | % | 1.43 | % | ||||||||||
| Operating expenses including reimbursement/waiver | 1.56 | % | 1.51 | % | 1.43 | % | 1.37 | % | 1.43 | % | ||||||||||
| PORTFOLIO TURNOVER RATE | 171 | % | 46 | % | 55 | % | 62 | % | 36 | % | ||||||||||
| (a) | Per share amounts are based upon average shares outstanding. |
See Notes to Financial Statements.
| Annual Report | April 30, 2021 | 43 |
| Emerald Funds | Notes to Financial Statements |
April 30, 2021
1. ORGANIZATION
Financial Investors Trust (the “Trust”), a Delaware statutory trust, is an open-end management investment company registered under the Investment Company Act of 1940, as amended (the “1940 Act”). The Trust consists of multiple separate portfolios or series. This annual report describes the Emerald Growth Fund, Emerald Insights Fund, and Emerald Banking and Finance Fund (each a “Fund” and collectively, the “Funds”).
The Emerald Growth Fund and Emerald Insights Fund seek to achieve long-term growth through capital appreciation. The Emerald Banking and Finance Fund seeks to achieve long-term growth through capital appreciation with income as a secondary objective.
2. SIGNIFICANT ACCOUNTING POLICIES
The accompanying financial statements were prepared in accordance with accounting principles generally accepted in the United States of America (“U.S. GAAP”). The preparation of financial statements in conformity with U.S. GAAP requires management to make certain estimates and assumptions that affect the reported amounts of assets and liabilities and disclosures of contingent assets and liabilities at the date of the financial statements and the reported amounts of revenue and expenses during the period. Actual results could differ from those estimates. The Funds are considered an investment company for financial reporting purposes under U.S. GAAP and follows the accounting and reporting guidance applicable to investment companies in the Financial Accounting Standards Board Accounting Standards Codification Topic 946. The following is a summary of significant accounting policies consistently followed by the Funds in preparation of their financial statements.
Investment Valuation: The Funds generally value their securities based on market prices determined at the close of regular trading on the New York Stock Exchange (“NYSE”), normally, 4:00 p.m. Eastern Time, on each business day the NYSE is open for trading.
For equity securities and mutual funds that are traded on an exchange, the market price is usually the closing sale or official closing price on that exchange. In the case of equity securities not traded on an exchange, or if such closing prices are not otherwise available, the securities are valued at the mean of the most recent bid and ask prices on such day. Redeemable securities issued by open-end registered investment companies are valued at the investment company’s applicable net asset value, with the exception of exchange-traded open-end investment companies, which are priced as equity securities.
The market price for debt obligations is generally the price supplied by an independent third-party pricing service approved by the Board of Trustees of the Trust (the “Board” or the “Trustees”), which may use a matrix, formula or other objective method that takes into consideration quotations from dealers, market transactions in comparable investments, market indices and yield curves. If vendors are unable to supply a price, or if the price supplied is deemed to be unreliable, the market price may be determined using quotations received from one or more brokers–dealers that make a market in the security.
Equity securities that are primarily traded on foreign securities exchanges are valued at the preceding closing values of such securities on their respective exchanges, except when an occurrence subsequent to the time a value was so established is likely to have changed such value. In such an event, the fair values of those securities are determined in good faith through consideration of other factors in accordance with procedures established by and under the general supervision of the Board.
When such prices or quotations are not available, or when Emerald Mutual Fund Advisers Trust, (the “Adviser”), believes that they are unreliable, securities may be priced using fair value procedures approved by the Board.
Fair Value Measurements: A three-tier hierarchy has been established to classify fair value measurements for disclosure purposes. Inputs refer broadly to the assumptions that market participants would use in pricing the asset or liability, including assumptions about risk. Inputs may be observable or unobservable. Observable inputs are inputs that reflect the assumptions market participants would use in pricing the asset or liability that are developed based on market data obtained from sources independent of the reporting entity. Unobservable inputs are inputs that reflect the reporting entity’s own assumptions about the assumptions market participants would use in pricing the asset or liability that are developed based on the best information available. Various inputs are used in determining the value of each Fund’s investments as of the reporting period end. The designated input levels are not necessarily an indication of the risk or liquidity associated with these investments.
These inputs are categorized in the following hierarchy under applicable financial accounting standards:
| Level 1 – | Unadjusted quoted prices in active markets for identical investments, unrestricted assets or liabilities that the Funds have the ability to access at the measurement date; |
| Level 2 – | Quoted prices which are not active, quoted prices for similar assets or liabilities in active markets or inputs other than quoted prices that are observable (either directly or indirectly) for substantially the full term of the asset or liability; and |
| Level 3 – | Significant unobservable prices or inputs (including the Funds’ own assumptions in determining the fair value of investments) where there is little or no market activity for the asset or liability at the measurement date. |
| 44 | www.emeraldmutualfunds.com |
| Emerald Funds | Notes to Financial Statements |
April 30, 2021
The following is a summary of each input used to value the Funds as of April 30, 2021:
| Investments in Securities at Value(a) | Level 1 - Quoted Prices | Level 2 - Other Significant Observable Inputs | Level 3 - Significant Unobservable Inputs | Total | ||||||||||||
| Emerald Growth Fund | ||||||||||||||||
| Common Stocks | $ | 1,654,534,692 | $ | – | $ | – | $ | 1,654,534,692 | ||||||||
| Short Term Investments | 23,969,071 | – | – | 23,969,071 | ||||||||||||
| TOTAL | $ | 1,678,503,763 | $ | – | $ | – | $ | 1,678,503,763 | ||||||||
| Investments in Securities at Value(a) | Level 1 - Quoted Prices | Level 2 - Other Significant Observable Inputs | Level 3 - Significant Unobservable Inputs | Total | ||||||||||||
| Emerald Insights Fund | ||||||||||||||||
| Common Stocks | $ | 22,034,698 | $ | – | $ | – | $ | 22,034,698 | ||||||||
| Short Term Investments | 100,752 | – | – | 100,752 | ||||||||||||
| TOTAL | $ | 22,135,450 | $ | – | $ | – | $ | 22,135,450 | ||||||||
| Investments in Securities at Value(a) | Level 1 - Quoted Prices | Level 2 - Other Significant Observable Inputs | Level 3 - Significant Unobservable Inputs | Total | ||||||||||||
| Emerald Banking and Finance Fund | ||||||||||||||||
| Common Stocks | $ | 238,724,416 | $ | 1,927,793 | $ | – | $ | 240,652,209 | ||||||||
| Short Term Investments | 6,846,133 | – | – | 6,846,133 | ||||||||||||
| Mutual Funds | 11,228,107 | – | – | 11,228,107 | ||||||||||||
| Warrant | 286,763 | – | – | 286,763 | ||||||||||||
| TOTAL | $ | 257,085,419 | $ | 1,927,793 | $ | – | $ | 259,013,212 | ||||||||
| (a) | For detailed descriptions of sector and industry, see the accompanying Schedule of Investments. |
For the year ended April 30, 2021, the Funds did not have any securities that used significant unobservable inputs (Level 3) in determining fair value.
Investment Transactions and Investment Income: Investment transactions are accounted for on the date the investments are purchased or sold (trade date). Realized gains and losses from investment transactions are reported on an identified cost basis, which is the same basis the Funds use for federal income tax purposes. Interest income, which includes accretion of discounts, is accrued and recorded as earned. Dividend income is recognized on the ex-dividend date or for certain foreign securities, as soon as information is available to the Funds. All of the realized and unrealized gains and losses and net investment income, are allocated daily to each class in proportion to its average daily net assets.
Real Estate Investment Trusts (“REITs”): The Funds may invest a portion of their assets in REITs and are subject to certain risks associated with direct investment in REITs. REITs may be affected by changes in the value of their underlying properties and by defaults by borrowers or tenants. REITs depend generally on their ability to generate cash flow to make distributions to shareowners, and certain REITs have self-liquidation provisions by which mortgages held may be paid in full and distributions of capital returns may be made at any time. In addition, the performance of a REIT may be affected by its failure to qualify for tax-free pass-through of income under the Internal Revenue Code of 1986, as amended (the “Code”), or its failure to maintain exemption from registration under the 1940 Act. A Fund’s investments in REITs may result in such Fund’s receipt of cash in excess of the REITs’ earnings. If the Fund receives such distributions all or a portion of these distributions will constitute a return of capital to such Fund. Receiving a return of capital distribution from REITs will reduce the amount of income available to be distributed to Fund shareholders. Income from REITs generally will not be eligible for treatment as qualified dividend income. As the final character of the distributions is not known until reported by the REITs on their 1099s, the Funds utilize an average of the prior year’s reallocation information as an estimate for the current year character of distributions.
Trust Expenses: Some expenses of the Trust can be directly attributed to the Funds. Expenses which cannot be directly attributed to the Funds are apportioned among all funds in the Trust based on average net assets of each fund.
| Annual Report | April 30, 2021 | 45 |
| Emerald Funds | Notes to Financial Statements |
April 30, 2021
Fund and Class Expenses: Expenses that are specific to a Fund or class of shares of a Fund, including distribution fees (Rule 12b-1 fees) and shareholder servicing fees, are charged directly to that Fund or share class. All expenses of a Fund, other than class specific expenses, are allocated daily to each class in proportion to its average daily net assets. Expenses that are common to the Funds generally are allocated among the Funds in proportion to their average daily net assets.
Federal Income Taxes: Each Fund complies with the requirements under Subchapter M of the Code, applicable to regulated investment companies and intends to distribute substantially all of its net taxable income and net capital gains, if any, each year so that the Funds will not be subject to excise tax on undistributed income and gains. The Funds are not subject to income taxes to the extent such distributions are made.
As of and during the year ended April 30, 2021, the Funds did not have a liability for any unrecognized tax benefits. The Funds file U.S. federal, state, and local tax returns as required. The Funds’ tax returns are subject to examination by the relevant tax authorities until expiration of the applicable statute of limitations, which is generally three years after the filing of the tax return for federal purposes and four years for most state returns. Tax returns for open years have incorporated no uncertain tax positions that require a provision for income taxes.
Distributions to Shareholders: Each Fund normally pays dividends and distributes capital gains, if any, on an annual basis. Income dividend distributions are derived from dividends and other income each Fund receives from its investments, including short-term capital gains. Long term capital gain distributions are derived from gains realized when each Fund sells a security it has owned for more than a year. Each Fund may make additional distributions and dividends at other times if the portfolio manager believes doing so may be necessary for each Fund to avoid or reduce taxes.
Epidemic and Pandemic Risk: Certain countries have been susceptible to epidemics, most recently COVID-19, which has been designated as a pandemic by world health authorities. The outbreak of such epidemics, together with any resulting restrictions on travel or quarantines imposed, could have a negative impact on the economy and business activity globally (including in the countries in which we invest), and thereby could adversely affect the performance of our investments. Furthermore, the rapid development of epidemics could preclude prediction as to their ultimate adverse impact on economic and market conditions, and, as a result, present material uncertainty and risk with respect to us and the performance of our investments.
Libor Risk: In March 2020, the Financial Accounting Standards Board (FASB) issued Accounting Standards Update (“ASU”) No. 2020-04, Reference Rate Reform (Topic 848): Facilitation of the Effects of Reference Rate Reform on Financial Reporting. The Funds’ investments, payment obligations, and financing terms may be based on floating rates, such as the London Interbank Offered Rate, or “LIBOR,” which is the offered rate for short-term Eurodollar deposits between major international banks. On November 30, 2020, the administrator of LIBOR announced its intention to delay the phase out of the majority of the U.S. dollar LIBOR publications until June 30, 2023, with the remainder of LIBOR publications to still end at the end of 2021. There remains uncertainty regarding the nature of any replacement rate and the impact of the transition from LIBOR on the Funds’ transactions and the financial markets generally. As such, the potential effect of a transition away from LIBOR on the Funds or the Funds’ investments cannot yet be determined.
3. TAX BASIS INFORMATION
Tax Basis of Investments: As of April 30, 2021, the aggregate cost of investments, gross unrealized appreciation/(depreciation) and net unrealized appreciation/(depreciation) for Federal tax purposes was as follows:
| Gross Appreciation (excess of value over tax cost) | Gross Depreciation (excess of tax cost over value) | Net Unrealized Appreciation/(Depreciation) | Cost of Investments for Income Tax Purposes | |||||||||||||
| Emerald Growth Fund | $ | 683,111,642 | $ | (34,029,269 | ) | $ | 649,082,373 | $ | 1,029,421,390 | |||||||
| Emerald Insights Fund | 8,944,656 | (324,881 | ) | 8,619,775 | 13,515,675 | |||||||||||
| Emerald Banking and Finance Fund | 85,494,114 | (12,060,236 | ) | 73,433,878 | 185,579,334 | |||||||||||
| 46 | www.emeraldmutualfunds.com |
| Emerald Funds | Notes to Financial Statements |
April 30, 2021
Components of Distributable Earnings: As of April 30, 2021, components of distributable earnings were as follows:
| Emerald Growth Fund | Emerald Insights Fund | Emerald Banking and Finance Fund | ||||||||||
| Undistributed ordinary income | $ | 51,321,804 | $ | 1,474,381 | $ | 10,512,414 | ||||||
| Accumulated capital gains | 170,399,668 | 738,268 | – | |||||||||
| Net unrealized appreciation on investments | 649,082,373 | 8,619,775 | 73,433,878 | |||||||||
| Total | $ | 870,803,845 | $ | 10,832,424 | $ | 83,946,292 | ||||||
During the fiscal year ended April 30, 2021, Emerald Banking and Finance Fund utilized capital losses carried forward from prior fiscal year in the amount of $3,900,205.
Tax Basis of Distributions to Shareholders: The character of distributions made during the year from net investment income or net realized gains may differ from its ultimate characterization for federal income tax purposes. Also, due to the timing of dividend distributions, the fiscal year in which amounts are distributed may differ from the fiscal year in which the income or realized gain were recorded by each Fund.
The tax characters of distributions paid by the Funds for the fiscal year ended April 30, 2021 were as follows:
| Ordinary Income | Long-Term Capital Gain | |||||||
| Emerald Growth Fund | $ | 13,844,336 | $ | 106,737,343 | ||||
| Emerald Insights Fund | 756,049 | 862,121 | ||||||
| Emerald Banking and Finance Fund | – | – | ||||||
The tax characters of distributions paid by the Funds for the fiscal year ended April 30, 2020 were as follows:
| Ordinary Income | Long-Term Capital Gain | |||||||
| Emerald Growth Fund | $ | – | $ | 18,434,222 | ||||
| Emerald Insights Fund | – | 4,578 | ||||||
| Emerald Banking and Finance Fund | – | – | ||||||
4. SECURITIES TRANSACTIONS
The cost of purchases and proceeds from sales of securities (excluding short-term securities) during the year ended April 30, 2021 was as follows:
| Funds | Cost of Investments Purchased | Proceeds from Investments Sold | ||||||
| Emerald Growth Fund | $ | 907,733,350 | $ | 1,068,768,909 | ||||
| Emerald Insights Fund | 15,123,126 | 14,829,352 | ||||||
| Emerald Banking and Finance Fund | 266,457,904 | 270,230,938 | ||||||
5. SHARES OF BENEFICIAL INTEREST
The capitalization of the Trust consists of an unlimited number of shares of beneficial interest with no par value per share. Holders of the shares of the Funds of the Trust have one vote for each share held and a proportionate fraction of a vote for each fractional share. All shares issued and outstanding are fully paid and are transferable and redeemable at the option of the shareholder. Purchasers of the shares do not have any obligation to make payments to the Trust or its creditors (other than the purchase price for the shares) or make contributions to the Trust or its creditors solely by reason of the purchaser’s ownership of the shares. Shares have no pre-emptive rights.
| Annual Report | April 30, 2021 | 47 |
| Emerald Funds | Notes to Financial Statements |
April 30, 2021
6. MANAGEMENT AND RELATED-PARTY TRANSACTIONS
The Adviser, subject to the authority of the Board, is responsible for the overall management and administration of the Funds’ business affairs. The Adviser manages the investments of the Funds in accordance with the Funds’ investment objective, policies and limitations and investment guidelines established jointly by the Adviser and the Trustees. Pursuant to the Advisory Agreement, the Funds pay the Adviser fees for the services and facilities it provides payable on a monthly basis at the annual rate set forth below of the Funds’ average daily net assets. The management fee is paid on a monthly basis.
Emerald Growth Fund
| Average Total Net Assets | Contractual Fee |
| Up to and including $250M | 0.75% |
| Over $250M and including $500M | 0.65% |
| Over $500M and including $750M | 0.55% |
| Over $750M | 0.45% |
| Emerald Insights Fund | |
| Average Total Net Assets | Contractual Fee |
| Up to and including $250M | 0.75% |
| Over $250M and including $500M | 0.65% |
| Over $500M and including $750M | 0.55% |
| Over $750M | 0.45% |
| Emerald Banking and Finance Fund | |
| Average Total Net Assets | Contractual Fee |
| Up to and including $100M | 1.00% |
| Over $100M | 0.90% |
The Adviser has contractually agreed to limit each Fund’s total annual operating expenses (exclusive of acquired fund fees and expenses, brokerage expenses, interest expenses, taxes and extraordinary expense) set forth to the annual shares (as percentages of a Funds average daily net assets) in the following table for Class A, Class C, Institutional Class, and Investor Class shares. This agreement (the “Expense Agreement”) is in effect from September 1, 2020 through August 31, 2021, for all Funds. The prior Expense Agreement was in effect from September 1, 2019 through August 31, 2020 for all Funds. The Adviser will be permitted to recover, on a class-by-class basis, expenses it has borne through the expense agreement to the extent that a Funds expenses in later periods fall below the expense cap in effect at the time of the waiver or reimbursement. Notwithstanding the foregoing, the Funds will not be obligated to pay any such fees and expenses more than three years after the date of the waiver or reimbursement. The Adviser may not discontinue this waiver, prior to August 31, 2021, without the approval by the Funds Board, for all Funds. Fees waived/reimbursed by the Adviser for the year ended April 30, 2021 are disclosed in the Statements of Operations.
| Emerald Growth Fund | |||
| Class A | Class C | Institutional Class | Investor Class |
| 1.29% | 1.94% | 0.99% | 1.34% |
| Emerald Insights Fund | |||
| Class A | Class C | Institutional Class | Investor Class |
| 1.35% | 2.00% | 1.05% | 1.40% |
| Emerald Banking and Finance Fund | |||
| Class A | Class C | Institutional Class | Investor Class |
| 1.84% | 2.49% | 1.54% | 1.89% |
| 48 | www.emeraldmutualfunds.com |
| Emerald Funds | Notes to Financial Statements |
April 30, 2021
For the year ended April 30, 2021, the fee waivers/reimbursements and recoupments of past waived fees were as follows:
| Fund | Fees Waived/ Reimbursed By Adviser | |||
| Emerald Insights Fund | ||||
| Class A | $ | 80,330 | ||
| Class C | 1,121 | |||
| Institutional Class | 13,352 | |||
| Investor Class | 1,874 | |||
As of April 30, 2021, the balances of recoupable expenses for each Fund were as follows:
| Fund | Expires 2022 | Expires 2023 | Expires 2024 | Total | ||||||||||||
| Emerald Insights Fund | ||||||||||||||||
| Class A | $ | 77,413 | $ | 88,177 | $ | 80,330 | $ | 245,920 | ||||||||
| Class C | 1,019 | 1,283 | 1,121 | 3,423 | ||||||||||||
| Institutional Class | 11,141 | 12,318 | 13,352 | 36,811 | ||||||||||||
| Investor Class | 1,004 | 1,098 | 1,874 | 3,976 | ||||||||||||
Fund Administrator Fees and Expenses: ALPS Fund Services, Inc. (“ALPS”) serves as administrator to the Funds and the Funds have agreed to pay expenses incurred in connection with their administrative activities. Pursuant to an Administration Agreement, ALPS provides operational services to the Funds including, but not limited to, fund accounting and fund administration and generally assist in the Funds’ operations. Officers of the Trust are employees of ALPS. The Funds’ administration fee is accrued on a daily basis and paid monthly. Administration fees paid by the Funds for the year ended April 30, 2021 are disclosed in the Statements of Operations.
The Administrator is also reimbursed by the Funds for certain out-of-pocket expenses.
Transfer Agent: ALPS serves as transfer, dividend paying and shareholder servicing agent for the Funds. ALPS receives an annual minimum fee, a fee based upon the number of shareholder accounts, and is also reimbursed by the Funds for certain out-of-pocket expenses. Transfer agent fees paid by the Funds for the year ended April 30, 2021 are disclosed in the Statements of Operations.
Compliance Services: ALPS provides services that assist the Trust’s chief compliance officer in monitoring and testing the policies and procedures of the Trust in conjunction with requirements under Rule 38a-1 under the 1940 Act and receives an annual base fee. ALPS is reimbursed for certain out-of-pocket expenses by the Funds. Compliance service fees paid by the Funds for the year ended April 30, 2021 are disclosed in the Statements of Operations.
Principal Financial Officer: ALPS receives an annual fee for providing principal financial officer services to the Funds. Principal financial officer fees paid by the Funds for the year ended April 30, 2021 are disclosed in the Statements of Operations.
Distributor: ALPS Distributors, Inc. (“ADI” or the “Distributor”) (an affiliate of ALPS) acts as the distributor of the Funds’ shares pursuant to a Distribution Agreement with the Trust. Shares are sold on a continuous basis by ADI as agent for the Funds, and ADI has agreed to use its best efforts to solicit orders for the sale of Funds’ shares, although it is not obliged to sell any particular amount of shares. ADI is not entitled to any compensation for its services as Distributor. ADI is registered as a broker-dealer with the U.S. Securities and Exchange Commission.
Each Fund has adopted a separate Distribution and Services Plan (each a “Plan” and collectively, the “Plans”) pursuant to Rule 12b-1 of the 1940 Act. The Plans allow each Fund, as applicable, to use each Fund’s assets to pay fees in connection with the distribution and marketing of the Funds’ shares and/or the provision of shareholder services to the Funds’ shareholders. The Plan permits payment for services in connection with the administration of plans or programs that use shares of each Fund as their funding medium and for related expenses. The recipients of such payments may include other affiliates of the Adviser, broker-dealers, financial institutions, plan sponsors and administrators and other financial intermediaries through which investors may purchase shares of the Fund. The Plans permit each Fund to make total payments at an annual rate of up to 0.35%, 0.75% and 0.25% of the average daily net asset value of Class A, Class C and Investor Class, respectively. Because these fees are paid out of the Funds’ assets on an ongoing basis, over time they will increase the cost of an investment in the Funds, and Plan fees may cost an investor more than other types of sales charges.
Each Fund, has adopted a Shareholder Services Plan (a “Shareholder Services Plan”) with respect to its Class C, Institutional Class and Investor Class shares. Under the Shareholder Services Plan, a Fund is authorized to compensate certain financial intermediaries, including broker-dealers and Fund affiliates which may include the Distributor, Adviser and/or the transfer agent (the “Participating Organizations”), an aggregate fee in an amount not
| Annual Report | April 30, 2021 | 49 |
| Emerald Funds | Notes to Financial Statements |
April 30, 2021
to exceed on an annual basis 0.25%, 0.05% and 0.15% of the average daily net asset value of Class C, Institutional Class and Investor Class, respectively, of the Funds attributable to or held in the name of the Participating Organizations pursuant to an agreement with such Participating Organizations (the “Agreement”). Each Agreement will set forth the non-distribution related shareholder services to be performed by the Participating Organizations for the benefit of a Fund’s shareholders who have elected to have such Participating Organizations service their accounts. Any amount of such payment not paid to Participating Organizations during a Fund’s fiscal year for such service activities shall be reimbursed to the Fund as soon as practicable. Shareholder Services Plan fees are included with distribution and service fees in the Statements of Operations. Fees recaptured pursuant to the Shareholder Services Plan for the year ended April 30, 2021, are included as an offset to distribution and service fees as disclosed in the Statements of Operations.
Trustees
The fees and expenses of the Trustees of the Board are presented in the Statements of Operations.
7. INDEMNIFICATIONS
Under the Trust’s organizational documents, its officers and Trustees are indemnified against certain liability arising out of the performance of their duties to the Trust. Additionally, in the normal course of business, the Trust enters into contracts with service providers that may contain general indemnification clauses, which may permit indemnification to the extent permissible under applicable law. The Trust’s maximum exposure under these arrangements is unknown, as this would involve future claims that may be made against the Trust that have not yet occurred.
8. SUBSEQUENT EVENTS
Subsequent events after the date of the Statements of Assets and Liabilities have been evaluated through the date the financial statements were issued.
| 50 | www.emeraldmutualfunds.com |
| Emerald Funds | Report of Independent Registered Public Accounting Firm |
To the shareholders and the Board of Trustees of Financial Investors Trust
Opinion on the Financial Statements and Financial Highlights
We have audited the accompanying statements of assets and liabilities of Emerald Growth Fund, Emerald Insights Fund, and Emerald Banking and Finance Fund, three of the funds constituting the Financial Investors Trust, including the schedule of investments, as of April 30, 2021; the related statements of operations for the year then ended, the statements of changes in net assets for each of the two years in the period then ended, and the financial highlights for each of the five years in the period then ended, and the related notes. In our opinion, the financial statements and financial highlights present fairly, in all material respects, the financial position of each of the funds listed above constituting Financial Investors Trust, as of April 30, 2021, and the results of their operations for the year then ended, the changes in their net assets for each of the two years in the period then ended, and the financial highlights for each of the five years in the period then ended, in conformity with accounting principles generally accepted in the United States of America.
Basis for Opinion
These financial statements and financial highlights are the responsibility of the Funds’ management. Our responsibility is to express an opinion on the Funds’ financial statements and financial highlights based on our audits. We are a public accounting firm registered with the Public Company Accounting Oversight Board (United States) (PCAOB) and are required to be independent with respect to the Funds in accordance with the U.S. federal securities laws and the applicable rules and regulations of the Securities and Exchange Commission and the PCAOB.
We conducted our audits in accordance with the standards of the PCAOB. Those standards require that we plan and perform the audit to obtain reasonable assurance about whether the financial statements and financial highlights are free of material misstatement, whether due to error or fraud. The Funds are not required to have, nor were we engaged to perform, an audit of their internal control over financial reporting. As part of our audits we are required to obtain an understanding of internal control over financial reporting but not for the purpose of expressing an opinion on the effectiveness of the Funds’ internal control over financial reporting. Accordingly, we express no such opinion.
Our audits included performing procedures to assess the risks of material misstatement of the financial statements and financial highlights, whether due to error or fraud, and performing procedures that respond to those risks. Such procedures included examining, on a test basis, evidence regarding the amounts and disclosures in the financial statements and financial highlights. Our audits also included evaluating the accounting principles used and significant estimates made by management, as well as evaluating the overall presentation of the financial statements and financial highlights. Our procedures included confirmation of securities owned as of April 30, 2021, by correspondence with the custodian and brokers; when replies were not received from brokers, we performed other auditing procedures. We believe that our audits provide a reasonable basis for our opinion.
DELOITTE & TOUCHE LLP
Denver, Colorado
June 28, 2021
We have served as the auditor of one or more investment companies advised by Emerald Mutual Fund Advisers Trust since 2012
| Annual Report | April 30, 2021 | 51 |
| Emerald Funds | Additional Information |
April 30, 2021 (Unaudited)
1. FUND HOLDINGS
The Funds file their complete schedule of portfolio holdings with the Securities and Exchange Commission (SEC) for the first and third quarters of each fiscal year as an exhibit to its reports on Form N-PORT. The Funds’ Form N-PORT reports are available on the SEC's Web site at http://www.sec.gov. The Funds’ Form N-PORT reports are also available upon request by calling (toll-free) (855) 828-9909.
2. FUND PROXY VOTING POLICIES, PROCEDURES AND SUMMARIES
Each Fund’s policies and procedures used in determining how to vote proxies and information regarding how the Funds voted proxies relating to portfolio securities during the most recent prior 12-month period ending June 30 are available without charge, (1) upon request, by calling (toll-free) (855) 828-9909 and (2) on the SEC’s website at http://www.sec.gov.
3. TAX INFORMATION (UNAUDITED)
The Funds designate the following for federal income tax purposes for distributions made during the calendar year ended December 31, 2020:
| QDI | DRD | |
| Emerald Banking and Finance Fund | N/A | N/A |
| Emerald Growth Fund | 22.59% | 22.65% |
| Emerald Insights Fund | 9.55% | 9.63% |
In early 2021, if applicable, shareholders of record received this information for the distribution paid to them by the Funds during the calendar year 2020 via Form 1099. The Funds will notify shareholders in early 2022 of amounts paid to them by the Funds, if any, during the calendar year 2021.
Pursuant to Section 852(b)(3) of the Internal Revenue Code, the Emerald Growth Fund and the Emerald Insights Fund designated $106,737,343 and $862,121 respectively, as long-term capital gain dividends.
| 52 | www.emeraldmutualfunds.com |
| Emerald Funds | Disclosure Regarding Approval of Fund Advisory Agreement |
April 30, 2021 (Unaudited)
On March 9, 2021, the Trustees met via Zoom video conference to discuss, among other things, the renewal of the Investment Advisory Agreement between Emerald Mutual Fund Advisers Trust (“Emerald”) and the Trust, with respect to the Emerald Banking and Finance Fund, the Emerald Growth Fund, and the Emerald Insights Fund (together, the “Emerald Funds”), dated October 1, 2018 (the “Emerald Investment Advisory Agreement”), in accordance with Section 15(c) of the 1940 Act. In renewing and approving the Emerald Investment Advisory Agreement, the Trustees, including the Independent Trustees, considered the following factors with respect to the Emerald Funds:
Investment Advisory Fee Rate: The Trustees reviewed and considered the contractual annual advisory fee paid by the Trust, on behalf of the Funds, to Emerald of 1.00% of the Emerald Banking and Finance Fund’s daily average net assets up to and including $100 million and 0.90% in excess of $100 million and, for each of the other Funds, 0.75% of the daily average net assets up to and including $250 million, 0.65% in excess of $250 million and up to and including $500 million, 0.55% in excess of $500 million and up to and including $750 million, and 0.45% in excess of $750 million, in light of the extent and quality of the advisory services provided by Emerald to the Funds.
The Board received and considered information including a comparison of each of the Fund’s contractual advisory fees with those of funds in the expense peer group of comparable funds provided by an independent provider of investment company data (the “Data Provider”). With regard to the Emerald Growth Fund, the Trustees noted that the contractual advisory fee rate, for each share class, was below the Data Provider peer group median. With regard to the Emerald Banking and Finance Fund, the Trustees noted that the contractual advisory fee rate, for each share class, was above the Data Provider peer group median. With regard to the Emerald Insights Fund, the Trustees noted that the contractual advisory fee rate, for each share class, was the same as the Data Provider peer group median.
Total Net Expense Ratios: The Trustees further reviewed and considered that the total net expense ratio of each class of the Emerald Insights Fund and of the Emerald Banking & Finance Fund was generally higher than the Data Provider peer group median, and that the total net expense ratio of each class of the Emerald Growth Fund was lower than the Data Provider peer group median.
Nature, Extent, and Quality of the Services under the Investment Advisory Agreement: The Trustees received and considered information regarding the nature, extent, and quality of services provided to the Emerald Funds under the Emerald Investment Advisory Agreement. The Trustees reviewed certain background materials supplied by Emerald in its presentation, including its Form ADV.
The Trustees reviewed and considered Emerald’s investment advisory personnel, its history as an asset manager, and its performance and the amount of assets currently under management by Emerald and its affiliated entities. The Trustees also reviewed the research and decision-making processes utilized by Emerald, including the methods adopted to seek to achieve compliance with the investment objectives, policies, and restrictions of the Emerald Funds.
The Trustees considered the background and experience of Emerald’s management in connection with the Emerald Funds, including reviewing the qualifications, backgrounds, and responsibilities of the management team primarily responsible for the day-to-day portfolio management of each Emerald Fund and the extent of the resources devoted to research and analysis of actual and potential investments.
The Trustees also reviewed, among other things, Emerald’s insider trading policies and procedures and its Code of Ethics.
Performance: The Trustees reviewed performance information for the Institutional Class, Class A, Class C, and Investor Class shares of the Emerald Insights Fund, Emerald Growth Fund, and Emerald Banking and Finance Fund for the 3-month, 1-year, 3-year, 5-year, 10-year, and since inception periods, as applicable, ended December 31, 2020. That review included a comparison of each Fund’s performance to the performance of a group of comparable funds selected by the Data Provider. The Trustees noted that each class of the Emerald Growth Fund and of the Emerald Banking & Finance Fund generally outperformed the Data Provider peer group median for each period, and that the each class of the Emerald Insights Fund outperformed the Data Provider peer group median for each applicable time period, except for the 3-month period. The Trustees also considered Emerald’s discussion of its reputation generally and its investment techniques, risk management controls, and decision-making processes.
Comparable Accounts: The Trustees noted certain information provided by Emerald regarding fees charged to its other clients utilizing a strategy similar to that employed by one or more of the Emerald Funds.
Profitability: The Trustees received and considered a profitability analysis prepared by Emerald based on the fees payable under the Emerald Investment Advisory Agreement.
Economies of Scale: The Trustees considered whether economies of scale in the provision of services to the Emerald Funds will be passed along to the shareholders under the proposed agreements.
| Annual Report | April 30, 2021 | 53 |
| Emerald Funds | Disclosure Regarding Approval of Fund Advisory Agreement |
April 30, 2021 (Unaudited)
Other Benefits to the Adviser: The Trustees reviewed and considered any other incidental benefits derived or to be derived by Emerald from its relationship with the Emerald Funds, including whether soft dollar arrangements were used.
The Trustees, including all of the Independent Trustees, concluded that:
| ● | With regard to the Emerald Growth Fund, for each share class, the contractual advisory fee rate was below the Data Provider peer group median. With regard to the Emerald Banking and Finance Fund, for each share class, the contractual advisory fee rate was above the Data Provider peer group median. With regard to the Emerald Insights Fund, for each share class, the contractual advisory fee rate was the same as the Data Provider peer group median. |
| ● | The total net expense ratio of each class of the Emerald Insights Fund and of the Emerald Banking & Finance Fund was generally higher than the Data Provider peer group median, and that the total net expense ratio of each class of the Emerald Growth Fund was lower than the Data Provider peer group median. |
| ● | The nature, extent, and quality of services rendered by Emerald under the Emerald Investment Advisory Agreement with respect to each Emerald Fund were adequate. |
| ● | With regard to the Emerald Growth Fund, for each share class, the contractual advisory fee rate was below the Data Provider peer group median. With regard to the Emerald Banking and Finance Fund, for each share class, the contractual advisory fee rate was above the Data Provider peer group median. With regard to the Emerald Insights Fund, for each share class, the contractual advisory fee rate was the same as the Data Provider peer group median. |
| ● | For the 3-month, 1-year, 3-year, 5-year, 10-year, and since inception periods, as applicable, ended December 31, 2020, each class of the Emerald Growth Fund and of the Emerald Banking & Finance Fund generally outperformed the Data Provider peer group median for each applicable period, and that the each class of the Emerald Insights Fund outperformed the Data Provider peer group median for each applicable time period, except for the 3-month period. |
| ● | Bearing in mind the limitations of comparing different types of managed accounts and the different levels of service typically associated with such accounts, the fee structures applicable to Emerald’s other clients employing a comparable strategy to one or more of the Emerald Funds were not indicative of any unreasonableness with respect to the advisory fee payable to Emerald by the Funds. |
| ● | The profit, if any, realized by Emerald in connection with the operation of any of the Emerald Funds is not unreasonable. |
| ● | There were no material economies of scale or other incidental benefits accruing to Emerald in connection with its relationship with any of the Emerald Funds. |
Based on the Trustees’ deliberations and their evaluation of the information described above, the Trustees, including all of the Independent Trustees, concluded that Emerald’s compensation for investment advisory services is consistent with the best interests of each of the Emerald Funds and their shareholders.
| 54 | www.emeraldmutualfunds.com |
| Emerald Funds | Liquidity Risk Management Program |
April 30, 2021 (Unaudited)
The Financial Investors Trust (the “Trust”) has established a liquidity risk management program (the “Program”) to govern the Trust’s approach to managing liquidity risk for each fund in the Trust (each a “Fund”). The Program is overseen by the Liquidity Committee (the “Committee”), a committee comprised of representatives of the Trust’s investment advisers, sub-advisers, and Officers of the Trust. The Trust’s Board of Trustees (the “Board”) has approved the designation of the Committee to oversee the Program.
The Program’s principal objectives include supporting each Fund’s compliance with limits on investments in illiquid assets and mitigating the risk that a Fund will be unable to meet its redemption obligations in a timely manner. The Program also includes a number of elements that support the management and assessment of liquidity risk, including a periodic assessment of factors that influence a Fund’s liquidity and the periodic classification and re-classification of the Fund’s investments into groupings that reflect the Committee’s assessment of their relative liquidity under current market conditions.
At a meeting of the Board held on March 10, 2021, the Trustees received a report from the Committee regarding the design and operational effectiveness of the Program during 2020. The Committee determined, and reported to the Board, that the Program is reasonably designed to assess and manage each Fund’s liquidity risk and has operated adequately and effectively to manage each Fund’s liquidity risk since implementation.
The Committee reported that during the period covered by the report, there were no liquidity events that impacted the Funds or their ability to timely meet redemptions without dilution to existing shareholders. Among other things, the Board noted that the Funds are not required to have a highly liquid investment minimum based on their liquidity classifications. The Board further noted that no material changes have been made to the Program since its implementation.
| Annual Report | April 30, 2021 | 55 |
| Emerald Funds | Trustees and Officers |
April 30, 2021 (Unaudited)
Additional information regarding the Fund’s trustees is included in the Statement of Additional Information, which can be obtained without charge by calling 855-828-9909.
| INDEPENDENT TRUSTEES | |||||
| Name, Address* & Year of Birth | Position(s) Held with Fund | Term of Office** and Length of Time Served | Principal Occupation(s) During Past 5 Years*** | Number of Funds in Fund Complex Overseen by Trustee**** | Other Directorships Held by Trustee During Past 5 Years*** |
| Mary K. Anstine, 1940 | Trustee and Chairman | Ms. Anstine was elected at a special meeting of shareholders held on March 21, 1997 and re- elected at a special meeting of shareholders held on August 7, 2009. Ms. Anstine was appointed Chairman of the Board at the June 6, 2017 meeting of the Board of Trustees. | Ms. Anstine is Trustee/Director of AV Hunter Trust and Colorado Uplift Board. | 31 | Ms. Anstine is a Trustee of ALPS ETF Trust (17 funds); ALPS Variable Investment Trust (7 funds); Reaves Utility Income Fund (1 fund); and Segall Bryant & Hamill Trust through December 2020 (14 funds as of December 2020). |
| Jeremy W. Deems, 1976 | Trustee | Mr. Deems was appointed as a Trustee at the March 11, 2008 meeting of the Board of Trustees and elected at a special meeting of shareholders held on August 7, 2009. | Mr. Deems is the Co-Founder and Chief Financial Officer of Green Alpha Advisors, LLC, a registered investment advisor, and Co-Portfolio Manager of the Shelton Green Alpha Fund. | 31 | Mr. Deems is a Trustee of ALPS ETF Trust (17 funds); ALPS Variable Investment Trust (7 funds); Clough Funds Trust (1 fund); and Reaves Utility Income Fund (1 fund). |
| Jerry G. Rutledge, 1944 | Trustee | Mr. Rutledge was elected at a special meeting of shareholders held on August 7, 2009. | Mr. Rutledge is the President and owner of Rutledge’s Inc., a retail clothing business. | 31 | Mr. Rutledge is a Trustee of Clough Global Dividend and Income Fund (1 fund); Clough Global Equity Fund (1 fund); Clough Global Opportunities Fund (1 fund); and Principal Real Estate Income Fund (1 fund). |
| 56 | www.emeraldmutualfunds.com |
| Emerald Funds | Trustees and Officers |
April 30, 2021 (Unaudited)
| INDEPENDENT TRUSTEES | |||||
| Name, Address* & Year of Birth | Position(s) Held with Fund | Term of Office** and Length of Time Served | Principal Occupation(s) During Past 5 Years*** | Number of Funds in Fund Complex Overseen by Trustee**** | Other Directorships Held by Trustee During Past 5 Years*** |
| Michael “Ross” Shell, 1970 | Trustee | Mr. Shell was elected at a special meeting of shareholders held on August 7, 2009. | Mr. Shell is Founder and CEO of Red Idea, LLC, a strategic consulting/early stage venture firm (since June 2008). Mr. Shell serves on the Board of Directors of TalkBox, a phone/privacy booth company (since 2018) and DLVR, a package security company (since 2018). Mr. Shell served on the Advisory Board, St. Vrain School District Innovation Center (from 2015- 2018). Mr. Shell graduated with honors from Stanford University with a degree in Political Science. | 31 | None. |
| INTERESTED TRUSTEE | |||||
| Name, Address* & Year of Birth | Position(s) Held with Fund | Term of Office** and Length of Time Served | Principal Occupation(s) During Past 5 Years*** | Number of Funds in Fund Complex Overseen by Trustee**** | Other Directorships Held by Trustee During Past 5 Years*** |
| Edmund J. Burke, 1961 | Trustee | Mr. Burke was elected as Trustee at a special meeting of shareholders held on August 7, 2009. | Mr. Burke joined ALPS in 1991 and served as the President and Director of ALPS Holdings, Inc., and ALPS Advisors, Inc., and Director of ALPS Distributors, Inc., ALPS Fund Services, Inc. (“ALPS”), and ALPS Portfolio Solutions Distributor, Inc. (collectively, the “ALPS Companies”). Mr. Burke retired from the ALPS Companies in June 2019. Mr. Burke is currently a partner at ETF Action, a web-based system that provides data and analytics to registered investment advisers, (since 2020) and a Director of Alliance Bioenergy Plus, Inc., echnology company focused on emerging technologies in the renewable energy, biofuels, and bioplastics technology sectors (since 2020). Mr. Burke is deemed an interested Trustee by virtue of his prior positions with the ALPS Companies. | 31 | Mr. Burke is a Trustee of ALPS ETF Trust (17 funds); Clough Global Dividend and Income Fund (1 fund); Clough Global Equity Fund (1 fund); Clough Global Opportunities Fund (1 fund); Clough Funds Trust (1 fund); Liberty All-Star Equity Fund (1 fund); and Director of the Liberty All-Star Growth Fund, Inc. (1 fund). |
| Annual Report | April 30, 2021 | 57 |
| Emerald Funds | Trustees and Officers |
April 30, 2021 (Unaudited)
| OFFICERS | |||
| Name, Address* & Year of Birth | Position(s) Held with Fund | Term of Office** and Length of Time Served | Principal Occupation(s) During Past 5 Years*** |
| Bradley J. Swenson, 1972***** | President | Mr. Swenson was appointed President of the Trust at the June 11, 2019 meeting of the Board of Trustees. | Mr. Swenson joined ALPS in 2004 and has served as its President since June 2019. In this role, he serves as an officer to certain other closed-end and open-end investment companies. He previously served as the Chief Operating Officer of ALPS (2015-2019). Mr. Swenson also previously served as Chief Compliance Officer to ALPS, its affiliated entities, and to certain ETF, closed-end and open-end investment companies (2004-2015). Because of his position with ALPS, Mr. Swenson is deemed an affiliate of the Trust as defined under the 1940 Act. |
| Dawn Cotten, 1977 | President | Ms. Cotten was appointed President of the Trust at the June 8-9, 2021 meeting of the Trustees. | Ms. Cotten joined ALPS in 2009 and is currently Senior Vice President of Fund Administration and Relationship Management of ALPS. She has served in that role since January 2020. Prior to that, Ms. Cotten served as Senior Vice President of Relationship Management (2017-2020). Ms. Cotten served as a VP in Relationship Management from 2013-2017. Ms. Cotten also serves as President of ALPS Series Trust, Clough Funds Trust, Clough Global Dividend and Income Fund, and Clough Global Equity Fund and Clough Global Opportunities Fund. |
| Jennell Panella, 1974 | Treasurer | Ms. Panella was appointed Treasurer of the Trust at the September 15, 2020 meeting of the Board of Trustees. | Ms. Panella joined ALPS in June 2012 and is currently Vice President and Fund Controller of ALPS Fund Services, Inc. Prior to joining ALPS, Ms. Panella served as Financial Reporting Manager for Parker Global Strategies, LLC (2009-2012). Because of her position with ALPS, Ms. Panella is deemed an affiliate of the Trust as defined under the 1940 Act. |
| Karen S. Gilomen, 1970***** | Secretary | Ms. Gilomen was appointed Secretary of the Trust at the December 13, 2016 meeting of the Board of Trustees. | Ms. Gilomen joined ALPS in August 2016 as Vice President and Senior Counsel. Prior to joining ALPS, Ms. Gilomen was Vice President - General Counsel & CCO of Monticello Associates, Inc. from 2010 to 2016. Because of her position with ALPS, Ms. Gilomen is deemed an affiliate of the Trust, as defined under the 1940 Act. Ms. Gilomen is also the Secretary of ALPS Variable Investment Trust and Reaves Utility Income Fund, and the Assistant Secretary of the WesMark Funds. |
| Cara Owen, 1981 | Secretary | Ms. Owen was appointed Secretary of the Trust at the June 8-9, 2021 meeting of the Board of Trustees. | Vice President and Principal Legal Counsel, ALPS Fund Services, Inc. Prior to joining ALPS, Ms. Owen was Senior Counsel, Corporate & Investments, Great-West Life & Annuity Insurance Company; Senior Counsel & Assistant Secretary, Great-West Funds, Inc., Great-West Capital Management, LLC, Great-West Trust Company, LLC, and Advised Assets Group, LLC (2014-2019). Ms. Owen also serves as Secretary of ALPS ETF Trust, Vice President and Secretary of Boulder Growth & Income Fund, and Assistant Secretary of James Advantage Funds. |
| 58 | www.emeraldmutualfunds.com |
| Emerald Funds | Trustees and Officers |
April 30, 2021 (Unaudited)
| OFFICERS | |||
| Name, Address* & Year of Birth | Position(s) Held with Fund | Term of Office** and Length of Time Served | Principal Occupation(s) During Past 5 Years*** |
| Ted Uhl, 1974 | Chief Compliance Officer (“CCO”) | Mr. Uhl was appointed CCO of the Trust at the June 8, 2010 meeting of the Board of Trustees. | Mr. Uhl joined ALPS in October 2006, and is currently Deputy Compliance Officer of ALPS. Prior to his current role, Mr. Uhl served as Senior Risk Manager for ALPS from October 2006 until June 2010. Before joining ALPS, Mr. Uhl served a Sr. Analyst with Enenbach and Associates (RIA), and a Sr. Financial Analyst at Sprint. Because of his position with ALPS, Mr. Uhl is deemed an affiliate of the Trust as defined under the 1940 Act. Mr. Uhl is also CCO of the Boulder Growth & Income Fund, Inc., Centre Funds, Index Funds, Reality Shares ETF Trust, Reaves Utility Income Fund and XAI Octagon Floating Rate & Alternative Income Term Trust. |
| Jennifer Craig, 1973 | Assistant Secretary | Ms. Craig was appointed Assistant Secretary of the Trust at the June 8, 2016 meeting of the Board of Trustees. | Ms. Craig joined ALPS in 2007 and is currently Assistant Vice President and Paralegal Manager of ALPS. Because of her position with ALPS, Ms. Craig is deemed an affiliate of the Trust as defined under the 1940 Act. Ms. Craig is also Secretary of Principal Real Estate Income Fund, Assistant Secretary of ALPS ETF Trust, Clough Global Dividend and Income Fund, Clough Global Equity Fund, Clough Global Opportunities Fund, Liberty All-Star Equity Fund and Liberty All-Star Growth Fund, Inc. and Clerk of Goehring & Rozencwajg Investment Funds. |
| * | All communications to Trustees and Officers may be directed to Financial Investors Trust c/o 1290 Broadway, Suite 1000, Denver, CO 80203. |
| ** | This is the period for which the Trustee or Officer began serving the Trust. Each Trustee serves an indefinite term, until such Trustees successor is elected and appointed, or such Trustee resigns or is deceased. Officers are elected on an annual basis. |
| *** | Except as otherwise indicated, each individual has held the office shown or other offices in the same company for the last five years. |
| **** | The Fund Complex includes all series of the Trust, currently 31, and any other investment companies for which any Trustee serves as trustee for and for which Emerald Mutual Fund Advisers Trust provides investment advisory services (currently none). |
| ***** | Mr. Swenson resigned his position as President of the Trust effective June 9, 2021 and Ms. Gilomen resigned her position as Secretary of the Trust effective June 4, 2021. |
| Annual Report | April 30, 2021 | 59 |
| Emerald Funds | Privacy Policy |
| Who We Are | |
| Who is providing this notice? | Emerald Banking and Finance Fund, Emerald Growth Fund, Emerald Insights Fund |
| What We Do | |
| How do the Funds protect my personal information? | To protect your personal information from unauthorized access and use, we use security measures that comply with federal law. These measures include computer safeguards and secured files and buildings. |
| How do the Funds collect my personal information? | We collect your personal information, for example, when you
• open an account • provide account information or give us your contact information • make a wire transfer or deposit money |
| Why can’t I limit all sharing? | Federal law gives you the right to limit only
• sharing for affiliates’ everyday business purposes-information about your creditworthiness • affiliates from using your information to market to you • sharing for non-affiliates to market to you
State laws and individual companies may give you additional rights to limit sharing. |
| Definitions | |
| Affiliates | Companies related by common ownership or control. They can be financial and nonfinancial companies. |
| Non-affiliates | Companies not related by common ownership or control. They can be financial and nonfinancial companies.
• The Funds do not share with non-affiliates so they can market to you. |
| Joint marketing | A formal agreement between non-affiliated financial companies that together market financial products or services to you.
• The Funds do not jointly market. |
| Other Important Information | |
| California residents | If your account has a California home address, your personal information will not be disclosed to nonaffiliated third parties except as permitted by applicable California law, and we will limit sharing such personal information with our affiliates to comply with California privacy laws that apply to us. |
| Vermont residents | The State of Vermont requires financial institutions to obtain your consent prior to sharing personal information that they collect about you with affiliated companies and nonaffiliated third parties other than in certain limited circumstances. Except as permitted by law, we will not share personal information we collect about you with nonaffiliated third parties or other affiliated companies unless you provide us with your written consent to share such information. |
| 60 | www.emeraldmutualfunds.com |
| Emerald Funds | Privacy Policy |
| FACTS | WHAT DO THE FUNDS DO WITH YOUR PERSONAL INFORMATION? |
| WHY? | Financial companies choose how they share your personal information. Federal law gives consumers the right to limit some but not all sharing. Federal law also requires us to tell you how we collect, share, and protect your personal information.
Please read this notice carefully to understand what we do. |
| WHAT? | The types of personal information we collect and share depend on the product or service you have with us. This information can include:
• Social Security number and account transactions • Account balances and transaction history • Wire transfer instructions |
| HOW? | All financial companies need to share customers’ personal information to run their everyday business. In the section below, we list the reasons financial companies can share their customers’ personal information; the reasons the Funds choose to share; and whether you can limit this sharing. |
| Reasons we can share your personal information | Do the funds share: | Can you limit this sharing? |
| For our everyday business purposes – | ||
| such as to process your transactions, maintain your account(s), respond to court orders and legal investigations, or report to credit bureaus | Yes | No |
| For our marketing purposes – to offer our products and services to you | No | We do not share. |
| For joint marketing with other financial companies | No | We do not share. |
| For our affiliates’ everyday business purposes – information about your transactions and experiences | Yes | No |
| For our affiliates’ everyday business purposes – information about your creditworthiness | No | We do not share. |
| For non-affiliates to market to you | No | We do not share. |
| Annual Report | April 30, 2021 | 61 |


TABLE OF CONTENTS
| Shareholder Letter | 1 |
| Performance Update | 7 |
| Disclosure of Fund Expenses | 34 |
| Portfolio of Investments | |
| Grandeur Peak Emerging Markets Opportunities Fund | 36 |
| Grandeur Peak Global Contrarian Fund | 40 |
| Grandeur Peak Global Micro Cap Fund | 43 |
| Grandeur Peak Global Opportunities Fund | 47 |
| Grandeur Peak Global Reach Fund | 51 |
| Grandeur Peak Global Stalwarts Fund | 57 |
| Grandeur Peak International Opportunities Fund | 61 |
| Grandeur Peak International Stalwarts Fund | 65 |
| Grandeur Peak US Stalwarts Fund | 68 |
| Statements of Assets and Liabilities | 70 |
| Statements of Operations | 73 |
| Statements of Changes in Net Assets | |
| Grandeur Peak Emerging Markets Opportunities Fund | 76 |
| Grandeur Peak Global Contrarian Fund | 77 |
| Grandeur Peak Global Micro Cap Fund | 78 |
| Grandeur Peak Global Opportunities Fund | 79 |
| Grandeur Peak Global Reach Fund | 80 |
| Grandeur Peak Global Stalwarts Fund | 81 |
| Grandeur Peak International Opportunities Fund | 82 |
| Grandeur Peak International Stalwarts Fund | 83 |
| Grandeur Peak US Stalwarts Fund | 84 |
| Financial Highlights | |
| Grandeur Peak Emerging Markets Opportunities Fund | 85 |
| Grandeur Peak Global Contrarian Fund | 87 |
| Grandeur Peak Global Micro Cap Fund | 88 |
| Grandeur Peak Global Opportunities Fund | 89 |
| Grandeur Peak Global Reach Fund | 91 |
| Grandeur Peak Global Stalwarts Fund | 93 |
| Grandeur Peak International Opportunities Fund | 95 |
| Grandeur Peak International Stalwarts Fund | 97 |
| Grandeur Peak US Stalwarts Fund | 99 |
| Notes to Financial Statements | 100 |
| Report of Independent Registered Public Accounting Firm | 115 |
| Additional Information | 116 |
| Trustees and Officers | 118 |
| Privacy Policy | 122 |
| Grandeur Peak Funds® | Shareholder Letter |
April 30, 2021 (Unaudited)
Dear Fellow Shareholders,
In June 1992, Eugene Fama and Kenneth French published their seminal paper, “Common Risk Factors in the Returns on Stocks and Bonds,” in the Journal of Financial Economics. With this paper, the era of Factor Investing was born and equity portfolios the world over began to be allocated into buckets of Small Cap vs. Large Cap and Value vs. Growth. To build their Size and Value Factors, Fama/French used excess returns on 25 portfolios, formed on market cap (Size) and book-to-market equity (Value) as dependent variables in the time-series regressions. The Size factor was named SMB: “Small minus Big” and the Value Factor was named HML: “High minus Low (Book-to-Market Equity Ratio).” The irony of the timing of their paper is that Large Cap Growth stocks1, the very type of stocks that the paper claimed underperform markets on a regular basis, went on a tear in the latter half of the 1990s, outperforming Small Cap Value stocks2 by 255% on a cumulative basis from January 1995 – August 2000, when Large Cap growth stocks peaked, as shown in Exhibit 1.
Exhibit 1: Large Cap Growth (Russell 200 Growth Index) vs. Small Cap Value (Russell 2000 Value Index)

Source: FTSE Russell (data from January 1995 – August 2000).
Past performance is no indication of future returns.
In the close to 30 years since the Fama/French paper was published, the academics have discovered a myriad of other market factors, and the opportunists have launched a host of indexes and investment products based on those factors. And yet the debate still rages: Growth vs. Value, Small Cap vs. Large Cap, and Quality vs. Junk. Hopefully you know how we view the world at Grandeur Peak Global Advisors. We believe that Quality outperforms, but that Valuation is incredibly important. We also like hunting for great investments among the small cap names across the globe, not because we necessarily think the Fama/French Size Factor leads to excess return, but because we believe that smaller companies can grow faster for longer than large companies. We also believe that the enormity of the global small cap market makes for better fishing, and we like to throw as wide a net as possible when looking for opportunity, and we like to fish in lakes where there are fewer people casting their nets.
Index provider MSCI is one of the opportunists that have created a slew of Factor-based indexes over the years, and as we come up on our 10th anniversary as a firm, we thought it would be interesting to compare how our “Quality at a Reasonable Price,” investment style has fared. As Global investors, we like to compare MSCI’s series of World Indexes.
| 1 | As measured by the Russell 200 Large Cap Growth Index |
| 2 | As measured by the Russell 2000 Small Cap Value Index |
| Annual Report | April 30, 2021 | 1 |
| Grandeur Peak Funds® | Shareholder Letter |
April 30, 2021 (Unaudited)
The MSCI World Index captures Large- and Mid-cap representation across 23 Developed Market countries. The MSCI World Large Cap Index is a subset to the MSCI World Index, which captures the largest companies in each country (approximately 70% of the free float-adjusted market capitalization). The MSCI World Small Cap Index captures the smallest companies in each country (approximately 14% of the free float-adjusted market capitalization).
The MSCI World Growth Index is a subset of the MSCI World Index of stocks that exhibits overall Growth Characteristics using 5 variables3. The MSCI World Value Index is a subset of the MSCI World Index of stocks that exhibit Value Characteristics using 3 variables4.
The MSCI World Quality Index is a subset of the MSCI World Index of stocks that exhibit Quality Characteristics using 3 variables5. The MSCI World Prime Value Index is designed to represent the performance of companies with relatively low valuations and high quality characteristics. It can be considered a “Quality Value” index where the MSCI World Quality Index can be considered “Quality Growth”.
Exhibit 2 shows the 10yr annualized returns of these 7 indexes from April 2010 through the market meltdown of March 2020 (we’ll look at how they’ve done since then in just a moment).
Exhibit 2: Annualized 10-yr Returns through March 2020

Source: MSCI (data from 3/31/2011 – 3/31/2021).
Past performance is no indication of future returns.
As you can see, over the 10 years ended March 31, 2020, Large companies outperformed Small (but not by much), Growth outperformed Value by a lot, and Quality outperformed generic stocks, both in the Growth and Value space. The Prime Value Index (Quality Value) outperformed the traditional Value index, and the Quality Index (Quality Growth) outperformed the traditional Growth index. Fortunately, for Grandeur Peak and our clients Quality Growth was the place to be.
Exhibit 3 takes a longer term view and shows Annualized returns from January 2001 through March 2020.
| 3 | Long-term forward Earnings-Per-Share (EPS) growth rate, Short-term forward EPS growth rate, Current internal growth rate, Long-term historical EPS growth trend, and Long-term historical sales per share growth trend |
| 4 | Book value-to-price ratio, 12-month forward earnings-to-price ratio, and Dividend yield |
| 5 | High return on equity (ROE), Stable year-over-year earnings growth, and Low financial leverage |
| 2 | 1.855.377.7325 | www.GrandeurPeakGlobal.com |
| Grandeur Peak Funds® | Shareholder Letter |
April 30, 2021 (Unaudited)
Exhibit 3: Annualized Returns Jan 2001 – Mar 2020
Source: MSCI (data from 12/31/2000 – 3/31/2021).
Past performance is no indication of future returns.
Longer-term, since the dot.com crash of 2001, Small Caps outperformed Large Caps by a lot. But more interesting for us is that while traditional Growth outperformed traditional Value, the difference between Quality Value and Quality Growth was negligible.
Exhibit 4 shows more recent returns for these indexes, for the last 12 months through from the 3/31/2020 market bottom through 3/31/2021.
Exhibit 4: Last 12-month Returns Apr 2020 – Mar 2021

Source: MSCI (data from 3/31/2020 – 3/31/2021).
Past performance is no indication of future returns.
| Annual Report | April 30, 2021 | 3 |
| Grandeur Peak Funds® | Shareholder Letter |
April 30, 2021 (Unaudited)
Since the market bottom last March (2020), Small caps have come screaming back and traditional Growth continues to outperform traditional Value as of the date of this report. But again, as of April 30th, Quality Value has continued to perform, even as Quality Growth has underperformed traditional Growth.
As you may recall, in September 2019 we launched a Quality Value strategy, Grandeur Peak Global Contrarian. Within our traditional Quality, Value, Momentum (QVM) framework, the Global Contrarian team is taking more of a VQM approach. That is, Value first, Quality second. While the Global Contrarian strategy is the purest expression of our Quality Value approach, the best thing about our QVM framework (in our opinion), is that we can be flexible across the Quality spectrum. So, while Quality Growth has been the place to be for the past 10 years, there may come a time where a more disciplined approach on valuation becomes warranted. That is, while we will never be able to guess which Factors may outperform over the next 10 years, we believe that we are well prepared to continue finding high quality companies, on both the Value and Growth side of the equation going forward.
Business Update
We recently closed several Funds to new investments due to the continued strength of global markets. We continuously monitor capacity at both the strategy and firm level. We are committed to keeping our investment strategies nimble to pursue their investment objectives without being unduly encumbered by their individual asset base or the firm’s collective assets. Achieving performance for Grandeur Peak clients is our paramount objective.6
Our tag line, “Elevated Global Investing,” highlights our focus and approach to go above and beyond in covering the global investable universe. We believe by seeing the global opportunity set, we can make elevated investment decisions. We’ve recently extended the tag line to include, “Active At Its Best,” to emphasize what we believe is a key differentiator of our investment approach… to very actively engage, and dig deep to understand, each company in which we invest. Active investing7 is a hallmark of our firm, and in an industry that has been shifting towards passive investments over the past decade, we feel our very active approach provides an increasingly distinct and exciting opportunity to outperform over the long-term. We are not shying away from our strength as active investors.
Our Sustainability Team has begun a quarterly report which summarizes many of the efforts being made across the investment team on ESG ("Environmental, Social and Governance") topics. The report includes details of our Sustainability Framework, company engagement and collaboration, our independent research and answers to frequently asked questions. It also includes sustainability profiles of our Funds and our owned companies for your reference.
Fund Performance & Attribution
The market has been favoring a very different set of companies to begin 2021 vs what we saw in 2020. With growing hope that we have turned the corner on COVID-19, many of what we would consider lower quality companies have been seeing a nice rebound, while many of our solid executors from last year have seen their stock prices underperform in markets rotating away from quality. Over the last several months we have been buying these higher quality names opportunistically in the Funds, taking advantage of the volatility, as we believe quality is the right space for long-term investments.
The last twelve months have been a very unusual period for global equity markets, with very strong absolute returns. It was definitely a period that brings to mind the common disclosure “past performance is no indication of future results.” We are very pleased to report the sizeable outperformance of the Grandeur Peak Funds vs their benchmarks for the year ending April 30, 2021. Given our quality focus, we generally seek to just keep up in strong bull markets, but the markets favored our style this year, and when combined with solid stock picking across our team, the nine Grandeur Peak Funds all delivered very nice gains, ranging from 59.92% to 102.43%.
Emerging Markets Opportunities: For the year, the Institutional share class returned a healthy +60.30% vs +63.05% for the benchmark. All regions of the emerging markets benchmark index posted very strong returns for the year. The Fund’s best returns came in Central Asia, but the Fund’s small underperformance in Asia Pacific, where the majority of the portfolio and benchmark reside, outweighed other areas of outperformance. Across sectors, the Fund outperformed the benchmark in Technology, but lagged in Consumer and Healthcare.
| 6 | The Grandeur Peak Funds’ investment objective is long-term growth of capital; Grandeur Peak Funds’ Prospectus dated 8/31/2020. |
| 7 | If you’re not familiar with the terms “Active” and “Passive” investing, Active investing refers to the process of actively evaluating individual companies and selecting investments based on the merits of each company, while Passive investing refers to investing in a bundle of companies, typically in the form of Index Funds (a group of companies compiled to mimic a specific index – e.g. the S&P 500) or ETFs (Exchange Traded Funds, which are also a basic group of companies designed to mimic an index, industry, geography, or such) without evaluating the individual companies within the bundle. |
| 4 | 1.855.377.7325 | www.GrandeurPeakGlobal.com |
| Grandeur Peak Funds® | Shareholder Letter |
April 30, 2021 (Unaudited)
Global Contrarian: For the year, the Fund outperformed with a +78.51% return vs +66.94% for the benchmark. The Fund outperformed the benchmark in every region except Eastern Europe and a slight underperformance in North America, which together only make up about 17% of the portfolio. The Fund’s largest concentration is in Asia Pacific, where the Fund outperformed by more than 29 percentage points. Across sectors, Technology was a large contributor to performance, as was Financials, while the Fund lagged in Consumer.
Global Micro Cap: For the year, the Fund enjoyed a return of +102.43% return vs +67.65% for the benchmark, as micro caps finally enjoyed a tailwind. Every geography saw positive returns, but the biggest drivers of Fund performance were Western Europe and Asia Pacific where the Fund was overweight and outperformed. The biggest detractor was North America, where the Fund still outperformed the benchmark, but was significantly underweight. From a sector standpoint, the Fund outperformed across each sector, but the underweight to Industrials detracted slightly from performance.
Global Opportunities/International Opportunities: For the year, the Global Opportunities Institutional share class returned +83.44% vs +67.65% for the benchmark, and the International Opportunities Institutional share class also returned relative outperformance of +76.29% vs 58.94% for the benchmark. The Funds’ common big weights are in Asia Pacific and Western Europe. The Funds outperformed and were overweight in both these geographies. The Global Fund’s underweight to North America was detractor to performance, even though the Fund slightly outperformed in that region as well. The International Fund outperformed the benchmark across sectors, while the Global Fund did so except in the Consumer sector.
Global Reach: For the year, the Institutional share class returned +77.81% vs +67.65% for the benchmark. Stock picking and the Fund’s underweight in the US contributed positively to performance during the period. The Fund’s big weights were in Asia Pacific, Western Europe, and North America. The Fund outperformed and was overweight in both Asia Pacific and Western Europe. The Fund slightly underperformed in the North American markets. The Fund outperformed the benchmark across Technology, Healthcare, Financials and Industrials, but slightly underperformed in the Consumer sector.
Global Stalwarts/International Stalwarts: For the year, the Global Stalwarts Institutional share class returned +68.62% vs +54.93% for the benchmark, and the International Stalwarts Institutional share class returned relative performance of +67.61% vs +47.49% for the benchmark. The Funds’ outperformance came from all regions, except Eastern Europe, which makes up less than 2% of either Fund. The Funds’ strength in Asia Pacific was a key driver to the Funds’ outperformance. The Global Fund remained a little underweight in the North America markets, but its outperformance in that region helped lessen the impact. The Funds outperformed the benchmark across sectors, with Consumer being the smallest outperformance for both Funds.
US Stalwarts: For the year, the Fund outperformed with a +73.67% return vs +62.89% for the benchmark. Health Care was the Fund’s strongest sector, and it helped to be a little overweight there. Fund performance also saw positive contributions from the Consumer and Industrials sectors. The Fund’s two largest sector weights were in Technology and Financials, both of which the Fund slightly underperformed the benchmark.
We are optimistic about the general decline in COVID-19 cases in Utah, which we hope will allow for a carefully planned return to our offices this summer. Regardless of where our team sits, we are fully engaged in our efforts to serve you, our clients, in seeking to find the most interesting investment opportunities around the world.
As always, please feel free to reach out any time with any questions, requests or comments. We appreciate the opportunity to work on your behalf.
Sincerely,
Your Grandeur Peak Team
The objective of all Grandeur Peak Funds is long-term growth of capital.
RISKS: Investing in small and micro-cap funds will be more volatile and loss of principal could be greater than investing in large cap or more diversified funds. Investing in foreign securities entails special risks, such as currency fluctuations and political uncertainties, which are described in more detail in the prospectus. Investments in emerging markets are subject to the same risks as other foreign securities and may be subject to greater risks than investments in foreign countries with more established economies and securities markets.
An investor should consider investment objectives, risks, charges, and expenses carefully before investing. To obtain a Grandeur Peak Funds prospectus, containing this and other information, visit www.grandeurpeakglobal.com or call 1-855-377-7325. Please read it carefully before investing.
The views and information discussed in this commentary are as of the date of publication, are subject to change, and may not reflect the writer’s current views. The views expressed represent an assessment of market conditions at a specific point in time, are opinions only and should not be relied upon as investment advice regarding a particular investment or markets in general. Such information does not constitute a recommendation to
| Annual Report | April 30, 2021 | 5 |
| Grandeur Peak Funds® | Shareholder Letter |
April 30, 2021 (Unaudited)
buy or sell specific securities or investment vehicles. It should not be assumed that any investment will be profitable or will equal the performance of the Funds or any securities or any sectors mentioned herein. The subject matter contained herein has been derived from several sources believed to be reliable and accurate at the time of compilation. The Funds do not accept any liability for losses either direct or consequential caused by the use of this information.
Past performance does not guarantee future results.
Grandeur Peak Funds are distributed by ALPS Distributors, Inc. (ADI). ADI is not affiliated with Grandeur Peak Global Advisors.
A mortgage-backed security is a type of asset-backed security which is secured by a mortgage or collection of mortgages. The mortgages are aggregated and sold to a group of individuals that securitizes, or packages, the loans together into a security that investors can buy.
The term “high-yield funds” generally refers to mutual funds or exchange-traded funds (ETFs) that hold stocks that pay above-average dividends, bonds with above-average interest payments, or a combination of both.
Investing in securities that meet ESG criteria may result in the Funds forgoing otherwise attractive opportunities, which may result in underperformance when compared to funds that do not consider ESG factors.
Quantitative easing is a monetary policy whereby a central bank purchases at scale government bonds or other financial assets in order to inject money into the economy to expand economic activity.
The S&P 500® Index is an unmanaged index of 500 common stocks chosen for market size, liquidity and industry group representation. It is a market-value weighted index. The Index is not actively managed and does not reflect any deductions for fees, expenses or taxes. An investor may not invest directly in the Index.
| 6 | 1.855.377.7325 | www.GrandeurPeakGlobal.com |
| Grandeur Peak Emerging Markets Opportunities Fund | Performance Update |
April 30, 2021 (Unaudited)
Annualized Total Return Performance for the periods ended April 30, 2021
| Since | Expense Ratio(b) | |||||
| 1 Year | 3 Years | 5 Years | Inception(a) | Gross | Net(c) | |
Grandeur Peak Emerging Markets Opportunities Fund – Investor (GPEOX) | 59.92% | 11.11% | 12.85% | 9.16% | 1.78% | 1.78% |
Grandeur Peak Emerging Markets Opportunities Fund – Institutional (GPEIX) | 60.30% | 11.36% | 13.11% | 9.41% | 1.53% | 1.53% |
MSCI Emerging Markets SMID Cap Index(d) | 63.05% | 6.43% | 10.27% | 6.16% | ||
MSCI Emerging Markets IMI Index(e) | 51.70% | 7.88% | 12.64% | 7.09% | ||
Performance data quoted represents past performance. Past performance does not guarantee future results. Investment return and principal value of an investment will fluctuate so that an investor’s shares, when sold or redeemed, may be worth more or less than the original cost. The Fund imposes a 2.00% redemption fee on shares held for less than 60 days. Current performance data may be higher or lower than actual data quoted. For the most current month-end performance data, please call 1-855-377-PEAK (7325).
The table does not reflect the deduction of taxes a shareholder would pay on Fund distributions or redemption of Fund shares.
Subject to investment risks, including possible loss of the principal amount invested.
Returns for periods less than 1 year are cumulative.
��
| (a) | Fund inception date of December 16, 2013. |
| (b) | Ratios as of the Prospectus dated August 31, 2020 and may differ from the ratios presented in the Financial Highlights. |
| (c) | Grandeur Peak Global Advisors, LLC (the “Adviser”), has agreed to waive and/or reimburse fees or expenses in order to limit Total Annual Fund Operating Expenses After Fee Waiver/Expense Reimbursement (excluding acquired fund fees and expenses, brokerage expenses, interest expenses, taxes and extraordinary expenses) to 1.95% and 1.70% of the Fund’s average daily net assets for the Fund’s Investor Class Shares and Institutional Class Shares, respectively. This agreement (the “Expense Agreement”) is in effect through August 31, 2021. The Adviser will be permitted to recover, on a class- by-class basis, expenses it has borne through the Expense Agreement to the extent that a Fund’s expenses in later periods fall below annual rates set forth in the Expense Agreement; provided, however, that such recapture payments do not cause the Fund’s expense ratio (after recapture) to exceed the lesser of (i) the expense cap in effect at the time of the waiver and (ii) the expense cap in effect at the time of the recapture. Notwithstanding the foregoing, the Fund will not be obligated to pay any such deferred fees and expenses more than three years after the date on which the fee and expenses was deferred. The Expense Agreement may not be terminated or modified prior to August 31, 2021 except with the approval of the Fund’s Board of Trustees. |
| (d) | The MSCI Emerging Markets SMID Cap Index is designed to measure the equity market performance of small and mid-cap companies across emerging markets. MSCI makes no express or implied warranties or representations and shall have no liability whatsoever with respect to any MSCI data contained herein. The MSCI data may not be further redistributed or used to create indices or financial products. The Index is not actively managed and does not reflect any deductions for fees, expenses or taxes. An investor may not invest directly into the Index. |
| (e) | The MSCI Emerging Markets IMI Index is designed to measure the equity market performance of large, mid, and small-cap companies across emerging markets. The Index is not actively managed and does not reflect any deductions for fees, expenses or taxes. An investor may not invest directly into the Index. |
| Annual Report | April 30, 2021 | 7 |
| Grandeur Peak Emerging Markets Opportunities Fund | Performance Update |
April 30, 2021 (Unaudited)
Growth of $10,000 for the period ended April 30, 2021

The chart shown above represents a hypothetical investment of $10,000 in the Fund’s Investor Class shares for the period from inception to April 30, 2021. All returns reflect reinvested dividends, but do not reflect the deduction of taxes that an investor would pay on distributions or redemptions.
Investing in the Fund is subject to investment risks, including possible loss of the principal amount invested.
The Fund also offers Institutional Class shares, performance for which is not reflected in the graphs above. The performance of Institutional Class shares may be higher or lower than the performance of the Investor Class shares shown in the graphs above based upon differences in fees paid by shareholders investing in the Investor Class shares and Institutional Class shares.
| 8 | 1.855.377.7325 | www.GrandeurPeakGlobal.com |
| Grandeur Peak Emerging Markets Opportunities Fund | Performance Update |
April 30, 2021 (Unaudited)
| Regional Allocation (as a % of Net Assets)* | |
| Asia ex Japan | 70.6% |
| Latin America | 10.6% |
| Europe | 8.7% |
| Africa/Middle East | 3.8% |
| North America | 3.4% |
| Cash, Cash Equivalents, & Other Net Assets | 2.9% |
| Total | 100.0% |
| Top 10 Holdings (as a % of Net Assets)* | |
| Silergy Corp. | 3.9% |
| WNS Holdings, Ltd. | 2.4% |
| Metropolis Healthcare, Ltd. | 1.9% |
| Poya International Co., Ltd. | 1.9% |
| Dino Polska SA | 1.8% |
| IndiaMart InterMesh, Ltd. | 1.8% |
| Pagseguro Digital, Ltd. | 1.5% |
| Genpact, Ltd. | 1.5% |
| Locaweb Servicos de Internet SA | 1.5% |
| Tokai Carbon Korea Co., Ltd. | 1.4% |
| Total | 19.6% |
| * | Holdings are subject to change, and may not reflect the current or future position of the portfolio. |
| Annual Report | April 30, 2021 | 9 |
| Grandeur Peak Global Contrarian Fund | Performance Update |
April 30, 2021 (Unaudited)
Annualized Total Return Performance for the periods ended April 30, 2021
| Since | Expense Ratio(b) | |||
| 1 Year | Inception(a) | Gross | Net(c) | |
Grandeur Peak Global Contrarian Fund – Institutional (GPGCX) | 78.51% | 32.21% | 4.08% | 1.36% |
| MSCI All Country World Index Small Cap Value(d) | 66.94% | 18.94% | ||
| MSCI All Country World Index Small Cap(e) | 67.65% | 25.16% | ||
Performance data quoted represents past performance. Past performance does not guarantee future results. Investment return and principal value of an investment will fluctuate so that an investor’s shares, when sold or redeemed, may be worth more or less than the original cost. The Fund imposes a 2.00% redemption fee on shares held for less than 60 days. Current performance data may be higher or lower than actual data quoted. For the most current month-end performance data, please call 1-855-377-PEAK (7325).
The table does not reflect the deduction of taxes a shareholder would pay on Fund distributions or redemption of Fund shares.
Subject to investment risks, including possible loss of the principal amount invested.
Returns for periods less than 1 year are cumulative.
| (a) | Fund inception date of September 17, 2019. |
| (b) | Ratios as of the Prospectus dated August 31, 2020 and may differ from the ratios presented in the Financial Highlights. |
| (c) | Grandeur Peak Global Advisors, LLC (the “Adviser”), has agreed to waive and/or reimburse fees or expenses in order to limit Total Annual Fund Operating Expenses After Fee Waiver/Expense Reimbursement (excluding acquired fund fees and expenses, brokerage expenses, interest expenses, taxes and extraordinary expenses) to 1.35% of the Fund’s average daily net assets for the Fund’s Institutional Class Shares. This agreement (the “Expense Agreement”) is in effect through August 31, 2021. The Adviser will be permitted to recover, on a class- by-class basis, expenses it has borne through the Expense Agreement to the extent that a Fund’s expenses in later periods fall below annual rates set forth in the Expense Agreement; provided, however, that such recapture payments do not cause the Fund’s expense ratio (after recapture) to exceed the lesser of (i) the expense cap in effect at the time of the waiver and (ii) the expense cap in effect at the time of the recapture. Notwithstanding the foregoing, the Fund will not be obligated to pay any such deferred fees and expenses more than three years after the date on which the fee and expenses was deferred. The Expense Agreement may not be terminated or modified prior to August 31, 2021 except with the approval of the Fund’s Board of Trustees. |
| (d) | The MSCI ACWI Small Cap Value Index is designed to measure small cap companies exhibiting overall value style characteristics across developed and emerging markets globally. The Index is not actively managed and does not reflect any deductions for fees, expenses or taxes. An investor may not invest directly into the Index. |
| (e) | The MSCI ACWI Small Cap Index is designed to measure the equity market performance of performance of small-cap companies across developed and emerging markets globally. MSCI makes no express or implied warranties or representations and shall have no liability whatsoever with respect to any MSCI data contained herein. The MSCI data may not be further redistributed or used to create indices or financial products. The Index is not actively managed and does not reflect any deductions for fees, expenses or taxes. An investor may not invest directly into the Index. |
| 10 | 1.855.377.7325 | www.GrandeurPeakGlobal.com |
| Grandeur Peak Global Contrarian Fund | Performance Update |
April 30, 2021 (Unaudited)
Growth of $10,000 for the period ended April 30, 2021
The chart shown above represents a hypothetical investment of $10,000 in the Fund’s Institutional Class shares for the period from inception to April 30, 2021. All returns reflect reinvested dividends, but do not reflect the deduction of taxes that an investor would pay on distributions or redemptions.
Investing in the Fund is subject to investment risks, including possible loss of the principal amount invested.
| Annual Report | April 30, 2021 | 11 |
| Grandeur Peak Global Contrarian Fund | Performance Update |
April 30, 2021 (Unaudited)
| Regional Allocation (as a % of Net Assets)* | |
| Asia ex Japan | 30.2% |
| Europe | 22.5% |
| North America | 21.9% |
| Japan | 14.4% |
| Australia/New Zealand | 4.8% |
| Africa/Middle East | 2.5% |
| Latin America | 0.8% |
| Cash, Cash Equivalents, & Other Net Assets | 2.9% |
| Total | 100.0% |
| Top 10 Holdings (as a % of Net Assets)* | |
| Seria Co., Ltd. | 2.8% |
| Barrett Business Services, Inc. | 2.6% |
| Bank of NT Butterfield & Son, Ltd. | 2.5% |
| Fiducian Group, Ltd. | 2.5% |
| Ultra Electronics Holdings PLC | 2.0% |
| Guardian Capital Group, Ltd. | 2.0% |
| Plover Bay Technologies, Ltd. | 1.9% |
| Hackett Group, Inc. | 1.9% |
| Naigai Trans Line, Ltd. | 1.9% |
| Esquire Financial Holdings, Inc. | 1.7% |
| Total | 21.8% |
| * | Holdings are subject to change, and may not reflect the current or future position of the portfolio. |
| 12 | 1.855.377.7325 | www.GrandeurPeakGlobal.com |
| Grandeur Peak Global Micro Cap Fund | Performance Update |
April 30, 2021 (Unaudited)
Annualized Total Return Performance for the periods ended April 30, 2021
| Since | Expense Ratio(b) | |||||
| 1 Year | 3 Years | 5 Years | Inception(a) | Gross | Net(c) | |
Grandeur Peak Global Micro Cap Fund – Institutional (GPMCX) | 102.43% | 22.51% | 20.37% | 19.06% | 2.06% | 2.00% |
MSCI All Country World Index Small Cap(d) | 67.65% | 12.55% | 14.11% | 13.03% | ||
| MSCI World Micro Cap Index(e) | 80.94% | 12.44% | 14.81% | 14.00% | ||
Performance data quoted represents past performance. Past performance does not guarantee future results. Investment return and principal value of an investment will fluctuate so that an investor’s shares, when sold or redeemed, may be worth more or less than the original cost. The Fund imposes a 2.00% redemption fee on shares held for less than 60 days. Current performance data may be higher or lower than actual data quoted. For the most current month-end performance data, please call 1-855-377-PEAK (7325).
The table does not reflect the deduction of taxes a shareholder would pay on Fund distributions or redemption of Fund shares.
Subject to investment risks, including possible loss of the principal amount invested.
Returns for periods less than 1 year are cumulative.
| (a) | Fund inception date of October 20, 2015. |
| (b) | Ratios as of the Prospectus dated August 31, 2020 and may differ from the ratios presented in the Financial Highlights. |
| (c) | Grandeur Peak Global Advisors, LLC (the “Adviser”), has agreed to waive and/or reimburse fees or expenses in order to limit Total Annual Fund Operating Expenses After Fee Waiver/ Expense Reimbursement (excluding acquired fund fees and expenses, brokerage expenses, interest expenses, taxes and extraordinary expenses) to 2.00% of the Fund’s average daily net assets for the Fund’s Institutional Class Shares. This agreement is in effect through August 31, 2021. The Adviser will be permitted to recover expenses it has borne through this agreement to the extent that a Fund’s expenses in later periods fall below annual rates set forth in the Expense Agreement; provided, however, that such recapture payments do not cause the Fund’s expense ratio (after recapture) to exceed the lesser of (i) the expense cap in effect at the time of the waiver and (ii) the expense cap in effect at the time of the recapture. Notwithstanding the foregoing, the Fund will not be obligated to pay any such deferred fees and expenses more than three years after the date on which the fee and expenses was deferred . This agreement may not be terminated or modified prior to August 31, 2021 except with the approval of the Fund’s Board of Trustees. |
| (d) | The MSCI ACWI Small Cap Index is designed to measure the equity market performance of performance of small-cap companies across developed and emerging markets globally. MSCI makes no express or implied warranties or representations and shall have no liability whatsoever with respect to any MSCI data contained herein. The MSCI data may not be further redistributed or used to create indices or financial products. The Index is not actively managed and does not reflect any deductions for fees, expenses or taxes. An investor may not invest directly into the Index. |
| (e) | The MSCI World Micro Cap Index is designed to measure the equity market performance of micro-cap companies across developed markets globally. It does not include emerging markets. The Index is not actively managed and does not reflect any deductions for fees, expenses or taxes. An investor may not invest directly into the Index. |
| Annual Report | April 30, 2021 | 13 |
| Grandeur Peak Global Micro Cap Fund | Performance Update |
April 30, 2021 (Unaudited)
Growth of $10,000 for the period ended April 30, 2021

The chart shown above represents a hypothetical investment of $10,000 in the Fund’s Institutional Class shares for the period from inception to April 30, 2021. All returns reflect reinvested dividends, but do not reflect the deduction of taxes that an investor would pay on distributions or redemptions.
Investing in the Fund is subject to investment risks, including possible loss of the principal amount invested.
| 14 | 1.855.377.7325 | www.GrandeurPeakGlobal.com |
| Grandeur Peak Global Micro Cap Fund | Performance Update |
April 30, 2021 (Unaudited)
| Regional Allocation (as a % of Net Assets)* | |
| Europe | 41.4% |
| Asia ex Japan | 19.9% |
| Japan | 15.8% |
| North America | 15.1% |
| Australia/New Zealand | 5.7% |
| Latin America | 1.3% |
| Africa/Middle East | 0.5% |
| Cash, Cash Equivalents, & Other Net Assets | 0.3% |
| Total | 100.0% |
| Top 10 Holdings (as a % of Net Assets)* | |
| SwedenCare AB | 3.7% |
| Joint Corp. | 3.6% |
| Musti Group Oyj | 2.4% |
| Impax Asset Management Group PLC | 1.8% |
| K3 Capital Group PLC | 1.8% |
| Sarantis SA | 1.8% |
| Westwing Group AG | 1.8% |
| Kogan.com, Ltd. | 1.6% |
| Syuppin Co., Ltd. | 1.5% |
| TK Group Holdings, Ltd. | 1.5% |
| Total | 21.5% |
| * | Holdings are subject to change, and may not reflect the current or future position of the portfolio. |
| Annual Report | April 30, 2021 | 15 |
| Grandeur Peak Global Opportunities Fund | Performance Update |
April 30, 2021 (Unaudited)
Annualized Total Return Performance for the periods ended April 30, 2021
| Since | Expense Ratio(b) | |||||
| 1 Year | 3 Years | 5 Years | Inception(a) | Gross | Net(c) | |
Grandeur Peak Global Opportunities Fund – Investor (GPGOX) | 82.94% | 20.84% | 19.60% | 17.18% | 1.62% | 1.62% |
Grandeur Peak Global Opportunities Fund – Institutional (GPGIX) | 83.44% | 21.08% | 19.93% | 17.49% | 1.37% | 1.37% |
MSCI All Country World Index Small Cap(d) | 67.65% | 12.55% | 14.11% | 12.75% | ||
| MSCI All Country World Index IMI(e) | 48.76% | 13.72% | 14.40% | 12.25% | ||
Performance data quoted represents past performance. Past performance does not guarantee future results. Investment return and principal value of an investment will fluctuate so that an investor’s shares, when sold or redeemed, may be worth more or less than the original cost. The Fund imposes a 2.00% redemption fee on shares held for less than 60 days. Current performance data may be higher or lower than actual data quoted. For the most current month-end performance data, please call 1-855-377-PEAK (7325).
The table does not reflect the deduction of taxes a shareholder would pay on Fund distributions or redemption of Fund shares.
Subject to investment risks, including possible loss of the principal amount invested.
Returns for periods less than 1 year are cumulative.
| (a) | Fund inception date of October 17, 2011. |
| (b) | Ratios as of the Prospectus dated August 31, 2020 and may differ from the ratios presented in the Financial Highlights. |
| (c) | Grandeur Peak Global Advisors, LLC (the “Adviser”), has agreed to waive and/or reimburse fees or expenses in order to limit Total Annual Fund Operating Expenses After Fee Waiver/ Expense Reimbursement (excluding acquired fund fees and expenses, brokerage expenses, interest expenses, taxes and extraordinary expenses) to 1.75% and 1.50% of the Fund’s average daily net assets for the Fund’s Investor Class Shares and Institutional Class Shares, respectively. This agreement (the “Expense Agreement”) is in effect through August 31, 2021. The Adviser will be permitted to recover, on a class- by-class basis, expenses it has borne the Expense Agreement to the extent that a Fund’s expenses in later periods fall below annual rates set forth in the Expense Agreement; provided, however, that such recapture payments do not cause the Fund’s expense ratio (after recapture) to exceed the lesser of (i) the expense cap in effect at the time of the waiver and (ii) the expense cap in effect at the time of the recapture . Notwithstanding the foregoing, the Fund will not be obligated to pay any such deferred fees and expenses more than three years after the date on which the fee and expenses was deferred. The Expense Agreement may not be terminated or modified prior to August 31, 2021 except with the approval of the Fund’s Board of Trustees. |
| (d) | The MSCI ACWI Small Cap Index is designed to measure the equity market performance of performance of small-cap companies across developed and emerging markets globally. MSCI makes no express or implied warranties or representations and shall have no liability whatsoever with respect to any MSCI data contained herein. The MSCI data may not be further redistributed or used to create indices or financial products. The Index is not actively managed and does not reflect any deductions for fees, expenses or taxes. An investor may not invest directly into the Index. |
| (e) | The MSCI ACWI IMI Index is designed to measure the equity market performance of large, mid, and small-cap companies across developed and emerging markets globally. The Index is not actively managed and does not reflect any deductions for fees, expenses or taxes. An investor may not invest directly into the Index. |
| 16 | 1.855.377.7325 | www.GrandeurPeakGlobal.com |
| Grandeur Peak Global Opportunities Fund | Performance Update |
April 30, 2021 (Unaudited)
Growth of $10,000 for the period ended April 30, 2021

The chart shown above represents a hypothetical investment of $10,000 in the Fund’s Investor Class shares for the period from inception to April 30, 2021. All returns reflect reinvested dividends, but do not reflect the deduction of taxes that an investor would pay on distributions or redemptions.
Investing in the Fund is subject to investment risks, including possible loss of the principal amount invested.
The Fund also offers Institutional Class shares, performance for which is not reflected in the graphs above. The performance of Institutional Class shares may be higher or lower than the performance of the Investor Class shares shown in the graphs above based upon differences in fees paid by shareholders investing in the Investor Class shares and Institutional Class shares.
| Annual Report | April 30, 2021 | 17 |
| Grandeur Peak Global Opportunities Fund | Performance Update |
April 30, 2021 (Unaudited)
| Regional Allocation (as a % of Net Assets)* | |
| Europe | 42.0% |
| North America | 25.7% |
| Asia ex Japan | 18.6% |
| Japan | 8.9% |
| Latin America | 2.7% |
| Africa/Middle East | 1.2% |
| Australia/New Zealand | 0.7% |
| Cash, Cash Equivalents, & Other Net Assets | 0.2% |
| Total | 100.0% |
| Top 10 Holdings (as a % of Net Assets)* | |
| Dechra Pharmaceuticals PLC | 2.5% |
| Silergy Corp. | 2.2% |
| EPAM Systems, Inc. | 2.1% |
| Endava PLC | 2.0% |
| B&M European Value Retail SA | 1.9% |
| CVS Group PLC | 1.9% |
| Metropolis Healthcare, Ltd. | 1.4% |
| First Republic Bank | 1.4% |
| Heska Corp. | 1.3% |
| WNS Holdings, Ltd. | 1.3% |
| Total | 18.0% |
| * | Holdings are subject to change, and may not reflect the current or future position of the portfolio. |
| 18 | 1.855.377.7325 | www.GrandeurPeakGlobal.com |
| Grandeur Peak Global Reach Fund | Performance Update |
April 30, 2021 (Unaudited)
Annualized Total Return Performance for the periods ended April 30, 2021
| Since | Expense Ratio(b) | |||||
| 1 Year | 3 Years | 5 Years | Inception(a) | Gross | Net(c) | |
Grandeur Peak Global Reach Fund – Investor (GPROX) | 77.38% | 19.06% | 18.74% | 15.35% | 1.52% | 1.52% |
Grandeur Peak Global Reach Fund – Institutional (GPRIX) | 77.81% | 19.35% | 19.02% | 15.62% | 1.27% | 1.27% |
MSCI All Country World Small Cap Index(d) | 67.65% | 12.55% | 14.11% | 11.46% | ||
MSCI All Country World IMI Index(e) | 48.76% | 13.72% | 14.40% | 11.35% | ||
Performance data quoted represents past performance. Past performance does not guarantee future results. Investment return and principal value of an investment will fluctuate so that an investor’s shares, when sold or redeemed, may be worth more or less than the original cost. The Fund imposes a 2.00% redemption fee on shares held for less than 60 days. Current performance data may be higher or lower than actual data quoted. For the most current month-end performance data, please call 1-855-377-PEAK (7325).
The table does not reflect the deduction of taxes a shareholder would pay on Fund distributions or redemption of Fund shares.
Subject to investment risks, including possible loss of the principal amount invested.
Returns for periods less than 1 year are cumulative.
| (a) | Fund inception date of June 19, 2013. |
| (b) | Ratios as of the Prospectus dated August 31, 2020 and may differ from the ratios presented in the Financial Highlights. |
| (c) | Grandeur Peak Global Advisors, LLC (the “Adviser”), has agreed to waive and/or reimburse fees or expenses in order to limit Total Annual Fund Operating Expenses After Fee Waiver/Expense Reimbursement (excluding acquired fund fees and expenses, brokerage expenses, interest expenses, taxes and extraordinary expenses) to 1.60% and 1.35% of the Fund’s average daily net assets for the Fund’s Investor Class Shares and Institutional Class Shares, respectively. This agreement (the “Expense Agreement”) is in effect through August 31, 2021. The Adviser will be permitted to recover, on a class- by-class basis, expenses it has borne through the Expense Agreement to the extent that a Fund’s expenses in later periods fall below annual rates set forth in the Expense Agreement; provided, however, that such recapture payments do not cause the Fund’s expense ratio (after recapture) to exceed the lesser of (i) the expense cap in effect at the time of the waiver and (ii) the expense cap in effect at the time of the recapture . Notwithstanding the foregoing, the Fund will not be obligated to pay any such deferred fees and expenses more than three years after the date on which the fee and expenses was deferred. The Expense Agreement may not be terminated or modified prior to August 31, 2021 except with the approval of the Fund’s Board of Trustees. |
| (d) | The MSCI ACWI Small Cap Index is designed to measure the equity market performance of performance of small-cap companies across developed and emerging markets globally. MSCI makes no express or implied warranties or representations and shall have no liability whatsoever with respect to any MSCI data contained herein. The MSCI data may not be further redistributed or used to create indices or financial products. The Index is not actively managed and does not reflect any deductions for fees, expenses or taxes. An investor may not invest directly into the Index. |
| (e) | The MSCI ACWI IMI Index is designed to measure the equity market performance of large, mid, and small-cap companies across developed and emerging markets globally. The Index is not actively managed and does not reflect any deductions for fees, expenses or taxes. An investor may not invest directly into the Index. |
| Annual Report | April 30, 2021 | 19 |
| Grandeur Peak Global Reach Fund | Performance Update |
April 30, 2021 (Unaudited)
Growth of $10,000 for the period ended April 30, 2021

The chart shown above represents a hypothetical investment of $10,000 in the Fund’s Investor Class shares for the period from inception to April 30, 2021. All returns reflect reinvested dividends, but do not reflect the deduction of taxes that an investor would pay on distributions or redemptions.
Investing in the Fund is subject to investment risks, including possible loss of the principal amount invested.
The Fund also offers Institutional Class shares, performance for which is not reflected in the graphs above. The performance of Institutional Class shares may be higher or lower than the performance of the Investor Class shares shown in the graphs above based upon differences in fees paid by shareholders investing in the Investor Class shares and Institutional Class shares.
| 20 | 1.855.377.7325 | www.GrandeurPeakGlobal.com |
| Grandeur Peak Global Reach Fund | Performance Update |
April 30, 2021 (Unaudited)
| Regional Allocation (as a % of Net Assets)* | |
| Europe | 34.9% |
| North America | 29.3% |
| Asia ex Japan | 18.3% |
| Japan | 7.4% |
| Latin America | 3.9% |
| Australia/New Zealand | 3.1% |
| Africa/Middle East | 2.5% |
| Cash, Cash Equivalents, & Other Net Assets | 0.6% |
| Total | 100.0% |
| Top 10 Holdings (as a % of Net Assets)* | |
| Silergy Corp. | 1.6% |
| Impax Asset Management Group PLC | 1.5% |
| First Republic Bank | 1.4% |
| Esker SA | 1.4% |
| Endava PLC | 1.3% |
| EPAM Systems, Inc. | 1.2% |
| Wix.com, Ltd. | 1.2% |
| EQT AB | 1.1% |
| B&M European Value Retail SA | 1.0% |
| Vietnam Technological & Commercial Joint Stock Bank | 1.0% |
| Total | 12.7% |
| * | Holdings are subject to change, and may not reflect the current or future position of the portfolio. |
| Annual Report | April 30, 2021 | 21 |
| Grandeur Peak Global Stalwarts Fund | Performance Update |
April 30, 2021 (Unaudited)
Annualized Total Return Performance for the periods ended April 30, 2021
| Since | Expense Ratio(b) | |||||
| 1 Year | 3 Years | 5 Years | Inception(a) | Gross | Net(c) | |
Grandeur Peak Global Stalwarts Fund – Investor (GGSOX)* | 68.24% | 18.74% | 18.74% | 18.08% | 1.24% | 1.24% |
Grandeur Peak Global Stalwarts Fund – Institutional (GGSYX)* | 68.62% | 19.05% | 19.04% | 18.38% | 0.99% | 0.99% |
| MSCI All Country World Mid Cap Index(d) | 54.93% | 11.88% | 12.86% | 12.49% | ||
| MSCI All Country World Small Cap Index(e) | 67.65% | 12.55% | 14.11% | 13.50% | ||
Performance data quoted represents past performance. Past performance does not guarantee future results. Investment return and principal value of an investment will fluctuate so that an investor’s shares, when sold or redeemed, may be worth more or less than the original cost. The Fund imposes a 2.00% redemption fee on shares held for less than 60 days. Current performance data may be higher or lower than actual data quoted. For the most current month-end performance data, please call 1-855-377-PEAK (7325).
The table does not reflect the deduction of taxes a shareholder would pay on Fund distributions or redemption of Fund shares.
Subject to investment risks, including possible loss of the principal amount invested.
Returns for periods less than 1 year are cumulative.
| * | Excludes adjustments in accordance with accounting principles generally accepted in the United States of America and as such, the net asset value and total return for shareholder transactions reported to the market may differ from the net asset value for financial reporting purposes. |
| (a) | Fund inception date of September 1, 2015. |
| (b) | Ratios as of the Prospectus dated August 31, 2020 and may differ from the ratios presented in the Financial Highlights. |
| (c) | Grandeur Peak Global Advisors, LLC (the “Adviser”), has agreed to waive and/or reimburse fees or expenses in order to limit Total Annual Fund Operating Expenses After Fee Waiver/ Expense Reimbursement (excluding acquired fund fees and expenses, brokerage expenses, interest expenses, taxes and extraordinary expenses) to 1.35% and 1.10% of the Fund’s average daily net assets for the Fund’s Investor Class Shares and Institutional Class Shares, respectively. This agreement is in effect through August 31, 2021. The Adviser will be permitted to recover, on a class-by-class basis, expenses it has borne through this agreement to the extent that a Fund’s expenses in later periods fall below annual rates set forth in the Expense Agreement; provided, however, that such recapture payments do not cause the Fund’s expense ratio (after recapture) to exceed the lesser of (i) the expense cap in effect at the time of the waiver and (ii) the expense cap in effect at the time of the recapture . Notwithstanding the foregoing, the Fund will not be obligated to pay any such deferred fees and expenses more than three years after the date on which the fee and expenses was deferred. This agreement may not be terminated or modified prior to August 31, 2021 except with the approval of the Fund’s Board of Trustees. |
| (d) | The MSCI ACWI Mid Cap Index is designed to measure the equity market performance of performance of mid-cap companies across developed and emerging markets globally. MSCI makes no express or implied warranties or representations and shall have no liability whatsoever with respect to any MSCI data contained herein. The MSCI data may not be further redistributed or used to create indices or financial products. The Index is not actively managed and does not reflect any deductions for fees, expenses or taxes. An investor may not invest directly into the Index. |
| (e) | The MSCI ACWI Small Cap Index is designed to measure the equity market performance of small-cap companies across developed and emerging markets globally. The Index is not actively managed and does not reflect any deductions for fees, expenses or taxes. An investor may not invest directly into the Index. |
| 22 | 1.855.377.7325 | www.GrandeurPeakGlobal.com |
| Grandeur Peak Global Stalwarts Fund | Performance Update |
April 30, 2021 (Unaudited)
Growth of $10,000 for the period ended April 30, 2021
The chart shown above represents a hypothetical investment of $10,000 in the Fund’s Investor Class shares for the period from inception to April 30, 2021. All returns reflect reinvested dividends, but do not reflect the deduction of taxes that an investor would pay on distributions or redemptions.
Investing in the Fund is subject to investment risks, including possible loss of the principal amount invested.
The Fund also offers Institutional Class shares, performance for which is not reflected in the graphs above. The performance of Institutional Class shares may be higher or lower than the performance of the Investor Class shares shown in the graphs above based upon differences in fees paid by shareholders investing in the Investor Class shares and Institutional Class shares.
| Annual Report | April 30, 2021 | 23 |
| Grandeur Peak Global Stalwarts Fund | Performance Update |
April 30, 2021 (Unaudited)
| Regional Allocation (as a % of Net Assets)* | |
| North America | 43.1% |
| Europe | 25.5% |
| Asia ex Japan | 19.9% |
| Japan | 6.6% |
| Latin America | 2.0% |
| Africa/Middle East | 1.1% |
| Australia/New Zealand | 1.0% |
| Cash, Cash Equivalents, & Other Net Assets | 0.8% |
| Total | 100.0% |
| Top 10 Holdings (as a % of Net Assets)* | |
| Silergy Corp. | 4.0% |
| First Republic Bank | 3.3% |
| EPAM Systems, Inc. | 2.8% |
| Dechra Pharmaceuticals PLC | 2.6% |
| WNS Holdings, Ltd. | 2.4% |
| B&M European Value Retail SA | 2.2% |
| Endava PLC | 2.0% |
| St. James’s Place PLC | 1.5% |
| Intertek Group PLC | 1.3% |
| Fastenal Co. | 1.2% |
| Total | 23.3% |
| * | Holdings are subject to change, and may not reflect the current or future position of the portfolio. |
| 24 | 1.855.377.7325 | www.GrandeurPeakGlobal.com |
| Grandeur Peak International Opportunities Fund | Performance Update |
April 30, 2021 (Unaudited)
Annualized Total Return Performance for the periods ended April 30, 2021
| Since | Expense Ratio(b) | |||||
| 1 Year | 3 Years | 5 Years | Inception(a) | Gross | Net(c) | |
Grandeur Peak International Opportunities Fund – Investor (GPIOX) | 75.87% | 15.34% | 16.55% | 15.25% | 1.62% | 1.62% |
Grandeur Peak International Opportunities Fund – Institutional (GPIIX) | 76.29% | 15.59% | 16.74% | 15.50% | 1.37% | 1.37% |
MSCI All Country World Index ex USA Small Cap Index(d) | 58.94% | 8.22% | 11.21% | 9.51% | ||
MSCI All Country World IMI ex USA Index(e) | 45.53% | 7.57% | 10.46% | 7.96% | ||
Performance data quoted represents past performance. Past performance does not guarantee future results. Investment return and principal value of an investment will fluctuate so that an investor’s shares, when sold or redeemed, may be worth more or less than the original cost. The Fund imposes a 2.00% redemption fee on shares held for less than 60 days. Current performance data may be higher or lower than actual data quoted. For the most current month-end performance data, please call 1-855-377-PEAK (7325).
The table does not reflect the deduction of taxes a shareholder would pay on Fund distributions or redemption of Fund shares.
Subject to investment risks, including possible loss of the principal amount invested.
Returns for periods less than 1 year are cumulative.
| (a) | Fund inception date of October 17, 2011. |
| (b) | Ratios as of the Prospectus dated August 31, 2020 and may differ from the ratios presented in the Financial Highlights. |
| (c) | Grandeur Peak Global Advisors, LLC (the “Adviser”), has agreed to waive and/or reimburse fees or expenses in order to limit Total Annual Fund Operating Expenses After Fee Waiver/Expense Reimbursements (excluding acquired fund fees and expenses, brokerage expenses, interest expenses, taxes and extraordinary expenses) to 1.75% and 1.50% of the Fund’s average daily net assets for the Fund’s Investor Class Shares and Institutional Class Shares, respectively. This agreement (the “Expense Agreement”) is in effect through August 31, 2021. The Adviser will be permitted to recover, on a class- by-class basis, expenses it has borne through the Expense Agreement to the extent that a Fund’s expenses in later periods fall below annual rates set forth in the Expense Agreement; provided, however, that such recapture payments do not cause the Fund’s expense ratio (after recapture) to exceed the lesser of (i) the expense cap in effect at the time of the waiver and (ii) the expense cap in effect at the time of the recapture . Notwithstanding the foregoing, the Funds will not be obligated to pay any such deferred fees and expenses more than three years after the date on which the fee and expenses was deferred. The Expense Agreement may not be terminated or modified prior to August 31, 2021 except with the approval of the Fund’s Board of Trustees. |
| (d) | The MSCI ACWI ex USA Small Cap Index is designed to measure the equity market performance of small-cap companies across developed and emerging markets globally, excluding the United States. MSCI makes no express or implied warranties or representations and shall have no liability whatsoever with respect to any MSCI data contained herein. The MSCI data may not be further redistributed or used to create indices or financial products. The Index is not actively managed and does not reflect any deductions for fees, expenses or taxes. An investor may not invest directly into the Index. |
| (e) | The MSCI ACWI ex USA IMI Index is designed to measure the equity market performance of large, mid, and small-cap companies across developed and emerging markets globally, excluding the United States. The Index is not actively managed and does not reflect any deductions for fees, expenses or taxes. An investor may not invest directly into the Index. |
| Annual Report | April 30, 2021 | 25 |
| Grandeur Peak International Opportunities Fund | Performance Update |
April 30, 2021 (Unaudited)
Growth of $10,000 for the period ended April 30, 2021

The chart shown above represents a hypothetical investment of $10,000 in the Fund’s Investor Class shares for the period from inception to April 30, 2021. All returns reflect reinvested dividends, but do not reflect the deduction of taxes that an investor would pay on distributions or redemptions.
Investing in the Fund is subject to investment risks, including possible loss of the principal amount invested.
The Fund also offers Institutional Class shares, performance for which is not reflected in the graphs above. The performance of Institutional Class shares may be higher or lower than the performance of the Investor Class shares shown in the graphs above based upon differences in fees paid by shareholders investing in the Investor Class shares and Institutional Class shares.
| 26 | 1.855.377.7325 | www.GrandeurPeakGlobal.com |
| Grandeur Peak International Opportunities Fund | Performance Update |
April 30, 2021 (Unaudited)
| Regional Allocation (as a % of Net Assets)* | |
| Europe | 47.5% |
| Asia ex Japan | 23.0% |
| Japan | 12.2% |
| North America | 7.4% |
| Latin America | 3.4% |
| Australia/New Zealand | 2.1% |
| Africa/Middle East | 1.4% |
| Cash, Cash Equivalents, & Other Net Assets | 3.0% |
| Total | 100.0% |
| Top 10 Holdings (as a % of Net Assets)* | |
| Dechra Pharmaceuticals PLC | 2.2% |
| CVS Group PLC | 2.2% |
| Silergy Corp. | 2.1% |
| EPAM Systems, Inc. | 2.1% |
| WNS Holdings, Ltd. | 1.7% |
| Endava PLC | 1.5% |
| B&M European Value Retail SA | 1.5% |
| Esker SA | 1.5% |
| Aalberts NV | 1.2% |
| Metropolis Healthcare, Ltd. | 1.2% |
| Total | 17.2% |
| * | Holdings are subject to change, and may not reflect the current or future position of the portfolio. |
| Annual Report | April 30, 2021 | 27 |
| Grandeur Peak International Stalwarts Fund | Performance Update |
April 30, 2021 (Unaudited)
Annualized Total Return Performance for the periods ended April 30, 2021
| Since | Expense Ratio(b) | |||||
| 1 Year | 3 Years | 5 Years | Inception(a) | Gross | Net(c) | |
Grandeur Peak International Stalwarts Fund – Investor (GISOX)* | 67.13% | 16.90% | 17.97% | 17.71% | 1.17% | 1.17% |
Grandeur Peak International Stalwarts Fund – Institutional (GISYX)* | 67.61% | 17.20% | 18.26% | 17.99% | 0.92% | 0.92% |
| MSCI All Country World ex USA Mid Cap Index(d) | 47.49% | 6.85% | 9.66% | 9.75% | ||
| MSCI All Country World ex USA Small Index(e) | 58.94% | 8.22% | 11.21% | 11.35% | ||
Performance data quoted represents past performance. Past performance does not guarantee future results. Investment return and principal value of an investment will fluctuate so that an investor’s shares, when sold or redeemed, may be worth more or less than the original cost. The Fund imposes a 2.00% redemption fee on shares held for less than 60 days. Current performance data may be higher or lower than actual data quoted. For the most current month-end performance data, please call 1-855-377-PEAK (7325).
The table does not reflect the deduction of taxes a shareholder would pay on Fund distributions or redemption of Fund shares.
Subject to investment risks, including possible loss of the principal amount invested.
Returns for periods less than 1 year are cumulative.
| * | Excludes adjustments in accordance with accounting principles generally accepted in the United States of America and as such, the net asset value and total return for shareholder transactions reported to the market may differ from the net asset value for financial reporting purposes. |
| (a) | Fund inception date of September 1, 2015. |
| (b) | Ratios as of the Prospectus dated August 31, 2020 and may differ from the ratios presented in the Financial Highlights. |
| (c) | Grandeur Peak Global Advisors, LLC (the “Adviser”), has agreed to waive and/or reimburse fees or expenses in order to limit Total Annual Fund Operating Expenses After Fee Waiver/ Expense Reimbursements (excluding acquired fund fees and expenses, brokerage expenses, interest expenses, taxes and extraordinary expenses) to 1.35% and 1.10% of the Fund’s average daily net assets for the Fund’s Investor Class Shares and Institutional Class Shares, respectively. This agreement is in effect through August 31, 2021. The Adviser will be permitted to recover, on a class-by-class basis, expenses it has borne through this agreement to the extent that a Fund’s expenses in later periods fall below annual rates set forth in the Expense Agreement; provided, however, that such recapture payments do not cause the Fund’s expense ratio (after recapture) to exceed the lesser of (i) the expense cap in effect at the time of the waiver and (ii) the expense cap in effect at the time of the recapture . Notwithstanding the foregoing, the Funds will not be obligated to pay any such deferred fees and expenses more than three years after the date on which the fee and expenses was deferred This agreement may not be terminated or modified prior to August 31, 2021 except with the approval of the Fund’s Board of Trustees. |
| (d) | The MSCI ACWI ex USA Mid Cap Index is designed to measure the equity market performance of midcap companies across developed and emerging markets globally, excluding the United States. MSCI makes no express or implied warranties or representations and shall have no liability whatsoever with respect to any MSCI data contained herein. The MSCI data may not be further redistributed or used to create indices or financial products. The Index is not actively managed and does not reflect any deductions for fees, expenses or taxes. An investor may not invest directly into the Index. |
| (e) | The MSCI ACWI ex USA Small Cap Index is designed to measure the equity market performance of small-cap companies across developed and emerging markets globally, excluding the United States. The Index is not actively managed and does not reflect any deductions for fees, expenses or taxes. An investor may not invest directly into the Index. |
| 28 | 1.855.377.7325 | www.GrandeurPeakGlobal.com |
| Grandeur Peak International Stalwarts Fund | Performance Update |
April 30, 2021 (Unaudited)
Growth of $10,000 for the period ended April 30, 2021

The chart shown above represents a hypothetical investment of $10,000 in the Fund’s Investor Class shares for the period from inception to April 30, 2021. All returns reflect reinvested dividends, but do not reflect the deduction of taxes that an investor would pay on distributions or redemptions.
Investing in the Fund is subject to investment risks, including possible loss of the principal amount invested.
The Fund also offers Institutional Class shares, performance for which is not reflected in the graphs above. The performance of Institutional Class shares may be higher or lower than the performance of the Investor Class shares shown in the graphs above based upon differences in fees paid by shareholders investing in the Investor Class shares and Institutional Class shares.
| Annual Report | April 30, 2021 | 29 |
| Grandeur Peak International Stalwarts Fund | Performance Update |
April 30, 2021 (Unaudited)
| Regional Allocation (as a % of Net Assets)* | |
| Europe | 41.5% |
| Asia ex Japan | 28.8% |
| North America | 12.3% |
| Japan | 10.0% |
| Latin America | 3.1% |
| Africa/Middle East | 1.8% |
| Australia/New Zealand | 1.4% |
| Cash, Cash Equivalents, & Other Net Assets | 1.1% |
| Total | 100.0% |
| Top 10 Holdings (as a % of Net Assets)* | |
| Silergy Corp. | 5.4% |
| EPAM Systems, Inc. | 4.1% |
| Dechra Pharmaceuticals PLC | 3.8% |
| B&M European Value Retail SA | 3.4% |
| WNS Holdings, Ltd. | 3.3% |
| Endava PLC | 2.4% |
| St. James’s Place PLC | 2.1% |
| EQT AB | 1.9% |
| Intertek Group PLC | 1.9% |
| Wix.com, Ltd. | 1.8% |
| Total | 30.1% |
| * | Holdings are subject to change, and may not reflect the current or future position of the portfolio. |
| 30 | 1.855.377.7325 | www.GrandeurPeakGlobal.com |
| Grandeur Peak US Stalwarts Fund | Performance Update |
April 30, 2021 (Unaudited)
Annualized Total Return Performance for the periods ended April 30, 2021
| Since | Expense Ratio(b) | |||
| 1 Year | Inception(a) | Gross | Net(c) | |
| Grandeur Peak US Stalwarts Fund – Institutional (GUSYX) | 73.67% | 109.72% | 6.10% | 1.00% |
| MSCI USA Mid Cap Index(d) | 62.89% | 88.61% | ||
| MSCI USA Small Cap Index(e) | 76.25% | 104.36% | ||
Performance data quoted represents past performance. Past performance does not guarantee future results. Investment return and principal value of an investment will fluctuate so that an investor’s shares, when sold or redeemed, may be worth more or less than the original cost. The Fund imposes a 2.00% redemption fee on shares held for less than 60 days. Current performance data may be higher or lower than actual data quoted. For the most current month-end performance data, please call 1-855-377-PEAK (7325).
The table does not reflect the deduction of taxes a shareholder would pay on Fund distributions or redemption of Fund shares.
Subject to investment risks, including possible loss of the principal amount invested.
Returns for periods less than 1 year are cumulative.
| (a) | Fund inception date of March 19, 2020. |
| (b) | Ratios as of the Prospectus dated August 31, 2020 and may differ from the ratios presented in the Financial Highlights. |
| (c) | Grandeur Peak Global Advisors, LLC (the “Adviser”), has agreed to waive and/or reimburse fees or expenses in order to limit Total Annual Fund Operating Expenses After Fee Waiver/Expense Reimbursement (excluding acquired fund fees and expenses, brokerage expenses, interest expenses, taxes and extraordinary expenses) to 1.00% of the Fund’s average daily net assets for the Fund’s Institutional Class Shares. This agreement (the “Expense Agreement”) is in effect through August 31, 2021. The Adviser will be permitted to recover, on a class- by-class basis, expenses it has borne through the Expense Agreement to the extent that a Fund’s expenses in later periods fall below annual rates set forth in the Expense Agreement; provided, however, that such recapture payments do not cause the Fund’s expense ratio (after recapture) to exceed the lesser of (i) the expense cap in effect at the time of the waiver and (ii) the expense cap in effect at the time of the recapture. Notwithstanding the foregoing, the Fund will not be obligated to pay any such deferred fees and expenses more than three years after the date on which the fee and expenses was deferred. The Expense Agreement may not be terminated or modified prior to August 31, 2021 except with the approval of the Fund’s Board of Trustees. |
| (d) | The MSCI USA Mid Cap Index is designed to measure the performance of the mid cap segments of the US market. With 339 constituents, the index covers approximately 15% of the free float-adjusted market capitalization in the US. The Index is not actively managed and does not reflect any deductions for fees, expenses or taxes. An investor may not invest directly into the Index. |
| (e) | The MSCI USA Small Cap Index is designed to measure the performance of the small cap segment of the US equity market. With 1,740 constituents, the index represents approximately 14% of the free float-adjusted market capitalization in the US. The Index is not actively managed and does not reflect any deductions for fees, expenses or taxes. An investor may not invest directly into the Index. |
| Annual Report | April 30, 2021 | 31 |
| Grandeur Peak US Stalwarts Fund | Performance Update |
April 30, 2021 (Unaudited)
Growth of $10,000 for the period ended April 30, 2021
The chart shown above represent a hypothetical investment of $10,000 in the Fund’s Institutional Class shares for the period from inception to April 30, 2021. All returns reflect reinvested dividends, but do not reflect the deduction of taxes that an investor would pay on distributions or redemptions.
Investing in the Fund is subject to investment risks, including possible loss of the principal amount invested.
| 32 | 1.855.377.7325 | www.GrandeurPeakGlobal.com |
| Grandeur Peak US Stalwarts Fund | Performance Update |
April 30, 2021 (Unaudited)
| Regional Allocation (as a % of Net Assets)* | |
| North America | 88.9% |
| Europe | 3.3% |
| Asia ex Japan | 3.0% |
| Africa/Middle East | 2.1% |
| Latin America | 1.5% |
| Cash, Cash Equivalents, & Other Net Assets | 1.2% |
| Total | 100.0% |
| Top 10 Holdings (as a % of Net Assets)* | |
| First Republic Bank | 3.9% |
| EPAM Systems, Inc. | 3.4% |
| Heska Corp. | 2.7% |
| Endava PLC | 2.6% |
| Pool Corp. | 2.6% |
| PJT Partners, Inc. | 2.5% |
| Paycom Software, Inc. | 2.1% |
| Wix.com, Ltd. | 2.1% |
| WNS Holdings, Ltd. | 2.1% |
| Genpact, Ltd. | 2.0% |
| Total | 26.0% |
| * | Holdings are subject to change, and may not reflect the current or future position of the portfolio. |
| Annual Report | April 30, 2021 | 33 |
| Grandeur Peak Funds® | Disclosure of Fund Expenses |
April 30, 2021
As a shareholder of a Fund, you incur two types of costs: (1) transaction costs, including sales charges (loads) on purchase payments, reinvested dividends, or other distributions; redemption fees; and exchange fees; and (2) ongoing costs, including management fees; distribution and/or service (12b-1) fees; and other Fund expenses. This example is intended to help you understand your ongoing costs (in dollars) of investing in the Fund and to compare these costs with the ongoing costs of investing in other mutual funds.
This example is based on an investment of $1,000 invested at the beginning of the period and held for the entire six-month period of November 1, 2020 through April 30, 2021.
Actual Expenses The first line of the table provides information about actual account values and actual expenses. You may use the information in this line, together with the amount you invested, to estimate the expenses that you paid over the period. Simply divide your account value by $1,000 (for example, an $8,600 account value divided by $1,000 = 8.6), then multiply the result by the number in the first line under the heading “Expenses Paid During Period” to estimate the expenses you paid on your account during this period.
Hypothetical Example for Comparison Purposes The second line of the table provides information about hypothetical account values and hypothetical expenses based on the Fund’s actual expense ratio and an assumed rate of return of 5% per year before expenses, which is not the Fund’s actual return. The hypothetical account values and expenses may not be used to estimate the actual ending account balance or expenses you paid for the period. You may use this information to compare the ongoing costs of investing in the Fund and other mutual funds. To do so, compare this 5% hypothetical example with the 5% hypothetical examples that appear in the shareholder reports of the other funds.
Please note that the expenses shown in the table are meant to highlight your ongoing costs only and do not reflect any transactional costs, such as redemption fees or exchange fees. Therefore, the second line of the table is useful in comparing ongoing costs only and will not help you determine the relative total costs of owning different funds. In addition, if these transactional costs were included, your costs would have been higher.
| 34 | 1.855.377.7325 | www.GrandeurPeakGlobal.com |
| Grandeur Peak Funds® | Disclosure of Fund Expenses |
April 30, 2021
| Beginning Account Value November 1, 2020 | Ending Account Value April 30, 2021 | Expense Ratio(a) | Expenses Paid During period November 1, 2020 - April 30, 2021(b) | |
| Grandeur Peak Emerging Markets Opportunities Fund | ||||
| Investor Class | ||||
| Actual | $1,000.00 | $1,269.10 | 1.64% | $9.23 |
| Hypothetical (5% return before expenses) | $1,000.00 | $1,016.66 | 1.64% | $8.20 |
| Institutional Class | ||||
| Actual | $1,000.00 | $1,270.10 | 1.41% | $7.94 |
| Hypothetical (5% return before expenses) | $1,000.00 | $1,017.80 | 1.41% | $7.05 |
| Grandeur Peak Global Contrarian Fund | ||||
| Institutional Class | ||||
| Actual | $1,000.00 | $1,428.80 | 1.35% | $8.13 |
| Hypothetical (5% return before expenses) | $1,000.00 | $1,018.10 | 1.35% | $6.76 |
| Grandeur Peak Global Micro Cap Fund | ||||
| Institutional Class | ||||
| Actual | $1,000.00 | $1,417.50 | 2.00% | $11.99 |
| Hypothetical (5% return before expenses) | $1,000.00 | $1,014.88 | 2.00% | $9.99 |
| Grandeur Peak Global Opportunities Fund | ||||
| Investor Class | ||||
| Actual | $1,000.00 | $1,381.60 | 1.47% | $8.68 |
| Hypothetical (5% return before expenses) | $1,000.00 | $1,017.50 | 1.47% | $7.35 |
| Institutional Class | ||||
| Actual | $1,000.00 | $1,384.20 | 1.23% | $7.27 |
| Hypothetical (5% return before expenses) | $1,000.00 | $1,018.70 | 1.23% | $6.16 |
| Grandeur Peak Global Reach Fund | ||||
| Investor Class | ||||
| Actual | $1,000.00 | $1,349.40 | 1.50% | $8.74 |
| Hypothetical (5% return before expenses) | $1,000.00 | $1,017.36 | 1.50% | $7.50 |
| Institutional Class | ||||
| Actual | $1,000.00 | $1,350.70 | 1.26% | $7.34 |
| Hypothetical (5% return before expenses) | $1,000.00 | $1,018.55 | 1.26% | $6.31 |
| Grandeur Peak Global Stalwarts Fund | ||||
| Investor Class | ||||
| Actual | $1,000.00 | $1,300.50 | 1.19% | $6.79 |
| Hypothetical (5% return before expenses) | $1,000.00 | $1,018.89 | 1.19% | $5.96 |
| Institutional Class | ||||
| Actual | $1,000.00 | $1,302.30 | 0.94% | $5.37 |
| Hypothetical (5% return before expenses) | $1,000.00 | $1,020.13 | 0.94% | $4.71 |
| Grandeur Peak International Opportunities Fund | ||||
| Investor Class | ||||
| Actual | $1,000.00 | $1,320.10 | 1.49% | $8.57 |
| Hypothetical (5% return before expenses) | $1,000.00 | $1,017.41 | 1.49% | $7.45 |
| Institutional Class | ||||
| Actual | $1,000.00 | $1,322.20 | 1.25% | $7.20 |
| Hypothetical (5% return before expenses) | $1,000.00 | $1,018.60 | 1.25% | $6.26 |
| Grandeur Peak International Stalwarts Fund | ||||
| Investor Class | ||||
| Actual | $1,000.00 | $1,292.20 | 1.15% | $6.54 |
| Hypothetical (5% return before expenses) | $1,000.00 | $1,019.09 | 1.15% | $5.76 |
| Institutional Class | ||||
| Actual | $1,000.00 | $1,293.70 | 0.90% | $5.12 |
| Hypothetical (5% return before expenses) | $1,000.00 | $1,020.33 | 0.90% | $4.51 |
| Grandeur Peak US Stalwarts Fund | ||||
| Institutional Class | ||||
| Actual | $1,000.00 | $1,332.50 | 1.00% | $5.78 |
| Hypothetical (5% return before expenses) | $1,000.00 | $1,019.84 | 1.00% | $5.01 |
| (a) | The Fund’s expense ratios have been annualized based on the Fund’s most recent fiscal half-year expenses. |
| (b) | Expenses are equal to the Fund’s annualized expense ratio multiplied by the average account value over the period, multiplied by the number of days in the most recent fiscal half-year (181)/365 (to reflect the half-year period). |
| Annual Report | April 30, 2021 | 35 |
| Grandeur Peak Emerging Markets Opportunities Fund | Portfolio of Investments |
April 30, 2021
| Shares | Value (Note 2) | |||||||
| COMMON STOCKS (97.08%) | ||||||||
| Argentina (0.86%) | ||||||||
| Globant SA(a) | 24,017 | $ | 5,504,216 | |||||
| Bangladesh (0.64%) | ||||||||
| Square Pharmaceuticals, Ltd. | 1,635,320 | 4,085,648 | ||||||
| Brazil (8.77%) | ||||||||
| Arco Platform, Ltd., Class A(a) | 110,316 | 2,830,709 | ||||||
| Blau Farmaceutica SA(a) | 350,000 | 2,731,934 | ||||||
| Fleury SA | 1,035,600 | 4,886,264 | ||||||
| Hypera SA | 680,200 | 4,318,829 | ||||||
| Instituto Hermes Pardini SA | 1,092,400 | 3,786,764 | ||||||
| Locaweb Servicos de Internet SA(b)(c) | 1,770,400 | 9,516,790 | ||||||
| Magazine Luiza SA | 544,000 | 2,007,934 | ||||||
| Neogrid Participacoes SA | 2,019,000 | 2,698,418 | ||||||
| Pagseguro Digital, Ltd., Class A(a) | 212,506 | 9,720,024 | ||||||
| Patria Investments, Ltd.(a) | 253,135 | 3,505,920 | ||||||
| Raia Drogasil SA | 507,000 | 2,462,175 | ||||||
| TOTVS SA | 607,700 | 3,481,489 | ||||||
| Vasta Platform(a) | 192,634 | 1,885,887 | ||||||
| Westwing Comercio Varejista Ltda(a) | 1,323,500 | 2,183,073 | ||||||
| 56,016,210 | ||||||||
| China (20.89%) | ||||||||
| AK Medical Holdings, Ltd.(b)(c) | 978,000 | 1,523,453 | ||||||
| Alibaba Group Holding, Ltd.(a) | 101,800 | 2,948,730 | ||||||
| ANTA Sports Products, Ltd. | 267,000 | 4,795,018 | ||||||
| Autohome, Inc., ADR | 32,564 | 3,019,660 | ||||||
| Baozun, Inc.(a) | 398,500 | 4,663,339 | ||||||
| CSPC Pharmaceutical Group, Ltd. | 4,336,720 | 5,370,828 | ||||||
| Fu Shou Yuan International Group, Ltd. | 3,722,000 | 4,024,949 | ||||||
| Hangzhou Robam Appliances Co., Ltd., Class A | 1,123,400 | 6,660,721 | ||||||
| Hangzhou Tigermed Consulting Co., Ltd., Class A | 125,050 | 3,024,272 | ||||||
| HUYA, Inc., ADR(a) | 130,177 | 2,293,719 | ||||||
| JD.com, Inc., Class A(a) | 76,100 | 2,927,319 | ||||||
| Jiangsu Hengrui Medicine Co., Ltd., Class A | 175,080 | 2,275,242 | ||||||
| Koolearn Technology Holding, Ltd.(a)(b)(c) | 1,571,100 | 3,021,755 | ||||||
| Li Ning Co., Ltd. | 823,700 | 6,723,000 | ||||||
| Man Wah Holdings, Ltd. | 2,750,000 | 5,784,815 | ||||||
| ManpowerGroup Greater China, Ltd.(c) | 2,266,500 | 2,885,737 | ||||||
| New Oriental Education & Technology Group, Inc., Sponsored ADR(a) | 332,500 | 5,073,950 | ||||||
| O2Micro International, Ltd., ADR(a) | 140,582 | 957,363 | ||||||
| Shares | Value (Note 2) | |||||||
| China (continued) | ||||||||
| Silergy Corp. | 236,422 | $ | 24,756,895 | |||||
| Suofeiya Home Collection Co., Ltd., Class A(a) | 1,940,100 | 8,729,925 | ||||||
| Tencent Holdings, Ltd. | 58,900 | 4,723,981 | ||||||
| TK Group Holdings, Ltd. | 9,196,400 | 4,025,330 | ||||||
| Trip.com Group, Ltd., ADR(a) | 179,669 | 7,021,464 | ||||||
| WuXi AppTec Co., Ltd., Class H(b)(c) | 270,500 | 6,397,071 | ||||||
| Wuxi Biologics Cayman, Inc.(a)(b)(c) | 395,500 | 5,575,263 | ||||||
| Yum China Holdings, Inc. | 66,687 | 4,195,946 | ||||||
| 133,399,745 | ||||||||
| Colombia (0.93%) | ||||||||
| Parex Resources, Inc.(a) | 315,631 | 5,944,643 | ||||||
| Egypt (0.52%) | ||||||||
| African Export-Import Bank, GDR | 500,000 | 1,610,000 | ||||||
| Integrated Diagnostics Holdings PLC(b)(c) | 1,484,400 | 1,736,748 | ||||||
| 3,346,748 | ||||||||
| Georgia (1.14%) | ||||||||
| Bank of Georgia Group PLC(a) | 185,712 | 2,621,189 | ||||||
| Georgia Capital PLC(a) | 186,468 | 1,449,840 | ||||||
| TBC Bank Group PLC(a) | 240,293 | 3,232,269 | ||||||
| 7,303,298 | ||||||||
| Greece (1.83%) | ||||||||
| JUMBO SA | 277,659 | 5,190,855 | ||||||
| Sarantis SA | 603,670 | 6,473,829 | ||||||
| 11,664,684 | ||||||||
| Hong Kong (2.04%) | ||||||||
| Jacobson Pharma Corp., Ltd.(c) | 4,715,800 | 473,538 | ||||||
| Plover Bay Technologies, Ltd.(c) | 8,956,000 | 1,706,399 | ||||||
| Techtronic Industries Co., Ltd. | 351,000 | 6,398,455 | ||||||
| Vitasoy International Holdings, Ltd. | 1,156,383 | 4,473,536 | ||||||
| 13,051,928 | ||||||||
| India (17.44%) | ||||||||
| Avenue Supermarts, Ltd.(a)(b)(c) | 62,000 | 2,387,928 | ||||||
| Bajaj Finance, Ltd.(a) | 72,399 | 5,328,727 | ||||||
| Castrol India, Ltd. | 2,727,212 | 4,629,882 | ||||||
| Cera Sanitaryware, Ltd.(a) | 3,854 | 200,022 | ||||||
| City Union Bank, Ltd.(a) | 1,756,435 | 3,954,039 | ||||||
| Computer Age Management Services, Ltd. | 203,629 | 6,386,730 | ||||||
| EPL, Ltd. | 1,135,862 | 3,444,887 | ||||||
| Gulf Oil Lubricants India, Ltd. | 264,757 | 2,527,742 | ||||||
| Happiest Minds Technologies, Ltd.(a) | 631,530 | 6,176,542 | ||||||
See Notes to Financial Statements.
| 36 | 1.855.377.7325 | www.GrandeurPeakGlobal.com |
| Grandeur Peak Emerging Markets Opportunities Fund | Portfolio of Investments |
April 30, 2021
| Shares | Value (Note 2) | |||||||
| India (continued) | ||||||||
| HCL Technologies, Ltd. | 372,289 | $ | 4,518,130 | |||||
| HDFC Asset Management Co., Ltd.(b)(c) | 74,500 | 2,792,373 | ||||||
| HDFC Bank, Ltd.(a) | 342,947 | 6,538,784 | ||||||
| Home First Finance Co. India, Ltd.(a)(b)(c) | 502,237 | 3,374,577 | ||||||
| IndiaMart InterMesh, Ltd.(a)(b)(c) | 106,171 | 11,393,110 | ||||||
| L&T Technology Services, Ltd.(b)(c) | 138,752 | 5,111,753 | ||||||
| Marico, Ltd. | 345,835 | 1,921,007 | ||||||
| Metropolis Healthcare, Ltd.(b)(c) | 372,701 | 12,050,863 | ||||||
| Nippon Life India Asset Management, Ltd.(b)(c) | 781,684 | 3,605,946 | ||||||
| Polycab India, Ltd.(a) | 201,825 | 3,997,264 | ||||||
| Vaibhav Global, Ltd. | 100,932 | 5,681,815 | ||||||
| WNS Holdings, Ltd., ADR(a) | 211,650 | 15,329,809 | ||||||
| 111,351,930 | ||||||||
| Indonesia (2.94%) | ||||||||
| Ace Hardware Indonesia Tbk PT | 26,020,300 | 2,665,977 | ||||||
| Arwana Citramulia Tbk PT | 45,188,500 | 2,314,952 | ||||||
| Bank Central Asia Tbk PT | 1,271,500 | 2,818,954 | ||||||
| Bank Tabungan Pensiunan Nasional Syariah | 14,450,300 | 3,271,200 | ||||||
| Selamat Sempurna Tbk PT | 52,028,900 | 4,736,449 | ||||||
| Ultrajaya Milk Industry & Trading Co. Tbk PT | 26,276,000 | 2,928,651 | ||||||
| 18,736,183 | ||||||||
| Kenya (0.65%) | ||||||||
| Safaricom PLC | 11,096,600 | 4,151,579 | ||||||
| Malaysia (0.16%) | ||||||||
| Scicom MSC Bhd | 3,545,500 | 1,021,309 | ||||||
| Mexico (0.94%) | ||||||||
| Grupo Herdez SAB de CV | 306,276 | 642,579 | ||||||
| Regional SAB de CV(a) | 1,048,200 | 5,347,854 | ||||||
| 5,990,433 | ||||||||
| Philippines (3.04%) | ||||||||
| Concepcion Industrial Corp. | 1,861,792 | 868,063 | ||||||
| Philippine Seven Corp. | 1,023,000 | 2,273,333 | ||||||
| Puregold Price Club, Inc. | 7,163,100 | 5,548,985 | ||||||
| Robinsons Land Corp. | 8,164,200 | 2,777,354 | ||||||
| Wilcon Depot, Inc. | 21,691,900 | 7,928,919 | ||||||
| 19,396,654 | ||||||||
| Poland (3.47%) | ||||||||
| Allegro.eu SA(a)(b)(c) | 105,054 | 1,610,632 | ||||||
| Dino Polska SA(a)(b)(c) | 179,921 | 11,680,964 | ||||||
| LiveChat Software SA | 221,945 | 7,315,839 | ||||||
| Shares | Value (Note 2) | |||||||
| Poland (continued) | ||||||||
| PGS Software SA | 426,467 | $ | 1,529,442 | |||||
| 22,136,877 | ||||||||
| Russia (2.23%) | ||||||||
| HeadHunter Group PLC, ADR(a) | 141,100 | 5,797,799 | ||||||
| TCS Group Holding PLC, GDR(c) | 64,357 | 3,719,835 | ||||||
| Yandex NV, Class A(a) | 72,377 | 4,744,312 | ||||||
| 14,261,946 | ||||||||
| Singapore (0.66%) | ||||||||
| Riverstone Holdings, Ltd./Singapore | 3,882,400 | 4,230,306 | ||||||
| South Africa (2.62%) | ||||||||
| Capitec Bank Holdings, Ltd.(a) | 23,200 | 2,377,830 | ||||||
| Clicks Group, Ltd. | 216,900 | 3,622,353 | ||||||
| Italtile, Ltd. | 3,636,472 | 4,277,760 | ||||||
| Transaction Capital, Ltd.(a) | 2,843,328 | 6,448,341 | ||||||
| 16,726,284 | ||||||||
| South Korea (6.27%) | ||||||||
| Douzone Bizon Co., Ltd. | 46,000 | 3,486,133 | ||||||
| Hyundai Ezwel Co., Ltd. | 333,659 | 2,963,591 | ||||||
| LEENO Industrial, Inc. | 19,622 | 2,875,341 | ||||||
| LG Household & Health Care, Ltd. | 5,375 | 7,436,621 | ||||||
| NAVER Corp. | 13,560 | 4,382,452 | ||||||
| Orion Corp./Republic of Korea | 32,304 | 3,397,823 | ||||||
| Ray Co. Ltd/KR(a) | 43,000 | 2,002,427 | ||||||
| Settle Bank, Inc./Korea | 96,500 | 2,906,234 | ||||||
| Suprema, Inc.(a) | 68,000 | 1,632,220 | ||||||
| Tokai Carbon Korea Co., Ltd. | 50,654 | 8,920,860 | ||||||
| 40,003,702 | ||||||||
| Taiwan (10.44%) | ||||||||
| ASPEED Technology, Inc. | 67,000 | 5,061,039 | ||||||
| Bioteque Corp. | 950,000 | 4,251,244 | ||||||
| Brighten Optix Corp. | 210,000 | 1,841,907 | ||||||
| eMemory Technology, Inc. | 98,000 | 3,613,647 | ||||||
| FineTek Co., Ltd. | 409,500 | 1,298,883 | ||||||
| GEM Services, Inc./Tw | 901,000 | 2,586,912 | ||||||
| M31 Technology Corp. | 164,000 | 2,451,223 | ||||||
| momo.com, Inc. | 178,000 | 6,563,563 | ||||||
| Pacific Hospital Supply Co., Ltd. | 500,384 | 1,318,450 | ||||||
| Poya International Co., Ltd.(a) | 548,000 | 12,006,444 | ||||||
| Rafael Microelectronics, Inc. | 138,000 | 760,820 | ||||||
| Realtek Semiconductor Corp. | 255,000 | 4,856,621 | ||||||
| Sporton International, Inc. | 827,760 | 7,601,061 | ||||||
| Voltronic Power Technology Corp. | 192,608 | 8,791,580 | ||||||
See Notes to Financial Statements.
| Annual Report | April 30, 2021 | 37 |
| Grandeur Peak Emerging Markets Opportunities Fund | Portfolio of Investments |
April 30, 2021
| Shares | Value (Note 2) | |||||||
| Taiwan (continued) | ||||||||
| Wistron Information Technology & Services Corp. | 993,000 | $ | 3,661,583 | |||||
| 66,664,977 | ||||||||
| Thailand (1.72%) | ||||||||
| Humanica PCL | 6,774,100 | 2,327,832 | ||||||
| Muangthai Capital PCL | 1,779,000 | 3,656,556 | ||||||
| Netbay PCL | 1,926,100 | 1,917,594 | ||||||
| TOA Paint Thailand PCL | 2,776,000 | 3,075,777 | ||||||
| 10,977,759 | ||||||||
| Turkey (0.25%) | ||||||||
| DP Eurasia NV(a)(b)(c) | 1,646,300 | 1,577,887 | ||||||
| United States (2.48%) | ||||||||
| Frontage Holdings Corp.(a)(b)(c) | 9,170,000 | 6,244,962 | ||||||
| Genpact, Ltd. | 202,183 | 9,609,758 | ||||||
| 15,854,720 | ||||||||
| Vietnam (4.15%) | ||||||||
| FPT Corp. | 1,592,002 | 5,586,335 | ||||||
| Ho Chi Minh City Development Joint Stock Commercial Bank(a) | 2,038,639 | 2,409,582 | ||||||
| Lix Detergent JSC | 437,310 | 1,094,461 | ||||||
| Orient Commercial Joint Stock Bank(a) | 260,000 | 265,019 | ||||||
| Vietnam Dairy Products JSC | 1,899,622 | 7,703,954 | ||||||
| Vietnam Technological & Commercial Joint Stock Bank(a) | 3,440,269 | 6,118,023 | ||||||
| Vincom Retail JSC(a) | 2,386,220 | 3,312,038 | ||||||
| 26,489,412 | ||||||||
| TOTAL COMMON STOCKS | ||||||||
| (Cost $402,019,213) | 619,889,078 | |||||||
| TOTAL INVESTMENTS (97.08%) | ||||||||
| (Cost $402,019,213) | $ | 619,889,078 | ||||||
| Other Assets In Excess Of Liabilities (2.92%) | 18,660,258 | |||||||
| NET ASSETS (100.00%) | $ | 638,549,336 | ||||||
| (a) | Non-Income Producing Security. |
| (b) | Security exempt from registration under Rule 144A of the Securities Act of 1933. These securities may be resold in the ordinary course of business in transactions exempt from registration, normally to qualified institutional buyers. As of April 30, 2021, these securities had a total aggregate market value of $89,602,075, representing 14.03% of net assets. |
| (c) | Security was purchased pursuant to Regulation S under the Securities Act of 1933, which exempts securities offered and sold outside of the United States from registration. Such security cannot be sold in the United States without either an effective registration statement filed pursuant to the Securities Act of 1933, or pursuant to an exemption from registration. As of April 30, 2021, the aggregate market value of these securities was $98,387,584, representing 15.41% of net assets. |
For Fund compliance purposes, the Fund’s geographical classifications refer to any one or more of the country sub-classifications used by one or more widely recognized market indexes or ratings group indexes, and/or as defined by Fund management. This definition may not apply for purposes of this report, which may combine sub-classifications for reporting ease. Geographical regions are shown as a percentage of net assets.
Sector Composition (April 30, 2021)
| Consumer | 30.1% |
| Technology | 29.8% |
| Financials | 12.4% |
| Health Care | 12.3% |
| Industrials | 9.4% |
| Energy & Materials | 3.1% |
| Cash, Cash Equivalents, & Other Net Assets | 2.9% |
| Total | 100% |
See Notes to Financial Statements.
| 38 | 1.855.377.7325 | www.GrandeurPeakGlobal.com |
| Grandeur Peak Emerging Markets Opportunities Fund | Portfolio of Investments |
April 30, 2021
Industry Composition (April 30, 2021)
| IT Services | 12.5% |
| Semiconductors & Semiconductor Equipment | 8.9% |
| Banks | 6.7% |
| Food & Staples Retailing | 4.4% |
| Internet & Direct Marketing Retail | 4.4% |
| Software | 4.0% |
| Health Care Providers & Services | 3.5% |
| Professional Services | 3.4% |
| Life Sciences Tools & Services | 3.3% |
| Household Durables | 3.3% |
| Specialty Retail | 3.1% |
| Food Products | 3.0% |
| Textiles, Apparel & Luxury Goods | 2.7% |
| Diversified Consumer Services | 2.6% |
| Interactive Media & Services | 2.6% |
| Pharmaceuticals | 2.6% |
| Personal Products | 2.5% |
| Consumer Finance | 2.4% |
| Health Care Equipment & Supplies | 2.4% |
| Electrical Equipment | 2.2% |
| Multiline Retail | 2.2% |
| Capital Markets | 1.8% |
| Trading Companies & Distributors | 1.8% |
| Machinery | 1.6% |
| Chemicals | 1.6% |
| Other Industries (each less than 1%) | 7.6% |
| Cash and Other Assets, Less Liabilities | 2.9% |
| Total | 100% |
See Notes to Financial Statements.
| Annual Report | April 30, 2021 | 39 |
| Grandeur Peak Global Contrarian Fund | Portfolio of Investments |
April 30, 2021
| Shares | Value (Note 2) | |||||||
| COMMON STOCKS (97.13%) | ||||||||
| Australia (4.18%) | ||||||||
| Fiducian Group, Ltd. | 235,298 | $ | 1,223,519 | |||||
| Kogan.com, Ltd. | 41,200 | 351,662 | ||||||
| QANTM Intellectual Property, Ltd. | 585,684 | 491,788 | ||||||
| 2,066,969 | ||||||||
| Austria (0.46%) | ||||||||
| Schoeller-Bleckmann Oilfield Equipment AG | 5,300 | 226,842 | ||||||
| Bangladesh (0.64%) | ||||||||
| Square Pharmaceuticals, Ltd. | 127,390 | 318,268 | ||||||
| Belgium (0.53%) | ||||||||
| X-Fab Silicon Foundries SE(a)(b)(c) | 27,095 | 263,207 | ||||||
| Britain (10.14%) | ||||||||
| Ascential PLC(a) | 73,707 | 355,053 | ||||||
| B&M European Value Retail SA | 74,752 | 584,108 | ||||||
| City of London Investment Group PLC | 57,641 | 429,866 | ||||||
| Clinigen Group PLC | 21,700 | 255,782 | ||||||
| K3 Capital Group PLC | 132,654 | 597,235 | ||||||
| On the Beach Group PLC(a)(b)(c) | 128,139 | 734,407 | ||||||
| Premier Miton Group PLC | 297,038 | 717,889 | ||||||
| Sabre Insurance Group PLC(b)(c) | 96,717 | 347,951 | ||||||
| Ultra Electronics Holdings PLC | 35,342 | 986,915 | ||||||
| 5,009,206 | ||||||||
| Canada (4.42%) | ||||||||
| BioSyent, Inc.(a) | 112,087 | 711,287 | ||||||
| Guardian Capital Group, Ltd. | 37,292 | 978,454 | ||||||
| Kirkland Lake Gold, Ltd. | 13,242 | 492,017 | ||||||
| 2,181,758 | ||||||||
| China (3.83%) | ||||||||
| Hangzhou Robam Appliances Co., Ltd., Class A | 63,400 | 375,903 | ||||||
| O2Micro International, Ltd., ADR(a) | 5,260 | 35,821 | ||||||
| TK Group Holdings, Ltd. | 1,744,000 | 763,361 | ||||||
| Xin Point Holdings, Ltd.(c) | 1,113,000 | 716,424 | ||||||
| 1,891,509 | ||||||||
| Colombia (0.77%) | ||||||||
| Parex Resources, Inc.(a) | 20,214 | 380,714 | ||||||
| France (3.58%) | ||||||||
| Alten SA(a) | 1,400 | 175,217 | ||||||
| Neurones | 16,588 | 546,439 | ||||||
| Rothschild & Co.(a) | 11,143 | 396,543 | ||||||
| Shares | Value (Note 2) | |||||||
| France (continued) | ||||||||
| Thermador Groupe | 2,347 | $ | 240,408 | |||||
| Wavestone(a) | 9,014 | 411,811 | ||||||
| 1,770,418 | ||||||||
| Georgia (1.00%) | ||||||||
| Bank of Georgia Group PLC(a) | 16,357 | 230,867 | ||||||
| TBC Bank Group PLC(a) | 19,644 | 264,239 | ||||||
| 495,106 | ||||||||
| Germany (1.42%) | ||||||||
| Grand City Properties SA | 16,417 | 441,328 | ||||||
| Norma Group SE | 4,641 | 258,897 | ||||||
| 700,225 | ||||||||
| Greece (1.99%) | ||||||||
| Kri-Kri Milk Industry SA | 66,238 | 614,782 | ||||||
| Sarantis SA | 34,322 | 368,073 | ||||||
| 982,855 | ||||||||
| Hong Kong (2.53%) | ||||||||
| Jacobson Pharma Corp., Ltd.(c) | 2,980,000 | 299,237 | ||||||
| Plover Bay Technologies, Ltd.(c) | 4,993,000 | 951,323 | ||||||
| 1,250,560 | ||||||||
| India (4.86%) | ||||||||
| City Union Bank, Ltd.(a) | 162,500 | 365,816 | ||||||
| Gulf Oil Lubricants India, Ltd. | 50,713 | 484,177 | ||||||
| HCL Technologies, Ltd. | 17,988 | 218,304 | ||||||
| Mahanagar Gas, Ltd.(c) | 32,237 | 489,762 | ||||||
| Time Technoplast, Ltd. | 825,995 | 840,798 | ||||||
| 2,398,857 | ||||||||
| Indonesia (1.84%) | ||||||||
| Selamat Sempurna Tbk PT | 3,587,700 | 326,606 | ||||||
| Ultrajaya Milk Industry & Trading Co. Tbk PT | 2,216,500 | 247,045 | ||||||
| Uni-Charm Indonesia Tbk PT | 2,956,100 | 334,595 | ||||||
| 908,246 | ||||||||
| Ireland (0.74%) | ||||||||
| Irish Residential Properties REIT PLC | 186,406 | 364,399 | ||||||
| Italy (1.59%) | ||||||||
| Banca Sistema SpA(a)(b)(c) | 137,982 | 345,050 | ||||||
| Piovan SpA(b)(c) | 49,469 | 441,300 | ||||||
| 786,350 | ||||||||
| Japan (14.37%) | ||||||||
| Beenos, Inc. | 27,400 | 757,142 | ||||||
| Central Automotive Products, Ltd. | 11,700 | 310,994 | ||||||
| Create SD Holdings Co., Ltd. | 11,000 | 333,654 | ||||||
See Notes to Financial Statements.
| 40 | 1.855.377.7325 | www.GrandeurPeakGlobal.com |
| Grandeur Peak Global Contrarian Fund | Portfolio of Investments |
April 30, 2021
| Shares | Value (Note 2) | |||||||
| Japan (continued) | ||||||||
| Japan Lifeline Co., Ltd. | 51,000 | $ | 718,638 | |||||
| Medikit Co., Ltd. | 16,800 | 496,514 | ||||||
| Naigai Trans Line, Ltd. | 60,000 | 945,375 | ||||||
| Nikkon Holdings Co., Ltd. | 22,500 | 470,834 | ||||||
| Seria Co., Ltd. | 37,800 | 1,371,369 | ||||||
| Synchro Food Co., Ltd.(a) | 105,600 | 360,406 | ||||||
| Trancom Co., Ltd. | 7,800 | 605,216 | ||||||
| YAMADA Consulting Group Co., Ltd. | 69,400 | 727,719 | ||||||
| 7,097,861 | ||||||||
| Mexico (0.69%) | ||||||||
| Regional SAB de CV(a) | 66,900 | 341,320 | ||||||
| Netherlands (0.62%) | ||||||||
| Aalberts NV | 5,643 | 305,634 | ||||||
| New Zealand (0.62%) | ||||||||
| a2 Milk Co., Ltd.(a) | 55,884 | 305,928 | ||||||
| Oman (0.69%) | ||||||||
| Tethys Oil AB | 46,576 | 338,913 | ||||||
| Philippines (1.22%) | ||||||||
| Concepcion Industrial Corp. | 530,800 | 247,486 | ||||||
| Pryce Corp. | 3,213,600 | 353,730 | ||||||
| 601,216 | ||||||||
| Singapore (1.54%) | ||||||||
| Riverstone Holdings, Ltd./Singapore | 699,800 | 762,510 | ||||||
| South Africa (0.93%) | ||||||||
| City Lodge Hotels, Ltd.(a) | 849,600 | 251,907 | ||||||
| Italtile, Ltd. | 178,471 | 209,944 | ||||||
| 461,851 | ||||||||
| South Korea (1.41%) | ||||||||
| HCT Co., Ltd. | 31,144 | 488,572 | ||||||
| Tokai Carbon Korea Co., Ltd. | 1,181 | 207,990 | ||||||
| 696,562 | ||||||||
| Sweden (0.47%) | ||||||||
| Beijer Alma AB | 10,407 | 234,311 | ||||||
| Taiwan (7.62%) | ||||||||
| Bioteque Corp. | 152,000 | 680,199 | ||||||
| FineTek Co., Ltd. | 71,000 | 225,203 | ||||||
| Fuzetec Technology Co., Ltd. | 147,000 | 377,854 | ||||||
| GEM Services, Inc./Tw | 123,000 | 353,152 | ||||||
| Pacific Hospital Supply Co., Ltd. | 170,000 | 447,929 | ||||||
| Tehmag Foods Corp. | 70,000 | 773,100 | ||||||
| Tofu Restaurant Co., Ltd. | 64,000 | 404,396 | ||||||
| Shares | Value (Note 2) | |||||||
| Taiwan (continued) | ||||||||
| Wistron Information Technology & Services Corp. | 136,000 | $ | 501,486 | |||||
| 3,763,319 | ||||||||
| United Arab Emirates (0.92%) | ||||||||
| Aramex PJSC | 425,000 | 452,405 | ||||||
| United States (16.79%) | ||||||||
| Bank of NT Butterfield & Son, Ltd. | 31,556 | 1,237,626 | ||||||
| Barrett Business Services, Inc. | 17,301 | 1,268,682 | ||||||
| Esquire Financial Holdings, Inc.(a) | 36,657 | 841,278 | ||||||
| First Hawaiian, Inc. | 17,500 | 480,550 | ||||||
| Hackett Group, Inc. | 57,170 | 950,737 | ||||||
| Healthcare Services Group, Inc. | 16,347 | 489,593 | ||||||
| Hingham Institution For Savings The | 2,722 | 827,869 | ||||||
| Kimball International, Inc., Class B | 51,025 | 743,944 | ||||||
| LGI Homes, Inc.(a) | 1,375 | 227,948 | ||||||
| Samsonite International SA(a)(b)(c) | 198,000 | 367,566 | ||||||
| TriMas Corp.(a) | 7,154 | 227,783 | ||||||
| WW Grainger, Inc. | 1,463 | 634,269 | ||||||
| 8,297,845 | ||||||||
| Vietnam (4.72%) | ||||||||
| FPT Corp. | 145,643 | 511,061 | ||||||
| Hoa Phat Group JSC | 146,880 | 370,147 | ||||||
| Orient Commercial Joint Stock Bank(a) | 537,500 | 547,874 | ||||||
| Vietnam Dairy Products JSC | 119,988 | 486,614 | ||||||
| Vietnam Technological & Commercial Joint Stock Bank(a) | 233,000 | 414,357 | ||||||
| 2,330,053 | ||||||||
| TOTAL COMMON STOCKS | ||||||||
| (Cost $41,258,988) | 47,985,217 | |||||||
| TOTAL INVESTMENTS (97.13%) | ||||||||
| (Cost $41,258,988) | $ | 47,985,217 | ||||||
| Other Assets In Excess Of Liabilities (2.87%) | 1,417,827 | |||||||
| NET ASSETS (100.00%) | $ | 49,403,044 | ||||||
See Notes to Financial Statements.
| Annual Report | April 30, 2021 | 41 |
| Grandeur Peak Global Contrarian Fund | Portfolio of Investments |
April 30, 2021
| (a) | Non-Income Producing Security. |
| (b) | Security exempt from registration under Rule 144A of the Securities Act of 1933. These securities may be resold in the ordinary course of business in transactions exempt from registration, normally to qualified institutional buyers. As of April 30, 2021, these securities had a total aggregate market value of $2,499,481, representing 5.06% of net assets. |
| (c) | Security was purchased pursuant to Regulation S under the Securities Act of 1933, which exempts securities offered and sold outside of the United States from registration. Such security cannot be sold in the United States without either an effective registration statement filed pursuant to the Securities Act of 1933, or pursuant to an exemption from registration. As of April 30, 2021, the aggregate market value of these securities was $4,956,227, representing 10.03% of net assets. |
For Fund compliance purposes, the Fund’s geographical classifications refer to any one or more of the country sub-classifications used by one or more widely recognized market indexes or ratings group indexes, and/or as defined by Fund management. This definition may not apply for purposes of this report, which may combine sub-classifications for reporting ease. Geographical regions are shown as a percentage of net assets.
Sector Composition (April 30, 2021)
| Industrials | 24.0% |
| Financials | 21.9% |
| Consumer | 21.3% |
| Technology | 12.4% |
| Health Care | 9.3% |
| Energy & Materials | 7.2% |
| Utilities | 1.0% |
| Cash, Cash Equivalents, & Other Net Assets | 2.9% |
| Total | 100% |
Industry Composition (April 30, 2021)
| Banks | 10.3% |
| Capital Markets | 7.6% |
| Professional Services | 7.2% |
| IT Services | 6.7% |
| Health Care Equipment & Supplies | 6.3% |
| Food Products | 4.9% |
| Machinery | 4.5% |
| Multiline Retail | 4.0% |
| Hotels, Restaurants & Leisure | 2.8% |
| Pharmaceuticals | 2.7% |
| Commercial Services & Supplies | 2.5% |
| Internet & Direct Marketing Retail | 2.2% |
| Oil, Gas & Consumable Fuels | 2.2% |
| Road & Rail | 2.2% |
| Auto Components | 2.1% |
| Aerospace & Defense | 2.0% |
| Communications Equipment | 1.9% |
| Marine | 1.9% |
| Trading Companies & Distributors | 1.8% |
| Metals & Mining | 1.8% |
| Semiconductors & Semiconductor Equipment | 1.7% |
| Containers & Packaging | 1.7% |
| Thrifts & Mortgage Finance | 1.7% |
| Household Durables | 1.2% |
| Other Industries (each less than 1%) | 13.2% |
| Cash and Other Assets, Less Liabilities | 2.9% |
| Total | 100% |
See Notes to Financial Statements.
| 42 | 1.855.377.7325 | www.GrandeurPeakGlobal.com |
| Grandeur Peak Global Micro Cap Fund | Portfolio of Investments |
April 30, 2021
| Shares | Value (Note 2) | |||||||
| COMMON STOCKS (99.65%) | ||||||||
| Australia (5.32%) | ||||||||
| Australian Ethical Investment, Ltd. | 57,454 | $ | 386,387 | |||||
| Fiducian Group, Ltd. | 190,828 | 992,280 | ||||||
| Kogan.com, Ltd. | 133,811 | 1,142,142 | ||||||
| National Storage REIT | 257,787 | 399,159 | ||||||
| People Infrastructure, Ltd. | 76,774 | 266,735 | ||||||
| Redbubble, Ltd.(a) | 38,500 | 121,600 | ||||||
| Temple & Webster Group, Ltd.(a) | 27,368 | 225,588 | ||||||
| Whispir, Ltd.(a) | 85,100 | 211,093 | ||||||
| 3,744,984 | ||||||||
| Belgium (0.48%) | ||||||||
| X-Fab Silicon Foundries SE(a)(b)(c) | 34,819 | 338,240 | ||||||
| Brazil (1.26%) | ||||||||
| Locaweb Servicos de Internet SA(b)(c) | 66,400 | 356,933 | ||||||
| Neogrid Participacoes SA | 220,300 | 294,434 | ||||||
| Westwing Comercio Varejista Ltda(a) | 143,200 | 236,204 | ||||||
| 887,571 | ||||||||
| Britain (13.77%) | ||||||||
| AB Dynamics PLC | 13,514 | 429,259 | ||||||
| Acacia Pharma Group PLC(a) | 82,311 | 232,553 | ||||||
| Bytes Technology Group PLC(a) | 38,057 | 259,113 | ||||||
| City of London Investment Group PLC | 46,732 | 348,510 | ||||||
| Curtis Banks Group PLC | 78,479 | 305,640 | ||||||
| CVS Group PLC(a) | 19,010 | 585,456 | ||||||
| dotdigital group PLC | 129,000 | 338,494 | ||||||
| Foresight Group Holdings, Ltd.(a) | 54,168 | 317,188 | ||||||
| Impax Asset Management Group PLC | 93,518 | 1,296,691 | ||||||
| JTC PLC(b)(c) | 60,251 | 559,998 | ||||||
| K3 Capital Group PLC | 277,632 | 1,249,956 | ||||||
| Keystone Law Group PLC | 23,672 | 217,402 | ||||||
| On the Beach Group PLC(a)(b)(c) | 126,875 | 727,163 | ||||||
| Pensionbee Group PLC(a) | 306,740 | 762,519 | ||||||
| Premier Miton Group PLC | 385,142 | 930,821 | ||||||
| Tracsis PLC(a) | 19,300 | 226,560 | ||||||
| Tristel PLC | 12,810 | 106,147 | ||||||
| Volution Group PLC | 86,601 | 498,133 | ||||||
| XPS Pensions Group PLC(c) | 173,192 | 295,394 | ||||||
| 9,686,997 | ||||||||
| Canada (1.11%) | ||||||||
| Guardian Capital Group, Ltd. | 22,300 | 585,100 | ||||||
| Pivotree, Inc.(a) | 26,400 | 168,819 | ||||||
| Shares | Value (Note 2) | |||||||
| Canada (continued) | ||||||||
| WeCommerce Holdings, Ltd.(a) | 1,906 | $ | 24,919 | |||||
| 778,838 | ||||||||
| China (1.83%) | ||||||||
| O2Micro International, Ltd., ADR(a) | 31,756 | 216,258 | ||||||
| TK Group Holdings, Ltd. | 2,452,600 | 1,073,521 | ||||||
| 1,289,779 | ||||||||
| Finland (2.41%) | ||||||||
| Musti Group Oyj | 44,964 | 1,696,347 | ||||||
| France (3.51%) | ||||||||
| Esker SA | 3,700 | 1,032,016 | ||||||
| Neurones | 9,400 | 309,653 | ||||||
| Sidetrade(a) | 1,250 | 269,005 | ||||||
| Thermador Groupe | 5,874 | 601,686 | ||||||
| Wavestone(a) | 5,647 | 257,987 | ||||||
| 2,470,347 | ||||||||
| Georgia (0.21%) | ||||||||
| TBC Bank Group PLC(a) | 11,050 | 148,638 | ||||||
| Germany (5.89%) | ||||||||
| Deutsche Industrie REIT AG | 9,460 | 189,935 | ||||||
| Exasol AG(a) | 29,465 | 855,146 | ||||||
| Fashionette AG(a) | 10,926 | 441,364 | ||||||
| Home24 SE(a) | 39,008 | 914,034 | ||||||
| Marley Spoon AG(a) | 111,136 | 226,876 | ||||||
| Nexus AG | 3,900 | 269,606 | ||||||
| Westwing Group AG(a) | 21,739 | 1,249,293 | ||||||
| 4,146,254 | ||||||||
| Greece (2.88%) | ||||||||
| Kri-Kri Milk Industry SA | 83,721 | 777,049 | ||||||
| Sarantis SA | 116,542 | 1,249,810 | ||||||
| 2,026,859 | ||||||||
| Hong Kong (0.54%) | ||||||||
| Plover Bay Technologies, Ltd.(c) | 2,008,000 | 382,587 | ||||||
| India (6.19%) | ||||||||
| Amrutanjan Health Care, Ltd. | 61,461 | 528,047 | ||||||
| Cera Sanitaryware, Ltd.(a) | 421 | 21,850 | ||||||
| EPL, Ltd. | 72,500 | 219,881 | ||||||
| Gulf Oil Lubricants India, Ltd. | 63,717 | 608,332 | ||||||
| Happiest Minds Technologies, Ltd.(a) | 43,552 | 425,951 | ||||||
| IndiaMart InterMesh, Ltd.(a)(b)(c) | 5,482 | 588,268 | ||||||
| Metropolis Healthcare, Ltd.(b)(c) | 18,316 | 592,227 | ||||||
| Vaibhav Global, Ltd. | 16,898 | 951,247 | ||||||
See Notes to Financial Statements.
| Annual Report | April 30, 2021 | 43 |
| Grandeur Peak Global Micro Cap Fund | Portfolio of Investments |
April 30, 2021
| Shares | Value (Note 2) | |||||||
| India (continued) | ||||||||
| Westlife Development, Ltd.(a) | 71,521 | $ | 422,092 | |||||
| 4,357,895 | ||||||||
| Indonesia (1.26%) | ||||||||
| Arwana Citramulia Tbk PT | 7,920,100 | 405,737 | ||||||
| Selamat Sempurna Tbk PT | 5,271,800 | 479,918 | ||||||
| 885,655 | ||||||||
| Ireland (0.84%) | ||||||||
| Irish Residential Properties REIT PLC | 137,000 | 267,817 | ||||||
| Uniphar PLC | 90,411 | 320,656 | ||||||
| 588,473 | ||||||||
| Israel (0.20%) | ||||||||
| Max Stock, Ltd.(a) | 41,382 | 143,318 | ||||||
| Italy (0.60%) | ||||||||
| Piovan SpA(b)(c) | 47,181 | 420,889 | ||||||
| Japan (15.76%) | ||||||||
| AIT Corp. | 35,400 | 341,400 | ||||||
| Atrae, Inc.(a) | 7,400 | 113,956 | ||||||
| Beenos, Inc. | 38,300 | 1,058,340 | ||||||
| Central Automotive Products, Ltd. | 10,900 | 289,729 | ||||||
| Charm Care Corp. | 58,400 | 651,917 | ||||||
| Creema, Ltd.(a) | 9,400 | 342,749 | ||||||
| eGuarantee, Inc. | 23,900 | 460,986 | ||||||
| ENECHANGE, Ltd.(a) | 15,200 | 336,851 | ||||||
| geechs, Inc. | 15,000 | 227,971 | ||||||
| Kinjiro Co., Ltd. | 12,200 | 306,535 | ||||||
| M&A Capital Partners Co., Ltd.(a) | 22,400 | 1,037,094 | ||||||
| MarkLines Co., Ltd. | 9,100 | 240,718 | ||||||
| Medikit Co., Ltd. | 4,000 | 118,218 | ||||||
| Meinan M&A Co., Ltd. | 14,500 | 238,814 | ||||||
| Open Door, Inc.(a) | 42,800 | 784,804 | ||||||
| Strike Co., Ltd. | 6,200 | 260,106 | ||||||
| Sun*, Inc.(a) | 16,500 | 339,542 | ||||||
| Synchro Food Co., Ltd.(a) | 83,800 | 286,004 | ||||||
| System Information Co., Ltd. | 22,000 | 201,903 | ||||||
| Syuppin Co., Ltd. | 101,500 | 1,081,961 | ||||||
| TeamSpirit, Inc.(a) | 17,800 | 224,271 | ||||||
| Trancom Co., Ltd. | 2,700 | 209,498 | ||||||
| User Local, Inc.(a) | 3,300 | 139,349 | ||||||
| Vega Corp. Co., Ltd. | 54,700 | 851,856 | ||||||
| WDB coco Co., Ltd. | 6,600 | 221,329 | ||||||
| YAKUODO Holdings Co., Ltd. | 33,600 | 725,556 | ||||||
| 11,091,457 | ||||||||
| Netherlands (0.41%) | ||||||||
| Shop Apotheke Europe NV(a)(b)(c) | 1,410 | 291,062 | ||||||
| Shares | Value (Note 2) | |||||||
| New Zealand (0.34%) | ||||||||
| CBL Corp., Ltd.(a)(d) | 159,993 | $ | 0 | |||||
| NZX, Ltd. | 162,500 | 240,710 | ||||||
| 240,710 | ||||||||
| Norway (2.03%) | ||||||||
| 24sevenoffice Scandinavia AB(a) | 99,164 | 412,327 | ||||||
| Medistim ASA | 7,989 | 261,053 | ||||||
| Self Storage Group ASA(a) | 268,416 | 751,333 | ||||||
| 1,424,713 | ||||||||
| Oman (0.31%) | ||||||||
| Tethys Oil AB | 30,300 | 220,479 | ||||||
| Philippines (1.01%) | ||||||||
| Concepcion Industrial Corp. | 334,770 | 156,087 | ||||||
| Pryce Corp. | 3,937,000 | 433,356 | ||||||
| Wilcon Depot, Inc. | 335,000 | 122,451 | ||||||
| 711,894 | ||||||||
| Poland (0.89%) | ||||||||
| Answear.com SA(a) | 25,400 | 230,410 | ||||||
| LiveChat Software SA | 6,400 | 210,959 | ||||||
| PGS Software SA | 51,047 | 183,070 | ||||||
| 624,439 | ||||||||
| Singapore (0.53%) | ||||||||
| Riverstone Holdings, Ltd./Singapore | 343,600 | 374,390 | ||||||
| South Korea (1.53%) | ||||||||
| Hyundai Ezwel Co., Ltd. | 25,910 | 230,135 | ||||||
| MegaStudyEdu Co., Ltd. | 2,818 | 146,683 | ||||||
| Ray Co. Ltd/KR(a) | 3,800 | 176,959 | ||||||
| Suprema, Inc.(a) | 8,703 | 208,900 | ||||||
| Tokai Carbon Korea Co., Ltd. | 1,781 | 313,658 | ||||||
| 1,076,335 | ||||||||
| Sweden (7.52%) | ||||||||
| KNOW IT AB(a) | 19,882 | 736,279 | ||||||
| Lyko Group AB(a)(c) | 11,292 | 421,505 | ||||||
| OEM International AB, Class B | 13,485 | 643,542 | ||||||
| Sdiptech AB(a) | 8,000 | 359,103 | ||||||
| SwedenCare AB | 40,385 | 2,614,240 | ||||||
| Vitec Software Group AB, Class B | 10,899 | 515,625 | ||||||
| 5,290,294 | ||||||||
| Taiwan (5.81%) | ||||||||
| Bioteque Corp. | 130,000 | 581,749 | ||||||
| Brighten Optix Corp. | 77,000 | 675,366 | ||||||
| FineTek Co., Ltd. | 96,150 | 304,976 | ||||||
| Fuzetec Technology Co., Ltd. | 192,000 | 493,524 | ||||||
| GEM Services, Inc./Tw | 182,000 | 522,550 | ||||||
| Poya International Co., Ltd.(a) | 16,000 | 350,553 | ||||||
See Notes to Financial Statements.
| 44 | 1.855.377.7325 | www.GrandeurPeakGlobal.com |
| Grandeur Peak Global Micro Cap Fund | Portfolio of Investments |
April 30, 2021
| Shares | Value (Note 2) | |||||||
| Taiwan (continued) | ||||||||
| Sporton International, Inc. | 60,725 | $ | 557,619 | |||||
| Tehmag Foods Corp. | 13,300 | 146,889 | ||||||
| Tofu Restaurant Co., Ltd. | 36,050 | 227,789 | ||||||
| Wistron Information Technology & Services Corp. | 61,000 | 224,931 | ||||||
| 4,085,946 | ||||||||
| Thailand (0.63%) | ||||||||
| Humanica PCL | 935,000 | 321,301 | ||||||
| Netbay PCL | 125,000 | 124,448 | ||||||
| 445,749 | ||||||||
| United States (14.00%) | ||||||||
| 4imprint Group PLC(a) | 24,264 | 787,477 | ||||||
| Barrett Business Services, Inc. | 9,305 | 682,336 | ||||||
| Better Choice Co., Inc.(a) | 249,661 | 347,029 | ||||||
| Castle Biosciences, Inc.(a) | 3,300 | 227,799 | ||||||
| Coastal Financial Corp.(a) | 12,400 | 369,148 | ||||||
| Esquire Financial Holdings, Inc.(a) | 25,349 | 581,759 | ||||||
| Hackett Group, Inc. | 19,165 | 318,714 | ||||||
| Heska Corp.(a) | 3,666 | 669,595 | ||||||
| Intersect ENT, Inc.(a) | 17,275 | 376,768 | ||||||
| Joint Corp.(a) | 45,451 | 2,521,621 | ||||||
| LeMaitre Vascular, Inc. | 10,200 | 535,194 | ||||||
| Limeade, Inc.(a) | 493,905 | 325,310 | ||||||
| MaxCyte, Inc.(a) | 74,400 | 932,967 | ||||||
| ProntoForms Corp.(a) | 432,000 | 414,726 | ||||||
| Systemax, Inc. | 17,800 | 760,416 | ||||||
| 9,850,859 | ||||||||
| Vietnam (0.58%) | ||||||||
| Lix Detergent JSC | 163,520 | 409,243 | ||||||
| TOTAL COMMON STOCKS | ||||||||
| (Cost $43,260,892) | 70,131,241 | |||||||
| TOTAL INVESTMENTS (99.65%) | ||||||||
| (Cost $43,260,892) | $ | 70,131,241 | ||||||
| Other Assets In Excess Of Liabilities (0.35%) | 243,516 | |||||||
| NET ASSETS (100.00%) | $ | 70,374,757 | ||||||
| (a) | Non-Income Producing Security. |
| (b) | Security exempt from registration under Rule 144A of the Securities Act of 1933. These securities may be resold in the ordinary course of business in transactions exempt from registration, normally to qualified institutional buyers. As of April 30, 2021, these securities had a total aggregate market value of $3,874,780, representing 5.51% of net assets. |
| (c) | Security was purchased pursuant to Regulation S under the Securities Act of 1933, which exempts securities offered and sold outside of the United States from registration. Such security cannot be sold in the United States without either an effective registration statement filed pursuant to the Securities Act of 1933, or pursuant to an exemption from registration. As of April 30, 2021, the aggregate market value of these securities was $4,974,266, representing 7.07% of net assets. |
| (d) | As a result of the use of significant unobservable inputs to determine fair value, these investments have been classified as level 3 assets. See also Note 2 to the financial statements for additional information. |
For Fund compliance purposes, the Fund’s geographical classifications refer to any one or more of the country sub-classifications used by one or more widely recognized market indexes or ratings group indexes, and/or as defined by Fund management. This definition may not apply for purposes of this report, which may combine sub-classifications for reporting ease. Geographical regions are shown as a percentage of net assets.
Sector Composition (April 30, 2021)
| Consumer | 27.3% |
| Technology | 20.7% |
| Health Care | 19.2% |
| Financials | 15.7% |
| Industrials | 14.7% |
| Energy & Materials | 2.1% |
| Cash, Cash Equivalents, & Other Net Assets | 0.3% |
| Total | 100% |
See Notes to Financial Statements.
| Annual Report | April 30, 2021 | 45 |
| Grandeur Peak Global Micro Cap Fund | Portfolio of Investments |
April 30, 2021
Industry Composition (April 30, 2021)
| Internet & Direct Marketing Retail | 13.1% |
| Capital Markets | 11.7% |
| Software | 9.9% |
| Health Care Providers & Services | 7.0% |
| Health Care Equipment & Supplies | 5.5% |
| IT Services | 5.2% |
| Pharmaceuticals | 4.8% |
| Professional Services | 4.2% |
| Trading Companies & Distributors | 3.7% |
| Specialty Retail | 3.2% |
| Personal Products | 2.3% |
| Machinery | 2.1% |
| Semiconductors & Semiconductor Equipment | 2.0% |
| Hotels, Restaurants & Leisure | 2.0% |
| Commercial Services & Supplies | 1.6% |
| Banks | 1.6% |
| Building Products | 1.5% |
| Textiles, Apparel & Luxury Goods | 1.4% |
| Biotechnology | 1.3% |
| Food Products | 1.3% |
| Auto Components | 1.3% |
| Equity Real Estate Investment Trusts (REITs) | 1.2% |
| Media | 1.1% |
| Diversified Financial Services | 1.1% |
| Food & Staples Retailing | 1.0% |
| Electronic Equipment, Instruments & Components | 1.0% |
| Other Industries (each less than 1%) | 7.6% |
| Cash and Other Assets, Less Liabilities | 0.3% |
| Total | 100% |
See Notes to Financial Statements.
| 46 | 1.855.377.7325 | www.GrandeurPeakGlobal.com |
| Grandeur Peak Global Opportunities Fund | Portfolio of Investments |
April 30, 2021
| Shares | Value (Note 2) | |||||||
| COMMON STOCKS (99.42%) | ||||||||
| Argentina (0.56%) | ||||||||
| Globant SA(a) | 24,775 | $ | 5,677,935 | |||||
| Australia (0.72%) | ||||||||
| Fiducian Group, Ltd. | 182,850 | 950,796 | ||||||
| Kogan.com, Ltd. | 745,408 | 6,362,419 | ||||||
| 7,313,215 | ||||||||
| Bangladesh (0.24%) | ||||||||
| Square Pharmaceuticals, Ltd. | 962,029 | 2,403,512 | ||||||
| Belgium (1.38%) | ||||||||
| Melexis NV | 62,854 | 6,846,331 | ||||||
| Warehouses De Pauw CVA | 84,756 | 2,987,660 | ||||||
| X-Fab Silicon Foundries SE(a)(b)(c) | 442,506 | 4,298,602 | ||||||
| 14,132,593 | ||||||||
| Brazil (2.12%) | ||||||||
| Fleury SA | 1,000,200 | 4,719,236 | ||||||
| Instituto Hermes Pardini SA | 708,600 | 2,456,336 | ||||||
| Locaweb Servicos de Internet SA(b)(c) | 642,900 | 3,455,911 | ||||||
| Neogrid Participacoes SA | 2,950,700 | 3,943,646 | ||||||
| Pagseguro Digital, Ltd., Class A(a) | 126,141 | 5,769,689 | ||||||
| Patria Investments, Ltd.(a) | 95,883 | 1,327,979 | ||||||
| 21,672,797 | ||||||||
| Britain (17.47%) | ||||||||
| AB Dynamics PLC | 67,600 | 2,147,247 | ||||||
| Ascential PLC(a) | 1,826,939 | 8,800,513 | ||||||
| B&M European Value Retail SA | 2,524,207 | 19,724,017 | ||||||
| Bytes Technology Group PLC(a) | 437,194 | 2,976,655 | ||||||
| City of London Investment Group PLC | 393,420 | 2,933,983 | ||||||
| Curtis Banks Group PLC | 388,399 | 1,512,637 | ||||||
| CVS Group PLC(a) | 631,780 | 19,457,103 | ||||||
| Dechra Pharmaceuticals PLC | 455,423 | 25,372,210 | ||||||
| Diploma PLC | 129,290 | 5,120,962 | ||||||
| Endava PLC, ADR(a) | 226,518 | 20,508,940 | ||||||
| Gamma Communications PLC | 206,400 | 5,182,162 | ||||||
| Impax Asset Management Group PLC | 266,274 | 3,692,070 | ||||||
| JTC PLC(b)(c) | 482,638 | 4,485,843 | ||||||
| K3 Capital Group PLC | 865,551 | 3,896,886 | ||||||
| On the Beach Group PLC(a)(b)(c) | 1,128,677 | 6,468,822 | ||||||
| Pensionbee Group PLC(a) | 888,523 | 2,208,760 | ||||||
| Premier Miton Group PLC | 1,776,550 | 4,293,613 | ||||||
| Sabre Insurance Group PLC(b)(c) | 974,131 | 3,504,552 | ||||||
| Sanne Group PLC | 558,317 | 4,981,049 | ||||||
| Softcat PLC | 207,456 | 5,492,317 | ||||||
| Shares | Value (Note 2) | |||||||
| Britain (continued) | ||||||||
| St. James's Place PLC | 445,740 | $ | 8,381,210 | |||||
| Team17 Group PLC(a) | 329,984 | 3,531,848 | ||||||
| Tristel PLC | 48,517 | 402,025 | ||||||
| Ultra Electronics Holdings PLC | 273,063 | 7,625,204 | ||||||
| Volution Group PLC | 1,006,553 | 5,789,741 | ||||||
| 178,490,369 | ||||||||
| Canada (1.76%) | ||||||||
| Gildan Activewear, Inc.(a) | 226,300 | 7,854,174 | ||||||
| Guardian Capital Group, Ltd. | 115,200 | 3,022,577 | ||||||
| Pivotree, Inc.(a) | 191,300 | 1,223,299 | ||||||
| Richelieu Hardware, Ltd. | 168,565 | 5,888,769 | ||||||
| 17,988,819 | ||||||||
| China (6.47%) | ||||||||
| CSPC Pharmaceutical Group, Ltd. | 2,758,920 | 3,416,795 | ||||||
| Hangzhou Robam Appliances Co., Ltd., Class A | 1,028,800 | 6,099,831 | ||||||
| Li Ning Co., Ltd. | 738,600 | 6,028,417 | ||||||
| Man Wah Holdings, Ltd. | 3,380,900 | 7,111,957 | ||||||
| O2Micro International, Ltd., ADR(a) | 289,520 | 1,971,631 | ||||||
| Silergy Corp. | 218,352 | 22,864,698 | ||||||
| Suofeiya Home Collection Co., Ltd., Class A(a) | 1,758,300 | 7,911,875 | ||||||
| Trip.com Group, Ltd., ADR(a) | 138,534 | 5,413,909 | ||||||
| WuXi AppTec Co., Ltd., Class H(b)(c) | 222,180 | 5,254,349 | ||||||
| 66,073,462 | ||||||||
| Egypt (0.11%) | ||||||||
| Integrated Diagnostics Holdings PLC(b)(c) | 933,600 | 1,092,312 | ||||||
| Finland (1.02%) | ||||||||
| Musti Group Oyj | 276,174 | 10,419,155 | ||||||
| France (4.68%) | ||||||||
| Alten SA(a) | 60,082 | 7,519,550 | ||||||
| BioMerieux | 24,847 | 2,954,982 | ||||||
| Esker SA | 35,947 | 10,026,455 | ||||||
| Neurones | 110,960 | 3,655,222 | ||||||
| Rothschild & Co.(a) | 85,510 | 3,043,024 | ||||||
| Thermador Groupe | 73,248 | 7,502,951 | ||||||
| Virbac SA(a) | 34,462 | 11,186,674 | ||||||
| Wavestone(a) | 42,647 | 1,948,358 | ||||||
| 47,837,216 | ||||||||
| Georgia (0.50%) | ||||||||
| Bank of Georgia Group PLC(a) | 92,641 | 1,307,560 | ||||||
| Georgia Capital PLC(a) | 300,557 | 2,336,914 | ||||||
| TBC Bank Group PLC(a) | 110,932 | 1,492,187 | ||||||
| 5,136,661 | ||||||||
See Notes to Financial Statements.
| Annual Report | April 30, 2021 | 47 |
| Grandeur Peak Global Opportunities Fund | Portfolio of Investments |
April 30, 2021
| Shares | Value (Note 2) | |||||||
| Germany (7.51%) | ||||||||
| Atoss Software AG | 12,700 | $ | 2,830,807 | |||||
| Dermapharm Holding SE | 113,975 | 9,961,868 | ||||||
| Exasol AG(a) | 208,200 | 6,042,473 | ||||||
| Fashionette AG(a) | 160,243 | 6,473,141 | ||||||
| Friedrich Vorwerk Group SE(a) | 60,903 | 3,748,913 | ||||||
| Grand City Properties SA | 112,198 | 3,016,155 | ||||||
| Home24 SE(a) | 129,187 | 3,027,104 | ||||||
| Nagarro SE(a) | 27,170 | 2,979,074 | ||||||
| Nexus AG | 82,624 | 5,711,771 | ||||||
| Norma Group SE | 213,223 | 11,894,571 | ||||||
| PATRIZIA AG | 131,095 | 3,585,620 | ||||||
| PharmaSGP Holding SE(a) | 159,300 | 3,160,068 | ||||||
| QIAGEN NV(a) | 167,477 | 8,060,668 | ||||||
| Westwing Group AG(a) | 108,845 | 6,255,084 | ||||||
| 76,747,317 | ||||||||
| Hong Kong (0.24%) | ||||||||
| Jacobson Pharma Corp., Ltd.(c) | 2,412,100 | 242,211 | ||||||
| Vitasoy International Holdings, Ltd. | 584,000 | 2,259,239 | ||||||
| 2,501,450 | ||||||||
| India (4.67%) | ||||||||
| Computer Age Management Services, Ltd. | 164,350 | 5,154,762 | ||||||
| EPL, Ltd. | 481,054 | 1,458,960 | ||||||
| Gulf Oil Lubricants India, Ltd. | 200,637 | 1,915,562 | ||||||
| HCL Technologies, Ltd. | 294,138 | 3,569,683 | ||||||
| IndiaMart InterMesh, Ltd.(a)(b)(c) | 49,575 | 5,319,847 | ||||||
| L&T Technology Services, Ltd.(b)(c) | 89,947 | 3,313,731 | ||||||
| Metropolis Healthcare, Ltd.(b)(c) | 431,609 | 13,955,586 | ||||||
| WNS Holdings, Ltd., ADR(a) | 180,376 | 13,064,634 | ||||||
| 47,752,765 | ||||||||
| Indonesia (1.00%) | ||||||||
| Arwana Citramulia Tbk PT | 58,214,800 | 2,982,274 | ||||||
| Selamat Sempurna Tbk PT | 56,561,200 | 5,149,047 | ||||||
| Ultrajaya Milk Industry & Trading Co. Tbk PT | 18,240,200 | 2,033,002 | ||||||
| 10,164,323 | ||||||||
| Ireland (1.56%) | ||||||||
| Irish Residential Properties REIT PLC | 4,325,741 | 8,456,250 | ||||||
| Keywords Studios PLC(a) | 201,271 | 7,521,707 | ||||||
| 15,977,957 | ||||||||
| Israel (0.83%) | ||||||||
| Wix.com, Ltd.(a) | 26,747 | 8,502,336 | ||||||
| Italy (1.40%) | ||||||||
| DiaSorin SpA | 12,949 | 2,198,981 | ||||||
| Shares | Value (Note 2) | |||||||
| Italy (continued) | ||||||||
| GVS SpA(a)(b)(c) | 179,465 | $ | 3,128,560 | |||||
| Interpump Group SpA | 143,595 | 7,647,857 | ||||||
| Piovan SpA(b)(c) | 144,291 | 1,287,182 | ||||||
| 14,262,580 | ||||||||
| Japan (8.85%) | ||||||||
| AIT Corp. | 335,400 | 3,234,620 | ||||||
| Appier Group, Inc.(a) | 33,500 | 585,767 | ||||||
| BayCurrent Consulting, Inc. | 20,900 | 5,708,345 | ||||||
| Charm Care Corp. | 252,000 | 2,813,066 | ||||||
| Create SD Holdings Co., Ltd. | 182,700 | 5,541,683 | ||||||
| Japan Lifeline Co., Ltd. | 566,600 | 7,983,933 | ||||||
| Kinjiro Co., Ltd. | 88,600 | 2,226,147 | ||||||
| M&A Capital Partners Co., Ltd.(a) | 164,200 | 7,602,269 | ||||||
| MarkLines Co., Ltd. | 45,200 | 1,195,656 | ||||||
| Medikit Co., Ltd. | 80,500 | 2,379,129 | ||||||
| MonotaRO Co., Ltd. | 136,200 | 3,476,969 | ||||||
| Naigai Trans Line, Ltd. | 118,700 | 1,870,266 | ||||||
| Open Door, Inc.(a) | 337,300 | 6,184,913 | ||||||
| Seria Co., Ltd. | 322,900 | 11,714,690 | ||||||
| Strike Co., Ltd. | 94,800 | 3,977,107 | ||||||
| Synchro Food Co., Ltd.(a) | 449,300 | 1,533,433 | ||||||
| Systena Corp. | 153,200 | 3,152,592 | ||||||
| Syuppin Co., Ltd. | 164,600 | 1,754,589 | ||||||
| Trancom Co., Ltd. | 73,470 | 5,700,664 | ||||||
| User Local, Inc.(a) | 106,100 | 4,480,296 | ||||||
| Visional, Inc.(a) | 12,100 | 691,966 | ||||||
| YAKUODO Holdings Co., Ltd. | 305,700 | 6,601,263 | ||||||
| 90,409,363 | ||||||||
| Mexico (0.85%) | ||||||||
| Grupo Herdez SAB de CV | 2,218,966 | 4,655,480 | ||||||
| Regional SAB de CV(a) | 781,527 | 3,987,304 | ||||||
| 8,642,784 | ||||||||
| Netherlands (1.60%) | ||||||||
| Aalberts NV | 143,153 | 7,753,397 | ||||||
| Shop Apotheke Europe NV(a)(b)(c) | 41,456 | 8,557,648 | ||||||
| 16,311,045 | ||||||||
| �� | ||||||||
| New Zealand (0.00%)(d) | ||||||||
| CBL Corp., Ltd.(a)(e) | 1,107,672 | 1 | ||||||
| Norway (0.20%) | ||||||||
| Medistim ASA | 64,055 | 2,093,099 | ||||||
| Philippines (0.73%) | ||||||||
| Concepcion Industrial Corp. | 1,035,152 | 482,641 | ||||||
| Puregold Price Club, Inc. | 6,155,800 | 4,768,668 | ||||||
| Wilcon Depot, Inc. | 6,158,500 | 2,251,082 | ||||||
| 7,502,391 | ||||||||
See Notes to Financial Statements.
| 48 | 1.855.377.7325 | www.GrandeurPeakGlobal.com |
| Grandeur Peak Global Opportunities Fund | Portfolio of Investments |
April 30, 2021
| Shares | Value (Note 2) | |||||||
| Poland (0.69%) | ||||||||
| Dino Polska SA(a)(b)(c) | 100,797 | $ | 6,544,017 | |||||
| PGS Software SA | 138,443 | 496,499 | ||||||
| 7,040,516 | ||||||||
| Singapore (0.53%) | ||||||||
| Riverstone Holdings, Ltd./Singapore | 4,938,000 | 5,380,500 | ||||||
| South Africa (0.25%) | ||||||||
| Italtile, Ltd. | 2,148,741 | 2,527,669 | ||||||
| South Korea (1.02%) | ||||||||
| LEENO Industrial, Inc. | 24,704 | 3,620,040 | ||||||
| Tokai Carbon Korea Co., Ltd. | 38,780 | 6,829,687 | ||||||
| 10,449,727 | ||||||||
| Sweden (3.67%) | ||||||||
| AddTech AB, Class B | 59,087 | 1,032,996 | ||||||
| Beijer Alma AB | 321,810 | 7,245,481 | ||||||
| Boozt AB(a)(b)(c) | 96,808 | 2,253,942 | ||||||
| Cint Group AB(a) | 204,468 | 2,077,154 | ||||||
| EQT AB | 101,324 | 3,426,719 | ||||||
| Hexpol AB | 325,814 | 4,004,577 | ||||||
| KNOW IT AB(a) | 174,959 | 6,479,159 | ||||||
| Lyko Group AB(a)(c) | 43,831 | 1,636,113 | ||||||
| OEM International AB, Class B | 62,406 | 2,978,191 | ||||||
| Sdiptech AB(a) | 44,439 | 1,994,769 | ||||||
| SwedenCare AB | 66,792 | 4,323,643 | ||||||
| 37,452,744 | ||||||||
| Switzerland (0.40%) | ||||||||
| Partners Group Holding AG | 2,850 | 4,056,940 | ||||||
| Taiwan (2.33%) | ||||||||
| ASPEED Technology, Inc. | 53,500 | 4,041,277 | ||||||
| Bioteque Corp. | 1,169,000 | 5,231,268 | ||||||
| Brighten Optix Corp. | 172,000 | 1,508,610 | ||||||
| Poya International Co., Ltd.(a) | 208,000 | 4,557,190 | ||||||
| Sporton International, Inc. | 705,671 | 6,479,956 | ||||||
| Tofu Restaurant Co., Ltd. | 47,000 | 296,979 | ||||||
| Voltronic Power Technology Corp. | 37,100 | 1,693,427 | ||||||
| 23,808,707 | ||||||||
| United States (22.66%) | ||||||||
| 4imprint Group PLC(a) | 162,955 | 5,288,628 | ||||||
| Bank of NT Butterfield & Son, Ltd. | 209,104 | 8,201,059 | ||||||
| Barrett Business Services, Inc. | 47,990 | 3,519,107 | ||||||
| Cardiovascular Systems, Inc.(a) | 129,773 | 5,232,447 | ||||||
| Castle Biosciences, Inc.(a) | 54,096 | 3,734,247 | ||||||
| EPAM Systems, Inc.(a) | 45,978 | 21,046,430 | ||||||
| Esquire Financial Holdings, Inc.(a) | 21,936 | 503,431 | ||||||
| Etsy, Inc.(a) | 17,631 | 3,504,866 | ||||||
| Shares | Value (Note 2) | |||||||
| United States (continued) | ||||||||
| ExlService Holdings, Inc.(a) | 66,543 | $ | 6,147,242 | |||||
| First Republic Bank | 75,666 | 13,865,038 | ||||||
| Five Below, Inc.(a) | 22,052 | 4,438,406 | ||||||
| Frontage Holdings Corp.(a)(b)(c) | 2,815,100 | 1,917,142 | ||||||
| FTI Consulting, Inc.(a) | 38,574 | 5,356,000 | ||||||
| Genpact, Ltd. | 191,300 | 9,092,489 | ||||||
| Glacier Bancorp, Inc. | 140,254 | 8,267,973 | ||||||
| Heska Corp.(a) | 73,617 | 13,446,145 | ||||||
| Houlihan Lokey, Inc. | 42,250 | 2,799,908 | ||||||
| IDEXX Laboratories, Inc.(a) | 6,575 | 3,609,609 | ||||||
| Insperity, Inc. | 40,139 | 3,513,768 | ||||||
| Joint Corp.(a) | 28,615 | 1,587,560 | ||||||
| LeMaitre Vascular, Inc. | 173,934 | 9,126,317 | ||||||
| LGI Homes, Inc.(a) | 51,189 | 8,486,112 | ||||||
| Littelfuse, Inc. | 44,684 | 11,851,984 | ||||||
| Marcus & Millichap, Inc.(a) | 138,449 | 4,890,019 | ||||||
| MaxCyte, Inc.(a) | 286,500 | 3,592,675 | ||||||
| Moelis & Co., Class A | 16,169 | 877,653 | ||||||
| NV5 Global, Inc.(a) | 54,534 | 4,915,149 | ||||||
| Ollie's Bargain Outlet Holdings, Inc.(a) | 59,788 | 5,516,639 | ||||||
| Paylocity Holding Corp.(a) | 10,445 | 2,018,392 | ||||||
| PJT Partners, Inc., Class A | 91,475 | 6,726,157 | ||||||
| Poshmark, Inc.(a) | 26,850 | 1,123,136 | ||||||
| Power Integrations, Inc. | 37,854 | 3,134,690 | ||||||
| PPD, Inc.(a) | 97,349 | 4,497,524 | ||||||
| Qualys, Inc.(a) | 95,894 | 9,719,816 | ||||||
| Rapid7, Inc.(a) | 67,264 | 5,465,200 | ||||||
| Silicon Laboratories, Inc.(a) | 21,139 | 2,979,542 | ||||||
| SVB Financial Group(a) | 9,863 | 5,639,959 | ||||||
| Systemax, Inc. | 145,716 | 6,224,988 | ||||||
| TriMas Corp.(a) | 179,710 | 5,721,966 | ||||||
| Ulta Beauty, Inc.(a) | 11,927 | 3,928,157 | ||||||
| 231,507,570 | ||||||||
| Vietnam (1.40%) | ||||||||
| Vietnam Dairy Products JSC | 914,196 | 3,707,540 | ||||||
| Vietnam Technological & Commercial Joint Stock Bank(a) | 5,964,004 | 10,606,123 | ||||||
| 14,313,663 | ||||||||
| TOTAL COMMON STOCKS | ||||||||
| (Cost $610,028,375) | 1,015,643,493 | |||||||
| PREFERRED STOCKS (0.42%) | ||||||||
| United States (0.42%) | ||||||||
| Dataminr Inc - Private Placement(a)(e) | 96,640 | 4,252,160 | ||||||
| TOTAL PREFERRED STOCKS | ||||||||
| (Cost $1,923,136) | 4,252,160 | |||||||
See Notes to Financial Statements.
| Annual Report | April 30, 2021 | 49 |
| Grandeur Peak Global Opportunities Fund | Portfolio of Investments |
April 30, 2021
| Value | ||||
| TOTAL INVESTMENTS (99.84%) | ||||
| (Cost $611,951,511) | $ | 1,019,895,653 | ||
| Other Assets In Excess Of Liabilities (0.16%) | 1,666,100 | |||
| NET ASSETS (100.00%) | $ | 1,021,561,753 | ||
| (a) | Non-Income Producing Security. |
| (b) | Security exempt from registration under Rule 144A of the Securities Act of 1933. These securities may be resold in the ordinary course of business in transactions exempt from registration, normally to qualified institutional buyers. As of April 30, 2021, these securities had a total aggregate market value of $74,838,046, representing 7.33% of net assets. |
| (c) | Security was purchased pursuant to Regulation S under the Securities Act of 1933, which exempts securities offered and sold outside of the United States from registration. Such security cannot be sold in the United States without either an effective registration statement filed pursuant to the Securities Act of 1933, or pursuant to an exemption from registration. As of April 30, 2021, the aggregate market value of these securities was $76,716,370, representing 7.51% of net assets. |
| (d) | Less than 0.005%. |
| (e) | As a result of the use of significant unobservable inputs to determine fair value, these investments have been classified as level 3 assets. See also Note 2 to the financial statements for additional information. |
For Fund compliance purposes, the Fund's geographical classifications refer to any one or more of the country sub-classifications used by one or more widely recognized market indexes or ratings group indexes, and/or as defined by Fund management. This definition may not apply for purposes of this report, which may combine sub-classifications for reporting ease. Geographical regions are shown as a percentage of net assets.
| Sector Composition (April 30, 2021) | |
| Technology | 29.1% |
| Consumer | 20.2% |
| Health Care | 19.9% |
| Financials | 15.0% |
| Industrials | 14.9% |
| Energy & Materials | 0.7% |
| Cash, Cash Equivalents, & Other Net Assets | 0.2% |
| Total | 100% |
| Industry Composition (April 30, 2021) | |
| IT Services | 14.0% |
| Capital Markets | 7.0% |
| Health Care Equipment & Supplies | 6.3% |
| Pharmaceuticals | 5.9% |
| Software | 5.6% |
| Semiconductors & Semiconductor Equipment | 5.5% |
| Banks | 5.3% |
| Internet & Direct Marketing Retail | 5.0% |
| Health Care Providers & Services | 4.9% |
| Multiline Retail | 4.1% |
| Machinery | 4.1% |
| Trading Companies & Distributors | 3.7% |
| Professional Services | 3.1% |
| Household Durables | 2.9% |
| Specialty Retail | 2.5% |
| Food & Staples Retailing | 2.3% |
| Life Sciences Tools & Services | 1.9% |
| Media | 1.4% |
| Textiles, Apparel & Luxury Goods | 1.4% |
| Food Products | 1.2% |
| Electronic Equipment, Instruments & Components | 1.2% |
| Real Estate Management & Development | 1.1% |
| Equity Real Estate Investment Trusts (REITs) | 1.1% |
| Other Industries (each less than 1%) | 8.3% |
| Cash and Other Assets, Less Liabilities | 0.2% |
| Total | 100% |
See Notes to Financial Statements.
| 50 | 1.855.377.7325 | www.GrandeurPeakGlobal.com |
| Grandeur Peak Global Reach Fund | Portfolio of Investments |
April 30, 2021
| Shares | Value (Note 2) | |||||||
| COMMON STOCKS (98.83%) | ||||||||
| Argentina (0.37%) | ||||||||
| Globant SA(a) | 6,105 | $ | 1,399,144 | |||||
| Australia (2.68%) | ||||||||
| Appen, Ltd. | 54,722 | 660,149 | ||||||
| Australian Ethical Investment, Ltd. | 373,810 | 2,513,933 | ||||||
| Bravura Solutions, Ltd. | 122,268 | 265,614 | ||||||
| EQT Holdings, Ltd. | 45,188 | 853,208 | ||||||
| Kogan.com, Ltd. | 163,531 | 1,395,817 | ||||||
| National Storage REIT | 470,466 | 728,472 | ||||||
| Netwealth Group, Ltd. | 89,313 | 1,024,467 | ||||||
| People Infrastructure, Ltd. | 299,959 | 1,042,142 | ||||||
| Redbubble, Ltd.(a) | 227,593 | 718,838 | ||||||
| Whispir, Ltd.(a) | 367,258 | 910,994 | ||||||
| 10,113,634 | ||||||||
| Austria (0.27%) | ||||||||
| Schoeller-Bleckmann Oilfield Equipment AG | 23,700 | 1,014,367 | ||||||
| Bangladesh (0.14%) | ||||||||
| Square Pharmaceuticals, Ltd. | 202,545 | 506,034 | ||||||
| Belgium (0.58%) | ||||||||
| Melexis NV | 10,126 | 1,102,968 | ||||||
| Warehouses De Pauw CVA | 30,732 | 1,083,307 | ||||||
| 2,186,275 | ||||||||
| Brazil (2.80%) | ||||||||
| Arco Platform, Ltd., Class A(a) | 11,542 | 296,168 | ||||||
| Diagnosticos da America SA(a) | 52,000 | 551,202 | ||||||
| Fleury SA | 339,800 | 1,603,276 | ||||||
| Hypera SA | 81,800 | 519,377 | ||||||
| Instituto Hermes Pardini SA | 198,300 | 687,400 | ||||||
| Locaweb Servicos de Internet SA(b)(c) | 327,268 | 1,759,230 | ||||||
| Neogrid Participacoes SA | 702,600 | 939,033 | ||||||
| Pagseguro Digital, Ltd., Class A(a) | 51,452 | 2,353,414 | ||||||
| Patria Investments, Ltd.(a) | 53,975 | 747,554 | ||||||
| Pet Center Comercio e Participacoes SA | 40,000 | 174,299 | ||||||
| Raia Drogasil SA | 140,000 | 679,891 | ||||||
| Vasta Platform(a) | 26,251 | 256,997 | ||||||
| 10,567,841 | ||||||||
| Britain (14.58%) | ||||||||
| AB Dynamics PLC | 51,876 | 1,647,790 | ||||||
| Abcam PLC(a) | 65,482 | 1,381,824 | ||||||
| Ascential PLC(a) | 67,756 | 326,386 | ||||||
| B&M European Value Retail SA | 487,900 | 3,812,424 | ||||||
| Bytes Technology Group PLC(a) | 113,792 | 774,758 | ||||||
| Shares | Value (Note 2) | |||||||
| Britain (continued) | ||||||||
| Clinigen Group PLC | 91,173 | $ | 1,074,675 | |||||
| Curtis Banks Group PLC | 104,800 | 408,148 | ||||||
| CVS Group PLC(a) | 74,800 | 2,303,636 | ||||||
| Darktrace PLC(a) | 25,000 | 113,936 | ||||||
| Dechra Pharmaceuticals PLC | 62,014 | 3,454,881 | ||||||
| Diploma PLC | 18,786 | 744,082 | ||||||
| dotdigital group PLC | 721,682 | 1,893,682 | ||||||
| Endava PLC, ADR(a) | 52,553 | 4,758,149 | ||||||
| First Derivatives PLC(a) | 7,600 | 307,006 | ||||||
| Foresight Group Holdings, Ltd.(a) | 216,892 | 1,270,038 | ||||||
| FRP Advisory Group PLC | 238,865 | 394,210 | ||||||
| Gamma Communications PLC | 74,969 | 1,882,275 | ||||||
| GlobalData PLC | 27,797 | 600,786 | ||||||
| Impax Asset Management Group PLC | 415,217 | 5,757,266 | ||||||
| Intertek Group PLC | 20,231 | 1,714,951 | ||||||
| JTC PLC(b)(c) | 369,856 | 3,437,599 | ||||||
| K3 Capital Group PLC | 532,428 | 2,397,099 | ||||||
| Keystone Law Group PLC | 119,151 | 1,094,276 | ||||||
| Ocado Group PLC(a) | 18,958 | 549,033 | ||||||
| On the Beach Group PLC(a)(b)(c) | 541,626 | 3,104,238 | ||||||
| Pensionbee Group PLC(a) | 815,693 | 2,027,714 | ||||||
| Rotork PLC | 140,010 | 666,318 | ||||||
| Sanne Group PLC | 295,332 | 2,634,817 | ||||||
| Softcat PLC | 28,098 | 743,884 | ||||||
| Team17 Group PLC(a) | 34,619 | 370,530 | ||||||
| Tristel PLC | 25,000 | 207,157 | ||||||
| Ultra Electronics Holdings PLC | 40,770 | 1,138,490 | ||||||
| Volution Group PLC | 193,447 | 1,112,716 | ||||||
| XPS Pensions Group PLC(c) | 510,185 | 870,166 | ||||||
| 54,974,940 | ||||||||
| Canada (1.17%) | ||||||||
| Gildan Activewear, Inc.(a) | 49,600 | 1,721,463 | ||||||
| Guardian Capital Group, Ltd. | 16,000 | 419,802 | ||||||
| Pivotree, Inc.(a) | 50,200 | 321,012 | ||||||
| Richelieu Hardware, Ltd. | 17,100 | 597,383 | ||||||
| Ritchie Bros Auctioneers, Inc. | 21,401 | 1,361,104 | ||||||
| 4,420,764 | ||||||||
| China (4.72%) | ||||||||
| CSPC Pharmaceutical Group, Ltd. | 769,520 | 953,015 | ||||||
| Guangzhou KDT Machinery Co., Ltd.(a) | 93,100 | 776,133 | ||||||
| Hangzhou Robam Appliances Co., Ltd., Class A | 102,700 | 608,916 | ||||||
| HUYA, Inc., ADR(a) | 21,488 | 378,618 | ||||||
| Koolearn Technology Holding, Ltd.(a)(b)(c) | 141,400 | 271,960 | ||||||
| Li Ning Co., Ltd. | 73,800 | 602,352 | ||||||
| Man Wah Holdings, Ltd. | 660,800 | 1,390,039 | ||||||
| ManpowerGroup Greater China, Ltd.(c) | 578,000 | 735,917 | ||||||
See Notes to Financial Statements.
| Annual Report | April 30, 2021 | 51 |
| Grandeur Peak Global Reach Fund | Portfolio of Investments |
April 30, 2021
| Shares | Value (Note 2) | |||||||
| China (continued) | ||||||||
| O2Micro International, Ltd., ADR(a) | 117,745 | $ | 801,843 | |||||
| Silergy Corp. | 56,925 | 5,960,893 | ||||||
| Suofeiya Home Collection Co., Ltd., Class A(a) | 134,100 | 603,414 | ||||||
| TK Group Holdings, Ltd. | 1,830,000 | 801,004 | ||||||
| Trip.com Group, Ltd., ADR(a) | 13,250 | 517,810 | ||||||
| WuXi AppTec Co., Ltd., Class H(b)(c) | 118,760 | 2,808,563 | ||||||
| Yum China Holdings, Inc. | 8,943 | 562,693 | ||||||
| 17,773,170 | ||||||||
| Colombia (0.74%) | ||||||||
| Parex Resources, Inc.(a) | 148,861 | 2,803,671 | ||||||
| Egypt (0.26%) | ||||||||
| African Export-Import Bank, GDR | 200,000 | 644,000 | ||||||
| Integrated Diagnostics Holdings PLC(b)(c) | 291,972 | 341,607 | ||||||
| 985,607 | ||||||||
| Finland (0.76%) | ||||||||
| Musti Group Oyj | 75,531 | 2,849,541 | ||||||
| France (3.22%) | ||||||||
| Alten SA(a) | 10,400 | 1,301,610 | ||||||
| BioMerieux | 2,676 | 318,249 | ||||||
| Bureau Veritas SA(a) | 35,351 | 1,056,998 | ||||||
| Esker SA | 18,548 | 5,173,469 | ||||||
| Neurones | 17,282 | 569,300 | ||||||
| Sidetrade(a) | 2,745 | 590,734 | ||||||
| Thermador Groupe | 19,759 | 2,023,957 | ||||||
| Virbac SA(a) | 3,383 | 1,098,152 | ||||||
| 12,132,469 | ||||||||
| Germany (4.53%) | ||||||||
| Dermapharm Holding SE | 17,100 | 1,494,608 | ||||||
| Deutsche Industrie REIT AG | 21,300 | 427,654 | ||||||
| Exasol AG(a) | 45,800 | 1,329,228 | ||||||
| Fashionette AG(a) | 41,523 | 1,677,354 | ||||||
| Friedrich Vorwerk Group SE(a) | 21,968 | 1,352,251 | ||||||
| Home24 SE(a) | 65,399 | 1,532,427 | ||||||
| Nagarro SE(a) | 8,803 | 965,211 | ||||||
| Nexus AG | 11,031 | 762,570 | ||||||
| Norma Group SE | 13,460 | 750,861 | ||||||
| PATRIZIA AG | 53,603 | 1,466,112 | ||||||
| PharmaSGP Holding SE(a) | 32,536 | 645,424 | ||||||
| Puma SE(a) | 5,149 | 543,023 | ||||||
| QIAGEN NV(a) | 24,225 | 1,165,949 | ||||||
| Westwing Group AG(a) | 51,400 | 2,953,845 | ||||||
| 17,066,517 | ||||||||
| Greece (0.72%) | ||||||||
| Kri-Kri Milk Industry SA | 61,300 | 568,951 | ||||||
| Shares | Value (Note 2) | |||||||
| Greece (continued) | ||||||||
| Sarantis SA | 199,040 | $ | 2,134,528 | |||||
| 2,703,479 | ||||||||
| Hong Kong (1.17%) | ||||||||
| Jacobson Pharma Corp., Ltd.(c) | 2,583,300 | 259,403 | ||||||
| Plover Bay Technologies, Ltd.(c) | 3,254,000 | 619,989 | ||||||
| Techtronic Industries Co., Ltd. | 122,000 | 2,223,964 | ||||||
| Vitasoy International Holdings, Ltd. | 336,000 | 1,299,836 | ||||||
| 4,403,192 | ||||||||
| India (4.59%) | ||||||||
| Avenue Supermarts, Ltd.(a)(b)(c) | 15,385 | 592,553 | ||||||
| Cera Sanitaryware, Ltd.(a) | 2,253 | 116,930 | ||||||
| Computer Age Management Services, Ltd. | 15,000 | 470,468 | ||||||
| EPL, Ltd. | 367,424 | 1,114,338 | ||||||
| Gulf Oil Lubricants India, Ltd. | 100,176 | 956,421 | ||||||
| HCL Technologies, Ltd. | 43,536 | 528,356 | ||||||
| HDFC Bank, Ltd.(a) | 67,037 | 1,278,158 | ||||||
| IndiaMart InterMesh, Ltd.(a)(b)(c) | 15,491 | 1,662,325 | ||||||
| L&T Technology Services, Ltd.(b)(c) | 28,748 | 1,059,103 | ||||||
| Metropolis Healthcare, Ltd.(b)(c) | 90,081 | 2,912,667 | ||||||
| Poly Medicure, Ltd.(a) | 33,085 | 443,419 | ||||||
| Polycab India, Ltd.(a) | 41,000 | 812,029 | ||||||
| Time Technoplast, Ltd. | 1,106,883 | 1,126,720 | ||||||
| Vaibhav Global, Ltd. | 8,197 | 461,438 | ||||||
| Westlife Development, Ltd.(a) | 75,255 | 444,129 | ||||||
| WNS Holdings, Ltd., ADR(a)(d) | 46,019 | 3,333,156 | ||||||
| 17,312,210 | ||||||||
| Indonesia (1.19%) | ||||||||
| Arwana Citramulia Tbk PT | 26,137,200 | 1,338,978 | ||||||
| Bank Central Asia Tbk PT | 332,700 | 737,606 | ||||||
| Selamat Sempurna Tbk PT | 19,027,700 | 1,732,186 | ||||||
| Ultrajaya Milk Industry & Trading Co. Tbk PT | 6,163,200 | 686,933 | ||||||
| 4,495,703 | ||||||||
| Ireland (0.89%) | ||||||||
| Keywords Studios PLC(a) | 39,519 | 1,476,866 | ||||||
| Uniphar PLC | 523,697 | 1,857,372 | ||||||
| 3,334,238 | ||||||||
| Israel (1.23%) | ||||||||
| Max Stock, Ltd.(a) | 85,618 | 296,520 | ||||||
| Wix.com, Ltd.(a)(d) | 13,652 | 4,339,698 | ||||||
| 4,636,218 | ||||||||
| Italy (0.70%) | ||||||||
| GVS SpA(a)(b)(c) | 17,537 | 305,718 | ||||||
See Notes to Financial Statements.
| 52 | 1.855.377.7325 | www.GrandeurPeakGlobal.com |
| Grandeur Peak Global Reach Fund | Portfolio of Investments |
April 30, 2021
| Shares | Value (Note 2) | |||||||
| Italy (continued) | ||||||||
| Interpump Group SpA | 20,850 | $ | 1,110,469 | |||||
| Piovan SpA(b)(c) | 138,608 | 1,236,485 | ||||||
| 2,652,672 | ||||||||
| Japan (7.38%) | ||||||||
| AIT Corp. | 58,900 | 568,036 | ||||||
| Appier Group, Inc.(a) | 12,100 | 211,576 | ||||||
| BASE, Inc.(a) | 29,000 | 483,731 | ||||||
| BayCurrent Consulting, Inc. | 10,900 | 2,977,079 | ||||||
| Beenos, Inc. | 27,500 | 759,905 | ||||||
| Charm Care Corp. | 68,600 | 765,779 | ||||||
| Coconala, Inc.(a) | 19,100 | 355,995 | ||||||
| Creema, Ltd.(a) | 13,000 | 474,014 | ||||||
| eGuarantee, Inc. | 6,400 | 123,444 | ||||||
| ENECHANGE, Ltd.(a) | 16,600 | 367,876 | ||||||
| Funai Soken Holdings, Inc. | 36,700 | 650,788 | ||||||
| geechs, Inc. | 46,100 | 700,632 | ||||||
| gremz, Inc. | 69,100 | 1,175,377 | ||||||
| Industrial & Infrastructure Fund Investment Corp. | 409 | 741,357 | ||||||
| Japan Lifeline Co., Ltd. | 79,700 | 1,123,049 | ||||||
| Kinjiro Co., Ltd. | 29,100 | 731,161 | ||||||
| MarkLines Co., Ltd. | 24,800 | 656,023 | ||||||
| Medikit Co., Ltd. | 20,700 | 611,776 | ||||||
| MonotaRO Co., Ltd. | 36,200 | 924,129 | ||||||
| Naigai Trans Line, Ltd. | 68,150 | 1,073,788 | ||||||
| Nihon M&A Center, Inc. | 50,400 | 1,320,758 | ||||||
| Open Door, Inc.(a) | 60,200 | 1,103,859 | ||||||
| Seria Co., Ltd. | 22,400 | 812,664 | ||||||
| Synchro Food Co., Ltd.(a) | 113,400 | 387,027 | ||||||
| System Information Co., Ltd. | 43,600 | 400,135 | ||||||
| Systena Corp. | 35,800 | 736,702 | ||||||
| Syuppin Co., Ltd. | 119,100 | 1,269,572 | ||||||
| TeamSpirit, Inc.(a) | 22,800 | 287,269 | ||||||
| Trancom Co., Ltd. | 18,100 | 1,404,410 | ||||||
| Tsuruha Holdings, Inc. | 3,200 | 369,512 | ||||||
| User Local, Inc.(a) | 12,500 | 527,839 | ||||||
| Vega Corp. Co., Ltd. | 38,600 | 601,127 | ||||||
| Visional, Inc.(a) | 4,500 | 257,343 | ||||||
| WDB coco Co., Ltd. | 11,900 | 399,062 | ||||||
| WealthNavi, Inc.(a) | 29,600 | 1,136,170 | ||||||
| YAKUODO Holdings Co., Ltd. | 36,200 | 781,700 | ||||||
| YAMADA Consulting Group Co., Ltd. | 53,900 | 565,188 | ||||||
| 27,835,852 | ||||||||
| Netherlands (0.85%) | ||||||||
| Aalberts NV | 27,756 | 1,503,310 | ||||||
| Shop Apotheke Europe NV(a)(b)(c) | 8,316 | 1,716,649 | ||||||
| 3,219,959 | ||||||||
| New Zealand (0.42%) | ||||||||
| CBL Corp., Ltd.(a)(e) | 819,006 | 0 | ||||||
| Shares | Value (Note 2) | |||||||
| New Zealand (continued) | ||||||||
| NZX, Ltd. | 1,059,037 | $ | 1,568,742 | |||||
| 1,568,742 | ||||||||
| Norway (1.20%) | ||||||||
| 24sevenoffice Scandinavia AB(a) | 222,199 | 923,910 | ||||||
| CSAM Health Group AS(a) | 91,191 | 943,242 | ||||||
| Medistim ASA | 12,841 | 419,600 | ||||||
| Nordic Semiconductor ASA(a) | 11,845 | 293,136 | ||||||
| Self Storage Group ASA(a) | 694,169 | 1,943,073 | ||||||
| 4,522,961 | ||||||||
| Oman (0.33%) | ||||||||
| Tethys Oil AB | 173,100 | 1,259,571 | ||||||
| Philippines (1.13%) | ||||||||
| Concepcion Industrial Corp. | 1,793,920 | 836,418 | ||||||
| Pryce Corp. | 6,894,800 | 758,929 | ||||||
| Puregold Price Club, Inc. | 490,700 | 380,127 | ||||||
| Wilcon Depot, Inc. | 6,270,400 | 2,291,984 | ||||||
| 4,267,458 | ||||||||
| Poland (1.06%) | ||||||||
| Dino Polska SA(a)(b)(c) | 47,357 | 3,074,546 | ||||||
| LiveChat Software SA | 27,929 | 920,607 | ||||||
| 3,995,153 | ||||||||
| Singapore (0.15%) | ||||||||
| Riverstone Holdings, Ltd./Singapore | 532,300 | 580,000 | ||||||
| South Africa (0.53%) | ||||||||
| Clicks Group, Ltd. | 73,588 | 1,228,961 | ||||||
| Italtile, Ltd. | 665,000 | 782,272 | ||||||
| 2,011,233 | ||||||||
| South Korea (0.91%) | ||||||||
| Douzone Bizon Co., Ltd. | 3,400 | 257,671 | ||||||
| Hyundai Ezwel Co., Ltd. | 33,500 | 297,550 | ||||||
| LEENO Industrial, Inc. | 3,790 | 555,374 | ||||||
| Ray Co. Ltd/KR(a) | 7,896 | 367,701 | ||||||
| Suprema, Inc.(a) | 8,000 | 192,026 | ||||||
| Tokai Carbon Korea Co., Ltd. | 10,000 | 1,761,136 | ||||||
| 3,431,458 | ||||||||
| Spain (0.00%)(f) | ||||||||
| Let's GOWEX SA(a)(e) | 10,700 | 0 | ||||||
| Sweden (5.00%) | ||||||||
| Beijer Alma AB | 82,700 | 1,861,972 | ||||||
| Boozt AB(a)(b)(c) | 21,200 | 493,591 | ||||||
| Cint Group AB(a) | 37,581 | 381,779 | ||||||
| EQT AB | 126,813 | 4,288,742 | ||||||
| KNOW IT AB(a) | 60,565 | 2,242,870 | ||||||
| Lyko Group AB(a)(c) | 16,800 | 627,106 | ||||||
See Notes to Financial Statements.
| Annual Report | April 30, 2021 | 53 |
| Grandeur Peak Global Reach Fund | Portfolio of Investments |
April 30, 2021
| Shares | Value (Note 2) | |||||||
| Sweden (continued) | ||||||||
| Nordnet AB publ | 34,622 | $ | 650,475 | |||||
| OEM International AB, Class B | 19,724 | 941,285 | ||||||
| Paradox Interactive AB | 14,841 | 347,465 | ||||||
| Sagax AB, Class A | 47,309 | 1,262,982 | ||||||
| Sagax AB B | 24,922 | 659,441 | ||||||
| Sdiptech AB(a) | 15,789 | 708,734 | ||||||
| SwedenCare AB | 53,487 | 3,462,371 | ||||||
| Vitec Software Group AB, Class B | 19,425 | 918,985 | ||||||
| 18,847,798 | ||||||||
| Switzerland (0.45%) | ||||||||
| Partners Group Holding AG | 1,187 | 1,689,680 | ||||||
| Taiwan (2.74%) | ||||||||
| ASPEED Technology, Inc. | 5,000 | 377,690 | ||||||
| Bioteque Corp. | 284,000 | 1,270,898 | ||||||
| Brighten Optix Corp. | 102,000 | 894,641 | ||||||
| FineTek Co., Ltd. | 155,400 | 492,909 | ||||||
| Fuzetec Technology Co., Ltd. | 199,000 | 511,517 | ||||||
| GEM Services, Inc./Tw | 122,000 | 350,281 | ||||||
| momo.com, Inc. | 17,000 | 626,857 | ||||||
| Pacific Hospital Supply Co., Ltd. | 356,317 | 938,851 | ||||||
| Poya International Co., Ltd.(a) | 46,000 | 1,007,840 | ||||||
| Sporton International, Inc. | 249,859 | 2,294,377 | ||||||
| Voltronic Power Technology Corp. | 23,047 | 1,051,979 | ||||||
| Wistron Information | ||||||||
| Technology & Services Corp. | 138,000 | 508,861 | ||||||
| 10,326,701 | ||||||||
| Thailand (0.12%) | ||||||||
| TOA Paint Thailand PCL | 413,300 | 457,932 | ||||||
| United Arab Emirates (0.16%) | ||||||||
| Aramex PJSC | 550,033 | 585,500 | ||||||
| United States (27.61%) | ||||||||
| 4imprint Group PLC(a) | 25,771 | 836,386 | ||||||
| 8x8, Inc.(a) | 21,677 | 712,957 | ||||||
| Align Technology, Inc.(a) | 661 | 393,645 | ||||||
| Apollo Global Management, Inc. | 14,082 | 779,720 | ||||||
| Array Technologies, Inc.(a) | 70,193 | 1,976,635 | ||||||
| Bank of Hawaii Corp. | 16,705 | 1,518,317 | ||||||
| Bank of NT Butterfield & Son, Ltd. | 73,047 | 2,864,903 | ||||||
| Barrett Business Services, Inc. | 26,037 | 1,909,293 | ||||||
| Blackline, Inc.(a) | 12,841 | 1,490,326 | ||||||
| Blackstone Group, Inc., Class A | 29,433 | 2,604,526 | ||||||
| Cactus, Inc., Class A | 31,925 | 951,684 | ||||||
| Cardiovascular Systems, Inc.(a) | 16,655 | 671,530 | ||||||
| Castle Biosciences, Inc.(a) | 7,869 | 543,197 | ||||||
| Shares | Value (Note 2) | |||||||
| United States (continued) | ||||||||
| Chewy, Inc.(a) | 6,633 | $ | 528,783 | |||||
| Cross Creek Lucid LP/Partnership Interest(a)(e) | 1,000,000 | 1,000,000 | ||||||
| Digital Realty Trust, Inc. | 4,875 | 752,261 | ||||||
| EPAM Systems, Inc.(a)(d) | 10,155 | 4,648,451 | ||||||
| Equinix, Inc. | 2,375 | 1,711,805 | ||||||
| Esquire Financial Holdings, Inc.(a) | 24,887 | 571,157 | ||||||
| Etsy, Inc.(a) | 6,265 | 1,245,419 | ||||||
| Exact Sciences Corp.(a) | 8,225 | 1,084,219 | ||||||
| ExlService Holdings, Inc.(a) | 15,550 | 1,436,509 | ||||||
| Fastenal Co. | 21,882 | 1,143,991 | ||||||
| First Hawaiian, Inc. | 43,436 | 1,192,753 | ||||||
| First Republic Bank(d) | 29,265 | 5,362,519 | ||||||
| Five Below, Inc.(a) | 2,945 | 592,740 | ||||||
| Freshpet, Inc.(a) | 3,361 | 621,180 | ||||||
| Frontage Holdings Corp.(a)(b)(c) | 2,551,000 | 1,737,284 | ||||||
| FTI Consulting, Inc.(a) | 8,680 | 1,205,218 | ||||||
| Genpact, Ltd. | 47,275 | 2,246,981 | ||||||
| Glacier Bancorp, Inc. | 25,201 | 1,485,599 | ||||||
| Goosehead Insurance, Inc., Class A | 10,174 | 1,118,530 | ||||||
| Healthcare Services Group, Inc. | 36,567 | 1,095,182 | ||||||
| Heska Corp.(a) | 11,160 | 2,038,374 | ||||||
| Houlihan Lokey, Inc. | 18,111 | 1,200,216 | ||||||
| HubSpot, Inc.(a) | 725 | 381,676 | ||||||
| I3 Verticals, Inc., Class A(a) | 22,900 | 760,738 | ||||||
| IDEXX Laboratories, Inc.(a) | 1,066 | 585,223 | ||||||
| Insperity, Inc. | 18,697 | 1,636,735 | ||||||
| Intersect ENT, Inc.(a) | 29,598 | 645,532 | ||||||
| Joint Corp.(a) | 15,602 | 865,599 | ||||||
| Kinsale Capital Group, Inc. | 3,619 | 629,742 | ||||||
| LeMaitre Vascular, Inc. | 24,525 | 1,286,827 | ||||||
| LGI Homes, Inc.(a) | 11,975 | 1,985,215 | ||||||
| Littelfuse, Inc. | 3,529 | 936,032 | ||||||
| Lululemon Athletica, Inc.(a) | 3,392 | 1,137,236 | ||||||
| MaxCyte, Inc.(a) | 120,600 | 1,512,309 | ||||||
| Medallia, Inc.(a) | 22,134 | 652,732 | ||||||
| Medpace Holdings, Inc.(a) | 7,942 | 1,347,599 | ||||||
| Microchip Technology, Inc. | 4,713 | 708,317 | ||||||
| Mimecast, Ltd.(a) | 24,363 | 1,057,841 | ||||||
| Morningstar, Inc. | 2,550 | 675,775 | ||||||
| MSCI, Inc. | 1,145 | 556,207 | ||||||
| New Relic, Inc.(a) | 21,925 | 1,409,777 | ||||||
| NV5 Global, Inc.(a) | 6,730 | 606,575 | ||||||
| NVIDIA Corp. | 975 | 585,371 | ||||||
| Ollie's Bargain Outlet Holdings, Inc.(a) | 14,321 | 1,321,399 | ||||||
| PagerDuty, Inc.(a) | 23,427 | 994,710 | ||||||
| Paycom Software, Inc.(a) | 1,867 | 717,693 | ||||||
| Paylocity Holding Corp.(a) | 8,950 | 1,729,498 | ||||||
| PJT Partners, Inc., Class A | 38,783 | 2,851,714 | ||||||
| Poshmark, Inc.(a) | 18,584 | 777,369 | ||||||
| Power Integrations, Inc. | 8,289 | 686,412 | ||||||
| PPD, Inc.(a) | 34,750 | 1,605,450 | ||||||
See Notes to Financial Statements.
| 54 | 1.855.377.7325 | www.GrandeurPeakGlobal.com |
| Grandeur Peak Global Reach Fund | Portfolio of Investments |
April 30, 2021
| Shares | Value (Note 2) | |||||||
| United States (continued) | ||||||||
| ProntoForms Corp.(a) | 365,500 | $ | 350,885 | |||||
| Qualtrics International, Inc.(a) | 10,725 | 400,579 | ||||||
| Qualys, Inc.(a)(d) | 17,580 | 1,781,909 | ||||||
| Rapid7, Inc.(a) | 25,364 | 2,060,825 | ||||||
| Revolve Group, Inc.(a) | 36,164 | 1,753,592 | ||||||
| Rexford Industrial Realty, Inc. | 20,400 | 1,133,220 | ||||||
| Samsonite International SA(a)(b)(c) | 1,208,700 | 2,243,823 | ||||||
| ServiceNow, Inc.(a) | 675 | 341,800 | ||||||
| Shoals Technologies Group, Inc.(a) | 11,406 | 365,790 | ||||||
| Silicon Laboratories, Inc.(a) | 4,725 | 665,989 | ||||||
| Sumo Logic, Inc.(a) | 37,292 | 726,821 | ||||||
| SVB Financial Group(a) | 3,326 | 1,901,907 | ||||||
| Systemax, Inc. | 41,420 | 1,769,462 | ||||||
| Tabula Rasa HealthCare, Inc.(a) | 16,873 | 802,480 | ||||||
| Terreno Realty Corp. | 21,825 | 1,408,149 | ||||||
| TriMas Corp.(a) | 18,175 | 578,692 | ||||||
| Ulta Beauty, Inc.(a) | 1,825 | 601,064 | ||||||
| Unity Software, Inc.(a) | 1,719 | 174,616 | ||||||
| WW Grainger, Inc. | 3,403 | 1,475,337 | ||||||
| YETI Holdings, Inc.(a) | 12,675 | 1,082,699 | ||||||
| Zendesk, Inc.(a) | 3,825 | 559,024 | ||||||
| 104,098,256 | ||||||||
| Vietnam (1.48%) | ||||||||
| FPT Corp. | 146,000 | 512,314 | ||||||
| Vietnam Dairy Products JSC | 308,062 | 1,249,352 | ||||||
| Vietnam Technological & Commercial Joint Stock Bank(a) | 2,138,281 | 3,802,625 | ||||||
| 5,564,291 | ||||||||
| TOTAL COMMON STOCKS | ||||||||
| (Cost $217,817,922) | 372,594,231 | |||||||
| PREFERRED STOCKS (0.54%) | ||||||||
| United States (0.54%) | ||||||||
| Dataminr Inc - Private Placement(a)(e) | 45,833 | 2,016,652 | ||||||
| TOTAL PREFERRED STOCKS | ||||||||
| (Cost $912,077) | 2,016,652 | |||||||
| TOTAL INVESTMENTS (99.37%) | ||||||||
| (Cost $218,729,999) | $ | 374,610,883 | ||||||
| Other Assets In Excess Of Liabilities (0.63%) | 2,381,808 | |||||||
| NET ASSETS (100.00%) | $ | 376,992,691 | ||||||
| (a) | Non-Income Producing Security. |
| (b) | Security exempt from registration under Rule 144A of the Securities Act of 1933. These securities may be resold in the ordinary course of business in transactions exempt from registration, normally to qualified institutional buyers. As of April 30, 2021, these securities had a total aggregate market value of $28,757,941, representing 7.63% of net assets. |
| (c) | Security was purchased pursuant to Regulation S under the Securities Act of 1933, which exempts securities offered and sold outside of the United States from registration. Such security cannot be sold in the United States without either an effective registration statement filed pursuant to the Securities Act of 1933, or pursuant to an exemption from registration. As of April 30, 2021, the aggregate market value of these securities was $31,870,522, representing 8.45% of net assets. |
| (d) | Security position either entirely or partially pledged as collateral for securities sold short. Aggretate fair value of $6,941,225. See also Note 2 to the financial statements for additional information. |
| (e) | As a result of the use of significant unobservable inputs to determine fair value, these investments have been classified as level 3 assets. See also Note 2 to the financial statements for additional information. |
| (f) | Less than 0.005%. |
For Fund compliance purposes, the Fund's geographical classifications refer to any one or more of the country sub-classifications used by one or more widely recognized market indexes or ratings group indexes, and/or as defined by Fund management. This definition may not apply for purposes of this report, which may combine sub-classifications for reporting ease. Geographical regions are shown as a percentage of net assets.
See Notes to Financial Statements.
| Annual Report | April 30, 2021 | 55 |
| Grandeur Peak Global Reach Fund | Portfolio of Investments |
April 30, 2021
| Sector Composition (April 30, 2021) | |
| Technology | 26.0% |
| Financials | 19.8% |
| Consumer | 18.7% |
| Industrials | 17.8% |
| Health Care | 14.4% |
| Energy & Materials | 2.7% |
| Cash, Cash Equivalents, & Other Net Assets | 0.6% |
| Total | 100% |
| Industry Composition (April 30, 2021) | |
| Capital Markets | 10.9% |
| IT Services | 10.3% |
| Software | 9.6% |
| Professional Services | 5.6% |
| Internet & Direct Marketing Retail | 5.5% |
| Banks | 5.5% |
| Semiconductors & Semiconductor Equipment | 3.7% |
| Health Care Equipment & Supplies | 3.5% |
| Pharmaceuticals | 3.3% |
| Health Care Providers & Services | 3.3% |
| Machinery | 3.1% |
| Trading Companies & Distributors | 3.0% |
| Life Sciences Tools & Services | 2.7% |
| Specialty Retail | 2.1% |
| Equity Real Estate Investment Trusts (REITs) | 2.1% |
| Multiline Retail | 1.9% |
| Food & Staples Retailing | 1.9% |
| Textiles, Apparel & Luxury Goods | 1.8% |
| Commercial Services & Supplies | 1.7% |
| Oil, Gas & Consumable Fuels | 1.6% |
| Electrical Equipment | 1.3% |
| Household Durables | 1.2% |
| Food Products | 1.2% |
| Hotels, Restaurants & Leisure | 1.1% |
| Biotechnology | 1.1% |
| Other Industries (each less than 1%) | 10.4% |
| Cash and Other Assets, Less Liabilities | 0.6% |
| Total | 100% |
See Notes to Financial Statements.
| 56 | 1.855.377.7325 | www.GrandeurPeakGlobal.com |
| Grandeur Peak Global Stalwarts Fund | Portfolio of Investments |
April 30, 2021
| Shares | Value (Note 2) | |||||||
| COMMON STOCKS (98.90%) | ||||||||
| Argentina (0.72%) | ||||||||
| Globant SA(a) | 11,589 | $ | 2,655,967 | |||||
| Australia (0.99%) | ||||||||
| Kogan.com, Ltd. | 118,000 | 1,007,187 | ||||||
| Netwealth Group, Ltd. | 230,269 | 2,641,306 | ||||||
| 3,648,493 | ||||||||
| Belgium (1.39%) | ||||||||
| Melexis NV | 28,011 | 3,051,080 | ||||||
| Warehouses De Pauw CVA | 58,669 | 2,068,090 | ||||||
| 5,119,170 | ||||||||
| Brazil (1.30%) | ||||||||
| Locaweb Servicos de Internet SA(b)(c) | 283,000 | 1,521,267 | ||||||
| Pagseguro Digital, Ltd., Class A(a) | 15,484 | 708,238 | ||||||
| Patria Investments, Ltd.(a) | 103,316 | 1,430,927 | ||||||
| Raia Drogasil SA | 228,800 | 1,111,136 | ||||||
| 4,771,568 | ||||||||
| Britain (13.47%) | ||||||||
| Abcam PLC(a) | 89,306 | 1,884,566 | ||||||
| B&M European Value Retail SA | 1,032,800 | 8,070,243 | ||||||
| Dechra Pharmaceuticals PLC | 174,040 | 9,695,996 | ||||||
| Diploma PLC | 47,364 | 1,876,009 | ||||||
| Endava PLC, ADR(a) | 81,573 | 7,385,620 | ||||||
| Gamma Communications PLC | 71,203 | 1,787,721 | ||||||
| Impax Asset Management Group PLC | 155,609 | 2,157,625 | ||||||
| Intertek Group PLC | 56,194 | 4,763,479 | ||||||
| Sanne Group PLC | 481,260 | 4,293,582 | ||||||
| Softcat PLC | 84,529 | 2,237,872 | ||||||
| St. James’s Place PLC | 284,819 | 5,355,426 | ||||||
| 49,508,139 | ||||||||
| Canada (0.96%) | ||||||||
| Gildan Activewear, Inc.(a) | 47,399 | 1,645,073 | ||||||
| Ritchie Bros Auctioneers, Inc. | 29,425 | 1,871,430 | ||||||
| 3,516,503 | ||||||||
| China (8.34%) | ||||||||
| Baozun, Inc., Sponsored ADR(a) | 44,306 | 1,537,861 | ||||||
| CSPC Pharmaceutical Group, Ltd. | 1,353,680 | 1,676,470 | ||||||
| Hangzhou Robam Appliances Co., Ltd., Class A | 212,600 | 1,260,521 | ||||||
| Hangzhou Tigermed Consulting Co., Ltd., Class A | 66,200 | 1,601,014 | ||||||
| Li Ning Co., Ltd. | 210,000 | 1,714,010 | ||||||
| Silergy Corp. | 140,000 | 14,660,079 | ||||||
| Shares | Value (Note 2) | |||||||
| China (continued) | ||||||||
| Trip.com Group, Ltd., ADR(a) | 40,725 | $ | 1,591,533 | |||||
| WuXi AppTec Co., Ltd., Class H(b)(c) | 130,160 | 3,078,162 | ||||||
| Wuxi Biologics Cayman, Inc.(a)(b)(c) | 135,000 | 1,903,061 | ||||||
| Yum China Holdings, Inc. | 25,875 | 1,628,055 | ||||||
| 30,650,766 | ||||||||
| France (1.88%) | ||||||||
| Alten SA(a) | 24,336 | 3,045,767 | ||||||
| BioMerieux | 8,193 | 974,370 | ||||||
| Bureau Veritas SA(a) | 73,887 | 2,209,228 | ||||||
| Esker SA | 2,427 | 676,947 | ||||||
| 6,906,312 | ||||||||
| Germany (1.84%) | ||||||||
| Dermapharm Holding SE | 39,200 | 3,426,236 | ||||||
| PATRIZIA AG | 31,525 | 862,250 | ||||||
| Puma SE(a) | 12,248 | 1,291,697 | ||||||
| QIAGEN NV(a) | 24,865 | 1,196,752 | ||||||
| 6,776,935 | ||||||||
| Hong Kong (1.13%) | ||||||||
| Techtronic Industries Co., Ltd. | 165,000 | 3,007,821 | ||||||
| Vitasoy International Holdings, Ltd. | 295,500 | 1,143,159 | ||||||
| 4,150,980 | ||||||||
| India (6.64%) | ||||||||
| Avenue Supermarts, Ltd.(a)(b)(c) | 44,500 | 1,713,916 | ||||||
| Bajaj Finance, Ltd.(a) | 26,054 | 1,917,632 | ||||||
| HCL Technologies, Ltd. | 100,410 | 1,218,584 | ||||||
| HDFC Asset Management Co., Ltd.(b)(c) | 32,478 | 1,217,325 | ||||||
| HDFC Bank, Ltd.(a) | 88,069 | 1,679,164 | ||||||
| IndiaMart InterMesh, Ltd.(a)(b)(c) | 10,988 | 1,179,112 | ||||||
| Marico, Ltd. | 182,487 | 1,013,659 | ||||||
| Metropolis Healthcare, Ltd.(b)(c) | 96,966 | 3,135,285 | ||||||
| Nippon Life India Asset Management, Ltd.(b)(c) | 262,692 | 1,211,811 | ||||||
| Titan Co., Ltd. | 64,516 | 1,299,204 | ||||||
| WNS Holdings, Ltd., ADR(a) | 122,027 | 8,838,416 | ||||||
| 24,424,108 | ||||||||
| Indonesia (0.32%) | ||||||||
| Bank Tabungan Pensiunan Nasional Syariah | 5,142,700 | 1,164,183 | ||||||
| Ireland (0.92%) | ||||||||
| Keywords Studios PLC(a) | 90,907 | 3,397,290 | ||||||
See Notes to Financial Statements.
| Annual Report | April 30, 2021 | 57 |
| Grandeur Peak Global Stalwarts Fund | Portfolio of Investments |
April 30, 2021
| Shares | Value (Note 2) | |||||||
| Israel (1.13%) | ||||||||
| Wix.com, Ltd.(a) | 13,075 | $ | 4,156,281 | |||||
| Italy (0.58%) | ||||||||
| GVS SpA(a)(b)(c) | 56,990 | 993,490 | ||||||
| Interpump Group SpA | 21,092 | 1,123,358 | ||||||
| 2,116,848 | ||||||||
| Japan (6.63%) | ||||||||
| BASE, Inc.(a) | 80,000 | 1,334,431 | ||||||
| BayCurrent Consulting, Inc. | 11,300 | 3,086,330 | ||||||
| Freee KK(a) | 14,500 | 1,231,220 | ||||||
| IR Japan Holdings, Ltd. | 27,300 | 3,589,542 | ||||||
| M&A Capital Partners Co., Ltd.(a) | 58,900 | 2,727,002 | ||||||
| M3, Inc. | 18,800 | 1,303,391 | ||||||
| MonotaRO Co., Ltd. | 83,000 | 2,118,858 | ||||||
| Nihon M&A Center, Inc. | 129,800 | 3,401,475 | ||||||
| Seria Co., Ltd. | 71,100 | 2,579,481 | ||||||
| Systena Corp. | 127,800 | 2,629,904 | ||||||
| Visional, Inc.(a) | 6,500 | 371,717 | ||||||
| 24,373,351 | ||||||||
| Netherlands (1.26%) | ||||||||
| Aalberts NV | 33,784 | �� | 1,829,795 | |||||
| Shop Apotheke Europe NV(a)(b)(c) | 13,640 | 2,815,668 | ||||||
| 4,645,463 | ||||||||
| Philippines (0.29%) | ||||||||
| Wilcon Depot, Inc. | 2,924,400 | 1,068,939 | ||||||
| Poland (0.91%) | ||||||||
| Dino Polska SA(a)(b)(c) | 51,253 | 3,327,485 | ||||||
| Singapore (0.29%) | ||||||||
| Riverstone Holdings, Ltd./Singapore | 961,700 | 1,047,879 | ||||||
| South Korea (0.37%) | ||||||||
| LEENO Industrial, Inc. | 9,328 | 1,366,893 | ||||||
| Sweden (2.57%) | ||||||||
| AddTech AB, Class B | 74,900 | 1,309,448 | ||||||
| EQT AB | 117,800 | 3,983,928 | ||||||
| Nibe Industrier AB, Class B | 32,708 | 1,196,962 | ||||||
| Sagax AB B | 77,431 | 2,048,838 | ||||||
| Sweco AB, Class B | 51,306 | 915,145 | ||||||
| 9,454,321 | ||||||||
| Switzerland (0.72%) | ||||||||
| Partners Group Holding AG | 1,869 | 2,660,498 | ||||||
| Taiwan (1.70%) | ||||||||
| ASPEED Technology, Inc. | 20,000 | 1,510,758 | ||||||
| momo.com, Inc. | 69,000 | 2,544,303 | ||||||
| Shares | Value (Note 2) | |||||||
| Taiwan (continued) | ||||||||
| Voltronic Power Technology Corp. | 47,875 | $ | 2,185,251 | |||||
| 6,240,312 | ||||||||
| United States (41.72%) | ||||||||
| Align Technology, Inc.(a) | 2,925 | 1,741,925 | ||||||
| Apollo Global Management, Inc. | 39,138 | 2,167,071 | ||||||
| Array Technologies, Inc.(a) | 57,333 | 1,614,497 | ||||||
| Ashtead Group PLC | 28,084 | 1,803,901 | ||||||
| Bank of Hawaii Corp. | 28,620 | 2,601,272 | ||||||
| Bank of NT Butterfield & Son, Ltd. | 93,631 | 3,672,208 | ||||||
| Blackline, Inc.(a) | 23,544 | 2,732,517 | ||||||
| Blackstone Group, Inc., Class A | 31,000 | 2,743,190 | ||||||
| Cardiovascular Systems, Inc.(a) | 34,092 | 1,374,589 | ||||||
| Castle Biosciences, Inc.(a) | 21,110 | 1,457,223 | ||||||
| CDW Corp. | 5,466 | 974,752 | ||||||
| Chewy, Inc.(a) | 17,285 | 1,377,960 | ||||||
| Cross Creek Lucid LP/Partnership Interest(a)(d) | 1,300,000 | 1,300,000 | ||||||
| Elastic NV(a) | 9,131 | 1,101,381 | ||||||
| EPAM Systems, Inc.(a) | 22,313 | 10,213,776 | ||||||
| Equinix, Inc. | 2,500 | 1,801,900 | ||||||
| Etsy, Inc.(a) | 12,450 | 2,474,935 | ||||||
| Exact Sciences Corp.(a) | 12,883 | 1,698,237 | ||||||
| ExlService Holdings, Inc.(a) | 15,558 | 1,437,248 | ||||||
| Fastenal Co. | 87,100 | 4,553,588 | ||||||
| First Hawaiian, Inc. | 64,768 | 1,778,529 | ||||||
| First Republic Bank | 65,650 | 12,029,706 | ||||||
| Five Below, Inc.(a) | 14,877 | 2,994,294 | ||||||
| Freshpet, Inc.(a) | 6,350 | 1,173,607 | ||||||
| Genpact, Ltd. | 80,702 | 3,835,766 | ||||||
| Glacier Bancorp, Inc. | 34,350 | 2,024,932 | ||||||
| Goosehead Insurance, Inc., Class A | 23,775 | 2,613,823 | ||||||
| Heska Corp.(a) | 17,073 | 3,118,383 | ||||||
| Houlihan Lokey, Inc. | 24,325 | 1,612,018 | ||||||
| HubSpot, Inc.(a) | 3,042 | 1,601,461 | ||||||
| IDEXX Laboratories, Inc.(a) | 3,050 | 1,674,419 | ||||||
| Kinsale Capital Group, Inc. | 10,176 | 1,770,726 | ||||||
| LGI Homes, Inc.(a) | 23,397 | 3,878,755 | ||||||
| Littelfuse, Inc. | 13,228 | 3,508,595 | ||||||
| Lululemon Athletica, Inc.(a) | 11,337 | 3,800,956 | ||||||
| Medallia, Inc.(a) | 46,425 | 1,369,073 | ||||||
| Medpace Holdings, Inc.(a) | 16,425 | 2,786,994 | ||||||
| Microchip Technology, Inc. | 14,775 | 2,220,535 | ||||||
| Monolithic Power Systems, Inc. | 5,800 | 2,096,004 | ||||||
| MSCI, Inc. | 3,100 | 1,505,887 | ||||||
| Ollie’s Bargain Outlet Holdings, Inc.(a) | 22,677 | 2,092,407 | ||||||
| PagerDuty, Inc.(a) | 23,900 | 1,014,794 | ||||||
| Paycom Software, Inc.(a) | 7,666 | 2,946,887 | ||||||
See Notes to Financial Statements.
| 58 | 1.855.377.7325 | www.GrandeurPeakGlobal.com |
| Grandeur Peak Global Stalwarts Fund | Portfolio of Investments |
April 30, 2021
| Shares | Value (Note 2) | |||||||
| United States (continued) | ||||||||
| Paylocity Holding Corp.(a) | 9,650 | $ | 1,864,766 | |||||
| PJT Partners, Inc., Class A | 55,075 | 4,049,665 | ||||||
| Pool Corp. | 8,925 | 3,770,991 | ||||||
| Poshmark, Inc.(a) | 42,497 | 1,777,650 | ||||||
| Power Integrations, Inc. | 40,825 | 3,380,718 | ||||||
| PPD, Inc.(a) | 46,350 | 2,141,370 | ||||||
| Qualtrics International, Inc.(a) | 87,150 | 3,255,053 | ||||||
| Qualys, Inc.(a) | 25,934 | 2,628,670 | ||||||
| Rapid7, Inc.(a) | 30,850 | 2,506,563 | ||||||
| Shoals Technologies Group, Inc.(a) | 35,441 | 1,136,593 | ||||||
| Silicon Laboratories, Inc.(a) | 10,643 | 1,500,131 | ||||||
| SVB Financial Group(a) | 5,514 | 3,153,071 | ||||||
| Systemax, Inc. | 57,200 | 2,443,584 | ||||||
| Terreno Realty Corp. | 31,951 | 2,061,479 | ||||||
| Ulta Beauty, Inc.(a) | 4,612 | 1,518,962 | ||||||
| WW Grainger, Inc. | 1,975 | 856,241 | ||||||
| YETI Holdings, Inc.(a) | 20,375 | 1,740,433 | ||||||
| Zendesk, Inc.(a) | 8,721 | 1,274,574 | ||||||
| 153,351,235 | ||||||||
| Vietnam (0.83%) | ||||||||
| Vietnam Dairy Products JSC | 274,144 | 1,111,796 | ||||||
| Vietnam Technological & Commercial Joint Stock Bank(a) | 1,089,305 | 1,937,172 | ||||||
| 3,048,968 | ||||||||
| TOTAL COMMON STOCKS | ||||||||
| (Cost $228,461,898) | 363,548,887 | |||||||
| PREFERRED STOCKS (0.29%) | ||||||||
| United States (0.29%) | ||||||||
| Dataminr Inc - Private Placement(a)(d) | 24,262 | 1,067,528 | ||||||
| TOTAL PREFERRED STOCKS | ||||||||
| (Cost $482,814) | 1,067,528 | |||||||
| TOTAL INVESTMENTS (99.19%) | ||||||||
| (Cost $228,944,712) | $ | 364,616,415 | ||||||
| Other Assets In Excess Of Liabilities (0.81%) | 2,984,780 | |||||||
| NET ASSETS (100.00%) | $ | 367,601,195 | ||||||
| (a) | Non-Income Producing Security. |
| (b) | Security exempt from registration under Rule 144A of the Securities Act of 1933. These securities may be resold in the ordinary course of business in transactions exempt from registration, normally to qualified institutional buyers. As of April 30, 2021, these securities had a total aggregate market value of $22,096,582, representing 6.01% of net assets. |
| (c) | Security was purchased pursuant to Regulation S under the Securities Act of 1933, which exempts securities offered and sold outside of the United States from registration. Such security cannot be sold in the United States without either an effective registration statement filed pursuant to the Securities Act of 1933, or pursuant to an exemption from registration. As of April 30, 2021, the aggregate market value of these securities was $22,096,582, representing 6.01% of net assets. |
| (d) | As a result of the use of significant unobservable inputs to determine fair value, these investments have been classified as level 3 assets. See also Note 2 to the financial statements for additional information. |
For Fund compliance purposes, the Fund’s geographical classifications refer to any one or more of the country sub-classifications used by one or more widely recognized market indexes or ratings group indexes, and/or as defined by Fund management. This definition may not apply for purposes of this report, which may combine sub-classifications for reporting ease. Geographical regions are shown as a percentage of net assets.
| Sector Composition (April 30, 2021) | |
| Technology | 31.4% |
| Financials | 23.4% |
| Consumer | 18.3% |
| Health Care | 13.2% |
| Industrials | 12.9% |
| Cash, Cash Equivalents, & Other Net Assets | 0.8% |
| Total | 100% |
See Notes to Financial Statements.
| Annual Report | April 30, 2021 | 59 |
| Grandeur Peak Global Stalwarts Fund | Portfolio of Investments |
April 30, 2021
| Industry Composition (April 30, 2021) | |
| IT Services | 14.1% |
| Capital Markets | 11.2% |
| Banks | 8.2% |
| Semiconductors & Semiconductor Equipment | 8.1% |
| Software | 7.7% |
| Professional Services | 4.6% |
| Trading Companies & Distributors | 4.4% |
| Internet & Direct Marketing Retail | 4.1% |
| Pharmaceuticals | 4.0% |
| Multiline Retail | 3.5% |
| Life Sciences Tools & Services | 3.5% |
| Health Care Equipment & Supplies | 3.0% |
| Textiles, Apparel & Luxury Goods | 2.7% |
| Food & Staples Retailing | 1.7% |
| Machinery | 1.6% |
| Equity Real Estate Investment Trusts (REITs) | 1.6% |
| Specialty Retail | 1.5% |
| Household Durables | 1.4% |
| Electrical Equipment | 1.4% |
| Health Care Providers & Services | 1.3% |
| Electronic Equipment, Instruments & Components | 1.2% |
| Insurance | 1.2% |
| Distributors | 1.0% |
| Other Industries (each less than 1%) | 6.2% |
| Cash and Other Assets, Less Liabilities | 0.8% |
| Total | 100% |
See Notes to Financial Statements.
| 60 | 1.855.377.7325 | www.GrandeurPeakGlobal.com |
| Grandeur Peak International Opportunities Fund | Portfolio of Investments |
April 30, 2021
| Shares | Value (Note 2) | |||||||
| COMMON STOCKS (97.05%) | ||||||||
| Argentina (0.48%) | ||||||||
| Globant SA(a) | 20,248 | $ | 4,640,437 | |||||
| Australia (2.13%) | ||||||||
| Fiducian Group, Ltd. | 215,640 | 1,121,300 | ||||||
| HUB24, Ltd. | 225,392 | 4,389,389 | ||||||
| Kogan.com, Ltd. | 662,167 | 5,651,917 | ||||||
| National Storage REIT | 1,942,036 | 3,007,058 | ||||||
| Netwealth Group, Ltd. | 199,554 | 2,288,989 | ||||||
| People Infrastructure, Ltd. | 1,232,348 | 4,281,524 | ||||||
| 20,740,177 | ||||||||
| Bangladesh (0.40%) | ||||||||
| Square Pharmaceuticals, Ltd. | 1,579,730 | 3,946,763 | ||||||
| Belgium (1.00%) | ||||||||
| Melexis NV | 49,162 | 5,354,938 | ||||||
| Warehouses De Pauw CVA | 123,834 | 4,365,165 | ||||||
| 9,720,103 | ||||||||
| Brazil (2.44%) | ||||||||
| Fleury SA | 826,000 | 3,897,309 | ||||||
| Locaweb Servicos de Internet SA(b)(c) | 1,450,900 | 7,799,317 | ||||||
| Neogrid Participacoes SA | 3,003,700 | 4,014,481 | ||||||
| Pagseguro Digital, Ltd., Class A(a) | 138,675 | 6,342,995 | ||||||
| Patria Investments, Ltd.(a) | 123,851 | 1,715,336 | ||||||
| 23,769,438 | ||||||||
| Britain (19.12%) | ||||||||
| Ascential PLC(a) | 1,004,600 | 4,839,239 | ||||||
| B&M European Value Retail SA | 1,885,409 | 14,732,484 | ||||||
| boohoo Group PLC(a) | 1,363,518 | 6,404,348 | ||||||
| Bytes Technology Group PLC(a) | 408,894 | 2,783,974 | ||||||
| Clinigen Group PLC | 442,273 | 5,213,164 | ||||||
| CVS Group PLC(a) | 679,400 | 20,923,670 | ||||||
| Dechra Pharmaceuticals PLC | 385,704 | 21,488,074 | ||||||
| Diploma PLC | 145,579 | 5,766,142 | ||||||
| Endava PLC, ADR(a) | 166,514 | 15,076,178 | ||||||
| Foresight Group Holdings, Ltd.(a) | 1,109,119 | 6,494,586 | ||||||
| Gamma Communications PLC | 254,024 | 6,377,876 | ||||||
| GlobalData PLC | 54,264 | 1,172,826 | ||||||
| Impax Asset Management Group PLC | 791,576 | 10,975,739 | ||||||
| JTC PLC(b)(c) | 663,047 | 6,162,640 | ||||||
| K3 Capital Group PLC | 810,360 | 3,648,405 | ||||||
| On the Beach Group PLC(a)(b)(c) | 1,454,633 | 8,336,984 | ||||||
| Pensionbee Group PLC(a) | 1,259,004 | 3,129,731 | ||||||
| Sabre Insurance Group PLC(b)(c) | 880,201 | 3,166,628 | ||||||
| Sanne Group PLC | 764,228 | 6,818,093 | ||||||
| Shares | Value (Note 2) | |||||||
| Britain (continued) | ||||||||
| Softcat PLC | 309,584 | $ | 8,196,115 | |||||
| St. James’s Place PLC | 283,296 | 5,326,790 | ||||||
| Team17 Group PLC(a) | 446,526 | 4,779,208 | ||||||
| Tristel PLC | 34,951 | 289,613 | ||||||
| Ultra Electronics Holdings PLC | 264,257 | 7,379,299 | ||||||
| Volution Group PLC | 1,144,000 | 6,580,342 | ||||||
| 186,062,148 | ||||||||
| Canada (2.06%) | ||||||||
| Gildan Activewear, Inc.(a) | 197,000 | 6,837,261 | ||||||
| Pivotree, Inc.(a) | 218,800 | 1,399,152 | ||||||
| Richelieu Hardware, Ltd. | 159,350 | 5,566,846 | ||||||
| Ritchie Bros Auctioneers, Inc. | 31,900 | 2,028,840 | ||||||
| StorageVault Canada, Inc. | 1,061,900 | 3,801,294 | ||||||
| WeCommerce Holdings, Ltd.(a) | 32,006 | 418,449 | ||||||
| 20,051,842 | ||||||||
| China (7.01%) | ||||||||
| Baozun, Inc.(a) | 603,400 | 7,061,126 | ||||||
| CSPC Pharmaceutical Group, Ltd. | 3,479,680 | 4,309,423 | ||||||
| Hangzhou Robam Appliances Co., Ltd., Class A | 1,227,900 | 7,280,310 | ||||||
| Man Wah Holdings, Ltd. | 2,318,400 | 4,876,915 | ||||||
| O2Micro International, Ltd., ADR(a) | 167,266 | 1,139,082 | ||||||
| Silergy Corp. | 197,199 | 20,649,664 | ||||||
| Suofeiya Home Collection Co., Ltd., Class A(a) | 2,133,600 | 9,600,623 | ||||||
| TK Group Holdings, Ltd. | 7,310,000 | 3,199,640 | ||||||
| Trip.com Group, Ltd., ADR(a) | 130,768 | 5,110,413 | ||||||
| WuXi AppTec Co., Ltd., Class H(b)(c) | 210,680 | 4,982,384 | ||||||
| 68,209,580 | ||||||||
| Colombia (0.53%) | ||||||||
| Parex Resources, Inc.(a) | 273,275 | 5,146,903 | ||||||
| Finland (1.10%) | ||||||||
| Musti Group Oyj | 283,265 | 10,686,675 | ||||||
| France (5.06%) | ||||||||
| Alten SA(a) | 47,500 | 5,944,852 | ||||||
| Bureau Veritas SA(a) | 196,483 | 5,874,860 | ||||||
| Esker SA | 52,205 | 14,561,189 | ||||||
| Neurones | 77,697 | 2,559,479 | ||||||
| Thermador Groupe | 83,436 | 8,546,530 | ||||||
| Virbac SA(a) | 36,192 | 11,748,248 | ||||||
| 49,235,158 | ||||||||
| Georgia (0.48%) | ||||||||
| Bank of Georgia Group PLC(a) | 65,283 | 921,422 | ||||||
| Georgia Capital PLC(a) | 163,711 | 1,272,898 | ||||||
See Notes to Financial Statements.
| Annual Report | April 30, 2021 | 61 |
| Grandeur Peak International Opportunities Fund | Portfolio of Investments |
April 30, 2021
| Shares | Value (Note 2) | |||||||
| Georgia (continued) | ||||||||
| TBC Bank Group PLC(a) | 183,446 | $ | 2,467,599 | |||||
| 4,661,919 | ||||||||
| Germany (8.19%) | ||||||||
| Atoss Software AG | 16,900 | 3,766,979 | ||||||
| CANCOM SE | 71,700 | 4,427,320 | ||||||
| Dermapharm Holding SE | 126,476 | 11,054,505 | ||||||
| Deutsche Industrie REIT AG | 69,886 | 1,403,148 | ||||||
| Exasol AG(a) | 241,012 | 6,994,758 | ||||||
| Fashionette AG(a) | 132,020 | 5,333,051 | ||||||
| Friedrich Vorwerk Group SE(a) | 82,614 | 5,085,344 | ||||||
| Grand City Properties SA | 176,652 | 4,748,835 | ||||||
| Home24 SE(a) | 164,628 | 3,857,557 | ||||||
| Nagarro SE(a) | 48,040 | 5,267,379 | ||||||
| Nexus AG | 63,706 | 4,403,976 | ||||||
| Norma Group SE | 108,390 | 6,046,498 | ||||||
| PATRIZIA AG | 300,526 | 8,219,780 | ||||||
| PharmaSGP Holding SE(a) | 124,900 | 2,477,668 | ||||||
| QIAGEN NV(a) | 137,256 | 6,606,131 | ||||||
| 79,692,929 | ||||||||
| Greece (0.11%) | ||||||||
| Sarantis SA | 100,600 | 1,078,846 | ||||||
| Hong Kong (0.34%) | ||||||||
| Jacobson Pharma Corp., Ltd.(c) | 2,109,100 | 211,786 | ||||||
| Vitasoy International Holdings, Ltd. | 804,338 | 3,111,629 | ||||||
| 3,323,415 | ||||||||
| India (6.26%) | ||||||||
| Castrol India, Ltd. | 3,506,788 | 5,953,338 | ||||||
| Computer Age Management Services, Ltd. | 201,157 | 6,309,197 | ||||||
| EPL, Ltd. | 1,115,229 | 3,382,311 | ||||||
| Gulf Oil Lubricants India, Ltd. | 203,478 | 1,942,686 | ||||||
| IndiaMart InterMesh, Ltd.(a)(b)(c) | 58,144 | 6,239,378 | ||||||
| L&T Technology Services, Ltd.(b)(c) | 90,564 | 3,336,462 | ||||||
| Metropolis Healthcare, Ltd.(b)(c) | 367,832 | 11,893,429 | ||||||
| Nippon Life India Asset Management, Ltd.(b)(c) | 695,602 | 3,208,845 | ||||||
| Time Technoplast, Ltd. | 2,560,734 | 2,606,627 | ||||||
| WNS Holdings, Ltd., ADR(a) | 222,000 | 16,079,460 | ||||||
| 60,951,733 | ||||||||
| Indonesia (1.33%) | ||||||||
| Arwana Citramulia Tbk PT | 63,783,500 | 3,267,552 | ||||||
| Bank Tabungan Pensiunan Nasional Syariah | 11,709,500 | 2,650,749 | ||||||
| Selamat Sempurna Tbk PT | 48,677,500 | 4,431,354 | ||||||
| Shares | Value (Note 2) | |||||||
| Indonesia (continued) | ||||||||
| Ultrajaya Milk Industry & Trading Co. Tbk PT | 22,958,000 | $ | 2,558,836 | |||||
| 12,908,491 | ||||||||
| Ireland (2.87%) | ||||||||
| Irish Residential Properties REIT PLC | 4,766,689 | 9,318,245 | ||||||
| Keywords Studios PLC(a) | 198,679 | 7,424,842 | ||||||
| Uniphar PLC | 3,144,449 | 11,152,271 | ||||||
| 27,895,358 | ||||||||
| Israel (0.87%) | ||||||||
| Wix.com, Ltd.(a) | 26,683 | 8,481,992 | ||||||
| Italy (1.72%) | ||||||||
| DiaSorin SpA | 15,943 | 2,707,418 | ||||||
| GVS SpA(a)(b)(c) | 157,776 | 2,750,462 | ||||||
| Interpump Group SpA | 138,091 | 7,354,715 | ||||||
| Piovan SpA(b)(c) | 437,003 | 3,898,388 | ||||||
| 16,710,983 | ||||||||
| Japan (12.17%) | ||||||||
| AIT Corp. | 392,300 | 3,783,367 | ||||||
| Appier Group, Inc.(a) | 31,900 | 557,790 | ||||||
| BayCurrent Consulting, Inc. | 33,400 | 9,122,427 | ||||||
| Charm Care Corp. | 412,400 | 4,603,605 | ||||||
| Create SD Holdings Co., Ltd. | 133,700 | 4,055,408 | ||||||
| eGuarantee, Inc. | 177,000 | 3,414,000 | ||||||
| Funai Soken Holdings, Inc. | 118,700 | 2,104,864 | ||||||
| Japan Lifeline Co., Ltd. | 533,500 | 7,517,522 | ||||||
| Kinjiro Co., Ltd. | 119,300 | 2,997,509 | ||||||
| M&A Capital Partners Co., Ltd.(a) | 156,300 | 7,236,508 | ||||||
| MonotaRO Co., Ltd. | 129,400 | 3,303,376 | ||||||
| Naigai Trans Line, Ltd. | 111,800 | 1,761,548 | ||||||
| Nihon M&A Center, Inc. | 180,200 | 4,722,233 | ||||||
| Open Door, Inc.(a) | 319,800 | 5,864,024 | ||||||
| Seria Co., Ltd. | 286,500 | 10,394,112 | ||||||
| SMS Co., Ltd. | 83,100 | 2,268,921 | ||||||
| Strike Co., Ltd. | 145,600 | 6,108,299 | ||||||
| Synchro Food Co., Ltd.(a) | 644,400 | 2,199,297 | ||||||
| System Information Co., Ltd. | 410,500 | 3,767,330 | ||||||
| Systena Corp. | 205,600 | 4,230,894 | ||||||
| Syuppin Co., Ltd. | 316,400 | 3,372,733 | ||||||
| Trancom Co., Ltd. | 88,990 | 6,904,888 | ||||||
| Tsuruha Holdings, Inc. | 37,200 | 4,295,581 | ||||||
| User Local, Inc.(a) | 92,500 | 3,906,007 | ||||||
| Visional, Inc.(a) | 17,200 | 983,622 | ||||||
| YAKUODO Holdings Co., Ltd. | 250,200 | 5,402,800 | ||||||
| Yumshin Group Co. | 269,325 | 3,511,649 | ||||||
| 118,390,314 | ||||||||
| Malaysia (0.10%) | ||||||||
| Scicom MSC Bhd | 3,549,500 | 1,022,461 | ||||||
See Notes to Financial Statements.
| 62 | 1.855.377.7325 | www.GrandeurPeakGlobal.com |
| Grandeur Peak International Opportunities Fund | Portfolio of Investments |
April 30, 2021
| Shares | Value (Note 2) | |||||||
| Netherlands (1.76%) | ||||||||
| Aalberts NV | 222,217 | $ | 12,035,630 | |||||
| Shop Apotheke Europe NV(a)(b)(c) | 24,607 | 5,079,555 | ||||||
| 17,115,185 | ||||||||
| New Zealand (0.00%)(d) | ||||||||
| CBL Corp., Ltd.(a)(e) | 1,542,256 | 1 | ||||||
| Norway (1.24%) | ||||||||
| 24sevenoffice Scandinavia AB(a) | 204,934 | 852,121 | ||||||
| Medistim ASA | 85,511 | 2,794,208 | ||||||
| Nordic Semiconductor ASA(a) | 227,120 | 5,620,702 | ||||||
| Self Storage Group ASA(a) | 1,016,072 | 2,844,123 | ||||||
| 12,111,154 | ||||||||
| Philippines (0.94%) | ||||||||
| Puregold Price Club, Inc. | 9,057,000 | 7,016,119 | ||||||
| Wilcon Depot, Inc. | 5,738,600 | 2,097,598 | ||||||
| 9,113,717 | ||||||||
| Poland (0.99%) | ||||||||
| Dino Polska SA(a)(b)(c) | 105,634 | 6,858,048 | ||||||
| LiveChat Software SA | 85,000 | 2,801,804 | ||||||
| 9,659,852 | ||||||||
| Singapore (0.77%) | ||||||||
| Riverstone Holdings, Ltd./Singapore | 6,884,800 | 7,501,755 | ||||||
| South Africa (0.51%) | ||||||||
| Italtile, Ltd. | 4,209,423 | 4,951,750 | ||||||
| South Korea (2.13%) | ||||||||
| Hyundai Ezwel Co., Ltd. | 317,661 | 2,821,496 | ||||||
| LEENO Industrial, Inc. | 23,508 | 3,444,783 | ||||||
| Settle Bank, Inc./Korea | 99,000 | 2,981,525 | ||||||
| Suprema, Inc.(a) | 91,500 | 2,196,296 | ||||||
| Tokai Carbon Korea Co., Ltd. | 52,555 | 9,255,652 | ||||||
| 20,699,752 | ||||||||
| Sweden (3.87%) | ||||||||
| AddTech AB, Class B | 195,436 | 3,416,733 | ||||||
| Beijer Alma AB | 282,509 | 6,360,628 | ||||||
| Cint Group AB(a) | 267,830 | 2,720,837 | ||||||
| KNOW IT AB(a) | 194,292 | 7,195,107 | ||||||
| Lyko Group AB(a)(c) | 79,553 | 2,969,535 | ||||||
| Nibe Industrier AB, Class B | 37,457 | 1,370,753 | ||||||
| OEM International AB, Class B | 49,078 | 2,342,141 | ||||||
| Sagax AB B | 159,528 | 4,221,140 | ||||||
| Sdiptech AB(a) | 66,230 | 2,972,920 | ||||||
| SwedenCare AB | 63,289 | 4,096,884 | ||||||
| 37,666,678 | ||||||||
| Shares | Value (Note 2) | |||||||
| Taiwan (2.54%) | ||||||||
| ASPEED Technology, Inc. | 49,000 | $ | 3,701,357 | |||||
| Bioteque Corp. | 932,000 | 4,170,694 | ||||||
| Sporton International, Inc. | 1,034,003 | 9,494,926 | ||||||
| Voltronic Power Technology Corp. | 85,650 | 3,909,489 | ||||||
| Wistron Information Technology & Services Corp. | 923,000 | 3,403,465 | ||||||
| 24,679,931 | ||||||||
| United States (5.33%) | ||||||||
| Bank of NT Butterfield & Son, Ltd. | 251,443 | 9,861,594 | ||||||
| EPAM Systems, Inc.(a) | 44,738 | 20,478,820 | ||||||
| Frontage Holdings Corp.(a)(b)(c) | 11,226,900 | 7,645,753 | ||||||
| Genpact, Ltd. | 202,618 | 9,630,434 | ||||||
| Lululemon Athletica, Inc.(a) | 12,717 | 4,263,629 | ||||||
| 51,880,230 | ||||||||
| Vietnam (1.20%) | ||||||||
| Vietnam Dairy Products JSC | 1,224,917 | 4,967,675 | ||||||
| Vietnam Technological & Commercial Joint Stock Bank(a) | 3,772,473 | 6,708,800 | ||||||
| 11,676,475 | ||||||||
| TOTAL COMMON STOCKS | ||||||||
| (Cost $564,955,589) | 944,384,145 | |||||||
| TOTAL INVESTMENTS (97.05%) | ||||||||
| (Cost $564,955,589) | $ | 944,384,145 | ||||||
| Other Assets In Excess Of Liabilities (2.95%) | 28,716,399 | |||||||
| NET ASSETS (100.00%) | $ | 973,100,544 | ||||||
| (a) | Non-Income Producing Security. |
| (b) | Security exempt from registration under Rule 144A of the Securities Act of 1933. These securities may be resold in the ordinary course of business in transactions exempt from registration, normally to qualified institutional buyers. As of April 30, 2021, these securities had a total aggregate market value of $81,358,273, representing 8.36% of net assets. |
| (c) | Security was purchased pursuant to Regulation S under the Securities Act of 1933, which exempts securities offered and sold outside of the United States from registration. Such security cannot be sold in the United States without either an effective registration statement filed pursuant to the Securities Act of 1933, or pursuant to an exemption from registration. As of April 30, 2021, the aggregate market value of these securities was $84,539,594, representing 8.69% of net assets. |
| (d) | Less than 0.005%. |
See Notes to Financial Statements.
| Annual Report | April 30, 2021 | 63 |
| Grandeur Peak International Opportunities Fund | Portfolio of Investments |
April 30, 2021
| (e) | As a result of the use of significant unobservable inputs to determine fair value, these investments have been classified as level 3 assets. See also Note 2 to the financial statements for additional information. |
For Fund compliance purposes, the Fund’s geographical classifications refer to any one or more of the country sub-classifications used by one or more widely recognized market indexes or ratings group indexes, and/or as defined by Fund management. This definition may not apply for purposes of this report, which may combine sub-classifications for reporting ease. Geographical regions are shown as a percentage of net assets.
| Sector Composition (April 30, 2021) | |
| Technology | 28.0% |
| Consumer | 18.4% |
| Industrials | 17.6% |
| Health Care | 17.4% |
| Financials | 13.6% |
| Energy & Materials | 2.0% |
| Cash, Cash Equivalents, & Other Net Assets | 3.0% |
| Total | 100% |
| Industry Composition (April 30, 2021) | |
| IT Services | 15.3% |
| Capital Markets | 6.8% |
| Pharmaceuticals | 6.1% |
| Software | 5.6% |
| Health Care Providers & Services | 5.4% |
| Professional Services | 5.1% |
| Semiconductors & Semiconductor Equipment | 5.1% |
| Internet & Direct Marketing Retail | 4.9% |
| Machinery | 4.0% |
| Trading Companies & Distributors | 3.6% |
| Health Care Equipment & Supplies | 2.8% |
| Food & Staples Retailing | 2.8% |
| Multiline Retail | 2.6% |
| Life Sciences Tools & Services | 2.5% |
| Banks | 2.3% |
| Household Durables | 2.2% |
| Real Estate Management & Development | 2.2% |
| Specialty Retail | 2.1% |
| Equity Real Estate Investment Trusts (REITs) | 1.9% |
| Building Products | 1.2% |
| Textiles, Apparel & Luxury Goods | 1.1% |
| Food Products | 1.1% |
| Oil, Gas & Consumable Fuels | 1.1% |
| Other Industries (each less than 1%) | 9.2% |
| Cash and Other Assets, Less Liabilities | 3.0% |
| Total | 100% |
See Notes to Financial Statements.
| 64 | 1.855.377.7325 | www.GrandeurPeakGlobal.com |
| Grandeur Peak International Stalwarts Fund | Portfolio of Investments |
April 30, 2021
| Shares | Value (Note 2) | |||||||
| COMMON STOCKS (98.91%) | ||||||||
| Argentina (1.35%) | ||||||||
| Globant SA(a) | 119,750 | $ | 27,444,305 | |||||
| �� | ||||||||
| Australia (1.36%) | ||||||||
| Kogan.com, Ltd. | 925,063 | 7,895,862 | ||||||
| Netwealth Group, Ltd. | 1,728,376 | 19,825,376 | ||||||
| 27,721,238 | ||||||||
| Belgium (2.10%) | ||||||||
| Melexis NV | 234,117 | 25,501,040 | ||||||
| Warehouses De Pauw CVA | 490,387 | 17,286,205 | ||||||
| 42,787,245 | ||||||||
| Brazil (1.77%) | ||||||||
| Locaweb Servicos de Internet SA(b)(c) | 2,218,200 | 11,923,940 | ||||||
| Pagseguro Digital, Ltd., Class A(a) | 138,269 | 6,324,424 | ||||||
| Patria Investments, Ltd.(a) | 716,051 | 9,917,307 | ||||||
| Raia Drogasil SA | 1,602,400 | 7,781,834 | ||||||
| 35,947,505 | ||||||||
| Britain (20.23%) | ||||||||
| Abcam PLC(a) | 970,235 | 20,474,238 | ||||||
| B&M European Value Retail SA | 8,781,200 | 68,615,821 | ||||||
| boohoo Group PLC(a) | 1,134,403 | 5,328,211 | ||||||
| Dechra Pharmaceuticals PLC | 1,373,600 | 76,525,051 | ||||||
| Diploma PLC | 393,793 | 15,597,485 | ||||||
| Endava PLC, ADR(a) | 542,349 | 49,104,278 | ||||||
| Gamma Communications PLC | 560,056 | 14,061,537 | ||||||
| Impax Asset Management Group PLC | 1,081,358 | 14,993,764 | ||||||
| Intertek Group PLC | 447,375 | 37,923,293 | ||||||
| Sanne Group PLC | 3,863,124 | 34,465,027 | ||||||
| Softcat PLC | 1,211,594 | 32,076,478 | ||||||
| St. James’s Place PLC | 2,247,048 | 42,251,044 | ||||||
| 411,416,227 | ||||||||
| Canada (1.92%) | ||||||||
| Gildan Activewear, Inc.(a) | 581,584 | 20,184,984 | ||||||
| Ritchie Bros Auctioneers, Inc. | 298,224 | 18,967,047 | ||||||
| 39,152,031 | ||||||||
| China (11.76%) | ||||||||
| Baozun, Inc., Sponsored ADR(a) | 302,943 | 10,515,152 | ||||||
| CSPC Pharmaceutical Group, Ltd. | 9,470,600 | 11,728,901 | ||||||
| Hangzhou Robam Appliances Co., Ltd., Class A | 1,450,000 | 8,597,157 | ||||||
| Hangzhou Tigermed Consulting Co., Ltd., Class A | 477,750 | 11,554,145 | ||||||
| Li Ning Co., Ltd. | 1,627,000 | 13,279,495 | ||||||
| Shares | Value (Note 2) | |||||||
| China (continued) | ||||||||
| Silergy Corp. | 1,048,200 | $ | 109,762,109 | |||||
| Trip.com Group, Ltd., ADR(a) | 316,025 | 12,350,257 | ||||||
| WuXi AppTec Co., Ltd., Class H(b)(c) | 1,163,260 | 27,510,008 | ||||||
| Wuxi Biologics Cayman, Inc.(a)(b)(c) | 970,000 | 13,673,844 | ||||||
| Yum China Holdings, Inc. | 319,464 | 20,100,675 | ||||||
| 239,071,743 | ||||||||
| France (3.17%) | ||||||||
| Alten SA(a) | 237,264 | 29,694,726 | ||||||
| BioMerieux | 75,050 | 8,925,480 | ||||||
| Bureau Veritas SA(a) | 659,012 | 19,704,520 | ||||||
| Esker SA | 21,721 | 6,058,492 | ||||||
| 64,383,218 | ||||||||
| Germany (3.40%) | ||||||||
| Dermapharm Holding SE | 296,564 | 25,920,871 | ||||||
| MYT Netherlands Parent BV, ADR(a) | 10,000 | 299,700 | ||||||
| PATRIZIA AG | 705,980 | 19,309,479 | ||||||
| Puma SE(a) | 123,122 | 12,984,673 | ||||||
| QIAGEN NV(a) | 221,281 | 10,650,254 | ||||||
| 69,164,977 | ||||||||
| Hong Kong (1.80%) | ||||||||
| Techtronic Industries Co., Ltd. | 1,400,500 | 25,530,018 | ||||||
| Vitasoy International Holdings, Ltd. | 2,861,700 | 11,070,656 | ||||||
| 36,600,674 | ||||||||
| India (9.16%) | ||||||||
| Avenue Supermarts, Ltd.(a)(b)(c) | 324,500 | 12,498,107 | ||||||
| Bajaj Finance, Ltd.(a) | 227,376 | 16,735,377 | ||||||
| HCL Technologies, Ltd. | 779,861 | 9,464,458 | ||||||
| HDFC Asset Management Co., Ltd.(b)(c) | 252,479 | 9,463,297 | ||||||
| HDFC Bank, Ltd.(a) | 789,291 | 15,048,981 | ||||||
| IndiaMart InterMesh, Ltd.(a)(b)(c) | 88,101 | 9,454,035 | ||||||
| Marico, Ltd. | 1,372,658 | 7,624,694 | ||||||
| Metropolis Healthcare, Ltd.(b)(c) | 703,405 | 22,743,800 | ||||||
| Nippon Life India Asset Management, Ltd.(b)(c) | 1,615,720 | 7,453,394 | ||||||
| Titan Co., Ltd. | 432,255 | 8,704,623 | ||||||
| WNS Holdings, Ltd., ADR(a) | 926,920 | 67,136,816 | ||||||
| 186,327,582 | ||||||||
| Indonesia (0.39%) | ||||||||
| Bank Tabungan Pensiunan Nasional Syariah | 34,880,500 | 7,896,105 | ||||||
See Notes to Financial Statements.
| Annual Report | April 30, 2021 | 65 |
| Grandeur Peak International Stalwarts Fund | Portfolio of Investments |
April 30, 2021
| Shares | Value (Note 2) | |||||||
| Ireland (1.25%) | ||||||||
| Keywords Studios PLC(a) | 681,240 | $ | 25,458,651 | |||||
| Israel (1.76%) | ||||||||
| Wix.com, Ltd.(a) | 112,429 | 35,738,930 | ||||||
| Italy (1.00%) | ||||||||
| GVS SpA(a)(b)(c) | 455,497 | 7,940,544 | ||||||
| Interpump Group SpA | 231,829 | 12,347,193 | ||||||
| 20,287,737 | ||||||||
| Japan (9.99%) | ||||||||
| BASE, Inc.(a) | 581,500 | 9,699,648 | ||||||
| BayCurrent Consulting, Inc. | 88,300 | 24,117,074 | ||||||
| Freee KK(a) | 98,500 | 8,363,803 | ||||||
| IR Japan Holdings, Ltd. | 194,900 | 25,626,434 | ||||||
| M&A Capital Partners Co., Ltd.(a) | 464,000 | 21,482,661 | ||||||
| M3, Inc. | 147,400 | 10,219,140 | ||||||
| MonotaRO Co., Ltd. | 912,600 | 23,297,228 | ||||||
| Nihon M&A Center, Inc. | 1,041,400 | 27,290,416 | ||||||
| Seria Co., Ltd. | 661,800 | 24,009,854 | ||||||
| Systena Corp. | 1,314,800 | 27,056,320 | ||||||
| Visional, Inc.(a) | 35,800 | 2,047,305 | ||||||
| 203,209,883 | ||||||||
| Netherlands (2.25%) | ||||||||
| Aalberts NV | 446,158 | 24,164,635 | ||||||
| Shop Apotheke Europe NV(a)(b)(c) | 104,839 | 21,641,627 | ||||||
| 45,806,262 | ||||||||
| Norway (0.85%) | ||||||||
| Nordic Semiconductor ASA(a) | 696,792 | 17,244,012 | ||||||
| Philippines (0.41%) | ||||||||
| Wilcon Depot, Inc. | 23,051,800 | 8,425,995 | ||||||
| Poland (1.76%) | ||||||||
| Allegro.eu SA(a)(b)(c) | 459,868 | 7,050,452 | ||||||
| Dino Polska SA(a)(b)(c) | 442,472 | 28,726,493 | ||||||
| 35,776,945 | ||||||||
| Singapore (0.47%) | ||||||||
| Riverstone Holdings, Ltd./Singapore | 8,786,000 | 9,573,323 | ||||||
| South Korea (0.92%) | ||||||||
| Douzone Bizon Co., Ltd. | 104,500 | 7,919,585 | ||||||
| LEENO Industrial, Inc. | 73,428 | 10,759,890 | ||||||
| 18,679,475 | ||||||||
| Sweden (4.16%) | ||||||||
| AddTech AB, Class B | 697,100 | 12,187,135 | ||||||
| EQT AB | 1,137,900 | 38,483,119 | ||||||
| Shares | Value (Note 2) | |||||||
| Sweden (continued) | ||||||||
| Nibe Industrier AB, Class B | 261,597 | $ | 9,573,241 | |||||
| Sagax AB B | 610,304 | 16,148,756 | ||||||
| Sweco AB, Class B | 459,000 | 8,187,182 | ||||||
| 84,579,433 | ||||||||
| Switzerland (1.45%) | ||||||||
| Partners Group Holding AG | 20,734 | 29,514,591 | ||||||
| Taiwan (2.80%) | ||||||||
| ASPEED Technology, Inc. | 171,000 | 12,916,980 | ||||||
| momo.com, Inc. | 531,000 | 19,580,067 | ||||||
| Voltronic Power Technology Corp. | 535,190 | 24,428,713 | ||||||
| 56,925,760 | ||||||||
| United States (10.36%) | ||||||||
| Ashtead Group PLC | 232,501 | 14,934,085 | ||||||
| Bank of NT Butterfield & Son, Ltd. | 801,853 | 31,448,675 | ||||||
| EPAM Systems, Inc.(a) | 181,839 | 83,236,802 | ||||||
| Genpact, Ltd. | 674,850 | 32,075,621 | ||||||
| Lululemon Athletica, Inc.(a) | 98,189 | 32,919,826 | ||||||
| Monolithic Power Systems, Inc. | 44,275 | 16,000,099 | ||||||
| 210,615,108 | ||||||||
| Vietnam (1.07%) | ||||||||
| Vietnam Dairy Products JSC | 2,034,652 | 8,251,571 | ||||||
| Vietnam Technological & Commercial Joint Stock Bank(a) | 7,584,926 | 13,488,699 | ||||||
| 21,740,270 | ||||||||
| TOTAL COMMON STOCKS | ||||||||
| (Cost $1,306,984,334) | 2,011,489,225 | |||||||
| TOTAL INVESTMENTS (98.91%) | ||||||||
| (Cost $1,306,984,334) | $ | 2,011,489,225 | ||||||
| Other Assets In Excess Of Liabilities (1.09%) | 22,241,607 | |||||||
| NET ASSETS (100.00%) | $ | 2,033,730,832 | ||||||
| (a) | Non-Income Producing Security. |
| (b) | Security exempt from registration under Rule 144A of the Securities Act of 1933. These securities may be resold in the ordinary course of business in transactions exempt from registration, normally to qualified institutional buyers. As of April 30, 2021, these securities had a total aggregate market value of $180,079,541, representing 8.85% of net assets. |
See Notes to Financial Statements.
| 66 | 1.855.377.7325 | www.GrandeurPeakGlobal.com |
| Grandeur Peak International Stalwarts Fund | Portfolio of Investments |
April 30, 2021
| (c) | Security was purchased pursuant to Regulation S under the Securities Act of 1933, which exempts securities offered and sold outside of the United States from registration. Such security cannot be sold in the United States without either an effective registration statement filed pursuant to the Securities Act of 1933, or pursuant to an exemption from registration. As of April 30, 2021, the aggregate market value of these securities was $180,079,541, representing 8.85% of net assets. |
For Fund compliance purposes, the Fund’s geographical classifications refer to any one or more of the country sub-classifications used by one or more widely recognized market indexes or ratings group indexes, and/or as defined by Fund management. This definition may not apply for purposes of this report, which may combine sub-classifications for reporting ease. Geographical regions are shown as a percentage of net assets.
| Sector Composition (April 30, 2021) | |
| Technology | 33.3% |
| Consumer | 18.4% |
| Financials | 18.1% |
| Industrials | 16.5% |
| Health Care | 12.6% |
| Cash, Cash Equivalents, & Other Net Assets | 1.1% |
| Total | 100% |
| Industry Composition (April 30, 2021) | |
| IT Services | 20.6% |
| Capital Markets | 11.2% |
| Semiconductors & Semiconductor Equipment | 9.5% |
| Professional Services | 6.6% |
| Pharmaceuticals | 5.6% |
| Multiline Retail | 4.6% |
| Textiles, Apparel & Luxury Goods | 4.3% |
| Internet & Direct Marketing Retail | 4.2% |
| Trading Companies & Distributors | 3.7% |
| Banks | 3.3% |
| Life Sciences Tools & Services | 3.1% |
| Machinery | 3.1% |
| Software | 2.5% |
| Food & Staples Retailing | 2.4% |
| Real Estate Management & Development | 1.8% |
| Health Care Equipment & Supplies | 1.3% |
| Electrical Equipment | 1.2% |
| Health Care Providers & Services | 1.1% |
| Biotechnology | 1.0% |
| Other Industries (each less than 1%) | 7.8% |
| Cash and Other Assets, Less Liabilities | 1.1% |
| Total | 100% |
See Notes to Financial Statements.
| Annual Report | April 30, 2021 | 67 |
| Grandeur Peak US Stalwarts Fund | Portfolio of Investments |
April 30, 2021
| Shares | Value (Note 2) | |||||||
| COMMON STOCKS (98.75%) | ||||||||
| Argentina (1.46%) | ||||||||
| Globant SA(a) | 8,050 | $ | 1,844,899 | |||||
| Britain (2.65%) | ||||||||
| Endava PLC, ADR(a) | 36,875 | 3,338,662 | ||||||
| Canada (1.19%) | ||||||||
| Gildan Activewear, Inc.(a) | 15,944 | 553,367 | ||||||
| Ritchie Bros Auctioneers, Inc. | 14,800 | 941,280 | ||||||
| 1,494,647 | ||||||||
| Germany (0.64%) | ||||||||
| QIAGEN NV(a) | 16,658 | 801,750 | ||||||
| Hong Kong (0.92%) | ||||||||
| Techtronic Industries Co., Ltd. | 64,000 | 1,166,670 | ||||||
| India (2.09%) | ||||||||
| WNS Holdings, Ltd., ADR(a) | 36,350 | 2,632,831 | ||||||
| Israel (2.13%) | ||||||||
| Wix.com, Ltd.(a) | 8,437 | 2,681,954 | ||||||
| United States (87.67%) | ||||||||
| 4imprint Group PLC(a) | 16,600 | 538,745 | ||||||
| Align Technology, Inc.(a) | 2,675 | 1,593,043 | ||||||
| Apollo Global Management, Inc. | 25,719 | 1,424,061 | ||||||
| Array Technologies, Inc.(a) | 45,703 | 1,286,996 | ||||||
| Ashtead Group PLC | 8,425 | 541,158 | ||||||
| Bank of Hawaii Corp. | 17,491 | 1,589,757 | ||||||
| Bank of NT Butterfield & Son, Ltd. | 57,436 | 2,252,640 | ||||||
| Blackline, Inc.(a) | 17,975 | 2,086,179 | ||||||
| Blackstone Group, Inc., Class A | 22,725 | 2,010,935 | ||||||
| Cardiovascular Systems, Inc.(a) | 25,838 | 1,041,788 | ||||||
| Castle Biosciences, Inc.(a) | 14,110 | 974,013 | ||||||
| CDW Corp. | 3,025 | 539,448 | ||||||
| Chewy, Inc.(a) | 15,550 | 1,239,646 | ||||||
| Cross Creek Lucid LP/Partnership Interest(a)(b) | 700,000 | 700,000 | ||||||
| Dexcom, Inc.(a) | 1,525 | 588,803 | ||||||
| Elastic NV(a) | 5,008 | 604,065 | ||||||
| EPAM Systems, Inc.(a) | 9,400 | 4,302,849 | ||||||
| Equinix, Inc. | 3,025 | 2,180,299 | ||||||
| Etsy, Inc.(a) | 9,175 | 1,823,898 | ||||||
| Exact Sciences Corp.(a) | 14,675 | 1,934,459 | ||||||
| ExlService Holdings, Inc.(a) | 15,275 | 1,411,105 | ||||||
| Fastenal Co. | 42,025 | 2,197,066 | ||||||
| First Hawaiian, Inc. | 34,934 | 959,288 | ||||||
| First Republic Bank | 26,650 | 4,883,346 | ||||||
| Five Below, Inc.(a) | 6,325 | 1,273,033 | ||||||
| Freshpet, Inc.(a) | 3,750 | 693,075 | ||||||
| Shares | Value (Note 2) | |||||||
| United States (continued) | ||||||||
| Frontage Holdings Corp.(a)(c)(d) | 1,904,000 | $ | 1,296,664 | |||||
| Genpact, Ltd. | 53,100 | 2,523,843 | ||||||
| Glacier Bancorp, Inc. | 15,950 | 940,253 | ||||||
| Goosehead Insurance, Inc., Class A | 20,825 | 2,289,500 | ||||||
| Hamilton Lane, Inc., Class A | 10,500 | 949,725 | ||||||
| Heska Corp.(a) | 18,750 | 3,424,687 | ||||||
| Houlihan Lokey, Inc. | 23,875 | 1,582,196 | ||||||
| HubSpot, Inc.(a) | 1,586 | 834,950 | ||||||
| IDEXX Laboratories, Inc.(a) | 1,360 | 746,626 | ||||||
| Joint Corp.(a) | 20,283 | 1,125,301 | ||||||
| Kinsale Capital Group, Inc. | 10,988 | 1,912,022 | ||||||
| LeMaitre Vascular, Inc. | 34,150 | 1,791,850 | ||||||
| LGI Homes, Inc.(a) | 14,225 | 2,358,221 | ||||||
| Littelfuse, Inc. | 6,792 | 1,801,510 | ||||||
| Lululemon Athletica, Inc.(a) | 6,203 | 2,079,680 | ||||||
| Medallia, Inc.(a) | 20,000 | 589,800 | ||||||
| Medpace Holdings, Inc.(a) | 9,800 | 1,662,864 | ||||||
| Microchip Technology, Inc. | 5,200 | 781,508 | ||||||
| Mimecast, Ltd.(a) | 6,775 | 294,171 | ||||||
| Monolithic Power Systems, Inc. | 3,950 | 1,427,451 | ||||||
| Morningstar, Inc. | 1,450 | 384,265 | ||||||
| MSCI, Inc. | 1,650 | 801,521 | ||||||
| NV5 Global, Inc.(a) | 6,101 | 549,883 | ||||||
| Old Dominion Freight Line, Inc. | 1,750 | 451,168 | ||||||
| Ollie's Bargain Outlet Holdings, Inc.(a) | 16,672 | 1,538,325 | ||||||
| PagerDuty, Inc.(a) | 15,595 | 662,164 | ||||||
| Paycom Software, Inc.(a) | 6,991 | 2,687,409 | ||||||
| Paylocity Holding Corp.(a) | 7,825 | 1,512,103 | ||||||
| PJT Partners, Inc., Class A | 43,300 | 3,183,849 | ||||||
| Pool Corp. | 7,650 | 3,232,278 | ||||||
| Poshmark, Inc.(a) | 31,924 | 1,335,381 | ||||||
| Power Integrations, Inc. | 23,025 | 1,906,701 | ||||||
| PPD, Inc.(a) | 39,750 | 1,836,449 | ||||||
| Qualtrics International, Inc.(a) | 51,600 | 1,927,260 | ||||||
| Qualys, Inc.(a) | 20,613 | 2,089,334 | ||||||
| Rapid7, Inc.(a) | 14,225 | 1,155,781 | ||||||
| Rexford Industrial Realty, Inc. | 16,500 | 916,575 | ||||||
| Shoals Technologies Group, Inc.(a) | 27,957 | 896,581 | ||||||
| Silicon Laboratories, Inc.(a) | 4,753 | 669,935 | ||||||
| SVB Financial Group(a) | 3,580 | 2,047,151 | ||||||
| Systemax, Inc. | 47,725 | 2,038,812 | ||||||
| Terreno Realty Corp. | 24,999 | 1,612,935 | ||||||
| TriMas Corp.(a) | 20,050 | 638,392 | ||||||
| Ulta Beauty, Inc.(a) | 6,150 | 2,025,502 | ||||||
| WW Grainger, Inc. | 3,625 | 1,571,583 | ||||||
| YETI Holdings, Inc.(a) | 11,100 | 948,162 | ||||||
| Zendesk, Inc.(a) | 4,066 | 594,246 | ||||||
See Notes to Financial Statements.
| 68 | 1.855.377.7325 | www.GrandeurPeakGlobal.com |
| Grandeur Peak US Stalwarts Fund | Portfolio of Investments |
April 30, 2021
| Shares | Value (Note 2) | |||||||
| United States (continued) | ||||||||
| Zoetis, Inc. | 1,591 | $ | 275,291 | |||||
| 110,571,553 | ||||||||
| TOTAL COMMON STOCKS | ||||||||
| (Cost $104,066,562) | 124,532,966 | |||||||
| TOTAL INVESTMENTS (98.75%) | ||||||||
| (Cost $104,066,562) | $ | 124,532,966 | ||||||
| Other Assets In Excess Of Liabilities (1.25%) | 1,572,975 | |||||||
| NET ASSETS (100.00%) | $ | 126,105,941 | ||||||
| (a) | Non-Income Producing Security. |
| (b) | As a result of the use of significant unobservable inputs to determine fair value, these investments have been classified as level 3 assets. See also Note 2 to the financial statements for additional information. |
| (c) | Security exempt from registration under Rule 144A of the Securities Act of 1933. These securities may be resold in the ordinary course of business in transactions exempt from registration, normally to qualified institutional buyers. As of April 30, 2021, these securities had a total aggregate market value of $1,296,664, representing 1.03% of net assets. |
| (d) | Security was purchased pursuant to Regulation S under the Securities Act of 1933, which exempts securities offered and sold outside of the United States from registration. Such security cannot be sold in the United States without either an effective registration statement filed pursuant to the Securities Act of 1933, or pursuant to an exemption from registration. As of April 30, 2021, the aggregate market value of these securities was $1,296,664, representing 1.03% of net assets. |
For Fund compliance purposes, the Fund’s geographical classifications refer to any one or more of the country sub-classifications used by one or more widely recognized market indexes or ratings group indexes, and/or as defined by Fund management. This definition may not apply for purposes of this report, which may combine sub-classifications for reporting ease. Geographical regions are shown as a percentage of net assets.
| Sector Composition (April 30, 2021) | |
| Technology | 32.9% |
| Financials | 25.9% |
| Health Care | 15.2% |
| Consumer | 15.1% |
| Industrials | 9.7% |
| Cash, Cash Equivalents, & Other Net Assets | 1.2% |
| Total | 100% |
| Industry Composition (April 30, 2021) | |
| IT Services | 14.9% |
| Software | 11.9% |
| Banks | 10.1% |
| Capital Markets | 8.8% |
| Health Care Equipment & Supplies | 7.3% |
| Trading Companies & Distributors | 5.0% |
| Life Sciences Tools & Services | 4.4% |
| Semiconductors & Semiconductor Equipment | 3.8% |
| Equity Real Estate Investment Trusts (REITs) | 3.7% |
| Internet & Direct Marketing Retail | 3.5% |
| Insurance | 3.3% |
| Specialty Retail | 2.6% |
| Distributors | 2.6% |
| Textiles, Apparel & Luxury Goods | 2.1% |
| Household Durables | 1.9% |
| Electronic Equipment, Instruments & Components | 1.9% |
| Electrical Equipment | 1.7% |
| Health Care Providers & Services | 1.7% |
| Biotechnology | 1.5% |
| Machinery | 1.4% |
| Multiline Retail | 1.2% |
| Other Industries (each less than 1%) | 3.5% |
| Cash and Other Assets, Less Liabilities | 1.2% |
| Total | 100% |
See Notes to Financial Statements.
| Annual Report | April 30, 2021 | 69 |
| Grandeur Peak Funds® | Statements of Assets and Liabilities |
April 30, 2021
Grandeur Peak Emerging Markets Opportunities Fund | Grandeur Peak Global Contrarian Fund | Grandeur Peak Global Micro Cap | ||||||||||
| ASSETS | ||||||||||||
| Investments, at value (Cost - see below) | $ | 619,889,078 | $ | 47,985,217 | $ | 70,131,241 | ||||||
| Cash | 20,875,908 | 1,608,194 | 432,695 | |||||||||
| Foreign cash, at value (Cost $5,098,659, $71,389 and $87,665, respectively) | 5,098,960 | 71,439 | 87,556 | |||||||||
| Dividends and interest receivable | 483,217 | 122,323 | 78,745 | |||||||||
| Receivable for investments sold | 1,090,438 | – | 144,131 | |||||||||
| Receivable for fund shares subscribed | 123,734 | 1,103,679 | 92,011 | |||||||||
| Prepaid and other assets | 16,913 | 5,868 | 6,629 | |||||||||
| Total assets | 647,578,248 | 50,896,720 | 70,973,008 | |||||||||
| LIABILITIES | ||||||||||||
| Payable for investments purchased | 2,953,511 | 1,280,563 | 155,107 | |||||||||
| Foreign capital gains tax | 4,776,583 | 66,465 | 293,133 | |||||||||
| Payable for fund shares redeemed | 500,442 | 69,887 | – | |||||||||
| Advisory fees payable | 618,248 | 28,049 | 90,639 | |||||||||
| Administration fees payable | 28,119 | 11,818 | 15,329 | |||||||||
| Custodian fees payable | 90,375 | 14,433 | 9,594 | |||||||||
| Payable for trustee fees and expenses | 12,201 | 819 | 1,338 | |||||||||
| Payable for chief compliance officer fee | 815 | 55 | 89 | |||||||||
| Payable for principal financial officer fees | 149 | 10 | 16 | |||||||||
| Distribution and service fees payable | 3,020 | – | – | |||||||||
| Payable for transfer agency fees | 3,957 | 2,783 | 3,634 | |||||||||
| Accrued expenses and other liabilities | 41,492 | 18,794 | 29,372 | |||||||||
| Total liabilities | 9,028,912 | 1,493,676 | 598,251 | |||||||||
| NET ASSETS | $ | 638,549,336 | $ | 49,403,044 | $ | 70,374,757 | ||||||
| NET ASSETS CONSISTS OF | ||||||||||||
| Paid-in capital (Note 5) | $ | 391,929,814 | $ | 40,181,483 | $ | 39,907,548 | ||||||
| Total distributable earnings | 246,619,522 | 9,221,561 | 30,467,209 | |||||||||
| NET ASSETS | $ | 638,549,336 | $ | 49,403,044 | $ | 70,374,757 | ||||||
| INVESTMENTS, AT COST | $ | 402,019,213 | $ | 41,258,988 | $ | 43,260,892 | ||||||
| PRICING OF SHARES | ||||||||||||
| Investor Class | ||||||||||||
| Net Assets | $ | 15,011,138 | $ | – | $ | – | ||||||
| Net Asset Value, offering and redemption price per share | $ | 17.70 | $ | – | $ | – | ||||||
| Shares of beneficial interest outstanding | 848,128 | – | – | |||||||||
| Institutional Class | ||||||||||||
| Net Assets | $ | 623,538,198 | $ | 49,403,044 | $ | 70,374,757 | ||||||
| Net Asset Value, offering and redemption price per share | $ | 17.83 | $ | 15.41 | $ | 20.65 | ||||||
| Shares of beneficial interest outstanding | 34,975,293 | 3,205,192 | 3,408,530 | |||||||||
See Notes to Financial Statements.
| 70 | 1.855.377.7325 | www.GrandeurPeakGlobal.com |
| Grandeur Peak Funds® | Statements of Assets and Liabilities |
April 30, 2021
Grandeur Peak Global Opportunities Fund | Grandeur Peak Global Reach Fund | Grandeur Peak Global Stalwarts Fund | ||||||||||
| ASSETS | ||||||||||||
| Investments, at value (Cost - see below) | $ | 1,019,895,653 | $ | 374,610,883 | $ | 364,616,415 | ||||||
| Cash | 3,436,884 | 2,684,912 | 3,325,090 | |||||||||
| Deposit with broker for short sales (Note 2) | – | 1,000,000 | – | |||||||||
| Foreign cash, at value (Cost $234,447, $69,120 and $11,469, respectively) | 232,394 | 69,120 | 11,333 | |||||||||
| Dividends and interest receivable | 1,925,924 | 449,277 | 543,174 | |||||||||
| Receivable for investments sold | – | 626,112 | 240,487 | |||||||||
| Receivable for fund shares subscribed | 136,159 | 565,883 | 252,427 | |||||||||
| Prepaid and other assets | 16,082 | 6,701 | 10,784 | |||||||||
| Total assets | 1,025,643,096 | 380,012,888 | 368,999,710 | |||||||||
| LIABILITIES | ||||||||||||
| Payable for investments purchased | 118,291 | 1,707,901 | 507,758 | |||||||||
| Foreign capital gains tax | 2,283,339 | 765,574 | – | |||||||||
| Payable for fund shares redeemed | 568,019 | 80,780 | 34,573 | |||||||||
| Advisory fees payable | 925,333 | 332,634 | 235,293 | |||||||||
| Administration fees payable | 35,897 | 30,784 | 18,491 | |||||||||
| Custodian fees payable | 57,203 | 31,770 | 22,112 | |||||||||
| Payable for trustee fees and expenses | 19,681 | 7,146 | 6,840 | |||||||||
| Payable for chief compliance officer fee | 1,314 | 477 | 457 | |||||||||
| Payable for principal financial officer fees | 240 | 87 | 84 | |||||||||
| Distribution and service fees payable | 26,406 | 11,894 | 20,962 | |||||||||
| Payable for transfer agency fees | 6,735 | 5,283 | 519,885 | |||||||||
| Accrued expenses and other liabilities | 38,885 | 45,867 | 32,060 | |||||||||
| Total liabilities | 4,081,343 | 3,020,197 | 1,398,515 | |||||||||
| NET ASSETS | $ | 1,021,561,753 | $ | 376,992,691 | $ | 367,601,195 | ||||||
| NET ASSETS CONSISTS OF | ||||||||||||
| Paid-in capital (Note 5) | $ | 513,430,910 | $ | 185,504,663 | $ | 210,297,280 | ||||||
| Total distributable earnings | 508,130,843 | 191,488,028 | 157,303,915 | |||||||||
| NET ASSETS | $ | 1,021,561,753 | $ | 376,992,691 | $ | 367,601,195 | ||||||
| INVESTMENTS, AT COST | $ | 611,951,511 | $ | 218,729,999 | $ | 228,944,712 | ||||||
| PRICING OF SHARES | ||||||||||||
| Investor Class | ||||||||||||
| Net Assets | $ | 131,738,650 | $ | 59,164,328 | $ | 103,890,636 | ||||||
| Net Asset Value, offering and redemption price per share | $ | 5.51 | $ | 23.16 | $ | 23.26 | ||||||
| Shares of beneficial interest outstanding | 23,924,303 | 2,554,461 | 4,466,459 | |||||||||
| Institutional Class | ||||||||||||
| Net Assets | $ | 889,823,103 | $ | 317,828,363 | $ | 263,710,559 | ||||||
| Net Asset Value, offering and redemption price per share | $ | 5.61 | $ | 23.31 | $ | 23.50 | ||||||
| Shares of beneficial interest outstanding | 158,646,812 | 13,635,389 | 11,222,806 | |||||||||
See Notes to Financial Statements.
| Annual Report | April 30, 2021 | 71 |
| Grandeur Peak Funds® | Statements of Assets and Liabilities |
April 30, 2021
Grandeur Peak International Opportunities Fund | Grandeur Peak International Stalwarts Fund | Grandeur Peak US Stalwarts Fund | ||||||||||
| ASSETS | ||||||||||||
| Investments, at value (Cost - see below) | $ | 944,384,145 | $ | 2,011,489,225 | $ | 124,532,966 | ||||||
| Cash | 28,656,864 | 23,845,122 | 1,778,493 | |||||||||
| Foreign cash, at value (Cost $1,334,374, $102,608 and $–, respectively) | 1,334,014 | 101,391 | – | |||||||||
| Dividends and interest receivable | 2,110,834 | 3,811,105 | 36,683 | |||||||||
| Receivable for investments sold | 740,540 | 601,073 | 622,597 | |||||||||
| Receivable for fund shares subscribed | 156,270 | 1,312,330 | 147,452 | |||||||||
| Prepaid and other assets | 18,269 | 20,232 | 8,825 | |||||||||
| Total assets | 977,400,936 | 2,041,180,478 | 127,127,016 | |||||||||
| LIABILITIES | ||||||||||||
| Payable for investments purchased | 1,104,506 | 1,316,906 | 861,897 | |||||||||
| Foreign capital gains tax | 2,124,882 | 3,714,968 | – | |||||||||
| Payable for fund shares redeemed | 28,163 | 861,852 | 31,813 | |||||||||
| Advisory fees payable | 882,282 | 1,294,894 | 77,556 | |||||||||
| Administration fees payable | 34,949 | 51,957 | 10,268 | |||||||||
| Custodian fees payable | 59,674 | 104,263 | 6,252 | |||||||||
| Payable for trustee fees and expenses | 18,777 | 37,849 | 1,808 | |||||||||
| Payable for chief compliance officer fee | 1,254 | 2,528 | 121 | |||||||||
| Payable for principal financial officer fees | 229 | 462 | 22 | |||||||||
| Distribution and service fees payable | 13,789 | 13,613 | – | |||||||||
| Payable for transfer agency fees | 3,290 | 17,295 | 3,077 | |||||||||
| Accrued expenses and other liabilities | 28,597 | 33,059 | 28,261 | |||||||||
| Total liabilities | 4,300,392 | 7,449,646 | 1,021,075 | |||||||||
| NET ASSETS | $ | 973,100,544 | $ | 2,033,730,832 | $ | 126,105,941 | ||||||
| NET ASSETS CONSISTS OF | ||||||||||||
| Paid-in capital (Note 5) | $ | 528,931,575 | $ | 1,272,009,372 | $ | 104,072,170 | ||||||
| Total distributable earnings | 444,168,969 | 761,721,460 | 22,033,771 | |||||||||
| NET ASSETS | $ | 973,100,544 | $ | 2,033,730,832 | $ | 126,105,941 | ||||||
| INVESTMENTS, AT COST | $ | 564,955,589 | $ | 1,306,984,334 | $ | 104,066,562 | ||||||
| PRICING OF SHARES | ||||||||||||
| Investor Class | ||||||||||||
| Net Assets | $ | 69,041,325 | $ | 67,687,734 | $ | – | ||||||
| Net Asset Value, offering and redemption price per share | $ | 5.17 | $ | 24.05 | $ | – | ||||||
| Shares of beneficial interest outstanding | 13,352,880 | 2,814,019 | – | |||||||||
| Institutional Class | ||||||||||||
| Net Assets | $ | 904,059,219 | $ | 1,966,043,098 | $ | 126,105,941 | ||||||
| Net Asset Value, offering and redemption price per share | $ | 5.21 | $ | 24.19 | $ | 22.71 | ||||||
| Shares of beneficial interest outstanding | 173,460,630 | 81,272,280 | 5,553,678 | |||||||||
See Notes to Financial Statements.
| 72 | 1.855.377.7325 | www.GrandeurPeakGlobal.com |
| Grandeur Peak Funds® | Statements of Operations |
For the Year Ended April 30, 2021
Grandeur Peak Emerging Markets Opportunities Fund | Grandeur Peak Global Contrarian Fund | Grandeur Peak Global Micro Cap | ||||||||||
| INVESTMENT INCOME | ||||||||||||
| Dividends | $ | 6,727,235 | $ | 723,934 | $ | 725,459 | ||||||
| Foreign taxes withheld | (703,280 | ) | (39,542 | ) | (70,992 | ) | ||||||
| Total investment income | 6,023,955 | 684,392 | 654,467 | |||||||||
| EXPENSES | ||||||||||||
| Investment advisor fees (Note 6) | 6,878,521 | 208,698 | 709,192 | |||||||||
| Administrative fees | 182,128 | 15,392 | 49,144 | |||||||||
| Distribution and service fees - Investor Class | 29,222 | – | – | |||||||||
| Transfer agent fees | 40,616 | 31,026 | 37,996 | |||||||||
| Recoupment of previously waived fees | – | – | 34,610 | |||||||||
| Professional fees | 62,675 | 22,357 | 31,627 | |||||||||
| Printing fees | 11,222 | – | 3,156 | |||||||||
| Registration fees | 36,406 | 21,569 | 20,462 | |||||||||
| Custodian fees | 482,329 | 70,789 | 59,489 | |||||||||
| Trustee fees and expenses | 25,271 | 1,251 | 2,560 | |||||||||
| Chief compliance officer fees | 10,203 | 385 | 928 | |||||||||
| Principal financial officer fees | 1,851 | 70 | 169 | |||||||||
| Offering costs | – | 16,656 | – | |||||||||
| Other expenses | 18,468 | 4,025 | 5,864 | |||||||||
| Total expenses | 7,778,912 | 392,218 | 955,197 | |||||||||
| Voluntary waiver of investment advisory fees (Note 6) | (350,781 | ) | – | – | ||||||||
| Less fees waived/reimbursed by investment advisor (Note 6) | – | (109,006 | ) | (7,343 | ) | |||||||
| Total net expenses | 7,428,131 | 283,212 | 947,854 | |||||||||
| NET INVESTMENT INCOME/(LOSS) | (1,404,176 | ) | 401,180 | (293,387 | ) | |||||||
| REALIZED AND UNREALIZED GAIN/(LOSS) ON INVESTMENTS | ||||||||||||
| Net realized gain on investments | 46,955,704 | 3,103,091 | 8,095,477 | |||||||||
| Net realized loss on foreign currency transactions | (205,187 | ) | (15,723 | ) | (12,553 | ) | ||||||
| Net realized gain | 46,750,517 | 3,087,368 | 8,082,924 | |||||||||
| Net change in unrealized appreciation on investments (net of change in foreign capital gains tax of $4,735,729, $66,466 and $292,419, respectively) | 182,558,932 | 7,660,274 | 23,349,554 | |||||||||
| Net change in unrealized appreciation/(depreciation) on translation of assets and liabilities in foreign currencies | 13,963 | (131 | ) | 622 | ||||||||
| Net change in unrealized appreciation | 182,572,895 | 7,660,143 | 23,350,176 | |||||||||
| NET REALIZED AND UNREALIZED GAIN ON INVESTMENTS AND FOREIGN CURRENCY TRANSACTIONS | 229,323,412 | 10,747,511 | 31,433,100 | |||||||||
| NET INCREASE IN NET ASSETS RESULTING FROM OPERATIONS | $ | 227,919,236 | $ | 11,148,691 | $ | 31,139,713 | ||||||
See Notes to Financial Statements.
| Annual Report | April 30, 2021 | 73 |
| Grandeur Peak Funds® | Statements of Operations |
For the Year Ended April 30, 2021
Grandeur Peak Global Opportunities Fund | Grandeur Peak Global Reach | Grandeur Peak Global Stalwarts Fund | ||||||||||
| INVESTMENT INCOME | ||||||||||||
| Dividends | $ | 10,535,641 | $ | 3,811,749 | $ | 3,040,824 | ||||||
| Foreign taxes withheld | (998,511 | ) | (339,387 | ) | (215,196 | ) | ||||||
| Total investment income | 9,537,130 | 3,472,362 | 2,825,628 | |||||||||
| EXPENSES | ||||||||||||
| Investment advisor fees (Note 6) | 10,035,019 | 3,371,158 | 2,254,081 | |||||||||
| Administrative fees | 265,103 | 143,425 | 110,685 | |||||||||
| Distribution and service fees - Investor Class | 281,151 | 126,442 | 237,783 | |||||||||
| Transfer agent fees | 63,465 | 52,048 | 67,209 | |||||||||
| Professional fees | 60,321 | 60,641 | 42,676 | |||||||||
| Printing fees | 27,226 | 19,693 | 12,455 | |||||||||
| Registration fees | 37,159 | 35,470 | 35,746 | |||||||||
| Custodian fees | 318,948 | 184,701 | 140,426 | |||||||||
| Trustee fees and expenses | 40,614 | 15,324 | 14,565 | |||||||||
| Chief compliance officer fees | 15,916 | 6,152 | 5,649 | |||||||||
| Principal financial officer fees | 2,890 | 1,117 | 1,027 | |||||||||
| Other expenses | 27,436 | 14,996 | 14,717 | |||||||||
| Total expenses | 11,175,248 | 4,031,167 | 2,937,019 | |||||||||
| Voluntary waiver of investment advisory fees (Note 6) | (703,763 | ) | – | – | ||||||||
| Total net expenses | 10,471,485 | 4,031,167 | 2,937,019 | |||||||||
| NET INVESTMENT LOSS | (934,355 | ) | (558,805 | ) | (111,391 | ) | ||||||
| REALIZED AND UNREALIZED GAIN/(LOSS) ON INVESTMENTS | ||||||||||||
| Net realized gain on investments | 168,407,252 | 61,936,310 | 36,555,452 | |||||||||
| Net realized loss on foreign currency transactions | (177,660 | ) | (9,894 | ) | (4,576 | ) | ||||||
| Net realized gain | 168,229,592 | 61,926,416 | 36,550,876 | |||||||||
| Net change in unrealized appreciation on investments (net of change in foreign capital gains tax of $2,283,340, $759,814 and $512,433, respectively) | 299,092,273 | 109,184,868 | 103,496,600 | |||||||||
| Net change in unrealized appreciation on translation of assets and liabilities in foreign currencies | 17,570 | 7,421 | 2,700 | |||||||||
| Net change in unrealized appreciation | 299,109,843 | 109,192,289 | 103,499,300 | |||||||||
| NET REALIZED AND UNREALIZED GAIN ON INVESTMENTS AND FOREIGN CURRENCY TRANSACTIONS | 467,339,435 | 171,118,705 | 140,050,176 | |||||||||
| NET INCREASE IN NET ASSETS RESULTING FROM OPERATIONS | $ | 466,405,080 | $ | 170,559,900 | $ | 139,938,785 | ||||||
See Notes to Financial Statements.
| 74 | 1.855.377.7325 | www.GrandeurPeakGlobal.com |
| Grandeur Peak Funds® | Statements of Operations |
For the Year Ended April 30, 2021
Grandeur Peak International Opportunities Fund | Grandeur Peak International Stalwarts Fund | Grandeur Peak US Stalwarts Fund | ||||||||||
| INVESTMENT INCOME | ||||||||||||
| Dividends | $ | 10,668,071 | $ | 19,718,128 | $ | 307,615 | ||||||
| Foreign taxes withheld | (1,175,399 | ) | (1,817,080 | ) | (823 | ) | ||||||
| Total investment income | 9,492,672 | 17,901,048 | 306,792 | |||||||||
| EXPENSES | ||||||||||||
| Investment advisor fees (Note 6) | 9,439,878 | 11,874,065 | 332,677 | |||||||||
| Administrative fees | 250,590 | 446,367 | 33,581 | |||||||||
| Distribution and service fees - Investor Class | 134,410 | 209,632 | – | |||||||||
| Transfer agent fees | 37,840 | 144,806 | 32,736 | |||||||||
| Professional fees | 56,507 | 69,324 | 16,466 | |||||||||
| Printing fees | 19,218 | 56,211 | 25 | |||||||||
| Registration fees | 55,828 | 58,092 | – | |||||||||
| Custodian fees | 337,946 | 566,653 | 30,480 | |||||||||
| Trustee fees and expenses | 38,509 | 77,489 | 2,823 | |||||||||
| Chief compliance officer fees | 14,939 | 29,369 | 787 | |||||||||
| Principal financial officer fees | 2,712 | 5,341 | 144 | |||||||||
| Offering costs | – | – | 40,186 | |||||||||
| Other expenses | 27,000 | 43,269 | 6,586 | |||||||||
| Total expenses | 10,415,377 | 13,580,618 | 496,491 | |||||||||
| Voluntary waiver of investment advisory fees (Note 6) | (601,414 | ) | – | – | ||||||||
| Less fees waived/reimbursed by investment advisor (Note 6) | – | – | (49,676 | ) | ||||||||
| Total net expenses | 9,813,963 | 13,580,618 | 446,815 | |||||||||
| NET INVESTMENT INCOME/(LOSS) | (321,291 | ) | 4,320,430 | (140,023 | ) | |||||||
| REALIZED AND UNREALIZED GAIN/(LOSS) ON INVESTMENTS | ||||||||||||
| Net realized gain on investments | 104,049,870 | 78,008,723 | 2,016,644 | |||||||||
| Net realized gain/(loss) on foreign currency transactions | (781,261 | ) | 35,446 | (292 | ) | |||||||
| Net realized gain | 103,268,609 | 78,044,169 | 2,016,352 | |||||||||
| Net change in unrealized appreciation on investments (net of change in foreign capital gains tax of $2,088,372, $3,714,968 and $0, respectively) | 297,636,181 | 628,477,541 | 18,985,167 | |||||||||
| Net change in unrealized appreciation/(depreciation) on translation of assets and liabilities in foreign currencies | 23,851 | 23,464 | (6 | ) | ||||||||
| Net change in unrealized appreciation | 297,660,032 | 628,501,005 | 18,985,161 | |||||||||
| NET REALIZED AND UNREALIZED GAIN ON INVESTMENTS AND FOREIGN CURRENCY TRANSACTIONS | 400,928,641 | 706,545,174 | 21,001,513 | |||||||||
| NET INCREASE IN NET ASSETS RESULTING FROM OPERATIONS | $ | 400,607,350 | $ | 710,865,604 | $ | 20,861,490 | ||||||
See Notes to Financial Statements.
| Annual Report | April 30, 2021 | 75 |
| Grandeur Peak Emerging Markets Opportunities Fund | Statements of Changes in Net Assets |
For the Year Ended April 30, 2021 | For the Year Ended April 30, 2020 | |||||||
| OPERATIONS | ||||||||
| Net investment income/(loss) | $ | (1,404,176 | ) | $ | 1,293,698 | |||
| Net realized gain/(loss) | 46,750,517 | (888,857 | ) | |||||
| Net change in unrealized appreciation/(depreciation) | 182,572,895 | (27,811,796 | ) | |||||
| Net increase/(decrease) in net assets resulting from operations | 227,919,236 | (27,406,955 | ) | |||||
| DISTRIBUTIONS TO SHAREHOLDERS (NOTE 3) | ||||||||
| Investor Class | (2,571 | ) | (8,164 | ) | ||||
| Institutional Class | (794,820 | ) | (986,840 | ) | ||||
| Net decrease in net assets from distributions | (797,391 | ) | (995,004 | ) | ||||
| CAPITAL SHARE TRANSACTIONS (NOTE 5) | ||||||||
| Investor Class | ||||||||
| Proceeds from sales of shares | 1,984,236 | 451,669 | ||||||
| Distributions reinvested | 2,543 | 8,003 | ||||||
| Cost of shares redeemed | (2,636,891 | ) | (3,475,235 | ) | ||||
| Redemption fees | 485 | – | ||||||
| Net decrease from capital shares transactions | (649,627 | ) | (3,015,563 | ) | ||||
| Institutional Class | ||||||||
| Proceeds from sales of shares | 110,127,902 | 67,811,609 | ||||||
| Distributions reinvested | 730,183 | 920,902 | ||||||
| Cost of shares redeemed | (98,220,322 | ) | (104,284,799 | ) | ||||
| Redemption fees | 9,739 | 850 | ||||||
| Net increase/(decrease) from capital shares transactions | 12,647,502 | (35,551,438 | ) | |||||
| Net increase/(decrease) in net assets | 239,119,720 | (66,968,960 | ) | |||||
| NET ASSETS | ||||||||
| Beginning of year | 399,429,616 | 466,398,576 | ||||||
| End of year | $ | 638,549,336 | $ | 399,429,616 | ||||
| OTHER INFORMATION | ||||||||
| Shares Transactions | ||||||||
| Investor Class | ||||||||
| Issued | 122,035 | 40,303 | ||||||
| Issued to shareholders in reinvestment of distributions | 156 | 631 | ||||||
| Redeemed | (182,150 | ) | (306,328 | ) | ||||
| Net decrease in share transactions | (59,959 | ) | (265,394 | ) | ||||
| Institutional Class | ||||||||
| Issued | 6,753,337 | 5,981,655 | ||||||
| Issued to shareholders in reinvestment of distributions | 44,496 | 72,228 | ||||||
| Redeemed | (6,761,873 | ) | (9,192,424 | ) | ||||
| Net increase/(decrease) in share transactions | 35,960 | (3,138,541 | ) | |||||
See Notes to Financial Statements.
| 76 | 1.855.377.7325 | www.GrandeurPeakGlobal.com |
| Grandeur Peak Global Contrarian Fund | Statements of Changes in Net Assets |
For the Year Ended April 30, 2021 | For the Period September 18, 2019 (Commencement of Operations) to April 30, 2020 | |||||||
| OPERATIONS | ||||||||
| Net investment income | $ | 401,180 | $ | 43,887 | ||||
| Net realized gain/(loss) | 3,087,368 | (524,050 | ) | |||||
| Net change in unrealized appreciation/(depreciation) | 7,660,143 | (1,000,272 | ) | |||||
| Net increase/(decrease) in net assets resulting from operations | 11,148,691 | (1,480,435 | ) | |||||
| DISTRIBUTIONS TO SHAREHOLDERS (NOTE 3) | ||||||||
| Institutional Class | (409,394 | ) | (19,023 | ) | ||||
| Net decrease in net assets from distributions | (409,394 | ) | (19,023 | ) | ||||
| CAPITAL SHARE TRANSACTIONS (NOTE 5) | ||||||||
| Institutional Class | ||||||||
| Proceeds from sales of shares | 31,456,092 | 12,724,690 | ||||||
| Distributions reinvested | 403,668 | 18,940 | ||||||
| Cost of shares redeemed | (2,063,549 | ) | (2,384,958 | ) | ||||
| Redemption fees | 6,119 | 2,203 | ||||||
| Net increase from capital shares transactions | 29,802,330 | 10,360,875 | ||||||
| Net increase in net assets | 40,541,627 | 8,861,417 | ||||||
| NET ASSETS | ||||||||
| Beginning of year | 8,861,417 | – | ||||||
| End of year | $ | 49,403,044 | $ | 8,861,417 | ||||
| OTHER INFORMATION | ||||||||
| Shares Transactions | ||||||||
| Institutional Class | ||||||||
| Issued | 2,350,442 | 1,260,722 | ||||||
| Issued to shareholders in reinvestment of distributions | 30,237 | 1,747 | ||||||
| Redeemed | (184,812 | ) | (253,144 | ) | ||||
| Net increase in share transactions | 2,195,867 | 1,009,325 | ||||||
See Notes to Financial Statements.
| Annual Report | April 30, 2021 | 77 |
| Grandeur Peak Global Micro Cap Fund | Statements of Changes in Net Assets |
For the Year Ended April 30, 2021 | For the Year Ended April 30, 2020 | |||||||
| OPERATIONS | ||||||||
| Net investment income/(loss) | $ | (293,387 | ) | $ | 29,619 | |||
| Net realized gain | 8,082,924 | 711,242 | ||||||
| Net change in unrealized appreciation/(depreciation) | 23,350,176 | (1,056,838 | ) | |||||
| Net increase/(decrease) in net assets resulting from operations | 31,139,713 | (315,977 | ) | |||||
| DISTRIBUTIONS TO SHAREHOLDERS (NOTE 3) | ||||||||
| Institutional Class | (4,057,924 | ) | (250,282 | ) | ||||
| Net decrease in net assets from distributions | (4,057,924 | ) | (250,282 | ) | ||||
| CAPITAL SHARE TRANSACTIONS (NOTE 5) | ||||||||
| Institutional Class | ||||||||
| Proceeds from sales of shares | 13,038,427 | 2,296,880 | ||||||
| Distributions reinvested | 3,771,469 | 235,712 | ||||||
| Cost of shares redeemed | (3,150,855 | ) | (7,986,889 | ) | ||||
| Redemption fees | – | 2 | ||||||
| Net increase/(decrease) from capital shares transactions | 13,659,041 | (5,454,295 | ) | |||||
| Net increase/(decrease) in net assets | 40,740,830 | (6,020,554 | ) | |||||
| NET ASSETS | ||||||||
| Beginning of year | 29,633,927 | 35,654,481 | ||||||
| End of year | $ | 70,374,757 | $ | 29,633,927 | ||||
| OTHER INFORMATION | ||||||||
| Shares Transactions | ||||||||
| Institutional Class | ||||||||
| Issued | 706,934 | 217,579 | ||||||
| Issued to shareholders in reinvestment of distributions | 213,802 | 18,872 | ||||||
| Redeemed | (195,217 | ) | (706,293 | ) | ||||
| Net increase/(decrease) in share transactions | 725,519 | (469,842 | ) | |||||
See Notes to Financial Statements.
| 78 | 1.855.377.7325 | www.GrandeurPeakGlobal.com |
| Grandeur Peak Global Opportunities Fund | Statements of Changes in Net Assets |
For the Year Ended April 30, 2021 | For the Year Ended April 30, 2020 | |||||||
| OPERATIONS | ||||||||
| Net investment income/(loss) | $ | (934,355 | ) | $ | 78,438 | |||
| Net realized gain | 168,229,592 | 26,694,598 | ||||||
| Net change in unrealized appreciation/(depreciation) | 299,109,843 | (44,213,439 | ) | |||||
| Net increase/(decrease) in net assets resulting from operations | 466,405,080 | (17,440,403 | ) | |||||
| DISTRIBUTIONS TO SHAREHOLDERS (NOTE 3) | ||||||||
| Investor Class | (9,200,642 | ) | (6,708,303 | ) | ||||
| Institutional Class | (54,763,378 | ) | (30,103,204 | ) | ||||
| Net decrease in net assets from distributions | (63,964,020 | ) | (36,811,507 | ) | ||||
| CAPITAL SHARE TRANSACTIONS (NOTE 5) | ||||||||
| Investor Class | ||||||||
| Proceeds from sales of shares | 13,573,747 | 7,454,239 | ||||||
| Distributions reinvested | 8,906,996 | 6,371,304 | ||||||
| Cost of shares redeemed | (43,809,498 | ) | (41,539,676 | ) | ||||
| Redemption fees | 581 | 754 | ||||||
| Net decrease from capital shares transactions | (21,328,174 | ) | (27,713,379 | ) | ||||
| Institutional Class | ||||||||
| Proceeds from sales of shares | 105,694,563 | 65,579,216 | ||||||
| Distributions reinvested | 50,942,882 | 28,060,062 | ||||||
| Cost of shares redeemed | (79,175,222 | ) | (103,299,952 | ) | ||||
| Redemption fees | 1,131 | 4,046 | ||||||
| Net increase/(decrease) from capital shares transactions | 77,463,354 | (9,656,628 | ) | |||||
| Net increase/(decrease) in net assets | 458,576,240 | (91,621,917 | ) | |||||
| NET ASSETS | ||||||||
| Beginning of year | 562,985,513 | 654,607,430 | ||||||
| End of year | $ | 1,021,561,753 | $ | 562,985,513 | ||||
| OTHER INFORMATION | ||||||||
| Shares Transactions | ||||||||
| Investor Class | ||||||||
| Issued | 2,966,817 | 2,224,286 | ||||||
| Issued to shareholders in reinvestment of distributions | 1,840,288 | 1,750,358 | ||||||
| Redeemed | (9,575,738 | ) | (12,872,148 | ) | ||||
| Net decrease in share transactions | (4,768,633 | ) | (8,897,504 | ) | ||||
| Institutional Class | ||||||||
| Issued | 22,648,748 | 19,482,616 | ||||||
| Issued to shareholders in reinvestment of distributions | 10,333,242 | 7,604,353 | ||||||
| Redeemed | (17,308,856 | ) | (32,775,945 | ) | ||||
| Net increase/(decrease) in share transactions | 15,673,134 | (5,688,976 | ) | |||||
See Notes to Financial Statements.
| Annual Report | April 30, 2021 | 79 |
| Grandeur Peak Global Reach Fund | Statements of Changes in Net Assets |
For the Year Ended April 30, 2021 | For the Year Ended April 30, 2020 | |||||||
| OPERATIONS | ||||||||
| Net investment income/(loss) | $ | (558,805 | ) | $ | 490,829 | |||
| Net realized gain | 61,926,416 | 10,535,989 | ||||||
| Net change in unrealized appreciation/(depreciation) | 109,192,289 | (15,663,042 | ) | |||||
| Net increase/(decrease) in net assets resulting from operations | 170,559,900 | (4,636,224 | ) | |||||
| DISTRIBUTIONS TO SHAREHOLDERS (NOTE 3) | ||||||||
| Investor Class | (4,512,695 | ) | (1,188,362 | ) | ||||
| Institutional Class | (21,062,660 | ) | (6,944,162 | ) | ||||
| Net decrease in net assets from distributions | (25,575,355 | ) | (8,132,524 | ) | ||||
| CAPITAL SHARE TRANSACTIONS (NOTE 5) | ||||||||
| Investor Class | ||||||||
| Proceeds from sales of shares | 5,613,392 | 7,664,510 | ||||||
| Distributions reinvested | 4,404,465 | 1,160,085 | ||||||
| Cost of shares redeemed | (15,781,767 | ) | (24,000,795 | ) | ||||
| Redemption fees | 922 | 243 | ||||||
| Net decrease from capital shares transactions | (5,762,988 | ) | (15,175,957 | ) | ||||
| Institutional Class | ||||||||
| Proceeds from sales of shares | 33,269,428 | 30,887,024 | ||||||
| Distributions reinvested | 17,988,818 | 6,260,838 | ||||||
| Cost of shares redeemed | (54,802,889 | ) | (96,958,918 | ) | ||||
| Redemption fees | 20,130 | 1,537 | ||||||
| Net decrease from capital shares transactions | (3,524,513 | ) | (59,809,519 | ) | ||||
| Net increase/(decrease) in net assets | 135,697,044 | (87,754,224 | ) | |||||
| NET ASSETS | ||||||||
| Beginning of year | 241,295,647 | 329,049,871 | ||||||
| End of year | $ | 376,992,691 | $ | 241,295,647 | ||||
| OTHER INFORMATION | ||||||||
| Shares Transactions | ||||||||
| Investor Class | ||||||||
| Issued | 274,610 | 602,908 | ||||||
| Issued to shareholders in reinvestment of distributions | 212,776 | 72,733 | ||||||
| Redeemed | (787,437 | ) | (1,579,288 | ) | ||||
| Net decrease in share transactions | (300,051 | ) | (903,647 | ) | ||||
| Institutional Class | ||||||||
| Issued | 1,595,452 | 2,095,909 | ||||||
| Issued to shareholders in reinvestment of distributions | 864,016 | 391,058 | ||||||
| Redeemed | (2,989,136 | ) | (6,457,674 | ) | ||||
| Net decrease in share transactions | (529,668 | ) | (3,970,707 | ) | ||||
See Notes to Financial Statements.
| 80 | 1.855.377.7325 | www.GrandeurPeakGlobal.com |
| Statements of | |
| Grandeur Peak Global Stalwarts Fund | Changes in Net Assets |
| For the Year Ended April 30, 2021 | For the Year Ended April 30, 2020 | |||||||
| OPERATIONS | ||||||||
| Net investment income/(loss) | $ | (111,391 | ) | $ | 97,454 | |||
| Net realized gain/(loss) | 36,550,876 | (253,222 | ) | |||||
| Net change in unrealized appreciation/(depreciation) | 103,499,300 | (1,536,586 | ) | |||||
| Net increase/(decrease) in net assets resulting from operations | 139,938,785 | (1,692,354 | ) | |||||
| DISTRIBUTIONS TO SHAREHOLDERS (NOTE 3) | ||||||||
| Investor Class | (2,718,511 | ) | (1,469,313 | ) | ||||
| Institutional Class | (6,931,888 | ) | (1,886,642 | ) | ||||
| Net decrease in net assets from distributions | (9,650,399 | ) | (3,355,955 | ) | ||||
| CAPITAL SHARE TRANSACTIONS (NOTE 5) | ||||||||
| Investor Class | ||||||||
| Proceeds from sales of shares | 27,358,183 | 18,760,212 | ||||||
| Distributions reinvested | 2,592,184 | 1,431,115 | ||||||
| Cost of shares redeemed | (57,966,121 | ) | (22,089,480 | ) | ||||
| Redemption fees | 6,566 | 5,329 | ||||||
| Net decrease from capital shares transactions | (28,009,188 | ) | (1,892,824 | ) | ||||
| Institutional Class | ||||||||
| Proceeds from sales of shares | 94,505,187 | 38,109,836 | ||||||
| Distributions reinvested | 6,307,636 | 1,647,207 | ||||||
| Cost of shares redeemed | (40,407,995 | ) | (27,260,248 | ) | ||||
| Redemption fees | 6,702 | 20,718 | ||||||
| Net increase from capital shares transactions | 60,411,530 | 12,517,513 | ||||||
| Net increase in net assets | 162,690,728 | 5,576,380 | ||||||
| NET ASSETS | ||||||||
| Beginning of year | 204,910,467 | 199,334,087 | ||||||
| End of year | $ | 367,601,195 | $ | 204,910,467 | ||||
| OTHER INFORMATION | ||||||||
| Shares Transactions | ||||||||
| Investor Class | ||||||||
| Issued | 1,379,187 | 1,356,611 | ||||||
| Issued to shareholders in reinvestment of distributions | 122,043 | 90,922 | ||||||
| Redeemed | (3,017,181 | ) | (1,559,169 | ) | ||||
| Net decrease in share transactions | (1,515,951 | ) | (111,636 | ) | ||||
| Institutional Class | ||||||||
| Issued | 4,690,459 | 2,855,814 | ||||||
| Issued to shareholders in reinvestment of distributions | 294,199 | 103,990 | ||||||
| Redeemed | (2,087,109 | ) | (1,932,732 | ) | ||||
| Net increase in share transactions | 2,897,549 | 1,027,072 | ||||||
| See Notes to Financial Statements. |
| Annual Report | April 30, 2021 | 81 |
| Statements of | |
| Grandeur Peak International Opportunities Fund | Changes in Net Assets |
| For the Year Ended April 30, 2021 | For the Year Ended April 30, 2020 | |||||||
| OPERATIONS | ||||||||
| Net investment income/(loss) | $ | (321,291 | ) | $ | 1,396,777 | |||
| Net realized gain | 103,268,609 | 18,565,541 | ||||||
| Net change in unrealized appreciation/(depreciation) | 297,660,032 | (59,862,701 | ) | |||||
| Net increase/(decrease) in net assets resulting from operations | 400,607,350 | (39,900,383 | ) | |||||
| DISTRIBUTIONS TO SHAREHOLDERS (NOTE 3) | ||||||||
| Investor Class | (1,935,548 | ) | (1,839,214 | ) | ||||
| Institutional Class | (27,434,147 | ) | (22,483,478 | ) | ||||
| Net decrease in net assets from distributions | (29,369,695 | ) | (24,322,692 | ) | ||||
| CAPITAL SHARE TRANSACTIONS (NOTE 5) | ||||||||
| Investor Class | ||||||||
| Proceeds from sales of shares | 12,647,959 | 4,655,083 | ||||||
| Distributions reinvested | 1,833,688 | 1,750,795 | ||||||
| Cost of shares redeemed | (14,427,792 | ) | (17,993,458 | ) | ||||
| Redemption fees | 3,332 | 2,029 | ||||||
| Net increase/(decrease) from capital shares transactions | 57,187 | (11,585,551 | ) | |||||
| Institutional Class | ||||||||
| Proceeds from sales of shares | 159,401,438 | 66,126,881 | ||||||
| Distributions reinvested | 25,008,654 | 20,460,565 | ||||||
| Cost of shares redeemed | (97,776,649 | ) | (206,920,088 | ) | ||||
| Redemption fees | 740 | 1,152 | ||||||
| Net increase/(decrease) from capital shares transactions | 86,634,183 | (120,331,490 | ) | |||||
| Net increase/(decrease) in net assets | 457,929,025 | (196,140,116 | ) | |||||
| NET ASSETS | ||||||||
| Beginning of year | 515,171,519 | 711,311,635 | ||||||
| End of year | $ | 973,100,544 | $ | 515,171,519 | ||||
| OTHER INFORMATION | ||||||||
| Shares Transactions | ||||||||
| Investor Class | ||||||||
| Issued | 2,822,461 | 1,502,144 | ||||||
| Issued to shareholders in reinvestment of distributions | 395,191 | 495,976 | ||||||
| Redeemed | (3,455,829 | ) | (5,810,441 | ) | ||||
| Net decrease in share transactions | (238,177 | ) | (3,812,321 | ) | ||||
| Institutional Class | �� | |||||||
| Issued | 36,023,156 | 21,300,368 | ||||||
| Issued to shareholders in reinvestment of distributions | 5,355,172 | 5,763,539 | ||||||
| Redeemed | (22,601,463 | ) | (67,024,606 | ) | ||||
| Net increase/(decrease) in share transactions | 18,776,865 | (39,960,699 | ) | |||||
| See Notes to Financial Statements. |
| 82 | 1.855.377.7325 | www.GrandeurPeakGlobal.com |
| Statements of | |
| Grandeur Peak International Stalwarts Fund | Changes in Net Assets |
| For the Year Ended April 30, 2021 | For the Year Ended April 30, 2020 | |||||||
| OPERATIONS | ||||||||
| Net investment income | $ | 4,320,430 | $ | 2,199,658 | ||||
| Net realized gain/(loss) | 78,044,169 | (9,198,168 | ) | |||||
| Net change in unrealized appreciation/(depreciation) | 628,501,005 | (14,970,807 | ) | |||||
| Net increase/(decrease) in net assets resulting from operations | 710,865,604 | (21,969,317 | ) | |||||
| DISTRIBUTIONS TO SHAREHOLDERS (NOTE 3) | ||||||||
| Investor Class | (134,760 | ) | (122,186 | ) | ||||
| Institutional Class | (5,483,373 | ) | (1,992,693 | ) | ||||
| Net decrease in net assets from distributions | (5,618,133 | ) | (2,114,879 | ) | ||||
| CAPITAL SHARE TRANSACTIONS (NOTE 5) | ||||||||
| Investor Class | ||||||||
| Proceeds from sales of shares | 25,400,324 | 39,311,307 | ||||||
| Distributions reinvested | 132,026 | 60,668 | ||||||
| Cost of shares redeemed | (84,393,412 | ) | (27,261,155 | ) | ||||
| Redemption fees | 3,667 | 6,267 | ||||||
| Net increase/(decrease) from capital shares transactions | (58,857,395 | ) | 12,117,087 | |||||
| Institutional Class | ||||||||
| Proceeds from sales of shares | 682,871,722 | 470,808,042 | ||||||
| Distributions reinvested | 5,168,335 | 1,834,446 | ||||||
| Cost of shares redeemed | (253,915,683 | ) | (140,807,902 | ) | ||||
| Redemption fees | 10,688 | 34,124 | ||||||
| Net increase from capital shares transactions | 434,135,062 | 331,868,710 | ||||||
| Net increase in net assets | 1,080,525,138 | 319,901,601 | ||||||
| NET ASSETS | ||||||||
| Beginning of year | 953,205,694 | 633,304,093 | ||||||
| End of year | $ | 2,033,730,832 | $ | 953,205,694 | ||||
| OTHER INFORMATION | ||||||||
| Shares Transactions | ||||||||
| Investor Class | ||||||||
| Issued | 1,403,607 | 2,693,314 | ||||||
| Issued to shareholders in reinvestment of distributions | 6,001 | 3,778 | ||||||
| Redeemed | (4,309,298 | ) | (1,896,118 | ) | ||||
| Net increase/(decrease) in share transactions | (2,899,690 | ) | 800,974 | |||||
| Institutional Class | ||||||||
| Issued | 33,619,349 | 31,956,402 | ||||||
| Issued to shareholders in reinvestment of distributions | 233,756 | 113,799 | ||||||
| Redeemed | (12,798,649 | ) | (9,910,143 | ) | ||||
| Net increase in share transactions | 21,054,456 | 22,160,058 | ||||||
| See Notes to Financial Statements. |
| Annual Report | April 30, 2021 | 83 |
| Statements of | |
| Grandeur Peak US Stalwarts Fund | Changes in Net Assets |
| For the Year Ended April 30, 2021 | For the Period March 20, 2020 (Commencement of Operations) to April 30, 2020 | |||||||
| OPERATIONS | ||||||||
| Net investment loss | $ | (140,023 | ) | $ | (3,383 | ) | ||
| Net realized gain | 2,016,352 | 9,572 | ||||||
| Net change in unrealized appreciation | 18,985,161 | 1,481,238 | ||||||
| Net increase in net assets resulting from operations | 20,861,490 | 1,487,427 | ||||||
| DISTRIBUTIONS TO SHAREHOLDERS (NOTE 3) | ||||||||
| Institutional Class | (267,844 | ) | – | |||||
| Net decrease in net assets from distributions | (267,844 | ) | – | |||||
| CAPITAL SHARE TRANSACTIONS (NOTE 5) | ||||||||
| Institutional Class | ||||||||
| Proceeds from sales of shares | 100,478,541 | 7,953,203 | ||||||
| Distributions reinvested | 195,265 | – | ||||||
| Cost of shares redeemed | (4,590,003 | ) | (20,274 | ) | ||||
| Redemption fees | 7,731 | 405 | ||||||
| Net increase from capital shares transactions | 96,091,534 | 7,933,334 | ||||||
| Net increase in net assets | 116,685,180 | 9,420,761 | ||||||
| NET ASSETS | ||||||||
| Beginning of year | 9,420,761 | – | ||||||
| End of year | $ | 126,105,941 | $ | 9,420,761 | ||||
| OTHER INFORMATION | ||||||||
| Shares Transactions | ||||||||
| Institutional Class | ||||||||
| Issued | 5,055,779 | 718,380 | ||||||
| Issued to shareholders in reinvestment of distributions | 9,700 | – | ||||||
| Redeemed | (228,376 | ) | (1,805 | ) | ||||
| Net increase in share transactions | 4,837,103 | 716,575 | ||||||
| See Notes to Financial Statements. |
| 84 | 1.855.377.7325 | www.GrandeurPeakGlobal.com |
| Grandeur Peak Emerging Markets Opportunities Fund | Financial Highlights |
| For a Share Outstanding Throughout the Years Presented |
| Investor Class | Year Ended April 30, 2021 | Year Ended April 30, 2020 | Year Ended April 30, 2019 | Year Ended April 30, 2018 | Year Ended April 30, 2017 | |||||||||||||||
| NET ASSET VALUE, BEGINNING OF PERIOD | $ | 11.07 | $ | 11.82 | $ | 13.05 | $ | 11.55 | $ | 9.82 | ||||||||||
| INCOME FROM INVESTMENT OPERATIONS | ||||||||||||||||||||
| Net investment income/(loss)(a) | (0.08 | ) | 0.01 | 0.01 | 0.03 | 0.02 | ||||||||||||||
| Net realized and unrealized gain/(loss) on investments | 6.71 | (0.75 | ) | (1.13 | ) | 1.47 | 1.75 | |||||||||||||
| Total income/(loss) from investment operations | 6.63 | (0.74 | ) | (1.12 | ) | 1.50 | 1.77 | |||||||||||||
| DISTRIBUTIONS | ||||||||||||||||||||
| From net investment income | (0.00 | )(b) | (0.01 | ) | (0.02 | ) | – | (0.04 | ) | |||||||||||
| From net realized gain on investments | – | – | (0.09 | ) | – | – | ||||||||||||||
| Total distributions | 0.00 | (0.01 | ) | (0.11 | ) | – | (0.04 | ) | ||||||||||||
| REDEMPTION FEES ADDED TO PAID-IN CAPITAL | 0.00 | (b) | – | 0.00 | (b) | – | 0.00 | (b) | ||||||||||||
| INCREASE/DECREASE IN NET ASSET VALUE | 6.63 | (0.75 | ) | (1.23 | ) | 1.50 | 1.73 | |||||||||||||
| NET ASSET VALUE, END OF PERIOD | $ | 17.70 | $ | 11.07 | $ | 11.82 | $ | 13.05 | $ | 11.55 | ||||||||||
| TOTAL RETURN | 59.92 | % | (6.29 | )% | (8.48 | )% | 12.99 | % | 18.08 | % | ||||||||||
| RATIOS AND SUPPLEMENTAL DATA | ||||||||||||||||||||
| Net assets, end of period (in 000s) | $ | 15,011 | $ | 10,056 | $ | 13,869 | $ | 18,668 | $ | 18,074 | ||||||||||
| RATIOS TO AVERAGE NET ASSETS | ||||||||||||||||||||
| Expenses (excluding fees waived/reimbursed by investment advisor) | 1.75 | % | 1.76 | % | 1.77 | % | 1.79 | % | 1.76 | % | ||||||||||
| Expenses (including fees waived/reimbursed by investment advisor) | 1.68 | % | 1.74 | % | 1.76 | % | 1.78 | % | 1.76 | % | ||||||||||
| Net investment income/(loss) | (0.50 | )% | 0.09 | % | 0.11 | % | 0.26 | % | 0.21 | % | ||||||||||
| PORTFOLIO TURNOVER RATE | 35 | % | 24 | % | 34 | % | 33 | % | 42 | % | ||||||||||
| (a) | Per share numbers have been calculated using the average shares method. |
| (b) | Less than $0.005 or ($0.005) per share. |
| See Notes to Financial Statements. |
| Annual Report | April 30, 2021 | 85 |
| Grandeur Peak Emerging Markets Opportunities Fund | Financial Highlights |
| For a Share Outstanding Throughout the Years Presented |
| Institutional Class | Year Ended April 30, 2021 | Year Ended April 30, 2020 | Year Ended April 30, 2019 | Year Ended April 30, 2018 | Year Ended April 30, 2017 | |||||||||||||||
| NET ASSET VALUE, BEGINNING OF PERIOD | $ | 11.14 | $ | 11.88 | $ | 13.12 | $ | 11.60 | $ | 9.85 | ||||||||||
| INCOME FROM INVESTMENT OPERATIONS | ||||||||||||||||||||
| Net investment income/(loss)(a) | (0.04 | ) | 0.04 | 0.03 | 0.06 | 0.04 | ||||||||||||||
| Net realized and unrealized gain/(loss) on investments | 6.76 | (0.75 | ) | (1.14 | ) | 1.48 | 1.77 | |||||||||||||
| Total income/(loss) from investment operations | 6.72 | (0.71 | ) | (1.11 | ) | 1.54 | 1.81 | |||||||||||||
| DISTRIBUTIONS | ||||||||||||||||||||
| From net investment income | (0.01 | ) | (0.03 | ) | (0.04 | ) | (0.02 | ) | (0.06 | ) | ||||||||||
| From net realized gain on investments | (0.02 | ) | – | (0.09 | ) | – | – | |||||||||||||
| Total distributions | (0.03 | ) | (0.03 | ) | (0.13 | ) | (0.02 | ) | (0.06 | ) | ||||||||||
| REDEMPTION FEES ADDED TO PAID-IN CAPITAL | 0.00 | (b) | 0.00 | (b) | 0.00 | (b) | 0.00 | (b) | 0.00 | (b) | ||||||||||
| INCREASE/DECREASE IN NET ASSET VALUE | 6.69 | (0.74 | ) | (1.24 | ) | 1.52 | 1.75 | |||||||||||||
| NET ASSET VALUE, END OF PERIOD | $ | 17.83 | $ | 11.14 | $ | 11.88 | $ | 13.12 | $ | 11.60 | ||||||||||
| TOTAL RETURN | 60.30 | % | (6.03 | )% | (8.32 | )% | 13.24 | % | 18.42 | % | ||||||||||
| RATIOS AND SUPPLEMENTAL DATA | ||||||||||||||||||||
| Net assets, end of period (in 000s) | $ | 623,538 | $ | 389,373 | $ | 452,530 | $ | 471,260 | $ | 398,891 | ||||||||||
| RATIOS TO AVERAGE NET ASSETS | ||||||||||||||||||||
| Expenses (excluding fees waived/reimbursed by investment advisor) | 1.52 | % | 1.53 | % | 1.53 | % | 1.55 | % | 1.55 | % | ||||||||||
| Expenses (including fees waived/reimbursed by investment advisor) | 1.45 | % | 1.51 | % | 1.52 | % | 1.54 | % | 1.55 | % | ||||||||||
| Net investment income/(loss) | (0.27 | )% | 0.29 | % | 0.29 | % | 0.49 | % | 0.35 | % | ||||||||||
| PORTFOLIO TURNOVER RATE | 35 | % | 24 | % | 34 | % | 33 | % | 42 | % | ||||||||||
| (a) | Per share numbers have been calculated using the average shares method. |
| (b) | Less than $0.005 or ($0.005) per share. |
| See Notes to Financial Statements. |
| 86 | 1.855.377.7325 | www.GrandeurPeakGlobal.com |
| Grandeur Peak Global Contrarian Fund | Financial Highlights |
For a Share Outstanding Throughout the Year or Period Presented
| Institutional Class | Year Ended April 30, 2021 | For the Period September 18, 2019 (Commencement of Operations) to April 30, 2020 | ||||||
| NET ASSET VALUE, BEGINNING OF PERIOD | $ | 8.78 | $ | 10.00 | ||||
| INCOME FROM INVESTMENT OPERATIONS | ||||||||
| Net investment income(a) | 0.25 | 0.06 | ||||||
| Net realized and unrealized gain/(loss) on investments | 6.61 | (1.25 | ) | |||||
| Total income/(loss) from investment operations | 6.86 | (1.19 | ) | |||||
| DISTRIBUTIONS | ||||||||
| From net investment income | (0.23 | ) | (0.01 | ) | ||||
| From net realized gain on investments | – | (0.02 | ) | |||||
| Total distributions | (0.23 | ) | (0.03 | ) | ||||
| REDEMPTION FEES ADDED TO PAID-IN CAPITAL | 0.00 | (b) | 0.00 | (b) | ||||
| INCREASE/DECREASE IN NET ASSET VALUE | 6.63 | (1.22 | ) | |||||
| NET ASSET VALUE, END OF PERIOD | $ | 15.41 | $ | 8.78 | ||||
| TOTAL RETURN | 78.51 | % | (11.96 | )%(c) | ||||
| RATIOS AND SUPPLEMENTAL DATA | ||||||||
| Net assets, end of period (in 000s) | $ | 49,403 | $ | 8,861 | ||||
| RATIOS TO AVERAGE NET ASSETS | ||||||||
| Expenses (excluding fees waived/ reimbursed by investment advisor) | 1.87 | % | 4.69 | %(d)(e) | ||||
| Expenses (including fees waived/ reimbursed by investment advisor) | 1.35 | % | 1.35 | %(d)(e) | ||||
| Net investment income | 1.91 | % | 1.05 | %(d) | ||||
| PORTFOLIO TURNOVER RATE | 54 | % | 34 | %(c) | ||||
| (a) | Per share numbers have been calculated using the average shares method. |
| (b) | Less than $0.005 or ($0.005) per share. |
| (c) | Not Annualized. |
| (d) | Annualized. |
| (e) | Expense ratios during startup periods may not be representative of longer term operating periods. |
| See Notes to Financial Statements. |
| Annual Report | April 30, 2021 | 87 |
| Grandeur Peak Global Micro Cap Fund | Financial Highlights |
For a Share Outstanding Throughout the Years Presented
| Institutional Class | Year Ended April 30, 2021 | Year Ended April 30, 2020 | Year Ended April 30, 2019 | Year Ended April 30, 2018 | Year Ended April 30, 2017 | |||||||||||||||
| NET ASSET VALUE, BEGINNING OF PERIOD | $ | 11.05 | $ | 11.31 | $ | 13.12 | $ | 11.98 | $ | 10.38 | ||||||||||
| INCOME FROM INVESTMENT OPERATIONS | ||||||||||||||||||||
| Net investment income/(loss)(a) | (0.10 | ) | 0.01 | (0.01 | ) | (0.00 | )(b) | 0.01 | ||||||||||||
| Net realized and unrealized gain/(loss) on investments | 11.17 | (0.19 | ) | (1.08 | ) | 2.12 | 1.72 | |||||||||||||
| Total income/(loss) from investment operations | 11.07 | (0.18 | ) | (1.09 | ) | 2.12 | 1.73 | |||||||||||||
| DISTRIBUTIONS | ||||||||||||||||||||
| From net investment income | (0.14 | ) | (0.03 | ) | – | (0.06 | ) | (0.02 | ) | |||||||||||
| From net realized gain on investments | (1.33 | ) | (0.05 | ) | (0.72 | ) | (0.92 | ) | (0.11 | ) | ||||||||||
| Total distributions | (1.47 | ) | (0.08 | ) | (0.72 | ) | (0.98 | ) | (0.13 | ) | ||||||||||
| REDEMPTION FEES ADDED TO PAID-IN CAPITAL | – | 0.00 | (b) | 0.00 | (b) | 0.00 | (b) | 0.00 | (b) | |||||||||||
| INCREASE/DECREASE IN NET ASSET VALUE | 9.60 | (0.26 | ) | (1.81 | ) | 1.14 | 1.60 | |||||||||||||
| NET ASSET VALUE, END OF PERIOD | $ | 20.65 | $ | 11.05 | $ | 11.31 | $ | 13.12 | $ | 11.98 | ||||||||||
| TOTAL RETURN | 102.43 | % | (1.62 | )% | (7.67 | )% | 17.68 | % | 16.81 | % | ||||||||||
| RATIOS AND SUPPLEMENTAL DATA | ||||||||||||||||||||
| Net assets, end of period (in 000s) | $ | 70,375 | $ | 29,634 | $ | 35,654 | $ | 41,709 | $ | 36,620 | ||||||||||
| RATIOS TO AVERAGE NET ASSETS | ||||||||||||||||||||
| Expenses (excluding fees waived/ reimbursed by investment advisor) | 2.02 | % | 2.06 | % | 2.05 | % | 2.06 | % | 2.17 | % | ||||||||||
| Expenses (including fees waived/ reimbursed by investment advisor) | 2.00 | % | 2.00 | % | 2.00 | % | 2.00 | % | 2.00 | % | ||||||||||
| Net investment income/(loss) | (0.62 | )% | 0.09 | % | (0.06 | )% | 0.00 | %(c) | 0.11 | % | ||||||||||
| PORTFOLIO TURNOVER RATE | 36 | % | 33 | % | 37 | % | 46 | % | 37 | % | ||||||||||
| (a) | Per share numbers have been calculated using the average shares method. |
| (b) | Less than $0.005 or ($0.005) per share. |
| (c) | Less than 0.005% of average net assets. |
| See Notes to Financial Statements. |
| 88 | 1.855.377.7325 | www.GrandeurPeakGlobal.com |
| Grandeur Peak Global Opportunities Fund | Financial Highlights |
For a Share Outstanding Throughout the Years Presented
| Investor Class | Year Ended April 30, 2021 | Year Ended April 30, 2020 | Year Ended April 30, 2019 | Year Ended April 30, 2018 | Year Ended April 30, 2017 | |||||||||||||||
| NET ASSET VALUE, BEGINNING OF PERIOD | $ | 3.24 | $ | 3.48 | $ | 3.95 | $ | 3.52 | $ | 3.01 | ||||||||||
| INCOME FROM INVESTMENT OPERATIONS | ||||||||||||||||||||
| Net investment income/(loss)(a) | (0.02 | ) | (0.01 | )(b) | (0.00 | )(c) | 0.00 | (c) | (0.00 | )(b)(c) | ||||||||||
| Net realized and unrealized gain/(loss) on investments | 2.66 | (0.03 | ) | (0.14 | ) | 0.65 | 0.51 | |||||||||||||
| Total income/(loss) from investment operations | 2.64 | (0.04 | ) | (0.14 | ) | 0.65 | 0.51 | |||||||||||||
| DISTRIBUTIONS | ||||||||||||||||||||
| From net investment income | (0.00 | )(c) | – | (0.00 | )(c) | – | – | |||||||||||||
| From net realized gain on investments | (0.37 | ) | (0.20 | ) | (0.33 | ) | (0.22 | ) | (0.00 | )(c) | ||||||||||
| Total distributions | (0.37 | ) | (0.20 | ) | (0.33 | ) | (0.22 | ) | (0.00 | )(c) | ||||||||||
| REDEMPTION FEES ADDED TO PAID-IN CAPITAL | 0.00 | (c) | 0.00 | (c) | 0.00 | (c) | 0.00 | (c) | 0.00 | (c) | ||||||||||
| INCREASE/DECREASE IN NET ASSET VALUE | 2.27 | (0.24 | ) | (0.47 | ) | 0.43 | 0.51 | |||||||||||||
| NET ASSET VALUE, END OF PERIOD | $ | 5.51 | $ | 3.24 | $ | 3.48 | $ | 3.95 | $ | 3.52 | ||||||||||
| TOTAL RETURN | 82.94 | % | (1.73 | )% | (1.83 | )% | 18.41 | % | 17.09 | % | ||||||||||
| �� | ||||||||||||||||||||
| RATIOS AND SUPPLEMENTAL DATA | ||||||||||||||||||||
| Net assets, end of period (in 000s) | $ | 131,739 | $ | 92,843 | $ | 130,745 | $ | 188,379 | $ | 166,284 | ||||||||||
| RATIOS TO AVERAGE NET ASSETS | ||||||||||||||||||||
| Expenses (excluding fees waived/ reimbursed by investment advisor) | 1.60 | % | 1.61 | % | 1.61 | % | 1.61 | % | 1.61 | % | ||||||||||
| Expenses (including fees waived/ reimbursed by investment advisor) | 1.51 | % | 1.57 | % | 1.57 | % | 1.55 | % | 1.59 | % | ||||||||||
| Net investment income/(loss) | (0.34 | )% | (0.17 | )% | (0.12 | )% | 0.03 | % | (0.06 | )% | ||||||||||
| PORTFOLIO TURNOVER RATE | 47 | % | 41 | % | 38 | % | 29 | % | 30 | % | ||||||||||
| (a) | Per share numbers have been calculated using the average shares method. |
| (b) | The per share amount does not correspond to activity reflected in the Statement of Operations due to class specific expenses during the period. |
| (c) | Less than $0.005 or ($0.005) per share. |
| See Notes to Financial Statements. |
| Annual Report | April 30, 2021 | 89 |
| Grandeur Peak Global Opportunities Fund | Financial Highlights |
| For a Share Outstanding Throughout the Years Presented |
| Institutional Class | Year Ended April 30, 2021 | Year Ended April 30, 2020 | Year Ended April 30, 2019 | Year Ended April 30, 2018 | Year Ended April 30, 2017 | |||||||||||||||
| NET ASSET VALUE, BEGINNING OF PERIOD | $ | 3.29 | $ | 3.52 | $ | 4.00 | $ | 3.56 | $ | 3.03 | ||||||||||
| INCOME FROM INVESTMENT OPERATIONS | ||||||||||||||||||||
| Net investment income/(loss)(a) | (0.00 | )(b) | 0.00 | (b) | 0.00 | (b) | 0.01 | 0.01 | ||||||||||||
| Net realized and unrealized gain/(loss) on investments | 2.70 | (0.03 | ) | (0.14 | ) | 0.65 | 0.52 | |||||||||||||
| Total income/(loss) from investment operations | 2.70 | (0.03 | ) | (0.14 | ) | 0.66 | 0.53 | |||||||||||||
| DISTRIBUTIONS | ||||||||||||||||||||
| From net investment income | (0.01 | ) | – | (0.01 | ) | (0.00 | )(b) | (0.00 | )(b) | |||||||||||
| From net realized gain on investments | (0.37 | ) | (0.20 | ) | (0.33 | ) | (0.22 | ) | (0.00 | )(b) | ||||||||||
| Total distributions | (0.38 | ) | (0.20 | ) | (0.34 | ) | (0.22 | ) | (0.01 | ) | ||||||||||
| REDEMPTION FEES ADDED TO PAID-IN CAPITAL | 0.00 | (b) | 0.00 | (b) | 0.00 | (b) | 0.00 | (b) | 0.00 | (b) | ||||||||||
| INCREASE/DECREASE IN NET ASSET VALUE | 2.32 | (0.23 | ) | (0.48 | ) | 0.44 | 0.53 | |||||||||||||
| NET ASSET VALUE, END OF PERIOD | $ | 5.61 | $ | 3.29 | $ | 3.52 | $ | 4.00 | $ | 3.56 | ||||||||||
| TOTAL RETURN | 83.44 | % | (1.42 | )% | (1.84 | )% | 18.62 | % | 17.81 | % | ||||||||||
| RATIOS AND SUPPLEMENTAL DATA | ||||||||||||||||||||
| Net assets, end of period (in 000s) | $ | 889,823 | $ | 470,142 | $ | 523,862 | $ | 591,470 | $ | 532,946 | ||||||||||
| RATIOS TO AVERAGE NET ASSETS | ||||||||||||||||||||
| Expenses (excluding fees waived/ reimbursed by investment advisor) | 1.35 | % | 1.37 | % | 1.37 | % | 1.36 | % | 1.37 | % | ||||||||||
| Expenses (including fees waived/ reimbursed by investment advisor) | 1.27 | % | 1.33 | % | 1.33 | % | 1.31 | % | 1.35 | % | ||||||||||
| Net investment income/(loss) | (0.08 | )% | 0.05 | % | 0.13 | % | 0.28 | % | 0.18 | % | ||||||||||
| PORTFOLIO TURNOVER RATE | 47 | % | 41 | % | 38 | % | 29 | % | 30 | % | ||||||||||
| (a) | Per share numbers have been calculated using the average shares method. |
| (b) | Less than $0.005 or ($0.005) per share. |
| See Notes to Financial Statements. |
| 90 | 1.855.377.7325 | www.GrandeurPeakGlobal.com |
| Grandeur Peak Global Reach Fund | Financial Highlights |
For a Share Outstanding Throughout the Years Presented
| Investor Class | Year Ended April 30, 2021 | Year Ended April 30, 2020 | Year Ended April 30, 2019 | Year Ended April 30, 2018 | Year Ended April 30, 2017 | |||||||||||||||
| NET ASSET VALUE, BEGINNING OF PERIOD | $ | 14.12 | $ | 14.98 | $ | 16.97 | $ | 14.52 | $ | 12.31 | ||||||||||
| INCOME FROM INVESTMENT OPERATIONS | ||||||||||||||||||||
| Net investment income/(loss)(a) | (0.07 | ) | (0.01 | )(b) | 0.01 | 0.01 | 0.01 | |||||||||||||
| Net realized and unrealized gain/(loss) on investments | 10.79 | (0.44 | ) | (0.58 | ) | 2.66 | 2.22 | |||||||||||||
| Total income/(loss) from investment operations | 10.72 | (0.45 | ) | (0.57 | ) | 2.67 | 2.23 | |||||||||||||
| DISTRIBUTIONS | ||||||||||||||||||||
| From net investment income | (0.01 | ) | – | (0.00 | )(c) | – | (0.02 | ) | ||||||||||||
| From net realized gain on investments | (1.67 | ) | (0.41 | ) | (1.42 | ) | (0.22 | ) | – | |||||||||||
| Total distributions | (1.68 | ) | (0.41 | ) | (1.42 | ) | (0.22 | ) | (0.02 | ) | ||||||||||
| REDEMPTION FEES ADDED TO PAID-IN CAPITAL | 0.00 | (c) | 0.00 | (c) | 0.00 | (c) | 0.00 | (c) | 0.00 | (c) | ||||||||||
| INCREASE/DECREASE IN NET ASSET VALUE | 9.04 | (0.86 | ) | (1.99 | ) | 2.45 | 2.21 | |||||||||||||
| NET ASSET VALUE, END OF PERIOD | $ | 23.16 | $ | 14.12 | $ | 14.98 | $ | 16.97 | $ | 14.52 | ||||||||||
| TOTAL RETURN | 77.38 | % | (3.31 | )% | (1.61 | )% | 18.44 | % | 18.11 | % | ||||||||||
| RATIOS AND SUPPLEMENTAL DATA | ||||||||||||||||||||
| Net assets, end of period (in 000s) | $ | 59,164 | $ | 40,307 | $ | 56,307 | $ | 65,923 | $ | 67,574 | ||||||||||
| RATIOS TO AVERAGE NET ASSETS | ||||||||||||||||||||
| Expenses (excluding fees waived/reimbursed by investment advisor) | 1.52 | % | 1.52 | % | 1.52 | % | 1.52 | % | 1.52 | % | ||||||||||
| Expenses (including fees waived/reimbursed by investment advisor) | 1.52 | % | 1.52 | % | 1.52 | % | 1.52 | % | 1.52 | % | ||||||||||
| Net investment income/(loss) | (0.38 | )% | (0.04 | )% | 0.05 | % | 0.06 | % | 0.07 | % | ||||||||||
| PORTFOLIO TURNOVER RATE | 41 | % | 32 | % | 50 | % | 43 | % | 42 | % | ||||||||||
| (a) | Per share numbers have been calculated using the average shares method. |
| (b) | The per share amount does not correspond to activity reflected in the Statement of Operations due to class specific expenses during the period. |
| (c) | Less than $0.005 or ($0.005) per share. |
| See Notes to Financial Statements. |
| Annual Report | April 30, 2021 | 91 |
| Grandeur Peak Global Reach Fund | Financial Highlights |
For a Share Outstanding Throughout the Years Presented
| Institutional Class | Year Ended April 30, 2021 | Year Ended April 30, 2020 | Year Ended April 30, 2019 | Year Ended April 30, 2018 | Year Ended April 30, 2017 | |||||||||||||||
| NET ASSET VALUE, BEGINNING OF PERIOD | $ | 14.19 | $ | 15.04 | $ | 17.02 | $ | 14.55 | $ | 12.33 | ||||||||||
| INCOME FROM INVESTMENT OPERATIONS | ||||||||||||||||||||
| Net investment income/(loss)(a) | (0.03 | ) | 0.03 | 0.05 | 0.04 | 0.04 | ||||||||||||||
| Net realized and unrealized gain/(loss) on investments | 10.86 | (0.45 | ) | (0.58 | ) | 2.67 | 2.22 | |||||||||||||
| Total income/(loss) from investment operations | 10.83 | (0.42 | ) | (0.53 | ) | 2.71 | 2.26 | |||||||||||||
| DISTRIBUTIONS | ||||||||||||||||||||
| From net investment income | (0.04 | ) | (0.02 | ) | (0.03 | ) | (0.02 | ) | (0.04 | ) | ||||||||||
| From net realized gain on investments | (1.67 | ) | (0.41 | ) | (1.42 | ) | (0.22 | ) | – | |||||||||||
| Total distributions | (1.71 | ) | (0.43 | ) | (1.45 | ) | (0.24 | ) | (0.04 | ) | ||||||||||
| REDEMPTION FEES ADDED TO PAID-IN CAPITAL | 0.00 | (b) | 0.00 | (b) | 0.00 | (b) | 0.00 | (b) | 0.00 | (b) | ||||||||||
| INCREASE/DECREASE IN NET ASSET VALUE | 9.12 | (0.85 | ) | (1.98 | ) | 2.47 | 2.22 | |||||||||||||
| NET ASSET VALUE, END OF PERIOD | $ | 23.31 | $ | 14.19 | $ | 15.04 | $ | 17.02 | $ | 14.55 | ||||||||||
| TOTAL RETURN | 77.81 | % | (3.09 | )% | (1.33 | )% | 18.69 | % | 18.36 | % | ||||||||||
| RATIOS AND SUPPLEMENTAL DATA | ||||||||||||||||||||
| Net assets, end of period (in 000s) | $ | 317,828 | $ | 200,988 | $ | 272,743 | $ | 302,269 | $ | 258,683 | ||||||||||
| RATIOS TO AVERAGE NET ASSETS | ||||||||||||||||||||
| Expenses (excluding fees waived/reimbursed by investment advisor) | 1.27 | % | 1.27 | % | 1.27 | % | 1.28 | % | 1.29 | % | ||||||||||
| Expenses (including fees waived/reimbursed by investment advisor) | 1.27 | % | 1.27 | % | 1.27 | % | 1.28 | % | 1.29 | % | ||||||||||
| Net investment income/(loss) | (0.14 | )% | 0.21 | % | 0.29 | % | 0.27 | % | 0.28 | % | ||||||||||
| PORTFOLIO TURNOVER RATE | 41 | % | 32 | % | 50 | % | 43 | % | 42 | % | ||||||||||
| (a) | Per share numbers have been calculated using the average shares method. |
| (b) | Less than $0.005 or ($0.005) per share. |
| See Notes to Financial Statements. |
| 92 | 1.855.377.7325 | www.GrandeurPeakGlobal.com |
| Grandeur Peak Global Stalwarts Fund | Financial Highlights |
For a Share Outstanding Throughout the Years Presented
| Investor Class | Year Ended April 30, 2021 | Year Ended April 30, 2020 | Year Ended April 30, 2019 | Year Ended April 30, 2018 | Year Ended April 30, 2017 | |||||||||||||||
| NET ASSET VALUE, BEGINNING OF PERIOD | $ | 14.26 | $ | 14.83 | $ | 15.06 | $ | 12.76 | $ | 10.85 | ||||||||||
| INCOME FROM INVESTMENT OPERATIONS | ||||||||||||||||||||
| Net investment income/(loss)(a) | (0.04 | ) | (0.01 | )(b) | 0.01 | (0.00 | )(c) | (0.03 | ) | |||||||||||
| Net realized and unrealized gain/(loss) on investments | 9.72 | (0.31 | ) | 0.16 | 2.52 | 1.95 | ||||||||||||||
| Total income/(loss) from investment operations | 9.68 | (0.32 | ) | 0.17 | 2.52 | 1.92 | ||||||||||||||
| DISTRIBUTIONS | ||||||||||||||||||||
| From net investment income | – | (0.00 | )(c) | – | – | (0.01 | ) | |||||||||||||
| From net realized gain on investments | (0.68 | ) | (0.25 | ) | (0.40 | ) | (0.22 | ) | – | |||||||||||
| Total distributions | (0.68 | ) | (0.25 | ) | (0.40 | ) | (0.22 | ) | (0.01 | ) | ||||||||||
| REDEMPTION FEES ADDED TO PAID-IN CAPITAL | 0.00 | (c) | 0.00 | (c) | 0.00 | (c) | 0.00 | (c) | 0.00 | (c) | ||||||||||
| INCREASE/DECREASE IN NET ASSET VALUE | 9.00 | (0.57 | ) | (0.23 | ) | 2.30 | 1.91 | |||||||||||||
| NET ASSET VALUE, END OF PERIOD | $ | 23.26 | $ | 14.26 | $ | 14.83 | $ | 15.06 | $ | 12.76 | ||||||||||
| TOTAL RETURN | 68.36 | % | (2.22 | )% | 1.78 | % | 19.79 | % | 17.70 | % | ||||||||||
| RATIOS AND SUPPLEMENTAL DATA | ||||||||||||||||||||
| Net assets, end of period (in 000s) | $ | 103,891 | $ | 85,310 | $ | 90,400 | $ | 92,552 | $ | 61,212 | ||||||||||
| RATIOS TO AVERAGE NET ASSETS | ||||||||||||||||||||
| Expenses (excluding fees waived/ reimbursed by investment advisor) | 1.21 | % | 1.24 | % | 1.27 | % | 1.35 | % | 1.41 | % | ||||||||||
| Expenses (including fees waived/ reimbursed by investment advisor) | 1.21 | % | 1.24 | % | 1.27 | % | 1.35 | % | 1.35 | % | ||||||||||
| Net investment income/(loss) | (0.23 | )% | (0.10 | )% | 0.05 | % | (0.03 | )% | (0.23 | )% | ||||||||||
| PORTFOLIO TURNOVER RATE | 50 | % | 50 | % | 52 | % | 30 | % | 32 | % | ||||||||||
| (a) | Per share numbers have been calculated using the average shares method. |
| (b) | The per share amount does not correspond to activity reflected in the Statement of Operations due to class specific expenses during the period. |
| (c) | Less than $0.005 or ($0.005) per share. |
| See Notes to Financial Statements. |
| Annual Report | April 30, 2021 | 93 |
| Grandeur Peak Global Stalwarts Fund | Financial Highlights |
For a Share Outstanding Throughout the Years Presented
| Institutional Class | Year Ended April 30, 2021 | Year Ended April 30, 2020 | Year Ended April 30, 2019 | Year Ended April 30, 2018 | Year Ended April 30, 2017 | |||||||||||||||
| NET ASSET VALUE, BEGINNING OF PERIOD | $ | 14.37 | $ | 14.93 | $ | 15.14 | $ | 12.79 | $ | 10.87 | ||||||||||
| INCOME FROM INVESTMENT OPERATIONS | ||||||||||||||||||||
| Net investment income(a) | 0.01 | 0.03 | 0.04 | 0.03 | 0.01 | (b) | ||||||||||||||
| Net realized and unrealized gain/(loss) on investments | 9.80 | (0.31 | ) | 0.17 | 2.54 | 1.93 | ||||||||||||||
| Total income/(loss) from investment operations | 9.81 | (0.28 | ) | 0.21 | 2.57 | 1.94 | ||||||||||||||
| DISTRIBUTIONS | ||||||||||||||||||||
| From net investment income | – | (0.03 | ) | (0.02 | ) | – | (0.02 | ) | ||||||||||||
| From net realized gain on investments | (0.68 | ) | (0.25 | ) | (0.40 | ) | (0.22 | ) | – | |||||||||||
| Total distributions | (0.68 | ) | (0.28 | ) | (0.42 | ) | (0.22 | ) | (0.02 | ) | ||||||||||
| REDEMPTION FEES ADDED TO PAID-IN CAPITAL | 0.00 | (c) | 0.00 | (c) | 0.00 | (c) | 0.00 | (c) | 0.00 | (c) | ||||||||||
| INCREASE/DECREASE IN NET ASSET VALUE | 9.13 | (0.56 | ) | (0.21 | ) | 2.35 | 1.92 | |||||||||||||
| NET ASSET VALUE, END OF PERIOD | $ | 23.50 | $ | 14.37 | $ | 14.93 | $ | 15.14 | $ | 12.79 | ||||||||||
| TOTAL RETURN | 68.74 | % | (2.05 | )% | 2.08 | % | 20.14 | % | 17.92 | % | ||||||||||
| RATIOS AND SUPPLEMENTAL DATA | ||||||||||||||||||||
| Net assets, end of period (in 000s) | $ | 263,711 | $ | 119,600 | $ | 108,934 | $ | 95,533 | $ | 47,811 | ||||||||||
| RATIOS TO AVERAGE NET ASSETS | ||||||||||||||||||||
| Expenses (excluding fees waived/ reimbursed by investment advisor) | 0.96 | % | 0.99 | % | 1.02 | % | 1.10 | % | 1.17 | % | ||||||||||
| Expenses (including fees waived/ reimbursed by investment advisor) | 0.96 | % | 0.99 | % | 1.02 | % | 1.10 | % | 1.10 | % | ||||||||||
| Net investment income | 0.06 | % | 0.17 | % | 0.27 | % | 0.24 | % | 0.05 | % | ||||||||||
| PORTFOLIO TURNOVER RATE | 50 | % | 50 | % | 52 | % | 30 | % | 32 | % | ||||||||||
| (a) | Per share numbers have been calculated using the average shares method. |
| (b) | The per share amount does not correspond to activity reflected in the Statement of Operations due to class specific expenses during the period. |
| (c) | Less than $0.005 or ($0.005) per share. |
| See Notes to Financial Statements. |
| 94 | 1.855.377.7325 | www.GrandeurPeakGlobal.com |
| Grandeur Peak International Opportunities Fund | Financial Highlights |
For a Share Outstanding Throughout the Years Presented
| Investor Class | Year Ended April 30, 2021 | Year Ended April 30, 2020 | Year Ended April 30, 2019 | Year Ended April 30, 2018 | Year Ended April 30, 2017 | |||||||||||||||
| NET ASSET VALUE, BEGINNING OF PERIOD | $ | 3.04 | $ | 3.34 | $ | 4.10 | $ | 3.55 | $ | 3.09 | ||||||||||
| INCOME FROM INVESTMENT OPERATIONS | ||||||||||||||||||||
| Net investment income/(loss)(a) | (0.01 | ) | 0.00 | (b) | 0.00 | (b) | 0.01 | 0.01 | ||||||||||||
| Net realized and unrealized gain/(loss) on investments | 2.30 | (0.18 | ) | (0.38 | ) | 0.68 | 0.52 | |||||||||||||
| Total income/(loss) from investment operations | 2.29 | (0.18 | ) | (0.38 | ) | 0.69 | 0.53 | |||||||||||||
| DISTRIBUTIONS | ||||||||||||||||||||
| From net investment income | (0.01 | ) | (0.00 | )(b) | (0.01 | ) | (0.01 | ) | (0.02 | ) | ||||||||||
| From net realized gain on investments | (0.15 | ) | (0.12 | ) | (0.37 | ) | (0.13 | ) | (0.05 | ) | ||||||||||
| Total distributions | (0.16 | ) | (0.12 | ) | (0.38 | ) | (0.14 | ) | (0.07 | ) | ||||||||||
| REDEMPTION FEES ADDED TO PAID-IN CAPITAL | 0.00 | (b) | 0.00 | (b) | 0.00 | (b) | 0.00 | (b) | 0.00 | (b) | ||||||||||
| INCREASE/DECREASE IN NET ASSET VALUE | 2.13 | (0.30 | ) | (0.76 | ) | 0.55 | 0.46 | |||||||||||||
| NET ASSET VALUE, END OF PERIOD | $ | 5.17 | $ | 3.04 | $ | 3.34 | $ | 4.10 | $ | 3.55 | ||||||||||
| TOTAL RETURN | 75.87 | % | (5.79 | )% | (7.40 | )% | 19.30 | % | 17.50 | % | ||||||||||
| RATIOS AND SUPPLEMENTAL DATA | ||||||||||||||||||||
| Net assets, end of period (in 000s) | $ | 69,041 | $ | 41,351 | $ | 58,070 | $ | 78,686 | $ | 78,403 | ||||||||||
| RATIOS TO AVERAGE NET ASSETS | ||||||||||||||||||||
| Expenses (excluding fees waived/ reimbursed by investment advisor) | 1.60 | % | 1.61 | % | 1.62 | % | 1.61 | % | 1.61 | % | ||||||||||
| Expenses (including fees waived/ reimbursed by investment advisor) | 1.53 | % | 1.58 | % | 1.57 | % | 1.55 | % | 1.58 | % | ||||||||||
| Net investment income/(loss) | (0.27 | )% | 0.01 | % | 0.11 | % | 0.31 | % | 0.16 | % | ||||||||||
| PORTFOLIO TURNOVER RATE | 36 | % | 27 | % | 34 | % | 26 | % | 30 | % | ||||||||||
| (a) | Per share numbers have been calculated using the average shares method. |
| (b) | Less than $0.005 or ($0.005) per share. |
| See Notes to Financial Statements. |
| Annual Report | April 30, 2021 | 95 |
| Grandeur Peak International Opportunities Fund | Financial Highlights |
For a Share Outstanding Throughout the Years Presented
| Institutional Class | Year Ended April 30, 2021 | Year Ended April 30, 2020 | Year Ended April 30, 2019 | Year Ended April 30, 2018 | Year Ended April 30, 2017 | |||||||||||||||
| NET ASSET VALUE, BEGINNING OF PERIOD | $ | 3.06 | $ | 3.36 | $ | 4.12 | $ | 3.57 | $ | 3.11 | ||||||||||
| INCOME FROM INVESTMENT OPERATIONS | ||||||||||||||||||||
| Net investment income/(loss)(a) | (0.00 | )(b) | 0.01 | 0.01 | 0.02 | 0.01 | ||||||||||||||
| Net realized and unrealized gain/(loss) on investments | 2.31 | (0.18 | ) | (0.38 | ) | 0.67 | 0.52 | |||||||||||||
| Total income/(loss) from investment operations | 2.31 | (0.17 | ) | (0.37 | ) | 0.69 | 0.53 | |||||||||||||
| DISTRIBUTIONS | ||||||||||||||||||||
| From net investment income | (0.01 | ) | (0.01 | ) | (0.02 | ) | (0.01 | ) | (0.02 | ) | ||||||||||
| From net realized gain on investments | (0.15 | ) | (0.12 | ) | (0.37 | ) | (0.13 | ) | (0.05 | ) | ||||||||||
| Total distributions | (0.16 | ) | (0.13 | ) | (0.39 | ) | (0.14 | ) | (0.07 | ) | ||||||||||
| REDEMPTION FEES ADDED TO PAID-IN CAPITAL | 0.00 | (b) | 0.00 | (b) | 0.00 | (b) | 0.00 | (b) | 0.00 | (b) | ||||||||||
| INCREASE/DECREASE IN NET ASSET VALUE | 2.15 | (0.30 | ) | (0.76 | ) | 0.55 | 0.46 | |||||||||||||
| NET ASSET VALUE, END OF PERIOD | $ | 5.21 | $ | 3.06 | $ | 3.36 | $ | 4.12 | $ | 3.57 | ||||||||||
| TOTAL RETURN | 76.29 | % | (5.60 | )% | (7.19 | )% | 19.38 | % | 17.59 | % | ||||||||||
| RATIOS AND SUPPLEMENTAL DATA | ||||||||||||||||||||
| Net assets, end of period (in 000s) | $ | 904,059 | $ | 473,820 | $ | 653,241 | $ | 813,322 | $ | 698,504 | ||||||||||
| RATIOS TO AVERAGE NET ASSETS | ||||||||||||||||||||
| Expenses (excluding fees waived/ reimbursed by investment advisor) | 1.36 | % | 1.37 | % | 1.37 | % | 1.37 | % | 1.37 | % | ||||||||||
| Expenses (including fees waived/ reimbursed by investment advisor) | 1.28 | % | 1.34 | % | 1.32 | % | 1.30 | % | 1.34 | % | ||||||||||
| Net investment income/(loss) | (0.02 | )% | 0.24 | % | 0.41 | % | 0.54 | % | 0.42 | % | ||||||||||
| PORTFOLIO TURNOVER RATE | 36 | % | 27 | % | 34 | % | 26 | % | 30 | % | ||||||||||
| (a) | Per share numbers have been calculated using the average shares method. |
| (b) | Less than $0.005 or ($0.005) per share. |
See Notes to Financial Statements.
| 96 | 1.855.377.7325 | www.GrandeurPeakGlobal.com |
| Grandeur Peak International Stalwarts Fund | Financial Highlights |
For a Share Outstanding Throughout the Years Presented
| Investor Class | Year Ended April 30, 2021 | Year Ended April 30, 2020 | Year Ended April 30, 2019 | Year Ended April 30, 2018 | Year Ended April 30, 2017 | |||||||||||||||
| NET ASSET VALUE, BEGINNING OF PERIOD | $ | 14.40 | $ | 14.70 | $ | 15.53 | $ | 13.04 | $ | 11.02 | ||||||||||
| INCOME FROM INVESTMENT OPERATIONS | ||||||||||||||||||||
| Net investment income/(loss)(a) | (0.00 | )(b) | 0.01 | 0.04 | 0.05 | 0.02 | ||||||||||||||
| Net realized and unrealized gain/(loss) on investments | 9.70 | (0.29 | ) | (0.53 | ) | 2.62 | 2.03 | |||||||||||||
| Total income/(loss) from investment operations | 9.70 | (0.28 | ) | (0.49 | ) | 2.67 | 2.05 | |||||||||||||
| DISTRIBUTIONS | ||||||||||||||||||||
| From net investment income | – | (0.02 | ) | (0.05 | ) | – | (0.03 | ) | ||||||||||||
| From net realized gain on investments | (0.05 | ) | – | (0.29 | ) | (0.18 | ) | – | ||||||||||||
| Total distributions | (0.05 | ) | (0.02 | ) | (0.34 | ) | (0.18 | ) | (0.03 | ) | ||||||||||
| REDEMPTION FEES ADDED TO PAID-IN CAPITAL | 0.00 | (b) | 0.00 | (b) | 0.00 | (b) | 0.00 | (b) | 0.00 | (b) | ||||||||||
| INCREASE/DECREASE IN NET ASSET VALUE | 9.65 | (0.30 | ) | (0.83 | ) | 2.49 | 2.02 | |||||||||||||
| NET ASSET VALUE, END OF PERIOD | $ | 24.05 | $ | 14.40 | $ | 14.70 | $ | 15.53 | $ | 13.04 | ||||||||||
| TOTAL RETURN | 67.36 | % | (1.91 | )% | (2.69 | )% | 20.50 | % | 18.68 | % | ||||||||||
| RATIOS AND SUPPLEMENTAL DATA | ||||||||||||||||||||
| Net assets, end of period (in 000s) | $ | 67,688 | $ | 82,289 | $ | 72,204 | $ | 52,478 | $ | 31,045 | ||||||||||
| RATIOS TO AVERAGE NET ASSETS | ||||||||||||||||||||
| Expenses (excluding fees waived/ reimbursed by investment advisor) | 1.15 | % | 1.17 | % | 1.19 | % | 1.19 | % | 1.27 | % | ||||||||||
| Expenses (including fees waived/ reimbursed by investment advisor) | 1.15 | % | 1.17 | % | 1.19 | % | 1.19 | % | 1.27 | % | ||||||||||
| Net investment income/(loss) | (0.01 | )% | 0.04 | % | 0.26 | % | 0.33 | % | 0.19 | % | ||||||||||
| PORTFOLIO TURNOVER RATE | 33 | % | 32 | % | 42 | % | 24 | % | 37 | % | ||||||||||
| (a) | Per share numbers have been calculated using the average shares method. |
| (b) | Less than $0.005 or ($0.005) per share. |
See Notes to Financial Statements.
| Annual Report | April 30, 2021 | 97 |
| Grandeur Peak International Stalwarts Fund | Financial Highlights |
For a Share Outstanding Throughout the Years Presented
| Institutional Class | Year Ended April 30, 2021 | Year Ended April 30, 2020 | Year Ended April 30, 2019 | Year Ended April 30, 2018 | Year Ended April 30, 2017 | |||||||||||||||
| NET ASSET VALUE, BEGINNING OF PERIOD | $ | 14.46 | $ | 14.74 | $ | 15.57 | $ | 13.06 | $ | 11.03 | ||||||||||
| INCOME FROM INVESTMENT OPERATIONS | ||||||||||||||||||||
| Net investment income(a) | 0.06 | 0.05 | 0.07 | 0.08 | 0.04 | |||||||||||||||
| Net realized and unrealized gain/(loss) on investments | 9.75 | (0.29 | ) | (0.54 | ) | 2.63 | 2.04 | |||||||||||||
| Total income/(loss) from investment operations | 9.81 | (0.24 | ) | (0.47 | ) | 2.71 | 2.08 | |||||||||||||
| DISTRIBUTIONS | ||||||||||||||||||||
| From net investment income | (0.03 | ) | (0.04 | ) | (0.07 | ) | (0.02 | ) | (0.05 | ) | ||||||||||
| From net realized gain on investments | (0.05 | ) | – | (0.29 | ) | (0.18 | ) | – | ||||||||||||
| Total distributions | (0.08 | ) | (0.04 | ) | (0.36 | ) | (0.20 | ) | (0.05 | ) | ||||||||||
| REDEMPTION FEES ADDED TO PAID-IN CAPITAL | 0.00 | (b) | 0.00 | (b) | 0.00 | (b) | 0.00 | (b) | 0.00 | (b) | ||||||||||
| INCREASE/DECREASE IN NET ASSET VALUE | 9.73 | (0.28 | ) | (0.83 | ) | 2.51 | 2.03 | |||||||||||||
| NET ASSET VALUE, END OF PERIOD | $ | 24.19 | $ | 14.46 | $ | 14.74 | $ | 15.57 | $ | 13.06 | ||||||||||
| TOTAL RETURN | 67.84 | % | (1.63 | )% | (2.50 | )% | 20.79 | % | 18.96 | % | ||||||||||
| RATIOS AND SUPPLEMENTAL DATA | ||||||||||||||||||||
| Net assets, end of period (in 000s) | $ | 1,966,043 | $ | 870,916 | $ | 561,100 | $ | 496,358 | $ | 265,393 | ||||||||||
| RATIOS TO AVERAGE NET ASSETS | ||||||||||||||||||||
| Expenses (excluding fees waived/ reimbursed by investment advisor) | 0.90 | % | 0.92 | % | 0.94 | % | 0.94 | % | 1.02 | % | ||||||||||
| Expenses (including fees waived/ reimbursed by investment advisor) | 0.90 | % | 0.92 | % | 0.94 | % | 0.94 | % | 1.02 | % | ||||||||||
| Net investment income | 0.31 | % | 0.32 | % | 0.51 | % | 0.57 | % | 0.37 | % | ||||||||||
| PORTFOLIO TURNOVER RATE | 33 | % | 32 | % | 42 | % | 24 | % | 37 | % | ||||||||||
| (a) | Per share numbers have been calculated using the average shares method. |
| (b) | Less than $0.005 or ($0.005) per share. |
See Notes to Financial Statements.
| 98 | 1.855.377.7325 | www.GrandeurPeakGlobal.com |
| Grandeur Peak US Stalwarts Fund | Financial Highlights |
For a Share Outstanding Throughout the Year or Period Presented
| Institutional Class | Year Ended April 30, 2021 | For the Period March 20, 2020 (Commencement of Operations) to April 30, 2020 | ||||||
| NET ASSET VALUE, BEGINNING OF PERIOD | $ | 13.15 | $ | 10.00 | ||||
| INCOME FROM INVESTMENT OPERATIONS | ||||||||
| Net investment income/(loss)(a) | (0.06 | ) | (0.01 | ) | ||||
| Net realized and unrealized gain on investments | 9.73 | 3.16 | ||||||
| Total income from investment operations | 9.67 | 3.15 | ||||||
| DISTRIBUTIONS | ||||||||
| From net investment income | (0.00 | )(b) | – | |||||
| From net realized gain on investments | (0.11 | ) | – | |||||
| Total distributions | (0.11 | ) | – | |||||
| REDEMPTION FEES ADDED TO PAID-IN CAPITAL | 0.00 | (b) | 0.00 | (b) | ||||
| INCREASE IN NET ASSET VALUE | 9.56 | 3.15 | ||||||
| NET ASSET VALUE, END OF PERIOD | $ | 22.71 | $ | 13.15 | ||||
| TOTAL RETURN | 73.67 | % | 31.50 | %(c) | ||||
| RATIOS AND SUPPLEMENTAL DATA | ||||||||
| Net assets, end of period (in 000s) | $ | 126,106 | $ | 9,421 | ||||
| RATIOS TO AVERAGE NET ASSETS | ||||||||
| Expenses (excluding fees waived/ reimbursed by investment advisor) | 1.11 | % | 6.23 | %(d)(e) | ||||
| Expenses (including fees waived/ reimbursed by investment advisor) | 1.00 | % | 1.00 | %(d)(e) | ||||
| Net investment income/(loss) | (0.31 | )% | (0.53 | )%(d) | ||||
| PORTFOLIO TURNOVER RATE | 24 | % | 2 | %(c) | ||||
| (a) | Per share numbers have been calculated using the average shares method. |
| (b) | Less than $0.005 or ($0.005) per share. |
| (c) | Not Annualized. |
| (d) | Annualized. |
| (e) | Expense ratios during startup periods may not be representative of longer term operating periods. |
See Notes to Financial Statements.
| Annual Report | April 30, 2021 | 99 |
| Grandeur Peak Funds® | Notes to Financial Statements |
April 30, 2021
1. ORGANIZATION
Financial Investors Trust (the “Trust”), a Delaware statutory trust, is an open-end management investment company registered under the Investment Company Act of 1940, as amended (“1940 Act”). As of April 30, 2021, the Trust consists of multiple separate portfolios or series. This annual report describes the Grandeur Peak Emerging Markets Opportunities Fund, Grandeur Peak Global Contrarian Fund, Grandeur Peak Global Micro Cap Fund, Grandeur Peak Global Opportunities Fund, Grandeur Peak Global Reach Fund, Grandeur Peak Global Stalwarts Fund, Grandeur Peak International Opportunities Fund, Grandeur Peak International Stalwarts Fund and Grandeur Peak US Stalwarts Fund (individually a “Fund” and collectively, the “Funds”). The Funds seek long-term growth of capital. The Funds offer Investor Class (except the Grandeur Peak Global Contrarian Fund, Grandeur Peak Global Micro Cap Fund and Grandeur Peak US Stalwarts Fund) and Institutional Class shares.
2. SIGNIFICANT ACCOUNTING POLICIES
The accompanying financial statements were prepared in accordance with accounting principles generally accepted in the United States of America (“U.S. GAAP”). The preparation of financial statements in conformity with U.S. GAAP requires management to make certain estimates and assumptions that affect the reported amounts of assets and liabilities and disclosures of contingent assets and liabilities at the date of the financial statements and the reported amounts of revenue and expenses during the period. Actual results could differ from those estimates. The Funds are considered an investment company for financial reporting purposes under U.S. GAAP and follows the accounting and reporting guidance applicable to investment companies in the Financial Accounting Standards Board Accounting Standards Codification Topic 946. The following is a summary of significant accounting policies consistently followed by the Funds in preparation of their financial statements.
Investment Valuation: The Funds generally value their securities based on market prices determined at the close of regular trading on the New York Stock Exchange (“NYSE”), normally 4:00 p.m. Eastern Time, on each day the NYSE is open for trading.
For equity securities and mutual funds that are traded on an exchange, the market price is usually the closing sale or official closing price on that exchange. In the case of equity securities not traded on an exchange, or if such closing prices are not otherwise available, the securities are valued at the mean of the most recent bid and ask prices on such day. Redeemable securities issued by open-end registered investment companies are valued at the investment company’s applicable net asset value, with the exception of exchange-traded open-end investment companies, which are priced as equity securities.
Equity securities that are primarily traded on foreign securities exchanges are valued at the closing values of such securities on their respective foreign exchanges, except when an event occurs subsequent to the close of the foreign exchange and the close of the NYSE that was likely to have changed such value. In such an event, the fair value of those securities are determined in good faith through consideration of other factors in accordance with procedures established by and under the general supervision of the Board of Trustees of the Trust (the “Board” or the “Trustees”). The Funds will use a fair valuation model provided by an independent pricing service, which is intended to reflect fair value when a security’s value or a meaningful portion of each Fund’s portfolio is believed to have been materially affected by a valuation event that has occurred between the close of the exchange or market on which the security is traded and the close of the regular trading day on the NYSE. The Funds’ valuation procedures set forth certain triggers which instruct when to use the fair valuation model.
Corporate bonds are valued using market models that consider trade data, quotations from dealers and active market makers, relevant yield curve and spread data, creditworthiness, trade data or market information on comparable securities, and other relevant security specific information.
Forward currency exchange contracts have a fair value determined by the prevailing foreign currency exchange daily rates and current foreign currency exchange forward rates. The foreign currency exchange forward rates are calculated using an automated system that estimates rates on the basis of the current day foreign currency exchange rates and forward foreign currency exchange rates supplied by a pricing service.
When such prices or quotations are not available, or when Grandeur Peak Global Advisors, LLC (the “Adviser” or “Grandeur Peak”) believes that they are unreliable, securities may be priced using fair value procedures approved by the Board.
Fair Value Measurements: The Funds disclose the classification of their fair value measurements following a three-tier hierarchy based on the inputs used to measure fair value. Inputs refer broadly to the assumptions that market participants would use in pricing the asset or liability, including assumptions about risk. Inputs may be observable or unobservable. Observable inputs reflect the assumptions market participants would use in pricing the asset or liability that are developed based on market data obtained from sources independent of the reporting entity. Unobservable inputs reflect the reporting entity’s own assumptions about the assumptions market participants would use in pricing the asset or liability that are developed based on the best information available.
| 100 | 1.855.377.7325 | www.GrandeurPeakGlobal.com |
| Grandeur Peak Funds® | Notes to Financial Statements |
April 30, 2021
Various inputs are used in determining the value of the Funds’ investments as of the end of the reporting period. When inputs used fall into different levels of the fair value hierarchy, the level in the hierarchy within which the fair value measurement falls is determined based on the lowest level input that is significant to the fair value measurement in its entirety. The designated input levels are not necessarily an indication of the risk or liquidity associated with these investments. These inputs are categorized in the following hierarchy under applicable financial accounting standards:
Level 1 – Unadjusted quoted prices in active markets for identical investments, unrestricted assets or liabilities that the Funds have the ability to access at the measurement date;
Level 2 – Quoted prices which are not active, quoted prices for similar assets or liabilities in active markets or inputs other than quoted prices that are observable (either directly or indirectly) for substantially the full term of the asset or liability; and
Level 3 – Significant unobservable prices or inputs (including the Funds’ own assumptions in determining the fair value of investments) where there is little or no market activity for the asset or liability at the measurement date.
The following is a summary of each Fund’s investments in the fair value hierarchy as of April 30, 2021:
| Investments in Securities at Value | Level 1 - Quoted and Unadjusted Prices | Level 2 - Other Significant Observable Inputs | Level 3 - Significant Unobservable Inputs | Total | ||||||||||||
| Grandeur Peak Emerging Markets Opportunities Fund | ||||||||||||||||
| Common Stocks* | $ | 619,889,078 | – | – | $ | 619,889,078 | ||||||||||
| Total | $ | 619,889,078 | $ | – | $ | – | $ | 619,889,078 | ||||||||
| * | For a detailed country breakdown, see the accompanying Portfolio of Investments. |
| Investments in Securities at Value | Level 1 - Quoted and Unadjusted Prices | Level 2 - Other Significant Observable Inputs | Level 3 - Significant Unobservable Inputs | Total | ||||||||||||
| Grandeur Peak Global Contrarian Fund | ||||||||||||||||
| Common Stocks* | $ | 47,985,217 | – | – | $ | 47,985,217 | ||||||||||
| Total | $ | 47,985,217 | $ | – | $ | – | $ | 47,985,217 | ||||||||
| * | For a detailed country breakdown, see the accompanying Portfolio of Investments. |
| Investments in Securities at Value | Level 1 - Quoted and Unadjusted Prices | Level 2 - Other Significant Observable Inputs | Level 3 - Significant Unobservable Inputs | Total | ||||||||||||
| Grandeur Peak Global Micro Cap Fund | ||||||||||||||||
| Common Stocks | ||||||||||||||||
| New Zealand | $ | 240,710 | $ | – | $ | – | $ | 240,710 | ||||||||
| Other* | 69,890,531 | – | – | 69,890,531 | ||||||||||||
| Total | $ | 70,131,241 | $ | – | $ | – | $ | 70,131,241 | ||||||||
| * | For a detailed country breakdown, see the accompanying Portfolio of Investments. |
| Investments in Securities at Value | Level 1 - Quoted and Unadjusted Prices | Level 2 - Other Significant Observable Inputs | Level 3 - Significant Unobservable Inputs | Total | ||||||||||||
| Grandeur Peak Global Opportunities Fund | ||||||||||||||||
| Common Stocks | ||||||||||||||||
| New Zealand | $ | – | $ | – | $ | 1 | $ | 1 | ||||||||
| Other* | 1,015,643,492 | – | – | 1,015,643,492 | ||||||||||||
| Preferred Stocks* | – | – | 4,252,160 | 4,252,160 | ||||||||||||
| Total | $ | 1,015,643,492 | $ | – | $ | 4,252,161 | $ | 1,019,895,653 | ||||||||
| * | For a detailed country breakdown, see the accompanying Portfolio of Investments. |
| Annual Report | April 30, 2021 | 101 |
| Grandeur Peak Funds® | Notes to Financial Statements |
April 30, 2021
| Investments in Securities at Value | Level 1 - Quoted and Unadjusted Prices | Level 2 - Other Significant Observable Inputs | Level 3 - Significant Unobservable Inputs | Total | ||||||||||||
| Grandeur Peak Global Reach Fund | ||||||||||||||||
| Common Stocks | ||||||||||||||||
| New Zealand | $ | 1,568,742 | $ | – | $ | – | $ | 1,568,742 | ||||||||
| Spain | – | – | – | – | ||||||||||||
| United States | 103,098,256 | – | 1,000,000 | 104,098,256 | ||||||||||||
| Other* | 266,927,233 | – | – | 266,927,233 | ||||||||||||
| Preferred Stocks* | – | – | 2,016,652 | 2,016,652 | ||||||||||||
| Total | $ | 371,594,231 | $ | – | $ | 3,016,652 | $ | 374,610,883 | ||||||||
| * | For a detailed country breakdown, see the accompanying Portfolio of Investments. |
| Investments in Securities at Value | Level 1 - Quoted and Unadjusted Prices | Level 2 - Other Significant Observable Inputs | Level 3 -Significant Unobservable Inputs | Total | ||||||||||||
| Grandeur Peak Global Stalwarts Fund | ||||||||||||||||
| Common Stocks | ||||||||||||||||
| United States | $ | 152,051,235 | $ | – | $ | 1,300,000 | $ | 153,351,235 | ||||||||
| Other* | 210,197,652 | – | – | 210,197,652 | ||||||||||||
| Preferred Stocks* | – | – | 1,067,528 | 1,067,528 | ||||||||||||
| Total | $ | 362,248,887 | $ | – | $ | 2,367,528 | $ | 364,616,415 | ||||||||
| * | For a detailed country breakdown, see the accompanying Portfolio of Investments. |
| Investments in Securities at Value | Level 1 - Quoted and Unadjusted Prices | Level 2 - Other Significant Observable Inputs | Level 3 - Significant Unobservable Inputs | Total | ||||||||||||
| Grandeur Peak International Opportunities Fund | ||||||||||||||||
| Common Stocks | ||||||||||||||||
| New Zealand | $ | – | $ | – | $ | 1 | $ | 1 | ||||||||
| Other* | 944,384,144 | – | – | 944,384,144 | ||||||||||||
| Total | $ | 944,384,144 | $ | – | $ | 1 | $ | 944,384,145 | ||||||||
| * | For a detailed country breakdown, see the accompanying Portfolio of Investments. |
| Investments in Securities at Value | Level 1 - Quoted and Unadjusted Prices | Level 2 - Other Significant Observable Inputs | Level 3 - Significant Unobservable Inputs | Total | ||||||||||||
| Grandeur Peak International Stalwarts Fund | ||||||||||||||||
| Common Stocks* | 2,011,489,225 | – | – | 2,011,489,225 | ||||||||||||
| Total | $ | 2,011,489,225 | $ | – | $ | – | $ | 2,011,489,225 | ||||||||
| * | For a detailed country breakdown, see the accompanying Portfolio of Investments. |
| 102 | 1.855.377.7325 | www.GrandeurPeakGlobal.com |
| Grandeur Peak Funds® | Notes to Financial Statements |
April 30, 2021
| Investments in Securities at Value | Level 1 - Quoted and Unadjusted Prices | Level 2 - Other Significant Observable Inputs | Level 3 - Significant Unobservable Inputs | Total | ||||||||||||
| Grandeur Peak US Stalwarts Fund | ||||||||||||||||
| Common Stocks | ||||||||||||||||
| United States | $ | 109,871,553 | $ | – | $ | 700,000 | $ | 110,571,553 | ||||||||
| Other* | 13,961,413 | – | – | 13,961,413 | ||||||||||||
| Total | $ | 123,832,966 | $ | – | $ | 700,000 | $ | 124,532,966 | ||||||||
| * | For a detailed country breakdown, see the accompanying Portfolio of Investments. |
The following is a reconciliation of the investments in which significant unobservable inputs (Level 3) were used in determining fair value:
| Grandeur Peak Emerging Markets Opportunities Fund | Common Stock | Total | ||||||
| Balance as of April 30, 2020 | $ | 7,060 | $ | 7,060 | ||||
| Accrued discount/ premium | – | – | ||||||
| Realized Gain/(Loss) | – | – | ||||||
| Change in Unrealized Appreciation/(Depreciation) | (7,060 | ) | (7,060 | ) | ||||
| Purchases | – | – | ||||||
| Sales Proceeds | – | – | ||||||
| Transfer into Level 3 | – | – | ||||||
| Transfer out of Level 3 | – | – | ||||||
| Balance as of April 30, 2021 | $ | – | $ | – | ||||
| Net change in unrealized appreciation/(depreciation) included in the Statements of Operations attributable to Level 3 investments held at April 30, 2021 | $ | – | $ | – | ||||
| Grandeur Peak Global Micro Cap Fund | Common Stock | Total | ||||||
| Balance as of April 30, 2020 | $ | – | $ | – | ||||
| Accrued discount/ premium | – | – | ||||||
| Realized Gain/(Loss) | – | – | ||||||
| Change in Unrealized Appreciation/(Depreciation) | – | – | ||||||
| Purchases | – | – | ||||||
| Sales Proceeds | – | – | ||||||
| Transfer into Level 3 | – | – | ||||||
| Transfer out of Level 3 | – | |||||||
| Balance as of April 30, 2021 | $ | – | $ | – | ||||
| Net change in unrealized appreciation/(depreciation) included in the Statements of Operations attributable to Level 3 investments held at April 30, 2021 | $ | – | $ | – |
| Annual Report | April 30, 2021 | 103 |
| Grandeur Peak Funds® | Notes to Financial Statements |
April 30, 2021
| Grandeur Peak Global Opportunities Fund | Common Stock | Preferred Stocks | Total | |||||||||
| Balance as of April 30, 2020 | $ | 1 | $ | 2,022,675 | $ | 2,022,676 | ||||||
| Accrued discount/ premium | – | – | – | |||||||||
| Realized Gain/(Loss) | – | – | – | |||||||||
| Change in Unrealized Appreciation/(Depreciation) | – | 2,229,485 | 2,229,485 | |||||||||
| Purchases | – | – | – | |||||||||
| Sales Proceeds | – | – | – | |||||||||
| Transfer into Level 3 | – | – | – | |||||||||
| Transfer out of Level 3 | – | – | – | |||||||||
| Balance as of April 30, 2021 | $ | 1 | $ | 4,252,160 | $ | 4,252,161 | ||||||
| Net change in unrealized appreciation/(depreciation) included in the Statements of Operations attributable to Level 3 investments held at April 30, 2021 | $ | – | $ | 2,329,024 | $ | 2,329,024 | ||||||
| Grandeur Peak Global Reach Fund | Common Stock | Preferred Stocks | Total | |||||||||
| Balance as of April 30, 2020 | $ | – | $ | 959,285 | $ | 959,285 | ||||||
| Accrued discount/ premium | – | – | – | |||||||||
| Realized Gain/(Loss) | – | – | – | |||||||||
| Change in Unrealized Appreciation/(Depreciation) | – | 1,057,367 | 1,057,367 | |||||||||
| Purchases | 1,000,000 | – | 1,000,000 | |||||||||
| Sales Proceeds | – | – | – | |||||||||
| Transfer into Level 3 | – | – | – | |||||||||
| Transfer out of Level 3 | – | – | – | |||||||||
| Balance as of April 30, 2021 | $ | 1,000,000 | $ | 2,016,652 | $ | 3,016,652 | ||||||
| Net change in unrealized appreciation/(depreciation) included in the Statements of Operations attributable to Level 3 investments held at April 30, 2021 | $ | – | $ | 1,104,575 | $ | 1,104,575 | ||||||
| Grandeur Peak Global Stalwarts Fund | Common Stock | Preferred Stocks | Total | |||||||||
| Balance as of April 30, 2020 | $ | – | $ | 507,803 | $ | 507,803 | ||||||
| Accrued discount/ premium | – | – | – | |||||||||
| Realized Gain/(Loss) | – | – | – | |||||||||
| Change in Unrealized Appreciation/(Depreciation) | – | 559,725 | 559,725 | |||||||||
| Purchases | 1,300,000 | – | 1,300,000 | |||||||||
| Sales Proceeds | – | – | – | |||||||||
| Transfer into Level 3 | – | – | – | |||||||||
| Transfer out of Level 3 | – | – | – | |||||||||
| Balance as of April 30, 2021 | $ | 1,300,000 | $ | 1,067,528 | $ | 2,367,528 | ||||||
| Net change in unrealized appreciation/(depreciation) included in the Statements of Operations attributable to Level 3 investments held at April 30, 2021 | $ | – | $ | 584,715 | $ | 584,715 | ||||||
| 104 | 1.855.377.7325 | www.GrandeurPeakGlobal.com |
| Grandeur Peak Funds® | Notes to Financial Statements |
April 30, 2021
| Grandeur Peak International Opportunities Fund | Common Stock | Total | ||||||
| Balance as of April 30, 2020 | $ | 1 | $ | 1 | ||||
| Accrued discount/ premium | – | – | ||||||
| Realized Gain/(Loss) | – | – | ||||||
| Change in Unrealized Appreciation/(Depreciation) | – | – | ||||||
| Purchases | – | – | ||||||
| Sales Proceeds | – | – | ||||||
| Transfer into Level 3 | – | – | ||||||
| Transfer out of Level 3 | – | – | ||||||
| Balance as of April 30, 2021 | $ | 1 | $ | 1 | ||||
| Net change in unrealized appreciation/(depreciation) included in the Statements of Operations attributable to Level 3 investments held at April 30, 2021 | $ | – | $ | – | ||||
| Grandeur Peak US Stalwarts Fund | Common Stock | Total | ||||||
| Balance as of April 30, 2020 | $ | – | $ | – | ||||
| Accrued discount/ premium | – | – | ||||||
| Realized Gain/(Loss) | – | – | ||||||
| Change in Unrealized Appreciation/(Depreciation) | – | – | ||||||
| Purchases | 700,000 | 700,000 | ||||||
| Sales Proceeds | – | – | ||||||
| Transfer into Level 3 | – | – | ||||||
| Transfer out of Level 3 | – | – | ||||||
| Balance as of April 30, 2021 | $ | 700,000 | $ | 700,000 | ||||
| Net change in unrealized appreciation/(depreciation) included in the Statements of Operations attributable to Level 3 investments held at April 30, 2021 | $ | – | $ | – | ||||
Change in unrealized appreciation/depreciation on Level 3 securities is included on the Statements of Operations under Net change in unrealized appreciation/(depreciation) on investments. Realized gain/(loss) on Level 3 securities is included on the Statements of Operations under Net realized gain/(loss) on investments.
The table below provides additional information about the Level 3 Fair Value Measurements as of April 30, 2021:
Quantitative Information about Level 3 Fair Value Measurements
Grandeur Peak Global Opportunities Fund
| Asset Class | Fair Value (USD) at 04/30/2021 | Valuation Technique | Unobservable Inputs(a) | Value/Range |
| Preferred Stocks | $4,252,160 | Market Approach | Enterprise Value-to-Sales Multiple | 16.84x |
Grandeur Peak Global Reach Fund
| Asset Class | Fair Value (USD) at 04/30/2021 | Valuation Technique | Unobservable Inputs(a) | Value/Range |
| Private Investment Funds | $1,000,000 | Cost/Third-Party Valuation | Third-Party Valuation | Cost |
| Preferred Stocks | 2,016,652 | Market Approach | Enterprise Value-to-Sales Multiple | 16.84x |
Grandeur Peak Global Stalwarts Fund
| Asset Class | Fair Value (USD) at 04/30/2021 | Valuation Technique | Unobservable Inputs(a) | Value/Range |
| Private Investment Funds | $1,300,000 | Cost/Third-Party Valuation | Third-Party Valuation | Cost |
| Preferred Stocks | 1,067,528 | Market Approach | Enterprise Value-to-Sales Multiple | 16.84x |
| Annual Report | April 30, 2021 | 105 |
| Grandeur Peak Funds® | Notes to Financial Statements |
April 30, 2021
Grandeur Peak US Stalwarts Fund
| Asset Class | Fair Value (USD) at 04/30/2021 | Valuation Technique | Unobservable Inputs(a) | Value/Range |
| Private Investment Funds | $700,000 | Cost/Third-Party Valuation | Third-Party Valuation | Cost |
| (a) | A change to the unobservable input may result in a significant change to the value of the investment as follows: |
| Unobservable Input | Impact to Value if Input Increases | Impact to Value if Input Decreases |
| Enterprise Value-to-Sales Multiple | Increase | Decrease |
| Third-Party Valuation | Increase | Decrease |
Investment Transactions and Investment Income: Investment transactions are accounted for on the date the investments are purchased or sold (trade date). Realized gains and losses from investment transactions are reported on an identified cost which is the same basis the Fund uses for federal income tax purposes. Interest income, which includes accretion of discounts and amortization of premiums, is accrued and recorded as earned. Dividend income is recognized on the ex-dividend date or for certain foreign securities, as soon as information is available to the Funds. All of the realized and unrealized gains and losses and net investment income, are allocated daily to each class in proportion to its average daily net assets.
Cash Management Transactions: The Funds subscribe to the Brown Brothers Harriman & Co. (“BBH”) Cash Management Service (“CMS”), whereby cash balances are automatically swept into overnight offshore demand deposits with either the BBH Grand Cayman branch or a branch of a pre-approved commercial bank. This fully automated program allows the Funds to earn interest on cash balances. Excess cash with deposit institutions domiciled outside of the U.S. are subject to sovereign actions in the jurisdiction of the deposit institution including, but not limited to, freeze, seizure or diminution. Cash balances in the BBH CMS are included on the Statements of Assets and Liabilities under Cash and Foreign Cash, at Value. As of April 30, 2021, the Funds had the following cash balances participating in the BBH CMS:
| Fund | ||||
| Grandeur Peak Emerging Markets Opportunities Fund | $ | 20,875,908 | ||
| Grandeur Peak Global Contrarian Fund | 1,608,194 | |||
| Grandeur Peak Global Micro Cap Fund | 432,695 | |||
| Grandeur Peak Global Opportunities Fund | 3,436,884 | |||
| Grandeur Peak Global Reach Fund | 2,684,912 | |||
| Grandeur Peak Global Stalwarts Fund | 3,325,090 | |||
| Grandeur Peak International Opportunities Fund | 28,656,864 | |||
| Grandeur Peak International Stalwarts Fund | 23,845,122 | |||
| Grandeur Peak US Stalwarts Fund | 1,778,493 | |||
As of April 30, 2021, the Funds had the following foreign cash balances participating in the BBH CMS (cost and value of foreign cash balances are equal):
| Fund | ||||
| Grandeur Peak Emerging Markets Opportunities Fund | $ | 1 | ||
| Grandeur Peak Global Contrarian Fund | – | |||
| Grandeur Peak Global Micro Cap Fund | 11,025 | |||
| Grandeur Peak Global Opportunities Fund | 62,027 | |||
| Grandeur Peak Global Reach Fund | 17,255 | |||
| Grandeur Peak Global Stalwarts Fund | 11,333 | |||
| Grandeur Peak International Opportunities Fund | 49,149 | |||
| Grandeur Peak International Stalwarts Fund | 101,391 | |||
| Grandeur Peak US Stalwarts Fund | – | |||
Short Sales: The Funds may make short sales of securities consistent with their strategies. A short sale is a transaction in which a Fund sells a security it does not own in anticipation that the market price of that security will decline.
When a Fund makes a short sale, it must borrow the security sold short and deliver it to the broker dealer through which it made the short sale as collateral for its obligation to deliver the security upon conclusion of the sale. The Fund may have to pay a fee to borrow particular securities and is often obligated to pay over any accrued interest and dividends on such borrowed securities.
| 106 | 1.855.377.7325 | www.GrandeurPeakGlobal.com |
| Grandeur Peak Funds® | Notes to Financial Statements |
April 30, 2021
If the price of the security sold short increases between the time of the short sale and the time that a Fund replaces the borrowed security, the Fund will incur a loss; conversely, if the price declines, the Fund will realize a capital gain. Any gain will be decreased, and any loss increased, by the transaction costs described above. The successful use of short selling may be adversely affected by imperfect correlation between movements in the price of the security sold short and the securities being hedged.
To the extent that a Fund engages in short sales, it will provide collateral to the broker-dealer and (except in the case of short sales “against the box”) will maintain additional asset coverage in the form of segregated or “earmarked” assets determined to be liquid in accordance with procedures established by the Board and that is equal to the current market value of the securities sold short, or will ensure that such positions are covered by “offsetting” positions, until the Fund replaces the borrowed security. A short sale is “against the box” to the extent that the Fund contemporaneously owns, or has the right to obtain at no added cost, securities identical to those sold short. The Fund may engage in short selling to the extent permitted by the federal securities laws and rules and interpretations thereunder. To the extent a Fund engages in short selling in foreign (non-U.S.) jurisdictions, the Fund will do so to the extent permitted by the laws and regulations of such jurisdiction.
Foreign Securities: The Funds may directly purchase securities of foreign issuers. Investing in securities of foreign issuers involves special risks not typically associated with investing in securities of U.S. issuers. The risks include possible reevaluation of currencies, the inability to repatriate foreign currency, less complete financial information about companies and possible future adverse political and economic developments. Moreover, securities of many foreign issuers and their markets may be less liquid and their prices more volatile than those of securities of comparable U.S. issuers.
Foreign Currency Translation: The books and records of the Funds are maintained in U.S. dollars. Investment valuations and other assets and liabilities initially expressed in foreign currencies are converted each business day into U.S. dollars based upon current exchange rates. Prevailing foreign exchange rates may generally be obtained at the close of the NYSE (normally, 4:00 p.m. Eastern Time). The portion of realized and unrealized gains or losses on investments due to fluctuations in foreign currency exchange rates is not separately disclosed and is included in realized and unrealized gains or losses on investments, when applicable.
Foreign Currency Spot Contracts: The Funds may enter into foreign currency spot contracts to facilitate transactions in foreign securities or to convert foreign currency receipts into U.S. dollars. A foreign currency spot contract is an agreement between two parties to buy and sell currencies at the current market rate, for settlement generally within two business days. The U.S. dollar value of the contracts is determined using current currency exchange rates supplied by a pricing service.
The contract is marked-to-market daily for settlements beyond one day and any change in market value is recorded as an unrealized gain or loss. When the contract is closed, a realized gain or loss is recorded equal to the difference between the value on the open and close date. Losses may arise from changes in the value of the foreign currency, or if the counterparties do not perform under the contract’s terms. The maximum potential loss from such contracts is the aggregate face value in U.S. dollars at the time the contract was opened.
Special Purpose Vehicle: The Funds may invest in a Special Purpose Vehicle (a “SPV”). A SPV is a separate legal entity created by an organization. The SPV is a distinct company with its own assets and liabilities, as well as its own legal status. Usually, they are created for a specific objective, often to isolate financial risk. As it is a separate legal entity, if the parent company goes bankrupt, the special purpose vehicle can carry on.
Trust Expenses: Some expenses of the Trust can be directly attributed to the Funds. Expenses which cannot be directly attributed to the Funds are apportioned among all funds in the Trust based on average net assets of each fund.
Fund and Class Expenses: Expenses that are specific to a Fund or class of shares of a Fund, including distribution fees (Rule 12b-1 fees), are charged directly to that Fund or share class. Expenses that are common to all Funds generally are allocated among the Funds in proportion to their average daily net assets.
Federal Income Taxes: The Funds comply with the requirements under Subchapter M of the Internal Revenue Code of 1986, as amended, applicable to regulated investment companies and intend to distribute substantially all of their net taxable income and net capital gains, if any, each year so that it will not be subject to excise tax on undistributed income and gains. The Funds are not subject to income taxes to the extent such distributions are made.
As of and during the year ended April 30, 2021, the Funds had a liability for unrecognized capital gains tax. These amounts are disclosed as Foreign Capital Gains Tax on the Statements of Assets and Liabilities. The Funds file U.S. federal, state, and local tax returns as required. The Funds’ tax returns are subject to examination by the relevant tax authorities until expiration of the applicable statute of limitations, which is generally three years after the filing of the tax return for federal purposes and four years for most state returns. Tax returns for open years have incorporated no uncertain tax positions that require a provision for income taxes.
| Annual Report | April 30, 2021 | 107 |
| Grandeur Peak Funds® | Notes to Financial Statements |
April 30, 2021
Distributions to Shareholders: Each Fund normally pays dividends and distributes capital gains, if any, on an annual basis. Income dividend distributions are derived from dividends and other income each Fund receives from their investments, including short term capital gains. Long term capital gain distributions are derived from gains realized when each Fund sells a security it has owned for more than a year. Each Fund may make additional distributions and dividends at other times if the portfolio manager believes doing so may be necessary for each Fund to avoid or reduce taxes. The Funds intend to pass through foreign tax credits to shareholders.
Epidemic and Pandemic Risk: Certain countries have been susceptible to epidemics, most recently COVID-19, which has been designated as a pandemic by world health authorities. The outbreak of such epidemics, together with any resulting restrictions on travel or quarantines imposed, could have a negative impact on the economy and business activity globally (including in the countries in which we invest), and thereby could adversely affect the performance of our investments. Furthermore, the rapid development of epidemics could preclude prediction as to their ultimate adverse impact on economic and market conditions, and, as a result, present material uncertainty and risk with respect to us and the performance of our investments.
Libor Risk: In March 2020, the Financial Accounting Standards Board (FASB) issued Accounting Standards Update (“ASU”) No. 2020-04, Reference Rate Reform (Topic 848): Facilitation of the Effects of Reference Rate Reform on Financial Reporting. The Funds’ investments, payment obligations, and financing terms may be based on floating rates, such as the London Interbank Offered Rate, or “LIBOR,” which is the offered rate for short-term Eurodollar deposits between major international banks. On November 30, 2020, the administrator of LIBOR announced its intention to delay the phase out of the majority of the U.S. dollar LIBOR publications until June 30, 2023, with the remainder of LIBOR publications to still end at the end of 2020.
3. TAX BASIS INFORMATION
Reclassifications: As of April 30, 2021, permanent differences in book and tax accounting were reclassified. These differences had no effect on net assets and are primarily attributed to tax equalization. The reclassifications were as follows:
| Fund | Paid-in Capital | Distributable earnings | ||||||
| Grandeur Peak Emerging Markets Opportunities Fund | $ | 908,610 | $ | (908,610 | ) | |||
| Grandeur Peak Global Contrarian Fund | 18,278 | (18,278 | ) | |||||
| Grandeur Peak Global Micro Cap Fund | 84,819 | (84,819 | ) | |||||
| Grandeur Peak Global Opportunities Fund | 6,259,692 | (6,259,692 | ) | |||||
| Grandeur Peak Global Reach Fund | 2,514,561 | (2,514,561 | ) | |||||
| Grandeur Peak Global Stalwarts Fund | 2,817,294 | (2,817,294 | ) | |||||
| Grandeur Peak International Opportunities Fund | 3,689,131 | (3,689,131 | ) | |||||
| Grandeur Peak International Stalwarts Fund | 3,804,035 | (3,804,035 | ) | |||||
| Grandeur Peak US Stalwarts Fund | 55,230 | (55,230 | ) | |||||
Tax Basis of Investments: As of April 30, 2021, the aggregate cost of investments, gross unrealized appreciation/(depreciation) and net unrealized appreciation/(depreciation) for Federal tax purposes was as follows:
| Fund | Gross Appreciation (excess of value over tax cost) | Gross Depreciation (excess of tax cost over value) | Net Appreciation/ (Depreciation) of Foreign Currency | Net Unrealized Appreciation/ (Depreciation) | Cost of Investments for Income Tax Purposes | |||||||||||||||
| Grandeur Peak Emerging Markets Opportunities Fund | $ | 241,788,096 | $ | (24,738,694 | ) | $ | (4,773,673 | ) | $ | 212,275,729 | $ | 402,839,676 | ||||||||
| Grandeur Peak Global Contrarian Fund | 7,585,826 | (866,694 | ) | (66,358 | ) | 6,652,774 | 41,266,085 | |||||||||||||
| Grandeur Peak Global Micro Cap Fund | 28,286,039 | (1,678,943 | ) | (292,592 | ) | 26,314,504 | 43,524,145 | |||||||||||||
| Grandeur Peak Global Opportunities Fund | 421,928,259 | (15,823,997 | ) | (2,273,634 | ) | 403,830,628 | 613,791,391 | |||||||||||||
| Grandeur Peak Global Reach Fund | 163,965,101 | (8,769,509 | ) | (758,981 | ) | 154,436,611 | 219,415,291 | |||||||||||||
| Grandeur Peak Global Stalwarts Fund | 140,478,431 | (5,298,522 | ) | (509,160 | ) | 134,670,749 | 229,436,506 | |||||||||||||
| Grandeur Peak International Opportunities Fund | 397,023,499 | (19,288,659 | ) | (2,110,972 | ) | 375,623,868 | 566,649,305 | |||||||||||||
| Grandeur Peak International Stalwarts Fund | 731,441,927 | (31,131,038 | ) | (3,696,596 | ) | 696,614,293 | 1,311,178,336 | |||||||||||||
| Grandeur Peak US Stalwarts Fund | 22,236,197 | (1,811,313 | ) | (5 | ) | 20,424,879 | 104,108,082 | |||||||||||||
| 108 | 1.855.377.7325 | www.GrandeurPeakGlobal.com |
| Grandeur Peak Funds® | Notes to Financial Statements |
April 30, 2021
Components of Earnings: As of April 30, 2021, components of distributable earnings on a tax basis were as follows:
| Fund | Undistributed Ordinary Income | Accumulated Capital Gains/(Losses) | Other Accumulated Gain/(Loss) | Net Unrealized Appreciation/ (Depreciation) on Investments and Foreign Currency | Total Distributable Earnings | |||||||||||||||
| Grandeur Peak Emerging Markets Opportunities Fund | $ | – | $ | 34,432,255 | $ | (88,462 | ) | $ | 212,275,729 | $ | 246,619,522 | |||||||||
| Grandeur Peak Global Contrarian Fund | 1,686,392 | 880,802 | 1,593 | 6,652,774 | 9,221,561 | |||||||||||||||
| Grandeur Peak Global Micro Cap Fund | 771,278 | 3,381,427 | – | 26,314,504 | 30,467,209 | |||||||||||||||
| Grandeur Peak Global Opportunities Fund | 13,505,060 | 90,794,975 | 181 | 403,830,628 | 508,130,844 | |||||||||||||||
| Grandeur Peak Global Reach Fund | 5,530,237 | 31,516,413 | 4,767 | 154,436,611 | 191,488,028 | |||||||||||||||
| Grandeur Peak Global Stalwarts Fund | 4,870,113 | 17,761,173 | 1,880 | 134,670,749 | 157,303,915 | |||||||||||||||
| Grandeur Peak International Opportunities Fund | 9,440,901 | 59,100,445 | 3,755 | 375,623,868 | 444,168,969 | |||||||||||||||
| Grandeur Peak International Stalwarts Fund | 2,961,464 | 62,138,698 | 7,005 | 696,614,293 | 761,721,460 | |||||||||||||||
| Grandeur Peak US Stalwarts Fund | 1,620,641 | – | – | 20,424,879 | 22,045,520 | |||||||||||||||
Tax Basis of Distributions to Shareholders: The character of distributions made during the year from net investment income or net realized gains may differ from its ultimate characterization for federal income tax purposes. Also, due to the timing of dividend distributions, the fiscal year in which amounts are distributed may differ from the fiscal year in which the income or realized gain were recorded by the Funds.
The tax character of distributions paid by the Funds for the fiscal year ended April 30, 2021 were as follows:
| Fund | Ordinary Income | Long-Term Capital Gain | ||||||
| Grandeur Peak Emerging Markets Opportunities Fund | $ | 208,905 | $ | 588,486 | ||||
| Grandeur Peak Global Contrarian Fund | 409,394 | – | ||||||
| Grandeur Peak Global Micro Cap Fund | 870,224 | 3,187,700 | ||||||
| Grandeur Peak Global Opportunities Fund | 7,761,520 | 56,202,500 | ||||||
| Grandeur Peak Global Reach Fund | 2,560,410 | 23,014,944 | ||||||
| Grandeur Peak Global Stalwarts Fund | 1,116,972 | 8,533,427 | ||||||
| Grandeur Peak International Opportunities Fund | 3,394,873 | 25,974,822 | ||||||
| Grandeur Peak International Stalwarts Fund | 2,036,831 | 3,581,302 | ||||||
| Grandeur Peak US Stalwarts Fund | 267,443 | 401 | ||||||
The tax character of distributions paid by the Funds for the fiscal year ended April 30, 2020 were as follows:
| Fund | Ordinary Income | Long-Term Capital Gain | ||||||
| Grandeur Peak Emerging Markets Opportunities Fund | $ | 995,004 | $ | – | ||||
| Grandeur Peak Global Contrarian Fund | 19,023 | – | ||||||
| Grandeur Peak Global Micro Cap Fund | 25,741 | 224,541 | ||||||
| Grandeur Peak Global Opportunities Fund | – | 36,811,507 | ||||||
| Grandeur Peak Global Reach Fund | 805,795 | 7,326,729 | ||||||
| Grandeur Peak Global Stalwarts Fund | 179,533 | 3,176,422 | ||||||
| Grandeur Peak International Opportunities Fund | 1,679,453 | 22,643,239 | ||||||
| Grandeur Peak International Stalwarts Fund | 2,114,879 | – | ||||||
| Grandeur Peak US Stalwarts Fund | – | – | ||||||
| Annual Report | April 30, 2021 | 109 |
| Grandeur Peak Funds® | Notes to Financial Statements |
April 30, 2021
The following Funds utilized capital losses carried forward from the prior fiscal year during the year ending April 30, 2021, in the amounts as specified below:
| Fund | Capital Losses Recognized | |||
| Grandeur Peak Emerging Markets Opportunities Fund | $ | 9,299,583 | ||
| Grandeur Peak International Stalwarts Fund | 1,550,827 | |||
The following Funds elect to defer to the period ending April 30, 2022, late year ordinary losses in the amount of:
| Fund | Ordinary Losses Recognized | |||
| Grandeur Peak Emerging Markets Opportunities Fund | $ | 90,862 | ||
4. SECURITIES TRANSACTIONS
The cost of purchases and proceeds from sales of securities (excluding short term securities) during the year ended April 30, 2021 were as follows:
| Fund | Purchases of Securities | Proceeds From Sales of Securities | ||||||
| Grandeur Peak Emerging Markets Opportunities Fund | $ | 172,728,334 | $ | 182,442,719 | ||||
| Grandeur Peak Global Contrarian Fund | 39,768,491 | 11,429,299 | ||||||
| Grandeur Peak Global Micro Cap Fund | 26,529,378 | 16,552,346 | ||||||
| Grandeur Peak Global Opportunities Fund | 365,753,616 | 370,512,393 | ||||||
| Grandeur Peak Global Reach Fund | 122,937,328 | 153,200,491 | ||||||
| Grandeur Peak Global Stalwarts Fund | 161,498,988 | 139,818,851 | ||||||
| Grandeur Peak International Opportunities Fund | 290,263,968 | 261,523,409 | ||||||
| Grandeur Peak International Stalwarts Fund | 856,614,226 | 478,791,827 | ||||||
| Grandeur Peak US Stalwarts Fund | 105,243,527 | 10,821,160 | ||||||
5. SHARES OF BENEFICIAL INTEREST
The capitalization of the Trust consists of an unlimited number of shares of beneficial interest with no par value per share. Holders of the shares of the Funds of the Trust have one vote for each share held and a proportionate fraction of a vote for each fractional share. All shares issued and outstanding are fully paid and are transferable and redeemable at the option of the shareholder. Purchasers of the share do not have any obligation to make payments to the Trust or its creditors solely by reason of the purchasers’ ownership of the shares. Shares have no pre-emptive rights.
Shares redeemed within 60 days of purchase may incur a 2% short-term redemption fee deducted from the redemption amount. For the year ended April 30, 2021 and the year ended April 30, 2020, the redemption fees charged by the Funds are presented in the Statements of Changes in Net Assets.
| 110 | 1.855.377.7325 | www.GrandeurPeakGlobal.com |
| Grandeur Peak Funds® | Notes to Financial Statements |
April 30, 2021
6. MANAGEMENT AND RELATED-PARTY TRANSACTIONS
The Adviser, subject to the authority of the Board, is responsible for the overall management and administration of the Funds’ business affairs. The Adviser manages the investments of the Funds in accordance with the Funds’ investment objective, policies and limitations and investment guidelines established jointly by the Adviser and the Trustees. Pursuant to the Advisory Agreement, (the “Advisory Agreement”), each Fund pays the Adviser an annual management fee based on each Fund’s average daily net assets. The management fee is paid on a monthly basis. The following table reflects the Funds’ advisory fee rates.
| Fund | Advisory Fee |
| Grandeur Peak Emerging Markets Opportunities Fund | 1.35% |
| Grandeur Peak Global Contrarian Fund | 1.00% |
| Grandeur Peak Global Opportunities Fund | 1.25% |
| Grandeur Peak Global Micro Cap Fund | 1.50% |
| Grandeur Peak Global Reach Fund | 1.10% |
| Grandeur Peak Global Stalwarts Fund | 0.80% |
| Grandeur Peak International Opportunities Fund | 1.25% |
| Grandeur Peak International Stalwarts Fund | 0.80% |
| Grandeur Peak US Stalwarts Fund | 0.75% |
The Adviser has contractually agreed to limit certain of each Fund’s expenses (excluding acquired fund fees and expenses, brokerage expenses, interest expenses, taxes and extraordinary expenses). The following table reflects the Funds’ expense cap.
| Fund | Expense Cap | Term of Expense Limit Agreements |
Grandeur Peak Emerging Markets Opportunities Fund | September 1, 2020 – August 31, 2021 / September 1, 2019 – August 31, 2020 | |
| Investor Class | 1.95% | |
| Institutional Class | 1.70% | |
Grandeur Peak Global Contrarian Fund | September 12, 2019 – August 31, 2021 | |
| Institutional Class | 1.35% | |
Grandeur Peak Global Micro Cap Fund | September 1, 2020 – August 31, 2021 / September 1, 2019 – August 31, 2020 | |
| Institutional Class | 2.00% | |
Grandeur Peak Global Opportunities Fund | September 1, 2020 – August 31, 2021 / September 1, 2019 – August 31, 2020 | |
| Investor Class | 1.75% | |
| Institutional Class | 1.50% | |
| Grandeur Peak Global Reach Fund | September 1, 2020 – August 31, 2021 / September 1, 2019 – August 31, 2020 | |
| Investor Class | 1.60% | |
| Institutional Class | 1.35% | |
| Grandeur Peak Global Stalwarts Fund | September 1, 2020 – August 31, 2021 / September 1, 2019 – August 31, 2020 | |
| Investor Class | 1.35% | |
| Institutional Class | 1.10% | |
Grandeur Peak International Opportunities Fund | September 1, 2020 – August 31, 2021 / September 1, 2019 – August 31, 2020 | |
| Investor Class | 1.75% | |
| Institutional Class | 1.50% | |
Grandeur Peak International Stalwarts Fund | September 1, 2020 – August 31, 2021 / September 1, 2019 – August 31, 2020 | |
| Investor Class | 1.35% | |
| Institutional Class | 1.10% | |
| Grandeur Peak US Stalwarts Fund | December 23, 2019 - August 31, 2021 | |
| Institutional Class | 1.00% |
| Annual Report | April 30, 2021 | 111 |
| Grandeur Peak Funds® | Notes to Financial Statements |
April 30, 2021
Pursuant to these agreements, each Fund will reimburse the Adviser for any previous fee waivers and expense reimbursements made by the Adviser, provided that any such reimbursements made by the Funds to the Adviser will not cause the Funds’ expense limitation to exceed expense limitations in existence at the time the expense was incurred, or at the time of the reimbursement, whichever is lower, and the reimbursement is made within three years after the expenses were incurred. Fees waived/reimbursed by the Adviser for the year ended April 30, 2021 are disclosed in the Statements of Operations.
In addition to the foregoing contractual arrangements, the Adviser has voluntarily agreed, effective September 1, 2020, to waive, with respect to the Grandeur Peak Global Opportunities Fund and the Grandeur Peak International Opportunities Fund, annual management fees to the extent such fees exceed 1.00% on assets above $500 million (the annual management fee rate with respect to such funds will remain 1.25% on the first $500 million in assets). Previously, the Adviser had voluntarily agreed, effective September 1, 2016, to waive, with respect to the Grandeur Peak Global Opportunities Fund and the Grandeur Peak International Opportunities Fund, annual management fees to the extent such fees exceed 1.10% on assets above $500 million (the annual management fee rate with respect to such funds will remain 1.25% on the first $500 million in assets). The Adviser has also voluntarily agreed, effective September 1, 2020, to waive, with respect to the Grandeur Peak Emerging Markets Opportunities Fund, annual management fees to the extent such fees exceed 1.00% on all assets above $400 million (the annual management fee rate with respect to the Fund will remain 1.35% on the first $400 million in assets). Previously, the Adviser had voluntarily agreed, effective January 1, 2018, to waive, with respect to the Grandeur Peak Emerging Markets Opportunities Fund, annual management fees to the extent such fees exceed 1.20% on all assets above $400 million (the annual management fee rate with respect to the Fund will remain 1.35% on the first $400 million in assets). These voluntary arrangements may be terminated at any time by the Adviser. Voluntary waivers are not subject to recoupment by the Adviser. Voluntary fees waived by the Adviser for the year ended April 30, 2021 are disclosed in the Statements of Operations.
For the year ended April 30, 2021, the fee waivers/reimbursements and/or recoupments, excluding voluntary waivers, were as follows:
| Fund | Fees Waived/Reimbursed By Adviser | Recoupment of Previously Waived Fees By Adviser | ||||||
| Grandeur Peak Emerging Markets Opportunities Fund | ||||||||
| Investor Class | $ | – | $ | – | ||||
| Institutional Class | – | – | ||||||
| Grandeur Peak Global Contrarian Fund | ||||||||
| Institutional Class | $ | 109,006 | $ | – | ||||
| Grandeur Peak Global Micro Cap Fund | ||||||||
| Institutional Class | $ | 7,343 | $ | 34,610 | ||||
| Grandeur Peak Global Opportunities Fund | ||||||||
| Investor Class | $ | – | $ | – | ||||
| Institutional Class | – | – | ||||||
| Grandeur Peak Global Reach Fund | ||||||||
| Investor Class | $ | – | $ | – | ||||
| Institutional Class | – | – | ||||||
| Grandeur Peak Global Stalwarts Fund | ||||||||
| Investor Class | $ | – | $ | – | ||||
| Institutional Class | – | – | ||||||
| Grandeur Peak International Opportunities Fund | ||||||||
| Investor Class | $ | – | $ | – | ||||
| Institutional Class | – | – | ||||||
| Grandeur Peak International Stalwarts Fund | ||||||||
| Investor Class | $ | – | $ | – | ||||
| Institutional Class | – | – | ||||||
| Grandeur Peak US Stalwarts Fund | ||||||||
| Institutional Class | $ | 49,676 | $ | – | ||||
| 112 | 1.855.377.7325 | www.GrandeurPeakGlobal.com |
| Grandeur Peak Funds® | Notes to Financial Statements |
April 30, 2021
As of April 30, 2021, the balances of recoupable expenses for each Fund were as follows:
| Fund | Expires 2022 | Expires 2023 | Expires 2024 | Total | ||||||||||||
| Grandeur Peak Emerging Markets Opportunities Fund | ||||||||||||||||
| Investor Class | $ | – | $ | – | $ | – | $ | – | ||||||||
| Institutional Class | – | – | – | – | ||||||||||||
| Grandeur Peak Global Contrarian Fund | ||||||||||||||||
| Institutional Class | $ | – | $ | 139,213 | $ | 109,006 | $ | 248,219 | ||||||||
| Grandeur Peak Global Micro Cap Fund | ||||||||||||||||
| Institutional Class | $ | – | $ | 14,526 | $ | 7,343 | $ | 21,869 | ||||||||
| Grandeur Peak Global Opportunities Fund | ||||||||||||||||
| Investor Class | $ | – | $ | – | $ | – | $ | – | ||||||||
| Institutional Class | – | – | – | – | ||||||||||||
| Grandeur Peak Global Reach Fund | ||||||||||||||||
| Investor Class | $ | – | $ | – | $ | – | $ | – | ||||||||
| Institutional Class | – | – | – | – | ||||||||||||
| Grandeur Peak Global Stalwarts Fund | ||||||||||||||||
| Investor Class | $ | – | $ | – | $ | – | $ | – | ||||||||
| Institutional Class | – | – | – | – | ||||||||||||
| Grandeur Peak International Opportunities Fund | ||||||||||||||||
| Investor Class | $ | – | $ | – | $ | – | $ | – | ||||||||
| Institutional Class | – | – | – | – | ||||||||||||
| Grandeur Peak International Stalwarts Fund | ||||||||||||||||
| Investor Class | $ | – | $ | – | $ | – | $ | – | ||||||||
| Institutional Class | – | – | – | – | ||||||||||||
| Grandeur Peak US Stalwarts Fund | ||||||||||||||||
| Institutional Class | $ | – | $ | 33,383 | $ | 49,676 | $ | 83,059 | ||||||||
Administrator Fees and Expenses: ALPS Fund Services, Inc. (“ALPS”) serves as administrator to the Funds and the Funds have agreed to pay expenses incurred in connection with their administrative activities. Pursuant to an Administration Agreement, ALPS provides operational services to the Funds including, but not limited to, fund accounting and fund administration and generally assists in the Funds’ operations. Officers of the Trust are employees of ALPS. The Funds’ administration fee is accrued on a daily basis and paid monthly. Administration fees paid by the Funds for the year ended April 30, 2021 are disclosed in the Statements of Operations.
ALPS is reimbursed by the Funds for certain out-of-pocket expenses.
Transfer Agent: ALPS serves as transfer, dividend paying and shareholder servicing agent for the Funds. ALPS receives an annual minimum fee, a fee based upon the number of shareholder accounts, and is also reimbursed by the Funds for certain out-of-pocket expenses. Transfer agent fees paid by the Funds for the year ended April 30, 2021 are disclosed in the Statements of Operations.
Compliance Services: ALPS provides services that assist the Trust’s chief compliance officer in monitoring and testing the policies and procedures of the Trust in conjunction with requirements under Rule 38a-1 under the 1940 Act and receives an annual base fee. ALPS is reimbursed for certain out-of-pocket expenses by the Funds. Compliance service fees paid by the Funds for the year ended April 30, 2021 are disclosed in the Statements of Operations.
Principal Financial Officer: ALPS receives an annual fee for providing principal financial officer services to the Funds. Principal financial officer fees paid by the Fund for the year ended April 30, 2021 are disclosed in the Statements of Operations.
Trustees: The fees and expenses of the Trustees of the Board are presented in the Statements of Operations.
| Annual Report | April 30, 2021 | 113 |
| Grandeur Peak Funds® | Notes to Financial Statements |
April 30, 2021
Distributor: ALPS Distributors, Inc. (“ADI” or the “Distributor”) (an affiliate of ALPS) acts as the distributor of the Funds’ shares pursuant to a Distribution Agreement with the Trust. Shares are sold on a continuous basis by ADI as agent for the Funds, and ADI has agreed to use its best efforts to solicit orders for the sale of Funds’ shares, although it is not obliged to sell any particular amount of shares. ADI is not entitled to any compensation for its services as Distributor. ADI is registered as a broker-dealer with the U.S. Securities and Exchange Commission.
Each Fund has adopted a Distribution and Services (Rule 12b-1) Plan pursuant to Rule 12b-1 of the 1940 Act (the “Plan”) for its Investor Class shares. The Plan allows the Funds to use Investor Class assets to pay fees in connection with the distribution and marketing of Investor Class shares and/or the provision of shareholder services to Investor Class shareholders. The Plan permits payment for services in connection with the administration of plans or programs that use Investor Class shares of each Fund as their funding medium and for related expenses. The recipients of such payments may include the Distributor, other affiliates of the Adviser, broker-dealers, financial institutions, plan sponsors and administrators and other financial intermediaries through which investors may purchase shares of the Fund. The Plan permits the Funds to make total payments at an annual rate of up to 0.25% of each Fund’s average daily net assets attributable to its Investor Class shares. The expenses of the Plan are reflected as distribution and service fees in the Statements of Operations.
7. INDEMNIFICATIONS
Under the Trust’s organizational documents, its officers and Trustees are indemnified against certain liability arising out of the performance of their duties to the Trust. Additionally, in the normal course of business, the Trust enters into contracts with service providers that may contain general indemnification clauses, which may permit indemnification to the extent permissible under applicable law. The Trust’s maximum exposure under these arrangements is unknown, as this would involve future claims that may be made against the Trust that have not yet occurred.
| 114 | 1.855.377.7325 | www.GrandeurPeakGlobal.com |
Grandeur Peak Funds® | Report of Independent Registered Public Accounting Firm |
To the shareholders and the Board of Trustees of Financial Investors Trust
Opinion on the Financial Statements and Financial Highlights
We have audited the accompanying statements of assets and liabilities of Grandeur Peak Emerging Markets Opportunities Fund, Grandeur Peak Global Contrarian Fund, Grandeur Peak Global Micro Cap Fund, Grandeur Peak Global Opportunities Fund, Grandeur Peak Global Reach Fund, Grandeur Peak Global Stalwarts Fund, Grandeur Peak International Opportunities Fund, Grandeur Peak International Stalwarts Fund, and Grandeur Peak US Stalwarts Fund (the “Funds”), nine of the funds constituting the Financial Investors Trust, including the portfolio of investments, as of April 30, 2021; the related statements of operations for the year then ended, the statements of changes in net assets for each of the two years in the period then ended, and the financial highlights for each of the five years in the period then ended for Grandeur Peak Emerging Markets Opportunities Fund, Grandeur Peak Global Opportunities Fund, Grandeur Peak Global Reach Fund, Grandeur Peak Global Micro Cap Fund, Grandeur Peak Global Stalwarts Fund, Grandeur Peak International Stalwarts Fund and Grandeur Peak International Opportunities Fund; the related statements of operations, changes in net assets, and the financial highlights for the periods indicated in the table below for Grandeur Peak Global Contrarian Fund and Grandeur Peak US Stalwarts Fund; and the related notes.
In our opinion, the financial statements and financial highlights present fairly, in all material respects, the financial position of each of the funds listed above constituting Financial Investors Trust as of April 30, 2021, and the results of their operations for the year then ended (or for the period listed in the table below), the changes in their net assets for each of the two years in the period then ended (or for the periods listed in the table below), and the financial highlights for each of the five years in the period then ended (or for the periods listed in the table below), in conformity with accounting principles generally accepted in the United States of America.
| Individual Fund Comprising the Financial Investors Trust | Statement of Operations | Statements of Changes in Net Assets | Financial Highlights |
| Grandeur Peak US Stalwarts Fund | For the year ended April 30, 2021 | For the year ended April 30, 2021 and the period from March 20, 2020 (Commencement of operations) through April 30, 2020 | For the year ended April 30, 2021 and the period from March 20, 2020 (Commencement of operations) through April 30, 2020 |
| Grandeur Peak Global Contrarian Fund | For the year ended April 30, 2021 | For the year ended April 30, 2021 and the period from September 18, 2019 (Commencement of operations) through April 30, 2020 | For the year ended April 30, 2021 and the period from September 18, 2019 (Commencement of operations) through April 30, 2020 |
Basis for Opinion
These financial statements and financial highlights are the responsibility of the Funds’ management. Our responsibility is to express an opinion on the Funds’ financial statements and financial highlights based on our audits. We are a public accounting firm registered with the Public Company Accounting Oversight Board (United States) (PCAOB) and are required to be independent with respect to the Funds in accordance with the U.S. federal securities laws and the applicable rules and regulations of the Securities and Exchange Commission and the PCAOB.
We conducted our audits in accordance with the standards of the PCAOB. Those standards require that we plan and perform the audit to obtain reasonable assurance about whether the financial statements and financial highlights are free of material misstatement, whether due to error or fraud. The Funds are not required to have, nor were we engaged to perform, an audit of their internal control over financial reporting. As part of our audits we are required to obtain an understanding of internal control over financial reporting but not for the purpose of expressing an opinion on the effectiveness of the Funds’ internal control over financial reporting. Accordingly, we express no such opinion.
Our audits included performing procedures to assess the risks of material misstatement of the financial statements and financial highlights, whether due to error or fraud, and performing procedures that respond to those risks. Such procedures included examining, on a test basis, evidence regarding the amounts and disclosures in the financial statements and financial highlights. Our audits also included evaluating the accounting principles used and significant estimates made by management, as well as evaluating the overall presentation of the financial statements and financial highlights. Our procedures included confirmation of securities owned as of April 30, 2021, by correspondence with the custodian and brokers; when replies were not received from brokers, we performed other auditing procedures. We believe that our audits provide a reasonable basis for our opinion.
DELOITTE & TOUCHE LLP
Denver, Colorado
June 28, 2021
We have served as the auditor of one or more investment companies advised by Grandeur Peak Global Advisors, LLC since 2012.
| Annual Report | April 30, 2021 | 115 |
| Grandeur Peak Funds® | Additional Information |
April 30, 2021 (Unaudited)
1. FUND HOLDINGS
The Funds file their complete schedule of portfolio holdings with the Securities and Exchange Commission (SEC) for the first and third quarters of each fiscal year as an exhibit to its reports on Form N-PORT. The Funds’ Form N-PORT reports are available on the SEC's Web site at http://www.sec.gov. The Funds’ Form N-PORT reports are also available upon request by calling 1-855-377-PEAK (7325).
2. FUND PROXY VOTING POLICIES, PROCEDURES AND SUMMARIES
The Funds’ policies and procedures used in determining how to vote proxies and information regarding how the Funds voted proxies relating to portfolio securities during the most recent prior 12-month period ending June 30 are available without charge, (1) upon request, by calling 1-855-377-PEAK (7325) and (2) on the SEC’s website at http://www.sec.gov.
3. TAX DESIGNATIONS
The Funds designate the following amounts for federal income tax purposes for the fiscal year ended April 30, 2021:
| Foreign Taxes Paid | Foreign Source Income | |||||||
| Grandeur Peak Global Opportunities Fund | $ | 2,077,264 | $ | 8,524,777 | ||||
| Grandeur Peak International Opportunities Fund | 1,592,105 | 9,885,843 | ||||||
| Grandeur Peak Global Reach Fund | 641,098 | 3,105,498 | ||||||
| Grandeur Peak Emerging Markets Opportunities Fund | 1,125,997 | 7,086,930 | ||||||
| Grandeur Peak Global Micro Cap Fund | 129,664 | 620,587 | ||||||
| Grandeur Peak Global Stalwarts Fund | 599,739 | 2,151,782 | ||||||
| Grandeur Peak International Stalwarts Fund | 3,457,339 | 17,485,205 | ||||||
| Grandeur Peak Global Contrarian Fund | 44,836 | 552,601 | ||||||
| Grandeur Peak US Stalwarts Fund | – | – | ||||||
Of the distributions paid by the Funds from ordinary income for the calendar year ended December 31, 2020, the following percentages met the requirements to be treated as qualifying for the corporate dividends received deduction and qualified dividend income:
| Dividend Received Deduction | Qualified Dividend Income | |||||||
| Grandeur Peak Global Opportunities Fund | 20.29 | % | 75.13 | % | ||||
| Grandeur Peak International Opportunities Fund | 0.00 | % | 100.00 | % | ||||
| Grandeur Peak Global Reach Fund | 33.13 | % | 100.00 | % | ||||
| Grandeur Peak Emerging Markets Opportunities Fund | 6.20 | % | 100.00 | % | ||||
| Grandeur Peak Global Micro Cap Fund | 9.37 | % | 49.10 | % | ||||
| Grandeur Peak Global Stalwarts Fund | 45.44 | % | 100.00 | % | ||||
| Grandeur Peak International Stalwarts Fund | 8.09 | % | 100.00 | % | ||||
| Grandeur Peak Global Contrarian Fund | 13.82 | % | 44.93 | % | ||||
| Grandeur Peak US Stalwarts Fund | 43.29 | % | 43.89 | % | ||||
In early 2021, if applicable, shareholders of record received this information for the distributions paid to them by the Funds during the calendar year 2020 via Form 1099. The Funds will notify shareholders in early 2022 of amounts paid to them by the Funds, if any, during the calendar year 2021.
Pursuant to Section 852(b)(3) of the Internal Revenue Code, the Funds designate the following as long-term capital gain dividends:
| Grandeur Peak Global Opportunities Fund | $ | 56,202,500 | ||
| Grandeur Peak International Opportunities Fund | 25,974,822 | |||
| Grandeur Peak Global Reach Fund | 23,014,944 | |||
| Grandeur Peak Emerging Markets Opportunities Fund | 588,486 | |||
| Grandeur Peak Global Micro Cap Fund | 3,187,700 | |||
| Grandeur Peak Global Stalwarts Fund | 8,533,427 | |||
| Grandeur Peak International Stalwarts Fund | 3,581,302 | |||
| Grandeur Peak Global Contrarian Fund | – | |||
| Grandeur Peak US Stalwarts Fund | 401 |
| 116 | 1.855.377.7325 | www.GrandeurPeakGlobal.com |
| Grandeur Peak Funds® | Additional Information |
April 30, 2021 (Unaudited)
For the fiscal year ended April 30, 2021, the following long term amounts were utilized as earnings and profits distributed to shareholders on redemptions:
| Grandeur Peak Global Opportunities Fund | $ | 5,633,724 | ||
| Grandeur Peak International Opportunities Fund | 3,320,219 | |||
| Grandeur Peak Global Reach Fund | 2,252,725 | |||
| Grandeur Peak Emerging Markets Opportunities Fund | 817,750 | |||
| Grandeur Peak Global Micro Cap Fund | 76,337 | |||
| Grandeur Peak Global Stalwarts Fund | 2,535,564 | |||
| Grandeur Peak International Stalwarts Fund | 3,423,631 | |||
| Grandeur Peak Global Contrarian Fund | 16,451 | |||
| Grandeur Peak US Stalwarts Fund | 55,638 |
| Annual Report | April 30, 2021 | 117 |
| Grandeur Peak Funds® | Trustees and Officers |
April 30, 2021 (Unaudited)
Additional information regarding the Fund’s trustees is included in the Statement of Additional Information, which can be obtained without charge by calling 1-855-377-PEAK (7325).
| INDEPENDENT TRUSTEES | |||||
| Name, Address* & Year of Birth | Position(s) Held with Fund | Term of Office** and Length of Time Served | Principal Occupation(s) During Past 5 Years*** | Number of Funds in Fund Complex Overseen by Trustee**** | Other Directorships Held by Trustee During Past 5 Years*** |
| Mary K. Anstine, 1940 | Trustee and Chairman | Ms. Anstine was elected at a special meeting of shareholders held on March 21, 1997 and re-elected at a special meeting of shareholders held on August 7, 2009. Ms. Anstine was appointed Chairman of the Board at the June 6, 2017 meeting of the Board of Trustees. | Ms. Anstine is Trustee/Director of AV Hunter Trust and Colorado Uplift Board. | 31 | Ms. Anstine is a Trustee of ALPS ETF Trust (17 funds); ALPS Variable Investment Trust (7 funds); Reaves Utility Income Fund (1 fund); and Segall Bryant & Hamill Trust through December 2020 (as of December 31, 2020 14 funds). |
| Jeremy W. Deems, 1976 | Trustee | Mr. Deems was appointed as a Trustee at the March 11, 2008 meeting of the Board of Trustees and elected at a special meeting of shareholders held on August 7, 2009. | Mr. Deems is the Co-Founder and Chief Financial Officer of Green Alpha Advisors, LLC, a registered investment advisor, and Co-Portfolio Manager of the Shelton Green Alpha Fund. | 31 | Mr. Deems is a Trustee of ALPS ETF Trust (17 funds); ALPS Variable Investment Trust (7 funds); Clough Funds Trust (1 fund); and Reaves Utility Income Fund (1 fund). |
| Jerry G. Rutledge, 1944 | Trustee | Mr. Rutledge was elected at a special meeting of shareholders held on August 7, 2009. | Mr. Rutledge is the President and owner of Rutledge’s Inc., a retail clothing business. | 31 | Mr. Rutledge is a Trustee of Clough Global Dividend and Income Fund (1 fund); Clough Global Equity Fund (1 fund); Clough Global Opportunities Fund (1 fund); and Principal Real Estate Income Fund (1 fund). |
| 118 | 1.855.377.7325 | www.GrandeurPeakGlobal.com |
| Grandeur Peak Funds® | Trustees and Officers |
April 30, 2021 (Unaudited)
| INDEPENDENT TRUSTEES | |||||
| Name, Address* & Year of Birth | Position(s) Held with Fund | Term of Office** and Length of Time Served | Principal Occupation(s) During Past 5 Years*** | Number of Funds in Fund Complex Overseen by Trustee**** | Other Directorships Held by Trustee During Past 5 Years*** |
| Michael “Ross” Shell, 1970 | Trustee | Mr. Shell was elected at a special meeting of shareholders held on August 7, 2009. | Mr. Shell is Founder and CEO of Red Idea, LLC, a strategic consulting/early stage venture firm (since June 2008). Mr. Shell serves on the Board of Directors of TalkBox, a phone/privacy booth company (since 2018) and DLVR, a package security company (since 2018). Mr. Shell served on the Advisory Board, St. Vrain School District Innovation Center (from 2015- 2018). Mr. Shell graduated with honors from Stanford University with a degree in Political Science. | 31 | None. |
INTERESTED TRUSTEE | |||||
| Name, Address* & Year of Birth | Position(s) Held with Fund | Term of Office** and Length of Time Served | Principal Occupation(s) During Past 5 Years*** | Number of Funds in Fund Complex Overseen by Trustee**** | Other Directorships Held by Trustee During Past 5 Years*** |
| Edmund J. Burke, 1961 | Trustee | Mr. Burke was elected as Trustee at a special meeting of shareholders held on August 7, 2009. | Mr. Burke joined ALPS in 1991 and served as the President and Director of ALPS Holdings, Inc., and ALPS Advisors, Inc., and Director of ALPS Distributors, Inc., ALPS Fund Services, Inc. (“ALPS”), and ALPS Portfolio Solutions Distributor, Inc. (collectively, the “ALPS Companies”). Mr. Burke retired from the ALPS Companies in June 2019. Mr. Burke is currently a partner at ETF Action, a web-based system that provides data and analytics to registered investment advisers, (since 2020) and a Director of Alliance Bioenergy Plus, Inc., echnology company focused on emerging technologies in the renewable energy, biofuels, and bioplastics technology sectors (since 2020). Mr. Burke is deemed an interested Trustee by virtue of his prior positions with the ALPS Companies. | 31 | Mr. Burke is a Trustee of ALPS ETF Trust (17 funds); Clough Global Dividend and Income Fund (1 fund); Clough Global Equity Fund (1 fund); Clough Global Opportunities Fund (1 fund); Clough Funds Trust (1 fund); Liberty All-Star Equity Fund (1 fund); and Director of the Liberty All-Star Growth Fund, Inc. (1 fund). |
| Annual Report | April 30, 2021 | 119 |
| Grandeur Peak Funds® | Trustees and Officers |
April 30, 2021 (Unaudited)
| OFFICERS | |||
| Name, Address* & Year of Birth | Position(s) Held with Fund | Term of Office** and Length of Time Served | Principal Occupation(s) During Past 5 Years*** |
| Bradley J. Swenson, 1972***** | President | Mr. Swenson was appointed President of the Trust at the June 11, 2019 meeting of the Board of Trustees. | Mr. Swenson joined ALPS in 2004 and has served as its President since June 2019. In this role, he serves as an officer to certain other closed-end and open-end investment companies. He previously served as the Chief Operating Officer of ALPS (2015-2019). Mr. Swenson also previously served as Chief Compliance Officer to ALPS, its affiliated entities, and to certain ETF, closed-end and open-end investment companies (2004-2015). Because of his position with ALPS, Mr. Swenson is deemed an affiliate of the Trust as defined under the 1940 Act. |
| Dawn Cotten, 1977 | President | Ms. Cotten was appointed President of the Trust at the June 8-9, 2021 meeting of the Trustees. | Ms. Cotten joined ALPS in 2009 and is currently Senior Vice President of Fund Administration and Relationship Management of ALPS. She has served in that role since January 2020. Prior to that, Ms. Cotten served as Senior Vice President of Relationship Management (2017-2020). Ms. Cotten served as a VP in Relationship Management from 2013-2017. Ms. Cotten also serves as President of ALPS Series Trust, Clough Funds Trust, Clough Global Dividend and Income Fund, and Clough Global Equity Fund and Clough Global Opportunities Fund. |
| Jennell Panella, 1974 | Treasurer | Ms. Panella was appointed Treasurer of the Trust at the September 15, 2020 meeting of the Board of Trustees. | Ms. Panella joined ALPS in June 2012 and is currently Vice President and Fund Controller of ALPS Fund Services, Inc. Prior to joining ALPS, Ms. Panella served as Financial Reporting Manager for Parker Global Strategies, LLC (2009-2012). Because of her position with ALPS, Ms. Panella is deemed an affiliate of the Trust as defined under the 1940 Act. Ms. Panella also serves as Assistant Treasurer of James Advantage Funds. |
| Karen S. Gilomen, 1970***** | Secretary | Ms. Gilomen was appointed Secretary of the Trust at the December 13, 2016 meeting of the Board of Trustees. | Ms. Gilomen joined ALPS in August 2016 as Vice President and Senior Counsel. Prior to joining ALPS, Ms. Gilomen was Vice President - General Counsel & CCO of Monticello Associates, Inc. from 2010 to 2016. Because of her position with ALPS, Ms. Gilomen is deemed an affiliate of the Trust, as defined under the 1940 Act. Ms. Gilomen is also the Secretary of ALPS Variable Investment Trust and Reaves Utility Income Fund, and the Assistant Secretary of the WesMark Funds. |
| Cara Owen, 1981 | Secretary | Ms. Owen was appointed Secretary of the Trust at the June 8-9, 2021 meeting of the Trustees. | Vice President and Principal Legal Counsel, ALPS Fund Services, Inc. Prior to joining ALPS, Ms. Owen was Senior Counsel, Corporate & Investments, Great-West Life & Annuity Insurance Company; Senior Counsel & Assistant Secretary, Great-West Funds, Inc., Great-West Capital Management, LLC, Great-West Trust Company, LLC, and Advised Assets Group, LLC (2014-2019). Ms. Owen also serves as Secretary of ALPS ETF Trust, Vice President and Secretary of Boulder Growth & Income Fund, and Assistant Secretary of James Advantage Funds. |
| Ted Uhl, 1974 | Chief Compliance Officer (“CCO”) | Mr. Uhl was appointed CCO of the Trust at the June 8, 2010 meeting of the Board of Trustees. | Mr. Uhl joined ALPS in October 2006, and is currently Deputy Compliance Officer of ALPS. Prior to his current role, Mr. Uhl served as Senior Risk Manager for ALPS from October 2006 until June 2010. Before joining ALPS, Mr. Uhl served a Sr. Analyst with Enenbach and Associates (RIA), and a Sr. Financial Analyst at Sprint. Because of his position with ALPS, Mr. Uhl is deemed an affiliate of the Trust as defined under the 1940 Act. Mr. Uhl is also CCO of the Boulder Growth & Income Fund, Inc., Centre Funds, Index Funds, Reality Shares ETF Trust, Reaves Utility Income Fund and XAI Octagon Floating Rate & Alternative Income Term Trust. |
| 120 | 1.855.377.7325 | www.GrandeurPeakGlobal.com |
| Grandeur Peak Funds® | Trustees and Officers |
April 30, 2021 (Unaudited)
| OFFICERS | |||
Name, Address* & Year of Birth | Position(s) Held with Fund | Term of Office** and Length of Time Served | Principal Occupation(s) During Past 5 Years*** |
Jennifer Craig, 1973
| Assistant Secretary
| Ms. Craig was appointed Assistant Secretary of the Trust at the June 8, 2016 meeting of the Board of Trustees. | Ms. Craig joined ALPS in 2007 and is currently Assistant Vice President and Paralegal Manager of ALPS. Because of her position with ALPS, Ms. Craig is deemed an affiliate of the Trust as defined under the 1940 Act. Ms. Craig is also Secretary of Principal Real Estate Income Fund, Assistant Secretary of ALPS ETF Trust, Clough Global Dividend and Income Fund, Clough Global Equity Fund, Clough Global Opportunities Fund, Liberty All-Star Equity Fund and Liberty All-Star Growth Fund, Inc. and Clerk of Goehring & Rozencwajg Investment Funds. |
| * | All communications to Trustees and Officers may be directed to Financial Investors Trust c/o 1290 Broadway, Suite 1000, Denver, CO 80203. |
| ** | This is the period for which the Trustee or Officer began serving the Trust. Each Trustee serves an indefinite term, until such Trustees successor is elected and appointed, or such Trustee resigns or is deceased. Officers are elected on an annual basis. |
| *** | Except as otherwise indicated, each individual has held the office shown or other offices in the same company for the last five years. |
| **** | The Fund Complex includes all series of the Trust, currently 31, and any other investment companies for which any Trustee serves as trustee for and for which Grandeur Peak Global Advisors, LLC provides investment advisory services (currently none). |
| ***** | Mr. Swenson resigned his position as President of the Trust effective June 9, 2021 and Ms. Gilomen resigned her position as Secretary of the Trust effective June 4, 2021. |
| Annual Report | April 30, 2021 | 121 |
| Grandeur Peak Funds® | Privacy Policy |
April 30, 2021 (Unaudited)
| Who We Are | |
| Who is providing this notice? | Grandeur Peak Global Opportunities Fund, Grandeur Peak International Opportunities Fund, Grandeur Peak Global Reach Fund, Grandeur Peak Emerging Markets Opportunities Fund, Grandeur Peak Global Micro Cap Fund, Grandeur Peak Global Stalwarts Fund, and Grandeur Peak International Stalwarts Fund. |
| What We Do | |
| How do the Funds protect my personal information? | To protect your personal information from unauthorized access and use, we use security measures that comply with federal law. These measures include computer safeguards and secured files and buildings. |
| How do the Funds collect my personal information? | We collect your personal information, for example, when you
● open an account ● provide account information or give us your contact information ● make a wire transfer or deposit money |
| Why can't I limit all sharing? | Federal law gives you the right to limit only
● sharing for affiliates’ everyday business purposes-information about your creditworthiness ● affiliates from using your information to market to you ● sharing for non-affiliates to market to you
State laws and individual companies may give you additional rights to limit sharing. |
| Definitions | |
| Affiliates | Companies related by common ownership or control. They can be financial and nonfinancial companies. |
| Non-affiliates | Companies not related by common ownership or control. They can be financial and nonfinancial companies.
● The Funds does not share with non-affiliates so they can market to you. |
| Joint marketing | A formal agreement between non-affiliated financial companies that together market financial products or services to you.
● The Funds does not jointly market. |
| Other Important Information | |
| California Residents | If your account has a California home address, your personal information will not be disclosed to nonaffiliated third parties except as permitted by applicable California law, and we will limit sharing such personal information with our affiliates to comply with California privacy laws that apply to us. |
| Vermont Residents | The State of Vermont requires financial institutions to obtain your consent prior to sharing personal information that they collect about you with affiliated companies and nonaffiliated third parties other than in certain limited circumstances. Except as permitted by law, we will not share personal information we collect about you with nonaffiliated third parties or other affiliated companies unless you provide us with your written consent to share such information. |
| 122 | 1.855.377.7325 | www.GrandeurPeakGlobal.com |
| Grandeur Peak Funds® | Privacy Policy |
April 30, 2021 (Unaudited)
| FACTS | WHAT DO THE FUNDS DO WITH YOUR PERSONAL INFORMATION? |
| Why? | Financial companies choose how they share your personal information. Federal law gives consumers the right to limit some but not all sharing. Federal law also requires us to tell you how we collect, share, and protect your personal information. Please read this notice carefully to understand what we do. |
| What? | The types of personal information we collect and share depend on the product or service you have with us. This information can include:
● Social Security number and account transactions ● Account balances and transaction history ● Wire transfer instructions |
| How? | All financial companies need to share customers’ personal information to run their everyday business. In the section below, we list the reasons financial companies can share their customers’ personal information; the reasons the Funds choose to share; and whether you can limit this sharing. |
| Reasons we can share your personal information | Do the Funds share: | Can you limit this sharing? |
| For our everyday business purposes — such as to process your transactions, maintain your account(s), respond to court orders and legal investigations, or report to credit bureaus | Yes | No |
| For our marketing purposes — to offer our products and services to you | No | We do not share. |
| For joint marketing with other financial companies | No | We do not share. |
| For our affiliates’ everyday business purposes — information about your transactions and experiences | Yes | No |
| For our affiliates’ everyday business purposes — information about your creditworthiness | No | We do not share. |
| For nonaffiliates to market to you | No | We do not share. |
| Annual Report | April 30, 2021 | 123 |

ANNUAL April 30, 2021
Highland Resolute Fund
Class I RMRGX
Highland Resolute Fund | Table of Contents |
| PAGE |
Shareholder Letter | 2 |
Performance Update | 6 |
Consolidated Disclosure of Fund Expenses | 8 |
Consolidated Schedule of Investments | 9 |
Consolidated Statement of Assets and Liabilities | 17 |
Consolidated Statement of Operations | 18 |
Consolidated Statements of Changes in Net Assets | 19 |
Consolidated Financial Highlights | 20 |
Notes to Consolidated Financial Statements | 21 |
Report of Independent Registered Accounting Firm | 33 |
Additional Information | 34 |
Disclosure Regarding Approval of Fund Advisory Agreements | 35 |
Liquidity Risk Management Program | 38 |
Trustees & Officers | 39 |
Privacy Policy | 44 |
| 1
Highland Resolute Fund | Shareholder Letter |
| April 30, 2021 (Unaudited) |
PERFORMANCE:
April 30, 2021
Highland Resolute Fund's ("the Fund") fiscal year 2021 happened to come during one of the largest equity market rallies in history. At the time of our last letter, global equities had just begun to recover from the rapid correction related to COVID-19. The Federal Reserve stepped in with the proverbial “bazooka” and provided a wave of liquidity to bond markets while lowering interest rates to stimulate the economy. As a result, concerns around a wave of defaults eased throughout the remainder of the year and into 2021 when the global community began the concerted vaccination efforts. Technology and growth-related names outperformed value as a number of technology services were essential for business continuity during the pandemic. Like many other firms, Highland Associates put its business continuity plan into place in mid-March and all employees began working remotely with little to no impact around operations. Virtual technology such as video conferencing and workflow/project management applications had been utilized by Highland for years prior to the pandemic as a tool to remain in frequent contact with our clients and team across the country. By leveraging those same technologies, the team was able to adapt to the new remote working environment with ease and maintain our rigorous investment and operational due diligence processes in the new virtual world.
Highland Resolute returned 24.78% during the fiscal year ended April 30, 2021, resulting in an excess return of approximately 10% relative to the HFRX Global Hedge Index (the “Index”)1. Since inception the Fund has outperformed the Index by approximately 160 basis points2 annualized. The Fund’s performance during the trailing twelve months was primarily driven by the Beta Sleeve3. The Parametric Defensive Equity separate account captured approximately 66% of the S&P 500 Index total return over the period, while the Vanguard Institutional Index Fund underperformed the S&P 500 Index slightly. Highland and Parametric reviewed and implemented a small change to the Defensive Equity separate account in February 2021 to increase the portfolio’s overall beta sensitivity relative to the S&P 500 Index. Within the Alpha Sleeve6 the event-driven strategy was the primary driver of performance in 2020. The European long/short strategy and relative value strategy both posted high single digit returns in 2020, but detracted during the first quarter of 2021 as the portfolios were impacted by equity and interest rate volatility. The alpha sleeve’s newest allocation, a commodity trading strategy, was added to the portfolio in November of 2020 with the objective of seeking to provide an uncorrelated return stream that would potentially benefit from volatility in commodities as global supply chains were reconfigured. The strategy has generated mid-single digit returns since its addition as inflation concerns have increased globally.
When compared to the mutual fund universe to which Morningstar assigned the Fund, the Fund has outperformed the Universe materially over longer time horizons. As with the HFRX Global Hedge Index, the Universe is very diverse and contains a number of market-neutral and other low net equity strategies that have caused the average net equity exposure for the Universe to be considerably less than our Fund. Due to these structural biases we anticipate the strategy to outperform the Universe in up or range-bound markets and underperform in down markets, which is consistent with the Fund’s realized performance. Below is a brief overview of the different portfolio pillars:
Beta Sleeve3 – A combined portfolio consisting of the Parametric Defensive Equity separately managed account and the Vanguard Institutional Index Fund. The sleeve is constructed to generate returns similar to those of hedged equity. The S&P 500 Index fund returned 43.4% during the period while Parametric generated a total return of 32.2%.
Liquidity Sleeve4 – The sole mutual fund within this sleeve, PIMCO Income Fund outperformed the Bloomberg Barclays U.S. Aggregate Bond Index5 by 13.6% during the period.
Alpha Sleeve6 – The overall alpha sleeve outperformed on a year-to-date basis with only one manager underperforming its respective benchmark.
Past performance is not indicative of future results.
2 |
Highland Resolute Fund | Shareholder Letter |
| April 30, 2021 (Unaudited) |
HIGHLAND RESOLUTE FUND
Table 1 notes the performance for the Fund as of quarter end under standard reporting (since inception) as well as of April 30, 2021.
Table 1
Performance (amounts greater than one year are annualized)
|
|
| Standardized Performance Data as of March 31, 2021 |
|
| Non-Standardized Performance Data as of April 30, 2021 | ||||
| YTD | 1-Year | 3-Year | 5-Year | Since Inception | YTD | 1-Year | 3-Year | 5-Year | Since Inception |
| Highland Resolute Fund – Class I | 4.07% | 24.75% | 3.30% | 4.32% | 3.96% | 7.22% | 24.78% | 4.46% | 4.79% | 4.26% |
| HFRX Global Hedge Fund Index | 1.29% | 16.15% | 3.46% | 3.95% | 2.53% | 2.94% | 14.74% | 3.99% | 4.20% | 2.69% |
| Gross Expense Ratio | Less Expense Waivers | Net Expense Ratio | Net Ratio ex Dividend & Short Expense |
| Highland Resolute Fund – Class I | 2.23% | -1.47% | 0.76% | 0.67% |
Performance data quoted represents past performance. Past performance does not guarantee future results. Investment return and principal value of an investment will fluctuate so that an investor’s shares, when sold or redeemed, may be worth more or less than the original cost. Current performance data may be higher or lower than actual data quoted. For the most current month-end performance data please call 1-855-268-2242.
The Fund has a redemption fee of 2.00% for shares redeemed within the first 90 days of purchase. Performance shown at NAV does not include these sales charges and would have been lower had it been taken into account.
Ratios as of the Prospectus dated August 31, 2020 and may differ from the ratios presented in the Financial Highlights
The Adviser has agreed to waive the portion of its 1.50% Management Fee in excess of any sub-advisory fees paid by the Adviser to sub-advisors in connection with the Fund (“Sub-Advisory Fees”). This agreement (the “Expense Agreement”) is in effect through August 31, 2021. The Adviser may not discontinue this agreement to waive fees prior to August 31, 2021 without the approval by the Fund’s Board of Trustees.
Net Ratio ex Dividend & Short Expense is the Net Expense Ratio less any Dividend and Interest Expense on Securities Sold Short.
Non-standardized performance is any performance period that doesn’t fall on a quarter end.
Closing:
We continue to seek to add value both in our allocation and manager selection decisions. We appreciate your investment in our Highland Resolute Fund, please feel free to contact us with any questions.
Sincerely,


Matthew W. Sampson, CFA & Jason T. Copeland, CFA, CAIA
Portfolio Managers7
1 | Representative of the overall composition of the hedge fund universe. |
2 | Basis Point = 0.01%, 100 basis points would equal 1.0% |
3 | Beta Sleeve is in place to create sensitivity to the overall equity market. |
4 | Liquidity Sleeve is in place to have liquidity for rebalancing and redemptions. |
5 | A broad-based benchmark that measures the investment grade, U.S. dollar-denominated, fixed-rate taxable bond market |
6 | Alpha Sleeve is to provide market outperformance. |
7 | Jason T. Copeland is a registered representative of ALPS Distributors, Inc. CFA Institute Marks are trademarks owned by the CFA Institute. CAIA Association grants the right to use the CAIA Certification and Collective Marks to those individuals who have been granted the status of either Full Member or Retired Member by CAIAA. |
Annual Report | April 30, 2021 | 3 |
Highland Resolute Fund | Shareholder Letter |
| April 30, 2021 (Unaudited) |
Underlying Allocation Weights:
Figure 1 lists the long-term target asset allocation for the Fund as well as the allocation as of April 30, 2021.
Holdings and allocations subject to change and may not reflect the current or future position of the portfolio.
4 |
Highland Resolute Fund | Shareholder Letter |
| April 30, 2021 (Unaudited) |
IMPORTANT NOTES AND DISCLOSURES
Past performance does not guarantee future results.
Fund prices fluctuate as the underlying assets have exposure to market fluctuations and other risks, as described in the Fund’s prospectus. Please call 1-855-268-2242 to obtain current performance information and for the current prospectus and statement of additional information. This material must be preceded or accompanied by a prospectus. Please read the prospectus carefully before investing.
The views of Highland Associates, Inc. and the information discussed in this commentary are as of the date of publication, are subject to change, and may not reflect the writers’ current views. The views expressed are those of the Fund’s adviser only, and represent an assessment of market conditions at a specific point in time, are opinions only and should not be relied upon as investment advice regarding a particular investment or markets in general. Such information does not constitute a recommendation to buy or sell specific securities or investment vehicles. It should not be assumed that any investment will be profitable or will equal the performance of the portfolios or any securities or any sectors mentioned in this letter. The subject matter contained in this letter has been derived from several sources believed to be reliable and accurate at the time of compilation. Neither Highland Associates, Inc. nor the Fund accepts any liability for losses either direct or consequential caused by the use of this information.
The Highland Resolute Fund is distributed by ALPS Distributors, Inc.
The Fund is subject to investment risks, including possible loss of the principal amount invested and therefore is not suitable for all investors. The Fund may not achieve its objectives.
Diversification does not eliminate the risk of experiencing investment losses.
RISKS:
The Fund’s strategy may expose it to the risks of investments in Swap Contracts and Other Investment Companies. These risks include, but are not limited to higher expenses, allocation risk, underlying fund risk, transparency risk, and underlying fund managed portfolio risk. Investments which focus on alternative strategies are subject to increased risk and loss of principal and are not suitable for all investors. Swap Risk involves swap agreements and are subject to counterparty default risk and may not perform as intended. Derivatives Risk involves the exercise of skill and judgment. Derivatives may expire worthless or not perform as expected. Equity Risk may cause the value of the securities held by the Fund to fall due to general market and economic conditions, perceptions regarding the industries in which the issuers of securities held by the Fund participate, or factors relating to specific companies in which the Fund invest.
The Fund’s investments in non-U.S. issuers may be even more volatile and may present more risks than investments in U.S. issuers.
Commodity Risk may subject the Fund to greater volatility than traditional investments because of global supply and demand, changes in interest rates, commodity index volatility, and factors affecting a particular industry or commodity. Commodity-linked investments may not move in the same direction and to the same extent as the underlying commodities.
Beta is a measure of the volatility–or systematic risk–of a security or portfolio compared to the market as a whole. Beta is used in the capital asset pricing model (CAPM), which describes the relationship between systematic risk and expected return for assets (usually stocks).
Alpha is referred to as “excess return” or “abnormal rate of return,” which refers to the idea that markets are efficient, and so there is no way to systematically earn returns that exceed the broad market as a whole.
The Morningstar Multi-Alternative Universe is designed to represent the exposure to alternative investment tactics. Funds in this category have the majority of their assets exposed to alternative strategies. An investor’s exposure to different tactics may change slightly over time in response to market movements. Funds in this category include both funds with static allocations to alternative strategies and funds tactically allocating among alternative strategies and asset classes. The gross short exposure is greater than 20%.
The HFRX Global Hedge Fund Index is designed to be representative of the overall composition of the hedge fund universe, and includes convertible arbitrage, distressed securities, equity hedge, equity market neutral, event driven, macro, merger arbitrage, and relative value strategies. The index returns are updated periodically and are subject to change. The returns were accurate as of the date of this publication. Investors cannot invest directly in an index.
The S&P 500® Index is the Standard & Poor’s composite index of 500 stocks, a widely recognized, unmanaged index of common stock prices. The index is not actively managed and does not reflect any deduction of fees, expenses or taxes. An investor may not invest directly in an index.
Annual Report | April 30, 2021 | 5 |
Highland Resolute Fund | Performance Update |
| April 30, 2021 (Unaudited) |
Performance (for the year ended April 30, 2021)
Highland Resolute Fund
Cumulative Total Return
(for the period ended April 30, 2021) | 1 Year | 3 Year | 5 Year | Since Inception* | Gross Ratio(a) | Net Ratio(a) |
Highland Resolute Fund - Class I - NAV | 24.78% | 4.46% | 4.79% | 4.26% | 2.23% | 0.76% |
HFRX Global Hedge Fund Index(b) | 14.74% | 3.99% | 4.20% | 2.69% |
|
|
S&P 500® Index(c) | 45.98% | 18.67% | 17.42% | 16.07% |
|
|
Dow Jones U.S. Select Dividend Index(d) | 53.35% | 11.68% | 11.93% | 13.05% |
|
|
Performance data quoted represents past performance. Past performance does not guarantee future results. Investment return and principal value of an investment will fluctuate so that an investor’s shares, when sold or redeemed, may be worth more or less than the original cost. Current performance data may be higher or lower than actual data quoted. For the most current month-end performance data please call 1-855-268-2242.
The Fund has a redemption fee of 2.00% for shares redeemed within the first 90 days of purchase. Performance shown at NAV does not include these sales charges and would have been lower had it been taken into account.
The Adviser has agreed to waive the portion of its 1.50% Management Fee in excess of any sub-advisory fees paid by the Adviser to sub-advisors in connection with the Fund (“Sub-Advisory Fees”). This agreement (the “Expense Agreement”) is in effect through August 31, 2021. The Adviser may not discontinue this agreement to waive fees prior to August 31, 2021 without the approval by the Fund’s Board of Trustees.
* | Fund inception date of 12/30/11. |
(a) | Ratios as of the Prospectus dated August 31, 2020 and may differ from the ratios presented in the Financial Highlights. |
(b) | The HFRX Global Hedge Fund Index is an additional index, and is designed to be representative of the overall composition of the hedge fund universe and includes convertible arbitrage, distressed securities, equity hedge, equity market neutral, event driven, macro, merger arbitrage and relative value strategies. The index returns are updated periodically and are subject to change. The returns were accurate as of the date of this publication. The index is not actively managed and does not reflect any deduction of fees, expenses or taxes. An investor may not invest directly in an index. |
(c) | The S&P 500® Index is the Standard & Poor’s composite index of 500 stocks, a widely recognized, unmanaged index of common stock prices. The index is not actively managed and does not reflect any deduction of fees, expenses or taxes. An investor may not invest directly in an index. |
(d) | The Dow Jones U.S. Select Dividend Index is an additional index, and represents the country’s top stocks by dividend yield, selected annually and subject to screening and buffering criteria. The index is not actively managed and does not reflect any deductions of fees, expenses or taxes. An investor may not invest directly in an index. |
The table does not reflect the deduction of taxes that a shareholder would pay on Fund distributions or the redemption of Fund shares.
Top Ten Holdings**
(for the year ended April 30, 2021)
As a percentage of Net Assets |
|
Melchior Segregated Portfolio | 19.66% |
WABR | 17.56% |
Vanguard S&P 500 ETF | 15.79% |
PIMCO Short-Term Fund, Institutional Class | 14.90% |
Typhon Capital | 14.47% |
Vanguard Institutional Index Fund | 13.97% |
iShares Core S&P 500 ETF | 9.59% |
E-mini S&P® 500 | 9.43% |
PIMCO Income Fund, Institutional Class | 3.71% |
U.S. Treasury Note | 1.97% |
Top Ten Holdings | 121.05% |
** | Holdings are subject to change, and may not reflect the current or future position of the portfolio. |
6 |
Highland Resolute Fund | Performance Update |
| April 30, 2021 (Unaudited) |
Performance of $10,000 Initial Investment (for the year ended April 30, 2021)
Comparison of change in value of a $10,000 investment
The chart represents historical performance of a hypothetical investment of $10,000 in the Fund since inception. Past performance does not guarantee future results. This chart does not reflect the deduction of taxes that a shareholder would pay on Fund distributions or the redemption of Fund shares.
Investing in the Fund is subject to investment risks, including possible loss of the principal amount invested.
Annual Report | April 30, 2021 | 7 |
Highland Resolute Fund | Consolidated Disclosure of Fund Expenses |
| April 30, 2021 (Unaudited) |
As a shareholder of the Fund, you incur two types of costs: (1) transaction costs, including applicable sales charges (loads), redemption fees; and (2) ongoing costs, including management fees, shareholder service fees and other Fund operating expenses. This example is intended to help you understand your ongoing costs (in dollars) of investing in the Fund and to compare these costs with the ongoing costs of investing in other mutual funds.
This example is based on an investment of $1,000 invested at the beginning of the period and held for the six-month period of November 1, 2020 to April 30, 2021.
Actual Expenses. The first line of the table below provides information about actual account values and actual expenses. You may use the information in this line, together with the amount you invested to estimate the expenses that you paid over the period. Simply divide your account value by $1,000 (for example, an $8,600 account value divided by $1,000 = 8.6), then multiply the result by the number in the first line of the table below under the heading titled “Expenses Paid During Period” to estimate the expenses you paid on your account during this period.
Hypothetical Example for Comparison Purposes. The second line of the table below provides information about hypothetical account values and hypothetical expenses based on the Fund’s actual expense ratio and an assumed rate of return of 5% per year before expenses, which is not the Fund’s actual return. The hypothetical account values and expenses may not be used to estimate the actual ending account balance or expenses you paid for the period. You may use this information to compare the ongoing costs of investing in the Fund and other mutual funds. To do so, compare this 5% hypothetical example with the 5% hypothetical examples that appear in the shareholder reports of the other funds.
Please note that the expenses shown in the table below are meant to highlight your ongoing costs only and do not reflect any transactional costs, such as applicable sales charges (loads), redemption fees, or exchange fees. Therefore, the second line of the table below is useful in comparing ongoing costs only and will not help you determine the relative total costs of owning different funds. In addition, if these transactional costs were included, your costs would have been higher.
Highland Resolute Fund | BEGINNING | ENDING | EXPENSE | EXPENSES PAID 11/01/20-04/30/21(b) |
Class I |
|
|
|
|
Actual | $1,000.00 | $1,161.50 | 0.47% | $2.52 |
Hypothetical (5% return before expenses) | $1,000.00 | $1,022.46 | 0.47% | $2.36 |
(a) | Annualized, based on the Fund’s most recent fiscal half year expenses. |
(b) | Expenses are equal to the Fund’s annualized expense ratio multiplied by the average account value over the period, multiplied by the number of days in the most recent fiscal half-year (181)/365 (to reflect the half-year period). |
8 |
Highland Resolute Fund | Consolidated Schedule of Investments |
| April 30, 2021 |
| Description | Shares | Value (Note 2) | ||||||
| EXCHANGE TRADED FUNDS (25.38%) | ||||||||
| iShares Core S&P 500 ETF | 36,490 | $ | 15,284,931 | |||||
| Vanguard S&P 500 ETF | 65,658 | 25,184,439 | ||||||
| 40,469,370 | ||||||||
| TOTAL EXCHANGE TRADED FUNDS | ||||||||
| (Cost 31,110,051) | 40,469,370 | |||||||
| OPEN-END MUTUAL FUNDS (32.58%) | ||||||||
| PIMCO Income Fund, Institutional Class | 490,399 | 5,914,212 | ||||||
| PIMCO Short-Term Fund, Institutional Class | 2,413,951 | 23,753,281 | ||||||
| Vanguard Institutional Index Fund, Institutional Class | 60,968 | 22,284,392 | ||||||
| 51,951,885 | ||||||||
| TOTAL OPEN-END MUTUAL FUNDS | ||||||||
| (Cost 43,954,854) | 51,951,885 | |||||||
| Description | Principal Amount | Value | ||||||
| GOVERNMENT & AGENCY OBLIGATIONS (1.97%) | ||||||||
U.S. Treasury Note(a) | ||||||||
| 1.38%, 01/31/2022 | $ | 3,100,000 | 3,130,749 | |||||
| TOTAL GOVERNMENT & AGENCY OBLIGATIONS | ||||||||
| (Cost $3,132,820) | 3,130,749 | |||||||
| Description | Shares | Value (Note 2) | ||||||
| Short-Term Investments (12.15%) | ||||||||
| MONEY MARKET FUNDS (10.37%) | ||||||||
| Dreyfus Treasury Cash Management Fund, Institutional Class, 7-day yield, 0.010% | 16,536,255 | 16,536,255 | ||||||
| U.S. TREASURY BILLS (1.78%) | ||||||||
0.120%, 09/09/2021(a)(b) | 763,000 | 762,959 | ||||||
0.100%, 12/02/2021(a)(b) | 2,073,000 | 2,072,755 | ||||||
| 2,835,714 | ||||||||
| TOTAL SHORT-TERM INVESTMENTS | ||||||||
| (Cost $19,370,731) | 19,371,969 | |||||||
| TOTAL INVESTMENTS (72.08%) | ||||||||
| (Cost $97,568,456) | $ | 114,923,973 | ||||||
SEGREGATED CASH WITH BROKERS (26.65%)(c) | 42,490,000 | |||||||
| OTHER ASSETS IN EXCESS OF LIABILITIES (1.27%) | 2,028,203 | |||||||
| NET ASSETS (100.00%) | $ | 159,442,176 | ||||||
(a) | Security position either entirely or partially held in segregated accounts as collateral for written option contracts, total return swaps and futures. Aggregate total fair value of $4,724,379. |
(b) | Rate shown represents the bond equivalent yield to maturity at date of purchase. |
(c) | Includes cash which is being held as collateral for written option contracts and total return swap contracts. |
See Notes to Financial Statements.
Annual Report | April 30, 2021 | 9 |
Highland Resolute Fund | Consolidated Schedule of Investments |
| April 30, 2021 |
WRITTEN OPTION CONTRACTS (0.06%)
| Counterparty | Expiration Date | Strike Price | Contracts | Premiums Received | Notional Value | Value (Note 2) | |||||||||||||||||
| Call Option Contracts - (0.02%) | |||||||||||||||||||||||
| S&P 500® Index | |||||||||||||||||||||||
| Citigroup | 05/03/2021 | $ | 4,240 | (5) | $ | 4,845 | $ | (2,090,585 | ) | $ | (395 | ) | |||||||||||
| Citigroup | 05/05/2021 | 4,200 | (5) | 6,335 | (2,090,585 | ) | (8,150 | ) | |||||||||||||||
| Citigroup | 05/05/2021 | 4,245 | (5) | 2,770 | (2,090,585 | ) | (1,405 | ) | |||||||||||||||
| Citigroup | 05/07/2021 | 4,240 | (5) | 5,695 | (2,090,585 | ) | (3,215 | ) | |||||||||||||||
| Citigroup | 05/07/2021 | 4,235 | (5) | 3,145 | (2,090,585 | ) | (3,860 | ) | |||||||||||||||
| Citigroup | 05/10/2021 | 4,250 | (5) | 6,045 | (2,090,585 | ) | (3,300 | ) | |||||||||||||||
| Citigroup | 05/12/2021 | 4,270 | (5) | 4,020 | (2,090,585 | ) | (2,950 | ) | |||||||||||||||
| Citigroup | 05/14/2021 | 4,295 | (5) | 7,145 | (2,090,585 | ) | (2,000 | ) | |||||||||||||||
| Citigroup | 05/19/2021 | 4,270 | (5) | 7,720 | (2,090,585 | ) | (5,980 | ) | |||||||||||||||
| Citigroup | 05/24/2021 | 4,300 | (5) | 7,870 | (2,090,585 | ) | (5,205 | ) | |||||||||||||||
| Citigroup | 05/28/2021 | 4,300 | (5) | 7,445 | (2,090,585 | ) | (7,600 | ) | |||||||||||||||
| Put Option Contracts - (0.04%) | |||||||||||||||||||||||
| S&P 500® Index | |||||||||||||||||||||||
| Citigroup | 05/03/2021 | 4,125 | (5) | 4,920 | (2,090,585 | ) | (930 | ) | |||||||||||||||
| Citigroup | 05/05/2021 | 4,125 | (5) | 4,995 | (2,090,585 | ) | (3,395 | ) | |||||||||||||||
| Citigroup | 05/07/2021 | 4,045 | (5) | 6,970 | (2,090,585 | ) | (1,850 | ) | |||||||||||||||
| Citigroup | 05/07/2021 | 4,110 | (5) | 5,595 | (2,090,585 | ) | (4,535 | ) | |||||||||||||||
| Citigroup | 05/10/2021 | 3,960 | (5) | 11,995 | (2,090,585 | ) | (1,330 | ) | |||||||||||||||
| Citigroup | 05/12/2021 | 4,090 | (5) | 7,570 | (2,090,585 | ) | (7,730 | ) | |||||||||||||||
| Citigroup | 05/14/2021 | 4,025 | (5) | 11,270 | (2,090,585 | ) | (6,500 | ) | |||||||||||||||
| Citigroup | 05/19/2021 | 3,980 | (5) | 12,045 | (2,090,585 | ) | (7,530 | ) | |||||||||||||||
| Citigroup | 05/24/2021 | 4,000 | (5) | 11,495 | (2,090,585 | ) | (11,265 | ) | |||||||||||||||
| Citigroup | 05/28/2021 | 3,980 | (5) | 12,595 | (2,090,585 | ) | (12,300 | ) | |||||||||||||||
| TOTAL WRITTEN OPTION CONTRACTS | $ | 152,485 | $ | (43,902,285 | ) | $ | (101,425 | ) | |||||||||||||||
| FUTURES CONTRACTS | |||||||||||||||||||||||
| Description | Counterparty | Position | Contracts | Expiration Date | Notional | Value | Unrealized | ||||||||||||||||
| E-MINI S&P® 500 | Citigroup | Long | 72 | June 2021 | $ | 15,027,840 | $ | 765,320 | $ | 765,320 | |||||||||||||
| $ | 15,027,840 | $ | 765,320 | $ | 765,320 | ||||||||||||||||||
See Notes to Financial Statements.
10 |
Highland Resolute Fund | Consolidated Schedule of Investments |
| April 30, 2021 |
TOTAL RETURN SWAP CONTRACTS* | ||||||||||||||||||||
Counterparty | Reference Obligation | Notional | Value |
Rate Paid by the Fund |
Reference Rate | Termination Date | Unrealized Appreciation/ (Depreciation) | |||||||||||||
| Morgan Stanley | Dalton Melchior Segregated Portfolio(a) | $ | 31,335,738 | $ | 31,351,689 | 100 bps | N/A | 03/20/2023 | $ | 15,951 | ||||||||||
| Morgan Stanley | PSAM Highland(b) | 157,733 | 155,919 | 215 bps + 1M EURIBOR | -57 bps | 06/03/2021 | (1,814 | ) | ||||||||||||
| Morgan Stanley | Typhon Argos Capital(c) | 23,122,110 | 23,075,514 | 85 bps | N/A | 09/08/2025 | (46,596 | ) | ||||||||||||
| Morgan Stanley | WABR(d) | 27,992,910 | 27,994,313 | 120 bps + 1M LIBOR | 12 bps | 09/01/2022 | 1,403 | |||||||||||||
| $ | 82,608,491 | $ | 82,577,435 | $ | (31,056 | ) | ||||||||||||||
* | For the long positions, the Fund receives payments based on any positive return of the Reference Obligation less the rate paid by the Fund. The Fund makes payments on any negative return of such Reference Obligation plus the rate paid by the Fund. For short positions, the Fund receives payments based on any negative return of the Reference Obligation less the rate paid by the Fund. The Fund makes payments on any positive return of such Reference Obligation plus the rate paid by the Fund. Payments are made monthly. |
(a) | Dalton Melchior Segregated Portfolio is a global equity long/short strategy that uses a long-biased strategy that is focused on cyclical sectors. The strategy has a net exposure that ranges between 50% and 80%, and long exposure varies between 80% and 100%. The strategy is comprised of large cap stocks listed on exchanges of developed and emerging market countries. |
(b) | PSAM Highland employs an event driven strategy. The Fund will primarily make investments in equity special situations and merger arbitrage. The strategy will also opportunistically allocate to liquid high yield credit positions when trading at stressed levels. The strategy will employ gross long exposure of up to 120%, and net exposure will typically vary from 40% to 80%. |
(c) | Typhon Argos is a discretionary multi-manager futures strategy with a bias to relative value strategies and commodity focused teams. The manager utilizes seven sub-strategies including four physical commodities specialists across metals, energy, livestock, and grain categories. The remaining strategies trade multiple commodity or financial futures with various quantitative mean reverting or trend following approaches. No single sub-strategy makes up more than 25% of the total portfolio. |
(d) | WABR incorporates an absolute return oriented approach within a risk parity framework. Active absolute return strategies include fundamental long/short equity, credit relative value, discretionary macro, and equity market neutral strategies. The strategy also maintains a passive risk weighted allocation to equities and fixed income, but each of the three allocations is equally risk weighted subject to a 40% limit on the absolute return allocation. Gross equity long exposure will typically be 140% or less, and net equity exposure will vary between 5% and 35%. |
See Notes to Financial Statements.
Annual Report | April 30, 2021 | 11 |
Highland Resolute Fund | Consolidated Schedule of Investments |
| April 30, 2021 |
| TYPHON ARGOS CAPITAL | ||||||||||||||||||||
| Description | Contracts/Shares | Notional Value | Expiration Date | Value | Percentage of Value | Counterparty | ||||||||||||||
| LONG SECURITIES | �� | |||||||||||||||||||
| COMMODITY FUTURE CONTRACTS | ||||||||||||||||||||
| GOLD CMX | 150 | 26,547,000 | August 2021 | $ | (168,000 | ) | -0.73 | % | Morgan Stanley & Co. LLC | |||||||||||
| GOLD CMX | 45 | 7,964,100 | August 2021 | (86,112 | ) | -0.37 | % | Morgan Stanley & Co. LLC | ||||||||||||
| GOLD CMX | 15 | 2,654,700 | August 2021 | (12,009 | ) | -0.05 | % | Morgan Stanley & Co. LLC | ||||||||||||
| HI GR. COPPER | 15 | 1,678,125 | June 2021 | 179,438 | 0.78 | % | Morgan Stanley & Co. LLC | |||||||||||||
| HI GR. COPPER | 15 | 1,678,125 | June 2021 | 153,307 | 0.66 | % | Morgan Stanley & Co. LLC | |||||||||||||
| LEAN HOGS | 12 | 524,400 | July 2021 | 32,640 | 0.14 | % | Morgan Stanley & Co. LLC | |||||||||||||
| LEAN HOGS | 16 | 702,240 | June 2021 | 28,644 | 0.12 | % | Morgan Stanley & Co. LLC | |||||||||||||
| LEAN HOGS | 12 | 526,680 | June 2021 | 25,680 | 0.11 | % | Morgan Stanley & Co. LLC | |||||||||||||
| LEAN HOGS | 12 | 524,400 | July 2021 | 22,287 | 0.10 | % | Morgan Stanley & Co. LLC | |||||||||||||
| LEAN HOGS | 8 | 351,120 | June 2021 | 11,600 | 0.05 | % | Morgan Stanley & Co. LLC | |||||||||||||
| LEAN HOGS | 12 | 425,760 | October 2021 | 6,707 | 0.03 | % | Morgan Stanley & Co. LLC | |||||||||||||
| WHEAT | 68 | 2,491,520 | December 2021 | (20,030 | ) | -0.09 | % | Morgan Stanley & Co. LLC | ||||||||||||
| COMMODITY FUTURE CONTRACTS Total | 46,068,170 | 174,152 | 0.75 | % | ||||||||||||||||
| OPTIONS | ||||||||||||||||||||
| CRUDE OIL | 26 | 12,480 | June 2021 | 12,480 | 0.05 | % | Morgan Stanley & Co. LLC | |||||||||||||
| LIVE CATTLE | 24 | 12,240 | August 2021 | 12,240 | 0.05 | % | Morgan Stanley & Co. LLC | |||||||||||||
| LEAN HOGS | 60 | 93,600 | June 2021 | 93,600 | 0.41 | % | Morgan Stanley & Co. LLC | |||||||||||||
| LEAN HOGS | 16 | 2,400 | June 2021 | 2,400 | 0.01 | % | Morgan Stanley & Co. LLC | |||||||||||||
| LEAN HOGS | 8 | 1,200 | June 2021 | 1,200 | 0.01 | % | Morgan Stanley & Co. LLC | |||||||||||||
| OPTIONS Total | 121,920 | 121,920 | 0.53 | % | ||||||||||||||||
| TOTAL LONG | 46,190,090 | 296,072 | 1.28 | % | ||||||||||||||||
| SECURITIES SOLD SHORT | ||||||||||||||||||||
| COMODITY FUTURE CONTRACTS | ||||||||||||||||||||
| GOLD CMX | (127 | ) | (22,449,790 | ) | June 2021 | 143,510 | 0.62 | % | Morgan Stanley & Co. LLC | |||||||||||
| GOLD CMX | (60 | ) | (10,606,200 | ) | June 2021 | 102,610 | 0.44 | % | Morgan Stanley & Co. LLC | |||||||||||
| GOLD CMX | (8 | ) | (1,414,160 | ) | June 2021 | (3,760 | ) | -0.02 | % | Morgan Stanley & Co. LLC | ||||||||||
| GOLD CMX | (7 | ) | (1,237,390 | ) | June 2021 | 869 | 0.00 | % | Morgan Stanley & Co. LLC | |||||||||||
| HI GR. COPPER | (15 | ) | (1,675,500 | ) | September 2021 | (91,150 | ) | -0.40 | % | Morgan Stanley & Co. LLC | ||||||||||
| HI GR. COPPER | (15 | ) | (1,675,500 | ) | September 2021 | 13,835 | 0.06 | % | Morgan Stanley & Co. LLC | |||||||||||
| WHEAT | (68 | ) | (2,498,320 | ) | July 2021 | 16,150 | 0.07 | % | Morgan Stanley & Co. LLC | |||||||||||
| COMMODITY FUTURE CONTRACTS Total | (41,556,860 | ) | 182,064 | 0.79 | % | |||||||||||||||
| OPTIONS | ||||||||||||||||||||
| CRUDE OIL | (26 | ) | (13,780 | ) | June 2021 | (13,780 | ) | -0.06 | % | Morgan Stanley & Co. LLC | ||||||||||
| LEAN HOGS | (16 | ) | (1,440 | ) | June 2021 | (1,440 | ) | -0.01 | % | Morgan Stanley & Co. LLC | ||||||||||
| LEAN HOGS | (8 | ) | (720 | ) | June 2021 | (720 | ) | 0.00 | % | Morgan Stanley & Co. LLC | ||||||||||
| OPTIONS Total | (15,940 | ) | (15,940 | ) | -0.07 | % | ||||||||||||||
| TOTAL SHORT | (41,572,800 | ) | 166,124 | 0.72 | % | |||||||||||||||
| REMAINING CASH | 22,613,318 | 98.00 | % | |||||||||||||||||
| GRAND TOTAL | $ | 23,075,514 | ||||||||||||||||||
See Notes to Financial Statements.
12 |
Highland Resolute Fund | Consolidated Schedule of Investments |
April 30, 2021
DALTON MELCHIOR SEGREGATED PORTFOLIO
Description | Contracts | Notional | Value | Percentage of Value | Counterparty | Floating Rate/ | Reference | Termination | Unrealized | |||||||||||||||||
LONG SECURITIES |
|
|
|
| ||||||||||||||||||||||
| EQUITY SWAPS | ||||||||||||||||||||||||||
Alten SA | $ | 130,099 | $ | 195,685 | 0.62 | % | Morgan Stanley & Co. LLC | 55 bps + 1M EURIB | -55 bps | 3/28/22 | $ | 65,587 | ||||||||||||||
Applus Services SA | 496,008 | 682,990 | 2.18 | % | Morgan Stanley & Co. LLC | 55 bps + 1M EURIB | -55 bps | 3/28/22 | 186,982 | |||||||||||||||||
Arjo AB - B Shares | 225,987 | 316,362 | 1.01 | % | Morgan Stanley & Co. LLC | 55 bps + 1M STIBO | -7 bps | 9/9/21 | 90,375 | |||||||||||||||||
Asml Holding NV | 475,187 | 777,453 | 2.48 | % | Morgan Stanley & Co. LLC | 55 bps + 1M EURIB | -55 bps | 3/28/22 | 302,266 | |||||||||||||||||
Asr Nederland NV | 703,927 | 1,018,338 | 3.25 | % | Morgan Stanley & Co. LLC | 55 bps + 1M EURIB | -55 bps | 3/28/22 | 314,411 | |||||||||||||||||
Avon Rubber PLC | 358,141 | 431,743 | 1.38 | % | Morgan Stanley & Co. LLC | 59 bps + 1D SONIA | 5 bps | 3/28/22 | 73,602 | |||||||||||||||||
Bankinter SA | 404,255 | 442,741 | 1.41 | % | Morgan Stanley & Co. LLC | 55 bps + 1M EURIB | -56 bps | 3/28/22 | 38,486 | |||||||||||||||||
Befesa SA | 282,517 | 445,747 | 1.42 | % | Morgan Stanley & Co. LLC | 55 bps + 1M EURIB | -55 bps | 3/25/22 | 163,230 | |||||||||||||||||
Breedon group PLC | 398,632 | 535,327 | 1.71 | % | Morgan Stanley & Co. LLC | 59 bps + 1D SONIA | 5 bps | 3/28/22 | 136,695 | |||||||||||||||||
Carrefour SA | 1,214,738 | 1,329,601 | 4.24 | % | Morgan Stanley & Co. LLC | 55 bps + 1M EURIB | -56 bps | 3/28/22 | 114,863 | |||||||||||||||||
Ceres Power Holdings PLC | 311,384 | 348,689 | 1.11 | % | Morgan Stanley & Co. LLC | 59 bps + 1D SONIA | 5 bps | 3/28/22 | 37,305 | |||||||||||||||||
Crh PLC | 265,059 | 378,099 | 1.21 | % | Morgan Stanley & Co. LLC | 55 bps + 1M EURIB | -55 bps | 3/28/22 | 113,040 | |||||||||||||||||
Erste Group Bank AG | 424,119 | 626,227 | 2.00 | % | Morgan Stanley & Co. LLC | 55 bps + 1M EURIB | -55 bps | 3/28/22 | 202,108 | |||||||||||||||||
Ferguson PLC | 324,686 | 455,636 | 1.45 | % | Morgan Stanley & Co. LLC | 59 bps + 1D SONIA | 5 bps | 3/28/22 | 130,949 | |||||||||||||||||
Finecobank SPA | 967,082 | 1,147,267 | 3.66 | % | Morgan Stanley & Co. LLC | 55 bps + 1M EURIB | -55 bps | 3/28/22 | 180,185 | |||||||||||||||||
Fluidra SA | 398,719 | 624,082 | 1.99 | % | Morgan Stanley & Co. LLC | 55 bps + 1M EURIB | -55 bps | 3/28/22 | 225,363 | |||||||||||||||||
Games Workshop Group PLC | 616,311 | 705,410 | 2.25 | % | Morgan Stanley & Co. LLC | 59 bps + 1D SONIA | 5 bps | 3/28/22 | 89,100 | |||||||||||||||||
Grafton Group PLC-UTS | 459,279 | 707,319 | 2.26 | % | Morgan Stanley & Co. LLC | 59 bps + 1D SONIA | 5 bps | 3/28/22 | 248,040 | |||||||||||||||||
GVS SPA | 465,998 | 585,357 | 1.87 | % | Morgan Stanley & Co. LLC | 55 bps + 1M EURIB | -55 bps | 3/28/22 | 119,359 | |||||||||||||||||
Howden Joinery Group PLC | 529,838 | 688,149 | 2.19 | % | Morgan Stanley & Co. LLC | 59 bps + 1D SONIA | 5 bps | 3/28/22 | 158,311 | |||||||||||||||||
Inficon Holding AG-Reg | 315,868 | 384,370 | 1.23 | % | Morgan Stanley & Co. LLC | 49 bps + 1D SARON | -73 bps | 3/28/22 | 68,502 | |||||||||||||||||
Inmobiliaria Colonial Socimi | 527,765 | 568,516 | 1.81 | % | Morgan Stanley & Co. LLC | 55 bps + 1M EURIB | -55 bps | 3/28/22 | 40,751 | |||||||||||||||||
Intermediate Capital Group | 166,672 | 246,839 | 0.79 | % | Morgan Stanley & Co. LLC | 59 bps + 1D SONIA | 5 bps | 3/28/22 | 80,166 | |||||||||||||||||
Intertrust NV | 407,836 | 465,954 | 1.49 | % | Morgan Stanley & Co. LLC | 55 bps + 1M EURIB | -55 bps | 3/28/22 | 58,118 | |||||||||||||||||
Jupiter Fund Management | 271,238 | 309,588 | 0.99 | % | Morgan Stanley & Co. LLC | 59 bps + 1D SONIA | 5 bps | 3/28/22 | 38,350 | |||||||||||||||||
Koninklijke Philips NV | 366,202 | 410,880 | 1.31 | % | Morgan Stanley & Co. LLC | 55 bps + 1M EURIB | -55 bps | 3/28/22 | 44,678 | |||||||||||||||||
Korian | 601,935 | 733,501 | 2.34 | % | Morgan Stanley & Co. LLC | 55 bps + 1M EURIB | -55 bps | 3/28/22 | 131,566 | |||||||||||||||||
Laboratorios Farmaceuticos R | 460,138 | 688,275 | 2.20 | % | Morgan Stanley & Co. LLC | 55 bps + 1M EURIB | -55 bps | 3/28/22 | 228,137 | |||||||||||||||||
Lamda Development SA | 560,896 | 714,038 | 2.28 | % | Morgan Stanley & Co. LLC | 175 bps + 1M EURIB | -55 bps | 2/23/22 | 153,142 | |||||||||||||||||
Linea Directa Aseguradora SA | 145,574 | 158,365 | 0.51 | % | Morgan Stanley & Co. LLC | 55 bps + 1M EURIB | -56 bps | 3/28/22 | 12,790 | |||||||||||||||||
Lonza Group AG-Reg | 496,889 | 572,170 | 1.83 | % | Morgan Stanley & Co. LLC | 49 bps + 1D SARON | -73 bps | 3/28/22 | 75,281 | |||||||||||||||||
Merck Kgaa | 845,599 | 920,704 | 2.94 | % | Morgan Stanley & Co. LLC | 55 bps + 1M EURIB | -55 bps | 3/25/22 | 75,105 | |||||||||||||||||
Moncler SPA | 270,941 | 349,450 | 1.11 | % | Morgan Stanley & Co. LLC | 55 bps + 1M EURIB | -55 bps | 3/28/22 | 78,510 | |||||||||||||||||
Musti Group Oy | 181,235 | 233,194 | 0.74 | % | Morgan Stanley & Co. LLC | 55 bps + 1M EURIB | -56 bps | 3/28/22 | 51,959 | |||||||||||||||||
Nestle SA-Reg | 1,056,133 | 1,111,599 | 3.55 | % | Morgan Stanley & Co. LLC | 49 bps + 1D SARON | -73 bps | 3/28/22 | 55,466 | |||||||||||||||||
Piaggio & C. S.P.A. | 228,183 | 330,111 | 1.05 | % | Morgan Stanley & Co. LLC | 55 bps + 1M EURIB | -55 bps | 3/28/22 | 101,929 | |||||||||||||||||
Robertet SA | 658,085 | 777,283 | 2.48 | % | Morgan Stanley & Co. LLC | 55 bps + 1M EURIB | -55 bps | 3/28/22 | 119,198 | |||||||||||||||||
Roche Holding Ag-Genusschein | 923,450 | 885,224 | 2.82 | % | Morgan Stanley & Co. LLC | 49 bps + 1D SARON | -73 bps | 3/28/22 | (38,227 | ) | ||||||||||||||||
Sbanken ASA | 377,466 | 570,628 | 1.82 | % | Morgan Stanley & Co. LLC | 55 bps + 1M NIBOR | 26 bps | 5/2/22 | 193,162 | |||||||||||||||||
Thule Group AB/The | 602,633 | 744,420 | 2.37 | % | Morgan Stanley & Co. LLC | 55 bps + 1M STIBO | -7 bps | 9/9/21 | 141,786 | |||||||||||||||||
Vivendi | 1,060,502 | 1,307,316 | 4.17 | % | Morgan Stanley & Co. LLC | 55 bps + 1M EURIB | -55 bps | 3/28/22 | 246,814 | |||||||||||||||||
Worldline SA | 631,265 | 697,681 | 2.23 | % | Morgan Stanley & Co. LLC | 55 bps + 1M EURIB | -55 bps | 3/28/22 | 66,417 | |||||||||||||||||
EQUITY SWAPS Total | 20,608,471 | 25,622,328 | 81.75 | % |
|
|
|
| ||||||||||||||||||
INDEX OPTIONS CONTRACTS |
|
|
|
| ||||||||||||||||||||||
EURO STOXX 50 PR P @ 3850 JUN 21 | 48 | 37,365 | 37,365 | 0.12 | % | Morgan Stanley & Co. LLC |
|
|
| |||||||||||||||||
INDEX OPTIONS CONTRACTS Total | 37,365 | 37,365 | 0.12 | % |
|
|
|
| ||||||||||||||||||
TOTAL LONG | 20,645,836 | 25,659,693 | 81.87 | % |
|
|
|
| ||||||||||||||||||
See Notes to Financial Statements.
Annual Report | April 30, 2021 | 13 |
Highland Resolute Fund | Consolidated Schedule of Investments |
April 30, 2021
Description | Contracts | Notional | Value | Percentage | Counterparty | Floating Rate/ | Reference | Termination | Unrealized | |||||||||||||||||
SECURITIES SOLD SHORT |
|
|
|
| ||||||||||||||||||||||
EQUITY SWAPS |
|
|
|
| ||||||||||||||||||||||
DJS Mid 200 PR | $ | (2,647,947 | ) | $ | (3,297,231 | ) | -10.52 | % | Morgan Stanley & Co. LLC | 1D EONIA - 45 bps | -48 bps | 7/29/22 | $ | (649,284 | ) | |||||||||||
FTSE 250 Index | (508,940 | ) | (568,145 | ) | -1.81 | % | Morgan Stanley & Co. LLC | 1D SONIA - 50 bps | 5 bps | 11/21/22 | (59,205 | ) | ||||||||||||||
Learning Technologies Group | (236,043 | ) | (331,826 | ) | -1.06 | % | Morgan Stanley & Co. LLC | 1D SONIA - 35 bps | 5 bps | 3/28/22 | (95,783 | ) | ||||||||||||||
Stoxx-DJ Small 200 Price | (2,885,207 | ) | (3,432,918 | ) | -10.95 | % | Morgan Stanley & Co. LLC | 1D EONIA - 71 bps | -48 bps | 7/29/22 | (547,711 | ) | ||||||||||||||
Technogym SPA | (256,324 | ) | (306,363 | ) | -0.98 | % | Morgan Stanley & Co. LLC | 1D EONIA - 50 bps | -48 bps | 3/28/22 | (50,039 | ) | ||||||||||||||
Varta AG | (508,512 | ) | (467,793 | ) | -1.49 | % | Morgan Stanley & Co. LLC | 1D EONIA - 800 bps | -48 bps | 3/25/22 | 40,719 | |||||||||||||||
EQUITY SWAPS Total | (7,042,973 | ) | (8,404,276 | ) | -26.81 | % |
|
|
|
| ||||||||||||||||
INDEX FUTURE CONTRACTS |
|
|
|
| ||||||||||||||||||||||
EURO STOXX 50 JUN21 | (112 | ) | (5,292,523 | ) | (88,380 | ) | -0.28 | % | Morgan Stanley & Co. LLC |
|
|
| ||||||||||||||
INDEX FUTURE CONTRACTS Total | (5,292,523 | ) | (88,380 | ) | -0.28 | % |
|
|
|
| ||||||||||||||||
TOTAL SHORT | (12,335,496 | ) | (8,492,656 | ) | -27.09 | % |
|
|
|
| ||||||||||||||||
REMAINING SECURITIES AND CASH | 14,184,652 | 45.24 | % |
|
|
|
| |||||||||||||||||||
GRAND TOTAL | $ | 31,351,689 |
|
|
|
| ||||||||||||||||||||
| PSAM HIGHLAND | ||||||||||||
| Description | Contracts/Shares | Value | Percentage of Value | |||||||||
| LONG SECURITIES | ||||||||||||
| CORPORATE BONDS | ||||||||||||
| Bruce Mansfield Unit 1 6.85% June 1, 2034 | 2,311,228 | $ | 2,889 | 1.85 | % | |||||||
| First Union Real Estate 6.05% August 15, 2021 | 33,178 | 42 | 0.03 | % | ||||||||
| First Union Real Estate 6.80% August 15, 2039 | 132,224 | 165 | 0.11 | % | ||||||||
| CORPORATE BONDS Total | 3,096 | 1.99 | % | |||||||||
| TOTAL LONG | 3,096 | 1.99 | % | |||||||||
| REMAINING CASH | 152,823 | 98.01 | % | |||||||||
| GRAND TOTAL | $ | 155,919 | ||||||||||
See Notes to Financial Statements.
14
Highland Resolute Fund | Consolidated Schedule of Investments |
April 30, 2021
WABR
| Description | Contracts/Shares | Notional Value | Value | Percentage of Value | Counterparty | |||||||||||||
| LONG SECURITIES | ||||||||||||||||||
| COMMON STOCKS | ||||||||||||||||||
| Acadia Realty REIT | 4,829 | $ | 100,878 | 0.36 | % | |||||||||||||
| Alexion Pharmaceuticals | 964 | 162,608 | 0.58 | % | ||||||||||||||
| Alphabet Class A | 62 | 145,919 | 0.52 | % | ||||||||||||||
| Amazon | 44 | 152,566 | 0.54 | % | ||||||||||||||
| Americold Realty | 3,042 | 122,866 | 0.44 | % | ||||||||||||||
| CM Life Sciences Class A | 6,910 | 93,631 | 0.33 | % | ||||||||||||||
| Coherent | 965 | 250,890 | 0.90 | % | ||||||||||||||
| Commscope Holding | 8,601 | 141,487 | 0.51 | % | ||||||||||||||
| Fedex | 439 | 127,447 | 0.46 | % | ||||||||||||||
| Hitachi | 1,880 | 92,547 | 0.33 | % | ||||||||||||||
| IHS Markit | 993 | 106,827 | 0.38 | % | ||||||||||||||
| Ishares Iboxx High Yield Bond ETF | 39,345 | 3,440,327 | 12.29 | % | ||||||||||||||
| Ishares Iboxx Investment Grade Bond ETF | 26,229 | 3,439,933 | 12.29 | % | ||||||||||||||
| Kansas City Southern | 1,012 | 295,716 | 1.06 | % | ||||||||||||||
| Medical Properties REIT | 5,262 | 116,027 | 0.41 | % | ||||||||||||||
| Micron Technology | 1,303 | 112,149 | 0.40 | % | ||||||||||||||
| Netstreit | 6,032 | 125,647 | 0.45 | % | ||||||||||||||
| Palo Alto Networks | 330 | 116,619 | 0.42 | % | ||||||||||||||
| Piedmont Office REIT Class A | 6,525 | 121,496 | 0.43 | % | ||||||||||||||
| RPT Realty | 7,266 | 92,351 | 0.33 | % | ||||||||||||||
| Sabra Health Care REIT | 5,064 | 92,013 | 0.33 | % | ||||||||||||||
| Slack Technologies Class A | 7,251 | 307,442 | 1.10 | % | ||||||||||||||
| Ventas REIT | 2,004 | 111,142 | 0.40 | % | ||||||||||||||
| Vereit | 1,955 | 93,527 | 0.33 | % | ||||||||||||||
| Volkswagen PRF | 345 | 89,879 | 0.32 | % | ||||||||||||||
| Weingarten Realty REIT | 3,095 | 100,092 | 0.36 | % | ||||||||||||||
| COMMON STOCKS Total | 10,152,026 | 36.26 | % | |||||||||||||||
| CORPORATE BONDS | ||||||||||||||||||
| bespl emtn 0.0000% 2035-01-15 | 700,000 | 171,638 | 0.61 | % | ||||||||||||||
| CORPORATE BONDS Total | 171,638 | 0.61 | % | |||||||||||||||
| INDEX FUTURE CONTRACTS | ||||||||||||||||||
| Emini S&P 500 stock index jun-21 | 9 | 1,878,480 | 97,290 | 0.35 | % | Morgan Stanley & Co. LLC | ||||||||||||
| INDEX FUTURE CONTRACTS Total | 1,878,480 | 97,290 | 0.35 | % | ||||||||||||||
| TOTAL LONG | 1,878,480 | 10,420,954 | 37.23 | % | ||||||||||||||
See Notes to Financial Statements.
Annual Report | April 30, 2021 | 15 |
Highland Resolute Fund | Consolidated Schedule of Investments |
April 30, 2021
| Description | Contracts/Shares | Notional Value | Value | Percentage of Value | Counterparty | |||||||||||||
| SECURITIES SOLD SHORT | ||||||||||||||||||
| COMMON STOCKS | ||||||||||||||||||
| American Homes 4 rent Class A REIT | (2,964 | ) | $ | (109,787 | ) | -0.39 | % | |||||||||||
| Ark Innovation ETF | (1,952 | ) | (235,743 | ) | -0.84 | % | ||||||||||||
| Astrazeneca ADR | (1,783 | ) | (94,624 | ) | -0.34 | % | ||||||||||||
| Brandywine Realty REIT | (8,574 | ) | (116,006 | ) | -0.41 | % | ||||||||||||
| Broadridge Financial Solutions | (629 | ) | (99,778 | ) | -0.36 | % | ||||||||||||
| Camden Property REIT | (893 | ) | (107,589 | ) | -0.38 | % | ||||||||||||
| Dominos Pizza | (240 | ) | (101,362 | ) | -0.36 | % | ||||||||||||
| Electronic Arts | (1,394 | ) | (198,059 | ) | -0.71 | % | ||||||||||||
| Healthcare Real REIT | (3,070 | ) | (98,731 | ) | -0.35 | % | ||||||||||||
| Invesco QQQ Trust ETF | (1,448 | ) | (489,408 | ) | -1.75 | % | ||||||||||||
| Ishares Expanded Tech ETF | (572 | ) | (206,830 | ) | -0.74 | % | ||||||||||||
| Ishares Russell 2000 ETF | (1,222 | ) | (274,815 | ) | -0.98 | % | ||||||||||||
| Ishares Transportation Average ETF | (354 | ) | (95,604 | ) | -0.34 | % | ||||||||||||
| Ishares US Real Estate ETF | (1,532 | ) | (151,959 | ) | -0.54 | % | ||||||||||||
| Ishares US Technology ETF | (1,328 | ) | (123,584 | ) | -0.44 | % | ||||||||||||
| National Retail Properties REIT | (2,442 | ) | (113,358 | ) | -0.40 | % | ||||||||||||
| Prologis REIT | (1,173 | ) | (136,690 | ) | -0.49 | % | ||||||||||||
| Salesforce.com | (384 | ) | (88,443 | ) | -0.32 | % | ||||||||||||
| SPDR S&P 500 ETF | (1,966 | ) | (820,412 | ) | -2.93 | % | ||||||||||||
| Vaneck Vectors Semiconductor ETF | (459 | ) | (111,537 | ) | -0.40 | % | ||||||||||||
| Vanguard Real Estate ETF | (2,799 | ) | (277,325 | ) | -0.99 | % | ||||||||||||
| Verizon Communications | (2,696 | ) | (155,802 | ) | -0.56 | % | ||||||||||||
| COMMON STOCKS Total | (4,207,446 | ) | -15.03 | % | ||||||||||||||
| TOTAL SHORT | (4,207,446 | ) | -15.03 | % | ||||||||||||||
| REMAINING SECURITIES AND CASH | 21,780,805 | 77.80 | % | |||||||||||||||
| GRAND TOTAL | $ | 27,994,313 | ||||||||||||||||
Common Abbreviations:
ETF - Exchange Traded Fund.
EURIBOR - Euro Interbank Offered Rate.
LIBOR - London Interbank Offered Rate.
PIMCO - Pacific Investment Management Company.
REIT - Real Estate Investment Trust
S&P - Standard & Poor’s.
SPDR - Standard & Poor’s Depositary Receipt.
Currency Abbreviations:
EUR - Euro
See Notes to Financial Statements.
16
Highland Resolute Fund | Consolidated Statement of Assets and Liabilities |
| April 30, 2021 |
ASSETS |
|
|
|
|
Investments, at value |
| $ | 114,923,973 |
|
Unrealized appreciation on total return swap contracts |
|
| 17,354 |
|
Cash |
|
| 1,439,342 |
|
Deposits with brokers for total return swap contracts and written options |
|
| 42,490,000 |
|
Receivable for investments sold |
|
| 31,522 |
|
Dividends receivable |
|
| 38,110 |
|
Interest receivable |
|
| 10,877 |
|
Receivable for total return swap reset |
|
| 1,242,488 |
|
Other assets |
|
| 8,773 |
|
Total assets |
|
| 160,202,439 |
|
LIABILITIES |
|
|
|
|
Written options, at value (Premiums received 152,485) |
|
| 101,425 |
|
Unrealized depreciation on total return swap contracts |
|
| 48,410 |
|
Investment advisory fees payable |
|
| 50,111 |
|
Shareholder service fees payable |
|
| 24,112 |
|
Payable for interest expense on total return swap contracts |
|
| 72,250 |
|
Payable for total return swap reset |
|
| 119,473 |
|
Payable for investments purchased |
|
| 26,355 |
|
Variation margin payable |
|
| 104,400 |
|
Trustee fees and expenses payable |
|
| 14,456 |
|
Chief compliance officer fees payable |
|
| 13,127 |
|
Principal financial officer fees payable |
|
| 2,573 |
|
Administration fees payable |
|
| 76,681 |
|
Transfer agency fees payable |
|
| 15,173 |
|
Professional fees payable |
|
| 60,479 |
|
Custody fees payable |
|
| 16,568 |
|
Accrued expenses and other liabilities |
|
| 14,670 |
|
Total liabilities |
|
| 760,263 |
|
NET ASSETS |
| $ | 159,442,176 |
|
NET ASSETS CONSIST OF |
|
|
|
|
Paid-in capital (Note 6) |
| $ | 149,357,041 |
|
Total distributable earnings/(loss) |
|
| 10,085,135 |
|
NET ASSETS |
| $ | 159,442,176 |
|
INVESTMENTS, AT COST |
| $ | 97,568,456 |
|
PRICING OF SHARES |
|
|
|
|
Class I: |
|
|
|
|
Net Asset Value, offering and redemption price per share |
| $ | 11.58 |
|
Net Assets |
| $ | 159,442,176 |
|
Shares of beneficial interest outstanding (unlimited number of shares, no par value common stock authorized) |
|
| 13,771,457 |
|
See Notes to Financial Statements. |
|
Annual Report | April 30, 2021 | 17 |
Highland Resolute Fund | Consolidated Statement of Operations |
| For the Year Ended April 30, 2021 |
INVESTMENT INCOME |
|
|
|
|
Dividends |
| $ | 3,544,755 |
|
Interest |
|
| 204,346 |
|
Foreign taxes withheld |
|
| (4,173 | ) |
Total investment income |
|
| 3,744,928 |
|
|
|
|
|
|
EXPENSES |
|
|
|
|
Investment advisory fees (Note 7) |
|
| 3,006,453 |
|
Investment advisory fees-subsidiary |
|
| 253,601 |
|
Administration fees |
|
| 425,763 |
|
Transfer agency fees |
|
| 100,241 |
|
Shareholder service fees |
|
|
|
|
Class I |
|
| 18,796 |
|
Professional fees |
|
| 78,382 |
|
Custody fees |
|
| 69,108 |
|
Reports to shareholders and printing fees |
|
| 6,948 |
|
Trustee fees and expenses |
|
| 15,862 |
|
Registration/filing fees |
|
| 26,937 |
|
Chief compliance officer fees |
|
| 78,582 |
|
Principal financial officer fees |
|
| 15,320 |
|
Other |
|
| 34,852 |
|
Total expenses before waivers |
|
| 4,130,845 |
|
Less fees waived/reimbursed by investment adviser (Note 7) |
|
|
|
|
Class I |
|
| (2,869,225 | ) |
Waiver of investment advisory fees - subsidiary (Note 7) |
|
| (253,601 | ) |
Total net expenses |
|
| 1,008,019 |
|
NET INVESTMENT INCOME |
|
| 2,736,909 |
|
Net realized gain on investments |
|
| 10,447,246 |
|
Net realized gain on futures contracts |
|
| 154,061 |
|
Net realized gain on written options |
|
| 1,844,271 |
|
Net realized gain on total return swap contracts |
|
| 11,026,895 |
|
Net realized gain on foreign currency transactions |
|
| 43,346 |
|
Total net realized gain |
|
| 23,515,819 |
|
|
|
|
|
|
Net change in unrealized appreciation on investments |
|
| 15,306,567 |
|
Net change in unrealized appreciation on written options |
|
| 20,426 |
|
Net change in unrealized appreciation on futures contracts |
|
| 765,320 |
|
Net change in unrealized depreciation on total return swap contracts |
|
| (31,082 | ) |
Net change in unrealized depreciation on translation of assets and liabilities in foreign currency transactions |
|
| (11 | ) |
Total net change in unrealized appreciation |
|
| 16,061,220 |
|
NET REALIZED AND UNREALIZED GAIN ON INVESTMENTS |
|
| 39,577,039 |
|
NET INCREASE IN NET ASSETS RESULTING FROM OPERATIONS |
| $ | 42,313,948 |
|
See Notes to Financial Statements. |
18 |
Highland Resolute Fund | Consolidated Statements of Changes in Net Assets |
| For the Year Ended April 30, 2021 | For the Year Ended April 30, 2020 | |||||||
| OPERATIONS | ||||||||
| Net investment income | $ | 2,736,909 | $ | 5,499,415 | ||||
| Net realized gain/(loss) | 23,515,819 | (37,178,643 | ) | |||||
| Net change in unrealized appreciation | 16,061,220 | 1,872,075 | ||||||
| Net increase/(decrease) in net assets resulting from operations | 42,313,948 | (29,807,153 | ) | |||||
| TOTAL DISTRIBUTIONS (NOTE 4) | ||||||||
| Class I | – | (3,500,019 | ) | |||||
| Net decrease in net assets from distributions | – | (3,500,019 | ) | |||||
| BENEFICIAL INTEREST TRANSACTIONS (NOTE 6) | ||||||||
| Shares sold | ||||||||
| Class I | 28,612,421 | 9,378,217 | ||||||
| Dividends reinvested | ||||||||
| Class I | – | 3,500,019 | ||||||
| Shares redeemed, net of redemption fees | ||||||||
| Class I | (91,284,334 | ) | (132,205,860 | ) | ||||
| Net decrease in net assets derived from beneficial interest transactions | (62,671,913 | ) | (119,327,624 | ) | ||||
| Net decrease in Net Assets | (20,357,965 | ) | (152,634,796 | ) | ||||
| NET ASSETS: | ||||||||
| Beginning of period | 179,800,141 | 332,434,937 | ||||||
| End of period | $ | 159,442,176 | $ | 179,800,141 | ||||
See Notes to Financial Statements. |
|
Annual Report | April 30, 2021 | 19 |
Highland Resolute Fund | Consolidated Financial Highlights |
| For a share outstanding throughout the years presented |
| Class I | ||||||||||||||||||||
| For the Year Ended April 30, 2021 | For the Year Ended April 30, 2020 | For the Year Ended April 30, 2019 | For the Year Ended April 30, 2018(a) | For the Year Ended April 30, 2017(b) | ||||||||||||||||
| NET ASSET VALUE, BEGINNING OF PERIOD | $ | 9.28 | $ | 10.30 | $ | 10.81 | $ | 11.14 | $ | 10.75 | ||||||||||
| INCOME/(LOSS) FROM OPERATIONS | ||||||||||||||||||||
| Net investment income(c) | 0.14 | 0.19 | 0.20 | 0.25 | 0.09 | |||||||||||||||
| Net realized and unrealized gain/(loss) on investments | 2.16 | (1.09 | ) | (0.22 | ) | 0.38 | 0.45 | |||||||||||||
| Total from Investment Operations | 2.30 | (0.90 | ) | (0.02 | ) | 0.63 | 0.54 | |||||||||||||
| LESS DISTRIBUTIONS | ||||||||||||||||||||
| Net investment income | – | (0.12 | ) | (0.15 | ) | (0.77 | ) | (0.13 | ) | |||||||||||
| Net realized gain on investments | – | – | (0.34 | ) | (0.19 | ) | (0.02 | ) | ||||||||||||
| Total Distributions | – | (0.12 | ) | (0.49 | ) | (0.96 | ) | (0.15 | ) | |||||||||||
| NET INCREASE/(DECREASE) IN NET ASSET VALUE | 2.30 | (1.02 | ) | (0.51 | ) | (0.33 | ) | 0.39 | ||||||||||||
| NET ASSET VALUE, END OF PERIOD | $ | 11.58 | $ | 9.28 | $ | 10.30 | $ | 10.81 | $ | 11.14 | ||||||||||
| TOTAL RETURN(d) | 24.78 | % | (8.65 | )% | 0.22 | % | 5.51 | % | 5.04 | % | ||||||||||
| RATIOS/SUPPLEMENTAL DATA | ||||||||||||||||||||
| Net assets, End of Period (000s) | $ | 159,442 | $ | 179,800 | $ | 332,435 | $ | 373,865 | $ | 491,811 | ||||||||||
| RATIOS TO AVERAGE NET ASSETS: | ||||||||||||||||||||
| Operating expenses excluding reimbursement/waiver(e) | 1.94 | %(f)(g) | 1.90 | %(f)(g) | 1.89 | %(f)(g) | 1.94 | %(f)(g) | 1.77 | %(f)(g) | ||||||||||
| Operating expenses including reimbursement/waiver(e) | 0.50 | %(f) | 0.69 | %(f) | 0.74 | %(f) | 0.82 | %(f) | 0.52 | %(f) | ||||||||||
| Net investment income including reimbursement/waiver(e) | 1.37 | % | 1.89 | % | 1.95 | % | 2.24 | % | 0.86 | % | ||||||||||
| PORTFOLIO TURNOVER RATE | 42 | % | 103 | % | 55 | % | 79 | % | 94 | % | ||||||||||
(a) | Prior to August 31, 2017 the Highland Resolute Fund was known as the Redmont Resolute Fund. |
(b) | Prior to August 31, 2016 the Highland Resolute Fund was known as the Redmont Resolute Fund II. |
(c) | Calculated using the average shares method. |
(d) | Total investment return is calculated assuming a purchase of a common share at the opening of the first day and a sale at closing on the last day of each period reported. Dividends and distributions, if any, are assumed for purposes of this calculation to be reinvested at prices obtained under the Fund’s dividend reinvestment plan. Total returns would have been lower had certain expenses not been waived during the period. Total investment returns do not reflect brokerage commissions, if any, and are not annualized. |
(e) | The ratios exclude the impact of expenses of the underlying funds in which the Fund invests as represented in the Consolidated Schedule of Investments. |
(f) | Dividend and interest expense on securities sold short totaled 0.00%, 0.09%, 0.19%, 0.25%, and 0.10% of average net assets for the years ended April 30, 2021, 2020, 2019, 2018, and 2017, respectively. |
(g) | The ratio of operating expenses excluding fee waiver/reimbursements to average net assets is calculated excluding the waived Subsidiary management fee (See Note 7 for additional detail). The ratio inclusive of that fee would be 2.06%, 1.99%, 1.97%, 2.01% and 1.81% for the years ended April 30, 2021, 2020, 2019, 2018 and 2017, respectively. |
See Notes to Financial Statements. |
20 |
| Highland Resolute Fund | Notes to Consolidated Financial Statements |
April 30, 2021
1. ORGANIZATION
Financial Investors Trust (the “Trust”), a Delaware statutory trust, is an open-end management investment company registered under the Investment Company Act of 1940, as amended (“1940 Act”). The Trust consists of multiple separate portfolios or series. This annual report describes the Highland Resolute Fund (the “Fund”). Effective August 31, 2017, the Fund changed its name from Redmont Resolute Fund. The Fund seeks to provide long-term total return with reduced volatility and reduced correlation to the conventional stock and bond markets. The Fund offers Class I shares.
Basis of Consolidation: Highland Resolute Cayman (the “Subsidiary”), a Cayman Islands exempted company, is a wholly owned subsidiary of the Fund. The Subsidiary’s investment objective is designed to enhance the ability of the Fund to obtain exposure to equities, financial, currency and commodities markets consistent with the limits of the U.S. federal tax law requirements applicable to registered investment companies. The Subsidiary is subject to substantially the same investment policies and investment restrictions as the Fund. The Subsidiary acts as an investment vehicle for the Fund in order to effect certain commodity-related investments on behalf of the Fund. Investments in the Subsidiary are expected to provide the Fund with exposure to the commodity markets within the limitations of Subchapter M of the Internal Revenue Code of 1986, as amended (the “Code”), and recent IRS revenue rulings, as discussed below under “Federal Income Taxes”. The Fund is the sole shareholder of the Subsidiary pursuant to a subscription agreement, and it is intended that the Fund will remain the sole shareholder and will continue to control the Subsidiary. Under the Articles of Association of the Subsidiary, shares issued by the Subsidiary confer upon a shareholder the right to wholly own and vote at general meetings of the Subsidiary and certain rights in connection with any winding-up or repayment of capital, as well as the right to participate in the profits or assets of the Subsidiary. The Fund may invest up to 25% of its total assets in shares of the Subsidiary. As a wholly owned subsidiary of the Fund, all assets and liabilities, income and expenses of the Subsidiary are consolidated in the financial statements and financial highlights of the Fund collectively referred to as the "financial statements" in these notes to the consolidated financial statements. All investments held by the Subsidiary are disclosed in the accounts of the Fund. As of April 30, 2021, net assets of the Fund were $159,442,176, of which $17,658,585 or 11.08%, represented the Fund’s ownership of all issued shares and voting rights of the Subsidiary. The Fund and the Subsidiary are "commodity pools" under the U.S. Commodity Exchange Act, and Highland Associates, Inc. (the "Adviser") is a "commodity pool operator" registered with and regulated by the Commodities Futures Trading Commission (CFTC).
2. SIGNIFICANT ACCOUNTING POLICIES
The accompanying financial statements were prepared in accordance with accounting principles generally accepted in the United States of America (“U.S. GAAP”). The preparation of financial statements in conformity with U.S. GAAP requires management to make certain estimates and assumptions that affect the reported amounts of assets and liabilities and disclosures of contingent assets and liabilities at the date of the financial statements and the reported amounts of increases and decreases in net assets from operations during the reporting period. Actual results could differ from those estimates. The Fund is considered an investment company for financial reporting purposes under U.S. GAAP and follows the accounting and reporting guidance applicable to investment companies in the Financial Accounting Standards Board ("FASB") Accounting Standards Codification (ASU) Topic 946 Financial Services – Investment Companies. The following is a summary of significant accounting policies consistently followed by the Fund and Subsidiary in preparation of the financial statements.
Investment Valuation: The Fund generally values its securities based on market prices determined at the close of regular trading on the New York Stock Exchange (“NYSE”), normally 4:00 p.m. Eastern Time, on each day the NYSE is open for trading.
For equity securities and mutual funds that are traded on an exchange, the market price is usually the closing sale or official closing price on that exchange. In the case of equity securities not traded on an exchange, or if such closing prices are not otherwise available, the securities are valued at the mean of the most recent bid and ask prices on such day. Redeemable securities issued by open-end registered investment companies are valued at the investment company’s applicable net asset value, with the exception of exchange-traded open-end investment companies, which are priced as equity securities.
The market price for debt obligations is generally the price supplied by an independent third-party pricing service approved by the Board of Trustees of the Trust (the “Board”), which may use a matrix, formula or other objective method that takes into consideration quotations from dealers, market transactions in comparable investments, market indices and yield curves. If vendors are unable to supply a price, or if the price supplied is deemed to be unreliable, the market price may be determined using quotations received from one or more brokers–dealers that make a market in the security. Municipal securities having a remaining maturity of greater than 60 days, are typically valued at the evaluated bid price formulated by an independent pricing service. Corporate Bonds, U.S. Government & Agency, and U.S. Treasury Bonds & Notes are valued using market models that consider trade data, quotations from dealers and active market makers, relevant yield curve and spread data, creditworthiness, trade data or market information on comparable securities, and other relevant security specific information. Mortgage-related and asset-backed securities are valued based on models that consider trade data, prepayment and default projections, benchmark yield and spread data and estimated cash flows of each tranche of the issuer. Publicly traded foreign government debt securities are typically traded internationally in the over-the-counter market and are valued at the mean between the bid and asked prices as of the close of business of that market.
| Annual Report | April 30, 2021 | 21 |
| Highland Resolute Fund | Notes to Consolidated Financial Statements |
April 30, 2021
Futures contracts that are listed or traded on a national securities exchange, commodities exchange, contract market or comparable over the counter market, and that are freely transferrable, are valued at their closing settlement price on the exchange on which they are primarily traded or based upon the current settlement price for a like instrument acquired on the day on which the instrument is being valued. A settlement price may not be used if the market moves with respect to a particular commodity. Over-the-counter swap contracts for which market quotations are readily available are valued based on quotes received from independent pricing services or one or more dealers that make markets in such securities. When an available price is not obtainable, the last traded priced is utilized to value the swap contracts, or price is provided by the swap provider or prime broker. Options contracts listed for trading on a securities exchange or board of trade are valued at the last quoted sales price or, in the absence of a sale at the mean of the last bid and asked price.
Forward currency exchange contracts have a fair value determined by the current foreign currency exchange forward rates. The foreign currency exchange forward rates are calculated using an automated system that estimates rates on the basis of the current day foreign currency exchange rates and forward foreign currency exchange rates supplied by a pricing service. Foreign exchange rates and forward foreign currency exchange rates may generally be obtained at the close of the NYSE, normally 4:00 p.m. Eastern Time.
When such prices or quotations are not available, or when the Adviser believes that they are unreliable, securities may be priced using fair value procedures approved by the Board.
Fair Value Measurements: The Fund discloses the classification of its fair value measurements following a three-tier hierarchy based on the inputs used to measure fair value. Inputs refer broadly to the assumptions that market participants would use in pricing the asset or liability, including assumptions about risk. Inputs may be observable or unobservable. Observable inputs reflect the assumptions market participants would use in pricing the asset or liability that are developed based on market data obtained from sources independent of the reporting entity. Unobservable inputs reflect the reporting entity’s own assumptions about the assumptions market participants would use in pricing the asset or liability that are developed based on the best information available.
Various inputs are used in determining the value of the Fund’s investments as of the end of the reporting period. When inputs used fall into different levels of the fair value hierarchy, the level in the hierarchy within which the fair value measurement falls is determined based on the lowest level input that is significant to the fair value measurement in its entirety. The designated input levels are not necessarily an indication of the risk or liquidity associated with these investments. These inputs are categorized in the following hierarchy under applicable financial accounting standards:
| Level 1 – | Unadjusted quoted prices in active markets for identical investments, unrestricted assets or liabilities that the Fund has the ability to access at the measurement date; |
| Level 2 – | Quoted prices which are not active, quoted prices for similar assets or liabilities in active markets or inputs other than quoted prices that are observable (either directly or indirectly) for substantially the full term of the asset or liability; and |
| Level 3 – | Significant unobservable prices or inputs (including the Fund’s own assumptions in determining the fair value of investments) where there is little or no market activity for the asset or liability at the measurement date. |
22
| Highland Resolute Fund | Notes to Consolidated Financial Statements |
April 30, 2021
The following is a summary of the inputs used to value the Fund’s investments as of April 30, 2021:
Highland Resolute Fund
| Investments in Securities at Value* | Level 1 - Quoted Prices | Level 2 - Other Significant Observable Inputs | Level 3 - Significant Unobservable Inputs | Total | ||||||||||||
| Exchange Traded Funds | $ | 40,469,370 | $ | – | $ | – | $ | 40,469,370 | ||||||||
| Open-End Mutual Funds | 51,951,885 | – | – | 51,951,885 | ||||||||||||
| Government & Agency Obligations | – | 3,130,749 | – | 3,130,749 | ||||||||||||
| Short-Term Investments | ||||||||||||||||
| Money Market Fund | 16,536,255 | – | – | 16,536,255 | ||||||||||||
| U.S. Treasury Bills | – | 2,835,714 | – | 2,835,714 | ||||||||||||
| Total | $ | 108,957,510 | $ | 5,966,463 | $ | – | $ | 114,923,973 | ||||||||
| Other Financial Instruments** | ||||||||||||||||
| Assets: | ||||||||||||||||
| Futures Contracts | $ | 765,320 | $ | – | $ | – | $ | 765,320 | ||||||||
| Total Return Swap Contracts | – | 17,354 | – | 17,354 | ||||||||||||
| Liabilities: | ||||||||||||||||
| Written Option Contracts | (101,425 | ) | – | – | (101,425 | ) | ||||||||||
| Total Return Swap Contracts | – | (48,410 | ) | – | (48,410 | ) | ||||||||||
| Total | $ | 663,895 | $ | (31,056 | ) | $ | – | $ | 632,839 | |||||||
* | For detailed descriptions, see the accompanying Consolidated Schedule of Investments. |
** | Other financial instruments are derivative instruments reflected in the Consolidated Schedule of Investments. The Total Return Swap Contracts and Futures shown in the table are reported at their unrealized appreciation/(depreciation) at the measurement date, which represents the change in the contract’s value from trade date. |
The changes of the fair value of investments for which the Fund have used Level 3 inputs to determine the fair value are as follows:
| Highland Resolute Fund | Common Stocks | Preferred Stocks | Total | |||||||||
| Balance as of April 30, 2020 | $ | 359,388 | $ | 2,166,219 | $ | 2,525,607 | ||||||
| Accrued Discount/Premium | – | – | – | |||||||||
| Realized Gain/(Loss) | (40,781 | ) | (245,828 | ) | (286,609 | ) | ||||||
| Change in Unrealized Appreciation/(Depreciation) | 25,542 | 153,957 | 179,499 | |||||||||
| Purchases | – | – | – | |||||||||
| Sales Proceeds | (344,149 | ) | (2,074,348 | ) | (2,418,497 | ) | ||||||
| Transfer into Level 3 | – | – | – | |||||||||
| Transfer out of Level 3 | – | – | – | |||||||||
| Balance as of April 30, 2021 | $ | – | $ | – | $ | – | ||||||
| Net change in unrealized Appreciation/(Depreciation) attributable to Level 3 investments held at April 30, 2021 | $ | – | $ | – | $ | – | ||||||
As of April 30, 2021 the Fund did not have any securities that used significant unobservable inputs (Level 3) in determining fair value.
| Annual Report | April 30, 2021 | 23 |
| Highland Resolute Fund | Notes to Consolidated Financial Statements |
April 30, 2021
Trust Expenses: Some expenses of the Trust can be directly attributed to the Fund. Expenses which cannot be directly attributed to the Fund are apportioned among all funds in the Trust based on average net assets of the Fund.
Federal Income Taxes: The Fund complies with the requirements under Subchapter M of the Internal Revenue Code of 1986, as amended, applicable to regulated investment companies and intends to distribute substantially all of its net taxable income and net capital gains, if any, each year so that the Fund will not be subject to excise tax on undistributed income and gains. The Fund is not subject to income taxes to the extent such distributions are made.
As of and during the year ended April 30, 2021, the Fund did not have a liability for any unrecognized tax benefits. The Fund files U.S. federal, state, and local tax returns as required. The Fund’s tax returns are subject to examination by the relevant tax authorities until expiration of the applicable statute of limitations, which is generally three years after the filing of the tax return for federal purposes and four years for most state returns. Tax returns for open years have incorporated no uncertain tax positions that require a provision for income taxes. For tax purposes, the Subsidiary is an exempt Cayman Islands investment company and has received an undertaking from the Government of the Cayman Islands exempting it from all local income, profits, and capital gains taxes. No such taxes are levied in the Cayman Islands at the present time. For U.S. income tax purposes, the Subsidiary is a controlled foreign corporation ("CFC") and as such is not subject to U.S. income tax. However, as a wholly-owned CFC, the net income and capital gain of the CFC, to the extent of its earnings and profits, will be included each year in the Fund’s taxable income. The Fund recognizes interest and penalties, if any, related to tax liabilities as income tax expense in the Consolidated Statement of Operations.
Concentration of Credit Risk: The Fund places its cash with a banking institution, which is insured by the FDIC. The FDIC limit is $250,000. At various times throughout the year, the amount on deposit may exceed the FDIC limit and subject the Fund to a credit risk. The Fund does not believe that such deposits are subject to any unusual risk associated with investment activities.
Investment Transactions and Investment Income: Investment transactions are accounted for on the date the investments are purchased or sold (trade date basis). Net realized gains and losses from investment transactions are reported on an identified cost basis. Interest income, which includes accretion of discounts and amortization of premiums, is accrued and recorded as earned using the effective yield method. Dividend income is recognized on the ex-dividend date or for withholding taxes or certain foreign securities, as soon as information is available to the Fund. Withholding taxes on foreign dividends are paid (a portion of which may be reclaimable) or provided for in accordance with the applicable country’s tax rules and rates and are disclosed in the Consolidated Statement of Operations.
Foreign Securities: The Fund may directly purchase securities of foreign issuers. Investing in securities of foreign issuers involves special risks not typically associated with investing in securities of U.S. issuers. The risks include possible re-evaluation of currencies, the inability to repatriate foreign currency, less complete financial information about companies and possible future adverse political and economic developments. Moreover, securities of many foreign issuers and their markets may be less liquid and their prices more volatile than those of securities of comparable U.S. issuers.
Foreign Currency Translation: Values of investments denominated in foreign currencies are converted into U.S. dollars using the current exchange rates each business day (generally 4:00 p.m. Eastern Time). Purchases and sales of investments and dividend income are translated into U.S. dollars using the current prevailing exchange rate on the transaction date. The effect of changes in foreign exchange rates on realized and unrealized gains or losses on securities is reflected as a component of such gains or losses. Transactions in foreign denominated assets may involve greater risks than domestic transactions.
Short Sales: The Fund may make short sales of securities consistent with its strategies. A short sale is a transaction in which a Fund sells a security it does not own in anticipation that the market price of that security will decline.
When a Fund makes a short sale, it must borrow the security sold short and deliver it to the broker dealer through which it made the short sale as collateral for its obligation to deliver the security upon conclusion of the sale. The Fund may have to pay a fee to borrow particular securities and is often obligated to pay over any accrued interest and dividends on such borrowed securities.
If the price of the security sold short increases between the time of the short sale and the time that a Fund replaces the borrowed security, the Fund will incur a loss; conversely, if the price declines, the Fund will realize a capital gain. Any gain will be decreased, and any loss increased, by the transaction costs described above. The successful use of short selling may be adversely affected by imperfect correlation between movements in the price of the security sold short and the securities being hedged. Losses incurred from engaging in short sales may be unlimited.
24
| Highland Resolute Fund | Notes to Consolidated Financial Statements |
April 30, 2021
To the extent that a Fund engages in short sales, it will provide collateral to the broker-dealer and (except in the case of short sales “against the box”) will maintain additional asset coverage in the form of segregated or “earmarked” assets determined to be liquid in accordance with procedures established by the Board and that is equal to the current market value of the securities sold short, or will ensure that such positions are covered by “offsetting” positions, until the Fund replaces the borrowed security. A short sale is “against the box” to the extent that the Fund contemporaneously owns, or has the right to obtain at no added cost, securities identical to those sold short. The Fund may engage in short selling to the extent permitted by the federal securities laws and rules and interpretations thereunder. To the extent a Fund engages in short selling in foreign (non-U.S.) jurisdictions, the Fund will do so to the extent permitted by the laws and regulations of such jurisdiction.
Distributions to Shareholders: The Fund normally pays dividends and distributes capital gains, if any, on an annual basis. Income dividend distributions are derived from interest and dividends and other income the Fund receives from their investments, including distributions of short term capital gains. Capital gain distributions are derived from gains realized when the Fund sells a security it has owned for more than a year. The Fund may make additional distributions and dividends at other times if its portfolio manager or managers believe doing so may be necessary for the Fund to avoid or reduce taxes.
Epidemic and Pandemic Risk: Certain countries have been susceptible to epidemics, most recently COVID-19, which has been designated as a pandemic by world health authorities. The outbreak of such epidemics, together with any resulting restrictions on travel or quarantines imposed, could have a negative impact on the economy and business activity globally (including in the countries in which we invest), and thereby could adversely affect the performance of our investments. Furthermore, the rapid development of epidemics could preclude prediction as to their ultimate adverse impact on economic and market conditions, and, as a result, present material uncertainty and risk with respect to us and the performance of our investments.
Libor Risk: In March 2020, the FASB issued ASU No. 2020-04, Reference Rate Reform (Topic 848): Facilitation of the Effects of Reference Rate Reform on Financial Reporting. The Fund’s investments, payment obligations, and financing terms may be based on floating rates, such as the London Interbank Offered Rate, or “LIBOR,” which is the offered rate for short-term Eurodollar deposits between major international banks. On November 30, 2020, the administrator of LIBOR announced its intention to delay the phase out of the majority of the U.S. dollar LIBOR publications until June 30, 2023, with the remainder of LIBOR publications to still end at the end of 2020.
3. DERIVATIVE INSTRUMENTS
Swap Contracts: The Fund may enter into swap transactions for hedging purposes or to seek to increase total return. At the present time, the Fund primarily enters into swap transactions for the purpose of increasing total return. Risks may arise as a result of the failure of the counterparty to the swap contract to comply with the terms of the swap contract. The loss incurred by the failure of a counterparty is generally limited to the net payment to be received by the Fund and/or the termination value at the end of the contract.
Therefore, the Fund considers the creditworthiness of each counterparty to a contract in evaluating potential credit risk. Additionally, risks may arise from unanticipated movements in interest rates or in the value of the underlying reference asset or index. Entering into these agreements involves, to varying degrees, market risk, liquidity risk and elements of credit, legal and documentation risk that are not directly reflected in the amounts recognized in the Consolidated Statement of Assets and Liabilities.
The Fund invests in total return swaps to obtain exposure to a security or market without owning such security or investing directly in that market or to transfer the risk/return of one market (e.g., fixed income) to another market (e.g., equity) (equity risk and/or interest rate risk). Total return swaps are agreements in which there is an exchange of cash flows whereby one party commits to make payments based on the total return (coupons plus capital gains/losses) of an underlying instrument in exchange for fixed or floating rate interest payments. To the extent the total return of the instrument or index underlying the transaction exceeds or falls short of the offsetting interest rate obligation, the Fund will receive a payment from or make a payment to the counterparty. The Fund may pay or receive cash as collateral on these contracts which may be recorded as an asset and/or liability. The Fund must set aside liquid assets, or engage in other appropriate measures, to cover its obligations under these contracts. Swaps are marked to market daily using either pricing vendor quotations, counterparty prices or model prices and the change in value, if any, is recorded as an unrealized gain or loss. Upfront payments made and/or received by the Fund are recorded as an asset and/or liability and realized gains or losses are recognized ratably over the contract’s term/event, with the exception of forward starting interest rate swaps, whose realized gains or losses are recognized ratably from the effective start date. Periodic payments received or made on swap contracts are recorded as realized gains or losses. Gains or losses are realized upon termination of a swap contract and are recorded on the Consolidated Statement of Operations. Swap agreements held at April 30, 2021 are disclosed in the Consolidated Schedule of Investments.
International Swaps and Derivatives Association, Inc. Master Agreements (“ISDA Master Agreements”) govern OTC financial derivative transactions entered into by the Fund and those counterparties. The ISDA Master Agreements maintain provisions for general obligations, representations, agreements, collateral and events of default or termination. Events of termination include conditions that may entitle counterparties to elect to
| Annual Report | April 30, 2021 | 25 |
| Highland Resolute Fund | Notes to Consolidated Financial Statements |
April 30, 2021
terminate early and cause settlement of all outstanding transactions under the applicable ISDA Master Agreement. Any election to early terminate could be material to the financial statements.
Option Contracts: The Fund may enter into options transactions for hedging purposes and for non-hedging purposes such as seeking to enhance return. The Fund may write covered put and call options on any stocks or stock indices, currencies traded on domestic and foreign securities exchanges, or futures contracts on stock indices, interest rates and currencies traded on domestic and, to the extent permitted by the CFTC, foreign exchanges. A call option on an asset written by the Fund obligates the Fund to sell the specified asset to the holder (purchaser) at a stated price (the exercise price) if the option is exercised before a specified date (the expiration date). A put option on an asset written by a Fund obligates the Fund to buy the specified asset from the purchaser at the exercise price if the option is exercised before the expiration date. Premiums received when writing options are recorded as liabilities and are subsequently adjusted to the current value of the options written. Premiums received from writing options that expire are treated as realized gains. Premiums received from writing options, which are either exercised or closed, are offset against the proceeds received or amount paid on the transaction to determine realized gains or losses which are recorded on the Consolidated Statement of Operations.
Futures: The Fund may enter into futures contracts for hedging purposes. A futures contract represents a commitment for the future purchase or sale of an asset at a specified price on a specified date. Upon entering into a futures contract, the Fund is required to deposit an initial margin with the broker in an amount equal to a certain percentage of the contract amount. The Fund receives from or pays to the broker, on a daily basis, an amount of cash equal to the daily fluctuation in value of the contract. Such receipts or payments are known as “variation margin,” and are recorded by the Fund as unrealized gains or losses. When the futures contract is closed, the Fund records a gain or loss equal to the difference between the value of the contract at the time it was opened and the value at the time it was closed.
The Fund’s potential losses from the use of futures extend beyond its initial investment in such contracts. The use of futures contracts involves, to varying degrees, elements of market risk in excess of the amount recognized in the Consolidated Statement of Assets and Liabilities. The predominant risk is that the movement of a futures contract’s price may result in a loss, which could render the Fund’s hedging strategy unsuccessful. There is minimal counterparty credit risk since futures contracts are exchange traded and the exchange’s clearinghouse, as counterparty to all exchange traded futures, guarantees the futures against default.
Risk Exposure: The following tables disclose the amounts related to the Fund’s use of derivative instruments.
The effect of derivative instruments on the Consolidated Statement of Assets and Liabilities as of April 30, 2021 was as follows:
| Risk Exposure | Asset Derivatives Statement of Location | Fair Value | Liability Derivatives Statement of Location | Fair Value | ||||||||
| Highland Resolute Fund | ||||||||||||
| Equity Risk (Total Return Swap Contracts) | Unrealized appreciation on total return swap contracts | $ | 17,354 | Unrealized depreciation on total return swap contracts | $ | – | ||||||
| Commodity Risk (Total Return Swap Contracts) | Unrealized appreciation on total return swap contracts | – | Unrealized depreciation on total return swap contracts | 46,596 | ||||||||
| Credit Risk (Total Return Swap Contracts) | Unrealized appreciation on total return swap contracts | – | Unrealized depreciation on total return swap contracts | 1,814 | ||||||||
| Equity Risk (Written Options) | N/A | N/A | Written options, at value | 101,425 | ||||||||
| Equity Risk (Futures Contracts) | Unrealized appreciation on futures contracts | 765,320 | (a) | N/A | N/A | |||||||
| Total | $ | 782,674 | $ | 149,835 | ||||||||
| (a) | Reflects cumulative unrealized appreciation of futures contracts as reported in the Consolidated Schedule of Investments. The value reflected on the accompanying Consolidated Statement of Assets and Liabilities is only the unsettled variation margin payable as of April 30, 2021. |
26
| Highland Resolute Fund | Notes to Consolidated Financial Statements |
April 30, 2021
The effect of derivative instruments on the Consolidated Statements of Operations for the year ended April 30, 2021 was as follows:
| Risk Exposure | Statement of Operations Location | Realized Gain/(Loss) on Derivatives Recognized in Income | Change in Unrealized Appreciation/(Depreciation) on Derivatives Recognized in Income | |||||||
| Highland Resolute Fund | ||||||||||
| Equity Risk (Total Return Swap Contracts) | Net realized gain/(loss) on total return swap contracts/Net change in unrealized appreciation/(depreciation) on total return swap contracts | $ | 5,710,536 | $ | 17,334 | |||||
| Commodity Risk (Total Return Swap Contracts) | Net realized gain/(loss) on total return swap contracts/Net change in unrealized appreciation/(depreciation) on total return swap contracts | $ | 1,035,035 | $ | (46,596 | ) | ||||
| Credit Risk (Total Return Swap Contracts) | Net realized gain/(loss) on total return swap contracts/Net change in unrealized appreciation/(depreciation) on total return swap contracts. | $ | 4,373,886 | $ | (1,814 | ) | ||||
| Foreign Exchange Rate Risk (Total Return Swap Contracts) | Net realized gain/(loss) on total return swap contracts/Net change in unrealized appreciation/(depreciation) on total return swap contracts | (92,562 | ) | (6 | ) | |||||
| Equity Risk (Written Options) | Net realized gain/(loss) on written options/Net change in unrealized appreciation/(depreciation) on written options | 1,844,271 | 20,426 | |||||||
| Equity Risk (Futures Contracts) | Net realized gain/(loss) on futures contracts/Net change in unrealized appreciation/(depreciation) futures contracts | 154,061 | 765,320 | |||||||
| Total | $ | 13,025,227 | $ | 754,664 | ||||||
| Annual Report | April 30, 2021 | 27 |
Highland Resolute Fund | Notes to Consolidated Financial Statements |
April 30, 2021
Volume of Derivative Instruments for the Fund during the year ended April 30, 2021 was as follows:
Derivative Type | Unit of Measurement | Monthly Average |
Highland Resolute Fund |
|
|
Equity Risk (Total Return Swap Contracts) | Notional Quantity | 58,608,010 |
Commodity Risk (Total Return Swap Contracts) | Notional Quantity | 11,090,706 |
Credit Risk (Total Return Swap Contracts) | Notional Quantity | 26,432,213 |
Foreign Exchange Rate Risk (Total Return Swap Contracts) | Notional Quantity | 3,916,616 |
Equity Risk (Written Options) | Value | (190,013) |
Equity Risk (Futures Contracts) | Notional Quantity | 1,946,615 |
Certain derivative contracts are executed under either standardized netting agreements or, for exchange-traded derivatives, the relevant contracts for a particular exchange which contain enforceable netting provisions. A derivative netting arrangement creates an enforceable right of off-set that becomes effective, and affects the realization of settlement on individual assets, liabilities and collateral amounts, only following a specified event of default or early termination. Default events may include the failure to make payments or deliver securities timely, material adverse changes in financial condition or insolvency, the breach of minimum regulatory capital requirements, or loss of license, charter or other legal authorization necessary to perform under the contract.
The following table presents financial instruments that are subject to enforceable netting arrangements or other similar agreements as of April 30, 2021:
Highland Resolute Fund | |||||||||||||||||||||||||
Offsetting of Derivatives Assets | |||||||||||||||||||||||||
|
|
|
|
|
|
|
|
|
|
| Gross Amounts |
| |||||||||||||
|
| Gross Amounts of Recognized Assets |
|
| Gross Amounts Offset in the Statement of Assets and Liabilities |
|
| Net Amounts Presented in the Statement of Assets and Liabilities |
|
| Financial Instruments Available for Offset(a) |
|
| Cash Collateral Received(a) |
|
| Net Receivable Amount |
| |||||||
Total Return Swap Contracts |
| $ | 17,354 |
|
| $ | – |
|
| $ | 17,354 |
|
| $ | (17,354 | ) |
| $ | – |
|
| $ | – |
| |
Total |
| $ | 17,354 |
|
| $ | – |
|
| $ | 17,354 |
|
| $ | (17,354 | ) |
| $ | – |
|
| $ | – |
| |
Highland Resolute Fund | |||||||||||||||||||||||||
Offsetting of Derivatives Liabilities | |||||||||||||||||||||||||
|
|
|
|
|
|
|
|
|
|
| Gross Amounts |
| |||||||||||||
|
| Gross Amounts of Recognized Liabilities |
|
| Gross Amounts Offset in the Statement of Assets and Liabilities |
|
| Net Amounts Presented in the Statement of Assets and Liabilities |
|
| Financial Instruments Available for Offset(a) |
|
| Cash Collateral Pledged(a) |
|
| Net Payable Amount |
| |||||||
Total Return Swap Contracts |
| $ | (48,410 | ) |
| $ | – |
|
| $ | (48,410 | ) |
| $ | 17,354 |
|
| $ | 31,056 |
|
| $ | – |
| |
Total |
| $ | (48,410 | ) |
| $ | – |
|
| $ | (48,410 | ) |
| $ | 17,354 |
|
| $ | 31,056 |
|
| $ | – |
| |
(a) | These amounts are limited to the derivative asset/liability balance and, accordingly, do not include excess collateral received/pledged. |
28 |
Highland Resolute Fund | Notes to Consolidated Financial Statements |
April 30, 2021
4. | TAX BASIS INFORMATION |
Reclassifications: As of April 30, 2021, these differences had no effect on net assets and were primarily attributed to differing book and tax treatment of consolidating entries from the Fund’s Controlled Foreign Corporation (“CFC”) and inclusion of Earnings and Profits (“E&P”) from the same. The reclassifications were as follows:
|
| Paid-in Capital |
|
| Distributable earnings |
| ||
|
| $ | 46,602 |
|
| $ | (46,602 | ) |
The temporary differences are primarily attributed to the tax treatment of wash sales, swaps, and unrealized gains/losses on certain derivative instruments.
Tax Basis of Investments: As of April 30, 2021, the aggregate cost of investments, gross unrealized appreciation/(depreciation) and net unrealized appreciation for Federal tax purposes were as follows:
|
| Gross Appreciation (excess of value over tax cost) |
|
| Gross Depreciation (excess of tax cost over value) |
|
| Net Appreciation/ |
|
| Net Unrealized Appreciation/ |
|
| Cost of Investments for Income Tax Purposes |
| |||||
Highland Resolute Fund |
| $ | 99,546,469 |
|
| $ | (82,767,610 | ) |
| $ | 380 |
|
| $ | 16,779,239 |
|
| $ | 98,914,898 |
|
Components of Earnings: As of April 30, 2021, components of distributable earnings were as follows:
|
| Accumulated Capital |
|
|
Undistributed Ordinary Income |
|
| Net Unrealized |
|
| Other Cumulative |
| ||||
Highland Resolute Fund |
| $ | (16,932,061 | ) |
| $ | 10,237,957 |
|
| $ | 16,779,239 |
|
| $ | – |
|
Tax Basis of Distributions to Shareholders: The character of distributions made during the year from net investment income or net realized gains may differ from its ultimate characterization for federal income tax purposes. Also, due to the timing of dividend distributions, the fiscal year in which amounts are distributed may differ from the fiscal year in which the income or realized gain were recorded by the Fund.
The tax character of distributions paid by the Fund for the fiscal year ended April 30, 2021, were as follows:
|
| Ordinary Income |
|
| Long-Term Capital Gains |
| ||
Highland Resolute Fund |
| $ | – |
|
| $ | – |
|
The tax character of distributions paid by the Fund for the fiscal year ended April 30, 2020, were as follows:
Fund |
| Ordinary Income |
|
| Long-Term Capital Gain |
| ||
Highland Resolute Fund |
| $ | 3,500,019 |
|
| $ | – |
|
Under current law, capital losses maintain their character as short-term or long-term and are carried forward to the next tax year without expiration. As of April 30, 2021, the Fund elects to carry forward $8,963,754 in long-term capital losses and $7,968,307 in short-term capital losses to the next tax year.
| Annual Report | April 30, 2021 | 29 |
Highland Resolute Fund | Notes to Consolidated Financial Statements |
April 30, 2021
5. | SECURITIES TRANSACTIONS |
Purchases and sales of securities, excluding short-term securities and U.S. Government Obligations during the year ended April 30, 2021 were as follows:
Fund |
| Purchases of Securities |
|
| Proceeds From Sales of Securities |
| ||
Highland Resolute Fund |
| $ | 50,505,065 |
|
| $ | 93,428,797 |
|
6. | BENEFICIAL SHARE TRANSACTIONS |
The capitalization of the Trust consists of an unlimited number of shares of beneficial interest with no par value per share. Holders of the shares of the Fund of the Trust have one vote for each share held and a proportionate fraction of a vote for each fractional share. All shares issued and outstanding are fully paid and are transferable and redeemable at the option of the shareholder. Purchasers of the shares do not have any obligation to make payments to the Trust or its creditors solely by reason of the purchasers’ ownership of the shares. Shares have no pre-emptive rights.
Transactions in common shares were as follows:
Highland Resolute Fund |
|
|
|
| ||||
Class I: |
| For the |
|
| For the |
| ||
Common Shares Outstanding - Beginning of Period |
|
| 19,374,899 |
|
|
| 32,287,022 |
|
Common Shares Sold |
|
| 2,863,529 |
|
|
| 926,202 |
|
Common Shares Issued as Reinvestment of Dividends |
|
| – |
|
|
| 340,801 |
|
Common Shares Redeemed |
|
| (8,466,971 | ) |
|
| (14,179,126 | ) |
Common Shares Outstanding - End of Period |
|
| 13,771,457 |
|
|
| 19,374,899 |
|
Shares redeemed within 90 days of purchase may incur a 2% short-term redemption fee deducted from the redemption amount. Redemption fees are reflected in the “Shares redeemed, net of redemption fees” in the Consolidated Statements of Changes in Net Assets. For the year ended April 30, 2021 and the year ended April 30, 2020, the Fund retained fees as follows:
Fund |
| For the Year Ended April 30, 2021 |
|
| For the Year Ended April 30, 2020 |
| ||
Highland Resolute Fund |
| $ | – |
|
| $ | 16 |
|
7. | MANAGEMENT AND RELATED PARTY TRANSACTIONS |
Investment Advisory
The Adviser, subject to the authority of the Board, is responsible for the overall management and administration of the Fund’s business affairs. Pursuant to the Investment Advisory Agreement (the “Advisory Agreement”), the Adviser is entitled to an investment advisory fee, computed daily and payable monthly of 1.50% of the average daily net assets for the Fund. The management fee is paid on a quarterly basis.
The Subsidiary has entered into a separate advisory agreement (the “Subsidiary Advisory Agreement”) with the Adviser for the management of the Subsidiary’s portfolio pursuant to which the Subsidiary is obligated to pay the Adviser a management fee at the same rate that the Fund pays the Adviser for investment advisory services provided to the Fund. The Adviser has agreed to waive the advisory fee it receives from the Fund in an amount equal to the management fee paid by the Subsidiary. This waiver may not be terminated or modified without the consent of the Board. This agreement may not be terminated or modified prior to this date except with the approval of the Board. For the year ended April 30, 2021, this amount equaled $253,601 and is disclosed in the Consolidated Statement of Operations. Fees under the Subsidiary Advisory Agreement are not permitted to be recouped.
The Adviser entered into Investment Sub-Advisory Agreements with Chatham Asset Management, LLC (“Chatham”) and Parametric Portfolio Associates, LLC (“Parametric”). The Adviser determines the allocation of the Fund’s assets among Chatham and Parametric (collectively the “Sub-Advisers”) and other open-end investment companies. The Fund is not required to invest with any minimum number of sub-advisers or open-end investment companies, and does not have minimum or maximum limitations with respect to allocations of assets to the Sub-Advisers, investment
30 |
Highland Resolute Fund | Notes to Consolidated Financial Statements |
April 30, 2021
strategy or market sector. The Adviser may change the allocation of the Fund’s assets among the available investment options, and may add or remove sub-advisers, at any time. Each Sub-Adviser is responsible for the day-to-day management of its allocated portion of Fund assets. The Adviser has ultimate responsibility, subject to the oversight of the Board of the Fund, to oversee the Sub-Advisers, and to recommend their hiring, termination and replacement.
Pursuant to each Investment Sub-Advisory Agreement, the Adviser pays the Sub-Advisers an annual sub-advisory management fee which is based on the Fund’s average quarterly market value of the assets managed by the Sub-Advisers. The Adviser is required to pay all fees due to Sub-Advisers out of the management fee the Adviser receives from the Fund. The following table reflects the Fund’s contractual sub-advisory fee rates.
Sub-Advisers | Contractual |
Chatham Asset Management, LLC(a) | 1.00% |
Parametric Portfolio Associates, LLC | 0.30% |
(a) | Effective June 30, 2020, Chatham Asset Management, LLC, ceased serving as an investment Sub-Adviser to the Fund. |
The Adviser has agreed, with respect to the Fund’s Class I shares, to waive the portion of its 1.50% management fee in excess of any sub-advisory fees (as defined in the Prospectus), and effective September 1, 2019, less third-party administrative costs charged to the Adviser in connection with the non-recurring addition of a new investment sub-adviser for the Fund or removal of an existing investment sub-adviser to the Fund. The Adviser may not discontinue this agreement to waive fees prior to August 31, 2021 without the approval of the Fund’s Board. The Adviser is not permitted to recoup any amounts waived or reimbursed to the extent actual fees and expenses for a fiscal period are less than the expense limitation cap. Fees waived/reimbursed by the Adviser for the year ended April 30, 2021 are disclosed in the Consolidated Statement of Operations.
For the year ended April 30, 2021, the fee waivers and/or reimbursements were as follows:
|
| Fees Waived/ Reimbursed By Adviser |
| |
Highland Resolute Fund - Class I |
| $ | (2,869,225 | ) |
Administrator Fees and Expenses
ALPS Fund Services, Inc. (“ALPS”) serves as administrator to the Fund, and the Fund has agreed to pay expenses incurred in connection with its administrative activities. Pursuant to an Administration Agreement, ALPS provides operational services to the Fund including, but not limited to, fund accounting and fund administration and generally assists in the Fund’s operations. Officers of the Trust are employees of ALPS. The Fund’s administration fee is accrued on a daily basis and paid monthly. Administration fees paid by the Fund for the year ended April 30, 2021 are disclosed in the Consolidated Statement of Operations.
ALPS is reimbursed by the Fund for certain out-of-pocket expenses.
Transfer Agent
ALPS serves as transfer, dividend paying and shareholder servicing agent for the Fund. ALPS receives an annual minimum fee, a fee based upon the number of shareholder accounts and is also reimbursed by the Fund for certain out-of-pocket expenses. Transfer agent fees paid by the Fund for the year ended April 30, 2021 are disclosed in the Consolidated Statement of Operations.
Compliance Services
ALPS provides services that assist the Fund’s chief compliance officer in monitoring and testing the policies and procedures of the Fund in conjunction with requirements under Rule 38a-1 under the 1940 Act and receives an annual base fee. ALPS is reimbursed for certain out-of-pocket expenses by the Fund. Compliance service fees paid by the Fund for the year ended April 30, 2021 are disclosed in the Consolidated Statement of Operations.
Principal Financial Officer
ALPS receives an annual fee for providing principal financial officer services to the Fund. Principal financial officer fees paid by the Fund for the year ended April 30, 2021 are disclosed in the Consolidated Statement of Operations.
Distributor
ALPS Distributors, Inc. (“ADI” or the “Distributor”) (an affiliate of ALPS) acts as the distributor of the Fund’s shares pursuant to a Distribution Agreement with the Trust on behalf of the Fund. Shares are sold on a continuous basis by ADI as agent for the Fund, and ADI has agreed to use its best efforts to solicit orders for the sale of Fund’s shares, although it is not obliged to sell any particular amount of shares. ADI is not entitled to any compensation for its services as Distributor. ADI is registered as a broker-dealer with the U.S. Securities and Exchange Commission.
Annual Report | April 30, 2021 | 31 |
Highland Resolute Fund | Notes to Consolidated Financial Statements |
April 30, 2021
Shareholder Services Plan
Effective December 12, 2017, the Fund has adopted a Shareholder Services Plan (the “Plan”) with respect to its Class I shares. Under the Plan, the Fund is authorized to pay banks and its affiliates and other institutions, including broker-dealers and Fund affiliates which may include the Distributor, Adviser and/or the transfer agent (“Participating Organizations”), an aggregate fee in an amount not to exceed on an annual basis 0.10% of the average daily net asset value of Class I shares of the Fund attributable to or held in the name of the Participating Organizations for its clients as compensation for providing shareholder service activities, which do not include distribution services pursuant to an agreement with Participating Organizations. Any amount of such payment not paid to the Participating Organizations during the Fund’s fiscal year for such service activities shall be reimbursed to the Fund as soon as practicable. Plan fees are included with shareholder service fees in the Consolidated Statement of Operations. Fees recaptured pursuant to the Plan for the year ended April 30, 2021 are included as an offset to shareholder service fees as disclosed in the Consolidated Statement of Operations.
Trustees
The fees and expenses of the Trustees of the Board are presented in the Consolidated Statement of Operations.
8. | INDEMNIFICATIONS |
Under the Trust’s organizational documents, its officers and Trustees are indemnified against certain liability arising out of the performance of their duties to the Trust. Additionally, in the normal course of business, the Trust enters into contracts with service providers that may contain general indemnification clauses which may permit indemnification to the extent permissible under applicable law. The Trust’s maximum exposure under these arrangements is unknown, as this would involve future claims that may be made against the Trust that have not yet occurred.
9. | SUBSEQUENT EVENT |
Subsequent events after the date of the Consolidated Statement of Assets and Liabilities have been evaluated through the date the financial statements were issued.
Effective as of the close of business May 13, 2021, Parametric no longer serves as an investment sub-adviser to the Fund.
32 |
Highland Resolute Fund | Report of Independent Registered Accounting Firm |
April 30, 2021
To the Shareholders of Highland Resolute Fund and Board of Trustees of Financial Investors Trust
Opinion on the Financial Statements
We have audited the accompanying consolidated statement of assets and liabilities, including the consolidated schedule of investments, of Highland Resolute Fund (the “Fund”), a series of Financial Investors Trust, as of April 30, 2021, the related consolidated statement of operations for the year then ended, and the consolidated statements of changes in net assets, the related notes, and the consolidated financial highlights for each of the two years in the period then ended (collectively referred to as the “financial statements”). In our opinion, the financial statements present fairly, in all material respects, the financial position of the Fund as of April 30, 2021, the results of its operations for the year then ended, and the changes in net assets and the financial highlights for each of the two years in the period then ended, in conformity with accounting principles generally accepted in the United States of America.
The Fund’s consolidated financial highlights for the years ended April 30, 2019, and prior, were audited by other auditors whose report dated June 25, 2019, expressed an unqualified opinion on those financial highlights.
Basis for Opinion
These financial statements are the responsibility of the Fund’s management. Our responsibility is to express an opinion on the Fund’s financial statements based on our audits. We are a public accounting firm registered with the Public Company Accounting Oversight Board (United States) (“PCAOB”) and are required to be independent with respect to the Fund in accordance with the U.S. federal securities laws and the applicable rules and regulations of the Securities and Exchange Commission and the PCAOB.
We conducted our audits in accordance with the standards of the PCAOB. Those standards require that we plan and perform the audit to obtain reasonable assurance about whether the financial statements are free of material misstatement whether due to error or fraud.
Our audits included performing procedures to assess the risks of material misstatement of the financial statements, whether due to error or fraud, and performing procedures that respond to those risks. Such procedures included examining, on a test basis, evidence regarding the amounts and disclosures in the financial statements. Our procedures included confirmation of securities owned as of April 30, 2021, by correspondence with the custodian and brokers. Our audits also included evaluating the accounting principles used and significant estimates made by management, as well as evaluating the overall presentation of the financial statements. We believe that our audits provide a reasonable basis for our opinion.
We have served as the Fund’s auditor since 2020.
COHEN & COMPANY, LTD.
Cleveland, Ohio
June 29, 2021
Annual Report | April 30, 2021 | 33 |
| Highland Resolute Fund | Additional Information |
April 30, 2021 (Unaudited)
1. | FUND HOLDINGS |
The Fund files its complete schedule of portfolio holdings with the Securities and Exchange Commission (SEC) for the first and third quarters of each fiscal year on Form N-PORT. The Fund files its complete schedule of portfolio holdings with the SEC for the first and third quarters of each fiscal year as an exhibit to its reports on Form N-PORT. The Fund’s Form N-PORT reports are available on the SEC’s Web site at http://www.sec.gov. The Fund’s Form N-PORT reports are also available upon request by calling toll-free (855) 268-2242.
2. | FUND PROXY VOTING POLICIES, PROCEDURES AND SUMMARIES |
Fund policies and procedures used in determining how to vote proxies and information regarding how each of the Fund voted proxies relating to portfolio securities during the most recent prior 12-month period ending June 30 are available without charge, (1) upon request, by calling (toll-free) (855) 268-2242 and (2) on the SEC’s website at http://www.sec.gov.
3. | TAX INFORMATION |
The Fund designates the following for federal income tax purposes for distributions made during the calendar year ended December 31, 2020:
| QDI | DRD |
Highland Resolute Fund | N/A | N/A |
In early 2021, if applicable, shareholders of record received this information for the distribution paid to them by the Fund during the calendar year 2020 via Form 1099. The Fund will notify shareholders in early 2022 of amounts paid to them by the Funds, if any, during the calendar year 2021.
34 |
Highland Resolute Fund | Disclosure Regarding Approval of |
| April 30, 2021 (Unaudited) |
On February 24, 2021, the Trustees met via Zoom video conference to discuss, among other things, the approval of a new sub-advisory agreement among Highland Associates, Inc. (“Highland”), Parametric Portfolio Associates LLC (“Parametric”), and the Trust, with respect to the Highland Resolute Fund (the “Fund”), in accordance with Section 15(c) of the 1940 Act (the “New Sub-Advisory Agreement”). The New Sub-Advisory Agreement was necessary due to Eaton Vance Corp., Parametric’s parent company, and Morgan Stanley entering into an agreement whereby Morgan Stanley acquired Eaton Vance (the “Transaction”), which Transaction resulted in the termination of the sub-advisory agreement among the Trust, on behalf of the Fund, Highland, and Parametric, dated August 1, 2019. In approving the New Sub-Advisory Agreement, the Trustees, including the Independent Trustees, considered the following factors with respect to the Fund:
Nature, Extent, and Quality of the Services: The Trustees reviewed and considered Parametric’s personnel, its history as an asset manager and its performance. The Trustees discussed the research and decision-making processes utilized by Parametric, including the methods adopted to seek to achieve compliance with the investment objectives, policies, and restrictions of the Fund.
The Trustees reviewed the background and experience of Parametric’s management relating to the Fund, including the qualifications, backgrounds and responsibilities of the management team primarily responsible for the day-to-day portfolio management of the Fund, and noted that the Transaction would not result in a change in portfolio managers and that there is not expected to be any diminution in the nature, quality, and extent of services provided to the Fund as a result of the Transaction. They also discussed the resources of Parametric devoted to research and analysis of actual and potential investments. The Trustees also reviewed, among other things, Parametric’s Code of Ethics.
Performance: The Trustees reviewed performance information with respect to Parametric’s defensive equity strategy. The Trustees also considered Parametric’s reputation generally and its investment techniques, risk management controls, and decision-making processes.
Sub-Advisory Fee Rate: The Trustees reviewed and considered the proposed annual sub-advisory fee to be paid by Highland to Parametric of 0.30% of the Fund’s daily average net assets, in light of the extent and quality of the advisory services to be provided by Parametric to the Fund, noting that the fees would not change as a result of the Transaction.
Comparable Accounts: The Trustees noted certain information provided by Parametric regarding fees charged to its other clients utilizing a strategy similar to the one it employs for the Fund.
Profitability: The Trustees received and considered an estimated profitability analysis provided by Parametric. The Trustees considered the profits, if any, anticipated to be realized by Parametric relating to the operation of the Fund. The Trustees then considered the financial condition of Parametric. They concluded that any profits were projected to remain reasonable in the short term after the Transaction.
Economies of Scale: The Trustees considered whether economies of scale in the provision of services to the Fund would be passed along to the shareholders under the New Sub-Advisory Agreement.
Other Benefits to the Sub-Adviser: The Trustees reviewed and considered any other incidental benefits to be derived by Parametric from its relationship with the Fund, including whether soft dollar arrangements were used.
In evaluating Parametric and the fees to be charged under the New Sub-Advisory Agreement, the Trustees concluded that no single factor reviewed by the Trustees was identified by the Trustees to be determinative as the principal factor in whether to approve the Agreement. Further, the Independent Trustees were advised by independent legal counsel throughout the process.
Annual Report | April 30, 2021 | 35 |
Highland Resolute Fund | Disclosure Regarding Approval of |
| April 30, 2021 (Unaudited) |
On March 9, 2021, the Trustees met via Zoom video conference to discuss, among other things, the renewal of the Investment Advisory Agreement between Highland Associates, Inc. (“Highland”) and the Trust, with respect to the Highland Fund, dated September 16, 2019 (the “Highland Investment Advisory Agreement”), in accordance with Section 15(c) of the 1940 Act. In renewing and approving the Highland Investment Advisory Agreement, the Trustees, including the Independent Trustees, considered the following factors with respect to the Highland Fund:
Investment Advisory Fee Rate: The Trustees reviewed and considered the contractual annual advisory fee paid by the Trust, on behalf of the Highland Fund, to Highland, of 1.50% of the Highland Fund’s daily average net assets, in light of the extent and quality of the advisory services provided by Highland to the Highland Fund.
The Board received and considered information including a comparison of the Highland Fund’s contractual advisory fee rate with those of funds in the peer group of funds provided by the Data Provider. The Trustees noted that the contractual advisory fee rate of the Highland Fund was higher than the Data Provider peer group median.
Total Net Expense Ratios: The Trustees further reviewed and considered that the total net expense ratio of the Highland Fund was lower than the Data Provider peer group median. The comparison with the peer group at the level of the total net expense ratio yielded more useful comparative data than the level of the investment advisory rate.
Nature, Extent, and Quality of the Services under the Investment Advisory Agreement: The Trustees received and considered information regarding the nature, extent, and quality of services provided to the Highland Fund under the Highland Investment Advisory Agreement. The Trustees reviewed certain background materials supplied by Highland in its presentation, including its Form ADV.
The Trustees reviewed and considered Highland’s investment advisory personnel, its history as an asset manager, and its performance and the amount of assets currently under management by Highland. The Trustees also reviewed the research and decision-making processes utilized by Highland, including the methods adopted to seek to achieve compliance with the investment objectives, policies, and restrictions of the Highland Fund.
The Trustees considered the background and experience of Highland’s management in connection with the Highland Fund, including reviewing the qualifications, backgrounds, and responsibilities of the management team primarily responsible for the day-to-day portfolio management of the Fund and the extent of the resources devoted to research and analysis of actual and potential investments.
The Trustees also reviewed, among other things, Highland’s insider trading policies and procedures and its Code of Ethics.
Performance: The Trustees reviewed performance information of the Highland Fund for the 3-month, 1-year, 3-year, 5-year, and since inception periods ended December 31, 2020. That review included a comparison of the Highland Fund’s performance to the performance of a group of comparable funds selected by the Data Provider. The Trustees noted that the Highland Fund general outperformed its peer group for the 3-month, 1-year, 5-year, and since inception periods, and underperformed its peer group for the 3-year period.
The Trustees also considered Highland’s discussion of its reputation generally and its investment techniques, risk management controls, and decision-making processes.
Comparable Accounts: The Trustees noted certain information provided by Highland regarding fees charged to its other clients utilizing a strategy similar to that employed by the Highland Fund.
Profitability: The Trustees received and considered a profitability analysis prepared by Highland based on the fees payable under the Highland Investment Advisory Agreement.
Economies of Scale: The Trustees considered whether economies of scale in the provision of services to the Highland Fund would be passed along to shareholders.
Other Benefits to the Adviser: The Trustees reviewed and considered any other incidental benefits derived or to be derived by Highland from its relationship with the Highland Fund, including whether soft dollar arrangements were used.
36 |
Highland Resolute Fund | Disclosure Regarding Approval of |
| April 30, 2021 (Unaudited) |
The Trustees, including all of the Independent Trustees, concluded that:
| ● | The contractual advisory fee rate of the Highland Fund was higher than the Data Provider peer group median. |
| ● | The total net expense ratio of the Highland Fund was lower than the Data Provider peer group median. The comparison with the peer group at the level of the total net expense ratio yielded more useful comparative data than the level of the investment advisory fee rate. |
| ● | The nature, extent, and quality of services rendered by Highland under the Highland Investment Advisory Agreement were adequate. |
| ● | For the period ended December 31, 2020, the Highland Fund outperformed its Data Provider peer group for the 3-month, 1-year, 5-year, and since inception periods, and underperformed its peer group for the 3-year period. |
| ● | Bearing in mind the limitations of comparing different types of managed accounts and the different levels of service typically associated with such accounts, the fee structures applicable to Highland’s other clients employing a comparable strategy to the Highland Fund were not indicative of any unreasonableness with respect to the advisory fee payable to Highland by the Highland Fund. |
| ● | The profit, if any, realized by Highland in connection with the operation of the Highland Fund is not unreasonable. |
| ● | There were no material economies of scale or other incidental benefits accruing to Highland in connection with its relationship with the Highland Fund. |
Based on the Trustees’ deliberations and their evaluation of the information described above, the Trustees, including all of the Independent Trustees, concluded that Highland’s compensation for investment advisory services is consistent with the best interests of the Highland Fund and its shareholders.
Annual Report | April 30, 2021 | 37 |
Highland Resolute Fund | Liquidity Risk Management Program |
| April 30, 2021 (Unaudited) |
The Financial Investors Trust (the “Trust”) has established a liquidity risk management program (the “Program”) to govern the Trust’s approach to managing liquidity risk for each fund in the Trust (each a “Fund”). The Program is overseen by the Liquidity Committee (the “Committee”), a committee comprised of representatives of the Trust’s investment advisers, sub-advisers, and Officers of the Trust. The Trust’s Board of Trustees (the “Board”) has approved the designation of the Committee to oversee the Program.
The Program’s principal objectives include supporting each Fund’s compliance with limits on investments in illiquid assets and mitigating the risk that a Fund will be unable to meet its redemption obligations in a timely manner. The Program also includes a number of elements that support the management and assessment of liquidity risk, including a periodic assessment of factors that influence a Fund’s liquidity and the periodic classification and re-classification of the Fund’s investments into groupings that reflect the Committee’s assessment of their relative liquidity under current market conditions.
At a meeting of the Board held on March 10, 2021, the Trustees received a report from the Committee regarding the design and operational effectiveness of the Program during 2020. The Committee determined, and reported to the Board, that the Program is reasonably designed to assess and manage each Fund’s liquidity risk and has operated adequately and effectively to manage each Fund’s liquidity risk since implementation.
The Committee reported that during the period covered by the report, there were no liquidity events that impacted the Funds or their ability to timely meet redemptions without dilution to existing shareholders. Among other things, the Board noted that the Funds are not required to have a highly liquid investment minimum based on their liquidity classifications. The Board further noted that no material changes have been made to the Program since its implementation.
38 |
Highland Resolute Fund | Trustees & Officers |
| April 30, 2021 (Unaudited) |
Additional information regarding the Fund’s trustees is included in the Statement of Additional Information, which can be obtained without charge by calling 855-268-2242.
| INDEPENDENT TRUSTEES | |||||
| Name, Address* & Year of Birth | Position(s) Held with Fund | Term of Office** and Length of Time Served | Principal Occupation(s) During Past 5 Years*** | Number of Funds in Fund Complex Overseen by Trustee**** | Other Directorships Held by Trustee During Past 5 Years*** |
| Mary K. Anstine, 1940 | Trustee and Chairman | Ms. Anstine was elected at a special meeting of shareholders held on March 21, 1997 and re-elected at a special meeting of shareholders held on August 7, 2009. Ms. Anstine was appointed Chairman of the Board at the June 6, 2017 meeting of the Board of Trustees. | Ms. Anstine is Trustee/Director of AV Hunter Trust and Colorado Uplift Board. | 31 | Ms. Anstine is a Trustee of ALPS ETF Trust (17 funds); ALPS Variable Investment Trust (7 funds); Reaves Utility Income Fund (1 fund); and Segall Bryant & Hamill Trust through December 2020 (as of December 31, 2020 14 funds). |
| Jeremy W. Deems, 1976 | Trustee | Mr. Deems was appointed as a Trustee at the March 11, 2008 meeting of the Board of Trustees and elected at a special meeting of shareholders held on August 7, 2009. | Mr. Deems is the Co-Founder and Chief Financial Officer of Green Alpha Advisors, LLC, a registered investment advisor, and Co-Portfolio Manager of the Shelton Green Alpha Fund. | 31 | Mr. Deems is a Trustee of ALPS ETF Trust (17 funds); ALPS Variable Investment Trust (7 funds); Clough Funds Trust (1 fund); and Reaves Utility Income Fund (1 fund). |
Annual Report | April 30, 2021 | 39 |
Highland Resolute Fund | Trustees & Officers |
| April 30, 2021 (Unaudited) |
| INDEPENDENT TRUSTEES | |||||
| Name, Address* & Year of Birth | Position(s) Held with Fund | Term of Office** and Length of Time Served | Principal Occupation(s) During Past 5 Years*** | Number of Funds in Fund Complex Overseen by Trustee**** | Other Directorships Held by Trustee During Past 5 Years*** |
| Jerry G. Rutledge, 1944 | Trustee | Mr. Rutledge was elected at a special meeting of shareholders held on August 7, 2009. | Mr. Rutledge is the President and owner of Rutledge’s Inc., a retail clothing business. | 31 | Mr. Rutledge is a Trustee of Clough Global Dividend and Income Fund (1 fund); Clough Global Equity Fund (1 fund); Clough Global Opportunities Fund (1 fund); and Principal Real Estate Income Fund (1 fund). |
| Michael “Ross” Shell, 1970 | Trustee | Mr. Shell was elected at a special meeting of shareholders held on August 7, 2009. | Mr. Shell is Founder and CEO of Red Idea, LLC, a strategic consulting/early stage venture firm (since June 2008). Mr. Shell serves on the Board of Directors of TalkBox, a phone/privacy booth company (since 2018) and DLVR, a package security company (since 2018). Mr. Shell served on the Advisory Board, St. Vrain School District Innovation Center (from 2015-2018). Mr. Shell graduated with honors from Stanford University with a degree in Political Science. | 31 | None. |
40 |
Highland Resolute Fund | Trustees & Officers |
| April 30, 2021 (Unaudited) |
INTERESTED TRUSTEE | |||||
| Name, Address* & Year of Birth | Position(s) Held with Fund | Term of Office** and Length of Time Served | Principal Occupation(s) During Past 5 Years*** | Number of Funds in Fund Complex Overseen by Trustee**** | Other Directorships Held by Trustee During Past 5 Years*** |
| Edmund J. Burke, 1961 | Trustee | Mr. Burke was elected as Trustee at a special meeting of shareholders held on August 7, 2009. | Mr. Burke joined ALPS in 1991 and served as the President and Director of ALPS Holdings, Inc., and ALPS Advisors, Inc., and Director of ALPS Distributors, Inc., ALPS Fund Services, Inc. (“ALPS”), and ALPS Portfolio Solutions Distributor, Inc. (collectively, the “ALPS Companies”). Mr. Burke retired from the ALPS Companies in June 2019. Mr. Burke is currently a partner at ETF Action, a web-based system that provides data and analytics to registered investment advisers, (since 2020) and a Director of Alliance Bioenergy Plus, Inc., technology company focused on emerging technologies in the renewable energy, biofuels, and bioplastics technology sectors (since 2020). Mr. Burke is deemed an interested Trustee by virtue of his prior positions with the ALPS Companies. | 31 | Mr. Burke is a Trustee of ALPS ETF Trust (17 funds); Clough Global Dividend and Income Fund (1 fund); Clough Global Equity Fund (1 fund); Clough Global Opportunities Fund (1 fund); Clough Funds Trust (1 fund); Liberty All-Star Equity Fund (1 fund); and Director of the Liberty All-Star Growth Fund, Inc. (1 fund). |
Annual Report | April 30, 2021 | 41 |
Highland Resolute Fund | Trustees & Officers |
| April 30, 2021 (Unaudited) |
| OFFICERS | |||
| Name, Address* & Year of Birth | Position(s) Held with Fund | Term of Office** and Length of Time Served | Principal Occupation(s) During Past 5 Years*** |
| Bradley J. Swenson, 1972***** | President | Mr. Swenson was appointed President of the Trust at the June 11, 2019 meeting of the Board of Trustees. | Mr. Swenson joined ALPS in 2004 and has served as its President since June 2019. In this role, he serves as an officer to certain other closed-end and open-end investment companies. He previously served as the Chief Operating Officer of ALPS (2015-2019). Mr. Swenson also previously served as Chief Compliance Officer to ALPS, its affiliated entities, and to certain ETF, closed-end and open-end investment companies (2004-2015). Because of his position with ALPS, Mr. Swenson is deemed an affiliate of the Trust as defined under the 1940 Act. |
| Dawn Cotten, 1977 | President | Ms. Cotten was appointed President of the Trust at the June 8-9, 2021 meeting of the Trustees. | Ms. Cotten joined ALPS in 2009 and is currently Senior Vice President of Fund Administration and Relationship Management of ALPS. She has served in that role since January 2020. Prior to that, Ms. Cotten served as Senior Vice President of Relationship Management (2017-2020). Ms. Cotten served as a VP in Relationship Management from 2013-2017. Ms. Cotten also serves as President of ALPS Series Trust, Clough Funds Trust, Clough Global Dividend and Income Fund, and Clough Global Equity Fund and Clough Global Opportunities Fund. |
| Jennell Panella, 1974 | Treasurer | Ms. Panella was appointed Treasurer of the Trust at the September 15, 2020 meeting of the Board of Trustees. | Ms. Panella joined ALPS in June 2012 and is currently Vice President and Fund Controller of ALPS Fund Services, Inc. Prior to joining ALPS, Ms. Panella served as Financial Reporting Manager for Parker Global Strategies, LLC (2009-2012). Because of her position with ALPS, Ms. Panella is deemed an affiliate of the Trust as defined under the 1940 Act. |
| Karen S. Gilomen, 1970***** | Secretary | Ms. Gilomen was appointed Secretary of the Trust at the December 13, 2016 meeting of the Board of Trustees. | Ms. Gilomen joined ALPS in August 2016 as Vice President and Senior Counsel. Prior to joining ALPS, Ms. Gilomen was Vice President - General Counsel & CCO of Monticello Associates, Inc. from 2010 to 2016. Because of her position with ALPS, Ms. Gilomen is deemed an affiliate of the Trust, as defined under the 1940 Act. Ms. Gilomen is also the Secretary of ALPS Variable Investment Trust and Reaves Utility Income Fund, and the Assistant Secretary of the WesMark Funds. |
| Cara Owen, (1981) | Secretary | Ms. Owen was appointed Secretary of the Trust at the June 8-9, 2021 meeting of the Trustees. | Vice President and Principal Legal Counsel, ALPS Fund Services, Inc. Prior to joining ALPS, Ms. Owen was Senior Counsel, Corporate & Investments, Great-West Life & Annuity Insurance Company; Senior Counsel & Assistant Secretary, Great-West Funds, Inc., Great-West Capital Management, LLC, Great-West Trust Company, LLC, and Advised Assets Group, LLC (2014-2019). Ms. Owen also serves as Secretary of ALPS ETF Trust, Vice President and Secretary of Boulder Growth & Income Fund, and Assistant Secretary of James Advantage Funds. |
42 |
Highland Resolute Fund | Trustees & Officers |
| April 30, 2021 (Unaudited) |
| OFFICERS | |||
| Name, Address* & Year of Birth | Position(s) Held with Fund | Term of Office** and Length of Time Served | Principal Occupation(s) During Past 5 Years*** |
| Ted Uhl, 1974 | Chief Compliance Officer (“CCO��) | Mr. Uhl was appointed CCO of the Trust at the June 8, 2010 meeting of the Board of Trustees. | Mr. Uhl joined ALPS in October 2006, and is currently Deputy Compliance Officer of ALPS. Prior to his current role, Mr. Uhl served as Senior Risk Manager for ALPS from October 2006 until June 2010. Before joining ALPS, Mr. Uhl served a Sr. Analyst with Enenbach and Associates (RIA), and a Sr. Financial Analyst at Sprint. Because of his position with ALPS, Mr. Uhl is deemed an affiliate of the Trust as defined under the 1940 Act. Mr. Uhl is also CCO of the Boulder Growth & Income Fund, Inc., Centre Funds, Index Funds, Reality Shares ETF Trust, Reaves Utility Income Fund and XAI Octagon Floating Rate & Alternative Income Term Trust. |
| Jennifer Craig, 1973 | Assistant Secretary | Ms. Craig was appointed Assistant Secretary of the Trust at the June 8, 2016 meeting of the Board of Trustees. | Ms. Craig joined ALPS in 2007 and is currently Assistant Vice President and Paralegal Manager of ALPS. Because of her position with ALPS, Ms. Craig is deemed an affiliate of the Trust as defined under the 1940 Act. Ms. Craig is also Secretary of Principal Real Estate Income Fund, Assistant Secretary of Clough Global Dividend and Income Fund, Clough Global Equity Fund, Clough Global Opportunities Fund, Liberty All-Star Equity Fund and Liberty All-Star Growth Fund, Inc. and Clerk of Goehring & Rozencwajg Investment Funds. |
* | All communications to Trustees and Officers may be directed to Financial Investors Trust c/o 1290 Broadway, Suite 1000, Denver, CO 80203. |
** | This is the period for which the Trustee or Officer began serving the Trust. Each Trustee serves an indefinite term, until such Trustees successor is elected and appointed, or such Trustee resigns or is deceased. Officers are elected on an annual basis. |
*** | Except as otherwise indicated, each individual has held the office shown or other offices in the same company for the last five years. |
**** | The Fund Complex includes all series of the Trust, currently 31, and any other investment companies for which any Trustee serves as trustee for and for which Seafarer Capital Partners, LLC provides investment advisory services (currently none). |
***** | Mr. Swenson resigned his position as President of the Trust effective June 9, 2021 and Ms. Gilomen resigned her position as Secretary of the Trust effective June 4, 2021. |
Annual Report | April 30, 2021 | 43 |
Highland Resolute Fund | Privacy Policy |
| April 30, 2021 (Unaudited) |
Who We Are |
|
Who is providing this notice? | Highland Resolute Fund |
What We Do |
|
How does the Fund protect my personal information? | To protect your personal information from unauthorized access and use, we use security measures that comply with federal law. These measures include computer safeguards and secured files and buildings. |
How does the Fund collect my personal information? | We collect your personal information, for example, when you ● open an account ● provide account information or give us your contact information ● make a wire transfer or deposit money |
Why can’t I limit all sharing? | Federal law gives you the right to limit only
● sharing for affiliates’ everyday business purposes-information about your creditworthiness ● affiliates from using your information to market to you ● sharing for non-affiliates to market to you
State laws and individual companies may give you additional rights to limit sharing. |
Definitions |
|
Affiliates | Companies related by common ownership or control. They can be financial and nonfinancial companies. |
Non-affiliates | Companies not related by common ownership or control. They can be financial and nonfinancial companies.
● The Fund does not share with non-affiliates so they can market to you. |
Joint marketing | A formal agreement between non-affiliated financial companies that together market financial products or services to you.
● The Fund does not jointly market. |
Other Important Information |
|
California Residents | If your account has a California home address, your personal information will not be disclosed to nonaffiliated third parties except as permitted by applicable California law, and we will limit sharing such personal information with our affiliates to comply with California privacy laws that apply to us. |
Vermont Residents | The State of Vermont requires financial institutions to obtain your consent prior to sharing personal information that they collect about you with affiliated companies and nonaffiliated third parties other than in certain limited circumstances. Except as permitted by law, we will not share personal information we collect about you with nonaffiliated third parties or other affiliated companies unless you provide us with your written consent to share such information. |
44 |
Highland Resolute Fund | Privacy Policy |
| April 30, 2021 (Unaudited) |
FACTS | WHAT DOES THE FUND DO WITH YOUR PERSONAL INFORMATION? |
Why? | Financial companies choose how they share your personal information. Federal law gives consumers the right to limit some but not all sharing. Federal law also requires us to tell you how we collect, share, and protect your personal information. Please read this notice carefully to understand what we do. |
What? | The types of personal information we collect and share depend on the product or service you have with us. This information can include:
● Social Security number and account transactions ● Account balances and transaction history ● Wire transfer instructions |
How? | All financial companies need to share customers’ personal information to run their everyday business. In the section below, we list the reasons financial companies can share their customers’ personal information; the reasons the Fund chooses to share; and whether you can limit this sharing. |
Reasons we can share your personal information | Does the Fund share: | Can you limit this sharing? |
For our everyday business purposes — such as to process your transactions, maintain your account(s), respond to court orders and legal investigations, or report to credit bureaus | Yes | No |
For our marketing purposes — to offer our products and services to you | No | We do not share. |
For joint marketing with other financial companies | No | We do not share. |
For our affiliates’ everyday business purposes — information about your transactions and experiences | Yes | No |
For our affiliates’ everyday business purposes — information about your creditworthiness | No | We do not share. |
For nonaffiliates to market to you | No | We do not share. |
Annual Report | April 30, 2021 | 45 |

 | TABLE OF CONTENTS |
| Shareholder Letter | 1 |
| Performance Update | 4 |
| Disclosure of Fund Expenses | 10 |
| Portfolio of Investments | |
| Rondure New World Fund | 11 |
| Rondure Overseas Fund | 14 |
| Statements of Assets and Liabilities | 17 |
| Statements of Operations | 18 |
| Statement of Changes in Net Assets | |
| Rondure New World Fund | 19 |
| Rondure Overseas Fund | 20 |
| Financial Highlights | |
| Rondure New World Fund | 21 |
| Rondure Overseas Fund | 23 |
| Notes to Financial Statements | 25 |
| Report of Independent Registered Public Accounting Firm | 32 |
| Additional Information | 33 |
| Liquidity Risk Management Program | 34 |
| Trustees and Officers | 35 |
| Privacy Policy | 40 |
| Rondure Funds | Shareholder Letter |
| April 30, 2021 (Unaudited) |
Dear Fellow Shareholders,
Overview
“It was as if God had decided to put to the test every capacity for surprise and was keeping the inhabitants of Macondo in a permanent alternation between excitement and disappointment, doubt and revelation, to such an extreme that no one knew for certain where the limits of reality lay. It was an intricate stew of truths and mirages that convulsed the ghost of José Arcadio Buendía with impatience and made him wander all through the house even in broad daylight.” –Gabriel García Márquez, 100 Years of Solitude
Columbian novelist Gabriel Garcia Marquez earned a Nobel Prize for Literature for One Hundred Years of Solitude. He is the father of magical realism, a literary genre where the world is grounded in reality but fantastical elements are considered normal. This in many ways describes the past year on planet Earth. Consider:
| ● | A global pandemic-driven lockdown beginning March 2020. No friends, no school, no restaurants, no gatherings, no office, no travel. |
| ● | Combined U.S. Federal Reserve, Bank of Japan, European Central Bank and People’s Bank of China balance sheet expansion of $7.5 trillion in 2020, equivalent to 14% of combined GDP (Gross Domestic Product). Unprecedented. By the end of 2021 it is estimated that these four largest economies will hold greater than 55% of their combined GDPs on their balance sheets. |
| ● | A run on toilet paper and other staples across America. Empty grocery shelves for weeks on end. |
| ● | A 27% surge in M2 vs. the more normal ~6% CAGR (Compounded Annual Growth Rate). |
| ● | An oil price that went negative in April 2020, meaning that sellers were paying buyers to take their oil. |
| ● | Unprecedented fiscal stimulus packages (as a percentage of GDP) from countries like Japan (54%), Germany (36%), Italy (28%), and the U.S. (27%). |
| ● | The rise of special purpose acquisitions companies (SPACs) or “blank check companies” which have raised over $120 billion in the last 15 months. |
| ● | Record-high and still-rising margin debt. |
| ● | A massive margin call on “family office” Archegos Capital, resulting in a fire sale of more than $24 billion in stock and billions of dollars of losses at Credit Suisse Group and Nomura Holdings. |
| ● | The largest mass demonstrations in U.S. history, led by the Black community, in support of racial equality and police reform. These protests have evolved into a broader national discussion around race relations in America. |
| ● | Unprecedented and devastating wildfires in Australia and California. |
| ● | The release of actual footage of an “Unidentified Aerial Phenomena” (aka: UFO) by the Pentagon. |
| ● | The lodging of the massive Ever Given container ship in the Suez Canal, a major East-West trade route. |
| ● | The exit of the United Kingdom from the European Union. Brexit happened. Really. |
Life really can be stranger than fiction. It certainly has been over the last year.
So where do we stand?
Across emerging markets broadly, resource-rich and tourist-beneficiary countries are surging as capital floods back to these previously unloved corners of the market. At the same time, many growth stocks with high valuation multiples are coming under pressure. The Chinese equity market has been particularly volatile. China’s financial regulators are publicly warning against the risks of asset bubbles in foreign financial markets as well as stress in its own property market. Chinese regulators continue to take a tough anti-trust stance on its internet companies, which created an overhang on these stocks and encouraged profit-taking. Geopolitical issues in Brazil and Turkey have renewed investors’ concerns regarding those developing nations that are more vulnerable to rising U.S. Treasury yields and a strong dollar. Companies in these countries—those with fragile current accounts accounts—have been among the worst performers in the index, while equity markets in North Asia are holding up relatively better.
| Annual Report | April 30, 2021 | 1 |
| Rondure Funds | Shareholder Letter |
| April 30, 2021 (Unaudited) |
Uneven as it is, an economic recovery in much of the world appears to be well underway. That is especially true in the developed world. Equity markets and other financial assets have staged an impressive recovery from their March lows, propelled by stimulus and liquidity. U.S. real GDP is forecast to rebound past 6% in 2021, according to a Bloomberg survey of economists, after contracting 3.5% in 2020. The IMF expects the world economy to grow at almost the same rate this year, although at varying speeds across countries.
Yet, despite this progress, major uncertainties about the recovery linger.
Consider, for instance, the dilemma facing the Federal Reserve as it attempts to stimulate a recovery in employment while avoiding asset bubbles and excessive inflation. With U.S. unemployment still exceptionally high at over 6%, it is difficult to imagine robust wage-driven inflation until unemployment falls below the pre-pandemic level of 3.5%. In fact, the national unemployment landscape may be far weaker than the 6% headline figure captures. Using a broader government measure (U-6) that includes people who stopped looking for work in the last 12 months as well as those who can only find part-time jobs, unemployment stands at a whopping 10.7%.
The Fed’s messaging has been clear: It will tolerate higher inflation for longer periods of time before policy rates rise. Should that outcome be achieved, the adverse impact on equity markets could be substantial. Longer-dated sovereign bonds tend to rapidly incorporate any hint of rising inflation, leaving long-duration equities especially vulnerable and debt service costs higher. We have seen glimpses of this already in 2021. Yet the last few years have also shown how fragile the U.S. economy is against higher interest rates, limiting the potential for harmful runaway inflation, in our view. Sustained, sharply higher private borrowing costs would likely cause a material domestic credit contraction. The ensuing economic slowdown may throw cold water on rising prices rather quickly. One need only recall how quickly financial markets tumbled and prevailing price levels cooled in late 2018 and 2019 during the Fed’s so-called “autopilot” quantitative tightening phase to see that the Fed’s ability to anchor price levels, should it choose to do so, appears to be quite robust.
We believe the inflation debate will be resolved as we move into 2022 and beyond. In the meantime, much of the world is focused on getting back to normal—to living again. The dramatic surge in the global savings rate during the pandemic (skewed to upper-income) is likely to normalize as consumers travel, eat out, dress up and otherwise enjoy life. So many companies will benefit from these trends. The Funds own many of these names. We believe that they will do well regardless of most inflation outcomes, regardless of the gyrations in the market from one day to the next as investors vacillate between greed and fear.
Fund Performance & Attribution
Rondure Overseas: For the year, the Institutional share class returned +37.85% vs. +40.45% for the benchmark. The key investment region for the Fund is Western Europe, making up over 60% of the portfolio. The Fund's outperformance in Asia Pacific and North America, was countered by a small underperformance in Western Europe. Across sectors, the Fund outperformed in Health Care and Technology, but underperformed a little in the Consumer sector. As of the date of this report, the Fund remains heavily allocated to the Consumer sector.
Rondure New World: For the year, the Institutional share class returned +37.11% vs. +49.21% for the benchmark. The key investment region for the Fund is Asia Pacific, making up over 60% of the portfolio. The Fund outperformed in China, but was underweight there, while the Fund underperformed in several smaller Asian countries. The Fund outperformed in Eastern Europe, but it is a small segment of the Fund's portfolio. Across sectors, the Fund outperformed in Health Care and Financials, but underperformed in the Industrials and Consumer sectors. As of the date of this report, the Fund remains heavily allocated to the Consumer sector.
Parting Thoughts and Market Outlook
There is certainly no lack of commentary and memes about excessive risk-taking in the financial markets and inflation in asset prices. Yet markets continued to want to march forward after brushing off the prolonged exuberance from retail investors and leverage induced blow-ups in some hedge funds. In a vast liquidity environment and a post-COVID world, it seems like no countries other than the U.S and China are material enough to present meaningful systemic risks to slow down the momentum in some pockets of the financial market like what the GFC and previous emerging market debt crises presented. Concerns over the prospect of rising inflation and corporate taxes were short-lived. The ample liquidity is back to rotating between deep cyclical sectors to high-flying growth stocks, resulting in an environment where “steady-eddy” companies are somewhat ignored in emerging markets.
We believe that from a risk mitigation perspective, owning a diversified portfolio of reasonably priced stocks across the market capitalization makes sense at this juncture where risk factors are becoming more prominent around the globe. While we are constructive in the long-term structural opportunities in broader emerging markets, we are reluctant to chase expensive stocks that might be priced at the “best case scenario.” Many are that we believe to be unstainable valuation multiples which hinge on the assumption that long-term interest rates will stay ultra-low perpetually. We believe that the prudent course is to focus on companies with quality return metrics and strong moats that are equipped with durable balance sheets to withstand unexpected shocks.
| 2 | 1.855.775.3337 | www.rondureglobal.com |
| Rondure Funds | Shareholder Letter |
| April 30, 2021 (Unaudited) |
The Rondure team remains wholly dedicated to identifying investment opportunities that fit our disciplined approach. It is the adherence to this discipline that centers us on what we believe to be the greatest upside opportunities with the least amount of risk for our clients. We continue to work diligently to provide our clients with our best efforts in stock picking, and we are grateful for your confidence in us as active managers.
Sincerely,
The Rondure Global Advisors Research Team
The objective of all Rondure Funds is long-term growth of capital.
RISKS: Investing in foreign securities entails special risks, such as currency fluctuations and political uncertainties, which are described in more detail in the prospectus. Investments in emerging and frontier markets are subject to the same risks as other foreign securities and may be subject to greater risks than investments in foreign countries with more established economies and securities markets. Diversification does not eliminate the risk of experiencing investment loses.
Must be preceded or accompanied by a prospectus.
An investor should consider investment objectives, risks, charges, and expenses carefully before investing. To obtain a Rondure Funds prospectus, containing this and other information, visit www.rondureglobal.com or call 1-855-775-3337. Please read it carefully before investing.
The views and information discussed in this commentary are as of the date of publication, are subject to change, and may not reflect the writer's current views. The views expressed represent an assessment of market conditions at a specific point in time, are opinions only and should not be relied upon as investment advice regarding a particular investment or markets in general. Such information does not constitute a recommendation to buy or sell specific securities or investment vehicles. It should not be assumed that any investment will be profitable or will equal the performance of the Funds or any securities or any sectors mentioned herein. The subject matter contained herein has been derived from several sources believed to be reliable and accurate at the time of compilation. The Funds do not accept any liability for losses either direct or consequential caused by the use of this information.
Past performance does not guarantee future results.
Rondure Funds are distributed by ALPS Distributors, Inc. (ADI). ADI is not affiliated with Rondure Global Advisors.
| Annual Report | April 30, 2021 | 3 |
| Rondure New World Fund | Performance Update |
| April 30, 2021 (Unaudited) |
Annualized Total Return Performance for the periods ended April 30, 2021
| 1 Year | 3 Year | Since Inception(a) | Expense Ratio(b) | ||
| Gross | Net(c) | ||||
| Rondure New World Fund – Institutional (RNWIX) | 37.11% | 7.19% | 8.57% | 1.43% | 1.10% |
| Rondure New World Fund – Investor (RNWOX) | 36.83% | 6.92% | 8.30% | 1.72% | 1.35% |
| MSCI Emerging Markets Index(d) | 49.21% | 7.91% | 11.26% | ||
Performance data quoted represents past performance. Past performance does not guarantee future results. Investment return and principal value of an investment will fluctuate so that an investor’s shares, when sold or redeemed, may be worth more or less than the original cost. The Fund imposes a 2.00% redemption fee on shares held for less than 60 days. Current performance data may be higher or lower than actual data quoted. For the most current month-end performance data, please call 1-855-775-3337.
The table does not reflect the deduction of taxes a shareholder would pay on Fund distributions or redemption of Fund shares.
Subject to investment risks, including possible loss of the principal amount invested.
Returns for periods less than 1 year are cumulative.
| (a) | Fund inception date of May 1, 2017. |
| (b) | Ratios as of the Prospectus dated August 31, 2020 and may differ from the ratios presented in the Financial Highlights. |
| (c) | Rondure Global Advisors, LLC (the “Advisor”), has agreed to waive and/or reimburse fees or expenses in order to limit Total Annual Fund Operating Expenses After Fee Waiver/ Expense Reimbursement (excluding acquired fund fees and expenses, brokerage expenses, interest expenses, taxes and extraordinary expenses) to 1.35% and 1.10% of the Fund’s average daily net assets for the Fund’s Investor Class Shares and Institutional Class Shares, respectively. This agreement (the “Expense Agreement”) is in effect through August 31, 2021. The Advisor will be permitted to recover, on a class-by-class basis, expenses it has borne through the Expense Agreement to the extent that a Fund’s expenses in later periods fall below the expense cap in effect at the time of waiver or reimbursement. However, such recapture payments may not cause the Fund’s expense ratio (after recapture) to exceed the lesser of (i) the expense cap in effect at the time of the waiver and (ii) the expense cap in effect at the time of the recapture. Notwithstanding the foregoing, the Fund will not be obligated to pay any such deferred fees and expenses more than three years after the date of the waiver or reimbursement. The Expense Agreement may not be terminated or modified by the Advisor prior to August 31, 2021, except with the approval of the Fund’s Board of Trustees. |
| (d) | The MSCI Emerging Markets Index is an unmanaged total return index, reported in U.S. Dollars, based on share prices and reinvested dividends of approximately 800 companies from 24 emerging market countries. The Index is not actively managed and does not reflect any deductions for fees, expense, or taxes. An investor may not invest directly in the Index. |
| 4 | 1.855.775.3337 | www.rondureglobal.com |
| Rondure New World Fund | Performance Update |
| April 30, 2021 (Unaudited) |
Growth of $10,000 for the period ended April 30, 2021
The chart shown above represent a hypothetical investment of $10,000 in the Fund’s Investor Class shares for the period from inception to April 30, 2021. All returns reflect reinvested dividends, but do not reflect the deduction of taxes that an investor would pay on distributions or redemptions.
Investing in the Fund is subject to investment risks, including possible loss of the principal amount invested.
The Fund also offers Institutional Class shares, performance for which is not reflected in the graphs above. The performance of Institutional Class shares may be higher or lower than the performance of the Investor Class shares shown in the graphs above based upon differences in fees paid by shareholders investing in the Investor Class shares and Institutional Class shares.
| Annual Report | April 30, 2021 | 5 |
| Rondure New World Fund | Performance Update |
| April 30, 2021 (Unaudited) |
| Regional Allocation (as a % of Net Assets)* | |
| Asia ex Japan | 79.7% |
| North America | 6.8% |
| Africa/Middle East | 5.4% |
| Europe | 3.5% |
| Latin America | 1.5% |
| Cash, Cash Equivalents, & Other Net Assets | 3.1% |
| Total | 100.0% |
| Top 10 Holdings (as a % of Net Assets)* | |
| Taiwan Semiconductor Manufacturing Co., Ltd. | 5.4% |
| Samsung Electronics Co., Ltd. | 3.7% |
| ANTA Sports Products, Ltd. | 3.0% |
| Li Ning Co., Ltd. | 2.9% |
| Tata Consultancy Services, Ltd. | 2.9% |
| Yum China Holdings, Inc. | 2.6% |
| Safaricom PLC | 2.0% |
| Moscow Exchange MICEX-RTS PJSC | 1.9% |
| Wal-Mart de Mexico SAB de CV | 1.9% |
| Bumrungrad Hospital PCL | 1.9% |
| Total | 28.2% |
| * | Holdings are subject to change, and may not reflect the current or future position of the portfolio. |
| 6 | 1.855.775.3337 | www.rondureglobal.com |
| Rondure Overseas Fund | Performance Update |
| April 30, 2021 (Unaudited) |
Annualized Total Return Performance for the periods ended April 30, 2021
| 1 Year | 3 Year | Since Inception(a) | Expense Ratio(b) | ||
| Gross | Net(c) | ||||
| Rondure Overseas Fund – Institutional (ROSIX)(d) | 37.85% | 8.32% | 10.17% | 1.73% | 0.85% |
| Rondure Overseas Fund – Investor (ROSOX) | 37.34% | 8.05% | 9.91% | 2.06% | 1.10% |
| MSCI EAFE Index(e) | 40.45% | 6.78% | 8.72% | ||
Performance data quoted represents past performance. Past performance does not guarantee future results. Investment return and principal value of an investment will fluctuate so that an investor’s shares, when sold or redeemed, may be worth more or less than the original cost. The Fund imposes a 2.00% redemption fee on shares held for less than 60 days. Current performance data may be higher or lower than actual data quoted. For the most current month-end performance data, please call 1-855-775-3337.
The table does not reflect the deduction of taxes a shareholder would pay on Fund distributions or redemption of Fund shares.
Subject to investment risks, including possible loss of the principal amount invested.
Returns for periods less than 1 year are cumulative.
| (a) | Fund inception date of May 1, 2017. |
| (b) | Ratios as of the Prospectus dated August 31, 2020 and may differ from the ratios presented in the Financial Highlights. |
| (c) | Rondure Global Advisors, LLC (the “Advisor”), has agreed to waive and/or reimburse fees or expenses in order to limit Total Annual Fund Operating Expenses After Fee Waiver/ Expense Reimbursement (excluding acquired fund fees and expenses, brokerage expenses, interest expenses, taxes and extraordinary expenses) to 1.10% and 0.85% of the Fund’s average daily net assets for the Fund’s Investor Class Shares and Institutional Class Shares, respectively. This agreement (the “Expense Agreement”) is in effect through August 31, 2021. The Advisor will be permitted to recover, on a class-by-class basis, expenses it has borne through the Expense Agreement to the extent that a Fund’s expenses in later periods fall below the expense cap in effect at the time of waiver or reimbursement. However, such recapture payments may not cause the Fund’s expense ratio (after recapture) to exceed the lesser of (i) the expense cap in effect at the time of the waiver and (ii) the expense cap in effect at the time of the recapture. Notwithstanding the foregoing, the Fund will not be obligated to pay any such deferred fees and expenses more than three years after the date of the waiver or reimbursement. The Expense Agreement may not be terminated or modified by the Advisor prior to August 31, 2021, except with the approval of the Fund’s Board of Trustees. |
| (d) | Excludes adjustments in accordance with accounting principles generally accepted in the United States of America and as such, the net asset value and total return for shareholder transactions reported to the market may differ from the net asset value for financial reporting purposes. |
| (e) | The MSCI EAFE Index is an unmanaged total return index, reported in U.S. dollars, based on share prices and reinvested net dividends of approximately 1,100 companies from 22 developed market countries excluding the US and Canada. The Index is not actively managed and does not reflect any deductions for fees, expense, or taxes. An investor may not invest directly in the Index. |
| Annual Report | April 30, 2021 | 7 |
| Rondure Overseas Fund | Performance Update |
| April 30, 2021 (Unaudited) |
Growth of $10,000 for the period ended April 30, 2021
The chart shown above represent a hypothetical investment of $10,000 in the Fund’s Investor Class shares for the period from inception to April 30, 2021. All returns reflect reinvested dividends, but do not reflect the deduction of taxes that an investor would pay on distributions or redemptions.
Investing in the Fund is subject to investment risks, including possible loss of the principal amount invested.
The Fund also offers Institutional Class shares, performance for which is not reflected in the graphs above. The performance of Institutional Class shares may be higher or lower than the performance of the Investor Class shares shown in the graphs above based upon differences in fees paid by shareholders investing in the Investor Class shares and Institutional Class shares.
| 8 | 1.855.775.3337 | www.rondureglobal.com |
| Rondure Overseas Fund | Performance Update |
| April 30, 2021 (Unaudited) |
| Regional Allocation (as a % of Net Assets)* | |
| Europe | 67.2% |
| Japan | 12.9% |
| North America | 12.7% |
| Australia/New Zealand | 5.3% |
| Asia ex Japan | 1.3% |
| Cash, Cash Equivalents, & Other Net Assets | 0.6% |
| Total | 100.0% |
| Top 10 Holdings (as a % of Net Assets)* | |
| Nestle SA | 3.5% |
| Unilever PLC | 3.3% |
| adidas AG | 2.8% |
| Diageo PLC | 2.3% |
| Mastercard, Inc. | 2.2% |
| Coca-Cola HBC AG | 2.0% |
| Ferrari NV | 2.0% |
| Puma SE | 1.9% |
| Visa, Inc. | 1.8% |
| Chocoladefabriken Lindt & Spruengli AG | 1.7% |
| Total | 23.5% |
| * | Holdings are subject to change, and may not reflect the current or future position of the portfolio. |
| Annual Report | April 30, 2021 | 9 |
| Rondure Funds | Disclosure of Fund Expenses |
| April 30, 2021 (Unaudited) |
As a shareholder of a Fund, you incur two types of costs: (1) transaction costs, including sales charges (loads) on purchase payments, reinvested dividends, or other distributions; redemption fees; and exchange fees; and (2) ongoing costs, including management fees; distribution and/or service (12b-1) fees; and other Fund expenses. This example is intended to help you understand your ongoing costs (in dollars) of investing in the Fund and to compare these costs with the ongoing costs of investing in other mutual funds.
This example is based on an investment of $1,000 invested at the beginning of the period and held for the entire six-month period of November 1, 2020 through April 30, 2021.
Actual Expenses The first line of the table provides information about actual account values and actual expenses. You may use the information in this line, together with the amount you invested, to estimate the expenses that you paid over the period. Simply divide your account value by $1,000 (for example, an $8,600 account value divided by $1,000 = 8.6), then multiply the result by the number in the first line under the heading “Expenses Paid During Period” to estimate the expenses you paid on your account during this period.
Hypothetical Example for Comparison Purposes The second line of the table provides information about hypothetical account values and hypothetical expenses based on the Fund’s actual expense ratio and an assumed rate of return of 5% per year before expenses, which is not the Fund’s actual return. The hypothetical account values and expenses may not be used to estimate the actual ending account balance or expenses you paid for the period. You may use this information to compare the ongoing costs of investing in the Fund and other mutual funds. To do so, compare this 5% hypothetical example with the 5% hypothetical examples that appear in the shareholder reports of the other funds. Please note that the expenses shown in the table are meant to highlight your ongoing costs only and do not reflect any transactional costs, such as redemption fees or exchange fees. Therefore, the second line of the table is useful in comparing ongoing costs only and will not help you determine the relative total costs of owning different funds. In addition, if these transactional costs were included, your costs would have been higher.
Beginning Account Value | Ending Account Value | Expense Ratio(a) | Expenses Paid During Period November 1, 2020 - April 30, 2021(b) | |
| Rondure New World Fund | ||||
| Institutional Class | ||||
| Actual | $1,000.00 | $1,163.60 | 1.10% | $5.90 |
| Hypothetical (5% return before expenses) | $1,000.00 | $1,019.34 | 1.10% | $5.51 |
| Investor Class | ||||
| Actual | $1,000.00 | $1,161.70 | 1.35% | $7.24 |
| Hypothetical (5% return before expenses) | $1,000.00 | $1,018.10 | 1.35% | $6.76 |
| Rondure Overseas Fund | ||||
| Institutional Class | ||||
| Actual | $1,000.00 | $1,195.60 | 0.85% | $4.63 |
| Hypothetical (5% return before expenses) | $1,000.00 | $1,020.58 | 0.85% | $4.26 |
| Investor Class | ||||
| Actual | $1,000.00 | $1,193.40 | 1.10% | $5.98 |
| Hypothetical (5% return before expenses) | $1,000.00 | $1,019.34 | 1.10% | $5.51 |
| (a) | The Fund's expense ratios have been annualized based on the Fund's most recent fiscal half-year expenses. |
| (b) | Expenses are equal to the Fund's annualized expense ratio multiplied by the average account value over the period, multiplied by the number of days in the most recent fiscal half-year (181)/365 (to reflect the half-year period). |
| 10 | 1.855.775.3337 | www.rondureglobal.com |
| Rondure New World Fund | Portfolio of Investments |
April 30, 2021
| Shares | Value (Note 2) | |||||||
| COMMON STOCKS (96.88%) | ||||||||
| Bangladesh (0.47%) | ||||||||
| Square Pharmaceuticals, Ltd. | 439,773 | $ | 1,098,719 | |||||
| Brazil (1.15%) | ||||||||
| B3 SA - Brasil Bolsa Balcao | 252,400 | 2,395,269 | ||||||
| TOTVS SA | 54,600 | 312,801 | ||||||
| 2,708,070 | ||||||||
| China (20.29%) | ||||||||
| Alibaba Group Holding, Ltd.(a) | 151,700 | 4,394,130 | ||||||
| ANTA Sports Products, Ltd. | 397,000 | 7,129,671 | ||||||
| Autohome, Inc., ADR | 14,650 | 1,358,494 | ||||||
| Baidu, Inc., Sponsored ADR(a) | 5,281 | 1,110,753 | ||||||
| China Resources Beer Holdings Co., Ltd. | 140,000 | 1,130,958 | ||||||
| Country Garden Services Holdings Co., Ltd. | 195,300 | 2,049,107 | ||||||
| JD.com, Inc., Class A(a) | 88,300 | 3,396,613 | ||||||
| Kweichow Moutai Co., Ltd., Class A | 4,400 | 1,364,418 | ||||||
| Li Ning Co., Ltd. | 845,500 | 6,900,930 | ||||||
| LONGi Green Energy Technology Co., Ltd., Class A(a) | 251,100 | 3,856,809 | ||||||
| Sichuan Swellfun Co., Ltd., Class A | 132,500 | 2,094,530 | ||||||
| Tencent Holdings, Ltd. | 21,300 | 1,708,332 | ||||||
| Trip.com Group, Ltd., ADR(a) | 38,134 | 1,490,277 | ||||||
| Tsingtao Brewery Co., Ltd., Class H | 322,000 | 2,922,468 | ||||||
| WuXi AppTec Co., Ltd., Class H(b)(c) | 31,200 | 737,851 | ||||||
| Yum China Holdings, Inc. | 97,300 | 6,124,488 | ||||||
| 47,769,829 | ||||||||
| Hong Kong (2.88%) | ||||||||
| Hong Kong Exchanges & Clearing, Ltd. | 73,700 | 4,459,335 | ||||||
| Vitasoy International Holdings, Ltd. | 599,000 | 2,317,267 | ||||||
| 6,776,602 | ||||||||
| Shares | Value (Note 2) | |||||||
| India (18.30%) | ||||||||
| 3M India, Ltd.(a) | 1,575 | $ | 543,012 | |||||
| Asian Paints, Ltd. | 36,352 | 1,244,770 | ||||||
| Castrol India, Ltd. | 423,000 | 718,111 | ||||||
| Colgate-Palmolive India, Ltd. | 46,704 | 934,364 | ||||||
| Crompton Greaves Consumer Electricals, Ltd. | 271,846 | 1,412,583 | ||||||
| Dabur India, Ltd. | 180,000 | 1,307,489 | ||||||
| Divi's Laboratories, Ltd.(a) | 56,020 | 3,072,299 | ||||||
| HCL Technologies, Ltd. | 247,324 | 3,001,545 | ||||||
| HDFC Asset Management Co., Ltd.(b)(c) | 86,153 | 3,229,145 | ||||||
| HDFC Bank, Ltd.(a) | 157,547 | 3,003,863 | ||||||
| Honeywell Automation India, Ltd. | 355 | 206,633 | ||||||
| Jubilant Foodworks, Ltd.(a) | 33,441 | 1,305,496 | ||||||
| Marico, Ltd. | 31,400 | 174,417 | ||||||
| Nestle India, Ltd. | 7,995 | 1,760,336 | ||||||
| Nippon Life India Asset Management, Ltd.(b)(c) | 589,152 | 2,717,786 | ||||||
| Oracle Financial Services Software, Ltd. | 20,000 | 939,228 | ||||||
| Pidilite Industries, Ltd.(a) | 13,575 | 332,775 | ||||||
| Reliance Industries, Ltd. | 102,078 | 2,748,585 | ||||||
| Schaeffler India, Ltd. | 23,500 | 1,660,331 | ||||||
| SKF India, Ltd. | 46,424 | 1,401,729 | ||||||
| Tata Consultancy Services, Ltd. | 165,665 | 6,789,307 | ||||||
| Tech Mahindra, Ltd. | 199,853 | 2,591,229 | ||||||
| United Breweries, Ltd. | 66,362 | 1,085,749 | ||||||
| United Spirits, Ltd.(a) | 127,406 | 893,635 | ||||||
| 43,074,417 | ||||||||
| Indonesia (2.79%) | ||||||||
| Ace Hardware Indonesia Tbk PT | 17,144,800 | 1,756,615 | ||||||
| Bank Central Asia Tbk PT | 415,600 | 921,398 | ||||||
| Indofood CBP Sukses Makmur Tbk PT | 4,105,200 | 2,472,498 | ||||||
| Unilever Indonesia Tbk PT | 3,434,200 | �� | 1,426,459 | |||||
| 6,576,970 | ||||||||
| Kenya (1.97%) | ||||||||
| Safaricom PLC | 12,374,200 | 4,629,569 | ||||||
See Notes to Financial Statements.
| Annual Report | April 30, 2021 | 11 |
| Rondure New World Fund | Portfolio of Investments |
April 30, 2021
| Shares | Value (Note 2) | |||||||
| Malaysia (4.61%) | ||||||||
| Carlsberg Brewery Malaysia Bhd | 631,000 | $ | 3,524,382 | |||||
| Genting Bhd | 2,597,800 | 3,158,150 | ||||||
| Heineken Malaysia Bhd | 663,000 | 4,175,715 | ||||||
| 10,858,247 | ||||||||
| Mexico (5.07%) | ||||||||
| Becle SAB de CV | 817,200 | 1,961,006 | ||||||
| Grupo Aeroportuario del Centro Norte SAB de CV, Class B(a) | 193,000 | 1,205,905 | ||||||
| Grupo Aeroportuario del Pacifico SAB de CV, Class B(a) | 201,200 | 2,071,197 | ||||||
| Grupo Aeroportuario del Sureste SAB de CV(a) | 126,290 | 2,138,644 | ||||||
| Wal-Mart de Mexico SAB de CV | 1,392,900 | 4,567,821 | ||||||
| 11,944,573 | ||||||||
| Netherlands (0.40%) | ||||||||
| Prosus NV | 8,715 | 945,399 | ||||||
| Peru (0.30%) | ||||||||
| Inretail Peru Corp(b)(c) | 20,196 | 714,938 | ||||||
| Philippines (3.70%) | ||||||||
| International Container Terminal Services, Inc. | 272,000 | 733,807 | ||||||
| Philippine Seven Corp. | 1,678,447 | 3,729,882 | ||||||
| Wilcon Depot, Inc. | 11,607,600 | 4,242,861 | ||||||
| 8,706,550 | ||||||||
| Poland (0.38%) | ||||||||
| Dino Polska SA(a)(b)(c) | 13,912 | 903,205 | ||||||
| Russia (2.69%) | ||||||||
| LUKOIL PJSC, Sponsored ADR | 22,777 | 1,746,540 | ||||||
| Moscow Exchange MICEX-RTS PJSC | 1,945,750 | 4,578,266 | ||||||
| 6,324,806 | ||||||||
| South Africa (2.47%) | ||||||||
| Clicks Group, Ltd. | 115,400 | 1,927,246 | ||||||
| Shares | Value (Note 2) | |||||||
| South Africa (continued) | ||||||||
| Distell Group Holdings, Ltd.(a) | 69,900 | $ | 608,266 | |||||
| Naspers, Ltd. | 14,393 | 3,285,415 | ||||||
| 5,820,927 | ||||||||
| South Korea (5.68%) | ||||||||
| Kangwon Land, Inc.(a) | 48,000 | 1,091,743 | ||||||
| LG Household & Health Care, Ltd. | 1,664 | 2,302,239 | ||||||
| NAVER Corp. | 3,858 | 1,246,865 | ||||||
| Samsung Electronics Co., Ltd. | 119,251 | 8,737,319 | ||||||
| 13,378,166 | ||||||||
| Sri Lanka (0.59%) | ||||||||
| Lion Brewery Ceylon PLC | 472,256 | 1,377,314 | ||||||
| Taiwan (12.12%) | ||||||||
| Chroma ATE, Inc. | 153,000 | 1,062,614 | ||||||
| MediaTek, Inc. | 71,000 | 3,012,029 | ||||||
| momo.com, Inc. | 58,000 | 2,138,689 | ||||||
| Poya International Co., Ltd.(a) | 44,000 | 964,021 | ||||||
| President Chain Store Corp. | 401,000 | 3,890,416 | ||||||
| Sinbon Electronics Co., Ltd. | 238,000 | 2,215,301 | ||||||
| Taiwan FamilyMart Co., Ltd. | 274,000 | 2,609,244 | ||||||
| Taiwan Semiconductor Manufacturing Co., Ltd. | 589,000 | 12,651,702 | ||||||
| 28,544,016 | ||||||||
| Thailand (5.85%) | ||||||||
| Airports of Thailand PCL | 721,000 | 1,435,632 | ||||||
| Bangkok Dusit Medical Services PCL | 1,685,000 | 1,174,292 | ||||||
| Bumrungrad Hospital PCL | 1,046,300 | 4,502,744 | ||||||
| CP ALL PCL(a) | 1,116,800 | 2,241,670 | ||||||
| Home Product Center PCL | 1,620,000 | 733,585 | ||||||
| TOA Paint Thailand PCL | 3,321,000 | 3,679,631 | ||||||
| 13,767,554 | ||||||||
| United Arab Emirates (0.97%) | ||||||||
| Aramex PJSC | 2,133,000 | 2,270,539 | ||||||
| United States (1.77%) | ||||||||
| Starbucks Corp. | 13,475 | 1,542,753 | ||||||
See Notes to Financial Statements.
| 12 | 1.855.775.3337 | www.rondureglobal.com |
| Rondure New World Fund | Portfolio of Investments |
April 30, 2021
| Shares | Value (Note 2) | |||||||
| United States (continued) | ||||||||
| The Walt Disney Co.(a) | 14,150 | $ | 2,632,183 | |||||
| 4,174,936 | ||||||||
| Vietnam (2.43%) | ||||||||
| Saigon Beer Alcohol Beverage Corp. | 64,520 | 467,634 | ||||||
| Vietnam Dairy Products JSC | 846,878 | 3,434,530 | ||||||
| Vincom Retail JSC(a) | 1,305,705 | 1,812,299 | ||||||
| 5,714,463 | ||||||||
| TOTAL COMMON STOCKS | ||||||||
| (Cost $179,872,825) | 228,079,809 | |||||||
| TOTAL INVESTMENTS (96.88%) | ||||||||
| (Cost $179,872,825) | $ | 228,079,809 | ||||||
| Other Assets In Excess Of Liabilities (3.12%) | 7,352,858 | |||||||
| NET ASSETS (100.00%) | $ | 235,432,667 | ||||||
| (a) | Non-Income Producing Security. |
| (b) | Security exempt from registration under Rule 144A of the Securities Act of 1933. These securities may be resold in the ordinary course of business in transactions exempt from registration, normally to qualified institutional buyers. As of April 30, 2021, these securities had a total aggregate market value of $8,302,925 representing 3.53% of net assets. |
| (c) | Security was purchased pursuant to Regulation S under the Securities Act of 1933, which exempts securities offered and sold outside of the United States from registration. Such security cannot be sold in the United States without either an effective registration statement filed pursuant to the Securities Act of 1933, or pursuant to an exemption from registration. As of April 30, 2021, the aggregate market value of those securities was $8,302,925, representing 3.53% of net assets. |
| Sector Composition (April 30, 2021) | |
| Consumer | 47.0% |
| Technology | 24.6% |
| Financials | 9.9% |
| Industrials | 6.5% |
| Health Care | 4.5% |
| Energy & Materials | 4.4% |
| Cash, Cash Equivalents, & Other Net Assets | 3.1% |
| Total | 100% |
Industry Composition (April 30, 2021)
| Beverages | 9.2% |
| Food & Staples Retailing | 8.7% |
| Semiconductors & Semiconductor Equipment | 8.3% |
| Capital Markets | 7.4% |
| Internet & Direct Marketing Retail | 6.6% |
| Textiles, Apparel & Luxury Goods | 6.0% |
| Hotels, Restaurants & Leisure | 5.6% |
| IT Services | 5.3% |
| Food Products | 4.3% |
| Technology Hardware, Storage & Peripherals | 3.7% |
| Transportation Infrastructure | 3.2% |
| Specialty Retail | 2.9% |
| Chemicals | 2.6% |
| Health Care Providers & Services | 2.4% |
| Interactive Media & Services | 2.3% |
| Personal Products | 2.0% |
| Wireless Telecommunication Services | 2.0% |
| Oil, Gas & Consumable Fuels | 1.9% |
| Banks | 1.7% |
| Life Sciences Tools & Services | 1.6% |
| Electronic Equipment, Instruments & Components | 1.5% |
| Machinery | 1.3% |
| Entertainment | 1.1% |
| Other Industries (each less than 1%) | 5.5% |
| Cash and Other Assets, Less Liabilities | 2.9% |
| Total | 100% |
See Notes to Financial Statements.
| Annual Report | April 30, 2021 | 13 |
| Rondure Overseas Fund | Portfolio of Investments |
April 30, 2021
| Shares | Value (Note 2) | |||||||
| COMMON STOCKS (99.35%) | ||||||||
| Australia (4.08%) | ||||||||
| ASX, Ltd. | 1,500 | $ | 84,330 | |||||
| Cochlear, Ltd. | 2,141 | 366,974 | ||||||
| CSL, Ltd. | 1,149 | 240,013 | ||||||
| Domino's Pizza Enterprises, Ltd. | 2,266 | 186,170 | ||||||
| REA Group, Ltd. | 3,470 | 423,288 | ||||||
| 1,300,775 | ||||||||
| Belgium (1.98%) | ||||||||
| Lotus Bakeries NV | 38 | 206,956 | ||||||
| Melexis NV | 2,456 | 267,518 | ||||||
| Warehouses De Pauw CVA | 4,432 | 156,229 | ||||||
| 630,703 | ||||||||
| Britain (18.44%) | ||||||||
| Abcam PLC(a) | 14,900 | 314,425 | ||||||
| B&M European Value Retail SA | 32,987 | 257,759 | ||||||
| Compass Group PLC(a) | 17,438 | 378,699 | ||||||
| Diageo PLC | 16,296 | 731,653 | ||||||
| Diploma PLC | 4,900 | 194,081 | ||||||
| Experian PLC | 2,000 | 77,117 | ||||||
| Greggs PLC(a) | 11,584 | 377,553 | ||||||
| Halma PLC | 4,311 | 154,081 | ||||||
| Intertek Group PLC | 4,705 | 398,836 | ||||||
| J D Wetherspoon PLC(a) | 22,017 | 406,230 | ||||||
| Linde PLC | 563 | 160,892 | ||||||
| London Stock Exchange Group PLC | 4,379 | 447,522 | ||||||
| Rightmove PLC | 26,609 | 225,634 | ||||||
| Rotork PLC | 31,443 | 149,640 | ||||||
| Softcat PLC | 15,101 | 399,793 | ||||||
| Spirax-Sarco Engineering PLC | 939 | 153,217 | ||||||
| Unilever PLC | 17,955 | 1,048,672 | ||||||
| 5,875,804 | ||||||||
| Canada (6.45%) | ||||||||
| Alimentation Couche-Tard, Inc., Class B | 11,400 | 386,291 | ||||||
| Canadian National Railway Co. | 3,442 | 370,565 | ||||||
| Canadian Pacific Railway, Ltd. | 337 | 125,766 | ||||||
| Dollarama, Inc. | 7,340 | 342,053 | ||||||
| Shares | Value (Note 2) | |||||||
| Canada (continued) | ||||||||
| Enbridge, Inc. | 4,200 | $ | 162,000 | |||||
| Fortis, Inc. | 6,853 | 305,699 | ||||||
| Gildan Activewear, Inc.(a) | 5,600 | 194,359 | ||||||
| Ritchie Bros Auctioneers, Inc. | 2,675 | 170,130 | ||||||
| 2,056,863 | ||||||||
| Denmark (4.34%) | ||||||||
| Carlsberg A/S | 1,826 | 320,452 | ||||||
| Coloplast A/S, Class B | 2,377 | 393,323 | ||||||
| Novo Nordisk A/S, Class B | 4,527 | 331,580 | ||||||
| Royal Unibrew A/S | 2,756 | 336,402 | ||||||
| 1,381,757 | ||||||||
| Finland (2.10%) | ||||||||
| Kone Oyj, Class B | 3,200 | 251,377 | ||||||
| Olvi Oyj, Class A | 6,573 | 416,458 | ||||||
| 667,835 | ||||||||
| France (11.95%) | ||||||||
| Air Liquide SA | 2,517 | 424,014 | ||||||
| Bureau Veritas SA(a) | 12,437 | 371,867 | ||||||
| Dassault Systemes SE | 1,450 | 336,364 | ||||||
| EssilorLuxottica SA | 2,554 | 424,966 | ||||||
| Hermes International | 330 | 414,201 | ||||||
| L'Oreal SA | 1,210 | 497,008 | ||||||
| LVMH Moet Hennessy Louis Vuitton SE | 624 | 469,780 | ||||||
| Pernod Ricard SA | 2,422 | 497,055 | ||||||
| Sodexo SA(a) | 2,301 | 229,887 | ||||||
| TOTAL SE | 3,259 | 144,286 | ||||||
| 3,809,428 | ||||||||
| Germany (7.04%) | ||||||||
| adidas AG(a) | 2,888 | 891,812 | ||||||
| CTS Eventim AG & Co., KGaA(a) | 4,797 | 331,500 | ||||||
| Puma SE(a) | 5,865 | 618,534 | ||||||
| SAP SE | 1,676 | 235,269 | ||||||
| Symrise AG | 1,280 | 165,277 | ||||||
| 2,242,392 | ||||||||
| Hong Kong (1.33%) | ||||||||
| Hong Kong Exchanges & Clearing, Ltd. | 4,500 | 272,279 | ||||||
See Notes to Financial Statements.
| 14 | 1.855.775.3337 | www.rondureglobal.com |
| Rondure Overseas Fund | Portfolio of Investments |
April 30, 2021
| Shares | Value (Note 2) | |||||||
| Hong Kong (continued) | ||||||||
| Vitasoy International Holdings, Ltd. | 39,000 | $ | 150,874 | |||||
| 423,153 | ||||||||
| Ireland (1.34%) | ||||||||
| ICON PLC, ADR(a) | 1,285 | 278,781 | ||||||
| Kerry Group PLC, Class A | 1,136 | 147,229 | ||||||
| 426,010 | ||||||||
| Italy (3.04%) | ||||||||
| Davide Campari-Milano NV | 20,416 | 240,838 | ||||||
| DiaSorin SpA | 599 | 101,721 | ||||||
| Ferrari NV | 2,932 | 627,981 | ||||||
| 970,540 | ||||||||
| Japan (12.90%) | ||||||||
| Create SD Holdings Co., Ltd. | 4,400 | 133,462 | ||||||
| IR Japan Holdings, Ltd. | 1,600 | 210,376 | ||||||
| Kotobuki Spirits Co., Ltd. | 5,400 | 323,140 | ||||||
| Kusuri no Aoki Holdings Co., Ltd. | 800 | 56,218 | ||||||
| Matsumotokiyoshi Holdings Co., Ltd. | 4,700 | 188,576 | ||||||
| MonotaRO Co., Ltd. | 13,000 | 331,869 | ||||||
| Nihon M&A Center, Inc. | 13,400 | 351,154 | ||||||
| OBIC Business Consultants Co., Ltd. | 3,000 | 176,228 | ||||||
| Oriental Land Co., Ltd. | 3,500 | 495,585 | ||||||
| Recruit Holdings Co., Ltd. | 3,700 | 167,209 | ||||||
| Secom Co., Ltd. | 3,600 | 298,962 | ||||||
| Seria Co., Ltd. | 10,000 | 362,796 | ||||||
| Seven & i Holdings Co., Ltd. | 5,000 | 214,979 | ||||||
| Shiseido Co., Ltd. | 4,300 | 311,926 | ||||||
| Sundrug Co., Ltd. | 700 | 23,859 | ||||||
| Unicharm Corp. | 12,000 | 465,990 | ||||||
| 4,112,329 | ||||||||
| Netherlands (5.49%) | ||||||||
| Aalberts NV | 3,886 | 210,472 | ||||||
| Akzo Nobel NV | 1,500 | 180,194 | ||||||
| ASML Holding NV | 509 | 331,186 | ||||||
| Euronext NV(b)(c) | 2,020 | 203,270 | ||||||
| Heineken NV | 4,288 | 497,175 | ||||||
| Prosus NV | 1,660 | 180,076 | ||||||
| Shares | Value (Note 2) | |||||||
| Netherlands (continued) | ||||||||
| Royal Dutch Shell PLC, Class A | 7,700 | $ | 146,637 | |||||
| 1,749,010 | ||||||||
| New Zealand (1.23%) | ||||||||
| Mainfreight, Ltd. | 7,543 | 390,798 | ||||||
| Sweden (1.28%) | ||||||||
| Assa Abloy AB, Class B | 14,289 | 407,290 | ||||||
| Switzerland (10.16%) | ||||||||
| Chocoladefabriken Lindt & Spruengli AG | 60 | 556,474 | ||||||
| Coca-Cola HBC AG | 18,214 | 629,362 | ||||||
| Flughafen Zurich AG(a) | 983 | 176,741 | ||||||
| Givaudan SA | 33 | 138,179 | ||||||
| Nestle SA | 9,255 | 1,103,405 | ||||||
| Partners Group Holding AG | 224 | 318,861 | ||||||
| Schindler Holding AG | 556 | 154,639 | ||||||
| Sika AG | 538 | 160,472 | ||||||
| 3,238,133 | ||||||||
| United States (6.20%) | ||||||||
| Accenture PLC, Class A | 927 | 268,802 | ||||||
| Estee Lauder Cos., Inc., Class A | 939 | 294,658 | ||||||
| Mastercard, Inc., Class A | 1,796 | 686,180 | ||||||
| MSCI, Inc. | 340 | 165,162 | ||||||
| Visa, Inc., Class A | 2,399 | 560,310 | ||||||
| 1,975,112 | ||||||||
| TOTAL COMMON STOCKS | ||||||||
| (Cost $24,575,970) | 31,657,932 | |||||||
| Rights and Warrants (0.08%) | ||||||||
| Netherlands (0.08%) | ||||||||
| Euronext NV | 2,020 | 23,678 | ||||||
| TOTAL Rights and Warrants | ||||||||
| (Cost $0) | 23,678 | |||||||
See Notes to Financial Statements.
| Annual Report | April 30, 2021 | 15 |
| Rondure Overseas Fund | Portfolio of Investments |
April 30, 2021
| Shares | Value (Note 2) | |||||||
| TOTAL INVESTMENTS (99.43%) | ||||||||
| (Cost $24,575,970) | $ | 31,681,610 | ||||||
| Other Assets In Excess Of Liabilities (0.57%) | 182,868 | |||||||
| NET ASSETS (100.00%) | $ | 31,864,478 | ||||||
| (a) | Non-Income Producing Security. |
| (b) | Security exempt from registration under Rule 144A of the Securities Act of 1933. These securities may be resold in the ordinary course of business in transactions exempt from registration, normally to qualified institutional buyers. As of April 30, 2021, these securities had a total aggregate market value of $203,270 representing 0.64% of net assets. |
| (c) | Security was purchased pursuant to Regulation S under the Securities Act of 1933, which exempts securities offered and sold outside of the United States from registration. Such security cannot be sold in the United States without either an effective registration statement filed pursuant to the Securities Act of 1933, or pursuant to an exemption from registration. As of April 30, 2021, the aggregate market value of those securities was $203,270, representing 0.64% of net assets. |
| Sector Composition (April 30, 2021) | |
| Consumer | 52.5% |
| Industrials | 15.6% |
| Technology | 13.6% |
| Health Care | 6.3% |
| Energy & Materials | 6.2% |
| Financials | 5.2% |
| Cash, Cash Equivalents, & Other Net Assets | 0.6% |
| Total | 100% |
Industry Composition (April 30, 2021)
| Beverages | 11.5% |
| Textiles, Apparel & Luxury Goods | 9.5% |
| Food Products | 7.8% |
| Personal Products | 6.8% |
| Hotels, Restaurants & Leisure | 6.5% |
| IT Services | 6.0% |
| Professional Services | 4.9% |
| Capital Markets | 4.8% |
| Chemicals | 3.9% |
| Food & Staples Retailing | 3.2% |
| Multiline Retail | 3.0% |
| Machinery | 2.9% |
| Health Care Equipment & Supplies | 2.7% |
| Software | 2.4% |
| Interactive Media & Services | 2.0% |
| Automobiles | 2.0% |
| Semiconductors & Semiconductor Equipment | 1.9% |
| Biotechnology | 1.7% |
| Trading Companies & Distributors | 1.7% |
| Road & Rail | 1.6% |
| Commercial Services & Supplies | 1.5% |
| Household Products | 1.5% |
| Oil, Gas & Consumable Fuels | 1.4% |
| Building Products | 1.3% |
| Air Freight & Logistics | 1.2% |
| Entertainment | 1.0% |
| Pharmaceuticals | 1.0% |
| Other Industries (each less than 1%) | 3.8% |
| Cash and Other Assets, Less Liabilities | 0.5% |
| Total | 100% |
See Notes to Financial Statements.
| 16 | 1.855.775.3337 | www.rondureglobal.com |
| Rondure Funds | Statements of Assets and Liabilities |
| April 30, 2021 |
Rondure New World Fund | Rondure Overseas Fund | |||||||
| ASSETS | ||||||||
| Investments, at value (Cost - see below) | $ | 228,079,809 | $ | 31,681,610 | ||||
| Foreign cash, at value (Cost $9,550 and $4,990, respectively) | 9,550 | 4,946 | ||||||
| Cash | 4,716,342 | 210,357 | ||||||
| Dividends and interest receivable | 298,243 | 81,017 | ||||||
| Receivable for fund shares subscribed | 3,821,256 | 489 | ||||||
| Receivable due from advisor | – | 12,852 | ||||||
| Prepaid and other assets | 20,846 | 19,240 | ||||||
| Total assets | 236,946,046 | 32,010,511 | ||||||
| LIABILITIES | ||||||||
| Payable for investments purchased | 319,409 | 47,868 | ||||||
| Foreign capital gains tax | 848,505 | – | ||||||
| Payable for fund shares redeemed | 75,477 | 24,959 | ||||||
| Advisory fees payable | 101,180 | – | ||||||
| Administration fees payable | 36,204 | 21,261 | ||||||
| Custodian fees payable | 39,362 | 9,058 | ||||||
| Payable for professional fees | 27,426 | 27,687 | ||||||
| Payable for trustee fees and expenses | 4,656 | 618 | ||||||
| Payable for chief compliance officer fee | 2,720 | 361 | ||||||
| Payable for principal financial officer fees | 2,272 | 301 | ||||||
| Distribution and service fees payable - Investor Class | 5,559 | 848 | ||||||
| Payable for transfer agency fees | 43,808 | 8,957 | ||||||
| Accrued expenses and other liabilities | 6,801 | 4,115 | ||||||
| Total liabilities | 1,513,379 | 146,033 | ||||||
| NET ASSETS | $ | 235,432,667 | $ | 31,864,478 | ||||
| NET ASSETS CONSISTS OF | ||||||||
| Paid-in capital (Note 5) | $ | 192,127,480 | $ | 24,945,504 | ||||
| Total distributable earnings | 43,305,187 | 6,918,974 | ||||||
| NET ASSETS | $ | 235,432,667 | $ | 31,864,478 | ||||
| INVESTMENTS, AT COST | $ | 179,872,825 | $ | 24,575,970 | ||||
| PRICING OF SHARES | ||||||||
| Institutional Class | ||||||||
| Net Assets | $ | 209,531,317 | $ | 27,691,857 | ||||
| Net Asset Value, offering and redemption price per share | $ | 13.56 | $ | 14.18 | ||||
| Shares of beneficial interest outstanding | 15,452,332 | 1,952,980 | ||||||
| Investor Class | ||||||||
| Net Assets | $ | 25,901,350 | $ | 4,172,621 | ||||
| Net Asset Value, offering and redemption price per share | $ | 13.51 | $ | 14.16 | ||||
| Shares of beneficial interest outstanding | 1,917,367 | 294,602 | ||||||
See Notes to Financial Statements.
| Annual Report | April 30, 2021 | 17 |
| Rondure Funds | Statements of Operations |
| For the Year Ended April 30, 2021 |
Rondure New World Fund | Rondure Overseas Fund | |||||||
| INVESTMENT INCOME | ||||||||
| Dividends | $ | 3,339,909 | $ | 393,529 | ||||
| Foreign taxes withheld | (393,271 | ) | (43,915 | ) | ||||
| Other Income | 72 | – | ||||||
| Total investment income | 2,946,710 | 349,614 | ||||||
| EXPENSES | ||||||||
| Investment advisor fees (Note 6) | 1,581,752 | 182,515 | ||||||
| Administrative fees | 266,430 | 74,585 | ||||||
| Distribution and service fees - Investor Class | 59,234 | 8,759 | ||||||
| Transfer agent fees | 232,126 | 64,965 | ||||||
| Professional fees | 43,258 | 28,550 | ||||||
| Printing fees | 24,888 | 3,304 | ||||||
| Registration fees | 36,499 | 35,011 | ||||||
| Custodian fees | 220,573 | 44,051 | ||||||
| Trustee fees and expenses | 9,411 | 1,326 | ||||||
| Chief compliance officer fees | 31,889 | 4,472 | ||||||
| Principal financial officer fees | 14,560 | 2,033 | ||||||
| Other expenses | 18,922 | 5,898 | ||||||
| Total expenses | 2,539,542 | 455,469 | ||||||
| Less fees waived/reimbursed by investment advisor (Note 6) | (430,368 | ) | (224,753 | ) | ||||
| Total net expenses | 2,109,174 | 230,716 | ||||||
| NET INVESTMENT INCOME | 837,536 | 118,898 | ||||||
| REALIZED AND UNREALIZED GAIN/(LOSS) ON INVESTMENTS | ||||||||
| Net realized gain on investments | 5,287,705 | 1,758,594 | ||||||
| Net realized gain/(loss) on foreign currency transactions | (72,164 | ) | 2,197 | |||||
| Net realized gain | 5,215,541 | 1,760,791 | ||||||
| Net change in unrealized appreciation on investments (net of change in foreign capital gains tax of $848,505 and $0, respectively) | 47,958,135 | 6,015,131 | ||||||
| Net change in unrealized appreciation/(depreciation) on translation of assets and liabilities in foreign currencies | 1,672 | (2,250 | ) | |||||
| Net change in unrealized appreciation | 47,959,807 | 6,012,881 | ||||||
| NET REALIZED AND UNREALIZED GAIN ON INVESTMENTS AND FOREIGN CURRENCY TRANSACTIONS | 53,175,348 | 7,773,672 | ||||||
| NET INCREASE IN NET ASSETS RESULTING FROM OPERATIONS | $ | 54,012,884 | $ | 7,892,570 | ||||
See Notes to Financial Statements.
| 18 | 1.855.775.3337 | www.rondureglobal.com |
| Rondure New World Fund | Statement of Changes in Net Assets |
For the Year Ended April 30, 2021 | For the Year Ended April 30, 2020 | |||||||
| OPERATIONS | ||||||||
| Net investment income | $ | 837,536 | $ | 1,090,746 | ||||
| Net realized gain/(loss) | 5,215,541 | (1,261,862 | ) | |||||
| Net change in unrealized appreciation/(depreciation) | 47,959,807 | (11,235,316 | ) | |||||
| Net increase/(decrease) in net assets resulting from operations | 54,012,884 | (11,406,432 | ) | |||||
| TOTAL DISTRIBUTIONS TO SHAREHOLDERS (NOTE 3) | ||||||||
| From distributable earnings | ||||||||
| Institutional Class | (724,741 | ) | (1,036,130 | ) | ||||
| Investor Class | (67,304 | ) | (138,384 | ) | ||||
| Net decrease in net assets from distributions | (792,045 | ) | (1,174,514 | ) | ||||
| CAPITAL SHARE TRANSACTIONS (NOTE 5) | ||||||||
| Institutional Class | ||||||||
| Proceeds from sales of shares | 58,214,092 | 33,531,344 | ||||||
| Distributions reinvested | 707,032 | 1,015,211 | ||||||
| Cost of shares redeemed | (14,561,301 | ) | (15,803,966 | ) | ||||
| Redemption fees | 10,421 | 15,734 | ||||||
| Net increase from capital shares transactions | 44,370,244 | 18,758,323 | ||||||
| Investor Class | ||||||||
| Proceeds from sales of shares | 8,807,686 | 6,220,152 | ||||||
| Distributions reinvested | 67,123 | 138,268 | ||||||
| Cost of shares redeemed | (8,100,996 | ) | (6,865,062 | ) | ||||
| Redemption fees | 1,084 | 1,211 | ||||||
| Net increase/(decrease) from capital shares transactions | 774,897 | (505,431 | ) | |||||
| Net increase in net assets | 98,365,980 | 5,671,946 | ||||||
| NET ASSETS | ||||||||
| Beginning of period | 137,066,687 | 131,394,741 | ||||||
| End of period | $ | 235,432,667 | $ | 137,066,687 | ||||
| OTHER INFORMATION | ||||||||
| Shares Transactions | ||||||||
| Institutional Class | ||||||||
| Issued | 4,615,909 | 3,149,600 | ||||||
| Issued to shareholders in reinvestment of distributions | 53,604 | 88,820 | ||||||
| Redeemed | (1,173,436 | ) | (1,543,323 | ) | ||||
| Net increase in share transactions | 3,496,077 | 1,695,097 | ||||||
| Investor Class | ||||||||
| Issued | 687,756 | 579,043 | ||||||
| Issued to shareholders in reinvestment of distributions | 5,104 | 12,118 | ||||||
| Redeemed | (632,251 | ) | (644,762 | ) | ||||
| Net increase/(decrease) in share transactions | 60,609 | (53,601 | ) | |||||
See Notes to Financial Statements.
| Annual Report | April 30, 2021 | 19 |
| Rondure Overseas Fund | Statement of Changes in Net Assets |
For the Year Ended April 30, 2021 | For the Year Ended April 30, 2020 | |||||||
| OPERATIONS | ||||||||
| Net investment income | $ | 118,898 | $ | 185,418 | ||||
| Net realized gain/(loss) | 1,760,791 | (1,238,043 | ) | |||||
| Net change in unrealized appreciation/(depreciation) | 6,012,881 | (141,360 | ) | |||||
| Net increase/(decrease) in net assets resulting from operations | 7,892,570 | (1,193,985 | ) | |||||
| TOTAL DISTRIBUTIONS TO SHAREHOLDERS (NOTE 3) | ||||||||
| From distributable earnings | ||||||||
| Institutional Class | (110,149 | ) | (181,265 | ) | ||||
| Investor Class | (11,833 | ) | (29,412 | ) | ||||
| Net decrease in net assets from distributions | (121,982 | ) | (210,677 | ) | ||||
| CAPITAL SHARE TRANSACTIONS (NOTE 5) | ||||||||
| Institutional Class | ||||||||
| Proceeds from sales of shares | 6,502,316 | 2,445,201 | ||||||
| Distributions reinvested | 108,604 | 175,567 | ||||||
| Cost of shares redeemed | (2,409,017 | ) | (3,488,107 | ) | ||||
| Redemption fees | 8 | 26 | ||||||
| Net increase/(decrease) from capital shares transactions | 4,201,911 | (867,313 | ) | |||||
| Investor Class | ||||||||
| Proceeds from sales of shares | 1,766,564 | 578,474 | ||||||
| Distributions reinvested | 11,832 | 29,251 | ||||||
| Cost of shares redeemed | (1,270,752 | ) | (1,720,062 | ) | ||||
| Redemption fees | 167 | 1,376 | ||||||
| Net increase/(decrease) from capital shares transactions | 507,811 | (1,110,961 | ) | |||||
| Net increase/(decrease) in net assets | 12,480,310 | (3,382,936 | ) | |||||
| NET ASSETS | ||||||||
| Beginning of period | 19,384,168 | 22,767,104 | ||||||
| End of period | $ | 31,864,478 | $ | 19,384,168 | ||||
| OTHER INFORMATION | ||||||||
| Shares Transactions | ||||||||
| Institutional Class | ||||||||
| Issued | 520,727 | 233,288 | ||||||
| Issued to shareholders in reinvestment of distributions | 7,968 | 14,841 | ||||||
| Redeemed | (196,876 | ) | (323,690 | ) | ||||
| Net increase/(decrease) in share transactions | 331,819 | (75,561 | ) | |||||
| Investor Class | ||||||||
| Issued | 140,115 | 54,253 | ||||||
| Issued to shareholders in reinvestment of distributions | 868 | 2,470 | ||||||
| Redeemed | (100,434 | ) | (155,568 | ) | ||||
| Net increase/(decrease) in share transactions | 40,549 | (98,845 | ) | |||||
See Notes to Financial Statements.
| 20 | 1.855.775.3337 | www.rondureglobal.com |
| Rondure New World Fund – Institutional Class | Financial Highlights |
For a Share Outstanding Throughout the Years or Periods Presented
| Institutional Class | Year Ended April 30, 2021 | Year Ended April 30, 2020 | Year Ended April 30, 2019 | For the Period May 2, 2017 (Commencement of Operations) to April 30, 2018 | ||||||||||||
| NET ASSET VALUE, BEGINNING OF PERIOD | $ | 9.93 | $ | 10.80 | $ | 11.25 | $ | 10.00 | ||||||||
| INCOME FROM INVESTMENT OPERATIONS | ||||||||||||||||
| Net investment income(a) | 0.06 | 0.09 | 0.09 | 0.05 | ||||||||||||
| Net realized and unrealized gain/(loss) on investments | 3.62 | (0.87 | ) | (0.45 | ) | 1.23 | ||||||||||
| Total income/(loss) from investment operations | 3.68 | (0.78 | ) | (0.36 | ) | 1.28 | ||||||||||
| DISTRIBUTIONS | ||||||||||||||||
| From net investment income | (0.05 | ) | (0.09 | ) | (0.09 | ) | (0.03 | ) | ||||||||
| From net realized gain on investments | – | – | – | (0.00 | )(b) | |||||||||||
| Total distributions | (0.05 | ) | (0.09 | ) | (0.09 | ) | (0.03 | ) | ||||||||
| REDEMPTION FEES ADDED TO PAID-IN CAPITAL | 0.00 | (b) | 0.00 | (b) | 0.00 | (b) | 0.00 | (b) | ||||||||
| INCREASE/DECREASE IN NET ASSET VALUE | 3.63 | (0.87 | ) | (0.45 | ) | 1.25 | ||||||||||
| NET ASSET VALUE, END OF PERIOD | $ | 13.56 | $ | 9.93 | $ | 10.80 | $ | 11.25 | ||||||||
| TOTAL RETURN | 37.11 | % | (7.31 | )% | (3.09 | )% | 12.78 | %(c) | ||||||||
| RATIOS AND SUPPLEMENTAL DATA | ||||||||||||||||
| Net assets, end of period (in 000s) | $ | 209,531 | $ | 118,685 | $ | 110,800 | $ | 100,760 | ||||||||
| RATIOS TO AVERAGE NET ASSETS | ||||||||||||||||
| Expenses (excluding fees waived/ reimbursed by investment advisor) | 1.32 | % | 1.43 | % | 1.46 | % | 1.62 | %(d) | ||||||||
| Expenses (including fees waived/ reimbursed by investment advisor) | 1.10 | % | 1.10 | % | 1.10 | % | 1.10 | %(d) | ||||||||
| Net investment income | 0.48 | % | 0.83 | % | 0.87 | % | 0.43 | %(d) | ||||||||
| PORTFOLIO TURNOVER RATE | 36 | % | 27 | % | 37 | % | 13 | %(c) | ||||||||
| (a) | Per share numbers have been calculated using the average shares method. |
| (b) | Less than $0.005 or ($0.005) per share. |
| (c) | Not Annualized. |
| (d) | Annualized. |
See Notes to Financial Statements.
| Annual Report | April 30, 2021 | 21 |
| Rondure New World Fund – Investor Class | Financial Highlights |
For a Share Outstanding Throughout the Years or Periods Presented
| Investor Class | Year Ended April 30, 2021 | Year Ended April 30, 2020 | Year Ended April 30, 2019 | For the Period May 2, 2017 (Commencement of Operations) to April 30, 2018 | ||||||||||||
| NET ASSET VALUE, BEGINNING OF PERIOD | $ | 9.90 | $ | 10.78 | $ | 11.24 | $ | 10.00 | ||||||||
| INCOME FROM INVESTMENT OPERATIONS | ||||||||||||||||
| Net investment income(a) | 0.03 | 0.06 | 0.07 | 0.03 | ||||||||||||
| Net realized and unrealized gain/(loss) on investments | 3.61 | (0.87 | ) | (0.46 | ) | 1.22 | ||||||||||
| Total income/(loss) from investment operations | 3.64 | (0.81 | ) | (0.39 | ) | 1.25 | ||||||||||
| DISTRIBUTIONS | ||||||||||||||||
| From net investment income | (0.03 | ) | (0.07 | ) | (0.07 | ) | (0.01 | ) | ||||||||
| From net realized gain on investments | – | – | – | (0.00 | )(b) | |||||||||||
| Total distributions | (0.03 | ) | (0.07 | ) | (0.07 | ) | (0.01 | ) | ||||||||
| REDEMPTION FEES ADDED TO PAID-IN CAPITAL | 0.00 | (b) | 0.00 | (b) | 0.00 | (b) | 0.00 | (b) | ||||||||
| INCREASE/DECREASE IN NET ASSET VALUE | 3.61 | (0.88 | ) | (0.46 | ) | 1.24 | ||||||||||
| NET ASSET VALUE, END OF PERIOD | $ | 13.51 | $ | 9.90 | $ | 10.78 | $ | 11.24 | ||||||||
| TOTAL RETURN | 36.83 | % | (7.56 | )% | (3.37 | )% | 12.53 | %(c) | ||||||||
| RATIOS AND SUPPLEMENTAL DATA | ||||||||||||||||
| Net assets, end of period (in 000s) | $ | 25,901 | $ | 18,382 | $ | 20,595 | $ | 24,233 | ||||||||
| RATIOS TO AVERAGE NET ASSETS | ||||||||||||||||
| Expenses (excluding fees waived/ reimbursed by investment advisor) | 1.63 | % | 1.72 | % | 1.76 | % | 1.91 | %(d) | ||||||||
| Expenses (including fees waived/ reimbursed by investment advisor) | 1.35 | % | 1.35 | % | 1.35 | % | 1.35 | %(d) | ||||||||
| Net investment income | 0.25 | % | 0.59 | % | 0.66 | % | 0.24 | %(d) | ||||||||
| PORTFOLIO TURNOVER RATE | 36 | % | 27 | % | 37 | % | 13 | %(c) | ||||||||
| (a) | Per share numbers have been calculated using the average shares method. |
| (b) | Less than $0.005 or ($0.005) per share. |
| (c) | Not Annualized. |
| (d) | Annualized. |
See Notes to Financial Statements.
| 22 | 1.855.775.3337 | www.rondureglobal.com |
| Rondure Overseas Fund – Institutional Class | Financial Highlights |
For a Share Outstanding Throughout the Years or Periods Presented
| Institutional Class | Year Ended April 30, 2021 | Year Ended April 30, 2020 | Year Ended April 30, 2019 | For the Period (Commencement of Operations) to | ||||||||||||
| NET ASSET VALUE, BEGINNING OF PERIOD | $ | 10.34 | $ | 11.11 | $ | 11.46 | $ | 10.00 | ||||||||
| INCOME FROM INVESTMENT OPERATIONS | ||||||||||||||||
| Net investment income(a) | 0.06 | 0.10 | 0.10 | 0.10 | ||||||||||||
| Net realized and unrealized gain/(loss) on investments | 3.84 | (0.76 | ) | (0.31 | ) | 1.48 | ||||||||||
| Total income/(loss) from investment operations | 3.90 | (0.66 | ) | (0.21 | ) | 1.58 | ||||||||||
| DISTRIBUTIONS | ||||||||||||||||
| From net investment income | (0.06 | ) | (0.11 | ) | (0.11 | ) | (0.04 | ) | ||||||||
| From net realized gain on investments | – | – | (0.03 | ) | (0.08 | ) | ||||||||||
| Total distributions | (0.06 | ) | (0.11 | ) | (0.14 | ) | (0.12 | ) | ||||||||
| REDEMPTION FEES ADDED TO PAID-IN CAPITAL | 0.00 | (b) | 0.00 | (b) | 0.00 | (b) | 0.00 | (b) | ||||||||
| INCREASE/DECREASE IN NET ASSET VALUE | 3.84 | (0.77 | ) | (0.35 | ) | 1.46 | ||||||||||
| NET ASSET VALUE, END OF PERIOD | $ | 14.18 | $ | 10.34 | $ | 11.11 | $ | 11.46 | ||||||||
| TOTAL RETURN | 37.71 | % | (6.06 | )% | (1.76 | )% | 15.88 | %(c) | ||||||||
| RATIOS AND SUPPLEMENTAL DATA | ||||||||||||||||
| Net assets, end of period (in 000s) | $ | 27,692 | $ | 16,758 | $ | 18,845 | $ | 14,283 | ||||||||
| RATIOS TO AVERAGE NET ASSETS | ||||||||||||||||
| Expenses (excluding fees waived/ reimbursed by investment advisor) | 1.70 | % | 1.73 | % | 1.72 | % | 2.57 | %(d) | ||||||||
| Expenses (including fees waived/ reimbursed by investment advisor) | 0.85 | % | 0.85 | % | 0.85 | % | 0.85 | %(d) | ||||||||
| Net investment income | 0.49 | % | 0.89 | % | 0.95 | % | 0.92 | %(d) | ||||||||
| PORTFOLIO TURNOVER RATE | 51 | % | 66 | % | 40 | % | 14 | %(c) | ||||||||
| (a) | Per share numbers have been calculated using the average shares method. |
| (b) | Less than $0.005 or ($0.005) per share. |
| (c) | Not Annualized. |
| (d) | Annualized. |
See Notes to Financial Statements.
| Annual Report | April 30, 2021 | 23 |
| Rondure Overseas Fund – Investor Class | Financial Highlights |
For a Share Outstanding Throughout the Years or Periods Presented
| Investor Class | Year Ended April 30, 2021 | Year Ended April 30, 2020 | Year Ended April 30, 2019 | For the Period (Commencement of Operations) to | ||||||||||||
| NET ASSET VALUE, BEGINNING OF PERIOD | $ | 10.34 | $ | 11.12 | $ | 11.48 | $ | 10.00 | ||||||||
| INCOME FROM INVESTMENT OPERATIONS | ||||||||||||||||
| Net investment income(a) | 0.03 | 0.07 | 0.08 | 0.09 | ||||||||||||
| Net realized and unrealized gain/(loss) on investments | 3.83 | (0.76 | ) | (0.32 | ) | 1.46 | ||||||||||
| Total income/(loss) from investment operations | 3.86 | (0.69 | ) | (0.24 | ) | 1.55 | ||||||||||
| DISTRIBUTIONS | ||||||||||||||||
| From net investment income | (0.04 | ) | (0.09 | ) | (0.09 | ) | – | |||||||||
| From net realized gain on investments | – | – | (0.03 | ) | (0.08 | ) | ||||||||||
| Total distributions | (0.04 | ) | (0.09 | ) | (0.12 | ) | (0.08 | ) | ||||||||
| REDEMPTION FEES ADDED TO PAID-IN CAPITAL | 0.00 | (b) | 0.00 | (b) | 0.00 | (b) | 0.01 | |||||||||
| INCREASE/DECREASE IN NET ASSET VALUE | 3.82 | (0.78 | ) | (0.36 | ) | 1.48 | ||||||||||
| NET ASSET VALUE, END OF PERIOD | $ | 14.16 | $ | 10.34 | $ | 11.12 | $ | 11.48 | ||||||||
| TOTAL RETURN | 37.34 | % | (6.28 | )% | (1.98 | )% | 15.63 | %(c) | ||||||||
| RATIOS AND SUPPLEMENTAL DATA | ||||||||||||||||
| Net assets, end of period (in 000s) | $ | 4,173 | $ | 2,626 | $ | 3,922 | $ | 5,189 | ||||||||
| RATIOS TO AVERAGE NET ASSETS | ||||||||||||||||
| Expenses (excluding fees waived/ reimbursed by investment advisor) | 2.01 | % | 2.06 | % | 2.04 | % | 2.45 | %(d) | ||||||||
| Expenses (including fees waived/ reimbursed by investment advisor) | 1.10 | % | 1.10 | % | 1.10 | % | 1.10 | %(d) | ||||||||
| Net investment income | 0.23 | % | 0.61 | % | 0.74 | % | 0.82 | %(d) | ||||||||
| PORTFOLIO TURNOVER RATE | 51 | % | 66 | % | 40 | % | 14 | %(c) | ||||||||
| (a) | Per share numbers have been calculated using the average shares method. |
| (b) | Less than $0.005 or ($0.005) per share. |
| (c) | Not Annualized. |
| (d) | Annualized. |
See Notes to Financial Statements.
| 24 | 1.855.775.3337 | www.rondureglobal.com |
| Rondure Funds | Notes to Financial Statements |
April 30, 2021
1. ORGANIZATION
Financial Investors Trust (the “Trust”), a Delaware statutory trust, is an open-end management investment company registered under the Investment Company Act of 1940, as amended (“1940 Act”). As of April 30, 2021, the Trust consists of multiple separate Portfolios or series. This annual report describes the Rondure New World Fund and the Rondure Overseas Fund (individually a “Fund” and collectively, the “Funds”). The Funds seek long-term growth of capital. The Funds offer Investor Class and Institutional Class shares.
2. SIGNIFICANT ACCOUNTING POLICIES
The accompanying financial statements were prepared in accordance with accounting principles generally accepted in the United States of America (“U.S. GAAP”). The preparation of financial statements in conformity with U.S. GAAP requires management to make certain estimates and assumptions that affect the reported amounts of assets and liabilities and disclosures of contingent assets and liabilities at the date of the financial statements and the reported amounts of revenue and expenses during the period. Actual results could differ from those estimates. The Funds are considered an investment company for financial reporting purposes under U.S. GAAP and follows the accounting and reporting guidance applicable to investment companies in the Financial Accounting Standards Board Accounting Standards Codification Topic 946. The following is a summary of significant accounting policies consistently followed by the Funds in preparation of its financial statements.
Investment Valuation: The Funds generally value their securities based on market prices determined at the close of regular trading on the New York Stock Exchange (“NYSE”), normally 4:00 p.m. Eastern Time, on each day the NYSE is open for trading.
For equity securities and mutual funds that are traded on an exchange, the market price is usually the closing sale or official closing price on that exchange. In the case of equity securities not traded on an exchange, or if such closing prices are not otherwise available, the securities are valued at the mean of the most recent bid and ask prices on such day. Redeemable securities issued by open-end registered investment companies are valued at the investment company’s applicable net asset value, with the exception of exchange-traded open-end investment companies, which are priced as equity securities.
Equity securities that are primarily traded on foreign securities exchanges are valued at the closing values of such securities on their respective foreign exchanges, except when an event occurs subsequent to the close of the foreign exchange and the close of the NYSE that was likely to have changed such value. In such an event, the fair value of those securities are determined in good faith through consideration of other factors in accordance with procedures established by and under the general supervision of the Board of Trustees of the Trust (the “Board” or the “Trustees”). The Funds will use a fair valuation model provided by an independent pricing service, which is intended to reflect fair value when a security’s value or a meaningful portion of each Fund’s portfolio is believed to have been materially affected by a valuation event that has occurred between the close of the exchange or market on which the security is traded and the close of the regular trading day on the NYSE. The Funds’ valuation procedures set forth certain triggers which instruct when to use the fair valuation model.
The Funds may invest in warrants to participate in an anticipated increase in the market value of the security. A warrant entitles the holder to buy a security at a set price during a set period of time. If such market value increases, the warrant may be exercised and sold at a gain. A loss will be incurred if the market value decreases or if the term of the warrant expires before it is exercised. Warrants convey no rights to dividends or voting. An implied pricing method is used to value the rights.
When such prices or quotations are not available, or when Rondure Global Advisors, LLC (the “Advisor” or “Rondure”) believes that they are unreliable, securities may be priced using fair value procedures approved by the Board.
Fair Value Measurements: The Funds disclose the classification of their fair value measurements following a three-tier hierarchy based on the inputs used to measure fair value. Inputs refer broadly to the assumptions that market participants would use in pricing the asset or liability, including assumptions about risk. Inputs may be observable or unobservable. Observable inputs reflect the assumptions market participants would use in pricing the asset or liability that are developed based on market data obtained from sources independent of the reporting entity. Unobservable inputs reflect the reporting entity’s own assumptions about the assumptions market participants would use in pricing the asset or liability that are developed based on the best information available.
| Annual Report | April 30, 2021 | 25 |
| Rondure Funds | Notes to Financial Statements |
April 30, 2021
Various inputs are used in determining the value of the Funds’ investments as of the end of the reporting period. When inputs used fall into different levels of the fair value hierarchy, the level in the hierarchy within which the fair value measurement falls is determined based on the lowest level input that is significant to the fair value measurement in its entirety. The designated input levels are not necessarily an indication of the risk or liquidity associated with these investments. These inputs are categorized in the following hierarchy under applicable financial accounting standards:
Level 1 – Unadjusted quoted prices in active markets for identical investments, unrestricted assets or liabilities that the Funds have the ability to access at the measurement date;
Level 2 – Quoted prices which are not active, quoted prices for similar assets or liabilities in active markets or inputs other than quoted prices that are observable (either directly or indirectly) for substantially the full term of the asset or liability; and
Level 3 – Significant unobservable prices or inputs (including the Funds’ own assumptions in determining the fair value of investments) where there is little or no market activity for the asset or liability at the measurement date.
The following is a summary of each Fund’s investments in the fair value hierarchy as of April 30, 2021:
| Investments in Securities at Value | Level 1 - Quoted and Unadjusted Prices | Level 2 - Other Significant Observable Inputs | Level 3 - Significant Unobservable Inputs | Total | ||||||||||||
| Rondure New World Fund | ||||||||||||||||
| Common Stocks* | $ | 228,079,809 | $ | – | $ | – | $ | 228,079,809 | ||||||||
| Total | $ | 228,079,809 | $ | – | $ | – | $ | 228,079,809 | ||||||||
| Investments in Securities at Value | Level 1 - Quoted and Unadjusted Prices | Level 2 - Other Significant Observable Inputs | Level 3 - Significant Unobservable Inputs | Total | ||||||||||||
| Rondure Overseas Fund | ||||||||||||||||
| Common Stocks* | $ | 31,657,932 | $ | – | $ | – | $ | 31,657,932 | ||||||||
| Rights and Warrants* | 23,678 | – | �� | 23,678 | ||||||||||||
| Total | $ | 31,681,610 | $ | – | $ | – | $ | 31,681,610 | ||||||||
| * | For a detailed country breakdown, see the accompanying Portfolio of Investments. |
For the year ended April 30, 2021, the Funds did not have any securities that used significant unobservable inputs (Level 3) in determining fair value.
Investment Transactions and Investment Income: Investment transactions are accounted for on the date the investments are purchased or sold (trade date). Realized gains and losses from investment transactions are reported on an identified cost which is the same basis the Fund uses for federal income tax purposes. Interest income, which includes accretion of discounts and amortization of premiums, is accrued and recorded as earned. Dividend income is recognized on the ex-dividend date or for certain foreign securities, as soon as information is available to the Funds. All of the realized and unrealized gains and losses and net investment income, are allocated daily to each class in proportion to its average daily net assets.
Cash Management Transactions: The Funds subscribe to the Brown Brothers Harriman & Co. (“BBH”) Cash Management Service (“CMS”), whereby cash balances are automatically swept into overnight offshore demand deposits with either the BBH Grand Cayman branch or a branch of a pre-approved commercial bank. This fully automated program allows the Funds to earn interest on cash balances. Excess cash with deposit institutions domiciled outside of the U.S. are subject to sovereign actions in the jurisdiction of the deposit institution including, but not limited to, freeze, seizure or diminution. Cash balances in the BBH CMS are included on the Statements of Assets and Liabilities under Cash and Foreign Cash, at Value. As of April 30, 2021, the Funds had the following cash balances participating in the BBH CMS:
| Fund | ||||
| Rondure New World Fund | $ | 4,716,342 | ||
| Rondure Overseas Fund | 210,357 | |||
| 26 | 1.855.775.3337 | www.rondureglobal.com |
| Rondure Funds | Notes to Financial Statements |
April 30, 2021
As of April 30, 2021, the Funds had the following foreign cash balances participating in the BBH CMS (cost and value of foreign cash balances are equal):
| Fund | ||||
| Rondure New World Fund | $ | 2 | ||
| Rondure Overseas Fund | 4,279 | |||
Foreign Securities: The Funds may directly purchase securities of foreign issuers. Investing in securities of foreign issuers involves special risks not typically associated with investing in securities of U.S. issuers. The risks include possible reevaluation of currencies, the inability to repatriate foreign currency, less complete financial information about companies and possible future adverse political and economic developments. Moreover, securities of many foreign issuers and their markets may be less liquid and their prices more volatile than those of securities of comparable U.S. issuers.
Foreign Currency Translation: The books and records of the Funds are maintained in U.S. dollars. Investment valuations and other assets and liabilities initially expressed in foreign currencies are converted each business day into U.S. dollars based upon current exchange rates. Prevailing foreign exchange rates may generally be obtained at the close of the NYSE (normally, 4:00 p.m. Eastern Time). The portion of realized and unrealized gains or losses on investments due to fluctuations in foreign currency exchange rates are separately disclosed.
Foreign Currency Spot Contracts: The Funds may enter into foreign currency spot contracts to facilitate transactions in foreign securities or to convert foreign currency receipts into U.S. dollars. A foreign currency spot contract is an agreement between two parties to buy and sell currencies at the current market rate, for settlement generally within two business days. The U.S. dollar value of the contracts is determined using current currency exchange rates supplied by a pricing service.
The contract is marked-to-market daily for settlements beyond one day and any change in market value is recorded as an unrealized gain or loss. When the contract is closed, a realized gain or loss is recorded equal to the difference between the value on the open and close date. Losses may arise from changes in the value of the foreign currency, or if the counterparties do not perform under the contract’s terms. The maximum potential loss from such contracts is the aggregate face value in U.S. dollars at the time the contract was opened.
Trust Expenses: Some expenses of the Trust can be directly attributed to the Funds. Expenses which cannot be directly attributed to the Funds are apportioned among all funds in the Trust based on average net assets of each fund.
Fund and Class Expenses: Expenses that are specific to a Fund or class of shares of a Fund, including distribution fees (Rule 12b-1 fees), are charged directly to that Fund or share class. Expenses that are common to all Funds generally are allocated among the Funds in proportion to their average daily net assets.
Federal Income Taxes: The Funds comply with the requirements under Subchapter M of the Internal Revenue Code of 1986, as amended, applicable to regulated investment companies and intend to distribute substantially all of their net taxable income and net capital gains, if any, each year so that it will not be subject to excise tax on undistributed income and gains. The Funds are not subject to income taxes to the extent such distributions are made.
Distributions to Shareholders: Each Fund normally pays dividends and distributes capital gains, if any, on an annual basis. Income dividend distributions are derived from dividends and other income each Fund receives from their investments, including short term capital gains. Long term capital gain distributions are derived from gains realized when each Fund sells a security it has owned for more than a year. Each Fund may make additional distributions and dividends at other times if the portfolio manager believes doing so may be necessary for each Fund to avoid or reduce taxes. The Funds intend to pass through foreign tax credits to shareholders.
Epidemic and Pandemic Risk: Certain countries have been susceptible to epidemics, most recently COVID-19, which has been designated as a pandemic by world health authorities. The outbreak of such epidemics, together with any resulting restrictions on travel or quarantines imposed, could have a negative impact on the economy and business activity globally (including in the countries in which we invest), and thereby could adversely affect the performance of our investments. Furthermore, the rapid development of epidemics could preclude prediction as to their ultimate adverse impact on economic and market conditions, and, as a result, present material uncertainty and risk with respect to us and the performance of our investments.
| Annual Report | April 30, 2021 | 27 |
| Rondure Funds | Notes to Financial Statements |
April 30, 2021
Libor Risk: In March 2020, the Financial Accounting Standards Board (FASB) issued Accounting Standards Update (“ASU”) No. 2020-04, Reference Rate Reform (Topic 848): Facilitation of the Effects of Reference Rate Reform on Financial Reporting. The Funds' investments, payment obligations, and financing terms may be based on floating rates, such as the London Interbank Offered Rate, or “LIBOR,” which is the offered rate for short-term Eurodollar deposits between major international banks. Plans are underway to phase out the use of LIBOR by the end of 2021. There remains uncertainty regarding the nature of any replacement rate and the impact of the transition from LIBOR on the Funds' transactions and the financial markets generally. As such, the potential effect of a transition away from LIBOR on the Funds or the Funds' investments cannot yet be determined.
3. TAX BASIS INFORMATION
Tax Basis of Investments: As of April 30, 2021, the aggregate cost of investments, gross unrealized appreciation/(depreciation) and net unrealized appreciation/(depreciation) for Federal tax purposes was as follows:
| Fund | Gross Appreciation (excess of value over tax cost) | Gross Depreciation (excess of tax cost over value) | Net Appreciation/ (Depreciation) of Foreign Currency | Net Unrealized Appreciation | Cost of Investments for Income Tax Purposes | |||||||||||||||
| Rondure New World Fund | $ | 53,667,588 | $ | (5,622,689 | ) | $ | (847,910 | ) | $ | 47,196,989 | $ | 180,034,910 | ||||||||
| Rondure Overseas Fund | 7,246,198 | (212,215 | ) | 1,434 | 7,035,417 | 24,647,627 | ||||||||||||||
Components of Earnings: As of April 30, 2021, components of distributable earnings on a tax basis were as follows:
Rondure New World Fund | Rondure Overseas Fund | |||||||
| Undistributed ordinary income | $ | – | $ | 68,223 | ||||
| Accumulated capital losses | (3,888,108 | ) | (184,853 | ) | ||||
| Net unrealized appreciation on investments | 47,196,989 | 7,035,417 | ||||||
| Other cumulative effect of timing differences | (3,694 | ) | 187 | |||||
| Total distributable earnings | $ | 43,305,187 | $ | 6,918,974 | ||||
The following Funds elect to defer to the period ending April 30, 2022, late year ordinary losses in the amount of:
| Fund | Ordinary Losses Recognized | |||
| Rondure New World Fund Fund | $ | 3,694 | ||
The Rondure New World Fund used capital loss carryovers during the period ending April 30, 2021 in the amount of $4,081,543
The Rondure Overseas Fund used capital loss carryovers during the period ending April 30, 2021 in the amount of $942,432
Under current law, capital losses maintain their character as short-term or long-term and are carried forward to the next tax year without expiration. As of the current fiscal year end, the following amounts are available as carry forwards to the next tax year:
| Fund | Short-Term | Long-Term | ||||||
| Rondure New World Fund | $ | 3,822,452 | $ | 65,656 | ||||
| Rondure Overseas Fund | 184,853 | – | ||||||
Tax Basis of Distributions to Shareholders: The character of distributions made during the year from net investment income or net realized gains may differ from its ultimate characterization for federal income tax purposes. Also, due to the timing of dividend distributions, the fiscal year in which amounts are distributed may differ from the fiscal year in which the income or realized gain were recorded by the Funds.
| 28 | 1.855.775.3337 | www.rondureglobal.com |
| Rondure Funds | Notes to Financial Statements |
April 30, 2021
The tax characters of distributions paid by the Funds for the year ended April 30, 2021 were as follows:
| Fund | Ordinary Income | Long-Term Capital Gain | ||||||
| Rondure New World Fund | $ | 792,045 | $ | – | ||||
| Rondure Overseas Fund | 121,982 | – | ||||||
The tax characters of distributions paid by the Funds for the year ended April 30, 2020 were as follows:
| Fund | Ordinary Income | Long-Term Capital Gain | ||||||
| Rondure New World Fund | $ | 1,174,514 | $ | – | ||||
| Rondure Overseas Fund | 210,677 | – | ||||||
4. SECURITIES TRANSACTIONS
The cost of purchases and proceeds from sales of securities (excluding short term securities) during the year ended April 30, 2021 were as follows:
| Fund | Purchases of Securities | Proceeds From Sales of Securities | ||||||
| Rondure New World Fund | $ | 102,572,417 | $ | 65,641,711 | ||||
| Rondure Overseas Fund | 17,934,478 | 13,239,173 | ||||||
5. SHARES OF BENEFICIAL INTEREST
The capitalization of the Trust consists of an unlimited number of shares of beneficial interest with no par value per share. Holders of the shares of the Funds of the Trust have one vote for each share held and a proportionate fraction of a vote for each fractional share. All shares issued and outstanding are fully paid and are transferable and redeemable at the option of the shareholder. Purchasers of the share do not have any obligation to make payments to the Trust or its creditors solely by reason of the purchasers’ ownership of the shares. Shares have no pre-emptive rights.
Shares redeemed within 60 days of purchase may incur a 2% short-term redemption fee deducted from the redemption amount. For the year ended April 30, 2021, the redemption fees charged by the Funds are presented in the Statement of Changes in Net Assets.
6. MANAGEMENT AND RELATED-PARTY TRANSACTIONS
The Advisor, subject to the authority of the Board, is responsible for the overall management and administration of the Funds’ business affairs. The Advisor manages the investments of the Funds in accordance with the Funds’ investment objective, policies and limitations and investment guidelines established jointly by the Advisor and the Trustees. Pursuant to the Advisory Agreement, (the “Advisory Agreement”), each Fund pays the Advisor an annual management fee based on each Fund’s average daily net assets. The management fee is paid on a monthly basis. The following table reflects the Funds’ advisory fee rates.
| Fund | Advisory Fee |
| Rondure New World Fund | 0.85% |
| Rondure Overseas Fund | 0.70% |
| Annual Report | April 30, 2021 | 29 |
| Rondure Funds | Notes to Financial Statements |
April 30, 2021
The Advisor has contractually agreed to limit certain of each Fund’s expenses (excluding acquired fund fees and expenses, brokerage expenses, interest expense, taxes and extraordinary expenses). The following table reflects the Funds’ expense cap.
| Fund | Expense Cap | Term of Expense Limit Agreements |
| Rondure New World Fund | September 1, 2020-August 31, 2021/September 1, 2019-August 31, 2020 | |
| Institutional Class | 1.10% | |
| Investor Class | 1.35% | |
| Rondure Overseas Fund | September 1, 2020-August 31, 2021/September 1, 2019-August 31, 2020 | |
| Institutional Class | 0.85% | |
| Investor Class | 1.10% |
Pursuant to these agreements, the Advisor may seek reimbursement from a Fund for any previous fee waivers and expense reimbursements made by the Advisor, provided that any such reimbursements made by the Funds to the Advisor will not cause the Funds’ expense limitation to exceed expense limitations in existence at the time the expense was incurred, or at the time of the reimbursement, whichever is lower, and the reimbursement is made within three years after the expenses were incurred. Fees waived/reimbursed by Advisor for the year ended April 30, 2021 are disclosed in the Statements of Operations.
For the year ended April 30, 2021, the fee waivers/reimbursements and/or recoupments were as follows:
| Fund | Fees Waived/Reimbursed By Adviser | |||
| Rondure New World Fund | ||||
| Institutional Class | $ | 364,149 | ||
| Investor Class | 66,219 | |||
| Rondure Overseas Fund | ||||
| Institutional Class | $ | 192,733 | ||
| Investor Class | 32,020 | |||
| Fund | Expires 2022 | Expires 2023 | Expires 2024 | Total | ||||||||||||
| Rondure New World Fund | ||||||||||||||||
| Institutional Class | $ | 357,945 | $ | 385,786 | $ | 364,149 | $ | 1,107,880 | ||||||||
| Investor Class | 90,396 | 73,814 | 66,219 | 230,429 | ||||||||||||
| Rondure Overseas Fund | ||||||||||||||||
| Institutional Class | $ | 165,269 | $ | 162,555 | $ | 192,733 | $ | 520,557 | ||||||||
| Investor Class | 42,849 | 33,740 | 32,020 | 108,609 | ||||||||||||
Administrator Fees and Expenses
ALPS Fund Services, Inc. (“ALPS”) serves as administrator to the Funds and the Funds have agreed to pay expenses incurred in connection with their administrative activities. Pursuant to an Administration Agreement, ALPS provides operational services to the Funds including, but not limited to, fund accounting and fund administration and generally assists in the Funds’ operations. Officers of the Trust are employees of ALPS. The Funds’ administration fee is accrued on a daily basis and paid monthly. Administration fees paid by the Funds for the year ended April 30, 2021 are disclosed in the Statements of Operations.
ALPS is reimbursed by the Funds for certain out-of-pocket expenses.
Transfer Agent
ALPS serves as transfer, dividend paying and shareholder servicing agent for the Funds. ALPS receives an annual minimum fee, a fee based upon the number of shareholder accounts, and is also reimbursed by the Funds for certain out-of-pocket expenses. Transfer agent fees paid by the Funds for the year ended April 30, 2021 are disclosed in the Statements of Operations.
| 30 | 1.855.775.3337 | www.rondureglobal.com |
| Rondure Funds | Notes to Financial Statements |
April 30, 2021
Compliance Services
ALPS provides services that assist the Trust’s chief compliance officer in monitoring and testing the policies and procedures of the Trust in conjunction with requirements under Rule 38a-1 under the 1940 Act and receives an annual base fee. ALPS is reimbursed for certain out-of-pocket expenses by the Funds. Compliance service fees paid by the Funds for the year ended April 30, 2021 are disclosed in the Statements of Operations.
Principal Financial Officer
ALPS receives an annual fee for providing principal financial officer services to the Funds. Principal financial officer fees paid by the Fund for the year ended April 30, 2021 are disclosed in the Statements of Operations.
Distributor
ALPS Distributors, Inc. (“ADI” or the “Distributor”) (an affiliate of ALPS) acts as the distributor of the Funds’ shares pursuant to a Distribution Agreement with the Trust. Shares are sold on a continuous basis by ADI as agent for the Funds, and ADI has agreed to use its best efforts to solicit orders for the sale of each Fund’s shares, although it is not obliged to sell any particular amount of shares. ADI is not entitled to any compensation for its services as Distributor. ADI is registered as a broker-dealer with the U.S. Securities and Exchange Commission.
Each Fund has adopted a Distribution and Services (Rule 12b-1) Plan pursuant to Rule 12b-1 of the 1940 Act (the “Plan”) for its Investor Class shares. The Plan allows the Funds to use Investor Class assets to pay fees in connection with the distribution and marketing of Investor Class shares and/or the provision of shareholder services to Investor Class shareholders. The Plan permits payment for services in connection with the administration of plans or programs that use Investor Class shares of each Fund as their funding medium and for related expenses. The recipients of such payments may include the Distributor, other affiliates of the Advisor, broker-dealers, financial institutions, plan sponsors and administrators and other financial intermediaries through which investors may purchase shares of the Fund. The Plan permits the Funds to make total payments at an annual rate of up to 0.25% of each Fund’s average daily net assets attributable to its Investor Class shares. The expenses of the Plan are reflected as distribution and service fees in the Statements of Operations.
Trustees
The fees and expenses of the Trustees of the Board are presented in the Statements of Operations.
7. INDEMNIFICATIONS
Under the Trust’s organizational documents, its officers and Trustees are indemnified against certain liability arising out of the performance of their duties to the Trust. Additionally, in the normal course of business, the Trust enters into contracts with service providers that may contain general indemnification clauses, which may permit indemnification to the extent permissible under applicable law. The Trust’s maximum exposure under these arrangements is unknown, as this would involve future claims that may be made against the Trust that have not yet occurred.
| Annual Report | April 30, 2021 | 31 |
| Rondure Funds | Report of Independent Registered Public Accounting Firm |
To the shareholders and the Board of Trustees of Financial Investors Trust
Opinion on the Financial Statements and Financial Highlights
We have audited the accompanying statements of assets and liabilities of Rondure New World Fund and Rondure Overseas Fund (the "Funds"), two of the funds constituting the Financial Investors Trust, including the portfolio of investments, as of April 30, 2021, the related statements of operations for the year then ended, the statements of changes in net assets for each of the two years in the period then ended, the financial highlights for each of the three years in the period then ended and for the period May 2, 2017 (commencement of operations) to April 30, 2018, and the related notes. In our opinion, the financial statements and financial highlights present fairly, in all material respects, the financial position of Rondure New World Fund and Rondure Overseas Fund of Financial Investors Trust as of April 30, 2021, and the results of their operations for the year then ended, the changes in their net assets for each of the two years in the period then ended, and the financial highlights for each of the three years in the period then ended and for the period May 2, 2017 (commencement of operations) to April 30, 2018, in conformity with accounting principles generally accepted in the United States of America.
Basis for Opinion
These financial statements and financial highlights are the responsibility of the Funds’ management. Our responsibility is to express an opinion on the Funds’ financial statements and financial highlights based on our audits. We are a public accounting firm registered with the Public Company Accounting Oversight Board (United States) (PCAOB) and are required to be independent with respect to the Funds in accordance with the U.S. federal securities laws and the applicable rules and regulations of the Securities and Exchange Commission and the PCAOB.
We conducted our audits in accordance with the standards of the PCAOB. Those standards require that we plan and perform the audit to obtain reasonable assurance about whether the financial statements and financial highlights are free of material misstatement, whether due to error or fraud. The Funds are not required to have, nor were we engaged to perform, an audit of their internal control over financial reporting. As part of our audits we are required to obtain an understanding of internal control over financial reporting but not for the purpose of expressing an opinion on the effectiveness of the Funds’ internal control over financial reporting. Accordingly, we express no such opinion.
Our audits included performing procedures to assess the risks of material misstatement of the financial statements and financial highlights, whether due to error or fraud, and performing procedures that respond to those risks. Such procedures included examining, on a test basis, evidence regarding the amounts and disclosures in the financial statements and financial highlights. Our audits also included evaluating the accounting principles used and significant estimates made by management, as well as evaluating the overall presentation of the financial statements and financial highlights. Our procedures included confirmation of securities owned as of April 30, 2021, by correspondence with the custodian and brokers; when replies were not received from brokers, we performed other auditing procedures. We believe that our audits provide a reasonable basis for our opinion.
DELOITTE & TOUCHE LLP
Denver, Colorado
June 28, 2021
We have served as the auditor of one or more investment companies advised by Rondure Global Advisors, LLC since 2018.
| 32 | 1.855.775.3337 | www.rondureglobal.com |
| Rondure Funds | Additional Information |
| April 30, 2021 (Unaudited) |
1. FUND HOLDINGS
The Funds file their complete schedule of portfolio holdings with the Securities and Exchange Commission for the first and third quarters of each fiscal year as an exhibit to its reports on Form N-PORT. The Funds’ Form N-PORT reports are available on the Commission’s Web site at http://www.sec.gov. The Funds’ Form N-PORT reports are also available upon request by calling toll-free (855) 775-3337.
2. FUND PROXY VOTING POLICIES, PROCEDURES AND SUMMARIES
The Funds’ policies and procedures used in determining how to vote proxies and information regarding how the Funds voted proxies relating to portfolio securities during the most recent prior 12-month period ending June 30 are available without charge, (1) upon request, by calling (toll-free) 1-855-775-3337 and (2) on the SEC’s website at http://www.sec.gov.
3. TAX DESIGNATIONS
The Funds designate the following amounts for federal income tax purposes for the fiscal year ended April 30, 2021:
Foreign Taxes Paid | Foreign Source Income | |||||||
| Rondure Overseas Fund | $ | 44,605 | $ | 382,797 | ||||
| Rondure New World Fund | $ | 316,895 | $ | 3,022,549 | ||||
Of the distributions paid by the Funds from ordinary income for the calendar year ended December 31, 2020, the following percentages met the requirements to be treated as qualifying for the corporate dividends received deduction and qualified dividend income:
| Dividend Received Deduction | Qualified Dividend Income | |
| Rondure Overseas Fund | 7.69% | 100.00% |
| Rondure New World Fund | 9.38% | 100.00% |
In early 2021, if applicable, shareholders of record received this information for the distributions paid to them by the Funds during the calendar year 2020 via Form 1099. The Funds will notify shareholders in early 2022 of amounts paid to them by the Funds, if any, during the calendar year 2021.
| Annual Report | April 30, 2021 | 33 |
| Rondure Funds | Liquidity Risk Management Program |
| April 30, 2021 (Unaudited) |
The Financial Investors Trust (the “Trust”) has established a liquidity risk management program (the “Program”) to govern the Trust’s approach to managing liquidity risk for each fund in the Trust (each a “Fund”). The Program is overseen by the Liquidity Committee (the “Committee”), a committee comprised of representatives of the Trust’s investment advisers, sub-advisers, and Officers of the Trust. The Trust’s Board of Trustees (the “Board”) has approved the designation of the Committee to oversee the Program.
The Program’s principal objectives include supporting each Fund’s compliance with limits on investments in illiquid assets and mitigating the risk that a Fund will be unable to meet its redemption obligations in a timely manner. The Program also includes a number of elements that support the management and assessment of liquidity risk, including a periodic assessment of factors that influence a Fund’s liquidity and the periodic classification and re-classification of the Fund’s investments into groupings that reflect the Committee’s assessment of their relative liquidity under current market conditions.
At a meeting of the Board held on March 10, 2021, the Trustees received a report from the Committee regarding the design and operational effectiveness of the Program during 2020. The Committee determined, and reported to the Board, that the Program is reasonably designed to assess and manage each Fund’s liquidity risk and has operated adequately and effectively to manage each Fund’s liquidity risk since implementation.
The Committee reported that during the period covered by the report, there were no liquidity events that impacted the Funds or their ability to timely meet redemptions without dilution to existing shareholders. Among other things, the Board noted that the Funds are not required to have a highly liquid investment minimum based on their liquidity classifications. The Board further noted that no material changes have been made to the Program since its implementation.
| 34 | 1.855.775.3337 | www.rondureglobal.com |
| Rondure Funds | Trustees and Officers |
| April 30, 2021 (Unaudited) |
Additional information regarding the Fund’s trustees is included in the Statement of Additional Information, which can be obtained without charge by calling 855-775-3337.
INDEPENDENT TRUSTEES
| Name, Address* & Year of Birth | Position(s) Held with Fund | Term of Office** and Length of Time Served | Principal Occupation(s) During Past 5 Years*** | Number of Funds in Fund Complex Overseen by Trustee**** | Other Directorships Held by Trustee During Past 5 Years*** |
| Mary K. Anstine, 1940 | Trustee and Chairman | Ms. Anstine was elected at a special meeting of shareholders held on March 21, 1997 and re-elected at a special meeting of shareholders held on August 7, 2009. Ms. Anstine was appointed Chairman of the Board at the June 6, 2017 meeting of the Board of Trustees. | Ms. Anstine is Trustee/Director of AV Hunter Trust and Colorado Uplift Board. | 31 | Ms. Anstine is a Trustee of ALPS ETF Trust (17 funds); ALPS Variable Investment Trust (7 funds); Reaves Utility Income Fund (1 fund); and Segall Bryant & Hamill Trust through December 2020 (as of December 31, 2020 14 funds). |
| Jeremy W. Deems, 1976 | Trustee | Mr. Deems was appointed as a Trustee at the March 11, 2008 meeting of the Board of Trustees and elected at a special meeting of shareholders held on August 7, 2009. | Mr. Deems is the Co-Founder and Chief Financial Officer of Green Alpha Advisors, LLC, a registered investment advisor, and Co-Portfolio Manager of the Shelton Green Alpha Fund. | 31 | Mr. Deems is a Trustee of ALPS ETF Trust (17 funds); ALPS Variable Investment Trust (7 funds); Clough Funds Trust (1 fund); and Reaves Utility Income Fund (1 fund). |
| Annual Report | April 30, 2021 | 35 |
| Rondure Funds | Trustees and Officers |
| April 30, 2021 (Unaudited) |
INDEPENDENT TRUSTEES
| Name, Address* & Year of Birth | Position(s) Held with Fund | Term of Office** and Length of Time Served | Principal Occupation(s) During Past 5 Years*** | Number of Funds in Fund Complex Overseen by Trustee**** | Other Directorships Held by Trustee During Past 5 Years*** |
| Jerry G. Rutledge, 1944 | Trustee | Mr. Rutledge was elected at a special meeting of shareholders held on August 7, 2009. | Mr. Rutledge is the President and owner of Rutledge’s Inc., a retail clothing business. | 31 | Mr. Rutledge is a Trustee of Clough Global Dividend and Income Fund (1 fund); Clough Global Equity Fund (1 fund); Clough Global Opportunities Fund (1 fund); and Principal Real Estate Income Fund (1 fund). |
| Michael “Ross” Shell, 1970 | Trustee | Mr. Shell was elected at a special meeting of shareholders held on August 7, 2009. | Mr. Shell is Founder and CEO of Red Idea, LLC, a strategic consulting/early stage venture firm (since June 2008). Mr. Shell serves on the Board of Directors of TalkBox, a phone/privacy booth company (since 2018) and DLVR, a package security company (since 2018). Mr. Shell served on the Advisory Board, St. Vrain School District Innovation Center (from 2015-2018). Mr. Shell graduated with honors from Stanford University with a degree in Political Science. | 31 | None. |
| 36 | 1.855.775.3337 | www.rondureglobal.com |
| Rondure Funds | Trustees and Officers |
| April 30, 2021 (Unaudited) |
INTERESTED TRUSTEE
| Name, Address* & Year of Birth | Position(s) Held with Fund | Term of Office** and Length of Time Served | Principal Occupation(s) During Past 5 Years*** | Number of by Trustee**** | Other Directorships Held by Trustee During Past 5 Years*** |
| Edmund J. Burke, 1961 | Trustee | Mr. Burke was elected as Trustee at a special meeting of shareholders held on August 7, 2009. | Mr. Burke joined ALPS in 1991 and served as the President and Director of ALPS Holdings, Inc., and ALPS Advisors, Inc., and Director of ALPS Distributors, Inc., ALPS Fund Services, Inc. (“ALPS”), and ALPS Portfolio Solutions Distributor, Inc. (collectively, the “ALPS Companies”). Mr. Burke retired from the ALPS Companies in June 2019. Mr. Burke is currently a partner at ETF Action, a web-based system that provides data and analytics to registered investment advisers, (since 2020) and a Director of Alliance Bioenergy Plus, Inc., echnology company focused on emerging technologies in the renewable energy, biofuels, and bioplastics technology sectors (since 2020). Mr. Burke is deemed an interested Trustee by virtue of his prior positions with the ALPS Companies. | 31 | Mr. Burke is a Trustee of ALPS ETF Trust (17 funds); Clough Global Dividend and Income Fund (1 fund); Clough Global Equity Fund (1 fund); Clough Global Opportunities Fund (1 fund); Clough Funds Trust (1 fund); Liberty All-Star Equity Fund (1 fund); and Director of the Liberty All-Star Growth Fund, Inc. (1 fund). |
| Annual Report | April 30, 2021 | 37 |
| Rondure Funds | Trustees and Officers |
| April 30, 2021 (Unaudited) |
OFFICERS
| Name, Address* & Year of Birth | Position(s) Held with Fund | Term of Office** and Length of Time Served | Principal Occupation(s) During Past 5 Years*** |
| Bradley J. Swenson, 1972***** | President | Mr. Swenson was appointed President of the Trust at the June 11, 2019 meeting of the Board of Trustees. | Mr. Swenson joined ALPS in 2004 and has served as its President since June 2019. In this role, he serves as an officer to certain other closed-end and open-end investment companies. He previously served as the Chief Operating Officer of ALPS (2015-2019). Mr. Swenson also previously served as Chief Compliance Officer to ALPS, its affiliated entities, and to certain ETF, closed-end and open-end investment companies (2004-2015). Because of his position with ALPS, Mr. Swenson is deemed an affiliate of the Trust as defined under the 1940 Act. |
| Dawn Cotten, 1977 | President | Ms. Cotten was appointed President of the Trust at the June 8-9, 2021 meeting of the Trustees. | Ms. Cotten joined ALPS in 2009 and is currently Senior Vice President of Fund Administration and Relationship Management of ALPS. She has served in that role since January 2020. Prior to that, Ms. Cotten served as Senior Vice President of Relationship Management (2017-2020). Ms. Cotten served as a VP in Relationship Management from 2013-2017. Ms. Cotten also serves as President of ALPS Series Trust, Clough Funds Trust, Clough Global Dividend and Income Fund, and Clough Global Equity Fund and Clough Global Opportunities Fund. |
| Jennell Panella, 1974 | Treasurer | Ms. Panella was appointed Treasurer of the Trust at the September 15, 2020 meeting of the Board of Trustees | Ms. Panella joined ALPS in June 2012 and is currently Vice President and Fund Controller of ALPS Fund Services, Inc. Prior to joining ALPS, Ms. Panella served as Financial Reporting Manager for Parker Global Strategies, LLC (2009-2012). Because of her position with ALPS, Ms. Panella is deemed an affiliate of the Trust as defined under the 1940 Act. Ms. Panella also serves as Assistant Treasurer of James Advantage Funds. |
| Karen S. Gilomen, 1970***** | Secretary | Ms. Gilomen was appointed Secretary of the Trust at the December 13, 2016 meeting of the Board of Trustees. | Ms. Gilomen joined ALPS in August 2016 as Vice President and Senior Counsel. Prior to joining ALPS, Ms. Gilomen was Vice President - General Counsel & CCO of Monticello Associates, Inc. from 2010 to 2016. Because of her position with ALPS, Ms. Gilomen is deemed an affiliate of the Trust, as defined under the 1940 Act. Ms. Gilomen is also the Secretary of ALPS Variable Investment Trust and Reaves Utility Income Fund, and the Assistant Secretary of the WesMark Funds. |
| Cara Owen, 1981 | Secretary | Ms. Owen was appointed Secretary of the Trust at the June 8-9, 2021 meeting of the Trustees. | Vice President and Principal Legal Counsel, ALPS Fund Services, Inc. Prior to joining ALPS, Ms. Owen was Senior Counsel, Corporate & Investments, Great-West Life & Annuity Insurance Company; Senior Counsel & Assistant Secretary, Great-West Funds, Inc., Great-West Capital Management, LLC, Great-West Trust Company, LLC, and Advised Assets Group, LLC (2014-2019). Ms. Owen also serves as Secretary of ALPS ETF Trust, Vice President and Secretary of Boulder Growth & Income Fund, and Assistant Secretary of James Advantage Funds. |
| Ted Uhl, 1974 | Chief Compliance Officer (“CCO”) | Mr. Uhl was appointed CCO of the Trust at the June 8, 2010 meeting of the Board of Trustees. | Mr. Uhl joined ALPS in October 2006, and is currently Deputy Compliance Officer of ALPS. Prior to his current role, Mr. Uhl served as Senior Risk Manager for ALPS from October 2006 until June 2010. Before joining ALPS, Mr. Uhl served a Sr. Analyst with Enenbach and Associates (RIA), and a Sr. Financial Analyst at Sprint. Because of his position with ALPS, Mr. Uhl is deemed an affiliate of the Trust as defined under the 1940 Act. Mr. Uhl is also CCO of the Boulder Growth & Income Fund, Inc., Centre Funds, Index Funds, Reality Shares ETF Trust, Reaves Utility Income Fund and XAI Octagon Floating Rate & Alternative Income Term Trust. |
| 38 | 1.855.775.3337 | www.rondureglobal.com |
| Rondure Funds | Trustees and Officers |
| April 30, 2021 (Unaudited) |
OFFICERS
| Name, Address* & Year of Birth | Position(s) Held with Fund | Term of Office** and Length of Time Served | Principal Occupation(s) During Past 5 Years*** |
| Jennifer Craig, 1973 | Assistant Secretary | Ms. Craig was appointed Assistant Secretary of the Trust at the June 8, 2016 meeting of the Board of Trustees. | Ms. Craig joined ALPS in 2007 and is currently Assistant Vice President and Paralegal Manager of ALPS. Because of her position with ALPS, Ms. Craig is deemed an affiliate of the Trust as defined under the 1940 Act. Ms. Craig is also Secretary of Principal Real Estate Income Fund, Assistant Secretary of Clough Global Dividend and Income Fund, Clough Global Equity Fund, Clough Global Opportunities Fund, Liberty All-Star Equity Fund and Liberty All-Star Growth Fund, Inc. and Clerk of Goehring & Rozencwajg Investment Funds. |
| * | All communications to Trustees and Officers may be directed to Financial Investors Trust c/o 1290 Broadway, Suite 1000, Denver, CO 80203. |
| ** | This is the period for which the Trustee or Officer began serving the Trust. Each Trustee serves an indefinite term, until such Trustees successor is elected and appointed, or such Trustee resigns or is deceased. Officers are elected on an annual basis. |
| *** | Except as otherwise indicated, each individual has held the office shown or other offices in the same company for the last five years. |
| **** | The Fund Complex includes all series of the Trust, currently 31, and any other investment companies for which any Trustee serves as trustee for and for which Rondure Global Advisors, LLC provides investment advisory services (currently none). |
| ***** | Mr. Swenson resigned his position as President of the Trust effective June 9, 2021 and Ms. Gilomen resigned her position as Secretary of the Trust effective June 4, 2021. |
| Annual Report | April 30, 2021 | 39 |
| Rondure Funds | Privacy Policy |
| April 30, 2021 (Unaudited) |
| Who We Are | |
| Who is providing this notice? | Rondure New World Fund and Rondure Overseas Fund. |
| What We Do | |
| How do the Funds protect my personal information? | To protect your personal information from unauthorized access and use, we use security measures that comply with federal law. These measures include computer safeguards and secured files and buildings. |
| How do the Funds collect my personal information? | We collect your personal information, for example, when you
● open an account ● provide account information or give us your contact information ● make a wire transfer or deposit money |
| Why can't I limit all sharing? | Federal law gives you the right to limit only
● sharing for affiliates’ everyday business purposes-information about your creditworthiness ● affiliates from using your information to market to you ● sharing for non-affiliates to market to you
State laws and individual companies may give you additional rights to limit sharing. |
| Definitions | |
| Affiliates | Companies related by common ownership or control. They can be financial and nonfinancial companies. |
| Non-affiliates | Companies not related by common ownership or control. They can be financial and nonfinancial companies.
● The Funds does not share with non-affiliates so they can market to you. |
| Joint marketing | A formal agreement between non-affiliated financial companies that together market financial products or services to you.
● The Funds does not jointly market. |
| Other Important Information | |
| California Residents | If your account has a California home address, your personal information will not be disclosed to nonaffiliated third parties except as permitted by applicable California law, and we will limit sharing such personal information with our affiliates to comply with California privacy laws that apply to us. |
| Vermont Residents | The State of Vermont requires financial institutions to obtain your consent prior to sharing personal information that they collect about you with affiliated companies and nonaffiliated third parties other than in certain limited circumstances. Except as permitted by law, we will not share personal information we collect about you with nonaffiliated third parties or other affiliated companies unless you provide us with your written consent to share such information. |
| 40 | 1.855.775.3337 | www.rondureglobal.com |
| Rondure Funds | Privacy Policy |
| April 30, 2021 (Unaudited) |
| FACTS | WHAT DO THE FUNDS DO WITH YOUR PERSONAL INFORMATION? |
| Why? | Financial companies choose how they share your personal information. Federal law gives consumers the right to limit some but not all sharing. Federal law also requires us to tell you how we collect, share, and protect your personal information. Please read this notice carefully to understand what we do. |
| What? | The types of personal information we collect and share depend on the product or service you have with us. This information can include:
● Social Security number and account transactions ● Account balances and transaction history ● Wire transfer instructions |
| How? | All financial companies need to share customers’ personal information to run their everyday business. In the section below, we list the reasons financial companies can share their customers’ personal information; the reasons the Funds choose to share; and whether you can limit this sharing. |
| Reasons we can share your personal information | Do the Funds share: | Can you limit this sharing? |
| For our everyday business purposes — such as to process your transactions, maintain your account(s), respond to court orders and legal investigations, or report to credit bureaus | Yes | No |
| For our marketing purposes — to offer our products and services to you | No | We do not share. |
| For joint marketing with other financial companies | No | We do not share. |
| For our affiliates’ everyday business purposes — information about your transactions and experiences | Yes | No |
| For our affiliates’ everyday business purposes — information about your creditworthiness | No | We do not share. |
| For nonaffiliates to market to you | No | We do not share. |
| Annual Report | April 30, 2021 | 41 |

Contact Us
| Mail: | Rondure Funds, P.O. Box 13664, Denver, CO 80201 | E-Mail: | rondureglobal@alpsinc.com |
| Phone: | 1.855.775.3337 | Web: | www.rondureglobal.com |
TABLE OF CONTENTS
| Letter to Shareholders | 1 |
| Performance Review | |
| Seafarer Overseas Growth and Income Fund | 5 |
| Seafarer Overseas Value Fund | 10 |
| Disclosure of Fund Expenses | 16 |
| Portfolio of Investments | 18 |
| Statements of Assets and Liabilities | 27 |
| Statements of Operations | 28 |
| Statements of Changes in Net Assets | 29 |
| Financial Highlights | 32 |
| Notes to Financial Statements | 40 |
| Report of Independent Registered Public Accounting Firm | 50 |
| Additional Information | 51 |
| Approval of Fund Advisory Agreement | 52 |
| Liquidity Risk Management Program | 54 |
| Trustees and Officers | 55 |
| Privacy Policy | 60 |
| Seafarer Funds | Letter to Shareholders |
April 30, 2021
LETTER TO SHAREHOLDERS
May 20, 2021
Dear Fellow Shareholders,
I am pleased to address you on behalf of Seafarer Capital Partners (“Seafarer”), the adviser to the Seafarer Funds (the "Funds"). This shareholder report covers the Funds’ 2020-2021 fiscal year (May 1, 2020 to April 30, 2021).
The Future of China within the Emerging Market Asset Class
Over the past ten years, I have used shareholder letters in the Funds’ Annual and Semi-annual Reports as a forum to opine on a handful of “big picture” topics.
In the autumn of 2015, I wrote a letter in which I discussed the challenges associated with the “emerging market equities” asset classification.1 A substantial portion of that letter was dedicated to emphasizing China’s unique status within the asset class: China’s scale, resources, advanced technologies, wealth, economic progress, and national ambition set its investment potential apart from the rest of the developing world. In my view, China has always held the greatest promise – possibly more than all other emerging markets combined.
In the autumn of 2017, I took up the topic of China again.2 I offered a summary of my “dream” for modern China and its development. For the past three decades, my academic studies and professional career have been heavily influenced by an abiding interest in China’s practical and largely successful effort to escape mass poverty. Over time, my understanding of the country’s economic progress had manifest in a formative idea of China’s emergent potential. However, that year I was forced to recognize that my hopes for China’s future were naïve. From 2013 onward, President Xi and his administration had explicitly imagined a very different “Chinese Dream,” and by 2017 the machinations of Xi’s Dream were transparent enough to reveal that my understanding of China’s future was outdated at best, and utterly misguided at worst.3 While I was alarmed and disappointed, I accepted that my dream had no relevance except as a personal artifact: who can legitimately construct a vision for China’s future but the Chinese themselves? Thus, as Xi’s Dream was ascendant, I wrote a requiem for my own, and adapted to the reality that was, rather than extend a futile dream for what might have been.
Playing a New Role
Much has changed and even more has been revealed in the intervening years since the publication of those two letters. My gut tells me that it is time to revisit China’s role within the emerging market asset class.
In the interim, China’s financial, economic and geopolitical heft have grown to the extent that the country’s global prominence is undeniable. China’s economy and its stock market are now the second largest in the world.4 Its domestic bond market has boomed, making it one of the largest as well.5 After a 15-year surge in initial public offerings (IPOs) the country has approximately 7,000 publicly-traded companies, and it boasts a new stock exchange dedicated to fostering innovative companies that advance new technologies.6 7 The country is home to the largest private equity and venture capital markets within the developing world, and financial reforms permit Chinese companies much improved access to international capital markets.8 In response, China’s stock markets have swollen to the point that the country typically constitutes nearly 40% of prominent benchmark indices that track the emerging market asset class – a far higher allocation than any other country within the developing world receives, and yet there is ample evidence that China is nonetheless substantially undercounted and underweighted.9
Meanwhile, Xi’s ambitious Dream to rejuvenate the Chinese nation has taken greater shape. At home, he has undertaken multiple purges against official graft and corruption, often sweeping up some of his perceived political rivals in the process. He has also reasserted the primacy of the state within the economy. State-owned enterprises (SOEs) have been given central roles within several industries, augmented by mega-mergers and enhanced access to capital. Meanwhile, ostensibly private
| Annual Report – April 30, 2021 | 1 |
| Seafarer Funds | Letter to Shareholders |
April 30, 2021
companies have been required to adopt executive committees that answer to the Communist party. Abroad, Xi has reversed three decades of Chinese policy that favored domestic development over international entanglements. Xi has sought to extend the nation’s international reach peacefully, via his signature “Belt and Road”10 financial and development scheme, and more recently via “vaccine diplomacy” – China has sought to buy goodwill via the provision of domestically-developed vaccines to nations struggling with the COVID-19 pandemic.
Xi’s Dream has also manifest in assertive actions to curtail perceived threats to the nation’s security and sovereignty. On the international front, China has undertaken aggressive military maneuvers in the South China Seas and made provocative flights over Taiwanese airspace. At home, the government has sought to stamp out any source of domestic discontent. This has meant the mass suppression of the Uighur people in the Xinjiang Autonomous Region, in an utterly disproportionate response to a legitimate terrorism risk; and it has led to the subjugation of Hong Kong, seemingly in violation of the Special Administrative Region’s Basic Law. Even as such policies have stoked controversy and ire abroad, Xi’s China has not shied from deflecting all criticism, vigorously asserting its autonomy, and boldly laying claim to an expansive vision of its future.
Alone on the Stage
From the beginning of my career, I have understood that China was exceptional within the developing world. As such, I have always and actively questioned the merit of grouping China with other developing countries to form the “emerging market asset class.” I have long suspected that China’s scale, economic progress, and future potential would mean that it would one day stand apart from the rest and become an “asset class” unto itself – its financial and economic breadth and depth rivaling that of the United States (which likewise comprises its own single-country “asset class”). I imagined that if China’s stature ever rose to such a level, the event would mark a welcome moment in the country’s modernization and development.
In 2021, much of what I imagined has come to pass. China has grown and prospered, such that it dominates the emerging market asset class. The country now serves as the central economic “hub” around which many developing nations orient their trade and economic policies (notably supplanting the U.S.’s leading role as a trading partner for the developing world). Thus it seems fitting that many investors are beginning to openly wonder whether China should be carved out from the rest of the emerging markets to receive a distinct and prominent position in a global portfolio allocation.
Increasingly, I lean towards this view – but for a decidedly mixed and unwelcome set of reasons. The emergent scale, depth, breadth and complexity of China’s capital markets seem to favor specialist skills: to optimize China’s potential from bond markets, stock markets, venture capital and private equity markets, I recognize that it might be ideal to utilize dedicated investment capabilities trained solely on the country. But there is another, more difficult reason to prefer China as an independent asset class: the country has become fraught with legal, political, martial and moral morasses. Even as the country’s economic might has become starkly evident to all, the darker aspects of the Chinese Dream have forced many to question whether the country remains investable.11 Even as some may favor a dedicated capability that might maximize the country’s investment potential, others might wish to cleave China from the rest to manage its risks more directly, and if necessary, summarily excise it from their portfolios. Frankly, it disappoints me to contemplate the latter possibility given the dream I once held for China, a nation that I will always deem exceptional among its peers.
What will Seafarer do in response? Nothing will change in the foreseeable future for the Funds. We will continue to invest selectively within China, acutely aware of the risks posed by the darker aspects of China’s modern development. Likewise, Seafarer will not in the foreseeable future launch dedicated investment capabilities and related products for the Chinese market. The only residual, unanswered question before us is whether to pursue an emerging market strategy that excludes China. I am undecided. I find it difficult to contemplate the merits of an ex-China strategy: for the aforementioned reasons, China is home to many of the developing world’s best companies. To omit the nation from a portfolio is to forgo some of the most important potential sources of return; that which remains might be hampered with too much risk and offer too little reward to be worthy of dedicated long-term investment. Worse, the remainder might lack relevant scale for many global investors. Many investors
| 2 | (855) 732-9220 seafarerfunds.com |
| Seafarer Funds | Letter to Shareholders |
April 30, 2021
tend to allocate a small portion of their portfolios overseas, and an even smaller portion to the emerging markets. If China – the largest and arguably most vital constituent of the asset class – is carved out, would the remainder be large enough to matter? The key question is whether the rest of the emerging markets will generate sufficiently numerous opportunities as to warrant a dedicated, long-term strategy. I wonder.
I plan to contemplate this question further, and I urge you to do the same. China’s emergence is so big, so critical and so fraught that it demands a deliberate response within your portfolio allocation. If you choose to continue to group China with other emerging markets, do so deliberately, and not because of a historical default. If you choose to carve China out from the rest, seek out the best dedicated capabilities you can find to pursue the full breadth of the country’s investment potential – and if suitable for you, consider asset classes beyond public equities. Lastly, if you have thoughts on whether an ex-China strategy holds ongoing relevance, let us know; it might be time for a new dream.
Expense Ratios and Economies of Scale
As described in the Letter to Shareholders as of April 30, 2017, Seafarer has committed to reduce expenses for the Funds, particularly as time and scale afford greater efficiency.12
During the 2020-2021 fiscal year, the scale of the Growth and Income Fund was similar to that during the prior year. Accordingly, the operating expense ratios for the fiscal year were unchanged at 0.92% and 1.02% for the Institutional and Investor classes, respectively.13 As the Funds enter a new fiscal year, Seafarer’s intention remains the same: to offer shareholders positive economies, over time and with scale.
Compared to the Growth and Income Fund, the Value Fund’s smaller scale does not yield an equivalent degree of cost efficiency. However, Seafarer has established the same underlying expense structure for both Funds. Should the Value Fund’s assets grow over time, it is expected to achieve similar economies of scale. In the meantime, Seafarer continues to limit the Fund’s operating expenses via a contractual commitment, such that its net expense ratios remain 1.05% and 1.15% for the Institutional and Investor classes, respectively.14
Thank you for entrusting us with your capital during these difficult times. We are, as always, honored to serve as your investment advisor in the developing world.
Andrew Foster
Chief Investment Officer
Seafarer Capital Partners, LLC
The Funds are subject to investment risks, including possible loss of the principal amount invested and therefore are not suitable for all investors. The Funds may not achieve their objectives. Diversification does not ensure a profit or guarantee against loss.
Information on the Seafarer website and references to Seafarer publications are provided for textual reference only, and are not incorporated by reference into this report.
The views and information discussed in this commentary are as of the date of publication, are subject to change, and may not reflect Seafarer’s current views. The views expressed represent an assessment of market conditions at a specific point in time, are opinions only and should not be relied upon as investment advice regarding a particular investment or markets in general. Such information does not constitute a recommendation to buy or sell specific securities or investment vehicles. It should not be assumed that any investment will be profitable or will equal the performance of the portfolios or any securities or any sectors mentioned herein. The subject matter contained herein has been derived from several sources believed to be reliable and accurate at the time of compilation. Seafarer does not accept any liability for losses either direct or consequential caused by the use of this information.
| 1 | www.seafarerfunds.com/letters-to-shareholders/2015/10/semi-annual/#death-of-the-emerging-markets |
| 2 | www.seafarerfunds.com/letters-to-shareholders/2017/10/semi-annual |
| 3 | Xi Jinping and the Chinese Dream (www.economist.com/leaders/2013/05/04/xi-jinping-and-the-chinese-dream), The Economist, 4 May 2013. |
| Annual Report – April 30, 2021 | 3 |
| Seafarer Funds | Letter to Shareholders |
April 30, 2021
| 4 | Regarding the scale and rank of China’s annual economic output, see GDP (current US$) (data.worldbank.org/indicator/NY.GDP.MKTP.CD), World Bank, measured on 20 May 2021. Regarding the scale and rank of China’s stock market, see Market Capitalization of Listed Domestic Companies (Current US$) (data.worldbank.org/indicator/CM.MKT.LCAP.CD?most_recent_value_desc=true), World Bank, measured on 20 May 2021. |
| 5 | As of 2019, China’s domestic bond markets were the third largest in the world, ranking behind only the United States and Japan. However, Euro-denominated regional markets likely collectively eclipse the yen and renminbi markets of Japan and China, respectively. See www.seafarerfunds.com/commentary/the-evolution-of-chinas-bond-market |
| 6 | Sources: Bloomberg, Seafarer. Data as of 20 May 2021. |
| 7 | An initial public offering (IPO) is the process of offering shares of a private company to the public in a new stock issuance. |
| 8 | Tabby Kinder, Mercedes Ruehl and Yuan Yang, Chinese Private Equity Targets Record Fundraisings (www.ft.com/content/d8ea1bf7-51d4-454c-80f3-753b18eb3642), Financial Times, 6 April 2021. |
| 9 | Based on the weighting of China (excluding Taiwan) within the MSCI Emerging Markets Index. The MSCI Emerging Markets Index is a free float-adjusted market capitalization index designed to measure equity market performance of emerging markets. Index code: MXEF. It is not possible to invest directly in an index. Sources: MSCI, Bloomberg. Data as of 20 May 2021. |
| 10 | www.seafarerfunds.com/commentary/one-belt-one-road-many-motives |
| 11 | For more on the challenges associated with investment in modern China, please see my colleague Nicholas Borst’s white paper The China Investment Dilemma (www.seafarerfunds.com/commentary/the-china-investment-dilemma). Also see his writings on the U.S. push for divestment from and delisting of Chinese companies (www.seafarerfunds.com/prevailing-winds/divest-and-delist-the-case-against-exiting-china), and the policy and investment questions that surround state-owned enterprises (SOEs) in China (www.seafarerfunds.com/prevailing-winds/soe-reform-in-china-implications-for-policymakers-and-investors). |
| 12 | www.seafarerfunds.com/letters-to-shareholders/2017/04/annual#cost-reduction |
| 13 | The Growth and Income Fund’s Prospectus (dated August 31, 2020) states that the Fund’s expenses are 0.93% and 1.03% for the Institutional and Investor classes, respectively. |
| 14 | Seafarer Capital Partners, LLC has agreed contractually to waive and/or reimburse fees or expenses in order to limit Total Annual Fund Operating Expenses After Fee Waiver / Expense Reimbursements (inclusive of acquired fund fees and expenses, and exclusive of brokerage expenses, interest expenses, taxes and extraordinary expenses) to 1.15% and 1.05% of each Fund’s average daily net assets for the Investor and Institutional share classes, respectively. This agreement is in effect through August 31, 2021. |
| 4 | (855) 732-9220 seafarerfunds.com |
| Seafarer Overseas Growth and Income Fund | Performance Review |
April 30, 2021
SEAFARER OVERSEAS GROWTH AND INCOME FUND
PERFORMANCE REVIEW
May 15, 2021
This report addresses the 2020-2021 fiscal year (May 1, 2020 to April 30, 2021) for the Seafarer Overseas Growth and Income Fund (the “Growth and Income Fund" or the "Fund").
During the fiscal year, the Fund returned 52.28%, while the Fund’s benchmark indices, the MSCI Emerging Markets Total Return USD Index and the Morningstar Emerging Markets Net Return USD Index, returned 49.21% and 51.45%, respectively.1 By way of broader comparison, the S&P 500 Index gained 45.98%.
The Fund began the fiscal year with a net asset value (NAV) of $10.36 per share. During the ensuing twelve months, the Fund paid two distributions: $0.072 per share in June 2020 and $0.264 per share in December 2020. Those payments brought the cumulative distribution per share, as measured from the Fund’s inception to the end of the fiscal year, to $3.329. The Fund finished the fiscal year with a value of $15.39 per share.2
From the Fund’s inception (February 15, 2012) through the end of the fiscal year (April 30, 2021), the Fund generated an annualized rate of return of 8.10%.3 Over the same period, the benchmark indices, the MSCI Emerging Markets Total Return USD Index and Morningstar Emerging Markets Net Return USD Index, rose at annualized rates of 5.52% and 5.66%, respectively.
* * *
The Growth and Income Fund’s fiscal year coincided with a sustained and pronounced rally in stock prices throughout the developing world. The COVID-19 pandemic induced a collapse in stock prices that reached its nadir on March 23, 2020; the Fund’s fiscal year began five weeks later. The MSCI Emerging Markets Index then proceeded to rise, nearly uninterrupted for the next 10 months, such that it peaked in mid-February, nearly 60% higher than where it began the fiscal year.4 Markets have consolidated since February, but the index still rose 49.21% in the complete fiscal year – a remarkable performance, particularly as the economic and health recovery among developing countries has been very uneven, and several large countries such as India and Brazil remain deeply mired in the pandemic.
Even as stock price movements were both swift and sustained, they were also exceedingly narrow with respect to geography. During the fiscal year, 79% of the returns in the MSCI Emerging Markets Index came from four countries (China, Taiwan, South Korea, and India).5 Companies categorized in just two sectors (Information Technology and Consumer Discretionary), while accounting for 37% of the MSCI benchmark, drove 49% of the returns.6 The two sectors are notable because together they house nearly all the “high tech” companies that have dominated performance throughout global stock markets over the past few years – the former includes semiconductor and software companies; the latter includes internet entertainment, social media and e-commerce companies.
Compared to the concentrated make-up of the MSCI Emerging Markets Index, the sources of the Growth and Income Fund’s performance were more differentiated by geography. South Korea was the single largest source of return, followed by China; the Fund also saw significant gains from its holdings in Singapore, India, Vietnam, the Middle East and Eastern Europe. Every sector contributed positively to the Fund during the fiscal year – though this was due to the fact that the Fund’s fiscal year began on May 1, 2020, which nearly coincided with the nadir of the COVID-19-induced collapse in stock markets. Like the MSCI benchmark, the Fund benefited most from its holdings in information technology stocks – particularly semiconductor companies – but it also saw notable gains in health care, industrials and consumer staples.
Given the Fund’s outsized exposure to South Korean stocks in this period, it comes as no surprise that the top three individual contributors to total return are based in Korea. Three long-held and large Korean stocks rose substantially: Samsung SDI (a globally competitive company in battery technologies); Samsung Electronics (a semiconductor company); and Hyundai Mobis (a manufacturer of auto parts and systems). Three other top contributors to Fund performance include Infosys, a leading information
| Annual Report – April 30, 2021 | 5 |
| Seafarer Overseas Growth and Income Fund | Performance Review |
April 30, 2021
technology company, Alibaba, China’s largest e-commerce company, and Taiwan Semiconductor Manufacturing Company (TSMC), the semiconductor leader. Notably, the Fund exited Alibaba during the fourth quarter of 2020 (after substantially reducing the Fund’s weight during the first half of the annual period) and also exited its holding in TSMC in early 2021; both decisions were driven by a combination of excessive valuation and concerns regarding looming performance challenges for each company.
The top detractors to total return for this period include Samsung C&T, a recently added issuer from South Korea and a holding company of the Samsung Group, and Odontoprev, a Brazil-based dental benefits company.
Amid such volatile conditions, and rapidly moving stock prices, we were pleased that the Fund managed to outpace the indexes and proved more stable than its benchmarks. We thank you for entrusting us with your capital during a tumultuous and uncertain year. We are, as ever, honored to serve as your investment adviser in the emerging markets.
Andrew Foster and Paul Espinosa
Portfolio Managers, Seafarer Overseas Growth and Income Fund
Seafarer Capital Partners, LLC
The MSCI Emerging Markets Total Return Index, Standard (Large+Mid Cap) Core, Gross (dividends reinvested), USD is a free float-adjusted market capitalization index designed to measure equity market performance of emerging markets. Index code: GDUEEGF.
The Morningstar Emerging Markets Net Return USD Index measures the performance of emerging markets targeting the top 97% of stocks by market capitalization. The index does not incorporate Morningstar’s environmental, social, or governance (ESG) criteria. Index code: MEMMN.
The S&P 500 Total Return Index is a stock market index based on the market capitalizations of 500 large companies with common stock listed on the NYSE or NASDAQ.
It is not possible to invest directly in an index.
The Fund is subject to investment risks, including possible loss of the principal amount invested and therefore is not suitable for all investors. The Fund may not achieve its objectives. Diversification does not ensure a profit or guarantee against loss.
The views and information discussed in this commentary are as of the date of publication, are subject to change, and may not reflect Seafarer’s current views. The views expressed represent an assessment of market conditions at a specific point in time, are opinions only and should not be relied upon as investment advice regarding a particular investment or markets in general. Such information does not constitute a recommendation to buy or sell specific securities or investment vehicles. It should not be assumed that any investment will be profitable or will equal the performance of the portfolios or any securities or any sectors mentioned herein. The subject matter contained herein has been derived from several sources believed to be reliable and accurate at the time of compilation. Seafarer does not accept any liability for losses either direct or consequential caused by the use of this information.
As of April 30, 2021, the Fund did not own shares in Alibaba Group Holding, Ltd. or Taiwan Semiconductor Manufacturing Co., Ltd.
| 1 | References to the “Fund” pertain to the Fund’s Institutional share class (ticker: SIGIX). The Investor share class (ticker: SFGIX) returned 52.15% during the fiscal year. |
| 2 | The Fund’s Investor share class began the fiscal year with a net asset value of $10.31 per share. The Fund paid two distributions: $0.070 per share in June 2020 and $0.257 per share in December 2020. The Fund finished the fiscal year with a value of $15.31 per share. |
| 3 | The Fund’s Investor share class generated an annualized rate of return of 7.97% from the Fund’s inception through the end of the fiscal year. |
| 4 | For the period April 30, 2020 to February 17, 2021, the MSCI Emerging Markets Index rose 59.39%. |
| 5 | Collectively, these four countries represented an average weight of 74% of the MSCI Emerging Markets Index throughout the fiscal year. Sources: MSCI, Bloomberg. |
| 6 | 37% represents the average of the combined weight of the Information Technology and Consumer Discretionary sectors in the MSCI Emerging Markets Index throughout the fiscal year. Sources: MSCI, Bloomberg. |
| 6 | (855) 732-9220 seafarerfunds.com |
| Seafarer Overseas Growth and Income Fund | Performance Review |
April 30, 2021
Total Returns
| As of April 30, 2021 | 1 Year | 3 Year | 5 Year | 7 Year | Since Inception Annualized1 | Gross Expense Ratio2 |
| Investor Class (SFGIX) | 52.15% | 10.04% | 9.87% | 7.42% | 7.97% | 1.03% |
| Institutional Class (SIGIX) | 52.28% | 10.18% | 10.00% | 7.55% | 8.10% | 0.93% |
| MSCI Emerging Markets Total Return USD Index3 | 49.21% | 7.91% | 12.91% | 7.29% | 5.52% | |
| Morningstar Emerging Markets Net Return USD Index4 | 51.45% | 8.12% | 12.58% | 7.37% | 5.66% |
Fund performance is presented in U.S. dollar terms, with U.S. jurisdiction distributions reinvested on a gross (pre-tax) basis. For the MSCI index, performance is calculated to reflect the reinvestment of dividends, capital gains, and other corporate actions gross of foreign jurisdiction withholding taxes (i.e., such taxes are ignored). For the Morningstar index, performance is calculated to reflect the reinvestment of dividends, capital gains, and other corporate actions net of foreign jurisdiction withholding taxes. The performance data quoted represents past performance and does not guarantee future results. Future returns may be lower or higher. The investment return and principal value will fluctuate so that an investor's shares, when redeemed, may be worth more or less than the original cost. Prior to August 31, 2016, shares of the Fund redeemed or exchanged within 90 days of purchase were subject to a 2% redemption fee. Performance does not reflect this fee, which if deducted would reduce an individual's return. To obtain the Fund’s most recent month-end performance, visit seafarerfunds.com or call (855) 732-9220.
| 1 | Inception Date: February 15, 2012. |
| 2 | Ratios as of Prospectus dated August 31, 2020. Seafarer Capital Partners, LLC has agreed contractually to waive and/or reimburse fees or expenses in order to limit Total Annual Fund Operating Expenses After Fee Waiver/Expense Reimbursements (inclusive of acquired fund fees and expenses, and exclusive of brokerage expenses, interest expenses, taxes and extraordinary expenses) to 1.15% and 1.05% of the Fund’s average daily net assets for the Investor and Institutional share classes, respectively. This agreement is in effect through August 31, 2021. |
| 3 | The MSCI Emerging Markets Total Return Index, Standard (Large+Mid Cap) Core, Gross (dividends reinvested), USD is a free float-adjusted market capitalization index designed to measure equity market performance of emerging markets. Index code: GDUEEGF. The index is not actively managed and does not reflect any deductions for fees, expense or taxes. An investor may not invest directly in an index. |
| 4 | The Morningstar Emerging Markets Net Return USD Index measures the performance of emerging markets targeting the top 97% of stocks by market capitalization. The index does not incorporate Morningstar’s environmental, social, or governance (ESG) criteria. Index code: MEMMN. The index is not actively managed and does not reflect any deductions for fees, expense or taxes. An investor may not invest directly in an index. |
| Annual Report – April 30, 2021 | 7 |
| Seafarer Overseas Growth and Income Fund | Performance Review |
April 30, 2021
Performance of a $10,000 Investment Since Inception

| * | Inception Date: February 15, 2012. |
The chart shown above represents historical performance of a hypothetical investment of $10,000 in the Fund’s Investor Class shares for the period from inception to April 30, 2021. All returns reflect reinvested dividends and/or distributions, but do not reflect the deduction of taxes that an investor would pay on distributions or redemptions.
The Fund also offers Institutional Class shares, performance of which is not reflected in the chart above. The performance of Institutional Class shares may be higher or lower than the performance of the Investor Class shares shown above based upon differences in fees paid by shareholders investing in the Investor Class shares and Institutional Class shares.
Investment Objective
The Seafarer Overseas Growth and Income Fund seeks to provide long-term capital appreciation along with some current income. The Fund seeks to mitigate adverse volatility in returns as a secondary objective.
Strategy
The Fund invests primarily in the securities of companies located in developing countries. The Fund invests in several asset classes including dividend-paying common stocks, preferred stocks, and fixed-income securities.
The Fund seeks to offer investors a relatively stable means of participating in developing countries’ growth prospects, while attempting to mitigate adverse volatility in returns.
| 8 | (855) 732-9220 seafarerfunds.com |
| Seafarer Overseas Growth and Income Fund | Performance Review |
April 30, 2021
| Portfolio Composition by Region | % Net Assets |
| East & South Asia | 71.6% |
| Emerging Europe | 7.2% |
| Latin America | 7.4% |
| Middle East & Africa | 7.2% |
| Other | 2.5% |
| Cash & Other Assets, Less Liabilities | 4.1% |
| Total | 100.0% |
| Portfolio Composition by Sector | % Net Assets |
| Communication Services | 7.3% |
| Consumer Discretionary | 11.8% |
| Consumer Staples | 11.2% |
| Energy | 1.6% |
| Financials | 14.5% |
| Health Care | 10.4% |
| Industrials | 11.0% |
| Information Technology | 22.9% |
| Materials | 3.4% |
| Utilities | 1.8% |
| Cash & Other Assets, Less Liabilities | 4.1% |
| Total | 100.0% |
| Top 10 Holdings | % Net Assets |
| Hyundai Mobis Co., Ltd. | 4.8% |
| Samsung Electronics Co., Ltd. | 4.4% |
| China Literature, Ltd. | 4.3% |
| Richter Gedeon Nyrt | 3.8% |
| Sanlam, Ltd. | 3.8% |
| Venture Corp., Ltd. | 3.8% |
| Rohm Co., Ltd. | 3.6% |
| Samsung SDI Co., Ltd. | 3.6% |
| Ping An Insurance Group Co. of China, Ltd. | 3.5% |
| Samsung C&T Corp. | 3.2% |
| Total | 38.8% |
| Total Number of Holdings | 45 |
Holdings are subject to change, and may not reflect the current or future position of the portfolio.
Source: ALPS Fund Services, Inc.
| Annual Report – April 30, 2021 | 9 |
| Seafarer Overseas Value Fund | Performance Review |
April 30, 2021
SEAFARER OVERSEAS VALUE FUND
PERFORMANCE REVIEW
May 15, 2021
This report addresses the 2020-2021 fiscal year (May 1, 2020 to April 30, 2021) for the Seafarer Overseas Value Fund (the “Value Fund" or the "Fund").
During the fiscal year, the Fund returned 40.98%, while the Fund’s benchmark indices, the MSCI Emerging Markets Total Return USD Index and the Morningstar Emerging Markets Net Return USD Index, returned 49.21% and 51.45%, respectively.1 By way of broader comparison, the S&P 500 Index gained 45.98%.
The Fund began the fiscal year with a net asset value (NAV) of $9.48 per share. The Fund paid a distribution of $0.169 per share in December 2020. That payment brought the cumulative distribution per share, as measured from the Fund’s inception to the end of the fiscal year, to $1.404. The Fund finished the fiscal year with a value of $13.18 per share.2
From the Fund’s inception (May 31, 2016) through the end of the fiscal year (April 30, 2021), the Fund generated an annualized rate of return of 8.46%.3 Over the same period, the benchmark indices, the MSCI Emerging Markets Total Return USD Index and Morningstar Emerging Markets Net Return USD Index, rose at annualized rates of 14.02% and 13.70%, respectively.
* * *
Over the course of this annual period, the Value Fund’s NAV steadily climbed higher after recovering from the pandemic-induced market drawdown in March 2020. While the Fund’s performance trailed that of the benchmark indices, it is important to note that the drivers of return between the Value Fund and the indices could not be more different. For the annual period, a familiar group of large Asia-based technology and internet companies led the indices, whereas the Value Fund generated its total return from a more diversified set of factors.
Despite the dominance of growth -oriented companies in driving index performance during the fiscal year, the Value Fund managed to capture returns from price discovery in non-growth-oriented companies. Specifically, three of the Fund holdings realized latent balance sheet value with the help of less-traditional, public market participants. In the case of Amvig Holdings (Structural Shift source of value; Seafarer’s seven sources of value,4 hereafter referenced using parenthesized italics, are defined in Figure 1), a Chinese tobacco packaging manufacturer, a Chinese private equity fund announced a tender offer for the publicly-listed shares of the company at a 51.4% premium to the last traded price prior to the announcement. Another privatization case, a partial one this time, is that of Moneta Money Bank (Asset Productivity), a Czech bank, which received a tender offer in January 2021 from a Czech conglomerate for 29% of the shares in this 100% float public company.5 The third case of balance sheet value realization was that of Wilmar International (Asset Productivity and Breakup Value), a Singapore-based edible oils and consumer company, whose share price rose significantly in anticipation of the mid-October 2020 initial public offering (IPO) of its Chinese subsidiary.6
| 10 | (855) 732-9220 seafarerfunds.com |
| Seafarer Overseas Value Fund | Performance Review |
April 30, 2021
Figure 1. Sources of Value
Seafarer has identified seven distinct sources of value in emerging markets that may give rise to viable opportunities for long-term, value-oriented investments.

Source: Seafarer
A top contributor to the Fund’s performance during the fiscal year, unrelated to the technology sector and without a growth orientation, was Pacific Basin (Asset Productivity), a dry bulk shipping company headquartered in Hong Kong. The stock price has traded below book value for most of the last twelve years since the Global Financial Crisis of 2008-09.7 The stock’s notable appreciation in U.S. dollars during the early months of 2021 relates to industry-specific dynamics where regulatory changes conflated with supply-side dynamics for the stock to anticipate a sharp rise in profitability.
A third group of contributors to the Fund’s total return includes companies that while cyclical, and therefore expected to resume their growth trajectory as the effects of the pandemic ebb, have yet to demonstrate earnings growth that justifies their significant stock price appreciation. In my opinion, these Fund holdings represent cases where the market reassessed the risk for equity holders after a year of crisis management. Three holdings are representative of this dynamic: First Pacific (Breakup Value), a consumer and infrastructure conglomerate operating in Southeast Asia; China Foods (Asset Productivity), a Coca-Cola bottler with territories covering half of China; and Shangri-La (Breakup Value and Asset Productivity), a hotel owner and operator in Asia.
Lastly, and unsurprisingly, the Value Fund’s leading contributor to performance during the fiscal year was a technology-related company: Samsung SDI (Breakup Value), a South Korean battery manufacturer. In my view, the stock’s superlative performance relates as much to the valuation ascribed to the sector this year as it does to the company’s prospect of reaching sustained profitability at its electric vehicle battery manufacturing division.
The few negative contributors to the Fund’s total return for this period include WH Group (Management Change), a Chinese meat processor, and Crédito Real (Asset Productivity), a Mexican consumer finance company. The former’s very modest share price decline reflected struggling profitability at its U.S. subsidiary, Smithfield Foods, stemming from the impact of the pandemic on the production chain. The latter’s more meaningful share price decline was a function of Mexico’s mismanaged handling of the pandemic and a significant credit loss at one of its subsidiaries.
| Annual Report – April 30, 2021 | 11 |
| Seafarer Overseas Value Fund | Performance Review |
April 30, 2021
Thank you for entrusting us with your capital. We are honored to serve as your investment adviser in the emerging markets.
Paul Espinosa
Portfolio Manager, Seafarer Overseas Value Fund
Seafarer Capital Partners, LLC
The MSCI Emerging Markets Total Return Index, Standard (Large+Mid Cap) Core, Gross (dividends reinvested), USD is a free float-adjusted market capitalization index designed to measure equity market performance of emerging markets. Index code: GDUEEGF.
The Morningstar Emerging Markets Net Return USD Index measures the performance of emerging markets targeting the top 97% of stocks by market capitalization. The index does not incorporate Morningstar’s environmental, social, or governance (ESG) criteria. Index code: MEMMN.
The S&P 500 Total Return Index is a stock market index based on the market capitalizations of 500 large companies with common stock listed on the NYSE or NASDAQ.
It is not possible to invest directly in an index.
The Fund is subject to investment risks, including possible loss of the principal amount invested and therefore is not suitable for all investors. The Fund may not achieve its objectives. Diversification does not ensure a profit or guarantee against loss.
Information on the Seafarer website and references to Seafarer publications are provided for textual reference only, and are not incorporated by reference into this report.
The views and information discussed in this commentary are as of the date of publication, are subject to change, and may not reflect Seafarer’s current views. The views expressed represent an assessment of market conditions at a specific point in time, are opinions only and should not be relied upon as investment advice regarding a particular investment or markets in general. Such information does not constitute a recommendation to buy or sell specific securities or investment vehicles. It should not be assumed that any investment will be profitable or will equal the performance of the portfolios or any securities or any sectors mentioned herein. The subject matter contained herein has been derived from several sources believed to be reliable and accurate at the time of compilation. Seafarer does not accept any liability for losses either direct or consequential caused by the use of this information.
As of April 30, 2021, the Fund did not own shares in Amvig Holdings, Ltd., the Coca-Cola Co., or Smithfield Foods, Inc.
| 1 | References to the “Fund” pertain to the Fund’s Institutional share class (ticker: SIVLX). The Investor share class (ticker: SFVLX) returned 40.96% during the fiscal year. |
| 2 | The Fund’s Investor share class began the fiscal year with a net asset value of $9.46 per share; it paid an annual distribution of $0.160 per share in December 2020; and it finished the fiscal year with a value of $13.16 per share. |
| 3 | The Fund’s Investor share class generated an annualized rate of return of 8.36% from the Fund’s inception through the end of the fiscal year. |
| 4 | Additional information on Seafarer’s seven sources of value is available in the white paper On Value in the Emerging Markets (www.seafarerfunds.com/value-in-em). |
| 5 | A company’s free float (or float) refers to the portion of outstanding shares held by public investors, as opposed to those that are restricted shares held by company insiders. |
| 6 | An initial public offering (IPO) is the process of offering shares of a private company to the public in a new stock issuance. |
| 7 | Book value is the value of an asset as represented in the accounts of a balance sheet. |
| 12 | (855) 732-9220 seafarerfunds.com |
| Seafarer Overseas Value Fund | Performance Review |
April 30, 2021
Total Returns
| As of April 30, 2021 | 1 Year | 3 Year | Since Inception Annualized1 | Net Expense Ratio2 |
| Investor Class (SFVLX) | 40.96% | 5.87% | 8.36% | 1.15% |
| Institutional Class (SIVLX) | 40.98% | 5.96% | 8.46% | 1.05% |
| MSCI Emerging Markets Total Return USD Index3 | 49.21% | 7.91% | 14.02% | |
| Morningstar Emerging Markets Net Return USD Index4 | 51.45% | 8.12% | 13.70% |
Gross expense ratio: 1.59% for Investor Class; 1.44% for Institutional Class.2
Fund performance is presented in U.S. dollar terms, with U.S. jurisdiction distributions reinvested on a gross (pre-tax) basis. For the MSCI index, performance is calculated to reflect the reinvestment of dividends, capital gains, and other corporate actions gross of foreign jurisdiction withholding taxes (i.e., such taxes are ignored). For the Morningstar index, performance is calculated to reflect the reinvestment of dividends, capital gains, and other corporate actions net of foreign jurisdiction withholding taxes. The performance data quoted represents past performance and does not guarantee future results. Future returns may be lower or higher. The investment return and principal value will fluctuate so that an investor's shares, when redeemed, may be worth more or less than the original cost. Prior to August 31, 2016, shares of the Fund redeemed or exchanged within 90 days of purchase were subject to a 2% redemption fee. Performance does not reflect this fee, which if deducted would reduce an individual's return. To obtain the Fund’s most recent month-end performance, visit seafarerfunds.com or call (855) 732-9220.
| 1 | Inception Date: May 31, 2016. |
| 2 | Ratios as of Prospectus dated August 31, 2020. Seafarer Capital Partners, LLC has agreed contractually to waive and/or reimburse fees or expenses in order to limit Total Annual Fund Operating Expenses After Fee Waiver/Expense Reimbursements (inclusive of acquired fund fees and expenses, and exclusive of brokerage expenses, interest expenses, taxes and extraordinary expenses) to 1.15% and 1.05% of the Fund’s average daily net assets for the Investor and Institutional share classes, respectively. This agreement is in effect through August 31, 2021. |
| 3 | The MSCI Emerging Markets Total Return Index, Standard (Large+Mid Cap) Core, Gross (dividends reinvested), USD is a free float-adjusted market capitalization index designed to measure equity market performance of emerging markets. Index code: GDUEEGF. The index is not actively managed and does not reflect any deductions for fees, expense or taxes. An investor may not invest directly in an index. |
| 4 | The Morningstar Emerging Markets Net Return USD Index measures the performance of emerging markets targeting the top 97% of stocks by market capitalization. The index does not incorporate Morningstar’s environmental, social, or governance (ESG) criteria. Index code: MEMMN. The index is not actively managed and does not reflect any deductions for fees, expense or taxes. An investor may not invest directly in an index. |
| Annual Report – April 30, 2021 | 13 |
| Seafarer Overseas Value Fund | Performance Review |
April 30, 2021
Performance of a $10,000 Investment Since Inception

| * | Inception Date: May 31, 2016. |
The chart shown above represents historical performance of a hypothetical investment of $10,000 in the Fund’s Investor Class shares for the period from inception to April 30, 2021. All returns reflect reinvested dividends and/or distributions, but do not reflect the deduction of taxes that an investor would pay on distributions or redemptions.
The Fund also offers Institutional Class shares, performance of which is not reflected in the chart above. The performance of Institutional Class shares may be higher or lower than the performance of the Investor Class shares shown above based upon differences in fees paid by shareholders investing in the Investor Class shares and Institutional Class shares.
Investment Objective
The Seafarer Overseas Value Fund seeks to provide long-term capital appreciation.
Strategy
The Fund invests primarily in the securities of companies located in developing countries. The Fund invests in several asset classes including common stocks, preferred stocks, and fixed-income securities.
The Fund’s portfolio is comprised of securities identified through a bottom-up security selection process based on fundamental research. The Fund seeks to produce a minimum long-term rate of return by investing in securities priced at a discount to their intrinsic value.
| 14 | (855) 732-9220 seafarerfunds.com |
Seafarer Overseas Value Fund | Performance Review |
| April 30, 2021 |
Portfolio Composition by Region | % Net Assets |
East & South Asia | 63.6% |
Emerging Europe | 9.5% |
Latin America | 7.7% |
Middle East & Africa | 10.0% |
Other | 4.1% |
Cash & Other Assets, Less Liabilities | 5.1% |
Total | 100.0% |
Portfolio Composition by Sector | % Net Assets |
Communication Services | 5.5% |
Consumer Discretionary | 12.3% |
Consumer Staples | 15.8% |
Energy | 7.7% |
Financials | 17.8% |
Industrials | 20.0% |
Information Technology | 3.5% |
Materials | 9.6% |
Utilities | 2.7% |
Cash & Other Assets, Less Liabilities | 5.1% |
Total | 100.0% |
Top 10 Holdings | % Net Assets |
National Central Cooling Co. PJSC | 5.4% |
First Pacific Co., Ltd. | 5.1% |
Wilmar International, Ltd. | 4.7% |
Moneta Money Bank AS | 4.6% |
Pacific Basin Shipping, Ltd. | 4.6% |
Qatar Gas Transport Co., Ltd. | 4.6% |
Mondi PLC | 4.1% |
China Foods, Ltd. | 4.0% |
Georgia Capital PLC | 3.9% |
Shangri-La Asia, Ltd. | 3.8% |
Total | 44.8% |
Total Number of Holdings | 29 |
Holdings are subject to change, and may not reflect the current or future position of the portfolio.
Source: ALPS Fund Services, Inc.
Annual Report – April 30, 2021 | 15 |
Seafarer Funds | Disclosure of Fund Expenses |
| April 30, 2021 (Unaudited) |
DISCLOSURE OF FUND EXPENSES
As a shareholder of a Fund you will incur two types of costs: (1) transaction costs; and (2) ongoing costs, including management fees and other Fund expenses. The following examples are intended to help you understand your ongoing costs (in dollars) of investing in a Fund and to compare these costs with the ongoing costs of investing in other mutual funds. The examples are based on an investment of $1,000 invested on November 1, 2020 and held until April 30, 2021.
Actual Expenses. For each Fund and share class, the first line of the following table provides information about actual account values and actual expenses. You may use the information in this line, together with the amount you invested, to estimate the expenses that you paid over the period. Simply divide your account value by $1,000 (for example, an $8,600 account value divided by $1,000 = 8.6), then multiply the result by the number in the first line under the heading “Expenses Paid During Period” to estimate the expenses you paid on your account during this period.
Hypothetical Example for Comparison Purposes. For each Fund and share class, the second line of the following table provides information about hypothetical account values and hypothetical expenses based on the Fund’s actual expense ratio and an assumed rate of return of 5% per year before expenses, which is not the Fund’s actual return. The hypothetical account values and expenses may not be used to estimate the actual ending account balance or expenses you paid for the period. You may use this information to compare the ongoing costs of investing in the Fund and other mutual funds. To do so, compare this 5% hypothetical example with the 5% hypothetical examples that appear in the shareholder reports of the other mutual funds.
Please note the expenses shown in the following table are meant to highlight your ongoing costs only and do not reflect transaction costs. Therefore, for each Fund and share class, the second line of the following table is useful in comparing ongoing costs only, and will not help you determine the relative total costs of owning different funds. In addition, if these transactional costs were included, your costs would have been higher.
16 | (855) 732-9220 seafarerfunds.com |
Seafarer Funds | Disclosure of Fund Expenses |
| April 30, 2021 (Unaudited) |
| Beginning Account Value 11/01/20 | Ending Account Value 04/30/21 | Expense Ratio(a) | Expenses Paid During Period 11/01/20 - 04/30/21(b) | |
| SEAFARER OVERSEAS GROWTH AND INCOME FUND | ||||
| Investor Class | ||||
| Actual | $1,000.00 | $1,266.30 | 1.01% | $5.68 |
| Hypothetical (5% return before expenses) | $1,000.00 | $1,019.79 | 1.01% | $5.06 |
| Institutional Class | ||||
| Actual | $1,000.00 | $1,266.20 | 0.90% | $5.06 |
| Hypothetical (5% return before expenses) | $1,000.00 | $1,020.33 | 0.90% | $4.51 |
| SEAFARER OVERSEAS VALUE FUND | ||||
| Investor Class | ||||
| Actual | $1,000.00 | $1,284.70 | 1.15% | $6.51 |
| Hypothetical (5% return before expenses) | $1,000.00 | $1,019.09 | 1.15% | $5.76 |
| Institutional Class | ||||
| Actual | $1,000.00 | $1,285.10 | 1.05% | $5.95 |
| Hypothetical (5% return before expenses) | $1,000.00 | $1,019.59 | 1.05% | $5.26 |
(a) | Annualized, based on the Fund’s most recent fiscal half year expenses. |
(b) | Expenses are equal to the Fund’s annualized expense ratio multiplied by the average account value over the period, multiplied by the number of days in the most recent fiscal half-year (181)/365 (to reflect the half-year period). |
Annual Report – April 30, 2021 | 17 |
Seafarer Overseas Growth and Income Fund | Portfolio of Investments |
| April 30, 2021 |
| Currency | Shares | Value | ||||||||
| COMMON STOCKS (91.2%) | ||||||||||
| Brazil (6.0%) | ||||||||||
| Ambev SA, ADR | USD | 18,100,000 | $ | 50,318,000 | ||||||
| Itau Unibanco Holding SA, ADR | USD | 10,600,000 | 53,000,000 | |||||||
| Odontoprev SA | BRL | 8,872,300 | 20,955,552 | |||||||
| Total Brazil | 124,273,552 | |||||||||
| China / Hong Kong (24.1%) | ||||||||||
| China Foods, Ltd. | HKD | 90,314,000 | 37,601,749 | |||||||
China Literature, Ltd.(a) | HKD | 8,500,000 | 88,524,601 | |||||||
| First Pacific Co., Ltd. | HKD | 92,000,000 | 31,533,660 | |||||||
| Greatview Aseptic Packaging Co., Ltd. | HKD | 35,000,000 | 17,292,791 | |||||||
| Jardine Matheson Holdings, Ltd. | USD | 657,700 | 44,164,015 | |||||||
| Jiangsu Hengrui Medicine Co., Ltd., Class A | CNY | 2,499,975 | 32,383,183 | |||||||
| Pacific Basin Shipping, Ltd. | HKD | 120,000,000 | 42,049,165 | |||||||
| Pico Far East Holdings, Ltd. | HKD | 53,296,000 | 9,392,515 | |||||||
| Ping An Insurance Group Co. of China, Ltd. | HKD | 6,625,000 | 72,227,564 | |||||||
Shangri-La Asia, Ltd.(a) | HKD | 38,000,000 | 36,174,982 | |||||||
| Shenzhou International Group Holdings, Ltd. | HKD | 1,150,000 | 25,298,845 | |||||||
| WH Group, Ltd. | HKD | 42,200,000 | 36,768,938 | |||||||
| Xinhua Winshare Publishing and Media Co., Ltd., Class H | HKD | 30,002,000 | 21,297,335 | |||||||
| Total China / Hong Kong | 494,709,343 | |||||||||
| Czech Republic (3.4%) | ||||||||||
| Avast PLC | GBP | 5,375,000 | 35,460,436 | |||||||
Moneta Money Bank AS(a) | CZK | 9,062,815 | 33,657,581 | |||||||
| Total Czech Republic | 69,118,017 | |||||||||
| Hungary (3.8%) | ||||||||||
| Richter Gedeon Nyrt | HUF | 2,721,756 | 77,843,816 | |||||||
| Total Hungary | 77,843,816 | |||||||||
| India (1.2%) | ||||||||||
| Infosys, Ltd., Sponsored ADR | USD | 1,400,000 | 25,312,000 | |||||||
| Total India | 25,312,000 | |||||||||
18 | (855) 732-9220 seafarerfunds.com |
Seafarer Overseas Growth and Income Fund | Portfolio of Investments |
| April 30, 2021 |
| Currency | Shares | Value | ||||||||
| Japan (3.6%) | ||||||||||
| Rohm Co., Ltd. | JPY | 750,000 | $ | 74,034,525 | ||||||
| Total Japan | 74,034,525 | |||||||||
| Mexico (1.4%) | ||||||||||
| Bolsa Mexicana de Valores SAB de CV | MXN | 11,000,000 | 24,474,009 | |||||||
Credito Real SAB de CV SOFOM ER(a) | MXN | 9,920,072 | 4,505,339 | |||||||
| Total Mexico | 28,979,348 | |||||||||
| Qatar (1.6%) | ||||||||||
| Qatar Gas Transport Co., Ltd. | QAR | 37,613,950 | 32,552,245 | |||||||
| Total Qatar | 32,552,245 | |||||||||
| Singapore (6.2%) | ||||||||||
| Venture Corp., Ltd. | SGD | 5,150,000 | 77,706,254 | |||||||
| Wilmar International, Ltd. | SGD | 12,800,000 | 50,094,405 | |||||||
| Total Singapore | 127,800,659 | |||||||||
| South Africa (3.9%) | ||||||||||
| Sanlam, Ltd. | ZAR | 20,500,000 | 79,145,353 | |||||||
| Total South Africa | 79,145,353 | |||||||||
| South Korea (23.9%) | ||||||||||
| Coway Co., Ltd. | KRW | 1,050,000 | 62,919,704 | |||||||
| Hyundai Mobis Co., Ltd. | KRW | 405,000 | 98,021,307 | |||||||
| Innocean Worldwide, Inc. | KRW | 540,000 | 29,075,487 | |||||||
| Koh Young Technology, Inc. | KRW | 715,000 | 17,811,968 | |||||||
| NAVER Corp. | KRW | 75,000 | 24,151,654 | |||||||
| Orion Corp. | KRW | 525,000 | 55,147,187 | |||||||
Samsung Biologics Co., Ltd.(a) | KRW | 77,259 | 55,526,850 | |||||||
| Samsung C&T Corp. | KRW | 539,500 | 65,654,204 | |||||||
| Samsung SDI Co., Ltd. | KRW | 126,000 | 73,543,742 | |||||||
Sindoh Co., Ltd.(a) | KRW | 362,500 | 10,423,233 | |||||||
| Total South Korea | 492,275,336 | |||||||||
| Taiwan (4.6%) | ||||||||||
| Accton Technology Corp. | TWD | 5,750,000 | 65,107,757 | |||||||
Annual Report – April 30, 2021 | 19 |
Seafarer Overseas Growth and Income Fund | Portfolio of Investments |
| April 30, 2021 |
| Currency | Shares | Value | ||||||||
| Taiwan (continued) | ||||||||||
| Bizlink Holding, Inc. | TWD | 3,250,000 | $ | 30,077,367 | ||||||
| Total Taiwan | 95,185,124 | |||||||||
| Thailand (1.4%) | ||||||||||
| Bangkok Dusit Medical Services PCL, Class F | THB | 40,000,000 | 27,860,058 | |||||||
| Total Thailand | 27,860,058 | |||||||||
| United Arab Emirates (1.8%) | ||||||||||
| National Central Cooling Co. PJSC | AED | 47,022,222 | 36,996,644 | |||||||
| Total United Arab Emirates | 36,996,644 | |||||||||
| United Kingdom (2.5%) | ||||||||||
| Mondi PLC | GBP | 1,900,000 | 51,572,871 | |||||||
| Total United Kingdom | 51,572,871 | |||||||||
| Vietnam (1.8%) | ||||||||||
| PetroVietnam Gas JSC | VND | 10,250,000 | 36,922,091 | |||||||
| Total Vietnam | 36,922,091 | |||||||||
| TOTAL COMMON STOCKS | ||||||||||
| (Cost $1,635,950,891) | 1,874,580,982 | |||||||||
| PREFERRED STOCKS (4.7%) | ||||||||||
| South Korea (4.7%) | ||||||||||
| Samsung C&T Corp. | KRW | 61,245 | 7,346,958 | |||||||
| Samsung Electronics Co., Ltd. | KRW | 1,375,000 | 90,274,811 | |||||||
| Total South Korea | 97,621,769 | |||||||||
| TOTAL PREFERRED STOCKS | ||||||||||
| (Cost $47,947,181) | 97,621,769 | |||||||||
| TOTAL INVESTMENTS | ||||||||||
| (Cost $1,683,898,072) (95.9%) | $ | 1,972,202,751 | ||||||||
| Cash and Other Assets, Less Liabilities (4.1%) | 84,111,898 | |||||||||
| NET ASSETS (100.0%) | $ | 2,056,314,649 | ||||||||
20 | (855) 732-9220 seafarerfunds.com |
Seafarer Overseas Growth and Income Fund | Portfolio of Investments |
| April 30, 2021 |
Principal Amount is stated in local currency unless otherwise noted.
| (a) | Non-income producing security. |
Currency Abbreviations | ||
AED | - | United Arab Emirates Dirham |
BRL | - | Brazil Real |
CNY | - | China Yuan |
CZK | - | Czech Republic Koruna |
HKD | - | Hong Kong Dollar |
HUF | - | Hungary Forint |
GBP | - | United Kingdom Pound |
JPY | - | Japan Yen |
KRW | - | South Korea Won |
MXN | - | Mexico Peso |
QAR | - | Qatar Riyal |
SGD | - | Singapore Dollar |
THB | - | Thailand Baht |
TWD | - | Taiwan New Dollar |
USD | - | United States Dollar |
VND | - | Vietnam Dong |
ZAR | - | South Africa Rand |
For Fund compliance purposes, the Fund’s geographical classifications refer to any one or more of the sub-classifications used by one or more widely recognized market indexes or ratings group indexes, and/or as defined by Fund management. This definition may not apply for purposes of this report, which may combine sub-classifications for reporting ease. Geographical regions are shown as a percentage of net assets.
Annual Report – April 30, 2021 | 21 |
Seafarer Overseas Growth and Income Fund | Portfolio of Investments |
| April 30, 2021 |
Industry Composition |
|
Insurance | 7.4% |
Electronic Equipment, Instruments & Components | 7.1% |
Food Products | 6.9% |
Media | 6.2% |
Industrial Conglomerates | 5.7% |
Pharmaceuticals | 5.4% |
Technology Hardware, Storage & Peripherals | 4.9% |
Auto Components | 4.8% |
Semiconductors & Semiconductor Equipment | 4.5% |
Beverages | 4.3% |
Banks | 4.2% |
Communications Equipment | 3.2% |
Household Durables | 3.1% |
Life Sciences Tools & Services | 2.7% |
Paper & Forest Products | 2.5% |
Health Care Providers & Services | 2.4% |
Marine | 2.0% |
Building Products | 1.8% |
Gas Utilities | 1.8% |
Hotels, Restaurants & Leisure | 1.8% |
Software | 1.7% |
Oil, Gas & Consumable Fuels | 1.6% |
Diversified Financial Services | 1.5% |
Electrical Equipment | 1.5% |
Textiles, Apparel & Luxury Goods | 1.2% |
IT Services | 1.2% |
Capital Markets | 1.2% |
Interactive Media & Services | 1.2% |
Distributors | 1.0% |
Other Industries (each less than 1%) | 1.1% |
Cash and Other Assets, Less Liabilities | 4.1% |
Total | 100% |
See accompanying Notes to Financial Statements.
22 | (855) 732-9220 seafarerfunds.com |
| Seafarer Overseas Value Fund | Portfolio of Investments |
April 30, 2021
| Currency | Shares | Value | ||||||||
| COMMON STOCKS (94.5%) | ||||||||||
| Brazil (6.9%) | ||||||||||
| Ambev SA, ADR | USD | 428,000 | $ | 1,189,840 | ||||||
| Itau Unibanco Holding SA, ADR | USD | 246,000 | 1,230,000 | |||||||
| Total Brazil | 2,419,840 | |||||||||
| China / Hong Kong (37.4%) | ||||||||||
| China Foods, Ltd. | HKD | 3,391,000 | 1,411,825 | |||||||
| China Yangtze Power Co., Ltd., Class A | CNY | 301,990 | 930,841 | |||||||
| First Pacific Co., Ltd. | HKD | 5,190,000 | 1,778,909 | |||||||
| Giordano International, Ltd. | HKD | 5,200,000 | 1,042,546 | |||||||
| Greatview Aseptic Packaging Co., Ltd. | HKD | 2,000,000 | 988,160 | |||||||
| Jardine Matheson Holdings, Ltd. | USD | 12,100 | 812,505 | |||||||
| Melco International Development, Ltd. | HKD | 549,000 | 1,088,897 | |||||||
| Pacific Basin Shipping, Ltd. | HKD | 4,600,000 | 1,611,885 | |||||||
| Pico Far East Holdings, Ltd. | HKD | 4,538,000 | 799,745 | |||||||
| Shangri-La Asia, Ltd.(a) | HKD | 1,420,000 | 1,351,801 | |||||||
| WH Group, Ltd. | HKD | 1,508,000 | 1,313,923 | |||||||
| Total China / Hong Kong | 13,131,037 | |||||||||
| Czech Republic (4.6%) | ||||||||||
| Moneta Money Bank AS(a) | CZK | 433,257 | 1,609,035 | |||||||
| Total Czech Republic | 1,609,035 | |||||||||
| Georgia (3.9%) | ||||||||||
| Georgia Capital PLC(a) | GBP | 174,174 | 1,354,251 | |||||||
| Total Georgia | 1,354,251 | |||||||||
| Mexico (0.8%) | ||||||||||
| Credito Real SAB de CV SOFOM ER(a) | MXN | 590,385 | 268,132 | |||||||
| Total Mexico | 268,132 | |||||||||
| Qatar (4.6%) | ||||||||||
| Qatar Gas Transport Co., Ltd. | QAR | 1,860,000 | 1,609,700 | |||||||
| Total Qatar | 1,609,700 | |||||||||
| Annual Report – April 30, 2021 | 23 |
| Seafarer Overseas Value Fund | Portfolio of Investments |
April 30, 2021
| Currency | Shares | Value | ||||||||
| Russia (1.0%) | ||||||||||
| Global Ports Investments PLC, GDR(a) | USD | 100,000 | $ | 362,649 | ||||||
| Total Russia | 362,649 | |||||||||
| Singapore (10.6%) | ||||||||||
| Genting Singapore, Ltd. | SGD | 1,300,000 | 843,115 | |||||||
| HRnetgroup, Ltd. | SGD | 2,500,000 | 1,220,564 | |||||||
| Wilmar International, Ltd. | SGD | 422,000 | 1,651,550 | |||||||
| Total Singapore | �� | 3,715,229 | ||||||||
| South Korea (9.4%) | ||||||||||
| Innocean Worldwide, Inc. | KRW | 21,000 | 1,130,713 | |||||||
| Samsung C&T Corp. | KRW | 7,910 | 962,604 | |||||||
| Samsung SDI Co., Ltd. | KRW | 2,100 | 1,225,729 | |||||||
| Total South Korea | 3,319,046 | |||||||||
| United Arab Emirates (5.4%) | ||||||||||
| National Central Cooling Co. PJSC | AED | 2,420,622 | 1,904,523 | |||||||
| Total United Arab Emirates | 1,904,523 | |||||||||
| United Kingdom (4.1%) | ||||||||||
| Mondi PLC | GBP | 53,600 | 1,454,898 | |||||||
| Total United Kingdom | 1,454,898 | |||||||||
| Vietnam (5.8%) | ||||||||||
| Petrovietnam Fertilizer & Chemicals JSC | VND | 1,158,000 | 954,965 | |||||||
| PetroVietnam Technical Services Corp. | VND | 1,263,780 | 1,091,697 | |||||||
| Total Vietnam | 2,046,662 | |||||||||
| TOTAL COMMON STOCKS | ||||||||||
| (Cost $30,263,271) | 33,195,002 | |||||||||
| 24 | (855) 732-9220 seafarerfunds.com |
| Seafarer Overseas Value Fund | Portfolio of Investments |
April 30, 2021
| Currency | Shares | Value | ||||||||
| PREFERRED STOCKS (0.4%) | ||||||||||
| South Korea (0.4%) | ||||||||||
| Samsung C&T Corp. | KRW | 1,296 | $ | 155,468 | ||||||
| Total South Korea | 155,468 | |||||||||
| TOTAL PREFERRED STOCKS | ||||||||||
| (Cost $140,136) | 155,468 | |||||||||
| TOTAL INVESTMENTS | ||||||||||
| (Cost $30,403,407) (94.9%) | $ | 33,350,470 | ||||||||
| Cash and Other Assets, Less Liabilities (5.1%) | 1,795,265 | |||||||||
| NET ASSETS (100.0%) | $ | 35,145,735 | ||||||||
Principal Amount is stated in local currency unless otherwise noted.
| (a) | Non-income producing security. |
| Currency Abbreviations | ||
| AED | - | United Arab Emirates Dirham |
| CNY | - | China Yuan |
| CZK | - | Czech Republic Koruna |
| GBP | - | United Kingdom Pound |
| HKD | - | Hong Kong Dollar |
| KRW | - | South Korea Won |
| MXN | - | Mexico Peso |
| QAR | - | Qatar Riyal |
| SGD | - | Singapore Dollar |
| USD | - | United States Dollar |
| VND | - | Vietnam Dong |
For Fund compliance purposes, the Fund's geographical classifications refer to any one or more of the sub-classifications used by one or more widely recognized market indexes or ratings group indexes, and/or as defined by Fund management. This definition may not apply for purposes of this report, which may combine sub-classifications for reporting ease. Geographical regions are shown as a percentage of net assets.
| Annual Report – April 30, 2021 | 25 |
| Seafarer Overseas Value Fund | Portfolio of Investments |
April 30, 2021
| Industry Composition | |
| Hotels, Restaurants & Leisure | 9.3% |
| Food Products | 8.4% |
| Banks | 8.1% |
| Beverages | 7.4% |
| Media | 5.5% |
| Industrial Conglomerates | 5.5% |
| Building Products | 5.4% |
| Diversified Financial Services | 5.1% |
| Marine | 4.6% |
| Oil, Gas & Consumable Fuels | 4.6% |
| Paper & Forest Products | 4.1% |
| Capital Markets | 3.9% |
| Electronic Equipment, Instruments & Components | 3.5% |
| Professional Services | 3.5% |
| Energy Equipment & Services | 3.1% |
| Specialty Retail | 3.0% |
| Containers & Packaging | 2.8% |
| Chemicals | 2.7% |
| Independent Power and Renewable Electricity Producers | 2.6% |
| Transportation Infrastructure | 1.0% |
| Other Industries (each less than 1%) | 0.8% |
| Cash and Other Assets, Less Liabilities | 5.1% |
| Total | 100% |
See accompanying Notes to Financial Statements.
| 26 | (855) 732-9220 seafarerfunds.com |
| Seafarer Funds | Statements of Assets and Liabilities |
April 30, 2021
| Seafarer Overseas Growth and Income Fund | Seafarer Overseas Value Fund | |||||||
| ASSETS: | ||||||||
| Investments, at value | $ | 1,972,202,751 | $ | 33,350,470 | ||||
| Cash | 81,279,964 | 1,688,401 | ||||||
| Foreign currency, at value (Cost $1,251,293 and $37,069) | 1,255,097 | 37,069 | ||||||
| Receivable for investments sold | 2,226,415 | – | ||||||
| Receivable for shares sold | 1,004,888 | – | ||||||
| Interest and dividends receivable | 5,714,492 | 157,590 | ||||||
| Prepaid expenses and other assets | 21,011 | 130 | ||||||
| Total Assets | 2,063,704,618 | 35,233,660 | ||||||
| LIABILITIES: | ||||||||
| Payable for investments purchased | 4,141,983 | – | ||||||
| Administrative fees payable | 129,899 | 14,425 | ||||||
| Shareholder service plan fees payable | 234,436 | 2,741 | ||||||
| Payable for shares redeemed | 1,147,175 | – | ||||||
| Investment advisory fees payable | 1,238,742 | 12,484 | ||||||
| Payable for chief compliance officer fees | 6,330 | 6,330 | ||||||
| Trustee fees and expenses payable | 51,531 | 936 | ||||||
| Payable for principal financial officer fees | 1,923 | 1,923 | ||||||
| Audit and tax fees payable | 40,174 | 24,034 | ||||||
| Accrued expenses and other liabilities | 397,776 | 25,052 | ||||||
| Total Liabilities | 7,389,969 | 87,925 | ||||||
| NET ASSETS | $ | 2,056,314,649 | $ | 35,145,735 | ||||
| NET ASSETS CONSIST OF: | ||||||||
| Paid-in capital (Note 5) | $ | 1,652,653,554 | $ | 32,512,309 | ||||
| Total distributable earnings | 403,661,095 | 2,633,426 | ||||||
| NET ASSETS | $ | 2,056,314,649 | $ | 35,145,735 | ||||
| INVESTMENTS, AT COST | $ | 1,683,898,072 | $ | 30,403,407 | ||||
| PRICING OF SHARES | ||||||||
| Investor Class: | ||||||||
| Net Asset Value, offering and redemption price per share | $ | 15.31 | $ | 13.16 | ||||
| Net Assets | $ | 228,690,175 | $ | 431,279 | ||||
| Shares of beneficial interest outstanding | 14,936,642 | 32,781 | ||||||
| Institutional Class: | ||||||||
| Net Asset Value, offering and redemption price per share | $ | 15.39 | $ | 13.18 | ||||
| Net Assets | $ | 1,827,624,474 | $ | 34,714,456 | ||||
| Shares of beneficial interest outstanding | 118,761,991 | 2,633,200 | ||||||
See accompanying Notes to Financial Statements.
| Annual Report – April 30, 2021 | 27 |
| Seafarer Funds | Statements of Operations |
Year Ended April 30, 2021
| Seafarer Overseas Growth and Income Fund | Seafarer Overseas Value Fund | |||||||
| INVESTMENT INCOME: | ||||||||
| Dividends | $ | 41,435,155 | $ | 981,527 | ||||
| Foreign taxes withheld | (3,108,211 | ) | (16,355 | ) | ||||
| Interest and other income | 4,681 | – | ||||||
| Total investment income | 38,331,625 | 965,172 | ||||||
| EXPENSES: | ||||||||
| Investment advisory fees (Note 6) | 11,945,890 | 222,106 | ||||||
| Administrative and transfer agency fees | 561,568 | 59,335 | ||||||
| Trustee fees and expenses | 93,658 | 1,699 | ||||||
| Registration/filing fees | 37,050 | 34,780 | ||||||
| Shareholder service plan fees | ||||||||
| Investor Class | 280,342 | – | ||||||
| Institutional Class | 637,982 | 11,733 | ||||||
| Recoupment of previously waived fees | ||||||||
| Investor Class | – | 72 | ||||||
| Institutional Class | – | – | ||||||
| Legal fees | 31,109 | 610 | ||||||
| Audit and tax fees | 42,288 | 26,606 | ||||||
| Reports to shareholders and printing fees | 71,110 | 1,009 | ||||||
| Custody fees | 1,087,103 | 42,033 | ||||||
| Chief compliance officer fees | 25,219 | 25,219 | ||||||
| Principal financial officer fees | 7,660 | 7,660 | ||||||
| Insurance expense | 22,031 | 479 | ||||||
| Miscellaneous | 57,157 | 16,390 | ||||||
| Total expenses | 14,900,167 | 449,731 | ||||||
| Less fees waived/reimbursed by investment adviser (Note 6) | ||||||||
| Investor Class | – | (1,259 | ) | |||||
| Institutional Class | – | (134,851 | ) | |||||
| Total net expenses | 14,900,167 | 313,621 | ||||||
| NET INVESTMENT INCOME: | 23,431,458 | 651,551 | ||||||
| Net realized gain on investments | 239,726,545 | 529,645 | ||||||
| Net realized loss on foreign currency transactions | (602,064 | ) | (9,703 | ) | ||||
| Net realized gain | 239,124,481 | 519,942 | ||||||
| Net change in unrealized appreciation on investments | 375,333,331 | 8,929,485 | ||||||
| Net change in unrealized appreciation/(depreciation) on translation of assets and liabilities in foreign currency transactions | (9,095 | ) | 1,011 | |||||
| Net unrealized appreciation | 375,324,236 | 8,930,496 | ||||||
| NET REALIZED AND UNREALIZED GAIN ON INVESTMENTS AND FOREIGN CURRENCY TRANSLATIONS | 614,448,717 | 9,450,438 | ||||||
| NET INCREASE IN NET ASSETS RESULTING FROM OPERATIONS | $ | 637,880,175 | $ | 10,101,989 | ||||
See accompanying Notes to Financial Statements.
| 28 | (855) 732-9220 seafarerfunds.com |
| Seafarer Overseas Growth and Income Fund | Statements of Changes in Net Assets |
| Year Ended April 30, 2021 | Year Ended April 30, 2020 | |||||||
| OPERATIONS: | ||||||||
| Net investment income | $ | 23,431,458 | $ | 28,276,405 | ||||
| Net realized gain/(loss) | 239,124,481 | (32,639,922 | ) | |||||
| Net change in unrealized appreciation/(depreciation) | 375,324,236 | (125,061,552 | ) | |||||
| Net increase/(decrease) in net assets resulting from operations | 637,880,175 | (129,425,069 | ) | |||||
| DISTRIBUTIONS TO SHAREHOLDERS (NOTE 3): | ||||||||
| Total amount of distribution | ||||||||
| Investor Class | (4,680,063 | ) | (5,408,005 | ) | ||||
| Institutional Class | (34,813,314 | ) | (35,937,028 | ) | ||||
| Net decrease in net assets from distributions | (39,493,377 | ) | (41,345,033 | ) | ||||
| BENEFICIAL INTEREST TRANSACTIONS (NOTE 5): | ||||||||
| Shares sold | ||||||||
| Investor Class | 38,474,164 | 22,164,876 | ||||||
| Institutional Class | 464,212,754 | 325,774,608 | ||||||
| Dividends reinvested | ||||||||
| Investor Class | 4,604,440 | 5,308,481 | ||||||
| Institutional Class | 25,200,873 | 26,911,893 | ||||||
| Shares redeemed | ||||||||
| Investor Class | (40,379,453 | ) | (83,481,230 | ) | ||||
| Institutional Class | (289,743,396 | ) | (407,913,072 | ) | ||||
| Net increase/(decrease) in net assets derived from beneficial interest transactions | 202,369,382 | (111,234,444 | ) | |||||
| Net increase/(decrease) in net assets | 800,756,180 | (282,004,546 | ) | |||||
| NET ASSETS: | ||||||||
| Beginning of period | 1,255,558,469 | 1,537,563,015 | ||||||
| End of period | $ | 2,056,314,649 | $ | 1,255,558,469 | ||||
| Other Information: | ||||||||
| SHARE TRANSACTIONS: | ||||||||
| Investor Class | ||||||||
| Sold | 2,871,389 | 2,037,998 | ||||||
| Distributions reinvested | 345,067 | 459,978 | ||||||
| Redeemed | (3,215,757 | ) | (7,725,123 | ) | ||||
| Net increase/(decrease) in shares outstanding | 699 | (5,227,147 | ) | |||||
| Institutional Class | ||||||||
| Sold | 33,422,168 | 29,550,598 | ||||||
| Distributions reinvested | 1,872,812 | 2,321,132 | ||||||
| Redeemed | (22,867,042 | ) | (37,912,324 | ) | ||||
| Net increase/(decrease) in shares outstanding | 12,427,938 | (6,040,594 | ) | |||||
See accompanying Notes to Financial Statements.
| Annual Report – April 30, 2021 | 29 |
| Seafarer Overseas Value Fund | Statements of Changes in Net Assets |
| Year Ended April 30, 2021 | Year Ended April 30, 2020 | |||||||
| OPERATIONS: | ||||||||
| Net investment income | $ | 651,551 | $ | 926,206 | ||||
| Net realized gain/(loss) | 519,942 | (498,896 | ) | |||||
| Net change in unrealized appreciation/(depreciation) | 8,930,496 | (6,055,128 | ) | |||||
| Net increase/(decrease) in net assets resulting from operations | 10,101,989 | (5,627,818 | ) | |||||
| DISTRIBUTIONS TO SHAREHOLDERS (NOTE 3): | ||||||||
| Total amount of distribution | ||||||||
| Investor Class | (5,163 | ) | (10,203 | ) | ||||
| Institutional Class | (422,933 | ) | (1,187,165 | ) | ||||
| Net decrease in net assets from distributions | (428,096 | ) | (1,197,368 | ) | ||||
| BENEFICIAL INTEREST TRANSACTIONS (NOTE 5): | ||||||||
| Shares sold | ||||||||
| Investor Class | 79,650 | 76,836 | ||||||
| Institutional Class | 5,691,263 | 18,676,589 | ||||||
| Dividends reinvested | ||||||||
| Investor Class | 4,809 | 9,407 | ||||||
| Institutional Class | 417,800 | 1,179,600 | ||||||
| Shares redeemed | ||||||||
| Investor Class | (49,983 | ) | (77,747 | ) | ||||
| Institutional Class | (10,506,690 | ) | (12,380,590 | ) | ||||
| Net increase/(decrease) in net assets derived from beneficial interest transactions | (4,363,151 | ) | 7,484,095 | |||||
| Net increase in net assets | 5,310,742 | 658,909 | ||||||
| NET ASSETS: | ||||||||
| Beginning of period | 29,834,993 | 29,176,084 | ||||||
| End of period | $ | 35,145,735 | $ | 29,834,993 | ||||
| Other Information: | ||||||||
| SHARE TRANSACTIONS: | ||||||||
| Investor Class | ||||||||
| Sold | 7,441 | 7,196 | ||||||
| Distributions reinvested | 401 | 805 | ||||||
| Redeemed | (4,480 | ) | (7,208 | ) | ||||
| Net increase in shares outstanding | 3,362 | 793 | ||||||
| Institutional Class | ||||||||
| Sold | 481,808 | 1,670,988 | ||||||
| Distributions reinvested | 34,759 | 100,907 | ||||||
| Redeemed | (1,002,045 | ) | (1,177,965 | ) | ||||
| Net increase/(decrease) in shares outstanding | (485,478 | ) | 593,930 | |||||
See accompanying Notes to Financial Statements.
| 30 | (855) 732-9220 seafarerfunds.com |
Page Intentionally Left Blank
Seafarer Overseas Growth and Income Fund
| Investor Class |
| NET ASSET VALUE, BEGINNING OF PERIOD |
| INCOME FROM OPERATIONS: |
| Net investment income(a) |
| Net realized and unrealized gain/(loss) on investments |
| Total from investment operations |
| LESS DISTRIBUTIONS: |
| From net investment income |
| From net realized gains on investments |
| Total distributions |
| REDEMPTION FEES ADDED TO PAID IN CAPITAL |
| NET INCREASE/(DECREASE) IN NET ASSET VALUE |
| NET ASSET VALUE, END OF PERIOD |
| TOTAL RETURN(d) |
| SUPPLEMENTAL DATA: |
| Net assets, end of period (in 000s) |
| RATIOS TO AVERAGE NET ASSETS: |
| Operating expenses excluding reimbursement/waiver |
| Operating expenses including reimbursement/waiver |
| Net investment income including reimbursement/waiver |
| PORTFOLIO TURNOVER RATE |
| (a) | Calculated using the average shares method. |
| (b) | Less than $0.005 per share. |
| (c) | In preparing the financial statements in accordance with U.S. GAAP, management made certain adjustments as required by U.S. GAAP which caused the net asset value for purposes of these financial statements to differ from the net asset value used to process shareholder transactions as of the date of these financial statements. As a result, the net asset value increased from $12.50 to $12.51. |
| (d) | Total returns are for the periods indicated and have not been annualized. Returns shown do not reflect the deduction of taxes that a shareholder would pay on Fund distributions or the redemption of Fund shares. |
| (e) | Includes adjustments in accordance with U.S. GAAP and as such, the total return for shareholder transactions reported to the market may differ from the total return for financial reporting purposes. As a result, the total return decreased from 8.12% to 8.03%. |
| (f) | Includes adjustments in accordance with U.S. GAAP and as such, the total return for shareholder transactions reported to the market may differ from the total return for financial reporting purposes. As a result, the total return increased from 11.13% to 11.22%. |
| 32 | (855) 732-9220 seafarerfunds.com |
| Financial Highlights |
| For a share outstanding through the years presented |
| Year Ended April 30, 2021 | Year Ended April 30, 2020 | Year Ended April 30, 2019 | Year Ended April 30, 2018 | Year Ended April 30, 2017 | ||||||||||||||
| $ | 10.31 | $ | 11.56 | $ | 13.11 | $ | 12.51 | $ | 11.44 | |||||||||
| 0.18 | 0.21 | 0.36 | 0.28 | 0.22 | ||||||||||||||
| 5.14 | (1.15 | ) | (1.02 | ) | 0.72 | 1.04 | ||||||||||||
| 5.32 | (0.94 | ) | (0.66 | ) | 1.00 | 1.26 | ||||||||||||
| (0.17 | ) | (0.31 | ) | (0.01 | ) | (0.37 | ) | (0.19 | ) | |||||||||
| (0.15 | ) | – | (0.88 | ) | (0.03 | ) | – | |||||||||||
| (0.32 | ) | (0.31 | ) | (0.89 | ) | (0.40 | ) | (0.19 | ) | |||||||||
| – | – | – | – | 0.00 | (b) | |||||||||||||
| 5.00 | (1.25 | ) | (1.55 | ) | 0.60 | 1.07 | ||||||||||||
| $ | 15.31 | $ | 10.31 | $ | 11.56 | $ | 13.11 | $ | 12.51 | (c) | ||||||||
| 52.15 | % | (8.44 | %) | (4.36 | %) | 8.03 | %(e) | 11.22 | %(f) | |||||||||
| $ | 228,690 | $ | 154,017 | $ | 233,072 | $ | 894,241 | $ | 877,384 | |||||||||
| 1.02 | % | 1.02 | % | 0.99 | % | 0.97 | % | 1.02 | % | |||||||||
| 1.02 | % | 1.02 | % | 0.99 | % | 0.97 | % | 1.02 | % | |||||||||
| 1.35 | % | 1.88 | % | 3.02 | % | 2.12 | % | 1.88 | % | |||||||||
| 47 | % | 29 | % | 52 | % | 23 | % | 14 | % | |||||||||
See accompanying Notes to Financial Statements.
| Annual Report – April 30, 2021 | 33 |
Seafarer Overseas Growth and Income Fund
| Institutional Class |
| NET ASSET VALUE, BEGINNING OF PERIOD |
| INCOME FROM OPERATIONS: |
| Net investment income(a) |
| Net realized and unrealized gain/(loss) on investments |
| Total from investment operations |
| LESS DISTRIBUTIONS: |
| From net investment income |
| From net realized gains on investments |
| Total distributions |
| REDEMPTION FEES ADDED TO PAID IN CAPITAL |
| NET INCREASE/(DECREASE) IN NET ASSET VALUE |
| NET ASSET VALUE, END OF PERIOD |
| TOTAL RETURN(c) |
| SUPPLEMENTAL DATA: |
| Net assets, end of period (in 000s) |
| RATIOS TO AVERAGE NET ASSETS: |
| Operating expenses excluding reimbursement/waiver |
| Operating expenses including reimbursement/waiver |
| Net investment income including reimbursement/waiver |
| PORTFOLIO TURNOVER RATE |
| (a) | Calculated using the average shares method. |
| (b) | Less than $0.005 per share. |
| (c) | Total returns are for the periods indicated and have not been annualized. Returns shown do not reflect the deduction of taxes that a shareholder would pay on Fund distributions or the redemption of Fund shares. |
| 34 | (855) 732-9220 seafarerfunds.com |
| Financial Highlights |
| For a share outstanding through the years presented |
| Year Ended April 30, 2021 | Year Ended April 30, 2020 | Year Ended April 30, 2019 | Year Ended April 30, 2018 | Year Ended April 30, 2017 | ||||||||||||||
| $ | 10.36 | $ | 11.61 | $ | 13.14 | $ | 12.54 | $ | 11.46 | |||||||||
| 0.20 | 0.22 | 0.29 | 0.28 | 0.21 | ||||||||||||||
| 5.16 | (1.16 | ) | (0.93 | ) | 0.73 | 1.07 | ||||||||||||
| 5.36 | (0.94 | ) | (0.64 | ) | 1.01 | 1.28 | ||||||||||||
| (0.18 | ) | (0.31 | ) | (0.01 | ) | (0.38 | ) | (0.20 | ) | |||||||||
| (0.15 | ) | – | (0.88 | ) | (0.03 | ) | – | |||||||||||
| (0.33 | ) | (0.31 | ) | (0.89 | ) | (0.41 | ) | (0.20 | ) | |||||||||
| 0.00 | (b) | – | – | – | 0.00 | (b) | ||||||||||||
| 5.03 | (1.25 | ) | (1.53 | ) | 0.60 | 1.08 | ||||||||||||
| $ | 15.39 | $ | 10.36 | $ | 11.61 | $ | 13.14 | $ | 12.54 | |||||||||
| 52.28 | % | (8.34 | %) | (4.17 | %) | 8.08 | % | 11.37 | % | |||||||||
| $ | 1,827,624 | $ | 1,101,542 | $ | 1,304,491 | $ | 2,134,051 | $ | 1,500,310 | |||||||||
| 0.92 | % | 0.92 | % | 0.90 | % | 0.87 | % | 0.92 | % | |||||||||
| 0.92 | % | 0.92 | % | 0.90 | % | 0.87 | % | 0.92 | % | |||||||||
| 1.47 | % | 1.91 | % | 2.45 | % | 2.09 | % | 1.82 | % | |||||||||
| 47 | % | 29 | % | 52 | % | 23 | % | 14 | % | |||||||||
See accompanying Notes to Financial Statements.
| Annual Report – April 30, 2021 | 35 |
Seafarer Overseas Value Fund
| Investor Class |
| NET ASSET VALUE, BEGINNING OF PERIOD |
| INCOME FROM OPERATIONS: |
| Net investment income(a) |
| Net realized and unrealized gain/(loss) on investments |
| Total from investment operations |
| LESS DISTRIBUTIONS: |
| From net investment income |
| From net realized gains on investments |
| Total distributions |
| NET INCREASE/(DECREASE) IN NET ASSET VALUE |
| NET ASSET VALUE, END OF PERIOD |
| TOTAL RETURN(b) |
| SUPPLEMENTAL DATA: |
| Net assets, end of period (in 000s) |
| RATIOS TO AVERAGE NET ASSETS: |
| Operating expenses excluding reimbursement/waiver |
| Operating expenses including reimbursement/waiver |
| Net investment income including reimbursement/waiver |
| PORTFOLIO TURNOVER RATE |
| (a) | Calculated using the average shares method. |
| (b) | Total returns are for the periods indicated and have not been annualized. In some periods, total returns would have been lower had certain expenses not been waived during the periods. Returns shown do not reflect the deduction of taxes that a shareholder would pay on Fund distributions or the redemption of Fund shares. |
| (c) | Annualized. |
| (d) | Portfolio turnover rate for a period less than one full year has not been annualized. |
| 36 | (855) 732-9220 seafarerfunds.com |
| Financial Highlights |
| For a share outstanding through the periods or years presented |
| Year Ended April 30, 2021 | Year Ended April 30, 2020 | Year Ended April 30, 2019 | Year Ended April 30, 2018 | May 31, 2016 (Inception) to April 30, 2017 | ||||||||||||||
| $ | 9.46 | $ | 11.41 | $ | 11.95 | $ | 11.30 | $ | 10.00 | |||||||||
| 0.22 | 0.29 | 0.29 | 0.35 | 0.12 | ||||||||||||||
| 3.64 | (1.88 | ) | (0.51 | ) | 0.72 | 1.28 | ||||||||||||
| 3.86 | (1.59 | ) | (0.22 | ) | 1.07 | 1.40 | ||||||||||||
| (0.16 | ) | (0.31 | ) | (0.29 | ) | (0.42 | ) | (0.10 | ) | |||||||||
| – | (0.05 | ) | (0.03 | ) | – | – | ||||||||||||
| (0.16 | ) | (0.36 | ) | (0.32 | ) | (0.42 | ) | (0.10 | ) | |||||||||
| 3.70 | (1.95 | ) | (0.54 | ) | 0.65 | 1.30 | ||||||||||||
| $ | 13.16 | $ | 9.46 | $ | 11.41 | $ | 11.95 | $ | 11.30 | |||||||||
| 40.96 | % | (14.54 | %) | (1.50 | %) | 9.55 | % | 14.15 | % | |||||||||
| $ | 431 | $ | 278 | $ | 327 | $ | 311 | $ | 280 | |||||||||
| 1.49 | % | 1.44 | % | 1.45 | % | 1.80 | % | 3.71 | %(c) | |||||||||
| 1.15 | % | 1.15 | % | 1.15 | % | 1.15 | % | 1.15 | %(c) | |||||||||
| 1.99 | % | 2.61 | % | 2.59 | % | 2.91 | % | 1.24 | %(c) | |||||||||
| 24 | % | 25 | % | 3 | % | 3 | % | 0 | %(d) | |||||||||
See accompanying Notes to Financial Statements.
| Annual Report – April 30, 2021 | 37 |
Seafarer Overseas Value Fund
| Institutional Class |
| NET ASSET VALUE, BEGINNING OF PERIOD |
| INCOME FROM OPERATIONS: |
| Net investment income(a) |
| Net realized and unrealized gain/(loss) on investments |
| Total from investment operations |
| LESS DISTRIBUTIONS: |
| From net investment income |
| From net realized gains on investments |
| Total distributions |
| NET INCREASE/(DECREASE) IN NET ASSET VALUE |
| NET ASSET VALUE, END OF PERIOD |
| TOTAL RETURN(c) |
| SUPPLEMENTAL DATA: |
| Net assets, end of period (in 000s) |
| RATIOS TO AVERAGE NET ASSETS: |
| Operating expenses excluding reimbursement/waiver |
| Operating expenses including reimbursement/waiver |
| Net investment income including reimbursement/waiver |
| PORTFOLIO TURNOVER RATE |
| (a) | Calculated using the average shares method. |
| (b) | In preparing the financial statements in accordance with U.S. GAAP, management made certain adjustments as required by U.S. GAAP which caused the net asset value for purposes of these financial statements to differ from the net asset value used to process shareholder transactions as of the date of these financial statements. As a result, the net asset value decreased from $11.29 to $11.28. |
| (c) | Total returns are for the periods indicated and have not been annualized. In some periods, total returns would have been lower had certain expenses not been waived during the periods. Returns shown do not reflect the deduction of taxes that a shareholder would pay on Fund distributions or the redemption of Fund shares. |
| (d) | Includes adjustments in accordance with U.S. GAAP and as such, the total return for shareholder transactions reported to the market may differ from the total return for financial reporting purposes. As a result, the total return increased from 9.64% to 9.74%. |
| (e) | Includes adjustments in accordance with U.S. GAAP and as such, the total return for shareholder transactions reported to the market may differ from the total return for financial reporting purposes. As a result, the total return decreased from 14.29% to 14.18%. |
| (f) | Annualized. |
| (g) | Portfolio turnover rate for a period less than one full year has not been annualized. |
| 38 | (855) 732-9220 seafarerfunds.com |
| Financial Highlights |
| For a share outstanding through the periods or years presented |
| Year Ended April 30, 2021 | Year Ended April 30, 2020 | Year Ended April 30, 2019 | Year Ended April 30, 2018 | May 31, 2016 (Inception) to April 30, 2017 | ||||||||||||||
| $ | 9.48 | $ | 11.43 | $ | 11.96 | $ | 11.28 | $ | 10.00 | |||||||||
| 0.25 | 0.30 | 0.30 | 0.35 | 0.13 | ||||||||||||||
| 3.62 | (1.88 | ) | (0.50 | ) | 0.74 | 1.28 | ||||||||||||
| 3.87 | (1.58 | ) | (0.20 | ) | 1.09 | 1.41 | ||||||||||||
| (0.17 | ) | (0.32 | ) | (0.30 | ) | (0.41 | ) | (0.13 | ) | |||||||||
| – | (0.05 | ) | (0.03 | ) | – | – | ||||||||||||
| (0.17 | ) | (0.37 | ) | (0.33 | ) | (0.41 | ) | (0.13 | ) | |||||||||
| 3.70 | (1.95 | ) | (0.53 | ) | 0.68 | 1.28 | ||||||||||||
| $ | 13.18 | $ | 9.48 | $ | 11.43 | $ | 11.96 | $ | 11.28 | (b) | ||||||||
| 40.98 | % | (14.47 | %) | (1.34 | %) | 9.74 | %(d) | 14.18 | %(e) | |||||||||
| $ | 34,714 | $ | 29,557 | $ | 28,849 | $ | 25,291 | $ | 9,846 | |||||||||
| 1.51 | % | 1.42 | % | 1.48 | % | 1.76 | % | 3.63 | %(f) | |||||||||
| 1.05 | % | 1.05 | % | 1.05 | % | 1.05 | % | 1.05 | %(f) | |||||||||
| 2.19 | % | 2.63 | % | 2.65 | % | 2.90 | % | 1.36 | %(f) | |||||||||
| 24 | % | 25 | % | 3 | % | 3 | % | 0 | %(g) | |||||||||
See accompanying Notes to Financial Statements.
| Annual Report – April 30, 2021 | 39 |
| Seafarer Funds | Notes to Financial Statements |
April 30, 2021
NOTES TO FINANCIAL STATEMENTS
1. Organization
Financial Investors Trust (the “Trust”), a Delaware statutory trust, is an open-end management investment company registered under the Investment Company Act of 1940, as amended (“1940 Act”). The Trust consists of multiple separate portfolios or series. This annual report describes the Seafarer Overseas Growth and Income Fund and the Seafarer Overseas Value Fund (individually a “Fund” and collectively, the “Funds”). The Seafarer Overseas Growth and Income Fund seeks to provide long-term capital appreciation along with some current income; it also seeks to mitigate adverse volatility in returns as a secondary objective. The Seafarer Overseas Value Fund seeks to provide long-term capital appreciation. The Funds each offer Investor Class and Institutional Class shares.
2. Significant Accounting Policies
The accompanying financial statements were prepared in accordance with accounting principles generally accepted in the United States of America (“U.S. GAAP”). The preparation of financial statements in conformity with U.S. GAAP requires management to make certain estimates and assumptions that affect the reported amounts of assets and liabilities and disclosures of contingent assets and liabilities at the date of the financial statements and the reported amounts of revenue and expenses during the period. Actual results could differ from those estimates. The Funds are considered an investment company for financial reporting purposes under U.S. GAAP and follow the accounting and reporting guidance applicable to investment companies in the Financial Accounting Standards Board Accounting Standards Codification Topic 946.The following is a summary of significant accounting policies consistently followed by the Funds in preparation of their financial statements.
Investment Valuation
Each Fund generally values its securities based on market prices determined at the close of regular trading on the New York Stock Exchange (“NYSE”), normally 4:00 p.m. Eastern Time, on each day the NYSE is open for trading.
For equity securities and exchange traded funds, the market price is usually the closing sale or official closing price on that exchange. In the case of equity securities not traded on an exchange, or if such closing prices are not otherwise available, the securities are valued at the mean of the most recent bid and ask prices on such day. Redeemable securities issued by open-end registered investment companies are valued at the investment company’s applicable net asset value, with the exception of exchange-traded open-end investment companies, which are priced as equity securities.
Equity securities that are primarily traded on foreign securities exchanges are valued at the closing values of such securities on their respective foreign exchanges, except when an event occurs subsequent to the close of the foreign exchange but before the close of the NYSE, such that the securities’ value would likely change. In such an event, the fair values of those securities are determined in good faith through consideration of other factors in accordance with procedures established by and under the general supervision of the Board of Trustees of the Trust (the “Board” or the “Trustees”). Each Fund uses a fair valuation model provided by an independent pricing service, which is intended to reflect fair value when a security’s value or a meaningful portion of the Fund’s portfolio is believed to have been materially affected by a valuation event that has occurred between the close of the exchange or market on which the security is traded and the close of the regular trading day on the NYSE.
The market price for debt obligations is generally the price supplied by an independent third-party pricing service approved by the Board, which may use a matrix, formula or other objective method that takes into consideration quotations from dealers, market transactions in comparable investments, market indices and yield curves. If vendors are unable to supply a price, or if the price supplied is deemed to be unreliable, the market price may be determined using quotations received from one or more broker-dealers that make a market in the security. Corporate bonds and convertible bonds are valued using market models that consider trade data, quotations from dealers and active market
40 | (855) 732-9220 seafarerfunds.com |
| Seafarer Funds | Notes to Financial Statements |
April 30, 2021
makers, relevant yield curve and spread data, creditworthiness, trade data or market information on comparable securities, and other relevant security specific information. Publicly traded foreign government debt securities and foreign corporate bonds are typically traded internationally in the over-the-counter market and are valued at the mean between the bid and asked prices as of the close of business of that market.
Forward currency exchange contracts have a market value determined by the prevailing foreign currency exchange daily rates and current foreign currency exchange forward rates. The foreign currency exchange forward rates are calculated using an automated system that estimates rates on the basis of the current day foreign currency exchange rates and forward foreign currency exchange rates supplied by a pricing service.
When such prices or quotations are not available, or when the Trust’s Valuation Committee believes that they are unreliable, securities may be priced using fair value procedures approved by the Board.
Certain foreign countries impose a tax on capital gains which is accrued by each Fund based on unrealized appreciation, if any, on affected securities. The tax is paid when the gain is realized.
Fair Value Measurements
Each Fund discloses the classification of its fair value measurements following a three-tier hierarchy based on the inputs used to measure fair value. Inputs refer broadly to the assumptions that market participants would use in pricing the asset or liability, including assumptions about risk. Inputs may be observable or unobservable. Observable inputs reflect the assumptions market participants would use in pricing the asset or liability. Such inputs are developed based on market data obtained from sources independent of the reporting entity. Unobservable inputs reflect the reporting entity’s own assumptions about the assumptions market participants would use in pricing the asset or liability, which are developed based on the information available and the reporting entity’s best efforts to interpret such information.
Various inputs are used in determining the value of the Funds’ investments as of the end of the reporting period. When inputs used fall into different levels of the fair value hierarchy, the level in the hierarchy within which the fair value measurement falls is determined based on the lowest level input that is significant to the fair value measurement in its entirety. The designated input levels are not necessarily an indication of the risk or liquidity associated with these investments. These inputs are categorized in the following hierarchy under applicable financial accounting standards:
| Level 1 – | Unadjusted quoted prices in active markets for identical investments, unrestricted assets or liabilities that the Funds have the ability to access at the measurement date; |
| Level 2 – | Quoted prices which are not active, quoted prices for similar assets or liabilities in active markets or inputs other than quoted prices that are observable (either directly or indirectly) for substantially the full term of the asset or liability; and |
| Level 3 – | Significant unobservable prices or inputs (including the Funds’ own assumptions in determining the fair value of investments) where there is little or no market activity for the asset or liability at the measurement date. |
Annual Report – April 30, 2021 | 41 |
| Seafarer Funds | Notes to Financial Statements |
April 30, 2021
The following is a summary of the inputs used to value each Fund as of April 30, 2021:
Investments in Securities at Value(a) | Level 1 - Quoted Prices | Level 2 - Other Significant Observable Inputs | Level 3 - Significant Unobservable Inputs | Total | ||||||||||||
| Seafarer Overseas Growth and Income Fund | ||||||||||||||||
| Common Stocks | ||||||||||||||||
| Brazil | $ | 124,273,552 | $ | – | $ | – | $ | 124,273,552 | ||||||||
| China / Hong Kong | – | 494,709,343 | – | 494,709,343 | ||||||||||||
| Czech Republic | – | 69,118,017 | – | 69,118,017 | ||||||||||||
| Hungary | – | 77,843,816 | – | 77,843,816 | ||||||||||||
| India | 25,312,000 | – | – | 25,312,000 | ||||||||||||
| Japan | – | 74,034,525 | – | 74,034,525 | ||||||||||||
| Mexico | 28,979,348 | – | – | 28,979,348 | ||||||||||||
| Qatar | – | 32,552,245 | – | 32,552,245 | ||||||||||||
| Singapore | – | 127,800,659 | – | 127,800,659 | ||||||||||||
| South Africa | – | 79,145,353 | – | 79,145,353 | ||||||||||||
| South Korea | – | 492,275,336 | – | 492,275,336 | ||||||||||||
| Taiwan | – | 95,185,124 | – | 95,185,124 | ||||||||||||
| Thailand | – | 27,860,058 | – | 27,860,058 | ||||||||||||
| United Arab Emirates | 36,996,644 | – | – | 36,996,644 | ||||||||||||
| United Kingdom | – | 51,572,871 | – | 51,572,871 | ||||||||||||
| Vietnam | – | 36,922,091 | – | 36,922,091 | ||||||||||||
| Preferred Stocks | – | 97,621,769 | – | 97,621,769 | ||||||||||||
| Total | $ | 215,561,544 | $ | 1,756,641,207 | $ | – | $ | 1,972,202,751 | ||||||||
| Investments in Securities at Value(a) | Level 1 - Quoted Prices | Level 2 - Other Significant Observable Inputs | Level 3 - Significant Unobservable Inputs | Total | ||||||||||||
| Seafarer Overseas Value Fund | ||||||||||||||||
| Common Stocks | ||||||||||||||||
| Brazil | $ | 2,419,840 | $ | – | $ | – | $ | 2,419,840 | ||||||||
| China / Hong Kong | – | 13,131,037 | – | 13,131,037 | ||||||||||||
| Czech Republic | – | 1,609,035 | – | 1,609,035 | ||||||||||||
| Georgia | 1,354,251 | – | – | 1,354,251 | ||||||||||||
| Mexico | 268,132 | – | – | 268,132 | ||||||||||||
| Qatar | – | 1,609,700 | – | 1,609,700 | ||||||||||||
| Russia | – | 362,649 | – | 362,649 | ||||||||||||
| Singapore | – | 3,715,229 | – | 3,715,229 | ||||||||||||
| South Korea | – | 3,319,046 | – | 3,319,046 | ||||||||||||
| United Arab Emirates | 1,904,523 | – | – | 1,904,523 | ||||||||||||
| United Kingdom | – | 1,454,898 | – | 1,454,898 | ||||||||||||
| Vietnam | – | 2,046,662 | – | 2,046,662 | ||||||||||||
| Preferred Stocks | – | 155,468 | – | 155,468 | ||||||||||||
| Total | $ | 5,946,746 | $ | 27,403,724 | $ | – | $ | 33,350,470 | ||||||||
| (a) | For detailed descriptions of securities by country, see the accompanying Portfolio of Investments. |
42 | (855) 732-9220 seafarerfunds.com |
| Seafarer Funds | Notes to Financial Statements |
April 30, 2021
For the year ended April 30, 2021, the Funds did not have any securities that used significant unobservable inputs (Level 3) in determining fair value.
Investment Transactions and Investment Income
Investment transactions are accounted for on the date the investments are purchased or sold (trade date). Realized gains and losses from investment transactions are reported on an identified cost basis. Interest income, which includes accretion of discounts and amortization of premiums, is accrued and recorded as earned. Dividend income is recognized on the ex-dividend date or for certain foreign securities, as soon as information is available to the Funds. All of the realized and unrealized gains and losses and net investment income are allocated daily to each share class in proportion to its average daily net assets.
Cash Management Transactions
Each of the Funds subscribes to the Brown Brothers Harriman & Co. (“BBH”) Cash Management Service (“CMS”), whereby cash balances are automatically swept into overnight offshore demand deposits with either the BBH Grand Cayman branch or a branch of a pre-approved commercial bank. This fully automated program allows the Funds to earn interest on cash balances. Excess cash with deposit institutions domiciled outside of the U.S. are subject to sovereign actions in the jurisdiction of the deposit institution including, but not limited to, freeze, seizure or diminution. Cash balances in the BBH CMS are included on the Statements of Assets and Liabilities under Cash and Foreign currency, at value. As of April 30, 2021, the Funds had the following cash balances participating in the BBH CMS:
| Fund | ||||
| Seafarer Overseas Growth and Income Fund | $ | 81,279,964 | ||
| Seafarer Overseas Value Fund | 1,688,401 | |||
As of April 30, 2021, the Funds had the following foreign cash balances participating in the BBH CMS (cost and value of foreign cash balances are equal):
| Fund | ||||
| Seafarer Overseas Growth and Income Fund | $ | – | ||
| Seafarer Overseas Value Fund | – |
Foreign Securities
The Funds may directly purchase securities of foreign issuers. Investing in securities of foreign issuers involves special risks not typically associated with investing in securities of U.S. issuers. The risks include possible revaluation of currencies, the inability to repatriate foreign currency, less complete financial information about companies, and possible future adverse political and economic developments. Moreover, securities of many foreign issuers and their markets may be less liquid and their prices more volatile than those of securities of comparable U.S. issuers.
Foreign Currency Translation
The books and records of the Funds are maintained in U.S. dollars. Investment valuations and other assets and liabilities initially expressed in foreign currencies are converted each business day into U.S. dollars based upon current exchange rates. Prevailing foreign exchange rates may generally be obtained at the close of the NYSE (normally, 4:00 p.m. Eastern Time). The portion of realized and unrealized gains or losses on investments due to fluctuations in foreign currency exchange rates is not separately disclosed and is included in realized and unrealized gains or losses on investments, when applicable.
Foreign Currency Spot Contracts
Each Fund may enter into foreign currency spot contracts to facilitate transactions in foreign securities or to convert foreign currency receipts into U.S. dollars. A foreign currency spot contract is an agreement between two parties to buy and sell currencies at the current market rate, for settlement generally within two business days. The U.S. dollar value of a contract is determined using current
| Annual Report – April 30, 2021 | 43 |
| Seafarer Funds | Notes to Financial Statements |
April 30, 2021
currency exchange rates supplied by a pricing service. The contract is marked-to-market daily for settlements beyond one day and any change in market value is recorded as an unrealized gain or loss. When the contract is closed, the Fund records a realized gain or loss equal to the difference between the value on the open and close date. Losses may arise from changes in the value of the foreign currency, or if the counterparties do not perform under the contract’s terms. The maximum potential loss from such contracts is the aggregate face value in U.S. dollars at the time the contract was opened.
Trust Expenses
Some expenses of the Trust can be directly attributed to the Funds. Expenses that cannot be directly attributed to the Funds are apportioned among all funds in the Trust based on the average daily net assets of each fund.
Fund and Class Expenses
Expenses that are specific to a Fund or class of shares of a Fund, including shareholder servicing fees, are charged directly to that Fund or share class. Expenses that are common to all Funds are generally allocated among the Funds in proportion to their average daily net assets.
Income Taxes
Each Fund complies with the requirements under Subchapter M of the Internal Revenue Code of 1986, as amended, applicable to regulated investment companies and intends to distribute substantially all of its net taxable income and net capital gains, if any, each year so that it will not be subject to excise tax on undistributed income and gains. The Funds are not subject to income taxes to the extent such distributions are made.
As of and during the year ended April 30, 2021, the Funds did not have a liability for any unrecognized tax benefits. The Funds file U.S. federal, state, and local tax returns as required. The Funds’ tax returns are subject to examination by the relevant tax authorities until expiration of the applicable statute of limitations, which is generally three years after the filing due date of the tax return for federal purposes and four years for most state returns. Tax returns for open years have incorporated no uncertain tax positions that require a provision for income taxes.
Distributions to Shareholders
In general, the Seafarer Overseas Growth and Income Fund’s policy is to distribute to its shareholders substantially all net investment income paid out via semi-annual dividends, in June and December. The Seafarer Overseas Value Fund’s policy is to distribute to its shareholders substantially all net investment income via one annual dividend in December. It is also each Fund’s policy to distribute annually all net realized short-term and long-term capital gains, if any, after offsetting any capital loss carryovers. Income dividend distributions are derived from dividends and other income each Fund receives from its investments, including short-term capital gains. Long-term capital gain distributions are derived from gains realized when a Fund sells a security it has owned for more than one year. Each Fund may make additional distributions at other times if the Fund believes doing so may be necessary for the Fund to share tax obligations more ratably and more equitably across shareholders over time.
Epidemic and Pandemic Risk
Certain countries have been susceptible to epidemics, most recently Covid-19, which has been designated as a pandemic by world health authorities. The outbreak of such epidemics, together with any resulting restrictions on travel or quarantines imposed, could have a negative impact on the economy and business activity globally (including in the countries in which the Funds invest), and thereby could adversely affect the performance of the Funds’ investments. Furthermore, the rapid development of epidemics could preclude prediction as to their ultimate adverse impact on economic and market conditions, and, as a result, presents material uncertainty and risk with respect to the performance of the Funds’ investments.
| 44 | (855) 732-9220 seafarerfunds.com |
| Seafarer Funds | Notes to Financial Statements |
April 30, 2021
3. Tax Basis Information
Reclassifications
As of April 30, 2021, permanent differences in book and tax accounting were reclassified. These differences had no effect on net assets and were primarily attributed to equalization. The reclassifications were as follows:
| Fund | Paid-in Capital | Distributable Earnings | ||||||
| Seafarer Overseas Growth and Income Fund | $ | 5,781,088 | $ | (5,781,088 | ) | |||
| Seafarer Overseas Value Fund | – | – | ||||||
Tax Basis of Investments
As of April 30, 2021, the aggregate cost of investments, gross unrealized appreciation/(depreciation), and net unrealized appreciation for federal income tax purposes were as follows:
| Fund | Cost of Investments | Gross Unrealized Appreciation | Gross Unrealized Depreciation | Net Appreciation/ (Depreciation) on Foreign Currencies | Net Unrealized Appreciation/ (Depreciation) | |||||||||||||||
| Seafarer Overseas Growth and Income Fund | ||||||||||||||||||||
| $ | 1,715,277,010 | $ | 361,972,952 | $ | (105,047,211 | ) | $ | 31,373 | $ | 256,957,114 | ||||||||||
| Seafarer Overseas Value Fund | ||||||||||||||||||||
| 30,478,804 | 6,854,664 | (3,982,998 | ) | (165 | ) | 2,871,501 | ||||||||||||||
Components of Distributable Earnings
As of April 30, 2021, components of distributable earnings were as follows:
| Seafarer Overseas Growth and Income Fund | ||||
| Accumulated net investment income | $ | 24,202,982 | ||
| Accumulated net realized gain | 122,500,999 | |||
| Net unrealized appreciation on investments | 256,957,114 | |||
| Total distributable earnings | $ | 403,661,095 | ||
| Seafarer Overseas Value Fund | ||||
| Accumulated net investment income | $ | 277,778 | ||
| Accumulated net realized loss | (515,853 | ) | ||
| Net unrealized appreciation on investments | 2,871,501 | |||
| Total distributable earnings | $ | 2,633,426 | ||
Capital Losses
The Seafarer Overseas Growth and Income Fund used capital loss carryovers during the period ending April 30, 2021 in the amount of $49,218,719.
| Annual Report – April 30, 2021 | 45 |
| Seafarer Funds | Notes to Financial Statements |
April 30, 2021
Under current law, capital losses maintain their character as short-term or long-term and are carried forward to the next tax year without expiration. As of the current fiscal year end, the following amounts are available as carry forwards to the next tax year:
| Fund | Short-Term | Long-Term | ||||||
| Seafarer Overseas Growth and Income Fund | $ | – | $ | – | ||||
| Seafarer Overseas Value Fund | 260,334 | 255,519 | ||||||
Tax Basis of Distributions to Shareholders
The character of distributions made during the fiscal year from net investment income or net realized gains may differ from the ultimate characterization for federal income tax purposes. Also, due to the timing of dividend distributions, the fiscal year in which amounts are distributed may differ from the fiscal year in which the income or realized gain is recorded by a Fund.
The tax character of distributions paid by the Funds for the fiscal year ended April 30, 2021 was as follows:
| Fund | Ordinary Income | Long-Term Capital Gain | ||||||
| Seafarer Overseas Growth and Income Fund | $ | 21,456,087 | $ | 18,037,291 | ||||
| Seafarer Overseas Value Fund | 428,096 | – | ||||||
The tax character of distributions paid by the Funds for the fiscal year ended April 30, 2020 was as follows:
| Fund | Ordinary Income | Long-Term Capital Gain | ||||||
| Seafarer Overseas Growth and Income Fund | $ | 41,345,033 | $ | – | ||||
| Seafarer Overseas Value Fund | 1,063,690 | 133,678 | ||||||
4. Securities Transactions
The cost of purchases and proceeds from sales of securities excluding short-term securities during the year ended April 30, 2021 were as follows:
| Fund | Purchases of Securities | Proceeds from Sales of Securities | ||||||
| Seafarer Overseas Growth and Income Fund | $ | 858,164,803 | $ | 705,690,342 | ||||
| Seafarer Overseas Value Fund | 6,456,327 | 10,155,575 | ||||||
5. Shares of Beneficial Interest
The capitalization of the Trust consists of an unlimited number of shares of beneficial interest with no par value per share. Holders of shares of the Funds of the Trust have one vote for each share held and a proportionate fraction of a vote for each fractional share. All shares issued and outstanding are fully paid and are transferable and redeemable at the option of the shareholder. Purchasers of the shares do not have any obligation to make payments to the Trust or its creditors solely by reason of the purchasers’ ownership of the shares. Shares have no pre-emptive rights.
| 46 | (855) 732-9220 seafarerfunds.com |
| Seafarer Funds | Notes to Financial Statements |
April 30, 2021
6. Management and Related Party Transactions
The Adviser, subject to the authority of the Board, is responsible for the overall management and administration of the Funds’ business affairs. The Adviser manages the investments of the Funds in accordance with the Funds’ investment objectives, policies, limitations and investment guidelines established jointly by the Adviser and the Trustees. Pursuant to the investment advisory agreement, the Funds, in the aggregate, pay the Adviser an annual management fee of 0.75% of the aggregate average daily net assets of the Funds up to $1.5 billion and 0.70% of the aggregate average daily net assets of the Funds over $1.5 billion. Each Fund pays the Adviser a monthly fee at the annual rate using the applicable management fee calculated based on the Fund’s pro rata share of the Funds’ combined average daily net assets.
Effective September 1, 2015, the Adviser contractually, through successive one-year agreements, agreed to waive and/or reimburse fees or expenses in order to limit Total Annual Fund Operating Expenses After Fee Waiver / Expense Reimbursements (excluding brokerage expenses, interest expenses, taxes and extraordinary expenses) to 1.15% and 1.05% of the Funds’ average daily net assets for the Investor and Institutional share classes, respectively. The current agreement (the “Expense Agreement”) is in effect through August 31, 2021. The Adviser will be permitted to recover, on a class-by-class basis, expenses it has borne through the Expense Agreement to the extent that the Funds’ expenses in later periods fall below the expense cap in effect at the time of waiver or reimbursement. The Funds will not be obligated to pay any such deferred fees and expenses more than three years after the date of the waiver. This agreement may not be terminated or modified prior to August 31, 2021, except with the approval of the Funds’ Board. During the year ended April 30, 2021, the Adviser agreed that it will only seek to recoup waived management fees and will not recoup any reimbursed expenses. As of April 30, 2021, the Adviser has recouped all available waived management fees from the Seafarer Overseas Growth and Income Fund.
For the year ended April 30, 2021, the fee waivers and/or reimbursements were as follows for the Seafarer Overseas Value Fund:
| Fund | Fees Waived/ Reimbursed By Adviser | Recoupment of Past Waived Fees | ||||||
| Seafarer Overseas Value Fund | ||||||||
| Investor Class | $ | 1,259 | $ | 72 | ||||
| Institutional Class | 134,851 | – | ||||||
As of April 30, 2021 the balances of recoupable expenses for each class were as follows for the Funds:
| Fund | Expires 2022 | Expires 2023 | Expires 2024 | Total | ||||||||||||
| Seafarer Overseas Growth and Income Fund | ||||||||||||||||
| Investor Class | $ | – | $ | – | $ | – | $ | – | ||||||||
| Institutional Class | – | – | – | – | ||||||||||||
| Seafarer Overseas Value Fund | ||||||||||||||||
| Investor Class | $ | 897 | $ | 912 | $ | 1,259 | $ | 3,068 | ||||||||
| Institutional Class | 115,259 | 129,046 | 134,851 | 379,156 | ||||||||||||
| Annual Report – April 30, 2021 | 47 |
| Seafarer Funds | Notes to Financial Statements |
April 30, 2021
Fund Administrator
ALPS Fund Services, Inc. (“ALPS” and the “Administrator”) provides administrative, fund accounting and other services to the Funds under the Administration, Bookkeeping and Pricing Services Agreement with the Trust.
The Funds’ administrative fee is accrued on a daily basis and paid monthly. The Administrator is also reimbursed by the Funds for certain out-of-pocket expenses. Administration fees paid by the Funds for the year ended April 30, 2021 are disclosed in the Statements of Operations.
Transfer Agent
ALPS serves as transfer, dividend paying and shareholder servicing agent for the Funds (“Transfer Agent”). ALPS is paid an annual base fee per Fund and a fee based on the number of shareholder accounts. The Transfer Agent is also reimbursed by the Funds for certain out-of-pocket expenses. Transfer agent fees paid by the Funds for the year ended April 30, 2021 are disclosed in the Statements of Operations.
Compliance Services
ALPS provides compliance services to the Funds under the Chief Compliance Officer Services Agreement with the Trust. ALPS provides services that assist the Trust’s chief compliance officer in monitoring and testing the policies and procedures of the Trust in accordance with the requirements of Rule 38a-1 under the 1940 Act. ALPS is paid an annual base fee and is reimbursed for certain out-of-pocket expenses. Compliance service fees paid by the Funds for the year ended April 30, 2021 are disclosed in the Statements of Operations.
Principal Financial Officer
ALPS provides principal financial officer services to the Funds under the Principal Financial Officer Services Agreement with the Trust. Under this Agreement, ALPS is paid an annual base fee and is reimbursed for certain out-of -pocket expenses. Principal financial officer fees paid by the Funds for the year ended April 30, 2021 are disclosed in the Statements of Operations.
Distributor
ALPS Distributors, Inc. (“ADI” or the “Distributor”) (an affiliate of ALPS) acts as the distributor of the Funds’ shares pursuant to the Distribution Agreement with the Trust. Under a side letter agreement, the Adviser pays ADI an annual base fee per Fund for the distribution services. The Adviser also reimburses ADI for certain out-of-pocket expenses. Shares are sold on a continuous basis by ADI as agent for the Funds, and ADI has agreed to use its best efforts to solicit orders for the sale of the Funds’ shares, although it is not obliged to sell any particular amount of shares. ADI is registered as a broker-dealer with the U.S. Securities and Exchange Commission.
Shareholder Service Plan for Investor Class and Institutional Class Shares
Each Fund has adopted a Shareholder Services Plan (a “Services Plan”) for each of its share classes. Under the Services Plan, each Fund is authorized to enter into shareholder service agreements with investment advisers, financial institutions and other service providers (“Participating Organizations”) to maintain and provide certain administrative and servicing functions in relation to the accounts of shareholders. Shareholder service arrangements typically include processing orders for shares, generating account and confirmation statements, sub-accounting, account maintenance, tax reporting, and disbursing cash dividends as well as other investment or administrative services required for a particular Participating Organizations’ products, programs, platform and accounts. The Services Plan will cause each Fund to pay an aggregate fee, not to exceed on an annual basis 0.15% and 0.05% of the average daily net asset value of the Investor and Institutional share classes, respectively. Such payments will be made on assets attributable to or held in the name of a Participating Organization, on behalf of its clients as compensation for providing service activities pursuant to an agreement with the Participating Organization. Any amount of such payment not paid to a Participating Organization for such service activities shall be reimbursed
| 48 | (855) 732-9220 seafarerfunds.com |
| Seafarer Funds | Notes to Financial Statements |
April 30, 2021
to the Fund as soon as practicable. Shareholder Services Plan fees paid by the Funds for the year ended April 30, 2021 are disclosed in the Statements of Operations.
Trustees
The fees and expenses of the Trustees of the Board are presented in the Statements of Operations.
7. Indemnifications
Under the Trust’s organizational documents, its officers and Trustees are indemnified against certain liability arising out of the performance of their duties to the Trust. Additionally, in the normal course of business, the Trust enters into contracts with service providers that may contain general indemnification clauses, which may permit indemnification to the extent permissible under the applicable law. The Trust’s maximum exposure under these arrangements is unknown, as this would involve future claims that may be made against the Trust that have not yet occurred.
| Annual Report – April 30, 2021 | 49 |
| Seafarer Funds | Report of Independent Registered Public Accounting Firm |
April 30, 2021
To the shareholders and the Board of Trustees of Financial Investors Trust
Opinion on the Financial Statements and Financial Highlights
We have audited the accompanying statements of assets and liabilities of Seafarer Overseas Growth and Income Fund and Seafarer Overseas Value Fund (the "Funds"), two of the funds constituting the Financial Investors Trust, including the portfolio of investments, as of April 30, 2021, the related statement of operations for the year then ended, the statements of changes in net assets for each of the two years in the period then ended, the financial highlights for each of the five years in the period then ended for Seafarer Overseas Growth and Income Fund; the related statement of operations for the year then ended, the statements of changes in net assets for each of the two years in the period then ended, the financial highlights for each of the four years in the period then ended and for the period from May 31, 2016 (inception) through April 30, 2017 for Seafarer Overseas Value Fund; and the related notes.
In our opinion, the financial statements and financial highlights present fairly, in all material respects, the financial position of Seafarer Overseas Growth and Income Fund as of April 30, 2021, and the results of its operations for the year then ended, the changes in its net assets for each of the two years in the period then ended, and the financial highlights for each of the five years in the period then ended in conformity with accounting principles generally accepted in the United States of America. Also, in our opinion, the financial statements and financial highlights present fairly, in all material respects, the financial position of Seafarer Overseas Value Fund as of April 30, 2021, and the results of its operations for the year then ended, the changes in its net assets for each of the two years in the period then ended, and the financial highlights for each of the four years in the period then ended and for the period from May 31, 2016 (inception) through April 30, 2017 in conformity with accounting principles generally accepted in the United States of America.
Basis for Opinion
These financial statements and financial highlights are the responsibility of the Funds’ management. Our responsibility is to express an opinion on the Funds’ financial statements and financial highlights based on our audits. We are a public accounting firm registered with the Public Company Accounting Oversight Board (United States) (PCAOB) and are required to be independent with respect to the Funds in accordance with the U.S. federal securities laws and the applicable rules and regulations of the Securities and Exchange Commission and the PCAOB.
We conducted our audits in accordance with the standards of the PCAOB. Those standards require that we plan and perform the audit to obtain reasonable assurance about whether the financial statements and financial highlights are free of material misstatement, whether due to error or fraud. The Funds are not required to have, nor were we engaged to perform, an audit of their internal control over financial reporting. As part of our audits we are required to obtain an understanding of internal control over financial reporting but not for the purpose of expressing an opinion on the effectiveness of the Funds’ internal control over financial reporting. Accordingly, we express no such opinion.
Our audits included performing procedures to assess the risks of material misstatement of the financial statements and financial highlights, whether due to error or fraud, and performing procedures that respond to those risks. Such procedures included examining, on a test basis, evidence regarding the amounts and disclosures in the financial statements and financial highlights. Our audits also included evaluating the accounting principles used and significant estimates made by management, as well as evaluating the overall presentation of the financial statements and financial highlights. Our procedures included confirmation of securities owned as of April 30, 2021, by correspondence with the custodian and brokers; when replies were not received from brokers, we performed other auditing procedures. We believe that our audits provide a reasonable basis for our opinion.
DELOITTE & TOUCHE LLP
Denver, Colorado
June 28, 2021
We have served as the auditor of one or more investment companies advised by Seafarer Capital Partners, LLC since 2012.
| 50 | (855) 732-9220 seafarerfunds.com |
| Seafarer Funds | Additional Information |
April 30, 2021 (Unaudited)
ADDITIONAL INFORMATION
1. Fund Holdings
The Funds file their complete schedule of portfolio holdings with the U.S. Securities and Exchange Commission for the first and third quarters of each fiscal year as an exhibit to their reports on Form N-PORT. The Funds’ Form N-PORT reports are available on the Commission’s Web site at http://www.sec.gov. The Funds’ Form N-PORT reports are also available upon request by calling toll-free (855) 732-9220.
2. Fund Proxy Voting Policies, Procedures and Summaries
The Funds’ policies and procedures used in determining how to vote proxies and information regarding how the Funds voted proxies relating to portfolio securities during the most recent prior 12-month period ending June 30 are available without charge, (1) upon request, by calling toll-free (855) 732-9220 and (2) on the SEC’s website at http://www.sec.gov.
3. Index Provider Disclosure
The Seafarer Funds are not sponsored, endorsed, sold, or promoted by Morningstar, Inc. Morningstar, Inc. makes no representation or warranty, express or implied, to the shareholders of the Funds or any member of the public regarding the advisability of investing in the Funds or the ability of the Morningstar Emerging Markets Net Return U.S. Dollar Index to track general equity market performance of emerging markets.
4. Tax Designations (Unaudited)
The Funds designate the following as a percentage of taxable ordinary income distributions, or up to the maximum amount allowable, for the calendar year ended December 31, 2020:
Dividends Received Deduction | Qualified Dividend Income | |
| Seafarer Overseas Growth and Income Fund | 0.00% | 37.31% |
| Seafarer Overseas Value Fund | 0.00% | 17.17% |
In early 2021, if applicable, shareholders of record received this information for the distributions paid to them by the Funds during the calendar year 2020 via Form 1099. The Funds will notify shareholders in early 2022 of amounts paid to them by the Funds, if any, during the calendar year 2021.
The Funds hereby designate the following numbers as long-term capital gain distributions:
Long-term Capital Gain Distributions | ||||
| Seafarer Overseas Growth and Income Fund | $ | 18,037,291 | ||
| Seafarer Overseas Value Fund | 0 | |||
The Seafarer Overseas Growth and Income Fund and the Seafarer Overseas Value Fund designate foreign taxes paid in the amounts of $2,430,664 and $7,912 and foreign source income in the amounts of $36,574,550 and $872,666, respectively, for federal income tax purposes for the year ended April 30, 2021.
Please consult a tax advisor if you have questions about federal or state income tax laws, or how to prepare your tax returns.
| Annual Report – April 30, 2021 | 51 |
| Seafarer Funds | Approval of Fund Advisory Agreement |
April 30, 2021
DISCLOSURE REGARDING APPROVAL OF FUND ADVISORY AGREEMENT
On December 8, 2020, the Trustees met via Zoom video conference to discuss, among other things, the renewal of the Investment Advisory Agreement between Seafarer Capital Partners, LLC (“Seafarer”) and the Trust, with respect to the Seafarer Overseas Growth and Income Fund and the Seafarer Overseas Value Fund (together, the “Seafarer Funds”), dated January 30, 2012, as amended (the “Seafarer Investment Advisory Agreement”), in accordance with Section 15(c) of the 1940 Act. In renewing and approving the Seafarer Investment Advisory Agreement, the Trustees, including the Independent Trustees, considered the following factors with respect to the Seafarer Funds:
Investment Advisory Fee Rate:
The Trustees reviewed and considered the contractual annual advisory fees paid by the Trust, on behalf of the Seafarer Funds, to Seafarer, of 0.75% of the aggregate average daily net assets of the Funds up to $1.5 billion and 0.70% of the aggregate average daily net assets of the Funds over $1.5 billion, in light of the extent and quality of the advisory services provided by Seafarer to each of the Seafarer Funds.
The Board received and considered information including a comparison of the Seafarer Funds contractual advisory fee rate with those of funds in the peer group of funds provided by an independent provider of investment company data (the “Data Provider”). The Trustees noted that the contractual advisory fee rate of both of the Seafarer Funds was lower than the Data Provider peer group median.
Total Net Expense Ratios:
The Trustees further reviewed and considered that the total net expense ratio of each Class of both Seafarer Funds was lower than the Data Provider peer group median. Rule 12b-1 Fees in peer group funds were excluded for the purpose of the comparison.
Nature, Extent, and Quality of the Services under the Investment Advisory Agreement:
The Trustees received and considered information regarding the nature, extent, and quality of services provided to the Seafarer Funds under the Seafarer Investment Advisory Agreement. The Trustees reviewed certain background materials supplied by Seafarer in its presentation, including its Form ADV.
The Trustees reviewed and considered Seafarer’s investment advisory personnel, its history as an asset manager, and its performance and the amount of assets currently under management by Seafarer. The Trustees also reviewed the research and decision-making processes utilized by Seafarer, including the methods adopted to seek to achieve compliance with the investment objectives, policies, and restrictions of the Seafarer Funds.
The Trustees considered the background and experience of Seafarer’s management in connection with the Seafarer Funds, including reviewing the qualifications, backgrounds, and responsibilities of the management team primarily responsible for the day-to-day portfolio management of each Seafarer Fund and the extent of the resources devoted to research and analysis of actual and potential investments.
The Trustees also reviewed, among other things, Seafarer’s insider trading policies and procedures and its Code of Ethics.
Performance:
The Trustees reviewed performance information for each Class of the Seafarer Funds for the 3-month, 1-year, 3-year, 5-year, and since inception periods, as applicable, ended September 30, 2020. That review included a comparison of each Seafarer Fund’s performance to the performance of a group of comparable funds selected by the Data Provider. The Trustees noted that each Class of the Seafarer Overseas Growth and Income Fund outperformed the Data Provider peer group median for each period, and that each Class of the Seafarer Overseas Value Fund underperformed the Data Provider peer group
| 52 | (855) 732-9220 seafarerfunds.com |
| Seafarer Funds | Approval of Fund Advisory Agreement |
April 30, 2021
median for each applicable time period. The Trustees also considered Seafarer’s discussion of its reputation generally and its investment techniques, risk management controls, and decision-making processes.
Comparable Accounts:
The Trustees noted that Seafarer’s only clients were the Seafarer Funds.
Profitability:
The Trustees received and considered a profitability analysis prepared by Seafarer based on the fees payable under the Seafarer Investment Advisory Agreement.
Economies of Scale:
The Trustees considered whether economies of scale in the provision of services to the Seafarer Funds will be passed along to the shareholders under the proposed agreement.
Other Benefits to the Adviser:
The Trustees reviewed and considered any other incidental benefits derived or to be derived by Seafarer from its relationship with the Seafarer Funds, including whether soft dollar arrangements were used.
The Trustees, including all of the Independent Trustees, concluded that:
| ● | the contractual advisory fee rate of both of the Seafarer Funds was lower than the Data Provider peer group median; |
| ● | the total net expense ratio of each Class of both Seafarer Funds was lower than the Data Provider peer group median; |
| ● | the nature, extent, and quality of services rendered by Seafarer under the Seafarer Investment Advisory Agreement with respect to each Seafarer Fund were adequate; |
| ● | for the 3-month, 1-year, 3-year, 5-year, and since inception periods, as applicable, ended September 30, 2020, each Class of the Seafarer Overseas Growth and Income Fund outperformed the Data Provider peer group median for each period, and each Class of the Seafarer Overseas Value Fund underperformed the Data Provider peer group median for each applicable time period; |
| ● | Seafarer had no other accounts with comparable investment objectives and strategies to the Seafarer Funds; |
| ● | the profit, if any, realized by Seafarer in connection with the operation of any of the Seafarer Funds is not unreasonable; and |
| ● | there were no material economies of scale or other incidental benefits accruing to Seafarer in connection with its relationship with any of the Seafarer Funds. |
Based on the Trustees’ deliberations and their evaluation of the information described above, the Trustees, including all of the Independent Trustees, concluded that Seafarer’s compensation for investment advisory services is consistent with the best interests of each of the Seafarer Funds and their shareholders.
| Annual Report – April 30, 2021 | 53 |
| Seafarer Funds | Liquidity Risk Management Program |
April 30, 2021 (Unaudited)
The Financial Investors Trust (the “Trust”) has established a liquidity risk management program (the “Program”) to govern the Trust’s approach to managing liquidity risk for each fund in the Trust (each a “Fund”). The Program is overseen by the Liquidity Committee (the “Committee”), a committee comprised of representatives of the Trust’s investment advisers, sub-advisers, and Officers of the Trust. The Trust’s Board of Trustees (the “Board”) has approved the designation of the Committee to oversee the Program.
The Program’s principal objectives include supporting each Fund’s compliance with limits on investments in illiquid assets and mitigating the risk that a Fund will be unable to meet its redemption obligations in a timely manner. The Program also includes a number of elements that support the management and assessment of liquidity risk, including a periodic assessment of factors that influence a Fund’s liquidity and the periodic classification and re-classification of the Fund’s investments into groupings that reflect the Committee’s assessment of their relative liquidity under current market conditions.
At a meeting of the Board held on March 10, 2021, the Trustees received a report from the Committee regarding the design and operational effectiveness of the Program during 2020. The Committee determined, and reported to the Board, that the Program is reasonably designed to assess and manage each Fund’s liquidity risk and has operated adequately and effectively to manage each Fund’s liquidity risk since implementation.
The Committee reported that during the period covered by the report, there were no liquidity events that impacted the Funds or their ability to timely meet redemptions without dilution to existing shareholders. Among other things, the Board noted that the Funds are not required to have a highly liquid investment minimum based on their liquidity classifications. The Board further noted that no material changes have been made to the Program since its implementation.
| 54 | (855) 732-9220 seafarerfunds.com |
| Seafarer Funds | Trustees and Officers |
April 30, 2021
Additional information regarding the Funds’ trustees is included in the Statement of Additional Information, which can be obtained without charge at seafarerfunds.com or by calling 855-732-9220.
INDEPENDENT TRUSTEES
| Name, Address* & Year of Birth | Position(s) Held with Fund | Term of Office** and Length of Time Served | Principal Occupation(s) During Past 5 Years*** | Number of Funds in Fund Complex Overseen by Trustee**** | Other Directorships Held by Trustee During Past 5 Years*** |
| Mary K. Anstine, 1940 | Trustee and Chairman | Ms. Anstine was elected at a special meeting of shareholders held on March 21, 1997 and re-elected at a special meeting of shareholders held on August 7, 2009. Ms. Anstine was appointed Chairman of the Board at the June 6, 2017 meeting of the Board of Trustees. | Ms. Anstine is Trustee/Director of AV Hunter Trust and Colorado Uplift Board. | 31 | Ms. Anstine is a Trustee of ALPS ETF Trust (17 funds); ALPS Variable Investment Trust (7 funds); Reaves Utility Income Fund (1 fund); and Segall Bryant & Hamill Trust through December 2020 (as of December 31, 2020 14 funds). |
| Jeremy W. Deems, 1976 | Trustee | Mr. Deems was appointed as a Trustee at the March 11, 2008 meeting of the Board of Trustees and elected at a special meeting of shareholders held on August 7, 2009. | Mr. Deems is the Co-Founder and Chief Financial Officer of Green Alpha Advisors, LLC, a registered investment advisor, and Co-Portfolio Manager of the Shelton Green Alpha Fund. | 31 | Mr. Deems is a Trustee of ALPS ETF Trust (17 funds); ALPS Variable Investment Trust (7 funds); Clough Funds Trust (1 fund); and Reaves Utility Income Fund (1 fund). |
| Annual Report – April 30, 2021 | 55 |
| Seafarer Funds | Trustees and Officers |
April 30, 2021
INDEPENDENT TRUSTEES (continued)
| Name, Address* & Year of Birth | Position(s) Held with Fund | Term of Office** and Length of Time Served | Principal Occupation(s) During Past 5 Years*** | Number of Funds in Fund Complex Overseen by Trustee**** | Other Directorships Held by Trustee During Past 5 Years*** |
Jerry G. Rutledge, 1944 | Trustee | Mr. Rutledge was elected at a special meeting of shareholders held on August 7, 2009. | Mr. Rutledge is the President and owner of Rutledge’s Inc., a retail clothing business. | 31 | Mr. Rutledge is a Trustee of Clough Global Dividend and Income Fund (1 fund); Clough Global Equity Fund (1 fund); Clough Global Opportunities Fund (1 fund); and Principal Real Estate Income Fund (1 fund). |
Michael “Ross” Shell, 1970 | Trustee | Mr. Shell was elected at a special meeting of shareholders held on August 7, 2009. | Mr. Shell is Founder and CEO of Red Idea, LLC, a strategic consulting/early stage venture firm (since June 2008). Mr. Shell serves on the Board of Directors of TalkBox, a phone/privacy booth company (since 2018) and DLVR, a package security company (since 2018). Mr. Shell served on the Advisory Board, St. Vrain School District Innovation Center (from 2015-2018). Mr. Shell graduated with honors from Stanford University with a degree in Political Science. | 31 | None. |
| 56 | (855) 732-9220 seafarerfunds.com |
| Seafarer Funds | Trustees and Officers |
April 30, 2021
INTERESTED TRUSTEE
| Name, Address* & Year of Birth | Position(s) Held with Fund | Term of Office** and Length of Time Served | Principal Occupation(s) During Past 5 Years*** | Number of Funds in Fund Complex Overseen by Trustee**** | Other Directorships Held by Trustee During Past 5 Years*** |
| Edmund J. Burke, 1961 | Trustee | Mr. Burke was elected as Trustee at a special meeting of shareholders held on August 7, 2009. | Mr. Burke joined ALPS in 1991 and served as the President and Director of ALPS Holdings, Inc., and ALPS Advisors, Inc., and Director of ALPS Distributors, Inc., ALPS Fund Services, Inc. (“ALPS”), and ALPS Portfolio Solutions Distributor, Inc. (collectively, the “ALPS Companies”). Mr. Burke retired from the ALPS Companies in June 2019. Mr. Burke is currently a partner at ETF Action, a web-based system that provides data and analytics to registered investment advisers, (since 2020) and a Director of Alliance Bioenergy Plus, Inc., technology company focused on emerging technologies in the renewable energy, biofuels, and bioplastics technology sectors (since 2020). Mr. Burke is deemed an interested Trustee by virtue of his prior positions with the ALPS Companies. | 31 | Mr. Burke is a Trustee of ALPS ETF Trust (17 funds); Clough Global Dividend and Income Fund (1 fund); Clough Global Equity Fund (1 fund); Clough Global Opportunities Fund (1 fund); Clough Funds Trust (1 fund); Liberty All-Star Equity Fund (1 fund); and Director of the Liberty All-Star Growth Fund, Inc. (1 fund). |
| Annual Report – April 30, 2021 | 57 |
| Seafarer Funds | Trustees and Officers |
April 30, 2021
OFFICERS
| Name, Address* & Year of Birth | Position(s) Held with Fund | Term of Office** and Length of Time Served | Principal Occupation(s) During Past 5 Years*** |
| Bradley J. Swenson, 1972***** | President | Mr. Swenson was appointed President of the Trust at the June 11, 2019 meeting of the Board of Trustees. | Mr. Swenson joined ALPS in 2004 and has served as its President since June 2019. In this role, he serves as an officer to certain other closed-end and open-end investment companies. He previously served as the Chief Operating Officer of ALPS (2015-2019). Mr. Swenson also previously served as Chief Compliance Officer to ALPS, its affiliated entities, and to certain ETF, closed-end and open-end investment companies (2004-2015). Because of his position with ALPS, Mr. Swenson is deemed an affiliate of the Trust as defined under the 1940 Act. |
| Dawn Cotten, 1977 | President | Ms. Cotten was appointed President of the Trust at the June 8-9, 2021 meeting of the Trustees. | Ms. Cotten joined ALPS in 2009 and is currently Senior Vice President of Fund Administration and Relationship Management of ALPS. She has served in that role since January 2020. Prior to that, Ms. Cotten served as Senior Vice President of Relationship Management (2017-2020). Ms. Cotten served as a VP in Relationship Management from 2013-2017. Ms. Cotten also serves as President of ALPS Series Trust, Clough Funds Trust, Clough Global Dividend and Income Fund, and Clough Global Equity Fund and Clough Global Opportunities Fund. |
| Jennell Panella, 1974 | Treasurer | Ms. Panella was appointed Treasurer of the Trust at the September 15, 2020 meeting of the Board of Trustees. | Ms. Panella joined ALPS in June 2012 and is currently Vice President and Fund Controller of ALPS Fund Services, Inc. Prior to joining ALPS, Ms. Panella served as Financial Reporting Manager for Parker Global Strategies, LLC (2009-2012). Because of her position with ALPS, Ms. Panella is deemed an affiliate of the Trust as defined under the 1940 Act. Ms. Panella also serves as Assistant Treasurer of James Advantage Funds. |
| Karen S. Gilomen, 1970***** | Secretary | Ms. Gilomen was appointed Secretary of the Trust at the December 13, 2016 meeting of the Board of Trustees. | Ms. Gilomen joined ALPS in August 2016 as Vice President and Senior Counsel. Prior to joining ALPS, Ms. Gilomen was Vice President - General Counsel & CCO of Monticello Associates, Inc. from 2010 to 2016. Because of her position with ALPS, Ms. Gilomen is deemed an affiliate of the Trust, as defined under the 1940 Act. Ms. Gilomen is also the Secretary of ALPS Variable Investment Trust and Reaves Utility Income Fund, and the Assistant Secretary of the WesMark Funds. |
| Cara Owen, 1981 | Secretary | Ms. Owen was appointed Secretary of the Trust at the June 8-9, 2021 meeting of the Trustees. | Vice President and Principal Legal Counsel, ALPS Fund Services, Inc. Prior to joining ALPS, Ms. Owen was Senior Counsel, Corporate & Investments, Great-West Life & Annuity Insurance Company; Senior Counsel & Assistant Secretary, Great-West Funds, Inc., Great-West Capital Management, LLC, Great-West Trust Company, LLC, and Advised Assets Group, LLC (2014-2019). Ms. Owen also serves as Secretary of ALPS ETF Trust, Vice President and Secretary of Boulder Growth & Income Fund, and Assistant Secretary of James Advantage Funds. |
| 58 | (855) 732-9220 seafarerfunds.com |
| Seafarer Funds | Trustees and Officers |
April 30, 2021
OFFICERS (continued)
| Name, Address* & Year of Birth | Position(s) Held with Fund | Term of Office** and Length of Time Served | Principal Occupation(s) During Past 5 Years*** |
Ted Uhl, 1974 | Chief Compliance Officer (“CCO”) | Mr. Uhl was appointed CCO of the Trust at the June 8, 2010 meeting of the Board of Trustees. | Mr. Uhl joined ALPS in October 2006, and is currently Deputy Compliance Officer of ALPS. Prior to his current role, Mr. Uhl served as Senior Risk Manager for ALPS from October 2006 until June 2010. Before joining ALPS, Mr. Uhl served a Sr. Analyst with Enenbach and Associates (RIA), and a Sr. Financial Analyst at Sprint. Because of his position with ALPS, Mr. Uhl is deemed an affiliate of the Trust as defined under the 1940 Act. Mr. Uhl is also CCO of the Boulder Growth & Income Fund, Inc., Centre Funds, Index Funds, Reality Shares ETF Trust, Reaves Utility Income Fund and XAI Octagon Floating Rate & Alternative Income Term Trust. |
Jennifer Craig, 1973 | Assistant Secretary | Ms. Craig was appointed Assistant Secretary of the Trust at the June 8, 2016 meeting of the Board of Trustees. | Ms. Craig joined ALPS in 2007 and is currently Assistant Vice President and Paralegal Manager of ALPS. Because of her position with ALPS, Ms. Craig is deemed an affiliate of the Trust as defined under the 1940 Act. Ms. Craig is also Secretary of Principal Real Estate Income Fund, Assistant Secretary of Clough Global Dividend and Income Fund, Clough Global Equity Fund, Clough Global Opportunities Fund, Liberty All-Star Equity Fund and Liberty All-Star Growth Fund, Inc. and Clerk of Goehring & Rozencwajg Investment Funds. |
| * | All communications to Trustees and Officers may be directed to Financial Investors Trust c/o 1290 Broadway, Suite 1000, Denver, CO 80203. |
| ** | This is the period for which the Trustee or Officer began serving the Trust. Each Trustee serves an indefinite term, until such Trustees successor is elected and appointed, or such Trustee resigns or is deceased. Officers are elected on an annual basis. |
| *** | Except as otherwise indicated, each individual has held the office shown or other offices in the same company for the last five years. |
| **** | The Fund Complex includes all series of the Trust, currently 31, and any other investment companies for which any Trustee serves as trustee for and for which Seafarer Capital Partners, LLC provides investment advisory services (currently none). |
| ***** | Mr. Swenson resigned his position as President of the Trust effective June 9, 2021 and Ms. Gilomen resigned her position as Secretary of the Trust effective June 4, 2021. |
| Annual Report – April 30, 2021 | 59 |
| Seafarer Funds | Privacy Policy |
| April 30, 2021 (Unaudited) |
| FACTS | WHAT DO THE FUNDS DO WITH YOUR PERSONAL INFORMATION? |
| Why? | Financial companies choose how they share your personal information. Federal law gives consumers the right to limit some but not all sharing. Federal law also requires us to tell you how we collect, share, and protect your personal information. Please read this notice carefully to understand what we do. |
| What? | The types of personal information we collect and share depend on the product or service you have with us. This information can include:
● Social Security number and account transactions ● Account balances and transaction history ● Wire transfer instructions |
| How? | All financial companies need to share customers’ personal information to run their everyday business. In the section below, we list the reasons financial companies can share their customers’ personal information; the reasons the Funds choose to share; and whether you can limit this sharing. |
| Reasons we can share your personal information | Do we share: | Can you limit this sharing? |
| For our everyday business purposes — such as to process your transactions, maintain your account(s), respond to court orders and legal investigations, or report to credit bureaus | Yes | No |
| For our marketing purposes — to offer our products and services to you | No | We do not share. |
| For joint marketing with other financial companies | No | We do not share. |
| For our affiliates’ everyday business purposes — information about your transactions and experiences | Yes | No |
| For our affiliates’ everyday business purposes — information about your creditworthiness | No | We do not share. |
| For nonaffiliates to market to you | No | We do not share. |
| 60 | (855) 732-9220 seafarerfunds.com |
| Seafarer Funds | Privacy Policy |
| April 30, 2021 (Unaudited) |
| Who We Are | |
| Who is providing this notice? | Seafarer Overseas Growth and Income Fund and Seafarer Overseas Value Fund. |
| What We Do | |
| How do the Funds protect my personal information? | To protect your personal information from unauthorized access and use, we use security measures that comply with federal law. These measures include computer safeguards and secured files and buildings. |
| How do the Funds collect my personal information? | We collect your personal information, for example, when you
● open an account ● provide account information or give us your contact information ● make a wire transfer or deposit money |
| Why can’t I limit all sharing? | Federal law gives you the right to limit only
● sharing for affiliates’ everyday business purposes-information about your creditworthiness ● affiliates from using your information to market to you ● sharing for non-affiliates to market to you
State laws and individual companies may give you additional rights to limit sharing. |
| Definitions | |
| Affiliates | Companies related by common ownership or control. They can be financial and nonfinancial companies. |
| Non-affiliates | Companies not related by common ownership or control. They can be financial and nonfinancial companies.
● The Funds do not share with non-affiliates so they can market to you. |
| Joint marketing | A formal agreement between non-affiliated financial companies that together market financial products or services to you.
● The Funds do not jointly market. |
| Other Important Information | |
| California Residents | If your account has a California home address, your personal information will not be disclosed to nonaffiliated third parties except as permitted by applicable California law, and we will limit sharing such personal information with our affiliates to comply with California privacy laws that apply to us. |
| Vermont Residents | The State of Vermont requires financial institutions to obtain your consent prior to sharing personal information that they collect about you with affiliated companies and nonaffiliated third parties other than in certain limited circumstances. Except as permitted by law, we will not share personal information we collect about you with nonaffiliated third parties or other affiliated companies unless you provide us with your written consent to share such information. |
| Annual Report – April 30, 2021 | 61 |

Table of Contents
| CONTENTS | PAGE |
| Shareholder Letter | 1 |
| Fund Overview | |
| Vulcan Value Partners Fund | 5 |
| Vulcan Value Partners Small Cap Fund | 9 |
| Disclosure of Fund Expenses | |
| Vulcan Value Partners Fund | 7 |
| Vulcan Value Partners Small Cap Fund | 11 |
| Statements of Investments | |
| Vulcan Value Partners Fund | 13 |
| Vulcan Value Partners Small Cap Fund | 16 |
| Statements of Assets and Liabilities | 19 |
| Statements of Operations | 21 |
| Statements of Changes in Net Assets | |
| Vulcan Value Partners Fund | 22 |
| Vulcan Value Partners Small Cap Fund | 23 |
| Financial Highlights | |
| Vulcan Value Partners Fund | 24 |
| Vulcan Value Partners Small Cap Fund | 28 |
| Notes to Financial Statements | 31 |
| Report of Independent Registered Public Accounting Firm | 42 |
| Additional Information | 43 |
| Disclosure Regarding Approval of Fund Advisory Agreements | 44 |
| Liquidity Risk Management Program | 47 |
| Trustees and Officers | 48 |
| Privacy Policy | 53 |
As permitted by regulations adopted by the U.S. Securities and Exchange Commission, paper copies of the Funds’ annual and semi-annual shareholder reports will no longer be sent by mail, unless you specifically request paper copies of the reports. Instead, the reports will be made available on the Funds’ website at www.vulcanvaluepartners.com and you will be notified by mail each time a report is posted and provided with a website link to access the report.
You may, notwithstanding the availability of shareholder reports online, elect to receive all future shareholder reports in paper free of charge. If you invest through a financial intermediary, you can contact your financial intermediary to request that you continue to receive paper copies of your shareholder reports. If you invest directly with the Funds, you can call 1.877.421.5078 to let the Funds know you wish to continue receiving paper copies of your shareholder reports.
If you already elected to receive shareholder reports electronically, you will not be affected by this change and you need not take any action. You may elect to receive shareholder reports and other communications from the Funds electronically anytime by contacting your financial intermediary (such as a broker-dealer or bank) or, if you are a direct investor, by enrolling at www.vulcanvaluepartners.com.
Shareholder Letter
April 30, 2021 (Unaudited)
PORTFOLIO REVIEW
General
Vulcan Value Partners Fund returned 58.62% versus 45.93% for the Russell 1000® Value Index, the Fund’s primary benchmark, and 45.98% for the S&P 500® Index, the Fund’s secondary benchmark, for the year ended April 30, 2021. The Vulcan Value Partners Small Cap Fund returned 88.51% versus 74.91% for the Russell 2000® Value Index, the Fund’s primary benchmark, and 78.96% for the Russell Value 2000® Index, the Fund’s secondary benchmark, for the year ended April 30, 2021.
As we have often said, we place no weight on short-term results, good or bad, and neither should you. In fact, we have made and will continue to make decisions that could negatively impact short-term performance when we think we can improve our long-term returns and mitigate risk. We encourage you to place more weight on our longer-term historical results and a great deal of weight on our long-term prospects.
We generally define material contributors and detractors as companies having a greater than 1% impact on the portfolio.
Performance data quoted represents past performance. Past performance does not guarantee future results.
Vulcan Value Partners Fund Review
In the discussion that follows, we highlight a few holdings in the Vulcan Value Partners Fund. Material contributors over the one-year period ending April 30, 2021 include KKR & Co. Inc., Skyworks Solutions Inc., Qorvo Inc., Carlyle Group Inc., General Electric Company, Alphabet Inc., NVIDIA Corp., Mastercard Inc., Amazon.com Inc., Jones Lang LaSalle Inc., Facebook Inc., TransDigm Group Inc., Hilton Worldwide Holdings Inc., Microsoft Corp., Visa Inc., Anthem Inc., Salesforce.com Inc., HEICO Corporation, Compass Group plc, and Credit Acceptance Corp.
The Fund did not have any material detractors during the period.
KKR & Co. Inc. materially contributed to performance during this period. KKR is a global investment firm that manages multiple alternative asset classes, including private equity, energy, infrastructure, real estate, various debt strategies, hedge funds, and portfolio re-financings. The company has deep and growing relationships with capital providers. KKR enjoys a very stable management fee stream and a proven ability to convert capital into a performance fee stream, both of which lead to a business with a stable and growing intrinsic value. In addition, the company enjoys nice tailwinds of increasing allocations to private and alternative investments. In addition to reporting solid results, KKR increased disclosure around its compensation ratio, improving transparency and making it easier to model the company’s earning power.
Skyworks Solutions and Qorvo, Inc. materially contributed to performance during this period. Qorvo and Skyworks Solutions are the two major providers of radio frequency (RF) systems to mobile device manufacturers and industry leaders in RF systems for the internet of things (IoT). The companies are benefitting during the pandemic as individuals are even more reliant on mobile communication. This phenomenon is accelerating the transition to 5G which contributes to their performance. Both company’s competitive positions have benefitted from COVID-19.
| Annual Report | April 30, 2021 | 1 |
Shareholder Letter
April 30, 2021 (Unaudited)
Partners Group Holding AG, a new position during the period, is a diversified Swiss private equity firm that invests globally. We like Partners Group for several reasons including its annuity-like fee streams, the ability to dependably convert investments to a fee stream from performance, and the tailwind of increasing capital flows into private equity. Partners Group pioneered a channel in the defined contribution space. While the defined contribution space is a new and relatively small source of investor capital for the company, this untapped channel has the potential to be a large portion of future growth. In addition, we believe Partners Group will likely capture a large share of private equity allocations from European investors.
We sold National Oilwell Varco during the period. National Oilwell Varco has been a disappointing investment for us. Our investment case was based on the belief that demand for National Oilwell Varco’s products was largely independent of oil prices over the long term. National Oilwell Varco’s products are used in harsh environments and are very important to safety and oil field productivity. National Oilwell Varco’s customers reacted to the fall in oil prices by cannibalizing existing equipment and becoming dramatically more efficient than we anticipated, resulting in lower demand for National Oilwell Varco’s products. National Oilwell Varco continues to produce free cash flow, has a strong balance sheet, and will, in our opinion, be a survivor in the current industry shakeout. However, its value has declined, and our original investment case is no longer intact. We used the proceeds from National Oilwell Varco to buy businesses with better long-term prospects and deeply discounted prices.
Vulcan Value Partners Small Cap Fund Review
In the discussion that follows, we highlight a few holdings in the Vulcan Value Partners Small Cap Fund. Material contributors over the one-year period ending April 30, 2021 include Virtus Investment Partners Inc., Park Hotels & Resorts Inc., Upstart Holdings Inc., Cerence Inc., Littelfuse Inc., Knoll Inc., Herman Miller Inc., EnerSys, Acuity Brands Inc., Colliers International Group Inc., Jones Lang LaSalle Inc., ISS A/S, Coherent Inc., Stabilus SA, Cushman & Wakefield plc, Carlisle Companies Inc., Curtiss-Wright Corp., Timken Company, ABM Industries Inc., Howden Joinery Group plc, Forterra plc, Savills plc, ACI Worldwide Inc., and Wyndham Hotels & Resorts Inc.
The Fund did not have any material detractors during the period.
Virtus Investment Partners was a material contributor during the period. It has strong investment performance across the company, produced positive net inflows, and net fees have been stable. Virtus and Allianz plan to create a strategic partnership which will add approximately 23 billion dollars to Virtus’ assets under management (AUM). We feel the market underappreciates Virtus’ value, even after its strong performance through the current crisis.
Upstart Holdings Inc. was a purchase and a material contributor during the period. It is a cloud-based lending platform that uses artificial intelligence in its underwriting. Upstart generates positive earnings and robust free cash flow. The company reported strong results with increased fee revenue for the fourth quarter and for the year. We believe that the company's unique product offering will continue to drive strong future growth. Despite the stock price appreciation during the quarter, we believe the stock continues to trade at a discount to our estimate of intrinsic value.
Park Hotels & Resorts Inc. also was a material contributor during the period. We believe the company is well positioned to take advantage of the global economic recovery which is occurring
| 2 | www.vulcanvaluepartners.com |
Shareholder Letter
April 30, 2021 (Unaudited)
more quickly than many anticipated. As of the end of the period, we are pleased to continue to own this business.
Coherent Inc. was a material contributor during the period. It is one of the world's leading providers of lasers and laser-based technology. Coherent received a buyout offer very close to our estimate of intrinsic value, so we exited the position.
Closing
After eight years and many contributions to our research efforts, Jim Falbe is leaving us at the end of May. We will miss working with him, but we will not “miss him” as we remain great friends and plan to stay in close contact. We wish Jim the best and are confident that he will be successful in his future endeavors.
We are pleased to announce that Jeff St. Denis, who many of you know, became a partner during the quarter. Jeff joined our Client Service team in 2016 and has made considerable contributions to Vulcan Value Partners. We are also pleased to announce that Trenton Green has been promoted from Associate Analyst to Equity Analyst. Trenton joined us as an Associate Analyst in 2018. His excellent work has exceeded our expectations and he has earned everyone’s respect on the research team and throughout the company.
Despite the recent stock market rally our price to value ratios are only modestly higher than at the beginning of the period. During the period, our portfolio companies’ values grew steadily, and we reallocated capital from more fully valued companies to more discounted companies as explained in the letter above. Your stable capital, combined with ours, and our shared long-term time horizon enabled us in our efforts to mitigate risk and improve our long-term prospects. We are grateful for you, our client partners, and appreciate the confidence you have placed in us. We look forward to updating you again.
C.T. Fitzpatrick, CFA
Chief Executive Officer
Vulcan Value Partners, LLC
Past performance does not guarantee future results. The Funds’ prices fluctuate as the underlying assets have exposure to market fluctuations and other risks, as described in the Funds’ prospectus. Please call 877.421.5078 to obtain current performance information and for the current prospectus and statement of additional information. This material must be preceded or accompanied by a prospectus. Please read the prospectus carefully before investing.
The views of the Vulcan Value Partners, LLC and information discussed in this commentary are as of the date of publication, are subject to change, and may not reflect the writer's current views. The views expressed represent an assessment of market conditions at a specific point in time, are opinions only and should not be relied upon as investment advice regarding a particular investment or markets in general. Such information does not constitute a recommendation to buy or sell specific securities or investment vehicles. It should not be assumed that any investment will be profitable or will equal the performance of the Funds or any securities or any sectors mentioned in this letter. The subject matter contained in this letter has been derived from several sources believed to be reliable and accurate at the time of compilation. Neither Vulcan Value Partners, LLC nor the Funds accept any liability for losses either direct or consequential caused by the use of this information.
The Funds are distributed by ALPS Distributors, Inc.
| Annual Report | April 30, 2021 | 3 |
Shareholder Letter
April 30, 2021 (Unaudited)
The Funds are subject to investment risks, including possible loss of the principal amount invested and therefore is not suitable for all investors. The Funds may not achieve their objectives.
Diversification does not eliminate the risk of experiencing investment losses.
Internet of things (IoT) is the interconnection via the internet of computing devices embedded in everyday objects, enabling them to send and receive data.
Free cash flow is the amount of cash that a company has left over after it has paid all of its expenses, including investments. Free cash flow yield is a security’s free cash flow divided by its market price.
The price to value ratio is a calculation that compares the price of a company’s stock to our appraisal of the company’s intrinsic value.
Fair, or intrinsic, value is our estimate of the price a willing buyer would pay and a willing seller would accept, assuming neither was compelled to enter into a transaction.
| 4 | www.vulcanvaluepartners.com |
Fund Overview
April 30, 2021 (Unaudited)
VULCAN VALUE PARTNERS FUND
Annualized Total Returns (as of 4/30/21)
| Since | Expense Ratios(1) | |||||||
| 6 Month | 1 Year | 3 Year | 5 Year | 10 Year | Inception* | Total | Net(2) | |
| Vulcan Value Partners Fund - Investor Class(3) | 36.20% | 58.62% | 17.94% | 16.06% | 14.26% | 14.07% | 1.09% | 1.09% |
| Vulcan Value Partners Fund - Institutional Class | 36.32% | 59.02% | – | – | – | 24.30% | 1.14% | 0.85% |
| S&P 500® Total Return Index(4) | 28.86% | 45.98% | 18.67% | 17.42% | 14.17% | 14.58% | ||
| Russell 1000® Value Index(5) | 36.30% | 45.93% | 12.30% | 12.15% | 11.13% | 11.95% | ||
Performance data quoted represents past performance. Past performance does not guarantee future results. Investment return and principal value of an investment will fluctuate so that an investor’s shares, when sold or redeemed, may be worth more or less than the original cost. The Fund imposes a 2.00% redemption fee on shares held for less than 90 days. Current performance data may be higher or lower than actual data quoted. For the most current month-end performance data, please call 1.877-421-5078.
The table does not reflect the deduction of taxes that a shareholder would pay on Fund distributions or the redemption of Fund shares.
Subject to investment risks, including possible loss of the principal amount invested.
Returns for periods less than 1 year are cumulative.
| * | Inception Dates – Investor Class: 12/30/09, Institutional Class: 5/01/19 |
| (1) | Ratios as of the Prospectus dated August 31, 2020 and may differ from the ratios presented in the Financial Highlights. |
| (2) | Vulcan Value Partners, LLC (“Vulcan” or the “Adviser”) has contractually agreed to limit the Fund’s total annual fund operating expenses (exclusive of Acquired Fund Fees and Expenses, brokerage expenses, interest expense, taxes and extraordinary expenses) to 1.25% and 0.85% of the Fund’s average daily net assets with respect to Investor Class shares and Institutional Class shares, respectively. This agreement (the “Expense Agreement”) is in effect through August 31, 2021. The Adviser will be permitted to recover, on a class-by-class basis, expenses it has borne through the Expense Agreement to the extent that the Fund’s expenses in later periods fall below the expense cap in effect at the time of waiver or reimbursement. Notwithstanding the foregoing, the Fund will not be obligated to pay any such fees and expenses more than three years after the end of the fiscal year in which the fees or expenses were foregone or reimbursed. The Adviser may not discontinue or modify this waiver prior to August 31, 2021 without the approval by the Fund’s Board of Trustees. |
| (3) | The initial share class of the Fund was redesignated as Investor Class shares effective April 23, 2019. |
| (4) | The S&P 500® Total Return Index is an unmanaged index of 500 common stocks chosen for market size, liquidity and industry group representation. It is a market-value weighted index. The Index is not actively managed and does not reflect any deductions for fees, expenses or taxes. An investor may not invest directly in the Index. |
| (5) | The Russell 1000® Value Index is presented here as an additional index, and measures the performance of the large-cap value segment of the U.S. equity universe. It includes those Russell 1000® companies with lower price-to-book ratios and lower expected growth values. The Index is not actively managed and does not reflect any deductions for fees, expenses or taxes. An investor may not invest directly in the Index. |
| Annual Report | April 30, 2021 | 5 |
Fund Overview
April 30, 2021 (Unaudited)
Growth of $10,000 Initial Investment (for the period ended April 30, 2021)

The chart above represents historical performance of a hypothetical investment of $10,000 in the Fund since inception. Past performance does not guarantee future results. This chart does not reflect the deduction of taxes that a shareholder would pay on Fund distributions or the redemption of Fund shares.
Investing in the Fund is subject to investment risks, including possible loss of the principal amount invested.
Industry Allocation (as a % of Net Assets)*

Top Ten Holdings (as a % of Net Assets)*
| Mastercard, Inc. | 7.05% |
| Amazon.com, Inc. | 6.75% |
| KKR & Co., Inc. | 6.35% |
| TransDigm Group, Inc. | 5.90% |
| Visa, Inc. | 5.56% |
| Wayfair, Inc. | 5.15% |
| Facebook, Inc. | 4.97% |
| NVIDIA Corp. | 4.94% |
| CoStar Group, Inc. | 4.59% |
| SAP SE | 4.40% |
| Top Ten Holdings | 55.66% |
| * | Holdings are subject to change, and may not reflect the current or future position of the portfolio. |
| 6 | www.vulcanvaluepartners.com |
Disclosure of Fund Expenses
April 30, 2021 (Unaudited)
As a shareholder of the Vulcan Value Partners Fund (the “Fund”), you will incur two types of costs: (1) transaction costs, including applicable redemption fees; and (2) ongoing costs, including management fees and other fund operating expenses. The following examples are intended to help you understand your ongoing costs (in dollars) of investing in the Fund and to compare these costs with the ongoing costs of investing in other mutual funds. The examples are based on an investment of $1,000 invested on November 1, 2020 and held until April 30, 2021.
Actual Expenses. The first line of each table below provides information about actual account values and actual expenses. You may use the information in this line, together with the amount you invested, to estimate the expenses that you paid over the period. Simply divide your account value by $1,000 (for example, an $8,600 account value divided by $1,000 = 8.6), then multiply the result by the number in the first line under the heading “Expenses Paid During Period” to estimate the expenses you paid on your account during this period.
Hypothetical Example for Comparison Purposes. The second line of the table below provides information about hypothetical account values and hypothetical expenses based on the Fund’s actual expense ratio and an assumed rate of return of 5% per year before expenses, which is not the Fund’s actual return. The hypothetical account values and expenses may not be used to estimate the actual ending account balance or expenses you paid for the period. You may use this information to compare the ongoing costs of investing in the Fund and other mutual funds. To do so, compare this 5% hypothetical example with the 5% hypothetical examples that appear in the shareholder reports of the other mutual funds.
Please note the expenses shown in the table are meant to highlight ongoing Fund costs only and do not reflect transactional costs, such as redemption fees or exchange fees. Therefore, the second line of the table below is useful in comparing your ongoing costs only, and will not help you determine the relative total costs of owning different funds. In addition, if these transactional costs were included, your costs would have been higher.
Vulcan Value Partners Fund
| Beginning Account Value 11/1/20 | Ending Account Value 4/30/21 | Expense Ratio(a) | Expenses Paid During period 11/1/20 - 4/30/21(b) | |
| VULCAN VALUE PARTNERS FUND | ||||
| Investor Class | ||||
| Actual | $1,000.00 | $1,362.00 | 1.07% | $ 6.27 |
| Hypothetical (5% return before expenses) | $1,000.00 | $1,019.49 | 1.07% | $ 5.36 |
| Institutional Class | ||||
| Actual | $1,000.00 | $1,363.20 | 0.85% | $ 4.98 |
| Hypothetical (5% return before expenses) | $1,000.00 | $1,020.58 | 0.85% | $ 4.26 |
| Annual Report | April 30, 2021 | 7 |
Disclosure of Fund Expenses
April 30, 2021 (Unaudited)
| (a) | The Fund's expense ratios have been annualized based on the Fund's most recent fiscal half-year expenses. |
| (b) | Expenses are equal to the Fund's annualized expense ratio multiplied by the average account value over the period, multiplied by the number of days in the most recent fiscal half-year (181)/365 (to reflect the half-year period). |
| 8 | www.vulcanvaluepartners.com |
Fund Overview
April 30, 2021 (Unaudited)
VULCAN VALUE PARTNERS SMALL CAP FUND
Annualized Total Returns (as of 4/30/21)
| Since | Expense Ratios(1) | |||||||
| 6 Month | 1 Year | 3 Year | 5 Year | 10 Year | Inception* | Total | Net(2) | |
| Vulcan Value Partners Small Cap Fund – Investor Class(3) | 70.36% | 88.51% | 12.82% | 12.54% | 11.34% | 13.34% | 1.27% | 1.26% |
| Vulcan Value Partners Small Cap Fund – Institutional Class | 70.63% | 89.07% | – | – | – | 17.84% | 1.33% | 1.01% |
| Russell 2000® Value Index(4) | 59.17% | 78.96% | 11.68% | 13.54% | 10.10% | 11.64% | ||
| Russell 2000® Index(5) | 48.06% | 74.91% | 15.23% | 16.48% | 11.63% | 13.42% | ||
Performance data quoted represents past performance. Past performance does not guarantee future results. Investment return and principal value of an investment will fluctuate so that an investor’s shares, when sold or redeemed, may be worth more or less than the original cost. The Fund imposes a 2.00% redemption fee on shares held for less than 90 days. Current performance data may be higher or lower than actual data quoted. For the most current month-end performance data, please call 1.877-421-5078.
The table does not reflect the deduction of taxes that a shareholder would pay on Fund distributions or the redemption of Fund shares.
Subject to investment risks, including possible loss of the principal amount invested.
Returns for periods less than 1 year are cumulative.
| * | Inception Dates – Investor Class: 12/30/09, Institutional Class: 5/01/19 |
| (1) | Ratios as of the Prospectus dated August 31, 2020 and may differ from the ratios presented in the Financial Highlights. |
| (2) | Vulcan Value Partners, LLC (“Vulcan” or the “Adviser”) has contractually agreed to limit the Fund’s total annual fund operating expenses (exclusive of Acquired Fund Fees and Expenses, brokerage expenses, interest expense, taxes and extraordinary expenses) to 1.25% and 1.00% of the Fund’s average daily net assets with respect to Investor Class shares and Institutional Class shares, respectively. This agreement (the “Expense Agreement”) is in effect through August 31, 2021. The Adviser will be permitted to recover, on a class-by-class basis, expenses it has borne through the Expense Agreement to the extent that the Fund’s expenses in later periods fall below the expense cap in effect at the time of waiver or reimbursement. Notwithstanding the foregoing, the Fund will not be obligated to pay any such fees and expenses more than three years after the end of the fiscal year in which the fees or expenses were foregone or reimbursed. The Adviser may not discontinue or modify this waiver prior to August 31, 2021 without the approval by the Fund’s Board of Trustees. |
| (3) | The initial share class of the Fund was redesignated as Investor Class shares effective April 23, 2019. |
| (4) | The Russell 2000® Value Index is presented here as the primary index, and measures the performance of small-cap value segment of the U.S. equity universe. It includes those Russell 2000® companies with lower price-to-book ratios and lower forecasted growth values. The Index is not actively managed and does not reflect any deductions for fees, expenses or taxes. An investor may not invest directly in the Index. |
| (5) | The Russell 2000® Index is presented here as an additional index, and measures the performance of the small-cap segment of the U.S. equity universe. The Russell 2000® Index is a subset of the Russell 3000® Index representing approximately 8% of the total market capitalization of that index. It includes approximately 2,000 of the smallest securities based on a combination of their market cap and current index membership. The Index is not actively managed and does not reflect any deductions for fees, expenses or taxes. An investor may not invest directly in the Index. |
| Annual Report | April 30, 2021 | 9 |
Fund Overview
April 30, 2021 (Unaudited)
Growth of $10,000 Initial Investment (for the period ended April 30, 2021)
The chart above represents historical performance of a hypothetical investment of $10,000 in the Fund since inception. Past performance does not guarantee future results. This chart does not reflect the deduction of taxes that a shareholder would pay on Fund distributions or the redemption of Fund shares.
Investing in the Fund is subject to investment risks, including possible loss of the principal amount invested.
Industry Allocation (as a % of Net Assets)*
Top Ten Holdings (as a % of Net Assets)*
| Upstart Holdings, Inc. | 6.85% |
| Cerence, Inc. | 6.19% |
| ISS A/S | 6.04% |
| Cushman & Wakefield PLC | 6.00% |
| Virtus Investment Partners, Inc. | 4.81% |
| ABM Industries, Inc. | 4.52% |
| PROG Holdings, Inc. | 4.36% |
| Colliers International Group, Inc. | 4.34% |
| Carlisle Cos., Inc. | 4.11% |
| Premium Brands Holdings Corp. | 3.77% |
| Top Ten Holdings | 50.99% |
| * | Holdings are subject to change, and may not reflect the current or future position of the portfolio. |
| 10 | www.vulcanvaluepartners.com |
Disclosure of Fund Expenses
April 30, 2021 (Unaudited)
As a shareholder of the Vulcan Value Partners Small Cap Fund (the “Fund”), you will incur two types of costs: (1) transaction costs, including applicable redemption fees; and (2) ongoing costs, including management fees and other fund operating expenses. The following examples are intended to help you understand your ongoing costs (in dollars) of investing in the Fund and to compare these costs with the ongoing costs of investing in other mutual funds. The examples are based on an investment of $1,000 invested on November 1, 2020 and held until April 30, 2021.
Actual Expenses. The first line of each table below provides information about actual account values and actual expenses. You may use the information in this line, together with the amount you invested, to estimate the expenses that you paid over the period. Simply divide your account value by $1,000 (for example, an $8,600 account value divided by $1,000 = 8.6), then multiply the result by the number in the first line under the heading “Expenses Paid During Period” to estimate the expenses you paid on your account during this period.
Hypothetical Example for Comparison Purposes. The second line of the table below provides information about hypothetical account values and hypothetical expenses based on the Fund’s actual expense ratio and an assumed rate of return of 5% per year before expenses, which is not the Fund’s actual return. The hypothetical account values and expenses may not be used to estimate the actual ending account balance or expenses you paid for the period. You may use this information to compare the ongoing costs of investing in the Fund and other mutual funds. To do so, compare this 5% hypothetical example with the 5% hypothetical examples that appear in the shareholder reports of the other mutual funds.
Please note the expenses shown in the table are meant to highlight ongoing Fund costs only and do not reflect transactional costs, such as redemption fees or exchange fees. Therefore, the second line of the table below is useful in comparing your ongoing costs only, and will not help you determine the relative total costs of owning different funds. In addition, if these transactional costs were included, your costs would have been higher.
Vulcan Value Partners Small Cap Fund
| Beginning Account Value 11/1/20 | Ending Account Value 4/30/21 | Expense Ratio(a) | Expenses Paid During period 11/1/20 - 4/30/21(b) | |
| VULCAN VALUE PARTNERS SMALL CAP FUND | ||||
| Investor Class | ||||
| Actual | $1,000.00 | $1,703.60 | 1.25% | $ 8.38 |
| Hypothetical (5% return before expenses) | $1,000.00 | $1,018.60 | 1.25% | $ 6.26 |
| Institutional Class | ||||
| Actual | $1,000.00 | $1,706.30 | 1.00% | $ 6.71 |
| Hypothetical (5% return before expenses) | $1,000.00 | $1,019.84 | 1.00% | $ 5.01 |
| Annual Report | April 30, 2021 | 11 |
Disclosure of Fund Expenses
April 30, 2021 (Unaudited)
| (a) | The Fund's expense ratios have been annualized based on the Fund's most recent fiscal half-year expenses. |
| (b) | Expenses are equal to the Fund's annualized expense ratio multiplied by the average account value over the period, multiplied by the number of days in the most recent fiscal half-year (181)/365 (to reflect the half-year period). |
| 12 | www.vulcanvaluepartners.com |
| Vulcan Value Partners Fund | Statement of Investments |
April 30, 2021
| Value | ||||||||
| Shares | (Note 2) | |||||||
| COMMON STOCKS (99.06%) | ||||||||
| Communications (20.91%) | ||||||||
| Internet (20.91%) | ||||||||
| Alphabet, Inc., Class C(a) | 29,701 | $ | 71,582,974 | |||||
| Amazon.com, Inc.(a) | 34,477 | 119,546,240 | ||||||
| Facebook, Inc., Class A(a) | 270,929 | 88,073,599 | ||||||
| Wayfair, Inc., Class A(a) | 308,607 | 91,214,971 | ||||||
| 370,417,784 | ||||||||
| TOTAL COMMUNICATIONS | 370,417,784 | |||||||
| Consumer, Non-cyclical (7.56%) | ||||||||
| Commercial Services (4.59%) | ||||||||
| CoStar Group, Inc.(a) | 95,172 | 81,317,812 | ||||||
| Healthcare-Services (2.97%) | ||||||||
| Anthem, Inc. | 138,766 | 52,646,433 | ||||||
| TOTAL CONSUMER, NON-CYCLICAL | 133,964,245 | |||||||
| Financial (29.79%) | ||||||||
| Diversified Financial Services (12.60%) | ||||||||
| Mastercard, Inc., Class A | 326,909 | 124,898,853 | ||||||
| Visa, Inc., Class A | 421,543 | 98,455,583 | ||||||
| 223,354,436 | ||||||||
| Private Equity (14.55%) | ||||||||
| Carlyle Group, Inc. | 1,771,678 | 75,579,783 | ||||||
| KKR & Co., Inc., Class A | 1,988,552 | 112,512,272 | ||||||
| Partners Group Holding AG | 48,984 | 69,728,114 | ||||||
| 257,820,169 | ||||||||
| Real Estate (2.64%) | ||||||||
| Jones Lang LaSalle, Inc.(a) | 248,776 | 46,747,498 | ||||||
| TOTAL FINANCIAL | 527,922,103 | |||||||
| Industrial (12.32%) | ||||||||
| Aerospace/Defense (9.59%) | ||||||||
| HEICO Corp., Class A | 516,989 | 65,285,371 | ||||||
| TransDigm Group, Inc.(a) | 170,374 | 104,565,339 | ||||||
| 169,850,710 | ||||||||
| Annual Report | April 30, 2021 | 13 |
| Statement of Investments | Vulcan Value Partners Fund |
April 30, 2021
| Value | ||||||||
| Shares | (Note 2) | |||||||
| Industrial (continued) | ||||||||
| Electric Equipment Manufacturing (2.73%) | ||||||||
| General Electric Co. | 3,692,183 | $ | 48,441,441 | |||||
| TOTAL INDUSTRIAL | 218,292,151 | |||||||
| Technology (28.48%) | ||||||||
| Semiconductors (12.88%) | ||||||||
| NVIDIA Corp. | 145,888 | 87,588,238 | ||||||
| Qorvo, Inc.(a) | 403,231 | 75,875,977 | ||||||
| Skyworks Solutions, Inc. | 357,300 | 64,789,209 | ||||||
| 228,253,424 | ||||||||
| Software (15.60%) | ||||||||
| Microsoft Corp. | 257,622 | 64,967,116 | ||||||
| salesforce.com, Inc.(a) | 335,804 | 77,342,377 | ||||||
| SAP SE | 555,317 | 77,952,815 | ||||||
| SS&C Technologies Holdings, Inc. | 756,410 | 56,140,750 | ||||||
| 276,403,058 | ||||||||
| TOTAL TECHNOLOGY | 504,656,482 | |||||||
| TOTAL COMMON STOCKS | ||||||||
| (Cost $1,148,194,989) | 1,755,252,765 | |||||||
| 7-Day | Value | |||||||||||
| Yield | Shares | (Note 2) | ||||||||||
| SHORT TERM INVESTMENTS (1.01%) | ||||||||||||
| Money Market Fund (1.01%) | ||||||||||||
| Invesco Government & Agency Portfolio, Institutional Class | 0.030 | % | 17,893,181 | 17,893,181 | ||||||||
| TOTAL SHORT TERM INVESTMENTS | ||||||||||||
| (Cost $17,893,181) | 17,893,181 | |||||||||||
| TOTAL INVESTMENTS (100.07%) | ||||||||||||
| (Cost $1,166,088,170) | $ | 1,773,145,946 | ||||||||||
| Liabilities In Excess Of Other Assets (-0.07%) | (1,181,526 | ) | ||||||||||
| NET ASSETS (100.00%) | $ | 1,771,964,420 | ||||||||||
| (a) | Non-Income Producing Security. |
| 14 | www.vulcanvaluepartners.com |
| Vulcan Value Partners Fund | Statement of Investments |
April 30, 2021
For Fund compliance purposes, the Fund's industry classifications refer to any one or more of the industry sub-classifications used by one or more widely recognized market indexes or ratings group indexes, and/or as defined by Fund management. This definition may not apply for purposes of this report, which may combine industry sub-classifications for reporting ease. Industries are shown as a percentage of net assets.
See Accompanying Notes to Financial Statements.
| Annual Report | April 30, 2021 | 15 |
| Statement of Investments | Vulcan Value Partners Small Cap Fund |
April 30, 2021
| Value | ||||||||
| Shares | (Note 2) | |||||||
| COMMON STOCKS (93.52%) | ||||||||
| Consumer, Cyclical (7.38%) | ||||||||
| Home Furnishings (4.58%) | ||||||||
| Herman Miller, Inc. | 725,497 | $ | 30,108,125 | |||||
| Howden Joinery Group PLC(a) | 671,267 | 7,497,973 | ||||||
| Tempur Sealy International, Inc. | 241,497 | 9,210,696 | ||||||
| 46,816,794 | ||||||||
| Office Furnishings (2.80%) | ||||||||
| Knoll, Inc. | 1,194,145 | 28,540,066 | ||||||
| TOTAL CONSUMER, CYCLICAL | 75,356,860 | |||||||
| Consumer, Non-cyclical (23.81%) | ||||||||
| Commercial Services (20.04%) | ||||||||
| ABM Industries, Inc. | 898,899 | 46,212,398 | ||||||
| Boyd Group Services, Inc. | 97,743 | 18,153,805 | ||||||
| Colliers International Group, Inc. | 410,647 | 44,300,599 | ||||||
| ISS A/S(a) | 3,247,816 | 61,670,383 | ||||||
| Sdiptech AB, Class B(a) | 763,648 | 34,278,486 | ||||||
| 204,615,671 | ||||||||
| Food (3.77%) | ||||||||
| Premium Brands Holdings Corp. | 396,079 | 38,530,013 | ||||||
| TOTAL CONSUMER, NON-CYCLICAL | 243,145,684 | |||||||
| Financial (27.38%) | ||||||||
| Diversified Financial Services (16.02%) | ||||||||
| PROG Holdings, Inc. | 874,578 | 44,551,004 | ||||||
| Upstart Holdings, Inc.(a) | 641,762 | 69,964,893 | ||||||
| Virtus Investment Partners, Inc. | 179,639 | 49,124,081 | ||||||
| 163,639,978 | ||||||||
| Real Estate (9.56%) | ||||||||
| Cushman & Wakefield PLC(a) | 3,603,210 | 61,254,570 | ||||||
| Jones Lang LaSalle, Inc.(a) | 193,281 | 36,319,433 | ||||||
| 97,574,003 | ||||||||
| REITS (1.80%) | ||||||||
| Park Hotels & Resorts, Inc.(a) | 824,950 | 18,404,634 | ||||||
| TOTAL FINANCIAL | 279,618,615 | |||||||
| 16 | www.vulcanvaluepartners.com |
| Vulcan Value Partners Small Cap Fund | Statement of Investments |
April 30, 2021
| Value | ||||||||
| Shares | (Note 2) | |||||||
| Industrial (28.76%) | ||||||||
| Aerospace/Defense (3.54%) | ||||||||
| Meggitt PLC(a) | 5,617,451 | $ | 36,152,027 | |||||
| Building Materials (10.16%) | ||||||||
| Curtiss-Wright Corp. | 253,075 | 32,368,292 | ||||||
| Forterra PLC(a) | 9,238,118 | 37,254,077 | ||||||
| Ibstock PLC | 8,340,038 | 25,431,651 | ||||||
| Victoria PLC(a) | 644,755 | 8,726,262 | ||||||
| 103,780,282 | ||||||||
| Electrical Components & Equipment (8.57%) | ||||||||
| Acuity Brands, Inc. | 191,314 | 35,492,573 | ||||||
| EnerSys | 309,149 | 28,311,866 | ||||||
| Littelfuse, Inc. | 89,558 | 23,754,364 | ||||||
| 87,558,803 | ||||||||
| Electronics (2.38%) | ||||||||
| Ituran Location and Control, Ltd. | 1,111,660 | 24,289,771 | ||||||
| Miscellaneous Manufacturing (4.11%) | ||||||||
| Carlisle Cos., Inc. | 219,165 | 42,002,972 | ||||||
| TOTAL INDUSTRIAL | 293,783,855 | |||||||
| Technology (6.19%) | ||||||||
| Software (6.19%) | ||||||||
| Cerence, Inc.(a) | 655,497 | 63,196,466 | ||||||
| TOTAL TECHNOLOGY | 63,196,466 | |||||||
| TOTAL COMMON STOCKS | ||||||||
| (Cost $658,599,533) | 955,101,480 | |||||||
| Annual Report | April 30, 2021 | 17 |
| Statement of Investments | Vulcan Value Partners Small Cap Fund |
April 30, 2021
| 7-Day | Value | |||||||||||
| Yield | Shares | (Note 2) | ||||||||||
| SHORT TERM INVESTMENTS (5.18%) | ||||||||||||
| Money Market Fund (5.18%) | ||||||||||||
| Invesco Government & Agency Portfolio, Institutional Class | 0.030 | % | 52,936,494 | $ | 52,936,494 | |||||||
| TOTAL SHORT TERM INVESTMENTS | ||||||||||||
| (Cost $52,936,494) | 52,936,494 | |||||||||||
| TOTAL INVESTMENTS (98.70%) | ||||||||||||
| (Cost $711,536,027) | $ | 1,008,037,974 | ||||||||||
| Other Assets In Excess Of Liabilities (1.30%) | 13,241,591 | |||||||||||
| NET ASSETS (100.00%) | $ | 1,021,279,565 | ||||||||||
| (a) | Non-Income Producing Security. |
For Fund compliance purposes, the Fund's industry classifications refer to any one or more of the industry sub-classifications used by one or more widely recognized market indexes or ratings group indexes, and/or as defined by Fund management. This definition may not apply for purposes of this report, which may combine industry sub-classifications for reporting ease. Industries are shown as a percentage of net assets.
See Accompanying Notes to Financial Statements.
| 18 | www.vulcanvaluepartners.com |
Statements of Assets and Liabilities
April 30, 2021
| Vulcan Value Partners Fund | Vulcan Value Partners Small Cap Fund | |||||||
| ASSETS: | ||||||||
| Investments, at value | $ | 1,773,145,946 | $ | 1,008,037,974 | ||||
| Cash | – | 4,223,653 | ||||||
| Foreign currency, at value (Cost $– and $51,136) | – | 50,967 | ||||||
| Receivable for investments sold | – | 15,871,140 | ||||||
| Receivable for shares sold | 733,196 | 20,076,536 | ||||||
| Dividends receivable | 143,855 | 568,348 | ||||||
| Other assets | 16,872 | 12,913 | ||||||
| Total assets | 1,774,039,869 | 1,048,841,531 | ||||||
| LIABILITIES: | ||||||||
| Payable for investments purchased | – | 19,721,905 | ||||||
| Payable for shares redeemed | 596,329 | 6,914,740 | ||||||
| Payable to adviser | 1,207,078 | 720,112 | ||||||
| Payable for administration fees | 83,079 | 47,143 | ||||||
| Payable for transfer agency fees | 17,606 | 18,542 | ||||||
| Payable for delegated transfer agent equivalent services fees | 60,424 | 52,213 | ||||||
| Payable for professional fees | 28,334 | 24,066 | ||||||
| Payable for trustee fees and expenses | 33,490 | 17,968 | ||||||
| Payable for principal financial officer fees | 1,656 | 889 | ||||||
| Accrued expenses and other liabilities | 47,453 | 44,388 | ||||||
| Total liabilities | 2,075,449 | 27,561,966 | ||||||
| NET ASSETS | $ | 1,771,964,420 | $ | 1,021,279,565 | ||||
| NET ASSETS CONSIST OF: | ||||||||
| Paid-in capital (Note 5) | $ | 1,102,715,891 | $ | 700,583,492 | ||||
| Total distributable earnings | 669,248,529 | 320,696,073 | ||||||
| NET ASSETS | $ | 1,771,964,420 | $ | 1,021,279,565 | ||||
| INVESTMENTS, AT COST | $ | 1,166,088,170 | $ | 711,536,027 | ||||
See Accompanying Notes to Financial Statements.
| Annual Report | April 30, 2021 | 19 |
Statements of Assets and Liabilities
April 30, 2021
| Vulcan Value Partners Fund | Vulcan Value Partners Small Cap Fund | |||||||
| PRICING OF SHARES: | ||||||||
| Investor Class: | ||||||||
| Net Asset Value, offering and redemption price per share | $ | 29.87 | $ | 22.62 | ||||
| Net Assets | $ | 624,789,371 | $ | 310,600,434 | ||||
| Shares of beneficial interest outstanding (unlimited number of shares, no par value common stock authorized) | 20,916,580 | 13,731,946 | ||||||
| Institutional Class: | ||||||||
| Net Asset Value, offering and redemption price per share | 29.93 | 22.70 | ||||||
| Net Assets | 1,147,175,049 | 710,679,131 | ||||||
| Shares of beneficial interest outstanding (unlimited number of shares, no par value common stock authorized) | 38,325,527 | 31,313,545 | ||||||
See Accompanying Notes to Financial Statements.
| 20 | www.vulcanvaluepartners.com |
Statements of Operations
For the Year Ended April 30, 2021
Vulcan Value Partners Fund | Vulcan Value Partners Small Cap Fund | |||||||
| INVESTMENT INCOME: | ||||||||
| Dividends | $ | 8,102,353 | $ | 3,916,048 | ||||
| Foreign taxes withheld | (1,013,908 | ) | (163,875 | ) | ||||
| Total investment income | 7,088,445 | 3,752,173 | ||||||
| EXPENSES: | ||||||||
| Investment advisory fees (Note 6) | 14,198,288 | 7,105,801 | ||||||
| Administrative fees | 438,494 | 197,277 | ||||||
| Transfer agency fees | 91,933 | 95,067 | ||||||
| Delegated transfer agent equivalent services fees | ||||||||
| Investor Class | 24,418 | 17,820 | ||||||
| Institutional Class | 442,180 | 225,283 | ||||||
| Professional fees | 43,674 | 31,144 | ||||||
| Custodian fees | 66,061 | 78,722 | ||||||
| Principal financial officer fees | 10,746 | 4,547 | ||||||
| Trustee fees and expenses | 71,848 | 33,596 | ||||||
| Recoupment of previously waived fees | ||||||||
| Investor Class | – | 32,352 | ||||||
| ReFlow Fees (Note 2) | 175,201 | – | ||||||
| Other | 129,778 | 88,214 | ||||||
| Total expenses before waiver | 15,692,621 | 7,909,823 | ||||||
| Less fees waived/reimbursed by investment adviser (Note 6) | ||||||||
| Investor Class | – | (9,343 | ) | |||||
| Institutional Class | (2,373,402 | ) | (1,148,576 | ) | ||||
| Total net expenses | 13,319,219 | 6,751,904 | ||||||
| NET INVESTMENT LOSS | (6,230,774 | ) | (2,999,731 | ) | ||||
| Net realized gain on investments(a) | 192,466,157 | 75,839,130 | ||||||
| Net realized gain/(loss) on foreign currency transactions | 313,121 | (71,717 | ) | |||||
| Net realized gain | 192,779,278 | 75,767,413 | ||||||
| Net change in unrealized appreciation of investments | 470,375,931 | 341,601,044 | ||||||
| Net change in unrealized appreciation/(depreciation) on translation of assets and liabilities denominated in foreign currencies | (74,717 | ) | 23,235 | |||||
| Net change in unrealized appreciation | 470,301,214 | 341,624,279 | ||||||
| NET REALIZED AND UNREALIZED GAIN ON INVESTMENTS | 663,080,492 | 417,391,692 | ||||||
| NET INCREASE IN NET ASSETS RESULTING FROM OPERATIONS | $ | 656,849,718 | $ | 414,391,961 | ||||
| (a) | See Note 2 for gain/(loss) on In-Kind transactions. |
See Accompanying Notes to Financial Statements.
| Annual Report | April 30, 2021 | 21 |
| Statements of Changes in Net Assets | Vulcan Value Partners Fund |
For the Year Ended April 30, 2021 | For the Year Ended April 30, 2020 | |||||||
| OPERATIONS: | ||||||||
| Net investment income/(loss) | $ | (6,230,774 | ) | $ | 3,207,527 | |||
| Net realized gain | 192,779,278 | 52,662,922 | ||||||
| Net change in unrealized appreciation/(depreciation) | 470,301,214 | (90,186,778 | ) | |||||
| Net increase/(decrease) in net assets resulting from operations | 656,849,718 | (34,316,329 | ) | |||||
| DISTRIBUTIONS TO SHAREHOLDERS (Note 3): | ||||||||
| From distributable earnings | ||||||||
| Investor Class | (19,870,128 | ) | (32,843,455 | ) | ||||
| Institutional Class(a) | (31,231,578 | ) | (33,490,625 | ) | ||||
| Net decrease in net assets from distributions | (51,101,706 | ) | (66,334,080 | ) | ||||
| SHARE TRANSACTIONS (Note 5): | ||||||||
| Investor Class | ||||||||
| Proceeds from sales of shares | 45,405,149 | 181,355,243 | ||||||
| Issued to shareholders in reinvestment of distributions | 16,646,680 | 28,416,427 | ||||||
| Cost of shares redeemed, net of redemption fees | (170,166,165 | ) | (974,172,281 | ) | ||||
| Institutional Class(a) | ||||||||
| Proceeds from sales of shares | 334,177,937 | 970,339,907 | ||||||
| Issued to shareholders in reinvestment of distributions | 28,723,974 | 31,558,042 | ||||||
| Cost of shares redeemed, net of redemption fees | (357,606,665 | ) | (152,367,669 | ) | ||||
| Net increase/(decrease) from share transactions | (102,819,090 | ) | 85,129,669 | |||||
| Net increase/(decrease) in net assets | 502,928,922 | (15,520,740 | ) | |||||
| NET ASSETS: | ||||||||
| Beginning of year | 1,269,035,498 | 1,284,556,238 | ||||||
| End of year | $ | 1,771,964,420 | $ | 1,269,035,498 | ||||
| (a) | Institutional Class inception date was May 1, 2019. |
See Accompanying Notes to Financial Statements.
| 22 | www.vulcanvaluepartners.com |
| Vulcan Value Partners Small Cap Fund | Statements of Changes in Net Assets |
For the Year Ended April 30, 2021 | For the Year Ended April 30, 2020 | |||||||
| OPERATIONS: | ||||||||
| Net investment income/(loss) | $ | (2,999,731 | ) | $ | 3,643,849 | |||
| Net realized gain/(loss) | 75,767,413 | (30,000,442 | ) | |||||
| Net change in unrealized appreciation/(depreciation) | 341,624,279 | (118,083,682 | ) | |||||
| Net increase/(decrease) in net assets resulting from operations | 414,391,961 | (144,440,275 | ) | |||||
| DISTRIBUTIONS TO SHAREHOLDERS (Note 3): | ||||||||
| From distributable earnings | ||||||||
| Investor Class | (230,257 | ) | (11,207,675 | ) | ||||
| Institutional Class(a) | (806,241 | ) | (12,648,479 | ) | ||||
| Net decrease in net assets from distributions | (1,036,498 | ) | (23,856,154 | ) | ||||
| SHARE TRANSACTIONS (Note 5): | ||||||||
| Investor Class | ||||||||
| Proceeds from sales of shares | 79,124,618 | 48,105,590 | ||||||
| Issued to shareholders in reinvestment of distributions | 178,374 | 9,756,596 | ||||||
| Cost of shares redeemed, net of redemption fees | (73,500,292 | ) | (371,647,565 | ) | ||||
| Institutional Class(a) | ||||||||
| Proceeds from sales of shares | 337,038,134 | 415,146,676 | ||||||
| Issued to shareholders in reinvestment of distributions | 690,932 | 11,957,260 | ||||||
| Cost of shares redeemed, net of redemption fees | (136,486,323 | ) | (87,317,255 | ) | ||||
| Net increase from share transactions | 207,045,443 | 26,001,302 | ||||||
| Net increase/(decrease) in net assets | 620,400,906 | (142,295,127 | ) | |||||
| NET ASSETS: | ||||||||
| Beginning of year | 400,878,659 | 543,173,786 | ||||||
| End of year | $ | 1,021,279,565 | $ | 400,878,659 | ||||
| (a) | Institutional Class inception date was May 1, 2019. |
See Accompanying Notes to Financial Statements.
| Annual Report | April 30, 2021 | 23 |
Financial Highlights
For a share outstanding throughout the years presented.
| Investor Class |
| NET ASSET VALUE, BEGINNING OF PERIOD |
| INCOME/(LOSS) FROM OPERATIONS: |
| Net investment income/(loss)(a) |
| Net realized and unrealized gain/(loss) on investments |
| Total from investment operations |
| LESS DISTRIBUTIONS TO SHAREHOLDERS: |
| From net investment income |
| From net realized gains on investments |
| Total distributions |
| Redemption fees added to paid-in capital |
| Increase/(decrease) in net asset value |
| NET ASSET VALUE, END OF YEAR |
| Total return |
| RATIOS AND SUPPLEMENTAL DATA: |
| Net assets, end of year (000's) |
| Ratio of expenses to average net assets without fee waivers/reimbursements |
| Ratio of expenses to average net assets including fee waivers/reimbursements |
| Net investment income/(loss) to average net assets including fee waivers/reimbursements |
| Portfolio turnover rate |
| (a) | Per share numbers have been calculated using the average shares method. |
| (b) | Less than $0.005 per share. |
See Accompanying Notes to Financial Statements.
| 24 | www.vulcanvaluepartners.com |
Vulcan Value Partners Fund
For the Year Ended April 30, 2021 | For the Year Ended April 30, 2020 | For the Year Ended April 30, 2019 | For the Year Ended April 30, 2018 | For the Year Ended April 30, 2017 | ||||||||||||||
| $ | 19.50 | $ | 21.05 | $ | 21.39 | $ | 19.30 | $ | 17.17 | |||||||||
| (0.14 | ) | 0.03 | 0.08 | 0.09 | 0.18 | |||||||||||||
| 11.42 | (0.53 | ) | 1.13 | 2.35 | 2.18 | |||||||||||||
| 11.28 | (0.50 | ) | 1.21 | 2.44 | 2.36 | |||||||||||||
| 0.00 | (b) | 0.00 | (b) | (0.13 | ) | (0.12 | ) | (0.23 | ) | |||||||||
| (0.91 | ) | (1.05 | ) | (1.42 | ) | (0.23 | ) | – | ||||||||||
| (0.91 | ) | (1.05 | ) | (1.55 | ) | (0.35 | ) | (0.23 | ) | |||||||||
| 0.00 | (b) | 0.00 | (b) | 0.00 | (b) | 0.00 | (b) | 0.00 | (b) | |||||||||
| 10.37 | (1.55 | ) | (0.34 | ) | 2.09 | 2.13 | ||||||||||||
| $ | 29.87 | $ | 19.50 | $ | 21.05 | $ | 21.39 | $ | 19.30 | |||||||||
| 58.62 | % | (3.15 | %) | 6.80 | % | 12.72 | % | 13.85 | % | |||||||||
| $ | 624,789 | $ | 500,309 | $ | 1,284,556 | $ | 1,314,519 | $ | 1,284,669 | |||||||||
| 1.08 | % | 1.09 | % | 1.08 | % | 1.08 | % | 1.07 | % | |||||||||
| 1.08 | % | 1.09 | % | 1.08 | % | 1.08 | % | 1.07 | % | |||||||||
| (0.57 | %) | 0.12 | % | 0.38 | % | 0.46 | % | 1.01 | % | |||||||||
| 67 | % | 80 | % | 73 | % | 50 | % | 49 | % | |||||||||
See Accompanying Notes to Financial Statements.
| Annual Report | April 30, 2021 | 25 |
| Financial Highlights | Vulcan Value Partners Fund |
For a share outstanding throughout the periods presented.
| Institutional Class | For the Year Ended April 30, 2021 | For the Period May 1, 2019 (Inception) to April 30, 2020 | ||||||
| NET ASSET VALUE, BEGINNING OF PERIOD | $ | 19.52 | $ | 21.02 | ||||
| INCOME/(LOSS) FROM OPERATIONS: | ||||||||
| Net investment income/(loss)(a) | (0.09 | ) | 0.09 | |||||
| Net realized and unrealized gain/(loss) on investments | 11.46 | (0.51 | ) | |||||
| Total from investment operations | 11.37 | (0.42 | ) | |||||
| LESS DISTRIBUTIONS TO SHAREHOLDERS: | ||||||||
| From net investment income | (0.05 | ) | (0.03 | ) | ||||
| From net realized gains on investments | (0.91 | ) | (1.05 | ) | ||||
| Total distributions | (0.96 | ) | (1.08 | ) | ||||
| Redemption fees added to paid-in capital | 0.00 | (b) | 0.00 | (b) | ||||
| Increase/(decrease) in net asset value | 10.41 | (1.50 | ) | |||||
| NET ASSET VALUE, END OF YEAR | $ | 29.93 | $ | 19.52 | ||||
| Total return | 59.02 | % | (2.83 | %) | ||||
| RATIOS AND SUPPLEMENTAL DATA: | ||||||||
| Net assets, end of year (000's) | $ | 1,147,175 | $ | 768,726 | ||||
| Ratio of expenses to average net assets without fee waivers/reimbursements | 1.12 | % | 1.14 | % | ||||
| Ratio of expenses to average net assets including fee waivers/reimbursements | 0.85 | % | 0.85 | % | ||||
| Net investment income/(loss) to average net assets including fee waivers/reimbursements | (0.36 | %) | 0.40 | % | ||||
| Portfolio turnover rate | 67 | % | 80 | % | ||||
| (a) | Per share numbers have been calculated using the average shares method. |
| (b) | Less than $0.005 per share. |
See Accompanying Notes to Financial Statements.
| 26 | www.vulcanvaluepartners.com |
Intentionally Left Blank
Financial Highlights
For a share outstanding throughout the years presented.
| Investor Class |
| NET ASSET VALUE, BEGINNING OF PERIOD |
| INCOME/(LOSS) FROM OPERATIONS: |
| Net investment income/(loss)(a) |
| Net realized and unrealized gain/(loss) on investments |
| Total from investment operations |
| LESS DISTRIBUTIONS TO SHAREHOLDERS: |
| From net investment income |
| From net realized gains on investments |
| Total distributions |
| Redemption fees added to paid-in capital |
| Increase/(decrease) in net asset value |
| NET ASSET VALUE, END OF YEAR |
| Total return |
| RATIOS AND SUPPLEMENTAL DATA: |
| Net assets, end of year (000's) |
| Ratio of expenses to average net assets without fee waivers/reimbursements |
| Ratio of expenses to average net assets including fee waivers/reimbursements |
| Net investment income/(loss) to average net assets including fee waivers/reimbursements |
| Portfolio turnover rate |
| (a) | Per share numbers have been calculated using the average shares method. |
| (b) | Less than $0.005 per share. |
See Accompanying Notes to Financial Statements.
| 28 | www.vulcanvaluepartners.com |
Vulcan Value Partners Small Cap Fund
For the Year Ended April 30, 2021 | For the Year Ended April 30, 2020 | For the Year Ended April 30, 2019 | For the Year Ended April 30, 2018 | For the Year Ended April 30, 2017 | ||||||||||||||
| $ | 12.01 | $ | 17.31 | $ | 19.52 | $ | 20.16 | $ | 16.58 | |||||||||
| (0.10 | ) | 0.12 | 0.10 | 0.02 | 0.03 | |||||||||||||
| 10.73 | (4.57 | ) | 0.38 | 0.59 | 3.61 | |||||||||||||
| 10.63 | (4.45 | ) | 0.48 | 0.61 | 3.64 | |||||||||||||
| (0.02 | ) | (0.08 | ) | (0.12 | ) | (0.03 | ) | (0.06 | ) | |||||||||
| – | (0.77 | ) | (2.57 | ) | (1.22 | ) | – | |||||||||||
| (0.02 | ) | (0.85 | ) | (2.69 | ) | (1.25 | ) | (0.06 | ) | |||||||||
| 0.00 | (b) | 0.00 | (b) | 0.00 | (b) | 0.00 | (b) | 0.00 | (b) | |||||||||
| 10.61 | (5.30 | ) | (2.21 | ) | (0.64 | ) | 3.58 | |||||||||||
| $ | 22.62 | $ | 12.01 | $ | 17.31 | $ | 19.52 | $ | 20.16 | |||||||||
| 88.51 | % | (27.28 | %) | 4.76 | % | 3.08 | % | 21.97 | % | |||||||||
| $ | 310,600 | $ | 153,249 | $ | 543,174 | $ | 1,196,558 | $ | 1,255,606 | |||||||||
| 1.25 | % | 1.26 | % | 1.27 | % | 1.24 | % | 1.25 | % | |||||||||
| 1.25 | % | 1.25 | % | 1.25 | % | 1.24 | % | 1.25 | % | |||||||||
| (0.65 | %) | 0.75 | % | 0.54 | % | 0.08 | % | 0.18 | % | |||||||||
| 75 | % | 102 | % | 68 | % | 68 | % | 52 | % | |||||||||
| Annual Report | April 30, 2021 | 29 |
| Financial Highlights | Vulcan Value Partners Small Cap Fund |
For a share outstanding throughout the periods presented.
| Institutional Class | For the Year Ended April 30, 2021 | For the Period May 1, 2019 (Inception) to April 30, 2020 | ||||||
| NET ASSET VALUE, BEGINNING OF PERIOD | $ | 12.03 | $ | 17.18 | ||||
| INCOME/(LOSS) FROM OPERATIONS: | ||||||||
| Net investment income/(loss)(a) | (0.06 | ) | 0.12 | |||||
| Net realized and unrealized gain/(loss) on investments | 10.77 | (4.41 | ) | |||||
| Total from investment operations | 10.71 | (4.29 | ) | |||||
| LESS DISTRIBUTIONS TO SHAREHOLDERS: | ||||||||
| From net investment income | (0.04 | ) | (0.09 | ) | ||||
| From net realized gains on investments | – | (0.77 | ) | |||||
| Total distributions | (0.04 | ) | (0.86 | ) | ||||
| Redemption fees added to paid-in capital | 0.00 | (b) | 0.00 | (b) | ||||
| Increase/(decrease) in net asset value | 10.67 | (5.15 | ) | |||||
| NET ASSET VALUE, END OF YEAR | $ | 22.70 | $ | 12.03 | ||||
| Total return | 89.07 | % | (26.56 | %) | ||||
| RATIOS AND SUPPLEMENTAL DATA: | ||||||||
| Net assets, end of year (000's) | $ | 710,679 | $ | 247,629 | ||||
| Ratio of expenses to average net assets without fee waivers/reimbursements | 1.29 | % | 1.32 | % | ||||
| Ratio of expenses to average net assets including fee waivers/reimbursements | 1.00 | % | 1.00 | % | ||||
| Net investment income/(loss) to average net assets including fee waivers/reimbursements | (0.39 | %) | 0.76 | % | ||||
| Portfolio turnover rate | 75 | % | 102 | % | ||||
| (a) | Per share numbers have been calculated using the average shares method. |
| (b) | Less than $0.005 per share. |
See Accompanying Notes to Financial Statements.
| 30 | www.vulcanvaluepartners.com |
Notes to Financial Statements
April 30, 2021
1. ORGANIZATION
Financial Investors Trust (the “Trust”) is organized as a Delaware statutory trust and is registered as an open-end management investment company under the Investment Company Act of 1940, as amended (“1940 Act”). The Trust consists of multiple separate portfolios or series. This annual report describes the Vulcan Value Partners Fund and Vulcan Value Partners Small Cap Fund (each a “Fund” and collectively, the “Funds”). The Funds seek to achieve long-term capital appreciation. The Funds offer Investor Class and Institutional Class shares.
2. SIGNIFICANT ACCOUNTING POLICIES
The accompanying financial statements were prepared in accordance with accounting principles generally accepted in the United States of America (“U.S. GAAP”), including policies specific to investment companies. The preparation of financial statements in conformity with U.S. GAAP requires management to make certain estimates and assumptions that affect the reported amounts of assets and liabilities and disclosures of contingent assets and liabilities at the date of the financial statements and the reported amounts of revenue and expenses during the period. Actual results could differ from those estimates. The Funds are considered an investment company for financial reporting purposes under U.S. GAAP and follows the accounting and reporting guidance applicable to investment companies in the Financial Accounting Standards Board Accounting Standards Codification Topic 946. The following is a summary of significant accounting policies consistently followed by the Funds in preparation of their financial statements.
Investment Valuation: The Funds generally value their securities based on market prices determined at the close of regular trading on the New York Stock Exchange (“NYSE”), normally 4:00 p.m. Eastern Time, on each day the NYSE is open for trading.
For equity securities and mutual funds that are traded on an exchange, the market price is usually the closing sale or official closing price on that exchange. In the case of equity securities not traded on an exchange, or if such closing prices are not otherwise available, the securities are valued at the mean of the most recent bid and ask prices on such day. Redeemable securities issued by open-end registered investment companies are valued at the investment company’s applicable net asset value, with the exception of exchange-traded open-end investment companies, which are priced as equity securities.
The market price for debt obligations is generally the quote supplied by an independent third-party pricing service approved by the Board of Trustees of the Trust (the “Board” or the “Trustees”), which may use a matrix, formula or other objective method that takes into consideration quotations from dealers, market transactions in comparable investments, market indices and yield curves. If vendors are unable to supply a quote, or if the quote supplied is deemed to be unreliable, the market price may be determined using quotations received from one or more broker–dealers that make a market in the security.
Equity securities that are primarily traded on foreign securities exchanges are valued at the preceding closing values of such securities on their respective exchanges, except when an occurrence subsequent to the time a value was so established is likely to have changed such value. In such an event, the fair values of those securities are determined in good faith through consideration of other factors in accordance with procedures established by and under the general supervision of the Board.
| Annual Report | April 30, 2021 | 31 |
Notes to Financial Statements
April 30, 2021
When such prices or quotations are not available, or when Vulcan Value Partners, LLC (the “Adviser”) believes that they are unreliable, securities may be priced using fair value procedures approved by the Board.
Fair Value Measurements: A three-tier hierarchy has been established to classify fair value measurements for disclosure purposes. Inputs refer broadly to the assumptions that market participants would use in pricing the asset or liability, including assumptions about risk. Inputs may be observable or unobservable. Observable inputs are inputs that reflect the assumptions market participants would use in pricing the asset or liability that are developed based on market data obtained from sources independent of the reporting entity. Unobservable inputs are inputs that reflect the reporting entity’s own assumptions about the assumptions market participants would use in pricing the asset or liability that are developed based on the best information available. Various inputs are used in determining the value of each Fund’s investments as of the reporting period end. The designated input levels are not necessarily an indication of the risk or liquidity associated with these investments. These inputs are categorized in the following hierarchy under applicable financial accounting standards:
| Level 1 – | Unadjusted quoted prices in active markets for identical investments, unrestricted assets or liabilities that the Funds have the ability to access at the measurement date; |
| Level 2 – | Quoted prices which are not active, quoted prices for similar assets or liabilities in active markets or inputs other than quoted prices that are observable (either directly or indirectly) for substantially the full term of the asset or liability; and |
| Level 3 – | Significant unobservable prices or inputs (including the Funds’ own assumptions in determining the fair value of investments) where there is little or no market activity for the asset or liability at the measurement date. |
The following is a summary of each input used to value each Fund’s investments as of April 30, 2021:
| Vulcan Value Partners Fund: | ||||||||||||||||
| Level 2 - Other | Level 3 - | |||||||||||||||
| Level 1 - | Significant | Significant | ||||||||||||||
| Unadjusted | Observable | Unobservable | ||||||||||||||
| Investments in Securities at Value | Quoted Prices | Inputs | Inputs | Total | ||||||||||||
| Common Stocks(a) | $ | 1,755,252,765 | $ | – | $ | – | $ | 1,755,252,765 | ||||||||
| Short Term Investments | 17,893,181 | – | – | 17,893,181 | ||||||||||||
| TOTAL | $ | 1,773,145,946 | $ | – | $ | – | $ | 1,773,145,946 | ||||||||
| Vulcan Value Partners Small Cap Fund: | ||||||||||||||||
| Level 2 - Other | Level 3 - | |||||||||||||||
| Level 1 - | Significant | Significant | ||||||||||||||
| Unadjusted | Observable | Unobservable | ||||||||||||||
| Investments in Securities at Value | Quoted Prices | Inputs | Inputs | Total | ||||||||||||
| Common Stocks(a) | $ | 955,101,480 | $ | – | $ | – | $ | 955,101,480 | ||||||||
| Short Term Investments | 52,936,494 | – | – | 52,936,494 | ||||||||||||
| TOTAL | $ | 1,008,037,974 | $ | – | $ | – | $ | 1,008,037,974 | ||||||||
| (a) | For detailed descriptions, see the accompanying Statements of Investments. |
| 32 | www.vulcanvaluepartners.com |
Notes to Financial Statements
April 30, 2021
For the year ended April 30, 2021, the Funds did not have any securities that used significant unobservable inputs (Level 3) in determining fair value.
Investment Transactions and Investment Income: Investment transactions are accounted for on the date the investments are purchased or sold (trade date). Realized gains and losses from investment transactions are reported on an identified cost basis, which is the same basis the Funds use for federal income tax purposes. Interest income, which includes accretion of discounts and amortization of premiums, is accrued and recorded as earned. Dividend income is recognized on the ex-dividend date or, for certain foreign securities, as soon as information is available to the Funds. All of the realized and unrealized gains and losses and net investment income, are allocated daily to each class in proportion to its average daily net assets.
ReFlow Liquidity Program: Each Fund may participate in the ReFlow liquidity program, which is designed to provide an alternative liquidity source for mutual funds experiencing net redemptions of their shares. Pursuant to the program, ReFlow Fund, LLC (“ReFlow”) provides participating mutual funds with a source of cash to meet net shareholder redemptions by standing ready each business day to purchase fund shares up to the value of the net shares redeemed by other shareholders that are to settle the next business day. ReFlow will purchase shares of the Fund at net asset value and will not be subject to any investment minimums. Following purchases of Fund shares, ReFlow then generally redeems those shares when the Fund experiences net subscriptions, at the end of a maximum holding period determined by ReFlow (currently 28 days), or at other times as the Fund may request. ReFlow may choose to redeem its position in the Fund with an in-kind transfer of securities, instead of cash, enabling the Fund to avoid a realization of capital gains on the securities it transfers. ReFlow will not be subject to any short-term redemption fees. While ReFlow holds Fund shares, it will have the same rights and privileges with respect to those shares as any other shareholder. For use of the ReFlow service, a Fund pays a fee to ReFlow each time it purchases Fund shares, calculated by applying to the purchase amount a fee rate determined through an automated daily auction among participating mutual funds. The current minimum fee rate is 0.20% of the value of the Fund shares purchased by ReFlow although the Fund may submit a bid at a higher fee rate if it determines that doing so is in the best interest of Fund shareholders. In accordance with federal securities laws, ReFlow is prohibited from acquiring more than 3% of the outstanding voting securities of a Fund. There is no assurance that ReFlow will have sufficient funds available to meet the Funds’ liquidity needs on a particular day. During the year ended April 30, 2021, only the Vulcan Value Partner Fund participated in ReFlow. Fees associated with ReFlow are disclosed in the Statements of Operations.
Real Estate Investment Trusts (“REITs”): The Funds may invest a portion of their assets in REITs and are subject to certain risks associated with direct investment in REITs. REITs may be affected by changes in the value of their underlying properties and by defaults by borrowers or tenants. REITs depend generally on their ability to generate cash flow to make distributions to shareowners, and certain REITs have self-liquidation provisions by which mortgages held may be paid in full and distributions of capital returns may be made at any time. In addition, the performance of a REIT may be affected by its failure to qualify for tax-free pass-through of income under the Internal Revenue Code of 1986, as amended (the “Code”), or its failure to maintain exemption from registration under the 1940 Act. A Fund’s investments in REITs may result in such Fund’s receipt of cash in excess of the REITs’ earnings. If the Fund receives such distributions all or a portion of these distributions will constitute a return of capital to such Fund. Receiving a return of capital distribution from REITs will reduce the amount of income available to be distributed to Fund shareholders. Income from
| Annual Report | April 30, 2021 | 33 |
Notes to Financial Statements
April 30, 2021
REITs generally will not be eligible for treatment as qualified dividend income. As the final character of the distributions is not known until reported by the REITs on their 1099s, the Funds utilize an average of the prior year’s reallocation information as an estimate for the current year character of distributions.
Foreign Securities: The Funds may directly purchase securities of foreign issuers. Investing in securities of foreign issuers involves special risks not typically associated with investing in securities of U.S. issuers. The risks include possible reevaluation of currencies, the inability to repatriate foreign currency, less complete financial information about companies and possible future adverse political and economic developments. Moreover, securities of many foreign issuers and their markets may be less liquid and their prices more volatile than those of securities of comparable U.S. issuers.
Foreign Currency Translation: The books and records of the Funds are maintained in U.S. dollars. Investment valuations and other assets and liabilities initially expressed in foreign currencies are converted each business day into U.S. dollars based upon current exchange rates. Prevailing foreign exchange rates may generally be obtained at the close of the NYSE (normally, 4:00 p.m. Eastern Time). The portion of realized and unrealized gains or losses on investments due to fluctuations in foreign currency exchange rates is not separately disclosed and is included in realized and unrealized gains or losses on investments, when applicable.
In-Kind Redemptions: During the year ended April 30, 2021, the Vulcan Value Partners Fund distributed portfolio securities rather than cash as payment for certain redemptions of fund shares (in-kind redemptions) in the amount of $77,761,829. For financial reporting purposes, the Vulcan Value Partners Fund recognized gains on the in-kind redemptions in the amount of $46,669,008. The Vulcan Value Partners Small Cap Fund did not have any in-kind transactions during the year ended April 30, 2021. For tax purposes, the gains are not recognized.
Trust Expenses: Some expenses of the Trust can be directly attributed to the Funds. Expenses which cannot be directly attributed are apportioned among all funds in the Trust based on average net assets of each fund.
Fund Expenses: Expenses that are specific to a Fund are charged directly to that Fund.
Federal Income Taxes: Each Fund complies with the requirements under Subchapter M of the Internal Revenue Code of 1986, as amended, applicable to regulated investment companies and intends to distribute substantially all of its net taxable income and net capital gains, if any, each year so that it will not be subject to excise tax on undistributed income and gains. The Funds are not subject to income taxes to the extent such distributions are made.
As of and during the year ended April 30, 2021, the Funds did not have a liability for any unrecognized tax benefits. The Funds file U.S. federal, state, and local tax returns as required. The Fund’s tax returns are subject to examination by the relevant tax authorities until expiration of the applicable statute of limitations, which is generally three years after the filing of the tax return for federal purposes and four years for most state returns. Tax returns for open years have incorporated no uncertain tax positions that require a provision for income taxes.
| 34 | www.vulcanvaluepartners.com |
Notes to Financial Statements
April 30, 2021
Distributions to Shareholders: Each Fund normally pays dividends and distributes capital gains, if any, on an annual basis. Income dividend distributions are derived from dividends and other income each Fund receives from its investments, including short-term capital gains. Long term capital gain distributions are derived from gains realized when each Fund sells a security it has owned for more than a year. Each Fund may make additional distributions and dividends at other times if the portfolio manager believes doing so may be necessary for each Fund to avoid or reduce taxes.
Epidemic and Pandemic Risk: Certain countries have been susceptible to epidemics, most recently COVID-19, which has been designated as a pandemic by world health authorities. The outbreak of such epidemics, together with any resulting restrictions on travel or quarantines imposed, could have a negative impact on the economy and business activity globally (including in the countries in which we invest), and thereby could adversely affect the performance of our investments. Furthermore, the rapid development of epidemics could preclude prediction as to their ultimate adverse impact on economic and market conditions, and, as a result, present material uncertainty and risk with respect to us and the performance of our investments.
Libor Risk: In March 2020, the Financial Accounting Standards Board (FASB) issued Accounting Standards Update (“ASU”) No. 2020-04, Reference Rate Reform (Topic 848): Facilitation of the Effects of Reference Rate Reform on Financial Reporting. The Funds’ investments, payment obligations, and financing terms may be based on floating rates, such as the London Interbank Offered Rate, or “LIBOR,” which is the offered rate for short-term Eurodollar deposits between major international banks. On November 30, 2020, the administrator of LIBOR announced its intention to delay the phase out of the majority of the U.S. dollar LIBOR publications until June 30, 2023, with the remainder of LIBOR publications to still end at the end of 2021. There remains uncertainty regarding the nature of any replacement rate and the impact of the transition from LIBOR on the Funds’ transactions and the financial markets generally. As such, the potential effect of a transition away from LIBOR on the Funds or the Funds’ investments cannot yet be determined.
3. TAX BASIS INFORMATION
Reclassifications: As of April 30, 2021 permanent differences in book and tax accounting were reclassified. These differences had no effect on net assets and were primarily attributed to in-kind redemptions. The reclassifications were as follows:
| Distributable | ||||||||
| Fund | Paid-in Capital | earnings | ||||||
| Vulcan Value Partners Fund | $ | 46,533,920 | $ | (46,533,920 | ) | |||
| Vulcan Value Partners Small Cap Fund | – | – | ||||||
| Annual Report | April 30, 2021 | 35 |
Notes to Financial Statements
April 30, 2021
Tax Basis of Investments: As of April 30, 2021, the aggregate cost of investments, gross unrealized appreciation/(depreciation) and net unrealized appreciation for federal tax purposes was as follows:
| Vulcan Value Partners Fund | Vulcan Value Partners Small Cap Fund | |||||||
| Gross appreciation | ||||||||
| (excess of value over tax cost) | $ | 603,860,070 | $ | 291,604,213 | ||||
| Gross depreciation | ||||||||
| (excess of tax cost over value) | (1,046,803 | ) | (6,594,739 | ) | ||||
| Net depreciation of foreign currency | – | 10,485 | ||||||
| Net unrealized appreciation | $ | 602,813,267 | $ | 285,019,959 | ||||
| Cost of investments for income tax purposes | $ | 1,170,332,679 | $ | 723,028,500 | ||||
Components of Earnings: As of April 30, 2021, components of distributable earnings were as follows:
| Vulcan Value Partners Fund | Vulcan Value Partners Small Cap Fund | |||||||
| Undistributed ordinary income | $ | 4,599,411 | $ | 20,338,896 | ||||
| Accumulated capital gains | 61,835,851 | 15,337,218 | ||||||
| Net unrealized appreciation on investments | 602,813,267 | 285,019,959 | ||||||
| Total | $ | 669,248,529 | $ | 320,696,073 | ||||
Tax Basis of Distributions to Shareholders: The character of distributions made during the year from net investment income or net realized gains may differ from its ultimate characterization for federal income tax purposes. Also, due to the timing of dividend distributions, the fiscal year in which amounts are distributed may differ from the fiscal year in which the income or realized gain were recorded by each Fund.
The tax character of distributions paid by the Funds for the fiscal year ended April 30, 2021 were as follows:
| Ordinary Income | Long-Term Capital Gain | |||||||
| 2021 | ||||||||
| Vulcan Value Partners Fund | $ | 1,593,194 | $ | 49,508,512 | ||||
| Vulcan Value Partners Small Cap Fund | 1,036,498 | – | ||||||
| 36 | www.vulcanvaluepartners.com |
Notes to Financial Statements
April 30, 2021
The tax character of distributions paid by the Funds for the fiscal year ended April 30, 2020 were as follows:
| Ordinary Income | Long-Term Capital Gain | |||||||
| 2020 | ||||||||
| Vulcan Value Partners Fund | $ | 27,684,241 | $ | 38,649,839 | ||||
| Vulcan Value Partners Small Cap Fund | 9,335,803 | 14,520,351 | ||||||
4. SECURITIES TRANSACTIONS
The cost of purchases and proceeds from sales of securities (excluding short-term securities and in-kind redemptions) during the year ended April 30, 2021 were as follows:
| Fund | Purchases of Securities | Proceeds From Sales of Securities | ||||||
| Vulcan Value Partners Fund | $ | 932,568,790 | $ | 1,011,505,821 | ||||
| Vulcan Value Partners Small Cap Fund | 603,897,636 | 447,092,981 | ||||||
5. SHARES OF BENEFICIAL INTEREST
The capitalization of the Trust consists of an unlimited number of shares of beneficial interest with no par value per share. Holders of the shares of the Funds of the Trust have one vote for each share held and a proportionate fraction of a vote for each fractional share. All shares issued and outstanding are fully paid and are transferable and redeemable at the option of the shareholder. Purchasers of the shares do not have any obligation to make payments to the Trust or its creditors solely by reason of the purchasers’ ownership of the shares. Shares have no pre-emptive rights.
Prior to May 14, 2020, shares redeemed within 90 days of purchase may incur a 2% short-term redemption fee deducted from the redemption amount. Effective May 14, 2020, the Funds will no longer impose a redemption fee. The Vulcan Value Partners Fund and the Vulcan Value Partners Small Cap Fund retained $32,866 and $15,978, respectively, for the year ended April 30, 2021, and $64,738 and $53,717, respectively, for the year ended April 30, 2020.
| Annual Report | April 30, 2021 | 37 |
Notes to Financial Statements
April 30, 2021
Transactions in shares of capital stock for the dates listed below were as follows:
| Vulcan Value Partners Fund | ||||||||
| For the Year Ended | For the Year Ended | |||||||
| April 30, 2021 | April 30, 2020 | |||||||
| Shares Sold | ||||||||
| Investor Class | 1,913,376 | 8,592,593 | ||||||
| Institutional Class | 13,337,480 | 45,052,843 | ||||||
| Shares Issued in Reinvestment of Dividends | ||||||||
| Investor Class | 644,471 | 1,225,786 | ||||||
| Institutional Class | 1,110,749 | 1,358,666 | ||||||
| Less Shares Redeemed | ||||||||
| Investor Class | (7,304,502 | ) | (45,177,914 | ) | ||||
| Institutional Class | (15,501,238 | ) | (7,032,973 | ) | ||||
| Net Increase/(Decrease) | (5,799,664 | ) | 4,019,001 | |||||
| Vulcan Value Partners Small Cap Fund | ||||||||
| For the Year Ended | For the Year Ended | |||||||
| April 30, 2021 | April 30, 2020 | |||||||
| Shares Sold | ||||||||
| Investor Class | 5,516,025 | 3,210,869 | ||||||
| Institutional Class | 19,908,018 | 25,839,809 | ||||||
| Shares Issued in Reinvestment of Dividends | ||||||||
| Investor Class | 10,164 | 550,493 | ||||||
| Institutional Class | 39,257 | 673,056 | ||||||
| Less Shares Redeemed | ||||||||
| Investor Class | (4,556,028 | ) | (22,380,086 | ) | ||||
| Institutional Class | (9,214,837 | ) | (5,931,759 | ) | ||||
| Net Increase | 11,702,599 | 1,962,382 |
6. MANAGEMENT AND RELATED-PARTY TRANSACTIONS
The Adviser, subject to the authority of the Board, is responsible for the overall management and administration of the Funds’ business affairs. The Adviser manages the investments of the Funds in accordance with each Fund’s investment objective, policies and limitations and investment guidelines established jointly by the Adviser and the Board. Pursuant to the Investment Advisory Agreement (the “Advisory Agreement”), the Funds pay the Adviser an annual management fee of 1.00% and 1.15% for Vulcan Value Partners Fund and Vulcan Value Partners Small Cap Fund, respectively, based on each Fund’s average daily net assets. The management fee is paid on a monthly basis.
The Adviser has contractually agreed to limit the Vulcan Value Partners Fund’s total annual fund operating expenses (exclusive of Acquired Fund Fees and Expenses, brokerage expenses, interest
| 38 | www.vulcanvaluepartners.com |
Notes to Financial Statements
April 30, 2021
expense, taxes and extraordinary expenses) to 1.25% and 0.85% of the Fund’s average daily net assets with respect to Investor Class shares and Institutional Class shares, respectively.
The Adviser has contractually agreed to limit the Vulcan Value Partners Small Cap Fund’s total annual fund operating expenses (exclusive of Acquired Fund Fees and Expenses, brokerage expenses, interest expense, taxes and extraordinary expenses) to 1.25% and 1.00% of the Fund’s average daily net assets with respect to Investor Class shares and Institutional Class shares, respectively.
These agreements (the “Expense Agreements”) are in effect from September 1, 2020 through August 31, 2021. The prior Expense Agreements were in effect from September 1, 2019 through August 31, 2020. The Adviser will be permitted to recover, on a class-by-class basis, expenses it has borne through the Expense Agreements to the extent that a Fund’s expenses in later periods fall below the expense cap in effect at the time of waiver or reimbursement. Notwithstanding the foregoing, the Funds will not be obligated to pay any such fees and expenses more than three years after the date of the waiver or reimbursement. The Adviser may not discontinue or modify this waiver prior to August 31, 2021 without the approval by the Funds’ Board.
For the year ended April 30, 2021, the fee waivers and/or reimbursements and recoupment amounts were as follows:
| Fund | Fees Waived/Reimbursed By Adviser | Recoupment of Previously Waived Fees by Adviser | ||||||
| Vulcan Value Partners Fund | ||||||||
| Investor | $ | – | $ | – | ||||
| Institutional | (2,373,402 | ) | – | |||||
| Vulcan Value Partners Small Cap Fund | ||||||||
| Investor | (9,343 | ) | 32,352 | |||||
| Institutional | (1,148,576 | ) | – | |||||
As of April 30, 2021, the balances of recoupable expenses for each Fund were as follows:
| Fund | Expires 2022 | Expires 2023 | Expires 2024 | Total | ||||||||||||
| Vulcan Value Partners Fund | ||||||||||||||||
| Investor | $ | – | $ | – | $ | – | $ | – | ||||||||
| Institutional | – | 1,571,670 | 2,373,402 | 3,945,072 | ||||||||||||
| Vulcan Value Partners Small Cap Fund | ||||||||||||||||
| Investor | 50,751 | 43,468 | 9,343 | 103,562 | ||||||||||||
| Institutional | – | 594,605 | 1,148,576 | 1,743,181 | ||||||||||||
| Annual Report | April 30, 2021 | 39 |
Notes to Financial Statements
April 30, 2021
Fund Administrator Fees and Expenses: ALPS Fund Services, Inc. (“ALPS”) serves as administrator to the Funds and the Funds have agreed to pay expenses incurred in connection with their administrative activities. Pursuant to an Administration Agreement, ALPS provides operational services to the Funds including, but not limited to fund accounting and fund administration and generally assist in each Fund’s operations. Officers of the Trust are employees of ALPS. The Funds’ administration fee is accrued on a daily basis and paid monthly. Administration fees paid by the Funds for the year ended April 30, 2021 are disclosed in the Statements of Operations.
ALPS is reimbursed by the Funds for certain out-of-pocket expenses.
Transfer Agent: ALPS serves as transfer, dividend paying and shareholder servicing agent for the Funds. ALPS receives an annual minimum fee, a fee based upon the number of shareholder accounts, and is also reimbursed by the Funds for certain out-of-pocket expenses. Transfer agent fees paid by the Funds for the year ended April 30, 2021 are disclosed in the Statements of Operations.
Compliance Services: ALPS provides services that assist the Trust’s chief compliance officer in monitoring and testing the policies and procedures of the Trust in conjunction with requirements under Rule 38a-1 under the 1940 Act and receives an annual base fee. ALPS is reimbursed for certain out-of-pocket expenses by the Funds. Vulcan pays this fee on behalf of the Funds.
Principal Financial Officer: ALPS receives an annual fee for providing principal financial officer services to the Funds. Principal financial officer fees paid by the Fund for the year ended April 30, 2021 are disclosed in the Statements of Operations.
Distributor: ALPS Distributors, Inc. (“ADI” or the “Distributor”) (an affiliate of ALPS) acts as the distributor of each Fund’s shares pursuant to a Distribution Agreement with the Trust. Shares are sold on a continuous basis by ADI as agent for the Funds, and ADI has agreed to use its best efforts to solicit orders for the sale of each Fund’s shares, although it is not obliged to sell any particular amount of shares. ADI is not entitled to any compensation for its services as Distributor. ADI is registered as a broker-dealer with the U.S. Securities and Exchange Commission. Certain intermediaries may charge networking, omnibus account or other administrative fees with respect to transactions in shares of the Funds. Transactions may be processed through the National Securities Clearing Corporation (“NSCC”) or similar systems or processed on a manual basis. These fees are paid by the Funds to the Distributor, which uses such fees to reimburse intermediaries. In the event an intermediary receiving payments from the Distributor on behalf of the Funds converts from a networking structure to an omnibus account structure or otherwise experiences increased costs, fees borne by the Funds may increase. Fees are disclosed on the Statements of Operations as “Delegated transfer agent equivalent services fees”.
Trustees: The fees and expenses of the Trustees of the Board are presented in the Statements of Operations.
| 40 | www.vulcanvaluepartners.com |
Notes to Financial Statements
April 30, 2021
7. INDEMNIFICATIONS
Under the Trust’s organizational documents, its Officers and Trustees are indemnified against certain liability arising out of the performance of their duties to the Trust. Additionally, in the normal course of business, the Trust enters into contracts with service providers that may contain general indemnification clauses which may permit indemnification to the extent permissible under applicable law. The Trust’s maximum exposure under these arrangements is unknown, as this would involve future claims that may be made against the Trust that have not yet occurred.
8. SUBSEQUENT EVENT
Subsequent events after the date of the Statements of Assets and Liabilities have been evaluated through the date the financial statements were issued.
| Annual Report | April 30, 2021 | 41 |
Report of Independent Registered Public Accounting Firm
To the shareholders and the Board of Trustees of Financial Investors Trust
Opinion on the Financial Statements and Financial Highlights
We have audited the accompanying statements of assets and liabilities of Vulcan Value Partners Fund and Vulcan Value Partners Small Cap Fund (the "Funds"), two of the funds constituting the Financial Investors Trust, including the statements of investments, as of April 30, 2021, the related statements of operations for the year then ended, the statements of changes in net assets for each of the two years in the period then ended, the financial highlights for each of the five years in the period then ended, and the related notes. In our opinion, the financial statements and financial highlights present fairly, in all material respects, the financial position of Vulcan Value Partners Fund and Vulcan Value Partners Small Cap Fund of Financials Investors Trust as of April 30, 2021, and the results of their operations for the year then ended, the changes in their net assets for each of the two years in the period then ended, and the financial highlights for each of the five years in the period then ended in conformity with accounting principles generally accepted in the United States of America.
Basis for Opinion
These financial statements and financial highlights are the responsibility of the Funds’ management. Our responsibility is to express an opinion on the Funds’ financial statements and financial highlights based on our audits. We are a public accounting firm registered with the Public Company Accounting Oversight Board (United States) (PCAOB) and are required to be independent with respect to the Funds in accordance with the U.S. federal securities laws and the applicable rules and regulations of the Securities and Exchange Commission and the PCAOB.
We conducted our audits in accordance with the standards of the PCAOB. Those standards require that we plan and perform the audit to obtain reasonable assurance about whether the financial statements and financial highlights are free of material misstatement, whether due to error or fraud. The Funds are not required to have, nor were we engaged to perform, an audit of their internal control over financial reporting. As part of our audits we are required to obtain an understanding of internal control over financial reporting but not for the purpose of expressing an opinion on the effectiveness of the Funds’ internal control over financial reporting. Accordingly, we express no such opinion.
Our audits included performing procedures to assess the risks of material misstatement of the financial statements and financial highlights, whether due to error or fraud, and performing procedures that respond to those risks. Such procedures included examining, on a test basis, evidence regarding the amounts and disclosures in the financial statements and financial highlights. Our audits also included evaluating the accounting principles used and significant estimates made by management, as well as evaluating the overall presentation of the financial statements and financial highlights. Our procedures included confirmation of securities owned as of April 30, 2021, by correspondence with the custodian and brokers; when replies were not received from brokers, we performed other auditing procedures. We believe that our audits provide a reasonable basis for our opinion.
DELOITTE & TOUCHE LLP
Denver, Colorado
June 28, 2021
We have served as the auditor of one or more investment companies advised by Vulcan Value Partners, LLC since 2010.
| 42 | www.vulcanvaluepartners.com |
Additional Information
April 30, 2021 (Unaudited)
1. FUND HOLDINGS
The Funds file its complete schedule of portfolio holdings with the Securities and Exchange Commission (SEC) for the first and third quarters of each fiscal year as an exhibit to its reports on Form N-PORT. The Funds’ Form N-PORT reports are available on the SEC's Web site at http://www.sec.gov. The Funds’ Form N-PORT reports are also available upon request by calling (toll-free) (866) 759-5679.
2. FUND PROXY VOTING POLICIES, PROCEDURES AND SUMMARIES
The Funds’ policies and procedures used in determining how to vote proxies and information regarding how the Fund voted proxies relating to portfolio securities during the most recent prior 12-month period ending June 30 are available without charge, (1) upon request, by calling (toll-free) (866)-759-5679 and (2) on the SEC’s website at http://www.sec.gov.
3. TAX DESIGNATIONS
The Funds designate the following for federal income tax purposes for the calendar year ended December 31, 2020:
| Qualified Dividend Income | Dividend Received Deduction | |
| Vulcan Value Partners Fund | 100.00% | 100.00% |
| Vulcan Value Partners Small Cap Fund | 100.00% | 100.00% |
In early 2021, if applicable, shareholders of record received this information for the distributions paid to them by the Funds during the calendar year 2020 via Form 1099. The Funds will notify shareholders in early 2022 of amounts paid to them by the Funds, if any, during the calendar year 2021.
Pursuant to Section 852(b)(3) of the Internal Revenue Code, the Vulcan Value Partners Fund designated $49,508,512 as long-term capital gain dividends.
| Annual Report | April 30, 2021 | 43 |
Disclosure Regarding Approval of Fund Advisory Agreements
April 30, 2021 (Unaudited)
On December 8, 2020, the Trustees met via Zoom video conference to discuss, among other things, the renewal of the Investment Advisory Agreement between Vulcan Value Partners, LLC (“Vulcan”) and the Trust, with respect to the Vulcan Value Partners Fund and the Vulcan Value Partners Small Cap Fund (together, the “Vulcan Funds”), dated December 30, 2009, as amended (the “Vulcan Investment Advisory Agreement”), in accordance with Section 15(c) of the 1940 Act. In renewing and approving the Vulcan Investment Advisory Agreement, the Trustees, including the Independent Trustees, considered the following factors with respect to the Vulcan Funds:
Investment Advisory Fee Rate: The Trustees reviewed and considered the contractual annual advisory fees paid by the Trust, on behalf of the Vulcan Funds, to Vulcan, of 1.00% for the Vulcan Value Partners Fund and 1.15% for the Vulcan Value Partners Small Cap Fund, in light of the extent and quality of the advisory services provided by Vulcan to each of the Vulcan Funds.
The Board received and considered information including a comparison of the Investor Class and Institutional Class of each Vulcan Fund’s contractual advisory fee rate with those of funds in the peer group of funds provided based on an independent analysis by an independent provider of investment company data (the “Data Provider”). The Trustees noted that the contractual advisory fee rate of both classes of both Vulcan Funds was higher than the Data Provider peer group median. The Trustees also reviewed and considered the supplemental comparison prepared by the Data Provider at the request of Vulcan.
Total Net Expense Ratios: The Trustees further reviewed and considered that the total net expense ratios of the Institutional Class and the Investor Class of the Vulcan Value Partners Fund were higher than the peer group median in the independent analysis prepared by the Data Provider, the total net expense ratio of the Investor share class of the Vulcan Value Partners Small Cap Fund in the same analysis was higher than the Data Provider peer group median, and the Institutional share class of the Vulcan Value Partners Small Cap Fund in the same analysis was lower than the Data Provider peer group median. The Trustees also reviewed and considered the supplemental comparison prepared by the Data Provider at the request of Vulcan.
Nature, Extent, and Quality of the Services under the Investment Advisory Agreement: The Trustees received and considered information regarding the nature, extent, and quality of services provided to the Vulcan Funds under the Vulcan Investment Advisory Agreement. The Trustees reviewed certain background materials supplied by Vulcan in its presentation, including its Form ADV.
The Trustees reviewed and considered Vulcan’s investment advisory personnel, its history as an asset manager, and its performance and the amount of assets currently under management by Vulcan. The Trustees also reviewed the research and decision-making processes utilized by Vulcan, including the methods adopted to seek to achieve compliance with the investment objectives, policies, and restrictions of the Vulcan Funds.
The Trustees considered the background and experience of Vulcan’s management in connection with the Vulcan Funds, including reviewing the qualifications, backgrounds, and responsibilities of the management team primarily responsible for the day-to-day portfolio management of each Vulcan Fund and the extent of the resources devoted to research and analysis of actual and potential investments.
| 44 | www.vulcanvaluepartners.com |
Disclosure Regarding Approval of Fund Advisory Agreements
April 30, 2021 (Unaudited)
The Trustees also reviewed, among other things, Vulcan’s insider trading policies and procedures and its Code of Ethics.
Performance: The Trustees reviewed performance information in the independent analysis prepared by the Data Provider for the Investor Class and Institutional Class of the Vulcan Funds for the 3-month, 1-year, 3-year, 5-year, 10-year, and since inception periods, as applicable, ended September 30, 2020. That review included a comparison of each Vulcan Fund’s performance to the performance of a group of comparable funds selected by the Data Provider. The Trustees noted that both classes of the Vulcan Value Partners Fund outperformed the Data Provider peer group median for each applicable period, and that both classes of the Vulcan Value Partners Small Cap Fund generally underperformed the Data Provider peer group median for each applicable time period. The Trustees considered Vulcan’s discussion of its reputation generally and its investment techniques, risk management controls, and decision-making processes. The Trustees also reviewed and considered the supplemental comparison prepared by the Data Provider at the request of Vulcan.
Comparable Accounts: The Trustees noted certain information provided by Vulcan regarding fees charged to its other clients utilizing a strategy similar to that employed by the Vulcan Funds.
Profitability: The Trustees received and considered a profitability analysis prepared by Vulcan based on the fees payable under the Vulcan Investment Advisory Agreement.
Economies of Scale: The Trustees considered whether economies of scale in the provision of services to the Vulcan Funds will be passed along to the shareholders under the proposed agreements.
Other Benefits to the Adviser: The Trustees reviewed and considered any other incidental benefits derived or to be derived by Vulcan from its relationship with the Vulcan Funds, including whether soft dollar arrangements were used.
The Trustees, including all of the Independent Trustees, concluded that:
| ● | the contractual advisory fee rate of both classes of both Vulcan Funds in the independent analysis prepared by the Data Provider was higher than the Data Provider peer group median; |
| ● | the total net expense ratios in the independent analysis prepared by the Data Provider of the Institutional Class and the Investor Class of the Vulcan Value Partners Fund were higher than the Data Provider peer group median, the total net expense ratio of the Investor Class of the Vulcan Value Partners Small Cap Fund in the same report was higher than the Data Provider peer group median, and the total net expense ratio of the Institutional Class of the Vulcan Value Partners Small Cap Fund in the same report was lower than the Data Provider peer group median; |
| ● | the nature, extent, and quality of services rendered by Vulcan under the Vulcan Investment Advisory Agreement with respect to each Vulcan Fund were adequate; |
| Annual Report | April 30, 2021 | 45 |
Disclosure Regarding Approval of Fund Advisory Agreements
April 30, 2021 (Unaudited)
| ● | for the period ended September 30, 2020, in the independent analysis prepared by the Data Provider, both classes of the Vulcan Value Partners Fund outperformed the Data Provider peer group median for each applicable period, and both classes of the Vulcan Value Partners Small Cap Fund generally underperformed the Data Provider peer group median for each applicable time period; |
| ● | bearing in mind the limitations of comparing different types of managed accounts and the different levels of service typically associated with such accounts, the fee structures applicable to Vulcan’s other clients employing a comparable strategy to any of the Vulcan Funds were not indicative of any unreasonableness with respect to the advisory fee payable by the Vulcan Funds; |
| ● | the profit, if any, realized by Vulcan in connection with the operation of any of the Vulcan Funds is not unreasonable; and |
| ● | there were no material economies of scale or other incidental benefits accruing to Vulcan in connection with its relationship with any of the Vulcan Funds. |
Based on the Trustees’ deliberations and their evaluation of the information described above, the Trustees, including all of the Independent Trustees, concluded that Vulcan’s compensation for investment advisory services is consistent with the best interests of each of the Vulcan Funds and their shareholders.
| 46 | www.vulcanvaluepartners.com |
Liquidity Risk Management Program
April 30, 2021 (Unaudited)
The Financial Investors Trust (the “Trust”) has established a liquidity risk management program (the “Program”) to govern the Trust’s approach to managing liquidity risk for each fund in the Trust (each a “Fund”). The Program is overseen by the Liquidity Committee (the “Committee”), a committee comprised of representatives of the Trust’s investment advisers, sub-advisers, and Officers of the Trust. The Trust’s Board of Trustees (the “Board”) has approved the designation of the Committee to oversee the Program.
The Program’s principal objectives include supporting each Fund’s compliance with limits on investments in illiquid assets and mitigating the risk that a Fund will be unable to meet its redemption obligations in a timely manner. The Program also includes a number of elements that support the management and assessment of liquidity risk, including a periodic assessment of factors that influence a Fund’s liquidity and the periodic classification and re-classification of the Fund’s investments into groupings that reflect the Committee’s assessment of their relative liquidity under current market conditions.
At a meeting of the Board held on March 10, 2021, the Trustees received a report from the Committee regarding the design and operational effectiveness of the Program during 2020. The Committee determined, and reported to the Board, that the Program is reasonably designed to assess and manage each Fund’s liquidity risk and has operated adequately and effectively to manage each Fund’s liquidity risk since implementation.
The Committee reported that during the period covered by the report, there were no liquidity events that impacted the Funds or their ability to timely meet redemptions without dilution to existing shareholders. Among other things, the Board noted that the Funds are not required to have a highly liquid investment minimum based on their liquidity classifications. The Board further noted that no material changes have been made to the Program since its implementation.
| Annual Report | April 30, 2021 | 47 |
Trustees and Officers
April 30, 2021 (Unaudited)
Additional information regarding the Fund’s trustees is included in the Statement of Additional Information, which can be obtained without charge by calling 855-344-3863.
INDEPENDENT TRUSTEES
| Name, Address* & Year of Birth | Position(s) Held with Fund | Term of Office** and Length of Time Served | Principal Occupation(s) During Past 5 Years*** | Number of Funds in Fund Complex Overseen by Trustee**** | Other Directorships Held by Trustee During Past 5 Years*** |
| Mary K. Anstine, 1940 | Trustee and Chairman | Ms. Anstine was elected at a special meeting of shareholders held on March 21, 1997 and re-elected at a special meeting of shareholders held on August 7, 2009. Ms. Anstine was appointed Chairman of the Board at the June 6, 2017 meeting of the Board of Trustees. | Ms. Anstine is Trustee/Director of AV Hunter Trust and Colorado Uplift Board. | 31 | Ms. Anstine is a Trustee of ALPS ETF Trust (17 funds); ALPS Variable Investment Trust (7 funds); Reaves Utility Income Fund (1 fund); and Segall Bryant & Hamill Trust through December 2020 (14 funds as of December 2020). |
| Jeremy W. Deems, 1976 | Trustee | Mr. Deems was appointed as a Trustee at the March 11, 2008 meeting of the Board of Trustees and elected at a special meeting of shareholders held on August 7, 2009. | Mr. Deems is the Co-Founder and Chief Financial Officer of Green Alpha Advisors, LLC, a registered investment advisor, and Co-Portfolio Manager of the Shelton Green Alpha Fund. | 31 | Mr. Deems is a Trustee of ALPS ETF Trust (17 funds); ALPS Variable Investment Trust (7 funds); Clough Funds Trust (1 fund); and Reaves Utility Income Fund (1 fund). |
| Jerry G. Rutledge, 1944 | Trustee | Mr. Rutledge was elected at a special meeting of shareholders held on August 7, 2009. | Mr. Rutledge is the President and owner of Rutledge’s Inc., a retail clothing business. | 31 | Mr. Rutledge is a Trustee of Clough Global Dividend and Income Fund (1 fund); Clough Global Equity Fund (1 fund); Clough Global Opportunities Fund (1 fund); and Principal Real Estate Income Fund (1 fund). |
| 48 | www.vulcanvaluepartners.com |
| Trustees and Officers |
| April 30, 2021 (Unaudited) |
INDEPENDENT TRUSTEES (continued)
| Name, Address* & Year of Birth | Position(s) Held with Fund | Term of Office** and Length of Time Served | Principal Occupation(s) During Past 5 Years*** | Number of Funds in Fund Complex Overseen by Trustee**** | Other Directorships Held by Trustee During Past 5 Years*** |
| Michael “Ross” Shell, 1970 | Trustee | Mr. Shell was elected at a special meeting of shareholders held on August 7, 2009. | Mr. Shell is Founder and CEO of Red Idea, LLC, a strategic consulting/early stage venture firm (since June 2008). Mr. Shell serves on the Board of Directors of TalkBox, a phone/privacy booth company (since 2018) and DLVR, a package security company (since 2018). Mr. Shell served on the Advisory Board, St. Vrain School District Innovation Center (from 2015-2018). Mr. Shell graduated with honors from Stanford University with a degree in Political Science. | 31 | None. |
| Annual Report | April 30, 2021 | 49 |
Trustees and Officers
April 30, 2021 (Unaudited)
INTERESTED TRUSTEE
| Name, Address* & Year of Birth | Position(s) Held with Fund | Term of Office** and Length of Time Served | Principal Occupation(s) During Past 5 Years*** | Number of Funds in Fund Complex Overseen by Trustee**** | Other Directorships Held by Trustee During Past 5 Years*** |
| Edmund J. Burke, 1961 | Trustee | Mr. Burke was elected as Trustee at a special meeting of shareholders held on August 7, 2009. | Mr. Burke joined ALPS in 1991 and served as the President and Director of ALPS Holdings, Inc., and ALPS Advisors, Inc., and Director of ALPS Distributors, Inc., ALPS Fund Services, Inc. (“ALPS”), and ALPS Portfolio Solutions Distributor, Inc. (collectively, the “ALPS Companies”). Mr. Burke retired from the ALPS Companies in June 2019. Mr. Burke is currently a partner at ETF Action, a web-based system that provides data and analytics to registered investment advisers, (since 2020) and a Director of Alliance Bioenergy Plus, Inc., a technology company focused on emerging technologies in the renewable energy, biofuels, and bioplastics technology sectors (since 2020). Mr. Burke is deemed an interested Trustee by virtue of his prior positions with the ALPS Companies. | 31 | Mr. Burke is a Trustee of ALPS ETF Trust (17 funds); Clough Global Dividend and Income Fund (1 fund); Clough Global Equity Fund (1 fund); Clough Global Opportunities Fund (1 fund); Clough Funds Trust (1 fund); Liberty All-Star Equity Fund (1 fund); and Director of the Liberty All-Star Growth Fund, Inc. (1 fund). |
| 50 | www.vulcanvaluepartners.com |
Trustees and Officers
April 30, 2021 (Unaudited)
OFFICERS
| Name, Address* & Year of Birth | Position(s) Held with Fund | Term of Office** and Length of Time Served | Principal Occupation(s) During Past 5 Years*** |
| Bradley J. Swenson, 1972***** | President | Mr. Swenson was appointed President of the Trust at the June 11, 2019 meeting of the Board of Trustees. | Mr. Swenson joined ALPS in 2004 and has served as its President since June 2019. In this role, he serves as an officer to certain other closed-end and open-end investment companies. He previously served as the Chief Operating Officer of ALPS (2015-2019). Mr. Swenson also previously served as Chief Compliance Officer to ALPS, its affiliated entities, and to certain ETF, closed-end and open-end investment companies (2004-2015). Because of his position with ALPS, Mr. Swenson is deemed an affiliate of the Trust as defined under the 1940 Act. |
| Dawn Cotten, 1977 | President | Ms. Cotten was appointed President of the Trust at the June 8-9, 2021 meeting of the Trustees. | Ms. Cotten joined ALPS in 2009 and is currently Senior Vice President of Fund Administration and Relationship Management of ALPS. She has served in that role since January 2020. Prior to that, Ms. Cotten served as Senior Vice President of Relationship Management (2017-2020). Ms. Cotten served as a VP in Relationship Management from 2013-2017. Ms. Cotten also serves as President of ALPS Series Trust, Clough Funds Trust, Clough Global Dividend and Income Fund, and Clough Global Equity Fund and Clough Global Opportunities Fund. |
| Jennell Panella, 1974 | Treasurer | Ms. Panella was appointed Treasurer of the Trust at the September 15, 2020 meeting of the Board of Trustees. | Ms. Panella joined ALPS in June 2012 and is currently Vice President and Fund Controller of ALPS Fund Services, Inc. Prior to joining ALPS, Ms. Panella served as Financial Reporting Manager for Parker Global Strategies, LLC (2009-2012). Because of her position with ALPS, Ms. Panella is deemed an affiliate of the Trust as defined under the 1940 Act. |
| Karen S. Gilomen, 1970***** | Secretary | Ms. Gilomen was appointed Secretary of the Trust at the December 13, 2016 meeting of the Board of Trustees. | Ms. Gilomen joined ALPS in August 2016 as Vice President and Senior Counsel. Prior to joining ALPS, Ms. Gilomen was Vice President - General Counsel & CCO of Monticello Associates, Inc. from 2010 to 2016. Because of her position with ALPS, Ms. Gilomen is deemed an affiliate of the Trust, as defined under the 1940 Act. Ms. Gilomen is also the Secretary of ALPS Variable Investment Trust and Reaves Utility Income Fund, and the Assistant Secretary of the WesMark Funds. |
| Cara Owen, 1981 | Secretary | Ms. Owen was appointed Secretary of the Trust at the June 8-9, 2021 meeting of the Board of Trustees. | Vice President and Principal Legal Counsel, ALPS Fund Services, Inc. Prior to joining ALPS, Ms. Owen was Senior Counsel, Corporate & Investments, Great-West Life & Annuity Insurance Company; Senior Counsel & Assistant Secretary, Great-West Funds, Inc., Great-West Capital Management, LLC, Great-West Trust Company, LLC, and Advised Assets Group, LLC (2014-2019). Ms. Owen also serves as Secretary of ALPS ETF Trust, Vice President and Secretary of Boulder Growth & Income Fund, and Assistant Secretary of James Advantage Funds. |
| Annual Report | April 30, 2021 | 51 |
Trustees and Officers
April 30, 2021 (Unaudited)
OFFICERS (continued)
| Name, Address* & Year of Birth | Position(s) Held with Fund | Term of Office** and Length of Time Served | Principal Occupation(s) During Past 5 Years*** |
| Ted Uhl, 1974 | Chief Compliance Officer (“CCO”) | Mr. Uhl was appointed CCO of the Trust at the June 8, 2010 meeting of the Board of Trustees. | Mr. Uhl joined ALPS in October 2006, and is currently Deputy Compliance Officer of ALPS. Prior to his current role, Mr. Uhl served as Senior Risk Manager for ALPS from October 2006 until June 2010. Before joining ALPS, Mr. Uhl served a Sr. Analyst with Enenbach and Associates (RIA), and a Sr. Financial Analyst at Sprint. Because of his position with ALPS, Mr. Uhl is deemed an affiliate of the Trust as defined under the 1940 Act. Mr. Uhl is also CCO of the Boulder Growth & Income Fund, Inc., Centre Funds, Index Funds, Reality Shares ETF Trust, Reaves Utility Income Fund and XAI Octagon Floating Rate & Alternative Income Term Trust. |
| Jennifer Craig, 1973 | Assistant Secretary | Ms. Craig was appointed Assistant Secretary of the Trust at the June 8, 2016 meeting of the Board of Trustees. | Ms. Craig joined ALPS in 2007 and is currently Assistant Vice President and Paralegal Manager of ALPS. Because of her position with ALPS, Ms. Craig is deemed an affiliate of the Trust as defined under the 1940 Act. Ms. Craig is also Secretary of Principal Real Estate Income Fund, Assistant Secretary of ALPS ETF Trust, Clough Global Dividend and Income Fund, Clough Global Equity Fund, Clough Global Opportunities Fund, Liberty All-Star Equity Fund and Liberty All-Star Growth Fund, Inc. and Clerk of Goehring & Rozencwajg Investment Funds. |
| * | All communications to Trustees and Officers may be directed to Financial Investors Trust c/o 1290 Broadway, Suite 1000, Denver, CO 80203. |
| ** | This is the period for which the Trustee or Officer began serving the Trust. Each Trustee serves an indefinite term, until such Trustees successor is elected and appointed, or such Trustee resigns or is deceased. Officers are elected on an annual basis. |
| *** | Except as otherwise indicated, each individual has held the office shown or other offices in the same company for the last five years. |
| **** | The Fund Complex includes all series of the Trust, currently 31, and any other investment companies for which any Trustee serves as trustee for and for which Vulcan Value Partners, LLC provides investment advisory services (currently none). |
| ***** | Mr. Swenson resigned his position as President of the Trust effective June 9, 2021 and Ms. Gilomen resigned her position as Secretary of the Trust effective June 4, 2021. |
| 52 | www.vulcanvaluepartners.com |
Privacy Policy
April 30, 2021 (Unaudited)
| WHO WE ARE | |
| Who is providing this notice? | Vulcan Value Partners Fund and Vulcan Value Partners Small Cap Fund. |
| WHAT WE DO | |
| How do the Funds protect my personal information? | To protect your personal information from unauthorized access and use, we use security measures that comply with federal law. These measures include computer safeguards and secured files and buildings. |
| How do the Funds collect my personal information? | We collect your personal information, for example, when you
● open an account ● provide account information or give us your contact information ● make a wire transfer or deposit money |
| Why can’t I limit all sharing? | Federal law gives you the right to limit only
● sharing for affiliates’ everyday business purposes-information about your creditworthiness ● affiliates from using your information to market to you ● sharing for non-affiliates to market to you
State laws and individual companies may give you additional rights to limit sharing. |
| Annual Report | April 30, 2021 | 53 |
Privacy Policy
April 30, 2021 (Unaudited)
| FACTS | WHAT DO THE FUNDS DO WITH YOUR PERSONAL INFORMATION? |
| WHY? | Financial companies choose how they share your personal information. Federal law gives consumers the right to limit some but not all sharing. Federal law also requires us to tell you how we collect, share, and protect your personal information. Please read this notice carefully to understand what we do. |
| WHAT? | The types of personal information we collect and share depend on the product or service you have with us. This information can include: ● Social Security number and account transactions ● Account balances and transaction history ● Wire transfer instructions |
| HOW? | All financial companies need to share customers’ personal information to run their everyday business. In the section below, we list the reasons financial companies can share their customers’ personal information; the reasons the Funds choose to share; and whether you can limit this sharing. |
| REASONS WE CAN SHARE YOUR PERSONAL INFORMATION | DO THE FUNDS SHARE: | CAN YOU LIMIT THIS SHARING? |
For our everyday business purposes – such as to process your transactions, maintain your account(s), respond to court orders and legal investigations, or report to credit bureaus | Yes | No |
For our marketing purposes – to offer our products and services to you | No | We do not share. |
| For joint marketing with other financial companies | No | We do not share. |
For our affiliates’ everyday business purposes – information about your transactions and experiences | Yes | No |
For our affiliates’ everyday business purposes – information about your creditworthiness | No | We do not share. |
| For non-affiliates to market to you | No | We do not share. |
| 54 | www.vulcanvaluepartners.com |
Intentionally Left Blank

The Funds are neither insured nor guaranteed by the U.S. Government, the FDIC, the Federal Reserve Board or any other governmental agency or insurer.
This material must be accompanied or preceded by a prospectus.
Managed Accounts are available only for institutional and private clients of Vulcan Value Partners, LLC, a federally registered investment advisor. Vulcan Value Partners Funds are distributed by ALPS Distributors, Inc. Separately Managed Accounts and related investment advisory services are provided by Vulcan Value Partners, LLC, a federally regulated investment advisor. ALPS Distributors, Inc. is not affiliated with Vulcan Value Partners, LLC.
(b) Not applicable.
Item 2. Code of Ethics.
| (a) | The Registrant, as of the end of the period covered by this report, has adopted a code of ethics that applies to the Registrant’s principal executive officer, principal financial officer, principal accounting officer or controller or any persons performing similar functions on behalf of the Registrant. |
| (b) | Not applicable. |
| (c) | During the period covered by this report, no amendments to the provisions of the code of ethics described in Item 2(a) above were made. |
| (d) | During the period covered by this report, no implicit or explicit waivers to the provisions of the code of ethics described in Item 2(a) above were granted. |
| (e) | Not applicable. |
| (f) | The Registrant’s Code of Ethics is attached as an Exhibit to this report. |
Item 3. Audit Committee Financial Expert.
The Board of Trustees of the Registrant has determined that the Registrant has at least one Audit Committee Financial Expert serving on its audit committee. The Board of Trustees of the Registrant has designated Jeremy W. Deems as the Registrant’s “Audit Committee Financial Expert.” Mr. Deems is “independent” as defined in paragraph (a)(2) of Item 3 to Form N-CSR.
Item 4. Principal Accountant Fees and Services.
| (a) | Audit Fees: For the Registrant’s fiscal years ended April 30, 2021 and April 30, 2020, the aggregate fees billed for professional services rendered by the principal accountant for the audit of the Registrant’s annual financial statements or services that are normally provided by the accountant in connection with statutory and regulatory filings or engagements for those fiscal years were $377,040 and $395,180, respectively. |
| (b) | Audit-Related Fees: For the Registrant’s fiscal years ended April 30, 2021 and April 30, 2020, the aggregate fees billed for assurance and related services by the principal accountant that were reasonably related to the performance of the audit |
| of the Registrant’s financial statements and are not reported under paragraph (a) of this Item were $0 and $0, respectively. |
| (c) | Tax Fees: For the Registrant’s fiscal years ended April 30, 2021 and April 30, 2020, the aggregate fees billed for professional services rendered by the principal accountant for tax compliance, tax advice and tax planning were $95,310 and $98,965, respectively. The fiscal years 2021 and 2020 tax fees were for services for dividend calculation, excise tax preparation and tax return preparation. |
| (d) | All Other Fees: For the Registrant’s fiscal years ended April 30, 2021 and April 30, 2020, no fees were billed to Registrant by the principal accountant for products and services, other than the services reported in paragraphs (a) through (c) of this Item. |
| (e)(1) | Audit Committee Pre-Approval Policies and Procedures: All services to be performed by the Registrant’s principal accountant must be pre-approved by the Registrant’s Audit Committee. The Chairman of the Audit Committee may pre-approve non-audit services to be performed by the Registrant’s principal accountant on an interim basis, subject to ratification by the Audit Committee at its next regularly scheduled meeting. |
| (e)(2) | No services described in paragraphs (b) through (d) of this Item were approved by the Registrant’s Audit Committee pursuant to paragraph (c)(7)(i)(C) of Rule 2-01 of Regulation S-X. |
| (f) | Not applicable. |
| (g) | The aggregate non-audit fees billed by the Registrant’s accountant to the Registrant, and rendered to the Registrant’s investment adviser (not including any sub-adviser whose role is primarily portfolio management and is subcontracted with or overseen by another investment adviser), and any entity controlling, controlled by, or under common control with the adviser that provides ongoing services to the Registrant, were $95,310 in the fiscal year ended April 30, 2021 and were $118,322 in the fiscal year ended April 30, 2020. These fees consisted of non-audit fees billed to (i) the Registrant of $95,310 in the fiscal year ended April 30, 2021 and $98,965 in the fiscal year ended April 30, 2020 as described in response to paragraph (c) above and (ii) to ALPS Fund Services, Inc. (“AFS”), an entity under common control with ALPS Advisors, Inc., the Registrant’s investment adviser, of $0 in the fiscal year ended April 30, 2021 and $19,357 in the fiscal year ended April 30, 2020. The non-audit fees billed to AFS related to SSAE 16 services and other compliance-related matters. |
| (h) | The Registrant��s audit committee has considered whether the provision of non-audit services that were rendered to the Registrant’s investment adviser (not including any sub-adviser whose role is primarily portfolio management and is subcontracted with or overseen by another investment adviser), and any entity |
| controlling, controlled by, or under common control with the investment adviser that provides ongoing services to the Registrant that were not pre-approved pursuant to paragraph (c)(7)(ii) of Rule 2-01 of Regulation S-X, is compatible with maintaining the principal accountant’s independence. The Registrant’s audit committee determined that the provision of such non-audit services is compatible with maintaining the principal accountant’s independence. |
Item 5. Audit Committee of Listed Registrants.
Not applicable to the Registrant.
Item 6. Investments.
| (a) | Schedule of Investments in securities of unaffiliated issuers as of the close of the reporting period is included as part of the Reports to Stockholders filed under Item 1(a) of this Form N-CSR. |
| (b) | Not applicable. |
Item 7. Disclosure of Proxy Voting Policies and Procedures for Closed-End Management Investment Companies.
Not applicable to the Registrant.
Item 8. Portfolio Managers of Closed-End Management Investment Companies.
Not applicable to the Registrant.
Item 9. Purchases of Equity Securities by Closed-End Management Investment Company and Affiliated Purchasers.
Not applicable to the Registrant.
Item 10. Submission of Matters to a Vote of Security Holders.
There have been no material changes to the procedures by which shareholders may recommend nominees to the Registrant’s Board of Trustees, where those changes were implemented after the Registrant last provided disclosure in response to the requirements of Item 407(c)(2)(iv) of Regulation S-K, or this Item.
Item 11. Controls and Procedures.
| (a) | The Registrant’s principal executive officer and principal financial officer have concluded that the Registrant’s disclosure controls and procedures (as defined in Rule 30a-3(c) under the Investment Company Act of 1940, as amended) are |
| effective based on their evaluation of these controls and procedures as of a date within 90 days of the filing date of this report. |
| (b) | There was no change in the Registrant’s internal control over financial reporting (as defined in Rule 30a-3(d) under the Investment Company Act of 1940, as amended) during the period covered by this report that has materially affected, or is reasonably likely to materially affect, the Registrant’s internal control over financial reporting. |
Item 12. Disclosure of Securities Lending Activities for Closed-End Management Investment Companies.
Not applicable to the Registrant.
Item 13. Exhibits.
| (a)(3) | Not applicable. |
| (a)(4) | Not applicable. |
SIGNATURES
Pursuant to the requirements of the Securities Exchange Act of 1934 and the Investment Company Act of 1940, the Registrant has duly caused this report to be signed on its behalf by the undersigned, thereunto duly authorized.
FINANCIAL INVESTORS TRUST
| By: | /s/ Dawn Cotten | |
| Dawn Cotten (Principal Executive Officer) | ||
| President | ||
| Date: | July 9, 2021 |
Pursuant to the requirements of the Securities Exchange Act of 1934 and the Investment Company Act of 1940, this report has been signed below by the following persons on behalf of the Registrant and in the capacities and on the dates indicated.
FINANCIAL INVESTORS TRUST
| By: | /s/ Dawn Cotten | |
| Dawn Cotten (Principal Executive Officer) | ||
| President | ||
| Date: | July 9, 2021 | |
| By: | /s/ Jennell Panella | |
| Jennell Panella (Principal Financial Officer) | ||
| Treasurer | ||
| Date: | July 9, 2021 |