UNITED STATES
SECURITIES AND EXCHANGE COMMISSION
Washington, D.C. 20549
FORM N-CSR
CERTIFIED SHAREHOLDER REPORT OF REGISTERED
MANAGEMENT INVESTMENT COMPANIES
Investment Company Act file number: 811-08194
FINANCIAL INVESTORS TRUST
(Exact name of registrant as specified in charter)
1290 Broadway, Suite 1100, Denver, Colorado 80203
(Address of principal executive offices) (Zip code)
Karen Gilomen, Esq., Secretary
Financial Investors Trust
1290 Broadway, Suite 1100
Denver, Colorado 80203
(Name and address of agent for service)
Registrant’s telephone number, including area code:303-623-2577
Date of fiscal year end:April 30
Date of reporting period:April 30, 2019
Item 1. Reports to Stockholders.

TABLE OF CONTENTS
ANNUAL REPORT
| SHAREHOLDER LETTER | 1 |
| PERFORMANCE UPDATE | 3 |
| DISCLOSURE OF FUND EXPENSES | 5 |
| PORTFOLIO OF INVESTMENTS | 6 |
| STATEMENT OF ASSETS AND LIABILITIES | 18 |
| STATEMENT OF OPERATIONS | 19 |
| STATEMENTS OF CHANGES IN NET ASSETS | 20 |
| FINANCIAL HIGHLIGHTS | 22 |
| NOTES TO FINANCIAL STATEMENTS | 24 |
| REPORT OF INDEPENDENT REGISTERED PUBLIC ACCOUNTING FIRM | 32 |
| ADDITIONAL INFORMATION | 33 |
| DISCLOSURE REGARDING APPROVAL OF FUND ADVISORY AGREEMENTS | 34 |
| TRUSTEES AND OFFICERS | 37 |
| PRIVACY POLICY | 42 |
Beginning on January 1, 2021, as permitted by regulations adopted by the U.S. Securities and Exchange Commission, paper copies of the Fund’s annual and semi-annual shareholder reports will no longer be sent by mail, unless you specifically request paper copies of the reports. Instead, the reports will be made available on the Fund’s website atwww.dgifund.com, and you will be notified by mail each time a report is posted and provided with a website link to access the report.
Beginning on January 1, 2019, you may, notwithstanding the availability of shareholder reports online, elect to receive all future shareholder reports in paper free of charge. If you invest through a financial intermediary, you can contact your financial intermediary to request that you continue to receive paper copies of your shareholder reports. If you invest directly with the Fund, you can call 1.855.DGI.FUND (1-855-344-3863) to let the Fund know you wish to continue receiving paper copies of your shareholder reports.
If you already elected to receive shareholder reports electronically, you will not be affected by this change and you need not take any action. You may elect to receive shareholder reports and other communications from the Fund electronically anytime by contacting your financial intermediary (such as a broker-dealer or bank) or, if you are a direct investor, by enrolling atwww.dgifund.com.
Disciplined Growth Investors’ goal is to communicate clearly and transparently with our clients and mutual fund shareholders. It is mutually beneficial when our shareholders understand how we invest, what we are currently thinking and forecasting, and the specific investment decisions we have made. Our views and opinions regarding the investment prospects of our portfolio holdings and the Fund are “forward looking statements” which may or may not be accurate over the long term. While we believe we have a reasonable basis for these forecasts and have confidence in our investment team’s views, actual results may differ materially from those we anticipate. Information provided in this report should not be considered a recommendation to purchase or sell any particular security.
You can identify forward looking statements as those including words such as “believe”, “expect”, “anticipate”, “forecast”, and similar statement. We cannot assure future performance. These forward-looking statements are made only as-of the date of this report. Following the publication of this report, we will not update any of the forward-looking statements included here.
This material must be preceded or accompanied by a prospectus. Please read the prospectus carefully before investing.
| The Disciplined Growth Investors Fund | Shareholder Letter |
April 30, 2019 (Unaudited)
Fund Performance and Asset Mix:
The DGI Fund’s fiscal year ended on April 30th. For the 2018 fiscal year (5/1/18-4/30/19), The DGI Fund returned 14.74%.
Stocks in The DGI Fund increased 19.45% and outperformed the S&P 500® Index, which increased 13.49%. The DGI Fund held 38 stocks that increased in value and 15 stocks that declined in value.
Bonds in the Fund returned 6.20%, outperforming the Barclays Government & Corporate Credit Index which gained 5.29% during the fiscal year. This represented the highest bond performance in the Fund for any fiscal year since inception (2011).
This fiscal year included a bear market during the fourth quarter of the 2018 calendar year, when the S&P 500 fell over 20% below its previous high point. The DGI Fund’s equities declined in a similar magnitude to the S&P 500. To start the 2019 calendar year, The DGI Fund rebounded and set new all-time high NAV of $21.26 on April 16th.
With 70.0% stocks and 30.0% bonds & cash as of 4/30/19, we have positioned the Fund to reflect our work which shows expected returns for the Fund’s stocks materially in excess of expected returns for bonds.
You can find additional performance information and a full list of the Fund’s holdings in this report and atwww.dgifund.com.
Performance data quoted represents past performance. Past performance does not guarantee future results. Investment return and principal value of an investment will fluctuate so that an investor’s shares, when sold or redeemed, may be worth more or less than the original cost. Current performance data may be higher or lower than actual data quoted. For the most current month-end performance data please call 1.855.DGI.FUND.
Portfolio Activity:
Since we last wrote to you at the end of October, 2018, we have added two new stocks to The DGI Fund.
IPG Photonics (IPGP) is the leader in the design and production of fiber lasers, with about 70% market share. Fiber lasers are revolutionizing industrial production. This technology is displacing legacy CO2, direct diode, and other solid-state lasers in the areas of cutting, welding/brazing, and marking/engraving. As fiber lasers continue displacing traditional machine tools, they are also making inroads into several brand new applications, including additive manufacturing. Trade tensions with China caused a slowdown in sales and we took advantage of stock price weakness to make an initial investment.
Stamps.com, Inc. (STMP)enables individuals and businesses to purchase and print U.S. Postal Service-approved postage. Its success has driven most of the growth in USPS shipping over the past several years. In addition to U.S. postage, Stamps.com has expanded to enabling shipping across multiple providers (FedEx, UPS, and others). The company recently focused its attention internationally – a market it has not yet tapped and we believe holds significant potential. These two shifts caused a backlash from the USPS and the stock price declined as a result. We have nearly two decades of investment experience with Stamps.com prior to its addition to The DGI
| Annual Report | April 30, 2019 | 1 |
| The Disciplined Growth Investors Fund | Shareholder Letter |
April 30, 2019 (Unaudited)
Fund. We consider both international expansion and multiple-vendor shipping to be long-term opportunities the company has created for which the market punished the stock price in the short term. We took advantage of this situation to add the holding to The DGI Fund.
In the last six months we also added to the Fund’s existing position inMedidata Solutions (MDSO)andRealPage (RP).
Finally, we sold the remaining position in bothSeagate Technology (STX)andSynaptics (SYNA).
Sincerely,

Portfolio Manager
Disciplined Growth Investors, Inc.
Asset class-specific performance is before fees. The Fund’s single fee – the management fee – is paid from the Fund’s holding of cash. Total Fund net-of-fees performance is presented in this letter, later in this annual report, and is updated monthly on the Fund’s website,www.dgifund.com.
The views of Disciplined Growth Investors, Inc. and information discussed in this commentary are as of the date of publication, are subject to change, and may not reflect the writers’ current views. The views expressed are those of the Fund’s adviser only, and represent an assessment of market conditions at a specific point in time, are opinions only and should not be relied upon as investment advice regarding a particular investment or markets in general. Such information does not constitute a recommendation to buy or sell specific securities or investment vehicles. It should not be assumed that any investment will be profitable or will equal the performance of the portfolios or any securities or any sectors mentioned in this letter. The subject matter contained in this letter has been derived from several sources believed to be reliable and accurate at the time of compilation. Neither Disciplined Growth Investors, Inc. nor the Fund accepts any liability for losses either direct or consequential caused by the use of this information.
The Fund is distributed by ALPS Distributors, Inc.
The Fund is subject to investment risks, including possible loss of the principal amount invested and therefore is not suitable for all investors. The Fund may not achieve its objectives.
Diversification does not eliminate the risk of experiencing investment losses.
Fred Martin is a registered representative of ALPS Distributors, Inc. CFA Institute Marks are trademarks owned by the CFA Institute.
The S&P 500® Total Return Index is an unmanaged index of 500 common stocks chosen for market size, liquidity and industry group representation. It is a market-value weighted index. The Index is not actively managed and does not reflect any deductions for fees, expenses or taxes. An investor may not invest directly in the Index.
| 2 | 1-855-DGI-FUND (344-3863) | www.DGIfund.com |
| The Disciplined Growth Investors Fund | Performance Update |
April 30, 2019 (Unaudited)
Annualized Total Return Performance(for the period ended April 30, 2019)
| | 6 month | Calendar YTD | 1 Year | 3 Year | 5 Year | Since Inception* |
| The Disciplined Growth Investors Fund | 11.26% | 17.74% | 14.74% | 13.13% | 9.86% | 12.38% |
| S&P 500® Total Return Index(1) | 9.76% | 18.25% | 13.49% | 14.87% | 11.63% | 14.99% |
Performance data quoted represents past performance. Past performance does not guarantee future results. Investment return and principal value of an investment will fluctuate so that an investor’s shares, when sold or redeemed, may be worth more or less than the original cost. Current performance data may be higher or lower than actual data quoted. For the most current month-end performance data please call 1.855.DGI.FUND.
The table does not reflect the deductions of taxes a shareholder would pay on Fund distributions or redemptions of Fund shares.
Subject to investment risks, including possible loss of the principal amount invested. Returns for periods less than 1 year are cumulative.
| * | Fund Inception date of August 12, 2011. |
| (1) | The S&P 500® Total Return Index is an unmanaged index of 500 common stocks chosen for market size, liquidity and industry group representation. It is a market-value weighted index. The Index is not actively managed and does not reflect any deductions for fees, expenses or taxes. An investor may not invest directly in the Index. |
| Annual Report | April 30, 2019 | 3 |
| The Disciplined Growth Investors Fund | Performance Update |
April 30, 2019 (Unaudited)
Growth of $10,000 Investment in the Fund(for the period ended April 30, 2019)
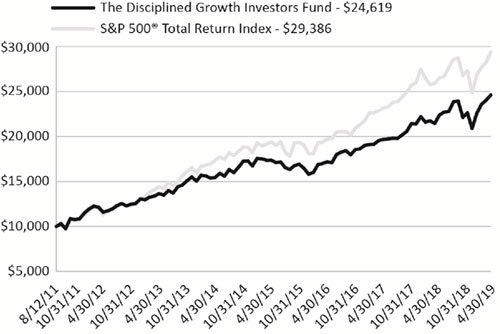
The chart above represents historical performance of a hypothetical investment of $10,000 in the Fund since inception. Past performance does not guarantee future results. This chart does not reflect the deduction of taxes that a shareholder would pay on Fund distributions or the redemption of Fund shares.
Investing in the Fund is subject to investment risks, including possible loss of the principal amount invested.
Industry Sector Allocation
(as a % of Net Assets)*
| Technology | 33.04% |
| Consumer Discretionary | 14.02% |
| Health Care | 13.19% |
| Industrials | 6.85% |
| Energy | 1.24% |
| Financials | 0.52% |
| Communications | 0.55% |
| Consumer, Cyclical | 0.71% |
| Corporate Bonds | 20.77% |
| Foreign Corporate Bonds | 0.61% |
| Foreign Government Bonds | 0.45% |
| Government & Agency Obligations | 7.40% |
| Other Assets in Excess of Liabilities | 0.65% |
Top Ten Holdings
(as a % of Net Assets)*
| Edwards Lifesciences Corp. | 4.66% |
| Ubiquiti Networks, Inc. | 3.68% |
| TJX Cos., Inc. | 3.60% |
| Align Technology, Inc. | 3.46% |
| Intuit, Inc. | 3.01% |
| U.S. Treasury Note | 2.68% |
| Middleby Corp. | 2.44% |
| FactSet Research Systems, Inc. | 2.32% |
| Intuitive Surgical, Inc. | 2.29% |
| Autodesk, Inc. | 2.24% |
| Top Ten Holdings | 30.38% |
| * | Holdings are subject to change, and may not reflect the current or future position of the portfolio. |
| 4 | 1-855-DGI-FUND (344-3863) | www.DGIfund.com |
| The Disciplined Growth Investors Fund | Disclosure of Fund Expenses |
April 30, 2019 (Unaudited)
As a shareholder of the Fund, you incur two types of costs: (1) transaction costs, including sales charges (loads) on purchase payments, reinvested dividends, or other distributions; redemption fees; and exchange fees; and (2) ongoing costs, including management fees; distribution and/or service (12b-1) fees; and other fund operating expenses. This example is intended to help you understand your ongoing costs (in dollars), of investing in the Fund and to compare these costs with the ongoing costs of investing in other mutual funds.
This example is based on an investment of $1,000 invested at the beginning of the period and held for the entire six-month period of November 1, 2018 through April 30, 2019.
Actual Expenses The first line of the table below provides information about actual account values and actual expenses. You may use the information in this line, together with the amount you invested, to estimate the expenses that you paid over the period. Simply divide your account value by $1,000 (for example, an $8,600 account value divided by $1,000 = 8.6), then multiply the result by the number in the first line under the heading “Expenses Paid During Period” to estimate the expenses you paid on your account during this period.
Hypothetical Example for Comparison Purposes The second line of the table below provides information about hypothetical account values and hypothetical expenses based on the Fund’s actual expense ratio and an assumed rate of return of 5% per year before expenses, which is not the Fund’s actual return. The hypothetical account values and expenses may not be used to estimate the actual ending account balance or expenses you paid for the period. You may use this information to compare the ongoing costs of investing in the Fund and other mutual funds. To do so, compare this 5% hypothetical example with the 5% hypothetical examples that appear in the shareholder reports of the other funds.
Please note that the expenses shown in the table are meant to highlight your ongoing costs only and do not reflect transactional costs, such as sales charges (loads), redemption fees or exchange fees. Therefore, the second line of the table is useful in comparing ongoing costs only and will not help you determine the relative total costs of owning different funds. In addition, if these transactional costs were included, your costs would have been higher.
| | Beginning Account Value 11/1/2018 | Ending Account Value 4/30/2019 | Expense Ratio(a) | Expenses Paid During period 11/1/2018 - 4/30/2019(b) |
| Actual | $1,000.00 | $1,112.60 | 0.78% | $4.09 |
| Hypothetical (5% return before expenses) | $1,000.00 | $1,020.93 | 0.78% | $3.91 |
| (a) | The Fund's expense ratios have been annualized based on the Fund's most recent fiscal half-year expenses. |
| (b) | Expenses are equal to the Fund's annualized expense ratio, multiplied by the average account value over the period, multiplied by the number of days in the most recent fiscal half-year (181)/365 (to reflect the half-year period). |
| Annual Report | April 30, 2019 | 5 |
| The Disciplined Growth Investors Fund | Portfolio of Investments |
April 30, 2019
| | | Shares | | | Value (Note 2) | |
| COMMON STOCKS (70.12%) | | | | | | | | |
| COMMUNICATIONS (0.55%) | | | | | | | | |
| Internet (0.55%) | | | | | | | | |
| Stamps.com, Inc.(a) | | | 15,502 | | | $ | 1,330,072 | |
| | | | | | | | | |
| TOTAL COMMUNICATIONS | | | | | | | 1,330,072 | |
| | | | | | | | | |
| CONSUMER DISCRETIONARY (14.02%) | | | | | | | | |
| Apparel & Textile Products (1.43%) | | | | | | | | |
| Ralph Lauren Corp. | | | 12,934 | | | | 1,701,856 | |
| Under Armour, Inc. , Class A(a) | | | 75,054 | | | | 1,732,997 | |
| | | | | | | | 3,434,853 | |
| | | | | | | | | |
| Automotive (1.99%) | | | | | | | | |
| Gentex Corp. | | | 141,545 | | | | 3,259,781 | |
| Gentherm, Inc.(a) | | | 35,826 | | | | 1,517,590 | |
| | | | | | | | 4,777,371 | |
| | | | | | | | | |
| Gaming, Lodging & Restaurants (2.21%) | | | | | | | | |
| Cheesecake Factory, Inc. | | | 22,470 | | | | 1,114,961 | |
| Royal Caribbean Cruises, Ltd. | | | 34,698 | | | | 4,196,376 | |
| | | | | | | | 5,311,337 | |
| | | | | | | | | |
| Leisure (0.37%) | | | | | | | | |
| TripAdvisor, Inc.(a) | | | 16,505 | | | | 878,561 | |
| | | | | | | | | |
| Passenger Transportation (1.25%) | | | | | | | | |
| JetBlue Airways Corp.(a) | | | 162,328 | | | | 3,011,184 | |
| | | | | | | | | |
| Retail - Consumer Discretionary (6.77%) | | | | | | | | |
| L Brands, Inc. | | | 68,551 | | | | 1,757,648 | |
| Nordstrom, Inc. | | | 49,463 | | | | 2,028,972 | |
| Sleep Number Corp.(a) | | | 83,681 | | | | 2,912,099 | |
| TJX Cos., Inc. | | | 157,601 | | | | 8,649,143 | |
| Urban Outfitters, Inc.(a) | | | 30,431 | | | | 904,713 | |
| | | | | | | | 16,252,575 | |
| | | | | | | | | |
| TOTAL CONSUMER DISCRETIONARY | | | | | | | 33,665,881 | |
| 6 | 1-855-DGI-FUND (344-3863) | www.DGIfund.com |
| The Disciplined Growth Investors Fund | Portfolio of Investments |
April 30, 2019
| | | Shares | | | Value (Note 2) | |
| CONSUMER, CYCLICAL (0.71%) | | | | | | | | |
| Retail (0.71%) | | | | | | | | |
| MSC Industrial Direct Co., Inc. , Class A | | | 20,443 | | | $ | 1,710,057 | |
| | | | | | | | | |
| TOTAL CONSUMER, CYCLICAL | | | | | | | 1,710,057 | |
| | | | | | | | | |
| ENERGY (1.24%) | | | | | | | | |
| Oil, Gas & Coal (1.24%) | | | | | | | | |
| Core Laboratories NV | | | 11,350 | | | | 719,477 | |
| Southwestern Energy Co.(a) | | | 535,154 | | | | 2,113,858 | |
| Ultra Petroleum Corp.(a) | | | 337,188 | | | | 141,754 | |
| | | | | | | | 2,975,089 | |
| | | | | | | | | |
| TOTAL ENERGY | | | | | | | 2,975,089 | |
| | | | | | | | | |
| FINANCIALS (0.52%) | | | | | | | | |
| Banks (0.52%) | | | | | | | | |
| TCF Financial Corp. | | | 55,847 | | | | 1,235,894 | |
| | | | | | | | | |
| TOTAL FINANCIALS | | | | | | | 1,235,894 | |
| | | | | | | | | |
| HEALTH CARE (13.19%) | | | | | | | | |
| Medical Equipment & Devices (13.19%) | | | | | | | | |
| Align Technology, Inc.(a) | | | 25,576 | | | | 8,304,016 | |
| Edwards Lifesciences Corp.(a) | | | 63,633 | | | | 11,203,862 | |
| Intuitive Surgical, Inc.(a) | | | 10,754 | | | | 5,491,315 | |
| Myriad Genetics, Inc.(a) | | | 102,968 | | | | 3,241,432 | |
| Varian Medical Systems, Inc.(a) | | | 25,305 | | | | 3,445,782 | |
| | | | | | | | 31,686,407 | |
| | | | | | | | | |
| TOTAL HEALTH CARE | | | | | | | 31,686,407 | |
| | | | | | | | | |
| INDUSTRIALS (6.85%) | | | | | | | | |
| Electrical Equipment (0.88%) | | | | | | | | |
| Cognex Corp. | | | 41,899 | | | | 2,112,966 | |
| | | | | | | | | |
| Machinery (3.37%) | | | | | | | | |
| Graco, Inc. | | | 43,386 | | | | 2,223,533 | |
| Middleby Corp.(a) | | | 44,439 | | | | 5,871,725 | |
| | | | | | | | 8,095,258 | |
| | | | | | | | | |
| Manufactured Goods (1.20%) | | | | | | | | |
| Proto Labs, Inc.(a) | | | 26,215 | | | | 2,878,145 | |
| Annual Report | April 30, 2019 | 7 |
| The Disciplined Growth Investors Fund | Portfolio of Investments |
April 30, 2019
| | | Shares | | | Value (Note 2) | |
| INDUSTRIALS (continued) | | | | | | | | |
| Transportation & Logistics (1.40%) | | | | | | | | |
| Landstar System, Inc. | | | 30,964 | | | $ | 3,373,837 | |
| | | | | | | | | |
| TOTAL INDUSTRIALS | | | | | | | 16,460,206 | |
| | | | | | | | | |
| TECHNOLOGY (33.04%) | | | | | | | | |
| Design, Manufacturing & Distribution (2.07%) | | | | | | | | |
| Plexus Corp.(a) | | | 82,562 | | | | 4,968,581 | |
| | | | | | | | | |
| Hardware (10.85%) | | | | | | | | |
| Dolby Laboratories, Inc. , Class A | | | 49,970 | | | | 3,232,559 | |
| Garmin, Ltd. | | | 49,173 | | | | 4,216,093 | |
| Plantronics, Inc. | | | 53,751 | | | | 2,767,102 | |
| Super Micro Computer, Inc.(a) | | | 144,011 | | | | 3,228,727 | |
| Ubiquiti Networks, Inc. | | | 51,883 | | | | 8,843,457 | |
| ViaSat, Inc.(a) | | | 41,592 | | | | 3,777,385 | |
| | | | | | | | 26,065,323 | |
| | | | | | | | | |
| Semiconductors (3.89%) | | | | | | | | |
| IPG Photonics Corp.(a) | | | 12,927 | | | | 2,258,735 | |
| Microchip Technology, Inc. | | | 31,555 | | | | 3,152,029 | |
| Power Integrations, Inc. | | | 49,825 | | | | 3,937,171 | |
| | | | | | | | 9,347,935 | |
| | | | | | | | | |
| Software (11.72%) | | | | | | | | |
| Akamai Technologies, Inc.(a) | | | 54,292 | | | | 4,346,618 | |
| Autodesk, Inc.(a) | | | 30,216 | | | | 5,384,793 | |
| Intuit, Inc. | | | 28,810 | | | | 7,233,039 | |
| Manhattan Associates, Inc.(a) | | | 30,170 | | | | 2,034,967 | |
| Open Text Corp. | | | 137,000 | | | | 5,267,650 | |
| RealPage, Inc.(a) | | | 59,502 | | | | 3,880,125 | |
| | | | | | | | 28,147,192 | |
| 8 | 1-855-DGI-FUND (344-3863) | www.DGIfund.com |
| The Disciplined Growth Investors Fund | Portfolio of Investments |
April 30, 2019
| | | Shares | | | Value (Note 2) | |
| TECHNOLOGY (continued) | | | | | | | | |
| Technology Services (4.51%) | | | | | | | | |
| FactSet Research Systems, Inc. | | | 20,188 | | | $ | 5,569,264 | |
| IHS Markit, Ltd.(a) | | | 27,705 | | | | 1,586,388 | |
| Medidata Solutions, Inc.(a) | | | 22,400 | | | | 2,023,616 | |
| Paychex, Inc. | | | 19,487 | | | | 1,642,949 | |
| | | | | | | | 10,822,217 | |
| | | | | | | | | |
| TOTAL TECHNOLOGY | | | | | | | 79,351,248 | |
| | | | | | | | | |
| TOTAL COMMON STOCKS | | | | | | | | |
| (Cost $99,554,799) | | | | | | | 168,414,854 | |
| | | Principal Amount | | | Value (Note 2) | |
| CORPORATE BONDS (20.77%) | | | | | | | | |
| BASIC MATERIALS (0.30%) | | | | | | | | |
| Chemicals (0.30%) | | | | | | | | |
| DowDuPont, Inc. | | | | | | | | |
| 4.725% 11/15/2028 | | $ | 666,000 | | | | 726,770 | |
| | | | | | | | | |
| TOTAL BASIC MATERIALS | | | | | | | 726,770 | |
| | | | | | | | | |
| COMMUNICATIONS (1.28%) | | | | | | | | |
| Cable & Satellite (0.34%) | | | | | | | | |
| Comcast Corp. | | | | | | | | |
| 3.375% 08/15/2025 | | | 810,000 | | | | 823,559 | |
| | | | | | | | | |
| Entertainment Content (0.31%) | | | | | | | | |
| CBS Corp. | | | | | | | | |
| 4.000% 01/15/2026 | | | 726,000 | | | | 740,350 | |
| | | | | | | | | |
| Wireless Telecommunications Services (0.63%) | | | | | | | | |
| AT&T, Inc. | | | | | | | | |
| 4.250% 03/01/2027 | | | 741,000 | | | | 768,201 | |
| 4.450% 04/01/2024 | | | 4,000 | | | | 4,231 | |
| Verizon Communications, Inc. | | | | | | | | |
| 4.125% 03/16/2027 | | | 698,000 | | | | 736,305 | |
| | | | | | | | 1,508,737 | |
| | | | | | | | | |
| TOTAL COMMUNICATIONS | | | | | | | 3,072,646 | |
| Annual Report | April 30, 2019 | 9 |
| The Disciplined Growth Investors Fund | Portfolio of Investments |
April 30, 2019
| | | Principal Amount | | | Value (Note 2) | |
| CONSUMER DISCRETIONARY (1.94%) | | | | | | | | |
| Airlines (0.31%) | | | | | | | | |
| Southwest Airlines Co. | | | | | | | | |
| 3.000% 11/15/2026 | | $ | 756,000 | | | $ | 729,932 | |
| | | | | | | | | |
| Apparel & Textile Products (0.30%) | | | | | | | | |
| Cintas Corp. No 2 | | | | | | | | |
| 3.700% 04/01/2027 | | | 710,000 | | | | 728,380 | |
| | | | | | | | | |
| Restaurants (0.31%) | | | | | | | | |
| McDonald's Corp., Series MTN | | | | | | | | |
| 6.300% 03/01/2038 | | | 604,000 | | | | 751,689 | |
| | | | | | | | | |
| Retail - Consumer Discretionary (1.02%) | | | | | | | | |
| Advance Auto Parts, Inc. | | | | | | | | |
| 4.500% 12/01/2023 | | | 685,000 | | | | 718,926 | |
| Amazon.com, Inc. | | | | | | | | |
| 5.200% 12/03/2025 | | | 885,000 | | | | 1,006,506 | |
| Lowe's Cos., Inc. | | | | | | | | |
| 2.500% 04/15/2026 | | | 770,000 | | | | 731,559 | |
| | | | | | | | 2,456,991 | |
| | | | | | | | | |
| TOTAL CONSUMER DISCRETIONARY | | | | | | | 4,666,992 | |
| | | | | | | | | |
| CONSUMER STAPLES (0.62%) | | | | | | | | |
| Mass Merchants (0.32%) | | | | | | | | |
| Costco Wholesale Corp. | | | | | | | | |
| 2.750% 05/18/2024 | | | 760,000 | | | | 762,284 | |
| | | | | | | | | |
| Supermarkets & Pharmacies (0.30%) | | | | | | | | |
| CVS Health Corp. | | | | | | | | |
| 5.000% 12/01/2024 | | | 675,000 | | | | 718,511 | |
| | | | | | | | | |
| TOTAL CONSUMER STAPLES | | | | | | | 1,480,795 | |
| | | | | | | | | |
| CONSUMER, CYCLICAL (0.30%) | | | | | | | | |
| Auto Manufacturers (0.30%) | | | | | | | | |
| General Motors Financial Co., Inc. | | | | | | | | |
| 3.500% 11/07/2024 | | | 720,000 | | | | 709,599 | |
| | | | | | | | | |
| TOTAL CONSUMER, CYCLICAL | | | | | | | 709,599 | |
| 10 | 1-855-DGI-FUND (344-3863) | www.DGIfund.com |
| The Disciplined Growth Investors Fund | Portfolio of Investments |
April 30, 2019
| | | Principal Amount | | | Value (Note 2) | |
| CONSUMER, NON-CYCLICAL (0.30%) | | | | | | | | |
| Pharmaceuticals (0.30%) | | | | | | | | |
| AbbVie, Inc. | | | | | | | | |
| 4.250% 11/14/2028 | | $ | 695,000 | | | $ | 712,477 | |
| | | | | | | | | |
| TOTAL CONSUMER, NON-CYCLICAL | | | | | | | 712,477 | |
| | | | | | | | | |
| ENERGY (2.14%) | | | | | | | | |
| Exploration & Production (0.31%) | | | | | | | | |
| Conoco Funding Co. | | | | | | | | |
| 7.250% 10/15/2031 | | | 551,000 | | | | 748,301 | |
| | | | | | | | | |
| Pipeline (1.83%) | | | | | | | | |
| Boardwalk Pipelines LP | | | | | | | | |
| 5.950% 06/01/2026 | | | 670,000 | | | | 721,950 | |
| Enbridge Energy Partners LP | | | | | | | | |
| 4.200% 09/15/2021 | | | 4,000 | | | | 4,106 | |
| 5.875% 10/15/2025 | | | 643,000 | | | | 729,163 | |
| Enterprise Products Operating LLC | | | | | | | | |
| 3.950% 02/15/2027 | | | 710,000 | | | | 737,063 | |
| MPLX LP | | | | | | | | |
| 4.125% 03/01/2027 | | | 748,000 | | | | 756,954 | |
| ONEOK Partners LP | | | | | | | | |
| 4.900% 03/15/2025 | | | 680,000 | | | | 725,157 | |
| Williams Cos., Inc. | | | | | | | | |
| 3.750% 06/15/2027 | | | 718,000 | | | | 718,668 | |
| | | | | | | | 4,393,061 | |
| | | | | | | | | |
| TOTAL ENERGY | | | | | | | 5,141,362 | |
| | | | | | | | | |
| FINANCIALS (3.95%) | | | | | | | | |
| Banks (1.50%) | | | | | | | | |
| Bank of America Corp., Series L | | | | | | | | |
| 4.183% 11/25/2027 | | | 715,000 | | | | 732,248 | |
| BB&T Corp., Series MTN | | | | | | | | |
| 3.875% 03/19/2029 | | | 695,000 | | | | 709,038 | |
| JPMorgan Chase & Co. | | | | | | | | |
| 4.125% 12/15/2026 | | | 690,000 | | | | 714,355 | |
| Morgan Stanley, Series GMTN | | | | | | | | |
| 3.700% 10/23/2024 | | | 690,000 | | | | 709,000 | |
| Wells Fargo & Co., Series GMTN | | | | | | | | |
| 4.300% 07/22/2027 | | | 710,000 | | | | 737,436 | |
| | | | | | | | 3,602,077 | |
| Annual Report | April 30, 2019 | 11 |
| The Disciplined Growth Investors Fund | Portfolio of Investments |
April 30, 2019
| | | Principal Amount | | | Value (Note 2) | |
| FINANCIALS (continued) | | | | | | | | |
| Consumer Finance (0.30%) | | | | | | | | |
| American Express Co. | | | | | | | | |
| 3.625% 12/05/2024 | | $ | 708,000 | | | $ | 730,476 | |
| | | | | | | | | |
| Diversified Banks (0.62%) | | | | | | | | |
| Citigroup, Inc. | | | | | | | | |
| 4.300% 11/20/2026 | | | 720,000 | | | | 744,082 | |
| US Bancorp, Series MTN | | | | | | | | |
| 3.100% 04/27/2026 | | | 739,000 | | | | 734,829 | |
| | | | | | | | 1,478,911 | |
| | | | | | | | | |
| Financial Services (0.60%) | | | | | | | | |
| National Rural Utilities Cooperative Finance Corp. | | | | | | | | |
| 2.950% 02/07/2024 | | | 707,000 | | | | 712,334 | |
| Northern Trust Corp. | | | | | | | | |
| 3.950% 10/30/2025 | | | 693,000 | | | | 732,019 | |
| | | | | | | | 1,444,353 | |
| | | | | | | | | |
| Life Insurance (0.31%) | | | | | | | | |
| MetLife, Inc. | | | | | | | | |
| 3.600% 11/13/2025 | | | 710,000 | | | | 737,116 | |
| | | | | | | | | |
| Property & Casualty Insurance (0.31%) | | | | | | | | |
| American International Group, Inc. | | | | | | | | |
| 3.750% 07/10/2025 | | | 740,000 | | | | 749,401 | |
| | | | | | | | | |
| Real Estate (0.31%) | | | | | | | | |
| Welltower, Inc. | | | | | | | | |
| 4.250% 04/01/2026 | | | 712,000 | | | | 737,276 | |
| | | | | | | | | |
| TOTAL FINANCIALS | | | | | | | 9,479,610 | |
| | | | | | | | | |
| HEALTH CARE (0.91%) | | | | | | | | |
| Managed Care (0.60%) | | | | | | | | |
| Anthem, Inc. | | | | | | | | |
| 3.650% 12/01/2027 | | | 731,000 | | | | 725,334 | |
| UnitedHealth Group, Inc. | | | | | | | | |
| 3.750% 07/15/2025 | | | 691,000 | | | | 718,982 | |
| | | | | | | | 1,444,316 | |
| 12 | 1-855-DGI-FUND (344-3863) | www.DGIfund.com |
| The Disciplined Growth Investors Fund | Portfolio of Investments |
April 30, 2019
| | | Principal Amount | | | Value (Note 2) | |
| HEALTH CARE (continued) | | | | | | | | |
| Pharmaceuticals (0.31%) | | | | | | | | |
| Johnson & Johnson | | | | | | | | |
| 5.850% 07/15/2038 | | $ | 572,000 | | | $ | 737,974 | |
| | | | | | | | | |
| TOTAL HEALTH CARE | | | | | | | 2,182,290 | |
| | | | | | | | | |
| INDUSTRIALS (3.40%) | | | | | | | | |
| Aerospace & Defense (0.88%) | | | | | | | | |
| Lockheed Martin Corp. | | | | | | | | |
| 3.100% 01/15/2023 | | | 680,000 | | | | 687,456 | |
| Rockwell Collins, Inc. | | | | | | | | |
| 3.500% 03/15/2027 | | | 730,000 | | | | 723,216 | |
| United Technologies Corp. | | | | | | | | |
| 3.950% 08/16/2025 | | | 680,000 | | | | 710,425 | |
| | | | | | | | 2,121,097 | |
| | | | | | | | | |
| Commercial Services & Supplies (0.31%) | | | | | | | | |
| Waste Management, Inc. | | | | | | | | |
| 3.150% 11/15/2027 | | | 745,000 | | | | 741,205 | |
| | | | | | | | | |
| Electrical Equipment Manufacturing (0.29%) | | | | | | | | |
| General Electric Co., Series MTN | | | | | | | | |
| 5.875% 01/14/2038 | | | 653,000 | | | | 706,520 | |
| | | | | | | | | |
| Engineering & Construction (0.31%) | | | | | | | | |
| Fluor Corp. | | | | | | | | |
| 4.250% 09/15/2028 | | | 725,000 | | | | 736,147 | |
| | | | | | | | | |
| Railroad (0.69%) | | | | | | | | |
| Burlington Northern Santa Fe LLC | | | | | | | | |
| 3.000% 03/15/2023 | | | 2,000 | | | | 2,022 | |
| 3.400% 09/01/2024 | | | 875,000 | | | | 901,494 | |
| Union Pacific Corp. | | | | | | | | |
| 3.250% 08/15/2025 | | | 735,000 | | | | 744,903 | |
| | | | | | | | 1,648,419 | |
| | | | | | | | | |
| Transportation (0.31%) | | | | | | | | |
| FedEx Corp. | | | | | | | | |
| 3.300% 03/15/2027 | | | 756,000 | | | | 752,880 | |
| | | | | | | | | |
| Transportation & Logistics (0.30%) | | | | | | | | |
| United Parcel Service, Inc. | | | | | | | | |
| 6.200% 01/15/2038 | | | 558,000 | | | | 726,131 | |
| Annual Report | April 30, 2019 | 13 |
| The Disciplined Growth Investors Fund | Portfolio of Investments |
April 30, 2019
| | | Principal Amount | | | Value (Note 2) | |
| INDUSTRIALS (continued) | | | | | | | | |
| Waste & Environmental Services & Equipment (0.31%) | | | | | | | | |
| Republic Services, Inc. | | | | | | | | |
| 3.375% 11/15/2027 | | $ | 735,000 | | | $ | 737,631 | |
| 5.500% 09/15/2019 | | | 1,000 | | | | 1,010 | |
| | | | | | | | 738,641 | |
| | | | | | | | | |
| TOTAL INDUSTRIALS | | | | | | | 8,171,040 | |
| | | | | | | | | |
| INFORMATION TECHNOLOGY (0.30%) | | | | | | | | |
| Semiconductors (0.30%) | | | | | | | | |
| Analog Devices, Inc. | | | | | | | | |
| 3.900% 12/15/2025 | | | 711,000 | | | | 730,541 | |
| | | | | | | | | |
| TOTAL INFORMATION TECHNOLOGY | | | | | | | 730,541 | |
| | | | | | | | | |
| UTILITIES (5.33%) | | | | | | | | |
| Electric (0.30%) | | | | | | | | |
| American Electric Power Co., Inc. | | | | | | | | |
| 3.200% 11/13/2027 | | | 731,000 | | | | 715,665 | |
| | | | | | | | | |
| Utilities (5.03%) | | | | | | | | |
| Black Hills Corp. | | | | | | | | |
| 3.150% 01/15/2027 | | | 700,000 | | | | 675,449 | |
| CenterPoint Energy, Inc. | | | | | | | | |
| 3.850% 02/01/2024 | | | 700,000 | | | | 718,133 | |
| CMS Energy Corp. | | | | | | | | |
| 3.000% 05/15/2026 | | | 760,000 | | | | 740,138 | |
| Dominion Energy, Inc., Series B | | | | | | | | |
| 2.750% 09/15/2022 | | | 695,000 | | | | 690,935 | |
| DTE Energy Co., Series C | | | | | | | | |
| 3.500% 06/01/2024 | | | 715,000 | | | | 724,978 | |
| Duke Energy Corp. | | | | | | | | |
| 3.950% 10/15/2023 | | | 690,000 | | | | 717,029 | |
| Edison International | | | | | | | | |
| 2.400% 09/15/2022 | | | 745,000 | | | | 708,654 | |
| Interstate Power & Light Co. | | | | | | | | |
| 3.400% 08/15/2025 | | | 723,000 | | | | 725,887 | |
| ITC Holdings Corp. | | | | | | | | |
| 4.050% 07/01/2023 | | | 540,000 | | | | 552,041 | |
| NiSource, Inc. | | | | | | | | |
| 3.850% 02/15/2023 | | | 695,000 | | | | 709,829 | |
| Potomac Electric Power Co. | | | | | | | | |
| 3.600% 03/15/2024 | | | 698,000 | | | | 718,459 | |
| 14 | 1-855-DGI-FUND (344-3863) | www.DGIfund.com |
| The Disciplined Growth Investors Fund | Portfolio of Investments |
April 30, 2019
| | | Principal Amount | | | Value (Note 2) | |
| UTILITIES (continued) | | | | | | | | |
| Utilities (continued) | | | | | | | | |
| PPL Capital Funding, Inc. | | | | | | | | |
| 3.100% 05/15/2026 | | $ | 820,000 | | | $ | 792,805 | |
| PSEG Power LLC | | | | | | | | |
| 4.300% 11/15/2023 | | | 675,000 | | | | 701,633 | |
| Puget Energy, Inc. | | | | | | | | |
| 3.650% 05/15/2025 | | | 725,000 | | | | 724,268 | |
| Sempra Energy | | | | | | | | |
| 2.875% 10/01/2022 | | | 720,000 | | | | 715,455 | |
| Virginia Electric & Power Co., Series A | | | | | | | | |
| 3.800% 04/01/2028 | | | 710,000 | | | | 737,987 | |
| Wisconsin Electric Power Co. | | | | | | | | |
| 3.100% 06/01/2025 | | | 735,000 | | | | 734,775 | |
| | | | | | | | 12,088,455 | |
| | | | | | | | | |
| TOTAL UTILITIES | | | | | | | 12,804,120 | |
| | | | | | | | | |
| TOTAL CORPORATE BONDS | | | | | | | | |
| (Cost $49,117,331) | | | | | | | 49,878,242 | |
| | | | | | | | | |
| FOREIGN CORPORATE BONDS (0.61%) | | | | | | | | |
| ENERGY (0.31%) | | | | | | | | |
| Pipeline (0.31%) | | | | | | | | |
| TransCanada PipeLines, Ltd. | | | | | | | | |
| 7.250% 08/15/2038 | | | 572,000 | | | | 748,875 | |
| | | | | | | | | |
| TOTAL ENERGY | | | | | | | 748,875 | |
| | | | | | | | | |
| INDUSTRIALS (0.30%) | | | | | | | | |
| Electrical Equipment Manufacturing (0.30%) | | | | | | | | |
| Tyco Electronics Group SA | | | | | | | | |
| 3.500% 02/03/2022 | | | 708,000 | | | | 719,209 | |
| | | | | | | | | |
| TOTAL INDUSTRIALS | | | | | | | 719,209 | |
| | | | | | | | | |
| TOTAL FOREIGN CORPORATE BONDS | | | | | | | | |
| (Cost $1,458,884) | | | | | | | 1,468,084 | |
| | | | | | | | | |
| FOREIGN GOVERNMENT BONDS (0.45%) | | | | | | | | |
| Corp Andina de Fomento | | | | | | | | |
| 8.125% 06/04/2019 | | | 375,000 | | | | 376,721 | |
| Annual Report | April 30, 2019 | 15 |
| The Disciplined Growth Investors Fund | Portfolio of Investments |
April 30, 2019
| | | Principal Amount | | | Value (Note 2) | |
| FOREIGN GOVERNMENT BONDS (continued) | | | | | | | | |
| Province of Quebec Canada, Series NN | | | | | | | | |
| 7.125% 02/09/2024 | | $ | 590,000 | | | $ | 706,507 | |
| | | | | | | | 1,083,228 | |
| | | | | | | | | |
| TOTAL FOREIGN GOVERNMENT BONDS | | | | | | | | |
| (Cost $1,071,689) | | | | | | | 1,083,228 | |
| | | | | | | | | |
| GOVERNMENT & AGENCY OBLIGATIONS (7.40%) | | | | | | | | |
| U.S. Treasury Bonds | | | | | | | | |
| 1.500% 08/15/2026 | | | 689,000 | | | | 646,987 | |
| 2.875% 05/15/2028 | | | 2,000,000 | | | | 2,063,008 | |
| 6.500% 11/15/2026 | | | 77,000 | | | | 98,542 | |
| U.S. Treasury Notes | | | | | | | | |
| 0.875% 07/31/2019 | | | 4,100,000 | | | | 4,083,926 | |
| 1.250% 01/31/2020 | | | 6,500,000 | | | | 6,443,379 | |
| 1.500% 04/15/2020 | | | 4,470,000 | | | | 4,432,983 | |
| | | | | | | | | |
| TOTAL GOVERNMENT & AGENCY OBLIGATIONS | | | | | | | | |
| (Cost $17,705,723) | | | | | | | 17,768,825 | |
| | | Yield | | Shares | | | Value (Note 2) | |
| SHORT TERM INVESTMENTS (0.67%) | | | | | | | | | | | |
| MONEY MARKET FUND (0.67%) | | | | | | | | | | | |
| Fidelity Investments Money Market Government Portfolio - Class I | | | 2.303 | %(b) | | 1,616,569 | | | | 1,616,569 | |
| | | | | | | | | | | | |
| TOTAL SHORT TERM INVESTMENTS | | | | | | | | | | | |
| (Cost $1,616,569) | | | | | | | | | | 1,616,569 | |
| | | | | | | | | | | | |
| TOTAL INVESTMENTS (100.02%) | | | | | | | | | | | |
| (Cost $170,524,995) | | | | | | | | | $ | 240,229,802 | |
| | | | | | | | | | | | |
| Liabilities In Excess Of Other Assets (-0.02%) | | | | | | | | | | (58,278 | ) |
| | | | | | | | | | | | |
| NET ASSETS (100.00%) | | | | | | | | | $ | 240,171,524 | |
| (a) | Non-Income Producing Security. |
| (b) | Represents the 7-day yield. |
For Fund compliance purposes, the Fund's industry classifications refer to any one or more of the industry sub-classifications used by one or more widely recognized market indexes or ratings group
| 16 | 1-855-DGI-FUND (344-3863) | www.DGIfund.com |
| The Disciplined Growth Investors Fund | Portfolio of Investments |
April 30, 2019
indexes, and/or as defined by Fund management. This definition may not apply for purposes of this report, which may combine industry sub-classifications for reporting ease. Industries are shown as a percent of net assets.
See Notes to Financial Statements.
| Annual Report | April 30, 2019 | 17 |
| The Disciplined Growth Investors Fund | Statement of Assets and Liabilities |
April 30, 2019
| ASSETS | | |
| Investments, at value | | $ | 240,229,802 | |
| Receivable for shares sold | | | 70,314 | |
| Dividends and interest receivable | | | 631,854 | |
| Total assets | | | 240,931,970 | |
| | | | | |
| LIABILITIES | | | | |
| Payable for investments purchased | | | 350,377 | |
| Payable for shares redeemed | | | 256,800 | |
| Payable to adviser | | | 153,269 | |
| Total liabilities | | | 760,446 | |
| NET ASSETS | | $ | 240,171,524 | |
| | | | | |
| NET ASSETS CONSIST OF | | | | |
| Paid-in capital (Note 5) | | $ | 167,397,042 | |
| Distributable Earnings | | | 72,774,482 | |
| NET ASSETS | | $ | 240,171,524 | |
| | | | | |
| INVESTMENTS, AT COST | | $ | 170,524,995 | |
| | | | | |
| PRICING OF SHARES | | | | |
| Net Asset Value, offering and redemption price per share | | $ | 21.15 | |
| Shares of beneficial interest outstanding | | | 11,353,354 | |
See Notes to Financial Statements.
| 18 | 1-855-DGI-FUND (344-3863) | www.DGIfund.com |
| The Disciplined Growth Investors Fund | Statement of Operations |
| | | For the Year Ended April 30, 2019 |
| INVESTMENT INCOME | | | | |
| Dividends | | $ | 1,397,637 | |
| Foreign taxes withheld | | | (16,143 | ) |
| Interest | | | 2,117,957 | |
| Total investment income | | | 3,499,451 | |
| | | | | |
| EXPENSES | | | | |
| Investment advisory fees (Note 6) | | | 1,732,520 | |
| Total expenses | | | 1,732,520 | |
| NET INVESTMENT INCOME | | | 1,766,931 | |
| | | | | |
| REALIZED AND UNREALIZED GAIN ON INVESTMENTS | | | | |
| Net realized gain on investments | | | 7,977,814 | |
| Net change in unrealized appreciation on investments | | | 21,055,807 | |
| NET REALIZED AND UNREALIZED GAIN ON INVESTMENTS | | | 29,033,621 | |
| NET INCREASE IN NET ASSETS RESULTING FROM OPERATIONS | | $ | 30,800,552 | |
See Notes to Financial Statements.
| Annual Report | April 30, 2019 | 19 |
| The Disciplined Growth Investors Fund | Statements of Changes in Net Assets |
| | | For the Year Ended April 30, 2019 | | For the Year Ended April 30, 2018 |
| OPERATIONS | | | | |
| Net investment income | | $ | 1,766,931 | | | $ | 1,179,799 | |
| Net realized gain | | | 7,977,814 | | | | 5,834,973 | |
| Net change in unrealized appreciation | | | 21,055,807 | | | | 9,802,428 | |
| Net increase in net assets resulting from operations | | | 30,800,552 | | | | 16,817,200 | |
| | | | | | | | | |
| DISTRIBUTIONS (Note 3) | | | | | | | | |
| Total distributions to shareholders(a) | | | (7,508,119 | ) | | | (8,118,741 | ) |
| Net decrease in net assets from distributions | | | (7,508,119 | ) | | | (8,118,741 | ) |
| | | | | | | | | |
| CAPITAL SHARE TRANSACTIONS (Note 5) | | | | | | | | |
| Proceeds from sales of shares | | | 20,768,296 | | | | 50,597,596 | |
| Issued to shareholders in reinvestment of distributions | | | 7,471,582 | | | | 8,084,564 | |
| Cost of shares redeemed, net of redemption fees | | | (15,429,264 | ) | | | (23,086,274 | ) |
| Net increase from capital share transactions | | | 12,810,614 | | | | 35,595,886 | |
| | | | | | | | | |
| Net increase in net assets | | | 36,103,047 | | | | 44,294,345 | |
| | | | | | | | | |
| NET ASSETS | | | | | | | | |
| Beginning of period | | | 204,068,477 | | | | 159,774,132 | |
| End of period | | $ | 240,171,524 | | | $ | 204,068,477 | (b) |
| | | | | | | | | |
| OTHER INFORMATION | | | | | | | | |
| Share Transactions | | | | | | | | |
| Issued | | | 1,042,174 | | | | 2,685,263 | |
| Issued to shareholders in reinvestment of distributions | | | 410,272 | | | | 428,168 | |
| Redeemed | | | (770,890 | ) | | | (1,218,824 | ) |
| Net increase in share transactions | | | 681,556 | | | | 1,894,607 | |
| (a) | For the prior year ended April 30, 2018, Total Distributions consisted of Net Investment Income of $1,134,526, and Net Realized Gains of $6,984,215. |
| (b) | For the prior year ended April 30, 2018, included accumulated net investment income of $76,473. |
See Notes to Financial Statements.
| 20 | 1-855-DGI-FUND (344-3863) | www.DGIfund.com |
Page Intentionally Left Blank
The Disciplined Growth Investors Fund
| NET ASSET VALUE, BEGINNING OF PERIOD |
| |
| INCOME FROM OPERATIONS |
| Net investment income(a) |
| Net realized and unrealized gain/(loss) on investments |
| Total from investment operations |
| |
| DISTRIBUTIONS |
| From net investment income |
| From net realized gain on investments |
| Total distributions |
| |
| REDEMPTION FEES ADDED TO PAID-IN CAPITAL |
| INCREASE/(DECREASE) IN NET ASSET VALUE |
| NET ASSET VALUE, END OF PERIOD |
| |
| TOTAL RETURN |
| |
| RATIOS AND SUPPLEMENTAL DATA |
| Net assets, end of period (000's) |
| |
| RATIOS TO AVERAGE NET ASSETS |
| Expenses |
| Net investment income |
| |
| PORTFOLIO TURNOVER RATE |
| (a) | Per share numbers have been calculated using the average shares method. |
| (b) | In 2018 the Fund's total return consists of a voluntary reimbursement by the advisor for a realized investment loss. Excluding this item, total return would not have been impacted. |
See Notes to Financial Statements.
| 22 | 1-855-DGI-FUND (344-3863) | www.DGIfund.com |
Financial Highlights
For a share outstanding during the periods presented
For the Year Ended April 30, 2019 | | For the Year Ended April 30, 2018 | | For the Year Ended April 30, 2017 | | For the Year Ended April 30, 2016 | | For the Year Ended April 30, 2015 |
| $ | 19.12 | | | $ | 18.20 | | | $ | 15.96 | | | $ | 16.75 | | | $ | 15.02 | |
| | | | | | | | | | | | | | | | | | | |
| | | | | | | | | | | | | | | | | | | |
| | 0.16 | | | | 0.12 | | | | 0.09 | | | | 0.09 | | | | 0.10 | |
| | 2.55 | | | | 1.64 | | | | 2.29 | | | | (0.44 | ) | | | 1.83 | |
| | 2.71 | | | | 1.76 | | | | 2.38 | | | | (0.35 | ) | | | 1.93 | |
| | | | | | | | | | | | | | | | | | | |
| | | | | | | | | | | | | | | | | | | |
| | (0.12 | ) | | | (0.12 | ) | | | (0.09 | ) | | | (0.10 | ) | | | (0.09 | ) |
| | (0.56 | ) | | | (0.72 | ) | | | (0.05 | ) | | | (0.34 | ) | | | (0.11 | ) |
| | (0.68 | ) | | | (0.84 | ) | | | (0.14 | ) | | | (0.44 | ) | | | (0.20 | ) |
| | | | | | | | | | | | | | | | | | | |
| | – | | | | – | | | | – | | | | – | | | | – | |
| | 2.03 | | | | 0.92 | | | | 2.24 | | | | (0.79 | ) | | | 1.73 | |
| $ | 21.15 | | | $ | 19.12 | | | $ | 18.20 | | | $ | 15.96 | | | $ | 16.75 | |
| | | | | | | | | | | | | | | | | | | |
| | 14.74 | % | | | 9.75 | %(b) | | | 14.96 | % | | | (2.05 | %) | | | 12.87 | % |
| | | | | | | | | | | | | | | | | | | |
| | | | | | | | | | | | | | | | | | | |
| $ | 240,172 | | | $ | 204,068 | | | $ | 159,774 | | | $ | 119,857 | | | $ | 113,342 | |
| | | | | | | | | | | | | | | | | | | |
| | | | | | | | | | | | | | | | | | | |
| | 0.78 | % | | | 0.78 | % | | | 0.78 | % | | | 0.78 | % | | | 0.78 | % |
| | 0.80 | % | | | 0.64 | % | | | 0.50 | % | | | 0.59 | % | | | 0.61 | % |
| | | | | | | | | | | | | | | | | | | |
| | 22 | % | | | 18 | % | | | 16 | % | | | 13 | % | | | 14 | % |
| Annual Report | April 30, 2019 | 23 |
| The Disciplined Growth Investors Fund | Notes to Financial Statements |
April 30, 2019
1. ORGANIZATION
Financial Investors Trust (the “Trust”), a Delaware statutory trust, is an open-end management investment company registered under the Investment Company Act of 1940, as amended (“1940 Act”). The Trust consists of multiple separate portfolios or series. This annual report describes The Disciplined Growth Investors Fund (the “Fund”). The Fund seeks long-term capital growth and as a secondary objective, modest income with reasonable risk.
2. SIGNIFICANT ACCOUNTING POLICIES
The accompanying financial statements were prepared in accordance with accounting principles generally accepted in the United States of America (“U.S. GAAP”). The preparation of financial statements in conformity with U.S. GAAP requires management to make certain estimates and assumptions that affect the reported amounts of assets and liabilities and disclosures of contingent assets and liabilities at the date of the financial statements and the reported amounts of revenue and expenses during the period. Actual results could differ from those estimates. The Fund is considered an investment company for financial reporting purposes under U.S. GAAP and follows the accounting and reporting guidance applicable to investment companies in the Financial Accounting Standards Board Accounting Standards Codification Topic 946. The following is a summary of significant accounting policies consistently followed by the Fund in preparation of its financial statements.
Investment Valuation: The Fund generally values its securities based on market prices determined at the close of regular trading on the New York Stock Exchange (“NYSE”), normally 4:00 p.m. Eastern Time, on each day the NYSE is open for trading.
For equity securities and mutual funds that are traded on an exchange, the market price is usually the closing sale or official closing price on that exchange. In the case of equity securities not traded on an exchange, or if such closing prices are not otherwise available, the securities are valued at the mean of the most recent bid and ask prices on such day. Redeemable securities issued by open-end registered investment companies are valued at the investment company’s applicable net asset value, with the exception of exchange-traded open-end investment companies, which are priced as equity securities.
The market price for debt obligations is generally the price supplied by an independent third-party pricing service approved by the Board of Trustees (the “Board”), which may use a matrix, formula or other objective method that takes into consideration quotations from dealers, market transactions in comparable investments, market indices and yield curves. If vendors are unable to supply a price, or if the price supplied is deemed to be unreliable, the market price may be determined using quotations received from one or more broker–dealers that make a market in the security. Fixed-income obligations, excluding municipal securities, having a remaining maturity of greater than 60 days, are typically valued at the mean between the evaluated bid and ask prices formulated by an independent pricing service. Corporate Bonds, U.S. Government & Agency, and U.S. Treasury Bonds & Notes are valued using market models that consider trade data, quotations from dealers and active market makers, relevant yield curve and spread data, creditworthiness, trade data or market information on comparable securities, and other relevant security specific information. Publicly traded Foreign Government Debt securities and Foreign Corporate Bonds are typically
| 24 | 1-855-DGI-FUND (344-3863) | www.DGIfund.com |
| The Disciplined Growth Investors Fund | Notes to Financial Statements |
April 30, 2019
traded internationally in the over-the-counter market and are valued at the mean between the bid and asked prices as of the close of business of that market. Mortgage-related and asset-backed securities are valued based on models that consider trade data, prepayment and default projections, benchmark yield and spread data and estimated cash flows of each tranche of the issuer. Publicly traded foreign government debt securities are typically traded internationally in the over-the-counter market and are valued at the mean between the bid and asked prices as of the close of business of that market.
When such prices or quotations are not available, or when Disciplined Growth Investors, Inc. (the “Adviser”) believes that they are unreliable, securities may be priced using fair value procedures approved by the Board.
Fair Value Measurements: The Fund discloses the classification of its fair value measurements following a three-tier hierarchy based on the inputs used to measure fair value. Inputs refer broadly to the assumptions that market participants would use in pricing the asset or liability, including assumptions about risk. Inputs may be observable or unobservable. Observable inputs reflect the assumptions market participants would use in pricing the asset or liability that are developed based on market data obtained from sources independent of the reporting entity. Unobservable inputs reflect the reporting entity’s own assumptions about the assumptions market participants would use in pricing the asset or liability that are developed based on the best information available.
Various inputs are used in determining the value of the Fund’s investments as of the end of the reporting period. When inputs used fall into different levels of the fair value hierarchy, the level in the hierarchy within which the fair value measurement falls is determined based on the lowest level input that is significant to the fair value measurement in its entirety. The designated input levels are not necessarily an indication of the risk or liquidity associated with these investments. These inputs are categorized in the following hierarchy under applicable financial accounting standards:
| Level 1 – | Unadjusted quoted prices in active markets for identical investments, unrestricted assets or liabilities that the Fund has the ability to access at the measurement date; |
| Level 2 – | Quoted prices which are not active, quoted prices for similar assets or liabilities in active markets or inputs other than quoted prices that are observable (either directly or indirectly) for substantially the full term of the asset or liability; and |
| Level 3 – | Significant unobservable prices or inputs (including the Fund’s own assumptions in determining the fair value of investments) where there is little or no market activity for the asset or liability at the measurement date. |
| Annual Report | April 30, 2019 | 25 |
The Disciplined Growth Investors Fund | Notes to Financial Statements |
April 30, 2019
The following is a summary of each input used to value the Fund as of April 30, 2019:
| Investments in Securities at Value | | Level 1 -
Unadjusted
Quoted Prices | | | Level 2 - Other
Significant
Observable Inputs | | | Level 3 -
Significant Unobservable Inputs | | | Total | |
| Common Stocks(a) | | $ | 168,414,854 | | | $ | – | | | $ | – | | | $ | 168,414,854 | |
| Corporate Bonds(a) | | | – | | | | 49,878,242 | | | | – | | | | 49,878,242 | |
| Foreign Corporate Bonds(a) | | | – | | | | 1,468,084 | | | | – | | | | 1,468,084 | |
| Foreign Government Bonds | | | – | | | | 1,083,228 | | | | – | | | | 1,083,228 | |
| Government & Agency Obligations | | | – | | | | 17,768,825 | | | | – | | | | 17,768,825 | |
| Short Term Investments | | | 1,616,569 | | | | – | | | | – | | | | 1,616,569 | |
| TOTAL | | $ | 170,031,423 | | | $ | 70,198,379 | | | $ | – | | | $ | 240,229,802 | |
| (a) | For detailed descriptions of the underlying industries, see the accompanying Portfolio of Investments. |
The following is a reconciliation of the investments in which significant unobservable inputs (Level 3) were used in determining fair value:
Investments
in Securities
at Value | | Balance
as of
04/30/2018 | | Return of
Capital | | Realized
Gain/(Loss) | | Change in
Unrealized
Appreciation/
(Depreciation) | | Purchases | | Sales
Proceeds | | Transfer
in and/or
(out) of
Level 3 | | Balance
as of
04/30/2019 | | Net change
in unrealized
appreciation/
(depreciation)
attributable to
Level 3
investments
held at
04/30/2019 |
| Common Stocks | | $ | 41,846 | | | $ | – | | | $ | – | | | $ | 224,254 | | | $ | – | | | $ | (266,100 | ) | | $ | – | | | $ | – | | | $ | – | |
| Total | | $ | 41,846 | | | $ | – | | | $ | – | | | $ | 224,254 | | | $ | – | | | $ | (266,100 | ) | | $ | – | | | $ | – | | | $ | – | |
Net change in unrealized appreciation/depreciation on Level 3 securities is included on the Statement of Operations under Net change in unrealized appreciation on investments.
Investment Transactions and Investment Income: Investment transactions are accounted for on the date the investments are purchased or sold (trade date). Realized gains and losses from investment transactions are reported on an identified cost basis, which is the same basis the Fund uses for federal income tax purposes. Interest income, which includes accretion of discounts, is accrued and recorded as earned. Dividend income is recognized on the ex-dividend date or for certain foreign securities, as soon as information is available to the Fund.
Trust Expenses: Some expenses of the Trust can be directly attributed to the Fund. Expenses which cannot be directly attributed to the Fund are apportioned among all funds in the Trust based on average net assets of each fund.
Fund Expenses: Expenses that are specific to the Fund are charged directly to the Fund.
| 26 | 1-855-DGI-FUND (344-3863) | www.DGIfund.com |
| The Disciplined Growth Investors Fund | Notes to Financial Statements |
April 30, 2019
Federal Income Taxes: The Fund complies with the requirements under Subchapter M of the Internal Revenue Code of 1986, as amended, applicable to regulated investment companies and intends to distribute substantially all of their net taxable income and net capital gains, if any, each year so that it will not be subject to excise tax on undistributed income and gains. The Fund is not subject to income taxes to the extent such distributions are made.
As of and during the year ended April 30, 2019, the Fund did not have a liability for any unrecognized tax benefits. The Fund files U.S. federal, state, and local tax returns as required. The Fund’s tax returns are subject to examination by the relevant tax authorities until expiration of the applicable statute of limitations, which is generally three years after the filing of the tax return for federal purposes and four years for most state returns. Tax returns for open years have incorporated no uncertain tax positions that require a provision for income taxes.
Distributions to Shareholders: The Fund normally pays dividends, if any, quarterly and distributes capital gains, if any, on an annual basis. Income dividend distributions are derived from dividends and other income the Fund receives from its investments, including short term capital gains. Long term capital gain distributions are derived from gains realized when the Fund sells a security it has owned for more than a year. The Fund may make additional distributions and dividends at other times if the portfolio manager believes doing so may be necessary for the Fund to avoid or reduce taxes.
3. TAX BASIS INFORMATION
Reclassifications:As of April 30, 2019, permanent differences in book and tax accounting were reclassified. These differences had no effect on net assets.
The reclassifications as of April 30, 2019 were as follows:
| Fund | | | Paid-in Capital | | | | Distributable earnings | |
| The Disciplined Growth Investors Fund | | $ | – | | | $ | – | |
Tax Basis of Investments: As of April 30, 2019, the aggregate cost of investments, gross unrealized appreciation/ (depreciation) and net unrealized appreciation for Federal tax purposes was as follows:
| | | The Disciplined
Growth Investors
Fund |
| Gross appreciation (excess of value over tax cost) | | $ | 76,062,855 | |
| Gross depreciation (excess of tax cost over value) | | | (6,358,048 | ) |
| Net unrealized appreciation | | $ | 69,704,807 | |
| Cost of investments for income tax purposes | | $ | 170,524,995 | |
| Annual Report | April 30, 2019 | 27 |
| The Disciplined Growth Investors Fund | Notes to Financial Statements |
April 30, 2019
Components of Earnings:As of April 30, 2019, components of distributable earnings were as follows:
| Undistributed ordinary income | | $ | 53,895 | |
| Accumulated capital gains | | | 3,021,472 | |
| Net unrealized appreciation on investments | | | 69,704,807 | |
| Other cumulative effect of timing differences | | | (5,692 | ) |
| Total | | $ | 72,774,482 | |
Tax Basis of Distributions to Shareholders: The character of distributions made during the year from net investment income or net realized gains may differ from its ultimate characterization for federal income tax purposes. Also, due to the timing of dividend distributions, the fiscal year in which amounts are distributed may differ from the fiscal year in which the income or realized gain was recorded by the Fund.
The tax character of distributions paid during the year ended April 30, 2019, were as follows:
| | | Ordinary Income | | Long-Term Capital Gain |
| The Disciplined Growth Investors Fund | | $ | 1,871,972 | | | $ | 5,636,147 | |
The tax character of distributions paid during the year ended April 30, 2018, were as follows:
| | | Ordinary Income | | Long-Term Capital Gain |
| The Disciplined Growth Investors Fund | | $ | 1,182,759 | | | $ | 6,935,982 | |
4. SECURITIES TRANSACTIONS
During the year ended April 30, 2019, equity holdings were transferred in-kind into the Fund. The intent of the transfers was to save on equity transaction costs both for the new shareholders at the institution they transferred from and for the Fund on the addition of assets. The assets of two separate accounts were transferred-in-kind into the Fund in the amount of $1,191,807.
The cost of purchases and proceeds from sales of securities (excluding short-term securities, transfers-in-kind, and U.S. Government Obligations) during the year ended April 30, 2019, were as follows:
| Fund | | Purchases of
Securities | | Proceeds From Sales of Securities |
| The Disciplined Growth Investors Fund | | $ | 43,140,201 | | | $ | 38,917,154 | |
| 28 | 1-855-DGI-FUND (344-3863) | www.DGIfund.com |
| The Disciplined Growth Investors Fund | Notes to Financial Statements |
April 30, 2019
Investment transactions in U.S. Government Obligations (excluding transfers-in-kind) during the year ended April 30, 2019 were as follows:
| Fund | | Purchases of Securities | | | Proceeds From Sales of Securities |
| The Disciplined Growth Investors Fund | | $ | 18,057,775 | | | $ | 7,894,211 | |
5. SHARES OF BENEFICIAL INTEREST
The capitalization of the Trust consists of an unlimited number of shares of beneficial interest with no par value per share. Holders of the shares of the Fund of the Trust have one vote for each share held and a proportionate fraction of a vote for each fractional share. All shares issued and outstanding are fully paid and are transferable and redeemable at the option of the shareholder. Purchasers of the shares do not have any obligation to make payments to the Trust or its creditors (other than the purchase price for the shares or make contributions to the Trust or its creditors solely by reason of the purchasers’ ownership of the shares. Shares have no pre-emptive rights.
Prior to September 1, 2015, shares redeemed within 90 days of purchase may have incurred a 2% short-term redemption fee deducted from the redemption amount. Effective September 1, 2015, the Fund no longer imposes redemption fees. For the year ended April 30, 2019 and April 30, 2018, the Fund did not receive any redemption fees.
6. MANAGEMENT AND RELATED-PARTY TRANSACTIONS
The Adviser, subject to the authority of the Board, is responsible for the overall management and administration of the Fund’s business affairs. The Adviser manages the investments of the Fund in accordance with the Fund’s investment objective, policies and limitations and investment guidelines established jointly by the Adviser and the Trustees. Pursuant to the Advisory Agreement, the Fund pays the Adviser a unitary management fee for the services and facilities it provides payable on a monthly basis at the annual rate of 0.78% of the Fund’s average daily net assets. The management fee is paid on a monthly basis.
Out of the unitary management fee, the Adviser pays substantially all expenses of the Fund, including the cost of transfer agency, custody, fund administration, bookkeeping and pricing services, legal, audit and other services, except for interest expenses, brokerage expenses, taxes and extraordinary expenses not incurred in the ordinary course of the Fund’s business. Also included are Trustee fees which were $6,484 for the year ended April 30, 2019.
Fund Administrator Fees and Expenses
ALPS Fund Services, Inc. (“ALPS”) serves as administrator to the Fund. Pursuant to an Administration Agreement, ALPS provides operational services to the Fund including, but not limited to, fund accounting and fund administration and generally assists in the Fund’s operations. Officers of the Trust are employees of ALPS. The Fund’s administration fee is accrued on a daily basis and paid monthly. The Administrator is also reimbursed for certain out-of-pocket expenses. The administrative fee and out-of-pocket expenses are included in the unitary management fee paid to the Adviser.
| Annual Report | April 30, 2019 | 29 |
| The Disciplined Growth Investors Fund | Notes to Financial Statements |
April 30, 2019
Transfer Agent
ALPS serves as transfer, dividend paying and shareholder servicing agent for the Fund. ALPS receives an annual minimum fee, a fee based upon the number of shareholder accounts, and is also reimbursed for certain out-of-pocket expenses. The fee and out-of-pocket expenses are included in the unitary management fee paid to the Adviser.
Compliance Services
ALPS provides services that assist the Trust’s chief compliance officer in monitoring and testing the policies and procedures of the Trust in conjunction with requirements under Rule 38a-1 under the 1940 Act and receives an annual base fee. ALPS is reimbursed for certain out-of-pocket expenses. The fee and out-of-pocket expenses are included in the unitary management fee paid to the Adviser.
Principal Financial Officer
ALPS receives an annual fee for providing principal financial officer services to the Fund. The fee is included in the unitary management fee paid to the Adviser.
Distributor
ALPS Distributors, Inc. (“ADI” or the “Distributor”) (an affiliate of ALPS) acts as the distributor of the Fund’s shares pursuant to a Distribution Agreement with the Trust. Shares are sold on a continuous basis by ADI as agent for the Fund, and ADI has agreed to use its best efforts to solicit orders for the sale of the Fund’s shares, although it is not obliged to sell any particular amount of shares. ADI is not entitled to any compensation for its services as Distributor. ADI is registered as a broker-dealer with the Securities and Exchange Commission.
7. INDEMNIFICATIONS
Under the Trust’s organizational documents, its officers and Trustees are indemnified against certain liability arising out of the performance of their duties to the Trust. Additionally, in the normal course of business, the Trust enters into contracts with service providers that may contain general indemnification clauses, which may permit indemnification to the extent permissible under applicable law. The Trust’s maximum exposure under these arrangements is unknown, as this would involve future claims that may be made against the Trust that have not yet occurred.
8. RECENT ACCOUNTING PRONOUNCEMENTS
On October 4, 2018, the SEC amended Regulation S-X to require certain financial statement disclosure requirements to conform them to U.S. GAAP for investment companies. Effective November 4, 2018, the Fund adopted disclosure requirement changes for Regulation S-X and these changes are reflected throughout this report. The Fund’s adoption of those amendments, effective with the financial statements prepared as of April 30, 2019, had no effect on the Fund’s net assets or results of operations.
In August 2018, the Financial Accounting Standards Board (“FASB”) issued Accounting Standards Update (“ASU”) 2018-13, which changes the fair value measurement disclosure requirements of FASB Accounting Standards Codification Topic 820, Fair Value Measurement. The update to Topic 820 includes new, eliminated, and modified disclosure requirements. ASU 2018-13 is effective for fiscal years beginning after December 15, 2019, including interim periods. Early adoption is
| 30 | 1-855-DGI-FUND (344-3863) | www.DGIfund.com |
| The Disciplined Growth Investors Fund | Notes to Financial Statements |
April 30, 2019
permitted for any eliminated or modified disclosures. The Fund early adopted effective with the financial statements prepared as of April 30, 2019, and they had no effect on the Fund’s net assets or results of operations.
9. SUBSEQUENT EVENTS
Subsequent events after the date of the Statement of Assets and Liabilities have been evaluated through the date the financial statements were issued.
| Annual Report | April 30, 2019 | 31 |
| The Disciplined Growth Investors Fund | Report of Independent Registered
Public Accounting Firm |
To the shareholders and the Board of Trustees of Financial Investors Trust:
Opinion on the Financial Statements and Financial Highlights
We have audited the accompanying statement of assets and liabilities, including the portfolio of investments, of The Disciplined Growth Investors Fund (the “Fund’), one of the funds constituting the Financial Investors Trust, as of April 30, 2019, the related statement of operations for the year then ended, the statements of changes in net assets for each of the two years in the period then ended, the financial highlights for each of the five years in the period then ended, and the related notes. In our opinion, the financial statements and financial highlights present fairly, in all material respects, the financial position of The Disciplined Growth Investors Fund of Financial Investors Trust as of April 30, 2019, and the results of its operations for the year then ended, the changes in its net assets for each of the two years in the period then ended, and the financial highlights for each of the five years in the period then ended, in conformity with accounting principles generally accepted in the United States of America.
Basis for Opinion
These financial statements and financial highlights are the responsibility of the Fund’s management. Our responsibility is to express an opinion on the Fund’s financial statements and financial highlights based on our audits. We are a public accounting firm registered with the Public Company Accounting Oversight Board (United States) (PCAOB) and are required to be independent with respect to the Fund in accordance with the U.S. federal securities laws and the applicable rules and regulations of the Securities and Exchange Commission and the PCAOB.
We conducted our audits in accordance with the standards of the PCAOB. Those standards require that we plan and perform the audit to obtain reasonable assurance about whether the financial statements and financial highlights are free of material misstatement, whether due to error or fraud. The Fund is not required to have, nor were we engaged to perform, an audit of its internal control over financial reporting. As part of our audits we are required to obtain an understanding of internal control over financial reporting but not for the purpose of expressing an opinion on the effectiveness of the Fund’s internal control over financial reporting. Accordingly, we express no such opinion.
Our audits included performing procedures to assess the risks of material misstatement of the financial statements and financial highlights, whether due to error or fraud, and performing procedures that respond to those risks. Such procedures included examining, on a test basis, evidence regarding the amounts and disclosures in the financial statements and financial highlights. Our audits also included evaluating the accounting principles used and significant estimates made by management, as well as evaluating the overall presentation of the financial statements and financial highlights. Our procedures included confirmation of securities owned as of April 30, 2019, by correspondence with the custodian and brokers; when replies were not received from brokers, we performed other auditing procedures. We believe that our audits provide a reasonable basis for our opinion.
DELOITTE & TOUCHE LLP
Denver, Colorado
June 25, 2019
We have served as the auditor of one or more investment companies advised by Disciplined Growth Investors, Inc. since 2012.
| 32 | 1-855-DGI-FUND (344-3863) | www.DGIfund.com |
| The Disciplined Growth Investors Fund | Additional Information |
April 30, 2019 (Unaudited)
1. FUND HOLDINGS
The Fund files its complete schedule of portfolio holdings with the Securities and Exchange Commission (the “SEC”) for the first and third quarters of each fiscal year within 60 days after the end of the period. Copies of the Fund’s previously filed Form N-Qs are available without charge on the SEC website at http://www.sec.gov.
2. FUND PROXY VOTING POLICIES, PROCEDURES AND SUMMARIES
The Fund’s policies and procedures used in determining how to vote proxies and information regarding how the Fund voted proxies relating to portfolio securities during the most recent prior 12-month period ending June 30 are available without charge, (1) upon request, by calling (toll-free) 855-DGI-Fund and (2) on the SEC’s website at http://www.sec.gov.
3. TAX DESIGNATIONS
The Fund designates the following for federal income tax purposes for distributions made during the calendar year ended December 31, 2018:
| Dividend Received Deduction | 51.55% |
| Qualified Dividend Income | 72.38% |
Pursuant to Section 852(b)(3) of the Internal Revenue Code, the Disciplined Growth Investors Fund designated $5,636,147 as long-term capital gain dividends.
In early 2019, if applicable, shareholders of record received this information for the distributions paid to them by the Fund during the calendar year 2018 via Form 1099. The Fund will notify shareholders in early 2020 of amounts paid to them by the Fund, if any, during the calendar year 2019.
| Annual Report | April 30, 2019 | 33 |
| The Disciplined Growth Investors Fund | Disclosure Regarding Approval of
Fund Advisory Agreements |
April 30, 2019 (Unaudited)
On December 11, 2018, the Trustees met in person to discuss, among other things, the approval of the Investment Advisory Agreement between Disciplined Growth Investors, Inc. (“DGI”) and the Trust, with respect to The Disciplined Growth Investors Fund (the “DGI Fund”), in accordance with Section 15(c) of the 1940 Act. In renewing and approving the Investment Advisory Agreement with DGI, the Trustees, including the Independent Trustees, considered the following factors with respect to the DGI Fund:
Nature, Extent, and Quality of the Services under the Investment Advisory Agreement: The Trustees received and considered information regarding the nature, extent, and quality of services to be provided to the DGI Fund under the Investment Advisory Agreement. The Trustees reviewed certain background materials supplied by DGI in its presentation, including its Form ADV.
The Trustees reviewed and considered DGI’s investment advisory personnel, its history as an asset manager, and its performance and the amount of assets currently under management by DGI. The Trustees also reviewed the research and decision-making processes utilized by DGI, including the methods adopted to seek to achieve compliance with the investment objectives, policies, and restrictions of the DGI Fund.
The Trustees considered the background and experience of DGI’s management in connection with the DGI Fund, including reviewing the qualifications, backgrounds, and responsibilities of the management team primarily responsible for the day-to-day portfolio management of the DGI Fund and the extent of the resources devoted to research and analysis of actual and potential investments.
The Trustees also reviewed, among other things, DGI’s insider trading policies and procedures and its Code of Ethics.
Performance:The Trustees reviewed performance information for the DGI Fund for the 3-month, 1-year, 3-year, 5-year, and since inception periods ended September 30, 2018. That review included a comparison of the Highland Fund’s performance to the performance of a group of comparable funds selected by an independent provider of investment company data (the “Data Provider”). The Trustees noted that the performance of the DGI Fund was above its Data Provider universe median performance for the 3-month, 1-year, 3-year, 5-year, and since inception periods ended September 30, 2018. The Trustees also considered DGI’s discussion of the DGI Fund’s underlying portfolio diversification categories, its top contributors and top detractors, as well as DGI’s performance and reputation generally and its investment techniques, risk management controls, and decision-making processes.
Investment Advisory Fee Rate: The Trustees reviewed and considered the contractual annual advisory fee paid by the Trust, on behalf of the DGI Fund, to DGI of 0.78% of the DGI Fund’s daily average net assets, in light of the extent and quality of the advisory services provided by DGI to the DGI Fund.
The Board received and considered information including a comparison of the DGI Fund’s contractual and actual advisory fees and overall expenses with those of funds in the peer group and universe of funds selected by the Data Provider. The Trustees noted that the contractual
| 34 | 1-855-DGI-FUND (344-3863) | www.DGIfund.com |
| The Disciplined Growth Investors Fund | Disclosure Regarding Approval of
Fund Advisory Agreements |
April 30, 2019 (Unaudited)
advisory fee rate for the DGI Fund was below the Data Provider peer group median contractual advisory fee rate.
Total Expense Ratios: The Trustees further reviewed and considered the total expense ratio (after waivers) of 0.78% for the DGI Fund. The Trustees noted that the DGI Fund’s total expense ratio (after waivers) was below the Data Provider peer group median total expense ratio (after waivers).
Comparable Accounts: The Trustees noted certain information provided by DGI regarding fees charged to its other clients utilizing a strategy similar to that employed by the DGI Fund.
Profitability:The Trustees received and considered a retrospective and projected profitability analysis prepared by DGI based on the fees payable under the Investment Advisory Agreement with respect to the DGI Fund. The Trustees considered the profits, if any, anticipated to be realized by DGI in connection with the operation of the DGI Fund. The Board then reviewed DGI’s audited financial statements for the years ended December 31, 2017 and 2016, in order to analyze the financial condition and stability and profitability of DGI.
Economies of Scale: The Trustees considered whether economies of scale in the provision of services to the DGI Fund will be passed along to the shareholders under the Investment Advisory Agreement.
Other Benefits to the Adviser: The Trustees reviewed and considered any other incidental benefits derived or to be derived by DGI from its relationship with the DGI Fund, including whether soft dollar arrangements were used.
In renewing DGI as the DGI Fund’s investment adviser and renewing the Investment Advisory Agreement and the fees charged under the Investment Advisory Agreement, the Trustees concluded that no single factor reviewed by the Trustees was identified by the Trustees to be determinative as the principal factor in whether to renew the Investment Advisory Agreement. Further, the Independent Trustees were advised by separate independent legal counsel throughout the process. The Trustees, including all of the Independent Trustees, concluded that:
| ● | the nature, extent and quality of services rendered by DGI under the Investment Advisory Agreement with respect to the DGI Fund were adequate; |
| ● | the performance of the DGI Fund was above its Data Provider universe median performance for the 3-month, 1-year, 3-year, 5-year, and since inception periods ended September 30, 2018; |
| ● | the contractual advisory fee rate for the DGI Fund was below the Data Provider peer group median contractual advisory fee rate; |
| ● | the DGI Fund’s total expense ratio (after waivers) was below the Data Provider peer group median total expense ratio (after waivers); |
| ● | bearing in mind the limitations of comparing different types of managed accounts and the different levels of service typically associated with such accounts, the fee structures applicable to DGI’s other clients employing a comparable strategy to the DGI Fund was not indicative of any unreasonableness with respect to the advisory fees proposed to be payable by the Fund; |
| Annual Report | April 30, 2019 | 35 |
| The Disciplined Growth Investors Fund | Disclosure Regarding Approval of
Fund Advisory Agreements |
April 30, 2019 (Unaudited)
| ● | the profit, if any, realized by DGI in connection with the operation of the DGI Fund is not unreasonable to such Fund; and |
| ● | there were no material economies of scale or other incidental benefits accruing to DGI in connection with its relationship with the DGI Fund. |
Based on the Trustees’ deliberations and their evaluation of the information described above, the Trustees, including all of the Independent Trustees, concluded that DGI’s compensation for investment advisory services is consistent with the best interests of the DGI Fund and its shareholders.
| 36 | 1-855-DGI-FUND (344-3863) | www.DGIfund.com |
| The Disciplined Growth Investors Fund | Trustees and Officers |
April 30, 2019 (Unaudited)
Additional information regarding the Fund’s trustees is included in the Statement of Additional Information, which can be obtained without charge by calling 855-344-3863.
INDEPENDENT TRUSTEES
Name, Address* & Year of Birth | Position(s) Held with Fund | Term of Office** and Length of Time Served | Principal Occupation(s) During Past 5 Years*** | Number of Funds in Fund Complex Overseen by Trustee**** | Other Directorships Held by Trustee During Past 5 Years*** |
Mary K. Anstine, 1940 | Trustee and Chairman | Ms. Anstine was elected at a special meeting of shareholders held on March 21, 1997 and re-elected at a special meeting of shareholders held on August 7, 2009. Ms. Anstine was appointed Chairman of the Board at the June 6, 2017 meeting of the Board of Trustees. | Ms. Anstine was formerly an Executive Vice President of First Interstate Bank of Denver until 1994, President/Chief Executive Officer of HealthONE Alliance, Denver, Colorado, from 1994 to 2004, and has been retired since 2004. Ms. Anstine is also Trustee/Director of AV Hunter Trust and Colorado Uplift Board. Ms. Anstine was formerly a Director of the Trust Bank of Colorado (later purchased and now known as Northern Trust Bank), HealthONE and Denver Area Council of the Boy Scouts of America, and a member of the American Bankers Association Trust Executive Committee. | 31 | Ms. Anstine is a Trustee of ALPS ETF Trust (20 funds); ALPS Variable Investment Trust (9 funds); Reaves Utility Income Fund (1 fund); and Segall Bryant & Hamill Trust (14 funds). |
Jeremy W. Deems, 1976 | Trustee | Mr. Deems was appointed as a Trustee at the March 11, 2008 meeting of the Board of Trustees and elected at a special meeting of shareholders held on August 7, 2009. | Mr. Deems is the Co-Founder, Chief Operations Officer and Chief Financial Officer of Green Alpha Advisors, LLC, a registered investment advisor, and Co-Portfolio Manager of the Shelton Green Alpha Fund. Prior to joining Green Alpha Advisors, Mr. Deems was CFO and Treasurer of Forward Management, LLC, ReFlow Management Co., LLC, ReFlow Fund, LLC, a private investment fund, and Sutton Place Management, LLC, an administrative services company, from 1998 to June 2007. From 2004 to 2005, Mr Deems also served as Treasurer of the Forward Funds and the Sierra Club Funds. | 31 | Mr. Deems is a Trustee of ALPS ETF Trust (20 funds); ALPS Variable Investment Trust (9 funds); Clough Funds Trust (1 fund); and Reaves Utility Income Fund (1 fund). |
| Annual Report | April 30, 2019 | 37 |
| The Disciplined Growth Investors Fund | Trustees and Officers |
April 30, 2019 (Unaudited)
INDEPENDENT TRUSTEES (continued)
Name, Address* & Year of Birth | Position(s) Held with Fund | Term of Office** and Length of Time Served | Principal Occupation(s) During Past 5 Years*** | Number of Funds in Fund Complex Overseen by Trustee**** | Other Directorships Held by Trustee During Past 5 Years*** |
Jerry G. Rutledge, 1944 | Trustee | Mr. Rutledge was elected at a special meeting of shareholders held on August 7, 2009. | Mr. Rutledge is the President and owner of Rutledge’s Inc., a retail clothing business. Mr. Rutledge is currently Director of the American National Bank. He was from 1994 to 2007 a Regent of the University of Colorado. | 31 | Mr. Rutledge is a Trustee of Principal Real Estate Income Fund (1 fund); Clough Global Dividend and Income Fund (1 fund); Clough Global Equity Fund (1 fund); and Clough Global Opportunities Fund (1 fund). |
Michael “Ross” Shell, 1970 | Trustee | Mr. Shell was elected at a special meeting of shareholders held on August 7, 2009. | Mr. Shell is Founder and CEO of Red Idea, LLC, a strategic consulting/early stage venture firm (since June 2008). From 1999 to 2009, he was a part-owner and Director of Tesser, Inc., a brand agency. From December 2005 to May 2008, he was Director, Marketing and Investor Relations, of Woodbourne, a REIT/real estate hedge fund and private equity firm. Prior to this, from May 2004 to November 2005, he worked as a business strategy consultant; from June 2003 to April 2004, he was on the Global Client Services team of IDEO, a product design/innovation firm; and from 1999 to 2003, he was President of Tesser, Inc. Mr. Shell graduated with honors from Stanford University with a degree in Political Science. | 31 | None. |
| 38 | 1-855-DGI-FUND (344-3863) | www.DGIfund.com |
| The Disciplined Growth Investors Fund | Trustees and Officers |
April 30, 2019 (Unaudited)
INTERESTED TRUSTEE
Name, Address* & Year of Birth | Position(s) Held with Fund | Term of Office** and Length of Time Served | Principal Occupation(s) During Past 5 Years*** | Number of Funds in Fund Complex Overseen by Trustee**** | Other Directorships Held by Trustee During Past 5 Years*** |
Edmund J. Burke, 1961 | Trustee and President^ | Mr. Burke was elected as Trustee at a special meeting of shareholders held on August 7, 2009. Mr. Burke was elected President of the Trust at the December 17, 2002 meeting of the Board of Trustees. | Mr. Burke is President and a Director of ALPS Holdings, Inc. (“AHI”) (since 2005) and ALPS Advisors, Inc. (“AAI”) and Director of Boston Financial Data Services, Inc. (“BFDS”), ALPS Distributors, Inc. (“ADI”), ALPS Fund Services, Inc. (“AFS”) and ALPS Portfolio Solutions Distributor, Inc. (“APSD”). Because of his positions with AHI, BFDS, AAI, ADI, AFS and APSD, Mr. Burke is deemed an affiliate of the Trust as defined under the 1940 Act. | 31 | Mr. Burke is a Trustee of ALPS ETF Trust (20 funds); Clough Global Dividend and Income Fund (1 fund); Clough Global Equity Fund (1 fund); Clough Global Opportunities Fund (1 fund); Clough Funds Trust (1 fund); Liberty All-Star Equity Fund (1 fund); and Director of the Liberty All-Star Growth Fund, Inc. (1 fund). |
| ^ | Effective June 12, 2019, Mr. Burke’s term as President of the Trust ended and Bradley J. Swenson was appointed President of the Trust. |
| Annual Report | April 30, 2019 | 39 |
| The Disciplined Growth Investors Fund | Trustees and Officers |
April 30, 2019 (Unaudited)
OFFICERS
Name, Address* & Year of Birth | Position(s) Held with Fund | Term of Office** and Length of Time Served | Principal Occupation(s) During Past 5 Years*** |
Kimberly R. Storms, 1972 | Treasurer | Ms. Storms was elected Treasurer of the Trust at the March 12, 2013 meeting of the Board of Trustees. | Ms. Storms is Senior Vice President - Director of Fund Administration of ALPS. Because of her position with ALPS, Ms. Storms is deemed an affiliate of the Trust as defined under the 1940 Act. Ms. Storms is also Treasurer of Liberty All-Star Equity Fund, Liberty All-Star Growth Fund, Inc., and ALPS Series Trust. Ms. Storms also serves as a Board member and Treasurer of The Center for Trauma & Resilience, a nonprofit agency. |
Karen S. Gilomen, 1970 | Secretary | Ms. Gilomen was elected Secretary of the Trust at the December 13, 2016 meeting of the Board of Trustees. | Ms. Gilomen joined ALPS in August 2016 as Vice President and Senior Counsel. Prior to joining ALPS, Ms. Gilomen was Vice President - General Counsel & CCO of Monticello Associates, Inc. from 2010 to 2016. Because of her position with ALPS, Ms. Gilomen is deemed an affiliate of the Trust, as defined under the 1940 Act. Ms. Gilomen is also the Secretary of Reaves Utility Income Fund and the Assistant Secretary of the WesMark Funds. |
Ted Uhl, 1974 | Chief Compliance Officer (“CCO”) | Mr. Uhl was appointed CCO of the Trust at the June 8, 2010 meeting of the Board of Trustees. | Mr. Uhl joined ALPS in October 2006, and is currently Deputy Compliance Officer of ALPS. Prior to his current role, Mr. Uhl served as Senior Risk Manager for ALPS from October 2006 until June 2010. Before joining ALPS, Mr. Uhl served a Sr. Analyst with Enenbach and Associates (RIA), and a Sr. Financial Analyst at Sprint. Because of his position with ALPS, Mr. Uhl is deemed an affiliate of the Trust as defined under the 1940 Act. Mr. Uhl is also CCO of the Axonic Alternative Income Fund, Boulder Growth & Income Fund, Inc., Centre Funds, Index Funds, Reality Shares ETF Trust, Reaves Utility Income Fund and XAI Octagon Floating Rate & Alternative Income Term Trust. |
Jennell Panella, 1974 | Assistant Treasurer | Ms. Panella was elected Assistant Treasurer of the Trust at the September 15, 2015 meeting of the Board of Trustees. | Ms. Panella joined ALPS in June 2012 and is currently Fund Controller of ALPS Fund Services, Inc. Prior to joining ALPS, Ms. Panella served as Financial Reporting Manager for Parker Global Strategies, LLC (2009-2012). Because of her position with ALPS, Ms. Panella is deemed an affiliate of the Trust as defined under the 1940 Act. Ms. Panella also serves as Assistant Treasurer of James Advantage Funds. |
| 40 | 1-855-DGI-FUND (344-3863) | www.DGIfund.com |
| The Disciplined Growth Investors Fund | Trustees and Officers |
April 30, 2019 (Unaudited)
OFFICERS (continued)
Name, Address* & Year of Birth | Position(s) Held with Fund | Term of Office** and Length of Time Served | Principal Occupation(s) During Past 5 Years*** |
Sharon Akselrod, 1974 | Assistant Secretary | Ms. Akselrod was elected Assistant Secretary of the Trust at the September 15, 2015 meeting of the Board of Trustees. | Ms. Akselrod joined ALPS in August 2014 and is currently Senior Investment Company Act Paralegal of ALPS Fund Services, Inc. Prior to joining ALPS, Ms. Akselrod served as Corporate Governance and Regulatory Associate for Nordstrom fsb (2013-2014) and Senior Legal Assistant – Legal Manager for AXA Equitable Life Insurance Company (2008-2013). Because of her position with ALPS, Ms. Akselrod is deemed an affiliate of the Trust as defined under the 1940 Act. Ms. Akselrod is also Assistant Secretary of ALPS ETF Trust, Clough Funds Trust and Principal Real Estate Income Fund. |
Jennifer Craig, 1973 | Assistant Secretary | Ms. Craig was elected Assistant Secretary of the Trust at the June 8, 2016 meeting of the Board of Trustees. | Ms. Craig joined ALPS in 2007 and is currently Assistant Vice President and Paralegal Manager of ALPS. Prior to joining ALPS, Ms. Craig was Legal Manager at Janus Capital Management LLC and served as Assistant Secretary of Janus Investment Fund, Janus Adviser Series and Janus Aspen Series. Because of her position with ALPS, Ms. Craig is deemed an affiliate of the Trust as defined under the 1940 Act. Ms. Craig is also Assistant Secretary of Clough Global Dividend and Income Fund, Clough Global Equity Fund, Clough Global Opportunities Fund, Liberty All-Star Equity Fund and Liberty All-Star Growth Fund, Inc. |
Sareena Khwaja-Dixon, 1980 | Assistant Secretary | Ms. Khwaja-Dixon was elected Assistant Secretary of the Trust at the December 12, 2017 meeting of the Board of Trustees. | Ms. Khwaja-Dixon joined ALPS in August 2015 and is currently Senior Counsel and Vice President of ALPS Fund Services, Inc. Prior to joining ALPS, Ms. Khwaja-Dixon served as a Senior Paralegal/Paralegal for Russell Investments (2011 – 2015). Ms. Khwaja-Dixon is also Secretary of Liberty All-Star Equity Fund and Liberty All-Star Growth Fund, Inc., Clough Funds Trust, Clough Dividend and Income Fund, Clough Global Opportunities Fund, and Clough Global Equity Fund. |
| * | All communications to Trustees and Officers may be directed to Financial Investors Trust c/o 1290 Broadway, Suite 1100, Denver, CO 80203. |
| ** | This is the period for which the Trustee or Officer began serving the Trust. Each Trustee serves an indefinite term, until his successor is elected. Officers are elected on an annual basis. |
| *** | Except as otherwise indicated, each individual has held the office shown or other offices in the same company for the last five years. |
| **** | The Fund Complex includes all series of the Trust (currently 31) and any other investment companies for which any Trustee serves as trustee for and which Disciplined Growth Investors, Inc. provides investment advisory services (currently none). |
| Annual Report | April 30, 2019 | 41 |
| The Disciplined Growth Investors Fund | Privacy Policy |
| WHO WE ARE | |
| Who is providing this notice? | The Disciplined Growth Investors Fund |
| WHAT WE DO | |
| How does the Fund protect my personal information? | To protect your personal information from unauthorized access and use, we use security measures that comply with federal law. These measures include computer safeguards and secured files and buildings. |
| How does the Fund collect my personal information? | We collect your personal information, for example, when you ● open an account ● provide account information or give us your contact information ● make a wire transfer or deposit money |
| Why can’t I limit all sharing? | Federal law gives you the right to limit only ● sharing for affiliates’ everyday business purposes-information about your creditworthiness ● affiliates from using your information to market to you ● sharing for non-affiliates to market to you State laws and individual companies may give you additional rights to limit sharing. |
| DEFINITIONS | |
| Affiliates | Companies related by common ownership or control. They can be financial and nonfinancial companies. |
| Non-affiliates | Companies not related by common ownership or control. They can be financial and nonfinancial companies. ● The Fund does not share with non-affiliates so they can market to you. |
| Joint marketing | A formal agreement between non-affiliated financial companies that together market financial products or services to you. ● The Fund does not jointly market. |
| 42 | 1-855-DGI-FUND (344-3863) | www.DGIfund.com |
| The Disciplined Growth Investors Fund | Privacy Policy |
| FACTS | WHAT DOES THE FUND DO WITH YOUR PERSONAL INFORMATION? |
| WHY? | Financial companies choose how they share your personal information. Federal law gives consumers the right to limit some but not all sharing. Federal law also requires us to tell you how we collect, share, and protect your personal information. Please read this notice carefully to understand what we do. |
| WHAT? | The types of personal information we collect and share depend on the product or service you have with us. This information can include: ● Social Security number and account transactions ● Account balances and transaction history ● Wire transfer instructions |
| HOW? | All financial companies need to share customers’ personal information to run their everyday business. In the section below, we list the reasons financial companies can share their customers’ personal information; the reasons the Fund chooses to share; and whether you can limit this sharing. |
| REASONS WE CAN SHARE YOUR PERSONAL INFORMATION | DOES THE FUND SHARE: | CAN YOU LIMIT THIS SHARING? |
For our everyday business purposes – such as to process your transactions, maintain your account(s), respond to court orders and legal investigations, or report to credit bureaus | Yes | No |
For our marketing purposes – to offer our products and services to you | No | We do not share. |
| For joint marketing with other financial companies | No | We do not share. |
For our affiliates’ everyday business purposes – information about your transactions and experiences | Yes | No |
For our affiliates’ everyday business purposes – information about your creditworthiness | No | We do not share. |
| For non-affiliates to market to you | No | We do not share. |
| Annual Report | April 30, 2019 | 43 |
| The Disciplined Growth Investors Fund | Privacy Policy |
| OTHER IMPORTANT INFORMATION |
| California Residents | If your account has a California home address, your personal information will not be disclosed to nonaffiliated third parties except as permitted by applicable California law, and we will limit sharing such personal information with our affiliates to comply with California privacy laws that apply to us. |
| Vermont Residents | The State of Vermont requires financial institutions to obtain your consent prior to sharing personal information that they collect about you with affiliated companies and nonaffiliated third parties other than in certain limited circumstances. Except as permitted by law, we will not share personal information we collect about you with nonaffiliated third parties or other affiliated companies unless you provide us with your written consent to share such information. |
| 44 | 1-855-DGI-FUND (344-3863) | www.DGIfund.com |

THIS MATERIAL MUST BE PRECEDED OR ACCOMPANIED BY A PROSPECTUS.
THE DISCIPLINED GROWTH INVESTORS FUND IS DISTRIBUTED BY ALPS DISTRIBUTORS, INC.
TABLE OF CONTENTS
| Manager Commentary | |
| Emerald Growth Fund | 1 |
| Emerald Small Cap Value Fund | 6 |
| Emerald Insights Fund | 12 |
| Emerald Banking and Finance Fund | 17 |
| Disclosure of Fund Expenses | 23 |
| Schedule of Investments | |
| Emerald Growth Fund | 25 |
| Emerald Small Cap Value Fund | 27 |
| Emerald Insights Fund | 29 |
| Emerald Banking and Finance Fund | 31 |
| Statements of Assets and Liabilities | 33 |
| Statements of Operations | 34 |
| Statements of Changes in Net Assets | |
| Emerald Growth Fund | 35 |
| Emerald Small Cap Value Fund | 37 |
| Emerald Insights Fund | 39 |
| Emerald Banking and Finance Fund | 41 |
| Financial Highlights | |
| Emerald Growth Fund | 43 |
| Emerald Small Cap Value Fund | 47 |
| Emerald Insights Fund | 51 |
| Emerald Banking and Finance Fund | 55 |
| Notes to Financial Statements | 59 |
| Report of Independent Registered Public Accounting Firm | 67 |
| Disclosure Regarding Approval of Fund Advisory Agreement | 68 |
| Additional Information | 71 |
| Trustees and Officers | 72 |
| Privacy Policy | 77 |
Beginning on January 1, 2021, as permitted by regulations adopted by the U.S. Securities and Exchange Commission, paper copies of the Fund’s annual and semi-annual shareholder reports will no longer be sent by mail, unless you specifically request paper copies of the reports. Instead, the reports will be made available on the Funds’ website atwww.emeraldmutualfunds.com and you will be notified by mail each time a report is posted and provided with a website link to access the report.
Beginning on January 1, 2019, you may, notwithstanding the availability of shareholder reports online, elect to receive all future shareholder reports in paper free of charge. If you invest through a financial intermediary, you can contact your financial intermediary to request that you continue to receive paper copies of your shareholder reports. If you invest directly with the Funds, you can call 1.855.828.9909 to let the Funds know you wish to continue receiving paper copies of your shareholder reports.
If you already elected to receive shareholder reports electronically, you will not be affected by this change and you need not take any action. You may elect to receive shareholder reports and other communications from the Funds electronically anytime by contacting your financial intermediary (such as a broker-dealer or bank) or, if you are a direct investor, by enrolling atwww.emeraldmutualfunds.com.
| Emerald Growth Fund | Manager Commentary |
April 30, 2019 (Unaudited)
April 30, 2019
Dear Shareholders:
Investment Results:
The performance of the Emerald Growth Fund Class A shares (without sales load), for the twelve months ended April 30, 2019, advanced by 11.79% outpacing the Russell 2000® Growth Index which appreciated by 6.91%.
After a dramatic slowdown in global manufacturing and industrial production over the course of the second half of 2018 that led to rising recession fears, and tremendous selling pressure across the broad market indices, the market staged an aggressive rally over the first four months of 2019. The massive reversal in market sentiment, from the record setting calendar fourth quarter 2018 market weakness, was driven by receding recession fears catalyzed by a more dovish tone from the Federal Reserve (the “Fed”), more optimism toward a trade resolution with China, greater confidence that global economic growth is stabilizing and a sense that negative revision corporate earnings growth are abating.
Growth as an investment style has demonstrated impressive resiliency, outperforming across the market capitalization spectrum over the last 12 months, despite the significant swings in recession expectations and downward revisions to corporate earnings growth. This outperformance appears to be reflective of the market’s gravitation toward those companies with secular growth drivers (which are not cyclical or seasonal) versus those that are more cyclical (reliant on the direction of economic growth) as trends in global Gross Domestic Product (GDP) growth have proven to be less certain.
Within the small capitalization universe, as measured by the Russell 2000, the Russell 2000® Growth Index gained 6.91% for the trailing period, while the Russell 2000® Value Index gained a more modest 2.19%. Within the Russell 2000® Growth Index, the significant relative outperformance of the technology and consumer discretionary sector were meaningful contributors to the Russell 2000® Growth Index’s outperformance and proved to be a solid tailwind for the Emerald Growth Fund over the same period.
Investment Analysis:
On a relative basis the portfolio outperformed the benchmark for the trailing period, driven by stock selection within the consumer discretionary, healthcare, technology, consumer staples and materials sectors. The positive contribution from these sectors, offset relative underperformance within the financial services, producer durables and utilities sectors.
The consumer discretionary sector was the largest positive contributor to return driven by stock selection within the educations services, leisure time, consumer services and specialty retail industries. The healthcare sector was also a top contributor to return for the period driven by stock selection within the biotechnology, medical equipment, medical services and pharmaceutical industries.
Performance within the technology sector was also a meaningful contributor to return driven by noteworthy outperformance within the software, electronic entertainment and communications technology industries.
Partially offsetting the aforementioned strength, was relative underperformance within the financial services and producer durables sectors. The financial services sector was the largest detractor to return driven by the portfolio’s relative overweight position and stock selection within the banking industry. Performance within the producer durables sector also proved challenging due to disappointing stock selection within the trucking, scientific instrument and engineering and contracting industries.
Exiting April 2019, the portfolio held the largest active exposures in the technology, consumer discretionary, and financial services sectors. Thoughts on those sectors and other notable areas of exposure are highlighted below.
| ● | The technology sector was the portfolio’s largest relative overweight position exiting the fiscal year. Within the sector, the computer software and services industry remains the portfolio’s largest total and active exposure. Emerald continues to see a strong secular growth opportunity in enterprise security and vertical software as we believe that large corporations are behind in their efforts to digitally transform their businesses. Within software we remain overweight the security end market given increased vigilance of corporate boards and ongoing upward pressure on security budgets as the threat landscape continues to broaden. We also continue to be optimistic regarding network infrastructure spending as consumer demand for bandwidth continues to drive network upgrades, and at this point, multiple segments (datacenter, telecom and cable companies) are in the early stages of network expansion/evolution. |
| ● | The portfolio also exited the period with an overweight position in the consumer discretionary sector. The overweight is comprised of a diverse subset of companies within the casino & gambling, specialty retail, education services, home building, leisure time, diversified |
| Annual Report | April 30, 2019 | 1 |
| Emerald Growth Fund | Manager Commentary |
April 30, 2019 (Unaudited)
retail, consumer services, apparel & shoes, and restaurant industries. Emerald believes that, amidst an expansionary consumer backdrop each of these companies is positioned to benefit from company specific initiatives and opportunities.
| ● | The portfolio also maintains an overweight position to the financial services. Emerald continues to find opportunities in the financial services sector, with the Fed seemingly on hold for future interest rate hikes, small capitalization financials such as banks and real estate investment trusts (REITs) should provide a stable stream of earnings over the rest of 2019. Further complementing the aforementioned are niche opportunities within the financial data & systems, consumer lending and diversified financial services industries. |
| ● | The healthcare sector, while underweight relative to the benchmark, also remains an area of meaningful exposure within the portfolio. At the industry level, the biotechnology industry remains the largest aggregate exposure. We continue to look for innovative therapeutics that can command premium pricing, though we note that competition for small niche patient populations is becoming a challenge. That being said there continues to be a high-level of successful innovation in the marketplace. Although there were only 6 drugs approved by the Food and Drug Administration (the “FDA”) during the first quarter (vs. 18 drugs approved by FDA during Q4-18), we believe the slower sequential approval rate was a fallout of the government shutdown which delayed the approval process. On average the FDA has approved approximately 10.8 drugs per quarter from 2015-2018. Further we also believe there is a developing opportunity in companies that have launched drugs in the past 2-3 years, as it often takes small companies several quarters to get their commercial organization running efficiently. Rounding out the portfolio’s healthcare sector exposure are niche opportunities within the healthcare services, medical equipment, medical & dental instruments and pharmaceutical industries. |
Market Outlook:
As we look to the balance of 2019, we remain encouraged by the underlying strength in the U.S. economy. After weakening economic data points exiting 2018, first quarter domestic GDP growth expanded by 3.2% which was substantially better than what was anticipated in early March. The Institute for Supply Management’s (ISM) Manufacturing Index has rebounded, ISM Services index remains in expansion territory and while retail sales have proven volatile year-to-date, we believe the U.S. consumer remains in a good financial position. Consumer confidence remains encouraging, the savings rate at 7% remains high, the debt service ratio is down near a historical low, wage growth is continuing unabated, and unemployment remains low. All of which continues to give us confidence regarding the domestic macroeconomic backdrop.
The better than expected first quarter economic growth contributed to the broadly better than expected first quarter earnings growth, with companies that comprise the S&P 500 now expected to show a consolidated 2-3% gain in earnings for the period according to a recent report from Jonathon Golub of Credit Suisse, substantially outpacing original expectations of a 4% decline. We view the solid first quarter earnings performance and improvement in earnings revisions as particularly encouraging given the challenges that were broadly apparent in the global economy entering 2019.
Nonetheless, while we are certainly encouraged by stabilization in both earnings and economic growth in the U.S. and abroad, the outlook for growth remains anything but certain. The on again, off again trade resolution with China remains a case in point. Beyond China, a more disruptive than expected United Kingdom departure from the European Union (or “BREXIT”), a prolonged inversion of the yield curve, the return to more hawkish posturing from the Federal Reserve and rising geopolitical tensions all remain sources of risk. Encouragingly relative to mid-2018, central banks across the globe have now shifted to more accommodative policies, which add a further leg of support to the stabilization in global growth.
All that being said, Emerald continues to believe that those companies with secular growth drivers will continue to garner the attention of the investment community and we remain focused, as always, on executing on our fundamental bottom research process to identify the most attractive growth opportunities within the small capitalization universe.
| Top Contributors | Top Detractors | |
| Tandem Diabetes Care, Inc. | Adamas Pharmaceuticals Inc. | |
| Chegg Inc. | Dycom Industries Inc. | |
| Five Below Inc. | Karyopharm Therapeutics Inc. | |
| Reata Pharmaceuticals Inc. | Cadence Bancorporation | |
| Planet Fitness Inc. | Atlas Air Worldwide Holdings Inc. | |
| | | |
| Kenneth G. Mertz II, CFA | Stacey L. Sears | Joseph W. Garner |
| Chief Investment Officer | Portfolio Manager | Portfolio Manager |
| Portfolio Manager | | |
| | | |
| Emerald Mutual Fund Advisers Trust | | |
| 2 | www.emeraldmutualfunds.com |
| Emerald Growth Fund | Manager Commentary |
April 30, 2019 (Unaudited)
Past performance does not guarantee future results. Fund prices fluctuate as the underlying assets have exposure to market fluctuations and other risks, as described in the Fund’s prospectus. Please visit www.emeraldmutualfunds.com to obtain current performance information and for the current prospectus and statement of additional information. This material must be preceded or accompanied by a prospectus. Please read the prospectus carefully before investing.
The views of Emerald Mutual Fund Advisers Trust and information discussed in this commentary are as of the date of publication, are subject to change, and may not reflect the writer's current views. The views expressed are those of the author only, and represent an assessment of market conditions at a specific point in time, are opinions only and should not be relied upon as investment advice regarding a particular investment or markets in general. Such information does not constitute a recommendation to buy or sell specific securities or investment vehicles. It should not be assumed that any investment will be profitable or will equal the performance of the Fund or any securities or any sectors mentioned in this letter. The subject matter contained in this letter has been derived from several sources believed to be reliable and accurate at the time of compilation. Neither Emerald Mutual Fund Advisers Trust nor the Fund accepts any liability for losses either direct or consequential caused by the use of this information.
The Emerald Growth Fund is distributed by ALPS Distributors, Inc.
The Fund is subject to investment risks, including possible loss of the principal amount invested and therefore is not suitable for all investors. The Fund may not achieve its objectives.
Diversification does not eliminate the risk of experiencing investment losses.
The Russell 2000® Growth Index measures the performance of the small-cap growth segment of the U.S. equity universe. It includes those Russell 2000® Index companies with higher price-to-value ratios and higher forecasted growth values. The Index is not actively managed and does not reflect any deductions for fees, expenses or taxes. An investor may not invest directly into the Index.
The Russell 2000® Value Index measures the performance of small-cap value segment of the U.S. equity universe. It includes those Russell 2000 companies with lower price-to-book ratios (A ratio used to compare a stock's market value to its book value. It is calculated by dividing the current closing price of the stock by the latest quarter's book value per share.) and lower forecasted growth values. The Index is not actively managed and does not reflect any deductions for fees, expenses or taxes. An investor may not invest directly into the Index.
A yield curve is a line that plots the interest rates, at a set point in time, of bonds having equal credit quality but differing maturity dates. The most frequently reported yield curve compares the three-month, two-year, five-year and 30-year U.S. Treasury debt. This yield curve is used as a benchmark for other debt in the market, such as mortgage rates or bank lending rates, and it is also used to predict changes in economic output and growth.
| Annual Report | April 30, 2019 | 3 |
| Emerald Growth Fund | Manager Commentary |
April 30, 2019 (Unaudited)
TOP TEN HOLDINGS
(as a % of Net Assets)*
| Chegg, Inc. | 2.71% |
| Five Below, Inc. | 2.26% |
| Planet Fitness, Inc. | 2.12% |
| Rapid7, Inc. | 2.00% |
| Trex Co., Inc. | 1.96% |
| Varonis Systems, Inc. | 1.79% |
| Ciena Corp. | 1.75% |
| Cadence BanCorp | 1.72% |
| NeoGenomics, Inc. | 1.67% |
| ForeScout Technologies, Inc. | 1.65% |
| Top Ten Holdings | 19.63% |
INDUSTRY SECTOR ALLOCATION
(as a % of Net Assets)
| Health Care | 22.95% |
| Technology | 21.52% |
| Consumer Discretionary | 20.31% |
| Financial Services | 12.00% |
| Producer Durables | 9.46% |
| Materials & Processing | 4.27% |
| Utilities | 2.68% |
| Consumer Staples | 2.57% |
| Energy | 1.55% |
| Consumer, Non-cyclical | 1.12% |
| Cash, Cash Equivalents, & Other Net Assets | 1.57% |
| * | Holdings are subject to change, and may not reflect the current or future position of the portfolio. |
ANNUALIZED TOTAL RETURN (for the period ended April 30, 2019)
| | 1 Year | 3 Year | 5 Year | 10 Year | Since Inception(1) | Expense Ratio |
| Gross(2) | Net(2) |
| Class A (NAV) | 11.79% | 18.37% | 11.99% | 17.06% | 11.41% | 1.03% | 1.03% |
| Class A (MOP) | 6.47% | 16.47% | 10.91% | 16.50% | 11.20% | 1.03% | 1.03% |
| Russell 2000® Growth Index(3) | 6.91% | 15.64% | 10.22% | 15.24% | 8.42% | | |
| Class C (NAV) | 11.08% | 17.62% | 11.27% | 16.31% | 6.66% | 1.68% | 1.68% |
| Class C (CDSC) | 10.11% | 17.62% | 11.27% | 16.31% | 6.66% | 1.68% | 1.68% |
| Russell 2000® Growth Index(3) | 6.91% | 15.64% | 10.22% | 15.24% | 8.42% | | |
| Investor Class | 11.81% | 18.34% | 11.95% | – | 12.05% | 1.08% | 1.08% |
| Russell 2000®Growth Index(3) | 6.91% | 15.64% | 10.22% | 15.24% | 8.42% | | |
| Institutional Class | 12.17% | 18.74% | 12.35% | 17.43% | 15.40% | 0.73% | 0.73% |
| Russell 2000® Growth Index(3) | 6.91% | 15.64% | 10.22% | 15.24% | 8.42% | | |
Performance quoted represents past performance, does not guarantee future results and current performance may be lower or higher than the data quoted. The investment return and principal value of an investment will fluctuate so that shares, when redeemed, may be worth more or less than their original cost. Performance data current to the most recent month end may be obtained at www.emeraldmutualfunds.com.
Performance shown for periods prior to March 16, 2012, reflects the performance of the Forward Growth Fund, a series of Forward Funds (as a result of a reorganization of the Forward Growth Fund into the Emerald Growth Fund).
Returns for periods less than 1 year are cumulative.
The table does not reflect the deduction of taxes that a shareholder would pay on Fund distributions or the redemption of Fund shares.
Subject to investment risks, including possible loss of the principal amount invested.
Maximum Offering Price (MOP) for Class A shares includes the Fund's maximum sales charge of 4.75%. Performance shown at NAV does not include these sales charges and would have been lower had it been taken into account.
A Contingent Deferred Sales Charge (CDSC) of 1.00% may apply to Class C shares redeemed within the first 12 months after a purchase.
| (1) | Inception Dates - Class A: 10/01/1992, Class C: 07/01/2000, Institutional Class: 10/21/2008, Investor Class: 05/01/2011 |
| (2) | Emerald Mutual Fund Advisers Trust ("Emerald" or the "Adviser") has agreed contractually to waive a portion of its fees and reimburse other expenses until August 31, 2019 in amounts necessary to limit the Fund's operating expenses (exclusive of Acquired Fund Fees and Expenses, brokerage expenses, interest expenses, taxes and extraordinary expense) for Class A, Class C, Institutional Class, and Investor Class shares to an annual rate (as percentage of the Fund's average daily net assets) of 1.29%, 1.94%, 0.99% and 1.34% respectively. The Adviser will be permitted to recover, on a class-by-class basis, expenses it has borne through the agreement described above to the extent that the Fund's expenses in later periods fall below the annual rates set forth in the relevant agreement. The Fund will not be obligated to pay any such deferred fees and expenses more than three years after the year(s) in which the fees and expense were incurred. The Adviser may not discontinue this waiver prior to August 31, 2019, without the approval by the Fund's Board of Trustees. Ratios as of the Prospectus dated August 31, 2018 and may differ from the ratios presented in the Financial Highlights. |
| (3) | The Russell 2000® Growth Index measures the performance of the small-cap growth segment of the U.S. equity universe. It includes those Russell 2000® Index companies with higher price-to-value ratios and higher forecasted growth values. The Index is not actively managed and does not reflect any deduction for fees, expenses or taxes. An investor may not invest directly into the Index. |
| 4 | www.emeraldmutualfunds.com |
| Emerald Growth Fund | Manager Commentary |
April 30, 2019 (Unaudited)
GROWTH OF $10,000 INVESTMENT IN THE FUND (for the period ended April 30, 2019)
Comparison of change in value of a $10,000 investment (includes applicable sales loads)
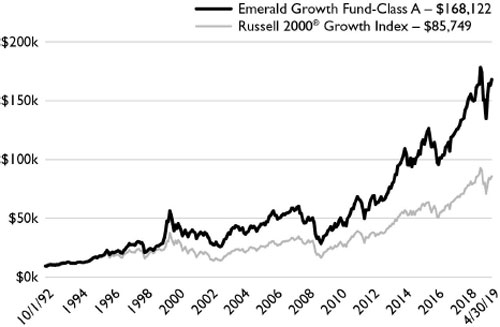
The chart represents historical performance of a hypothetical investment of $10,000 in the Fund since inception. Past performance does not guarantee future results. This chart does not reflect the deduction of taxes that a shareholder would pay on Fund distributions or the redemption of Fund shares.
Investing in the Fund is subject to investment risks, including possible loss of the principal amount invested.
| Annual Report | April 30, 2019 | 5 |
| Emerald Small Cap Value Fund | Manager Commentary |
April 30, 2019 (Unaudited)
April 30, 2019
Dear Shareholders:
Investment Results:
The performance of the Emerald Small Cap Value Fund Investor Class shares (without sales load), for the twelve months ended April 30, 2019, reflected a loss of 6.99% underperforming the Russell 2000® Value Index (or “R2V”) which was up 2.19%.
It has been a tumultuous year in the market, with volatility spiking up from recent decades lows. Active small cap managers faced significant headwinds in the 4th calendar quarter of 2018, as small cap stocks went through an unrelenting bear market correction. Additional headwinds to active managers during the last quarter of 2018 came from large ETF outflows, algorithm selling of certain factors without consideration for individual fundamentals, hedge fund redemptions and firings, and value manager terminations. Also, due to new tax rules, many individual investors have lost meaningful tax deductions from their state and local taxes making stock losses more valuable than in prior years.
However, in the first 4 months of 2019 we saw a dramatic reversal in the stock market as small caps staged an impressive rally. The Russell 2000® Value Index had the best start to the new year since 1991. However, once again it was small cap growth that bested small cap value. Investors shrugged off continued political discourse post mid-term election, the longest government shut-down on record, as well as weaker than expected economic data from both domestic and abroad, as the Federal Reserve (the “Fed”) sent a strong signal to the market that it is effectively putting any rate hikes throughout 2019 on hold.
Investment Analysis:
The Emerald Small Cap Value Fund (without sales load) underperformed its benchmark for the 12-month period ended April 30, 2019. At the sector level, relative outperformance was driven by stock selection within the consumer discretionary and healthcare sectors, and our relative underweight in consumer staples. Relative underperformance was experienced within the financial services, technology and producer durables sectors.
We have reduced our overweight in banks, but still believe that the underlying fundamentals of small cap community bank stocks remain attractive. In recent weeks, parts of the Treasury yield curve have inverted, presenting a potential barrier to increased earnings power for the bank sector. Therefore, investors have soured on the sector given uncertainty in the market based on the yield curve, global growth concerns and select calls for rate cuts. We believe that if banks can deliver on a solid first quarter, which has been the case for the majority of banks reporting so far, there could be a rally in stock prices considering the recent selloff. While lower rates will dampen loan yields, banks could see some benefit from slower rise in deposit costs, and higher yields on repriced loans. Additionally, the sharp decrease in long term rates over the last six months should bolster growth in tangible book values (TBV) for many community banks during the first quarter earnings seasons a result of increase in value of their available for sale (AFS) securities portfolios. The vast majority of banks’ AFS portfolios comprise of fixed income securities, which benefit when the 10 year Treasury yield declines. We continue to expect relative outperformance from community banks with: 1) solid core deposit basis that have net interest margin defensible characteristics in the form of lower cost commercial deposits; 2) loan growth outlooks that are better than average but achievable; 3) good credit quality; and 4) reasonable ability to offset top line revenue weakness through expense pruning all while still investing in the franchise. We believe that 2019 will also see a robust merger and acquisitions activity in the banking sector. Recent large merger of equals should spur additional consolidation, as banks are looking to grow and provide more services to customers in a cost efficient manner. Valuations remain attractive with many community banks trading below historical levels despite the rebound in 1Q19.
The energy sector was the worst performer in the past 12 months, down over 40% in the 4th calendar quarter of 2018 alone. WTI crude dropped almost 40% during that quarter on fears of a global demand slowdown and excess supply. Even OPEC’s commitment to remove 1.3 million barrels a day in production from the market in early 2019 failed to curb crude’s dramatic decline. The 1.6 – 1.8 million barrel per day increase in US production in 2018, as well as the OPEC production ramp up on the expectation of a severe Iran sanction impact caused inventories to rise, thus leading to investor angst. Natural gas prices moved in opposition to WTI crude prices, ending 2018 almost where they started at the beginning of the year with just a slight decline. Colder than expected winter weather in the US for much of the 4th quarter of 2018 served to bolster prices, with New York Mercantile Exchange (NYMEX) natural gas prices hitting almost $5/MMBtu in November. Even this price action, however, failed to support natural gas focused equities.
We believe that the small cap value portfolio is well positioned to benefit from a slowing, yet growing, domestic economy and the eventual turnaround in domestically focused industries (such as Banks). We continue to search for and invest in high quality companies that generate prodigious amounts of free cash flow, as well as financial services enterprises that trade significantly below their terminal value.
| 6 | www.emeraldmutualfunds.com |
| Emerald Small Cap Value Fund | Manager Commentary |
April 30, 2019 (Unaudited)
Market Outlook:
The strong rebound in the stock market, so far this year, was a welcomed relief for investors after being shell-shocked during calendar 4Q18. The markets rallied despite a change in Capitol Hill that guarantees political gridlock, so-so economic data, a lackluster housing market, continued negotiations with China on trade, and risks overseas (BREXIT, EU economic slowdown, China economic slowdown).
It seems that optimism abounds, as investors feel that the dark clouds are still far out on the horizon. The Fed definitely gave a big boost to the market by waiving the white flag on any future rate hikes. Also, employment data has been very strong with U.S. Job openings rising to 7.58 million in January, almost reaching back to the 20-year highest record of 7.63 million in November 2018 according to the Bureau of Labor Statistics (BLS). Currently, job openings are exceeding the unemployed by more than 1 million and this type of discrepancy has been present for 11 consecutive months. All the while, new claims for unemployment insurance broke below 200,000 number in early April to hit the lowest level since October 1969. The consumer is healthy and not stressed, given that credit card loan delinquencies are steady and have not deteriorated in almost two years. As for inflation, it seems that it is right about were the Fed’s target is (~2%).
While we still believe that the US business cycle is maturing, current market conditions are supportive of further growth and margin expansion in domestic companies. ISM Manufacturing and Non-Manufacturing Purchasing Managers Index (PMI) have been down sequentially year to date, but still well above 50 and signaling continued economic growth. National Federation of Independent Business (NFIB) Small Business Optimism Index has been above 100 despite government shut down earlier in the year, indicating that small businesses continue to power the economy. Also, it seems that labor slack is diminishing and wages continues to rise. The latest reading of the unemployment rate was 3.8%, and the U6 underemployment rate fell to 7.3%, which indicative of full employment (BLS).
Growth beats Value again so far in 2019, and it seems to be a recurring theme since the end of 2016. “Lower for longer” interest rates and a flattening yield curve (at some points on the curve even inverting), are becoming headwinds for financial services companies (banks, insurance), which are a significant portion of the R2V. “Lower for longer boosts longer duration assets like growth stocks, and lower rates tend to mean weaker GDP growth and that's not great for the cyclicals. The small cap value index has nearly 30% of its weight in the Financials versus less than 7% for growth. In addition, valuations not mattering also helps growth more than value”(1). With falling sales and earnings growth expectations for 2019, investors are willing to pay up for perceived scarcity of growth and gravitate towards secular themes in healthcare and technology, which represent a large chunk of the Russell 2000® Growth (R2G) benchmark. In other words, Since 2005, slow growth, low inflation, and low interest rates have placed a premium on growth and held back valuation’s power to produce positive relative returns. This dynamics eventually will change.
We believe that as value is cheaper relative to growth, valuation factors, which haven’t really mattered to investors thus far, will start to work, and value companies will exhibit greater improvement in earnings and sales as the domestic economy is expected to grow ~2.5% in 2019. We believe that companies that are generating prodigious amount of free cash flow are higher quality companies, and will outperform over a market cycle. We are confident in our ability to identify small banks that would outperform in challenging environments, by following our robust 10-step investment process and utilizing our long term relationships with executive management teams. You can learn more about our 10-step process at https://www.teamemerald.com/about-us/10-step-process.
In the past few quarters, companies that have low return on equity or "non-earners", which we consider lower quality companies, have done very well. We expect this trend to reverse as investors will start to focus on earnings growth and balance sheet strength as the valuation gap between growth and value widens, and concerns over an eventual economic slowdown increase.
As always, we will continue to seek attractive investment opportunities for our clients by focusing on high-quality companies identified and evaluated by our fundamental research and active portfolio management.
| Top Contributors | Top Detractors |
| Innovative Industrial Properties Inc | Mammoth Energy Services, Inc. |
| Gray Television, Inc. | Tower Semiconductor Ltd |
| Meritor, Inc. | Elevate Credit, Inc. |
| Kirkland Lake Gold Ltd. | Live Oak Bancshares, Inc. |
| Eldorado Resorts Inc | Dycom Industries, Inc. |
| | |
| Sincerely, | |
| | |
| Ori Elan | Steven E. Russell, Esq. |
| Vice President | Vice President |
| Portfolio Manager | Portfolio Manager |
| | |
| Emerald Mutual Fund Advisers Trust |
| Annual Report | April 30, 2019 | 7 |
| Emerald Small Cap Value Fund | Manager Commentary |
April 30, 2019 (Unaudited)
Past performance does not guarantee future results. Fund prices fluctuate as the underlying assets have exposure to market fluctuations and other risks, as described in the Fund’s prospectus. Please visit www.emeraldmutualfunds.com to obtain current performance information and for the current prospectus and statement of additional information. This material must be preceded or accompanied by a prospectus. Please read the prospectus carefully before investing.
The views of Emerald Mutual Fund Advisers Trust and information discussed in this commentary are as of the date of publication, are subject to change, and may not reflect the writer's current views. The views expressed are those of the author only, and represent an assessment of market conditions at a specific point in time, are opinions only and should not be relied upon as investment advice regarding a particular investment or markets in general. Such information does not constitute a recommendation to buy or sell specific securities or investment vehicles. It should not be assumed that any investment will be profitable or will equal the performance of the Fund or any securities or any sectors mentioned in this letter. The subject matter contained in this letter has been derived from several sources believed to be reliable and accurate at the time of compilation. Neither Emerald Mutual Fund Advisers Trust nor the Fund accepts any liability for losses either direct or consequential caused by the use of this information.
The Emerald Small Cap Value Fund is distributed by ALPS Distributors, Inc.
The Fund is subject to investment risks, including possible loss of the principal amount invested and therefore is not suitable for all investors. The Fund may not achieve its objectives.
Diversification does not eliminate the risk of experiencing investment losses.
The term Russell 2000® Value Index refers to a composite of small cap companies located in the United States that also exhibit a value probability. The Russell 2000® Value is published does not reflect any deductions for fees, expenses or taxes. An investor may not invest directly into the Index.
A yield curve is a line that plots the interest rates, at a set point in time, of bonds having equal credit quality but differing maturity dates. The most frequently reported yield curve compares the three-month, two-year, five-year and 30-year U.S. Treasury debt. This yield curve is used as a benchmark for other debt in the market, such as mortgage rates or bank lending rates, and it is also used to predict changes in economic output and growth.
| (1) | Jefferies, JEF's SMID-Cap Strategy—Lower for Longer Hurts Fin'ls, Downgrading to UW, 22 March, 2019 |
Tangible book value (TBV) is a valuation ratio expressing the price of a security compared to its hard, or tangible, book value as reported in the company's balance sheet. The tangible book value number is equal to the company's total book value less the value of any intangible assets.
| 8 | www.emeraldmutualfunds.com |
| Emerald Small Cap Value Fund | Manager Commentary |
April 30, 2019 (Unaudited)
TOP TEN HOLDINGS
(as a % of Net Assets)*
| Innovative Industrial Properties, Inc. | 2.89% |
| Aaron's, Inc. | 2.43% |
| Koppers Holdings, Inc. | 2.38% |
| Popular, Inc. | 2.34% |
| Rexford Industrial Realty, Inc. | 2.33% |
| Eldorado Resorts, Inc. | 2.30% |
| OSI Systems, Inc. | 2.21% |
| Meritor, Inc. | 2.15% |
| Gray Television, Inc. | 2.07% |
| Delek US Holdings, Inc. | 2.05% |
| Top Ten Holdings | 23.15% |
INDUSTRY SECTOR ALLOCATION
(as a % of Net Assets)
| Financial Services | 40.56% |
| Consumer Discretionary | 12.82% |
| Producer Durables | 12.82% |
| Technology | 11.71% |
| Materials & Processing | 5.94% |
| Energy | 5.20% |
| Industrial | 3.84% |
| Health Care | 2.47% |
| Utilities | 1.55% |
| Consumer, Cyclical | 1.28% |
| Consumer, Non-cyclical | 1.00% |
| Cash, Cash Equivalents, & Other Net Assets | 0.81% |
| * | Holdings are subject to change, and may not reflect the current or future position of the portfolio. |
ANNUALIZEDTOTAL RETURN (for the period ended April 30, 2019)(1),(2)
| | 1 Year | 3 Years | 5 Years | Since Inception(2) | Expense Ratio |
| Gross(3) | Net(3) |
| Class A (NAV) | -7.30% | 9.25% | 5.90% | 9.72% | 2.56% | 1.35% |
| Class A (MOP) | -11.70% | 7.49% | 4.87% | 8.91% | 2.56% | 1.35% |
| Russell 2000® Value Index(4) | 2.19% | 11.46% | 6.94% | 10.68% | | |
| Class C (NAV) | -7.88% | 8.53% | 5.21% | 9.01% | 3.20% | 2.00% |
| Class C (CDSC) | -8.57% | 8.53% | 5.21% | 9.01% | 3.20% | 2.00% |
| Russell 2000® Value Index(4) | 2.19% | 11.46% | 6.94% | 10.68% | | |
| Investor Class | -6.99% | 9.45% | 6.09% | 9.90% | 2.44% | 1.25% |
| Russell 2000® Value Index(4) | 2.19% | 11.46% | 6.94% | 10.68% | | |
| Institutional Class | -6.90% | 9.65% | 6.27% | 10.11% | 2.20% | 1.00% |
| Russell 2000® Value Index(4) | 2.19% | 11.46% | 6.94% | 10.68% | | |
Performance quoted represents past performance, does not guarantee future results and current performance may be lower or higher than the data quoted. The investment return and principal value of an investment will fluctuate so that shares, when redeemed, may be worth more or less than their original cost. Performance data current to the most recent month end may be obtained at www.emeraldmutualfunds.com.
Returns for periods less than 1 year are cumulative.
The table does not reflect the deduction of taxes that a shareholder would pay on Fund distributions or the redemption of Fund shares.
Subject to investment risks, including possible loss of the principal amount invested.
Maximum Offering Price (MOP) for Class A shares includes the Fund's maximum sales charge of 4.75%. Performance shown at NAV does not include these sales charges and would have been lower had it been taken into account.
A Contingent Deferred Sales Charge (CDSC) of 1.00% may apply to Class C shares redeemed within the first 12 months after a purchase.
| (1) | As of June 26, 2015, the Emerald Small Cap Value Fund was reorganized as a successor to the Elessar Small Cap Value Fund (the Predecessor Fund), a series of Elessar Investment Trust. The performance shown for periods prior to June 26, 2015 reflects the performance of the Predecessor Fund's Institutional Class and Investor Class shares. The Predecessor Fund did not offer Class A or Class C shares. The performance shown for Class A and C shares prior to June 30, 2015 reflect the historical performance of the Predecessor Fund’s Institutional and Investor Shares since inception on October 15, 2012, calculated using the fees and expenses of Class A and C shares, respectively. |
| (2) | Commencement Dates - Class A: 06/30/2015, Class C: 06/30/2015, Institutional Class: 10/15/2012, Investor Class:10/15/2012 |
| (3) | Emerald Mutual Fund Advisers Trust (“Emerald” or the “Adviser”) has agreed contractually to waive a portion of its fees and reimburse other expenses until August 31, 2019 in amounts necessary to limit the Fund’s operating expenses (exclusive of Acquired Fund Fees and Expenses, brokerage expenses, interest expenses, taxes and extraordinary expense) for Class A, Class C, Institutional Class, and Investor Class shares to an annual rate (as percentage of the Fund’s average daily net assets) of 1.35%, 2.00%, 1.00% and 1.25% respectively. The Adviser will be permitted to recover, on a class-by-class basis, expenses it has borne through the agreement described above to the extent that the Fund's expenses in later periods fall below the annual rates set forth in the relevant agreement. The Fund will not be obligated to pay any such deferred fees and expenses more than three years after the year(s) in which the fees and expense were incurred. The Adviser may not discontinue this waiver prior to August 31, 2019, without the approval by the Fund's Board of Trustees. Ratios as of the Prospectus dated August 31, 2018 and may differ from the ratios presented in the Financial Highlights. |
| Annual Report | April 30, 2019 | 9 |
| Emerald Small Cap Value Fund | Manager Commentary |
April 30, 2019 (Unaudited)
| (4) | The Russell 2000® Value Index measures the performance of small-cap value segment of the U.S. equity universe. It includes those Russell 2000 companies with lower price-to-book ratios and lower forecasted growth values. The Index is not actively managed and does not reflect any deductions for fees, expenses or taxes. An investor may not invest directly into the Index. |
Important Risks
Investing in smaller companies generally will present greater investment risks, including: greater price volatility, greater sensitivity to changing economic conditions and less liquidity than the securities of larger, more mature companies.
| 10 | www.emeraldmutualfunds.com |
| Emerald Small Cap Value Fund | Manager Commentary |
April 30, 2019 (Unaudited)
GROWTH OF $10,000 INVESTMENT IN THE FUND (for the period ended April 30, 2019)
Comparison of change in value of a $10,000 investment (includes applicable sales loads)
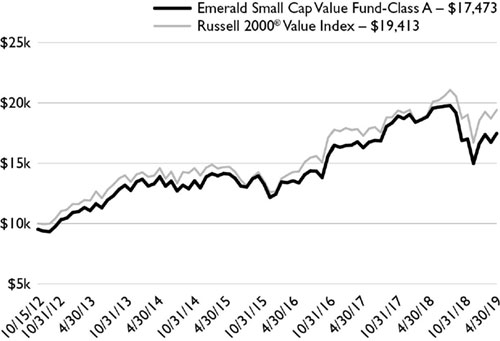
The chart represents historical performance of a hypothetical investment of $10,000 in the Fund since inception. Past performance does not guarantee future results. This chart does not reflect the deduction of taxes that a shareholder would pay on Fund distributions or the redemption of Fund shares.
Investing in the Fund is subject to investment risks, including possible loss of the principal amount invested.
| Annual Report | April 30, 2019 | 11 |
| Emerald Insights Fund | Manager Commentary |
April 30, 2019 (Unaudited)
April 30, 2019
Dear Shareholders:
Investment Results:
The performance of the Emerald Insights Fund Class A shares (without the sales load) for the 12 months ended April 30, 2019 reflected a return of 11.53%, trailing the Russell 3000® Growth Index benchmark return of 16.61%. Performance for the period was hampered by weak results in calendar Q4, which offset strong performance in both the first 5 months of the reporting period as well as the first calendar quarter of 2019. Strength in Healthcare and Consumer Discretionary was offset by weakness in the Energy, Financial Services, and Technology as part of a larger risk-off trade in late 2018.
Investment Analysis:
The last 12 months began with a belief in a global synchronized recovery, low volatility, investor bullishness and the widely-viewed potential for >20% S&P 500 earnings growth. Calendar 2018 ended with a global synchronized slowdown, high volatility, investor bearishness, concerns of a sharply slowing US economy and potential for flat earnings growth. As we expected, the final quarter of the last 12 fiscal months saw a recovery as economic indicators, corporate earnings, and global trade concerns began to moderate and fears of an earnings recession began to recede.
The Insights Fund took advantage of 4th fiscal calendar quarter volatility, using excess cash to make some well-timed purchases of names caught in the quarter’s liquidity-driven market sell off. The Fund was positioned with a modest degree of growth cyclical exposure, with overweights to Energy and Materials given our expectations of strong future earnings growth for those sectors. The first four months of 2019 started off with a significant reversal of the year-end equity decline with the Healthcare, Consumer and Financial sectors leading outperformance. Unfortunately for the full reporting period, in a continuation of a two year trend, expected growth rates and valuations failed to drive stock prices, as momentum and defensive characteristics were factors with more influence over equity returns.
Market Outlook:
We have maintained a bullish portfolio and market stance since it became clear to us last year that the market’s reaction to the Federal Reserve (the”Fed”), trade and an earnings slowdown was overblown. The Fed is clearly on hold at this point as the three rate hike scenario predicted by many for 2019 is far less likely, with a real possibility of a rate cut. We appear to be inching closer to a trade deal with China, although that failing, as well as a continued fall out from Brexit and some global economic slowing is a risk. Revenue and earnings expectations remain positive for 2019, and while the yield curve did momentarily invert and remains extremely flat, we think this is more of a flow-of-funds phenomenon rather than a precursor of domestic and global economic weakness.
We have built portfolios with what we call a cyclical growth flavor, but certainly still growth as evidenced by the portfolios’ expected 3-5 year Earnings Per Share (EPS) growth being 280 basis points ahead of the index. Portfolios remained overweight Energy and Materials, equal weight Consumer Staples and Technology.
We think the last two years have been an anomalous time in terms of the growth vs. value disparity of selected high growth names trading at discounted valuations. Given the portfolio’s excess projected 3-5 year growth rate vs. the benchmark has actually increased over the past few quarters while the valuation characteristics have remained steady, we like our positioning going forward and will continue to use pullbacks as opportunities to add to our favorite positions, particularly in the Technology sector. Interest rates, inflation and unemployment remain low and the consumer remains optimistic. Administration policy and global economies are in place for a continued equity advance in 2019. Through our fundamental bottom-up research process we will continue to look for names with strong growth prospects regardless of sector and industry.
| Top Contributors | Top Detractors | |
| Chegg, Inc. | Extraction Oil & Gas, Inc. | |
| Microsoft Corporation | GMS Inc. | |
| LendingTree, Inc. | Dycom Industries, Inc. | |
| Rapid7 Inc. | Puma Biotechnology, Inc. | |
| Amazon.com, Inc. | Patterson-UTI Energy, Inc. | |
| | | |
| David A. Volpe, CFA | Stephen L. Amsterdam | Joseph Hovorka |
| Deputy Chief Investment Officer | Associate Portfolio Manager | Associate Portfolio Manager |
| Portfolio Manager | | |
Emerald Mutual Fund Advisers Trust
| 12 | www.emeraldmutualfunds.com |
| Emerald Insights Fund | Manager Commentary |
April 30, 2019 (Unaudited)
Past performance does not guarantee future results. Fund prices fluctuate as the underlying assets have exposure to market fluctuations and other risks, as described in the Fund’s prospectus. Please visit www.emeraldmutualfunds.com to obtain current performance information and for the current prospectus and statement of additional information. This material must be preceded or accompanied by a prospectus. Please read the prospectus carefully before investing.
The views of Emerald Mutual Fund Advisers Trust and information discussed in this commentary are as of the date of publication, are subject to change, and may not reflect the writer's current views. The views expressed are those of the author only, and represent an assessment of market conditions at a specific point in time, are opinions only and should not be relied upon as investment advice regarding a particular investment or markets in general. Such information does not constitute a recommendation to buy or sell specific securities or investment vehicles. It should not be assumed that any investment will be profitable or will equal the performance of the Fund or any securities or any sectors mentioned in this letter. The subject matter contained in this letter has been derived from several sources believed to be reliable and accurate at the time of compilation. Neither Emerald Mutual Fund Advisers Trust nor the Fund accepts any liability for losses either direct or consequential caused by the use of this information.
The Emerald Insights Fund is distributed by ALPS Distributors, Inc.
The Fund is subject to investment risks, including possible loss of the principal amount invested and therefore is not suitable for all investors. The Fund may not achieve its objectives.
Diversification does not eliminate the risk of experiencing investment losses.
The Russell 3000® Growth Index is a market capitalization weighted index based on the Russell 3000® index. The Russell 3000® Growth Index includes companies that display signs of above average growth. The index is used to provide a gauge of the performance of growth stocks in the United States. The Index is not actively managed and does not reflect any deductions for fees, expenses or taxes. An investor may not invest directly into the Index.
A yield curve is a line that plots the interest rates, at a set point in time, of bonds having equal credit quality but differing maturity dates. The most frequently reported yield curve compares the three-month, two-year, five-year and 30-year U.S. Treasury debt. This yield curve is used as a benchmark for other debt in the market, such as mortgage rates or bank lending rates, and it is also used to predict changes in economic output and growth.
| Annual Report | April 30, 2019 | 13 |
| Emerald Insights Fund | Manager Commentary |
April 30, 2019 (Unaudited)
TOP TEN HOLDINGS
(as a % of Net Assets)*
| Microsoft Corp. | 5.50% |
| Amazon.com, Inc. | 5.50% |
| Apple, Inc. | 4.18% |
| Alphabet, Inc. | 3.61% |
| SeaWorld Entertainment, Inc. | 2.48% |
| LendingTree, Inc. | 2.13% |
| Rapid7, Inc. | 1.91% |
| Chegg, Inc. | 1.85% |
| Malibu Boats, Inc. | 1.85% |
| PlayAGS, Inc. | 1.61% |
| Top Ten Holdings | 30.62% |
INDUSTRY SECTOR ALLOCATION
(as a % of Net Assets)
| Technology | 31.12% |
| Consumer Discretionary | 18.55% |
| Health Care | 14.20% |
| Financial Services | 9.83% |
| Producer Durables | 7.37% |
| Materials & Processing | 5.87% |
| Energy | 5.81% |
| Utilities | 2.36% |
| Consumer, Cyclical | 1.24% |
| Consumer Staples | 1.02% |
| Industrial | 0.65% |
| Consumer, Non-cyclical | 0.25% |
| Cash, Cash Equivalents, & Other Net Assets | 1.73% |
| * | Holdings are subject to change, and may not reflect the current or future position of the portfolio. |
ANNUALIZED TOTAL RETURN (for the period ended April 30, 2019)
| | 1 Year | 3 Year | Since Inception(1) | Expense Ratio |
| Gross(2) | Net(2) |
| Class A (NAV) | 11.53% | 14.64% | 8.30% | 2.10% | 1.35% |
| Class A (MOP) | 6.25% | 12.81% | 7.19% | 2.10% | 1.35% |
| Russell MidCap® Growth Index(3) | 17.64% | 16.78% | 12.28% | | |
| Russell 3000® Growth Index(4) | 16.61% | 18.40% | 14.27% | | |
| Class C (NAV) | 10.66%(5) | 13.88% | 7.54% | 2.75% | 2.00% |
| Class C (CDSC) | 9.80% | 13.88% | 7.54% | 2.75% | 2.00% |
| Russell MidCap® Growth Index(3) | 17.64% | 16.78% | 12.28% | | |
| Russell 3000® Growth Index(4) | 16.61% | 18.40% | 14.27% | | |
| Investor Class | 11.41% | 14.56% | 8.21% | 2.17% | 1.40% |
| Russell MidCap® Growth Index(3) | 17.64% | 16.78% | 12.28% | | |
| Russell 3000® Growth Index(4) | 16.61% | 18.40% | 14.27% | | |
| Institutional Class | 11.81% | 14.96% | 8.58% | 1.80% | 1.05% |
| Russell MidCap® Growth Index(3) | 17.64% | 16.78% | 12.28% | | |
| Russell 3000® Growth Index(4) | 16.61% | 18.40% | 14.27% | | |
The performance quoted represents past performance, does not guarantee future results and current performance may be lower or higher than the data quoted. The investment return and principal value of an investment will fluctuate so that shares, when redeemed, may be worth more or less than their original cost. Performance data current to the most recent month end may be obtained at www.emeraldmutualfunds.com.
Returns for periods less than 1 year are cumulative.
The table does not reflect the deduction of taxes that a shareholder would pay on Fund distributions or the redemption of Fund shares.
Subject to investment risks, including possible loss of the principal amount invested.
Maximum Offering Price (MOP) for Class A shares includes the Fund's maximum sales charge of 4.75%. Performance shown at NAV does not include these sales charges and would have been lower had it been taken into account.
A Contingent Deferred Sales Charge (CDSC) of 1.00% may apply to Class C shares redeemed within the first 12 months after a purchase.
| (1) | Inception Date – August 1, 2014. |
| (2) | Emerald Mutual Fund Advisers Trust ("Emerald" or the "Adviser") has agreed contractually to waive a portion of its fees and reimburse other expenses until August 31, 2019 in amounts necessary to limit the Fund's operating expenses (exclusive of Acquired Fund Fees and Expenses, brokerage expenses, interest expenses, taxes and extraordinary expense) for Class A, Class C, Institutional Class, and Investor Class shares to an annual rate (as percentage of the Fund's average daily net assets) of 1.35%, 2.00%, 1.05% and 1.40% respectively. The Adviser will be permitted to recover, on a class-by-class basis, expenses it has borne through the agreement described above to the extent that the Fund's expenses in later periods fall below the annual rates set forth in the relevant agreement. The Fund will not be obligated to pay any such deferred fees and expenses more than three years after the year(s) in which the fees and expense were incurred. The Adviser may not discontinue this waiver prior to August 31, 2019, without the approval by the Fund's Board of Trustees. Ratios as of the Prospectus dated August 31, 2018 and may differ from the ratios presented in the Financial Highlights. |
| (3) | The Russell MidCap®Growth Index measures the performance of the mid-cap growth segment of the U.S. equity universe. It includes those Russell Midcap Index companies with higher price-to-book ratios and higher forecasted growth values. The Index is not actively managed and does not reflect any deductions for fees, expenses or taxes. An investor may not invest directly into the Index. |
| 14 | www.emeraldmutualfunds.com |
| Emerald Insights Fund | Manager Commentary |
April 30, 2019 (Unaudited)
| (4) | The Russell 3000® Growth Index is a market capitalization weighted index based on the Russell 3000® index. The Russell 3000® Growth Index includes companies that display signs of above average growth. The index is used to provide a gauge of the performance of growth stocks in the United States. The Index is not actively managed and does not reflect any deductions for fees, expenses or taxes. An investor may not invest directly into the Index. |
| (5) | Excludes adjustments in accordance with accounting principles generally accepted in the United States of America and as such, the net asset value and total return for shareholder transactions reported to the market may differ from the net asset value for financial reporting purposes. |
Important Risks
Investing in smaller companies generally will present greater investment risks, including: greater price volatility, greater sensitivity to changing economic conditions and less liquidity than the securities of larger, more mature companies.
| Annual Report | April 30, 2019 | 15 |
| Emerald Insights Fund | Manager Commentary |
April 30, 2019 (Unaudited)
GROWTH OF $10,000 INVESTMENT IN THE FUND (for the period ended April 30, 2019)
Comparison of change in value of a $10,000 investment (includes applicable sales loads)
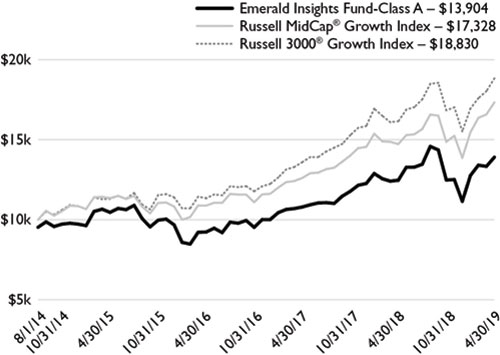
The chart represents historical performance of a hypothetical investment of $10,000 in the Fund since inception. Past performance does not guarantee future results. This chart does not reflect the deduction of taxes that a shareholder would pay on Fund distributions or the redemption of Fund shares.
Investing in the Fund is subject to investment risks, including possible loss of the principal amount invested.
| 16 | www.emeraldmutualfunds.com |
| Emerald Banking and Finance Fund | Manager Commentary |
April 30, 2019 (Unaudited)
April 30, 2019
Dear Shareholders:
Investment Results:
The Emerald Banking & Finance Fund Class A shares (without sales load) underperformed the Russell 2000® Index for the twelve months ended April 30, 2019, returning (-10.65)% vs. 4.61% for the Index. During the twelve months ended April 30, 2019, the Russell 2000® Financial Services Index returned 4.06%; the SNL Small Cap U.S. Bank & Thrift Index gained (-7.28)% versus a 13.21% gain delivered by the Standard & Poor’s 500® Index and a gain of 2.19% for the Russell 2000® Value Index.
Uncertainty continues to rule “bank land.” Will the yield curve invert? Will the Fed raise rates in 2019? Will the Federal Reserve (the “Fed”) cut rates? Will the strong U.S. dollar come home to roost? Will there be a trade deal with China? Iran...Venezuela…North Korea, etcetera, etcetera, etcetera.
The volatile ride continued in Q1’19 as the financial sector mounted a strong rebound from the dismal Q4’18 performance with the Emerald Banking and Finance Fund having rebounded 19.22% (without sales load) from the bottom of December 24, 2018 through February 22, 2019 before the yield curve inversion discussion took center stage and drove a late-quarter decline, resulting in a 6.09% Q1’19 return (-11.14% from the December 24th bottom) for the Emerald Banking and Finance Fund versus a 11.93% return for the Russell 2000® Value Index and a 4.47% return for the SNL Small Cap Bank Index.
Valuations remain attractive. Even at the peak of the rebound in Q1, valuations Price-to-Earnings (P/E) Ratio remained attractive with many community banks trading below historical levels and now have drifted back to levels seen at the end of 2018. Investors have soured on the sector given uncertainty in the market based on the yield curve, global growth concerns and select calls for rate cuts.
Investment Analysis:
After three consecutive quarters-over-quarter increases, net interest margins for U.S. banks and thrifts compressed in the first quarter, signaling that the sector already may be past a cyclical peak. In contrast to more recent quarters, banks were not able to offset escalating funding costs by ratcheting up yields. The aggregate first quarter yield on loans and leases was 5.49%, down 3 basis points from the fourth quarter of 2018.
Overall profitability has been in a relatively tight range in the last four quarters. Aggregate quarterly net income has held between $59 billion and $62 billion, while the industry’s return on average equity has ranged from 11.85% to 12.47%.
Similar to net interest margin, loan growth in the sector also may have reached a turning point in the first quarter. Total loans for the sector fell 0.1% on a quarter-over-quarter basis, representing the first quarterly decline in two years.
Credit quality across the industry continued to pose little near term concern. The early stage delinquency ratio declined 1 basis point quarter-over- quarter to 0.63%. The ratio for nonperforming assets and net charge offs were flat quarter-over-quarter. However, as we have stated many times, community banks, regional banks and money center banks are different animals and we must take a closer look at the community bank sector and how it has recently performed.
According to Standard & Poors Global Research, community banks under $10 billion in assets reported a year-over-year decrease in profitability for the first quarter of 2019, based on an analysis of results reported through April 26th.
The median return on average equity among the 226 publicly traded banks and thrifts in the analysis was 9.97% for the quarter, down from 10.20% in the year ago period. The group’s median net interest margin fell to 3.59% from 3.60%, and the median efficiency ratio was 62.43%, compared to 63.01% in the year ago quarter.
The group’s median net charge off ratio rose to 0.04% from 0.03%. As a group, the 226 banks posted a median 8.9% year-over-year increase in loans in the first quarter compared to a 10.9% increase in the prior year period. Deposits grew by a median 8.3% year-over-year, down from an 8.9% increase in the year ago quarter.
Market Outlook:
We believe that the set-up for the next 12 months for the bank sector is the “haziest” we have seen in some time. While we believe that deregulation, solid credit quality, strong earnings power and merger activity remains intact, there are several exogenous factors that may over shadow the fundamentals in the banking sector.
At the end of April, another round of weaker inflation figures began once again the debate about whether the Fed would cut interest rates in 2019. The recent report revealed that inflation slowed to 1.6% in March, its third consecutive decline and was once again below the central bank’s 2% goal. Since then, a tool from the CME Group shows a majority of interest rate traders expect a rate cut from the current range of 2.25% to 2.50% as
| Annual Report | April 30, 2019 | 17 |
| Emerald Banking and Finance Fund | Manager Commentary |
April 30, 2019 (Unaudited)
soon as September. However, we do not expect the Fed to react to one or two soft core inflation readings. We believe that inflation will gradually trend back to the Fed’s 2% target.
We believe that the U.S. economy has continued growing despite concerns in recent months that the expansion was nearing an end. In recent weeks, the spread between the 10-year Treasury note and the 3-month bills were negative between March 22nd and March 28th, sparking fears of a recession and concern for banks’ profitability, which relies to a certain extent on their ability to borrow at the short end of the curve and lend at the longer end. Yes, an inverted curve has historically preceded recessions but the inversion was short lived this time and the yield on the 10-year Treasury note was 2.51% on April 30th, 8 basis points above 3-month bills, compared with a spread of 1 basis point a month earlier.
Bank merger and acquisition (M&A) activity remains robust albeit slower than what we experienced in 2018. Year to date through May 2nd, 68 U.S. bank and thrift deals have been announced, down from 85 in the same period in 2018, while total deal value has surged to $35.84 billion from $6.38 billion in the same period of 2018, thanks to the $28.19 billion merger of BB&T Corp. and SunTrust Banks, Inc. announced February 7th. At the same time, the median deal value to tangible book value has decreased to 158.2% from 174.4% from the 2018 period.
We do believe that deal pace will gain strength as the year continues. From April 1st through May 2nd, 16 deals were announced, for a combined deal value of $928.3 million and a median deal value to tangible book value ratio of 156.3%. We believe deal values have trended lower given the lower price to tangible book value in the bank space.
With the increase in short term rates over the last few years, many CDs now carry rates that gain attention from potential deposits. Banks increasingly have relied on certificate of deposits as they seek to attract new funds and meet growing customer demands. In the fourth quarter of 2018, CD’s grew by 23.4% for banks with assets between $10 billion in assets and $50 billion but only 10% for community banks between $1 billion in assets and up to $10 billion. We believe the recent cost has come at a price to net interest margins since CDs usually carry higher rates than deposit products and tend to be more rate sensitive when they mature. Among banks with assets between $1 billion and $10 billion, the average rate on a 1-year CD rose by 7 basis points between December 14, 2018 and March 8, 2019. That compares to only a 1 basis point increase in the 1-year CD rate for banks between $10 billion in assets and $50 billion. We would highlight banks between $1 billion in assets and $5 billion in assets were the only sub category (by asset size) to increase their net interest margin during the first quarter of 2019 as deposit beats slowed overall. We believe that the growth in deposit betas for community banks will continue to slow for the remainder of 2019 and do not expect much further deterioration in net interest margins for the group.
On several positive notes we remain upbeat on our expectation for loan and deposit growth. While loan growth will slow slightly from 2018 we believe that double digit loan growth is achievable for community banks with assets below $10 billion. Despite the first quarter being historically a seasonally slow quarter banks with assets between $1 billion and $5 billion were able to post 9.1% loan growth. This gives us confidence in our 2019 expectations for loan growth. Even more impressive was that the same community banks were able to generate 8.7% in deposit growth in the first quarter to fund the loan growth all while improving net interest margin, according to S&P Global.
Bank stocks are lacking momentum, trading at less than 11x forward earnings despite net interest margins holding steady, double digit loan growth expectations for the year, clean credit quality, slowing deposit betas, and profitability that although down slightly for the group year-over-year we expect return on average assets to hang steady with Q1’19 results for the most part in 2019. We believe bank multiples are more attractive than this time last year and while there has been some slow-down in growth, we cannot overlook the strong returns on capital and active capital deployment by many that should provide upside to the sector.
Our focus remains on seeking companies capable of producing above average organic growth, relatively stable net interest margins, and improving earnings power aided by lower efficiency ratios, with potential for accretive mergers & acquisitions activity, as we deploy Emerald’s 10-Step research process to seek out companies in this market environment that is poised for the potential of higher short-term interest rates.
| Top Contributors | Top Detractors |
| LendingTree, Inc. | FCB Financial Holdings, Inc. Class A |
| Innovative Industrial Properties Inc | First Internet Bancorp |
| NMI Holdings, Inc. Class A | Equity Bancshares, Inc. Class A |
| Q2 Holdings, Inc. | RBB Bancorp |
| Worldpay, Inc. Class A | CURO Group Holdings Corp. |
| | |
| Kenneth G. Mertz II, CFA | Steven E. Russell, Esq. |
| Chief Investment Officer | Portfolio Manager |
| Portfolio Manager | |
Emerald Mutual Fund Advisers Trust
| 18 | www.emeraldmutualfunds.com |
| Emerald Banking and Finance Fund | Manager Commentary |
April 30, 2019 (Unaudited)
Past performance does not guarantee future results. Fund prices fluctuate as the underlying assets have exposure to market fluctuations and other risks, as described in the Fund’s prospectus. Please visit www.emeraldmutualfunds.com to obtain current performance information and for the current prospectus and statement of additional information. This material must be preceded or accompanied by a prospectus. Please read the prospectus carefully before investing.
The views of Emerald Mutual Fund Advisers Trust and information discussed in this commentary are as of the date of publication, are subject to change, and may not reflect the writer's current views. The views expressed are those of the author only, and represent an assessment of market conditions at a specific point in time, are opinions only and should not be relied upon as investment advice regarding a particular investment or markets in general. Such information does not constitute a recommendation to buy or sell specific securities or investment vehicles. It should not be assumed that any investment will be profitable or will equal the performance of the Fund or any securities or any sectors mentioned in this letter. The subject matter contained in this letter has been derived from several sources believed to be reliable and accurate at the time of compilation. Neither Emerald Mutual Fund Advisers Trust nor the Fund accepts any liability for losses either direct or consequential caused by the use of this information.
The Emerald Banking and Finance Fund is distributed by ALPS Distributors, Inc.
The Fund is subject to investment risks, including possible loss of the principal amount invested and therefore is not suitable for all investors. The Fund may not achieve its objectives.
Diversification does not eliminate the risk of experiencing investment losses.
The Russell 2000®Index measures the performance of the small-cap segment of the U.S. equity universe. The Russell 2000®Index is a subset of the Russell 3000®Index representing approximately 10% of the total market capitalization of that index. It includes approximately 2000 of the smallest securities based on a combination of their market cap and current index membership. The Index is not actively managed and does not reflect any deduction of fees, expenses or taxes. An investor may not invest directly into the Index.
The Russell 2000® Financial Services Index – is comprised of the smallest financial services companies in the Russell 3000 Index. The Index is not actively managed and does not reflect any deductions for fees, expense, or taxes. An investor may not invest directly in the Index.
SNL Small Cap Bank & Thrift Index: Includes all publicly traded (NYSE, NYSE Amex, NASDAQ, OTC BB, Pink Sheets) Banks and Thrifts in SNL's coverage universe with $250M to $1B Total Common Market Capitalization as of most recent pricing data. Source: SNL Financial, data as of April 30, 2019.
The Standard & Poor’s 500®Index is an unmanaged index of 500 common stocks chosen for the market size, liquidity and industry group representation. It is a market-value weighted index. The Index is not actively managed and does not reflect any deduction for fees, expenses or taxes. An investor may not invest directly into the Index
The Russell 2000® Value Index measures the performance of small-cap value segment of the U.S. equity universe. It includes those Russell 2000 companies with lower price-to-book ratios (A ratio used to compare a stock's market value to its book value. It is calculated by dividing the current closing price of the stock by the latest quarter's book value per share.) and lower forecasted growth values. The Index is not actively managed and does not reflect any deductions for fees, expenses or taxes. An investor may not invest directly into the Index.
A yield curve is a line that plots the interest rates, at a set point in time, of bonds having equal credit quality but differing maturity dates. The most frequently reported yield curve compares the three-month, two-year, five-year and 30-year U.S. Treasury debt. This yield curve is used as a benchmark for other debt in the market, such as mortgage rates or bank lending rates, and it is also used to predict changes in economic output and growth.
| Annual Report | April 30, 2019 | 19 |
| Emerald Banking and Finance Fund | Manager Commentary |
April 30, 2019 (Unaudited)
TOP TEN HOLDINGS
(as a % of Net Assets)*
| Meta Financial Group, Inc. | 3.41% |
| Innovative Industrial Properties, Inc. | 3.26% |
| Merchants Bancorp | 3.08% |
| Mercantil Bank Holding Corp. | 2.95% |
| Triumph Bancorp, Inc. | 2.92% |
| Bank of NT Butterfield & Son, Ltd. | 2.91% |
| CBTX, Inc. | 2.80% |
| Bancorp, Inc. | 2.73% |
| Metropolitan Bank Holding Corp. | 2.68% |
| Esquire Financial Holdings, Inc. | 2.59% |
| Top Ten Holdings | 29.33% |
INDUSTRY SECTOR ALLOCATION
(as a % of Net Assets)
| Banks: Diversified | 73.37% |
| Banks: Savings, Thrift & Mortgage Lending | 9.90% |
| Consumer Lending | 4.22% |
| Equity REIT- Industrial | 3.26% |
| Computer Services Software & Systems | 2.09% |
| Insurance: Property-Casualty | 1.36% |
| Diversified Financial Services | 1.32% |
| Precious Metals & Minerals | 1.32% |
| Commercial Finance & Mortgage Companies | 1.15% |
| Financial Data & Systems | 0.97% |
| Insurance: Multi-Line | 0.42% |
| Banks | 0.17% |
| Commercial Services | 0.02% |
| Cash, Cash Equivalents, & Other Net Assets | 0.43% |
| * | Holdings are subject to change, and may not reflect the current or future position of the portfolio. |
ANNUALIZED TOTAL RETURN (for the period ended April 30, 2019)
| | | | | | Since | Expense Ratio |
| | 1 Year | 3 Year | 5 Year | 10 Year | Inception(1) | Gross(2) | Net(2) |
| Class A (NAV) | -10.65% | 10.54% | 10.10% | 12.50% | 8.71% | 1.42% | 1.42% |
| Class A (MOP) | -14.89% | 8.76% | 9.03% | 11.95% | 8.47% | 1.42% | 1.42% |
| Russell 2000® Index(3) | 4.61% | 13.60% | 8.63% | 14.10% | 8.21% | | |
| Russell 2000® Financial Services Index(4) | 4.06% | 12.14% | 9.94% | 13.19% | 8.58% | | |
| Class C (NAV) | -11.21% | 9.83% | 9.39% | 11.78% | 8.74% | 2.07% | 2.07% |
| Class C (CDSC) | -11.89% | 9.83% | 9.39% | 11.78% | 8.74% | 2.07% | 2.07% |
| Russell 2000® Index(3) | 4.61% | 13.60% | 8.63% | 14.10% | 8.21% | | |
| Russell 2000® Financial Services Index(4) | 4.06% | 12.14% | 9.94% | 13.19% | 8.58% | | |
| Investor Class | -10.64% | 10.57% | 10.11% | – | 11.62% | 1.47% | 1.47% |
| Russell 2000® Index(3) | 4.61% | 13.60% | 8.63% | 14.10% | 8.21% | | |
| Russell 2000® Financial Services Index(4) | 4.06% | 12.14% | 9.94% | 13.19% | 8.58% | | |
| Institutional Class | -10.30% | 10.92% | 10.46% | – | 14.16% | 1.12% | 1.12% |
| Russell 2000® Index(3) | 4.61% | 13.60% | 8.63% | 14.10% | 8.21% | | |
| Russell 2000® Financial Services Index(4) | 4.06% | 12.14% | 9.94% | 13.19% | 8.58% | | |
The performance quoted represents past performance, does not guarantee future results and current performance may be lower or higher than the data quoted. The investment return and principal value of an investment will fluctuate so that shares, when redeemed, may be worth more or less than their original cost. Performance data current to the most recent month end may be obtained at www.emeraldmutualfunds.com.
Performance shown for periods prior to March 16, 2012, reflects the performance of the Forward Banking & Finance Fund, a series of Forward Funds (as a result of a reorganization of the Forward Banking & Finance Fund into the Emerald Banking & Finance Fund).
Returns for periods less than 1 year are cumulative.
The table does not reflect the deduction of taxes that a shareholder would pay on Fund distributions or the redemption of Fund shares.
Subject to investment risks, including possible loss of the principal amount invested.
Maximum Offering Price (MOP) for Class A shares includes the Fund's maximum sales charge of 4.75%. Performance shown at NAV does not include these sales charges and would have been lower had it been taken into account.
A Contingent Deferred Sales Charge (CDSC) of 1.00% may apply to Class C shares redeemed within the first 12 months after a purchase.
| (1) | Inception Dates - Class A: 02/18/1997, Class C: 07/01/2000, Institutional Class: 03/19/2012, Investor Class: 03/16/2010 |
| (2) | Emerald Mutual Fund Advisers Trust (“Emerald” or the “Adviser”) has agreed contractually to waive a portion of its fees and reimburse other expenses until August 31, 2019 in amounts necessary to limit the Fund's operating expenses (exclusive of Acquired Fund Fees and Expenses, brokerage expenses, interest expenses, taxes and extraordinary expense) for Class A, Class C, Institutional Class, and Investor Class shares to an annual rate (as percentage of the Fund's average daily net assets) of 1.84%, 2.49%, 1.54% and 1.89% respectively. The Adviser will be permitted to recover, on a class-by-class basis, expenses it has borne through the agreement described above to the extent |
| 20 | www.emeraldmutualfunds.com |
| Emerald Banking and Finance Fund | Manager Commentary |
April 30, 2019 (Unaudited)
that the Fund's expenses in later periods fall below the annual rates set forth in the relevant agreement. The Fund will not be obligated to pay any such deferred fees and expenses more than three years after the year(s) in which the fees and expense were incurred. The Adviser may not discontinue this waiver prior to August 31, 2019, without the approval by the Fund's Board of Trustees. Ratios as of the Prospectus dated August 31, 2018 and may differ from the ratios presented in the Financial Highlights.
| (3) | The Russell 2000® Index measures the performance of the small-cap segment of the U.S. equity universe. The Russell 2000® is a subset of the Russell 3000® Index representing approximately 8% of the total market capitalization of that index. It includes approximately 2000 of the smallest securities based on a combination of their market cap and current index membership. The index is not actively managed and does not reflect any deductions for fees, expenses or taxes. An investor may not invest directly into an index. |
| (4) | The Russell 2000® Financial Services Index is an additional index, and is comprised of the smallest financial services companies in the Russell 3000 Index. The Index is not actively managed and does not reflect any deductions for fees, expense, or taxes. An investor may not invest directly in the Index. |
Important Risks
A fund that concentrates in a particular industry will involve a greater degree of risk than a fund with a more diversified portfolio. Investing in smaller companies generally will present greater investment risks, including: greater price volatility, greater sensitivity to changing economic conditions and less liquidity than the securities of larger, more mature companies.
| Annual Report | April 30, 2019 | 21 |
| Emerald Banking and Finance Fund | Manager Commentary |
April 30, 2019 (Unaudited)
GROWTH OF $10,000 INVESTMENT IN THE FUND (for the period ended April 30, 2019)
Comparison of change in value of a $10,000 investment (includes applicable sales loads)
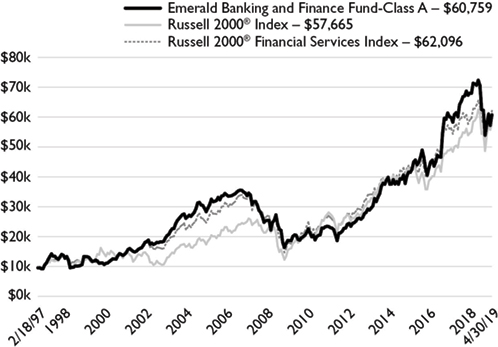
The chart represents historical performance of a hypothetical investment of $10,000 in the Fund since inception. Past performance does not guarantee future results. This chart does not reflect the deduction of taxes that a shareholder would pay on Fund distributions or the redemption of Fund shares.
Investing in the Fund is subject to investment risks, including possible loss of the principal amount invested.
| 22 | www.emeraldmutualfunds.com |
| Emerald Funds | Disclosure of Fund Expenses |
April 30, 2019 (Unaudited)
As a shareholder of the Funds, you incur two types of costs: (1) transaction costs, including applicable sales charges (loads); and (2) ongoing costs, including management fees, distribution and service (12b-1) fees, shareholder services fees and other Fund expenses. This example is intended to help you understand your ongoing costs (in dollars) of investing in the Funds and to compare these costs with the ongoing costs of investing in other mutual funds. The example is based on an investment of $1,000 invested at the beginning of the (six-month) period and held for the entire period November 1, 2018 through April 30, 2019.
Actual Expenses
The first line for each share class of the Fund in the table below provides information about actual account values and actual expenses. You may use this information, together with the amount you invested, to estimate the expenses that you paid over the period. Simply divide your account value by $1,000 (for example, an $8,600 account value divided by $1,000 = 8.6), then multiply the result by the number in the applicable line under the heading titled “Expenses Paid During Period” to estimate the expenses you paid on your account during this period.
Hypothetical Example For Comparison Purposes
The second line for each share class of each Fund in the table below provides information about hypothetical account values and hypothetical expenses based on the Fund’s actual expense ratio and an assumed rate of return of 5% per year before expenses, which is not the Fund’s actual return. The hypothetical account values and expenses may not be used to estimate the actual ending account balance or expenses you paid for the period. You may use this information to compare the ongoing costs of investing in the Funds and other funds. To do so, compare this 5% hypothetical example with the 5% hypothetical examples that appear in the shareholder reports of other mutual funds.
Please note that the expenses shown in the table below are meant to highlight your ongoing costs only and do not reflect any transactional costs, such as sales charges (loads), redemption fees or exchange fees. Therefore, the second line for each share class of the Fund within the table is useful in comparing ongoing costs only, and will not help you determine the relative total costs of owning different funds. If these transactional costs were included, your costs would have been higher.
| Emerald Growth Fund | Beginning
Account Value
11/01/18 | Ending
Account Value
04/30/19 | Expense
Ratio(a) | Expense Paid
During Period
11/01/18 - 4/30/19(b) |
| Class A | | | | |
| Actual | $1,000.00 | $1,117.10 | 1.02% | $5.35 |
| Hypothetical (5% return before expenses) | $1,000.00 | $1,019.74 | 1.02% | $5.11 |
| Class C | | | | |
| Actual | $1,000.00 | $1,113.80 | 1.67% | $8.75 |
| Hypothetical (5% return before expenses) | $1,000.00 | $1,016.51 | 1.67% | $8.35 |
| Institutional Class | | | | |
| Actual | $1,000.00 | $1,119.20 | 0.70% | $3.68 |
| Hypothetical (5% return before expenses) | $1,000.00 | $1,021.32 | 0.70% | $3.51 |
| Investor Class | | | | |
| Actual | $1,000.00 | $1,117.20 | 1.05% | $5.51 |
| Hypothetical (5% return before expenses) | $1,000.00 | $1,019.59 | 1.05% | $5.26 |
| | | | | |
| Emerald Small Cap Value Fund | | | | |
| Class A | | | | |
| Actual | $1,000.00 | $1,034.90 | 1.35% | $6.81 |
| Hypothetical (5% return before expenses) | $1,000.00 | $1,018.10 | 1.35% | $6.76 |
| Class C | | | | |
| Actual | $1,000.00 | $1,032.00 | 2.00% | $10.08 |
| Hypothetical (5% return before expenses) | $1,000.00 | $1,014.88 | 2.00% | $9.99 |
| Institutional Class | | | | |
| Actual | $1,000.00 | $1,036.80 | 1.00% | $5.05 |
| Hypothetical (5% return before expenses) | $1,000.00 | $1,019.84 | 1.00% | $5.01 |
| Investor Class | | | | |
| Actual | $1,000.00 | $1,036.10 | 1.26% | $6.36 |
| Hypothetical (5% return before expenses) | $1,000.00 | $1,018.55 | 1.26% | $6.31 |
| Annual Report | April 30, 2019 | 23 |
| Emerald Funds | Disclosure of Fund Expenses |
April 30, 2019 (Unaudited)
| Emerald Insights Fund | Beginning
Account Value
11/01/18 | Ending
Account Value
04/30/19 | Expense
Ratio(a) | Expense Paid
During Period
11/01/18 - 4/30/19(b) |
| Class A | | | | |
| Actual | $1,000.00 | $1,113.60 | 1.35% | $7.07 |
| Hypothetical (5% return before expenses) | $1,000.00 | $1,018.10 | 1.35% | $6.76 |
| Class C | | | | |
| Actual | $1,000.00 | $1,109.20 | 2.00% | $10.46 |
| Hypothetical (5% return before expenses) | $1,000.00 | $1,014.88 | 2.00% | $9.99 |
| Institutional Class | | | | |
| Actual | $1,000.00 | $1,114.70 | 1.05% | $5.51 |
| Hypothetical (5% return before expenses) | $1,000.00 | $1,019.59 | 1.05% | $5.26 |
| Investor Class | | | | |
| Actual | $1,000.00 | $1,113.30 | 1.40% | $7.34 |
| Hypothetical (5% return before expenses) | $1,000.00 | $1,017.85 | 1.40% | $7.00 |
| | | | | |
| Emerald Banking and Finance Fund | | | | |
| Class A | | | | |
| Actual | $1,000.00 | $972.80 | 1.46% | $7.14 |
| Hypothetical (5% return before expenses) | $1,000.00 | $1,017.55 | 1.46% | $7.30 |
| Class C | | | | |
| Actual | $1,000.00 | $969.80 | 2.11% | $10.31 |
| Hypothetical (5% return before expenses) | $1,000.00 | $1,014.33 | 2.11% | $10.54 |
| Institutional Class | | | | |
| Actual | $1,000.00 | $974.90 | 1.11% | $5.44 |
| Hypothetical (5% return before expenses) | $1,000.00 | $1,019.29 | 1.11% | $5.56 |
| Investor Class | | | | |
| Actual | $1,000.00 | $972.80 | 1.48% | $7.24 |
| Hypothetical (5% return before expenses) | $1,000.00 | $1,017.46 | 1.48% | $7.40 |
| (a) | The Fund's expense ratios have been based on the Fund's most recent fiscal half-year expenses. |
| (b) | Expenses are equal to the Fund's annualized expense ratio multiplied by the average account value over the period, multiplied by the number of days in the most recent fiscal half-year (181)/365 (to reflect the half-year period). |
| 24 | www.emeraldmutualfunds.com |
| Emerald Growth Fund | Schedule of Investments |
April 30, 2019
| Shares | | | | Value
(Note 2) |
| COMMON STOCKS: 98.43% | | |
| Consumer Discretionary: 20.31% | | | | |
| | 768,349 | | American Eagle Outfitters, Inc. | | $ | 18,271,339 | |
| | 1,044,667 | | Chegg, Inc.(a) | | | 37,242,379 | |
| | 164,826 | | Children's Place, Inc. | | | 18,595,669 | |
| | 163,065 | | Churchill Downs, Inc. | | | 16,445,105 | |
| | 202,299 | | Chuy's Holdings, Inc.(a) | | | 4,023,727 | |
| | 512,123 | | Del Taco Restaurants, Inc.(a) | | | 5,146,836 | |
| | 144,218 | | Eldorado Resorts, Inc.(a) | | | 7,120,043 | |
| | 159,521 | | Etsy, Inc.(a) | | | 10,774,048 | |
| | 211,882 | | Five Below, Inc.(a) | | | 31,017,406 | |
| | 121,037 | | Instructure, Inc.(a) | | | 5,214,274 | |
| | 74,934 | | Jack in the Box, Inc. | | | 5,777,412 | |
| | 249,281 | | Marcus Corp. | | | 9,377,951 | |
| | 161,103 | | Meritage Homes Corp.(a) | | | 8,240,419 | |
| | 575,849 | | Noodles & Co.(a) | | | 4,117,320 | |
| | 198,716 | | Ollie's Bargain Outlet Holdings, Inc.(a) | | | 19,005,198 | |
| | 385,313 | | Planet Fitness, Inc., Class A(a) | | | 29,168,194 | |
| | 644,198 | | SeaWorld Entertainment, Inc.(a) | | | 17,148,551 | |
| | 455,511 | | Steven Madden, Ltd. | | | 16,557,825 | |
| | 370,375 | | Tilly's, Inc., Class A | | | 4,355,610 | |
| | 105,120 | | Urban Outfitters, Inc.(a) | | | 3,125,218 | |
| | 232,706 | | YETI Holdings, Inc.(a) | | | 8,302,950 | |
| | | | | | | 279,027,474 | |
| | | | | | | | |
| Consumer Staples: 2.57% | | | | |
| | 469,817 | | Freshpet, Inc.(a) | | | 20,982,027 | |
| | 637,889 | | Simply Good Foods Co.(a) | | | 14,326,987 | |
| | | | | | | 35,309,014 | |
| | | | | | | | |
| Consumer, Non-cyclical: 1.12% | | | | |
| | 31,159 | | Addus HomeCare Corp.(a) | | | 2,115,696 | |
| | 853,513 | | ArQule, Inc.(a) | | | 5,095,473 | |
| | 373,347 | | Radius Health, Inc.(a) | | | 8,221,101 | |
| | | | | | | 15,432,270 | |
| | | | | | | | |
| Energy: 1.55% | | | | |
| | 204,967 | | Callon Petroleum Co.(a) | | | 1,539,302 | |
| | 113,096 | | Delek US Holdings, Inc. | | | 4,191,338 | |
| | 425,000 | | Enphase Energy, Inc.(a) | | | 4,267,000 | |
| | 478,011 | | New Fortress Energy LLC(a) | | | 6,003,818 | |
| | 158,100 | | Viper Energy Partners LP | | | 5,315,322 | |
| | | | | | | 21,316,780 | |
| | | | | | | | |
| Financial Services: 12.00% | | | | |
| | 98,484 | | Bryn Mawr Bank Corp. | | | 3,751,256 | |
| | 1,040,117 | | Cadence BanCorp | | | 23,662,662 | |
| | 442,061 | | CenterState Bank Corp. | | | 10,910,065 | |
| | 55,159 | | CNB Financial Corp. | | | 1,570,928 | |
| | 165,316 | | eHealth, Inc.(a) | | | 10,041,294 | |
| | 1,011,100 | | Everi Holdings, Inc.(a) | | | 10,404,219 | |
| | 146,592 | | Evo Payments, Inc., Class A(a) | | | 4,355,248 | |
| | 122,502 | | First Choice Bancorp | | | 2,604,393 | |
| Shares | | | | Value
(Note 2) |
| Financial Services (continued) | | | | |
| | 218,570 | | Green Dot Corp., Class A(a) | | $ | 13,938,209 | |
| | 439,087 | | Industrial Logistics Properties Trust | | | 8,715,877 | |
| | 58,041 | | LendingTree, Inc.(a) | | | 22,335,338 | |
| | 303,990 | | Moelis & Co., Class A | | | 12,448,390 | |
| | 544,605 | | Monmouth Real Estate Investment Corp. | | | 7,482,873 | |
| | 349,268 | | OceanFirst Financial Corp. | | | 8,794,568 | |
| | 172,312 | | Opus Bank | | | 3,768,463 | |
| | 448,774 | | Pacific Premier Bancorp, Inc. | | | 13,045,860 | |
| | 191,196 | | Union Bankshares Corp. | | | 6,978,654 | |
| | | | | | | 164,808,297 | |
| | | | | | | | |
| Health Care: 22.95% | | | | |
| | 125,000 | | Acer Therapeutics, Inc.(a) | | | 2,446,250 | |
| | 347,439 | | Adamas Pharmaceuticals, Inc.(a) | | | 2,195,814 | |
| | 485,065 | | Aimmune Therapeutics, Inc.(a) | | | 9,769,209 | |
| | 231,410 | | Arena Pharmaceuticals, Inc.(a) | | | 10,587,008 | |
| | 251,404 | | Assembly Biosciences, Inc.(a) | | | 3,967,155 | |
| | 269,960 | | AtriCure, Inc.(a) | | | 8,104,199 | |
| | 318,288 | | Avrobio, Inc.(a) | | | 5,986,997 | |
| | 1,035,252 | | BioDelivery Sciences International, Inc.(a) | | | 5,000,267 | |
| | 286,770 | | Biohaven Pharmaceutical Holding Co., Ltd.(a) | | | 17,163,185 | |
| | 224,593 | | Deciphera Pharmaceuticals, Inc.(a) | | | 5,165,639 | |
| | 552,950 | | Dicerna Pharmaceuticals, Inc.(a) | | | 7,166,232 | |
| | 200,000 | | Eloxx Pharmaceuticals, Inc.(a) | | | 2,388,000 | |
| | 89,307 | | Haemonetics Corp.(a) | | | 7,794,715 | |
| | 725,347 | | Horizon Pharma PLC(a) | | | 18,518,109 | |
| | 28,843 | | Inogen, Inc.(a) | | | 2,517,994 | |
| | 511,830 | | Insmed, Inc.(a) | | | 15,580,105 | |
| | 199,283 | | Integer Holdings Corp.(a) | | | 13,768,462 | |
| | 84,038 | | Intercept Pharmaceuticals, Inc.(a) | | | 7,242,395 | |
| | 175,400 | | IntriCon Corp.(a) | | | 4,099,098 | |
| | 833,486 | | Karyopharm Therapeutics, Inc.(a) | | | 3,892,380 | |
| | 49,481 | | LivaNova PLC(a) | | | 3,408,746 | |
| | 145,140 | | Merit Medical Systems, Inc.(a) | | | 8,153,965 | |
| | 1,102,288 | | NeoGenomics, Inc.(a) | | | 22,960,659 | |
| | 2,490,000 | | Oncocyte Corp.(a) | | | 10,707,000 | |
| | 305,344 | | Portola Pharmaceuticals, Inc.(a) | | | 10,778,643 | |
| | 166,960 | | PTC Therapeutics, Inc.(a) | | | 6,247,643 | |
| | 221,586 | | Reata Pharmaceuticals, Inc., Class A(a) | | | 17,385,638 | |
| | 457,185 | | Replimune Group, Inc.(a) | | | 7,666,992 | |
| | 24,665 | | Sarepta Therapeutics, Inc.(a) | | | 2,884,325 | |
| | 186,939 | | Savara, Inc.(a) | | | 1,996,509 | |
| | 104,781 | | Tabula Rasa HealthCare, Inc.(a) | | | 5,580,636 | |
| | 326,979 | | Tandem Diabetes Care, Inc.(a) | | | 20,079,780 | |
| | 348,054 | | Teladoc Health, Inc.(a) | | | 19,797,312 | |
| | 142,964 | | Twist Bioscience Corp.(a) | | | 3,382,528 | |
| | 183,015 | | Varex Imaging Corp.(a) | | | 6,010,213 | |
| | 400,000 | | Vericel Corp.(a) | | | 6,796,000 | |
| Annual Report | April 30, 2019 | 25 |
| Emerald Growth Fund | Schedule of Investments |
April 30, 2019
| Shares | | | | Value (Note 2) |
| Health Care(continued) | | | | |
| | 206,523 | | Zogenix, Inc.(a) | | $ | 8,052,332 | |
| | | | | | | 315,242,134 | |
| | | | | | | | |
| Materials & Processing: 4.27% | | | | |
| | 362,391 | | Allegheny Technologies, Inc.(a) | | | 9,030,784 | |
| | 115,799 | | Carpenter Technology Corp. | | | 5,751,736 | |
| | 56,752 | | Innospec, Inc. | | | 4,813,705 | |
| | 465,340 | | Livent Corp.(a) | | | 5,016,365 | |
| | 451,602 | | PQ Group Holdings, Inc.(a) | | | 7,139,827 | |
| | 389,399 | | Trex Co., Inc.(a) | | | 26,973,669 | |
| | | | | | | 58,726,086 | |
| | | | | | | | |
| Producer Durables: 9.46% | | | | |
| | 247,696 | | Air Transport Services Group, Inc.(a) | | | 5,828,287 | |
| | 30,109 | | Applied Industrial Technologies, Inc. | | | 1,804,733 | |
| | 151,938 | | Chart Industries, Inc.(a) | | | 13,411,567 | |
| | 280,817 | | H&E Equipment Services, Inc. | | | 8,539,645 | |
| | 117,135 | | Insperity, Inc. | | | 14,004,661 | |
| | 164,637 | | Knoll, Inc. | | | 3,595,672 | |
| | 1,161,756 | | Kratos Defense & Security Solutions, Inc.(a) | | | 18,448,685 | |
| | 179,333 | | NV5 Global, Inc.(a) | | | 11,358,952 | |
| | 147,190 | | Spirit Airlines, Inc.(a) | | | 8,004,192 | |
| | 215,416 | | Tetra Tech, Inc. | | | 13,941,724 | |
| | 319,956 | | TriNet Group, Inc.(a) | | | 19,946,057 | |
| | 415,770 | | Tutor Perini Corp.(a) | | | 8,302,927 | |
| | 422,647 | | US Xpress Enterprises, Inc., Class A(a) | | | 2,848,641 | |
| | | | | | | 130,035,743 | |
| | | | | | | | |
| Technology: 21.52% | | | | |
| | 187,500 | | Alarm.com Holdings, Inc.(a) | | | 13,290,000 | |
| | 626,079 | | Ciena Corp.(a) | | | 24,016,391 | |
| | 413,771 | | Cray, Inc.(a) | | | 10,865,627 | |
| | 96,990 | | EPAM Systems, Inc.(a) | | | 17,396,126 | |
| | 538,431 | | ForeScout Technologies, Inc.(a) | | | 22,635,639 | |
| | 1,308,511 | | Glu Mobile, Inc.(a) | | | 14,315,110 | |
| | 730,058 | | Leaf Group, Ltd.(a) | | | 6,125,187 | |
| | 157,913 | | Lumentum Holdings, Inc.(a) | | | 9,785,869 | |
| | 237,027 | | Mercury Systems, Inc.(a) | | | 17,307,712 | |
| | 362,060 | | Model N, Inc.(a) | | | 6,712,592 | |
| | 80,529 | | New Relic, Inc.(a) | | | 8,474,872 | |
| | 469,206 | | PlayAGS, Inc.(a) | | | 11,317,249 | |
| | 382,059 | | Pluralsight, Inc., Class A(a) | | | 13,559,274 | |
| | 109,050 | | Proofpoint, Inc.(a) | | | 13,677,051 | |
| | 275,369 | | Pure Storage, Inc., Class A(a) | | | 6,294,935 | |
| | 110,046 | | Q2 Holdings, Inc.(a) | | | 8,299,669 | |
| | 506,463 | | Rapid7, Inc.(a) | | | 27,521,199 | |
| | 310,063 | | SailPoint Technologies Holding, Inc.(a) | | | 8,762,380 | |
| | 386,378 | | SVMK, Inc.(a) | | | 6,916,166 | |
| | 696,516 | | USA Technologies, Inc.(a) | | | 3,949,246 | |
| | 346,261 | | Varonis Systems, Inc.(a) | | | 24,636,470 | |
| | 408,830 | | Vocera Communications, Inc.(a) | | | 13,021,236 | |
| Shares | | | | Value (Note 2) |
| Technology (continued) | | | | |
| | 98,586 | | Zscaler, Inc.(a) | | $ | 6,734,410 | |
| | | | | | | 295,614,410 | |
| | | | | | | | |
| Utilities: 2.68% | | | | |
| | 345,772 | | Boingo Wireless, Inc.(a) | | | 7,862,855 | |
| | 205,625 | | Cogent Communications Holdings, Inc. | | | 11,356,669 | |
| | 50,565 | | Shenandoah Telecommunications Co. | | | 2,089,851 | |
| | 1,590,055 | | Vonage Holdings Corp.(a) | | | 15,455,335 | |
| | | | | | | 36,764,710 | |
| | | | | | | | |
| | | | Total Common Stocks | | | | |
| | | | (Cost $971,663,565) | | | 1,352,276,918 | |
| | | | | | | | |
| SHORT TERM INVESTMENTS: 1.76% | | | | |
| | 24,179,170 | | Dreyfus Government Cash Management Fund - Institutional Class 2.303% (7-Day Yield) | | | 24,179,170 | |
| | | | | | | | |
| | | | Total Short Term Investments | | | | |
| | | | (Cost $24,179,170) | | | 24,179,170 | |
| | | | | | | | |
| Total Investments: 100.19% | | | | |
| (Cost $995,842,735) | | | 1,376,456,088 | |
| | | | | | | | |
| Liabilities In Excess Of Other Assets: (0.19)% | | | (2,657,824 | ) |
| Net Assets: 100.00% | | $ | 1,373,798,264 | |
| (a) | Non-income producing security. |
For Fund compliance purposes, the Fund's industry classifications refer to any one or more of the industry sub-classifications used by one or more widely recognized market indexes or ratings group indexes, and/or as defined by Fund management. This definition may not apply for purposes of this report, which may combine industry sub-classifications for reporting ease. Industries are shown as a percentage of net assets.
See Notes to Financial Statements.
| 26 | www.emeraldmutualfunds.com |
| Emerald Small Cap Value Fund | Schedule of Investments |
April 30, 2019
| Shares | | | | Value (Note 2) |
| COMMON STOCKS: 99.19% | | |
| Consumer Discretionary: 12.82% | | |
| | 1,780 | | Aaron's, Inc. | | $ | 99,128 | |
| | 1,902 | | Eldorado Resorts, Inc.(a) | | | 93,902 | |
| | 5,025 | | GameStop Corp. | | | 43,466 | |
| | 3,609 | | Gray Television, Inc.(a) | | | 84,559 | |
| | 1,488 | | Malibu Boats, Inc., Class A(a) | | | 61,931 | |
| | 3,617 | | Meritor, Inc.(a) | | | 87,748 | |
| | 6,408 | | ZAGG, Inc.(a) | | | 52,802 | |
| | | | | | | 523,536 | |
| | | | | | | | |
| Consumer, Cyclical: 1.28% | | | | |
| | 588 | | Dine Brands Global, Inc. | | | 52,132 | |
| | | | | | | | |
| Consumer, Non-cyclical: 1.00% | | | | |
| | 1,181 | | SP Plus Corp.(a) | | | 40,768 | |
| | | | | | | | |
| Energy: 5.20% | | | | |
| | 2,261 | | Delek US Holdings, Inc. | | | 83,793 | |
| | 5,141 | | Magnolia Oil & Gas Corp.(a) | | | 67,758 | |
| | 2,221 | | Whiting Petroleum Corp.(a) | | | 60,833 | |
| | | | | | | 212,384 | |
| | | | | | | | |
| Financial Services: 40.56% | | | | |
| | 3,378 | | Amalgamated Bank, Class A | | | 57,257 | |
| | 952 | | Americold Realty Trust | | | 30,474 | |
| | 1,094 | | Ameris Bancorp | | | 39,887 | |
| | 2,373 | | Ares Management Corp. | | | 58,020 | |
| | 5,728 | | Bancorp, Inc.(a) | | | 58,483 | |
| | 4,021 | | Bank7 Corp.(a) | | | 69,644 | |
| | 3,447 | | Baycom Corp.(a) | | | 79,453 | |
| | 4,239 | | Bridgewater Bancshares, Inc.(a) | | | 45,315 | |
| | 1,943 | | Capital Bancorp, Inc.(a) | | | 22,092 | |
| | 2,000 | | CNB Financial Corp. | | | 56,960 | |
| | 1,441 | | Employers Holdings, Inc. | | | 61,848 | |
| | 439 | | Euronet Worldwide, Inc.(a) | | | 65,802 | |
| | 6,485 | | Everi Holdings, Inc.(a) | | | 66,730 | |
| | 3,906 | | First BanCorp | | | 44,138 | |
| | 657 | | First Merchants Corp. | | | 24,092 | |
| | 5,048 | | Heritage Insurance Holdings, Inc. | | | 68,854 | |
| | 1,388 | | Innovative Industrial Properties, Inc. | | | 118,174 | |
| | 2,749 | | Investar Holding Corp. | | | 63,997 | |
| | 4,146 | | Mercantil Bank Holding Corp.(a) | | | 47,347 | |
| | 3,055 | | Meta Financial Group, Inc. | | | 78,697 | |
| | 1,274 | | Moelis & Co., Class A | | | 52,170 | |
| | 2,040 | | People's Utah Bancorp | | | 58,038 | |
| | 2,843 | | Plymouth Industrial REIT, Inc. | | | 53,363 | |
| | 1,657 | | Popular, Inc. | | | 95,626 | |
| | 2,511 | | Rexford Industrial Realty, Inc. | | | 95,142 | |
| | 1,135 | | Synovus Financial Corp. | | | 41,836 | |
| | 2,864 | | TPG RE Finance Trust, Inc. | | | 56,449 | |
| | 1,525 | | Triumph Bancorp, Inc.(a) | | | 47,290 | |
| | | | | | | 1,657,178 | |
| Shares | | | | Value (Note 2) |
| Health Care: 2.47% | | | | |
| | 4,455 | | Karyopharm Therapeutics, Inc.(a) | | $ | 20,805 | |
| | 2,433 | | Varex Imaging Corp.(a) | | | 79,900 | |
| | | | | | | 100,705 | |
| | | | | | | | |
| Industrial: 3.84% | | | | |
| | 1,402 | | Allied Motion Technologies, Inc. | | | 51,327 | |
| | 871 | | Applied Industrial Technologies, Inc. | | | 52,208 | |
| | 1,714 | | Arcosa, Inc. | | | 53,357 | |
| | | | | | | 156,892 | |
| | | | | | | | |
| Materials & Processing: 5.94% | | | | |
| | 2,185 | | Kirkland Lake Gold, Ltd. | | | 70,619 | |
| | 3,639 | | Koppers Holdings, Inc.(a) | | | 97,307 | |
| | 2,026 | | Universal Forest Products, Inc. | | | 74,861 | |
| | | | | | | 242,787 | |
| | | | | | | | |
| Producer Durables: 12.82% | | | | |
| | 1,906 | | Air Lease Corp. | | | 73,495 | |
| | 2,013 | | Columbus McKinnon Corp. | | | 79,232 | |
| | 1,137 | | Cubic Corp. | | | 64,559 | |
| | 1,052 | | ICF International, Inc. | | | 81,919 | |
| | 1,845 | | Kennametal, Inc. | | | 75,092 | |
| | 1,003 | | OSI Systems, Inc.(a) | | | 90,400 | |
| | 8,747 | | US Xpress Enterprises, Inc., Class A(a) | | | 58,955 | |
| | | | | | | 523,652 | |
| | | | | | | | |
| Technology: 11.71% | | | | |
| | 1,588 | | Blucora, Inc.(a) | | | 55,580 | |
| | 706 | | Ebix, Inc. | | | 35,639 | |
| | 3,434 | | Kulicke & Soffa Industries, Inc. | | | 79,909 | |
| | 432 | | MicroStrategy, Inc., Class A(a) | | | 64,670 | |
| | 542 | | MKS Instruments, Inc. | | | 49,327 | |
| | 8,742 | | Photronics, Inc.(a) | | | 81,651 | |
| | 2,892 | | PlayAGS, Inc.(a) | | | 69,755 | |
| | 4,090 | | Turtle Beach Corp.(a) | | | 41,882 | |
| | | | | | | 478,413 | |
| | | | | | | | |
| Utilities: 1.55% | | | | |
| | 6,522 | | Vonage Holdings Corp.(a) | | | 63,394 | |
| | | | | | | | |
| | | | Total Common Stocks | | | | |
| | | | (Cost $3,506,756) | | | 4,051,841 | |
| | | | | | | | |
| SHORT TERM INVESTMENTS: 1.19% | | | | |
| | 48,608 | | Dreyfus Government Cash Management Fund - Institutional Class 2.303% (7-Day Yield) | | | 48,608 | |
| | | | | | | | |
| | | | Total Short Term Investments | | | | |
| | | | (Cost $48,608) | | | 48,608 | |
| Annual Report | April 30, 2019 | 27 |
| Emerald Small Cap Value Fund | Schedule of Investments |
April 30, 2019
| Shares | | Value (Note 2) |
| Total Investments: 100.38% | | | | |
| (Cost $3,555,364) | | | 4,100,449 | |
| | | | | |
| Liabilities In Excess Of Other Assets: (0.38)% | | | (15,524 | ) |
| Net Assets: 100.00% | | $ | 4,084,925 | |
| (a) | Non-income producing security. |
For Fund compliance purposes, the Fund's industry classifications refer to any one or more of the industry sub-classifications used by one or more widely recognized market indexes or ratings group indexes, and/or as defined by Fund management. This definition may not apply for purposes of this report, which may combine industry sub-classifications for reporting ease. Industries are shown as a percentage of net assets.
See Notes to Financial Statements.
| 28 | www.emeraldmutualfunds.com |
| Emerald Insights Fund | Schedule of Investments |
April 30, 2019
| Shares | | | | | Value
(Note 2) | |
| COMMON STOCKS: 98.27% | | | |
| Consumer Discretionary: 18.55% | | | | |
| | 317 | | | Amazon.com, Inc.(a) | | $ | 610,707 | |
| | 604 | | | Burlington Stores, Inc.(a) | | | 102,022 | |
| | 5,768 | | | Chegg, Inc.(a) | | | 205,629 | |
| | 3,414 | | | Cinemark Holdings, Inc. | | | 143,559 | |
| | 2,342 | | | Eldorado Resorts, Inc.(a) | | | 115,624 | |
| | 484 | | | Home Depot, Inc. | | | 98,591 | |
| | 4,938 | | | Malibu Boats, Inc., Class A(a) | | | 205,519 | |
| | 1,702 | | | Overstock.com, Inc.(a) | | | 22,432 | |
| | 280 | | | Polaris Industries, Inc. | | | 26,992 | |
| | 737 | | | PVH Corp. | | | 95,066 | |
| | 1,297 | | | Royal Caribbean Cruises, Ltd. | | | 156,859 | |
| | 10,348 | | | SeaWorld Entertainment, Inc.(a) | | | 275,464 | |
| | | | | | | | 2,058,464 | |
| | | | | | | | | |
| Consumer Staples: 1.02% | | | | |
| | 364 | | | Boston Beer Co., Inc., Class A(a) | | | 112,844 | |
| | | | | | | | | |
| Consumer, Cyclical: 1.23% | | | | |
| | 917 | | | Dine Brands Global, Inc. | | | 81,301 | |
| | 1,069 | | | Lennar Corp., Class A | | | 55,620 | |
| | | | | | | | 136,921 | |
| | | | | | | | | |
| Consumer, Non-cyclical: 0.25% | | | | |
| | 4,534 | | | ArQule, Inc.(a) | | | 27,068 | |
| | | | | | | | | |
| Energy: 5.82% | | | | |
| | 1,267 | | | Diamondback Energy, Inc. | | | 134,796 | |
| | 4,033 | | | Magnolia Oil & Gas Corp.(a) | | | 53,155 | |
| | 2,765 | | | Oil States International, Inc.(a) | | | 53,420 | |
| | 4,251 | | | Patterson-UTI Energy, Inc. | | | 57,771 | |
| | 1,199 | | | ProPetro Holding Corp.(a) | | | 26,534 | |
| | 21,930 | | | TETRA Technologies, Inc.(a) | | | 52,194 | |
| | 682 | | | Valero Energy Corp. | | | 61,830 | |
| | 4,470 | | | Viper Energy Partners LP | | | 150,281 | |
| | 3,992 | | | WPX Energy, Inc.(a) | | | 55,449 | |
| | | | | | | | 645,430 | |
| | | | | | | | | |
| Financial Services: 9.83% | | | | |
| | 400 | | | Alliance Data Systems Corp. | | | 64,040 | |
| | 2,881 | | | Bank of America Corp. | | | 88,101 | |
| | 2,376 | | | Citigroup, Inc. | | | 167,983 | |
| | 1,180 | | | Evo Payments, Inc., Class A(a) | | | 35,058 | |
| | 2,006 | | | First Data Corp., Class A(a) | | | 51,875 | |
| | 632 | | | Fiserv, Inc.(a) | | | 55,136 | |
| | 931 | | | Independent Bank Group, Inc. | | | 53,067 | |
| | 613 | | | LendingTree, Inc.(a) | | | 235,895 | |
| | 384 | | | SVB Financial Group(a) | | | 96,660 | |
| | 827 | | | Visa, Inc., Class A | | | 135,984 | |
| | 2,244 | | | Western Alliance Bancorp(a) | | | 107,218 | |
| | | | | | | | 1,091,017 | |
| Shares | | | | | Value
(Note 2) | |
| Health Care: 14.20% | | | | |
| | 1,123 | | | Abbott Laboratories | | $ | 89,346 | |
| | 780 | | | AbbVie, Inc. | | | 61,924 | |
| | 988 | | | Alnylam Pharmaceuticals, Inc.(a) | | | 88,268 | |
| | 9,607 | | | BioDelivery Sciences International, Inc.(a) | | | 46,402 | |
| | 1,361 | | | Biohaven Pharmaceutical Holding Co., Ltd.(a) | | | 81,456 | |
| | 1,601 | | | BioTelemetry, Inc.(a) | | | 87,094 | |
| | 1,353 | | | Catalent, Inc.(a) | | | 60,641 | |
| | 1,571 | | | Deciphera Pharmaceuticals, Inc.(a) | | | 36,133 | |
| | 9,133 | | | Dicerna Pharmaceuticals, Inc.(a) | | | 118,364 | |
| | 2,376 | | | Horizon Pharma PLC(a) | | | 60,659 | |
| | 3,186 | | | Insmed, Inc.(a) | | | 96,982 | |
| | 1,673 | | | Integer Holdings Corp.(a) | | | 115,588 | |
| | 1,512 | | | PTC Therapeutics, Inc.(a) | | | 56,579 | |
| | 1,507 | | | Reata Pharmaceuticals, Inc., Class A(a) | | | 118,239 | |
| | 998 | | | Sarepta Therapeutics, Inc.(a) | | | 116,706 | |
| | 1,319 | | | Tabula Rasa HealthCare, Inc.(a) | | | 70,250 | |
| | 794 | | | Tandem Diabetes Care, Inc.(a) | | | 48,760 | |
| | 2,253 | | | Teladoc Health, Inc.(a) | | | 128,151 | |
| | 675 | | | Veeva Systems, Inc., Class A(a) | | | 94,412 | |
| | | | | | | | 1,575,954 | |
| | | | | | | | | |
| Industrial: 0.65% | | | | |
| | 743 | | | Allied Motion Technologies, Inc. | | | 27,201 | |
| | 119 | | | Boeing Co. | | | 44,945 | |
| | | | | | | | 72,146 | |
| | | | | | | | | |
| Materials & Processing: 5.87% | | | | |
| | 1,188 | | | Berry Global Group, Inc.(a) | | | 69,854 | |
| | 5,951 | | | GMS, Inc.(a) | | | 104,856 | |
| | 1,096 | | | Innospec, Inc. | | | 92,963 | |
| | 3,708 | | | Koppers Holdings, Inc.(a) | | | 99,152 | |
| | 4,647 | | | Livent Corp.(a) | | | 50,095 | |
| | 913 | | | Scotts Miracle-Gro Co. | | | 77,623 | |
| | 2,263 | | | Trex Co., Inc.(a) | | | 156,758 | |
| | | | | | | | 651,301 | |
| | | | | | | | | |
| Producer Durables: 7.37% | | | | |
| | 1,123 | | | Chart Industries, Inc.(a) | | | 99,127 | |
| | 227 | | | CoStar Group, Inc.(a) | | | 112,649 | |
| | 3,866 | | | Kratos Defense & Security Solutions, Inc.(a) | | | 61,392 | |
| | 1,328 | | | NV5 Global, Inc.(a) | | | 84,116 | |
| | 1,507 | | | OSI Systems, Inc.(a) | | | 135,826 | |
| | 837 | | | Parker-Hannifin Corp. | | | 151,564 | |
| | 960 | | | Spirit Airlines, Inc.(a) | | | 52,205 | |
| | 962 | | | TopBuild Corp.(a) | | | 68,523 | |
| | 706 | | | Wabtec Corp. | | | 52,293 | |
| | | | | | | | 817,695 | |
| | | | | | | | | |
| Technology: 31.12% | | | | |
| | 102 | | | Adobe, Inc.(a) | | | 29,503 | |
| | 1,569 | | | Alarm.com Holdings, Inc.(a) | | | 111,211 | |
| Annual Report | April 30, 2019 | 29 |
| Emerald Insights Fund | Schedule of Investments |
April 30, 2019
| Shares | | | | | Value
(Note 2) | |
| Technology (continued) | | | | |
| | 334 | | | Alphabet, Inc., Class A(a) | | $ | 400,453 | |
| | 2,313 | | | Apple, Inc. | | | 464,150 | |
| | 927 | | | DocuSign, Inc.(a) | | | 52,533 | |
| | 2,098 | | | Dropbox, Inc., Class A(a) | | | 51,149 | |
| | 645 | | | Facebook, Inc., Class A(a) | | | 124,743 | |
| | 715 | | | Fidelity National Information Services, Inc. | | | 82,890 | |
| | 1,057 | | | Fortinet, Inc.(a) | | | 98,745 | |
| | 11,212 | | | Glu Mobile, Inc.(a) | | | 122,659 | |
| | 918 | | | Lumentum Holdings, Inc.(a) | | | 56,888 | |
| | 4,677 | | | Microsoft Corp. | | | 610,816 | |
| | 681 | | | NVIDIA Corp. | | | 123,261 | |
| | 4,445 | | | ON Semiconductor Corp.(a) | | | 102,502 | |
| | 478 | | | Palo Alto Networks, Inc.(a) | | | 118,941 | |
| | 7,386 | | | PlayAGS, Inc.(a) | | | 178,150 | |
| | 1,026 | | | Proofpoint, Inc.(a) | | | 128,681 | |
| | 3,902 | | | Rapid7, Inc.(a) | | | 212,035 | |
| | 228 | | | RealPage, Inc.(a) | | | 14,868 | |
| | 365 | | | salesforce.com, Inc.(a) | | | 60,353 | |
| | 291 | | | ServiceNow, Inc.(a) | | | 79,009 | |
| | 930 | | | Take-Two Interactive Software, Inc.(a) | | | 90,052 | |
| | 1,967 | | | Varonis Systems, Inc.(a) | | | 139,952 | |
| | | | | | | | 3,453,544 | |
| | | | | | | | | |
| Utilities: 2.36% | | | | |
| | 2,260 | | | Aqua America, Inc. | | | 88,276 | |
| | 17,888 | | | Vonage Holdings Corp.(a) | | | 173,871 | |
| | | | | | | | 262,147 | |
| | | | | | | | | |
| | | | | Total Common Stocks | | | | |
| | | | | (Cost $8,719,176) | | | 10,904,531 | |
| | | | | | | | | |
| SHORT TERM INVESTMENTS: 1.91% | | | | |
| | 212,495 | | | Dreyfus Government Cash Management Fund - Institutional Class 2.303% (7-Day Yield) | | | 212,495 | |
| | | | | | | | | |
| | | | | Total Short Term Investments | | | | |
| | | | | (Cost $212,495) | | | 212,495 | |
| | | | | | | | | |
| Total Investments: 100.18% | | | | |
| (Cost $8,931,671) | | | 11,117,026 | |
| | | | | | | | | |
| Liabilities In Excess Of Other Assets: (0.18)% | | | (20,478 | ) |
| Net Assets: 100.00% | | $ | 11,096,548 | |
| (a) | Non-income producing security. |
For Fund compliance purposes, the Fund's industry classifications refer to any one or more of the industry sub-classifications used by one or more widely recognized market indexes or ratings group indexes, and/or as defined by Fund management. This definition may not apply for purposes of this report, which may combine industry sub-classifications for reporting ease. Industries are shown as a percentage of net assets.
See Notes to Financial Statements.
| 30 | www.emeraldmutualfunds.com |
| Emerald Banking and Finance Fund | Schedule of Investments |
April 30, 2019
| Shares | | | | | Value
(Note 2) | |
| COMMON STOCKS: 99.57% | | | |
| Consumer, Non-cyclical: 0.02% | | | |
| Commercial Services: 0.02% | | | | |
| | 34,921 | | | CPI Card Group, Inc.(a) | | $ | 84,160 | |
| | | | | | | | | |
| Financial Services: 96.14% | | | | |
| Banks: 0.17% | | | | |
| | 26,842 | | | Community Heritage Financial, Inc. | | | 575,761 | |
| | | | | | | | | |
| Banks: Diversified: 73.37% | | | | |
| | 100,000 | | | 1st Source Corp. | | | 4,683,000 | |
| | 162,101 | | | Amalgamated Bank, Class A | | | 2,747,612 | |
| | 69,178 | | | American Business Bank(a) | | | 2,507,709 | |
| | 185,488 | | | American Riviera Bank(a) | | | 3,348,058 | |
| | 80,890 | | | Ameris Bancorp | | | 2,949,249 | |
| | 913,279 | | | Bancorp, Inc.(a) | | | 9,324,579 | |
| | 424,577 | | | Bank of Commerce Holdings | | | 4,593,923 | |
| | 248,623 | | | Bank of NT Butterfield & Son, Ltd. | | | 9,949,892 | |
| | 495,424 | | | Bank7 Corp.(a) | | | 8,580,744 | |
| | 241,551 | | | Baycom Corp.(a) | | | 5,567,751 | |
| | 722,896 | | | Bridgewater Bancshares, Inc.(a) | | | 7,727,758 | |
| | 224,440 | | | Business First Bancshares, Inc. | | | 5,711,998 | |
| | 99,330 | | | Cadence BanCorp | | | 2,259,758 | |
| | 32,880 | | | Capital Bancorp, Inc.(a) | | | 373,846 | |
| | 302,108 | | | CBTX, Inc. | | | 9,576,824 | |
| | 178,444 | | | CenterState Bank Corp. | | | 4,403,998 | |
| | 97,000 | | | Centric Financial Corp.(a) | | | 1,001,525 | |
| | 118,810 | | | Civista Bancshares, Inc. | | | 2,613,820 | |
| | 150,002 | | | CNB Financial Corp. | | | 4,272,057 | |
| | 434,321 | | | Coastal Financial Corp.(a) | | | 6,927,420 | |
| | 351,830 | | | Esquire Financial Holdings, Inc.(a) | | | 8,845,006 | |
| | 83,770 | | | First BanCorp | | | 946,601 | |
| | 113,927 | | | First Bancshares, Inc. | | | 3,518,066 | |
| | 63,498 | | | First Choice Bancorp | | | 1,349,967 | |
| | 134,051 | | | First Mid Bancshares, Inc. | | | 4,623,419 | |
| | 66,405 | | | FS Bancorp, Inc. | | | 3,432,474 | |
| | 288,277 | | | FVCBankcorp, Inc.(a) | | | 4,727,743 | |
| | 200,000 | | | Guaranty Bancshares, Inc. | | | 5,614,000 | |
| | 211,862 | | | Heritage Commerce Corp. | | | 2,652,512 | |
| | 188,116 | | | Investar Holding Corp. | | | 4,379,340 | |
| | 36,553 | | | Live Oak Bancshares, Inc. | | | 638,581 | |
| | 53 | | | Mechanics Bank/Walnut Creek CA(a) | | | 1,537,000 | |
| | 576,000 | | | Mercantil Bank Holding Corp.(a) | | | 10,085,760 | |
| | 434,759 | | | Merchants Bancorp | | | 10,512,473 | |
| | 229,276 | | | Metropolitan Bank Holding Corp.(a) | | | 9,150,405 | |
| | 133,139 | | | Old Line Bancshares, Inc. | | | 3,328,475 | |
| | 121,519 | | | Opus Bank | | | 2,657,621 | |
| | 150,710 | | | Origin Bancorp, Inc. | | | 5,250,736 | |
| | 127,472 | | | People's Utah Bancorp | | | 3,626,578 | |
| | 57,190 | | | Popular, Inc. | | | 3,300,435 | |
| | 279,177 | | | Professional Holding Corp.(a) | | | 4,885,598 | |
| | 254,684 | | | Seacoast Commerce Banc Holdings | | | 5,045,290 | |
| | 243,750 | | | ServisFirst Bancshares, Inc. | | | 8,272,875 | |
| | 71,032 | | | Southern First Bancshares, Inc.(a) | | | 2,614,688 | |
| Shares | | | | | Value
(Note 2) | |
| Banks: Diversified (continued) | | | | |
| | 262,100 | | | Spirit of Texas Bancshares, Inc.(a) | | $ | 5,889,387 | |
| | 300,000 | | | Stewardship Financial Corp. | | | 2,730,000 | |
| | 27,120 | | | SVB Financial Group(a) | | | 6,826,646 | |
| | 52,620 | | | Synovus Financial Corp. | | | 1,939,573 | |
| | 139,935 | | | TriState Capital Holdings, Inc.(a) | | | 3,254,888 | |
| | 321,966 | | | Triumph Bancorp, Inc.(a) | | | 9,984,166 | |
| | 168,750 | | | Unity Bancorp, Inc. | | | 3,645,000 | |
| | 135,517 | | | Veritex Holdings, Inc. | | | 3,592,556 | |
| | 117,942 | | | West Town Bancorp, Inc.(a) | | | 2,707,948 | |
| | | | | | | | 250,687,328 | |
| | | | | | | | | |
| Banks: Savings, Thrift & Mortgage Lending: 9.90% | |
| | 230,146 | | | Heritage Financial Corp. | | | 6,966,519 | |
| | 262,103 | | | Malvern Bancorp, Inc.(a) | | | 5,553,963 | |
| | 451,878 | | | Meta Financial Group, Inc. | | | 11,640,377 | |
| | 778,700 | | | Sterling Bancorp, Inc. | | | 7,623,473 | |
| | 250,000 | | | University Bancorp, Inc./Ann Arbor MI(a) | | | 2,057,500 | |
| | | | | | | | 33,841,832 | |
| | | | | | | | | |
| Commercial Finance & Mortgage Companies: 1.15% | |
| | 1,222,440 | | | ECN Capital Corp. | | | 3,915,964 | |
| | | | | | | | | |
| Consumer Lending: 4.22% | |
| | 657,262 | | | Curo Group Holdings Corp.(a) | | | 8,754,730 | |
| | 82,995 | | | Enova International, Inc.(a) | | | 2,276,553 | |
| | 99,650 | | | OneMain Holdings, Inc. | | | 3,385,110 | |
| | | | | | | | 14,416,393 | |
| | | | | | | | | |
| Diversified Financial Services: 1.32% |
| | 176,340 | | | Cannae Holdings, Inc.(a) | | | 4,526,648 | |
| | | | | | | | | |
| Equity REIT - Industrial: 3.26% | |
| | 130,630 | | | Innovative Industrial Properties, Inc. | | | 11,121,838 | |
| | | | | | | | | |
| Financial Data & Systems: 0.97% |
| | 51,976 | | | Green Dot Corp., Class A(a) | | | 3,314,510 | |
| | | | | | | | | |
| Insurance: Multi-Line: 0.42% | |
| | 33,648 | | | James River Group Holdings, Ltd. | | | 1,420,619 | |
| | | | | | | | | |
| Insurance: Property-Casualty: 1.36% | |
| | 151,397 | | | Kingstone Cos., Inc. | | | 1,757,719 | |
| | 19,853 | | | Kinsale Capital Group, Inc. | | | 1,441,328 | |
| | 51,270 | | | NMI Holdings, Inc., Class A(a) | | | 1,439,662 | |
| | | | | | | | 4,638,709 | |
| | | | | | | | | |
| Materials & Processing: 1.32% |
| Precious Metals & Minerals: 1.32% | | | | |
| | 139,458 | | | Kirkland Lake Gold, Ltd. | | | 4,507,282 | |
| | | | | | | | | |
| Technology: 2.09% | | | | |
| Computer Service Software & Systems: 1.56% | |
| | 105,680 | | | Ebix, Inc. | | | 5,334,726 | |
| Annual Report | April 30, 2019 | 31 |
| Emerald Banking and Finance Fund | Schedule of Investments |
April 30, 2019
| Shares | | | | | Value
(Note 2) | |
| Computer Services Software & Systems: 0.53% | | | | |
| | 51,300 | | | Blucora, Inc.(a) | | $ | 1,795,500 | |
| | | | | | | | | |
| | | | | Total Common Stocks | | | | |
| | | | | (Cost $299,327,418) | | | 340,181,270 | |
| SHORT TERM INVESTMENTS: 0.60% | | | | |
| | 2,048,281 | | | Dreyfus Government Cash Management Fund - Institutional Class 2.303% (7-Day Yield) | | | 2,048,281 | |
| | | | | | | | | |
| | | | | Total Short Term Investments | | | | |
| | | | | (Cost $2,048,281) | | | 2,048,281 | |
| | | | | | | | | |
| Total Investments: 100.17% | | | | |
| (Cost $301,375,699) | | | 342,229,551 | |
| | | | | | | | | |
| Liabilities In Excess Of Other Assets: (0.17)% | | | (564,635 | ) |
| Net Assets: 100.00% | | $ | 341,664,916 | |
| (a) | Non-income producing security. |
For Fund compliance purposes, the Fund's industry classifications refer to any one or more of the industry sub-classifications used by one or more widely recognized market indexes or ratings group indexes, and/or as defined by Fund management. This definition may not apply for purposes of this report, which may combine industry sub-classifications for reporting ease. Industries are shown as a percentage of net assets.
See Notes to Financial Statements.
| 32 | www.emeraldmutualfunds.com |
| Emerald Funds | Statements of Assets and Liabilities |
April 30, 2019
| | | Emerald Growth Fund | | | Emerald Small Cap Value Fund | | | Emerald Insights Fund | | | Emerald Banking and Finance Fund | |
| ASSETS: | | | | | | | | | | | | |
| Investments, at value | | $ | 1,376,456,088 | | | $ | 4,100,449 | | | $ | 11,117,026 | | | $ | 342,229,551 | |
| Receivable for investments sold | | | 1,609,164 | | | | – | | | | 76,652 | | | | – | |
| Receivable for shares sold | | | 717,097 | | | | – | | | | – | | | | 323,426 | |
| Receivable due from advisor | | | – | | | | 5,050 | | | | 298 | | | | – | |
| Interest and dividends receivable | | | 292,950 | | | | 3 | | | | 1,427 | | | | 22,199 | |
| Other assets | | | 26,543 | | | | 12,339 | | | | 12,505 | | | | 28,690 | |
| Total Assets | | | 1,379,101,842 | | | | 4,117,841 | | | | 11,207,908 | | | | 342,603,866 | |
| LIABILITIES: | | | | | | | | | | | | | | | | |
| Payable for investments purchased | | | 3,047,658 | | | | – | | | | 84,038 | | | | – | |
| Payable for shares redeemed | | | 1,254,771 | | | | 9,132 | | | | – | | | | 458,897 | |
| Investment advisory fees payable | | | 623,527 | | | | – | | | | – | | | | 258,225 | |
| Payable to fund accounting and administration | | | 46,775 | | | | 2,113 | | | | 2,367 | | | | 13,246 | |
| Payable for distribution and service fees | | | 220,384 | | | | 930 | | | | 3,133 | | | | 139,292 | |
| Payable for trustee fees and expenses | | | 12,138 | | | | 43 | | | | 99 | | | | 3,174 | |
| Payable for transfer agency fees | | | 21,613 | | | | 3,250 | | | | 3,383 | | | | 20,011 | |
| Payable for chief compliance officer fee | | | 3,960 | | | | 14 | | | | 32 | | | | 1,036 | |
| Payable for principal financial officer fee | | | 655 | | | | 2 | | | | 5 | | | | 171 | |
| Payable for professional fees | | | 25,159 | | | | 16,365 | | | | 16,385 | | | | 21,652 | |
| Accrued expenses and other liabilities | | | 46,938 | | | | 1,067 | | | | 1,918 | | | | 23,246 | |
| Total Liabilities | | | 5,303,578 | | | | 32,916 | | | | 111,360 | | | | 938,950 | |
| NET ASSETS | | $ | 1,373,798,264 | | | $ | 4,084,925 | | | $ | 11,096,548 | | | $ | 341,664,916 | |
| NET ASSETS CONSIST OF: | | | | | | | | | | | | | | | | |
| Paid-in capital (Note 5) | | $ | 979,745,446 | | | $ | 3,947,156 | | | $ | 9,262,935 | | | $ | 310,247,191 | |
| Total distributable earnings | | | 394,052,818 | | | | 137,769 | | | | 1,833,613 | | | | 31,417,725 | |
| NET ASSETS | | $ | 1,373,798,264 | | | $ | 4,084,925 | | | $ | 11,096,548 | | | $ | 341,664,916 | |
| INVESTMENTS, AT COST | | $ | 995,842,735 | | | $ | 3,555,364 | | | $ | 8,931,671 | | | $ | 301,375,699 | |
| PRICING OF SHARES | | | | | | | | | | | | | | | | |
| Class A:(a) | | | | | | | | | | | | | | | | |
| Net Asset Value, offering and redemption price per share | | $ | 26.00 | | | $ | 7.29 | | | $ | 11.51 | | | $ | 32.71 | |
| Net Assets | | $ | 188,882,734 | | | $ | 2,664,120 | | | $ | 9,397,447 | | | $ | 87,266,513 | |
| Shares of beneficial interest outstanding | | | 7,264,690 | | | | 365,447 | | | | 816,814 | | | | 2,667,689 | |
| Maximum offering price per share (NAV/.9525, based on maximum sales charge of 4.75% of the offering price) | | $ | 27.30 | | | $ | 7.65 | | | $ | 12.08 | | | $ | 34.34 | |
| Class C:(a) | | | | | | | | | | | | | | | | |
| Net Asset Value, offering and redemption price per share | | $ | 21.59 | | | $ | 6.96 | | | $ | 11.04 | | | $ | 27.87 | |
| Net Assets | | $ | 29,974,866 | | | $ | 37,894 | | | $ | 141,341 | | | $ | 50,078,529 | |
| Shares of beneficial interest outstanding | | | 1,388,635 | | | | 5,445 | | | | 12,797 | | | | 1,797,106 | |
| Institutional Class: | | | | | | | | | | | | | | | | |
| Net Asset Value, offering and redemption price per share | | $ | 27.16 | | | $ | 7.46 | | | $ | 11.69 | | | $ | 33.70 | |
| Net Assets | | $ | 1,050,537,961 | | | $ | 873,792 | | | $ | 1,383,407 | | | $ | 162,909,647 | |
| Shares of beneficial interest outstanding | | | 38,685,193 | | | | 117,171 | | | | 118,325 | | | | 4,834,690 | |
| Investor Class: | | | | | | | | | | | | | | | | |
| Net Asset Value, offering and redemption price per share | | $ | 25.88 | | | $ | 7.33 | | | $ | 11.45 | | | $ | 30.96 | |
| Net Assets | | $ | 104,402,703 | | | $ | 509,119 | | | $ | 174,353 | | | $ | 41,410,227 | |
| Shares of beneficial interest outstanding | | | 4,034,856 | | | | 69,485 | | | | 15,233 | | | | 1,337,741 | |
| (a) | Redemption price per share may be reduced for any applicable contingent deferred sales charge. For a description of a possible sales charge, please see the Funds' Prospectus. |
See Notes to Financial Statements.
| Annual Report | April 30, 2019 | 33 |
| Emerald Funds | Statements of Operations |
For the Year Ended April 30, 2019
| | | Emerald Growth Fund | | | Emerald Small Cap Value Fund | | | Emerald Insights Fund | | | Emerald Banking and Finance Fund | |
| INVESTMENT INCOME: | | | | | | | | | | | | | | | | |
| Dividends | | $ | 6,704,530 | | | $ | 76,678 | | | $ | 70,087 | | | $ | 4,050,896 | |
| Foreign taxes withheld | | | – | | | | (44 | ) | | | – | | | | (5,735 | ) |
| Total Investment Income | | | 6,704,530 | | | | 76,634 | | | | 70,087 | | | | 4,045,161 | |
| | | | | | | | | | | | | | | | | |
| EXPENSES: | | | | | | | | | | | | | | | | |
| Investment advisory fee (Note 6) | | | 7,401,263 | | | | 49,803 | | | | 81,891 | | | | 4,458,419 | |
| Administration fee | | | 515,768 | | | | 12,096 | | | | 13,904 | | | | 195,529 | |
| Custodian fee | | | 112,201 | | | | 5,016 | | | | 5,016 | | | | 55,969 | |
| Professional fees | | | 35,032 | | | | 17,549 | | | | 17,593 | | | | 26,353 | |
| Transfer agent fee | | | 214,335 | | | | 30,939 | | | | 32,452 | | | | 210,556 | |
| Delegated transfer agent equivalent services fees | | | | | | | | | | | | | | | | |
| Class A | | | 2,502 | | | | – | | | | – | | | | 10,402 | |
| Class C | | | 965 | | | | – | | | | – | | | | 2,666 | |
| Institutional Class | | | 861 | | | | 149 | | | | – | | | | – | |
| Investor Class | | | 2,216 | | | | 21 | | | | – | | | | 36 | |
| Trustee fees and expenses | | | 45,068 | | | | 213 | | | | 365 | | | | 15,051 | |
| Registration/filing fees | | | 67,371 | | | | 42,544 | | | | 38,095 | | | | 73,117 | |
| Reports to shareholder and printing fees | | | 109,783 | | | | 1,429 | | | | 2,065 | | | | 66,908 | |
| Distribution and service fees | | | | | | | | | | | | | | | | |
| Class A | | | 739,396 | | | | 14,452 | | | | 32,536 | | | | 503,612 | |
| Class C | | | 320,172 | | | | 653 | | | | 1,216 | | | | 679,540 | |
| Institutional Class | | | 332,461 | | | | – | | | | 471 | | | | 225 | |
| Investor Class | | | 401,836 | | | | 1,405 | | | | 373 | | | | 233,924 | |
| Chief compliance officer fee | | | 46,416 | | | | 234 | | | | 386 | | | | 16,927 | |
| Principal financial officer fee | | | 7,255 | | | | 37 | | | | 60 | | | | 2,648 | |
| Other | | | 36,745 | | | | 6,812 | | | | 8,405 | | | | 19,368 | |
| Total expenses before waiver | | | 10,391,646 | | | | 183,352 | | | | 234,828 | | | | 6,571,250 | |
| Less fees waived/reimbursed by investment advisor (Note 6) | | | – | | | | (100,449 | ) | | | (90,577 | ) | | | – | |
| Total Net Expenses | | | 10,391,646 | | | | 82,903 | | | | 144,251 | | | | 6,571,250 | |
| | | | | | | | | | | | | | | | | |
| NET INVESTMENT INCOME/(LOSS): | | | (3,687,116 | ) | | | (6,269 | ) | | | (74,164 | ) | | | (2,526,089 | ) |
| | | | | | | | | | | | | | | | | |
| REALIZED AND UNREALIZED GAIN/(LOSS) | | | | | | | | | | | | | | | | |
| Net realized gain/(loss) | | | 65,609,700 | | | | (289,525 | ) | | | 165,436 | | | | 39,986,242 | |
| Net realized gain on foreign currency transactions | | | – | | | | 3 | | | | – | | | | 109 | |
| Net change in unrealized appreciation/(depreciation) | | | 79,706,677 | | | | (513,409 | ) | | | 1,129,078 | | | | (104,241,265 | ) |
| NET REALIZED AND UNREALIZED GAIN/(LOSS) | | | 145,316,377 | | | | (802,931 | ) | | | 1,294,514 | | | | (64,254,914 | ) |
| NET INCREASE/(DECREASE) IN NET ASSETS RESULTING FROM OPERATIONS | | $ | 141,629,261 | | | $ | (809,200 | ) | | $ | 1,220,350 | | | $ | (66,781,003 | ) |
See Notes to Financial Statements.
| 34 | www.emeraldmutualfunds.com |
| Emerald Growth Fund | Statements of Changes in Net Assets |
| | | Year Ended April 30, 2019 | | | Year Ended April 30, 2018 | |
| OPERATIONS: | | | | | | |
| Net investment loss | | $ | (3,687,116 | ) | | $ | (5,367,786 | ) |
| Net realized gain | | | 65,609,700 | | | | 124,517,595 | |
| Net change in unrealized appreciation | | | 79,706,677 | | | | 72,091,969 | |
| Net increase in net assets resulting from operations | | | 141,629,261 | | | | 191,241,778 | |
| DISTRIBUTIONS TO SHAREHOLDERS (NOTE 3): | | | | | | | | |
| Total amount of distributions | | | | | | | | |
| Class A | | | (18,783,708 | ) | | | – | |
| Class C | | | (3,291,825 | ) | | | – | |
| Institutional Class | | | (85,437,977 | ) | | | – | |
| Investor Class | | | (9,170,727 | ) | | | – | |
| Net decrease in net assets from distributions | | | (116,684,237 | ) | | | – | |
| SHARE TRANSACTIONS (NOTE 5): | | | | | | | | |
| Class A | | | | | | | | |
| Proceeds from sale of shares | | | 28,831,338 | | | | 37,090,912 | |
| Issued to shareholders in reinvestment of distributions | | | 17,242,400 | | | | – | |
| Cost of shares redeemed | | | (100,627,275 | ) | | | (116,095,204 | ) |
| Net decrease from share transactions | | | (54,553,537 | ) | | | (79,004,292 | ) |
| Class C | | | | | | | | |
| Proceeds from sale of shares | | | 1,048,239 | | | | 725,120 | |
| Issued to shareholders in reinvestment of distributions | | | 2,913,276 | | | | – | |
| Cost of shares redeemed | | | (7,089,084 | ) | | | (8,056,239 | ) |
| Net decrease from share transactions | | | (3,127,569 | ) | | | (7,331,119 | ) |
| Institutional Class | | | | | | | | |
| Proceeds from sale of shares | | | 294,328,397 | | | | 259,029,418 | |
| Issued to shareholders in reinvestment of distributions | | | 76,474,139 | | | | – | |
| Cost of shares redeemed | | | (176,456,213 | ) | | | (135,414,218 | ) |
| Net increase from share transactions | | | 194,346,323 | | | | 123,615,200 | |
| Investor Class | | | | | | | | |
| Proceeds from sale of shares | | | 30,586,078 | | | | 22,305,690 | |
| Issued to shareholders in reinvestment of distributions | | | 3,282,222 | | | | – | |
| Cost of shares redeemed | | | (40,897,792 | ) | | | (47,223,965 | ) |
| Net decrease from share transactions | | | (7,029,492 | ) | | | (24,918,275 | ) |
| Net increase in net assets | | $ | 154,580,749 | | | $ | 203,603,292 | |
| NET ASSETS: | | | | | | | | |
| Beginning of period | | | 1,219,217,515 | | | | 1,015,614,223 | |
| End of period | | $ | 1,373,798,264 | | | $ | 1,219,217,515 | |
| Annual Report | April 30, 2019 | 35 |
| Emerald Growth Fund | Statements of Changes in Net Assets |
| | | Year Ended April 30, 2019 | | | Year Ended April 30, 2018 | |
| Other Information: | | | | | | | | |
| SHARE TRANSACTIONS: | | | | | | | | |
| Class A | | | | | | | | |
| Sold | | | 1,099,455 | | | | 1,523,709 | |
| Distributions reinvested | | | 819,116 | | | | – | |
| Redeemed | | | (3,863,070 | ) | | | (4,700,055 | ) |
| Net decrease in shares outstanding | | | (1,944,499 | ) | | | (3,176,346 | ) |
| Class C | | | | | | | | |
| Sold | | | 52,709 | | | | 34,568 | |
| Distributions reinvested | | | 166,283 | | | | – | |
| Redeemed | | | (327,363 | ) | | | (385,002 | ) |
| Net decrease in shares outstanding | | | (108,371 | ) | | | (350,434 | ) |
| Institutional Class | | | | | | | | |
| Sold | | | 10,623,887 | | | | 9,981,574 | |
| Distributions reinvested | | | 3,482,429 | | | | – | |
| Redeemed | | | (6,569,755 | ) | | | (5,275,531 | ) |
| Net increase in shares outstanding | | | 7,536,561 | | | | 4,706,043 | |
| Investor Class | | | | | | | | |
| Sold | | | 1,272,243 | | | | 888,563 | |
| Distributions reinvested | | | 156,669 | | | | – | |
| Redeemed | | | (1,552,305 | ) | | | (1,972,720 | ) |
| Net decrease in shares outstanding | | | (123,393 | ) | | | (1,084,157 | ) |
See Notes to Financial Statements.
| 36 | www.emeraldmutualfunds.com |
| Emerald Small Cap Value Fund | Statements of Changes in Net Assets |
| | | Year Ended April 30, 2019 | | | Year Ended April 30, 2018 | |
| OPERATIONS: | | | | | | |
| Net investment loss | | $ | (6,269 | ) | | $ | (13,355 | ) |
| Net realized gain/(loss) | | | (289,522 | ) | | | 1,207,917 | |
| Net change in unrealized depreciation | | | (513,409 | ) | | | (267,114 | ) |
| Net increase/(decrease) in net assets resulting from operations | | | (809,200 | ) | | | 927,448 | |
| DISTRIBUTIONS TO SHAREHOLDERS (NOTE 3):(a) | | | | | | | | |
| Total amount of distributions | | | | | | | | |
| Class A | | | (832,298 | ) | | | (1,059,065 | ) |
| Class C | | | (2,956 | ) | | | (47,326 | ) |
| Institutional Class | | | (268,960 | ) | | | (2,006,350 | ) |
| Investor Class | | | (122,718 | ) | | | (306,751 | ) |
| Net decrease in net assets from distributions | | | (1,226,932 | ) | | | (3,419,492 | ) |
| SHARE TRANSACTIONS (NOTE 5): | | | | | | | | |
| Class A | | | | | | | | |
| Proceeds from sale of shares | | | 1,888,438 | | | | 2,516,038 | |
| Issued to shareholders in reinvestment of distributions | | | 832,298 | | | | 1,059,065 | |
| Cost of shares redeemed | | | (2,655,284 | ) | | | (740,130 | ) |
| Net increase from share transactions | | | 65,452 | | | | 2,834,973 | |
| Class C | | | | | | | | |
| Proceeds from sale of shares | | | 26,343 | | | | 9,102 | |
| Issued to shareholders in reinvestment of distributions | | | 2,956 | | | | 47,327 | |
| Cost of shares redeemed | | | (88,998 | ) | | | (123,065 | ) |
| Net decrease from share transactions | | | (59,699 | ) | | | (66,636 | ) |
| Institutional Class | | | | | | | | |
| Proceeds from sale of shares | | | 340,310 | | | | 2,040,666 | |
| Issued to shareholders in reinvestment of distributions | | | 268,960 | | | | 2,006,349 | |
| Cost of shares redeemed | | | (2,426,213 | ) | | | (4,415,382 | ) |
| Net decrease from share transactions | | | (1,816,943 | ) | | | (368,367 | ) |
| Investor Class | | | | | | | | |
| Proceeds from sale of shares | | | 134,280 | | | | 72,427 | |
| Issued to shareholders in reinvestment of distributions | | | 122,718 | | | | 306,751 | |
| Cost of shares redeemed | | | (125,199 | ) | | | (210,226 | ) |
| Net increase from share transactions | | | 131,799 | | | | 168,952 | |
| Net increase/(decrease) in net assets | | $ | (3,715,523 | ) | | $ | 76,878 | |
| NET ASSETS: | | | | | | | | |
| Beginning of period | | | 7,800,448 | | | | 7,723,570 | |
| End of period | | $ | 4,084,925 | | �� | $ | 7,800,448 | |
| Annual Report | April 30, 2019 | 37 |
| Emerald Small Cap Value Fund | Statements of Changes in Net Assets |
| | | Year Ended April 30, 2019 | | | Year Ended April 30, 2018 | |
| Other Information: | | | | | | | | |
| SHARE TRANSACTIONS: | | | | | | | | |
| Class A | | | | | | | | |
| Sold | | | 193,926 | | | | 204,655 | |
| Distributions reinvested | | | 131,485 | | | | 100,671 | |
| Redeemed | | | (338,910 | ) | | | (43,758 | ) |
| Net increase/(decrease) in shares outstanding | | | (13,499 | ) | | | 261,568 | |
| Class C | | | | | | | | |
| Sold | | | 4,031 | | | | 565 | |
| Distributions reinvested | | | 488 | | | | 4,622 | |
| Redeemed | | | (9,693 | ) | | | (7,663 | ) |
| Net decrease in shares outstanding | | | (5,174 | ) | | | (2,476 | ) |
| Institutional Class | | | | | | | | |
| Sold | | | 31,414 | | | | 131,987 | |
| Distributions reinvested | | | 41,570 | | | | 188,390 | |
| Redeemed | | | (255,759 | ) | | | (325,646 | ) |
| Net decrease in shares outstanding | | | (182,775 | ) | | | (5,269 | ) |
| Investor Class | | | | | | | | |
| Sold | | | 12,696 | | | | 5,844 | |
| Distributions reinvested | | | 19,295 | | | | 29,131 | |
| Redeemed | | | (15,655 | ) | | | (19,594 | ) |
| Net increase in shares outstanding | | | 16,336 | | | | 15,381 | |
| (a) | For the year ended April 30, 2018, total distributions consisted of Net Investment Income of $–, and Net Realized Gains of $3,419,492. |
See Notes to Financial Statements.
| 38 | www.emeraldmutualfunds.com |
| Emerald Insights Fund | Statements of Changes in Net Assets |
| | | Year Ended April 30, 2019 | | | Year Ended April 30, 2018 | |
| OPERATIONS: | | | | | | |
| Net investment loss | | $ | (74,164 | ) | | $ | (62,064 | ) |
| Net realized gain | | | 165,436 | | | | 2,535,047 | |
| Net change in unrealized appreciation/(depreciation) | | | 1,129,078 | | | | (848,799 | ) |
| Net increase in net assets resulting from operations | | | 1,220,350 | | | | 1,624,184 | |
| DISTRIBUTIONS TO SHAREHOLDERS (NOTE 3): | | | | | | | | |
| Total amount of distributions | | | | | | | | |
| Class A | | | (1,601,857 | ) | | | – | |
| Class C | | | (21,254 | ) | | | – | |
| Institutional Class | | | (260,149 | ) | | | – | |
| Investor Class | | | (27,338 | ) | | | – | |
| Net decrease in net assets from distributions | | | (1,910,598 | ) | | | – | |
| SHARE TRANSACTIONS (NOTE 5): | | | | | | | | |
| Class A | | | | | | | | |
| Proceeds from sale of shares | | | 875,418 | | | | 842,288 | |
| Issued to shareholders in reinvestment of distributions | | | 1,591,552 | | | | – | |
| Cost of shares redeemed | | | (1,860,087 | ) | | | (3,072,936 | ) |
| Net increase/(decrease) from share transactions | | | 606,883 | | | | (2,230,648 | ) |
| Class C | | | | | | | | |
| Proceeds from sale of shares | | | 17,884 | | | | 614 | |
| Issued to shareholders in reinvestment of distributions | | | 21,254 | | | | – | |
| Cost of shares redeemed | | | (22,797 | ) | | | – | |
| Net increase from share transactions | | | 16,341 | | | | 614 | |
| Institutional Class | | | | | | | | |
| Proceeds from sale of shares | | | 282,451 | | | | 103,001 | |
| Issued to shareholders in reinvestment of distributions | | | 260,149 | | | | – | |
| Cost of shares redeemed | | | (242,872 | ) | | | (90,992 | ) |
| Net increase from share transactions | | | 299,728 | | | | 12,009 | |
| Investor Class | | | | | | | | |
| Proceeds from sale of shares | | | 53,100 | | | | 24,500 | |
| Issued to shareholders in reinvestment of distributions | | | 27,338 | | | | – | |
| Cost of shares redeemed | | | (20,835 | ) | | | – | |
| Net increase from share transactions | | | 59,603 | | | | 24,500 | |
| Net increase/(decrease) in net assets | | $ | 292,307 | | | $ | (569,341 | ) |
| NET ASSETS: | | | | | | | | |
| Beginning of period | | | 10,804,241 | | | | 11,373,582 | |
| End of period | | $ | 11,096,548 | | | $ | 10,804,241 | |
| Annual Report | April 30, 2019 | 39 |
| Emerald Insights Fund | Statements of Changes in Net Assets |
| | | Year Ended April 30, 2019 | | | Year Ended April 30, 2018 | |
| Other Information: | | | | | | | | |
| SHARE TRANSACTIONS: | | | | | | | | |
| Class A | | | | | | | | |
| Sold | | | 83,189 | | | | 67,803 | |
| Distributions reinvested | | | 169,134 | | | | – | |
| Redeemed | | | (147,542 | ) | | | (249,908 | ) |
| Net increase/(decrease) in shares outstanding | | | 104,781 | | | | (182,105 | ) |
| Class C | | | | | | | | |
| Sold | | | 2,031 | | | | 49 | |
| Distributions reinvested | | | 2,349 | | | | – | |
| Redeemed | | | (1,680 | ) | | | – | |
| Net increase in shares outstanding | | | 2,700 | | | | 49 | |
| Institutional Class | | | | | | | | |
| Sold | | | 19,447 | | | | 8,256 | |
| Distributions reinvested | | | 27,241 | | | | – | |
| Redeemed | | | (21,265 | ) | | | (7,228 | ) |
| Net increase in shares outstanding | | | 25,423 | | | | 1,028 | |
| Investor Class | | | | | | | | |
| Sold | | | 4,162 | | | | 1,890 | |
| Distributions reinvested | | | 2,921 | | | | – | |
| Redeemed | | | (1,500 | ) | | | – | |
| Net increase in shares outstanding | | | 5,583 | | | | 1,890 | |
See Notes to Financial Statements.
| 40 | www.emeraldmutualfunds.com |
| Emerald Banking and Finance Fund | Statements of Changes in Net Assets |
| | | Year Ended April 30, 2019 | | | Year Ended April 30, 2018 | |
| OPERATIONS: | | | | | | |
| Net investment loss | | $ | (2,526,089 | ) | | $ | (3,180,919 | ) |
| Net realized gain | | | 39,986,351 | | | | 59,497,046 | |
| Net change in unrealized appreciation/(depreciation) | | | (104,241,265 | ) | | | 6,208,469 | |
| Net increase/(decrease) in net assets resulting from operations | | | (66,781,003 | ) | | | 62,524,596 | |
| DISTRIBUTIONS TO SHAREHOLDERS (NOTE 3):(a) | | | | | | | | |
| Total amount of distributions | | | | | | | | |
| Class A | | | (24,656,256 | ) | | | (4,810,448 | ) |
| Class C | | | (13,297,550 | ) | | | (2,417,291 | ) |
| Institutional Class | | | (37,095,621 | ) | | | (5,388,614 | ) |
| Investor Class | | | (11,056,960 | ) | | | (1,956,089 | ) |
| Net decrease in net assets from distributions | | | (86,106,387 | ) | | | (14,572,442 | ) |
| SHARE TRANSACTIONS (NOTE 5): | | | | | | | | |
| Class A | | | | | | | | |
| Proceeds from sale of shares | | | 42,099,315 | | | | 61,794,273 | |
| Issued to shareholders in reinvestment of distributions | | | 20,425,832 | | | | 4,334,289 | |
| Cost of shares redeemed | | | (101,578,106 | ) | | | (82,932,615 | ) |
| Net decrease from share transactions | | | (39,052,959 | ) | | | (16,804,053 | ) |
| Class C | | | | | | | | |
| Proceeds from sale of shares | | | 8,581,109 | | | | 11,650,753 | |
| Issued to shareholders in reinvestment of distributions | | | 11,494,938 | | | | 2,128,924 | |
| Cost of shares redeemed | | | (26,316,417 | ) | | | (17,500,493 | ) |
| Net decrease from share transactions | | | (6,240,370 | ) | | | (3,720,816 | ) |
| Institutional Class | | | | | | | | |
| Proceeds from sale of shares | | | 96,435,931 | | | | 109,407,696 | |
| Issued to shareholders in reinvestment of distributions | | | 24,683,933 | | | | 3,157,033 | |
| Cost of shares redeemed | | | (115,500,368 | ) | | | (42,560,350 | ) |
| Net increase from share transactions | | | 5,619,496 | | | | 70,004,379 | |
| Investor Class | | | | | | | | |
| Proceeds from sale of shares | | | 16,871,872 | | | | 41,406,943 | |
| Issued to shareholders in reinvestment of distributions | | | 10,138,517 | | | | 1,838,759 | |
| Cost of shares redeemed | | | (36,983,304 | ) | | | (64,240,554 | ) |
| Net decrease from share transactions | | | (9,972,915 | ) | | | (20,994,852 | ) |
| Net increase/(decrease) in net assets | | $ | (202,534,138 | ) | | $ | 76,436,812 | |
| NET ASSETS: | | | | | | | | |
| Beginning of period | | | 544,199,054 | | | | 467,762,242 | |
| End of period | | $ | 341,664,916 | | | $ | 544,199,054 | |
| Annual Report | April 30, 2019 | 41 |
| Emerald Banking and Finance Fund | Statements of Changes in Net Assets |
| | | Year Ended April 30, 2019 | | | Year Ended April 30, 2018 | |
| Other Information: | | | | | | | | |
| SHARE TRANSACTIONS: | | | | | | | | |
| Class A | | | | | | | | |
| Sold | | | 975,875 | | | | 1,390,894 | |
| Distributions reinvested | | | 679,954 | | | | 92,023 | |
| Redeemed | | | (2,733,766 | ) | | | (1,873,252 | ) |
| Net decrease in shares outstanding | | | (1,077,937 | ) | | | (390,335 | ) |
| Class C | | | | | | | | |
| Sold | | | 233,767 | | | | 291,776 | |
| Distributions reinvested | | | 448,146 | | | | 50,822 | |
| Redeemed | | | (819,451 | ) | | | (448,025 | ) |
| Net decrease in shares outstanding | | | (137,538 | ) | | | (105,427 | ) |
| Institutional Class | | | | | | | | |
| Sold | | | 2,318,054 | | | | 2,429,922 | |
| Distributions reinvested | | | 798,833 | | | | 65,771 | |
| Redeemed | | | (3,002,806 | ) | | | (943,291 | ) |
| Net increase in shares outstanding | | | 114,081 | | | | 1,552,402 | |
| Investor Class | | | | | | | | |
| Sold | | | 392,263 | | | | 976,209 | |
| Distributions reinvested | | | 356,613 | | | | 40,807 | |
| Redeemed | | | (1,028,361 | ) | | | (1,546,423 | ) |
| Net decrease in shares outstanding | | | (279,485 | ) | | | (529,407 | ) |
| (a) | For the year ended April 30, 2018, total distributions consisted of Net Investment Income of $–, and Net Realized Gains of $14,572,442. |
See Notes to Financial Statements.
| 42 | www.emeraldmutualfunds.com |
| Emerald Growth Fund | Financial Highlights |
For a share outstanding throughout the years presented
| | | CLASS A | |
| | | Year Ended April 30, 2019 | | Year Ended April 30, 2018 | | Year Ended April 30, 2017 | | Year Ended April 30, 2016 | | Year Ended April 30, 2015 | |
| NET ASSET VALUE, BEGINNING OF PERIOD | | $ | 25.99 | | $ | 21.83 | | $ | 17.52 | | $ | 20.02 | | $ | 18.11 | |
| INCOME/(LOSS) FROM OPERATIONS: | | | | | | | | | | | | | | | | |
| Net investment loss(a) | | | (0.13 | ) | | (0.16 | ) | | (0.11 | ) | | (0.15 | ) | | (0.18 | ) |
| Net realized and unrealized gain/(loss) on investments | | | 2.61 | | | 4.32 | | | 4.42 | | | (1.88 | ) | | 3.43 | |
| Total from Investment Operations | | | 2.48 | | | 4.16 | | | 4.31 | | | (2.03 | ) | | 3.25 | |
| | | | | | | | | | | | | | | | | |
| LESS DISTRIBUTIONS: | | | | | | | | | | | | | | | | |
| From capital gains | | | (2.47 | ) | | – | | | – | | | (0.47 | ) | | (1.34 | ) |
| Total Distributions | | | (2.47 | ) | | – | | | – | | | (0.47 | ) | | (1.34 | ) |
| NET INCREASE/(DECREASE) IN NET ASSET VALUE | | | 0.01 | | | 4.16 | | | 4.31 | | | (2.50 | ) | | 1.91 | |
| NET ASSET VALUE, END OF PERIOD | | $ | 26.00 | | $ | 25.99 | | $ | 21.83 | | $ | 17.52 | | $ | 20.02 | |
| | | | | | | | | | | | | | | | | |
| TOTAL RETURN(b) | | | 11.79 | % | | 19.06 | % | | 24.60 | % | | (10.28 | )% | | 18.38 | % |
| RATIOS/SUPPLEMENTAL DATA: | | | | | | | | | | | | | | | | |
| Net Assets, End of Period (000s) | | $ | 188,883 | | $ | 239,316 | | $ | 270,389 | | $ | 323,603 | | $ | 123,828 | |
| RATIOS TO AVERAGE NET ASSETS: | | | | | | | | | | | | | | | | |
| Net Investment loss | | | (0.50 | )% | | (0.64 | )% | | (0.57 | )% | | (0.81 | )% | | (0.93 | )% |
| Operating expenses excluding reimbursement/waiver | | | 1.01 | % | | 1.03 | % | | 1.08 | % | | 1.17 | % | | 1.29 | % |
| Operating expenses including reimbursement/waiver | | | 1.01 | % | | 1.03 | % | | 1.08 | % | | 1.17 | % | | 1.29 | % |
| PORTFOLIO TURNOVER RATE | | | 64 | % | | 66 | % | | 54 | % | | 45 | % | | 68 | % |
| (a) | Per share amounts are based upon average shares outstanding. |
| (b) | Total return does not reflect the effect of sales charges. |
See Notes to Financial Statements.
| Annual Report | April 30, 2019 | 43 |
| Emerald Growth Fund | Financial Highlights |
For a share outstanding throughout the years presented
| | | CLASS C | |
| | | Year Ended April 30, 2019 | | Year Ended April 30, 2018 | | Year Ended April 30, 2017 | | Year Ended April 30, 2016 | | Year Ended April 30, 2015 | |
| NET ASSET VALUE, BEGINNING OF PERIOD | | $ | 22.18 | | $ | 18.75 | | $ | 15.14 | | $ | 17.48 | | $ | 16.07 | |
| INCOME/(LOSS) FROM OPERATIONS: | | | | | | | | | | | | | | | | |
| Net investment loss(a) | | | (0.26 | ) | | (0.27 | ) | | (0.21 | ) | | (0.24 | ) | | (0.27 | ) |
| Net realized and unrealized gain/(loss) on investments | | | 2.14 | | | 3.70 | | | 3.82 | | | (1.63 | ) | | 3.02 | |
| Total from Investment Operations | | | 1.88 | | | 3.43 | | | 3.61 | | | (1.87 | ) | | 2.75 | |
| | | | | | | | | | | | | | | | | |
| LESS DISTRIBUTIONS: | | | | | | | | | | | | | | | | |
| From capital gains | | | (2.47 | ) | | – | | | – | | | (0.47 | ) | | (1.34 | ) |
| Total Distributions | | | (2.47 | ) | | – | | | – | | | (0.47 | ) | | (1.34 | ) |
| NET INCREASE/(DECREASE) IN NET ASSET VALUE | | | (0.59 | ) | | 3.43 | | | 3.61 | | | (2.34 | ) | | 1.41 | |
| NET ASSET VALUE, END OF PERIOD | | $ | 21.59 | | $ | 22.18 | | $ | 18.75 | | $ | 15.14 | | $ | 17.48 | |
| | | | | | | | | | | | | | | | | |
| TOTAL RETURN(b) | | | 11.08 | % | | 18.29 | % | | 23.84 | % | | (10.87 | )% | | 17.58 | % |
| RATIOS/SUPPLEMENTAL DATA: | | | | | | | | | | | | | | | | |
| Net Assets, End of Period (000s) | | $ | 29,975 | | $ | 33,197 | | $ | 34,642 | | $ | 42,075 | | $ | 15,427 | |
| RATIOS TO AVERAGE NET ASSETS: | | | | | | | | | | | | | | | | |
| Net Investment loss | | | (1.15 | )% | | (1.30 | )% | | (1.22 | )% | | (1.46 | )% | | (1.58 | )% |
| Operating expenses excluding reimbursement/waiver | | | 1.66 | % | | 1.68 | % | | 1.73 | % | | 1.81 | % | | 1.94 | % |
| Operating expenses including reimbursement/waiver | | | 1.66 | % | | 1.68 | % | | 1.73 | % | | 1.81 | % | | 1.94 | % |
| PORTFOLIO TURNOVER RATE | | | 64 | % | | 66 | % | | 54 | % | | 45 | % | | 68 | % |
| (a) | Per share amounts are based upon average shares outstanding. |
| (b) | Total return does not reflect the effect of sales charges. |
See Notes to Financial Statements.
| 44 | www.emeraldmutualfunds.com |
| Emerald Growth Fund | Financial Highlights |
For a share outstanding throughout the years presented
| | | INSTITUTIONAL CLASS | |
| | | Year Ended April 30, 2019 | | Year Ended April 30, 2018 | | Year Ended April 30, 2017 | | Year Ended April 30, 2016 | | Year Ended April 30, 2015 | |
| NET ASSET VALUE, BEGINNING OF PERIOD | | $ | 26.94 | | $ | 22.56 | | $ | 18.04 | | $ | 20.54 | | $ | 18.49 | |
| INCOME/(LOSS) FROM OPERATIONS: | | | | | | | | | | | | | | | | |
| Net investment loss(a) | | | (0.05 | ) | | (0.09 | ) | | (0.05 | ) | | (0.10 | ) | | (0.12 | ) |
| Net realized and unrealized gain/(loss) on investments | | | 2.74 | | | 4.47 | | | 4.57 | | | (1.93 | ) | | 3.51 | |
| Total from Investment Operations | | | 2.69 | | | 4.38 | | | 4.52 | | | (2.03 | ) | | 3.39 | |
| | | | | | | | | | | | | | | | | |
| LESS DISTRIBUTIONS: | | | | | | | | | | | | | | | | |
| From capital gains | | | (2.47 | ) | | – | | | – | | | (0.47 | ) | | (1.34 | ) |
| Total Distributions | | | (2.47 | ) | | – | | | – | | | (0.47 | ) | | (1.34 | ) |
| NET INCREASE/(DECREASE) IN NET ASSET VALUE | | | 0.22 | | | 4.38 | | | 4.52 | | | (2.50 | ) | | 2.05 | |
| NET ASSET VALUE, END OF PERIOD | | $ | 27.16 | | $ | 26.94 | | $ | 22.56 | | $ | 18.04 | | $ | 20.54 | |
| | | | | | | | | | | | | | | | | |
| TOTAL RETURN | | | 12.17 | % | | 19.41 | % | | 25.06 | % | | (9.97 | )% | | 18.77 | % |
| RATIOS/SUPPLEMENTAL DATA: | | | | | | | | | | | | | | | | |
| Net Assets, End of Period (000s) | | $ | 1,050,538 | | $ | 839,076 | | $ | 596,550 | | $ | 453,190 | | $ | 174,107 | |
| RATIOS TO AVERAGE NET ASSETS: | | | | | | | | | | | | | | | | |
| Net Investment loss | | | (0.18 | )% | | (0.33 | )% | | (0.26 | )% | | (0.51 | )% | | (0.63 | )% |
| Operating expenses excluding reimbursement/waiver | | | 0.69 | % | | 0.72 | % | | 0.77 | % | | 0.87 | % | | 0.99 | % |
| Operating expenses including reimbursement/waiver | | | 0.69 | % | | 0.72 | % | | 0.77 | % | | 0.87 | % | | 0.99 | % |
| PORTFOLIO TURNOVER RATE | | | 64 | % | | 66 | % | | 54 | % | | 45 | % | | 68 | % |
| (a) | Per share amounts are based upon average shares outstanding. |
See Notes to Financial Statements.
| Annual Report | April 30, 2019 | 45 |
| Emerald Growth Fund | Financial Highlights |
For a share outstanding throughout the years presented
| | | INVESTOR CLASS | |
| | | Year Ended April 30, 2019 | | Year Ended April 30, 2018 | | Year Ended April 30, 2017 | | Year Ended April 30, 2016 | | Year Ended April 30, 2015 | |
| NET ASSET VALUE, BEGINNING OF PERIOD | | $ | 25.88 | | $ | 21.75 | | $ | 17.46 | | $ | 19.97 | | $ | 18.06 | |
| INCOME/(LOSS) FROM OPERATIONS: | | | | | | | | | | | | | | | | |
| Net investment loss(a) | | | (0.14 | ) | | (0.17 | ) | | (0.12 | ) | | (0.16 | ) | | (0.17 | ) |
| Net realized and unrealized gain/(loss) on investments | | | 2.61 | | | 4.30 | | | 4.41 | | | (1.88 | ) | | 3.42 | |
| Total from Investment Operations | | | 2.47 | | | 4.13 | | | 4.29 | | | (2.04 | ) | | 3.25 | |
| | | | | | | | | | | | | | | | | |
| LESS DISTRIBUTIONS: | | | | | | | | | | | | | | | | |
| From capital gains | | | (2.47 | ) | | – | | | – | | | (0.47 | ) | | (1.34 | ) |
| Total Distributions | | | (2.47 | ) | | – | | | – | | | (0.47 | ) | | (1.34 | ) |
| NET INCREASE/(DECREASE) IN NET ASSET VALUE | | | 0.00 | | | 4.13 | | | 4.29 | | | (2.51 | ) | | 1.91 | |
| NET ASSET VALUE, END OF PERIOD | | $ | 25.88 | | $ | 25.88 | | $ | 21.75 | | $ | 17.46 | | $ | 19.97 | |
| | | | | | | | | | | | | | | | | |
| TOTAL RETURN | | | 11.81 | % | | 18.99 | % | | 24.57 | % | | (10.36 | )% | | 18.44 | % |
| RATIOS/SUPPLEMENTAL DATA: | | | | | | | | | | | | | | | | |
| Net Assets, End of Period (000s) | | $ | 104,403 | | $ | 107,629 | | $ | 114,033 | | $ | 112,526 | | $ | 23,517 | |
| RATIOS TO AVERAGE NET ASSETS: | | | | | | | | | | | | | | | | |
| Net Investment loss | | | (0.53 | )% | | (0.68 | )% | | (0.61 | )% | | (0.84 | )% | | (0.91 | )% |
| Operating expenses excluding reimbursement/waiver | | | 1.04 | % | | 1.07 | % | | 1.12 | % | | 1.19 | % | | 1.27 | % |
| Operating expenses including reimbursement/waiver | | | 1.04 | % | | 1.07 | % | | 1.12 | % | | 1.19 | % | | 1.27 | % |
| PORTFOLIO TURNOVER RATE | | | 64 | % | | 66 | % | | 54 | % | | 45 | % | | 68 | % |
| (a) | Per share amounts are based upon average shares outstanding. |
See Notes to Financial Statements.
| 46 | www.emeraldmutualfunds.com |
| Emerald Small Cap Value Fund | Financial Highlights |
For a share outstanding throughout the periods presented
| | | CLASS A | |
| | | Year Ended April 30, 2019 | | Year Ended April 30, 2018 | | Year Ended April 30, 2017 | | For the Period October 1, 2015 to April 30, 2016(a) | | Period Ended September 30, 2015(b) | |
| NET ASSET VALUE, BEGINNING OF PERIOD | | $ | 10.45 | | $ | 16.27 | | $ | 13.00 | | $ | 12.70 | | $ | 14.12 | |
| INCOME/(LOSS) FROM OPERATIONS: | | | | | | | | | | | | | | | | |
| Net investment loss(c) | | | (0.02 | ) | | (0.06 | )(d) | | (0.07 | )(d) | | (0.09 | ) | | (0.01 | ) |
| Net realized and unrealized gain/(loss) on investments | | | (1.06 | ) | | 2.13 | | | 3.34 | | | 0.44 | | | (1.03 | ) |
| Total from Investment Operations | | | (1.08 | ) | | 2.07 | | | 3.27 | | | 0.35 | | | (1.04 | ) |
| | | | | | | | | | | | | | | | | |
| LESS DISTRIBUTIONS: | | | | | | | | | | | | | | | | |
| From investment income | | | – | | | – | | | – | | | (0.05 | ) | | – | |
| From capital gains | | | (2.08 | ) | | (7.89 | ) | | – | | | – | | | (0.38 | ) |
| Total Distributions | | | (2.08 | ) | | (7.89 | ) | | – | | | (0.05 | ) | | (0.38 | ) |
| NET INCREASE/(DECREASE) IN NET ASSET VALUE | | | (3.16 | ) | | (5.82 | ) | | 3.27 | | | 0.30 | | | (1.42 | ) |
| NET ASSET VALUE, END OF PERIOD | | $ | 7.29 | | $ | 10.45 | | $ | 16.27 | | $ | 13.00 | | $ | 12.70 | |
| | | | | | | | | | | | | | | | | |
| TOTAL RETURN(e) | | | (7.30 | )% | | 12.41 | % | | 25.15 | % | | 2.77 | %(f) | | (7.49 | )%(f) |
| RATIOS/SUPPLEMENTAL DATA: | | | | | | | | | | | | | | | | |
| Net Assets, End of Period (000s) | | $ | 2,664 | | $ | 3,959 | | $ | 1,909 | | $ | 340 | | $ | 14 | |
| RATIOS TO AVERAGE NET ASSETS: | | | | | | | | | | | | | | | | |
| Net Investment loss | | | (0.19 | )% | | (0.42 | )% | | (0.46 | )% | | (1.13 | )%(g) | | (0.24 | )%(g) |
| Operating expenses excluding reimbursement/waiver | | | 2.89 | % | | 2.56 | % | | 2.26 | % | | 2.69 | %(g) | | 2.16 | %(g) |
| Operating expenses including reimbursement/waiver | | | 1.35 | % | | 1.35 | % | | 1.35 | % | | 1.35 | %(g) | | 1.35 | %(g) |
| PORTFOLIO TURNOVER RATE | | | 101 | % | | 71 | % | | 66 | % | | 31 | %(f) | | 69 | %(f)(h) |
| (a) | Effective March 3, 2015 the Board approved changing the fiscal year-end of the Fund from September 30 to April 30. |
| (b) | Class A commenced operations on June 30, 2015. |
| (c) | Per share amounts are based upon average shares outstanding. |
| (d) | The amount shown for a share outstanding throughout the period may not correlate with the Statement of Operations for the period due to the timing of sales and redemptions of Fund shares in relation to income earned and/or fluctuating market value of the investments of the Fund. |
| (e) | Total return does not reflect the effect of sales charges. |
| (h) | Portfolio turnover rate is calculated at the Fund level and represents the year ended September 30, 2015. |
See Notes to Financial Statements.
| Annual Report | April 30, 2019 | 47 |
| Emerald Small Cap Value Fund | Financial Highlights |
For a share outstanding throughout the periods presented
| | | CLASS C | |
| | | Year Ended April 30, 2019 | | Year Ended April 30, 2018 | | Year Ended April 30, 2017 | | For the Period October 1, 2015 to April 30, 2016(a) | | Period Ended September 30, 2015(b) | |
| NET ASSET VALUE, BEGINNING OF PERIOD | | $ | 10.15 | | $ | 16.10 | | $ | 12.94 | | $ | 12.68 | | $ | 14.12 | |
| INCOME/(LOSS) FROM OPERATIONS: | | | | | | | | | | | | | | | | |
| Net investment loss(c) | | | (0.08 | ) | | (0.13 | )(d) | | (0.13 | )(d) | | (0.14 | ) | | (0.03 | ) |
| Net realized and unrealized gain/(loss) on investments | | | (1.03 | ) | | 2.07 | | | 3.29 | | | 0.43 | | | (1.03 | ) |
| Total from Investment Operations | | | (1.11 | ) | | 1.94 | | | 3.16 | | | 0.29 | | | (1.06 | ) |
| | | | | | | | | | | | | | | | | |
| LESS DISTRIBUTIONS: | | | | | | | | | | | | | | | | |
| From investment income | | | – | | | – | | | – | | | (0.03 | ) | | – | |
| From capital gains | | | (2.08 | ) | | (7.89 | ) | | – | | | – | | | (0.38 | ) |
| Total Distributions | | | (2.08 | ) | | (7.89 | ) | | – | | | (0.03 | ) | | (0.38 | ) |
| NET INCREASE/(DECREASE) IN NET ASSET VALUE | | | (3.19 | ) | | (5.95 | ) | | 3.16 | | | 0.26 | | | (1.44 | ) |
| NET ASSET VALUE, END OF PERIOD | | $ | 6.96 | | $ | 10.15 | | $ | 16.10 | | $ | 12.94 | | $ | 12.68 | |
| | | | | | | | | | | | | | | | | |
| TOTAL RETURN(e) | | | (7.88 | )% | | 11.63 | % | | 24.42 | % | | 2.28 | %(f) | | (7.63 | )%(f) |
| RATIOS/SUPPLEMENTAL DATA: | | | | | | | | | | | | | | | | |
| Net Assets, End of Period (000s) | | $ | 38 | | $ | 108 | | $ | 211 | | $ | 566 | | $ | 14 | |
| RATIOS TO AVERAGE NET ASSETS: | | | | | | | | | | | | | | | | |
| Net Investment loss | | | (0.88 | )% | | (0.98 | )% | | (0.93 | )% | | (2.06 | )%(g) | | (0.89 | )%(g) |
| Operating expenses excluding reimbursement/waiver | | | 3.44 | % | | 3.20 | % | | 2.70 | % | | 3.37 | %(g) | | 2.81 | %(g) |
| Operating expenses including reimbursement/waiver | | | 2.00 | % | | 2.00 | % | | 2.00 | % | | 2.00 | %(g) | | 2.00 | %(g) |
| PORTFOLIO TURNOVER RATE | | | 101 | % | | 71 | % | | 66 | % | | 31 | %(f) | | 69 | %(f)(h) |
| (a) | Effective March 3, 2015 the Board approved changing the fiscal year-end of the Fund from September 30 to April 30. |
| (b) | Class C commenced operations on June 30, 2015. |
| (c) | Per share amounts are based upon average shares outstanding. |
| (d) | The amount shown for a share outstanding throughout the period may not correlate with the Statement of Operations for the period due to the timing of sales and redemptions of Fund shares in relation to income earned and/or fluctuating market value of the investments of the Fund. |
| (e) | Total return does not reflect the effect of sales charges. |
| (h) | Portfolio turnover rate is calculated at the Fund level and represents the year ended September 30, 2015. |
See Notes to Financial Statements.
| 48 | www.emeraldmutualfunds.com |
| Emerald Small Cap Value Fund | Financial Highlights |
For a share outstanding throughout the periods presented
| | | INSTITUTIONAL CLASS | |
| | | Year Ended April 30, 2019 | | Year Ended April 30, 2018 | | Year Ended April 30, 2017 | | For the Period October 1, 2015 to April 30, 2016(a) | | Year Ended September 30, 2015(b) | | Year Ended September 30, 2014 | |
| NET ASSET VALUE, BEGINNING OF PERIOD | | $ | 10.59 | | $ | 16.35 | | $ | 13.02 | | $ | 12.71 | | $ | 12.76 | | $ | 12.56 | |
| INCOME FROM OPERATIONS: | | | | | | | | | | | | | | | | | | | |
| Net investment income/(loss)(c) | | | 0.01 | | | 0.00 | (d) | | 0.02 | | | (0.01 | ) | | 0.06 | | | 0.09 | |
| Net realized and unrealized gain/(loss) on investments | | | (1.06 | ) | | 2.13 | | | 3.31 | | | 0.38 | | | 0.33 | | | 0.76 | |
| Total from Investment Operations | | | (1.05 | ) | | 2.13 | | | 3.33 | | | 0.37 | | | 0.39 | | | 0.85 | |
| | | | | | | | | | | | | | | | | | | | |
| LESS DISTRIBUTIONS: | | | | | | | | | | | | | | | | | | | |
| From investment income | | | – | | | – | | | – | | | (0.06 | ) | | (0.06 | ) | | (0.01 | ) |
| From capital gains | | | (2.08 | ) | | (7.89 | ) | | – | | | – | | | (0.38 | ) | | (0.64 | ) |
| Total Distributions | | | (2.08 | ) | | (7.89 | ) | | – | | | (0.06 | ) | | (0.44 | ) | | (0.65 | ) |
| NET INCREASE/(DECREASE) IN NET ASSET VALUE | | | (3.13 | ) | | (5.76 | ) | | 3.33 | | | 0.31 | | | (0.05 | ) | | 0.20 | |
| NET ASSET VALUE, END OF PERIOD | | $ | 7.46 | | $ | 10.59 | | $ | 16.35 | | $ | 13.02 | | $ | 12.71 | | $ | 12.76 | |
| | | | | | | | | | | | | | | | | | | | |
| TOTAL RETURN | | | (6.90 | )% | | 12.76 | % | | 25.58 | % | | 2.94 | %(e) | | 2.93 | % | | 6.64 | % |
| SUPPLEMENTAL DATA: | | | | | | | | | | | | | | | | | | | |
| Net Assets, End of Period (000s) | | $ | 874 | | $ | 3,177 | | $ | 4,989 | | $ | 13,691 | | $ | 16,507 | | $ | 24,343 | |
| RATIOS TO AVERAGE NET ASSETS: | | | | | | | | | | | | | | | | | | | |
| Net Investment income/(loss) | | | 0.13 | % | | 0.02 | % | | 0.13 | % | | (0.07 | )%(f) | | 0.45 | % | | 0.65 | % |
| Operating expenses excluding reimbursement/waiver | | | 2.44 | % | | 2.20 | % | | 1.56 | % | | 1.75 | %(f) | | 1.43 | % | | 1.29 | % |
| Operating expenses including reimbursement/waiver | | | 1.00 | % | | 1.00 | % | | 1.00 | % | | 1.00 | %(f) | | 1.00 | % | | 1.00 | % |
| PORTFOLIO TURNOVER RATE | | | 101 | % | | 71 | % | | 66 | % | | 31 | %(e) | | 69 | % | | 49 | % |
| (a) | Effective March 3, 2015 the Board approved changing the fiscal year-end of the Fund from September 30 to April 30. |
| (b) | Prior to its June 26, 2015 reorganization with and into the Emerald Small Cap Value Fund, the Fund was known as the Elessar Small Cap Value Fund. |
| (c) | Per share amounts are based upon average shares outstanding. |
| (d) | Less than $0.005 per share. |
See Notes to Financial Statements.
| Annual Report | April 30, 2019 | 49 |
| Emerald Small Cap Value Fund | Financial Highlights |
For a share outstanding throughout the periods presented
| | | INVESTOR CLASS | |
| | | Year Ended April 30, 2019 | | Year Ended April 30, 2018 | | Year Ended April 30, 2017 | | For the Period October 1, 2015 to April 30, 2016(a) | | Year Ended September 30, 2015(b) | | Year Ended September 30, 2014 | |
| NET ASSET VALUE, BEGINNING OF PERIOD | | $ | 10.46 | | $ | 16.26 | | $ | 12.98 | | $ | 12.68 | | $ | 12.73 | | $ | 12.54 | |
| INCOME FROM OPERATIONS: | | | | | | | | | | | | | | | | | | | |
| Net investment income/(loss)(c) | | | (0.01 | ) | | (0.04 | )(d) | | (0.02 | )(d) | | (0.02 | ) | | 0.03 | | | 0.07 | |
| Net realized and unrealized gain/(loss) on investments | | | (1.04 | ) | | 2.13 | | | 3.30 | | | 0.37 | | | 0.35 | | | 0.76 | |
| Total from Investment Operations | | | (1.05 | ) | | 2.09 | | | 3.28 | | | 0.35 | | | 0.38 | | | 0.83 | |
| | | | | | | | | | | | | | | | | | | | |
| LESS DISTRIBUTIONS: | | | | | | | | | | | | | | | | | | | |
| From investment income | | | – | | | – | | | – | | | (0.05 | ) | | (0.05 | ) | | – | |
| From capital gains | | | (2.08 | ) | | (7.89 | ) | | – | | | – | | | (0.38 | ) | | (0.64 | ) |
| Total Distributions | | | (2.08 | ) | | (7.89 | ) | | – | | | (0.05 | ) | | (0.43 | ) | | (0.64 | ) |
| NET INCREASE/(DECREASE) IN NET ASSET VALUE | | | (3.13 | ) | | (5.80 | ) | | 3.28 | | | 0.30 | | | (0.05 | ) | | 0.19 | |
| NET ASSET VALUE, END OF PERIOD | | $ | 7.33 | | $ | 10.46 | | $ | 16.26 | | $ | 12.98 | | $ | 12.68 | | $ | 12.73 | |
| | | | | | | | | | | | | | | | | | | | |
| TOTAL RETURN | | | (6.99 | )% | | 12.54 | % | | 25.27 | % | | 2.80 | %(e) | | 2.82 | % | | 6.46 | % |
| SUPPLEMENTAL DATA: | | | | | | | | | | | | | | | | | | | |
| Net Assets, End of Period (000s) | | $ | 509 | | $ | 556 | | $ | 614 | | $ | 1,946 | | $ | 399 | | $ | 474 | |
| RATIOS TO AVERAGE NET ASSETS: | | | | | | | | | | | | | | | | | | | |
| Net Investment income/(loss) | | | (0.10 | )% | | (0.25 | )% | | (0.11 | )% | | (0.25 | )%(f) | | 0.22 | % | | 0.52 | % |
| Operating expenses excluding reimbursement/waiver | | | 2.83 | % | | 2.44 | % | | 1.83 | % | | 2.14 | %(f) | | 1.67 | % | | 1.56 | % |
| Operating expenses including reimbursement/waiver | | | 1.25 | % | | 1.25 | % | | 1.25 | % | | 1.25 | %(f) | | 1.25 | % | | 1.25 | % |
| PORTFOLIO TURNOVER RATE | | | 101 | % | | 71 | % | | 66 | % | | 31 | %(e) | | 69 | % | | 49 | % |
| (a) | Effective March 3, 2015 the Board approved changing the fiscal year-end of the Fund from September 30 to April 30. |
| (b) | Prior to its June 26, 2015 reorganization with and into the Emerald Small Cap Value Fund, the Fund was known as the Elessar Small Cap Value Fund. |
| (c) | Per share amounts are based upon average shares outstanding. |
| (d) | The amount shown for a share outstanding throughout the period may not correlate with the Statement of Operations for the period due to the timing of sales and redemptions of Fund shares in relation to income earned and/or fluctuating market value of the investments of the Fund. |
See Notes to Financial Statements.
| 50 | www.emeraldmutualfunds.com |
| Emerald Insights Fund | Financial Highlights |
For a share outstanding throughout the periods presented
| | | CLASS A | |
| | | Year Ended April 30, 2019 | | Year Ended April 30, 2018 | | Year Ended April 30, 2017 | | Year Ended April 30, 2016 | | For the Period August 1, 2014 (Inception) to April 30, 2015 | |
| NET ASSET VALUE, BEGINNING OF PERIOD | | $ | 13.09 | | $ | 11.33 | | $ | 9.69 | | $ | 10.98 | | $ | 10.00 | |
| INCOME/(LOSS) FROM OPERATIONS: | | | | | | | | | | | | | | | | |
| Net investment loss(a) | | | (0.09 | ) | | (0.07 | ) | | (0.06 | ) | | (0.05 | ) | | (0.05 | ) |
| Net realized and unrealized gain/(loss) on investments | | | 1.04 | | | 1.83 | | | 1.70 | | | (1.24 | ) | | 1.03 | |
| Total from Investment Operations | | | 0.95 | | | 1.76 | | | 1.64 | | | (1.29 | ) | | 0.98 | |
| | | | | | | | | | | | | | | | | |
| LESS DISTRIBUTIONS: | | | | | | | | | | | | | | | | |
| From capital gains | | | (2.53 | ) | | – | | | – | | | – | | | – | |
| Total Distributions | | | (2.53 | ) | | – | | | – | | | – | | | – | |
| NET INCREASE/(DECREASE) IN NET ASSET VALUE | | | (1.58 | ) | | 1.76 | | | 1.64 | | | (1.29 | ) | | 0.98 | |
| NET ASSET VALUE, END OF PERIOD | | $ | 11.51 | | $ | 13.09 | | $ | 11.33 | | $ | 9.69 | | $ | 10.98 | |
| | | | | | | | | | | | | | | | | |
| TOTAL RETURN(b) | | | 11.53 | % | | 15.53 | % | | 16.92 | % | | (11.75 | %) | | 9.80 | %(c) |
| RATIOS/SUPPLEMENTAL DATA: | | | | | | | | | | | | | | | | |
| Net Assets, End of Period (000s) | | $ | 9,397 | | $ | 9,321 | | $ | 10,127 | | $ | 11,388 | | $ | 6,493 | |
| RATIOS TO AVERAGE NET ASSETS: | | | | | | | | | | | | | | | | |
| Net Investment loss | | | (0.71 | %) | | (0.58 | %) | | (0.57 | %) | | (0.54 | %) | | (0.66 | %)(d) |
| Operating expenses excluding reimbursement/waiver | | | 2.18 | % | | 2.10 | % | | 2.10 | % | | 2.01 | % | | 2.57 | %(d)(e) |
| Operating expenses including reimbursement/waiver | | | 1.35 | % | | 1.35 | % | | 1.35 | % | | 1.35 | % | | 1.35 | %(d)(e) |
| PORTFOLIO TURNOVER RATE | | | 63 | % | | 138 | % | | 75 | % | | 99 | % | | 88 | %(c) |
| (a) | Per share amounts are based upon average shares outstanding. |
| (b) | Total return does not reflect the effect of sales charges. |
| (e) | Expense ratios before reductions for startup costs may not be representative of longer term operating periods. |
See Notes to Financial Statements.
| Annual Report | April 30, 2019 | 51 |
| Emerald Insights Fund | Financial Highlights |
For a share outstanding throughout the periods presented
| | | CLASS C | |
| | | Year Ended April 30, 2019 | | Year Ended April 30, 2018 | | Year Ended April 30, 2017 | | Year Ended April 30, 2016 | | For the Period August 1, 2014 (Inception) to April 30, 2015 | |
| NET ASSET VALUE, BEGINNING OF PERIOD | | $ | 12.75 | | $ | 11.11 | | $ | 9.56 | | $ | 10.92 | | $ | 10.00 | |
| INCOME/(LOSS) FROM OPERATIONS: | | | | | | | | | | | | | | | | |
| Net investment loss(a) | | | (0.16 | ) | | (0.15 | ) | | (0.13 | ) | | (0.11 | ) | | (0.10 | ) |
| Net realized and unrealized gain/(loss) on investments | | | 0.98 | | | 1.79 | | | 1.68 | | | (1.25 | ) | | 1.02 | |
| Total from Investment Operations | | | 0.82 | | | 1.64 | | | 1.55 | | | (1.36 | ) | | 0.92 | |
| | | | | | | | | | | | | | | | | |
| LESS DISTRIBUTIONS: | | | | | | | | | | | | | | | | |
| From capital gains | | | (2.53 | ) | | – | | | – | | | – | | | – | |
| Total Distributions | | | (2.53 | ) | | – | | | – | | | – | | | – | |
| NET INCREASE/(DECREASE) IN NET ASSET VALUE | | | (1.71 | ) | | 1.64 | | | 1.55 | | | (1.36 | ) | | 0.92 | |
| NET ASSET VALUE, END OF PERIOD | | $ | 11.04 | | $ | 12.75 | | $ | 11.11 | | $ | 9.56 | | $ | 10.92 | |
| | | | | | | | | | | | | | | | | |
| TOTAL RETURN(b) | | | 10.75 | % | | 14.76 | % | | 16.21 | % | | (12.45 | %) | | 9.20 | %(c) |
| RATIOS/SUPPLEMENTAL DATA: | | | | | | | | | | | | | | | | |
| Net Assets, End of Period (000s) | | $ | 141 | | $ | 129 | | $ | 112 | | $ | 101 | | $ | 27 | |
| RATIOS TO AVERAGE NET ASSETS: | | | | | | | | | | | | | | | | |
| Net Investment loss | | | (1.36 | %) | | (1.24 | %) | | (1.22 | %) | | (1.17 | %) | | (1.34 | %)(d) |
| Operating expenses excluding reimbursement/waiver | | | 2.84 | % | | 2.75 | % | | 2.76 | % | | 2.70 | % | | 7.25 | %(d)(e) |
| Operating expenses including reimbursement/waiver | | | 2.00 | % | | 2.00 | % | | 2.00 | % | | 2.00 | % | | 2.00 | %(d)(e) |
| PORTFOLIO TURNOVER RATE | | | 63 | % | | 138 | % | | 75 | % | | 99 | % | | 88 | %(c) |
| (a) | Per share amounts are based upon average shares outstanding. |
| (b) | Total return does not reflect the effect of sales charges. |
| (e) | Expense ratios before reductions for startup costs may not be representative of longer term operating periods. |
See Notes to Financial Statements.
| 52 | www.emeraldmutualfunds.com |
| Emerald Insights Fund | Financial Highlights |
For a share outstanding throughout the periods presented
| | | INSTITUTIONAL CLASS | |
| | | Year Ended April 30, 2019 | | Year Ended April 30, 2018 | | Year Ended April 30, 2017 | | Year Ended April 30, 2016 | | For the Period August 1, 2014 (Inception) to April 30, 2015 | |
| NET ASSET VALUE, BEGINNING OF PERIOD | | $ | 13.22 | | $ | 11.41 | | $ | 9.73 | | $ | 10.99 | | $ | 10.00 | |
| INCOME/(LOSS) FROM OPERATIONS: | | | | | | | | | | | | | | | | |
| Net investment loss(a) | | | (0.05 | ) | | (0.04 | ) | | (0.03 | ) | | (0.00 | )(b) | | (0.03 | ) |
| Net realized and unrealized gain/(loss) on investments | | | 1.05 | | | 1.85 | | | 1.71 | | | (1.26 | ) | | 1.02 | |
| Total from Investment Operations | | | 1.00 | | | 1.81 | | | 1.68 | | | (1.26 | ) | | 0.99 | |
| | | | | | | | | | | | | | | | | |
| LESS DISTRIBUTIONS: | | | | | | | | | | | | | | | | |
| From capital gains | | | (2.53 | ) | | – | | | – | | | – | | | – | |
| Total Distributions | | | (2.53 | ) | | – | | | – | | | – | | | – | |
| NET INCREASE/(DECREASE) IN NET ASSET VALUE | | | (1.53 | ) | | 1.81 | | | 1.68 | | | (1.26 | ) | | 0.99 | |
| NET ASSET VALUE, END OF PERIOD | | $ | 11.69 | | $ | 13.22 | | $ | 11.41 | | $ | 9.73 | | $ | 10.99 | |
| | | | | | | | | | | | | | | | | |
| TOTAL RETURN | | | 11.81 | % | | 15.86 | % | | 17.27 | % | | (11.46 | %) | | 9.90 | %(c) |
| RATIOS/SUPPLEMENTAL DATA: | | | | | | | | | | | | | | | | |
| Net Assets, End of Period (000s) | | $ | 1,383 | | $ | 1,228 | | $ | 1,048 | | $ | 1,729 | | $ | 279 | |
| RATIOS TO AVERAGE NET ASSETS: | | | | | | | | | | | | | | | | |
| Net Investment loss | | | (0.41 | %) | | (0.29 | %) | | (0.28 | %) | | (0.05 | %) | | (0.34 | %)(d) |
| Operating expenses excluding reimbursement/waiver | | | 1.87 | % | | 1.77 | % | | 1.78 | % | | 1.90 | % | | 4.66 | %(d)(e) |
| Operating expenses including reimbursement/waiver | | | 1.05 | % | | 1.05 | % | | 1.05 | % | | 1.05 | % | | 1.05 | %(d)(e) |
| PORTFOLIO TURNOVER RATE | | | 63 | % | | 138 | % | | 75 | % | | 99 | % | | 88 | %(c) |
| (a) | Per share amounts are based upon average shares outstanding. |
| (b) | Less than $0.005 per share. |
| (e) | Expense ratios before reductions for startup costs may not be representative of longer term operating periods. |
See Notes to Financial Statements.
| Annual Report | April 30, 2019 | 53 |
| Emerald Insights Fund | Financial Highlights |
For a share outstanding throughout the periods presented
| | | INVESTOR CLASS | |
| | | Year Ended April 30, 2019 | | Year Ended April 30, 2018 | | Year Ended April 30, 2017 | | Year Ended April 30, 2016 | | For the Period August 1, 2014 (Inception) to April 30, 2015 | |
| NET ASSET VALUE, BEGINNING OF PERIOD | | $ | 13.05 | | $ | 11.29 | | $ | 9.67 | | $ | 10.96 | | $ | 10.00 | |
| INCOME/(LOSS) FROM OPERATIONS: | | | | | | | | | | | | | | | | |
| Net investment loss(a) | | | (0.10 | ) | | (0.08 | ) | | (0.07 | ) | | (0.08 | ) | | (0.05 | ) |
| Net realized and unrealized gain/(loss) on investments | | | 1.03 | | | 1.84 | | | 1.69 | | | (1.21 | ) | | 1.01 | |
| Total from Investment Operations | | | 0.93 | | | 1.76 | | | 1.62 | | | (1.29 | ) | | 0.96 | |
| | | | | | | | | | | | | | | | | |
| LESS DISTRIBUTIONS: | | | | | | | | | | | | | | | | |
| From capital gains | | | (2.53 | ) | | – | | | – | | | – | | | – | |
| Total Distributions | | | (2.53 | ) | | – | | | – | | | – | | | – | |
| NET INCREASE/(DECREASE) IN NET ASSET VALUE | | | (1.60 | ) | | 1.76 | | | 1.62 | | | (1.29 | ) | | 0.96 | |
| NET ASSET VALUE, END OF PERIOD | | $ | 11.45 | | $ | 13.05 | | $ | 11.29 | | $ | 9.67 | | $ | 10.96 | |
| | | | | | | | | | | | | | | | | |
| TOTAL RETURN | | | 11.41 | % | | 15.59 | % | | 16.75 | % | | (11.77 | %) | | 9.60 | %(b) |
| RATIOS/SUPPLEMENTAL DATA: | | | | | | | | | | | | | | | | |
| Net Assets, End of Period (000s) | | $ | 174 | | $ | 126 | | $ | 88 | | $ | 86 | | $ | 448 | |
| RATIOS TO AVERAGE NET ASSETS: | | | | | | | | | | | | | | | | |
| Net Investment loss | | | (0.77 | %) | | (0.65 | %) | | (0.63 | %) | | (0.72 | %) | | (0.67 | %)(c) |
| Operating expenses excluding reimbursement/waiver | | | 2.08 | % | | 2.07 | % | | 2.09 | % | | 1.91 | % | | 2.96 | %(c)(d) |
| Operating expenses including reimbursement/waiver | | | 1.40 | % | | 1.40 | % | | 1.40 | % | | 1.40 | % | | 1.40 | %(c)(d) |
| PORTFOLIO TURNOVER RATE | | | 63 | % | | 138 | % | | 75 | % | | 99 | % | | 88 | %(b) |
| (a) | Per share amounts are based upon average shares outstanding. |
| (d) | Expense ratios before reductions for startup costs may not be representative of longer term operating periods. |
See Notes to Financial Statements.
| 54 | www.emeraldmutualfunds.com |
| Emerald Banking and Finance Fund | Financial Highlights |
For a share outstanding throughout the years presented
| | | CLASS A | |
| | | Year Ended April 30, 2019 | | Year Ended April 30, 2018 | | Year Ended April 30, 2017 | | Year Ended April 30, 2016 | | Year Ended April 30, 2015 | |
| NET ASSET VALUE, BEGINNING OF PERIOD | | $ | 46.01 | | $ | 41.61 | | $ | 31.27 | | $ | 28.85 | | $ | 26.11 | |
| INCOME/(LOSS) FROM OPERATIONS: | | | | | | | | | | | | | | | | |
| Net investment loss(a) | | | (0.24 | ) | | (0.29 | ) | | (0.17 | ) | | (0.06 | ) | | (0.16 | ) |
| Net realized and unrealized gain/(loss) on investments | | | (5.35 | ) | | 5.98 | | | 10.51 | | | 2.48 | | | 2.90 | |
| Total from Investment Operations | | | (5.59 | ) | | 5.69 | | | 10.34 | | | 2.42 | | | 2.74 | |
| | | | | | | | | | | | | | | | | |
| LESS DISTRIBUTIONS: | | | | | | | | | | | | | | | | |
| From capital gains | | | (7.71 | ) | | (1.29 | ) | | – | | | – | | | – | |
| Total Distributions | | | (7.71 | ) | | (1.29 | ) | | – | | | – | | | – | |
| NET INCREASE/(DECREASE) IN NET ASSET VALUE | | | (13.30 | ) | | 4.40 | | | 10.34 | | | 2.42 | | | 2.74 | |
| NET ASSET VALUE, END OF PERIOD | | $ | 32.71 | | $ | 46.01 | | $ | 41.61 | | $ | 31.27 | | $ | 28.85 | |
| | | | | | | | | | | | | | | | | |
| TOTAL RETURN(b) | | | (10.65 | )% | | 13.59 | % | | 33.07 | % | | 8.39 | % | | 10.49 | % |
| RATIOS/SUPPLEMENTAL DATA: | | | | | | | | | | | | | | | | |
| Net Assets, End of Period (000s) | | $ | 87,267 | | $ | 172,338 | | $ | 172,106 | | $ | 110,601 | | $ | 48,575 | |
| RATIOS TO AVERAGE NET ASSETS: | | | | | | | | | | | | | | | | |
| Net Investment loss | | | (0.58 | )% | | (0.65 | )% | | (0.46 | )% | | (0.21 | )% | | (0.58 | )% |
| Operating expenses excluding reimbursement/waiver | | | 1.42 | % | | 1.41 | % | | 1.43 | % | | 1.48 | % | | 1.60 | % |
| Operating expenses including reimbursement/waiver | | | 1.42 | % | | 1.41 | % | | 1.43 | % | | 1.48 | % | | 1.60 | % |
| PORTFOLIO TURNOVER RATE | | | 55 | % | | 62 | % | | 36 | % | | 30 | % | | 33 | % |
| (a) | Per share amounts are based upon average shares outstanding. |
| (b) | Total return does not reflect the effect of sales charges. |
See Notes to Financial Statements.
| Annual Report | April 30, 2019 | 55 |
| Emerald Banking and Finance Fund | Financial Highlights |
For a share outstanding throughout the years presented
| | | CLASS C | |
| | | Year Ended April 30, 2019 | | Year Ended April 30, 2018 | | Year Ended April 30, 2017 | | Year Ended April 30, 2016 | | Year Ended April 30, 2015 | |
| NET ASSET VALUE, BEGINNING OF PERIOD | | $ | 40.83 | | $ | 37.29 | | $ | 28.20 | | $ | 26.19 | | $ | 23.86 | |
| INCOME/(LOSS) FROM OPERATIONS: | | | | | | | | | | | | | | | | |
| Net investment loss(a) | | | (0.44 | ) | | (0.51 | ) | | (0.36 | ) | | (0.24 | ) | | (0.30 | ) |
| Net realized and unrealized gain/(loss) on investments | | | (4.81 | ) | | 5.34 | | | 9.45 | | | 2.25 | | | 2.63 | |
| Total from Investment Operations | | | (5.25 | ) | | 4.83 | | | 9.09 | | | 2.01 | | | 2.33 | |
| | | | | | | | | | | | | | | | | |
| LESS DISTRIBUTIONS: | | | | | | | | | | | | | | | | |
| From capital gains | | | (7.71 | ) | | (1.29 | ) | | – | | | – | | | – | |
| Total Distributions | | | (7.71 | ) | | (1.29 | ) | | – | | | – | | | – | |
| NET INCREASE/(DECREASE) IN NET ASSET VALUE | | | (12.96 | ) | | 3.54 | | | 9.09 | | | 2.01 | | | 2.33 | |
| NET ASSET VALUE, END OF PERIOD | | $ | 27.87 | | $ | 40.83 | | $ | 37.29 | | $ | 28.20 | | $ | 26.19 | |
| | | | | | | | | | | | | | | | | |
| TOTAL RETURN(b) | | | (11.21 | )% | | 12.85 | % | | 32.23 | % | | 7.67 | % | | 9.77 | % |
| RATIOS/SUPPLEMENTAL DATA: | | | | | | | | | | | | | | | | |
| Net Assets, End of Period (000s) | | $ | 50,079 | | $ | 78,988 | | $ | 76,072 | | $ | 52,366 | | $ | 31,862 | |
| RATIOS TO AVERAGE NET ASSETS: | | | | | | | | | | | | | | | | |
| Net Investment loss | | | (1.23 | )% | | (1.30 | )% | | (1.11 | )% | | (0.87 | )% | | (1.23 | )% |
| Operating expenses excluding reimbursement/waiver | | | 2.07 | % | | 2.06 | % | | 2.08 | % | | 2.13 | % | | 2.25 | % |
| Operating expenses including reimbursement/waiver | | | 2.07 | % | | 2.06 | % | | 2.08 | % | | 2.13 | % | | 2.25 | % |
| PORTFOLIO TURNOVER RATE | | | 55 | % | | 62 | % | | 36 | % | | 30 | % | | 33 | % |
| (a) | Per share amounts are based upon average shares outstanding. |
| (b) | Total return does not reflect the effect of sales charges. |
See Notes to Financial Statements.
| 56 | www.emeraldmutualfunds.com |
| Emerald Banking and Finance Fund | Financial Highlights |
For a share outstanding throughout the years presented
| | | INSTITUTIONAL CLASS | |
| | | Year Ended April 30, 2019 | | Year Ended April 30, 2018 | | Year Ended April 30, 2017 | | Year Ended April 30, 2016 | | Year Ended April 30, 2015 | |
| NET ASSET VALUE, BEGINNING OF PERIOD | | $ | 46.95 | | $ | 42.30 | | $ | 31.69 | | $ | 29.15 | | $ | 26.29 | |
| INCOME/(LOSS) FROM OPERATIONS: | | | | | | | | | | | | | | | | |
| Net investment income/(loss)(a) | | | (0.09 | ) | | (0.15 | ) | | (0.05 | ) | | 0.03 | | | (0.07 | ) |
| Net realized and unrealized gain/(loss) on investments | | | (5.45 | ) | | 6.09 | | | 10.66 | | | 2.51 | | | 2.93 | |
| Total from Investment Operations | | | (5.54 | ) | | 5.94 | | | 10.61 | | | 2.54 | | | 2.86 | |
| | | | | | | | | | | | | | | | | |
| LESS DISTRIBUTIONS: | | | | | | | | | | | | | | | | |
| From capital gains | | | (7.71 | ) | | (1.29 | ) | | – | | | – | | | – | |
| Total Distributions | | | (7.71 | ) | | (1.29 | ) | | – | | | – | | | – | |
| NET INCREASE/(DECREASE) IN NET ASSET VALUE | | | (13.25 | ) | | 4.65 | | | 10.61 | | | 2.54 | | | 2.86 | |
| NET ASSET VALUE, END OF PERIOD | | $ | 33.70 | | $ | 46.95 | | $ | 42.30 | | $ | 31.69 | | $ | 29.15 | |
| | | | | | | | | | | | | | | | | |
| TOTAL RETURN | | | (10.30 | )% | | 13.97 | % | | 33.48 | % | | 8.71 | % | | 10.88 | % |
| RATIOS/SUPPLEMENTAL DATA: | | | | | | | | | | | | | | | | |
| Net Assets, End of Period (000s) | | $ | 162,910 | | $ | 221,638 | | $ | 134,027 | | $ | 61,654 | | $ | 23,730 | |
| RATIOS TO AVERAGE NET ASSETS: | | | | | | | | | | | | | | | | |
| Net Investment income/(loss) | | | (0.23 | )% | | (0.34 | )% | | (0.14 | )% | | 0.11 | % | | (0.25 | )% |
| Operating expenses excluding reimbursement/waiver | | | 1.06 | % | | 1.09 | % | | 1.11 | % | | 1.15 | % | | 1.27 | % |
| Operating expenses including reimbursement/waiver | | | 1.06 | % | | 1.09 | % | | 1.11 | % | | 1.15 | % | | 1.27 | % |
| PORTFOLIO TURNOVER RATE | | | 55 | % | | 62 | % | | 36 | % | | 30 | % | | 33 | % |
| (a) | Per share amounts are based upon average shares outstanding. |
See Notes to Financial Statements.
| Annual Report | April 30, 2019 | 57 |
| Emerald Banking and Finance Fund | Financial Highlights |
For a share outstanding throughout the years presented
| | | INVESTOR CLASS | |
| | | Year Ended April 30, 2019 | | Year Ended April 30, 2018 | | Year Ended April 30, 2017 | | Year Ended April 30, 2016 | | Year Ended April 30, 2015 | |
| NET ASSET VALUE, BEGINNING OF PERIOD | | $ | 44.05 | | $ | 39.86 | | $ | 29.95 | | $ | 27.64 | | $ | 25.01 | |
| INCOME/(LOSS) FROM OPERATIONS: | | | | | | | | | | | | | | | | |
| Net investment loss(a) | | | (0.23 | ) | | (0.25 | ) | | (0.16 | ) | | (0.07 | ) | | (0.15 | ) |
| Net realized and unrealized gain/(loss) on investments | | | (5.15 | ) | | 5.73 | | | 10.07 | | | 2.38 | | | 2.78 | |
| Total from Investment Operations | | | (5.38 | ) | | 5.48 | | | 9.91 | | | 2.31 | | | 2.63 | |
| | | | | | | | | | | | | | | | | |
| LESS DISTRIBUTIONS: | | | | | | | | | | | | | | | | |
| From capital gains | | | (7.71 | ) | | (1.29 | ) | | – | | | – | | | – | |
| Total Distributions | | | (7.71 | ) | | (1.29 | ) | | – | | | – | | | – | |
| NET INCREASE/(DECREASE) IN NET ASSET VALUE | | | (13.09 | ) | | 4.19 | | | 9.91 | | | 2.31 | | | 2.63 | |
| NET ASSET VALUE, END OF PERIOD | | $ | 30.96 | | $ | 44.05 | | $ | 39.86 | | $ | 29.95 | | $ | 27.64 | |
| | | | | | | | | | | | | | | | | |
| TOTAL RETURN | | | (10.64 | )% | | 13.67 | % | | 33.09 | % | | 8.36 | % | | 10.52 | % |
| RATIOS/SUPPLEMENTAL DATA: | | | | | | | | | | | | | | | | |
| Net Assets, End of Period (000s) | | $ | 41,410 | | $ | 71,236 | | $ | 85,557 | | $ | 80,404 | | $ | 27,440 | |
| RATIOS TO AVERAGE NET ASSETS: | | | | | | | | | | | | | | | | |
| Net Investment loss | | | (0.60 | )% | | (0.60 | )% | | (0.46 | )% | | (0.23 | )% | | (0.56 | )% |
| Operating expenses excluding reimbursement/waiver | | | 1.43 | % | | 1.37 | % | | 1.43 | % | | 1.48 | % | | 1.58 | % |
| Operating expenses including reimbursement/waiver | | | 1.43 | % | | 1.37 | % | | 1.43 | % | | 1.48 | % | | 1.58 | % |
| PORTFOLIO TURNOVER RATE | | | 55 | % | | 62 | % | | 36 | % | | 30 | % | | 33 | % |
| (a) | Per share amounts are based upon average shares outstanding. |
See Notes to Financial Statements.
| 58 | www.emeraldmutualfunds.com |
| Emerald Funds | Notes to Financial Statements |
April 30, 2019
1. ORGANIZATION
Financial Investors Trust (the “Trust”), a Delaware statutory trust, is an open-end management investment company registered under the Investment Company Act of 1940, as amended (the “1940 Act”). The Trust consists of multiple separate portfolios or series. This annual report describes the Emerald Growth Fund, Emerald Small Cap Value Fund, Emerald Insights Fund, and Emerald Banking and Finance Fund (each a “Fund” and collectively, the “Funds”). The Emerald Small Cap Value Fund is a successor to a previously operational fund which was a series of Elessar Funds Investment Trust, a Delaware statutory trust, and was organized into a series of the Trust effective as of the close of business on June 26, 2015. Effective March 3, 2015, the Board approved changing the fiscal year end of the Emerald Small Cap Value Fund from September 30 to April 30.
The Emerald Growth Fund and Emerald Insights Fund seek to achieve long-term growth through capital appreciation. The Emerald Small Cap Value Fund seeks long-term capital appreciation. The Emerald Banking and Finance Fund seeks to achieve long term growth through capital appreciation with income as a secondary objective.
2. SIGNIFICANT ACCOUNTING POLICIES
The accompanying financial statements were prepared in accordance with accounting principles generally accepted in the United States of America (“U.S. GAAP”). The preparation of financial statements in conformity with U.S. GAAP requires management to make certain estimates and assumptions that affect the reported amounts of assets and liabilities and disclosures of contingent assets and liabilities at the date of the financial statements and the reported amounts of revenue and expenses during the period. Actual results could differ from those estimates. The Funds are considered an investment company for financial reporting purposes under U.S. GAAP and follows the accounting and reporting guidance applicable to investment companies in the Financial Accounting Standards Board Accounting Standards Codification Topic 946. The following is a summary of significant accounting policies consistently followed by the Funds in preparation of their financial statements.
Investment Valuation: The Funds generally value their securities based on market prices determined at the close of regular trading on the New York Stock Exchange (“NYSE”), normally, 4:00 p.m. Eastern Time, on each business day the NYSE is open for trading.
For equity securities and mutual funds that are traded on an exchange, the market price is usually the closing sale or official closing price on that exchange. In the case of equity securities not traded on an exchange, or if such closing prices are not otherwise available, the securities are valued at the mean of the most recent bid and ask prices on such day. Redeemable securities issued by open-end registered investment companies are valued at the investment company’s applicable net asset value, with the exception of exchange-traded open-end investment companies, which are priced as equity securities.
The market price for debt obligations is generally the price supplied by an independent third-party pricing service approved by the Board of Trustees (the “Board”), which may use a matrix, formula or other objective method that takes into consideration quotations from dealers, market transactions in comparable investments, market indices and yield curves. If vendors are unable to supply a price, or if the price supplied is deemed to be unreliable, the market price may be determined using quotations received from one or more brokers-dealers that make a market in the security.
Equity securities that are primarily traded on foreign securities exchanges are valued at the preceding closing values of such securities on their respective exchanges, except when an occurrence subsequent to the time a value was so established is likely to have changed such value. In such an event, the fair values of those securities are determined in good faith through consideration of other factors in accordance with procedures established by and under the general supervision of the Board.
When such prices or quotations are not available, or when Emerald Mutual Fund Advisers Trust, (the “Adviser”), believes that they are unreliable, securities may be priced using fair value procedures approved by the Board.
Fair Value Measurements: A three-tier hierarchy has been established to classify fair value measurements for disclosure purposes. Inputs refer broadly to the assumptions that market participants would use in pricing the asset or liability, including assumptions about risk. Inputs may be observable or unobservable. Observable inputs are inputs that reflect the assumptions market participants would use in pricing the asset or liability that are developed based on market data obtained from sources independent of the reporting entity. Unobservable inputs are inputs that reflect the reporting entity’s own assumptions about the assumptions market participants would use in pricing the asset or liability that are developed based on the best information available. Various inputs are used in determining the value of each Fund’s investments as of the reporting period end. The designated input levels are not necessarily an indication of the risk or liquidity associated with these investments.
| Annual Report | April 30, 2019 | 59 |
| Emerald Funds | Notes to Financial Statements |
April 30, 2019
These inputs are categorized in the following hierarchy under applicable financial accounting standards:
| Level 1 – | Unadjusted quoted prices in active markets for identical investments, unrestricted assets or liabilities that the Funds have the ability to access at the measurement date; |
| Level 2 – | Quoted prices which are not active, quoted prices for similar assets or liabilities in active markets or inputs other than quoted prices that are observable (either directly or indirectly) for substantially the full term of the asset or liability; and |
| Level 3 – | Significant unobservable prices or inputs (including the Funds’ own assumptions in determining the fair value of investments) where there is little or no market activity for the asset or liability at the measurement date. |
The following is a summary of each input used to value the Funds as of April 30, 2019:
| Investments in Securities at Value | | Level 1 -
Quoted Prices | | | Level 2 -
Other Significant
Observable Inputs | | | Level 3 -
Significant
Unobservable
Inputs | | | Total | |
| Emerald Growth Fund | | | | | | | | | | | | | | | | |
| Common Stocks(a) | | $ | 1,352,276,918 | | | $ | – | | | $ | – | | | $ | 1,352,276,918 | |
| Short Term Investments | | | 24,179,170 | | | | – | | | | – | | | | 24,179,170 | |
| TOTAL | | $ | 1,376,456,088 | | | $ | – | | | $ | – | | | $ | 1,376,456,088 | |
| Investments in Securities at Value | | Level 1 -
Quoted Prices | | | Level 2 -
Other Significant
Observable Inputs | | | Level 3 -
Significant
Unobservable
Inputs | | | Total | |
| Emerald Small Cap Value Fund | | | | | | | | | | | | |
| Common Stocks(a) | | $ | 4,051,841 | | | $ | – | | | $ | – | | | $ | 4,051,841 | |
| Short Term Investments | | | 48,608 | | | | – | | | | – | | | | 48,608 | |
| TOTAL | | $ | 4,100,449 | | | $ | – | | | $ | – | | | $ | 4,100,449 | |
| Investments in Securities at Value | | Level 1 -
Quoted Prices | | | Level 2 -
Other Significant
Observable Inputs | | | Level 3 -
Significant
Unobservable
Inputs | | | Total | |
| Emerald Insights Fund | | | | | | | | | | | | |
| Common Stocks(a) | | $ | 10,904,531 | | | $ | – | | | $ | – | | | $ | 10,904,531 | |
| Short Term Investments | | | 212,495 | | | | – | | | | – | | | | 212,495 | |
| TOTAL | | $ | 11,117,026 | | | $ | – | | | $ | – | | | $ | 11,117,026 | |
| Investments in Securities at Value | | Level 1 -
Quoted Prices | | | Level 2 -
Other Significant
Observable Inputs | | | Level 3 -
Significant
Unobservable
Inputs | | | Total | |
| Emerald Banking and Finance Fund | | | | | | | | | | | | | | | | |
| Common Stocks | | | | | | | | | | | | | | | | |
| Banks | | $ | – | | | $ | 575,761 | | | $ | – | | | $ | 575,761 | |
| Banks: Diversified | | | 237,046,967 | | | | 13,640,361 | | | | – | | | | 250,687,328 | |
| Banks: Savings, Thrift & Mortgage Lending | | | 31,784,332 | | | | 2,057,500 | | | | – | | | | 33,841,832 | |
| Other(a) | | | 55,076,349 | | | | – | | | | – | | | | 55,076,349 | |
| Short Term Investments | | | 2,048,281 | | | | – | | | | – | | | | 2,048,281 | |
| TOTAL | | $ | 325,955,929 | | | $ | 16,273,622 | | | $ | – | | | $ | 342,229,551 | |
| (a) | For detailed descriptions of sector and industry, see the accompanying Schedule of Investments. |
For the year ended April 30, 2019, the Funds did not have any securities that used significant unobservable inputs (Level 3) in determining fair value.
| 60 | www.emeraldmutualfunds.com |
| Emerald Funds | Notes to Financial Statements |
April 30, 2019
Investment Transactions and Investment Income: Investment transactions are accounted for on the date the investments are purchased or sold (trade date). Realized gains and losses from investment transactions are reported on an identified cost basis, which is the same basis the Funds use for federal income tax purposes. Interest income, which includes accretion of discounts, is accrued and recorded as earned. Dividend income is recognized on the ex-dividend date or for certain foreign securities, as soon as information is available to the Funds. All of the realized and unrealized gains and losses and net investment income, are allocated daily to each class in proportion to its average daily net assets.
Real Estate Investment Trusts (“REITs”): The Funds may invest a portion of their assets in REITs and are subject to certain risks associated with direct investment in REITs. REITs may be affected by changes in the value of their underlying properties and by defaults by borrowers or tenants. REITs depend generally on their ability to generate cash flow to make distributions to shareowners, and certain REITs have self-liquidation provisions by which mortgages held may be paid in full and distributions of capital returns may be made at any time. In addition, the performance of a REIT may be affected by its failure to qualify for tax-free pass-through of income under the Internal Revenue Code of 1986, as amended (the “Code”), or its failure to maintain exemption from registration under the 1940 Act. A Fund’s investments in REITs may result in such Fund’s receipt of cash in excess of the REITs’ earnings. If the Fund receives such distributions all or a portion of these distributions will constitute a return of capital to such Fund. Receiving a return of capital distribution from REITs will reduce the amount of income available to be distributed to Fund shareholders. Income from REITs generally will not be eligible for treatment as qualified dividend income. As the final character of the distributions is not known until reported by the REITs on their 1099s, the Funds utilize an average of the prior year’s reallocation information as an estimate for the current year character of distributions.
Trust Expenses:Some expenses of the Trust can be directly attributed to the Funds. Expenses which cannot be directly attributed to the Funds are apportioned among all funds in the Trust based on average net assets of each fund.
Fund and Class Expenses: Expenses that are specific to a Fund or class of shares of a Fund, including distribution fees (Rule 12b-1 fees) and shareholder servicing fees, are charged directly to that Fund or share class. All expenses of a Fund, other than class specific expenses, are allocated daily to each class in proportion to its average daily net assets. Expenses that are common to the Funds generally are allocated among the Funds in proportion to their average daily net assets.
Federal Income Taxes: Each Fund complies with the requirements under Subchapter M of the Internal Revenue Code of 1986, as amended, applicable to regulated investment companies and intends to distribute substantially all of its net taxable income and net capital gains, if any, each year so that the Funds will not be subject to excise tax on undistributed income and gains. The Funds are not subject to income taxes to the extent such distributions are made.
As of and during the year ended April 30, 2019, the Funds did not have a liability for any unrecognized tax benefits. The Funds file U.S. federal, state, and local tax returns as required. The Funds’ tax returns are subject to examination by the relevant tax authorities until expiration of the applicable statute of limitations, which is generally three years after the filing of the tax return for federal purposes and four years for most state returns. Tax returns for open years have incorporated no uncertain tax positions that require a provision for income taxes.
Distributions to Shareholders: Each Fund normally pays dividends and distributes capital gains, if any, on an annual basis. Income dividend distributions are derived from dividends and other income each Fund receives from its investments, including short-term capital gains. Long term capital gain distributions are derived from gains realized when each Fund sells a security it has owned for more than a year. Each Fund may make additional distributions and dividends at other times if the portfolio manager believes doing so may be necessary for each Fund to avoid or reduce taxes.
3. TAX BASIS INFORMATION
Reclassifications:As of April 30, 2019, permanent differences on book and tax accounting were reclassified. These differences had no effect on net assets and were primarily attributed to treatment of book/tax distribution differences and net operating losses. These reclassifications were as follows:
| | | Distributable earnings | | | Paid-in Capital | |
| Emerald Growth Fund | | $ | 4,062,334 | | | $ | (4,062,334 | ) |
| Emerald Small Cap Value Fund | | | 10,424 | | | | (10,424 | ) |
| Emerald Insights Fund | | | 20,616 | | | | (20,616 | ) |
| Emerald Banking and Finance Fund | | | 3,115,881 | | | | (3,115,881 | ) |
Included in those amounts reclassified was a net operating loss offset to Paid-in capital for the Emerald Growth Fund, the Emerald Small Cap Value Fund, and the Emerald Banking and Finance Fund in the amount of $4,062,334, $9,674, and $3,115,881, respectively.
| Annual Report | April 30, 2019 | 61 |
| Emerald Funds | Notes to Financial Statements |
April 30, 2019
Tax Basis of Investments: As of April 30, 2019, the aggregate cost of investments, gross unrealized appreciation/(depreciation) and net unrealized appreciation/(depreciation) for Federal tax purposes was as follows:
| | | Gross Appreciation
(excess of value over tax cost) | | | Gross Depreciation
(excess of tax cost over value) | | | Net Unrealized
Appreciation/ (Depreciation) | | | Cost of Investments for
Income Tax Purposes | |
| Emerald Growth Fund | | $ | 444,542,362 | | | $ | (67,839,128 | ) | | $ | 376,703,234 | | | $ | 999,752,854 | |
| Emerald Small Cap Value Fund | | | 692,722 | | | | (165,484 | ) | | | 527,238 | | | | 3,573,211 | |
| Emerald Insights Fund | | | 2,353,502 | | | | (265,017 | ) | | | 2,088,485 | | | | 9,028,541 | |
| Emerald Banking and Finance Fund | | | 58,922,972 | | | | (18,084,580 | ) | | | 40,838,392 | | | | 301,391,159 | |
Components of Distributable Earnings: As of April 30, 2019, components of distributable earnings were as follows:
| | | Emerald Growth
Fund | | | Emerald Small
Cap Value Fund | | | Emerald Insights
Fund | | | Emerald Banking
and Finance Fund | |
| Accumulated capital gains/(losses) | | | 18,434,197 | | | | (386,369 | ) | | | (228,049 | ) | | | (8,733,399 | ) |
| Net unrealized appreciation on investments | | | 376,703,234 | | | | 527,238 | | | | 2,088,485 | | | | 40,838,392 | |
| Other cumulative effect of timing differences | | | (1,084,613 | ) | | | (3,100 | ) | | | (26,823 | ) | | | (687,268 | ) |
| Total | | $ | 394,052,818 | | | $ | 137,769 | | | $ | 1,833,613 | | | $ | 31,417,725 | |
The Emerald Small Cap Value Fund, Emerald Insights Fund, and Emerald Banking and Finance Fund elected to defer to the period ending April 30, 2020, capital losses recognized during the period November 1, 2018 to April 30, 2019 in the amount of $386,369, $228,049, and $8,733,399, respectively.
Ordinary Losses: As of April 30, 2019, the Emerald Growth Fund, Emerald Small Cap Value Fund, Emerald Insights Fund, and Emerald Banking and Finance Fund elected to defer to the period ending April 30, 2020, late year ordinary losses in the amount of $1,084,613, $3,100, $26,823 and $687,268, respectively.
Tax Basis of Distributions to Shareholders:The character of distributions made during the year from net investment income or net realized gains may differ from its ultimate characterization for federal income tax purposes. Also, due to the timing of dividend distributions, the fiscal year in which amounts are distributed may differ from the fiscal year in which the income or realized gain were recorded by each Fund.
The tax characters of distributions paid by the Funds for the fiscal year ended April 30, 2019 were as follows:
| | | Ordinary Income | | | Long-Term Capital Gain | |
| Emerald Growth Fund | | $ | – | | | $ | 116,684,237 | |
| Emerald Small Cap Value Fund | | | – | | | | 1,226,932 | |
| Emerald Insights Fund | | | 170,539 | | | | 1,740,059 | |
| Emerald Banking and Finance Fund | | | – | | | | 86,106,387 | |
The tax characters of distributions paid by the Funds for the fiscal year ended April 30, 2018 were as follows:
| | | Ordinary Income | | | Long-Term Capital Gain | |
| Emerald Growth Fund | | $ | – | | | $ | – | |
| Emerald Small Cap Value Fund | | | 506,928 | | | | 2,912,564 | |
| Emerald Insights Fund | | | – | | | | – | |
| Emerald Banking and Finance Fund | | | – | | | | 14,572,442 | |
| 62 | www.emeraldmutualfunds.com |
| Emerald Funds | Notes to Financial Statements |
April 30, 2019
4. SECURITIES TRANSACTIONS
The cost of purchases and proceeds from sales of securities (excluding short-term securities) during the year ended April 30, 2019 was as follows:
| Funds | | Cost of Investments
Purchased | | | Proceeds from
Investments Sold | |
| Emerald Growth Fund | | $ | 817,528,762 | | | $ | 814,526,996 | |
| Emerald Small Cap Value Fund | | | 6,389,371 | | | | 9,016,092 | |
| Emerald Insights Fund | | | 6,737,057 | | | | 7,707,643 | |
| Emerald Banking and Finance Fund | | | 258,808,486 | | | | 395,883,078 | |
5. SHARES OF BENEFICIAL INTEREST
The capitalization of the Trust consists of an unlimited number of shares of beneficial interest with no par value per share. Holders of the shares of the Funds of the Trust have one vote for each share held and a proportionate fraction of a vote for each fractional share. All shares issued and outstanding are fully paid and are transferable and redeemable at the option of the shareholder. Purchasers of the shares do not have any obligation to make payments to the Trust or its creditors (other than the purchase price for the shares) or make contributions to the Trust or its creditors solely by reason of the purchaser’s ownership of the shares. Shares have no pre-emptive rights.
6. MANAGEMENT AND RELATED-PARTY TRANSACTIONS
The Adviser, subject to the authority of the Board, is responsible for the overall management and administration of the Funds’ business affairs. The Adviser manages the investments of the Funds in accordance with the Funds’ investment objective, policies and limitations and investment guidelines established jointly by the Adviser and the Trustees. Pursuant to the Advisory Agreement, the Funds pay the Adviser fees for the services and facilities it provides payable on a monthly basis at the annual rate set forth below of the Funds’ average daily net assets. The management fee is paid on a monthly basis.
| Emerald Growth Fund | |
| Average Total Net Assets | Contractual Fee |
| Up to and including $250M | 0.75% |
| Over $250M and including $500M | 0.65% |
| Over $500M and including $750M | 0.55% |
| Over $750M | 0.45% |
| Emerald Small Cap Value Fund | |
| Average Total Net Assets | Contractual Fee |
| Up to and including $250M | 0.75% |
| Over $250M and including $500M | 0.65% |
| Over $500M and including $750M | 0.55% |
| Over $750M | 0.45% |
| Emerald Insights Fund | |
| Average Total Net Assets | Contractual Fee |
| Up to and including $250M | 0.75% |
| Over $250M and including $500M | 0.65% |
| Over $500M and including $750M | 0.55% |
| Over $750M | 0.45% |
| Emerald Banking and Finance Fund | |
| Average Total Net Assets | Contractual Fee |
| Up to and including $100M | 1.00% |
| Over $100M | 0.90% |
| Annual Report | April 30, 2019 | 63 |
| Emerald Funds | Notes to Financial Statements |
April 30, 2019
The Adviser has contractually agreed to limit each Fund’s total annual operating expenses (exclusive of acquired fund fees and expenses, brokerage expenses, interest expenses, taxes and extraordinary expense) set forth to the annual shares (as percentages of a Fund’s average daily net assets) in the following table for Class A, Class C, Institutional Class, and Investor Class shares. This agreement (the “Expense Agreement”) is in effect from September 1, 2018 through August 31, 2019. The prior Expense Agreement was in effect from September 1, 2017 through August 31, 2018. The Adviser will be permitted to recover, on a class-by-class basis, expenses it has borne through the expense agreement to the extent that a Fund’s expenses in later periods fall below the expense cap in effect at the time of the waiver or reimbursement. Notwithstanding the foregoing, the Funds will not be obligated to pay any such fees and expenses more than three years after the date of the waiver or reimbursement. The Adviser may not discontinue this waiver, prior to August 31, 2019, without the approval by the Fund’s Board. Fees waived/reimbursed by the Adviser for the year ended April 30, 2019 are disclosed in the Statements of Operations.
| Emerald Growth Fund | | | |
| Class A | Class C | Institutional Class | Investor Class |
| 1.29% | 1.94% | 0.99% | 1.34% |
| | | | |
| Emerald Small Cap Value Fund | | | |
| Class A | Class C | Institutional Class | Investor Class |
| 1.35% | 2.00% | 1.00% | 1.25% |
| | | | |
| Emerald Insights Fund | | | |
| Class A | Class C | Institutional Class | Investor Class |
| 1.35% | 2.00% | 1.05% | 1.40% |
| | | | |
| Emerald Banking and Finance Fund | | |
| Class A | Class C | Institutional Class | Investor Class |
| 1.84% | 2.49% | 1.54% | 1.89% |
For the year ended April 30, 2019, the fee waivers/reimbursements and recoupments of past waived fees were as follows:
| Fund | | Fees Waived/ Reimbursed By Adviser | | | Recoupment of Past Waived Fees By Adviser | |
| Emerald Growth Fund | | | | | | |
| Class A | | $ | – | | | $ | – | |
| Class C | | | – | | | | – | |
| Institutional Class | | | – | | | | – | |
| Investor Class | | | – | | | | – | |
| Emerald Small Cap Value Fund | | | | | | | | |
| Class A | | $ | 63,581 | | | $ | – | |
| Class C | | | 936 | | | | – | |
| Institutional Class | | | 27,060 | | | | – | |
| Investor Class | | | 8,872 | | | | – | |
| Emerald Insights Fund | | | | | | | | |
| Class A | | $ | 77,413 | | | $ | – | |
| Class C | | | 1,019 | | | | – | |
| Institutional Class | | | 11,141 | | | | – | |
| Investor Class | | | 1,004 | | | | – | |
| Emerald Banking and Finance Fund | | | | | | | | |
| Class A | | $ | – | | | $ | – | |
| Class C | | | – | | | | – | |
| Institutional Class | | | – | | | | – | |
| Investor Class | | | – | | | | – | |
| 64 | www.emeraldmutualfunds.com |
| Emerald Funds | Notes to Financial Statements |
April 30, 2019
As of April 30, 2019, the balances of recoupable expenses for each Fund were as follows:
| Fund | | Expires 2020 | | | Expires 2021 | | | Expires 2022 | | | Total | |
| Emerald Growth Fund | | | | | | | | | | | | |
| Class A | | $ | – | | | $ | – | | | $ | – | | | $ | – | |
| Class C | | | – | | | | – | | | | – | | | | – | |
| Institutional Class | | | – | | | | – | | | | – | | | | – | |
| Investor Class | | | – | | | | – | | | | – | | | | – | |
| Emerald Small Cap Value Fund | | | | | | | | | | | | | | | | |
| Class A | | $ | 6,552 | | | $ | 32,984 | | | $ | 63,581 | | | $ | 103,117 | |
| Class C | | | 4,441 | | | | 1,410 | | | | 936 | | | | 6,787 | |
| Institutional Class | | | 67,420 | | | | 53,258 | | | | 27,060 | | | | 147,738 | |
| Investor Class | | | 8,254 | | | | 7,303 | | | | 8,872 | | | | 24,429 | |
| Emerald Insights Fund | | | | | | | | | | | | | | | | |
| Class A | | $ | 80,509 | | | $ | 72,407 | | | $ | 77,413 | | | $ | 230,329 | |
| Class C | | | 793 | | | | 908 | | | | 1,019 | | | | 2,720 | |
| Institutional Class | | | 9,736 | | | | 8,238 | | | | 11,141 | | | | 29,115 | |
| Investor Class | | | 615 | | | | 693 | | | | 1,004 | | | | 2,312 | |
| Emerald Banking and Finance Fund | | | | | | | | | | | | | | | | |
| Class A | | $ | – | | | $ | – | | | $ | – | | | $ | – | |
| Class C | | | – | | | | – | | | | – | | | | – | |
| Institutional Class | | | – | | | | – | | | | – | | | | – | |
| Investor Class | | | – | | | | – | | | | – | | | | – | |
Fund Administrator Fees and Expenses: ALPS Fund Services, Inc. (“ALPS”) serves as administrator to the Funds and the Funds have agreed to pay expenses incurred in connection with their administrative activities. Pursuant to an Administration Agreement, ALPS provides operational services to the Funds including, but not limited to, fund accounting and fund administration and generally assist in the Funds’ operations. Officers of the Trust are employees of ALPS. The Funds’ administration fee is accrued on a daily basis and paid monthly. Administration fees paid by the Funds for the year ended April 30, 2019 are disclosed in the Statements of Operations.
The Administrator is also reimbursed by the Funds for certain out-of-pocket expenses.
Transfer Agent:ALPS serves as transfer, dividend paying and shareholder servicing agent for the Funds. ALPS receives an annual minimum fee, a fee based upon the number of shareholder accounts, and is also reimbursed by the Funds for certain out-of-pocket expenses. Transfer agent fees paid by the Funds for the year ended April 30, 2019 are disclosed in the Statements of Operations.
Compliance Services:ALPS provides services that assist the Trust’s chief compliance officer in monitoring and testing the policies and procedures of the Trust in conjunction with requirements under Rule 38a-1 under the 1940 Act and receives an annual base fee. ALPS is reimbursed for certain out-of-pocket expenses by the Funds. Compliance service fees paid by the Funds for the year ended April 30, 2019 are disclosed in the Statements of Operations.
Principal Financial Officer: ALPS receives an annual fee for providing principal financial officer services to the Funds. Principal financial officer fees paid by the Funds for the year ended April 30, 2019 are disclosed in the Statements of Operations.
Distributor:ALPS Distributors, Inc. (“ADI” or the “Distributor”) (an affiliate of ALPS) acts as the distributor of the Funds’ shares pursuant to a Distribution Agreement with the Trust. Shares are sold on a continuous basis by ADI as agent for the Funds, and ADI has agreed to use its best efforts to solicit orders for the sale of Funds’ shares, although it is not obliged to sell any particular amount of shares. ADI is not entitled to any compensation for its services as Distributor. ADI is registered as a broker-dealer with the U.S. Securities and Exchange Commission.
Each Fund has adopted a separate Distribution and Services Plan (each a “Plan” and collectively, the “Plans”) pursuant to Rule 12b-1 of the 1940 Act. The Plans allow each Fund, as applicable, to use each Fund’s assets to pay fees in connection with the distribution and marketing of the Funds’ shares and/or the provision of shareholder services to the Funds’ shareholders. The Plan permits payment for services in connection with the administration of plans or programs that use shares of each Fund as their funding medium and for related expenses. The recipients of such payments may include other affiliates of the Adviser, broker-dealers, financial institutions, plan sponsors and administrators and other financial intermediaries through which investors may purchase shares of the Fund. The Plans permit each Fund to make total payments at an annual rate of up to 0.35%, 0.75% and 0.25% of the average daily net asset value of Class A, Class C and Investor Class, respectively. Because these fees are paid
| Annual Report | April 30, 2019 | 65 |
| Emerald Funds | Notes to Financial Statements |
April 30, 2019
out of the Funds’ assets on an ongoing basis, over time they will increase the cost of an investment in the Funds, and Plan fees may cost an investor more than other types of sales charges.
Each Fund, except the Emerald Small Cap Value Fund, has adopted a Shareholder Services Plan (a “Shareholder Services Plan”) with respect to its Class C, Institutional Class and Investor Class shares. Under the Shareholder Services Plan, a Fund is authorized to compensate certain financial intermediaries, including broker-dealers and Fund affiliates which may include the Distributor, Adviser and/or the transfer agent (the “Participating Organizations”), an aggregate fee in an amount not to exceed on an annual basis 0.25%, 0.05% and 0.15% of the average daily net asset value of Class C, Institutional Class and Investor Class, respectively, of the Funds attributable to or held in the name of the Participating Organizations pursuant to an agreement with such Participating Organizations (the “Agreement”). Each Agreement will set forth the non-distribution related shareholder services to be performed by the Participating Organizations for the benefit of a Fund’s shareholders who have elected to have such Participating Organizations service their accounts. Any amount of such payment not paid to Participating Organizations during a Fund’s fiscal year for such service activities shall be reimbursed to the Fund as soon as practicable. Shareholder Services Plan fees are included with distribution and service fees in the Statements of Operations. Fees recaptured pursuant to the Shareholder Services Plan for the year ended April 30, 2019 are included as an offset to distribution and service fees as disclosed in the Statements of Operations.
The Emerald Small Cap Value Fund has adopted a Shareholder Services Plan (the “Plan”) with respect to its Class C shares. Under the Plan, the Fund is authorized to pay banks and its affiliates and other institutions, including broker-dealers and Fund affiliates which may include the Distributor, Adviser and/or the transfer agent (“Class C Participating Organizations”), an aggregate fee in an amount not to exceed on an annual basis 0.25% of the average daily net asset value of Class C shares of the Fund attributable to or held in the name of the Participating Organizations for its clients as compensation for providing shareholder service activities, which do not include distribution services pursuant to an agreement with Participating Organizations. Any amount of such payment not paid to the Participating Organizations during the Fund’s fiscal year for such service activities shall be reimbursed to the Fund as soon as practicable. Plan fees are included with distribution and service fees in the Statements of Operations. Fees recaptured pursuant to the Plan for the year ended April 30, 2019 are included as an offset to distribution and service fees as disclosed in the Statements of Operations.
Trustees
The fees and expenses of the independent trustees of the Board are presented in the Statements of Operations.
7. INDEMNIFICATIONS
Under the Trust’s organizational documents, its officers and Trustees are indemnified against certain liability arising out of the performance of their duties to the Trust. Additionally, in the normal course of business, the Trust enters into contracts with service providers that may contain general indemnification clauses, which may permit indemnification to the extent permissible under applicable law. The Trust’s maximum exposure under these arrangements is unknown, as this would involve future claims that may be made against the Trust that have not yet occurred.
8. NEW ACCOUNTING PRONOUNCEMENTS
On October 4, 2018, the SEC amended Regulation S-X to require certain financial statement disclosure requirements to conform them to US GAAP for investment companies. Effective November 4, 2018, the Funds adopted disclosure requirement changes for Regulation S-X and these changes are reflected throughout this report. The Funds’ adoption of those amendments, effective with the financial statements prepared as of April 30, 2019, had no effect on the Funds’ net assets or results of operations.
In August 2018, the Financial Accounting Standards Board (“FASB”) issued Accounting Standards Update (“ASU”) 2018-13, which changes the fair value measurement disclosure requirements of FASB Accounting Standards Codification Topic 820, Fair Value Measurement. The update to Topic 820 includes new, eliminated, and modified disclosure requirements. ASU 2018-13 is effective for fiscal years beginning after December 15, 2019, including interim periods. Early adoption is permitted for any eliminated or modified disclosures. The Funds early adopted effective with the financial statements prepared as of April 30, 2019, and they had no effect on the Funds’ net assets or results of operations.
9. SUBSEQUENT EVENTS
Subsequent events after the date of the Statements of Assets and Liabilities have been evaluated through the date the financial statements were issued.
| 66 | www.emeraldmutualfunds.com |
| Emerald Funds | Report of Independent Registered Public Accounting Firm |
To the shareholders and the Board of Trustees of Financial Investors Trust
Opinion on the Financial Statements and Financial Highlights
We have audited the accompanying statements of assets and liabilities, including the schedules of investments, of Emerald Growth Fund, Emerald Small Cap Value Fund, Emerald Insights Fund, and Emerald Banking and Finance Fund (the “Funds”), four of the funds constituting the Financial Investors Trust, as of April 30, 2019; the related statements of operations for the year then ended, the statements of changes in net assets for each of the two years in the period then ended, and the financial highlights for each of the five years in the period then ended for Emerald Growth Fund and Emerald Banking and Finance Fund; the related statements of operations, changes in net assets, and the financial highlights for the periods indicated in the table below for Emerald Small Cap Value Fund and Emerald Insights Fund; and the related notes. In our opinion, the financial statements and financial highlights present fairly, in all material respects, the financial position of each of the funds listed above constituting Financial Investors Trust as of April 30, 2019, and the results of their operations for the year then ended, the changes in their net assets for each of the two years in the period then ended, and the financial highlights for each of the five years in the period then ended (or for the period listed in the table below), in conformity with accounting principles generally accepted in the United States of America.
| Individual Fund Comprising the Financial Investors Trust | Statement of Operations | Statements of Changes in Net Assets | Financial Highlights |
| Emerald Small Cap Value Fund | For the year ended April 30, 2019 | For the years ended April 30, 2019 and 2018 | For the years ended April 30, 2019, 2018, 2017, the period from October 1, 2015 through April 30, 2016, and the years ended September 30, 2015 and 2014* |
| Emerald Insights Fund | For the year ended April 30, 2019 | For the years ended April 30, 2019 and 2018 | For the years ended April 30, 2019, 2018, 2017, 2016, and the period from August 1, 2014 (inception) through April 30, 2015 |
| * | The financial highlights for the Emerald Small Cap Value Fund for the year ended September 30, 2014 were audited by other auditors whose report, dated November 24, 2014, expressed an unqualified opinion on such financial highlights. |
Basis for Opinion
These financial statements and financial highlights are the responsibility of the Funds’ management. Our responsibility is to express an opinion on the Funds’ financial statements and financial highlights based on our audits. We are a public accounting firm registered with the Public Company Accounting Oversight Board (United States) (PCAOB) and are required to be independent with respect to the Funds in accordance with the U.S. federal securities laws and the applicable rules and regulations of the Securities and Exchange Commission and the PCAOB.
We conducted our audits in accordance with the standards of the PCAOB. Those standards require that we plan and perform the audit to obtain reasonable assurance about whether the financial statements and financial highlights are free of material misstatement, whether due to error or fraud. The Funds are not required to have, nor were we engaged to perform, an audit of their internal control over financial reporting. As part of our audits we are required to obtain an understanding of internal control over financial reporting but not for the purpose of expressing an opinion on the effectiveness of the Funds’ internal control over financial reporting. Accordingly, we express no such opinion.
Our audits included performing procedures to assess the risks of material misstatement of the financial statements and financial highlights, whether due to error or fraud, and performing procedures that respond to those risks. Such procedures included examining, on a test basis, evidence regarding the amounts and disclosures in the financial statements and financial highlights. Our audits also included evaluating the accounting principles used and significant estimates made by management, as well as evaluating the overall presentation of the financial statements and financial highlights. Our procedures included confirmation of securities owned as of April 30, 2019, by correspondence with the custodian and brokers; when replies were not received from brokers, we performed other auditing procedures. We believe that our audits provide a reasonable basis for our opinion.
DELOITTE & TOUCHE LLP
Denver, Colorado
June 25, 2019
We have served as the auditor of one or more investment companies advised by Emerald Mutual Fund Advisers Trust since 2012.
| Annual Report | April 30, 2019 | 67 |
| Emerald Funds | Disclosure Regarding Approval of Fund Advisory Agreement |
April 30, 2019 (Unaudited)
On March 12, 2019, the Trustees met in person to discuss, among other things, the approval of the Investment Advisory Agreement between Emerald Mutual Fund Advisers Trust (“Emerald”) and the Trust, with respect to the Emerald Banking and Finance Fund, the Emerald Growth Fund, the Emerald Insights Fund, and the Emerald Small Cap Value Fund (together, the “Emerald Funds”), in accordance with Section 15(c) of the 1940 Act. In renewing and approving the Investment Advisory Agreement between Emerald and the Trust, on behalf of the Emerald Funds, dated October 1, 2018 (the “Emerald Investment Advisory Agreement”), the Trustees, including the Independent Trustees, considered the following factors with respect to the Emerald Funds:
Nature, Extent, and Quality of the Services under the Investment Advisory Agreement: The Trustees received and considered information regarding the nature, extent, and quality of services to be provided to the Emerald Funds under the Emerald Investment Advisory Agreement. The Trustees reviewed certain background materials supplied by Emerald in its presentation, including its Form ADV.
The Trustees reviewed and considered Emerald’s investment advisory personnel, its history as an asset manager, and its performance and the amount of assets currently under management by Emerald and its affiliated entities. The Trustees also reviewed the research and decision-making processes utilized by Emerald, including the methods adopted to seek to achieve compliance with the investment objectives, policies, and restrictions of the Emerald Funds.
The Trustees considered the background and experience of Emerald’s management in connection with the Emerald Funds, including reviewing the qualifications, backgrounds, and responsibilities of the management team primarily responsible for the day-to-day portfolio management of the Emerald Funds and the extent of the resources devoted to research and analysis of actual and potential investments.
The Trustees also reviewed, among other things, Emerald’s insider trading policies and procedures and its Code of Ethics.
Performance:The Trustees reviewed performance information for each of the Emerald Funds for the 3-month, 1-year, 3-year, 5-year, and 10-year periods ended December 31, 2018 as applicable. That review included a comparison of each Fund’s performance to the performance of a universe of comparable funds provided by an independent provider of investment company data (the “Data Provider”). With regard to the Emerald Banking and Finance Fund, the Trustees noted that the performance of each of the share classes was below the Data Provider universe median for the available time periods. With regard to the Emerald Growth Fund, the Trustees noted that the performance of each of the share classes was below the Data Provider universe median for the 3-month, 1-year, and 3-year time periods and above the Data Provider universe median for the 5-year and 10-year time periods, as applicable. With regard to the Emerald Banking and Financing Fund, the Trustees noted that the performance of each of the share classes was below the Data Provider universe median for the 3-month, 1-year, and 10-year time periods as applicable, generally the same as the Data Provider universe median for the 3-year period, and above the Data Provider universe median for the 5-year period. With regard to the Emerald Small Cap Value Fund, the Trustees noted that the performance of each of the share classes was below the Data Provider universe median for the 3-month, 1-year, and 3-year periods and above the Data Provider universe median for the 5-year period as applicable.
The Trustees also considered Emerald’s discussion of each Emerald Fund’s underlying portfolio diversification categories, its top contributors and top detractors, as well as Emerald’s performance and reputation generally and its investment techniques, risk management controls, and decision-making processes.
Investment Advisory Fee Rate: The Trustees reviewed and considered the contractual annual advisory fee paid by the Trust, on behalf of the Emerald Funds, to Emerald of 1.00% of the Emerald Banking and Finance Fund’s daily average net assets up to and including $100 million and 0.90% in excess of $100 million and, for each of the other Emerald Funds, 0.75% of the daily average net assets up to and including $250 million, 0.65% in excess of $250 million and up to and including $500 million, 0.55% in excess of $500 million and up to and including $750 million, and 0.45% in excess of $750 million, in light of the extent and quality of the advisory services provided by Emerald to the Emerald Funds.
The Board received and considered information including a comparison of each of the Emerald Fund’s contractual advisory fees with those of funds in the expense peer group and universe of comparable funds provided by the Data Provider. With regard to the Emerald Growth Fund and the Emerald Small Cap Value Fund, the Trustees noted that the contractual advisory fee rate, for each share class of each Fund, was below the Data Provider peer group and universe medians. With regard to the Emerald Banking and Finance Fund, the Trustees noted that the contractual advisory fee rate, for each share class, was above the Data Provider peer group and universe medians. With regard to the Emerald Insights Fund, the Trustees noted that the contractual advisory fee rate, for each share class, was generally the same as the Data Provider peer group and universe medians.
Total Expense Ratios: The Trustees further reviewed and considered the total expense ratios (net of waivers) of 1.41% for Class A, 2.06% for Class C, 1.09% for Institutional Class, and 1.37% for Investor Class of the Emerald Banking and Finance Fund; 1.03% for Class A, 1.68% for Class C, 0.72% for Institutional Class, and 1.07% for Investor Class of the Emerald Growth Fund; 1.35% for Class A, 2.00% for Class C, 1.05% for Institutional
| 68 | www.emeraldmutualfunds.com |
| Emerald Funds | Disclosure Regarding Approval of Fund Advisory Agreement |
April 30, 2019 (Unaudited)
Class, and 1.40% for Investor Class of the Emerald Insights Fund; and 1.35% for Class A, 2.00% for Class C, 1.00% for Institutional Class, and 1.25% for Investor Class of the Emerald Small Cap Value Fund.
With regard to the Emerald Growth Fund, the Trustees noted that the total expense ratio (net of waivers), for each share class, was below the Data Provider peer group and universe medians. With regard to the Emerald Banking and Finance Fund, the Trustees noted that the total expense ratio (net of waivers), for Class A and Institutional Class, were above the Data Provider peer group and universe medians, and for Class C and Investor Class, were the same as the Data Provider peer group and universe medians. With regard to Emerald Small Cap Value Fund, the Trustees noted that the total expense ratio (net of waivers), for Class A, was above the Data Provider peer group and universe medians, and for Class C, Institutional Class, and Investor Class, was generally below the Data Provider peer group and universe medians. With regard to the Emerald Insights Fund, the Trustees noted that the total expense ratio (net of waivers), for each share class, was above the Data Provider universe median, for Class A, Class C, and Institutional Class, was below the Data Provider peer group median, and for Investor Class, was above the Data Provider peer group median.
Comparable Accounts: The Trustees noted certain information provided by Emerald regarding fees charged to its other clients utilizing a strategy similar to that employed by the Emerald Funds.
Profitability:The Trustees received and considered a retrospective and projected profitability analysis prepared by Emerald based on the fees payable under the Emerald Investment Advisory Agreement with respect to each Emerald Fund. The Trustees considered the profits, if any, anticipated to be realized by Emerald in connection with the operation of each Emerald Fund. The Board then reviewed Emerald’s audited financial statements for the years ended September 30, 2018 and 2017 in order to analyze the financial condition and stability and profitability of Emerald.
Economies of Scale: The Trustees considered whether economies of scale in the provision of services to the Emerald Funds are or will be passed along to the shareholders under the proposed agreements, and noted breakpoints in the advisory fee schedule.
Other Benefits to the Adviser: The Trustees reviewed and considered any other incidental benefits derived or to be derived by Emerald from its relationship with the Emerald Funds, including whether soft dollar arrangements were used.
In renewing Emerald as the Emerald Funds’ investment adviser and renewing the Emerald Investment Advisory Agreement and the fees charged under the Emerald Investment Advisory Agreement, the Trustees concluded that no single factor reviewed by the Trustees was identified by the Trustees to be determinative as the principal factor in whether to renew the Emerald Investment Advisory Agreement. Further, the Independent Trustees were advised by separate independent legal counsel throughout the process. The Trustees, including all of the Independent Trustees, concluded that:
| ● | The nature, extent, and quality of services rendered by Emerald under the Emerald Investment Advisory Agreement with respect to the Emerald Funds was adequate; |
| ● | With regard to the Emerald Banking and Finance Fund, the performance of each of the share classes was below the Data Provider universe median for the available time periods. With regard to the Emerald Growth Fund, the performance of each of the share classes was below the Data Provider universe median for the 3-month, 1-year, and 3-year time periods and above the Data Provider universe median for the 5-year and 10-year time periods, as applicable. With regard to the Emerald Banking and Financing Fund, the performance of each of the share classes was below the Data Provider universe median for the 3-month, 1-year, and 10-year time periods as applicable, generally the same as the Data Provider universe median for the 3-year period, and above the Data Provider universe median for the 5-year period. With regard to the Emerald Small Cap Value Fund, the performance of each of the share classes was below the Data Provider universe median for the 3-month, 1-year, and 3-year periods and above the Data Provider universe median for the 5-year period as applicable; |
| ● | With regard to the Emerald Growth Fund and the Emerald Small Cap Value Fund, the contractual advisory fee rate, for each share class of each Fund, was below the Data Provider peer group and universe medians. With regard to the Emerald Banking and Finance Fund, the contractual advisory fee rate, for each share class, was above the Data Provider peer group and universe medians. With regard to the Emerald Insights Fund, the contractual advisory fee rate, for each share class, was generally the same as the Data Provider peer group and universe medians; |
| ● | With regard to the Emerald Growth Fund, the total expense ratio (net of waivers), for each share class, was below the Data Provider peer group and universe medians. With regard to the Emerald Banking and Finance Fund, the total expense ratio (net of waivers), for Class A and Institutional Class, were above the Data Provider peer group and universe median, and for Class C and Investor Class, were the same as the Data Provider peer group and universe medians. With regard to Emerald Small Cap Value Fund, the total expense ratio (net of |
| Annual Report | April 30, 2019 | 69 |
| Emerald Funds | Disclosure Regarding Approval of Fund Advisory Agreement |
April 30, 2019 (Unaudited)
waivers), for Class A, was above the Data Provider peer group and universe medians, and for Class C, Institutional Class, and Investor Class, was generally below the Data Provider peer group and universe medians. With regard to the Emerald Insights Fund, the total expense ratio (net of waivers), for each share class, was above the Data Provider universe medians, for Class A, Class C, and Institutional Class, was below the Data Provider peer group median, and for Investor Class, was above the Data Provider peer group median.
| ● | Bearing in mind the limitations of comparing different types of managed accounts and the different levels of service typically associated with such accounts, the fee structures applicable to Emerald’s other clients employing a comparable strategy to one or more of the Emerald Funds were not indicative of any unreasonableness with respect to the advisory fees proposed to be payable by the Funds; |
| ● | The profit, if any, realized by Emerald in connection with the operation of the Emerald Funds is not unreasonable to the Funds; and |
| ● | There were no material economies of scale or other incidental benefits accruing to Emerald in connection with its relationship with the Emerald Funds. |
Based on the Trustees’ deliberations and their evaluation of the information described above, the Trustees, including all of the Independent Trustees, concluded that Emerald’s compensation for investment advisory services is consistent with the best interests of the Emerald Funds and their shareholders.
| 70 | www.emeraldmutualfunds.com |
| Emerald Funds | Additional Information |
April 30, 2019 (Unaudited)
1. FUND HOLDINGS
The Funds file their complete schedule of portfolio holdings with the Securities and Exchange Commission (the “SEC”) for the first and third quarters of each fiscal year within 60 days after the end of the period. Copies of the Funds’ previously filed Form NQs are available without charge on the SEC website at http://www.sec.gov.
2. FUND PROXY VOTING POLICIES, PROCEDURES AND SUMMARIES
Each Fund’s policies and procedures used in determining how to vote proxies and information regarding how the Funds voted proxies relating to portfolio securities during the most recent prior 12-month period ending June 30 are available without charge, (1) upon request, by calling (toll-free) (855) 828-9909 and (2) on the SEC’s website at http://www.sec.gov.
3. TAX INFORMATION (UNAUDITED)
The Funds designate the following for federal income tax purposes for distributions made during the calendar year ended December 31, 2018:
| | QDI | DRD |
| Emerald Banking and Finance Fund | N/A | N/A |
| Emerald Growth Fund | N/A | N/A |
| Emerald Insights Fund | 35.92% | 36.18% |
| Emerald Small-Cap Value Fund | N/A | N/A |
In early 2019, if applicable, shareholders of record received this information for the distribution paid to them by the Funds during the calendar year 2018 via Form 1099. The Funds will notify shareholders in early 2020 of amounts paid to them by the Funds, if any, during the calendar year 2019.
Pursuant to Section 852(b)(3) of the Internal Revenue Code, the Emerald Banking and Finance Fund, the Emerald Growth Fund, the Emerald Insights Fund, and the Emerald Small Cap Value Fund designated $86,106,387, $116,684,237, $1,740,059, and $1,226,182, respectively, as long-term capital gain dividends.
| Annual Report | April 30, 2019 | 71 |
| Emerald Funds | Trustees and Officers |
April 30, 2019 (Unaudited)
Additional information regarding the Fund’s trustees is included in the Statement of Additional Information, which can be obtained without charge by calling 855-828-9909.
INDEPENDENT TRUSTEES
Name, Address* & Year of Birth | Position(s) Held with Fund | Term of Office** and Length of Time Served | Principal Occupation(s) During Past 5 Years*** | Number of Funds in Fund Complex Overseen by Trustee**** | Other Directorships Held by Trustee During Past 5 Years*** |
Mary K. Anstine, 1940 | Trustee and Chairman | Ms. Anstine was elected at a special meeting of shareholders held on March 21, 1997 and re-elected at a special meeting of shareholders held on August 7, 2009. Ms. Anstine was appointed Chairman of the Board at the June 6, 2017 meeting of the Board of Trustees. | Ms. Anstine was formerly an Executive Vice President of First Interstate Bank of Denver until 1994, President/Chief Executive Officer of HealthONE Alliance, Denver, Colorado, from 1994 to 2004, and has been retired since 2004. Ms. Anstine is also Trustee/Director of AV Hunter Trust and Colorado Uplift Board. Ms. Anstine was formerly a Director of the Trust Bank of Colorado (later purchased and now known as Northern Trust Bank), HealthONE and Denver Area Council of the Boy Scouts of America, and a member of the American Bankers Association Trust Executive Committee. | 31 | Ms. Anstine is a Trustee of ALPS ETF Trust (20 funds); ALPS Variable Investment Trust (9 funds); Reaves Utility Income Fund (1 fund); and Segall Bryant & Hamill Trust (14 funds). |
Jeremy W. Deems, 1976 | Trustee | Mr. Deems was appointed as a Trustee at the March 11, 2008 meeting of the Board of Trustees and elected at a special meeting of shareholders held on August 7, 2009. | Mr. Deems is the Co-Founder, Chief Operations Officer and Chief Financial Officer of Green Alpha Advisors, LLC, a registered investment advisor, and Co-Portfolio Manager of the Shelton Green Alpha Fund. Prior to joining Green Alpha Advisors, Mr. Deems was CFO and Treasurer of Forward Management, LLC, ReFlow Management Co., LLC, ReFlow Fund, LLC, a private investment fund, and Sutton Place Management, LLC, an administrative services company, from 1998 to June 2007. From 2004 to 2005, Mr Deems also served as Treasurer of the Forward Funds and the Sierra Club Funds. | 31 | Mr. Deems is a Trustee of ALPS ETF Trust (20 funds); ALPS Variable Investment Trust (9 funds); Clough Funds Trust (1 fund); and Reaves Utility Income Fund (1 fund). |
| 72 | www.emeraldmutualfunds.com |
| Emerald Funds | Trustees and Officers |
April 30, 2019 (Unaudited)
INDEPENDENT TRUSTEES
Name, Address* & Year of Birth | Position(s) Held with Fund | Term of Office** and Length of Time Served | Principal Occupation(s) During Past 5 Years*** | Number of Funds in Fund Complex Overseen by Trustee**** | Other Directorships Held by Trustee During Past 5 Years*** |
Jerry G. Rutledge, 1944 | Trustee | Mr. Rutledge was elected at a special meeting of shareholders held on August 7, 2009. | Mr. Rutledge is the President and owner of Rutledge’s Inc., a retail clothing business. Mr. Rutledge is currently Director of the American National Bank. He was from 1994 to 2007 a Regent of the University of Colorado. | 31 | Mr. Rutledge is a Trustee of Principal Real Estate Income Fund (1 fund); Clough Global Dividend and Income Fund (1 fund); Clough Global Equity Fund (1 fund); and Clough Global Opportunities Fund (1 fund). |
Michael “Ross” Shell, 1970 | Trustee | Mr. Shell was elected at a special meeting of shareholders held on August 7, 2009. | Mr. Shell is Founder and CEO of Red Idea, LLC, a strategic consulting/early stage venture firm (since June 2008). From 1999 to 2009, he was a part-owner and Director of Tesser, Inc., a brand agency. From December 2005 to May 2008, he was Director, Marketing and Investor Relations, of Woodbourne, a REIT/real estate hedge fund and private equity firm. Prior to this, from May 2004 to November 2005, he worked as a business strategy consultant; from June 2003 to April 2004, he was on the Global Client Services team of IDEO, a product design/innovation firm; and from 1999 to 2003, he was President of Tesser, Inc. Mr. Shell graduated with honors from Stanford University with a degree in Political Science. | 31 | None. |
| Annual Report | April 30, 2019 | 73 |
| Emerald Funds | Trustees and Officers |
April 30, 2019 (Unaudited)
INTERESTED TRUSTEE
Name, Address* & Year of Birth | Position(s) Held with Fund | Term of Office** and Length of Time Served | Principal Occupation(s) During Past 5 Years*** | Number of Funds in Fund Complex Overseen by Trustee**** | Other Directorships Held by Trustee During Past 5 Years*** |
Edmund J. Burke, 1961 | Trustee and President^ | Mr. Burke was elected as Trustee at a special meeting of shareholders held on August 7, 2009. Mr. Burke was elected President of the Trust at the December 17, 2002 meeting of the Board of Trustees. | Mr. Burke is President and a Director of ALPS Holdings, Inc. (“AHI”) (since 2005)and ALPS Advisors, Inc. (“AAI”) and Director of Boston Financial Data Services, Inc. (“BFDS”), ALPS Distributors, Inc. (“ADI”), ALPS Fund Services, Inc. (“AFS”) and ALPS Portfolio Solutions Distributor, Inc. (“APSD”). Because of his positions with AHI, BFDS, AAI, ADI, AFS and APSD, Mr. Burke is deemed an affiliate of the Trust as defined under the 1940 Act. | 31 | Mr. Burke is a Trustee of ALPS ETF Trust (20 funds); Clough Global Dividend and Income Fund (1 fund); Clough Global Equity Fund (1 fund); Clough Global Opportunities Fund (1 fund); Clough Funds Trust (1 fund); Liberty All-Star Equity Fund (1 fund); and Director of the Liberty All-Star Growth Fund, Inc. (1 fund). |
| 74 | www.emeraldmutualfunds.com |
| Emerald Funds | Trustees and Officers |
April 30, 2019 (Unaudited)
OFFICERS
Name, Address* & Year of Birth | Position(s) Held with Fund | Term of Office** and Length of Time Served | Principal Occupation(s) During Past 5 Years*** |
Kimberly R. Storms, 1972 | Treasurer | Ms. Storms was elected Treasurer of the Trust at the March 12, 2013 meeting of the Board of Trustees. | Ms. Storms is Senior Vice President - Director of Fund Administration of ALPS. Because of her position with ALPS, Ms. Storms is deemed an affiliate of the Trust as defined under the 1940 Act. Ms. Storms is also Treasurer of Liberty All-Star Equity Fund, Liberty All-Star Growth Fund, Inc., and ALPS Series Trust. Ms. Storms also serves as a Board member and Treasurer of The Center for Trauma & Resilience, a nonprofit agency. |
Karen S. Gilomen, 1970 | Secretary | Ms. Gilomen was elected Secretary of the Trust at the December 13, 2016 meeting of the Board of Trustees. | Ms. Gilomen joined ALPS in August 2016 as Vice President and Senior Counsel. Prior to joining ALPS, Ms. Gilomen was Vice President - General Counsel & CCO of Monticello Associates, Inc. from 2010 to 2016. Because of her position with ALPS, Ms. Gilomen is deemed an affiliate of the Trust, as defined under the 1940 Act. Ms. Gilomen is also the Secretary of Reaves Utility Income Fund and the Assistant Secretary of the WesMark Funds. |
Ted Uhl, 1974 | Chief Compliance Officer (“CCO”) | Mr. Uhl was appointed CCO of the Trust at the June 8, 2010 meeting of the Board of Trustees. | Mr. Uhl joined ALPS in October 2006, and is currently Deputy Compliance Officer of ALPS. Prior to his current role, Mr. Uhl served as Senior Risk Manager for ALPS from October 2006 until June 2010. Before joining ALPS, Mr. Uhl served a Sr. Analyst with Enenbach and Associates (RIA), and a Sr. Financial Analyst at Sprint. Because of his position with ALPS, Mr. Uhl is deemed an affiliate of the Trust as defined under the 1940 Act. Mr. Uhl is also CCO of the Axonic Alternative Income Fund, Boulder Growth & Income Fund, Inc., Centre Funds, Index Funds, Reality Shares ETF Trust, Reaves Utility Income Fund and XAI Octagon Floating Rate & Alternative Income Term Trust. |
Jennell Panella, 1974 | Assistant Treasurer | Ms. Panella was elected Assistant Treasurer of the Trust at the September 15, 2015 meeting of the Board of Trustees. | Ms. Panella joined ALPS in June 2012 and is currently Fund Controller of ALPS Fund Services, Inc. Prior to joining ALPS, Ms. Panella served as Financial Reporting Manager for Parker Global Strategies, LLC (2009-2012). Because of her position with ALPS, Ms. Panella is deemed an affiliate of the Trust as defined under the 1940 Act. Ms. Panella also serves as Assistant Treasurer of James Advantage Funds. |
Sharon Akselrod, 1974 | Assistant Secretary | Ms. Akselrod was elected Assistant Secretary of the Trust at the September 15, 2015 meeting of the Board of Trustees. | Ms. Akselrod joined ALPS in August 2014 and is currently Senior Investment Company Act Paralegal of ALPS Fund Services, Inc. Prior to joining ALPS, Ms. Akselrod served as Corporate Governance and Regulatory Associate for Nordstrom fsb (2013-2014) and Senior Legal Assistant – Legal Manager for AXA Equitable Life Insurance Company (2008-2013). Because of her position with ALPS, Ms. Akselrod is deemed an affiliate of the Trust as defined under the 1940 Act. Ms. Akselrod is also Assistant Secretary of ALPS ETF Trust, Clough Funds Trust and Principal Real Estate Income Fund. |
| Annual Report | April 30, 2019 | 75 |
| Emerald Funds | Trustees and Officers |
April 30, 2019 (Unaudited)
OFFICERS
Name, Address* & Year of Birth | Position(s) Held with Fund | Term of Office** and Length of Time Served | Principal Occupation(s) During Past 5 Years*** |
Jennifer Craig 1973 | Assistant Secretary | Ms. Craig was elected Assistant Secretary of the Trust at the June 8, 2016 meeting of the Board of Trustees. | Ms. Craig joined ALPS in 2007 and is currently Assistant Vice President and Paralegal Manager of ALPS. Prior to joining ALPS, Ms. Craig was Legal Manager at Janus Capital Management LLC and served as Assistant Secretary of Janus Investment Fund, Janus Adviser Series and Janus Aspen Series. Because of her position with ALPS, Ms. Craig is deemed an affiliate of the Trust as defined under the 1940 Act. Ms. Craig is also Assistant Secretary of Clough Global Dividend and Income Fund, Clough Global Equity Fund, Clough Global Opportunities Fund, Liberty All-Star Equity Fund and Liberty All-Star Growth Fund, Inc. |
Sareena Khwaja-Dixon, 1980 | Assistant Secretary | Ms. Khwaja-Dixon was elected Assistant Secretary of the Trust at the December 12, 2017 meeting of the Board of Trustees. | Ms. Khwaja-Dixon joined ALPS in August 2015 and is currently Senior Counsel and Vice President of ALPS Fund Services, Inc. Prior to joining ALPS, Ms. Khwaja-Dixon served as a Senior Paralegal/Paralegal for Russell Investments (2011 – 2015). Ms. Khwaja-Dixon is also Secretary of Liberty All-Star Equity Fund and Liberty All-Star Growth Fund, Inc., Clough Funds Trust, Clough Dividend and Income Fund, Clough Global Opportunities Fund, and Clough Global Equity Fund. |
| * | All communications to Trustees and Officers may be directed to Financial Investors Trust c/o 1290 Broadway, Suite 1100, Denver, CO 80203. |
| ** | This is the period for which the Trustee or Officer began serving the Trust. Each Trustee serves an indefinite term, until his successor is elected. Officers are elected on an annual basis. |
| *** | Except as otherwise indicated, each individual has held the office shown or other offices in the same company for the last five years. |
| **** | The Fund Complex includes all series of the Trust (currently 31) and any other investment companies for which any Trustee serves as trustee for and which Emerald Mutual Fund Advisers Trust provides investment advisory services (currently none). |
| ^ | Effective June 12, 2019, Mr. Burke’s term as President of the Trust ended and Bradley J. Swenson was appointed President of the Trust. |
| 76 | www.emeraldmutualfunds.com |
| Emerald Funds | Privacy Policy |
| Who We Are | |
| Who is providing this notice? | Emerald Banking and Finance Fund, Emerald Growth Fund, Emerald Insights Fund and Emerald Small Cap Value Fund |
| What We Do | |
| How do the Funds protect my personal information? | To protect your personal information from unauthorized access and use, we use security measures that comply with federal law. These measures include computer safeguards and secured files and buildings. |
| How do the Funds collect my personal information? | We collect your personal information, for example, when you ● open an account ● provide account information or give us your contact information ● make a wire transfer or deposit money |
| Why can’t I limit all sharing? | Federal law gives you the right to limit only ● sharing for affiliates’ everyday business purposes-information about your creditworthiness ● affiliates from using your information to market to you ● sharing for non-affiliates to market to you State laws and individual companies may give you additional rights to limit sharing. |
| Definitions | |
| Affiliates | Companies related by common ownership or control. They can be financial and nonfinancial companies. |
| Non-affiliates | Companies not related by common ownership or control. They can be financial and nonfinancial companies. ● The Funds do not share with non-affiliates so they can market to you. |
| Joint marketing | A formal agreement between non-affiliated financial companies that together market financial products or services to you. ● The Funds do not jointly market. |
| Other Important Information | |
| California residents | If your account has a California home address, your personal information will not be disclosed to nonaffiliated third parties except as permitted by applicable California law, and we will limit sharing such personal information with our affiliates to comply with California privacy laws that apply to us. |
| Vermont residents | The State of Vermont requires financial institutions to obtain your consent prior to sharing personal information that they collect about you with affiliated companies and nonaffiliated third parties other than in certain limited circumstances. Except as permitted by law, we will not share personal information we collect about you with nonaffiliated third parties or other affiliated companies unless you provide us with your written consent to share such information. |
| Annual Report | April 30, 2019 | 77 |
| Emerald Funds | Privacy Policy |
| FACTS | WHAT DO THE FUNDS DO WITH YOUR PERSONAL INFORMATION? |
| WHY? | Financial companies choose how they share your personal information. Federal law gives consumers the right to limit some but not all sharing. Federal law also requires us to tell you how we collect, share, and protect your personal information. Please read this notice carefully to understand what we do. |
| WHAT? | The types of personal information we collect and share depend on the product or service you have with us. This information can include: ● Social Security number and account transactions ● Account balances and transaction history ● Wire transfer instructions |
| HOW? | All financial companies need to share customers’ personal information to run their everyday business. In the section below, we list the reasons financial companies can share their customers’ personal information; the reasons the Funds choose to share; and whether you can limit this sharing. |
| Reasons we can share your personal information | Do the funds share: | Can you limit this sharing? |
For our everyday business purposes – such as to process your transactions, maintain your account(s), respond to court orders and legal investigations, or report to credit bureaus | Yes | No |
For our marketing purposes – to offer our products and services to you | No | We do not share. |
| For joint marketing with other financial companies | No | We do not share. |
For our affiliates’ everyday business purposes – information about your transactions and experiences | Yes | No |
For our affiliates’ everyday business purposes – information about your creditworthiness | No | We do not share. |
| For non-affiliates to market to you | No | We do not share. |
| 78 | www.emeraldmutualfunds.com |
Intentionally Left Blank

Beginning on January 1, 2021, as permitted by regulations adopted by the U.S. Securities and Exchange Commission, paper copies of the Funds’ annual and semi-annual shareholder reports will no longer be sent by mail, unless you specifically request paper copies of the reports. Instead, the reports will be made available on the Funds’ website at www.GrandeurPeakGlobal.com and you will be notified by mail each time a report is posted and provided with a website link to access the report.
Beginning on January 1, 2019, you may, notwithstanding the availability of shareholder reports online, elect to receive all future shareholder reports in paper free of charge. If you invest through a financial intermediary, you can contact your financial intermediary to request that you continue to receive paper copies of your shareholder reports. If you invest directly with the Funds, you can call 1.855.377.7325 to let the Funds know you wish to continue receiving paper copies of your shareholder reports.
If you already elected to receive shareholder reports electronically, you will not be affected by this change and you need not take any action. You may elect to receive shareholder reports and other communications from the Funds electronically anytime by contacting your financial intermediary (such as a broker-dealer or bank) or, if you are a direct investor, by enrolling at www.GrandeurPeakGlobal.com.

TABLE OF CONTENTS
| Shareholder Letter | 2 |
| Performance Update | 7 |
| Disclosure of Fund Expenses | 28 |
| Portfolio of Investments | |
| Grandeur Peak Emerging Markets Opportunities Fund | 30 |
| Grandeur Peak Global Micro Cap Fund | 34 |
| Grandeur Peak Global Opportunities Fund | 37 |
| Grandeur Peak Global Reach Fund | 41 |
| Grandeur Peak Global Stalwarts Fund | 46 |
| Grandeur Peak International Opportunities Fund | 49 |
| Grandeur Peak International Stalwarts Fund | 53 |
| Statements of Assets and Liabilities | 56 |
| Statements of Operations | 58 |
| Statements of Changes in Net Assets | |
| Grandeur Peak Emerging Markets Opportunities Fund | 60 |
| Grandeur Peak Global Micro Cap Fund | 61 |
| Grandeur Peak Global Opportunities Fund | 62 |
| Grandeur Peak Global Reach Fund | 63 |
| Grandeur Peak Global Stalwarts Fund | 64 |
| Grandeur Peak International Opportunities Fund | 65 |
| Grandeur Peak International Stalwarts Fund | 66 |
| Financial Highlights | |
| Grandeur Peak Emerging Markets Opportunities Fund | 67 |
| Grandeur Peak Global Micro Cap Fund | 69 |
| Grandeur Peak Global Opportunities Fund | 70 |
| Grandeur Peak Global Reach Fund | 72 |
| Grandeur Peak Global Stalwarts Fund | 74 |
| Grandeur Peak International Opportunities Fund | 76 |
| Grandeur Peak International Stalwarts Fund | 78 |
| Notes to Financial Statements | 80 |
| Report of Independent Registered Public Accounting Firm | 92 |
| Additional Information | 93 |
| Trustees and Officers | 95 |
| Privacy Policy | 100 |
| Grandeur Peak Funds® | Shareholder Letter |
April 30, 2019 (Unaudited)
Dear Fellow Shareholders,
We’ve discussed in prior letters the fact that we like to cast our nets into the ocean of the micro to mid-cap universe. Some academics and market participants still profess the merits of the “small-cap premium,” but for us, we feel the real benefit of smaller-cap investing is that the opportunity set is so much more robust for fundamental stock pickers. According to Bloomberg, as of March 31, 2019 there were 2,813 listed companies across the globe with a market cap greater than $5 billion. But dip down below $5 billion and the opportunity set really opens up: 24,473 listed companies with a market cap above $100 million, and over 30,000 below $100 million. We love to fish in that large ocean, not only because of the opportunity set, but we also believe we are more likely to find faster and more sustainable earnings growth among this universe.
However, as you probably well know, the smaller cap fishing has been relatively poor over the past three years, and was downright lousy the past 15 months (January 2018 - March 2019), as shown in Exhibit 1 below.
Exhibit 1

Source: MSCI, S&P Dow Jones (data from 12/31/2017 - 3/29/2019).
Past performance is no guarantee of future results.
You can see that the return spread between large-cap stocks in the US and small-cap and micro-cap stocks outside the US has been massive over the past 15 months. This has been one of the toughest market environments we’ve seen for small-cap investors having to swim upstream.
On the flip side, there have been other periods when it felt like we were being swept down the river with the flow of increased risk taking and the jump in small-cap valuations. Such was the case in 2009 through mid-2011, as shown in Exhibit 2.
| 2 | 1.855.377.7325 | www.GrandeurPeakGlobal.com |
| Grandeur Peak Funds® | Shareholder Letter |
April 30, 2019 (Unaudited)
Exhibit 2
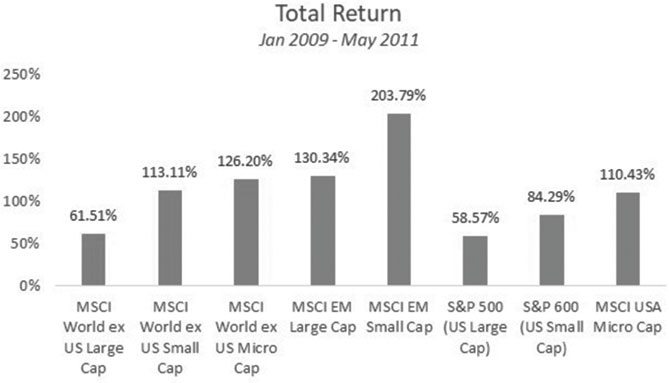
Source: MSCI, S&P Dow Jones (data from 12/31/2008 - 5/31/2011).
Past performance is no guarantee of future results.
In still other market environments it has felt like we’re swimming around in a placid lake. Such was the case over the three year period of 2012 - 2015 as shown in Exhibit 3.
Exhibit 3
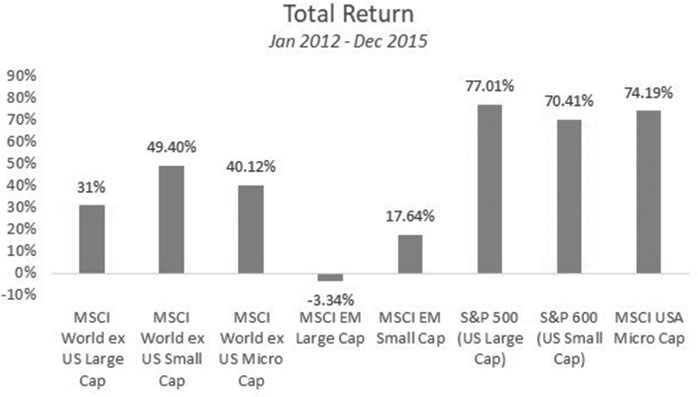
Source: MSCI, S&P Dow Jones (data from 12/31/2011 - 12/31/2015).
Past performance is no guarantee of future results.
| Annual Report | April 30, 2019 | 3 |
| Grandeur Peak Funds® | Shareholder Letter |
April 30, 2019 (Unaudited)
We get asked which market environments are better for our investment approach. Because of our focus on quality, we believe we are more likely to outperform in bear markets than bull markets; but more importantly, over market cycles we believe earnings growth drives stock prices, and if we can buy growing companies at fair valuations, such growth should be reflected in the stock price. However, as far as managing our process goes, we don’t change our approach based on market conditions. What we’re doing is hard, it’s always hard. Bottom-up, fundamental research on a global scale is painstaking, arduous, expensive and not for anyone lacking energy or passion. We’re trying to uncover what we think are the highest quality companies we can find among the listed companies across the world, and we try to buy them at reasonable to good valuations. Our allocation to various countries and regions across the globe is driven by our bottom-up stock picking, and most of the time our portfolios look fairly different than the benchmarks we get measured against.
We hang our hat on our stock picking, not our macro sector or country/regional allocations. Each quarter we publish our attribution, and each quarter we hope to see positive attribution from Stock Selection. This isn’t always the case (we definitely make mistakes), but it has been the case over the majority of quarters. Sometimes our currency exposures hurts us and sometime our sector or geographical allocations relative to the benchmark index moves against us, but we firmly believe that over the long run, buying what we believe are high quality companies — that can deliver robust earnings growth — at reasonable valuations, is a good recipe for generating excess returns.
Notes from the Road
Mark Madsen, Portfolio Manager of the International Opportunities Fund and the Global Reach Fund, has been living in Australia with his family since the first of the year. He shares his thoughts on working from Australia.
I’ve been living in Australia with my wife and four kids (ages 13, 11, 7, and 4) since January. We recently relocated to Sydney, after having spent several weeks each in Brisbane and Melbourne. In total, we will spend 5 months “down under.” Traveling as a family for an extended period of time has been an experience—full of both highs and lows. This is my kids’ first time traveling internationally and they have loved the adventure of researching new places and things to see. My wife Nicole has, as always, been the rock of our family and handled the bulk of the work involved in keeping the train on the tracks.
Our analysis at Grandeur is always grounded in bottom-up, company specific research, but our time here has come at an interesting point in Australia’s macro picture. The Australian housing markets, more specifically Sydney and Melbourne, have been correcting after a strong multi-year run—and yet it appears the economy is maneuvering towards a soft landing. The much anticipated Haynes report, an inquiry into abuses within the financial services industry, was released and, while the headlines were negative, it appears its bark was worse than its bite. Australia is rich in natural resources—and while the commodities cycle has been subdued since 2012, there are signs of life in that industry after years of under investment.
Working on the research team at Grandeur Peak is the opposite of an 8-to-5 job. There is a truly never-ending list of things to do—more companies worth looking into, further research we can do on the companies we already know, and a constant flow of events and news to account for. It’s normal for our team to spend time with our family after a day at the office—and then get back online later in the night to catch up on an earnings release or do a call with a management team in Asia. While living abroad hasn’t decreased the workload at all, it has afforded me a simpler lifestyle for a time—and allowed me to just focus on work and family.
Technology has allowed me all the access to all the tools and systems that we use and, with just a couple of exceptions, I’ve been able to seamlessly keep up with my regular work flow while half-way around the world. What I have missed while working remotely has been the constant dialogue, both formal and informal, that takes place in the office.
Living in Australia has allowed me to go further in-depth into a market that has a lot of characteristics that we as a firm like—but also a market where we are currently underweight and where our historical results have been mixed. My time here in Australia has been split between researching companies we already own and companies that we don’t own—but potentially could own, based on our initial screening process. In total, we’ll be in Australia for 5 months. During that time I’ll be doing company visits in 8 different cities and will likely interact with 100 or so companies (some new, but many that Grandeur was already familiar with). The end goal of all this work is to refine the list of what we own and, hopefully, to find a handful of new opportunities to put capital to work.
National Storage (NSR AU)1 is one example of an already-owned company where we’ve been able to really focus and do deep due diligence. NSR owns and operates storage rental facilities within Australia and New Zealand. We’ve looked at storage companies across the world—and think Australia is attractive because the industry is relatively unconsolidated and underpenetrated relative to other developed markets, such as the US. During my time in Australia, we have spoken to multiple members of the company’s management team, met with some of the company’s competitors (both public and private), talked with 3rd party industry experts, and toured some of the company’s assets to better understand how they are positioning themselves in the market.
| 1 | A full list of Fund holdings can be found later in this Annual Report. |
| 4 | 1.855.377.7325 | www.GrandeurPeakGlobal.com |
| Grandeur Peak Funds® | Shareholder Letter |
April 30, 2019 (Unaudited)
A couple of sets of colleagues have joined me during my stint here. Brad Barth and Conner Whipple, from our finance team, met me for a week in Sydney in February. We spent that week digging deeper into the Australian financial sector which has some strong secular tailwinds behind it, but also has a lot of peculiarities that are unique to the Australian market.
I also spent a week with traveling with Amy Sunderland and Spencer Hackett—who work on GP’s Global Micro Cap Fund. Australia is ripe with interesting smaller companies. As compared to the US, companies in Australia are much more likely to go public at a smaller size. The Australian market also tends to emphasize having companies that are both profitable and pay a dividend—both attributes that screen well for us. Our Micro Cap Fund is the one fund at Grandeur that is overweight in Australia—which makes sense given how plentiful small caps are.
Before I return to the Northern Hemisphere, I plan to visit New Zealand, and fully explore companies in the Sydney area. Then, pack up my family and our memories, my notes on living down under and be back in the Grandeur offices in Salt Lake City, planning our next team research trip.
Business Update
We continue to support our research team organically with our intern program. We’re impressed with the dedication of our young colleagues and have offered full-time positions beginning in May to three 2019 college graduates who have each been with us for a while already. Congratulations to Spencer Randall, Miranda Jacobs, and Dane Nielson, we’re excited to see all that you will accomplish! We of course added a few other college interns to the team this year as well. The other research addition this year was bringing on Rohan Dalal who is a skilled young analyst with particular knowledge of India. He will spend a meaningful portion of the year visiting companies in India.
On the business side of the firm, in the last year we have been fortune to add two very seasoned traders, Adam Rowbotham and Jason Mullin, to our global trading desk. We have also brought on Todd Matheny as Director of Client Relations and Nate Carmen as an Operations Analyst. You can find their impressive bios on our website.
In addition to fresh perspectives from new hires, we are benefitting greatly from the global observations shared by our colleagues temporarily living abroad. Mark Madsen is stationed in Australia from January through June in order to dive deep into the region and local companies. Preston Williams is in Eastern and Western Europe from February to June with the same mission. Spencer Hackett will be taking an extended trip to Japan to visit companies this summer, as will Juliette Douglas in Europe. We look forward to sharing their insights with you in the form of Notes from the Road and future white papers.
Fund Performance & Attribution
See full performance on pages 7-29.
The past year has been volatile, particularly with the large sell-off in Q4 2018 and the rebound in Q1 2019. The net results for the year were tough in Emerging Markets and favorable in the U.S. Given our continued overweight to Emerging Markets and underweight to the U.S. this provided a significant headwind for our funds. We continue to believe we’re finding much more compelling growth and better valuations in emerging countries, while struggling to find valuations in the U.S. that we believe can provide similar long-term returns. But over the short-term, the markets moved against us.
Emerging Markets Opportunities: For the year, the Institutional share class returned -8.32% vs -9.31% for the benchmark. All regions of the emerging markets benchmark index posted negative returns for the year. South and Central America showed the least negative returns, but they account for only 11% of the index. Roughly 60% of the Fund is in Asian countries, where we outperformed the declining index. Our weakest regional performance was among out small holdings in Eastern Europe. Our best sector contribution came from Industrials, while our biggest detractor was Health Care.
Global Micro Cap: For the year, the Fund returned -7.67% vs -0.32%% for the small cap benchmark. This has been a very tough year for micro caps. Even in the small cap index, North America is the only region that had positive returns. We outperformed in North America, but we are vastly underweight relative to the benchmark. We also outperformed in our largest region, Asia Pacific, but the negative returns there pulled us down. Despite outperformance in these two regions, they were the two biggest detractors to the find due to our weightings. Eastern Europe was our worst performing regions, but had only a minor impact on the Fund. From a sector standpoint, IT and Consumer that were the large detractors, with Industrials, Energy, and Materials providing small positive contributions.
Performance data quoted represents past performance. Past performance does not guarantee future results.
| Annual Report | April 30, 2019 | 5 |
| Grandeur Peak Funds® | Shareholder Letter |
April 30, 2019 (Unaudited)
Global Opportunities/International Opportunities: For the year, the Global Opportunities Institutional share class returned -1.84% vs -0.32% for the benchmark, and the International Opportunities Institutional share class returned -7.19% vs -8.19% for the benchmark. The difference in returns between these Funds was driven by the Global Fund’s allocation to the U.S. and the International Funds higher exposure to Emerging Markets. We outperformed nicely in the U.S. in the Global Fund, but were very underweight. Asia, where we were overweight, was the largest detractor to both Funds. The IT sector provided the highest contribution to the Funds’ performance, while Financials caused the most pain.
Global Reach: For the year, the Institutional share class returned -1.33% vs -0.32% for the benchmark. Our healthy outperformance in the U.S. more than made up for our significant underweight. Unfortunately, negative returns in Asia, Eastern Europe, and South America provided the counter-balance. The Industrials and IT sectors provided nice contributions, but were outweighed by negative contributions from the Financials and Consumer sectors.
Global Stalwarts/International Stalwarts: For the year, the Global Stalwarts Institutional share class returned 2.08% vs 1.25% for the benchmark, and the International Stalwarts Institutional share class returned -2.50% vs -5.31% for the benchmark. The difference in returns between these Funds was driven by the Global Fund’s allocation to the U.S. and the International Funds higher exposure to Emerging Markets. Both Funds outperformed in North America and underperformed in Asia Pacific. The strongest performance actually came in the Africa/Middle East region, which was a small weighting, but provided a meaningful contribution for the year. The IT sector provided the strongest contribution to both Funds, while Financials and Health Care were the biggest detractors.
Sincerely,
Robert Gardiner, CFA
Chairman & Portfolio Manager
Blake Walker
CEO & Portfolio Manager
Randy Pearce, CFA, MBA
CIO & Portfolio Manager
The objective of all Grandeur Peak Funds is long-term growth of capital.
RISKS: Mutual fund investing involves risks and loss of principal is possible. Investing in small and micro-cap funds will be more volatile and loss of principal could be greater than investing in large cap or more diversified funds. Investing in foreign securities entails special risks, such as currency fluctuations and political uncertainties, which are described in more detail in the prospectus. Investments in emerging markets are subject to the same risks as other foreign securities and may be subject to greater risks than investments in foreign countries with more established economies and securities markets.
Must be proceeded by or accompanied by a prospectus.
The views and information discussed in this commentary are as of the date of publication, are subject to change, and may not reflect the writer's current views. The views expressed represent an assessment of market conditions at a specific point in time, are opinions only and should not be relied upon as investment advice regarding a particular investment or markets in general. Such information does not constitute a recommendation to buy or sell specific securities or investment vehicles. It should not be assumed that any investment will be profitable or will equal the performance of the Funds or any securities or any sectors mentioned herein. The subject matter contained herein has been derived from several sources believed to be reliable and accurate at the time of compilation. The Funds do not accept any liability for losses either direct or consequential caused by the use of this information.
Past performance does not guarantee future results.
Eric Huefner, Amy Hone and Dustin Brown are registered representatives of ALPS Distributors, Inc.
CFA® is trademark owned by CFA Institute.
ALPS Distributors, Inc. is the Distributor for the Grandeur Peak Funds.
Grandeur Peak Global Advisors and ALPS Distributors, Inc are not affiliated.
| 6 | 1.855.377.7325 | www.GrandeurPeakGlobal.com |
| Grandeur Peak Emerging Markets Opportunities Fund | Performance Update |
April 30, 2019 (Unaudited)
Annualized Total Return Performance for the periods ended April 30, 2019
| | | | | | Since
Inception(a) | Expense Ratio(b) |
| | 6 Months | 1 Year | 3 Years | 5 Years | Gross | Net(c) |
| Grandeur Peak Emerging Markets Opportunities Fund - Investor (GPEOX) | 14.63% | -8.48% | 6.88% | 3.87% | 4.60% | 1.80% | 1.80% |
| Grandeur Peak Emerging Markets Opportunities Fund - Institutional (GPEIX) | 14.66% | -8.32% | 7.13% | 4.09% | 4.82% | 1.55% | 1.55% |
| MSCI Emerging Markets SMid Cap Index(d) | 12.85% | -9.31% | 7.04% | 2.30% | 2.94% | | |
| MSCI Emerging Markets IMI Index(e) | 13.71% | -5.50% | 10.92% | 4.13% | 4.20% | | |
Performance data quoted represents past performance. Past performance does not guarantee future results. Investment return and principal value of an investment will fluctuate so that an investor’s shares, when sold or redeemed, may be worth more or less than the original cost. The Fund imposes a 2.00% redemption fee on shares held for less than 60 days. Current performance data may be higher or lower than actual data quoted. For the most current month-end performance data, please call 1-855-377-PEAK (7325).
The table does not reflect the deduction of taxes a shareholder would pay on Fund distributions or redemption of Fund shares.
Subject to investment risks, including possible loss of the principal amount invested.
Returns for periods less than 1 year are cumulative.
| (a) | Fund inception date of December 16, 2013. |
| (b) | Ratios as of the Prospectus dated August 31, 2018 and may differ from the ratios presented in the Financial Highlights. |
| (c) | Grandeur Peak Global Advisors, LLC (the “Adviser”), has agreed to waive and/or reimburse fees or expenses in order to limit Total Annual Fund Operating Expenses After Fee Waiver/Expense Reimbursement (excluding acquired fund fees and expenses, brokerage expenses, interest expenses, taxes and extraordinary expenses) to 1.95% and 1.70% of the Fund’s average daily net assets for the Fund’s Investor Class Shares and Institutional Class Shares, respectively. This agreement (the “Expense Agreement”) is in effect through August 31, 2019. The Adviser will be permitted to recover, on a class- by-class basis, expenses it has borne through the Expense Agreement to the extent that a Fund’s expenses in later periods fall below annual rates set forth in the Expense Agreement; provided, however, that such recapture payments do not cause the Fund’s expense ratio (after recapture) to exceed the lesser of (i) the expense cap in effect at the time of the waiver and (ii) the expense cap in effect at the time of the recapture. Notwithstanding the foregoing, the Fund will not be obligated to pay any such deferred fees and expenses more than three years after the date on which the fee and expenses was deferred. The Expense Agreement may not be terminated or modified prior to August 31, 2019 except with the approval of the Fund’s Board of Trustees. |
| (d) | The MSCI Emerging Markets SMID Cap Index is designed to measure the equity market performance of small and mid-cap companies across emerging markets. The Adviser made this recommendation to the Board because the Russell indices are being decommissioned and the Advisor believes the MSCI index most closely aligns to the Fund’s investment strategies and investment restrictions. Information on both indices will be shown for a one-year transition period. MSCI makes no express or implied warranties or representations and shall have no liability whatsoever with respect to any MSCI data contained herein. The MSCI data may not be further redistributed or used to create indices or financial products. The Index is not actively managed and does not reflect any deductions for fees, expenses or taxes. An investor may not invest directly into the Index. |
| (e) | The MSCI Emerging Markets IMI Index is designed to measure the equity market performance of large, mid, and small-cap companies across emerging markets. The Index is not actively managed and does not reflect any deductions for fees, expenses or taxes. An investor may not invest directly into the Index. |
| Annual Report | April 30, 2019 | 7 |
| Grandeur Peak Emerging Markets Opportunities Fund | Performance Update |
April 30, 2019 (Unaudited)
Growth of $10,000 for the period ended April 30, 2019
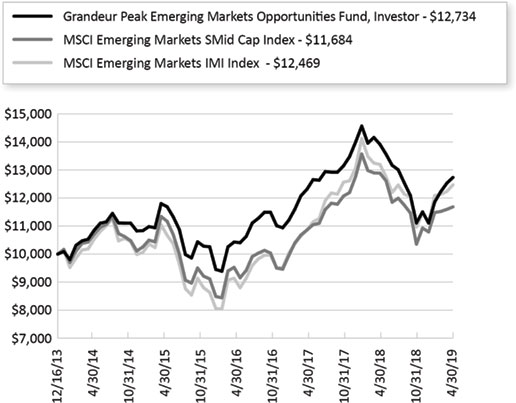
The chart shown above represent a hypothetical investment of $10,000 in the Fund’s Investor Class shares for the period from inception to April 30, 2019. All returns reflect reinvested dividends, but do not reflect the deduction of taxes that an investor would pay on distributions or redemptions.
Investing in the Fund is subject to investment risks, including possible loss of the principal amount invested.
The Fund also offers Institutional Class shares, performance for which is not reflected in the graphs above. The performance of Institutional Class shares may be higher or lower than the performance of the Investor Class shares shown in the graphs above based upon differences in fees paid by shareholders investing in the Investor Class shares and Institutional Class shares.
| 8 | 1.855.377.7325 | www.GrandeurPeakGlobal.com |
| Grandeur Peak Emerging Markets Opportunities Fund | Performance Update |
April 30, 2019 (Unaudited)
| Regional Allocation (as a % of Net Assets)* | |
| Asia ex Japan | 65.0% |
| North America | 4.2% |
| Latin America | 9.5% |
| Africa/Middle East | 7.1% |
| Europe | 7.0% |
| Cash, Cash Equivalents, & Other Net Assets | 7.2% |
| Total | 100.0% |
| Industry Sector Allocation (as a % of Net Assets)* | |
| Consumer | 27.4% |
| Financials | 20.6% |
| Technology | 20.1% |
| Health Care | 12.7% |
| Industrials | 7.9% |
| Energy & Materials | 4.1% |
| Cash, Cash Equivalents, & Other Net Assets | 7.2% |
| Total | 100.0% |
| Top 10 Holdings (as a % of Net Assets)* | |
| WNS Holdings, Ltd. | 2.2% |
| Vitasoy International Holdings, Ltd. | 1.9% |
| Fleury SA | 1.8% |
| Bajaj Finance, Ltd. | 1.7% |
| Value Partners Group, Ltd. | 1.5% |
| Dino Polska SA | 1.3% |
| LG Household & Health Care, Ltd. | 1.3% |
| Silergy Corp. | 1.2% |
| Parex Resources, Inc. | 1.2% |
| Cyient, Ltd. | 1.2% |
| Total | 15.3% |
| * | Holdings are subject to change, and may not reflect the current or future position of the portfolio. |
| Annual Report | April 30, 2019 | 9 |
| Grandeur Peak Global Micro Cap Fund | Performance Update |
April 30, 2019 (Unaudited)
Annualized Total Return Performance for the periods ended April 30, 2019
| | | | | Since
Inception(a) | Expense Ratio(b) |
| | 6 Months | 1 Year | 3 Years | Gross | Net(c) |
| Grandeur Peak Global MicroCap - Institutional (GPMCX) | 4.78% | -7.67% | 8.27% | 8.12% | 2.06% | 2.00% |
| MSCI All Country World Index Small Cap(d) | 7.77% | -0.32% | 10.60% | 9.47% | | |
| MSCI World Micro Cap Index(e) | 1.32% | -8.87% | 8.54% | 8.26% | | |
Performance data quoted represents past performance. Past performance does not guarantee future results. Investment return and principal value of an investment will fluctuate so that an investor’s shares, when sold or redeemed, may be worth more or less than the original cost. The Fund imposes a 2.00% redemption fee on shares held for less than 60 days. Current performance data may be higher or lower than actual data quoted. For the most current month-end performance data, please call 1-855-377-PEAK (7325).
The table does not reflect the deduction of taxes a shareholder would pay on Fund distributions or redemption of Fund shares.
Subject to investment risks, including possible loss of the principal amount invested.
Returns for periods less than 1 year are cumulative.
| (a) | Fund inception date of October 20, 2015. |
| (b) | Ratios as of the Prospectus dated August 31, 2018 and may differ from the ratios presented in the Financial Highlights. |
| (c) | Grandeur Peak Global Advisors, LLC (the “Adviser”), has agreed to waive and/or reimburse fees or expenses in order to limit Total Annual Fund Operating Expenses After Fee Waiver/ Expense Reimbursement (excluding acquired fund fees and expenses, brokerage expenses, interest expenses, taxes and extraordinary expenses) to 2.00% of the Fund’s average daily net assets for the Fund’s Institutional Class Shares. This agreement is in effect through August 31, 2019. The Adviser will be permitted to recover expenses it has borne through this agreement to the extent that a Fund’s expenses in later periods fall below annual rates set forth in the Expense Agreement; provided, however, that such recapture payments do not cause the Fund’s expense ratio (after recapture) to exceed the lesser of (i) the expense cap in effect at the time of the waiver and (ii) the expense cap in effect at the time of the recapture. Notwithstanding the foregoing, the Fund will not be obligated to pay any such deferred fees and expenses more than three years after the date on which the fee and expenses was deferred . This agreement may not be terminated or modified prior to August 31, 2019 except with the approval of the Fund’s Board of Trustees. |
| (d) | The MSCI ACWI Small Cap Index is designed to measure the equity market performance of performance of small-cap companies across developed and emerging markets globally. The Adviser made this recommendation to the Board because the Russell indices are being decommissioned and the Advisor believes the MSCI index most closely aligns to the Fund’s investment strategies and investment restrictions. Information on both indices will be shown for a one-year transition period. MSCI makes no express or implied warranties or representations and shall have no liability whatsoever with respect to any MSCI data contained herein. The MSCI data may not be further redistributed or used to create indices or financial products. The Index is not actively managed and does not reflect any deductions for fees, expenses or taxes. An investor may not invest directly into the Index. |
| (e) | The MSCI World Micro Cap Index is designed to measure the equity market performance of micro-cap companies across developed markets globally. It does not include emerging markets. The Index is not actively managed and does not reflect any deductions for fees, expenses or taxes. An investor may not invest directly into the Index. |
| 10 | 1.855.377.7325 | www.GrandeurPeakGlobal.com |
| Grandeur Peak Global Micro Cap Fund | Performance Update |
April 30, 2019 (Unaudited)
Growth of $10,000 for the period ended April 30, 2019
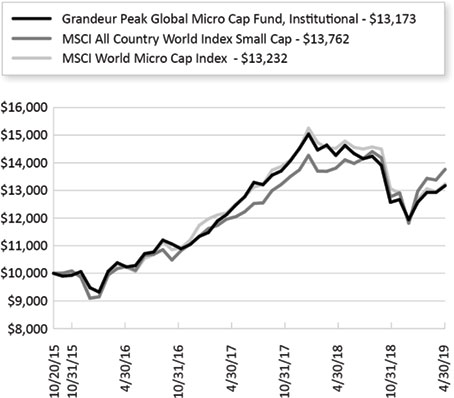
The chart shown above represent a hypothetical investment of $10,000 in the Fund’s Institutional Class shares for the period from inception to April 30, 2019. All returns reflect reinvested dividends, but do not reflect the deduction of taxes that an investor would pay on distributions or redemptions.
Investing in the Fund is subject to investment risks, including possible loss of the principal amount invested.
| Annual Report | April 30, 2019 | 11 |
| Grandeur Peak Global Micro Cap Fund | Performance Update |
April 30, 2019 (Unaudited)
| Regional Allocation (as a % of Net Assets)* | |
| Europe | 34.0% |
| Asia ex Japan | 27.4% |
| North America | 14.0% |
| Japan | 11.6% |
| Australia/New Zealand | 10.2% |
| Africa/Middle East | 1.5% |
| Latin America | 0.6% |
| Cash, Cash Equivalents, & Other Net Assets | 0.7% |
| Total | 100.0% |
| Industry Sector Allocation (as a % of Net Assets)* | |
| Financials | 24.7% |
| Industrials | 19.6% |
| Consumer | 19.4% |
| Technology | 17.8% |
| Health Care | 15.2% |
| Energy & Materials | 2.6% |
| Cash, Cash Equivalents, & Other Net Assets | 0.7% |
| Total | 100.0% |
| Top 10 Holdings (as a % of Net Assets)* | |
| Esquire Financial Holdings, Inc. | 2.3% |
| Fiducian Group, Ltd. | 2.2% |
| National Veterinary Care, Ltd. | 2.1% |
| Sarantis SA | 2.0% |
| Resources Connection, Inc. | 1.9% |
| M&A Capital Partners Co., Ltd. | 1.7% |
| Plover Bay Technologies, Ltd. | 1.7% |
| Kogan.com, Ltd. | 1.6% |
| Sbanken ASA | 1.5% |
| Bioteque Corp. | 1.4% |
| Total | 18.4% |
| * | Holdings are subject to change, and may not reflect the current or future position of the portfolio. |
| 12 | 1.855.377.7325 | www.GrandeurPeakGlobal.com |
| Grandeur Peak Global Opportunities Fund | Performance Update |
April 30, 2019 (Unaudited)
Annualized Total Return Performance for the periods ended April 30, 2019
| | | | | | Since
Inception(a) | Expense Ratio(b) |
| | 6 Months | 1 Year | 3 Years | 5 Years | Gross | Net(c) |
| Grandeur Peak Global Opportunities Fund - Investor (GPGOX) | 11.10% | -1.83% | 10.82% | 7.50% | 13.06% | 1.61% | 1.61% |
| Grandeur Peak Global Opportunities Fund - Institutional (GPGIX) | 11.23% | -1.84% | 11.11% | 7.67% | 13.35% | 1.36% | 1.36% |
| MSCI All Country World Index Small Cap(d) | 7.77% | -0.32% | 10.60% | 6.90% | 11.00% | | |
| MSCI All Country World Index IMI(e) | 9.43% | 4.83% | 11.79% | 7.46% | 10.67% | | |
Performance data quoted represents past performance. Past performance does not guarantee future results. Investment return and principal value of an investment will fluctuate so that an investor’s shares, when sold or redeemed, may be worth more or less than the original cost. The Fund imposes a 2.00% redemption fee on shares held for less than 60 days. Current performance data may be higher or lower than actual data quoted. For the most current month-end performance data, please call 1-855-377-PEAK (7325).
The table does not reflect the deduction of taxes a shareholder would pay on Fund distributions or redemption of Fund shares.
Subject to investment risks, including possible loss of the principal amount invested.
Returns for periods less than 1 year are cumulative.
| (a) | Fund inception date of October 17, 2011. |
| (b) | Ratios as of the Prospectus dated August 31, 2018 and may differ from the ratios presented in the Financial Highlights. |
| (c) | Grandeur Peak Global Advisors, LLC (the “Adviser”), has agreed to waive and/or reimburse fees or expenses in order to limit Total Annual Fund Operating Expenses After Fee Waiver/ Expense Reimbursement (excluding acquired fund fees and expenses, brokerage expenses, interest expenses, taxes and extraordinary expenses) to 1.75% and 1.50% of the Fund’s average daily net assets for the Fund’s Investor Class Shares and Institutional Class Shares, respectively. This agreement (the “Expense Agreement”) is in effect through August 31, 2019. The Adviser will be permitted to recover, on a class- by-class basis, expenses it has borne the Expense Agreement to the extent that a Fund’s expenses in later periods fall below annual rates set forth in the Expense Agreement; provided, however, that such recapture payments do not cause the Fund’s expense ratio (after recapture) to exceed the lesser of (i) the expense cap in effect at the time of the waiver and (ii) the expense cap in effect at the time of the recapture . Notwithstanding the foregoing, the Fund will not be obligated to pay any such deferred fees and expenses more than three years after the date on which the fee and expenses was deferred. The Expense Agreement may not be terminated or modified prior to August 31, 2019 except with the approval of the Fund’s Board of Trustees. |
| (d) | The MSCI ACWI Small Cap Index is designed to measure the equity market performance of performance of small-cap companies across developed and emerging markets globally. The Adviser made this recommendation to the Board because the Russell indices are being decommissioned and the Advisor believes the MSCI index most closely aligns to the Fund’s investment strategies and investment restrictions. Information on both indices will be shown for a one-year transition period. MSCI makes no express or implied warranties or representations and shall have no liability whatsoever with respect to any MSCI data contained herein. The MSCI data may not be further redistributed or used to create indices or financial products. The Index is not actively managed and does not reflect any deductions for fees, expenses or taxes. An investor may not invest directly into the Index. |
| (e) | The MSCI ACWI IMI Index is designed to measure the equity market performance of large, mid, and small-cap companies across developed and emerging markets globally. The Index is not actively managed and does not reflect any deductions for fees, expenses or taxes. An investor may not invest directly into the Index. |
| Annual Report | April 30, 2019 | 13 |
| Grandeur Peak Global Opportunities Fund | Performance Update |
April 30, 2019 (Unaudited)
Growth of $10,000 for the period ended April 30, 2019
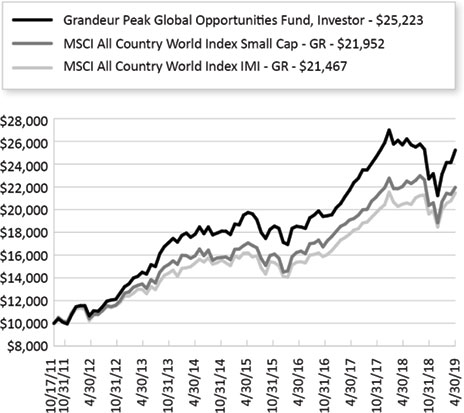
The chart shown above represent a hypothetical investment of $10,000 in the Fund’s Investor Class shares for the period from inception to April 30, 2019. All returns reflect reinvested dividends, but do not reflect the deduction of taxes that an investor would pay on distributions or redemptions.
Investing in the Fund is subject to investment risks, including possible loss of the principal amount invested.
The Fund also offers Institutional Class shares, performance for which is not reflected in the graphs above. The performance of Institutional Class shares may be higher or lower than the performance of the Investor Class shares shown in the graphs above based upon differences in fees paid by shareholders investing in the Investor Class shares and Institutional Class shares.
| 14 | 1.855.377.7325 | www.GrandeurPeakGlobal.com |
| Grandeur Peak Global Opportunities Fund | Performance Update |
April 30, 2019 (Unaudited)
| Regional Allocation (as a % of Net Assets)* | |
| Europe | 34.6% |
| North America | 29.1% |
| Asia ex Japan | 16.7% |
| Japan | 10.0% |
| Latin America | 3.1% |
| Africa/Middle East | 1.9% |
| Australia/New Zealand | 1.3% |
| Cash, Cash Equivalents, & Other Net Assets | 3.3% |
| Total | 100.0% |
| Industry Sector Allocation (as a % of Net Assets)* | |
| Technology | 24.2% |
| Industrials | 23.0% |
| Financials | 17.7% |
| Consumer | 15.7% |
| Health Care | 13.2% |
| Energy & Materials | 2.9% |
| Cash, Cash Equivalents, & Other Net Assets | 3.3% |
| Total | 100.0% |
| Top 10 Holdings (as a % of Net Assets)* | |
| Knight-Swift Transportation Holdings, Inc. | 2.3% |
| Power Integrations, Inc. | 2.1% |
| EPAM Systems, Inc. | 1.7% |
| First Republic Bank | 1.6% |
| Dechra Pharmaceuticals PLC | 1.4% |
| Fastenal Co. | 1.3% |
| B&M European Value Retail SA | 1.3% |
| Lululemon Athletica, Inc. | 1.2% |
| WNS Holdings, Ltd. | 1.2% |
| Resources Connection, Inc. | 1.1% |
| Total | 15.2% |
| * | Holdings are subject to change, and may not reflect the current or future position of the portfolio. |
| Annual Report | April 30, 2019 | 15 |
| Grandeur Peak Global Reach Fund | Performance Update |
April 30, 2019 (Unaudited)
Annualized Total Return Performance for the periods ended April 30, 2019
| | | | | | Since
Inception(a) | Expense Ratio(b) |
| | 6 Months | 1 Year | 3 Years | 5 Years | Gross | Net(c) |
| Grandeur Peak Global Reach Fund - Investor (GPROX) | 10.94% | -1.61% | 11.24% | 7.44% | 10.47% | 1.53% | 1.53% |
| Grandeur Peak Global Reach Fund - Institutional (GPRIX) | 11.14% | -1.33% | 11.49% | 7.71% | 10.73% | 1.28% | 1.28% |
| MSCI All Country World Small Cap Index(d) | 7.77% | -0.32% | 10.60% | 6.90% | 8.82% | | |
| MSCI All Country World IMI Index(e) | 9.43% | 4.83% | 11.79% | 7.46% | 9.04% | | |
Performance data quoted represents past performance. Past performance does not guarantee future results. Investment return and principal value of an investment will fluctuate so that an investor’s shares, when sold or redeemed, may be worth more or less than the original cost. The Fund imposes a 2.00% redemption fee on shares held for less than 60 days. Current performance data may be higher or lower than actual data quoted. For the most current month-end performance data, please call 1-855-377-PEAK (7325).
The table does not reflect the deduction of taxes a shareholder would pay on Fund distributions or redemption of Fund shares.
Subject to investment risks, including possible loss of the principal amount invested.
Returns for periods less than 1 year are cumulative.
| (a) | Fund inception date of June 19, 2013. |
| (b) | Ratios as of the Prospectus dated August 31, 2018 and may differ from the ratios presented in the Financial Highlights. |
| (c) | Grandeur Peak Global Advisors, LLC (the “Adviser”), has agreed to waive and/or reimburse fees or expenses in order to limit Total Annual Fund Operating Expenses After Fee Waiver/Expense Reimbursement (excluding acquired fund fees and expenses, brokerage expenses, interest expenses, taxes and extraordinary expenses) to 1. 60% and 1.35% of the Fund’s average daily net assets for the Fund’s Investor Class Shares and Institutional Class Shares, respectively. This agreement (the “Expense Agreement”) is in effect through August 31, 2019. The Adviser will be permitted to recover, on a class- by-class basis, expenses it has borne through the Expense Agreement to the extent that a Fund’s expenses in later periods fall below annual rates set forth in the Expense Agreement; provided, however, that such recapture payments do not cause the Fund’s expense ratio (after recapture) to exceed the lesser of (i) the expense cap in effect at the time of the waiver and (ii) the expense cap in effect at the time of the recapture . Notwithstanding the foregoing, the Fund will not be obligated to pay any such deferred fees and expenses more than three years after the date on which the fee and expenses was deferred. The Expense Agreement may not be terminated or modified prior to August 31, 2019 except with the approval of the Fund’s Board of Trustees. |
| (d) | The MSCI ACWI Small Cap Index is designed to measure the equity market performance of performance of small-cap companies across developed and emerging markets globally. The Adviser made this recommendation to the Board because the Russell indices are being decommissioned and the Advisor believes the MSCI index most closely aligns to the Fund’s investment strategies and investment restrictions. Information on both indices will be shown for a one-year transition period. MSCI makes no express or implied warranties or representations and shall have no liability whatsoever with respect to any MSCI data contained herein. The MSCI data may not be further redistributed or used to create indices or financial products. The Index is not actively managed and does not reflect any deductions for fees, expenses or taxes. An investor may not invest directly into the Index. |
| (e) | The MSCI ACWI IMI Index is designed to measure the equity market performance of large, mid, and small-cap companies across developed and emerging markets globally. The Index is not actively managed and does not reflect any deductions for fees, expenses or taxes. An investor may not invest directly into the Index. |
| 16 | 1.855.377.7325 | www.GrandeurPeakGlobal.com |
| Grandeur Peak Global Reach Fund | Performance Update |
April 30, 2019 (Unaudited)
Growth of $10,000 for the period ended April 30, 2019
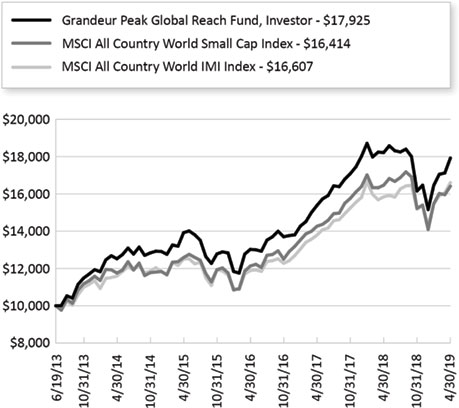
The chart shown above represent a hypothetical investment of $10,000 in the Fund’s Investor Class shares for the period from inception to April 30, 2019. All returns reflect reinvested dividends, but do not reflect the deduction of taxes that an investor would pay on distributions or redemptions.
Investing in the Fund is subject to investment risks, including possible loss of the principal amount invested.
The Fund also offers Institutional Class shares, performance for which is not reflected in the graphs above. The performance of Institutional Class shares may be higher or lower than the performance of the Investor Class shares shown in the graphs above based upon differences in fees paid by shareholders investing in the Investor Class shares and Institutional Class shares.
| Annual Report | April 30, 2019 | 17 |
| Grandeur Peak Global Reach Fund | Performance Update |
April 30, 2019 (Unaudited)
| Regional Allocation (as a % of Net Assets)* | |
| Europe | 31.7% |
| North America | 28.5% |
| Asia ex Japan | 21.5% |
| Japan | 6.8% |
| Africa/Middle East | 4.0% |
| Latin America | 3.3% |
| Australia/New Zealand | 3.3% |
| Cash, Cash Equivalents, & Other Net Assets | 0.9% |
| Total | 100.0% |
| Industry Sector Allocation (as a % of Net Assets)* | |
| Financials | 22.9% |
| Technology | 21.0% |
| Consumer | 20.9% |
| Industrials | 19.6% |
| Health Care | 10.9% |
| Energy & Materials | 3.8% |
| Cash, Cash Equivalents, & Other Net Assets | 0.9% |
| Total | 100.0% |
| Top 10 Holdings (as a % of Net Assets)* | |
| First Republic Bank | 2.6% |
| Knight-Swift Transportation Holdings, Inc. | 1.7% |
| Wix.com, Ltd. | 1.3% |
| Parex Resources, Inc. | 1.1% |
| Fastenal Co. | 1.1% |
| DXP Enterprises, Inc. | 1.0% |
| WNS Holdings, Ltd. | 1.0% |
| EPAM Systems, Inc. | 0.9% |
| Esquire Financial Holdings, Inc. | 0.9% |
| B&M European Value Retail SA | 0.9% |
| Total | 12.5% |
| * | Holdings are subject to change, and may not reflect the current or future position of the portfolio. |
| 18 | 1.855.377.7325 | www.GrandeurPeakGlobal.com |
| Grandeur Peak Global Stalwarts Fund | Performance Update |
April 30, 2019 (Unaudited)
Annualized Total Return Performance for the periods ended April 30, 2019
| | | | | Since
Inception(a) | Expense Ratio(b) |
| | 6 Months | 1 Year | 3 Years | Gross | Net(c) |
| Grandeur Peak Global Stalwarts - Investor (GGSOX) | 14.73% | 1.78% | 12.80% | 12.86% | 1.35% | 1.35% |
| Grandeur Peak Global Stalwarts - Institutional (GGSYX) | 14.91% | 2.08% | 13.09% | 13.16% | 1.10% | 1.10% |
| MSCI All Country World Mid Cap Index(d) | 9.66% | 1.25% | 9.81% | 9.79% | | |
| MSCI All Country World Small Cap Index(e) | 7.77% | -0.32% | 10.60% | 10.31% | | |
Performance data quoted represents past performance. Past performance does not guarantee future results. Investment return and principal value of an investment will fluctuate so that an investor’s shares, when sold or redeemed, may be worth more or less than the original cost. The Fund imposes a 2.00% redemption fee on shares held for less than 60 days. Current performance data may be higher or lower than actual data quoted. For the most current month-end performance data, please call 1-855-377-PEAK (7325).
The table does not reflect the deduction of taxes a shareholder would pay on Fund distributions or redemption of Fund shares.
Subject to investment risks, including possible loss of the principal amount invested.
Returns for periods less than 1 year are cumulative.
| (a) | Fund inception date of September 1, 2015. |
| (b) | Ratios as of the Prospectus dated August 31, 2018 and may differ from the ratios presented in the Financial Highlights. |
| (c) | Grandeur Peak Global Advisors, LLC (the “Adviser”), has agreed to waive and/or reimburse fees or expenses in order to limit Total Annual Fund Operating Expenses After Fee Waiver/ Expense Reimbursement (excluding acquired fund fees and expenses, brokerage expenses, interest expenses, taxes and extraordinary expenses) to 1.35% and 1.10% of the Fund’s average daily net assets for the Fund’s Investor Class Shares and Institutional Class Shares, respectively. This agreement is in effect through August 31, 2019. The Adviser will be permitted to recover, on a class-by-class basis, expenses it has borne through this agreement to the extent that a Fund’s expenses in later periods fall below annual rates set forth in the Expense Agreement; provided, however, that such recapture payments do not cause the Fund’s expense ratio (after recapture) to exceed the lesser of (i) the expense cap in effect at the time of the waiver and (ii) the expense cap in effect at the time of the recapture . Notwithstanding the foregoing, the Fund will not be obligated to pay any such deferred fees and expenses more than three years after the date on which the fee and expenses was deferred. This agreement may not be terminated or modified prior to August 31, 2019 except with the approval of the Fund’s Board of Trustees. |
| (d) | The MSCI ACWI Mid Cap Index is designed to measure the equity market performance of performance of mid-cap companies across developed and emerging markets globally. The Adviser made this recommendation to the Board because the Russell indices are being decommissioned and the Advisor believes the MSCI index most closely aligns to the Fund’s investment strategies and investment restrictions. Information on both indices will be shown for a one-year transition period. MSCI makes no express or implied warranties or representations and shall have no liability whatsoever with respect to any MSCI data contained herein. The MSCI data may not be further redistributed or used to create indices or financial products. The Index is not actively managed and does not reflect any deductions for fees, expenses or taxes. An investor may not invest directly into the Index. |
| (e) | The MSCI ACWI Small Cap Index is designed to measure the equity market performance of small-cap companies across developed and emerging markets globally. The Index is not actively managed and does not reflect any deductions for fees, expenses or taxes. An investor may not invest directly into the Index. |
| Annual Report | April 30, 2019 | 19 |
| Grandeur Peak Global Stalwarts Fund | Performance Update |
April 30, 2019 (Unaudited)
Growth of $10,000 for the period ended April 30, 2019
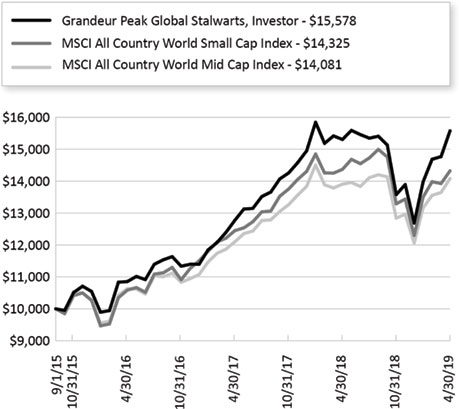
The graphs shown above represent a hypothetical investment of $10,000 in the Fund’s Investor Class shares for the period from inception to April 30, 2019. All returns reflect reinvested dividends, but do not reflect the deduction of taxes that an investor would pay on distributions or redemptions.
Investing in the Fund is subject to investment risks, including possible loss of the principal amount invested.
The Fund also offers Institutional Class shares, performance for which is not reflected in the graphs above. The performance of Institutional Class shares may be higher or lower than the performance of the Investor Class shares shown in the graphs above based upon differences in fees paid by shareholders investing in the Investor Class shares and Institutional Class shares.
| 20 | 1.855.377.7325 | www.GrandeurPeakGlobal.com |
| Grandeur Peak Global Stalwarts Fund | Performance Update |
April 30, 2019 (Unaudited)
| Regional Allocation (as a % of Net Assets)* | |
| North America | 34.0% |
| Europe | 32.2% |
| Asia ex Japan | 16.3% |
| Japan | 9.6% |
| Latin America | 2.9% |
| Africa/Middle East | 1.9% |
| Australia/New Zealand | 0.5% |
| Cash, Cash Equivalents, & Other Net Assets | 2.6% |
| Total | 100.0% |
| Industry Sector Allocation (as a % of Net Assets)* | |
| Financials | 23.6% |
| Technology | 21.6% |
| Consumer | 19.7% |
| Industrials | 19.3% |
| Health Care | 10.1% |
| Energy & Materials | 3.1% |
| Cash, Cash Equivalents, & Other Net Assets | 2.6% |
| Total | 100.0% |
| Top 10 Holdings (as a % of Net Assets)* | |
| First Republic Bank | 3.6% |
| Knight-Swift Transportation Holdings, Inc. | 2.8% |
| St James's Place PLC | 2.5% |
| Fastenal Co. | 2.2% |
| Nihon M&A Center, Inc. | 2.1% |
| Power Integrations, Inc. | 2.0% |
| B&M European Value Retail SA | 2.0% |
| Lululemon Athletica, Inc. | 1.7% |
| Aalberts NV | 1.7% |
| EPAM Systems, Inc. | 1.6% |
| Total | 22.2% |
| * | Holdings are subject to change, and may not reflect the current or future position of the portfolio. |
| Annual Report | April 30, 2019 | 21 |
| Grandeur Peak International Opportunities Fund | Performance Update |
April 30, 2019 (Unaudited)
Annualized Total Return Performance for the periods ended April 30, 2019
| | | | | | Since
Inception(a) | Expense Ratio(b) |
| | 6 Months | 1 Year | 3 Years | 5 Years | Gross | Net(c) |
| Grandeur Peak International Opportunities Fund - Investor (GPIOX) | 9.41% | -7.40% | 9.08% | 5.63% | 11.92% | 1.62% | 1.62% |
| Grandeur Peak International Opportunities Fund - Institutional (GPIIX) | 9.26% | -7.19% | 9.22% | 5.86% | 12.16% | 1.37% | 1.37% |
| MSCI All Country World Index ex USA Small Cap Index(d) | 7.03% | -8.19% | 7.21% | 4.13% | 7.49% | | |
| MSCI All Country World IMI ex USA Index(e) | 9.06% | -3.52% | 8.42% | 3.42% | 6.51% | | |
Performance data quoted represents past performance. Past performance does not guarantee future results. Investment return and principal value of an investment will fluctuate so that an investor’s shares, when sold or redeemed, may be worth more or less than the original cost. The Fund imposes a 2.00% redemption fee on shares held for less than 60 days. Current performance data may be higher or lower than actual data quoted. For the most current month-end performance data, please call 1-855-377-PEAK (7325).
The table does not reflect the deduction of taxes a shareholder would pay on Fund distributions or redemption of Fund shares.
Subject to investment risks, including possible loss of the principal amount invested.
Returns for periods less than 1 year are cumulative.
| (a) | Fund inception date of October 17, 2011. |
| (b) | Ratios as of the Prospectus dated August 31, 2018 and may differ from the ratios presented in the Financial Highlights. |
| (c) | Grandeur Peak Global Advisors, LLC (the “Adviser”), has agreed to waive and/or reimburse fees or expenses in order to limit Total Annual Fund Operating Expenses After Fee Waiver/Expense Reimbursements (excluding acquired fund fees and expenses, brokerage expenses, interest expenses, taxes and extraordinary expenses) to 1.75% and 1.50% of the Fund’s average daily net assets for the Fund’s Investor Class Shares and Institutional Class Shares, respectively. This agreement (the “Expense Agreement”) is in effect through August 31, 2019. The Adviser will be permitted to recover, on a class- by-class basis, expenses it has borne through the Expense Agreement to the extent that a Fund’s expenses in later periods fall below annual rates set forth in the Expense Agreement; provided, however, that such recapture payments do not cause the Fund’s expense ratio (after recapture) to exceed the lesser of (i) the expense cap in effect at the time of the waiver and (ii) the expense cap in effect at the time of the recapture . Notwithstanding the foregoing, the Funds will not be obligated to pay any such deferred fees and expenses more than three years after the date on which the fee and expenses was deferred. The Expense Agreement may not be terminated or modified prior to August 31, 2019 except with the approval of the Fund’s Board of Trustees. |
| (d) | The MSCI ACWI ex USA Small Cap Index is designed to measure the equity market performance of small-cap companies across developed and emerging markets globally, excluding the United States. The Adviser made this recommendation to the Board because the Russell indices are being decommissioned and the Advisor believes the MSCI index most closely aligns to the Fund’s investment strategies and investment restrictions. Information on both indices will be shown for a one-year transition period. MSCI makes no express or implied warranties or representations and shall have no liability whatsoever with respect to any MSCI data contained herein. The MSCI data may not be further redistributed or used to create indices or financial products. The Index is not actively managed and does not reflect any deductions for fees, expenses or taxes. An investor may not invest directly into the Index. |
| (e) | The MSCI ACWI ex USA IMI Index is designed to measure the equity market performance of large, mid, and small-cap companies across developed and emerging markets globally, excluding the United States. The Index is not actively managed and does not reflect any deductions for fees, expenses or taxes. An investor may not invest directly into the Index. |
| 22 | 1.855.377.7325 | www.GrandeurPeakGlobal.com |
| Grandeur Peak International Opportunities Fund | Performance Update |
April 30, 2019 (Unaudited)
Growth of $10,000 for the period ended April 30, 2019
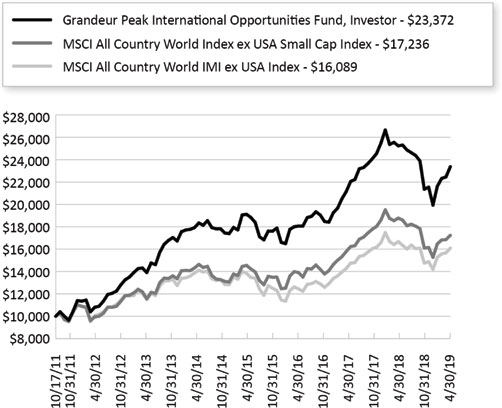
The chart shown above represent a hypothetical investment of $10,000 in the Fund’s Investor Class shares for the period from inception to April 30, 2019. All returns reflect reinvested dividends, but do not reflect the deduction of taxes that an investor would pay on distributions or redemptions.
Investing in the Fund is subject to investment risks, including possible loss of the principal amount invested.
The Fund also offers Institutional Class shares, performance for which is not reflected in the graphs above. The performance of Institutional Class shares may be higher or lower than the performance of the Investor Class shares shown in the graphs above based upon differences in fees paid by shareholders investing in the Investor Class shares and Institutional Class shares.
| Annual Report | April 30, 2019 | 23 |
| Grandeur Peak International Opportunities Fund | Performance Update |
April 30, 2019 (Unaudited)
| Regional Allocation (as a % of Net Assets)* | |
| Europe | 38.9% |
| Asia ex Japan | 24.4% |
| North America | 7.5% |
| Japan | 13.5% |
| Africa/Middle East | 3.0% |
| Latin America | 2.9% |
| Australia/New Zealand | 1.5% |
| Cash, Cash Equivalents, & Other Net Assets | 8.3% |
| Total | 100.0% |
| Industry Sector Allocation (as a % of Net Assets)* | |
| Technology | 21.1% |
| Financials | 19.1% |
| Industrials | 18.9% |
| Consumer | 17.0% |
| Health Care | 13.1% |
| Energy & Materials | 2.5% |
| Cash, Cash Equivalents, & Other Net Assets | 8.3% |
| Total | 100.0% |
| Top 10 Holdings (as a % of Net Assets)* | |
| boohoo Group PLC | 1.6% |
| Tokyo Century Corp. | 1.5% |
| EPAM Systems, Inc. | 1.4% |
| B&M European Value Retail SA | 1.4% |
| Sbanken ASA | 1.4% |
| Dechra Pharmaceuticals PLC | 1.3% |
| WNS Holdings, Ltd. | 1.3% |
| Aalberts NV | 1.3% |
| Seria Co., Ltd. | 1.3% |
| Japan Lifeline Co., Ltd. | 1.2% |
| Total | 13.7% |
| * | Holdings are subject to change, and may not reflect the current or future position of the portfolio. |
| 24 | 1.855.377.7325 | www.GrandeurPeakGlobal.com |
| Grandeur Peak International Stalwarts Fund | Performance Update |
April 30, 2019 (Unaudited)
Annualized Total Return Performance for the periods ended April 30, 2019
| | | | | Since
Inception(a) | Expense Ratio(b) |
| | 6 Months | 1 Year | 3 Years | Gross | Net(c) |
| Grandeur Peak International Stalwarts - Investor | 12.45% | -2.69% | 11.64% | 12.38% | 1.19% | 1.19% |
| Grandeur Peak International Stalwarts - Institutional | 12.53% | -2.50% | 11.89% | 12.63% | 0.94% | 0.94% |
| MSCI All Country World ex USA Mid Cap Index(d) | 7.98% | -5.31% | 7.17% | 7.76% | | |
| MSCI All Country World ex USA Small Index(e) | 7.03% | -8.19% | 7.21% | 8.13% | | |
Performance data quoted represents past performance. Past performance does not guarantee future results. Investment return and principal value of an investment will fluctuate so that an investor’s shares, when sold or redeemed, may be worth more or less than the original cost. The Fund imposes a 2.00% redemption fee on shares held for less than 60 days. Current performance data may be higher or lower than actual data quoted. For the most current month-end performance data, please call 1-855-377-PEAK (7325).
The table does not reflect the deduction of taxes a shareholder would pay on Fund distributions or redemption of Fund shares.
Subject to investment risks, including possible loss of the principal amount invested.
Returns for periods less than 1 year are cumulative.
| (a) | Fund inception date of September 1, 2015. |
| (b) | Ratios as of the Prospectus dated August 31, 2018 and may differ from the ratios presented in the Financial Highlights. |
| (c) | Grandeur Peak Global Advisors, LLC (the “Adviser”), has agreed to waive and/or reimburse fees or expenses in order to limit Total Annual Fund Operating Expenses After Fee Waiver/ Expense Reimbursements (excluding acquired fund fees and expenses, brokerage expenses, interest expenses, taxes and extraordinary expenses) to 1.35% and 1.10% of the Fund’s average daily net assets for the Fund’s Investor Class Shares and Institutional Class Shares, respectively. This agreement is in effect through August 31, 2019. The Adviser will be permitted to recover, on a class-by-class basis, expenses it has borne through this agreement to the extent that a Fund’s expenses in later periods fall below annual rates set forth in the Expense Agreement; provided, however, that such recapture payments do not cause the Fund’s expense ratio (after recapture) to exceed the lesser of (i) the expense cap in effect at the time of the waiver and (ii) the expense cap in effect at the time of the recapture . Notwithstanding the foregoing, the Funds will not be obligated to pay any such deferred fees and expenses more than three years after the date on which the fee and expenses was deferred This agreement may not be terminated or modified prior to August 31, 2019 except with the approval of the Fund’s Board of Trustees. |
| (d) | The MSCI ACWI ex USA Mid Cap Index is designed to measure the equity market performance of midcap companies across developed and emerging markets globally, excluding the United States. The Adviser made this recommendation to the Board because the Russell indices are being decommissioned and the Advisor believes the MSCI index most closely aligns to the Fund’s investment strategies and investment restrictions. Information on both indices will be shown for a one-year transition period. MSCI makes no express or implied warranties or representations and shall have no liability whatsoever with respect to any MSCI data contained herein. The MSCI data may not be further redistributed or used to create indices or financial products. The Index is not actively managed and does not reflect any deductions for fees, expenses or taxes. An investor may not invest directly into the Index. |
| (e) | The MSCI ACWI ex USA Small Cap Index is designed to measure the equity market performance of small-cap companies across developed and emerging markets globally, excluding the United States. The Index is not actively managed and does not reflect any deductions for fees, expenses or taxes. An investor may not invest directly into the Index. |
| Annual Report | April 30, 2019 | 25 |
| Grandeur Peak International Stalwarts Fund | Performance Update |
April 30, 2019 (Unaudited)
Growth of $10,000 for the period ended April 30, 2019
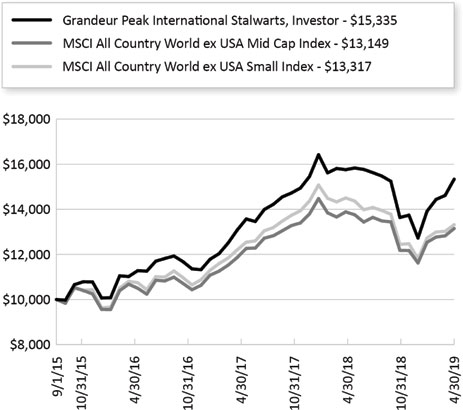
The chart shown above represent a hypothetical investment of $10,000 in the Fund’s Investor Class shares for the period from inception to April 30, 2019. All returns reflect reinvested dividends, but do not reflect the deduction of taxes that an investor would pay on distributions or redemptions.
Investing in the Fund is subject to investment risks, including possible loss of the principal amount invested.
The Fund also offers Institutional Class shares, performance for which is not reflected in the graphs above. The performance of Institutional Class shares may be higher or lower than the performance of the Investor Class shares shown in the graphs above based upon differences in fees paid by shareholders investing in the Investor Class shares and Institutional Class shares.
| 26 | 1.855.377.7325 | www.GrandeurPeakGlobal.com |
| Grandeur Peak International Stalwarts Fund | Performance Update |
April 30, 2019 (Unaudited)
| Regional Allocation (as a % of Net Assets)* | |
| Europe | 41.6% |
| Asia ex Japan | 21.2% |
| North America | 13.5% |
| Japan | 12.3% |
| Latin America | 3.8% |
| Africa/Middle East | 2.2% |
| Australia/New Zealand | 0.6% |
| Cash, Cash Equivalents, & Other Net Assets | 4.8% |
| Total | 100.0% |
| Industry Sector Allocation (as a % of Net Assets)* | |
| Consumer | 22.7% |
| Financials | 21.7% |
| Industrials | 18.7% |
| Technology | 17.4% |
| Health Care | 11.6% |
| Energy & Materials | 3.1% |
| Cash, Cash Equivalents, & Other Net Assets | 4.8% |
| Total | 100.0% |
| Top 10 Holdings (as a % of Net Assets)* | |
| St James's Place PLC | 2.9% |
| Nihon M&A Center, Inc. | 2.5% |
| B&M European Value Retail SA | 2.3% |
| Aalberts NV | 2.1% |
| Lululemon Athletica, Inc. | 2.1% |
| Dechra Pharmaceuticals PLC | 2.0% |
| Vitasoy International Holdings, Ltd. | 2.0% |
| EPAM Systems, Inc. | 2.0% |
| Wirecard AG | 2.0% |
| Silergy Corp. | 1.7% |
| Total | 21.6% |
| * | Holdings are subject to change, and may not reflect the current or future position of the portfolio. |
| Annual Report | April 30, 2019 | 27 |
| Grandeur Peak Funds® | Disclosure of Fund Expenses |
April 30, 2019 (Unaudited)
As a shareholder of a Fund, you incur two types of costs: (1) transaction costs, including sales charges (loads) on purchase payments, reinvested dividends, or other distributions; redemption fees; and exchange fees; and (2) ongoing costs, including management fees; distribution and/or service (12b-1) fees; and other Fund expenses. This example is intended to help you understand your ongoing costs (in dollars) of investing in the Fund and to compare these costs with the ongoing costs of investing in other mutual funds.
This example is based on an investment of $1,000 invested at the beginning of the period and held for the entire six-month period of October 31, 2018 through of April 30, 2019.
Actual ExpensesThe first line of the table provides information about actual account values and actual expenses. You may use the information in this line, together with the amount you invested, to estimate the expenses that you paid over the period. Simply divide your account value by $1,000 (for example, an $8,600 account value divided by $1,000 = 8.6), then multiply the result by the number in the first line under the heading “Expenses Paid During Period” to estimate the expenses you paid on your account during this period.
Hypothetical Example for Comparison PurposesThe second line of the table provides information about hypothetical account values and hypothetical expenses based on the Fund’s actual expense ratio and an assumed rate of return of 5% per year before expenses, which is not the Fund’s actual return. The hypothetical account values and expenses may not be used to estimate the actual ending account balance or expenses you paid for the period. You may use this information to compare the ongoing costs of investing in the Fund and other mutual funds. To do so, compare this 5% hypothetical example with the 5% hypothetical examples that appear in the shareholder reports of the other funds.
Please note that the expenses shown in the table are meant to highlight your ongoing costs only and do not reflect any transactional costs, such as redemption fees or exchange fees. Therefore, the second line of the table is useful in comparing ongoing costs only and will not help you determine the relative total costs of owning different funds. In addition, if these transactional costs were included, your costs would have been higher.
| 28 | 1.855.377.7325 | www.GrandeurPeakGlobal.com |
| Grandeur Peak Funds® | Disclosure of Fund Expenses |
April 30, 2019 (Unaudited)
| | Beginning Account Value November 1, 2018 | Ending Account Value April 30, 2019 | Expense Ratio(a) | Expenses Paid During period November 1, 2018 - April 30, 2019(b) |
| Grandeur Peak Emerging Markets Opportunities Fund | | | | |
| Investor Class | | | | |
| Actual | $1,000.00 | $1,146.30 | 1.75% | $9.31 |
| Hypothetical (5% return before expenses) | $1,000.00 | $1,016.12 | 1.75% | $8.75 |
| Institutional Class | | | | |
| Actual | $1,000.00 | $1,146.60 | 1.50% | $7.98 |
| Hypothetical (5% return before expenses) | $1,000.00 | $1,017.36 | 1.50% | $7.50 |
| Grandeur Peak Global Micro Cap Fund | | | | |
| Institutional Class | | | | |
| Actual | $1,000.00 | $1,047.80 | 2.00% | $10.15 |
| Hypothetical (5% return before expenses) | $1,000.00 | $1,014.88 | 2.00% | $9.99 |
| Grandeur Peak Global Opportunities Fund | | | | |
| Investor Class | | | | |
| Actual | $1,000.00 | $1,111.00 | 1.59% | $8.32 |
| Hypothetical (5% return before expenses) | $1,000.00 | $1,016.91 | 1.59% | $7.95 |
| Institutional Class | | | | |
| Actual | $1,000.00 | $1,112.30 | 1.34% | $7.02 |
| Hypothetical (5% return before expenses) | $1,000.00 | $1,018.15 | 1.34% | $6.71 |
| Grandeur Peak Global Reach Fund | | | | |
| Investor Class | | | | |
| Actual | $1,000.00 | $1,109.40 | 1.52% | $7.95 |
| Hypothetical (5% return before expenses) | $1,000.00 | $1,017.26 | 1.52% | $7.60 |
| Institutional Class | | | | |
| Actual | $1,000.00 | $1,111.40 | 1.28% | $6.70 |
| Hypothetical (5% return before expenses) | $1,000.00 | $1,018.45 | 1.28% | $6.41 |
| Grandeur Peak Global Stalwarts Fund | | | | |
| Investor Class | | | | |
| Actual | $1,000.00 | $1,147.30 | 1.27% | $6.76 |
| Hypothetical (5% return before expenses) | $1,000.00 | $1,018.50 | 1.27% | $6.36 |
| Institutional Class | | | | |
| Actual | $1,000.00 | $1,149.10 | 1.02% | $5.44 |
| Hypothetical (5% return before expenses) | $1,000.00 | $1,019.74 | 1.02% | $5.11 |
| Grandeur Peak International Opportunities Fund | | | | |
| Investor Class | | | | |
| Actual | $1,000.00 | $1,094.10 | 1.58% | $8.20 |
| Hypothetical (5% return before expenses) | $1,000.00 | $1,016.96 | 1.58% | $7.90 |
| Institutional Class | | | | |
| Actual | $1,000.00 | $1,092.60 | 1.34% | $6.95 |
| Hypothetical (5% return before expenses) | $1,000.00 | $1,018.15 | 1.34% | $6.71 |
| Grandeur Peak International Stalwarts Fund | | | | |
| Investor Class | | | | |
| Actual | $1,000.00 | $1,124.50 | 1.19% | $6.27 |
| Hypothetical (5% return before expenses) | $1,000.00 | $1,018.89 | 1.19% | $5.96 |
| Institutional Class | | | | |
| Actual | $1,000.00 | $1,125.30 | 0.95% | $5.01 |
| Hypothetical (5% return before expenses) | $1,000.00 | $1,020.08 | 0.95% | $4.76 |
| (a) | The Fund's expense ratios have been annualized based on the Fund's most recent fiscal half-year expenses. |
| (b) | Expenses are equal to the Fund's annualized expense ratio multiplied by the average account value over the period, multiplied by the number of days in the most recent fiscal half-year (181)/365 (to reflect the half-year period). |
| Annual Report | April 30, 2019 | 29 |
| Grandeur Peak Emerging Markets Opportunities Fund | Portfolio of Investments |
April 30, 2019
| | | Shares | | Value (Note 2) |
| COMMON STOCKS (92.59%) | | | | | | | | |
| Argentina (1.28%) | | | | | | | | |
| Despegar.com Corp.(a) | | | 33,015 | | | $ | 481,689 | |
| Globant SA(a) | | | 65,123 | | | | 5,469,681 | |
| | | | | | | | 5,951,370 | |
| | | | | | | | | |
| Bangladesh (1.06%) | | | | | | | | |
| Olympic Industries, Ltd. | | | 272,639 | | | | 723,657 | |
| Square Pharmaceuticals, Ltd. | | | 1,364,059 | | | | 4,198,969 | |
| | | | | | | | 4,922,626 | |
| | | | | | | | | |
| Brazil (4.99%) | | | | | | | | |
| Arco Platform, Ltd., Class A(a) | | | 92,525 | | | | 2,972,828 | |
| Fleury SA | | | 1,587,700 | | | | 8,405,971 | |
| Hypera SA | | | 397,400 | | | | 2,862,099 | |
| M Dias Branco SA | | | 192,200 | | | | 2,044,983 | |
| Pagseguro Digital, Ltd., Class A(a) | | | 159,850 | | | | 4,165,691 | |
| Raia Drogasil SA | | | 161,900 | | | | 2,831,217 | |
| | | | | | | | 23,282,789 | |
| | | | | | | | | |
| China (17.00%) | | | | | | | | |
| 51job, Inc., ADR(a) | | | 55,225 | | | | 5,099,476 | |
| 58.com, Inc., ADR(a) | | | 41,750 | | | | 2,997,232 | |
| AK Medical Holdings, Ltd.(b)(c) | | | 3,869,000 | | | | 1,967,840 | |
| Alibaba Group Holding, Ltd., Sponsored ADR(a) | | | 18,900 | | | | 3,507,273 | |
| ANTA Sports Products, Ltd. | | | 644,000 | | | | 4,539,721 | |
| Baozun, Inc., Sponsored ADR(a) | | | 54,100 | | | | 2,623,850 | |
| BBI Life Sciences Corp.(c) | | | 9,968,500 | | | | 2,998,886 | |
| China Medical System Holdings, Ltd. | | | 5,584,000 | | | | 4,947,073 | |
| CSPC Pharmaceutical Group, Ltd. | | | 1,854,000 | | | | 3,573,384 | |
| Ctrip.com International, Ltd., ADR(a) | | | 81,725 | | | | 3,599,986 | |
| Essex Bio-technology, Ltd. | | | 4,604,000 | | | | 4,243,183 | |
| Hangzhou Robam Appliances Co., Ltd., Class A | | | 365,200 | | | | 1,581,839 | |
| Hangzhou Tigermed Consulting Co., Ltd., Class A | | | 117,500 | | | | 1,158,117 | |
| HUYA, Inc., ADR(a) | | | 79,152 | | | | 1,890,941 | |
| Jiangsu Hengrui Medicine Co., Ltd., Class A | | | 148,800 | | | | 1,452,262 | |
| Koolearn Technology Holding, Ltd.(a)(b)(c) | | | 1,772,000 | | | | 2,489,221 | |
| Man Wah Holdings, Ltd. | | | 4,827,400 | | | | 2,486,067 | |
| New Oriental Education & Technology Group, Inc.,Sponsored ADR(a) | | | 48,050 | | | | 4,586,853 | |
| O2Micro International, Ltd., ADR(a) | | | 462,244 | | | | 674,876 | |
| On-Bright Electronics, Inc. | | | 655,941 | | | | 3,799,665 | |
| | | Shares | | Value (Note 2) |
| China (continued) | | | | | | | | |
| Shanghai Haohai Biological Technology Co., Ltd., Class H(b)(c) | | | 538,100 | | | $ | 3,450,238 | |
| Silergy Corp. | | | 354,422 | | | | 5,803,616 | |
| Tencent Holdings, Ltd. | | | 58,900 | | | | 2,913,165 | |
| WuXi AppTec Co., Ltd., Class H(a)(b)(c) | | | 164,000 | | | | 2,017,387 | |
| Wuxi Biologics Cayman, Inc.(a)(b)(c) | | | 231,000 | | | | 2,323,310 | |
| Yum China Holdings, Inc. | | | 53,475 | | | | 2,542,202 | |
| | | | | | | | 79,267,663 | |
| | | | | | | | | |
| Colombia (1.47%) | | | | | | | | |
| Amerisur Resources PLC(a) | | | 6,493,622 | | | | 1,088,945 | |
| Parex Resources, Inc.(a) | | | 337,931 | | | | 5,756,203 | |
| | | | | | | | 6,845,148 | |
| | | | | | | | | |
| Egypt (1.72%) | | | | | | | | |
| African Export-Import Bank, GDR | | | 500,000 | | | | 2,040,000 | |
| Commercial International Bank Egypt SAE | | | 468,067 | | | | 2,081,903 | |
| Integrated Diagnostics Holdings PLC(b)(c) | | | 371,100 | | | | 1,799,835 | |
| Obour Land For Food Industries | | | 4,233,886 | | | | 2,123,108 | |
| | | | | | | | 8,044,846 | |
| | | | | | | | | |
| Georgia (2.49%) | | | | | | | | |
| Bank of Georgia Group PLC | | | 185,712 | | | | 4,162,879 | |
| Georgia Capital PLC(a) | | | 115,112 | | | | 1,519,075 | |
| Georgia Healthcare Group PLC(a)(b)(c) | | | 356,781 | | | | 1,014,229 | |
| TBC Bank Group PLC | | | 232,132 | | | | 4,927,962 | |
| | | | | | | | 11,624,145 | |
| | | | | | | | | |
| Greece (1.78%) | | | | | | | | |
| JUMBO SA | | | 182,200 | | | | 3,310,561 | |
| Sarantis SA | | | 603,670 | | | | 5,003,596 | |
| | | | | | | | 8,314,157 | |
| | | | | | | | | |
| Hong Kong (5.12%) | | | | | | | | |
| International Housewares Retail Co., Ltd. | | | 4,246,000 | | | | 1,114,976 | |
| Jacobson Pharma Corp., Ltd.(c) | | | 5,020,000 | | | | 947,073 | |
| Plover Bay Technologies, Ltd.(c) | | | 8,956,000 | | | | 1,449,893 | |
| TK Group Holdings, Ltd. | | | 6,823,000 | | | | 4,609,665 | |
| Value Partners Group, Ltd. | | | 9,436,800 | | | | 7,097,328 | |
| Vitasoy International Holdings, Ltd. | | | 1,720,900 | | | | 8,665,046 | |
| | | | | | | | 23,883,981 | |
| | | | | | | | | |
| India (13.71%) | | | | | | | | |
| Alkem Laboratories, Ltd. | | | 2,839 | | | | 70,139 | |
See Notes to Financial Statements.
| 30 | 1.855.377.7325 | www.GrandeurPeakGlobal.com |
| Grandeur Peak Emerging Markets Opportunities Fund | Portfolio of Investments |
April 30, 2019
| | | Shares | | Value (Note 2) |
| India (continued) | | | | | | | | |
| Bajaj Finance, Ltd. | | | 176,500 | | | $ | 7,856,301 | |
| Central Depository Services India, Ltd.(c) | | | 615,000 | | | | 2,065,068 | |
| City Union Bank, Ltd. | | | 1,202,575 | | | | 3,506,385 | |
| Cyient, Ltd. | | | 668,095 | | | | 5,663,373 | |
| Dr Lal PathLabs, Ltd.(b)(c) | | | 133,000 | | | | 1,996,900 | |
| Gulf Oil Lubricants India, Ltd. | | | 30,702 | | | | 379,859 | |
| HDFC Asset Management Co., Ltd.(b)(c) | | | 123,358 | | | | 3,006,279 | |
| HDFC Bank, Ltd. | | | 81,500 | | | | 2,715,485 | |
| HDFC Life Insurance Co., Ltd.(b)(c) | | | 370,000 | | | | 2,152,055 | |
| Hexaware Technologies, Ltd. | | | 325,000 | | | | 1,628,183 | |
| Indiabulls Housing Finance, Ltd. | | | 146,000 | | | | 1,459,816 | |
| Kovai Medical Center and Hospital | | | 75,083 | | | | 798,827 | |
| L&T Technology Services, Ltd.(b)(c) | | | 161,040 | | | | 4,022,426 | |
| Metropolis Healthcare, Ltd.(a)(b)(c) | | | 326,701 | | | | 4,452,147 | |
| Mindtree, Ltd. | | | 276,000 | | | | 3,893,751 | |
| Supreme Industries, Ltd. | | | 128,260 | | | | 2,107,647 | |
| Thyrocare Technologies, Ltd.(b)(c) | | | 67,644 | | | | 478,394 | |
| Time Technoplast, Ltd. | | | 2,390,721 | | | | 3,112,410 | |
| Vaibhav Global, Ltd. | | | 256,319 | | | | 2,523,068 | |
| WNS Holdings, Ltd., ADR(a) | | | 175,986 | | | | 10,057,600 | |
| | | | | | | | 63,946,113 | |
| | | | | | | | | |
| Indonesia (3.55%) | | | | | | | | |
| Ace Hardware Indonesia Tbk PT | | | 21,449,000 | | | | 2,483,568 | |
| Arwana Citramulia Tbk PT | | | 45,188,500 | | | | 1,617,273 | |
| Bank Central Asia Tbk PT | | | 1,169,000 | | | | 2,358,509 | |
| Hexindo Adiperkasa Tbk PT | | | 3,557,100 | | | | 773,825 | |
| Indonesia Pondasi Raya Tbk PT | | | 14,738,400 | | | | 463,355 | |
| Link Net Tbk PT | | | 7,350,500 | | | | 2,243,837 | |
| Panin Sekuritas Tbk PT | | | 7,155,500 | | | | 713,039 | |
| Selamat Sempurna Tbk PT | | | 38,902,900 | | | | 4,095,042 | |
| Ultrajaya Milk Industry & Trading Co. Tbk PT | | | 20,171,600 | | | | 1,811,905 | |
| | | | | | | | 16,560,353 | |
| | | | | | | | | |
| Kenya (0.66%) | | | | | | | | |
| Safaricom PLC | | | 11,096,600 | | | | 3,088,179 | |
| | | | | | | | | |
| Malaysia (1.71%) | | | | | | | | |
| AEON Credit Service M Bhd | | | 1,224,400 | | | | 4,827,118 | |
| My EG Services Bhd | | | 3,821,900 | | | | 1,386,589 | |
| Mynews Holdings Bhd | | | 2,292,100 | | | | 778,909 | |
| Scicom MSC Bhd | | | 3,685,500 | | | | 962,714 | |
| | | | | | | | 7,955,330 | |
| | | Shares | | Value (Note 2) |
| Mexico (2.11%) | | | | |
| Credito Real SAB de CV SOFOM ER | | | 1,322,354 | | | $ | 1,527,584 | |
| Grupo Herdez SAB de CV | | | 1,576,060 | | | | 3,392,755 | |
| Regional SAB de CV | | | 905,400 | | | | 4,900,056 | |
| | | | | | | | 9,820,395 | |
| | | | | | | | | |
| Oman (0.43%) | | | | | | | | |
| Tethys Oil AB | | | 241,623 | | | | 1,983,175 | |
| | | | | | | | | |
| Pakistan (0.49%) | | | | | | | | |
| Akzo Nobel Pakistan, Ltd. | | | 496,500 | | | | 450,645 | |
| Meezan Bank, Ltd. | | | 2,649,152 | | | | 1,818,597 | |
| | | | | | | | 2,269,242 | |
| | | | | | | | | |
| Peru (1.73%) | | | | | | | | |
| Alicorp SAA | | | 1,004,053 | | | | 3,249,166 | |
| Credicorp, Ltd. | | | 20,325 | | | | 4,814,992 | |
| | | | | | | | 8,064,158 | |
| | | | | | | | | |
| Philippines (5.17%) | | | | | | | | |
| Concepcion Industrial Corp. | | | 1,861,792 | | | | 1,607,688 | |
| D&L Industries, Inc. | | | 1,590,000 | | | | 333,179 | |
| Holcim Philippines, Inc. | | | 6,363,500 | | | | 1,548,365 | |
| Philippine Seven Corp. | | | 917,000 | | | | 2,023,603 | |
| Puregold Price Club, Inc. | | | 4,121,100 | | | | 3,313,487 | |
| Robinsons Land Corp. | | | 7,151,762 | | | | 3,362,306 | |
| Robinsons Retail Holdings, Inc. | | | 1,675,000 | | | | 2,507,076 | |
| Security Bank Corp. | | | 1,254,980 | | | | 4,334,783 | |
| Wilcon Depot, Inc. | | | 15,904,900 | | | | 5,090,789 | |
| | | | | | | | 24,121,276 | |
| | | | | | | | | |
| Poland (2.30%) | | | | | | | | |
| CCC SA | | | 30,600 | | | | 1,660,741 | |
| Dino Polska SA(a)(b)(c) | | | 180,313 | | | | 5,992,425 | |
| LiveChat Software SA | | | 239,800 | | | | 1,945,282 | |
| PGS Software SA | | | 426,467 | | | | 1,131,606 | |
| | | | | | | | 10,730,054 | |
| | | | | | | | | |
| Russia (0.45%) | | | | | | | | |
| MD Medical Group Investments PLC, GDR(c) | | | 78,132 | | | | 382,847 | |
| TCS Group Holding PLC, GDR(c) | | | 86,700 | | | | 1,725,330 | |
| | | | | | | | 2,108,177 | |
| | | | | | | | | |
| South Africa (3.05%) | | | | | | | | |
| ARB Holdings, Ltd. | | | 1,134,108 | | | | 346,456 | |
| Capitec Bank Holdings, Ltd. | | | 23,200 | | | | 2,167,858 | |
| City Lodge Hotels, Ltd. | | | 57,892 | | | | 485,394 | |
| Clicks Group, Ltd. | | | 177,900 | | | | 2,433,269 | |
| Italtile, Ltd. | | | 3,636,472 | | | | 3,686,043 | |
| Shoprite Holdings, Ltd. | | | 83,700 | | | | 1,008,379 | |
| Transaction Capital, Ltd. | | | 3,071,128 | | | | 4,102,709 | |
| | | | | | | | 14,230,108 | |
See Notes to Financial Statements.
| Annual Report | April 30, 2019 | 31 |
| Grandeur Peak Emerging Markets Opportunities Fund | Portfolio of Investments |
April 30, 2019
| | | Shares | | Value
(Note 2) |
| South Korea (5.37%) | | | | | | | | |
| Douzone Bizon Co., Ltd. | | | 110,500 | | | $ | 5,410,778 | |
| Hanssem Co., Ltd. | | | 17,500 | | | | 1,543,038 | |
| Hy-Lok Corp. | | | 18,500 | | | | 311,989 | |
| ISC Co., Ltd. | | | 30,571 | | | | 302,269 | |
| Koh Young Technology, Inc. | | | 18,244 | | | | 1,508,685 | |
| LEENO Industrial, Inc. | | | 68,200 | | | | 3,339,503 | |
| LG Household & Health Care, Ltd. | | | 4,825 | | | | 5,873,518 | |
| Medy-Tox, Inc. | | | 4,386 | | | | 2,099,227 | |
| NAVER Corp. | | | 27,560 | | | | 2,819,347 | |
| Tokai Carbon Korea Co., Ltd. | | | 35,000 | | | | 1,857,638 | |
| | | | | | | | 25,065,992 | |
| | | | | | | | | |
| Sri Lanka (0.12%) | | | | | | | | |
| Royal Ceramics Lanka PLC | | | 1,749,110 | | | | 570,810 | |
| | | | | | | | | |
| Taiwan (7.31%) | | | | | | | | |
| Bioteque Corp. | | | 667,000 | | | | 2,471,490 | |
| FineTek Co., Ltd. | | | 113,000 | | | | 314,488 | |
| Gourmet Master Co., Ltd. | | | 276,760 | | | | 1,764,400 | |
| LandMark Optoelectronics Corp. | | | 210,000 | | | | 1,875,667 | |
| Materials Analysis Technology, Inc. | | | 501,000 | | | | 1,228,951 | |
| Poya International Co., Ltd. | | | 342,000 | | | | 4,144,817 | |
| Rafael Microelectronics, Inc. | | | 262,000 | | | | 1,420,181 | |
| Sinmag Equipment Corp. | | | 1,075,502 | | | | 4,280,986 | |
| Sporton International, Inc. | | | 774,760 | | | | 4,588,236 | |
| Tehmag Foods Corp. | | | 145,200 | | | | 1,003,210 | |
| Test Research, Inc. | | | 1,626,000 | | | | 2,830,937 | |
| TSC Auto ID Technology Co., Ltd. | | | 208,000 | | | | 1,904,922 | |
| TTFB Co., Ltd. | | | 179,000 | | | | 1,494,515 | |
| Voltronic Power Technology Corp. | | | 242,000 | | | | 4,777,192 | |
| | | | | | | | 34,099,992 | |
| | | | | | | | | |
| Thailand (1.25%) | | | | | | | | |
| Muangthai Capital PCL | | | 2,120,000 | | | | 3,419,890 | |
| TOA Paint Thailand PCL | | | 2,428,000 | | | | 2,395,678 | |
| | | | | | | | 5,815,568 | |
| | | | | | | | | |
| Turkey (0.52%) | | | | | | | | |
| Aselsan Elektronik Sanayi Ve Ticaret AS | | | 144,900 | | | | 496,364 | |
| DP Eurasia NV(a)(b)(c) | | | 1,646,300 | | | | 1,940,687 | |
| | | | | | | | 2,437,051 | |
| | | | | | | | | |
| United Arab Emirates (0.79%) | | | | | | | | |
| Aramex PJSC | | | 2,263,419 | | | | 2,926,981 | |
| Network InternationalHoldings PLC(a)(b)(c) | | | 112,600 | | | | 764,987 | |
| | | | | | | | 3,691,968 | |
| | | Shares | | Value
(Note 2) |
| United States (2.10%) | | | | | | | | |
| FirstCash, Inc. | | | 50,470 | | | $ | 4,929,910 | |
| Genpact, Ltd. | | | 134,525 | | | | 4,883,257 | |
| | | | | | | | 9,813,167 | |
| | | | | | | | | |
| Vietnam (2.86%) | | | | | | | | |
| FPT Corp. | | | 1,240,556 | | | | 2,639,594 | |
| Ho Chi Minh City Development Joint Stock Commercial Bank | | | 2,240,203 | | | | 2,703,154 | |
| Lix Detergent JSC | | | 437,310 | | | | 831,898 | |
| Vietnam Dairy Products JSC | | | 750,325 | | | | 4,182,166 | |
| Vietnam Technological & Commercial Joint Stock Bank(a) | | | 2,879,979 | | | | 2,986,645 | |
| | | | | | | | 13,343,457 | |
| | | | | | | | | |
| TOTAL COMMON STOCKS | | | | | | | | |
| (Cost $373,191,847) | | | | | | | 431,851,290 | |
| | | Principal Amount | | Value
(Note 2) |
| CORPORATE BONDS (0.18%) | | | | | | | | |
| Malaysia (0.18%) | | | | | | | | |
| AEON Credit Service M Bhd | | | | | | | | |
| 3.50%, 09/15/2020 | | $ | 2,260,800 | | | $ | 814,752 | |
| | | | | | | | | |
| TOTAL CORPORATE BONDS | | | | | | | | |
| (Cost $537,071) | | | | | | | 814,752 | |
| | | | | | | | | |
| TOTAL INVESTMENTS (92.77%) | | | | | |
| (Cost $373,728,918) | | | | | | $ | 432,666,042 | |
| | | | | | | | | |
| Other Assets In Excess Of Liabilities (7.23%) | | | | 33,732,534 | |
| | | | | | | | | |
| NET ASSETS (100.00%) | | | | | | $ | 466,398,576 | |
See Notes to Financial Statements.
| 32 | 1.855.377.7325 | www.GrandeurPeakGlobal.com |
| Grandeur Peak Emerging Markets Opportunities Fund | Portfolio of Investments |
April 30, 2019
| (a) | Non-Income Producing Security. |
| (b) | Security exempt from registration under Rule 144A of the Securities Act of 1933. These securities may be resold in the ordinary course of business in transactions exempt from registration, normally to qualified institutional buyers. As of April 30, 2019, these securities had a total aggregate market value of $39,868,360 representing 8.55% of net assets. |
| (c) | Security was purchased pursuant to Regulation S under the Securities Act of 1933, which exempts securities offered and sold outside of the United States from registration. Such security cannot be sold in the United States without either an effective registration statement filed pursuant to the Securities Act of 1933, or pursuant to an exemption from registration. The security has been deemed liquid under guidelines approved by the Fund's Board of Trustees. As of April 30, 2019, the aggregate market value of these securities was $49,437,457, representing 10.60% of net assets. |
For Fund compliance purposes, the Fund's geographical classifications refer to any one or more of the country sub-classifications used by one or more widely recognized market indexes or ratings group indexes, and/or as defined by Fund management. This definition may not apply for purposes of this report, which may combine sub-classifications for reporting ease. Geographical regions are shown as a percentage of net assets.
See Notes to Financial Statements.
| Annual Report | April 30, 2019 | 33 |
| Grandeur Peak Global Micro Cap Fund | Portfolio of Investments |
April 30, 2019
| | | Shares | | Value (Note 2) |
| COMMON STOCKS (98.75%) | | | | | | | | |
| Australia (10.22%) | | | | | | | | |
| Australian Ethical Investment, Ltd. | | | 41,500 | | | $ | 64,362 | |
| Class, Ltd. | | | 122,533 | | | | 150,301 | |
| Fiducian Group, Ltd. | | | 231,928 | | | | 787,241 | |
| HUB24, Ltd. | | | 16,900 | | | | 178,705 | |
| Kogan.com, Ltd. | | | 144,289 | | | | 569,613 | |
| Lycopodium, Ltd. | | | 49,526 | | | | 164,093 | |
| Mainstream Group Holdings, Ltd. | | | 1,001,078 | | | | 416,369 | |
| National Storage REIT | | | 348,373 | | | | 439,598 | |
| National Veterinary Care, Ltd. | | | 524,152 | | | | 742,697 | |
| People Infrastructure, Ltd. | | | 73,500 | | | | 132,125 | |
| | | | | | | | 3,645,104 | |
| | | | | | | | | |
| Brazil (0.13%) | | | | | | | | |
| Arco Platform, Ltd., Class A(a) | | | 1,475 | | | | 47,392 | |
| | | | | | | | | |
| Britain (14.07%) | | | | | | | | |
| AB Dynamics PLC | | | 6,532 | | | | 191,649 | |
| City of London Investment Group PLC | | | 44,447 | | | | 240,530 | |
| Clipper Logistics PLC | | | 59,135 | | | | 222,083 | |
| Curtis Banks Group PLC | | | 78,479 | | | | 312,127 | |
| CVS Group PLC | | | 31,500 | | | | 258,163 | |
| dotdigital group PLC | | | 152,400 | | | | 198,730 | |
| Impax Asset Management Group PLC | | | 136,519 | | | | 415,679 | |
| JTC PLC(b)(c) | | | 57,900 | | | | 299,742 | |
| K3 Capital Group PLC | | | 143,979 | | | | 276,929 | |
| LoopUp Group PLC(a) | | | 89,733 | | | | 403,691 | |
| Morses Club PLC | | | 68,538 | | | | 158,191 | |
| On the Beach Group PLC(c) | | | 51,200 | | | | 305,783 | |
| Oxford Immunotec Global PLC(a) | | | 20,167 | | | | 327,310 | |
| Premier Asset Management Group PLC | | | 60,375 | | | | 167,299 | |
| River & Mercantile Group PLC | | | 61,300 | | | | 206,233 | |
| Sanne Group PLC | | | 59,000 | | | | 481,620 | |
| Tracsis PLC | | | 19,300 | | | | 164,845 | |
| Volution Group PLC | | | 86,601 | | | | 195,365 | |
| XPS Pensions Group PLC(c) | | | 90,680 | | | | 189,195 | |
| | | | | | | | 5,015,164 | |
| | | | | | | | | |
| China (2.77%) | | | | | | | | |
| BBI Life Sciences Corp.(c) | | | 1,555,000 | | | | 467,800 | |
| Essex Bio-technology, Ltd. | | | 308,000 | | | | 283,862 | |
| O2Micro International, Ltd., ADR(a) | | | 162,425 | | | | 237,141 | |
| | | | | | | | 988,803 | |
| | | | | | | | | |
| Colombia (0.49%) | | | | | | | | |
| Amerisur Resources PLC(a) | | | 1,041,800 | | | | 174,704 | |
| | | Shares | | Value (Note 2) |
| Egypt (0.52%) | | | | |
| Obour Land For Food Industries | | | 372,774 | | | $ | 186,930 | |
| | | | | | | | | |
| Finland (0.29%) | | | | | | | | |
| Siili Solutions Oyj | | | 10,200 | | | | 102,963 | |
| | | | | | | | | |
| France (2.21%) | | | | | | | | |
| Esker SA | | | 3,500 | | | | 289,317 | |
| Infotel SA | | | 4,000 | | | | 172,726 | |
| Neurones | | | 3,900 | | | | 93,609 | |
| Thermador Groupe | | | 4,074 | | | | 232,126 | |
| | | | | | | | 787,778 | |
| | | | | | | | | |
| Georgia (1.27%) | | | | | | | | |
| Georgia Healthcare Group PLC(a)(b)(c) | | | 60,281 | | | | 171,362 | |
| TBC Bank Group PLC | | | 13,187 | | | | 279,949 | |
| | | | | | | | 451,311 | |
| | | | | | | | | |
| Germany (1.05%) | | | | | | | | |
| FinTech Group AG(a) | | | 6,400 | | | | 151,102 | |
| Marley Spoon AG(a) | | | 150,636 | | | | 45,131 | |
| Nexus AG | | | 6,200 | | | | 177,325 | |
| | | | | | | | 373,558 | |
| | | | | | | | | |
| Greece (2.03%) | | | | | | | | |
| Sarantis SA | | | 87,400 | | | | 724,426 | |
| | | | | | | | | |
| Hong Kong (2.82%) | | | | | | | | |
| Plover Bay Technologies, Ltd.(c) | | | 3,747,000 | | | | 606,604 | |
| TK Group Holdings, Ltd. | | | 589,000 | | | | 397,933 | |
| | | | | | | | 1,004,537 | |
| | | | | | | | | |
| India (3.94%) | | | | | | | | |
| Cyient, Ltd. | | | 23,640 | | | | 200,394 | |
| Kovai Medical Center and Hospital | | | 17,618 | | | | 187,442 | |
| Mastek, Ltd. | | | 19,498 | | | | 135,315 | |
| Metropolis Healthcare, Ltd.(a)(b)(c) | | | 18,316 | | | | 249,603 | |
| TCI Express, Ltd. | | | 12,556 | | | | 121,501 | |
| Time Technoplast, Ltd. | | | 77,015 | | | | 100,264 | |
| Vaibhav Global, Ltd. | | | 41,670 | | | | 410,177 | |
| | | | | | | | 1,404,696 | |
| | | | | | | | | |
| Indonesia (2.19%) | | | | | | | | |
| Arwana Citramulia Tbk PT | | | 7,920,100 | | | | 283,456 | |
| Hexindo Adiperkasa Tbk PT | | | 557,000 | | | | 121,172 | |
| Selamat Sempurna Tbk PT | | | 3,592,000 | | | | 378,105 | |
| | | | | | | | 782,733 | |
| | | | | | | | | |
| Ireland (0.94%) | | | | | | | | |
| Hostelworld Group PLC(b)(c) | | | 43,487 | | | | 140,350 | |
See Notes to Financial Statements.
| 34 | 1.855.377.7325 | www.GrandeurPeakGlobal.com |
| Grandeur Peak Global Micro Cap Fund | Portfolio of Investments |
April 30, 2019
| | | Shares | | Value (Note 2) |
| Ireland (continued) | | | | | | | | |
| Irish Residential Properties REIT PLC | | | 110,400 | | | $ | 195,643 | |
| | | | | | | | 335,993 | |
| | | | | | | | | |
| Italy (0.34%) | | | | | | | | |
| Piovan SpA(a)(b)(c) | | | 18,476 | | | | 122,057 | |
| | | | | | | | | |
| Japan (11.61%) | | | | | | | | |
| AIT Corp. | | | 19,600 | | | | 190,378 | |
| Atrae, Inc.(a) | | | 4,500 | | | | 136,945 | |
| Central Automotive Products, Ltd. | | | 16,500 | | | | 252,103 | |
| eGuarantee, Inc. | | | 22,000 | | | | 233,637 | |
| Future Corp. | | | 19,900 | | | | 331,205 | |
| M&A Capital Partners Co., Ltd.(a) | | | 14,400 | | | | 610,799 | |
| MarkLines Co., Ltd. | | | 20,600 | | | | 291,076 | |
| Naigai Trans Line, Ltd. | | | 34,600 | | | | 413,106 | |
| Open Door, Inc.(a) | | | 7,300 | | | | 209,377 | |
| SBI FinTech Solutions Co., Ltd. | | | 9,715 | | | | 96,472 | |
| Silver Life Co., Ltd.(a) | | | 3,700 | | | | 132,030 | |
| Synchro Food Co., Ltd.(a) | | | 31,500 | | | | 157,507 | |
| Syuppin Co., Ltd. | | | 56,500 | | | | 374,824 | |
| Trancom Co., Ltd. | | | 2,700 | | | | 156,336 | |
| Vega Corp. Co., Ltd.(a) | | | 27,500 | | | | 174,290 | |
| Yakuodo Co., Ltd. | | | 15,500 | | | | 378,334 | |
| | | | | | | | 4,138,419 | |
| | | | | | | | | |
| Malaysia (1.23%) | | | | | | | | |
| AEON Credit Service M Bhd | | | 64,950 | | | | 256,061 | |
| Mynews Holdings Bhd | | | 535,000 | | | | 181,806 | |
| | | | | | | | 437,867 | |
| | | | | | | | | |
| Netherlands (0.75%) | | | | | | | | |
| Shop Apotheke Europe NV(a)(b) | | | 6,875 | | | | 266,801 | |
| | | | | | | | | |
| New Zealand (0.00%)(d) | | | | | | | | |
| CBL Corp., Ltd.(a)(e) | | | 159,993 | | | | 0 | |
| | | | | | | | | |
| Norway (5.69%) | | | | | | | | |
| Infront ASA(a) | | | 155,600 | | | | 367,923 | |
| Medistim ASA | | | 19,662 | | | | 289,434 | |
| Sbanken ASA(b)(c) | | | 53,500 | | | | 526,477 | |
| Self Storage Group ASA(a) | | | 202,748 | | | | 434,756 | |
| Webstep AS(b)(c) | | | 145,752 | | | | 408,834 | |
| | | | | | | | 2,027,424 | |
| | | | | | | | | |
| Oman (0.65%) | | | | | | | | |
| Tethys Oil AB | | | 28,417 | | | | 233,239 | |
| | | | | | | | | |
| Philippines (2.03%) | | | | | | | | |
| Concepcion Industrial Corp. | | | 334,770 | | | | 289,079 | |
| Pryce Corp. | | | 4,656,000 | | | | 433,324 | |
| | | | | | | | 722,403 | |
| | | Shares | | Value (Note 2) |
| Poland (0.80%) | | | | |
| LiveChat Software SA | | | 18,500 | | | $ | 150,074 | |
| PGS Software SA | | | 51,047 | | | | 135,450 | |
| | | | | | | | 285,524 | |
| | | | | | | | | |
| Singapore (0.42%) | | | | | | | | |
| Riverstone Holdings, Ltd./Singapore | | | 197,800 | | | | 149,793 | |
| | | | | | | | | |
| South Africa (0.34%) | | | | | | | | |
| ARB Holdings, Ltd. | | | 400,143 | | | | 122,239 | |
| | | | | | | | | |
| South Korea (0.66%) | | | | | | | | |
| LEENO Industrial, Inc. | | | 4,800 | | | | 235,038 | |
| | | | | | | | | |
| Sri Lanka (0.07%) | | | | | | | | |
| Royal Ceramics Lanka PLC | | | 74,878 | | | | 24,436 | |
| | | | | | | | | |
| Sweden (4.11%) | | | | | | | | |
| Absolent Group AB | | | 6,876 | | | | 259,194 | |
| KNOW IT AB | | | 19,150 | | | | 451,672 | |
| OEM International AB, Class B | | | 5,685 | | | | 128,699 | |
| SwedenCare AB(a) | | | 36,978 | | | | 262,428 | |
| Vitec Software Group AB, Class B | | | 35,500 | | | | 362,583 | |
| | | | | | | | 1,464,576 | |
| | | | | | | | | |
| Taiwan (7.93%) | | | | | | | | |
| Bioteque Corp. | | | 130,000 | | | | 481,700 | |
| FineTek Co., Ltd. | | | 57,000 | | | | 158,636 | |
| Materials Analysis Technology, Inc. | | | 48,045 | | | | 117,854 | |
| Pacific Hospital Supply Co., Ltd. | | | 139,000 | | | | 329,721 | |
| Poya International Co., Ltd. | | | 25,000 | | | | 302,984 | |
| Rafael Microelectronics, Inc. | | | 32,000 | | | | 173,457 | |
| Sinmag Equipment Corp. | | | 35,190 | | | | 140,072 | |
| Sporton International, Inc. | | | 74,725 | | | | 442,532 | |
| Tehmag Foods Corp. | | | 30,300 | | | | 209,347 | |
| TSC Auto ID Technology Co., Ltd. | | | 27,000 | | | | 247,273 | |
| TTFB Co., Ltd. | | | 27,000 | | | | 225,430 | |
| | | | | | | | 2,829,006 | |
| | | | | | | | | |
| Thailand (0.33%) | | | | | | | | |
| WICE Logistics PCL | | | 961,000 | | | | 116,193 | |
| | | | | | | | | |
| Turkey (1.00%) | | | | | | | | |
| DP Eurasia NV(a)(b)(c) | | | 301,284 | | | | 355,159 | |
| | | | | | | | | |
| United States (13.96%) | | | | | | | | |
| Aratana Therapeutics, Inc.(a) | | | 68,900 | | | | 323,830 | |
| BioDelivery Sciences International, Inc.(a) | | | 35,225 | | | | 170,137 | |
| Coastal Financial Corp.(a) | | | 12,400 | | | | 197,780 | |
| DXP Enterprises, Inc.(a) | | | 8,800 | | | | 377,432 | |
See Notes to Financial Statements.
| Annual Report | April 30, 2019 | 35 |
| Grandeur Peak Global Micro Cap Fund | Portfolio of Investments |
April 30, 2019
| | | Shares | | Value (Note 2) |
| United States (continued) | | | | | | | | |
| Esquire Financial Holdings, Inc.(a) | | | 32,060 | | | $ | 805,988 | |
| Hackett Group, Inc. | | | 18,175 | | | | 278,986 | |
| Heska Corp.(a) | | | 2,400 | | | | 186,384 | |
| Hingham Institution for Savings | | | 2,315 | | | | 428,298 | |
| Kinsale Capital Group, Inc. | | | 2,600 | | | | 188,760 | |
| NV5 Global, Inc.(a) | | | 3,050 | | | | 193,187 | |
| Resources Connection, Inc. | | | 42,075 | | | | 675,725 | |
| Seacoast Commerce Banc Holdings | | | 15,325 | | | | 303,588 | |
| STAAR Surgical Co.(a) | | | 8,300 | | | | 269,584 | |
| Systemax, Inc. | | | 5,100 | | | | 115,821 | |
| Transcat, Inc.(a) | | | 8,616 | | | | 198,599 | |
| Veracyte, Inc.(a) | | | 11,529 | | | | 263,668 | |
| | | | | | | | 4,977,767 | |
| | | | | | | | | |
| Vietnam (1.89%) | | | | | | | | |
| Lix Detergent JSC | | | 208,790 | | | | 397,183 | |
| Taisun Int'l Holding Corp. | | | 67,000 | | | | 277,531 | |
| | | | | | | | 674,714 | |
| | | | | | | | | |
| TOTAL COMMON STOCKS | | | | | | | | |
| (Cost $30,929,997) | | | | | | | 35,208,747 | |
| | | Principal Amount | | Value (Note 2) |
| CORPORATE BONDS (0.59%) | | | | | | | | |
| Germany (0.46%) | | | | | | | | |
| publity AG | | | | | | | | |
| 3.50%, 11/17/2020 | | $ | 150,000 | | | $ | 162,478 | |
| | | | | | | | | |
| Malaysia (0.13%) | | | | | | | | |
| AEON Credit Service M Bhd | | | | | | | | |
| 3.50%, 09/15/2020 | | | 129,900 | | | | 46,814 | |
| | | | | | | | | |
| | | | | | | | | |
| TOTAL CORPORATE BONDS | | | | | | | | |
| (Cost $195,634) | | | | | | | 209,292 | |
| | | | | | | | | |
| TOTAL INVESTMENTS (99.34%) | | | | | | | | |
| (Cost $31,125,631) | | | | | | $ | 35,418,039 | |
| | | | | | | | | |
| Other Assets In Excess Of Liabilities (0.66%) | | | | | | | 236,442 | |
| | | | | | | | | |
| NET ASSETS (100.00%) | | | | | | $ | 35,654,481 | |
| (a) | Non-Income Producing Security. |
| (b) | Security exempt from registration under Rule 144A of the Securities Act of 1933. These securities may be resold in the ordinary course of business in transactions exempt from registration, normally to qualified institutional buyers. As of April 30, 2019, these securities had a total aggregate market value of $2,540,385 representing 7.13% of net assets. |
| (c) | Security was purchased pursuant to Regulation S under the Securities Act of 1933, which exempts securities offered and sold outside of the United States from registration. Such security cannot be sold in the United States without either an effective registration statement filed pursuant to the Securities Act of 1933, or pursuant to an exemption from registration. The security has been deemed liquid under guidelines approved by the Fund's Board of Trustees. As of April 30, 2019, the aggregate market value of these securities was $3,842,966, representing 10.78% of net assets. |
| (e) | As a result of the use of significant unobservable inputs to determine fair value, these investments have been classified as level 3 assets. See also Note 2 to the financial statements for additional information. |
For Fund compliance purposes, the Fund's geographical classifications refer to any one or more of the country sub-classifications used by one or more widely recognized market indexes or ratings group indexes, and/or as defined by Fund management. This definition may not apply for purposes of this report, which may combine sub-classifications for reporting ease. Geographical regions are shown as a percentage of net assets.
See Notes to Financial Statements.
| 36 | 1.855.377.7325 | www.GrandeurPeakGlobal.com |
| Grandeur Peak Global Opportunities Fund | Portfolio of Investments |
April 30, 2019
| | | Shares | | Value (Note 2) |
| COMMON STOCKS (96.33%) | | | | | | | | |
| Argentina (0.75%) | | | | | | | | |
| Globant SA(a) | | | 58,600 | | | $ | 4,921,814 | |
| | | | | | | | | |
| Australia (1.31%) | | | | | | | | |
| Class, Ltd. | | | 974,499 | | | | 1,195,333 | |
| Fiducian Group, Ltd. | | | 181,000 | | | | 614,375 | |
| Kogan.com, Ltd. | | | 725,112 | | | | 2,862,540 | |
| National Storage REIT | | | 1,818,117 | | | | 2,294,210 | |
| National Veterinary Care, Ltd. | | | 1,128,159 | | | | 1,598,545 | |
| | | | | | | | 8,565,003 | |
| | | | | | | | | |
| Austria (0.73%) | | | | | | | | |
| Palfinger AG | | | 147,118 | | | | 4,801,722 | |
| | | | | | | | | |
| Bangladesh (0.18%) | | | | | | | | |
| Square Pharmaceuticals, Ltd. | | | 377,221 | | | | 1,161,196 | |
| | | | | | | | | |
| Belgium (0.71%) | | | | | | | | |
| Melexis NV | | | 58,193 | | | | 4,666,755 | |
| | | | | | | | | |
| Bermuda (0.70%) | | | | | | | | |
| Bank of NT Butterfield & Son, Ltd. | | | 114,000 | | | | 4,562,280 | |
| | | | | | | | | |
| Brazil (1.58%) | | | | | | | | |
| Arco Platform, Ltd., Class A(a) | | | 17,864 | | | | 573,970 | |
| Fleury SA | | | 885,200 | | | | 4,686,632 | |
| Pagseguro Digital, Ltd., Class A(a) | | | 196,125 | | | | 5,111,018 | |
| | | | | | | | 10,371,620 | |
| | | | | | | | | |
| Britain (13.70%) | | | | | | | | |
| Ascential PLC | | | 963,100 | | | | 4,478,481 | |
| B&M European Value Retail SA | | | 1,591,400 | | | | 8,186,614 | |
| boohoo Group PLC(a) | | | 2,033,000 | | | | 6,513,591 | |
| City of London Investment Group PLC | | | 73,063 | | | | 395,388 | |
| Clipper Logistics PLC | | | 643,195 | | | | 2,415,534 | |
| Close Brothers Group PLC | | | 83,649 | | | | 1,692,897 | |
| Curtis Banks Group PLC | | | 196,200 | | | | 780,327 | |
| CVS Group PLC | | | 628,817 | | | | 5,153,562 | |
| Dechra Pharmaceuticals PLC | | | 268,400 | | | | 9,309,838 | |
| Endava PLC, ADR(a) | | | 119,857 | | | | 3,963,671 | |
| FDM Group Holdings PLC | | | 146,200 | | | | 1,868,321 | |
| Impax Asset Management Group PLC | | | 197,890 | | | | 602,544 | |
| Intertek Group PLC | | | 42,700 | | | | 2,978,925 | |
| JTC PLC(b)(c) | | | 795,438 | | | | 4,117,891 | |
| K3 Capital Group PLC | | | 356,600 | | | | 685,885 | |
| On the Beach Group PLC(c) | | | 608,300 | | | | 3,632,965 | |
| Oxford Immunotec Global PLC(a) | | | 245,458 | | | | 3,983,783 | |
| Premier Asset Management Group PLC | | | 423,737 | | | | 1,174,176 | |
| | | Shares | | Value (Note 2) |
| Britain (continued) | | | | | | | | |
| River & Mercantile Group PLC | | | 477,200 | | | $ | 1,605,455 | |
| RPS Group PLC | | | 1,037,039 | | | | 2,623,462 | |
| Sabre Insurance Group PLC(b)(c) | | | 837,400 | | | | 2,904,642 | |
| Sanne Group PLC | | | 641,314 | | | | 5,235,076 | |
| Secure Trust Bank PLC | | | 58,042 | | | | 1,135,303 | |
| Softcat PLC | | | 288,400 | | | | 3,410,991 | |
| St. James's Place PLC | | | 358,431 | | | | 5,241,829 | |
| Ted Baker PLC | | | 85,718 | | | | 1,797,364 | |
| Ultra Electronics Holdings PLC | | | 151,000 | | | | 3,134,714 | |
| Volution Group PLC | | | 291,700 | | | | 658,052 | |
| | | | | | | | 89,681,281 | |
| | | | | | | | | |
| Canada (4.06%) | | | | | | | | |
| Biosyent, Inc.(a) | | | 142,800 | | | | 788,774 | |
| Gildan Activewear, Inc. | | | 185,400 | | | | 6,836,426 | |
| Lululemon Athletica, Inc.(a) | | | 45,725 | | | | 8,063,604 | |
| Richelieu Hardware, Ltd. | | | 276,865 | | | | 4,300,635 | |
| Ritchie Bros Auctioneers, Inc. | | | 52,550 | | | | 1,828,214 | |
| Stantec, Inc. | | | 190,212 | | | | 4,763,464 | |
| | | | | | | | 26,581,117 | |
| | | | | | | | | |
| China (2.79%) | | | | | | | | |
| BBI Life Sciences Corp.(c) | | | 13,832,000 | | | | 4,161,167 | |
| CSPC Pharmaceutical Group, Ltd. | | | 1,849,000 | | | | 3,563,747 | |
| O2Micro International, Ltd., ADR(a) | | | 954,611 | | | | 1,393,732 | |
| On-Bright Electronics, Inc. | | | 508,181 | | | | 2,943,736 | |
| Silergy Corp. | | | 336,852 | | | | 5,515,909 | |
| WuXi AppTec Co., Ltd., Class H(a)(b)(c) | | | 56,000 | | | | 688,864 | |
| | | | | | | | 18,267,155 | |
| | | | | | | | | |
| Colombia (0.80%) | | | | | | | | |
| Parex Resources, Inc.(a) | | | 307,100 | | | | 5,231,038 | |
| | | | | | | | | |
| Denmark (0.42%) | | | | | | | | |
| Ambu A/S, Class B | | | 95,679 | | | | 2,744,754 | |
| | | | | | | | | |
| Egypt (0.10%) | | | | | | | | |
| Integrated Diagnostics Holdings PLC(b)(c) | | | 131,600 | | | | 638,260 | |
| | | | | | | | | |
| France (2.74%) | | | | | | | | |
| Alten SA | | | 28,581 | | | | 3,119,094 | |
| BioMerieux | | | 42,200 | | | | 3,348,707 | |
| Bureau Veritas SA | | | 48,500 | | | | 1,228,299 | |
| Esker SA | | | 28,047 | | | | 2,318,420 | |
| Eurofins Scientific SE | | | 8,500 | | | | 3,889,711 | |
| Infotel SA | | | 14,520 | | | | 626,997 | |
| Neurones | | | 39,608 | | | | 950,681 | |
| Thermador Groupe | | | 42,660 | | | | 2,430,652 | |
| | | | | | | | 17,912,561 | |
See Notes to Financial Statements.
| Annual Report | April 30, 2019 | 37 |
| Grandeur Peak Global Opportunities Fund | Portfolio of Investments |
April 30, 2019
| | | Shares | | Value (Note 2) |
| Georgia (0.92%) | | | | |
| Bank of Georgia Group PLC | | | 102,600 | | | $ | 2,299,859 | |
| Georgia Capital PLC(a) | | | 112,900 | | | | 1,489,884 | |
| TBC Bank Group PLC | | | 105,471 | | | | 2,239,058 | |
| | | | | | | | 6,028,801 | |
| | | | | | | | | |
| Germany (4.65%) | | | | | | | | |
| Dermapharm Holding SE(a) | | | 185,600 | | | | 6,744,678 | |
| FinTech Group AG(a) | | | 87,600 | | | | 2,068,209 | |
| Grand City Properties SA | | | 134,223 | | | | 3,155,415 | |
| GRENKE AG | | | 20,700 | | | | 2,197,501 | |
| Nexus AG | | | 111,824 | | | | 3,198,257 | |
| Norma Group SE | | | 104,068 | | | | 4,918,696 | |
| PATRIZIA Immobilien AG | | | 152,213 | | | | 3,170,311 | |
| Wirecard AG | | | 33,185 | | | | 4,976,356 | |
| | | | | | | | 30,429,423 | |
| | | | | | | | | |
| Hong Kong (1.34%) | | | | | | | | |
| International Housewares Retail Co., Ltd. | | | 2,372,000 | | | | 622,874 | |
| Value Partners Group, Ltd. | | | 6,961,000 | | | | 5,235,302 | |
| Vitasoy International Holdings, Ltd. | | | 578,483 | | | | 2,912,768 | |
| | | | | | | | 8,770,944 | |
| | | | | | | | | |
| India (4.83%) | | | | | | | | |
| Bajaj Finance, Ltd. | | | 154,250 | | | | 6,865,917 | |
| Cyient, Ltd. | | | 489,116 | | | | 4,146,186 | |
| Gulf Oil Lubricants India, Ltd. | | | 24,499 | | | | 303,112 | |
| HDFC Asset Management Co., Ltd.(b)(c) | | | 89,000 | | | | 2,168,962 | |
| HDFC Bank, Ltd. | | | 65,500 | | | | 2,182,384 | |
| Kellton Tech Solutions, Ltd.(a) | | | 447,981 | | | | 279,208 | |
| Kovai Medical Center and Hospital | | | 25,501 | | | | 271,312 | |
| L&T Technology Services, Ltd.(b)(c) | | | 64,348 | | | | 1,607,272 | |
| Metropolis Healthcare, Ltd.(a)(b)(c) | | | 267,791 | | | | 3,649,346 | |
| TCI Express, Ltd. | | | 59,149 | | | | 572,366 | |
| Time Technoplast, Ltd. | | | 1,305,759 | | | | 1,699,930 | |
| WNS Holdings, Ltd., ADR(a) | | | 138,025 | | | | 7,888,129 | |
| | | | | | | | 31,634,124 | |
| | | | | | | | | |
| Indonesia (1.43%) | | | | | | | | |
| Arwana Citramulia Tbk PT | | | 59,516,800 | | | | 2,130,075 | |
| Selamat Sempurna Tbk PT | | | 58,609,000 | | | | 6,169,368 | |
| Ultrajaya Milk Industry & Trading Co. Tbk PT | | | 11,829,000 | | | | 1,062,535 | |
| | | | | | | | 9,361,978 | |
| | | | | | | | | |
| Ireland (1.12%) | | | | | | | | |
| Irish Residential Properties REIT PLC | | | 1,674,246 | | | | 2,966,980 | |
| | | Shares | | Value (Note 2) |
| Ireland (continued) | | | | | | | | |
| Keywords Studios PLC | | | 215,200 | | | $ | 4,369,269 | |
| | | | | | | | 7,336,249 | |
| | | | | | | | | |
| Israel (0.87%) | | | | | | | | |
| Wix.com, Ltd.(a) | | | 42,459 | | | | 5,696,299 | |
| | | | | | | | | |
| Italy (3.17%) | | | | | | | | |
| Brembo SpA | | | 289,211 | | | | 3,795,237 | |
| DiaSorin SpA | | | 70,988 | | | | 6,934,918 | |
| FinecoBank Banca Fineco SpA | | | 316,812 | | | | 4,169,874 | |
| Interpump Group SpA | | | 145,683 | | | | 5,470,569 | |
| Piovan SpA(a)(b)(c) | | | 61,200 | | | | 404,301 | |
| | | | | | | | 20,774,899 | |
| | | | | | | | | |
| Japan (10.03%) | | | | | | | | |
| AIT Corp. | | | 371,600 | | | | 3,609,419 | |
| Arcland Service Holdings Co., Ltd. | | | 107,400 | | | | 1,908,026 | |
| Cosmos Pharmaceutical Corp. | | | 9,900 | | | | 1,576,606 | |
| Create SD Holdings Co., Ltd. | | | 265,400 | | | | 6,108,763 | |
| Future Corp. | | | 182,400 | | | | 3,035,770 | |
| Japan Lifeline Co., Ltd. | | | 401,500 | | | | 6,314,718 | |
| M&A Capital Partners Co., Ltd.(a) | | | 65,100 | | | | 2,761,322 | |
| MarkLines Co., Ltd. | | | 61,200 | | | | 864,750 | |
| MISUMI Group, Inc. | | | 193,400 | | | | 4,996,680 | |
| Naigai Trans Line, Ltd. | | | 74,300 | | | | 887,104 | |
| Nihon M&A Center, Inc. | | | 146,900 | | | | 4,154,002 | |
| Open Door, Inc.(a) | | | 73,600 | | | | 2,110,974 | |
| Seria Co., Ltd. | | | 173,300 | | | | 5,133,893 | |
| Strike Co., Ltd. | | | 70,300 | | | | 1,271,010 | |
| Sundrug Co., Ltd. | | | 71,100 | | | | 1,899,489 | |
| Synchro Food Co., Ltd.(a) | | | 320,900 | | | | 1,604,572 | |
| Systena Corp. | | | 204,200 | | | | 2,438,045 | |
| Syuppin Co., Ltd. | | | 215,200 | | | | 1,427,648 | |
| Tokyo Century Corp. | | | 71,800 | | | | 3,300,112 | |
| Trancom Co., Ltd. | | | 71,370 | | | | 4,132,470 | |
| Tsuruha Holdings, Inc. | | | 49,100 | | | | 4,174,128 | |
| Yakuodo Co., Ltd. | | | 79,400 | | | | 1,938,046 | |
| | | | | | | | 65,647,547 | |
| | | | | | | | | |
| Malaysia (0.44%) | | | | | | | | |
| AEON Credit Service M Bhd | | | 730,720 | | | | 2,880,817 | |
| | | | | | | | | |
| Mexico (0.31%) | | | | | | | | |
| Regional SAB de CV | | | 378,034 | | | | 2,045,933 | |
| | | | | | | | | |
| Netherlands (1.04%) | | | | | | | | |
| Aalberts NV | | | 173,522 | | | | 6,811,783 | |
| | | | | | | | | |
| | | | | | | | | |
| New Zealand (0.00%)(d) | | | | | | | | |
| CBL Corp., Ltd.(a)(e) | | | 1,107,672 | | | | 1 | |
| | | | | | | | | |
| Norway (1.43%) | | | | | | | | |
| Medistim ASA | | | 152,700 | | | | 2,247,814 | |
See Notes to Financial Statements.
| 38 | 1.855.377.7325 | www.GrandeurPeakGlobal.com |
| Grandeur Peak Global Opportunities Fund | Portfolio of Investments |
April 30, 2019
| | | Shares | | Value (Note 2) |
| Norway (continued) | | | | | | | | |
| Sbanken ASA(b)(c) | | | 724,610 | | | $ | 7,130,657 | |
| | | | | | | | 9,378,471 | |
| | | | | | | | | |
| Oman (0.28%) | | | | | | | | |
| Tethys Oil AB | | | 222,700 | | | | 1,827,861 | |
| | | | | | | | | |
| Philippines (1.14%) | | | | | | | | |
| Concepcion Industrial Corp. | | | 1,035,152 | | | | 893,871 | |
| Puregold Price Club, Inc. | | | 4,647,000 | | | | 3,736,326 | |
| Robinsons Retail Holdings, Inc. | | | 1,868,000 | | | | 2,795,951 | |
| | | | | | | | 7,426,148 | |
| | | | | | | | | |
| Poland (0.90%) | | | | | | | | |
| Dino Polska SA(a)(b)(c) | | | 148,097 | | | | 4,921,776 | |
| LiveChat Software SA | | | 76,200 | | | | 618,142 | |
| PGS Software SA | | | 120,487 | | | | 319,705 | |
| | | | | | | | 5,859,623 | |
| | | | | | | | | |
| Singapore (0.42%) | | | | | | | | |
| Riverstone Holdings, Ltd./Singapore | | | 3,665,000 | | | | 2,775,494 | |
| | | | | | | | | |
| South Africa (0.25%) | | | | | | | | |
| Italtile, Ltd. | | | 1,595,243 | | | | 1,616,989 | |
| | | | | | | | | |
| South Korea (0.83%) | | | | | | | | |
| Hy-Lok Corp. | | | 44,841 | | | | 756,211 | |
| ISC Co., Ltd. | | | 80,710 | | | | 798,014 | |
| Koh Young Technology, Inc. | | | 19,581 | | | | 1,619,248 | |
| LEENO Industrial, Inc. | | | 46,500 | | | | 2,276,934 | |
| | | | | | | | 5,450,407 | |
| | | | | | | | | |
| Sweden (2.91%) | | | | | | | | |
| AddTech AB, Class B | | | 201,927 | | | | 4,922,119 | |
| Hexpol AB | | | 372,500 | | | | 2,902,450 | |
| Indutrade AB | | | 105,600 | | | | 3,222,322 | |
| KNOW IT AB | | | 70,000 | | | | 1,651,022 | |
| Nibe Industrier AB, Class B | | | 276,600 | | | | 3,716,290 | |
| OEM International AB, Class B | | | 15,188 | | | | 343,831 | |
| Sweco AB, Class B | | | 90,185 | | | | 2,301,832 | |
| | | | | | | | 19,059,866 | |
| | | | | | | | | |
| Switzerland (0.09%) | | | | | | | | |
| VZ Holding AG | | | 2,335 | | | | 570,602 | |
| | | | | | | | | |
| Taiwan (1.96%) | | | | | | | | |
| Bioteque Corp. | | | 967,000 | | | | 3,583,104 | |
| FineTek Co., Ltd. | | | 102,000 | | | | 283,874 | |
| Poya International Co., Ltd. | | | 171,000 | | | | 2,072,409 | |
| Sinmag Equipment Corp. | | | 342,421 | | | | 1,362,991 | |
| Sporton International, Inc. | | | 734,671 | | | | 4,350,824 | |
| | | Shares | | Value (Note 2) |
| Taiwan (continued) | | | | | | | | |
| Test Research, Inc. | | | 665,000 | | | $ | 1,157,794 | |
| | | | | | | | 12,810,996 | |
| | | | | | | | | |
| Turkey (0.07%) | | | | | | | | |
| DP Eurasia NV(a)(b)(c) | | | 403,911 | | | | 476,137 | |
| | | | | | | | | |
| United Arab Emirates (0.40%) | | | | | | | | |
| Aramex PJSC | | | 2,042,645 | | | | 2,641,483 | |
| | | | | | | | | |
| United States (23.76%) | | | | | | | | |
| Aratana Therapeutics, Inc.(a) | | | 239,505 | | | | 1,125,673 | |
| BioDelivery Sciences International, Inc.(a) | | | 449,750 | | | | 2,172,292 | |
| Cactus, Inc., Class A(a) | | | 77,950 | | | | 2,829,585 | |
| Core Laboratories NV | | | 69,750 | | | | 4,421,453 | |
| DXP Enterprises, Inc.(a) | | | 131,500 | | | | 5,640,035 | |
| EPAM Systems, Inc.(a) | | | 62,150 | | | | 11,147,224 | |
| Esquire Financial Holdings, Inc.(a) | | | 13,051 | | | | 328,102 | |
| ExlService Holdings, Inc.(a) | | | 52,700 | | | | 3,130,380 | |
| Fastenal Co. | | | 121,100 | | | | 8,543,605 | |
| First Republic Bank | | | 100,900 | | | | 10,657,058 | |
| Genpact, Ltd. | | | 191,875 | | | | 6,965,063 | |
| Hackett Group, Inc. | | | 171,400 | | | | 2,630,990 | |
| Hamilton Lane, Inc., Class A | | | 53,042 | | | | 2,591,632 | |
| Heska Corp.(a) | | | 18,525 | | | | 1,438,652 | |
| Hingham Institution for Savings | | | 16,645 | | | | 3,079,491 | |
| Inphi Corp.(a) | | | 113,125 | | | | 5,165,288 | |
| Knight-Swift Transportation Holdings, Inc. | | | 449,720 | | | | 14,998,162 | |
| Littelfuse, Inc. | | | 6,900 | | | | 1,387,245 | |
| Microchip Technology, Inc. | | | 50,470 | | | | 5,041,448 | |
| Monro, Inc. | | | 61,725 | | | | 5,174,407 | |
| MSC Industrial Direct Co., Inc., Class A | | | 55,675 | | | | 4,657,214 | |
| NV5 Global, Inc.(a) | | | 28,050 | | | | 1,776,687 | |
| Paycom Software, Inc.(a) | | | 29,525 | | | | 5,979,698 | |
| Pluralsight, Inc., Class A(a) | | | 92,466 | | | | 3,281,618 | |
| Power Integrations, Inc. | | | 170,200 | | | | 13,449,204 | |
| Qualys, Inc.(a) | | | 43,800 | | | | 3,953,388 | |
| Resources Connection, Inc. | | | 462,493 | | | | 7,427,638 | |
| Silicon Laboratories, Inc.(a) | | | 39,640 | | | | 4,267,642 | |
| SVB Financial Group(a) | | | 20,275 | | | | 5,103,623 | |
| Systemax, Inc. | | | 140,845 | | | | 3,198,590 | |
| TriMas Corp.(a) | | | 128,594 | | | | 3,977,412 | |
| | | | | | | | 155,540,499 | |
| | | | | | | | | |
| Vietnam (1.17%) | | | | | | | | |
| Ho Chi Minh City | | | | | | | | |
| Development Joint Stock | | | | | | | | |
| Commercial Bank | | | 1,602,160 | | | | 1,933,256 | |
| Vietnam Dairy Products JSC | | | 430,560 | | | | 2,399,858 | |
See Notes to Financial Statements.
| Annual Report | April 30, 2019 | 39 |
| Grandeur Peak Global Opportunities Fund | Portfolio of Investments |
April 30, 2019
| | | Shares | | Value (Note 2) |
| Vietnam (continued) | | | | | | | | |
| Vietnam Technological & Commercial Joint Stock Bank(a) | | | 3,191,904 | | | $ | 3,310,122 | |
| | | | | | | | 7,643,236 | |
| | | | | | | | | |
| TOTAL COMMON STOCKS | | | | | | | | |
| (Cost $479,743,147) | | | | | | | 630,603,166 | |
| | | | | | | | | |
| PREFERRED STOCKS (0.30%) | | | | | | | | |
| United States (0.30%) | | | | | | | | |
| Dataminr Inc -Private Placement(a)(e) | | | 96,640 | | | | 1,923,136 | |
| | | | | | | | | |
| TOTAL PREFERRED STOCKS | | | | | | | | |
| (Cost $1,923,136) | | | | | | | 1,923,136 | |
| | | Principal Amount | | Value (Note 2) |
| CORPORATE BONDS (0.09%) | | | | | | | | |
| Malaysia (0.09%) | | | | | | | | |
| AEON Credit Service M Bhd | | | | | | | | |
| 3.50%, 09/15/2020 | | $ | 1,678,440 | | | $ | 604,880 | |
| | | | | | | | | |
| TOTAL CORPORATE BONDS | | | | | | | | |
| (Cost $398,727) | | | | | | | 604,880 | |
| | | | | | | | | |
| TOTAL INVESTMENTS (96.72%) | | | | | | | | |
| (Cost $482,065,010) | | | | | | $ | 633,131,182 | |
| | | | | | | | | |
| Other Assets In Excess Of Liabilities (3.28%) | | | | | | | 21,476,248 | |
| | | | | | | | | |
| NET ASSETS (100.00%) | | | | | | $ | 654,607,430 | |
| (a) | Non-Income Producing Security. |
| (b) | Security exempt from registration under Rule 144A of the Securities Act of 1933. These securities may be resold in the ordinary course of business in transactions exempt from registration, normally to qualified institutional buyers. As of April 30, 2019, these securities had a total aggregate market value of $28,708,108 representing 4.39% of net assets. |
| (c) | Security was purchased pursuant to Regulation S under the Securities Act of 1933, which exempts securities offered and sold outside of the United States from registration. Such security cannot be sold in the United States without either an effective registration statement filed pursuant to the Securities Act of 1933, or pursuant to an exemption from registration. The security has been deemed liquid under guidelines approved by the Fund's Board of Trustees. As of April 30, 2019, the aggregate market value of these securities was $36,502,240, representing 5.58% of net assets. |
| (e) | As a result of the use of significant unobservable inputs to determine fair value, these investments have been classified as level 3 assets. See also Note 2 to the financial statements for additional information. |
For Fund compliance purposes, the Fund's geographical classifications refer to any one or more of the country sub-classifications used by one or more widely recognized market indexes or ratings group indexes, and/or as defined by Fund management. This definition may not apply for purposes of this report, which may combine sub-classifications for reporting ease. Geographical regions are shown as a percentage of net assets.
See Notes to Financial Statements.
| 40 | 1.855.377.7325 | www.GrandeurPeakGlobal.com |
| Grandeur Peak Global Reach Fund | Portfolio of Investments |
| | April 30, 2019 |
| | | Shares | | Value
(Note 2) |
| COMMON STOCKS (98.53%) | | | | | | | | |
| Argentina (0.49%) | | | | | | | | |
| Globant SA(a) | | | 19,088 | | | $ | 1,603,201 | |
| | | | | | | | | |
| Australia (3.31%) | | | | | | | | |
| Appen, Ltd. | | | 41,442 | | | | 739,712 | |
| Australian Ethical Investment, Ltd. | | | 487,800 | | | | 756,524 | |
| Class, Ltd. | | | 436,300 | | | | 535,171 | |
| Domino's Pizza Enterprises, Ltd. | | | 49,000 | | | | 1,485,330 | |
| Kogan.com, Ltd. | | | 315,008 | | | | 1,243,564 | |
| Lycopodium, Ltd. | | | 181,976 | | | | 602,935 | |
| Mainstream Group Holdings, Ltd. | | | 2,505,366 | | | | 1,042,033 | |
| National Storage REIT | | | 1,034,786 | | | | 1,305,756 | |
| National Veterinary Care, Ltd. | | | 720,900 | | | | 1,021,479 | |
| Netwealth Group, Ltd. | | | 243,326 | | | | 1,629,561 | |
| People Infrastructure, Ltd. | | | 299,200 | | | | 537,849 | |
| | | | | | | | 10,899,914 | |
| | | | | | | | | |
| Austria (0.29%) | | | | | | | | |
| Palfinger AG | | | 29,648 | | | | 967,668 | |
| | | | | | | | | |
| Bangladesh (0.34%) | | | | | | | | |
| Square Pharmaceuticals, Ltd. | | | 359,269 | | | | 1,105,934 | |
| | | | | | | | | |
| Belgium (0.23%) | | | | | | | | |
| Melexis NV | | | 9,497 | | | | 761,607 | |
| | | | | | | | | |
| Bermuda (0.80%) | | | | | | | | |
| Bank of NT Butterfield & Son, Ltd. | | | 65,400 | | | | 2,617,308 | |
| | | | | | | | | |
| Brazil (1.46%) | | | | | | | | |
| Arco Platform, Ltd., Class A(a) | | | 27,873 | | | | 895,559 | |
| Fleury SA | | | 270,500 | | | | 1,432,144 | |
| Pagseguro Digital, Ltd., Class A(a) | | | 52,875 | | | | 1,377,923 | |
| Raia Drogasil SA | | | 63,000 | | | | 1,101,709 | |
| | | | | | | | 4,807,335 | |
| | | | | | | | | |
| Britain (12.78%) | | | | | | | | |
| AB Dynamics PLC | | | 38,193 | | | | 1,120,584 | |
| Abcam PLC | | | 53,200 | | | | 903,928 | |
| Alpha FX Group PLC(b) | | | 66,800 | | | | 683,792 | |
| Ascential PLC | | | 134,300 | | | | 624,504 | |
| ASOS PLC(a) | | | 27,300 | | | | 1,395,846 | |
| B&M European Value Retail SA | | | 554,600 | | | | 2,853,020 | |
| boohoo Group PLC(a) | | | 750,300 | | | | 2,403,909 | |
| Close Brothers Group PLC | | | 46,074 | | | | 932,450 | |
| Curtis Banks Group PLC | | | 278,800 | | | | 1,108,844 | |
| CVS Group PLC | | | 111,100 | | | | 910,537 | |
| Dechra Pharmaceuticals PLC | | | 61,300 | | | | 2,126,278 | |
| dotdigital group PLC | | | 1,212,256 | | | | 1,580,783 | |
| | | Shares | | Value
(Note 2) |
| Britain (continued) | | | | | | | | |
| Endava PLC, ADR(a) | | | 62,848 | | | $ | 2,078,383 | |
| First Derivatives PLC | | | 14,850 | | | | 613,852 | |
| Horizon Discovery Group PLC(a) | | | 282,600 | | | | 686,904 | |
| Impax Asset Management Group PLC | | | 547,041 | | | | 1,665,654 | |
| Intertek Group PLC | | | 11,400 | | | | 795,310 | |
| JTC PLC(b)(c) | | | 502,542 | | | | 2,601,602 | |
| K3 Capital Group PLC | | | 170,800 | | | | 328,517 | |
| LoopUp Group PLC(a) | | | 218,949 | | | | 985,009 | |
| Morses Club PLC | | | 475,200 | | | | 1,096,801 | |
| On the Beach Group PLC(b) | | | 275,700 | | | | 1,646,570 | |
| Oxford Immunotec Global PLC(a) | | | 50,575 | | | | 820,832 | |
| RPS Group PLC | | | 327,199 | | | | 827,736 | |
| Sabre Insurance Group PLC(b)(c) | | | 697,900 | | | | 2,420,766 | |
| Sanne Group PLC | | | 327,073 | | | | 2,669,912 | |
| Softcat PLC | | | 79,108 | | | | 935,633 | |
| St. James's Place PLC | | | 189,929 | | | | 2,777,593 | |
| Volution Group PLC | | | 346,347 | | | | 781,332 | |
| XPS Pensions Group PLC(b) | | | 804,128 | | | | 1,677,734 | |
| | | | | | | | 42,054,615 | |
| | | | | | | | | |
| Canada (2.29%) | | | | | | | | |
| Biosyent, Inc.(a) | | | 93,300 | | | | 515,354 | |
| Gildan Activewear, Inc. | | | 33,000 | | | | 1,216,840 | |
| Lululemon Athletica, Inc.(a) | | | 11,700 | | | | 2,063,295 | |
| Richelieu Hardware, Ltd. | | | 62,200 | | | | 966,173 | |
| Ritchie Bros Auctioneers, Inc. | | | 40,750 | | | | 1,417,692 | |
| Stantec, Inc. | | | 53,820 | | | | 1,347,810 | |
| | | | | | | | 7,527,164 | |
| | | | | | | | | |
| China (5.10%) | | | | | | | | |
| 51job, Inc., ADR(a) | | | 10,625 | | | | 981,113 | |
| 58.com, Inc., ADR(a) | | | 12,475 | | | | 895,580 | |
| BBI Life Sciences Corp.(b) | | | 7,001,500 | | | | 2,106,305 | |
| China Medical System Holdings, Ltd. | | | 565,000 | | | | 500,555 | |
| CSPC Pharmaceutical Group, Ltd. | | | 550,000 | | | | 1,060,065 | |
| Essex Bio-technology, Ltd. | | | 1,305,000 | | | | 1,202,727 | |
| Hop Hing Group Holdings, Ltd. | | | 43,436,000 | | | | 830,537 | |
| HUYA, Inc., ADR(a) | | | 6,488 | | | | 154,998 | |
| Koolearn Technology Holding, Ltd.(a)(b)(c) | | | 608,000 | | | | 854,089 | |
| Man Wah Holdings, Ltd. | | | 1,392,000 | | | | 716,867 | |
| O2Micro International, Ltd., ADR(a) | | | 292,039 | | | | 426,377 | |
| On-Bright Electronics, Inc. | | | 204,528 | | | | 1,184,768 | |
| Shanghai Haohai Biological Technology Co., Ltd., Class H(b)(c) | | | 121,700 | | | | 780,327 | |
| Silergy Corp. | | | 92,925 | | | | 1,521,635 | |
| See Notes to Financial Statements. | |
| Annual Report | April 30, 2019 | 41 |
| Grandeur Peak Global Reach Fund | Portfolio of Investments |
| | April 30, 2019 |
| | | Shares | | Value
(Note 2) |
| China (continued) | | | | | | | | |
| WuXi AppTec Co., Ltd., Class H(a)(b)(c) | | | 146,000 | | | $ | 1,795,967 | |
| Yum China Holdings, Inc. | | | 37,250 | | | | 1,770,865 | |
| | | | | | | | 16,782,775 | |
| | | | | | | | | |
| Colombia (1.38%) | | | | | | | | |
| Amerisur Resources PLC(a) | | | 5,167,900 | | | | 866,629 | |
| Parex Resources, Inc.(a) | | | 215,961 | | | | 3,678,607 | |
| | | | | | | | 4,545,236 | |
| | | | | | | | | |
| Denmark (0.16%) | | | | | | | | |
| Ambu A/S, Class B | | | 18,080 | | | | 518,663 | |
| | | | | | | | | |
| Egypt (0.55%) | | | | | | | | |
| African Export-Import Bank, GDR | | | 200,000 | | | | 816,000 | |
| Commercial International Bank Egypt SAE | | | 86,173 | | | | 383,287 | |
| Integrated Diagnostics Holdings PLC(b)(c) | | | 129,237 | | | | 626,799 | |
| | | | | | | | 1,826,086 | |
| | | | | | | | | |
| Finland (0.47%) | | | | | | | | |
| Metso OYJ | | | 25,300 | | | | 942,383 | |
| Terveystalo Oyj(b)(c) | | | 59,800 | | | | 602,304 | |
| | | | | | | | 1,544,687 | |
| | | | | | | | | |
| France (2.27%) | | | | | | | | |
| Alten SA | | | 10,400 | | | | 1,134,970 | |
| BioMerieux | | | 10,500 | | | | 833,209 | |
| Bureau Veritas SA | | | 36,300 | | | | 919,324 | |
| Esker SA | | | 21,509 | | | | 1,777,976 | |
| Eurofins Scientific SE | | | 900 | | | | 411,852 | |
| Infotel SA | | | 21,060 | | | | 909,405 | |
| Neurones | | | 17,282 | | | | 414,807 | |
| Thermador Groupe | | | 18,808 | | | | 1,071,629 | |
| | | | | | | | 7,473,172 | |
| | | | | | | | | |
| Georgia (0.25%) | | | | | | | | |
| Georgia Healthcare Group PLC(a)(b)(c) | | | 284,198 | | | | 807,896 | |
| | | | | | | | | |
| Germany (4.76%) | | | | | | | | |
| CANCOM SE | | | 15,800 | | | | 796,749 | |
| Dermapharm Holding SE(a) | | | 34,800 | | | | 1,264,627 | |
| FinTech Group AG(a) | | | 23,000 | | | | 543,023 | |
| FUCHS PETROLUB SE | | | 15,500 | | | | 674,183 | |
| Grand City Properties SA | | | 69,400 | | | | 1,631,507 | |
| GRENKE AG | | | 17,000 | | | | 1,804,711 | |
| Marley Spoon AG(a) | | | 1,162,278 | | | | 348,223 | |
| Nexus AG | | | 32,485 | | | | 929,098 | |
| Norma Group SE | | | 28,260 | | | | 1,335,688 | |
| PATRIZIA Immobilien AG | | | 99,904 | | | | 2,080,813 | |
| Puma SE | | | 3,000 | | | | 1,855,688 | |
| | | Shares | | Value
(Note 2) |
| Germany (continued) | | | | | | | | |
| Wirecard AG | | | 15,996 | | | $ | 2,398,728 | |
| | | | | | | | 15,663,038 | |
| | | | | | | | | |
| Greece (0.50%) | | | | | | | | |
| Sarantis SA | | | 199,040 | | | | 1,649,768 | |
| | | | | | | | | |
| Hong Kong (1.35%) | | | | | | | | |
| Plover Bay Technologies, Ltd.(b) | | | 2,930,000 | | | | 474,340 | |
| TK Group Holdings, Ltd. | | | 1,720,000 | | | | 1,162,043 | |
| Vitasoy International Holdings, Ltd. | | | 558,000 | | | | 2,809,632 | |
| | | | | | | | 4,446,015 | |
| | | | | | | | | |
| India (4.92%) | | | | | | | | |
| Bajaj Finance, Ltd. | | | 55,000 | | | | 2,448,139 | |
| Central Depository Services India, Ltd.(b) | | | 96,500 | | | | 324,031 | |
| Cyient, Ltd. | | | 181,100 | | | | 1,535,166 | |
| Gulf Oil Lubricants India, Ltd. | | | 15,885 | | | | 196,536 | |
| HDFC Asset Management Co., Ltd.(b)(c) | | | 26,000 | | | | 633,629 | |
| HDFC Bank, Ltd. | | | 56,000 | | | | 1,865,855 | |
| HDFC Life Insurance Co., Ltd.(b)(c) | | | 66,500 | | | | 386,788 | |
| Kovai Medical Center and Hospital | | | 18,322 | | | | 194,933 | |
| L&T Technology Services, Ltd.(b)(c) | | | 21,000 | | | | 524,534 | |
| Metropolis Healthcare, Ltd.(a)(b)(c) | | | 83,879 | | | | 1,143,069 | |
| Poly Medicure, Ltd. | | | 242,220 | | | | 680,826 | |
| TCI Express, Ltd. | | | 133,959 | | | | 1,296,280 | |
| Time Technoplast, Ltd. | | | 542,756 | | | | 706,598 | |
| Vaibhav Global, Ltd. | | | 96,447 | | | | 949,373 | |
| WNS Holdings, Ltd., ADR(a) | | | 58,075 | | | | 3,318,986 | |
| | | | | | | | 16,204,743 | |
| | | | | | | | | |
| Indonesia (1.67%) | | | | | | | | |
| Arwana Citramulia Tbk PT | | | 26,137,200 | | | | 935,437 | |
| Bank Central Asia Tbk PT | | | 571,500 | | | | 1,153,026 | |
| Hexindo Adiperkasa Tbk PT | | | 1,636,900 | | | | 356,097 | |
| Indonesia Pondasi Raya Tbk PT | | | 4,149,800 | | | | 130,464 | |
| Link Net Tbk PT | | | 1,082,400 | | | | 330,417 | |
| Selamat Sempurna Tbk PT | | | 20,026,300 | | | | 2,108,032 | |
| Ultrajaya Milk Industry & Trading Co. Tbk PT | | | 5,474,800 | | | | 491,771 | |
| | | | | | | | 5,505,244 | |
| | | | | | | | | |
| Ireland (0.55%) | | | | | | | | |
| Hostelworld Group PLC(b)(c) | | | 371,708 | | | | 1,199,652 | |
| Keywords Studios PLC | | | 29,800 | | | | 605,038 | |
| | | | | | | | 1,804,690 | |
| See Notes to Financial Statements. | |
| 42 | 1.855.377.7325 | www.GrandeurPeakGlobal.com |
| Grandeur Peak Global Reach Fund | Portfolio of Investments |
| | April 30, 2019 |
| | | Shares | | Value
(Note 2) |
| Israel (1.27%) | | | | |
| Wix.com, Ltd.(a) | | | 31,050 | | | $ | 4,165,668 | |
| | | | | | | | | |
| Italy (1.89%) | | | | | | | | |
| Brembo SpA | | | 108,750 | | | | 1,427,097 | |
| DiaSorin SpA | | | 10,928 | | | | 1,067,572 | |
| FinecoBank Banca Fineco SpA | | | 127,298 | | | | 1,675,494 | |
| Interpump Group SpA | | | 32,697 | | | | 1,227,811 | |
| Piovan SpA(a)(b)(c) | | | 123,863 | | | | 818,267 | |
| | | | | | | | 6,216,241 | |
| | | | | | | | | |
| Japan (6.83%) | | | | | | | | |
| Aeon Delight Co., Ltd. | | | 18,900 | | | | 635,401 | |
| AIT Corp. | | | 84,700 | | | | 822,707 | |
| Cosmos Pharmaceutical Corp. | | | 4,100 | | | | 652,938 | |
| Create SD Holdings Co., Ltd. | | | 47,300 | | | | 1,088,713 | |
| Future Corp. | | | 69,300 | | | | 1,153,393 | |
| Japan Lifeline Co., Ltd. | | | 75,200 | | | | 1,182,732 | |
| MarkLines Co., Ltd. | | | 36,300 | | | | 512,915 | |
| MISUMI Group, Inc. | | | 51,500 | | | | 1,330,553 | |
| Naigai Trans Line, Ltd. | | | 59,150 | | | | 706,221 | |
| Nihon M&A Center, Inc. | | | 77,100 | | | | 2,180,215 | |
| Open Door, Inc.(a) | | | 38,400 | | | | 1,101,378 | |
| Pigeon Corp. | | | 30,500 | | | | 1,290,969 | |
| SBI FinTech Solutions Co., Ltd. | | | 75,000 | | | | 744,767 | |
| Seria Co., Ltd. | | | 41,200 | | | | 1,220,522 | |
| Strike Co., Ltd. | | | 17,100 | | | | 309,165 | |
| Sundrug Co., Ltd. | | | 25,200 | | | | 673,237 | |
| Synchro Food Co., Ltd.(a) | | | 113,400 | | | | 567,025 | |
| Systena Corp. | | | 43,700 | | | | 521,756 | |
| Syuppin Co., Ltd. | | | 147,200 | | | | 976,532 | |
| Trancom Co., Ltd. | | | 18,300 | | | | 1,059,608 | |
| Tsuruha Holdings, Inc. | | | 10,500 | | | | 892,634 | |
| Unicharm Corp. | | | 23,600 | | | | 773,072 | |
| Vega Corp. Co., Ltd.(a) | | | 143,900 | | | | 912,010 | |
| Yakuodo Co., Ltd. | | | 47,200 | | | | 1,152,088 | |
| | | | | | | | 22,460,551 | |
| | | | | | | | | |
| Kenya (0.22%) | | | | | | | | |
| Safaricom PLC | | | 2,572,600 | | | | 715,953 | |
| | | | | | | | | |
| Malaysia (0.26%) | | | | | | | | |
| Mynews Holdings Bhd | | | 1,818,000 | | | | 617,799 | |
| Scicom MSC Bhd | | | 934,000 | | | | 243,976 | |
| | | | | | | | 861,775 | |
| | | | | | | | | |
| Mexico (0.12%) | | | | | | | | |
| Regional SAB de CV | | | 74,857 | | | | 405,129 | |
| | | | | | | | | |
| Netherlands (1.01%) | | | | | | | | |
| Aalberts NV | | | 52,082 | | | | 2,044,532 | |
| Shop Apotheke Europe NV(a)(c) | | | 33,000 | | | | 1,280,644 | |
| | | | | | | | 3,325,176 | |
| | | Shares | | Value
(Note 2) |
| New Zealand (0.00%)(d) | | | | | | | | |
| CBL Corp., Ltd.(a)(e) | | | 819,006 | | | $ | 0 | |
| | | | | | | | | |
| Norway (1.55%) | | | | | | | | |
| Infront ASA(a) | | | 156,700 | | | | 370,524 | |
| Medistim ASA | | | 41,941 | | | | 617,391 | |
| Multiconsult ASA(b)(c) | | | 63,000 | | | | 460,043 | |
| Sbanken ASA(b)(c) | | | 158,900 | | | | 1,563,685 | |
| Self Storage Group ASA(a) | | | 594,566 | | | | 1,274,939 | |
| Webstep AS(b)(c) | | | 288,000 | | | | 807,840 | |
| | | | | | | | 5,094,422 | |
| | | | | | | | | |
| Oman (0.28%) | | | | | | | | |
| Tethys Oil AB | | | 112,700 | | | | 925,011 | |
| | | | | | | | | |
| Pakistan (0.11%) | | | | | | | | |
| Meezan Bank, Ltd. | | | 543,356 | | | | 373,004 | |
| | | | | | | | | |
| Philippines (1.93%) | | | | | | | | |
| Concepcion Industrial Corp. | | | 1,793,920 | | | | 1,549,079 | |
| Holcim Philippines, Inc. | | | 3,883,400 | | | | 944,908 | |
| Pryce Corp. | | | 6,408,800 | | | | 596,454 | |
| Puregold Price Club, Inc. | | | 1,332,700 | | | | 1,071,530 | |
| Wilcon Depot, Inc. | | | 6,847,400 | | | | 2,191,694 | |
| | | | | | | | 6,353,665 | |
| | | | | | | | | |
| Poland (1.29%) | | | | | | | | |
| CCC SA | | | 8,462 | | | | 459,255 | |
| Dino Polska SA(a)(b)(c) | | | 80,518 | | | | 2,675,892 | |
| LiveChat Software SA | | | 89,904 | | | | 729,310 | |
| PGS Software SA | | | 138,887 | | | | 368,529 | |
| | | | | | | | 4,232,986 | |
| | | | | | | | | |
| Russia (0.02%) | | | | | | | | |
| MD Medical Group | | | | | | | | |
| Investments PLC, GDR(b) | | | 10,448 | | | | 51,195 | |
| | | | | | | | | |
| Singapore (0.23%) | | | | | | | | |
| Riverstone Holdings, | | | | | | | | |
| Ltd./Singapore | | | 1,008,800 | | | | 763,961 | |
| | | | | | | | | |
| South Africa (0.95%) | | | | | | | | |
| ARB Holdings, Ltd. | | | 2,093,266 | | | | 639,467 | |
| Clicks Group, Ltd. | | | 64,000 | | | | 875,375 | |
| Italtile, Ltd. | | | 822,600 | | | | 833,813 | |
| Shoprite Holdings, Ltd. | | | 64,200 | | | | 773,452 | |
| | | | | | | | 3,122,107 | |
| | | | | | | | | |
| South Korea (0.33%) | | | | | | | | |
| ISC Co., Ltd. | | | 1,133 | | | | 11,203 | |
| Koh Young Technology, Inc. | | | 8,993 | | | | 743,675 | |
| Tokai Carbon Korea Co., Ltd. | | | 6,000 | | | | 318,452 | |
| | | | | | | | 1,073,330 | |
| See Notes to Financial Statements. | |
| Annual Report | April 30, 2019 | 43 |
| Grandeur Peak Global Reach Fund | Portfolio of Investments |
| | April 30, 2019 |
| | | Shares | | Value
(Note 2) |
| Spain (0.00%)(d) | | | | |
| Let's GOWEX SA(a)(e) | | | 10,700 | | | $ | 0 | |
| | | | | | | | | |
| Sri Lanka (0.05%) | | | | | | | | |
| Royal Ceramics Lanka PLC | | | 547,598 | | | | 178,705 | |
| | | | | | | | | |
| Sweden (2.59%) | | | | | | | | |
| AddTech AB, Class B | | | 34,300 | | | | 836,088 | |
| Hexpol AB | | | 94,627 | | | | 737,316 | |
| Indutrade AB | | | 26,800 | | | | 817,786 | |
| KNOW IT AB | | | 70,000 | | | | 1,651,021 | |
| Nibe Industrier AB, Class B | | | 93,000 | | | | 1,249,512 | |
| OEM International AB, Class B | | | 17,200 | | | | 389,380 | |
| Sweco AB, Class B | | | 41,100 | | | | 1,049,014 | |
| SwedenCare AB(a) | | | 157,700 | | | | 1,119,176 | |
| Vitec Software Group AB, Class B | | | 67,500 | | | | 689,417 | |
| | | | | | | | 8,538,710 | |
| | | | | | | | | |
| Switzerland (0.74%) | | | | | | | | |
| Partners Group Holding AG | | | 3,235 | | | | 2,437,005 | |
| | | | | | | | | |
| Taiwan (2.84%) | | | | | | | | |
| Bioteque Corp. | | | 299,000 | | | | 1,107,909 | |
| FineTek Co., Ltd. | | | 148,000 | | | | 411,896 | |
| Pacific Hospital Supply Co., Ltd. | | | 588,000 | | | | 1,394,790 | |
| Poya International Co., Ltd. | | | 98,000 | | | | 1,187,696 | |
| Sinmag Equipment Corp. | | | 175,298 | | | | 697,766 | |
| Sporton International, Inc. | | | 275,859 | | | | 1,633,675 | |
| Test Research, Inc. | | | 409,440 | | | | 712,853 | |
| TSC Auto ID Technology Co., Ltd. | | | 64,600 | | | | 591,625 | |
| TTFB Co., Ltd. | | | 148,000 | | | | 1,235,688 | |
| Voltronic Power Technology Corp. | | | 19,000 | | | | 375,069 | |
| | | | | | | | 9,348,967 | |
| | | | | | | | | |
| Thailand (0.20%) | | | | | | | | |
| TOA Paint Thailand PCL | | | 666,000 | | | | 657,134 | |
| | | | | | | | | |
| Turkey (0.42%) | | | | | | | | |
| DP Eurasia NV(a)(b)(c) | | | 1,180,525 | | | | 1,391,623 | |
| | | | | | | | | |
| United Arab Emirates (0.60%) | | | | | | | | |
| Aramex PJSC | | | 1,518,033 | | | | 1,963,072 | |
| | | | | | | | | |
| United States (25.07%) | | | | | | | | |
| 8x8, Inc.(a) | | | 50,400 | | | | 1,205,568 | |
| Accenture PLC, Class A | | | 2,125 | | | | 388,174 | |
| Amazon.com, Inc.(a) | | | 950 | | | | 1,830,194 | |
| Apollo Global Management LLC, Class A | | | 55,225 | | | | 1,805,305 | |
| Aratana Therapeutics, Inc.(a) | | | 153,675 | | | | 722,272 | |
| Axos Financial, Inc.(a) | | | 22,200 | | | | 726,384 | |
| Bank of Hawaii Corp. | | | 15,525 | | | | 1,278,949 | |
| | | Shares | | Value
(Note 2) |
| United States (continued) | | | | | | | | |
| BioDelivery Sciences International, Inc.(a) | | | 226,975 | | | $ | 1,096,289 | |
| Blackline, Inc.(a) | | | 15,450 | | | | 789,186 | |
| Blackstone Group LP | | | 32,075 | | | | 1,265,679 | |
| Burford Capital, Ltd. | | | 88,000 | | | | 1,876,197 | |
| Cactus, Inc., Class A(a) | | | 39,650 | | | | 1,439,295 | |
| Core Laboratories NV | | | 16,175 | | | | 1,025,333 | |
| CoreSite Realty Corp. | | | 15,075 | | | | 1,649,356 | |
| DexCom, Inc.(a) | | | 3,450 | | | | 417,691 | |
| DXP Enterprises, Inc.(a) | | | 79,400 | | | | 3,405,466 | |
| Edwards Lifesciences Corp.(a) | | | 1,675 | | | | 294,917 | |
| EPAM Systems, Inc.(a) | | | 16,800 | | | | 3,013,248 | |
| Equinix, Inc. | | | 1,375 | | | | 625,213 | |
| Esquire Financial Holdings, Inc.(a) | | | 114,787 | | | | 2,885,745 | |
| ExlService Holdings, Inc.(a) | | | 19,475 | | | | 1,156,815 | |
| Fastenal Co. | | | 49,386 | | | | 3,484,182 | |
| First Republic Bank | | | 81,325 | | | | 8,589,547 | |
| Focus Financial Partners, Inc., Class A(a) | | | 11,775 | | | | 441,563 | |
| Genpact, Ltd. | | | 53,875 | | | | 1,955,663 | |
| Goosehead Insurance, Inc., Class A | | | 60,110 | | | | 1,831,552 | |
| Hackett Group, Inc. | | | 28,025 | | | | 430,184 | |
| HealthEquity, Inc.(a) | | | 12,725 | | | | 862,119 | |
| Heska Corp.(a) | | | 4,673 | | | | 362,905 | |
| Hingham Institution for Savings | | | 1,900 | | | | 351,519 | |
| I3 Verticals, Inc., Class A(a) | | | 20,800 | | | | 502,112 | |
| Inphi Corp.(a) | | | 34,275 | | | | 1,564,997 | |
| Kinsale Capital Group, Inc. | | | 25,050 | | | | 1,818,630 | |
| Knight-Swift Transportation Holdings, Inc. | | | 167,125 | | | | 5,573,619 | |
| LGI Homes, Inc.(a) | | | 16,425 | | | | 1,138,417 | |
| Littelfuse, Inc. | | | 3,100 | | | | 623,255 | |
| Microchip Technology, Inc. | | | 9,650 | | | | 963,939 | |
| Monro, Inc. | | | 16,375 | | | | 1,372,716 | |
| MSC Industrial Direct Co., Inc., Class A | | | 12,525 | | | | 1,047,716 | |
| New Relic, Inc.(a) | | | 13,000 | | | | 1,368,120 | |
| NV5 Global, Inc.(a) | | | 18,175 | | | | 1,151,205 | |
| NVIDIA Corp. | | | 3,025 | | | | 547,525 | |
| Palo Alto Networks, Inc.(a) | | | 2,700 | | | | 671,841 | |
| Paycom Software, Inc.(a) | | | 9,025 | | | | 1,827,833 | |
| Pluralsight, Inc., Class A(a) | | | 52,064 | | | | 1,847,751 | |
| Power Integrations, Inc. | | | 21,615 | | | | 1,708,017 | |
| Qualys, Inc.(a) | | | 17,200 | | | | 1,552,472 | |
| Resources Connection, Inc. | | | 100,975 | | | | 1,621,659 | |
| Seacoast Commerce Banc Holdings | | | 44,700 | | | | 885,507 | |
| Silicon Laboratories, Inc.(a) | | | 10,450 | | | | 1,125,047 | |
| STAAR Surgical Co.(a) | | | 9,979 | | | | 324,118 | |
| SVB Financial Group(a) | | | 10,200 | | | | 2,567,544 | |
| Systemax, Inc. | | | 44,213 | | | | 1,004,077 | |
| Transcat, Inc.(a) | | | 44,927 | | | | 1,035,567 | |
| Veracyte, Inc.(a) | | | 18,597 | | | | 425,313 | |
| See Notes to Financial Statements. | |
| 44 | 1.855.377.7325 | www.GrandeurPeakGlobal.com |
| Grandeur Peak Global Reach Fund | Portfolio of Investments |
| | April 30, 2019 |
| | | Shares | | Value
(Note 2) |
| United States (continued) | | | | | | | | |
| Watsco, Inc. | | | 6,325 | | | $ | 1,002,323 | |
| | | | | | | | 82,477,830 | |
| | | | | | | | | |
| Vietnam (1.81%) | | | | | | | | |
| Lix Detergent JSC | | | 237,170 | | | | 451,170 | |
| Taisun Int'l Holding Corp. | | | 301,400 | | | | 1,248,477 | |
| Vietnam Dairy Products JSC | | | 365,929 | | | | 2,039,617 | |
| Vietnam Technological & Commercial Joint Stock Bank(a) | | | 2,138,281 | | | | 2,217,477 | |
| | | | | | | | 5,956,741 | |
| | | | | | | | | |
| TOTAL COMMON STOCKS | | | | | | | | |
| (Cost $262,491,688) | | | | | | | 324,206,720 | |
| | | | | | | | | |
| PREFERRED STOCKS (0.28%) | | | | | | | | |
| United States (0.28%) | | | | | | | | |
| Dataminr Inc - Private Placement(a)(e) | | | 45,833 | | | | 912,077 | |
| | | | | | | | | |
| TOTAL PREFERRED STOCKS | | | | | | | | |
| (Cost $912,077) | | | | | | | 912,077 | |
| | Principal
Amount | | Value
(Note 2) |
| CORPORATE BONDS (0.31%) | | | | |
| Germany (0.26%) | | | | |
| publity AG | | | | | | | | |
| 3.50%, 11/17/2020 | | $ | 800,000 | | | $ | 866,549 | |
| | | | | | | | | |
| Malaysia (0.05%) | | | | | | | | |
| AEON Credit Service M Bhd | | | | | | | | |
| 3.50%, 09/15/2020 | | | 445,800 | | | | 160,658 | |
| | | | | | | | | |
| TOTAL CORPORATE BONDS | | | | | | | | |
| (Cost $984,704) | | | | | | | 1,027,207 | |
| | | | | | | | | |
| TOTAL INVESTMENTS (99.12%) | | | | | | | | |
| (Cost $264,388,469) | | | | | | $ | 326,146,004 | |
| | | | | | | | | |
| Other Assets In Excess Of Liabilities (0.88%) | | | | | | | 2,903,867 | |
| | | | | | | | | |
| NET ASSETS (100.00%) | | | | | | $ | 329,049,871 | |
| (a) | Non-Income Producing Security. |
| (b) | Security was purchased pursuant to Regulation S under the Securities Act of 1933, which exempts securities offered and sold outside of the United States from registration. Such security cannot be sold in the United States without either an effective registration statement filed pursuant to the Securities Act of 1933, or pursuant to an exemption from registration. The security has been deemed liquid under guidelines approved by the Fund's Board of Trustees. As of April 30, 2019, the aggregate market value of these securities was $29,058,739, representing 8.83% of net assets. |
| (c) | Security exempt from registration under Rule 144A of the Securities Act of 1933. These securities may be resold in the ordinary course of business in transactions exempt from registration, normally to qualified institutional buyers. As of April 30, 2019, these securities had a total aggregate market value of $23,375,416 representing 7.10% of net assets. |
| (e) | As a result of the use of significant unobservable inputs to determine fair value, these investments have been classified as level 3 assets. See also Note 2 to the financial statements for additional information. |
For Fund compliance purposes, the Fund's geographical classifications refer to any one or more of the country sub-classifications used by one or more widely recognized market indexes or ratings group indexes, and/or as defined by Fund management. This definition may not apply forpurposes of this report, which may combine sub-classifications for reporting ease. Geographical regions are shown as a percentage of net assets.
| See Notes to Financial Statements. | |
| Annual Report | April 30, 2019 | 45 |
| Grandeur Peak Global Stalwarts Fund | Portfolio of Investments |
April 30, 2019
| | | Shares | | Value
(Note 2) |
| COMMON STOCKS (97.21%) | | | | | | | | |
| Argentina (0.59%) | | | | | | | | |
| Globant SA(a) | | | 13,925 | | | $ | 1,169,561 | |
| | | | | | | | | |
| Australia (0.49%) | | | | | | | | |
| Domino's Pizza Enterprises, Ltd. | | | 26,300 | | | | 797,228 | |
| Netwealth Group, Ltd. | | | 26,059 | | | | 174,518 | |
| | | | | | | | 971,746 | |
| Bangladesh (0.48%) | | | | | | | | |
| Square Pharmaceuticals, Ltd. | | | 309,463 | | | | 952,617 | |
| | | | | | | | | |
| Belgium (0.87%) | | | | | | | | |
| Melexis NV | | | 21,596 | | | | 1,731,879 | |
| | | | | | | | | |
| Bermuda (0.94%) | | | | | | | | |
| Bank of NT Butterfield & Son, Ltd. | | | 46,660 | | | | 1,867,333 | |
| | | | | | | | | |
| Brazil (1.29%) | | | | | | | | |
| Fleury SA | | | 204,000 | | | | 1,080,064 | |
| Pagseguro Digital, Ltd., Class A(a) | | | 30,225 | | | | 787,663 | |
| Raia Drogasil SA | | | 40,800 | | | | 713,488 | |
| | | | | | | | 2,581,215 | |
| Britain (10.83%) | | | | | | | | |
| Ascential PLC | | | 151,900 | | | | 706,345 | |
| B&M European Value Retail SA | | | 765,900 | | | | 3,940,008 | |
| boohoo Group PLC(a) | | | 497,300 | | | | 1,593,315 | |
| Close Brothers Group PLC | | | 46,755 | | | | 946,232 | |
| Dechra Pharmaceuticals PLC | | | 92,000 | | | | 3,191,152 | |
| Diploma PLC | | | 24,450 | | | | 510,125 | |
| Endava PLC, ADR(a) | | | 20,975 | | | | 693,643 | |
| Intertek Group PLC | | | 18,800 | | | | 1,311,564 | |
| Sanne Group PLC | | | 360,020 | | | | 2,938,860 | |
| Softcat PLC | | | 68,800 | | | | 813,718 | |
| St. James's Place PLC | | | 337,507 | | | | 4,935,828 | |
| | | | | | | | 21,580,790 | |
| Canada (4.52%) | | | | | | | | |
| Gildan Activewear, Inc. | | | 58,867 | | | | 2,170,657 | |
| Lululemon Athletica, Inc.(a) | | | 19,750 | | | | 3,482,913 | |
| Ritchie Bros Auctioneers, Inc. | | | 39,350 | | | | 1,368,987 | |
| Stantec, Inc. | | | 79,292 | | | | 1,985,703 | |
| | | | | | | | 9,008,260 | |
| China (5.40%) | | | | | | | | |
| 51job, Inc., ADR(a) | | | 12,875 | | | | 1,188,878 | |
| 58.com, Inc., ADR(a) | | | 4,050 | | | | 290,749 | |
| China Medical System Holdings, Ltd. | | | 120,000 | | | | 106,312 | |
| CSPC Pharmaceutical Group, Ltd. | | | 577,000 | | | | 1,112,105 | |
| | | Shares | | Value
(Note 2) |
| China (continued) | | | | | | | | |
| Ctrip.com International, Ltd., ADR(a) | | | 26,650 | | | $ | 1,173,932 | |
| Silergy Corp. | | | 165,000 | | | | 2,701,854 | |
| Tencent Holdings, Ltd. | | | 15,100 | | | | 746,839 | |
| WuXi AppTec Co., Ltd., Class H(a)(b)(c) | | | 51,000 | | | | 627,358 | |
| Wuxi Biologics Cayman, Inc.(a)(b)(c) | | | 77,000 | | | | 774,437 | |
| Yum China Holdings, Inc. | | | 43,175 | | | | 2,052,540 | |
| | | | | | | | 10,775,004 | |
| | | | | | | | | |
| Colombia (1.04%) | | | | | | | | |
| Parex Resources, Inc.(a) | | | 122,195 | | | | 2,081,428 | |
| | | | | | | | | |
| Denmark (0.49%) | | | | | | | | |
| Ambu A/S, Class B | | | 34,071 | | | | 977,398 | |
| | | | | | | | | |
| Egypt (0.29%) | | | | | | | | |
| Commercial International | | | | | | | | |
| Bank Egypt SAE | | | 129,577 | | | | 576,342 | |
| | | | | | | | | |
| France (2.87%) | | | | | | | | |
| Alten SA | | | 19,982 | | | | 2,180,670 | |
| BioMerieux | | | 10,475 | | | | 831,225 | |
| Bureau Veritas SA | | | 41,250 | | | | 1,044,687 | |
| Eurofins Scientific SE | | | 3,635 | | | | 1,663,424 | |
| | | | | | | | 5,720,006 | |
| | | | | | | | | |
| Georgia (0.80%) | | | | | | | | |
| Bank of Georgia Group PLC | | | 53,962 | | | | 1,209,600 | |
| Georgia Capital PLC(a) | | | 29,100 | | | | 384,018 | |
| | | | | | | | 1,593,618 | |
| | | | | | | | | |
| Germany (6.65%) | | | | | | | | |
| Dermapharm Holding SE(a) | | | 55,600 | | | | 2,020,496 | |
| FUCHS PETROLUB SE | | | 25,200 | | | | 1,096,091 | |
| Grand City Properties SA | | | 63,100 | | | | 1,483,402 | |
| GRENKE AG | | | 15,400 | | | | 1,634,856 | |
| Norma Group SE | | | 37,490 | | | | 1,771,937 | |
| PATRIZIA Immobilien AG | | | 76,015 | | | | 1,583,250 | |
| Puma SE | | | 1,100 | | | | 680,419 | |
| Wirecard AG | | | 19,850 | | | | 2,976,666 | |
| | | | | | | | 13,247,117 | |
| | | | | | | | | |
| Hong Kong (2.47%) | | | | | | | | |
| Value Partners Group, Ltd. | | | 2,387,900 | | | | 1,795,917 | |
| Vitasoy International Holdings, Ltd. | | | 620,500 | | | | 3,124,331 | |
| | | | | | | | 4,920,248 | |
| | | | | | | | | |
| India (4.16%) | | | | | | | | |
| Bajaj Finance, Ltd. | | | 53,070 | | | | 2,362,232 | |
| HDFC Asset Management Co., Ltd.(b)(c) | | | 53,408 | | | | 1,301,572 | |
| HDFC Bank, Ltd. | | | 24,500 | | | | 816,311 | |
See Notes to Financial Statements.
| 46 | 1.855.377.7325 | www.GrandeurPeakGlobal.com |
| Grandeur Peak Global Stalwarts Fund | Portfolio of Investments |
April 30, 2019
| | | Shares | | Value
(Note 2) |
| India (continued) | | | | | | | | |
| HDFC Life Insurance Co., Ltd.(b)(c) | | | 141,500 | | | $ | 823,016 | |
| L&T Technology Services, Ltd.(b)(c) | | | 30,757 | | | | 768,242 | |
| WNS Holdings, Ltd., ADR(a) | | | 38,825 | | | | 2,218,849 | |
| | | | | | | | 8,290,222 | |
| | | | | | | | | |
| Indonesia (0.41%) | | | | | | | | |
| Bank Central Asia Tbk PT | | | 410,500 | | | | 828,202 | |
| | | | | | | | | |
| Israel (1.08%) | | | | | | | | |
| Wix.com, Ltd.(a) | | | 16,050 | | | | 2,153,268 | |
| | | | | | | | | |
| Italy (4.08%) | | | | | | | | |
| Brembo SpA | | | 170,349 | | | | 2,235,443 | |
| DiaSorin SpA | | | 26,546 | | | | 2,593,316 | |
| FinecoBank Banca Fineco SpA | | | 138,740 | | | | 1,826,094 | |
| Interpump Group SpA | | | 39,292 | | | | 1,475,461 | |
| | | | | | | | 8,130,314 | |
| | | | | | | | | |
| Japan (9.62%) | | | | | | | | |
| Aeon Delight Co., Ltd. | | | 31,600 | | | | 1,062,364 | |
| Cosmos Pharmaceutical Corp. | | | 3,500 | | | | 557,386 | |
| Create SD Holdings Co., Ltd. | | | 53,800 | | | | 1,238,325 | |
| Japan Lifeline Co., Ltd. | | | 148,300 | | | | 2,332,435 | |
| MISUMI Group, Inc. | | | 97,400 | | | | 2,516,425 | |
| MonotaRO Co., Ltd. | | | 31,800 | | | | 731,376 | |
| Nihon M&A Center, Inc. | | | 146,800 | | | | 4,151,174 | |
| Pigeon Corp. | | | 27,200 | | | | 1,151,290 | |
| Seria Co., Ltd. | | | 62,800 | | | | 1,860,407 | |
| Systena Corp. | | | 69,200 | | | | 826,213 | |
| Tokyo Century Corp. | | | 19,000 | | | | 873,289 | |
| Tsuruha Holdings, Inc. | | | 13,800 | | | | 1,173,176 | |
| Unicharm Corp. | | | 21,700 | | | | 710,833 | |
| | | | | | | | 19,184,693 | |
| | | | | | | | | |
| Mexico (0.45%) | | | | | | | | |
| Regional SAB de CV | | | 166,100 | | | | 898,939 | |
| | | | | | | | | |
| Netherlands (1.72%) | | | | | | | | |
| Aalberts NV | | | 87,185 | | | | 3,422,536 | |
| | | | | | | | | |
| Philippines (1.46%) | | | | | | | | |
| Philippine Seven Corp. | | | 259,000 | | | | 571,552 | |
| Puregold Price Club, Inc. | | | 1,189,000 | | | | 955,991 | |
| Robinsons Retail Holdings, Inc. | | | 387,900 | | | | 580,594 | |
| Security Bank Corp. | | | 233,300 | | | | 805,834 | |
| | | | | | | | 2,913,971 | |
| | | | | | | | | |
| Poland (0.76%) | | | | | | | | |
| Dino Polska SA(a)(b)(c) | | | 45,734 | | | | 1,519,899 | |
| | | Shares | | Value
(Note 2) |
| South Korea (0.47%) | | | | | | | | |
| LG Household & Health Care, Ltd. | | | 775 | | | $ | 943,415 | |
| | | | | | | | | |
| Sweden (2.45%) | | | | | | | | |
| AddTech AB, Class B | | | 37,100 | | | | 904,340 | |
| Hexpol AB | | | 79,300 | | | | 617,891 | |
| Indutrade AB | | | 38,483 | | | | 1,174,286 | |
| Nibe Industrier AB, Class B | | | 61,408 | | | | 825,054 | |
| Sweco AB, Class B | | | 53,100 | | | | 1,355,295 | |
| | | | | | | | 4,876,866 | |
| | | | | | | | | |
| Switzerland (0.74%) | | | | | | | | |
| Partners Group Holding AG | | | 1,950 | | | | 1,468,983 | |
| | | | | | | | | |
| United Arab Emirates (0.58%) | | | | | | | | |
| Aramex PJSC | | | 757,000 | | | | 978,928 | |
| Network International Holdings PLC(a)(b)(c) | | | 25,400 | | | | 172,564 | |
| | | | | | | | 1,151,492 | |
| | | | | | | | | |
| United States (27.74%) | | | | | | | | |
| Accenture PLC, Class A | | | 5,400 | | | | 986,418 | |
| Amazon.com, Inc.(a) | | | 425 | | | | 818,771 | |
| Apollo Global Management LLC, Class A | | | 32,100 | | | | 1,049,349 | |
| Axos Financial, Inc.(a) | | | 13,675 | | | | 447,446 | |
| Bank of Hawaii Corp. | | | 7,250 | | | | 597,255 | |
| Burford Capital, Ltd. | | | 57,100 | | | | 1,217,396 | |
| Cactus, Inc., Class A(a) | | | 27,550 | | | | 1,000,065 | |
| Core Laboratories NV | | | 21,175 | | | | 1,342,283 | |
| CoreSite Realty Corp. | | | 8,875 | | | | 971,014 | |
| Edwards Lifesciences Corp.(a) | | | 4,000 | | | | 704,280 | |
| EPAM Systems, Inc.(a) | | | 17,975 | | | | 3,223,996 | |
| ExlService Holdings, Inc.(a) | | | 12,725 | | | | 755,865 | |
| Fastenal Co. | | | 61,075 | | | | 4,308,841 | |
| First Republic Bank | | | 68,750 | | | | 7,261,375 | |
| Genpact, Ltd. | | | 45,002 | | | | 1,633,573 | |
| HealthEquity, Inc.(a) | | | 16,957 | | | | 1,148,837 | |
| Inphi Corp.(a) | | | 28,800 | | | | 1,315,008 | |
| IPG Photonics Corp.(a) | | | 4,925 | | | | 860,545 | |
| Knight-Swift Transportation Holdings, Inc. | | | 166,525 | | | | 5,553,609 | |
| LGI Homes, Inc.(a) | | | 12,500 | | | | 866,375 | |
| Littelfuse, Inc. | | | 3,725 | | | | 748,911 | |
| Microchip Technology, Inc. | | | 23,550 | | | | 2,352,409 | |
| Monro, Inc. | | | 34,000 | | | | 2,850,220 | |
| NVIDIA Corp. | | | 2,475 | | | | 447,975 | |
| Palo Alto Networks, Inc.(a) | | | 3,175 | | | | 790,035 | |
| Paycom Software, Inc.(a) | | | 9,150 | | | | 1,853,149 | |
| Pluralsight, Inc., Class A(a) | | | 35,484 | | | | 1,259,327 | |
| Power Integrations, Inc. | | | 50,525 | | | | 3,992,486 | |
| Qualys, Inc.(a) | | | 13,425 | | | | 1,211,741 | |
| Silicon Laboratories, Inc.(a) | | | 10,750 | | | | 1,157,345 | |
| SVB Financial Group(a) | | | 10,210 | | | | 2,570,061 | |
| | | | | | | | 55,295,960 | |
See Notes to Financial Statements.
| Annual Report | April 30, 2019 | 47 |
| Grandeur Peak Global Stalwarts Fund | Portfolio of Investments |
April 30, 2019
| | | Shares | | Value
(Note 2) |
| Vietnam (1.47%) | | | | |
| Ho Chi Minh City | | | | | | | | |
| Development Joint Stock Commercial Bank | | | 544,106 | | | $ | 656,549 | |
| Vietnam Dairy Products JSC | | | 255,454 | | | | 1,423,851 | |
| Vietnam Technological &Commercial Joint Stock Bank(a) | | | 817,275 | | | | 847,544 | |
| | | | | | | | 2,927,944 | |
| | | | | | | | | |
TOTAL COMMON STOCKS | | | | | | | | |
| (Cost $160,364,732) | | | | | | | 193,761,266 | |
| | | | | | | | | |
| PREFERRED STOCKS (0.24%) | | | | | | | | |
| United States (0.24%) | | | | | | | | |
| Dataminr Inc - Private Placement(a)(d) | | | 24,262 | | | | 482,814 | |
| | | | | | | | | |
| TOTAL PREFERRED STOCKS | | | | | | | | |
| (Cost $482,814) | | | | | | | 482,814 | |
| | | | | | | | | |
| TOTAL INVESTMENTS (97.45%) |
| (Cost $160,847,546) | | | | | | $ | 194,244,080 | |
| | | | | | | | | |
| Other Assets In Excess Of Liabilities (2.55%) | | 5,090,007 | |
| | | | | | | | | |
| NET ASSETS (100.00%) | | | | | | $ | 199,334,087 | |
| (a) | Non-Income Producing Security. |
| (b) | Security exempt from registration under Rule 144A of the Securities Act of 1933. These securities may be resold in the ordinary course of business in transactions exempt from registration, normally to qualified institutional buyers. As of April 30, 2019, these securities had a total aggregate market value of $5,987,088 representing 3.00% of net assets. |
| (c) | Security was purchased pursuant to Regulation S under the Securities Act of 1933, which exempts securities offered and sold outside of the United States from registration. Such security cannot be sold in the United States without either an effective registration statement filed pursuant to the Securities Act of 1933, or pursuant to an exemption from registration. The security has been deemed liquid under guidelines approved by the Fund's Board of Trustees. As of April 30, 2019, the aggregate market value of these securities was $5,987,088, representing 3.00% of net assets. |
| (d) | As a result of the use of significant unobservable inputs to determine fair value, these investments have been classified as level 3 assets. See also Note 2 to the financial statements for additional information. |
For Fund compliance purposes, the Fund's geographical classifications refer to any one or more of the country sub-classifications used by one or more widely recognized market indexes or ratings group indexes, and/or as defined by Fund management. This definition may not apply for purposes of this report, which may combine sub-classifications for reporting ease. Geographical regions are shown as a percentage of net assets.
See Notes to Financial Statements.
| 48 | 1.855.377.7325 | www.GrandeurPeakGlobal.com |
| Grandeur Peak International Opportunities Fund | Portfolio of Investments |
April 30, 2019
| | | Shares | | Value
(Note 2) |
| COMMON STOCKS (91.59%) | | | | | | | | |
| Argentina (0.68%) | | | | | | | | |
| Globant SA(a) | | | 58,025 | | | $ | 4,873,520 | |
| | | | | | | | | |
| Australia (1.55%) | | | | | | | | |
| Class, Ltd. | | | 1,043,018 | | | | 1,279,380 | |
| Fiducian Group, Ltd. | | | 151,700 | | | | 514,921 | |
| Kogan.com, Ltd. | | | 924,822 | | | | 3,650,939 | |
| National Storage REIT | | | 3,157,557 | | | | 3,984,397 | |
| National Veterinary Care, Ltd. | | | 1,102,500 | | | | 1,562,187 | |
| | | | | | | | 10,991,824 | |
| | | | | | | | | |
| Austria (0.65%) | | | | | | | | |
| Palfinger AG | | | 141,639 | | | | 4,622,895 | |
| | | | | | | | | |
| Bangladesh (0.61%) | | | | | | | | |
| Square Pharmaceuticals, Ltd. | | | 1,406,080 | | | | 4,328,322 | |
| | | | | | | | | |
| Belgium (0.84%) | | | | | | | | |
| Melexis NV | | | 74,368 | | | | 5,963,900 | |
| | | | | | | | | |
| Bermuda (1.11%) | | | | | | | | |
| Bank of NT Butterfield & Son, Ltd. | | | 197,584 | | | | 7,907,312 | |
| | | | | | | | | |
| Brazil (1.11%) | | | | | | | | |
| Arco Platform, Ltd., Class A(a) | | | 28,925 | | | | 929,360 | |
| Fleury SA | | | 820,100 | | | | 4,341,964 | |
| Pagseguro Digital, Ltd., Class A(a) | | | 100,000 | | | | 2,606,000 | |
| | | | | | | | 7,877,324 | |
| | | | | | | | | |
| Britain (14.56%) | | | | | | | | |
| B&M European Value Retail SA | | | 1,969,400 | | | | 10,131,154 | |
| boohoo Group PLC(a) | | | 3,536,000 | | | | 11,329,099 | |
| Clinigen Group PLC | | | 172,673 | | | | 2,241,525 | |
| Close Brothers Group PLC | | | 182,117 | | | | 3,685,702 | |
| CVS Group PLC | | | 667,469 | | | | 5,470,340 | |
| Dechra Pharmaceuticals PLC | | | 276,700 | | | | 9,597,735 | |
| Endava PLC, ADR(a) | | | 107,613 | | | | 3,558,762 | |
| FDM Group Holdings PLC | | | 226,200 | | | | 2,890,658 | |
| First Derivatives PLC | | | 77,400 | | | | 3,199,471 | |
| Impax Asset Management Group PLC | | | 721,427 | | | | 2,196,632 | |
| Intertek Group PLC | | | 47,500 | | | | 3,313,793 | |
| JTC PLC(b)(c) | | | 867,799 | | | | 4,492,495 | |
| K3 Capital Group PLC | | | 220,500 | | | | 424,110 | |
| LoopUp Group PLC(a) | | | 462,200 | | | | 2,079,347 | |
| On the Beach Group PLC(c) | | | 1,020,250 | | | | 6,093,265 | |
| Oxford Immunotec Global PLC(a) | | | 238,465 | | | | 3,870,287 | |
| River & Mercantile Group PLC | | | 625,400 | | | | 2,104,048 | |
| RPS Group PLC | | | 1,003,946 | | | | 2,539,745 | |
| Sabre Insurance Group PLC(b)(c) | | | 881,000 | | | | 3,055,874 | |
| | | Shares | | Value
(Note 2) |
| Britain (continued) | | | | | | | | |
| Sanne Group PLC | | | 898,106 | | | $ | 7,331,282 | |
| Secure Trust Bank PLC | | | 60,200 | | | | 1,177,513 | |
| Softcat PLC | | | 300,000 | | | | 3,548,187 | |
| St. James's Place PLC | | | 475,479 | | | | 6,953,582 | |
| Volution Group PLC | | | 996,500 | | | | 2,248,026 | |
| | | | | | | | 103,532,632 | |
| | | | | | | | | |
| Canada (3.65%) | | | | | | | | |
| Biosyent, Inc.(a) | | | 239,100 | | | | 1,320,699 | |
| Gildan Activewear, Inc. | | | 114,200 | | | | 4,211,002 | |
| Lululemon Athletica, Inc.(a) | | | 39,200 | | | | 6,912,920 | |
| Richelieu Hardware, Ltd. | | | 301,050 | | | | 4,676,309 | |
| Ritchie Bros Auctioneers, Inc. | | | 124,400 | | | | 4,327,876 | |
| Stantec, Inc. | | | 179,810 | | | | 4,502,967 | |
| | | | | | | | 25,951,773 | |
| | | | | | | | | |
| China (4.31%) | | | | | | | | |
| 51job, Inc., ADR(a) | | | 36,050 | | | | 3,328,857 | |
| BBI Life Sciences Corp.(c) | | | 15,551,500 | | | | 4,678,455 | |
| China Medical System Holdings, Ltd. | | | 3,262,000 | | | | 2,889,927 | |
| CSPC Pharmaceutical Group, Ltd. | | | 1,687,000 | | | | 3,251,509 | |
| Man Wah Holdings, Ltd. | | | 6,824,000 | | | | 3,514,297 | |
| O2Micro International, Ltd., ADR(a) | | | 1,054,233 | | | | 1,539,180 | |
| On-Bright Electronics, Inc. | | | 777,780 | | | | 4,505,441 | |
| Silergy Corp. | | | 386,199 | | | | 6,323,960 | |
| WuXi AppTec Co., Ltd., Class H(a)(b)(c) | | | 53,000 | | | | 651,961 | |
| | | | | | | | 30,683,587 | |
| | | | | | | | | |
| Colombia (1.11%) | | | | | | | | |
| Amerisur Resources PLC(a) | | | 4,343,668 | | | | 728,409 | |
| Parex Resources, Inc.(a) | | | 419,301 | | | | 7,142,233 | |
| | | | | | | | 7,870,642 | |
| | | | | | | | | |
| Egypt (0.10%) | | | | | | | | |
| Integrated Diagnostics Holdings PLC(b)(c) | | | 154,200 | | | | 747,870 | |
| | | | | | | | | |
| Finland (0.48%) | | | | | | | | |
| Metso OYJ | | | 91,400 | | | | 3,404,500 | |
| | | | | | | | | |
| France (3.56%) | | | | | | | | |
| Alten SA | | | 53,500 | | | | 5,838,548 | |
| Bureau Veritas SA | | | 208,100 | | | | 5,270,287 | |
| Esker SA | | | 60,443 | | | | 4,996,337 | |
| Eurofins Scientific SE | | | 9,200 | | | | 4,210,040 | |
| Infotel SA | | | 16,113 | | | | 695,785 | |
| Neurones | | | 50,872 | | | | 1,221,042 | |
| Thermador Groupe | | | 54,436 | | | | 3,101,617 | |
| | | | | | | | 25,333,656 | |
See Notes to Financial Statements.
| Annual Report | April 30, 2019 | 49 |
| Grandeur Peak International Opportunities Fund | Portfolio of Investments |
April 30, 2019
| | | Shares | | Value
(Note 2) |
| Georgia (1.21%) | | | | |
| Bank of Georgia Group PLC | | | 144,411 | | | $ | 3,237,085 | |
| Georgia Capital PLC(a) | | | 163,711 | | | | 2,160,411 | |
| TBC Bank Group PLC | | | 150,650 | | | | 3,198,170 | |
| | | | | | | | 8,595,666 | |
| | | | | | | | | |
| Germany (6.99%) | | | | | | | | |
| Aroundtown SA | | | 240,800 | | | | 1,951,608 | |
| CANCOM SE | | | 157,700 | | | | 7,952,363 | |
| Dermapharm Holding SE(a) | | | 201,300 | | | | 7,315,214 | |
| FinTech Group AG(a) | | | 91,000 | | | | 2,148,482 | |
| Grand City Properties SA | | | 203,956 | | | | 4,794,750 | |
| GRENKE AG | | | 28,800 | | | | 3,057,393 | |
| Nexus AG | | | 204,206 | | | | 5,840,458 | |
| Norma Group SE | | | 96,203 | | | | 4,546,963 | |
| PATRIZIA Immobilien AG | | | 247,150 | | | | 5,147,671 | |
| Wirecard AG | | | 46,544 | | | | 6,979,645 | |
| | | | | | | | 49,734,547 | |
| | | | | | | | | |
| Greece (0.12%) | | | | | | | | |
| Sarantis SA | | | 100,600 | | | | 833,836 | |
| | | | | | | | | |
| Hong Kong (2.73%) | | | | | | | | |
| International Housewares Retail Co., Ltd. | | | 2,564,000 | | | | 673,292 | |
| TK Group Holdings, Ltd. | | | 4,923,000 | | | | 3,326,012 | |
| Value Partners Group, Ltd. | | | 10,675,000 | | | | 8,028,567 | |
| Vitasoy International Holdings, Ltd. | | | 1,465,338 | | | | 7,378,244 | |
| | | | | | | | 19,406,115 | |
| | | | | | | | | |
| India (5.39%) | | | | | | | | |
| Bajaj Finance, Ltd. | | | 161,760 | | | | 7,200,199 | |
| Byke Hospitality, Ltd. | | | 941,279 | | | | 393,814 | |
| Central Depository Services India, Ltd.(c) | | | 522,500 | | | | 1,754,469 | |
| Cyient, Ltd. | | | 615,912 | | | | 5,221,023 | |
| Kellton Tech Solutions, Ltd.(a) | | | 527,478 | | | | 328,755 | |
| L&T Technology Services, Ltd.(b)(c) | | | 105,618 | | | | 2,638,106 | |
| Metropolis Healthcare, Ltd.(a)(b)(c) | | | 398,000 | | | | 5,423,781 | |
| TCI Express, Ltd. | | | 217,000 | | | | 2,099,841 | |
| Time Technoplast, Ltd. | | | 2,884,734 | | | | 3,755,551 | |
| WNS Holdings, Ltd., ADR(a) | | | 166,425 | | | | 9,511,189 | |
| | | | | | | | 38,326,728 | |
| | | | | | | | | |
| Indonesia (2.13%) | | | | | | | | |
| Arwana Citramulia Tbk PT | | | 63,783,500 | | | | 2,282,778 | |
| Indonesia Pondasi Raya Tbk PT | | | 19,093,100 | | | | 600,260 | |
| Link Net Tbk PT | | | 8,897,400 | | | | 2,716,048 | |
| Panin Sekuritas Tbk PT | | | 8,494,000 | | | | 846,420 | |
| Selamat Sempurna Tbk PT | | | 63,313,800 | | | | 6,664,611 | |
| | | Shares | | Value
(Note 2) |
| Indonesia (continued) | | | | | | | | |
| Ultrajaya Milk Industry & Trading Co. Tbk PT | | | 22,958,000 | | | $ | 2,062,192 | |
| | | | | | | | 15,172,309 | |
| | | | | | | | | |
| Ireland (1.12%) | | | | | | | | |
| Irish Residential Properties REIT PLC | | | 1,932,976 | | | | 3,425,482 | |
| Keywords Studios PLC | | | 222,800 | | | | 4,523,575 | |
| | | | | | | | 7,949,057 | |
| | | | | | | | | |
| Israel (1.15%) | | | | | | | | |
| Wix.com, Ltd.(a) | | | 61,108 | | | | 8,198,249 | |
| | | | | | | | | |
| Italy (3.31%) | | | | | | | | |
| Brembo SpA | | | 418,082 | | | | 5,486,376 | |
| DiaSorin SpA | | | 50,201 | | | | 4,904,207 | |
| FinecoBank Banca Fineco SpA | | | 407,187 | | | | 5,359,388 | |
| Interpump Group SpA | | | 150,622 | | | | 5,656,035 | |
| Piovan SpA(a)(b)(c) | | | 324,473 | | | | 2,143,542 | |
| | | | | | | | 23,549,548 | |
| | | | | | | | | |
| Japan (13.46%) | | | | | | | | |
| Aeon Delight Co., Ltd. | | | 18,600 | | | | 625,315 | |
| AIT Corp. | | | 500,200 | | | | 4,858,534 | |
| Cosmos Pharmaceutical Corp. | | | 13,400 | | | | 2,133,992 | |
| Create SD Holdings Co., Ltd. | | | 293,800 | | | | 6,762,451 | |
| Future Corp. | | | 362,200 | | | | 6,028,267 | |
| Japan Lifeline Co., Ltd. | | | 556,000 | | | | 8,744,665 | |
| M&A Capital Partners Co., Ltd.(a) | | | 58,800 | | | | 2,494,098 | |
| Macromill, Inc. | | | 164,100 | | | | 1,872,356 | |
| Matsumotokiyoshi Holdings Co., Ltd. | | | 21,000 | | | | 689,035 | |
| MISUMI Group, Inc. | | | 201,400 | | | | 5,203,368 | |
| Naigai Trans Line, Ltd. | | | 72,000 | | | | 859,644 | |
| Nihon M&A Center, Inc. | | | 188,000 | | | | 5,316,217 | |
| Open Door, Inc.(a) | | | 76,000 | | | | 2,179,811 | |
| Seria Co., Ltd. | | | 314,500 | | | | 9,316,845 | |
| SMS Co., Ltd. | | | 226,300 | | | | 4,331,178 | |
| Strike Co., Ltd. | | | 97,200 | | | | 1,757,357 | |
| Sundrug Co., Ltd. | | | 81,200 | | | | 2,169,318 | |
| Synchro Food Co., Ltd.(a) | | | 435,800 | | | | 2,179,098 | |
| Systena Corp. | | | 300,000 | | | | 3,581,848 | |
| Syuppin Co., Ltd. | | | 274,300 | | | | 1,819,720 | |
| Tokyo Century Corp. | | | 230,700 | | | | 10,603,564 | |
| Trancom Co., Ltd. | | | 92,890 | | | | 5,378,522 | |
| Tsuruha Holdings, Inc. | | | 50,500 | | | | 4,293,146 | |
| Yakuodo Co., Ltd. | | | 105,100 | | | | 2,565,348 | |
| | | | | | | | 95,763,697 | |
| | | | | | | | | |
| Malaysia (0.83%) | | | | | | | | |
| AEON Credit Service M Bhd | | | 816,560 | | | | 3,219,235 | |
| My EG Services Bhd | | | 4,672,400 | | | | 1,695,150 | |
See Notes to Financial Statements.
| 50 | 1.855.377.7325 | www.GrandeurPeakGlobal.com |
| Grandeur Peak International Opportunities Fund | Portfolio of Investments |
April 30, 2019
| | | Shares | | Value
(Note 2) |
| Malaysia (continued) | | | | | | | | |
| Scicom MSC Bhd | | | 3,754,500 | | | $ | 980,738 | |
| | | | | | | | 5,895,123 | |
| | | | | | | | | |
| Mexico (0.50%) | | | | | | | | |
| Credito Real SAB de CV SOFOM ER | | | 476,230 | | | | 550,141 | |
| Regional SAB de CV | | | 560,065 | | | | 3,031,091 | |
| | | | | | | | 3,581,232 | |
| | | | | | | | | |
| Netherlands (1.32%) | | | | | | | | |
| Aalberts NV | | | 238,376 | | | | 9,357,693 | |
| | | | | | | | | |
| | | | | | | | | |
| New Zealand (0.00%)(d) | | | | | | | | |
| CBL Corp., Ltd.(a)(e) | | | 1,542,256 | | | | 1 | |
| | | | | | | | | |
| Norway (1.92%) | | | | | | | | |
| Medistim ASA | | | 270,359 | | | | 3,979,808 | |
| Sbanken ASA(b)(c) | | | 982,300 | | | | 9,666,503 | |
| | | | | | | | 13,646,311 | |
| | | | | | | | | |
| Oman (0.32%) | | | | | | | | |
| Tethys Oil AB | | | 274,208 | | | | 2,250,624 | |
| | | | | | | | | |
| Philippines (2.39%) | | | | | | | | |
| Concepcion Industrial Corp. | | | 3,070,600 | | | | 2,651,514 | |
| Holcim Philippines, Inc. | | | 5,918,300 | | | | 1,440,039 | |
| Puregold Price Club, Inc. | | | 5,645,000 | | | | 4,538,748 | |
| Robinsons Retail Holdings, Inc. | | | 1,696,000 | | | | 2,538,508 | |
| Security Bank Corp. | | | 1,695,760 | | | | 5,857,266 | |
| | | | | | | | 17,026,075 | |
| | | | | | | | | |
| Poland (0.64%) | | | | | | | | |
| Dino Polska SA(a)(b)(c) | | | 105,062 | | | | 3,491,573 | |
| LiveChat Software SA | | | 85,000 | | | | 689,529 | |
| PGS Software SA | | | 130,778 | | | | 347,012 | |
| | | | | | | | 4,528,114 | |
| | | | | | | | | |
| Singapore (0.64%) | | | | | | | | |
| Riverstone Holdings, Ltd./Singapore | | | 6,057,000 | | | | 4,586,949 | |
| | | | | | | | | |
| South Africa (0.60%) | | | | | | | | |
| Italtile, Ltd. | | | 4,209,423 | | | | 4,266,804 | |
| | | | | | | | | |
| South Korea (1.05%) | | | | | | | | |
| Hy-Lok Corp. | | | 84,332 | | | | 1,422,198 | |
| ISC Co., Ltd. | | | 55,224 | | | | 546,023 | |
| Koh Young Technology, Inc. | | | 19,883 | | | | 1,644,222 | |
| LEENO Industrial, Inc. | | | 79,500 | | | | 3,892,822 | |
| | | | | | | | 7,505,265 | |
| | | | | | | | | |
| Sweden (2.14%) | | | | | | | | |
| AddTech AB, Class B | | | 220,908 | | | | 5,384,795 | |
| | | Shares | | Value
(Note 2) |
| Sweden (continued) | | | | | | | | |
| Hexpol AB | | | 304,600 | | | $ | 2,373,386 | |
| HIQ International AB | | | 124,653 | | | | 700,891 | |
| Indutrade AB | | | 110,850 | | | | 3,382,523 | |
| KNOW IT AB | | | 96,200 | | | | 2,268,975 | |
| Nibe Industrier AB, Class B | | | 82,700 | | | | 1,111,125 | |
| | | | | | | | 15,221,695 | |
| | | | | | | | | |
| Taiwan (2.80%) | | | | | | | | |
| Bioteque Corp. | | | 908,000 | | | | 3,364,487 | |
| Materials Analysis Technology, Inc. | | | 748,000 | | | | 1,834,840 | |
| Sinmag Equipment Corp. | | | 986,158 | | | | 3,925,356 | |
| Sporton International, Inc. | | | 955,003 | | | | 5,655,660 | |
| Test Research, Inc. | | | 2,238,252 | | | | 3,896,895 | |
| TSC Auto ID Technology Co., Ltd. | | | 138,000 | | | | 1,263,843 | |
| | | | | | | | 19,941,081 | |
| | | | | | | | | |
| Turkey (0.11%) | | | | | | | | |
| DP Eurasia NV(a)(b)(c) | | | 635,340 | | | | 748,950 | |
| | | | | | | | | |
| United Arab Emirates (0.84%) | | | | | | | | |
| Aramex PJSC | | | 4,066,125 | | | | 5,258,183 | |
| Network International Holdings PLC(a)(b)(c) | | | 106,400 | | | | 722,865 | |
| | | | | | | | 5,981,048 | |
| | | | | | | | | |
| United States (2.27%) | | | | | | | | |
| EPAM Systems, Inc.(a) | | | 57,225 | | | | 10,263,876 | |
| Genpact, Ltd. | | | 162,450 | | | | 5,896,935 | |
| | | | | | | | 16,160,811 | |
| | | | | | | | | |
| Vietnam (1.29%) | | | | | | | | |
| Ho Chi Minh City | | | | | | | | |
| Development Joint Stock Commercial Bank | | | 2,161,861 | | | | 2,608,622 | |
| Vietnam Dairy Products JSC | | | 510,986 | | | | 2,848,137 | |
| Vietnam Technological &Commercial Joint Stock Bank(a) | | | 3,570,063 | | | | 3,702,288 | |
| | | | | | | | 9,159,047 | |
| | | | | | | | | |
| TOTAL COMMON STOCKS | | | | | | | | |
| (Cost $512,068,806) | | | | | | | 651,476,332 | |
See Notes to Financial Statements.
| Annual Report | April 30, 2019 | 51 |
| Grandeur Peak International Opportunities Fund | Portfolio of Investments |
April 30, 2019
| | Principal
Amount | | Value
(Note 2) |
| CORPORATE BONDS (0.11%) | | | | | | | | |
| Malaysia (0.11%) | | | | | | | | |
| AEON Credit Service M Bhd 3.50%, 09/15/2020 | | $ | 2,235,120 | | | $ | 805,497 | |
| | | | | | | | | |
| TOTAL CORPORATE BONDS | | | |
| (Cost $530,970) | | | | | | | 805,497 | |
| | | | | | | | | |
| TOTAL INVESTMENTS (91.70%) | | | |
| (Cost $512,599,776) | | | | | | $ | 652,281,829 | |
| | | | | | | | | |
| Other Assets In Excess Of Liabilities (8.30%) | | | 59,029,806 | |
| | | | | | | | | |
| NET ASSETS (100.00%) | | | | | | $ | 711,311,635 | |
| (a) | Non-Income Producing Security. |
| (b) | Security exempt from registration under Rule 144A of the Securities Act of 1933. These securities may be resold in the ordinary course of business in transactions exempt from registration, normally to qualified institutional buyers. As of April 30, 2019, these securities had a total aggregate market value of $33,783,520 representing 4.75% of net assets. |
| (c) | Security was purchased pursuant to Regulation S under the Securities Act of 1933, which exempts securities offered and sold outside of the United States from registration. Such security cannot be sold in the United States without either an effective registration statement filed pursuant to the Securities Act of 1933, or pursuant to an exemption from registration. The security has been deemed liquid under guidelines approved by the Fund's Board of Trustees. As of April 30, 2019, the aggregate market value of these securities was $46,309,709, representing 6.51% of net assets. |
| (e) | As a result of the use of significant unobservable inputs to determine fair value, these investments have been classified as level 3 assets. See also Note 2 to the financial statements for additional information. |
For Fund compliance purposes, the Fund's geographical classifications refer to any one or more of the country sub-classifications used by one or more widely recognized market indexes or ratings group indexes, and/or as defined by Fund management. This definition may not apply for purposes of this report, which may combine sub-classifications for reporting ease. Geographical regions are shown as a percentage of net assets.
See Notes to Financial Statements.
| 52 | 1.855.377.7325 | www.GrandeurPeakGlobal.com |
| Grandeur Peak International Stalwarts Fund | Portfolio of Investments |
April 30, 2019
| | | Shares | | Value
(Note 2) |
| COMMON STOCKS (95.24%) | | | | | | | | |
| Argentina (0.78%) | | | | | | | | |
| Globant SA(a) | | | 58,500 | | | $ | 4,913,415 | |
| | | | | | | | | |
| Australia (0.62%) | | | | | | | | |
| Domino's Pizza Enterprises, Ltd. | | | 103,500 | | | | 3,137,381 | |
| Netwealth Group, Ltd. | | | 118,087 | | | | 790,832 | |
| | | | | | | | 3,928,213 | |
| | | | | | | | | |
| Bangladesh (0.53%) | | | | | | | | |
| Square Pharmaceuticals, Ltd. | | | 1,098,613 | | | | 3,381,849 | |
| | | | | | | | | |
| Belgium (1.11%) | | | | | | | | |
| Melexis NV | | | 87,592 | | | | 7,024,391 | |
| | | | | | | | | |
| Bermuda (1.30%) | | | | | | | | |
| Bank of NT Butterfield & Son, Ltd. | | | 205,032 | | | | 8,205,381 | |
| | | | | | | | | |
| Brazil (1.79%) | | | | | | | | |
| Fleury SA | | | 865,100 | | | | 4,580,214 | |
| Pagseguro Digital, Ltd., Class A(a) | | | 138,300 | | | | 3,604,098 | |
| Raia Drogasil SA | | | 179,800 | | | | 3,144,241 | |
| | | | | | | | 11,328,553 | |
| | | | | | | | | |
| Britain (13.27%) | | | | | | | | |
| Ascential PLC | | | 670,200 | | | | 3,116,476 | |
| B&M European Value Retail SA | | | 2,833,700 | | | | 14,577,359 | |
| boohoo Group PLC(a) | | | 2,123,914 | | | | 6,804,873 | |
| Close Brothers Group PLC | | | 191,888 | | | | 3,883,448 | |
| Dechra Pharmaceuticals PLC | | | 373,000 | | | | 12,938,038 | |
| Diploma PLC | | | 120,740 | | | | 2,519,122 | |
| Endava PLC, ADR(a) | | | 94,395 | | | | 3,121,643 | |
| Intertek Group PLC | | | 84,800 | | | | 5,915,992 | |
| Sanne Group PLC | | | 1,288,100 | | | | 10,514,821 | |
| Softcat PLC | | | 208,800 | | | | 2,469,538 | |
| St. James's Place PLC | | | 1,241,132 | | | | 18,150,777 | |
| | | | | | | | 84,012,087 | |
| | | | | | | | | |
| Canada (6.03%) | | | | | | | | |
| Gildan Activewear, Inc. | | | 245,619 | | | | 9,056,937 | |
| Lululemon Athletica, Inc.(a) | | | 76,675 | | | | 13,521,636 | |
| Ritchie Bros Auctioneers, Inc. | | | 146,675 | | | | 5,102,823 | |
| Stantec, Inc. | | | 420,889 | | | | 10,540,290 | |
| | | | | | | | 38,221,686 | |
| | | | | | | | | |
| China (7.69%) | | | | | | | | |
| 51job, Inc., ADR(a) | | | 57,625 | | | | 5,321,092 | |
| 58.com, Inc., ADR(a) | | | 23,300 | | | | 1,672,707 | |
| Alibaba Group Holding, Ltd., Sponsored ADR(a) | | | 20,525 | | | | 3,808,824 | |
| China Medical System Holdings, Ltd. | | | 513,600 | | | | 455,017 | |
| | | Shares | | Value
(Note 2) |
| China (continued) | | | | | | | | |
| CSPC Pharmaceutical Group, Ltd. | | | 2,457,000 | | | $ | 4,735,601 | |
| Ctrip.com International, Ltd., ADR(a) | | | 108,225 | | | | 4,767,311 | |
| Silergy Corp. | | | 659,200 | | | | 10,794,317 | |
| Tencent Holdings, Ltd. | | | 69,000 | | | | 3,412,707 | |
| WuXi AppTec Co., Ltd., Class H(a)(b)(c) | | | 187,000 | | | | 2,300,314 | |
| Wuxi Biologics Cayman, Inc.(a)(b)(c) | | | 276,000 | | | | 2,775,903 | |
| Yum China Holdings, Inc. | | | 181,875 | | | | 8,646,337 | |
| | | | | | | | 48,690,130 | |
| | | | | | | | | |
| Colombia (1.22%) | | | | | | | | |
| Parex Resources, Inc.(a) | | | 452,419 | | | | 7,706,353 | |
| | | | | | | | | |
| Denmark (0.57%) | | | | | | | | |
| Ambu A/S, Class B | | | 124,836 | | | | 3,581,184 | |
| | | | | | | | | |
| Egypt (0.37%) | | | | | | | | |
| Commercial International Bank Egypt SAE | | | 525,940 | | | | 2,339,315 | |
| | | | | | | | | |
| France (4.01%) | | | | | | | | |
| Alten SA | | | 88,664 | | | | 9,676,056 | |
| BioMerieux | | | 52,750 | | | | 4,185,884 | |
| Bureau Veritas SA | | | 188,650 | | | | 4,777,701 | |
| Eurofins Scientific SE | | | 14,709 | | | | 6,731,030 | |
| | | | | | | | 25,370,671 | |
| | | | | | | | | |
| Georgia (0.94%) | | | | | | | | |
| Bank of Georgia Group PLC | | | 203,000 | | | | 4,550,403 | |
| Georgia Capital PLC(a) | | | 108,500 | | | | 1,431,820 | |
| | | | | | | | 5,982,223 | |
| | | | | | | | | |
| Germany (8.89%) | | | | | | | | |
| Dermapharm Holding SE(a) | | | 220,734 | | | | 8,021,442 | |
| FUCHS PETROLUB SE | | | 95,600 | | | | 4,158,186 | |
| Grand City Properties SA | | | 322,900 | | | | 7,590,975 | |
| GRENKE AG | | | 57,650 | | | | 6,120,095 | |
| Norma Group SE | | | 143,850 | | | | 6,798,962 | |
| PATRIZIA Immobilien AG | | | 377,480 | | | | 7,862,200 | |
| Puma SE | | | 5,200 | | | | 3,216,526 | |
| Wirecard AG | | | 83,750 | | | | 12,558,982 | |
| | | | | | | | 56,327,368 | |
| | | | | | | | | |
| Hong Kong (3.08%) | | | | | | | | |
| Value Partners Group, Ltd. | | | 8,970,000 | | | | 6,746,252 | |
| Vitasoy International Holdings, Ltd. | | | 2,531,000 | | | | 12,744,047 | |
| | | | | | | | 19,490,299 | |
| | | | | | | | | |
| India (5.28%) | | | | | | | | |
| Bajaj Finance, Ltd. | | | 198,430 | | | | 8,832,440 | |
See Notes to Financial Statements.
| Annual Report | April 30, 2019 | 53 |
| Grandeur Peak International Stalwarts Fund | Portfolio of Investments |
April 30, 2019
| | | Shares | | Value
(Note 2) |
| India (continued) | | | | | | | | |
| HDFC Asset Management Co., Ltd.(b)(c) | | | 190,270 | | | $ | 4,636,949 | |
| HDFC Bank, Ltd. | | | 113,500 | | | | 3,781,688 | |
| HDFC Life Insurance Co., Ltd.(b)(c) | | | 603,000 | | | | 3,507,268 | |
| L&T Technology Services, Ltd.(b)(c) | | | 93,098 | | | | 2,325,384 | |
| WNS Holdings, Ltd., ADR(a) | | | 180,920 | | | | 10,339,578 | |
| | | | | | | | 33,423,307 | |
| | | | | | | | | |
| Indonesia (0.58%) | | | | | | | | |
| Bank Central Asia Tbk PT | | | 1,833,000 | | | | 3,698,158 | |
| | | | | | | | | |
| Israel (1.28%) | | | | | | | | |
| Wix.com, Ltd.(a) | | | 60,525 | | | | 8,120,034 | |
| | | | | | | | | |
| Italy (5.16%) | | | | | | | | |
| Brembo SpA | | | 697,857 | | | | 9,157,787 | |
| DiaSorin SpA | | | 106,320 | | | | 10,386,551 | |
| FinecoBank Banca Fineco SpA | | | 555,500 | | | | 7,311,481 | |
| Interpump Group SpA | | | 154,327 | | | | 5,795,162 | |
| | | | | | | | 32,650,981 | |
| | | | | | | | | |
| Japan (12.33%) | | | | | | | | |
| Aeon Delight Co., Ltd. | | | 139,300 | | | | 4,683,141 | |
| Cosmos Pharmaceutical Corp. | | | 14,900 | | | | 2,372,871 | |
| Create SD Holdings Co., Ltd. | | | 207,400 | | | | 4,773,765 | |
| Japan Lifeline Co., Ltd. | | | 611,500 | | | | 9,617,559 | |
| MISUMI Group, Inc. | | | 362,500 | | | | 9,365,546 | |
| MonotaRO Co., Ltd. | | | 149,000 | | | | 3,426,886 | |
| Nihon M&A Center, Inc. | | | 552,700 | | | | 15,629,113 | |
| Pigeon Corp. | | | 115,800 | | | | 4,901,450 | |
| Seria Co., Ltd. | | | 278,500 | | | | 8,250,370 | |
| Systena Corp. | | | 303,200 | | | | 3,620,055 | |
| Tokyo Century Corp. | | | 80,300 | | | | 3,690,794 | |
| Tsuruha Holdings, Inc. | | | 51,100 | | | | 4,344,154 | |
| Unicharm Corp. | | | 104,000 | | | | 3,406,760 | |
| | | | | | | | 78,082,464 | |
| | | | | | | | | |
| Mexico (0.65%) | | | | | | | | |
| Regional SAB de CV | | | 757,150 | | | | 4,097,722 | |
| | | | | | | | | |
| Netherlands (2.14%) | | | | | | | | |
| Aalberts NV | | | 346,058 | | | | 13,584,860 | |
| | | | | | | | | |
| Philippines (1.72%) | | | | | | | | |
| Puregold Price Club, Inc. | | | 5,236,200 | | | | 4,210,060 | |
| Robinsons Retail Holdings, Inc. | | | 2,016,320 | | | | 3,017,951 | |
| Security Bank Corp. | | | 1,062,810 | | | | 3,671,016 | |
| | | | | | | | 10,899,027 | |
| | | | | | | | | |
| Poland (1.03%) | | | | | | | | |
| Dino Polska SA(a)(b)(c) | | | 196,772 | | | | 6,539,414 | |
| | | Shares | | Value
(Note 2) |
| South Korea (0.62%) | | | | | | | | |
| LG Household & Health Care, Ltd. | | | 3,250 | | | $ | 3,956,256 | |
| | | | | | | | | |
| Sweden (3.38%) | | | | | | | | |
| AddTech AB, Class B | | | 173,700 | | | | 4,234,065 | |
| Hexpol AB | | | 344,900 | | | | 2,687,396 | |
| Indutrade AB | | | 182,966 | | | | 5,583,101 | |
| Nibe Industrier AB, Class B | | | 305,300 | | | | 4,101,891 | |
| Sweco AB, Class B | | | 187,700 | | | | 4,790,751 | |
| | | | | | | | 21,397,204 | |
| | | | | | | | | |
| Switzerland (0.93%) | | | | | | | | |
| Partners Group Holding AG | | | 7,790 | | | | 5,868,398 | |
| | | | | | | | | |
| United Arab Emirates (0.69%) | | | | | | | | |
| Aramex PJSC | | | 2,889,000 | | | | 3,735,962 | |
| Network International Holdings PLC(a)(b)(c) | | | 97,400 | | | | 661,721 | |
| | | | | | | | 4,397,683 | |
| | | | | | | | | |
| United States (5.52%) | | | | | | | | |
| Accenture PLC, Class A | | | 30,250 | | | | 5,525,767 | |
| Burford Capital, Ltd. | | | 226,100 | | | | 4,820,547 | |
| Core Laboratories NV | | | 83,625 | | | | 5,300,989 | |
| EPAM Systems, Inc.(a) | | | 70,375 | | | | 12,622,460 | |
| Genpact, Ltd. | | | 184,675 | | | | 6,703,702 | |
| | | | | | | | 34,973,465 | |
| | | | | | | | | |
| Vietnam (1.73%) | | | | | | | | |
| Ho Chi Minh City Development Joint Stock Commercial Bank | | | 1,946,248 | | | | 2,348,452 | |
| Vietnam Dairy Products JSC | | | 962,910 | | | | 5,367,073 | |
| Vietnam Technological & | | | | | | | | |
| Commercial Joint Stock Bank(a) | | | 3,118,067 | | | | 3,233,551 | |
| | | | | | | | 10,949,076 | |
| | | | | | | | | |
| TOTAL COMMON STOCKS | | | |
| (Cost $515,122,863) | | | | | | | 603,141,167 | |
| | | | | | | | | |
| TOTAL INVESTMENTS (95.24%) | | | |
| (Cost $515,122,863) | | | | | | $ | 603,141,167 | |
| | | | | | | | | |
| Other Assets In Excess Of Liabilities (4.76%) | | 30,162,926 | |
| | | | | | | | | |
| NET ASSETS (100.00%) | | | | | | $ | 633,304,093 | |
See Notes to Financial Statements.
| 54 | 1.855.377.7325 | www.GrandeurPeakGlobal.com |
| Grandeur Peak International Stalwarts Fund | Portfolio of Investments |
April 30, 2019
| (a) | Non-Income Producing Security. |
| (b) | Security exempt from registration under Rule 144A of the Securities Act of 1933. These securities may be resold in the ordinary course of business in transactions exempt from registration, normally to qualified institutional buyers. As of April 30, 2019, these securities had a total aggregate market value of $22,746,953 representing 3.59% of net assets. |
| (c) | Security was purchased pursuant to Regulation S under the Securities Act of 1933, which exempts securities offered and sold outside of the United States from registration. Such security cannot be sold in the United States without either an effective registration statement filed pursuant to the Securities Act of 1933, or pursuant to an exemption from registration. The security has been deemed liquid under guidelines approved by the Fund's Board of Trustees. As of April 30, 2019, the aggregate market value of these securities was $22,746,953, representing 3.59% of net assets. |
For Fund compliance purposes, the Fund's geographical classifications refer to any one or more of the country sub-classifications used by one or more widely recognized market indexes or ratings group indexes, and/or as defined by Fund management. This definition may not apply for purposes of this report, which may combine sub-classifications for reporting ease. Geographical regions are shown as a percentage of net assets.
See Notes to Financial Statements.
| Annual Report | April 30, 2019 | 55 |
| Grandeur Peak Funds® | Statements of Assets and Liabilities |
April 30, 2019
| | | Grandeur Peak Emerging Markets Opportunities Fund | | | Grandeur Peak Global Micro Cap Fund | | | Grandeur Peak Global Opportunities Fund | | | Grandeur Peak Global Reach Fund | |
| ASSETS | | | | | | | | | | | | | | | | |
| Investments, at value (Cost - see below) | | $ | 432,666,042 | | | $ | 35,418,039 | | | $ | 633,131,182 | | | $ | 326,146,004 | |
| Cash | | | 33,814,758 | | | | 78,318 | | | | 18,868,980 | | | | 2,636,592 | |
| Foreign cash, at value (Cost $2,045,936, $190,507, $1,285,649 and $579,444, respectively) | | | 2,040,497 | | | | 190,147 | | | | 1,281,872 | | | | 577,450 | |
| Dividends and interest receivable | | | 945,670 | | | | 90,863 | | | | 2,135,310 | | | | 903,876 | |
| Receivable for investments sold | | | – | | | | 10,299 | | | | 135,515 | | | | 12,667 | |
| Receivable for fund shares subscribed | | | 167,165 | | | | 60 | | | | 304,224 | | | | 32,954 | |
| Prepaid and other assets | | | 15,677 | | | | 5,488 | | | | 12,707 | | | | 5,078 | |
| Total assets | | | 469,649,809 | | | | 35,793,214 | | | | 655,869,790 | | | | 330,314,621 | |
| | | | | | | | | | | | | | | | | |
| LIABILITIES | | | | | | | | | | | | | | | | |
| Payable for investments purchased | | | 1,707,758 | | | | – | | | | 283 | | | | 645,731 | |
| Foreign capital gains tax | | | 592,231 | | | | 7,437 | | | | 283,761 | | | | 162,324 | |
| Payable for fund shares redeemed | | | 298,920 | | | | 31,232 | | | | 167,776 | | | | 47,629 | |
| Advisory fees payable | | | 503,940 | | | | 48,532 | | | | 642,463 | | | | 292,015 | |
| Administration fees payable | | | 20,537 | | | | 9,511 | | | | 25,622 | | | | 21,633 | |
| Custodian fees payable | | | 72,809 | | | | 7,769 | | | | 48,378 | | | | 33,587 | |
| Payable for trustee fees and expenses | | | 8,213 | | | | 656 | | | | 11,416 | | | | 5,728 | |
| Payable for chief compliance officer fee | | | 685 | | | | 55 | | | | 952 | | | | 478 | |
| Payable for principal financial officer fees | | | 132 | | | | 11 | | | | 183 | | | | 92 | |
| Distribution and service fees payable | | | 2,860 | | | | – | | | | 26,582 | | | | 11,414 | |
| Payable for transfer agency fees | | | 3,572 | | | | 3,538 | | | | 7,629 | | | | 5,902 | |
| Accrued expenses and other liabilities | | | 39,576 | | | | 29,992 | | | | 47,315 | | | | 38,217 | |
| Total liabilities | | | 3,251,233 | | | | 138,733 | | | | 1,262,360 | | | | 1,264,750 | |
| NET ASSETS | | $ | 466,398,576 | | | $ | 35,654,481 | | | $ | 654,607,430 | | | $ | 329,049,871 | |
| | | | | | | | | | | | | | | | | |
| NET ASSETS CONSISTS OF | | | | | | | | | | | | | | | | |
| Paid-in capital (Note 5) | | $ | 417,590,330 | | | $ | 31,540,862 | | | $ | 485,354,737 | | | $ | 264,837,320 | |
| Total distributable earnings | | | 48,808,246 | | | | 4,113,619 | | | | 169,252,693 | | | | 64,212,551 | |
| NET ASSETS | | $ | 466,398,576 | | | $ | 35,654,481 | | | $ | 654,607,430 | | | $ | 329,049,871 | |
| | | | | | | | | | | | | | | | | |
| INVESTMENTS, AT COST | | $ | 373,728,918 | | | $ | 31,125,631 | | | $ | 482,065,010 | | | $ | 264,388,469 | |
| | | | | | | | | | | | | | | | | |
| PRICING OF SHARES | | | | | | | | | | | | | | | | |
| Investor Class | | | | | | | | | | | | | | | | |
| Net Assets | | $ | 13,869,001 | | | $ | – | | | $ | 130,744,956 | | | $ | 56,306,807 | |
| Net Asset Value, offering and redemption price per share | | $ | 11.82 | | | $ | – | | | $ | 3.48 | | | $ | 14.98 | |
| Shares of beneficial interest outstanding | | | 1,173,481 | | | | – | | | | 37,590,440 | | | | 3,758,159 | |
| Institutional Class | | | | | | | | | | | | | | | | |
| Net Assets | | $ | 452,529,575 | | | $ | 35,654,481 | | | $ | 523,862,474 | | | $ | 272,743,064 | |
| Net Asset Value, offering and redemption price per share | | $ | 11.88 | | | $ | 11.31 | | | $ | 3.52 | | | $ | 15.04 | |
| Shares of beneficial interest outstanding | | | 38,077,874 | | | | 3,152,853 | | | | 148,662,654 | | | | 18,135,764 | |
See Notes to Financial Statements.
| 56 | 1.855.377.7325 | www.GrandeurPeakGlobal.com |
| Grandeur Peak Funds® | Statements of Assets and Liabilities |
April 30, 2019
| | | Grandeur Peak
Global Stalwarts
Fund | | | Grandeur Peak
International
Opportunities Fund | | | Grandeur Peak
International
Stalwarts Fund | |
| ASSETS | | | | | | | | | | | | |
| Investments, at value (Cost - see below) | | $ | 194,244,080 | | | $ | 652,281,829 | | | $ | 603,141,167 | |
| Cash | | | 4,726,149 | | | | 48,457,553 | | | | 27,417,489 | |
| Foreign cash, at value (Cost $309,723, $1,378,676 and $1,354,849, respectively) | | | 307,987 | | | | 1,374,404 | | | | 1,351,844 | |
| Dividends and interest receivable | | | 531,921 | | | | 2,832,005 | | | | 1,970,507 | |
| Receivable for investments sold | | | 508,912 | | | | 10,147,987 | | | | 1,909,010 | |
| Receivable for fund shares subscribed | | | 101,768 | | | | 9,375 | | | | 720,182 | |
| Prepaid and other assets | | | 8,111 | | | | 13,325 | | | | 12,388 | |
| Total assets | | | 200,428,928 | | | | 715,116,478 | | | | 636,522,587 | |
| | | | | | | | | | | | | |
| LIABILITIES | | | | | | | | | | | | |
| Payable for investments purchased | | | 460,308 | | | | 2,723,613 | | | | 1,820,391 | |
| Foreign capital gains tax | | | 193,025 | | | | 147,799 | | | | 728,821 | |
| Payable for fund shares redeemed | | | 225,789 | | | | 93,319 | | | | 123,025 | |
| Advisory fees payable | | | 127,987 | | | | 683,202 | | | | 404,071 | |
| Administration fees payable | | | 10,054 | | | | 27,388 | | | | 20,960 | |
| Custodian fees payable | | | 16,413 | | | | 58,066 | | | | 41,346 | |
| Payable for trustee fees and expenses | | | 3,460 | | | | 11,868 | | | | 10,619 | |
| Payable for chief compliance officer fee | | | 289 | | | | 990 | | | | 886 | |
| Payable for principal financial officer fees | | | 55 | | | | 190 | | | | 170 | |
| Distribution and service fees payable | | | 18,177 | | | | 11,876 | | | | 14,462 | |
| Payable for transfer agency fees | | | 6,723 | | | | 3,987 | | | | 13,174 | |
| Accrued expenses and other liabilities | | | 32,561 | | | | 42,545 | | | | 40,569 | |
| Total liabilities | | | 1,094,841 | | | | 3,804,843 | | | | 3,218,494 | |
| NET ASSETS | | $ | 199,334,087 | | | $ | 711,311,635 | | | $ | 633,304,093 | |
| | | | | | | | | | | | | |
| NET ASSETS CONSISTS OF | | | | | | | | | | | | |
| Paid-in capital (Note 5) | | $ | 164,421,662 | | | $ | 569,217,376 | | | $ | 548,584,520 | |
| Total distributable earnings | | | 34,912,425 | | | | 142,094,259 | | | | 84,719,573 | |
| NET ASSETS | | $ | 199,334,087 | | | $ | 711,311,635 | | | $ | 633,304,093 | |
| | | | | | | | | | | | | |
| INVESTMENTS, AT COST | | $ | 160,847,546 | | | $ | 512,599,776 | | | $ | 515,122,863 | |
| | | | | | | | | | | | | |
| PRICING OF SHARES | | | | | | | | | | | | |
| Investor Class | | | | | | | | | | | | |
| Net Assets | | $ | 90,399,744 | | | $ | 58,070,497 | | | $ | 72,204,474 | |
| Net Asset Value, offering and redemption price per share | | $ | 14.83 | | | $ | 3.34 | | | $ | 14.70 | |
| Shares of beneficial interest outstanding | | | 6,094,046 | | | | 17,403,378 | | | | 4,912,735 | |
| Institutional Class | | | | | | | | | | | | |
| Net Assets | | $ | 108,934,343 | | | $ | 653,241,138 | | | $ | 561,099,619 | |
| Net Asset Value, offering and redemption price per share | | $ | 14.93 | | | $ | 3.36 | | | $ | 14.74 | |
| Shares of beneficial interest outstanding | | | 7,298,185 | | | | 194,644,464 | | | | 38,057,766 | |
See Notes to Financial Statements.
| Annual Report | April 30, 2019 | 57 |
| Grandeur Peak Funds® | Statements of Operations |
For the Year Ended April 30, 2019
| | | Grandeur Peak
Emerging Markets
Opportunities Fund | | | Grandeur Peak
Global Micro Cap
Fund | | | Grandeur Peak
Global Opportunities
Fund | | | Grandeur Peak
Global Reach Fund | |
| INVESTMENT INCOME | | | | | | | | | | | | | | | | |
| Dividends | | $ | 8,595,346 | | | $ | 805,129 | | | $ | 11,166,859 | | | $ | 5,714,418 | |
| Interest | | | 19,325 | | | | 7,144 | | | | 14,347 | | | | 35,990 | |
| Foreign taxes withheld | | | (684,937 | ) | | | (71,659 | ) | | | (978,355 | ) | | | (456,184 | ) |
| Total investment income | | | 7,929,734 | | | | 740,614 | | | | 10,202,851 | | | | 5,294,224 | |
| EXPENSES | | | | | | | | | | | | | | | | |
| Investment advisor fees (Note 6) | | | 5,928,557 | | | | 572,789 | | | | 8,759,144 | | | | 3,726,877 | |
| Recoupment of previously waived fees (Note 6) | | | – | | | | 6,202 | | | | – | | | | – | |
| Administrative fees | | | 165,642 | | | | 40,324 | | | | 249,331 | | | | 149,374 | |
| Distribution and service fees - Investor Class | | | 34,918 | | | | – | | | | 386,938 | | | | 145,036 | |
| Transfer agent fees | | | 37,337 | | | | 37,341 | | | | 70,695 | | | | 56,847 | |
| Professional fees | | | 50,129 | | | | 36,542 | | | | 51,896 | | | | 43,912 | |
| Printing fees | | | 12,630 | | | | 3,035 | | | | 35,973 | | | | 22,911 | |
| Registration fees | | | 35,003 | | | | 19,954 | | | | 34,489 | | | | 33,335 | |
| Custodian fees | | | 457,629 | | | | 61,555 | | | | 321,104 | | | | 239,256 | |
| Trustee fees and expenses | | | 14,688 | | | | 1,253 | | | | 22,654 | | | | 11,114 | |
| Chief compliance officer fees | | | 8,620 | | | | 748 | | | | 13,647 | | | | 6,613 | |
| Principal financial officer fees | | | 1,470 | | | | 128 | | | | 2,328 | | | | 1,128 | |
| Other expenses | | | 14,399 | | | | 9,079 | | | | 20,719 | | | | 13,413 | |
| Total expenses | | | 6,761,022 | | | | 788,950 | | | | 9,968,918 | | | | 4,449,816 | |
| Voluntary waiver of investment advisory fees (Note 6) | | | (58,947 | ) | | | – | | | | (301,097 | ) | | | – | |
| Less fees waived/reimbursed by investment advisor (Note 6) | | | – | | | | (25,568 | ) | | | – | | | | – | |
| Total net expenses | | | 6,702,075 | | | | 763,382 | | | | 9,667,821 | | | | 4,449,816 | |
| NET INVESTMENT INCOME/(LOSS) | | | 1,227,659 | | | | (22,768 | ) | | | 535,030 | | | | 844,408 | |
| REALIZED AND UNREALIZED GAIN/(LOSS) ON INVESTMENTS | | | | | | | | | | | | | | | | |
| Net realized gain/(loss) on investments | | | (8,959,043 | ) | | | 230,840 | | | | 48,783,844 | | | | 20,280,115 | |
| Net realized loss on foreign currency transactions | | | (314,191 | ) | | | (16,939 | ) | | | (291,495 | ) | | | (164,951 | ) |
| Net realized gain/(loss) | | | (9,273,234 | ) | | | 213,901 | | | | 48,492,349 | | | | 20,115,164 | |
| Net change in unrealized depreciation on investments (net of change in foreign capital gains tax of $349,176, $5,190, $190,184 and $112,772, respectively) | | | (30,657,245 | ) | | | (3,433,371 | ) | | | (76,733,246 | ) | | | (30,260,052 | ) |
| Net change in unrealized appreciation/(depreciation) on translation of assets and liabilities in foreign currencies | | | (7,637 | ) | | | 60 | | | | 18,741 | | | | 4,558 | |
| Net change in unrealized depreciation | | | (30,664,882 | ) | | | (3,433,311 | ) | | | (76,714,505 | ) | | | (30,255,494 | ) |
| NET REALIZED AND UNREALIZED LOSS ON INVESTMENTS AND FOREIGN CURRENCY TRANSACTIONS | | | (39,938,116 | ) | | | (3,219,410 | ) | | | (28,222,156 | ) | | | (10,140,330 | ) |
| NET DECREASE IN NET ASSETS RESULTING FROM OPERATIONS | | $ | (38,710,457 | ) | | $ | (3,242,178 | ) | | $ | (27,687,126 | ) | | $ | (9,295,922 | ) |
See Notes to Financial Statements.
| 58 | 1.855.377.7325 | www.GrandeurPeakGlobal.com |
| Grandeur Peak Funds® | Statements of Operations |
For the Year Ended April 30, 2019
| | | Grandeur Peak
Global Stalwarts
Fund | | | Grandeur Peak
International
Opportunities Fund | | | Grandeur Peak
International
Stalwarts Fund | |
| INVESTMENT INCOME | | | | | | | | | | | | |
| Dividends | | $ | 2,624,768 | | | $ | 14,098,956 | | | $ | 8,882,420 | |
| Interest | | | – | | | | 19,105 | | | | – | |
| Foreign taxes withheld | | | (173,193 | ) | | | (1,448,334 | ) | | | (706,748 | ) |
| Total investment income | | | 2,451,575 | | | | 12,669,727 | | | | 8,175,672 | |
| EXPENSES | | | | | | | | | | | | |
| Investment advisor fees (Note 6) | | | 1,500,212 | | | | 9,181,699 | | | | 4,529,100 | |
| Recoupment of previously waived fees (Note 6) | | | 39,413 | | | | – | | | | – | |
| Administrative fees | | | 77,638 | | | | 261,329 | | | | 197,036 | |
| Distribution and service fees - Investor Class | | | 215,742 | | | | 163,226 | | | | 144,710 | |
| Transfer agent fees | | | 62,466 | | | | 46,799 | | | | 109,061 | |
| Professional fees | | | 43,115 | | | | 47,993 | | | | 49,139 | |
| Printing fees | | | 12,413 | | | | 22,916 | | | | 26,845 | |
| Registration fees | | | 33,622 | | | | 34,213 | | | | 43,236 | |
| Custodian fees | | | 124,911 | | | | 409,510 | | | | 299,537 | |
| Trustee fees and expenses | | | 6,469 | | | | 23,346 | | | | 19,782 | |
| Chief compliance officer fees | | | 3,683 | | | | 14,217 | | | | 11,105 | |
| Principal financial officer fees | | | 628 | | | | 2,425 | | | | 1,894 | |
| Other expenses | | | 12,630 | | | | 21,273 | | | | 19,231 | |
| Total expenses | | | 2,132,942 | | | | 10,228,946 | | | | 5,450,676 | |
| Voluntary waiver of investment advisory fees (Note 6) | | | – | | | | (351,804 | ) | | | – | |
| Total net expenses | | | 2,132,942 | | | | 9,877,142 | | | | 5,450,676 | |
| NET INVESTMENT INCOME | | | 318,633 | | | | 2,792,585 | | | | 2,724,996 | |
| REALIZED AND UNREALIZED GAIN/(LOSS) ON INVESTMENTS | | | | | | | | | | | | |
| Net realized gain on investments | | | 4,160,852 | | | | 37,760,441 | | | | 3,930 | |
| Net realized loss on foreign currency transactions | | | (64,070 | ) | | | (441,146 | ) | | | (310,833 | ) |
| Net realized gain/(loss) | | | 4,096,782 | | | | 37,319,295 | | | | (306,903 | ) |
| Net change in unrealized depreciation on investments (net of change in foreign capital gains tax of $172,178, ($28,675) and $664,526, respectively) | | | (1,416,874 | ) | | | (114,486,075 | ) | | | (17,911,852 | ) |
| Net change in unrealized appreciation/(depreciation) on translation of assets and liabilities in foreign currencies | | | (8,176 | ) | | | 24,100 | | | | (24,134 | ) |
| Net change in unrealized depreciation | | | (1,425,050 | ) | | | (114,461,975 | ) | | | (17,935,986 | ) |
| NET REALIZED AND UNREALIZED GAIN/(LOSS) ON INVESTMENTS AND FOREIGN CURRENCY TRANSACTIONS | | | 2,671,732 | | | | (77,142,680 | ) | | | (18,242,889 | ) |
| NET INCREASE/(DECREASE) IN NET ASSETS RESULTING FROM OPERATIONS | | $ | 2,990,365 | | | $ | (74,350,095 | ) | | $ | (15,517,893 | ) |
See Notes to Financial Statements.
| Annual Report | April 30, 2019 | 59 |
| | Statements of |
| Grandeur Peak Emerging Markets Opportunities Fund | Changes in Net Assets |
| | | For the
Year Ended
April 30, 2019 | | | For the
Year Ended
April 30, 2018 | |
| OPERATIONS | | | | | | |
| Net investment income | | $ | 1,227,659 | | | $ | 2,165,202 | |
| Net realized gain/(loss) | | | (9,273,234 | ) | | | 14,017,210 | |
| Net change in unrealized appreciation/(depreciation) | | | (30,664,882 | ) | | | 37,631,237 | |
| Net increase/(decrease) in net assets resulting from operations | | | (38,710,457 | ) | | | 53,813,649 | |
| | | | | | | | | |
| DISTRIBUTIONS TO SHAREHOLDERS (NOTE 3)(a) | | | | | | | | |
| Investor Class | | | (127,582 | ) | | | – | |
| Institutional Class | | | (4,727,858 | ) | | | (518,950 | ) |
| Net decrease in net assets from distributions | | | (4,855,440 | ) | | | (518,950 | ) |
| | | | | | | | | |
| CAPITAL SHARE TRANSACTIONS (NOTE 5) | | | | | | | | |
| Investor Class | | | | | | | | |
| Proceeds from sales of shares | | | 1,059,350 | | | | 775,580 | |
| Distributions reinvested | | | 125,079 | | | | – | |
| Cost of shares redeemed | | | (4,014,777 | ) | | | (2,386,409 | ) |
| Redemption fees | | | 7 | | | | – | |
| Net decrease from capital shares transactions | | | (2,830,341 | ) | | | (1,610,829 | ) |
| | | | | | | | | |
| Institutional Class | | | | | | | | |
| Proceeds from sales of shares | | | 90,993,584 | | | | 49,952,122 | |
| Distributions reinvested | | | 4,442,600 | | | | 468,941 | |
| Cost of shares redeemed | | | (72,570,056 | ) | | | (29,142,671 | ) |
| Redemption fees | | | 668 | | | | 322 | |
| Net increase from capital shares transactions | | | 22,866,796 | | | | 21,278,714 | |
| Net increase/(decrease) in net assets | | | (23,529,442 | ) | | | 72,962,584 | |
| | | | | | | | | |
| NET ASSETS | | | | | | | | |
| Beginning of year | | | 489,928,018 | | | | 416,965,434 | |
| End of year | | $ | 466,398,576 | | | $ | 489,928,018 | (b) |
| | | | | | | | | |
| OTHER INFORMATION | | | | | | | | |
| Shares Transactions | | | | | | | | |
| Investor Class | | | | | | | | |
| Issued | | | 93,074 | | | | 60,550 | |
| Issued to shareholders in reinvestment of distributions | | | 12,299 | | | | – | |
| Redeemed | | | (362,466 | ) | | | (194,865 | ) |
| Net decrease in share transactions | | | (257,093 | ) | | | (134,315 | ) |
| | | | | | | | | |
| Institutional Class | | | | | | | | |
| Issued | | | 8,122,212 | | | | 3,752,939 | |
| Issued to shareholders in reinvestment of distributions | | | 434,697 | | | | 36,017 | |
| Redeemed | | | (6,406,798 | ) | | | (2,258,217 | ) |
| Net increase in share transactions | | | 2,150,111 | | | | 1,530,739 | |
| (a) | For the prior year ended April 30, 2018, Total Distributions consisted of Net Investment Income of $518,950, and Net Realized Gains of $–. |
| (b) | For the prior year ended April 30, 2018, included accumulated net investment income of $309,589. |
See Notes to Financial Statements.
| 60 | 1.855.377.7325 | www.GrandeurPeakGlobal.com |
| | Statements of |
| Grandeur Peak Global Micro Cap Fund | Changes in Net Assets |
| | | For the
Year Ended
April 30, 2019 | | | For the
Year Ended
April 30, 2018 | |
| OPERATIONS | | | | | | |
| Net investment loss | | $ | (22,768 | ) | | $ | (1,052 | ) |
| Net realized gain | | | 213,901 | | | | 4,075,012 | |
| Net change in unrealized appreciation/(depreciation) | | | (3,433,311 | ) | | | 2,334,379 | |
| Net increase/(decrease) in net assets resulting from operations | | | (3,242,178 | ) | | | 6,408,339 | |
| | | | | | | | | |
| DISTRIBUTIONS TO SHAREHOLDERS (NOTE 3)(a) | | | | | | | | |
| Institutional Class | | | (2,218,023 | ) | | | (2,928,849 | ) |
| Net decrease in net assets from distributions | | | (2,218,023 | ) | | | (2,928,849 | ) |
| | | | | | | | | |
| CAPITAL SHARE TRANSACTIONS (NOTE 5) | | | | | | | | |
| Institutional Class | | | | | | | | |
| Proceeds from sales of shares | | | 1,235,898 | | | | 1,986,506 | |
| Distributions reinvested | | | 2,094,860 | | | | 2,815,178 | |
| Cost of shares redeemed | | | (3,925,444 | ) | | | (3,191,486 | ) |
| Redemption fees | | | 18 | | | | 17 | |
| Net increase/(decrease) from capital shares transactions | | | (594,668 | ) | | | 1,610,215 | |
| | | | | | | | | |
| Net increase/(decrease) in net assets | | | (6,054,869 | ) | | | 5,089,705 | |
| | | | | | | | | |
| NET ASSETS | | | | | | | | |
| Beginning of year | | | 41,709,350 | | | | 36,619,645 | |
| End of year | | $ | 35,654,481 | | | $ | 41,709,350 | (b) |
| | | | | | | | | |
| OTHER INFORMATION | | | | | | | | |
| Shares Transactions | | | | | | | | |
| Institutional Class | | | | | | | | |
| Issued | | | 107,279 | | | | 150,447 | |
| Issued to shareholders in reinvestment of distributions | | | 207,617 | | | | 212,948 | |
| Redeemed | | | (341,842 | ) | | | (241,118 | ) |
| Net increase/(decrease) in share transactions | | | (26,946 | ) | | | 122,277 | |
| (a) | For the prior year ended April 30, 2018, Total Distributions consisted of Net Investment Income of $184,962, and Net Realized Gains of $2,743,887. |
| (b) | For the prior year ended April 30, 2018, included accumulated net investment loss of ($128,821). |
See Notes to Financial Statements.
| Annual Report | April 30, 2019 | 61 |
| | Statements of |
| Grandeur Peak Global Opportunities Fund | Changes in Net Assets |
| | | For the
Year Ended
April 30, 2019 | | | For the
Year Ended
April 30, 2018 | |
| OPERATIONS | | | | | | |
| Net investment income | | $ | 535,030 | | | $ | 1,706,038 | |
| Net realized gain | | | 48,492,349 | | | | 65,306,493 | |
| Net change in unrealized appreciation/(depreciation) | | | (76,714,505 | ) | | | 61,142,695 | |
| Net increase/(decrease) in net assets resulting from operations | | | (27,687,126 | ) | | | 128,155,226 | |
| | | | | | | | | |
| DISTRIBUTIONS TO SHAREHOLDERS (NOTE 3)(a) | | | | | | | | |
| Investor Class | | | (13,296,063 | ) | | | (10,280,542 | ) |
| Institutional Class | | | (47,299,225 | ) | | | (32,134,010 | ) |
| Net decrease in net assets from distributions | | | (60,595,288 | ) | | | (42,414,552 | ) |
| | | | | | | | | |
| CAPITAL SHARE TRANSACTIONS (NOTE 5) | | | | | | | | |
| Investor Class | | | | | | | | |
| Proceeds from sales of shares | | | 12,071,234 | | | | 22,888,443 | |
| Distributions reinvested | | | 12,221,920 | | | | 9,719,833 | |
| Cost of shares redeemed | | | (60,190,701 | ) | | | (30,840,920 | ) |
| Redemption fees | | | 1,633 | | | | 1,110 | |
| Net increase/(decrease) from capital shares transactions | | | (35,895,914 | ) | | | 1,768,466 | |
| | | | | | | | | |
| Institutional Class | | | | | | | | |
| Proceeds from sales of shares | | | 44,492,723 | | | | 26,846,472 | |
| Distributions reinvested | | | 44,606,172 | | | | 30,664,935 | |
| Cost of shares redeemed | | | (90,165,710 | ) | | | (64,400,921 | ) |
| Redemption fees | | | 3,396 | | | | 274 | |
| Net decrease from capital shares transactions | | | (1,063,419 | ) | | | (6,889,240 | ) |
| | | | | | | | | |
| Net increase/(decrease) in net assets | | | (125,241,747 | ) | | | 80,619,900 | |
| | | | | | | | | |
| NET ASSETS | | | | | | | | |
| Beginning of year | | | 779,849,177 | | | | 699,229,277 | |
| End of year | | $ | 654,607,430 | | | $ | 779,849,177 | (b) |
| | | | | | | | | |
| OTHER INFORMATION | | | | | | | | |
| Shares Transactions | | | | | | | | |
| Investor Class | | | | | | | | |
| Issued | | | 3,435,546 | | | | 5,933,663 | |
| Issued to shareholders in reinvestment of distributions | | | 4,243,722 | | | | 2,460,717 | |
| Redeemed | | | (17,770,409 | ) | | | (7,896,305 | ) |
| Net increase/(decrease) in share transactions | | | (10,091,141 | ) | | | 498,075 | |
| | | | | | | | | |
| Institutional Class | | | | | | | | |
| Issued | | | 12,712,597 | | | | 6,845,193 | |
| Issued to shareholders in reinvestment of distributions | | | 15,328,581 | | | | 7,666,235 | |
| Redeemed | | | (27,328,207 | ) | | | (16,296,273 | ) |
| Net increase/(decrease) in share transactions | | | 712,971 | | | | (1,784,845 | ) |
| (a) | For the prior year ended April 30, 2018, Total Distributions consisted of Net Investment Income of $676,490, and Net Realized Gains of $41,738,062. |
| (b) | For the prior year ended April 30, 2018, included accumulated net investment income of $607,070. |
See Notes to Financial Statements.
| 62 | 1.855.377.7325 | www.GrandeurPeakGlobal.com |
| | Statements of |
| Grandeur Peak Global Reach Fund | Changes in Net Assets |
| | | For the
Year Ended
April 30, 2019 | | | For the
Year Ended
April 30, 2018 | |
| OPERATIONS | | | | | | |
| Net investment income | | $ | 844,408 | | | $ | 814,714 | |
| Net realized gain | | | 20,115,164 | | | | 23,684,460 | |
| Net change in unrealized appreciation/(depreciation) | | | (30,255,494 | ) | | | 35,204,597 | |
| Net increase/(decrease) in net assets resulting from operations | | | (9,295,922 | ) | | | 59,703,771 | |
| | | | | | | | | |
| DISTRIBUTIONS TO SHAREHOLDERS (NOTE 3)(a) | | | | | | | | |
| Investor Class | | | (5,034,062 | ) | | | (871,964 | ) |
| Institutional Class | | | (24,526,234 | ) | | | (4,329,408 | ) |
| Net decrease in net assets from distributions | | | (29,560,296 | ) | | | (5,201,372 | ) |
| | | | | | | | | |
| CAPITAL SHARE TRANSACTIONS (NOTE 5) | | | | | | | | |
| Investor Class | | | | | | | | |
| Proceeds from sales of shares | | | 6,349,549 | | | | 4,258,731 | |
| Distributions reinvested | | | 4,744,648 | | | | 821,348 | |
| Cost of shares redeemed | | | (13,942,928 | ) | | | (17,054,715 | ) |
| Redemption fees | | | 126 | | | | 51 | |
| Net decrease from capital shares transactions | | | (2,848,605 | ) | | | (11,974,585 | ) |
| | | | | | | | | |
| Institutional Class | | | | | | | | |
| Proceeds from sales of shares | | | 16,753,765 | | | | 18,157,332 | |
| Distributions reinvested | | | 22,514,921 | | | | 4,111,759 | |
| Cost of shares redeemed | | | (36,706,628 | ) | | | (22,861,068 | ) |
| Redemption fees | | | 213 | | | | 167 | |
| Net increase/(decrease) from capital shares transactions | | | 2,562,271 | | | | (591,810 | ) |
| | | | | | | | | |
| Net increase/(decrease) in net assets | | | (39,142,552 | ) | | | 41,936,004 | |
| | | | | | | | | |
| NET ASSETS | | | | | | | | |
| Beginning of year | | | 368,192,423 | | | | 326,256,419 | |
| End of year | | $ | 329,049,871 | | | $ | 368,192,423 | (b) |
| | | | | | | | | |
| OTHER INFORMATION | | | | | | | | |
| Shares Transactions | | | | | | | | |
| Investor Class | | | | | | | | |
| Issued | | | 410,809 | | | | 268,300 | |
| Issued to shareholders in reinvestment of distributions | | | 381,403 | | | | 49,360 | |
| Redeemed | | | (918,342 | ) | | | (1,087,058 | ) |
| Net decrease in share transactions | | | (126,130 | ) | | | (769,398 | ) |
| | | | | | | | | |
| Institutional Class | | | | | | | | |
| Issued | | | 1,076,282 | | | | 1,125,868 | |
| Issued to shareholders in reinvestment of distributions | | | 1,804,077 | | | | 246,656 | |
| Redeemed | | | (2,500,050 | ) | | | (1,399,288 | ) |
| Net increase/(decrease) in share transactions | | | 380,309 | | | | (26,764 | ) |
| (a) | For the prior year ended April 30, 2018, Total Distributions consisted of Net Investment Income of $374,631, and Net Realized Gains of $4,826,741. |
| (b) | For the prior year ended April 30, 2018, included accumulated net investment income of $4,867. |
See Notes to Financial Statements.
| Annual Report | April 30, 2019 | 63 |
| | Statements of |
| Grandeur Peak Global Stalwarts Fund | Changes in Net Assets |
| | | For the
Year Ended
April 30, 2019 | | | For the
Year Ended
April 30, 2018 | |
| OPERATIONS | | | | | | |
| Net investment income | | $ | 318,633 | | | $ | 138,744 | |
| Net realized gain | | | 4,096,782 | | | | 4,911,437 | |
| Net change in unrealized appreciation/(depreciation) | | | (1,425,050 | ) | | | 20,023,502 | |
| Net increase in net assets resulting from operations | | | 2,990,365 | | | | 25,073,683 | |
| | | | | | | | | |
| DISTRIBUTIONS TO SHAREHOLDERS (NOTE 3)(a) | | | | | | | | |
| Investor Class | | | (2,285,402 | ) | | | (1,233,885 | ) |
| Institutional Class | | | (2,952,434 | ) | | | (1,137,784 | ) |
| Net decrease in net assets from distributions | | | (5,237,836 | ) | | | (2,371,669 | ) |
| | | | | | | | | |
| CAPITAL SHARE TRANSACTIONS (NOTE 5) | | | | | | | | |
| Investor Class | | | | | | | | |
| Proceeds from sales of shares | | | 32,838,523 | | | | 30,508,717 | |
| Distributions reinvested | | | 2,227,413 | | | | 1,207,967 | |
| Cost of shares redeemed | | | (36,091,435 | ) | | | (12,629,686 | ) |
| Redemption fees | | | 10,751 | | | | 2,502 | |
| Net increase/(decrease) from capital shares transactions | | | (1,014,748 | ) | | | 19,089,500 | |
| | | | | | | | | |
| Institutional Class | | | | | | | | |
| Proceeds from sales of shares | | | 37,702,923 | | | | 47,116,433 | |
| Distributions reinvested | | | 2,636,334 | | | | 1,036,423 | |
| Cost of shares redeemed | | | (25,830,716 | ) | | | (10,882,140 | ) |
| Redemption fees | | | 3,063 | | | | 295 | |
| Net increase from capital shares transactions | | | 14,511,604 | | | | 37,271,011 | |
| | | | | | | | | |
| Net increase in net assets | | | 11,249,385 | | | | 79,062,525 | |
| | | | | | | | | |
| NET ASSETS | | | | | | | | |
| Beginning of year | | | 188,084,702 | | | | 109,022,177 | |
| End of year | | $ | 199,334,087 | | | $ | 188,084,702 | (b) |
| | | | | | | | | |
| OTHER INFORMATION | | | | | | | | |
| Shares Transactions | | | | | | | | |
| Investor Class | | | | | | | | |
| Issued | | | 2,290,756 | | | | 2,152,925 | |
| Issued to shareholders in reinvestment of distributions | | | 187,493 | | | | 82,511 | |
| Redeemed | | | (2,529,238 | ) | | | (888,539 | ) |
| Net increase/(decrease) in share transactions | | | (50,989 | ) | | | 1,346,897 | |
| | | | | | | | | |
| Institutional Class | | | | | | | | |
| Issued | | | 2,668,874 | | | | 3,250,939 | |
| Issued to shareholders in reinvestment of distributions | | | 220,614 | | | | 70,505 | |
| Redeemed | | | (1,899,776 | ) | | | (749,691 | ) |
| Net increase in share transactions | | | 989,712 | | | | 2,571,753 | |
| (a) | For the prior year ended April 30, 2018, Total Distributions consisted of Net Investment Income of $–, and Net Realized Gains of $2,371,669. |
| (b) | For the prior year ended April 30, 2018, included accumulated net investment income of $56,737. |
See Notes to Financial Statements.
| 64 | 1.855.377.7325 | www.GrandeurPeakGlobal.com |
| | Statements of |
| Grandeur Peak International Opportunities Fund | Changes in Net Assets |
| | | For the
Year Ended
April 30, 2019 | | | For the
Year Ended
April 30, 2018 | |
| OPERATIONS | | | | | | |
| Net investment income | | $ | 2,792,585 | | | $ | 4,535,773 | |
| Net realized gain | | | 37,319,295 | | | | 65,202,002 | |
| Net change in unrealized appreciation/(depreciation) | | | (114,461,975 | ) | | | 81,871,437 | |
| Net increase/(decrease) in net assets resulting from operations | | | (74,350,095 | ) | | | 151,609,212 | |
| | | | | | | | | |
| DISTRIBUTIONS TO SHAREHOLDERS (NOTE 3)(a) | | | | | | | | |
| Investor Class | | | (6,654,430 | ) | | | (2,773,544 | ) |
| Institutional Class | | | (62,445,383 | ) | | | (27,677,996 | ) |
| Net decrease in net assets from distributions | | | (69,099,813 | ) | | | (30,451,540 | ) |
| | | | | | | | | |
| CAPITAL SHARE TRANSACTIONS (NOTE 5) | | | | | | | | |
| Investor Class | | | | | | | | |
| Proceeds from sales of shares | | | 13,888,009 | | | | 9,422,538 | |
| Distributions reinvested | | | 6,248,519 | | | | 2,591,766 | |
| Cost of shares redeemed | | | (27,708,151 | ) | | | (23,474,795 | ) |
| Redemption fees | | | 3,291 | | | | 18 | |
| Net decrease from capital shares transactions | | | (7,568,332 | ) | | | (11,460,473 | ) |
| | | | | | | | | |
| Institutional Class | | | | | | | | |
| Proceeds from sales of shares | | | 98,259,521 | | | | 34,216,073 | |
| Distributions reinvested | | | 56,560,067 | | | | 24,999,053 | |
| Cost of shares redeemed | | | (184,500,982 | ) | | | (53,812,908 | ) |
| Redemption fees | | | 2,687 | | | | 1,808 | |
| Net increase/(decrease) from capital shares transactions | | | (29,678,707 | ) | | | 5,404,026 | |
| | | | | | | | | |
| Net increase/(decrease) in net assets | | | (180,696,947 | ) | | | 115,101,225 | |
| | | | | | | | | |
| NET ASSETS | | | | | | | | |
| Beginning of year | | | 892,008,582 | | | | 776,907,357 | |
| End of year | | $ | 711,311,635 | | | $ | 892,008,582 | (b) |
| | | | | | | | | |
| OTHER INFORMATION | | | | | | | | |
| Shares Transactions | | | | | | | | |
| Investor Class | | | | | | | | |
| Issued | | | 3,846,422 | | | | 2,374,458 | |
| Issued to shareholders in reinvestment of distributions | | | 2,231,614 | | | | 632,138 | |
| Redeemed | | | (7,851,116 | ) | | | (5,887,657 | ) |
| Net decrease in share transactions | | | (1,773,080 | ) | | | (2,881,061 | ) |
| | | | | | | | | |
| Institutional Class | | | | | | | | |
| Issued | | | 29,904,063 | | | | 8,496,775 | |
| Issued to shareholders in reinvestment of distributions | | | 20,056,761 | | | | 6,067,731 | |
| Redeemed | | | (52,526,853 | ) | | | (13,071,539 | ) |
| Net increase/(decrease) in share transactions | | | (2,566,029 | ) | | | 1,492,967 | |
| (a) | For the prior year ended April 30, 2018, Total Distributions consisted of Net Investment Income of $2,499,365, and Net Realized Gains of $27,952,175. |
| (b) | For the prior year ended April 30, 2018, included accumulated net investment income of $1,101,791. |
See Notes to Financial Statements.
| Annual Report | April 30, 2019 | 65 |
| | Statements of |
| Grandeur Peak International Stalwarts Fund | Changes in Net Assets |
| | | For the
Year Ended
April 30, 2019 | | | For the
Year Ended
April 30, 2018 | |
| OPERATIONS | | | | | | |
| Net investment income | | $ | 2,724,996 | | | $ | 2,349,601 | |
| Net realized gain/(loss) | | | (306,903 | ) | | | 13,362,555 | |
| Net change in unrealized appreciation/(depreciation) | | | (17,935,986 | ) | | | 60,834,947 | |
| Net increase/(decrease) in net assets resulting from operations | | | (15,517,893 | ) | | | 76,547,103 | |
| | | | | | | | | |
| DISTRIBUTIONS TO SHAREHOLDERS (NOTE 3)(a) | | | | | | | | |
| Investor Class | | | (1,361,964 | ) | | | (527,381 | ) |
| Institutional Class | | | (12,223,593 | ) | | | (5,642,167 | ) |
| Net decrease in net assets from distributions | | | (13,585,557 | ) | | | (6,169,548 | ) |
| | | | | | | | | |
| CAPITAL SHARE TRANSACTIONS (NOTE 5) | | | | | | | | |
| Investor Class | | | | | | | | |
| Proceeds from sales of shares | | | 35,814,499 | | | | 21,050,455 | |
| Distributions reinvested | | | 1,177,844 | | | | 485,971 | |
| Cost of shares redeemed | | | (15,609,386 | ) | | | (6,873,308 | ) |
| Redemption fees | | | 4,368 | | | | 663 | |
| Net increase from capital shares transactions | | | 21,387,325 | | | | 14,663,781 | |
| | | | | | | | | |
| Institutional Class | | | | | | | | |
| Proceeds from sales of shares | | | 195,348,183 | | | | 225,088,542 | |
| Distributions reinvested | | | 11,176,627 | | | | 5,267,972 | |
| Cost of shares redeemed | | | (114,352,225 | ) | | | (63,009,263 | ) |
| Redemption fees | | | 11,165 | | | | 9,004 | |
| Net increase from capital shares transactions | | | 92,183,750 | | | | 167,356,255 | |
| | | | | | | | | |
| Net increase in net assets | | | 84,467,625 | | | | 252,397,591 | |
| | | | | | | | | |
| NET ASSETS | | | | | | | | |
| Beginning of year | | | 548,836,468 | | | | 296,438,877 | |
| End of year | | $ | 633,304,093 | | | $ | 548,836,468 | (b) |
| | | | | | | | | |
| OTHER INFORMATION | | | | | | | | |
| Shares Transactions | | | | | | | | |
| Investor Class | | | | | | | | |
| Issued | | | 2,579,877 | | | | 1,425,304 | |
| Issued to shareholders in reinvestment of distributions | | | 98,154 | | | | 32,141 | |
| Redeemed | | | (1,144,985 | ) | | | (457,934 | ) |
| Net increase in share transactions | | | 1,533,046 | | | | 999,511 | |
| | | | | | | | | |
| Institutional Class | | | | | | | | |
| Issued | | | 13,577,287 | | | | 15,450,477 | |
| Issued to shareholders in reinvestment of distributions | | | 929,063 | | | | 347,951 | |
| Redeemed | | | (8,335,344 | ) | | | (4,230,944 | ) |
| Net increase in share transactions | | | 6,171,006 | | | | 11,567,484 | |
| (a) | For the prior year ended April 30, 2018, Total Distributions consisted of Net Investment Income of $604,680, and Net Realized Gains of $5,564,868. |
| (b) | For the prior year ended April 30, 2018, included accumulated net investment income of $1,152,977. |
See Notes to Financial Statements.
| 66 | 1.855.377.7325 | www.GrandeurPeakGlobal.com |
| Grandeur Peak Emerging Markets Opportunities Fund | Financial Highlights |
For a Share Outstanding Throughout the Periods Presented
| Investor Class | | Year Ended
April 30, 2019 | | Year Ended
April 30, 2018 | | Year Ended
April 30, 2017 | | Year Ended
April 30, 2016 | | Year Ended
April 30, 2015 | |
| NET ASSET VALUE, BEGINNING OF PERIOD | | $ | 13.05 | | $ | 11.55 | | $ | 9.82 | | $ | 11.51 | | $ | 10.53 | |
| | | | | | | | | | | | | | | | | |
| INCOME FROM INVESTMENT OPERATIONS | | | | | | | | | | | | | | | | |
| Net investment income(a) | | | 0.01 | | | 0.03 | | | 0.02 | | | 0.07 | | | 0.02 | |
| Net realized and unrealized gain/(loss) on investments | | | (1.13 | ) | | 1.47 | | | 1.75 | | | (1.41 | ) | | 1.22 | |
| Total income/(loss) from investment operations | | | (1.12 | ) | | 1.50 | | | 1.77 | | | (1.34 | ) | | 1.24 | |
| | | | | | | | | | | | | | | | | |
| DISTRIBUTIONS | | | | | | | | | | | | | | | | |
| From net investment income | | | (0.02 | ) | | – | | | (0.04 | ) | | – | | | (0.01 | ) |
| From net realized gain on investments | | | (0.09 | ) | | – | | | – | | | (0.35 | ) | | (0.25 | ) |
| Total distributions | | | (0.11 | ) | | – | | | (0.04 | ) | | (0.35 | ) | | (0.26 | ) |
| | | | | | | | | | | | | | | | | |
| REDEMPTION FEES ADDED TO PAID-IN CAPITAL | | | 0.00 | (b) | | – | | | 0.00 | (b) | | 0.00 | (b) | | 0.00 | (b) |
| | | | | | | | | | | | | | | | | |
| INCREASE/DECREASE IN NET ASSET VALUE | | | (1.23 | ) | | 1.50 | | | 1.73 | | | (1.69 | ) | | 0.98 | |
| NET ASSET VALUE, END OF PERIOD | | $ | 11.82 | | $ | 13.05 | | $ | 11.55 | | $ | 9.82 | | $ | 11.51 | |
| | | | | | | | | | | | | | | | | |
| TOTAL RETURN | | | (8.48 | )% | | 12.99 | % | | 18.08 | % | | (11.62 | )% | | 12.06 | % |
| | | | | | | | | | | | | | | | | |
| RATIOS AND SUPPLEMENTAL DATA | | | | | | | | | | | | | | | | |
| Net assets, end of period (in 000s) | | $ | 13,869 | | $ | 18,668 | | $ | 18,074 | | $ | 20,548 | | $ | 39,896 | |
| | | | | | | | | | | | | | | | | |
| RATIOS TO AVERAGE NET ASSETS | | | | | | | | | | | | | | | | |
| Expenses (excluding fees waived/reimbursed by investment advisor) | | | 1.77 | % | | 1.79 | % | | 1.76 | % | | 1.77 | % | | 1.82 | % |
| Expenses (including fees waived/reimbursed by investment advisor) | | | 1.76 | % | | 1.78 | % | | 1.76 | % | | 1.77 | % | | 1.82 | % |
| Net investment income | | | 0.11 | % | | 0.26 | % | | 0.21 | % | | 0.69 | % | | 0.22 | % |
| | | | | | | | | | | | | | | | | |
| PORTFOLIO TURNOVER RATE | | | 34 | % | | 33 | % | | 42 | % | | 40 | % | | 53 | % |
| (a) | Per share numbers have been calculated using the average shares method. |
| (b) | Less than $0.005 or ($0.005) per share. |
See Notes to Financial Statements.
| Annual Report | April 30, 2019 | 67 |
| Grandeur Peak Emerging Markets Opportunities Fund | Financial Highlights |
For a Share Outstanding Throughout the Periods Presented
| Institutional Class | | Year Ended
April 30, 2019 | | Year Ended
April 30, 2018 | | Year Ended
April 30, 2017 | | Year Ended
April 30, 2016 | | Year Ended
April 30, 2015 | |
| NET ASSET VALUE, BEGINNING OF PERIOD | | $ | 13.12 | | $ | 11.60 | | $ | 9.85 | | $ | 11.52 | | $ | 10.54 | |
| | | | | | | | | | | | | | | | | |
| INCOME FROM INVESTMENT OPERATIONS | | | | | | | | | | | | | | | | |
| Net investment income(a) | | | 0.03 | | | 0.06 | | | 0.04 | | | 0.08 | | | 0.05 | |
| Net realized and unrealized gain/(loss) on investments | | | (1.14 | ) | | 1.48 | | | 1.77 | | | (1.40 | ) | | 1.21 | |
| Total income/(loss) from investment operations | | | (1.11 | ) | | 1.54 | | | 1.81 | | | (1.32 | ) | | 1.26 | |
| | | | | | | | | | | | | | | | | |
| DISTRIBUTIONS | | | | | | | | | | | | | | | | |
| From net investment income | | | (0.04 | ) | | (0.02 | ) | | (0.06 | ) | | – | | | (0.03 | ) |
| From net realized gain on investments | | | (0.09 | ) | | – | | | – | | | (0.35 | ) | | (0.25 | ) |
| Total distributions | | | (0.13 | ) | | (0.02 | ) | | (0.06 | ) | | (0.35 | ) | | (0.28 | ) |
| | | | | | | | | | | | | | | | | |
| REDEMPTION FEES ADDED TO PAID-IN CAPITAL | | | 0.00 | (b) | | 0.00 | (b) | | 0.00 | (b) | | 0.00 | (b) | | 0.00 | (b) |
| | | | | | | | | | | | | | | | | |
| INCREASE/DECREASE IN NET ASSET VALUE | | | (1.24 | ) | | 1.52 | | | 1.75 | | | (1.67 | ) | | 0.98 | |
| NET ASSET VALUE, END OF PERIOD | | $ | 11.88 | | $ | 13.12 | | $ | 11.60 | | $ | 9.85 | | $ | 11.52 | |
| | | | | | | | | | | | | | | | | |
| TOTAL RETURN | | | (8.32 | )% | | 13.24 | % | | 18.42 | % | | (11.44 | )% | | 12.22 | % |
| | | | | | | | | | | | | | | | | |
| RATIOS AND SUPPLEMENTAL DATA | | | | | | | | | | | | | | | | |
| Net assets, end of period (in 000s) | | $ | 452,530 | | $ | 471,260 | | $ | 398,891 | | $ | 349,493 | | $ | 428,048 | |
| | | | | | | | | | | | | | | | | |
| RATIOS TO AVERAGE NET ASSETS | | | | | | | | | | | | | | | | |
| Expenses (excluding fees waived/reimbursed by investment advisor) | | | 1.53 | % | | 1.55 | % | | 1.55 | % | | 1.55 | % | | 1.58 | % |
| Expenses (including fees waived/reimbursed by investment advisor) | | | 1.52 | % | | 1.54 | % | | 1.55 | % | | 1.55 | % | | 1.58 | % |
| Net investment income | | | 0.29 | % | | 0.49 | % | | 0.35 | % | | 0.75 | % | | 0.43 | % |
| | | | | | | | | | | | | | | | | |
| PORTFOLIO TURNOVER RATE | | | 34 | % | | 33 | % | | 42 | % | | 40 | % | | 53 | % |
| (a) | Per share numbers have been calculated using the average shares method. |
| (b) | Less than $0.005 or ($0.005) per share. |
See Notes to Financial Statements.
| 68 | 1.855.377.7325 | www.GrandeurPeakGlobal.com |
| Grandeur Peak Global Micro Cap Fund | Financial Highlights |
For a Share Outstanding Throughout the Periods Presented
| Institutional Class | | Year Ended
April 30, 2019 | | Year Ended
April 30, 2018 | | Year Ended
April 30, 2017 | | For the Period
October 21, 2015
(Commencement
of Operations) to
April 30, 2016 | |
| NET ASSET VALUE, BEGINNING OF PERIOD | | $ | 13.12 | | $ | 11.98 | | $ | 10.38 | | $ | 10.00 | |
| | | | | | | | | | | | | | |
| INCOME FROM INVESTMENT OPERATIONS | | | | | | | | | | | | | |
| Net investment income/(loss)(a) | | | (0.01 | ) | | (0.00 | )(b) | | 0.01 | | | (0.02 | ) |
| Net realized and unrealized gain/(loss) on investments | | | (1.08 | ) | | 2.12 | | | 1.72 | | | 0.40 | |
| Total income/(loss) from investment operations | | | (1.09 | ) | | 2.12 | | | 1.73 | | | 0.38 | |
| | | | | | | | | | | | | | |
| DISTRIBUTIONS | | | | | | | | | | | | | |
| From net investment income | | | – | | | (0.06 | ) | | (0.02 | ) | | – | |
| From net realized gain on investments | | | (0.72 | ) | | (0.92 | ) | | (0.11 | ) | | – | |
| Total distributions | | | (0.72 | ) | | (0.98 | ) | | (0.13 | ) | | – | |
| | | | | | | | | | | | | | |
| REDEMPTION FEES ADDED TO PAID-IN CAPITAL | | | 0.00 | (b) | | 0.00 | (b) | | 0.00 | (b) | | 0.00 | (b) |
| | | | | | | | | | | | | | |
| INCREASE/DECREASE IN NET ASSET VALUE | | | (1.81 | ) | | 1.14 | | | 1.60 | | | 0.38 | |
| NET ASSET VALUE, END OF PERIOD | | $ | 11.31 | | $ | 13.12 | | $ | 11.98 | | $ | 10.38 | |
| | | | | | | | | | | | | | |
| TOTAL RETURN | | | (7.67 | )% | | 17.68 | % | | 16.81 | % | | 3.80 | %(c) |
| | | | | | | | | | | | | | |
| RATIOS AND SUPPLEMENTAL DATA | | | | | | | | | | | | | |
| Net assets, end of period (in 000s) | | $ | 35,654 | | $ | 41,709 | | $ | 36,620 | | $ | 30,735 | |
| | | | | | | | | | | | | | |
| RATIOS TO AVERAGE NET ASSETS | | | | | | | | | | | | | |
| Expenses (excluding fees waived/ reimbursed by investment advisor) | | | 2.05 | % | | 2.06 | % | | 2.17 | % | | 2.30 | %(d)(e) |
| Expenses (including fees waived/ reimbursed by investment advisor) | | | 2.00 | % | | 2.00 | % | | 2.00 | % | | 2.00 | %(d)(e) |
| Net investment income/(loss) | | | (0.06 | )% | | 0.00 | %(f) | | 0.11 | % | | (0.41 | )%(d) |
| | | | | | | | | | | | | | |
| PORTFOLIO TURNOVER RATE | | | 37 | % | | 46 | % | | 37 | % | | 8 | %(c) |
| (a) | Per share numbers have been calculated using the average shares method. |
| (b) | Less than $0.005 or ($0.005) per share. |
| (e) | Expense ratios during startup periods may not be representative of longer term operating periods. |
| (f) | Less than 0.005% of average net assets. |
See Notes to Financial Statements.
| Annual Report | April 30, 2019 | 69 |
| Grandeur Peak Global Opportunities Fund | Financial Highlights |
For a Share Outstanding Throughout the Periods Presented
| Investor Class | | Year Ended
April 30, 2019 | | Year Ended
April 30, 2018 | | Year Ended
April 30, 2017 | | Year Ended
April 30, 2016 | | Year Ended
April 30, 2015 | |
| NET ASSET VALUE, BEGINNING OF PERIOD | | $ | 3.95 | | $ | 3.52 | | $ | 3.01 | | $ | 3.43 | | $ | 3.31 | |
| | | | | | | | | | | | | | | | | |
| INCOME FROM INVESTMENT OPERATIONS | | | | | | | | | | | | | | | | |
| Net investment income/(loss)(a) | | | (0.00 | )(b) | | 0.00 | (b) | | (0.00 | )(b)(c) | | 0.00 | (b) | | 0.00 | (b) |
| Net realized and unrealized gain/(loss) on investments | | | (0.14 | ) | | 0.65 | | | 0.51 | | | (0.18 | ) | | 0.35 | |
| Total income/(loss) from investment operations | | | (0.14 | ) | | 0.65 | | | 0.51 | | | (0.18 | ) | | 0.35 | |
| | | | | | | | | | | | | | | | | |
| DISTRIBUTIONS | | | | | | | | | | | | | | | | |
| From net investment income | | | (0.00 | )(b) | | – | | | – | | | (0.00 | )(b) | | (0.01 | ) |
| From net realized gain on investments | | | (0.33 | ) | | (0.22 | ) | | (0.00 | )(b) | | (0.24 | ) | | (0.22 | ) |
| Total distributions | | | (0.33 | ) | | (0.22 | ) | | (0.00 | )(b) | | (0.24 | ) | | (0.23 | ) |
| | | | | | | | | | | | | | | | | |
| REDEMPTION FEES ADDED TO PAID-IN CAPITAL | | | 0.00 | (b) | | 0.00 | (b) | | 0.00 | (b) | | 0.00 | (b) | | 0.00 | (b) |
| | | | | | | | | | | | | | | | | |
| INCREASE/DECREASE IN NET ASSET VALUE | | | (0.47 | ) | | 0.43 | | | 0.51 | | | (0.42 | ) | | 0.12 | |
| NET ASSET VALUE, END OF PERIOD | | $ | 3.48 | | $ | 3.95 | | $ | 3.52 | | $ | 3.01 | | $ | 3.43 | |
| | | | | | | | | | | | | | | | | |
| TOTAL RETURN | | | (1.83 | )% | | 18.41 | % | | 17.09 | % | | (5.03 | )% | | 11.09 | % |
| | | | | | | | | | | | | | | | | |
| RATIOS AND SUPPLEMENTAL DATA | | | | | | | | | | | | | | | | |
| Net assets, end of period (in 000s) | | $ | 130,745 | | $ | 188,379 | | $ | 166,284 | | $ | 173,156 | | $ | 201,462 | |
| | | | | | | | | | | | | | | | | |
| RATIOS TO AVERAGE NET ASSETS | | | | | | | | | | | | | | | | |
| Expenses (excluding fees waived/reimbursed by investment advisor) | | | 1.61 | % | | 1.61 | % | | 1.61 | % | | 1.62 | % | | 1.62 | % |
| Expenses (including fees waived/reimbursed by investment advisor) | | | 1.57 | % | | 1.55 | % | | 1.59 | % | | 1.62 | % | | 1.62 | % |
| Net investment income/(loss) | | | (0.12 | )% | | 0.03 | % | | (0.06 | )% | | 0.06 | % | | 0.12 | % |
| | | | | | | | | | | | | | | | | |
| PORTFOLIO TURNOVER RATE | | | 38 | % | | 29 | % | | 30 | % | | 32 | % | | 37 | % |
| (a) | Per share numbers have been calculated using the average shares method. |
| (b) | Less than $0.005 or ($0.005) per share. |
| (c) | The per share amount does not correspond to activity reflected in the Statement of Operations due to class specific expenses during the period. |
See Notes to Financial Statements.
| 70 | 1.855.377.7325 | www.GrandeurPeakGlobal.com |
| Grandeur Peak Global Opportunities Fund | Financial Highlights |
For a Share Outstanding Throughout the Periods Presented
| Institutional Class | | Year Ended
April 30, 2019 | | Year Ended
April 30, 2018 | | Year Ended
April 30, 2017 | | Year Ended
April 30, 2016 | | Year Ended
April 30, 2015 | |
| NET ASSET VALUE, BEGINNING OF PERIOD | | $ | 4.00 | | $ | 3.56 | | $ | 3.03 | | $ | 3.46 | | $ | 3.34 | |
| | | | | | | | | | | | | | | | | |
| INCOME FROM INVESTMENT OPERATIONS | | | | | | | | | | | | | | | | |
| Net investment income(a) | | | 0.00 | (b) | | 0.01 | | | 0.01 | | | 0.01 | | | 0.01 | |
| Net realized and unrealized gain/(loss) on investments | | | (0.14 | ) | | 0.65 | | | 0.52 | | | (0.19 | ) | | 0.34 | |
| Total income/(loss) from investment operations | | | (0.14 | ) | | 0.66 | | | 0.53 | | | (0.18 | ) | | 0.35 | |
| | | | | | | | | | | | | | | | | |
| DISTRIBUTIONS | | | | | | | | | | | | | | | | |
| From net investment income | | | (0.01 | ) | | (0.00 | )(b) | | (0.00 | )(b) | | (0.01 | ) | | (0.01 | ) |
| From net realized gain on investments | | | (0.33 | ) | | (0.22 | ) | | (0.00 | )(b) | | (0.24 | ) | | (0.22 | ) |
| Total distributions | | | (0.34 | ) | | (0.22 | ) | | (0.00 | )(a) | | (0.25 | ) | | (0.23 | ) |
| | | | | | | | | | | | | | | | | |
| REDEMPTION FEES ADDED TO PAID-IN CAPITAL | | | 0.00 | (b) | | 0.00 | (b) | | 0.00 | (b) | | 0.00 | (b) | | 0.00 | (b) |
| | | | | | | | | | | | | | | | | |
| INCREASE/DECREASE IN NET ASSET VALUE | | | (0.48 | ) | | 0.44 | | | 0.53 | | | (0.43 | ) | | 0.12 | |
| NET ASSET VALUE, END OF PERIOD | | $ | 3.52 | | $ | 4.00 | | $ | 3.56 | | $ | 3.03 | | $ | 3.46 | |
| | | | | | | | | | | | | | | | | |
| TOTAL RETURN | | | (1.84 | )% | | 18.62 | % | | 17.81 | % | | (5.12 | )% | | 11.20 | % |
| | | | | | | | | | | | | | | | | |
| RATIOS AND SUPPLEMENTAL DATA | | | | | | | | | | | | | | | | |
| Net assets, end of period (in 000s) | | $ | 523,862 | | $ | 591,470 | | $ | 532,946 | | $ | 452,030 | | $ | 526,394 | |
| | | | | | | | | | | | | | | | | |
| RATIOS TO AVERAGE NET ASSETS | | | | | | | | | | | | | | | | |
| Expenses (excluding fees waived/reimbursed by investment advisor) | | | 1.37 | % | | 1.36 | % | | 1.37 | % | | 1.38 | % | | 1.38 | % |
| Expenses (including fees waived/reimbursed by investment advisor) | | | 1.33 | % | | 1.31 | % | | 1.35 | % | | 1.38 | % | | 1.38 | % |
| Net investment income | | | 0.13 | % | | 0.28 | % | | 0.18 | % | | 0.30 | % | | 0.35 | % |
| | | | | | | | | | | | | | | | | |
| PORTFOLIO TURNOVER RATE | | | 38 | % | | 29 | % | | 30 | % | | 32 | % | | 37 | % |
| (a) | Per share numbers have been calculated using the average shares method. |
| (b) | Less than $0.005 or ($0.005) per share. |
See Notes to Financial Statements.
| Annual Report | April 30, 2019 | 71 |
| Grandeur Peak Global Reach Fund | Financial Highlights |
For a Share Outstanding Throughout the Periods Presented
| Investor Class | | Year Ended
April 30, 2019 | | Year Ended
April 30, 2018 | | Year Ended
April 30, 2017 | | Year Ended
April 30, 2016 | | Year Ended
April 30, 2015 | |
| NET ASSET VALUE, BEGINNING OF PERIOD | | $ | 16.97 | | $ | 14.52 | | $ | 12.31 | | $ | 13.65 | | $ | 12.43 | |
| | | | | | | | | | | | | | | | | |
| INCOME FROM INVESTMENT OPERATIONS | | | | | | | | | | | | | | | | |
| Net investment income(a) | | | 0.01 | | | 0.01 | | | 0.01 | | | 0.01 | | | 0.00 | (b) |
| Net realized and unrealized gain/(loss) on investments | | | (0.58 | ) | | 2.66 | | | 2.22 | | | (0.89 | ) | | 1.37 | |
| Total income/(loss) from investment operations | | | (0.57 | ) | | 2.67 | | | 2.23 | | | (0.88 | ) | | 1.37 | |
| | | | | | | | | | | | | | | | | |
| DISTRIBUTIONS | | | | | | | | | | | | | | | | |
| From net investment income | | | (0.00 | ) | | – | | | (0.02 | ) | | (0.01 | ) | | (0.01 | ) |
| From net realized gain on investments | | | (1.42 | ) | | (0.22 | ) | | – | | | (0.45 | ) | | (0.14 | ) |
| Total distributions | | | (1.42 | ) | | (0.22 | ) | | (0.02 | ) | | (0.46 | ) | | (0.15 | ) |
| | | | | | | | | | | | | | | | | |
| REDEMPTION FEES ADDED TO PAID-IN CAPITAL | | | 0.00 | (b) | | 0.00 | (b) | | 0.00 | (b) | | 0.00 | (b) | | 0.00 | (b) |
| | | | | | | | | | | | | | | | | |
| INCREASE/DECREASE IN NET ASSET VALUE | | | (1.99 | ) | | 2.45 | | | 2.21 | | | (1.34 | ) | | 1.22 | |
| NET ASSET VALUE, END OF PERIOD | | $ | 14.98 | | $ | 16.97 | | $ | 14.52 | | $ | 12.31 | | $ | 13.65 | |
| | | | | | | | | | | | | | | | | |
| TOTAL RETURN | | | (1.61 | )% | | 18.44 | % | | 18.11 | % | | (6.45 | )% | | 11.09 | % |
| | | | | | | | | | | | | | | | | |
| RATIOS AND SUPPLEMENTAL DATA | | | | | | | | | | | | | | | | |
| Net assets, end of period (in 000s) | | $ | 56,307 | | $ | 65,923 | | $ | 67,574 | | $ | 66,984 | | $ | 87,354 | |
| | | | | | | | | | | | | | | | | |
| RATIOS TO AVERAGE NET ASSETS | | | | | | | | | | | | | | | | |
| Expenses (excluding fees waived/reimbursed by investment advisor) | | | 1.52 | % | | 1.52 | % | | 1.52 | % | | 1.60 | % | | 1.60 | % |
| Expenses (including fees waived/reimbursed by investment advisor) | | | 1.52 | % | | 1.52 | % | | 1.52 | % | | 1.60 | % | | 1.60 | % |
| Net investment income | | | 0.05 | % | | 0.06 | % | | 0.07 | % | | 0.10 | % | | 0.03 | % |
| | | | | | | | | | | | | | | | | |
| PORTFOLIO TURNOVER RATE | | | 50 | % | | 43 | % | | 42 | % | | 46 | % | | 46 | % |
| (a) | Per share numbers have been calculated using the average shares method. |
| (b) | Less than $0.005 or ($0.005) per share. |
See Notes to Financial Statements.
| 72 | 1.855.377.7325 | www.GrandeurPeakGlobal.com |
| Grandeur Peak Global Reach Fund | Financial Highlights |
For a Share Outstanding Throughout the Periods Presented
| Institutional Class | | Year Ended
April 30, 2019 | | Year Ended
April 30, 2018 | | Year Ended
April 30, 2017 | | Year Ended
April 30, 2016 | | Year Ended
April 30, 2015 | |
| NET ASSET VALUE, BEGINNING OF PERIOD | | $ | 17.02 | | $ | 14.55 | | $ | 12.33 | | $ | 13.66 | | $ | 12.42 | |
| | | | | | | | | | | | | | | | | |
| INCOME FROM INVESTMENT OPERATIONS | | | | | | | | | | | | | | | | |
| Net investment income(a) | | | 0.05 | | | 0.04 | | | 0.04 | | | 0.04 | | | 0.03 | |
| Net realized and unrealized gain/(loss) on investments | | | (0.58 | ) | | 2.67 | | | 2.22 | | | (0.89 | ) | | 1.37 | |
| Total income/(loss) from investment operations | | | (0.53 | ) | | 2.71 | | | 2.26 | | | (0.85 | ) | | 1.40 | |
| | | | | | | | | | | | | | | | | |
| DISTRIBUTIONS | | | | | | | | | | | | | | | | |
| From net investment income | | | (0.03 | ) | | (0.02 | ) | | (0.04 | ) | | (0.03 | ) | | (0.02 | ) |
| From net realized gain on investments | | | (1.42 | ) | | (0.22 | ) | | – | | | (0.45 | ) | | (0.14 | ) |
| Total distributions | | | (1.45 | ) | | (0.24 | ) | | (0.04 | ) | | (0.48 | ) | | (0.16 | ) |
| | | | | | | | | | | | | | | | | |
| REDEMPTION FEES ADDED TO PAID-IN CAPITAL | | | 0.00 | (b) | | 0.00 | (b) | | 0.00 | (b) | | 0.00 | (b) | | 0.00 | (b) |
| | | | | | | | | | | | | | | | | |
| INCREASE/DECREASE IN NET ASSET VALUE | | | (1.98 | ) | | 2.47 | | | 2.22 | | | (1.33 | ) | | 1.24 | |
| NET ASSET VALUE, END OF PERIOD | | $ | 15.04 | | $ | 17.02 | | $ | 14.55 | | $ | 12.33 | | $ | 13.66 | |
| | | | | | | | | | | | | | | | | |
| TOTAL RETURN | | | (1.33 | )% | | 18.69 | % | | 18.36 | % | | (6.18 | )% | | 11.41 | % |
| | | | | | | | | | | | | | | | | |
| RATIOS AND SUPPLEMENTAL DATA | | | | | | | | | | | | | | | | |
| Net assets, end of period (in 000s) | | $ | 272,743 | | $ | 302,269 | | $ | 258,683 | | $ | 221,759 | | $ | 260,239 | |
| | | | | | | | | | | | | | | | | |
| RATIOS TO AVERAGE NET ASSETS | | | | | | | | | | | | | | | | |
| Expenses (excluding fees waived/reimbursed by investment advisor) | | | 1.27 | % | | 1.28 | % | | 1.29 | % | | 1.35 | % | | 1.35 | % |
| Expenses (including fees waived/reimbursed by investment advisor) | | | 1.27 | % | | 1.28 | % | | 1.29 | % | | 1.35 | % | | 1.35 | % |
| Net investment income | | | 0.29 | % | | 0.27 | % | | 0.28 | % | | 0.34 | % | | 0.23 | % |
| | | | | | | | | | | | | | | | | |
| PORTFOLIO TURNOVER RATE | | | 50 | % | | 43 | % | | 42 | % | | 46 | % | | 46 | % |
| (a) | Per share numbers have been calculated using the average shares method. |
| (b) | Less than $0.005 or ($0.005) per share. |
See Notes to Financial Statements.
| Annual Report | April 30, 2019 | 73 |
| Grandeur Peak Global Stalwarts Fund | Financial Highlights |
For a Share Outstanding Throughout the Periods Presented
| Investor Class | | Year Ended
April 30, 2019 | | Year Ended
April 30, 2018 | | Year Ended
April 30, 2017 | | For the Period
September 2, 2015
(Commencement
of Operations) to
April 30, 2016 | |
| NET ASSET VALUE, BEGINNING OF PERIOD | | $ | 15.06 | | $ | 12.76 | | $ | 10.85 | | $ | 10.00 | |
| | | | | | | | | | | | | | |
| INCOME FROM INVESTMENT OPERATIONS | | | | | | | | | | | | | |
| Net investment income/(loss)(a) | | | 0.01 | | | (0.00 | )(b) | | (0.03 | ) | | 0.00 | (b) |
| Net realized and unrealized gain on investments | | | 0.16 | | | 2.52 | | | 1.95 | | | 0.85 | |
| Total income from investment operations | | | 0.17 | | | 2.52 | | | 1.92 | | | 0.85 | |
| | | | | | | | | | | | | | |
| DISTRIBUTIONS | | | | | | | | | | | | | |
| From net investment income | | | – | | | – | | | (0.01 | ) | | (0.00 | )(b) |
| From net realized gain on investments | | | (0.40 | ) | | (0.22 | ) | | – | | | (0.00 | )(b) |
| Total distributions | | | (0.40 | ) | | (0.22 | ) | | (0.01 | ) | | (0.00 | )(a) |
| | | | | | | | | | | | | | |
| REDEMPTION FEES ADDED TO PAID-IN CAPITAL | | | 0.00 | (b) | | 0.00 | (b) | | 0.00 | (b) | | 0.00 | (b) |
| | | | | | | | | | | | | | |
| INCREASE/DECREASE IN NET ASSET VALUE | | | (0.23 | ) | | 2.30 | | | 1.91 | | | 0.85 | |
| NET ASSET VALUE, END OF PERIOD | | $ | 14.83 | | $ | 15.06 | | $ | 12.76 | | $ | 10.85 | |
| | | | | | | | | | | | | | |
| TOTAL RETURN | | | 1.78 | % | | 19.79 | % | | 17.70 | % | | 8.55 | %(c) |
| | | | | | | | | | | | | | |
| RATIOS AND SUPPLEMENTAL DATA | | | | | | | | | | | | | |
| Net assets, end of period (in 000s) | | $ | 90,400 | | $ | 92,552 | | $ | 61,212 | | $ | 19,131 | |
| | | | | | | | | | | | | | |
| RATIOS TO AVERAGE NET ASSETS | | | | | | | | | | | | | |
| Expenses (excluding fees waived/ reimbursed by investment advisor) | | | 1.27 | % | | 1.35 | % | | 1.41 | % | | 2.06 | %(d)(e) |
| Expenses (including fees waived/ reimbursed by investment advisor) | | | 1.27 | % | | 1.35 | % | | 1.35 | % | | 1.35 | %(d)(e) |
| Net investment income/(loss) | | | 0.05 | % | | (0.03 | )% | | (0.23 | )% | | 0.00 | %(d)(f) |
| | | | | | | | | | | | | | |
| PORTFOLIO TURNOVER RATE | | | 52 | % | | 30 | % | | 32 | % | | 24 | %(c) |
| (a) | Per share numbers have been calculated using the average shares method. |
| (b) | Less than $0.005 or ($0.005) per share. |
| (e) | Expense ratios during startup periods may not be representative of longer term operating periods. |
| (f) | Less than 0.005% of average net assets. |
See Notes to Financial Statements.
| 74 | 1.855.377.7325 | www.GrandeurPeakGlobal.com |
| Grandeur Peak Global Stalwarts Fund | Financial Highlights |
For a Share Outstanding Throughout the Periods Presented
| Institutional Class | | Year Ended
April 30, 2019 | | Year Ended
April 30, 2018 | | Year Ended
April 30, 2017 | | For the Period
September 2, 2015
(Commencement
of Operations) to
April 30, 2016 | |
| NET ASSET VALUE, BEGINNING OF PERIOD | | $ | 15.14 | | $ | 12.79 | | $ | 10.87 | | $ | 10.00 | |
| | | | | | | | | | | | | | |
| INCOME FROM INVESTMENT OPERATIONS | | | | | | | | | | | | | |
| Net investment income(a) | | | 0.04 | | | 0.03 | | | 0.01 | (b) | | 0.02 | |
| Net realized and unrealized gain on investments | | | 0.17 | | | 2.54 | | | 1.93 | | | 0.85 | |
| Total income from investment operations | | | 0.21 | | | 2.57 | | | 1.94 | | | 0.87 | |
| | | | | | | | | | | | | | |
| DISTRIBUTIONS | | | | | | | | | | | | | |
| From net investment income | | | (0.02 | ) | | – | | | (0.02 | ) | | (0.00 | )(c) |
| From net realized gain on investments | | | (0.40 | ) | | (0.22 | ) | | – | | | (0.00 | )(c) |
| Total distributions | | | (0.42 | ) | | (0.22 | ) | | (0.02 | ) | | (0.00 | )(a) |
| | | | | | | | | | | | | | |
| REDEMPTION FEES ADDED TO PAID-IN CAPITAL | | | 0.00 | (c) | | 0.00 | (c) | | 0.00 | (c) | | 0.00 | (c) |
| | | | | | | | | | | | | | |
| INCREASE/DECREASE IN NET ASSET VALUE | | | (0.21 | ) | | 2.35 | | | 1.92 | | | 0.87 | |
| NET ASSET VALUE, END OF PERIOD | | $ | 14.93 | | $ | 15.14 | | $ | 12.79 | | $ | 10.87 | |
| | | | | | | | | | | | | | |
| TOTAL RETURN | | | 2.08 | % | | 20.14 | % | | 17.92 | % | | 8.76 | %(d) |
| | | | | | | | | | | | | | |
| RATIOS AND SUPPLEMENTAL DATA | | | | | | | | | | | | | |
| Net assets, end of period (in 000s) | | $ | 108,934 | | $ | 95,533 | | $ | 47,811 | | $ | 17,562 | |
| | | | | | | | | | | | | | |
| RATIOS TO AVERAGE NET ASSETS | | | | | | | | | | | | | |
| Expenses (excluding fees waived/ reimbursed by investment advisor) | | | 1.02 | % | | 1.10 | % | | 1.17 | % | | 1.86 | %(e)(f) |
| Expenses (including fees waived/ reimbursed by investment advisor) | | | 1.02 | % | | 1.10 | % | | 1.10 | % | | 1.10 | %(e)(f) |
| Net investment income | | | 0.27 | % | | 0.24 | % | | 0.05 | % | | 0.22 | %(e) |
| | | | | | | | | | | | | | |
| PORTFOLIO TURNOVER RATE | | | 52 | % | | 30 | % | | 32 | % | | 24 | %(d) |
| (a) | Per share numbers have been calculated using the average shares method. |
| (b) | The per share amount does not correspond to activity reflected in the Statement of Operations due to class specific expenses during the period. |
| (c) | Less than $0.005 or ($0.005) per share. |
| (f) | Expense ratios during startup periods may not be representative of longer term operating periods. |
See Notes to Financial Statements.
| Annual Report | April 30, 2019 | 75 |
| Grandeur Peak International Opportunities Fund | Financial Highlights |
For a Share Outstanding Throughout the Periods Presented
| Investor Class | | Year Ended
April 30, 2019 | | Year Ended
April 30, 2018 | | Year Ended
April 30, 2017 | | Year Ended
April 30, 2016 | | Year Ended
April 30, 2015 | |
| NET ASSET VALUE, BEGINNING OF PERIOD | | $ | 4.10 | | $ | 3.55 | | $ | 3.09 | | $ | 3.42 | | $ | 3.41 | |
| | | | | | | | | | | | | | | | | |
| INCOME FROM INVESTMENT OPERATIONS | | | | | | | | | | | | | | | | |
| Net investment income(a) | | | 0.00 | (b) | | 0.01 | | | 0.01 | | | 0.01 | | | 0.01 | |
| Net realized and unrealized gain/(loss) on investments | | | (0.38 | ) | | 0.68 | | | 0.52 | | | (0.20 | ) | | 0.21 | |
| Total income/(loss) from investment operations | | | (0.38 | ) | | 0.69 | | | 0.53 | | | (0.19 | ) | | 0.22 | |
| | | | | | | | | | | | | | | | | |
| DISTRIBUTIONS | | | | | | | | | | | | | | | | |
| From net investment income | | | (0.01 | ) | | (0.01 | ) | | (0.02 | ) | | (0.01 | ) | | (0.01 | ) |
| From net realized gain on investments | | | (0.37 | ) | | (0.13 | ) | | (0.05 | ) | | (0.13 | ) | | (0.20 | ) |
| Total distributions | | | (0.38 | ) | | (0.14 | ) | | (0.07 | ) | | (0.14 | ) | | (0.21 | ) |
| | | | | | | | | | | | | | | | | |
| REDEMPTION FEES ADDED TO PAID-IN CAPITAL | | | 0.00 | (b) | | 0.00 | (b) | | 0.00 | (b) | | 0.00 | (b) | | 0.00 | (b) |
| | | | | | | | | | | | | | | | | |
| INCREASE/DECREASE IN NET ASSET VALUE | | | (0.76 | ) | | 0.55 | | | 0.46 | | | (0.33 | ) | | 0.01 | |
| NET ASSET VALUE, END OF PERIOD | | $ | 3.34 | | $ | 4.10 | | $ | 3.55 | | $ | 3.09 | | $ | 3.42 | |
| | | | | | | | | | | | | | | | | |
| TOTAL RETURN | | | (7.40 | )% | | 19.30 | % | | 17.50 | % | | (5.53 | )% | | 7.25 | % |
| | | | | | | | | | | | | | | | | |
| RATIOS AND SUPPLEMENTAL DATA | | | | | | | | | | | | | | | | |
| Net assets, end of period (in 000s) | | $ | 58,070 | | $ | 78,686 | | $ | 78,403 | | $ | 123,922 | | $ | 173,842 | |
| | | | | | | | | | | | | | | | | |
| RATIOS TO AVERAGE NET ASSETS | | | | | | | | | | | | | | | | |
| Expenses (excluding fees waived/reimbursed by investment advisor) | | | 1.62 | % | | 1.61 | % | | 1.61 | % | | 1.62 | % | | 1.62 | % |
| Expenses (including fees waived/reimbursed by investment advisor) | | | 1.57 | % | | 1.55 | % | | 1.58 | % | | 1.62 | % | | 1.62 | % |
| Net investment income | | | 0.11 | % | | 0.31 | % | | 0.16 | % | | 0.45 | % | | 0.37 | % |
| | | | | | | | | | | | | | | | | |
| PORTFOLIO TURNOVER RATE | | | 34 | % | | 26 | % | | 30 | % | | 34 | % | | 36 | % |
| (a) | Per share numbers have been calculated using the average shares method. |
| (b) | Less than $0.005 or ($0.005) per share. |
See Notes to Financial Statements.
| 76 | 1.855.377.7325 | www.GrandeurPeakGlobal.com |
| Grandeur Peak International Opportunities Fund | Financial Highlights |
For a Share Outstanding Throughout the Periods Presented
| Institutional Class | | Year Ended
April 30, 2019 | | Year Ended
April 30, 2018 | | Year Ended
April 30, 2017 | | Year Ended
April 30, 2016 | | Year Ended
April 30, 2015 | |
| NET ASSET VALUE, BEGINNING OF PERIOD | | $ | 4.12 | | $ | 3.57 | | $ | 3.11 | | $ | 3.43 | | $ | 3.42 | |
| | | | | | | | | | | | | | | | | |
| INCOME FROM INVESTMENT OPERATIONS | | | | | | | | | | | | | | | | |
| Net investment income(a) | | | 0.01 | | | 0.02 | | | 0.01 | | | 0.02 | | | 0.02 | |
| Net realized and unrealized gain/(loss) on investments | | | (0.38 | ) | | 0.67 | | | 0.52 | | | (0.20 | ) | | 0.21 | |
| Total income/(loss) from investment operations | | | (0.37 | ) | | 0.69 | | | 0.53 | | | (0.18 | ) | | 0.23 | |
| | | | | | | | | | | | | | | | | |
| DISTRIBUTIONS | | | | | | | | | | | | | | | | |
| From net investment income | | | (0.02 | ) | | (0.01 | ) | | (0.02 | ) | | (0.01 | ) | | (0.02 | ) |
| From net realized gain on investments | | | (0.37 | ) | | (0.13 | ) | | (0.05 | ) | | (0.13 | ) | | (0.20 | ) |
| Total distributions | | | (0.39 | ) | | (0.14 | ) | | (0.07 | ) | | (0.14 | ) | | (0.22 | ) |
| | | | | | | | | | | | | | | | | |
| REDEMPTION FEES ADDED TO PAID-IN CAPITAL | | | 0.00 | (b) | | 0.00 | (b) | | 0.00 | (b) | | 0.00 | (b) | | 0.00 | (b) |
| | | | | | | | | | | | | | | | | |
| INCREASE/DECREASE IN NET ASSET VALUE | | | (0.76 | ) | | 0.55 | | | 0.46 | | | (0.32 | ) | | 0.01 | |
| NET ASSET VALUE, END OF PERIOD | | $ | 3.36 | | $ | 4.12 | | $ | 3.57 | | $ | 3.11 | | $ | 3.43 | |
| | | | | | | | | | | | | | | | | |
| TOTAL RETURN | | | (7.19 | )% | | 19.38 | % | | 17.59 | % | | (5.02 | )% | | 7.41 | % |
| | | | | | | | | | | | | | | | | |
| RATIOS AND SUPPLEMENTAL DATA | | | | | | | | | | | | | | | | |
| Net assets, end of period (in 000s) | | $ | 653,241 | | $ | 813,322 | | $ | 698,504 | | $ | 579,371 | | $ | 682,364 | |
| | | | | | | | | | | | | | | | | |
| RATIOS TO AVERAGE NET ASSETS | | | | | | | | | | | | | | | | |
| Expenses (excluding fees waived/reimbursed by investment advisor) | | | 1.37 | % | | 1.37 | % | | 1.37 | % | | 1.38 | % | | 1.38 | % |
| Expenses (including fees waived/reimbursed by investment advisor) | | | 1.32 | % | | 1.30 | % | | 1.34 | % | | 1.38 | % | | 1.38 | % |
| Net investment income | | | 0.41 | % | | 0.54 | % | | 0.42 | % | | 0.65 | % | | 0.61 | % |
| | | | | | | | | | | | | | | | | |
| PORTFOLIO TURNOVER RATE | | | 34 | % | | 26 | % | | 30 | % | | 34 | % | | 36 | % |
| (a) | Per share numbers have been calculated using the average shares method. |
| (b) | Less than $0.005 or ($0.005) per share. |
See Notes to Financial Statements.
| Annual Report | April 30, 2019 | 77 |
| Grandeur Peak International Stalwarts Fund | Financial Highlights |
For a Share Outstanding Throughout the Periods Presented
| Investor Class | | Year Ended
April 30, 2019 | | Year Ended
April 30, 2018 | | Year Ended
April 30, 2017 | | For the Period
September 2, 2015
(Commencement
of Operations) to
April 30, 2016 | |
| NET ASSET VALUE, BEGINNING OF PERIOD | | $ | 15.53 | | $ | 13.04 | | $ | 11.02 | | $ | 10.00 | |
| | | | | | | | | | | | | | |
| INCOME FROM INVESTMENT OPERATIONS | | | | | | | | | | | | | |
| Net investment income(a) | | | 0.04 | | | 0.05 | | | 0.02 | | | 0.03 | |
| Net realized and unrealized gain/(loss) on investments | | | (0.53 | ) | | 2.62 | | | 2.03 | | | 0.99 | |
| Total income/(loss) from investment operations | | | (0.49 | ) | | 2.67 | | | 2.05 | | | 1.02 | |
| | | | | | | | | | | | | | |
| DISTRIBUTIONS | | | | | | | | | | | | | |
| From net investment income | | | (0.05 | ) | | – | | | (0.03 | ) | | – | |
| From net realized gain on investments | | | (0.29 | ) | | (0.18 | ) | | – | | | – | |
| Total distributions | | | (0.34 | ) | | (0.18 | ) | | (0.03 | ) | | – | |
| | | | | | | | | | | | | | |
| REDEMPTION FEES ADDED TO PAID-IN CAPITAL | | | 0.00 | (b) | | 0.00 | (b) | | 0.00 | (b) | | 0.00 | (b) |
| | | | | | | | | | | | | | |
| INCREASE/DECREASE IN NET ASSET VALUE | | | (0.83 | ) | | 2.49 | | | 2.02 | | | 1.02 | |
| NET ASSET VALUE, END OF PERIOD | | $ | 14.70 | | $ | 15.53 | | $ | 13.04 | | $ | 11.02 | |
| | | | | | | | | | | | | | |
| TOTAL RETURN | | | (2.69 | )% | | 20.50 | % | | 18.68 | % | | 10.20 | %(c) |
| | | | | | | | | | | | | | |
| RATIOS AND SUPPLEMENTAL DATA | | | | | | | | | | | | | |
| Net assets, end of period (in 000s) | | $ | 72,204 | | $ | 52,478 | | $ | 31,045 | | $ | 22,028 | |
| | | | | | | | | | | | | | |
| RATIOS TO AVERAGE NET ASSETS | | | | | | | | | | | | | |
| Expenses (excluding fees waived/ reimbursed by investment advisor) | | | 1.19 | % | | 1.19 | % | | 1.27 | % | | 1.45 | %(d)(e) |
| Expenses (including fees waived/ reimbursed by investment advisor) | | | 1.19 | % | | 1.19 | % | | 1.27 | % | | 1.35 | %(d)(e) |
| Net investment income | | | 0.26 | % | | 0.33 | % | | 0.19 | % | | 0.44 | %(d) |
| | | | | | | | | | | | | | |
| PORTFOLIO TURNOVER RATE | | | 42 | % | | 24 | % | | 37 | % | | 59 | %(c) |
| (a) | Per share numbers have been calculated using the average shares method. |
| (b) | Less than $0.005 or ($0.005) per share. |
| (e) | Expense ratios during startup periods may not be representative of longer term operating periods. |
See Notes to Financial Statements.
| 78 | 1.855.377.7325 | www.GrandeurPeakGlobal.com |
| Grandeur Peak International Stalwarts Fund | Financial Highlights |
For a Share Outstanding Throughout the Periods Presented
| Institutional Class | | Year Ended
April 30, 2019 | | Year Ended
April 30, 2018 | | Year Ended
April 30, 2017 | | For the Period
September 2, 2015
(Commencement
of Operations) to
April 30, 2016 | |
| NET ASSET VALUE, BEGINNING OF PERIOD | | $ | 15.57 | | $ | 13.06 | | $ | 11.03 | | $ | 10.00 | |
| | | | | | | | | | | | | | |
| INCOME FROM INVESTMENT OPERATIONS | | | | | | | | | | | | | |
| Net investment income(a) | | | 0.07 | | | 0.08 | | | 0.04 | | | 0.04 | |
| Net realized and unrealized gain/(loss) on investments | | | (0.54 | ) | | 2.63 | | | 2.04 | | | 0.99 | |
| Total income/(loss) from investment operations | | | (0.47 | ) | | 2.71 | | | 2.08 | | | 1.03 | |
| | | | | | | | | | | | | | |
| DISTRIBUTIONS | | | | | | | | | | | | | |
| From net investment income | | | (0.07 | ) | | (0.02 | ) | | (0.05 | ) | | (0.00 | )(b) |
| From net realized gain on investments | | | (0.29 | ) | | (0.18 | ) | | – | | | – | |
| Total distributions | | | (0.36 | ) | | (0.20 | ) | | (0.05 | ) | | (0.00 | )(b) |
| | | | | | | | | | | | | | |
| REDEMPTION FEES ADDED TO PAID-IN CAPITAL | | | 0.00 | (b) | | 0.00 | (b) | | 0.00 | (b) | | 0.00 | (b) |
| | | | | | | | | | | | | | |
| INCREASE/DECREASE IN NET ASSET VALUE | | | (0.83 | ) | | 2.51 | | | 2.03 | | | 1.03 | |
| NET ASSET VALUE, END OF PERIOD | | $ | 14.74 | | $ | 15.57 | | $ | 13.06 | | $ | 11.03 | |
| | | | | | | | | | | | | | |
| TOTAL RETURN | | | (2.50 | )% | | 20.79 | % | | 18.96 | % | | 10.34 | %(c) |
| | | | | | | | | | | | | | |
| RATIOS AND SUPPLEMENTAL DATA | | | | | | | | | | | | | |
| Net assets, end of period (in 000s) | | $ | 561,100 | | $ | 496,358 | | $ | 265,393 | | $ | 119,070 | |
| | | | | | | | | | | | | | |
| RATIOS TO AVERAGE NET ASSETS | | | | | | | | | | | | | |
| Expenses (excluding fees waived/ reimbursed by investment advisor) | | | 0.94 | % | | 0.94 | % | | 1.02 | % | | 1.20 | %(d)(e) |
| Expenses (including fees waived/ reimbursed by investment advisor) | | | 0.94 | % | | 0.94 | % | | 1.02 | % | | 1.10 | %(d)(e) |
| Net investment income | | | 0.51 | % | | 0.57 | % | | 0.37 | % | | 0.60 | %(d) |
| | | | | | | | | | | | | | |
| PORTFOLIO TURNOVER RATE | | | 42 | % | | 24 | % | | 37 | % | | 59 | %(c) |
| (a) | Per share numbers have been calculated using the average shares method. |
| (b) | Less than $0.005 or ($0.005) per share. |
| (e) | Expense ratios during startup periods may not be representative of longer term operating periods. |
See Notes to Financial Statements.
| Annual Report | April 30, 2019 | 79 |
| Grandeur Peak Funds® | Notes to Financial Statements |
April 30, 2019
Financial Investors Trust (the “Trust”), a Delaware statutory trust, is an open-end management investment company registered under the Investment Company Act of 1940, as amended (“1940 Act”). As of April 30, 2019, the Trust consists of multiple separate portfolios or series. This annual report describes the Grandeur Peak Emerging Markets Opportunities Fund, Grandeur Peak Global Micro Cap Fund, Grandeur Peak Global Opportunities Fund, Grandeur Peak Global Reach Fund, Grandeur Peak Global Stalwarts Fund, Grandeur Peak International Opportunities Fund, and Grandeur Peak International Stalwarts Fund (individually a “Fund” and collectively, the “Funds”). The Funds seek long-term growth of capital. The Funds offer Investor Class (except the Grandeur Peak Global Micro Cap Fund) and Institutional Class shares.
| 2. | SIGNIFICANT ACCOUNTING POLICIES |
The accompanying financial statements were prepared in accordance with accounting principles generally accepted in the United States of America (“U.S. GAAP”). The preparation of financial statements in conformity with U.S. GAAP requires management to make certain estimates and assumptions that affect the reported amounts of assets and liabilities and disclosures of contingent assets and liabilities at the date of the financial statements and the reported amounts of revenue and expenses during the period. Actual results could differ from those estimates. The Funds are considered an investment company for financial reporting purposes under U.S. GAAP and follows the accounting and reporting guidance applicable to investment companies in the Financial Accounting Standards Board Accounting Standards Codification Topic 946. The following is a summary of significant accounting policies consistently followed by the Funds in preparation of their financial statements.
Investment Valuation:The Funds generally value their securities based on market prices determined at the close of regular trading on the New York Stock Exchange (“NYSE”), normally 4:00 p.m. Eastern Time, on each day the NYSE is open for trading.
For equity securities and mutual funds that are traded on an exchange, the market price is usually the closing sale or official closing price on that exchange. In the case of equity securities not traded on an exchange, or if such closing prices are not otherwise available, the securities are valued at the mean of the most recent bid and ask prices on such day. Redeemable securities issued by open-end registered investment companies are valued at the investment company’s applicable net asset value, with the exception of exchange-traded open-end investment companies, which are priced as equity securities.
Equity securities that are primarily traded on foreign securities exchanges are valued at the closing values of such securities on their respective foreign exchanges, except when an event occurs subsequent to the close of the foreign exchange and the close of the NYSE that was likely to have changed such value. In such an event, the fair value of those securities are determined in good faith through consideration of other factors in accordance with procedures established by and under the general supervision of the Board of Trustees (the “Board”). The Funds will use a fair valuation model provided by an independent pricing service, which is intended to reflect fair value when a security’s value or a meaningful portion of each Fund’s portfolio is believed to have been materially affected by a valuation event that has occurred between the close of the exchange or market on which the security is traded and the close of the regular trading day on the NYSE. The Funds’ valuation procedures set forth certain triggers which instruct when to use the fair valuation model.
Corporate Bonds are valued using market models that consider trade data, quotations from dealers and active market makers, relevant yield curve and spread data, creditworthiness, trade data or market information on comparable securities, and other relevant security specific information.
Forward currency exchange contracts have a fair value determined by the prevailing foreign currency exchange daily rates and current foreign currency exchange forward rates. The foreign currency exchange forward rates are calculated using an automated system that estimates rates on the basis of the current day foreign currency exchange rates and forward foreign currency exchange rates supplied by a pricing service.
When such prices or quotations are not available, or when Grandeur Peak Global Advisors, LLC (the “Adviser”) believes that they are unreliable, securities may be priced using fair value procedures approved by the Board.
Fair Value Measurements:The Funds disclose the classification of their fair value measurements following a three-tier hierarchy based on the inputs used to measure fair value. Inputs refer broadly to the assumptions that market participants would use in pricing the asset or liability, including assumptions about risk. Inputs may be observable or unobservable. Observable inputs reflect the assumptions market participants would use in pricing the asset or liability that are developed based on market data obtained from sources independent of the reporting entity. Unobservable inputs reflect the reporting entity’s own assumptions about the assumptions market participants would use in pricing the asset or liability that are developed based on the best information available.
Various inputs are used in determining the value of the Funds’ investments as of the end of the reporting period. When inputs used fall into different levels of the fair value hierarchy, the level in the hierarchy within which the fair value measurement falls is determined based on the
| 80 | 1.855.377.7325 | www.GrandeurPeakGlobal.com |
| Grandeur Peak Funds® | Notes to Financial Statements |
April 30, 2019
lowest level input that is significant to the fair value measurement in its entirety. The designated input levels are not necessarily an indication of the risk or liquidity associated with these investments. These inputs are categorized in the following hierarchy under applicable financial accounting standards:
Level 1 – Unadjusted quoted prices in active markets for identical investments, unrestricted assets or liabilities that the Funds have the ability to access at the measurement date;
Level 2 – Quoted prices which are not active, quoted prices for similar assets or liabilities in active markets or inputs other than quoted prices that are observable (either directly or indirectly) for substantially the full term of the asset or liability; and
Level 3 – Significant unobservable prices or inputs (including the Funds’ own assumptions in determining the fair value of investments) where there is little or no market activity for the asset or liability at the measurement date.
The following is a summary of each Fund’s investments in the fair value hierarchy as of April 30, 2019:
| Investments in Securities at Value | | Level 1 - Quoted and Unadjusted Prices | | | Level 2 - Other Significant Observable Inputs | | | Level 3 - Significant Unobservable Inputs | | | Total | |
| Grandeur Peak Emerging Markets Opportunities Fund | | | | | | | | | | | | | | | | |
| Common Stocks | | | | | | | | | | | | | | | | |
| Malaysia | | $ | 7,176,421 | | | $ | 778,909 | | | $ | – | | | $ | 7,955,330 | |
| Pakistan | | | 1,818,597 | | | | 450,645 | | | | – | | | | 2,269,242 | |
| Philippines | | | 22,513,588 | | | | 1,607,688 | | | | – | | | | 24,121,276 | |
| Russia | | | 1,725,330 | | | | 382,847 | | | | – | | | | 2,108,177 | |
| South Africa | | | 13,883,652 | | | | 346,456 | | | | – | | | | 14,230,108 | |
| Other* | | | 381,167,157 | | | | – | | | | – | | | | 381,167,157 | |
| Corporate Bonds* | | $ | – | | | $ | 814,752 | | | $ | – | | | $ | 814,752 | |
| Total | | $ | 428,284,745 | | | $ | 4,381,297 | | | $ | – | | | $ | 432,666,042 | |
| Investments in Securities at Value | | Level 1 - Quoted and Unadjusted Prices | | | Level 2 - Other Significant Observable Inputs | | | Level 3 - Significant Unobservable Inputs | | | Total | |
| Grandeur Peak Global Micro Cap Fund | | | | | | | | | | | | | | | | |
| Common Stocks | | | | | | | | | | | | | | | | |
| Malaysia | | $ | 256,061 | | | $ | 181,806 | | | $ | – | | | $ | 437,867 | |
| New Zealand | | | – | | | | – | | | | – | | | | – | |
| Philippines | | | 433,324 | | | | 289,079 | | | | – | | | | 722,403 | |
| South Africa | | | – | | | | 122,239 | | | | – | | | | 122,239 | |
| United States | | | 4,674,179 | | | | 303,588 | | | | – | | | | 4,977,767 | |
| Other* | | | 28,948,471 | | | | – | | | | – | | | | 28,948,471 | |
| Corporate Bonds* | | $ | – | | | $ | 209,292 | | | $ | – | | | $ | 209,292 | |
| Total | | $ | 34,312,035 | | | $ | 1,106,004 | | | $ | – | | | $ | 35,418,039 | |
| Investments in Securities at Value | | Level 1 - Quoted and Unadjusted Prices | | | Level 2 - Other Significant Observable Inputs | | | Level 3 - Significant Unobservable Inputs | | | Total | |
| Grandeur Peak Global Opportunities Fund | | | | | | | | | | | | | | | | |
| Common Stocks | | | | | | | | | | | | | | | | |
| New Zealand | | $ | – | | | $ | – | | | $ | 1 | | | $ | 1 | |
| Philippines | | | 6,532,277 | | | | 893,871 | | | | – | | | | 7,426,148 | |
| Other* | | | 623,177,017 | | | | – | | | | – | | | | 623,177,017 | |
| Preferred Stocks* | | $ | – | | | $ | – | | | $ | 1,923,136 | | | $ | 1,923,136 | |
| Corporate Bonds* | | | – | | | | 604,880 | | | | – | | | | 604,880 | |
| Total | | $ | 629,709,294 | | | $ | 1,498,751 | | | $ | 1,923,137 | | | $ | 633,131,182 | |
| Annual Report | April 30, 2019 | 81 |
| Grandeur Peak Funds® | Notes to Financial Statements |
April 30, 2019
| Investments in Securities at Value | | Level 1 - Quoted and Unadjusted Prices | | | Level 2 - Other Significant
Observable Inputs | | | Level 3 - Significant Unobservable Inputs | | | Total | |
| Grandeur Peak Global Reach Fund | | | | | | | | | | | | | | | | |
| Common Stocks | | | | | | | | | | | | | | | | |
| Malaysia | | $ | 243,976 | | | $ | 617,799 | | | $ | – | | | $ | 861,775 | |
| New Zealand | | | – | | | | – | | | | – | | | | – | |
| Philippines | | | 4,804,586 | | | | 1,549,079 | | | | – | | | | 6,353,665 | |
| Russia | | | – | | | | 51,195 | | | | – | | | | 51,195 | |
| South Africa | | | 2,482,640 | | | | 639,467 | | | | – | | | | 3,122,107 | |
| Spain | | | – | | | | – | | | | – | | | | – | |
| United States | | | 81,592,323 | | | | 885,507 | | | | – | | | | 82,477,830 | |
| Other* | | | 231,340,148 | | | | – | | | | – | | | | 231,340,148 | |
| Preferred Stocks* | | $ | – | | | $ | – | | | $ | 912,077 | | | $ | 912,077 | |
| Corporate Bonds* | | | – | | | | 1,027,207 | | | | – | | | | 1,027,207 | |
| Total | | $ | 320,463,673 | | | $ | 4,770,254 | | | $ | 912,077 | | | $ | 326,146,004 | |
| Investments in Securities at Value | | Level 1 - Quoted and Unadjusted Prices | | | Level 2 - Other Significant
Observable Inputs | | | Level 3 - Significant Unobservable Inputs | | | Total | |
| Grandeur Peak Global Stalwarts Fund | | | | | | | | | | | | | | | | |
| Common Stocks* | | $ | 193,761,266 | | | $ | – | | | $ | – | | | $ | 193,761,266 | |
| Preferred Stocks* | | | – | | | | – | | | | 482,814 | | | | 482,814 | |
| Total | | $ | 193,761,266 | | | $ | – | | | $ | 482,814 | | | $ | 194,244,080 | |
| Investments in Securities at Value | | Level 1 - Quoted and Unadjusted Prices | | | Level 2 - Other Significant
Observable Inputs | | | Level 3 - Significant Unobservable Inputs | | | Total | |
| Grandeur Peak International Opportunities Fund | | | | | | | | | | | | | | | | |
| Common Stocks | | | | | | | | | | | | | | | | |
| New Zealand | | $ | – | | | $ | – | | | $ | 1 | | | $ | 1 | |
| Philippines | | | 14,374,561 | | | | 2,651,514 | | | | – | | | | 17,026,075 | |
| Other* | | | 634,450,256 | | | | – | | | | – | | | | 634,450,256 | |
| Corporate Bonds* | | $ | – | | | $ | 805,497 | | | $ | – | | | $ | 805,497 | |
| Total | | $ | 648,824,817 | | | $ | 3,457,011 | | | $ | 1 | | | $ | 652,281,829 | |
| Investments in Securities at Value | | Level 1 - Quoted and Unadjusted Prices | | | Level 2 - Other Significant
Observable Inputs | | | Level 3 - Significant Unobservable Inputs | | | Total | |
| Grandeur Peak International Stalwarts Fund | | | | | | | | | | | | | | | | |
| Common Stocks* | | $ | 603,141,167 | | | $ | – | | | $ | – | | | $ | 603,141,167 | |
| Total | | $ | 603,141,167 | | | $ | – | | | $ | – | | | $ | 603,141,167 | |
| * | For a detailed country breakdown, see the accompanying Portfolio of Investments. |
| 82 | 1.855.377.7325 | www.GrandeurPeakGlobal.com |
| Grandeur Peak Funds® | Notes to Financial Statements |
April 30, 2019
The following is a reconciliation of the investments in which significant unobservable inputs (Level 3) were used in determining fair value:
| Grandeur Peak Global Opportunities Fund | | Common Stocks | | | Preferred Stocks | | | Total | |
| Balance as of April 30, 2018 | | $ | 179,252 | | | $ | – | | | $ | 179,252 | |
| Accrued Discount/Premium | | | – | | | | – | | | | – | |
| Return of Capital | | | – | | | | – | | | | – | |
| Realized Gain/(Loss) | | | – | | | | – | | | | – | |
| Change in Unrealized Appreciation/(Depreciation) | | | (179,251 | ) | | | – | | | | (179,251 | ) |
| Purchases | | | – | | | | 1,923,136 | | | | 1,923,136 | |
| Sales Proceeds | | | – | | | | – | | | | – | |
| Transfer into Level 3 | | | – | | | | – | | | | – | |
| Transfer out of Level 3 | | | – | | | | – | | | | – | |
| Balance as of April 30, 2019 | | $ | 1 | | | $ | 1,923,136 | | | $ | 1,923,137 | |
| Net change in unrealized Appreciation/(Depreciation) attributable to Level 3 investments held at April 30, 2019 | | $ | (179,252 | ) | | $ | – | | | $ | – | |
| Grandeur Peak Global Reach Fund | | Common Stocks | | | Preferred Stocks | | | Total | |
| Balance as of April 30, 2018 | | $ | 860,689 | | | $ | – | | | $ | 860,689 | |
| Accrued Discount/Premium | | | – | | | | – | | | | – | |
| Return of Capital | | | – | | | | – | | | | – | |
| Realized Gain/(Loss) | | | 517,440 | | | | – | | | | 517,440 | |
| Change in Unrealized Appreciation/(Depreciation) | | | (452,754 | ) | | | – | | | | (452,754 | ) |
| Purchases | | | – | | | | 912,077 | | | | 912,077 | |
| Sales Proceeds | | | (925,374 | ) | | | – | | | | (925,374 | ) |
| Transfer into Level 3 | | | – | | | | – | | | | – | |
| Transfer out of Level 3 | | | – | | | | – | | | | – | |
| Balance as of April 30, 2019 | | $ | 1 | | | $ | 912,077 | | | $ | 912,078 | |
| Net change in unrealized Appreciation/(Depreciation) attributable to Level 3 investments held at April 30, 2019 | | $ | (132,539 | ) | | $ | – | | | $ | – | |
| Grandeur Peak Global Stalwarts Fund | | Common Stocks | | | Preferred Stocks | | | Total | |
| Balance as of April 30, 2018 | | $ | – | | | $ | – | | | $ | – | |
| Accrued Discount/Premium | | | – | | | | – | | | | – | |
| Return of Capital | | | – | | | | – | | | | – | |
| Realized Gain/(Loss) | | | – | | | | – | | | | – | |
| Change in Unrealized Appreciation/(Depreciation) | | | – | | | | – | | | | – | |
| Purchases | | | – | | | | 482,814 | | | | 482,814 | |
| Sales Proceeds | | | – | | | | – | | | | – | |
| Transfer into Level 3 | | | – | | | | – | | | | – | |
| Transfer out of Level 3 | | | – | | | | – | | | | – | |
| Balance as of April 30, 2019 | | $ | – | | | $ | 482,814 | | | $ | 482,814 | |
| Net change in unrealized Appreciation/(Depreciation) attributable to Level 3 investments held at April 30, 2019 | | $ | – | | | $ | – | | | $ | – | |
Change in unrealized appreciation/depreciation on Level 3 securities is included on the Statements of Operations under Net change in unrealized appreciation/(depreciation) on investments. Realized gain (loss) on Level 3 securities is included on the Statements of Operations under Net realized gain/(loss) on investments.
The table below provided additional information about the Level 3 Fair Value Measurements as of April 30, 2019:
Quantitative Information about Level 3 Fair Value Measurements
Grandeur Peak Global Opportunities Fund
| Asset Class | | Fair Value (USD) at 04/30/2019 | | | Valuation Technique | | Unobservable Inputs(a) | | Value | |
| Preferred Stock | | $ | 1,923,136 | | | Purchase price | | Cost | | $ | 19.90 | |
| Annual Report | April 30, 2019 | 83 |
| Grandeur Peak Funds® | Notes to Financial Statements |
April 30, 2019
Grandeur Peak Global Reach Fund
| Asset Class | | Fair Value (USD) at 04/30/2019 | | | Valuation Technique | | Unobservable Inputs(a) | | Value | |
| Preferred Stock | | $ | 912,077 | | | Purchase price | | Cost | | $ | 19.90 | |
Grandeur Peak Global Stalwarts Fund
| Asset Class | | Fair Value (USD) at 04/30/2019 | | | Valuation Technique | | Unobservable Inputs(a) | | Value | |
| Preferred Stock | | $ | 482,814 | | | Purchase price | | Cost | | $ | 19.90 | |
(a) A change to the unobservable input may result in a significant change to the value of the investment as follows:
| Unobservable Input | Impact to Value if Input Increases | Impact to Value if Input Decreases |
| Discount | Decrease | Increase |
Investment Transactions and Investment Income:Investment transactions are accounted for on the date the investments are purchased or sold (trade date). Realized gains and losses from investment transactions are reported on an identified cost which is the same basis the Fund uses for federal income tax purposes. Interest income, which includes accretion of discounts and amortization of premiums, is accrued and recorded as earned. Dividend income is recognized on the ex-dividend date or for certain foreign securities, as soon as information is available to the Funds. All of the realized and unrealized gains and losses and net investment income, are allocated daily to each class in proportion to its average daily net assets.
Cash Management Transactions:The Funds subscribe to the Brown Brothers Harriman & Co. (“BBH”) Cash Management Service (“CMS”), whereby cash balances are automatically swept into overnight offshore demand deposits with either the BBH Grand Cayman branch or a branch of a pre-approved commercial bank. This fully automated program allows the Funds to earn interest on cash balances. Excess cash with deposit institutions domiciled outside of the U.S. are subject to sovereign actions in the jurisdiction of the deposit institution including, but not limited to, freeze, seizure or diminution. Cash balances in the BBH CMS are included on the Statements of Assets and Liabilities under Cash and Foreign Cash, at Value. As of April 30, 2019, the Funds had the following cash balances participating in the BBH CMS:
| Fund | | | |
| Grandeur Peak Emerging Markets Opportunities Fund | | $ | 33,814,758 | |
| Grandeur Peak Global Micro Cap Fund | | | 78,318 | |
| Grandeur Peak Global Opportunities Fund | | | 18,868,980 | |
| Grandeur Peak Global Reach Fund | | | 2,636,592 | |
| Grandeur Peak Global Stalwarts Fund | | | 4,726,149 | |
| Grandeur Peak International Opportunities Fund | | | 48,457,553 | |
| Grandeur Peak International Stalwarts Fund | | | 27,417,489 | |
As of April 30, 2019, the Funds had the following foreign cash balances participating in the BBH CMS (cost and value of foreign cash balances are equal):
| Fund | | | |
| Grandeur Peak Emerging Markets Opportunities Fund | | $ | 22,986 | |
| Grandeur Peak Global Micro Cap Fund | | | – | |
| Grandeur Peak Global Opportunities Fund | | | 5,648 | |
| Grandeur Peak Global Reach Fund | | | 6,727 | |
| Grandeur Peak Global Stalwarts Fund | | | 15 | |
| Grandeur Peak International Opportunities Fund | | | 16 | |
| Grandeur Peak International Stalwarts Fund | | | – | |
Foreign Securities:The Funds may directly purchase securities of foreign issuers. Investing in securities of foreign issuers involves special risks not typically associated with investing in securities of U.S. issuers. The risks include possible reevaluation of currencies, the inability to repatriate foreign currency, less complete financial information about companies and possible future adverse political and economic developments. Moreover, securities of many foreign issuers and their markets may be less liquid and their prices more volatile than those of securities of comparable U.S. issuers.
| 84 | 1.855.377.7325 | www.GrandeurPeakGlobal.com |
| Grandeur Peak Funds® | Notes to Financial Statements |
April 30, 2019
Foreign Currency Translation:The books and records of the Funds are maintained in U.S. dollars. Investment valuations and other assets and liabilities initially expressed in foreign currencies are converted each business day into U.S. dollars based upon current exchange rates. Prevailing foreign exchange rates may generally be obtained at the close of the NYSE (normally, 4:00 p.m. Eastern Time). The portion of realized and unrealized gains or losses on investments due to fluctuations in foreign currency exchange rates is not separately disclosed and is included in realized and unrealized gains or losses on investments, when applicable.
Foreign Currency Spot Contracts:The Funds may enter into foreign currency spot contracts to facilitate transactions in foreign securities or to convert foreign currency receipts into U.S. dollars. A foreign currency spot contract is an agreement between two parties to buy and sell currencies at the current market rate, for settlement generally within two business days. The U.S. dollar value of the contracts is determined using current currency exchange rates supplied by a pricing service.
The contract is marked-to-market daily for settlements beyond one day and any change in market value is recorded as an unrealized gain or loss. When the contract is closed, a realized gain or loss is recorded equal to the difference between the value on the open and close date. Losses may arise from changes in the value of the foreign currency, or if the counterparties do not perform under the contract’s terms. The maximum potential loss from such contracts is the aggregate face value in U.S. dollars at the time the contract was opened.
Trust Expenses: Some expenses of the Trust can be directly attributed to the Funds. Expenses which cannot be directly attributed to the Funds are apportioned among all funds in the Trust based on average net assets of each fund.
Fund and Class Expenses:Expenses that are specific to a Fund or class of shares of a Fund, including distribution fees (Rule 12b-1 fees), are charged directly to that Fund or share class. Expenses that are common to all Funds generally are allocated among the Funds in proportion to their average daily net assets.
Federal Income Taxes:The Funds comply with the requirements under Subchapter M of the Internal Revenue Code of 1986, as amended, applicable to regulated investment companies and intend to distribute substantially all of their net taxable income and net capital gains, if any, each year so that it will not be subject to excise tax on undistributed income and gains. The Funds are not subject to income taxes to the extent such distributions are made.
As of and during the year ended April 30, 2019, the Funds had a liability for unrecognized capital gains tax. These amounts are disclosed as Foreign Capital Gains Tax on the Statements of Assets and Liabilities. The Funds file U.S. federal, state, and local tax returns as required. The Funds’ tax returns are subject to examination by the relevant tax authorities until expiration of the applicable statute of limitations, which is generally three years after the filing of the tax return for federal purposes and four years for most state returns. Tax returns for open years have incorporated no uncertain tax positions that require a provision for income taxes.
Distributions to Shareholders:Each Fund normally pays dividends and distributes capital gains, if any, on an annual basis. Income dividend distributions are derived from dividends and other income each Fund receives from their investments, including short term capital gains. Long term capital gain distributions are derived from gains realized when each Fund sells a security it has owned for more than a year. Each Fund may make additional distributions and dividends at other times if the portfolio manager believes doing so may be necessary for each Fund to avoid or reduce taxes. The Funds intend to pass through foreign tax credits to shareholders.
3. TAX BASIS INFORMATION
Reclassifications: As of April 30, 2019, permanent differences in book and tax accounting were reclassified. These differences had no effect on net assets and are primarily attributed to tax equalization. The reclassifications were as follows:
| Fund | | Paid-in Capital | | | Distributable earnings | |
| Grandeur Peak Emerging Markets Opportunities Fund | | $ | – | | | $ | – | |
| Grandeur Peak Global Micro Cap Fund | | | (36,141 | ) | | | 36,141 | |
| Grandeur Peak Global Opportunities Fund | | | 3,491,680 | | | | (3,491,680 | ) |
| Grandeur Peak Global Reach Fund | | | 1,494,444 | | | | (1,494,444 | ) |
| Grandeur Peak Global Stalwarts Fund | | | 467,003 | | | | (467,003 | ) |
| Grandeur Peak International Opportunities Fund | | | 6,320,246 | | | | (6,320,246 | ) |
| Grandeur Peak International Stalwarts Fund | | | 471,646 | | | | (471,646 | ) |
Included in the amounts reclassified for Grandeur Peak Global Micro Cap Fund was a net operating loss of $44,222.
| Annual Report | April 30, 2019 | 85 |
| Grandeur Peak Funds® | Notes to Financial Statements |
April 30, 2019
Tax Basis of Investments:As of April 30, 2019, the aggregate cost of investments, gross unrealized appreciation/(depreciation) and net unrealized appreciation for Federal tax purposes was as follows:
| Fund | | Gross Appreciation (excess of value over tax cost) | | | Gross Depreciation (excess of tax cost over value) | | | Net Appreciation/ (Depreciation) of Foreign Currency | | | Net Unrealized Appreciation/ (Depreciation) | | | Cost of Investments for Income Tax Purposes | |
| Grandeur Peak Emerging Markets Opportunities Fund | | $ | 94,390,421 | | | $ | (35,668,478 | ) | | $ | (602,031 | ) | | $ | 58,119,912 | | | $ | 373,944,099 | |
| Grandeur Peak Global Micro Cap Fund | | | 7,119,360 | | | | (2,947,730 | ) | | | (7,801 | ) | | | 4,163,829 | | | | 31,246,409 | |
| Grandeur Peak Global Opportunities Fund | | | 188,234,340 | | | | (37,582,474 | ) | | | (292,069 | ) | | | 150,359,797 | | | | 482,479,316 | |
| Grandeur Peak Global Reach Fund | | | 83,648,067 | | | | (22,054,479 | ) | | | (164,878 | ) | | | 61,428,710 | | | | 264,552,416 | |
| Grandeur Peak Global Stalwarts Fund | | | 41,537,407 | | | | (8,280,304 | ) | | | (196,705 | ) | | | 33,060,398 | | | | 160,986,977 | |
| Grandeur Peak International Opportunities Fund | | | 180,108,468 | | | | (41,374,748 | ) | | | (161,800 | ) | | | 138,571,920 | | | | 513,548,109 | |
| Grandeur Peak International Stalwarts Fund | | | 117,529,140 | | | | (29,975,907 | ) | | | (740,207 | ) | | | 86,813,026 | | | | 515,587,934 | |
Components of Earnings: As of April 30, 2019, components of distributable earnings on a tax basis were as follows:
| Fund | | Undistributed Ordinary Income | | | Accumulated Capital Gains/(Losses) | | | Other Accumulated Gain/(Loss) | | | Net Unrealized Appreciation/ (Depreciation) on Investments and Foreign Currency | | | Total Distributable Earnings | |
| Grandeur Peak Emerging Markets Opportunities Fund | | $ | – | | | $ | (9,147,830 | ) | | $ | (163,836 | ) | | $ | 58,119,912 | | | $ | 48,808,246 | |
| Grandeur Peak Global Micro Cap Fund | | | – | | | | (34,171 | ) | | | (16,039 | ) | | | 4,163,829 | | | | 4,113,619 | |
| Grandeur Peak Global Opportunities Fund | | | – | | | | 18,892,896 | | | | – | | | | 150,359,797 | | | | 169,252,693 | |
| Grandeur Peak Global Reach Fund | | | 19,029 | | | | 2,765,179 | | | | (367 | ) | | | 61,428,710 | | | | 64,212,551 | |
| Grandeur Peak Global Stalwarts Fund | | | 122,506 | | | | 1,729,443 | | | | 78 | | | | 33,060,398 | | | | 34,912,425 | |
| Grandeur Peak International Opportunities Fund | | | 260,825 | | | | 3,261,929 | | | | (416 | ) | | | 138,571,921 | | | | 142,094,259 | |
| Grandeur Peak International Stalwarts Fund | | | 678,165 | | | | (2,771,618 | ) | | | – | | | | 86,813,026 | | | | 84,719,573 | |
Tax Basis of Distributions to Shareholders: The character of distributions made during the year from net investment income or net realized gains may differ from its ultimate characterization for federal income tax purposes. Also, due to the timing of dividend distributions, the fiscal year in which amounts are distributed may differ from the fiscal year in which the income or realized gain were recorded by the Funds.
The tax character of distributions paid by the Funds for the fiscal year ended April 30, 2019 were as follows:
| Fund | | Ordinary Income | | | Long-Term Capital Gain | |
| Grandeur Peak Emerging Markets Opportunities Fund | | $ | 1,399,313 | | | $ | 3,456,127 | |
| Grandeur Peak Global Micro Cap Fund | | | 10,964 | | | | 2,207,059 | |
| Grandeur Peak Global Opportunities Fund | | | 4,541,112 | | | | 56,054,176 | |
| Grandeur Peak Global Reach Fund | | | 2,440,188 | | | | 27,120,108 | |
| Grandeur Peak Global Stalwarts Fund | | | 150,604 | | | | 5,087,232 | |
| Grandeur Peak International Opportunities Fund | | | 6,846,633 | | | | 62,253,180 | |
| Grandeur Peak International Stalwarts Fund | | | 2,587,918 | | | | 10,997,639 | |
The tax character of distributions paid by the Funds for the fiscal year ended April 30, 2018 were as follows:
| Fund | | Ordinary Income | | | Long-Term Capital Gain | |
| Grandeur Peak Emerging Markets Opportunities Fund | | $ | 518,950 | | | $ | – | |
| Grandeur Peak Global Micro Cap Fund | | | 834,856 | | | | 2,093,993 | |
| Grandeur Peak Global Opportunities Fund | | | 1,359,717 | | | | 41,054,835 | |
| Grandeur Peak Global Reach Fund | | | 374,631 | | | | 4,826,741 | |
| Grandeur Peak Global Stalwarts Fund | | | – | | | | 2,371,669 | |
| Grandeur Peak International Opportunities Fund | | | 3,123,114 | | | | 27,328,426 | |
| Grandeur Peak International Stalwarts Fund | | | 604,680 | | | | 5,564,868 | |
| 86 | 1.855.377.7325 | www.GrandeurPeakGlobal.com |
| Grandeur Peak Funds® | Notes to Financial Statements |
April 30, 2019
Under current law, capital losses maintain their character as short-term or long-term and are carried forward to the next tax year without expiration. As of the current fiscal year end, the following amounts are available as carry forwards to the next tax year:
| Fund | | Short-Term | | | Long-Term | |
| Grandeur Peak Emerging Markets Opportunities Fund | | $ | 1,433,604 | | | $ | 1,294,348 | |
The following Funds elect to defer to the period ending April 30, 2020, capital losses recognized during the period November 1, 2018 - April 30, 2019 in the amount of:
| Fund | | Capital Losses Recognized | |
| Grandeur Peak Emerging Markets Opportunities Fund | | $ | 6,419,878 | |
| Grandeur Peak Global Micro Cap Fund | | | 34,171 | |
| Grandeur Peak International Stalwarts Fund | | | 2,771,618 | |
The following Funds elect to defer to the period ending April 30, 2020, late year ordinary losses in the amount of:
| Fund | | Ordinary Losses Recognized | |
| Grandeur Peak Emerging Markets Opportunities Fund | | $ | 163,828 | |
| Grandeur Peak Global Micro Cap Fund | | | 16,039 | |
4. SECURITIES TRANSACTIONS
The cost of purchases and proceeds from sales of securities (excluding short term securities) during the year ended April 30, 2019 were as follows:
| Fund | | Purchases of Securities | | | Proceeds From Sales of
Securities | |
| Grandeur Peak Emerging Markets Opportunities Fund | | $ | 148,118,893 | | | $ | 137,984,227 | |
| Grandeur Peak Global Micro Cap Fund | | | 13,949,929 | | | | 16,124,137 | |
| Grandeur Peak Global Opportunities Fund | | | 262,541,570 | | | | 387,492,386 | |
| Grandeur Peak Global Reach Fund | | | 165,608,238 | | | | 199,742,163 | |
| Grandeur Peak Global Stalwarts Fund | | | 103,083,926 | | | | 94,718,375 | |
| Grandeur Peak International Opportunities Fund | | | 243,052,546 | | | | 393,908,683 | |
| Grandeur Peak International Stalwarts Fund | | | 327,018,747 | | | | 225,650,507 | |
5. SHARES OF BENEFICIAL INTEREST
The capitalization of the Trust consists of an unlimited number of shares of beneficial interest with no par value per share. Holders of the shares of the Funds of the Trust have one vote for each share held and a proportionate fraction of a vote for each fractional share. All shares issued and outstanding are fully paid and are transferable and redeemable at the option of the shareholder. Purchasers of the share do not have any obligation to make payments to the Trust or its creditors solely by reason of the purchasers’ ownership of the shares. Shares have no pre-emptive rights.
Shares redeemed within 60 days of purchase may incur a 2% short-term redemption fee deducted from the redemption amount. For the year ended April 30, 2019 and the year ended April 30, 2018, the redemption fees charged by the Funds are presented in the Statements of Changes in Net Assets.
| Annual Report | April 30, 2019 | 87 |
| Grandeur Peak Funds® | Notes to Financial Statements |
April 30, 2019
6. MANAGEMENT AND RELATED-PARTY TRANSACTIONS
The Adviser, subject to the authority of the Board, is responsible for the overall management and administration of the Funds’ business affairs. The Adviser manages the investments of the Funds in accordance with the Funds’ investment objective, policies and limitations and investment guidelines established jointly by the Adviser and the Trustees. Pursuant to the Advisory Agreement, (the “Advisory Agreement”), each Fund pays the Adviser an annual management fee based on each Fund’s average daily net assets. The management fee is paid on a monthly basis. The following table reflects the Funds’ advisory fee rates.
| Fund | Advisory Fee |
| Grandeur Peak Emerging Markets Opportunities Fund | 1.35% |
| Grandeur Peak Global Micro Cap Fund | 1.50% |
| Grandeur Peak Global Opportunities Fund | 1.25% |
| Grandeur Peak Global Reach Fund | 1.10% |
| Grandeur Peak Global Stalwarts Fund | 0.80% |
| Grandeur Peak International Opportunities Fund | 1.25% |
| Grandeur Peak International Stalwarts Fund | 0.80% |
The Adviser has contractually agreed to limit certain of each Fund’s expenses (excluding acquired fund fees and expenses, brokerage expenses, interest expenses, taxes and extraordinary expenses). The following table reflects the Funds’ expense cap.
| Fund | Expense Cap | Term of Expense Limit Agreements |
| Grandeur Peak Emerging Markets Opportunities Fund | | |
| Investor Class | 1.95% | September 1, 2018 - August 31, 2019/ |
| Institutional Class | 1.70% | September 1, 2017 - August 31, 2018 |
| | | |
| Grandeur Peak Global Micro Cap Fund | | |
| Institutional Class | 2.00% | September 1, 2018 - August 31, 2019/ |
| | | September 1, 2017 - August 31, 2018 |
| Grandeur Peak Global Opportunities Fund | | |
| Investor Class | 1.75% | September 1, 2018 - August 31, 2019/ |
| Institutional Class | 1.50% | September 1, 2017 - August 31, 2018 |
| | | |
| Grandeur Peak Global Reach Fund | | |
| Investor Class | 1.60% | September 1, 2018 - August 31, 2019/ |
| Institutional Class | 1.35% | September 1, 2017 - August 31, 2018 |
| | | |
| Grandeur Peak Global Stalwarts Fund | | |
| Investor Class | 1.35% | September 1, 2018 - August 31, 2019/ |
| Institutional Class | 1.10% | September 1, 2017 - August 31, 2018 |
| | | |
| Grandeur Peak International Opportunities Fund | | |
| Investor Class | 1.75% | September 1, 2018 - August 31, 2019/ |
| Institutional Class | 1.50% | September 1, 2017 - August 31, 2018 |
| | | |
| Grandeur Peak International Stalwarts Fund | | |
| Investor Class | 1.35% | September 1, 2018 - August 31, 2019/ |
| Institutional Class | 1.10% | September 1, 2017 - August 31, 2018 |
Pursuant to these agreements, each Fund will reimburse the Adviser for any previous fee waivers and expense reimbursements made by the Adviser, provided that any such reimbursements made by the Funds to the Adviser will not cause the Funds’ expense limitation to exceed expense limitations in existence at the time the expense was incurred, or at the time of the reimbursement, whichever is lower, and the reimbursement is made within three years after the expenses were incurred. Fees waived/reimbursed by the Adviser for the year ended April 30, 2019 are disclosed in the Statements of Operations.
| 88 | 1.855.377.7325 | www.GrandeurPeakGlobal.com |
| Grandeur Peak Funds® | Notes to Financial Statements |
April 30, 2019
In addition to the foregoing contractual arrangements, the Adviser has voluntarily agreed, effective September 1, 2016, to waive, with respect to the Grandeur Peak Global Opportunities Fund and the Grandeur Peak International Opportunities Fund, annual management fees to the extent such fees exceed 1.10% on assets above $500 million (the annual management fee rate with respect to such funds will remain 1.25% on the first $500 million in assets). The Adviser has also voluntarily agreed, effective January 1, 2018, to waive, with respect to the Grandeur Peak Emerging Markets Opportunities Fund, annual management fees to the extent such fees exceed 1.20% on all assets above $400 million (the annual management fee rate with respect to the Fund will remain 1.35% on the first $400 million in assets). These voluntary arrangements may be terminated at any time by the Adviser. Voluntary waivers are not subject to recoupment by the Adviser. Voluntary fees waive by the Adviser for the year ended April 30, 2019 are disclosed in the Statements of Operations.
For the year ended April 30, 2019, the fee waivers/reimbursements and/or recoupments were as follows:
| Fund | | Fees Waived/Reimbursed By Adviser | | | Recoupment of Previously Waived Fees By Adviser | |
| Grandeur Peak Emerging Markets Opportunities Fund | | | | | | | | |
| Investor Class | | $ | – | | | $ | – | |
| Institutional Class | | | – | | | | – | |
| Grandeur Peak Global Micro Cap Fund | | | | | | | | |
| Institutional Class | | $ | 25,568 | | | $ | 6,202 | |
| Grandeur Peak Global Opportunities Fund | | | | | | | | |
| Investor Class | | $ | – | | | $ | – | |
| Institutional Class | | | – | | | | – | |
| Grandeur Peak Global Reach Fund | | | | | | | | |
| Investor Class | | $ | – | | | $ | – | |
| Institutional Class | | | – | | | | – | |
| Grandeur Peak Global Stalwarts Fund | | | | | | | | |
| Investor Class | | $ | – | | | $ | 16,519 | |
| Institutional Class | | | – | | | | 22,894 | |
| Grandeur Peak International Opportunities Fund | | | | | | | | |
| Investor Class | | $ | – | | | $ | – | |
| Institutional Class | | | – | | | | – | |
| Grandeur Peak International Stalwarts Fund | | | | | | | | |
| Investor Class | | $ | – | | | $ | – | |
| Institutional Class | | | – | | | | – | |
| Annual Report | April 30, 2019 | 89 |
| Grandeur Peak Funds® | Notes to Financial Statements |
April 30, 2019
As of April 30, 2019, the balances of recoupable expenses for each Fund were as follows:
| Fund | | Expires 2020 | | | Expires 2021 | | | Expires
2022 | | | Total | |
| Grandeur Peak Emerging Markets Opportunities Fund | | | | | | | | | | | | | | | | |
| Investor Class | | $ | – | | | $ | – | | | $ | – | | | $ | – | |
| Institutional Class | | | – | | | | – | | | | – | | | | – | |
| Grandeur Peak Global Micro Cap Fund | | | | | | | | | | | | | | | | |
| Institutional Class | | $ | 49,625 | | | $ | 27,510 | | | $ | 25,568 | | | $ | 102,703 | |
| Grandeur Peak Global Opportunities Fund | | | | | | | | | | | | | | | | |
| Investor Class | | $ | – | | | $ | – | | | $ | – | | | $ | – | |
| Institutional Class | | | – | | | | – | | | | – | | | | – | |
| Grandeur Peak Global Reach Fund | | | | | | | | | | | | | | | | |
| Investor Class | | $ | – | | | $ | – | | | $ | – | | | $ | – | |
| Institutional Class | | | – | | | | – | | | | – | | | | – | |
| Grandeur Peak Global Stalwarts Fund | | | | | | | | | | | | | | | | |
| Investor Class | | $ | – | | | $ | – | | | $ | – | | | $ | – | |
| Institutional Class | | | – | | | | – | | | | – | | | | – | |
| Grandeur Peak International Opportunities Fund | | | | | | | | | | | | | | | | |
| Investor Class | | $ | – | | | $ | – | | | $ | – | | | $ | – | |
| Institutional Class | | | – | | | | – | | | | – | | | | – | |
| Grandeur Peak International Stalwarts Fund | | | | | | | | | | | | | | | | |
| Investor Class | | $ | – | | | $ | – | | | $ | – | | | $ | – | |
| Institutional Class | | | – | | | | – | | | | – | | | | – | |
Administrator Fees and Expenses:ALPS Fund Services, Inc. (“ALPS”) serves as administrator to the Funds and the Funds have agreed to pay expenses incurred in connection with their administrative activities. Pursuant to an Administration Agreement, ALPS provides operational services to the Funds including, but not limited to, fund accounting and fund administration and generally assists in the Funds’ operations. Officers of the Trust are employees of ALPS. The Funds’ administration fee is accrued on a daily basis and paid monthly. Administration fees paid by the Funds for the year ended April 30, 2019 are disclosed in the Statements of Operations.
ALPS is reimbursed by the Funds for certain out-of-pocket expenses.
Transfer Agent:ALPS serves as transfer, dividend paying and shareholder servicing agent for the Funds. ALPS receives an annual minimum fee, a fee based upon the number of shareholder accounts, and is also reimbursed by the Funds for certain out-of-pocket expenses. Transfer agent fees paid by the Funds for the year ended April 30, 2019 are disclosed in the Statements of Operations.
Compliance Services:ALPS provides services that assist the Trust’s chief compliance officer in monitoring and testing the policies and procedures of the Trust in conjunction with requirements under Rule 38a-1 under the 1940 Act and receives an annual base fee. ALPS is reimbursed for certain out-of-pocket expenses by the Funds. Compliance service fees paid by the Funds for the year ended April 30, 2019 are disclosed in the Statements of Operations.
Principal Financial Officer:ALPS receives an annual fee for providing principal financial officer services to the Funds. Principal financial officer fees paid by the Fund for the year ended April 30, 2019 are disclosed in the Statements of Operations.
Distributor:ALPS Distributors, Inc. (“ADI” or the “Distributor”) (an affiliate of ALPS) acts as the distributor of the Funds’ shares pursuant to a Distribution Agreement with the Trust. Shares are sold on a continuous basis by ADI as agent for the Funds, and ADI has agreed to use its best efforts to solicit orders for the sale of each Fund’s shares, although it is not obliged to sell any particular amount of shares. ADI is not entitled to any compensation for its services as Distributor. ADI is registered as a broker-dealer with the U.S. Securities and Exchange Commission.
| 90 | 1.855.377.7325 | www.GrandeurPeakGlobal.com |
| Grandeur Peak Funds® | Notes to Financial Statements |
April 30, 2019
Trustees: The fees and expenses of the independent trustees of the Board are presented in the Statements of Operations.
Each Fund has adopted a Distribution and Services (Rule 12b-1) Plan pursuant to Rule 12b-1 of the 1940 Act (the “Plan”) for its Investor Class shares. The Plan allows the Funds to use Investor Class assets to pay fees in connection with the distribution and marketing of Investor Class shares and/or the provision of shareholder services to Investor Class shareholders. The Plan permits payment for services in connection with the administration of plans or programs that use Investor Class shares of each Fund as their funding medium and for related expenses. The recipients of such payments may include the Distributor, other affiliates of the Adviser, broker-dealers, financial institutions, plan sponsors and administrators and other financial intermediaries through which investors may purchase shares of the Fund. The Plan permits the Funds to make total payments at an annual rate of up to 0.25% of each Fund’s average daily net assets attributable to its Investor Class shares. The expenses of the Plan are reflected as distribution and service fees in the Statements of Operations.
7. INDEMNIFICATIONS
Under the Trust’s organizational documents, its officers and Trustees are indemnified against certain liability arising out of the performance of their duties to the Trust. Additionally, in the normal course of business, the Trust enters into contracts with service providers that may contain general indemnification clauses, which may permit indemnification to the extent permissible under applicable law. The Trust’s maximum exposure under these arrangements is unknown, as this would involve future claims that may be made against the Trust that have not yet occurred.
8. NEW ACCOUNTING PROUNCEMENTS
On October 4, 2018, the SEC amended Regulation S-X to require certain financial statement disclosure requirements to conform them to US GAAP for investment companies. Effective November 4, 2018, the Funds adopted disclosure requirement changes for Regulation S-X and these changes are reflected throughout this report. The Funds’ adoption of those amendments, effective with the financial statements prepared as of April 30, 2019, had no effect on the Funds’ net assets or results of operations.
In August 2018, the Financial Accounting Standards Board (“FASB”) issued Accounting Standards Update (“ASU”) 2018-13, which changes the fair value measurement disclosure requirements of FASB Accounting Standards Codification Topic 820, Fair Value Measurement. The update to Topic 820 includes new, eliminated, and modified disclosure requirements. ASU 2018-13 is effective for fiscal years beginning after December 15, 2019, including interim periods. Early adoption is permitted for any eliminated or modified disclosures. The Funds early adopted effective with the financial statements prepared as of April 30, 2019, and they had no effect on the Funds’ net assets or results of operations.
9. SUBSEQUENT EVENT
Subsequent events after the date of the Statements of Assets and Liabilities have been evaluated through the date the financial statements were issued.
| Annual Report | April 30, 2019 | 91 |
| Grandeur Peak Funds® | Report of Independent Registered
Public Accounting Firm |
To the shareholders and the Board of Trustees of Financial Investors Trust
Opinion on the Financial Statements and Financial Highlights
We have audited the accompanying statements of assets and liabilities, including the portfolios of investments, of Grandeur Peak Emerging Markets Opportunities Fund, Grandeur Peak Global Micro Cap Fund, Grandeur Peak Global Opportunities Fund, Grandeur Peak Global Reach Fund, Grandeur Peak Global Stalwarts Fund, Grandeur Peak International Opportunities Fund and Grandeur Peak International Stalwarts Fund (the “Funds”), seven of the funds constituting the Financial Investors Trust, as of April 30, 2019; the related statements of operations for the year then ended, the statements of changes in net assets for each of the two years in the period then ended, and the financial highlights for each of the five years in the period then ended for the Funds, except Grandeur Peak Global Micro Cap Fund, Grandeur Peak Global Stalwarts Fund and Grandeur Peak International Stalwarts Fund; the related statements of operations, changes in net assets, and the financial highlights for the periods indicated in the table below for Grandeur Peak Global Micro Cap Fund, Grandeur Peak Global Stalwarts Fund and Grandeur Peak International Stalwarts Fund; and the related notes. In our opinion, the financial statements and financial highlights present fairly, in all material respects, the financial position of each of the funds listed above constituting Financial Investors Trust as of April 30, 2019, and the results of their operations for the year then ended, the changes in their net assets for each of the two years in the period then ended, and the financial highlights for each of the five years in the period then ended (or for the period listed in the table below), in conformity with accounting principles generally accepted in the United States of America.
| Individual Fund Comprising the Financial Investors Trust | Statement of
Operations | Statements of Changes
in Net Assets | Financial Highlights |
| Grandeur Peak Global Micro Cap Fund | For the year ended April 30, 2019 | For the years ended April 30, 2019 and 2018 | For the years ended April 30, 2019, 2018, 2017, and the period from October 21, 2015 (commencement of operations) through April 30, 2016 |
| Grandeur Peak Global Stalwarts Fund | For the year ended April 30, 2019 | For the years ended April 30, 2019 and 2018 | For the years ended April 30, 2019, 2018, 2017, and the period from September 2, 2015 (commencement of operations) through April 30, 2016 |
| Grandeur Peak International Stalwarts Fund | For the year ended April 30, 2019 | For the years ended April 30, 2019 and 2018 | For the years ended April 30, 2019, 2018, 2017, and the period from September 2, 2015 (commencement of operations) through April 30, 2016 |
Basis for Opinion
These financial statements and financial highlights are the responsibility of the Funds’ management. Our responsibility is to express an opinion on the Funds’ financial statements and financial highlights based on our audits. We are a public accounting firm registered with the Public Company Accounting Oversight Board (United States) (PCAOB) and are required to be independent with respect to the Funds in accordance with the U.S. federal securities laws and the applicable rules and regulations of the Securities and Exchange Commission and the PCAOB.
We conducted our audits in accordance with the standards of the PCAOB. Those standards require that we plan and perform the audit to obtain reasonable assurance about whether the financial statements and financial highlights are free of material misstatement, whether due to error or fraud. The Funds are not required to have, nor were we engaged to perform, an audit of their internal control over financial reporting. As part of our audits we are required to obtain an understanding of internal control over financial reporting but not for the purpose of expressing an opinion on the effectiveness of the Funds’ internal control over financial reporting. Accordingly, we express no such opinion.
Our audits included performing procedures to assess the risks of material misstatement of the financial statements and financial highlights, whether due to error or fraud, and performing procedures that respond to those risks. Such procedures included examining, on a test basis, evidence regarding the amounts and disclosures in the financial statements and financial highlights. Our audits also included evaluating the accounting principles used and significant estimates made by management, as well as evaluating the overall presentation of the financial statements and financial highlights. Our procedures included confirmation of securities owned as of April 30, 2019, by correspondence with the custodian and brokers; when replies were not received from brokers, we performed other auditing procedures. We believe that our audits provide a reasonable basis for our opinion.
DELOITTE & TOUCHE LLP
Denver, Colorado
June 25, 2019
We have served as the auditor of one or more investment companies advised by Grandeur Peak Global Advisors, LLC since 2012.
| 92 | 1.855.377.7325 | www.GrandeurPeakGlobal.com |
| Grandeur Peak Funds® | Additional Information |
April 30, 2019 (Unaudited)
1. FUND HOLDINGS
The Funds file their complete schedule of portfolio holdings with the Securities and Exchange Commission (the “SEC”) for the first and third quarters of each fiscal year within 60 days after the end of the period. Copies of the Funds’ previously filed Form NQs are available without charge on the SEC website at http://www.sec.gov.
2. FUND PROXY VOTING POLICIES, PROCEDURES AND SUMMARIES
The Funds’ policies and procedures used in determining how to vote proxies and information regarding how the Funds voted proxies relating to portfolio securities during the most recent prior 12-month period ending June 30 are available without charge, (1) upon request, by calling (toll-free) 855-377-PEAK(7325) and (2) on the SEC’s website at http://www.sec.gov.
3. TAX DESIGNATIONS
The Funds designate the following amounts for federal income tax purposes for the fiscal year ended April 30, 2019:
| | | Foreign Taxes Paid | | | Foreign Source Income | |
| Grandeur Peak Global Opportunities Fund | | $ | 743,527 | | | $ | 9,350,887 | |
| Grandeur Peak International Opportunities Fund | | $ | 1,210,544 | | | $ | 13,587,017 | |
| Grandeur Peak Global Reach Fund | | $ | 386,505 | | | $ | 4,753,779 | |
| Grandeur Peak Emerging Markets Opportunities Fund | | $ | 661,636 | | | $ | 7,892,146 | |
| Grandeur Peak Global Micro Cap Fund | | $ | 70,069 | | | $ | 790,601 | |
| Grandeur Peak Global Stalwarts Fund | | $ | 125,498 | | | $ | 1,677,703 | |
| Grandeur Peak International Stalwarts Fund | | $ | 591,509 | | | $ | 7,537,929 | |
Of the distributions paid by the Funds from ordinary income for the calendar year ended December 31, 2018, the following percentages met the requirements to be treated as qualifying for the corporate dividends received deduction and qualified dividend income:
| | Dividend Received Deduction | Qualified Dividend Income |
| Grandeur Peak Global Opportunities Fund | 37.93% | 100.00% |
| Grandeur Peak International Opportunities Fund | 2.04% | 100.00% |
| Grandeur Peak Global Reach Fund | 20.36% | 100.00% |
| Grandeur Peak Emerging Markets Opportunities Fund | 8.69% | 100.00% |
| Grandeur Peak Global Micro Cap Fund | 100.00% | 100.00% |
| Grandeur Peak Global Stalwarts Fund | 100.00% | 100.00% |
| Grandeur Peak International Stalwarts Fund | 5.67% | 100.00% |
In early 2019, if applicable, shareholders of record received this information for the distributions paid to them by the Funds during the calendar year 2018 via Form 1099. The Funds will notify shareholders in early 2020 of amounts paid to them by the Funds, if any, during the calendar year 2019.
Pursuant to Section 852(b)(3) of the Internal Revenue Code, the Funds designate the following as long-term capital gain dividends:
| Grandeur Peak Global Opportunities Fund | | $ | 56,054,176 | |
| Grandeur Peak International Opportunities Fund | | $ | 62,253,180 | |
| Grandeur Peak Global Reach Fund | | $ | 27,120,108 | |
| Grandeur Peak Emerging Markets Opportunities Fund | | $ | 3,456,127 | |
| Grandeur Peak Global Micro Cap Fund | | $ | 2,207,058 | |
| Grandeur Peak Global Stalwarts Fund | | $ | 5,087,232 | |
| Grandeur Peak International Stalwarts Fund | | $ | 10,997,639 | |
| Annual Report | April 30, 2019 | 93 |
| Grandeur Peak Funds® | Additional Information |
April 30, 2019 (Unaudited)
For the fiscal year ended April 30, 2019, the following long term amounts were utilized as earnings and profits distributed to shareholders on redemptions:
| Grandeur Peak Global Opportunities Fund | | $ | 3,475,708 | |
| Grandeur Peak International Opportunities Fund | | $ | 5,970,466 | |
| Grandeur Peak Global Reach Fund | | $ | 1,392,386 | |
| Grandeur Peak Emerging Markets Opportunities Fund | | | – | |
| Grandeur Peak Global Micro Cap Fund | | $ | 8,082 | |
| Grandeur Peak Global Stalwarts Fund | | $ | 428,892 | |
| Grandeur Peak International Stalwarts Fund | | $ | 170,590 | |
| 94 | 1.855.377.7325 | www.GrandeurPeakGlobal.com |
| Grandeur Peak Funds® | Trustees and Officers |
April 30, 2019 (Unaudited)
Additional information regarding the Fund’s trustees is included in the Statement of Additional Information, which can be obtained without charge by calling 855-377-7325.
INDEPENDENT TRUSTEES
Name, Address* & Year of Birth | Position(s) Held with Fund | Term of Office** and Length of Time Served | Principal Occupation(s) During Past 5 Years*** | Number of Funds in Fund Complex Overseen By Trustee**** | Other Directorships Held by Trustee During Past 5 Years*** |
Mary K. Anstine, 1940 | Trustee and Chairman | Ms. Anstine was elected at a special meeting of shareholders held on March 21, 1997 and re-elected at a special meeting of shareholders held on August 7, 2009. Ms. Anstine was appointed Chairman of the Board at the June 6, 2017 meeting of the Board of Trustees. | Ms. Anstine was formerly an Executive Vice President of First Interstate Bank of Denver until 1994, President/Chief Executive Officer of HealthONE Alliance, Denver, Colorado, from 1994 to 2004, and has been retired since 2004. Ms. Anstine is also Trustee/Director of AV Hunter Trust and Colorado Uplift Board. Ms. Anstine was formerly a Director of the Trust Bank of Colorado (later purchased and now known as Northern Trust Bank), HealthONE and Denver Area Council of the Boy Scouts of America, and a member of the American Bankers Association Trust Executive Committee. | 31 | Ms. Anstine is a Trustee of ALPS ETF Trust (20 funds); ALPS Variable Investment Trust (9 funds); Reaves Utility Income Fund (1 fund); and Segall Bryant & Hamill Trust (14 funds). |
Jeremy W. Deems, 1976 | Trustee | Mr. Deems was appointed as a Trustee at the March 11, 2008 meeting of the Board of Trustees and elected at a special meeting of shareholders held on August 7, 2009. | Mr. Deems is the Co-Founder, Chief Operations Officer and Chief Financial Officer of Green Alpha Advisors, LLC, a registered investment advisor, and Co-Portfolio Manager of the Shelton Green Alpha Fund. Prior to joining Green Alpha Advisors, Mr. Deems was CFO and Treasurer of Forward Management, LLC, ReFlow Management Co., LLC, ReFlow Fund, LLC, a private investment fund, and Sutton Place Management, LLC, an administrative services company, from 1998 to June 2007. From 2004 to 2005, Mr Deems also served as Treasurer of the Forward Funds and the Sierra Club Funds. | 31 | Mr. Deems is a Trustee of ALPS ETF Trust (20 funds); ALPS Variable Investment Trust (9 funds); Clough Funds Trust (1 fund); and Reaves Utility Income Fund (1 fund). |
| Annual Report | April 30, 2019 | 95 |
| Grandeur Peak Funds® | Trustees and Officers |
April 30, 2019 (Unaudited)
INDEPENDENT TRUSTEES
Name, Address* & Year of Birth | Position(s) Held with Fund | Term of Office** and Length of Time Served | Principal Occupation(s) During Past 5 Years*** | Number of Funds in Fund Complex Overseen By Trustee**** | Other Directorships Held by Trustee During Past 5 Years*** |
Jerry G. Rutledge, 1944 | Trustee | Mr. Rutledge was elected at a special meeting of shareholders held on August 7, 2009. | Mr. Rutledge is the President and owner of Rutledge’s Inc., a retail clothing business. Mr. Rutledge is currently Director of the American National Bank. He was from 1994 to 2007 a Regent of the University of Colorado. | 31 | Mr. Rutledge is a Trustee of Principal Real Estate Income Fund (1 fund); Clough Global Dividend and Income Fund (1 fund); Clough Global Equity Fund (1 fund); and Clough Global Opportunities Fund (1 fund). |
Michael “Ross” Shell, 1970 | Trustee | Mr. Shell was elected at a special meeting of shareholders held on August 7, 2009. | Mr. Shell is Founder and CEO of Red Idea, LLC, a strategic consulting/early stage venture firm (since June 2008). From 1999 to 2009, he was a part-owner and Director of Tesser, Inc., a brand agency. From December 2005 to May 2008, he was Director, Marketing and Investor Relations, of Woodbourne, a REIT/real estate hedge fund and private equity firm. Prior to this, from May 2004 to November 2005, he worked as a business strategy consultant; from June 2003 to April 2004, he was on the Global Client Services team of IDEO, a product design/innovation firm; and from 1999 to 2003, he was President of Tesser, Inc. Mr. Shell graduated with honors from Stanford University with a degree in Political Science. | 31 | None. |
| 96 | 1.855.377.7325 | www.GrandeurPeakGlobal.com |
| Grandeur Peak Funds® | Trustees and Officers |
April 30, 2019 (Unaudited)
INTERESTED TRUSTEE
Name, Address* & Year of Birth | Position(s) Held with Fund | Term of Office** and Length of Time Served | Principal Occupation(s) During Past 5 Years*** | Number of Funds in Fund Complex Overseen by Trustee**** | Other Directorships Held by Trustee During Past 5 Years*** |
Edmund J. Burke, 1961 | Trustee and President^ | Mr. Burke was elected as Trustee at a special meeting of shareholders held on August 7, 2009. Mr. Burke was elected President of the Trust at the December 17, 2002 meeting of the Board of Trustees. | Mr. Burke is President and a Director of ALPS Holdings, Inc. (“AHI”) (since 2005)and ALPS Advisors, Inc. (“AAI”) and Director of Boston Financial Data Services, Inc. (“BFDS”), ALPS Distributors, Inc. (“ADI”), ALPS Fund Services, Inc. (“AFS”) and ALPS Portfolio Solutions Distributor, Inc. (“APSD”). Because of his positions with AHI, BFDS, AAI, ADI, AFS and APSD, Mr. Burke is deemed an affiliate of the Trust as defined under the 1940 Act. | 31 | Mr. Burke is a Trustee of ALPS ETF Trust (20 funds); Clough Global Dividend and Income Fund (1 fund); Clough Global Equity Fund (1 fund); Clough Global Opportunities Fund (1 fund); Clough Funds Trust (1 fund); Liberty All-Star Equity Fund (1 fund); and Director of the Liberty All-Star Growth Fund, Inc. (1 fund). |
| Annual Report | April 30, 2019 | 97 |
| Grandeur Peak Funds® | Trustees and Officers |
April 30, 2019 (Unaudited)
OFFICERS
Name, Address* & Year of Birth | Position(s) Held with Fund | Term of Office** and Length of Time Served | Principal Occupation(s) During Past 5 Years*** |
Kimberly R. Storms, 1972 | Treasurer | Ms. Storms was elected Treasurer of the Trust at the March 12, 2013 meeting of the Board of Trustees. | Ms. Storms is Senior Vice President - Director of Fund Administration of ALPS. Because of her position with ALPS, Ms. Storms is deemed an affiliate of the Trust as defined under the 1940 Act. Ms. Storms is also Treasurer of Liberty All-Star Equity Fund, Liberty All-Star Growth Fund, Inc., and ALPS Series Trust. Ms. Storms also serves as a Board member and Treasurer of The Center for Trauma & Resilience, a nonprofit agency. |
Karen S. Gilomen, 1970 | Secretary | Ms. Gilomen was elected Secretary of the Trust at the December 13, 2016 meeting of the Board of Trustees. | Ms. Gilomen joined ALPS in August 2016 as Vice President and Senior Counsel. Prior to joining ALPS, Ms. Gilomen was Vice President - General Counsel & CCO of Monticello Associates, Inc. from 2010 to 2016. Because of her position with ALPS, Ms. Gilomen is deemed an affiliate of the Trust, as defined under the 1940 Act. Ms. Gilomen is also the Secretary of Reaves Utility Income Fund and the Assistant Secretary of the WesMark Funds. |
Ted Uhl, 1974 | Chief Compliance Officer (“CCO”) | Mr. Uhl was appointed CCO of the Trust at the June 8, 2010 meeting of the Board of Trustees. | Mr. Uhl joined ALPS in October 2006, and is currently Deputy Compliance Officer of ALPS. Prior to his current role, Mr. Uhl served as Senior Risk Manager for ALPS from October 2006 until June 2010. Before joining ALPS, Mr. Uhl served a Sr. Analyst with Enenbach and Associates (RIA), and a Sr. Financial Analyst at Sprint. Because of his position with ALPS, Mr. Uhl is deemed an affiliate of the Trust as defined under the 1940 Act. Mr. Uhl is also CCO of the Axonic Alternative Income Fund, Boulder Growth & Income Fund, Inc., Centre Funds, Index Funds, Reality Shares ETF Trust, Reaves Utility Income Fund and XAI Octagon Floating Rate & Alternative Income Term Trust. |
Jennell Panella, 1974 | Assistant Treasurer | Ms. Panella was elected Assistant Treasurer of the Trust at the September 15, 2015 meeting of the Board of Trustees | Ms. Panella joined ALPS in June 2012 and is currently Fund Controller of ALPS Fund Services, Inc. Prior to joining ALPS, Ms. Panella served as Financial Reporting Manager for Parker Global Strategies, LLC (2009-2012). Because of her position with ALPS, Ms. Panella is deemed an affiliate of the Trust as defined under the 1940 Act. Ms. Panella also serves as Assistant Treasurer of James Advantage Funds. |
Sharon Akselrod, 1974 | Assistant Secretary | Ms. Akselrod was elected Assistant Secretary of the Trust at the September 15, 2015 meeting of the Board of Trustees. | Ms. Akselrod joined ALPS in August 2014 and is currently Senior Investment Company Act Paralegal of ALPS Fund Services, Inc. Prior to joining ALPS, Ms. Akselrod served as Corporate Governance and Regulatory Associate for Nordstrom fsb (2013-2014) and Senior Legal Assistant – Legal Manager for AXA Equitable Life Insurance Company (2008-2013). Because of her position with ALPS, Ms. Akselrod is deemed an affiliate of the Trust as defined under the 1940 Act. Ms. Akselrod is also Assistant Secretary of ALPS ETF Trust, Clough Funds Trust and Principal Real Estate Income Fund. |
| 98 | 1.855.377.7325 | www.GrandeurPeakGlobal.com |
| Grandeur Peak Funds® | Trustees and Officers |
April 30, 2019 (Unaudited)
OFFICERS
Name, Address* & Year of Birth | Position(s) Held with Fund | Term of Office** and Length of Time Served | Principal Occupation(s) During Past 5 Years*** |
Jennifer Craig, 1973 | Assistant Secretary | Ms. Craig was elected Assistant Secretary of the Trust at the June 8, 2016 meeting of the Board of Trustees. | Ms. Craig joined ALPS in 2007 and is currently Assistant Vice President and Paralegal Manager of ALPS. Prior to joining ALPS, Ms. Craig was Legal Manager at Janus Capital Management LLC and served as Assistant Secretary of Janus Investment Fund, Janus Adviser Series and Janus Aspen Series. Because of her position with ALPS, Ms. Craig is deemed an affiliate of the Trust as defined under the 1940 Act. Ms. Craig is also Assistant Secretary of Clough Global Dividend and Income Fund, Clough Global Equity Fund, Clough Global Opportunities Fund, Liberty All-Star Equity Fund and Liberty All-Star Growth Fund, Inc. |
Sareena Khwaja-Dixon, 1980 | Assistant Secretary | Ms. Khwaja-Dixon was elected Assistant Secretary of the Trust at the December 12, 2017 meeting of the Board of Trustees. | Ms. Khwaja-Dixon joined ALPS in August 2015 and is currently Senior Counsel and Vice President of ALPS Fund Services, Inc. Prior to joining ALPS, Ms. Khwaja-Dixon served as a Senior Paralegal/Paralegal for Russell Investments (2011 – 2015). Ms. Khwaja-Dixon is also Secretary of Liberty All-Star Equity Fund and Liberty All-Star Growth Fund, Inc., Clough Funds Trust, Clough Dividend and Income Fund, Clough Global Opportunities Fund, and Clough Global Equity Fund. |
| * | All communications to Trustees and Officers may be directed to Financial Investors Trust c/o 1290 Broadway, Suite 1100, Denver, CO 80203. |
| ** | This is the period for which the Trustee or Officer began serving the Trust. Each Trustee and/or Officer serves an indefinite term, until his successor is elected. Officers are elected on an annual basis. |
| *** | Except as otherwise indicated, each individual has held the office shown or other offices in the same company for the last five years. |
| **** | The Fund Complex includes all series of the Trust (currently 31) and any other investment companies for which Grandeur Peak Global Advisors LLC provides investment advisory services (currently none). |
| ^ | Effective June 12, 2019, Mr. Burke’s term as President of the Trust ended and Bradley J. Swenson was appointed President of the Trust. |
| Annual Report | April 30, 2019 | 99 |
| Grandeur Peak Funds® | Privacy Policy |
April 30, 2019 (Unaudited)
| Who We Are |
| Who is providing this notice? | Grandeur Peak Global Opportunities Fund, Grandeur Peak International Opportunities Fund, Grandeur Peak Global Reach Fund, Grandeur Peak Emerging Markets Opportunities Fund, Grandeur Peak Global Micro Cap Fund, Grandeur Peak Global Stalwarts Fund, and Grandeur Peak International Stalwarts Fund. |
| What We Do |
| How do the Funds protect my personal information? | To protect your personal information from unauthorized access and use, we use security measures that comply with federal law. These measures include computer safeguards and secured files and buildings. |
| How do the Funds collect my personal information? | We collect your personal information, for example, when you ● open an account ● provide account information or give us your contact information ● make a wire transfer or deposit money |
| Why can’t I limit all sharing? | Federal law gives you the right to limit only ● sharing for affiliates’ everyday business purposes-information about your creditworthiness ● affiliates from using your information to market to you ● sharing for non-affiliates to market to you State laws and individual companies may give you additional rights to limit sharing. |
| Definitions |
| Affiliates | Companies related by common ownership or control. They can be financial and nonfinancial companies. |
| Non-affiliates | Companies not related by common ownership or control. They can be financial and nonfinancial companies. ● The Funds does not share with non-affiliates so they can market to you. |
| Joint marketing | A formal agreement between non-affiliated financial companies that together market financial products or services to you. ● The Funds does not jointly market. |
| Other Important Information |
| California Residents | If your account has a California home address, your personal information will not be disclosed to nonaffiliated third parties except as permitted by applicable California law, and we will limit sharing such personal information with our affiliates to comply with California privacy laws that apply to us. |
| Vermont Residents | The State of Vermont requires financial institutions to obtain your consent prior to sharing personal information that they collect about you with affiliated companies and nonaffiliated third parties other than in certain limited circumstances. Except as permitted by law, we will not share personal information we collect about you with nonaffiliated third parties or other affiliated companies unless you provide us with your written consent to share such information. |
| 100 | 1.855.377.7325 | www.GrandeurPeakGlobal.com |
| Grandeur Peak Funds® | Privacy Policy |
April 30, 2019 (Unaudited)
| | WHAT DO THE FUNDS DO WITH YOUR PERSONAL INFORMATION? |
| Why? | Financial companies choose how they share your personal information. Federal law gives consumers the right to limit some but not all sharing. Federal law also requires us to tell you how we collect, share, and protect your personal information. Please read this notice carefully to understand what we do. |
| What? | The types of personal information we collect and share depend on the product or service you have with us. This information can include: ● Social Security number and account transactions ● Account balances and transaction history ● Wire transfer instructions |
| HOW? | All financial companies need to share customers’ personal information to run their everyday business. In the section below, we list the reasons financial companies can share their customers’ personal information; the reasons the Funds choose to share; and whether you can limit this sharing. |
| Reasons we can share your personal information | Do the Funds share: | Can you limit this sharing? |
| For our everyday business purposes — such as to process your transactions, maintain your account(s), respond to court orders and legal investigations, or report to credit bureaus | Yes | No |
| For our marketing purposes — to offer our products and services to you | No | We do not share. |
| For joint marketing with other financial companies | No | We do not share. |
| For our affiliates’ everyday business purposes — information about your transactions and experiences | Yes | No |
| For our affiliates’ everyday business purposes — information about your creditworthiness | No | We do not share. |
| For nonaffiliates to market to you | No | We do not share. |
| Annual Report | April 30, 2019 | 101 |

Contact Us
| Mail: | Grandeur Peak Funds, P.O. Box 13664, Denver, CO 80201 | E-Mail: | grandeurpeakglobal@alpsinc.com |
| Phone: | 1.855.377.PEAK (7325) | Web: | www.GrandeurPeakGlobal.com |
ANNUALApril 30, 2019
Highland Resolute Fund
Class I RMRGX
| Highland Resolute Fund | Table of Contents |
| | PAGE |
| Shareholder Letter | 2 |
| Performance Update | 7 |
| Consolidated Disclosure of Fund Expenses | 9 |
| Consolidated Schedule of Investments | 10 |
| Consolidated Statement of Assets and Liabilities | 25 |
| Consolidated Statement of Operations | 26 |
| Consolidated Statements of Changes in Net Assets | 27 |
| Consolidated Financial Highlights | 28 |
| Notes to Consolidated Financial Statements | 29 |
| Report of Independent Registered Accounting Firm | 40 |
| Disclosure Regarding Approval of Fund Advisory Agreements | 41 |
| Additional Information | 45 |
| Trustees & Officers | 46 |
| Privacy Policy | 51 |
1
| Highland Resolute Fund | Shareholder Letter |
April 30, 2019 (Unaudited)
PERFORMANCE:
April 30, 2019
The Highland Resolute Fund outperformed the HFRX Global Hedge Fund Index(1) by about 299 basis points(2) over the twelve months ending April 30, 2019. The Fund historically has strong up market capture with down market capture in line with the index. Since inception, the Fund has outperformed the HFRX Global Hedge Fund Index by roughly 220 basis points annualized. This is due primarily to a higher level of net equity exposure relative to the benchmark; which helped the Fund keep up with strong equity markets.
When compared to the peer group (Morningstar Multi-Alternative Universe)(3), the Fund has underperformed the Universe over the last twelve months but has continued to outperform the Universe materially over longer time horizons – by about 200 basis points annualized since inception. As with the HFRX Global Index, the Universe is very diverse and contains a number of market-neutral and other low net equity strategies that can cause the average net equity exposure for the Universe to be considerably less than our Fund. So, we anticipate outperforming the Universe in up markets and underperforming in down markets – recent performance has been consistent with our expectations.
Long/Short Equity– Long/Short equity outperformed the HFRX Equity Hedge Index(4) over the last 12 months, as all three strategies outperformed. The best performer was a U.S. focused generalist, which was the worst performer in 2018.
Macro– The sole Macro manager has outperformed the HFRX Macro Index(5) over the last 12 months. Increased volatility in equity markets has caused some of the outperformance. This sector is a small allocation and is held as a risk-off return contributor.
Credit/Global Tactical Asset Allocation – The lone credit strategy outperformed the HFRX Fixed Income – Credit Index(6) over the past 12 months. Performance was largely driven by positions in print media.
Relative Value– The Relative Value sleeve outperformed the HFRX Relative Value Arbitrage Index(7) over the past 12 months. Some outperformance from a multi-strategy fund was offset by negative absolute returns from a quantitative equity strategy that performed poorly due to its emerging markets exposure. This quantitative equity strategy was liquidated during the 1st quarter.
Event Driven – The Event Driven sleeve outperformed the HFRX Event Driven Index(8) over the past 12 months. A merger arbitrage focused manager has been the best performer in the sleeve with a few large mergers being responsible for most of the gains. A quantitative strategy struggled in many of its equity-oriented strategies and offset some of the outperformance in the sleeve.
Past performance is no guarantee of future results.
| Highland Resolute Fund | Shareholder Letter |
April 30, 2019 (Unaudited)
HIGHLAND RESOLUTE FUND
Table 1 notes the performance for the Fund as of quarter end under standard reporting (since inception) as well as of April 30th.
Table 1(1)(3)(9)(10)
Performance(amounts greater than one year are annualized)
| | Standardized Performance Data as of March 31, 2019 | Non-Standardized Performance Data as of April 30, 2019 |
| | YTD | 1-Year | 3-Year | 5-Year | Since Inception (12/30/11) | YTD | 1-Year | 3-Year | 5-Year | Since Inception (12/30/11) |
| Highland Resolute Fund - Class I NAV | 5.41% | -1.80% | 3.25% | 2.20% | 3.42% | 7.18% | 0.22% | 3.56% | 2.54% | 3.62% |
| Morningstar Multi-Alternative Universe | 4.24% | 0.28% | 2.12% | 0.93% | 1.54% | 5.34% | 1.09% | 2.44% | 1.10% | 1.67% |
| HFRX Global Hedge Fund Index | 2.60% | -3.32% | 1.95% | -0.30% | 1.33% | 3.28% | -2.77% | 2.04% | -0.02% | 1.40% |
| S&P 500® Index | 13.65% | 9.50% | 13.51% | 10.91% | 14.23% | 18.25% | 13.49% | 14.87% | 11.63% | 14.68% |
| | Gross Expense Ratio | Less Expense Waivers | Net Expense Ratio | Net Ratio ex Dividend & Short Expense |
| Highland Resolute Fund - Class I NAV | 2.47% | -1.20% | 1.27% | 1.19% |
Performance data quoted represents past performance. Past performance does not guarantee future results. Investment return and principal value of an investment will fluctuate so that an investor’s shares, when sold or redeemed, may be worth more or less than the original cost. Current performance data may be higher or lower than actual data quoted. For the most current month-end performance data please call 1-855-268-2242.
The Fund has a redemption fee of 2.00% for shares redeemed within the first 90 days of purchase. Performance shown at NAV does not include these sales charges and would have been lower had it been taken into account.
The Adviser has agreed to waive the portion of its 1.50% Management Fee in excess of any sub-advisory fees paid by the Adviser to sub-advisors in connection with the Fund (“Sub-Advisory Fees”). This agreement (the “Expense Agreement”) is in effect through August 31, 2019. The Adviser may not discontinue this agreement to waive fees prior to August 31, 2019 without the approval by the Fund’s Board of Trustees.
Net Ratio ex Dividend & Short Expense is the Net Expense Ratio less any Dividend and Interest Expense on Securities Sold Short.
Non-standardized performance is any performance period that doesn’t fall on a quarter end.
Portfolio Changes:
During the period, a quantitative equity strategy in the Relative Value space was liquidated.
Closing:
We continue to add value both in our allocation and manager selection decisions. We appreciate your investment in our Highland Resolute Fund, please feel free to contact us with any questions.
Sincerely,

R. Scott Graham, CFA & Michael T. Lytle, CFA
Portfolio Managers(11)
| Annual Report | April 30, 2019 | 3 |
| Highland Resolute Fund | Shareholder Letter |
April 30, 2019 (Unaudited)
Underlying Allocation Weights:
Figure 1lists the long-term target asset allocation for the Fund as well as the allocation as of April 30, 2019.

Holdings and allocations subject to change and may not reflect the current or future position of the portfolio.
4
| Highland Resolute Fund | Shareholder Letter |
April 30, 2019 (Unaudited)
IMPORTANT NOTES AND DISCLOSURES
Past performance does not guarantee future results.
Fund prices fluctuate as the underlying assets have exposure to market fluctuations and other risks, as described in the Fund’s prospectus. Please call 1-855-268-2242 to obtain current performance information and for the current prospectus and statement of additional information. This material must be preceded or accompanied by a prospectus. Please read the prospectus carefully before investing.
The views of Highland Associates, Inc. and the information discussed in this commentary are as of the date of publication, are subject to change, and may not reflect the writers’ current views. The views expressed are those of the Fund’s adviser only, and represent an assessment of market conditions at a specific point in time, are opinions only and should not be relied upon as investment advice regarding a particular investment or markets in general. Such information does not constitute a recommendation to buy or sell specific securities or investment vehicles. It should not be assumed that any investment will be profitable or will equal the performance of the portfolios or any securities or any sectors mentioned in this letter. The subject matter contained in this letter has been derived from several sources believed to be reliable and accurate at the time of compilation. Neither Highland Associates, Inc. nor the Fund accepts any liability for losses either direct or consequential caused by the use of this information.
The Highland Resolute Fund is distributed by ALPS Distributors, Inc.
The Fund is subject to investment risks, including possible loss of the principal amount invested and therefore is not suitable for all investors. The Fund may not achieve its objectives.
Diversification does not eliminate the risk of experiencing investment losses.
RISKS:
The Fund’s strategy may expose it to the risks of investments in Swap Contracts and Other Investment Companies. These risks include, but are not limited to higher expenses, allocation risk, underlying fund risk, transparency risk, and underlying fund managed portfolio risk. Investments which focus on alternative strategies are subject to increased risk and loss of principal and are not suitable for all investors. Swap Risk involves swap agreements and are subject to counterparty default risk and may not perform as intended. Derivatives Risk involves the exercise of skill and judgment. Derivatives may expire worthless or not perform as expected. Equity risk may cause the value of the securities held by the Fund to fall due to general market and economic conditions, perceptions regarding the industries in which the issuers of securities held by the Fund participate, or factors relating to specific companies in which the Fund invest.
The Fund’s investments in non-U.S. issuers may be even more volatile and may present more risks than investments in U.S. issuers.
Commodity Risk may subject the Funds to greater volatility than traditional investments because of global supply and demand, changes in interest rates, commodity index volatility, and factors affecting a particular industry or commodity. Commodity-linked investments may not move in the same direction and to the same extent as the underlying commodities.
| (1) | The HFRX Global Hedge Fund Index is designed to be representative of the overall composition of the hedge fund universe, and includes convertible arbitrage, distressed securities, equity hedge, equity market neutral, event driven, macro, merger arbitrage, and relative value strategies. The index returns are updated periodically and are subject to change. The returns were accurate as of the date of this publication. Investors cannot invest directly in an index. |
| (2) | Basis point is a common unit of measure for interest rates and other percentages in finance. One basis point is equal to 1/100th of 1% or 0.01%(.0001). |
| (3) | The Morningstar Multi-Alternative Universe is designed to represent the exposure to alternative investment tactics. Funds in this category have the majority of their assets exposed to alternative strategies. An investor’s exposure to different tactics may change slightly over time in response to market movements. Funds in this category include both funds with static allocations to alternative strategies and funds tactically allocating among alternative strategies and asset classes. The gross short exposure is greater than 20%. |
| (4) | The HFRX Equity Hedge Index is designed to be representative of a subset of the overall composition of the hedge fund universe. Equity Hedge strategies maintain positions both long and short in primarily equity and equity derivative securities. The index returns are updated periodically and are subject to change. The returns were accurate as of the date of this publication. The index figures do not reflect any fees, expense, or taxes. Investors cannot invest directly in an index. |
| (5) | The HFRX Macro Index is designed to be representative of a subset of the overall composition of the hedge fund universe. Macro strategy managers trade a broad range of strategies in which the investment process is predicated on movements in underlying economic variables and the impact these have on equity, fixed income, hard currency and commodity markets. Managers employ a variety of techniques, both discretionary and systematic analysis, combinations of top down and bottom up theses, quantitative and fundamental approaches and long and short-term holding periods. The index returns are updated periodically and are subject to change. The returns were accurate as of the date of this publication. The index figures do not reflect any fees, expense, or taxes. Investors cannot invest directly in an index. |
| Annual Report | April 30, 2019 | 5 |
| Highland Resolute Fund | Shareholder Letter |
April 30, 2019 (Unaudited)
| (6) | The HFRX Fixed Income - Credit Index is designed to be representative of a subset of the overall composition of the hedge fund universe. It includes strategies with exposure to credit across a broad continuum of credit sub-strategies, including Corporate, Sovereign, Distressed, Convertible, Asset Backed, Capital Structure Arbitrage, Multi-Strategy and other Relative Value and Event Driven sub-strategies. The index returns are updated periodically and are subject to change. The returns were accurate as of the date of this publication. The index figures do not reflect any fees, expense, or taxes. Investors cannot invest directly in an index. |
| (7) | The HFRX Relative Value Arbitrage Index is designed to be representative of a subset of the overall composition of the hedge fund universe. Relative Value investment managers who maintain positions in which the investment thesis is predicated on realization of a valuation discrepancy in the relationship between multiple securities. Managers employ a variety of fundamental and quantitative techniques to establish investment theses, and security types range broadly across equity, fixed income, derivative or other security types. The index returns are updated periodically and are subject to change. The returns were accurate as of the date of this publication. The index figures do not reflect any fees, expense, or taxes. Investors cannot invest directly in an index. |
| (8) | The HFRX Event Driven Index maintains positions in companies currently or prospectively involved in corporate transactions of a wide variety including but not limited to mergers, restructurings, financial distress, tender offers, shareholder buybacks, debt exchanges, security issuance or other capital structure adjustments. Security types can range from most senior in the capital structure to most junior or subordinated, and frequently involve additional derivative securities. Event Driven exposure includes a combination of sensitivities to equity markets, credit markets and idiosyncratic, company specific developments. The index returns are updated periodically and are subject to change. The returns were accurate as of the date of this publication. The index figures do not reflect any fees, expense, or taxes. Investors cannot invest directly in an index. |
| (9) | The S&P 500®Index is an unmanaged index of 500 common stocks chosen for market size, liquidity, and industry group representation. It is a market value weighted index. The S&P 500® Index figures do not reflect any fees, expenses, or taxes. Investors cannot invest directly in this index. |
| (10) | Highland Associates, Inc. has agreed to waive the portion of its 1.50% Management Fee in excess of any sub-advisory fees paid by the Adviser to sub-advisors in connection with the Highland Resolute Fund. This agreement is in effect through August 31, 2019. The Adviser may not discontinue this agreement to waive fees without the approval by the Fund’s Board of Trustees. |
| (11) | R. Scott Graham and Michael T. Lytle are registered representatives of ALPS Distributors, Inc. CFA Institute Marks are trademarks owned by the CFA Institute. |
6
| Highland Resolute Fund | Performance Update |
April 30, 2019 (Unaudited)
Performance(for the period ended April 30, 2019)
Highland Resolute Fund
Cumulative Total Return
| (for the period ended April 30, 2019) | 1 Year | 3 Year | 5 Year | Since Inception* | Gross Ratio(a) | Net Ratio(a) |
| Highland Resolute Fund - Class I - NAV | 0.22% | 3.56% | 2.54% | 3.62% | 2.47% | 1.27% |
| S&P 500® Index(b) | 13.49% | 14.87% | 11.63% | 14.67% | | |
| Dow Jones U.S. Select Dividend Index(c) | 9.04% | 11.20% | 10.17% | 13.05% | | |
| HFRX Global Hedge Fund Index(d) | -2.77% | 2.04% | -0.02% | 1.40% | | |
Performance data quoted represents past performance. Past performance does not guarantee future results. Investment return and principal value of an investment will fluctuate so that an investor’s shares, when sold or redeemed, may be worth more or less than the original cost. Current performance data may be higher or lower than actual data quoted. For the most current month-end performance data please call 1-855-268-2242.
The Fund has a redemption fee of 2.00% for shares redeemed within the first 90 days of purchase. Performance shown at NAV does not include these sales charges and would have been lower had it been taken into account.
The Adviser has agreed to waive the portion of its 1.50% Management Fee in excess of any sub-advisory fees paid by the Adviser to sub-advisors in connection with the Fund (“Sub-Advisory Fees”). This agreement (the “Expense Agreement”) is in effect through August 31, 2019. The Adviser may not discontinue this agreement to waive fees prior to August 31, 2019 without the approval by the Fund’s Board of Trustees.
| * | Fund inception date of 12/30/11. |
| (a) | Ratios as of the Prospectus dated August 31, 2018 and may differ from the ratios presented in the Financial Highlights. |
| (b) | The S&P 500® Index is the Standard & Poor's composite index of 500 stocks, a widely recognized, unmanaged index of common stock prices. The index is not actively managed and does not reflect any deduction of fees, expenses or taxes. An investor may not invest directly in an index. |
| (c) | The Dow Jones U.S. Select Dividend Index is an additional index, and represents the country’s top stocks by dividend yield, selected annually and subject to screening and buffering criteria. The index is not actively managed and does not reflect any deductions of fees, expenses or taxes. An investor may not invest directly in an index. |
| (d) | The HFRX Global Hedge Fund Index is an additional index, and is designed to be representative of the overall composition of the hedge fund universe and includes convertible arbitrage, distressed securities, equity hedge, equity market neutral, event driven, macro, merger arbitrage and relative value strategies. The index returns are updated periodically and are subject to change. The returns were accurate as of the date of this publication. The index is not actively managed and does not reflect any deduction of fees, expenses or taxes. An investor may not invest directly in an index. |
The table does not reflect the deduction of taxes that a shareholder would pay on Fund distributions or the redemption of Fund shares.
Top Ten Holdings**
(for the period ended April 30, 2019)
As a percentage of Net Assets
| PIMCO Short-Term Fund,Institutional Class | 30.57% |
| AQR Multi Strategy AlternativeFund, Class I | 9.99% |
| Worldwide Media Services Group, Inc. | 2.98% |
| Harland Clarke Holdings Corp. | 2.33% |
| Mohegan Tribal Gaming | 1.28% |
| RR Donnelley & Sons Co. | 1.21% |
| One Call Corp. | 1.12% |
| McClatchy Co. | 1.03% |
| One Call Corp. | 0.84% |
| Wyndham Hotels & Resorts, Inc. | 0.82% |
| Top Ten Holdings | |
| ** | Holdings are subject to change, and may not reflect the current or future position of the portfolio. |
| Annual Report | April 30, 2019 | 7 |
| Highland Resolute Fund | Performance Update |
April 30, 2019 (Unaudited)
Performance of $10,000 Initial Investment(for the period ended April 30, 2019)
Comparison of change in value of a $10,000 investment

The chart represents historical performance of a hypothetical investment of $10,000 in the Fund since inception. Past performance does not guarantee future results. This chart does not reflect the deduction of taxes that a shareholder would pay on Fund distributions or the redemption of Fund shares.
Investing in the Fund is subject to investment risks, including possible loss of the principal amount invested.
8
| Highland Resolute Fund | Consolidated Disclosure of Fund Expenses |
April 30, 2019 (Unaudited)
As a shareholder of the Fund, you incur two types of costs: (1) transaction costs, including applicable sales charges (loads), redemption fees; and (2) ongoing costs, including management fees, distribution and service (12b-1) fees, shareholder services fees and other Fund operating expenses. This example is intended to help you understand your ongoing costs (in dollars) of investing in the Fund and to compare these costs with the ongoing costs of investing in other mutual funds.
This example is based on an investment of $1,000 invested at the beginning of the period and held for the six-month period of November 1, 2018 to April 30, 2019.
Actual Expenses. The first line of the table below provides information about actual account values and actual expenses. You may use the information in this line, together with the amount you invested to estimate the expenses that you paid over the period. Simply divide your account value by $1,000 (for example, an $8,600 account value divided by $1,000 = 8.6), then multiply the result by the number in the first line of the table below under the heading titled “Expenses Paid During Period” to estimate the expenses you paid on your account during this period.
Hypothetical Example for Comparison Purposes. The second line of the table below provides information about hypothetical account values and hypothetical expenses based on the Fund’s actual expense ratio and an assumed rate of return of 5% per year before expenses, which is not the Fund’s actual return. The hypothetical account values and expenses may not be used to estimate the actual ending account balance or expenses you paid for the period. You may use this information to compare the ongoing costs of investing in the Fund and other mutual funds. To do so, compare this 5% hypothetical example with the 5% hypothetical examples that appear in the shareholder reports of the other funds.
Please note that the expenses shown in the table below are meant to highlight your ongoing costs only and do not reflect any transactional costs, such as applicable sales charges (loads), redemption fees, or exchange fees. Therefore, the second line of the table below is useful in comparing ongoing costs only and will not help you determine the relative total costs of owning different funds. In addition, if these transactional costs were included, your costs would have been higher.
| Highland Resolute Fund | BEGINNING
ACCOUNT VALUE
11/01/18 | ENDING
ACCOUNT VALUE
04/30/19 | EXPENSE
RATIO(a) | EXPENSES PAID
DURING THE
PERIOD
11/01/18-04/30/19(b) |
| Class I | | | | |
| Actual | $1,000.00 | $1,044.80 | 0.82% | $4.16 |
| Hypothetical (5% return before expenses) | $1,000.00 | $1,020.73 | 0.82% | $4.11 |
| (a) | Annualized, based on the Fund's most recent fiscal half year expenses. |
| (b) | Expenses are equal to the Fund's annualized expense ratio multiplied by the average account value over the period, multiplied by the number of days in the most recent fiscal half-year (181)/365 (to reflect the half-year period). |
| Annual Report | April 30, 2019 | 9 |
| Highland Resolute Fund | Consolidated Schedule of Investments |
| | April 30, 2019 |
| Description | | Shares | | Value
(Note 2) |
| COMMON STOCKS (12.98%) | | | | | | | | |
| AEROSPACE & DEFENSE (0.13%) | | | | | | | | |
| Raytheon Co. | | | 2,528 | | | $ | 448,948 | |
| | | | | | | | | |
| ASSET MANAGEMENT (0.54%) | | | | | | | | |
| Apollo Global Management LLC, Class A | | | 54,845 | | | | 1,792,883 | |
| | | | | | | | | |
| DISTRIBUTION & WHOLESALE (0.76%) | | | | | | | | |
| LKQ Corp.(a)(b) | | | 84,420 | | | | 2,541,042 | |
| | | | | | | | | |
| DIVERSIFIED FINANCIAL SERVICES (0.78%) | | | | | | | | |
| Visa, Inc., Class A(b) | | | 15,755 | | | | 2,590,595 | |
| | | | | | | | | |
| ELECTRIC (0.23%) | | | | | | | | |
| PG&E Corp.(a) | | | 34,339 | | | | 773,314 | |
| | | | | | | | | |
| FOOD SERVICE (0.47%) | | | | | | | | |
| Aramark | | | 50,127 | | | | 1,557,947 | |
| | | | | | | | | |
| HEALTHCARE - SERVICES (0.74%) | | | | | | | | |
| UnitedHealth Group, Inc. | | | 10,541 | | | | 2,456,791 | |
| | | | | | | | | |
| HOTELS, RESTAURANTS & LEISURE (0.82%) | | | | | | | | |
| Wyndham Hotels & Resorts, Inc. | | | 48,815 | | | | 2,719,972 | |
| | | | | | | | | |
| INTERNET (3.72%) | | | | | | | | |
| Alibaba Group Holding, Ltd., Sponsored ADR(a) | | | 12,571 | | | | 2,332,800 | |
| Alphabet, Inc., Class A(a)(b) | | | 1,828 | | | | 2,191,699 | |
| Amazon.com, Inc.(a)(b) | | | 1,320 | | | | 2,543,006 | |
| ANGI Homeservices, Inc., Class A(a) | | | 181 | | | | 3,146 | |
| Booking Holdings, Inc.(a)(b) | | | 1,426 | | | | 2,645,216 | |
| Facebook, Inc., Class A(a)(b) | | | 13,732 | | | | 2,655,769 | |
| | | | | | | | 12,371,636 | |
| | | | | | | | | |
| LODGING (0.66%) | | | | | | | | |
| Extended Stay America, Inc. | | | 122,795 | | | | 2,199,258 | |
| | | | | | | | | |
| MEDIA (1.11%) | | | | | | | | |
| Fox Corp., Class B(a) | | | 29,617 | | | | 1,140,254 | |
| Liberty Global PLC, Class C(a)(b) | | | 97,126 | | | | 2,539,845 | |
| | | | | | | | 3,680,099 | |
| See Notes to Financial Statements. |
| 10 |
| Highland Resolute Fund | Consolidated Schedule of Investments |
| | April 30, 2019 |
| Description | | Shares | | Value
(Note 2) |
| PIPELINES (0.69%) | | | | |
| Energy Transfer LP | | | 152,310 | | | $ | 2,302,927 | |
| | | | | | | | | |
| SOFTWARE (1.59%) | | | | | | | | |
| Fidelity National Information Services, Inc. | | | 4,030 | | | | 467,198 | |
| First Data Corp., Class A(a) | | | 97,896 | | | | 2,531,591 | |
| SS&C Technologies Holdings, Inc.(b) | | | 33,747 | | | | 2,283,322 | |
| | | | | | | | 5,282,111 | |
| | | | | | | | | |
| SPECIALTY FINANCE (0.74%) | | | | | | | | |
| Worldpay, Inc., Class A(a) | | | 20,882 | | | | 2,447,579 | |
| | | | | | | | | |
| TOTAL COMMON STOCKS | | | | | | | | |
| (Cost $38,592,859) | | | | | | | 43,165,102 | |
| | | | | | | | | |
| OPEN-END MUTUAL FUNDS (40.49%) | | | | | | | | |
| AQR Multi Strategy Alternative Fund, Class I(a) | | | 4,327,177 | | | | 33,146,177 | |
| PIMCO Short-Term Fund, Institutional Class | | | 10,343,787 | | | | 101,472,553 | |
| | | | | | | | 134,618,730 | |
| | | | | | | | | |
| TOTAL OPEN-END MUTUAL FUNDS | | | | | | | | |
| (Cost $141,101,393) | | | | | | | 134,618,730 | |
| | | Notional Amount | | Exercise Date | | Exercise Price | | Contracts | | Value
(Note 2) |
| PURCHASED PUT OPTIONS (0.03%) | | | | | | | | | | | | | | | | | | | | |
| S&P 500® Index | | $ | 22,977,474 | | | | 05/17/2019 | | | $ | 2,750 | | | | 78 | | | | 22,620 | |
| S&P 500® Index | | | 23,272,057 | | | | 05/31/2019 | | | | 2,775 | | | | 79 | | | | 61,620 | |
| | | | | | | | | | | | | | | | | | | | 84,240 | |
| | | | | | | | | | | | | | | | | | | | | |
| TOTAL PURCHASED PUT OPTIONS | | | | | | | | | | | | | | | | | | | | |
| (Cost $130,981) | | | | | | | | | | | | | | | | | | | 84,240 | |
| Description | | | Principal Amount | | Value
(Note 2) |
| CORPORATE BONDS (17.92%) | | | | |
| AEROSPACE & DEFENSE (0.34%) | | | | |
| TransDigm, Inc. | | | | | | | | |
| 6.25%, | 03/15/2026(c) | | $ | 485,000 | | | | 506,219 | |
| 7.50%, | 03/15/2027(c) | | | 286,000 | | | | 295,652 | |
| Triumph Group, Inc. | | | | | | | | |
| 4.88%, | 04/01/2021 | | | 147,000 | | | | 145,530 | |
| 5.25%, | 06/01/2022 | | | 176,000 | | | | 174,680 | |
| | | | | | | | | 1,122,081 | |
| | | | | | | | | | |
| COAL (0.06%) | | | | | | | | |
| SunCoke Energy Partners LP / SunCoke Energy Partners Finance Corp. | | | | | | | | |
| 7.50%, | 06/15/2025(c) | | | 213,000 | | | | 215,663 | |
| See Notes to Financial Statements. | |
| Annual Report | April 30, 2019 | 11 |
| Highland Resolute Fund | Consolidated Schedule of Investments |
| | April 30, 2019 |
| Description | | | Principal Amount | | Value
(Note 2) |
| COMMERCIAL SERVICES (2.35%) | | | | | | | | |
| Great Lakes Dredge & Dock Corp. | | | | | | | | |
| 8.00%, | 05/15/2022 | | $ | 65,000 | | | $ | 68,819 | |
| Midas Intermediate Holdco II LLC / Midas Intermediate Holdco II Finance, Inc. | | | | | | | | |
| 7.88%, | 10/01/2022(c) | | | 537,000 | | | | 496,725 | |
| RR Donnelley & Sons Co. | | | | | | | | |
| 6.00%, | 04/01/2024 | | | 1,291,000 | | | | 1,303,910 | |
| 6.50%, | 11/15/2023 | | | 3,925,000 | | | | 4,018,219 | |
| 6.63%, | 04/15/2029 | | | 149,000 | | | | 145,647 | |
| 7.00%, | 02/15/2022 | | | 680,000 | | | | 702,950 | |
| 8.88%, | 04/15/2021 | | | 740,000 | | | | 779,775 | |
| Star Merger Sub, Inc. | | | | | | | | |
| 6.88%, | 08/15/2026(c) | | | 274,000 | | | | 285,309 | |
| | | | | | | | | 7,801,354 | |
| | | | | | | | | | |
| COMPUTERS (2.75%) | | | | | | | | |
| Harland Clarke Holdings Corp. | | | | | | | | |
| 8.38%, | 08/15/2022(c) | | | 1,568,000 | | | | 1,399,440 | |
| 9.25%, | 03/01/2021(c) | | | 7,535,500 | | | | 7,742,726 | |
| | | | | | | | | 9,142,166 | |
| | | | | | | | | | |
| DISTRIBUTION & WHOLESALE (0.34%) | | | | | | | | |
| American News Co. LLC | | | | | | | | |
| 8.50% (10.00%), 09/01/2026(c)(d) | | | 721,521 | | | | 770,224 | |
| H&E Equipment Services, Inc. | | | | | | | | |
| 5.63%, | 09/01/2025 | | | 360,000 | | | | 366,750 | |
| | | | | | | | | 1,136,974 | |
| | | | | | | | | | |
| DIVERSIFIED FINANCIAL SERVICES (0.25%) | | | | | | | | |
| Navient Corp. | | | | | | | | |
| 6.75%, | 06/15/2026 | | | 570,000 | | | | 575,752 | |
| Quicken Loans, Inc. | | | | | | | | |
| 5.25%, | 01/15/2028(c) | | | 255,000 | | | | 248,306 | |
| | | | | | | | | 824,058 | |
| | | | | | | | | | |
| ENTERTAINMENT (1.58%) | | | | | | | | |
| Buena Vista Gaming Authority | | | | | | | | |
| 13.00%, | 04/01/2023(c) | | | 380,000 | | | | 382,850 | |
| Enterprise Development Authority | | | | | | | | |
| 12.00%, | 07/15/2024(c) | | | 607,000 | | | | 625,210 | |
| Mohegan Tribal Gaming | | | | | | | | |
| 7.88%, | 10/15/2024(c) | | | 4,331,000 | | | | 4,260,621 | |
| | | | | | | | | 5,268,681 | |
| | | | | | | | | | |
| ENVIRONMENTAL CONTROL (0.20%) | | | | | | | | |
| GFL Environmental, Inc. | | | | | | | | |
| 7.00%, | 06/01/2026(c) | | | 665,000 | | | | 650,038 | |
| | | | | | | | | | |
| HEALTHCARE-SERVICES (2.29%) | | | | | | | | |
| AHP Health Partners, Inc. | | | | | | | | |
| 9.75%, | 07/15/2026(c) | | | 1,004,000 | | | | 1,093,105 | |
| See Notes to Financial Statements. |
| 12 |
| Highland Resolute Fund | Consolidated Schedule of Investments |
| | April 30, 2019 |
| Description | | | Principal Amount | | Value (Note 2) |
| HEALTHCARE-SERVICES (2.29%) (continued) | | | | | | | | |
| One Call Corp. | | | | | | | | |
| 7.50%, | 07/01/2024(c) | | $ | 3,838,000 | | | $ | 3,713,265 | |
| 10.00%, | 10/01/2024(c) | | | 3,123,000 | | | | 2,802,893 | |
| | | | | | | | | 7,609,263 | |
| | | | | | | | | | |
| IRON & STEEL (0.36%) | | | | | | | | |
| AK Steel Corp. | | | | | | | | |
| 6.38%, | 10/15/2025 | | | 362,000 | | | | 304,985 | |
| 7.00%, | 03/15/2027 | | | 274,000 | | | | 233,585 | |
| 7.50%, | 07/15/2023 | | | 86,000 | | | | 88,930 | |
| 7.63%, | 10/01/2021 | | | 578,000 | | | | 578,000 | |
| | | | | | | | | 1,205,500 | |
| | | | | | | | | | |
| LEISURE TIME (0.15%) | | | | | | | | |
| Viking Cruises, Ltd. | | | | | | | | |
| 5.88%, | 09/15/2027(c) | | | 497,000 | | | | 495,757 | |
| | | | | | | | | | |
| LODGING (0.06%) | | | | | | | | |
| Station Casinos LLC | | | | | | | | |
| 5.00%, | 10/01/2025(c) | | | 204,000 | | | | 200,940 | |
| | | | | | | | | | |
| MACHINERY-CONSTRUCTION & MINING (0.28%) | | | | | | | | |
| Vertiv Group Corp. | | | | | | | | |
| 9.25%, | 10/15/2024(c) | | | 515,000 | | | | 505,987 | |
| Vertiv Intermediate Holding Corp. | | | | | | | | |
| 12.00% (13.00%), 02/15/2022(c)(d) | | | 449,000 | | | | 428,234 | |
| | | | | | | | | 934,221 | |
| | | | | | | | | | |
| OIL & GAS (0.07%) | | | | | | | | |
| Par Petroleum LLC / Par Petroleum Finance Corp. | | | | | | | | |
| 7.75%, | 12/15/2025(c) | | | 241,000 | | | | 236,180 | |
| | | | | | | | | | |
| PACKAGING & CONTAINERS (0.14%) | | | | | | | | |
| Plastipak Holdings, Inc. | | | | | | | | |
| 6.25%, | 10/15/2025(c) | | | 477,000 | | | | 448,380 | |
| | | | | | | | | | |
| PHARMACEUTICALS (0.02%) | | | | | | | | |
| Par Pharmaceutical, Inc. | | | | | | | | |
| 7.50%, | 04/01/2027(c) | | | 75,000 | | | | 77,985 | |
| | | | | | | | | | |
| PUBLISHING & BROADCASTING (5.41%) | | | | | | | | |
| American Media LLC | | | | | | | | |
| 10.50%, | 12/31/2026(c) | | | 30,000 | | | | 31,125 | |
| CCO Holdings LLC / CCO Holdings Capital Corp. | | | | | | | | |
| 5.00%, | 02/01/2028(c) | | | 1,178,000 | | | | 1,179,473 | |
| 5.13%, | 05/01/2027(c) | | | 415,000 | | | | 422,262 | |
| CSC Holdings LLC | | | | | | | | |
| 7.75%, | 07/15/2025(c) | | | 217,000 | | | | 233,750 | |
| See Notes to Financial Statements. | |
| Annual Report | April 30, 2019 | 13 |
| Highland Resolute Fund | Consolidated Schedule of Investments |
| | April 30, 2019 |
| Description | | | Principal Amount | | Value
(Note 2) |
| PUBLISHING & BROADCASTING (5.41%) (continued) | | | | |
| McClatchy Co. | | | | | | | | |
| 6.88%, | 07/15/2031(c) | | $ | 2,198,000 | | | $ | 2,588,145 | |
| 9.00%, | 07/15/2026(c) | | | 3,393,000 | | | | 3,409,965 | |
| Sinclair Television Group, Inc. | | | | | | | | |
| 5.13%, | 02/15/2027(c) | | | 250,000 | | | | 241,875 | |
| Worldwide Media Services Group, Inc. | | | | | | | | |
| 0.00%, | 12/01/2024(c)(e) | | | 13,970,693 | | | | 9,884,265 | |
| | | | | | | | | 17,990,860 | |
| | | | | | | | | | |
| RETAIL (0.25%) | | | | | | | | |
| Golden Nugget, Inc. | | | | | | | | |
| 8.75%, | 10/01/2025(c) | | | 802,000 | | | | 842,100 | |
| | | | | | | | | | |
| SEMICONDUCTORS (0.17%) | | | | | | | | |
| Amkor Technology, Inc. | | | | | | | | |
| 6.63%, | 09/15/2027(c) | | | 544,000 | | | | 556,580 | |
| | | | | | | | | | |
| SOFTWARE (0.75%) | | | | | | | | |
| Rackspace Hosting, Inc. | | | | | | | | |
| 8.63%, | 11/15/2024(c) | | | 2,654,000 | | | | 2,481,490 | |
| | | | | | | | | | |
| TRANSPORTATION (0.10%) | | | | | | | | |
| XPO Logistics, Inc. | | | | | | | | |
| 6.13%, | 09/01/2023(c) | | | 330,000 | | | | 338,250 | |
| | | | | | | | | | |
| TOTAL CORPORATE BONDS | | | | | | | | |
| (Cost $56,603,945) | | | | | | | 59,578,521 | |
| Description | | Shares | | Value
(Note 2) |
| Short Term Investments (9.96%) | | | | | | | | |
| MONEY MARKET FUNDS (9.96%) | | | | | | | | |
| Dreyfus Treasury Cash Management Fund, Institutional Class, 7-day yield, 2.300%(b) | | | 33,093,202 | | | | 33,093,202 | |
| | | | | | | | | |
| TOTAL SHORT TERM INVESTMENTS | | | | | | | | |
| (Cost $33,093,202) | | | | | | | 33,093,202 | |
| | | | | | | | | |
| TOTAL INVESTMENTS (81.38%) | | | | | | | | |
| (Cost $269,522,380) | | | $ | | | | 270,539,795 | |
| | | | | | | | | |
| SEGREGATED CASH WITH BROKERS (21.01%)(f) | | | | | | | 69,858,365 | |
| | | | | | | | | |
| SECURITIES SOLD SHORT (-4.15%) | | | | | | | | |
| (Proceeds $13,023,757) | | | $ | | | | (13,802,221 | ) |
| | | | | | | | | |
| OTHER ASSETS IN EXCESS OF LIABILITIES (1.76%) | | | | | | | 5,838,998 | |
| NET ASSETS (100.00%) | | | $ | | | | 332,434,937 | |
| See Notes to Financial Statements. |
| 14 |
| Highland Resolute Fund | Consolidated Schedule of Investments |
| | April 30, 2019 |
SCHEDULE OF SECURITIES SOLD SHORT
| Description | | Shares | | Value
(Note 2) |
| EXCHANGE TRADED FUNDS (-3.24%) | | | | | | | | |
| Consumer Discretionary Select Sector SPDR® Fund | | | (1,220 | ) | | $ | (146,485 | ) |
| Consumer Staples Select Sector SPDR® Fund | | | (4,946 | ) | | | (285,434 | ) |
| Health Care Select Sector SPDR® Fund | | | (15,405 | ) | | | (1,375,050 | ) |
| iShares® 20+ Year Treasury Bond ETF | | | (3,980 | ) | | | (492,127 | ) |
| iShares® MSCI EAFE ETF | | | (17,267 | ) | | | (1,152,745 | ) |
| iShares® MSCI Emerging Markets ETF | | | (9,494 | ) | | | (417,071 | ) |
| iShares® MSCI United Kingdom ETF | | | (14,675 | ) | | | (495,428 | ) |
| iShares® Russell 2000® ETF | | | (2,926 | ) | | | (463,156 | ) |
| SPDR® S&P Retail ETF | | | (34,167 | ) | | | (1,560,749 | ) |
| Utilities Select Sector SPDR® Fund | | | (9,524 | ) | | | (559,154 | ) |
| VanEck Vectors® Pharmaceutical ETF | | | (19,453 | ) | | | (1,129,247 | ) |
| Vanguard® FTSE Europe ETF | | | (23,953 | ) | | | (1,334,422 | ) |
| Vanguard® Total Stock Market ETF | | | (9,007 | ) | | | (1,354,563 | ) |
| | | | | | | | (10,765,631 | ) |
| TOTAL EXCHANGE TRADED FUNDS (-3.24%) | | | | | | | | |
| (Proceeds $9,956,616) | | | | | | | (10,765,631 | ) |
| Description | | Principal | | Value
(Note 2) |
| CORPORATE BONDS (-0.91%) | | | | | | | | |
| ADVERTISING (-0.31%) | | | | | | | | |
| MDC Partners, Inc. | | | | | | | | |
| 6.50%, 5/1/2024(c) | | $ | (1,215,000 | ) | | $ | (1,032,750 | ) |
| | | | | | | | | |
| FOOD (-0.21%) | | | | | | | | |
| TreeHouse Foods, Inc. | | | | | | | | |
| 6.00%, 2/15/2024(c) | | | (679,000 | ) | | | (709,555 | ) |
| | | | | | | | | |
| TELECOMMUNICATIONS (-0.39%) | | | | | | | | |
| GTT Communications, Inc. | | | | | | | | |
| 7.88%, 12/31/2024(c) | | | (1,366,000 | ) | | | (1,294,285 | ) |
| | | | | | | | | |
| TOTAL CORPORATE BONDS | | | | | | | | |
| (Proceeds $3,067,141) | | | | | | | (3,036,590 | ) |
| | | | | | | | | |
| TOTAL SECURITIES SOLD SHORT | | | | | | | | |
| (Proceeds $13,023,757) | | | | | | $ | (13,802,221 | ) |
| (a) | Non-income producing security. |
| (b) | Security position either entirely or partially held in a segregated account as collateral for securities sold short and total return swaps. Aggregate total fair value of $10,569,588. |
| (c) | Security exempt from registration under rule 144A of the Securities Act of 1933. This security may be resold in transactions exempt from registration, normally to qualified institutional buyers. At period end, the fair value of those securities held in long positions was $50,090,989, representing 15.07% of the Fund's net assets, and the value of the securities held in short positions was $(3,036,590), representing (0.91)% of the Fund's net assets. |
| (d) | Pay-in-kind securities - Rate paid in-kind is shown in parenthesis. |
| (e) | Issued with a zero coupon. Income is recognized through the accretion of discount. |
| (f) | Includes cash which is being held as collateral for securities sold short and total return swap contracts. |
| See Notes to Financial Statements. | |
| Annual Report | April 30, 2019 | 15 |
| Highland Resolute Fund | Consolidated Schedule of Investments |
| | April 30, 2019 |
TOTAL RETURN SWAP CONTRACTS*
| Counterparty | | Reference Obligation | | Notional Amount | | | Value | | | Rate Paid by the Fund | | Termination Date | | Unrealized Appreciation/ (Depreciation) | |
| Morgan Stanley | | BHDG Systematic Trading Segregated Portfolio(a) | | $ | 17,233,823 | | | $ | 17,233,832 | | | 1-Month LIBOR BBA | | 09/13/2023 | | $ | 9 | |
| Morgan Stanley | | iBoxx Liquid USD High Yield Index | | | (758,000 | ) | | | (783,265 | ) | | 3-Month LIBOR BBA | | 06/20/2019 | | | (25,265 | ) |
| Morgan Stanley | | iBoxx Liquid USD High Yield Index | | | (5,000,000 | ) | | | (5,012,572 | ) | | 3-Month LIBOR BBA | | 06/20/2019 | | | (12,572 | ) |
| Morgan Stanley | | iBoxx Liquid USD High Yield Index | | | (702,000 | ) | | | (705,255 | ) | | 3-Month LIBOR BBA | | 06/20/2019 | | | (3,255 | ) |
| Morgan Stanley | | iBoxx Liquid USD High Yield Index | | | (478,000 | ) | | | (480,175 | ) | | 3-Month LIBOR BBA | | 06/20/2019 | | | (2,175 | ) |
| Morgan Stanley | | Long/Short Segregated Portfolio(b) | | | 41,412,693 | | | | 41,412,706 | | | 1-Month LIBOR BBA | | 03/19/2021 | | | 13 | |
| Morgan Stanley | | Melchior Segregated Portfolio(c) | | | 33,276,589 | | | | 33,276,594 | | | 1-Month LIBOR BBA | | 03/19/2021 | | | 5 | |
| Morgan Stanley | | PSAM Highland(d) | | | 51,350,309 | | | | 51,350,297 | | | 1-Month EURIBOR | | 06/03/2021 | | | (12 | ) |
| Morgan Stanley | | WABR(e) | | | 34,630,656 | | | | 34,630,666 | | | 1-Month LIBOR BBA | | 09/01/2020 | | | 10 | |
| | | | | $ | 170,966,070 | | | $ | 170,922,828 | | | | | | | $ | (43,242 | ) |
| * | For the long positions, the Fund receives payments based on any positive return of the Reference Obligation less the rate paid by the Fund. The Fund makes payments on any negative return of such Reference Obligation plus the rate paid by the Fund. For short positions, the Fund receives payments based on any negative return of the Reference Obligation less the rate paid by the fund. The Fund makes payments on any positive return of such Reference Obligation plus the rate paid by the Fund. Payments are made monthly. |
| (a) | BHDG Systematic Trading Segregated Portfolio is a quantitative trend following strategy that uses futures. BHDG will employ some short, medium, and long term signals. Interest rate, commodity, equity, and sovereign debt futures will be used. Any asset class may have net long or short exposure, and exposures in aggregate may be net long or short. |
| (b) | Long/Short Segregated Portfolio is a European equity long/short strategy that employs a flexible, low-net strategy (0% to 50%), and long exposure will vary between 60% and 100%. The portfolio is primarily comprised of large and mid-cap stocks listed on European exchanges. |
| (c) | Melchior Segregated Portfolio is a global equity long/short strategy that uses a long-biased strategy that is focused on cyclical sectors. The strategy has a net exposure that ranges between 50% and 80%, and long exposure varies between 80% and 100%. The strategy is comprised of large cap stocks listed on exchanges of developed and emerging market countries. |
| (d) | PSAM Highland employs an event driven strategy. The fund will primarily make investments in equity special situations and merger arbitrage. The strategy will also opportunistically allocate to liquid high yield credit positions when trading at stressed levels. The strategy will employ gross long exposure of up to 120%, and net exposure will typically vary from 40% to 80%. |
| (e) | WABR incorporates an absolute return oriented approach within a risk parity framework. Active absolute return strategies include fundamental long/short equity, credit relative value, discretionary macro, and equity market neutral strategies. The strategy also maintains a passive risk weighted allocation to equities and fixed income, but each of the three allocations is equally risk weighted subject to a 40% limit on the absolute return allocation. Gross equity long exposure will typically be 140% or less, and net equity exposure will vary between 5% and 35%. |
| See Notes to Financial Statements. |
| 16 |
| Highland Resolute Fund | Consolidated Schedule of Investments |
April 30, 2019
BHDG SYSTEMATIC TRADING SEGREGATED PORTFOLIO
| Description | | Contracts/Shares | | | Value | | | Percentage of Value | |
| LONG SECURITIES | | | | | | | | | | | | |
| OUTSTANDING FORWARD FOREIGN CURRENCY CONTRACTS | | | | | | | | | | | | |
| AUD TO JPY FORWARD SD : 19-Jun-2019 | | | 2,376,970 | | | $ | 1,677,564 | | | | 9.72 | % |
| AUD TO USD FORWARD SD : 19-Jun-2019 | | | 2,806,848 | | | | 1,980,954 | | | | 11.48 | % |
| CAD TO USD FORWARD SD : 19-Jun-2019 | | | 1,966,058 | | | | 1,469,355 | | | | 8.52 | % |
| CHF TO USD FORWARD SD : 19-Jun-2019 | | | 1,517,215 | | | | 1,495,614 | | | | 8.67 | % |
| EUR TO USD FORWARD SD : 19-Jun-2019 | | | 2,756,274 | | | | 3,103,927 | | | | 17.99 | % |
| INR TO USD FORWARD SD : 19-Jun-2019 | | | 116,566,361 | | | | 1,663,764 | | | | 9.64 | % |
| JPY TO AUD FORWARD SD : 19-Jun-2019 | | | 207,792,200 | | | | 1,871,518 | | | | 10.85 | % |
| JPY TO USD FORWARD SD : 19-Jun-2019 | | | 166,166,646 | | | | 1,496,610 | | | | 8.68 | % |
| MXN TO USD FORWARD SD : 19-Jun-2019 | | | 32,095,418 | | | | 1,680,447 | | | | 9.74 | % |
| NOK TO USD FORWARD SD : 19-Jun-2019 | | | 11,126,243 | | | | 1,292,047 | | | | 7.49 | % |
| PLN TO EUR FORWARD SD : 19-Jun-2019 | | | 5,335,539 | | | | 1,398,032 | | | | 8.10 | % |
| PLN TO USD FORWARD SD : 19-Jun-2019 | | | 5,386,113 | | | | 1,411,284 | | | | 8.18 | % |
| SGD TO USD FORWARD SD : 19-Jun-2019 | | | 2,914,317 | | | | 2,144,312 | | | | 12.43 | % |
| USD TO AUD FORWARD SD : 19-Jun-2019 | | | 2,929,441 | | | | 2,929,441 | | | | 16.98 | % |
| USD TO CAD FORWARD SD : 19-Jun-2019 | | | 2,862,363 | | | | 2,862,363 | | | | 16.59 | % |
| USD TO CHF FORWARD SD : 19-Jun-2019 | | | 2,859,268 | | | | 2,859,268 | | | | 16.57 | % |
| USD TO EUR FORWARD SD : 19-Jun-2019 | | | 5,450,888 | | | | 5,450,888 | | | | 31.60 | % |
| USD TO GBP FORWARD SD : 19-Jun-2019 | | | 1,230,973 | | | | 1,230,973 | | | | 7.14 | % |
| USD TO INR FORWARD SD : 19-Jun-2019 | | | 1,275,494 | | | | 1,275,494 | | | | 7.39 | % |
| USD TO JPY FORWARD SD : 19-Jun-2019 | | | 2,302,507 | | | | 2,302,507 | | | | 13.35 | % |
| USD TO KRW FORWARD SD : 19-Jun-2019 | | | 1,921,626 | | | | 1,921,626 | | | | 11.14 | % |
| USD TO NOK FORWARD SD : 19-Jun-2019 | | | 1,905,707 | | | | 1,905,707 | | | | 11.05 | % |
| USD TO PLN FORWARD SD : 19-Jun-2019 | | | 2,289,630 | | | | 2,289,630 | | | | 13.27 | % |
| USD TO SEK FORWARD SD : 19-Jun-2019 | | | 1,355,036 | | | | 1,355,036 | | | | 7.85 | % |
| USD TO SGD FORWARD SD : 19-Jun-2019 | | | 2,658,651 | | | | 2,658,651 | | | | 15.41 | % |
| OUTSTANDING FORWARD FOREIGN CURRENCY CONTRACTS Total | | | 587,847,785 | | | | 51,727,012 | | | | 299.83 | % |
| TOTAL LONG | | | 587,847,785 | | | $ | 51,727,012 | | | | 299.83 | % |
| | | | | | | | | | |
| SECURITIES SOLD SHORT | | | | | | | | | |
| OUTSTANDING FORWARD FOREIGN CURRENCY CONTRACTS | | | | | | | | | |
| AUD TO JPY FORWARD SD : 19-Jun-2019 | | | (2,655,126 | ) | | | (1,873,875 | ) | | | -10.86 | % |
| AUD TO USD FORWARD SD : 19-Jun-2019 | | | (4,140,732 | ) | | | (2,922,353 | ) | | | -16.94 | % |
| CAD TO USD FORWARD SD : 19-Jun-2019 | | | (3,818,324 | ) | | | (2,853,668 | ) | | | -16.54 | % |
| CHF TO USD FORWARD SD : 19-Jun-2019 | | | (2,851,100 | ) | | | (2,810,509 | ) | | | -16.29 | % |
| EUR TO PLN FORWARD SD : 19-Jun-2019 | | | (1,239,086 | ) | | | (1,395,374 | ) | | | -8.09 | % |
| EUR TO USD FORWARD SD : 19-Jun-2019 | | | (4,804,514 | ) | | | (5,410,515 | ) | | | -31.36 | % |
| GBP TO USD FORWARD SD : 19-Jun-2019 | | | (941,938 | ) | | | (1,231,236 | ) | | | -7.14 | % |
| INR TO USD FORWARD SD : 19-Jun-2019 | | | (89,332,352 | ) | | | (1,275,050 | ) | | | -7.39 | % |
| JPY TO AUD FORWARD SD : 19-Jun-2019 | | | (187,479,942 | ) | | | (1,688,572 | ) | | | -9.79 | % |
| JPY TO USD FORWARD SD : 19-Jun-2019 | | | (255,359,920 | ) | | | (2,299,945 | ) | | | -13.33 | % |
| KRW TO USD FORWARD SD : 19-Jun-2019 | | | (2,175,660,958 | ) | | | (1,872,320 | ) | | | -10.85 | % |
| NOK TO USD FORWARD SD : 19-Jun-2019 | | | (16,385,922 | ) | | | (1,902,833 | ) | | | -11.03 | % |
| PLN TO USD FORWARD SD : 19-Jun-2019 | | | (8,711,343 | ) | | | (2,282,570 | ) | | | -13.23 | % |
| SEK TO USD FORWARD SD : 19-Jun-2019 | | | (12,542,310 | ) | | | (1,325,788 | ) | | | -7.69 | % |
| SGD TO USD FORWARD SD : 19-Jun-2019 | | | (3,603,386 | ) | | | (2,651,318 | ) | | | -15.37 | % |
| USD TO AUD FORWARD SD : 19-Jun-2019 | | | (2,001,460 | ) | | | (2,001,460 | ) | | | -11.60 | % |
| USD TO CAD FORWARD SD : 19-Jun-2019 | | | (1,476,409 | ) | | | (1,476,409 | ) | | | -8.56 | % |
| USD TO CHF FORWARD SD : 19-Jun-2019 | | | (1,522,552 | ) | | | (1,522,552 | ) | | | -8.83 | % |
| USD TO EUR FORWARD SD : 19-Jun-2019 | | | (3,130,747 | ) | | | (3,130,747 | ) | | | -18.15 | % |
| USD TO INR FORWARD SD : 19-Jun-2019 | | | (1,661,907 | ) | | | (1,661,907 | ) | | | -9.63 | % |
See Notes to Financial Statements.
| Annual Report | April 30, 2019 | 17 |
| Highland Resolute Fund | Consolidated Schedule of Investments |
April 30, 2019
| Description | | Contracts/Shares | | | Value | | | Percentage of Value | |
| OUTSTANDING FORWARD FOREIGN CURRENCY CONTRACTS (CONTINUED) | | | | | | | | | | | | |
| USD TO JPY FORWARD SD : 19-Jun-2019 | | | (1,507,622 | ) | | | (1,507,622 | ) | | | -8.74 | % |
| USD TO MXN FORWARD SD : 19-Jun-2019 | | | (1,661,385 | ) | | | (1,661,385 | ) | | | -9.63 | % |
| USD TO NOK FORWARD SD : 19-Jun-2019 | | | (1,307,553 | ) | | | (1,307,553 | ) | | | -7.58 | % |
| USD TO PLN FORWARD SD : 19-Jun-2019 | | | (1,422,109 | ) | | | (1,422,109 | ) | | | -8.24 | % |
| USD TO SGD FORWARD SD : 19-Jun-2019 | | | (2,157,216 | ) | | | (2,157,216 | ) | | | -12.50 | % |
| OUTSTANDING FORWARD FOREIGN CURRENCY CONTRACTS Total | | | (2,787,375,913 | ) | | | (51,644,886 | ) | | | -299.36 | % |
| TOTAL SHORT | | | (2,787,375,913 | ) | | $ | (51,644,886 | ) | | | -299.36 | % |
| | | | | | | | | | | | | |
| REMAINING SECURITIES AND CASH | | | | | | $ | 17,151,706 | | | | 99.53 | % |
| TOTAL VALUE | | | | | | $ | 17,233,832 | | | | | |
LONG/SHORT SEGREGATED PORTFOLIO
| Description | | Contracts/Shares | | | Value | | | Percentage of Value | |
| LONG SECURITIES | | | | | | | | | | | | |
| COMMON STOCK | | | | | | | | | | | | |
| B2GOLD ORD (TOR) | | | 89,740 | | | $ | 243,590 | | | | 0.59 | % |
| D R HORTON ORD (NYS) | | | 73,637 | | | | 3,262,856 | | | | 7.87 | % |
| DSV ORD (CPH) | | | 34,718 | | | | 3,207,723 | | | | 7.74 | % |
| FST QUANTUM MIN ORD (TOR) | | | 132,905 | | | | 1,402,391 | | | | 3.39 | % |
| GARDNER DENVER HOLDINGS ORD (NYS) | | | 8,311 | | | | 280,496 | | | | 0.68 | % |
| HARLEY DAVIDSON ORD (NYS) | | | 7,209 | | | | 268,391 | | | | 0.65 | % |
| HERC HOLDINGS ORD (NYS) | | | 25,627 | | | | 1,234,196 | | | | 2.98 | % |
| HESS ORD (NYS) | | | 24,602 | | | | 1,577,480 | | | | 3.81 | % |
| HOME DEPOT ORD (NYS) | | | 3,679 | | | | 749,412 | | | | 1.81 | % |
| KEYENCE ORD (TYO) | | | 547 | | | | 339,624 | | | | 0.82 | % |
| KRATOS DEFENSE AND SECURITY SOLS ORD (NMS) | | | 28,429 | | | | 451,453 | | | | 1.09 | % |
| LEAR ORD (NYS) | | | 4,069 | | | | 581,867 | | | | 1.41 | % |
| MOHAWK INDUSTRIES ORD (NYS) | | | 25,011 | | | | 3,407,749 | | | | 8.23 | % |
| NORFOLK SOUTHERN ORD (NYS) | | | 16,105 | | | | 3,285,742 | | | | 7.93 | % |
| NVR ORD (NYS) | | | 523 | | | | 1,648,748 | | | | 3.98 | % |
| QUALCOMM ORD (NMS) | | | 21,728 | | | | 1,871,433 | | | | 4.52 | % |
| RIO TINTO ADR REP ONE ORD (NYS) | | | 15,347 | | | | 903,938 | | | | 2.18 | % |
| STAR BULK CARRIERS ORD (NMS) | | | 130,706 | | | | 1,135,835 | | | | 2.74 | % |
| TECK RESOURCES CL B ORD (NYS) | | | 112,662 | | | | 2,664,456 | | | | 6.43 | % |
| UNITED RENTAL ORD (NYS) | | | 11,293 | | | | 1,591,410 | | | | 3.84 | % |
| VALERO ENERGY ORD (NYS) | | | 2,892 | | | | 262,189 | | | | 0.63 | % |
| WARRIOR MET COAL ORD (NYS) | | | 20,321 | | | | 629,951 | | | | 1.52 | % |
| COMMON STOCK Total | | | 790,061 | | | | 31,000,930 | | | | 74.84 | % |
See Notes to Financial Statements.
18
| Highland Resolute Fund | Consolidated Schedule of Investments |
April 30, 2019
| Description | | Contracts/
Shares | | | Value | | | Percentage
of Value | | | Swap Counterparty | | Floating Rate/
Fixed Rate
Amount paid by Fund | | Floating Rate
Index | | Termination
Date | | Unrealized
Gain
(Loss) | |
| EQUITY SWAP | | | | | | | | | | | | | | | | | | | | |
| NVR ORD (NYS) CFD | | | 0,530 | | | | 345,437 | | | | 0.83 | % | | Morgan Stanley & Co., LLC | | 50 bps + 1D FEDEF | | 1D FEDEF | | 12/3/2019 | | | 345,437 | |
| RIO TINTO ADR REP ONE ORD (NYS) CFD | | | 31,689 | | | | 344,915 | | | | 0.83 | % | | Morgan Stanley & Co., LLC | | 50 bps + 1M LIBOR | | 1M LIBOR | | 1/20/2020 | | | 83,821 | |
| EQUITY SWAP Total | | | 32,219 | | | | 690,352 | | | | 1.66 | % | | | | | | | | | | | | |
| TOTAL LONG | | | 822,280 | | | $ | 31,691,282 | | | | 76.50 | % | | | | | | | | | | | | |
| SECURITIES SOLD SHORT | | | | | | | | | |
| COMMON STOCK | | | | | | | | | |
| AMERICAN AIRLINES GROUP ORD (NMS) | | | (21,079 | ) | | | (720,480 | ) | | | -1.74 | % |
| APPLE ORD (NMS) | | | (1,384 | ) | | | (277,727 | ) | | | -0.67 | % |
| AVIS BUDGET GROUP ORD (NMS) | | | (22,630 | ) | | | (804,497 | ) | | | -1.94 | % |
| BOEING ORD (NYS) | | | (718 | ) | | | (271,181 | ) | | | -0.65 | % |
| FASTENAL ORD (NMS) | | | (3,578 | ) | | | (252,428 | ) | | | -0.61 | % |
| FLOOR DECOR HOLDINGS CL A ORD (NYS) | | | (5,573 | ) | | | (267,615 | ) | | | -0.65 | % |
| HUNTINGTON INGALLS INDUSTRIES ORD (NYS) | | | (5,226 | ) | | | (1,163,203 | ) | | | -2.81 | % |
| KIRBY ORD (NYS) | | | (4,099 | ) | | | (334,970 | ) | | | -0.81 | % |
| LINCOLN ELECTRIC HOLDINGS ORD (NMS) | | | (6,030 | ) | | | (526,238 | ) | | | -1.27 | % |
| LOWE'S COMPANIES ORD (NYS) | | | (3,227 | ) | | | (365,103 | ) | | | -0.88 | % |
| MONDELEZ INTERNATIONAL CL A ORD (NMS) | | | (12,815 | ) | | | (651,643 | ) | | | -1.57 | % |
| NORTHROP GRUMMAN ORD (NYS) | | | (3,498 | ) | | | (1,014,105 | ) | | | -2.45 | % |
| PARTNERS GROUP HOLDING ORD (VX) | | | (314 | ) | | | (236,602 | ) | | | -0.57 | % |
| RYDER SYSTEM ORD (NYS) | | | (4,907 | ) | | | (309,141 | ) | | | -0.75 | % |
| STADLER RAIL ORD (SWX) | | | (8,435 | ) | | | (357,413 | ) | | | -0.86 | % |
| WABTEC ORD (NYS) | | | (6,643 | ) | | | (492,047 | ) | | | -1.19 | % |
| WORKDAY CL A ORD (NMS) | | | (1,865 | ) | | | (383,500 | ) | | | -0.93 | % |
| XPO LOGISTICS ORD (NYS) | | | (18,455 | ) | | | (1,256,416 | ) | | | -3.03 | % |
| COMMON STOCK Total | | | (130,476 | ) | | | (9,684,309 | ) | | | -23.38 | % |
| TOTAL SHORT | | | (130,476 | ) | | | (9,684,309 | ) | | | -23.38 | % |
| | | | | | | | | | | | | |
| REMAINING SECURITIES AND CASH | | | | | | $ | 19,405,733 | | | | 46.88 | % |
| TOTAL VALUE | | | | | | $ | 41,412,706 | | | | | |
MELCHIOR SEGREGATED PORTFOLIO
| Description | | Contracts/
Shares | | | Value | | | Percentage
of Value | | | Swap Counterparty | | Floating Rate/
Fixed Rate
Amount paid by Fund | | Floating Rate
Index | | Termination
Date | | Unrealized
Gain
(Loss) | |
| LONG SECURITIES | | | | | | | | | | | | | | | | | | | | | | | | |
| EQUITY SWAP | | | | | | | | | | | | | | | | | | | | | | | | |
| ABN AMRO GROUP NV- CVA | | | 27,941 | | | $ | (52,864 | ) | | | -0.16 | % | | Morgan Stanley & Co., LLC | | 55 bps + 1M EURIB | | 1M EURIB | | 3/26/2020 | | | (61,445 | ) |
| ALTEN SA(PAR) | | | 6,204 | | | | 77,099 | | | | 0.23 | % | | Morgan Stanley & Co., LLC | | 55 bps + 1M EURIB | | 1M EURIB | | 3/26/2020 | | | 148,349 | |
| APPLUS SERVICES SA(MAD) | | | 87,833 | | | | 27,086 | | | | 0.08 | % | | Morgan Stanley & Co., LLC | | 55 bps + 1M EURIB | | 1M EURIB | | 3/26/2020 | | | 51,478 | |
| ASCENTIAL PLC | | | 162,008 | | | | (67,247 | ) | | | -0.20 | % | | Morgan Stanley & Co., LLC | | 55 bps + 1M LIBOR | | 1M LIBOR | | 3/26/2020 | | | (112,145 | ) |
| ASML HOLDING NV (EOE) | | | 2,479 | | | | 100,403 | | | | 0.30 | % | | Morgan Stanley & Co., LLC | | 55 bps + 1M EURIB | | 1M EURIB | | 3/26/2020 | | | 202,983 | |
| ASR NEDERLAND NV | | | 23,132 | | | | 57,992 | | | | 0.17 | % | | Morgan Stanley & Co., LLC | | 55 bps + 1M EURIB | | 1M EURIB | | 3/26/2020 | | | 111,301 | |
See Notes to Financial Statements.
| Annual Report | April 30, 2019 | 19 |
| Highland Resolute Fund | Consolidated Schedule of Investments |
April 30, 2019
| Description | | Contracts/
Shares | | | Value | | | Percentage
of Value | | | Swap Counterparty | | Floating Rate/
Fixed Rate
Amount paid by Fund | | Floating Rate
Index | | Termination
Date | | Unrealized
Gain
(Loss) | |
| EQUITY SWAP (CONTINUED) | | | | | | | | | | | | | | | | | | | | | | | | |
| ASSOCIATED BRITISH FOODS PLC | | | 30,026 | | | | 59,067 | | | | 0.18 | % | | Morgan Stanley & Co., LLC | | 55 bps + 1M LIBOR | | 1M LIBOR | | 3/26/2020 | | | 97,064 | |
| BAYER AG(GER) | | | 10,825 | | | | (39,731 | ) | | | -0.12 | % | | Morgan Stanley & Co., LLC | | 55 bps + 1M EURIB | | 1M EURIB | | 3/25/2020 | | | (21,262 | ) |
| BEFESA SA(GER) | | | 20,434 | | | | 42,442 | | | | 0.13 | % | | Morgan Stanley & Co., LLC | | 55 bps + 1M EURIB | | 1M EURIB | | 3/25/2020 | | | 81,314 | |
| COMPASS GROUP PLC | | | 52,432 | | | | 71,998 | | | | 0.22 | % | | Morgan Stanley & Co., LLC | | 55 bps + 1M LIBOR | | 1M LIBOR | | 3/26/2020 | | | 120,309 | |
| CRH PLC(ISE) | | | 16,939 | | | | 29,773 | | | | 0.09 | % | | Morgan Stanley & Co., LLC | | 55 bps + 1M EURIB | | 1M EURIB | | 3/26/2020 | | | 57,074 | |
| FERGUSON PLC | | | 14,127 | | | | 100,704 | | | | 0.30 | % | | Morgan Stanley & Co., LLC | | 55 bps + 1M LIBOR | | 1M LIBOR | | 3/26/2020 | | | 166,820 | |
| FINECOBANK SPA(MIL) | | | 71,831 | | | | 156,838 | | | | 0.47 | % | | Morgan Stanley & Co., LLC | | 55 bps + 1M EURIB | | 1M EURIB | | 3/26/2020 | | | 302,108 | |
| FLUIDRA SA(MAD) | | | 43,074 | | | | (93,396 | ) | | | -0.28 | % | | Morgan Stanley & Co., LLC | | 55 bps + 1M EURIB | | 1M EURIB | | 3/26/2020 | | | (180,605 | ) |
| HOWDEN JOINERY GROUP PLC | | | 75,069 | | | | 26,853 | | | | 0.08 | % | | Morgan Stanley & Co., LLC | | 55 bps + 1M LIBOR | | 1M LIBOR | | 3/26/2020 | | | 44,283 | |
| INFICON HOLDING AG-REG | | | 625 | | | | 47,368 | | | | 0.14 | % | | Morgan Stanley & Co., LLC | | 55 bps + 1M LIBOR | | 1M LIBOR | | 3/26/2020 | | | 104,194 | |
| INTERTRUST NV | | | 59,532 | | | | 92,650 | | | | 0.28 | % | | Morgan Stanley & Co., LLC | | 55 bps + 1M EURIB | | 1M EURIB | | 3/26/2020 | | | 178,658 | |
| JD SPORTS FASHION PLC | | | 84,639 | | | | 212,508 | | | | 0.64 | % | | Morgan Stanley & Co., LLC | | 55 bps + 1M LIBOR | | 1M LIBOR | | 3/26/2020 | | | 351,397 | |
| LONDON STOCK EXCHANGE GROUP | | | 8,201 | | | | 63,098 | | | | 0.19 | % | | Morgan Stanley & Co., LLC | | 55 bps + 1M LIBOR | | 1M LIBOR | | 3/26/2020 | | | 104,338 | |
| LONZA GROUP AG-REG | | | 2,717 | | | | 123,664 | | | | 0.37 | % | | Morgan Stanley & Co., LLC | | 55 bps + 1M LIBOR | | 1M LIBOR | | 3/26/2020 | | | 271,298 | |
| MAISONS DU MONDE SA | | | 21,438 | | | | (85,414 | ) | | | -0.26 | % | | Morgan Stanley & Co., LLC | | 55 bps + 1M EURIB | | 1M EURIB | | 3/26/2020 | | | (165,212 | ) |
| MTU AERO ENGINES AG(GER) | | | 3,811 | | | | 92,428 | | | | 0.28 | % | | Morgan Stanley & Co., LLC | | 55 bps + 1M EURIB | | 1M EURIB | | 3/25/2020 | | | 177,439 | |
| NESTLE SA-REG(VTX) | | | 9,365 | | | | 161,316 | | | | 0.48 | % | | Morgan Stanley & Co., LLC | | 55 bps + 1M LIBOR | | 1M LIBOR | | 3/26/2020 | | | 355,155 | |
| PROSEGUR CASH SA | | | 335,058 | | | | 47,975 | | | | 0.14 | % | | Morgan Stanley & Co., LLC | | 55 bps + 1M EURIB | | 1M EURIB | | 3/26/2020 | | | 91,677 | |
| PRUDENTIAL PLC | | | 46,925 | | | | 80,570 | | | | 0.24 | % | | Morgan Stanley & Co., LLC | | 55 bps + 1M LIBOR | | 1M LIBOR | | 3/26/2020 | | | 167,672 | |
| ROCHE HOLDING AG- GENUSSCHEIN(VTX) | | | 6,884 | | | | 123,860 | | | | 0.37 | % | | Morgan Stanley & Co., LLC | | 55 bps + 1M LIBOR | | 1M LIBOR | | 3/26/2020 | | | 271,377 | |
| RYANAIR HOLDINGS PLC(ISE) | | | 24,682 | | | | (63,565 | ) | | | -0.19 | % | | Morgan Stanley & Co., LLC | | 55 bps + 1M EURIB | | 1M EURIB | | 3/26/2020 | | | (122,882 | ) |
| STANDARD LIFE ABERDEEN PLC | | | 108,249 | | | | 45,743 | | | | 0.14 | % | | Morgan Stanley & Co., LLC | | 55 bps + 1M LIBOR | | 1M LIBOR | | 3/26/2020 | | | 124,444 | |
| TOTAL SA(PAR) | | | 22,935 | | | | (61,994 | ) | | | -0.19 | % | | Morgan Stanley & Co., LLC | | 55 bps + 1M EURIB | | 1M EURIB | | 3/26/2020 | | | (120,461 | ) |
| VESTAS WIND SYSTEMS A/S(CPH) | | | 8,821 | | | | 42,477 | | | | 0.13 | % | | Morgan Stanley & Co., LLC | | 55 bps + 1M CIBOR | | 1M CIBOR | | 10/30/2020 | | | 605,296 | |
| VIVENDI(PAR) | | | 44,199 | | | | 194,125 | | | | 0.58 | % | | Morgan Stanley & Co., LLC | | 55 bps + 1M EURIB | | 1M EURIB | | 3/26/2020 | | | 373,564 | |
| EQUITY SWAP Total | | | 1,432,435 | | | | 1,613,826 | | | | 4.83 | % | | Morgan Stanley & Co., LLC | | | | | | | | | | |
| TOTAL LONG | | | 1,432,435 | | | $ | 1,613,826 | | | | 4.83 | % | | | | | | | | | | | | |
| | | | | | | | | | | | | | | | | | | | | | | | | |
| SECURITIES SOLD SHORT | | | | | | | | | | | | | | | | | | | | | | | | |
| EQUITY SWAP | | | | | | | | | | | | | | | | | | | | | | | | |
| AA PLC | | | (274,986 | ) | | | 50,180 | | | | 0.15 | % | | Morgan Stanley & Co., LLC | | -35 bps + 1D SONIA | | 1D SONIA | | 3/26/2020 | | | 83,075 | |
| AGGREKO PLC(LSE) | | | (39,167 | ) | | | (52,819 | ) | | | -0.16 | % | | Morgan Stanley & Co., LLC | | -35 bps + 1D SONIA | | 1D SONIA | | 3/26/2020 | | | (102,855 | ) |
| AMADEUS IT GROUP SA(MAD) | | | (10,866 | ) | | | (67,393 | ) | | | -0.20 | % | | Morgan Stanley & Co., LLC | | -50 bps + 1D EONIA | | 1D EONIA | | 3/26/2020 | | | (130,620 | ) |
| ARCADIS NV | | | (79,697 | ) | | | (164,858 | ) | | | -0.50 | % | | Morgan Stanley & Co., LLC | | -90 bps + 1D EONIA | | 1D EONIA | | 3/26/2020 | | | (396,813 | ) |
| BOOHOO GROUP PLC | | | (237,911 | ) | | | (121,284 | ) | | | -0.36 | % | | Morgan Stanley & Co., LLC | | -35 bps + 1D SONIA | | 1D SONIA | | 3/26/2020 | | | (201,543 | ) |
| BURFORD CAPITAL LTD | | | (58,888 | ) | | | 54,936 | | | | 0.17 | % | | Morgan Stanley & Co., LLC | | -35 bps + 1D SONIA | | 1D SONIA | | 3/26/2020 | | | 86,745 | |
| CASINO GUICHARD PERRACHON(PAR) | | | (7,792 | ) | | | 60,858 | | | | 0.18 | % | | Morgan Stanley & Co., LLC | | -650 bps + 1D EONIA | | 1D EONIA | | 3/26/2020 | | | 116,011 | |
| DOMINO'S PIZZA GROUP PLC | | | (147,731 | ) | | | (39,519 | ) | | | -0.12 | % | | Morgan Stanley & Co., LLC | | -35 bps + 1D SONIA | | 1D SONIA | | 3/26/2020 | | | (65,777 | ) |
| EUROFINS SCIENTIFIC(PAR) | | | (2,152 | ) | | | (78,241 | ) | | | -0.24 | % | | Morgan Stanley & Co., LLC | | -450 bps + 1D EONIA | | 1D EONIA | | 3/26/2020 | | | (154,048 | ) |
| GEBERIT AG-REG(VTX) | | | (2,532 | ) | | | (65,554 | ) | | | -0.20 | % | | Morgan Stanley & Co., LLC | | -40 bps + 1D SARON | | 1D SARON | | 3/26/2020 | | | (145,241 | ) |
| KONINKLIJKE AHOLD DELHAIZE N | | | (13,311 | ) | | | 33,657 | | | | 0.10 | % | | Morgan Stanley & Co., LLC | | -40 bps + 1D EONIA | | 1D EONIA | | 3/26/2020 | | | 64,674 | |
| LANDIS+GYR GROUP AG | | | (8,799 | ) | | | (75,014 | ) | | | -0.23 | % | | Morgan Stanley & Co., LLC | | -198 bps + 1D SARON | | 1D SARON | | 3/26/2020 | | | (166,104 | ) |
See Notes to Financial Statements.
20
| Highland Resolute Fund | Consolidated Schedule of Investments |
April 30, 2019
| Description | | Contracts/
Shares | | | Value | | | Percentage of Value | | | Swap Counterparty | | Floating Rate/
Fixed Rate Amount paid by Fund | | Floating Rate
Index | | Termination
Date | | Unrealized Gain
(Loss) | |
| EQUITY SWAP (CONTINUED) | | | | | | | | | | | | | | | | | | | | | | | | |
| ORPEA(PAR) | | | (4,665 | ) | | | (62,383 | ) | | | -0.19 | % | | Morgan Stanley & Co., LLC | | -40 bps + 1D EONIA | | 1D EONIA | | 3/26/2020 | | | (122,529 | ) |
| PANDORA A/S | | | (10,879 | ) | | | 65,312 | | | | 0.20 | % | | Morgan Stanley & Co., LLC | | -50 bps + 1W CIBOR | | 1W CIBOR | | 10/30/2020 | | | 993,965 | |
| PUBLICIS GROUPE | | | (11,195 | ) | | | (52,373 | ) | | | -0.16 | % | | Morgan Stanley & Co., LLC | | -40 bps + 1D EONIA | | 1D EONIA | | 3/26/2020 | | | (103,958 | ) |
| SIEMENS GAMESA RENEWABLE ENE | | | (29,806 | ) | | | (74,640 | ) | | | -0.22 | % | | Morgan Stanley & Co., LLC | | -50 bps + 1D EONIA | | 1D EONIA | | 3/26/2020 | | | (158,675 | ) |
| SIGNIFY NV | | | (18,626 | ) | | | (80,953 | ) | | | -0.24 | % | | Morgan Stanley & Co., LLC | | -40 bps + 1D EONIA | | 1D EONIA | | 3/26/2020 | | | (154,803 | ) |
| SKF AB-B SHARES | | | (14,505 | ) | | | (32,118 | ) | | | -0.10 | % | | Morgan Stanley & Co., LLC | | -50 bps + 1W STIBO | | 1W STIBO | | 9/9/2020 | | | (660,980 | ) |
| ZALANDO SE | | | (13,817 | ) | | | (103,589 | ) | | | -0.31 | % | | Morgan Stanley & Co., LLC | | -150 bps + 1D EONIA | | 1D EONIA | | 3/25/2020 | | | (225,559 | ) |
| EQUITY SWAP Total | | | (987,325 | ) | | | (805,795 | ) | | | -2.43 | % | | Morgan Stanley & Co., LLC | | | | | | | | | | |
| TOTAL SHORT | | | (987,325 | ) | | $ | (805,795 | ) | | | -2.43 | % | | | | | | | | | | | | |
| | | | | | | | | | | | | | | | | | | | | | | | | |
| REMAINING SECURITIES AND CASH | | | | | | $ | 32,468,563 | | | | 97.60 | % | | | | | | | | | | | | |
| TOTAL VALUE | | | | | | $ | 33,276,594 | | | | | | | | | | | | | | | | | |
PSAM HIGHLAND
| Description | | Contracts/
Shares | | | Value | | | Percentage
of Value | |
| LONG SECURITIES | | | | | | | | | | | | |
| COMMON STOCK | | | | | | | | | | | | |
| ALLERGAN PLC | | | 9,530 | | | $ | 1,400,885 | | | | 2.73 | % |
| ALTABA INC | | | 41,300 | | | | 3,113,617 | | | | 6.06 | % |
| ANADARKO PETE CORP COM STK | | | 34,222 | | | | 2,493,049 | | | | 4.86 | % |
| BRISTOL MYERS SQUIBB | | | 17,880 | | | | 846,516 | | | | 1.65 | % |
| CELGENE CORP COM STK | | | 51,433 | | | | 4,868,679 | | | | 9.48 | % |
| DELL TECHNOLOGIES -C | | | 7,828 | | | | 527,718 | | | | 1.03 | % |
| DOWDUPONT INC | | | 25,034 | | | | 962,554 | | | | 1.87 | % |
| ENERGIAS DE PORTUGAL EUR5 REGD | | | 233,652 | | | | 885,474 | | | | 1.72 | % |
| EQUITRANS MIDSTREAM CORP | | | 40,351 | | | | 840,516 | | | | 1.64 | % |
| FOX CORP - CLASS A | | | 71,848 | | | | 2,801,360 | | | | 5.46 | % |
| KABU COM SEC | | | 90,296 | | | | 455,578 | | | | 0.89 | % |
| L-3 COMMUNICATIONS HOLDINGS IN COM STK | | | 4,647 | | | | 1,015,741 | | | | 1.98 | % |
| MCKESSON EUROPE AG (GFR LISTING) | | | 52,165 | | | | 1,567,949 | | | | 3.05 | % |
| PG&E CORP COM STK | | | 14,316 | | | | 322,397 | | | | 0.63 | % |
| RIVIERA RESOURCES INC/LINN | | | 29,634 | | | | 444,506 | | | | 0.87 | % |
| TRIBUNE MEDIA CO | | | 52,548 | | | | 2,427,725 | | | | 4.73 | % |
| TRINITY INDS INC COM STK | | | 34,275 | | | | 738,970 | | | | 1.44 | % |
| VERSUM MATERIALS | | | 44,943 | | | | 2,345,135 | | | | 4.56 | % |
| WABCO HOLDINGS INC | | | 10,554 | | | | 1,397,764 | | | | 2.72 | % |
| WORLDPAY INC | | | 21,024 | | | | 2,464,166 | | | | 4.79 | % |
| COMMON STOCK Total | | | 887,480 | | | | 31,920,299 | | | | 62.16 | % |
| | | | | | | | | | | | | |
| CORPORATE BONDS | | | | | | | | | | | | |
| BRKHEC 5.75 30SEP2039 144A | | | 299,018 | | | | 258,438 | | | | 0.50 | % |
| FE 6.85 01JUN2034 | | | 2,360,907 | | | | 1,499,612 | | | | 2.92 | % |
| HXN 10.375 01FEB2022 144A | | | 401,002 | | | | 314,787 | | | | 0.61 | % |
| ISATLN CB 3.875 09SEP2023 | | | 508,967 | | | | 763,330 | | | | 1.49 | % |
See Notes to Financial Statements.
| Annual Report | April 30, 2019 | 21 |
| Highland Resolute Fund | Consolidated Schedule of Investments |
April 30, 2019
| Description | | Contracts/
Shares | | | Value | | | Percentage of Value | | | Swap Counterparty | | Floating Rate/ Fixed Rate Amount paid by Fund | | Floating Rate
Index | | Termination Date | | Unrealized Gain (Loss) | |
| CORPORATE BONDS (CONTINUED) | | | | | | | | | | | | | | | | | |
| NBLACT 10 20JUN2022 REGS | | | 573,733 | | | | 567,896 | | | | 1.11 | % | | | | | | | | | | | | |
| NMG 8 15OCT2021 144A | | | 926,320 | | | | 509,296 | | | | 0.99 | % | | | | | | | | | | | | |
| NMG 8 15OCT2021 REGS | | | 514,566 | | | | 282,911 | | | | 0.55 | % | | | | | | | | | | | | |
| PCG 4.75 15FEB2044 | | | 1,347,299 | | | | 1,275,303 | | | | 2.48 | % | | | | | | | | | | | | |
| PCG 5.8 01MAR2037 | | | 488,990 | | | | 495,205 | | | | 0.96 | % | | | | | | | | | | | | |
| PCG 6.05 01MAR2034 | | | 225,918 | | | | 234,258 | | | | 0.46 | % | | | | | | | | | | | | |
| PUERTO RICO ELEC POWER AUTH XX 5.25% | | | 736,093 | | | | 591,636 | | | | 1.15 | % | | | | | | | | | | | | |
| CORPORATE BONDS Total | | | 8,382,813 | | | | 6,792,672 | | | | 13.22 | % | | | | | | | | | | | | |
| | | | | | | | | | | | | | | | | | | | | | | | | |
| EQUITY SWAP | | | | | | | | | | | | | | | | | | | | | | | | |
| ALTABA INC | | | 19,794 | | | | 727,971 | | | | 1.42 | % | | Morgan Stanley & Co., LLC | | 40 bps + 1D FEDEF | | 1D FEDEF | | 12/20/2019 | | | 10,884,738 | |
| DELL TECHNOLOGIES -C | | | 5,631 | | | | 265,017 | | | | 0.52 | % | | Morgan Stanley & Co., LLC | | 40 bps + 1D FEDEF | | 1D FEDEF | | 12/30/2020 | | | 4,161,330 | |
| EQUITY SWAP Total | | | 25,425 | | | | 992,988 | | | | 1.94 | % | | | | | | | | | | | | |
| | | | | | | | | | | | | | | | | | | | | | | | | |
| OUTSTANDING FORWARD FOREIGN CURRENCY CONTRACTS | | | | | | | | | | |
| EUR TO USD SPOT SD: 02-MAY-2019 | | | 284,428 | | | | 319,000 | | | | 0.62 | % | | | | | | | | | | | | |
| USD TO THB FORWARD SD: 15-MAY-2019 | | | 236,417 | | | | 236,170 | | | | 0.46 | % | | | | | | | | | | | | |
| OUTSTANDING FORWARD FOREIGN CURRENCY CONTRACTS Total | | | 520,845 | | | | 555,170 | | | | 1.08 | % | | | | | | | | | | | | |
| TOTAL LONG | | | 9,816,564 | | | $ | 40,261,129 | | | | 78.40 | % | | | | | | | | | | | | |
| | | | | | | | | | | | | | | | | | | | | | | | | |
| SECURITIES SOLD SHORT COMMON STOCK | | | | | | | | | | | | | | | | | | | | | | | | |
| ALIBABA GROUP HOLDING LTD | | | (12,254 | ) | | | (2,273,931 | ) | | | -4.43 | % | | | | | | | | | | | | |
| CARNIVAL CORP | | | (5,053 | ) | | | (277,202 | ) | | | -0.54 | % | | | | | | | | | | | | |
| FIDELITY NATIONAL INFORMATION COM STK | | | (19,516 | ) | | | (2,262,537 | ) | | | -4.41 | % | | | | | | | | | | | | |
| HARRIS CORP DEL COM STK | | | (6,032 | ) | | | (1,016,396 | ) | | | -1.98 | % | | | | | | | | | | | | |
| COMMON STOCK Total | | | (42,855 | ) | | | (5,830,066 | ) | | | -11.36 | % | | | | | | | | | | | | |
| | | | | | | | | | | | | | | | | | | | | | | | | |
| EQUITY SWAP | | | | | | | | | | | | | | | | | | | | | | | | |
| ALIBABA GROUP HOLDING LTD | | | (10,988 | ) | | | (386,335 | ) | | | -0.75 | % | | Morgan Stanley & Co., LLC | | 1D FEDEF -.35 bps | | 1D FEDEF | | 12/20/2019 | | | (5,764,943 | ) |
| EQUITY SWAP Total | | | (10,988 | ) | | | (386,335 | ) | | | -0.75 | % | | | | | | | | | | | | |
| | | | | | | | | | | | | | | | | | | | | | | | | |
| OUTSTANDING FORWARD FOREIGN CURRENCY CONTRACTS | | | | | | | | | | |
| USD TO EUR SPOT SD: 02-MAY-2019 | | | (318,104 | ) | | | (318,104 | ) | | | -0.62 | % | | | | | | | | | | | | |
| OUTSTANDING FORWARD FOREIGN CURRENCY CONTRACTS Total | | | (318,104 | ) | | | (283,629 | ) | | | -0.62 | % | | | | | | | | | | | | |
| TOTAL SHORT | | | (371,947 | ) | | $ | (6,534,505 | ) | | | -12.73 | % | | | | | | | | | | | | |
| | | | | | | | | | | | | | | | | | | | | | | | | |
| REMAINING SECURITIES AND CASH | | | 17,623,673 | | | | 34.33 | % | | | | | | | | | | | | |
| TOTAL VALUE | | | | | | $ | 51,350,297 | | | | | | | | | | | | | | | | | |
See Notes to Financial Statements.
22
| Highland Resolute Fund | Consolidated Schedule of Investments |
April 30, 2019
WABR
| Description | | Contracts/Shares | | | Value | | | Percentage
of Value | |
| LONG SECURITIES | | | | | | | | | | | | |
| COMMON STOCK | | | | | | | | | | | | |
| AMERICAN ASSETS REIT ORD (NYS) | | | 5,668 | | | $ | 261,805 | | | | 0.76 | % |
| AMERICAN ELECTRIC POWER ORD (NYS) | | | 2,501 | | | | 213,961 | | | | 0.62 | % |
| AMERICOLD REALTY ORD (NYS) | | | 15,746 | | | | 504,029 | | | | 1.46 | % |
| AVALONBAY COMMUNITIES REIT ORD (NYS) | | | 1,608 | | | | 323,095 | | | | 0.93 | % |
| BOSTON PROPERTIES REIT ORD (NYS) | | | 1,915 | | | | 263,542 | | | | 0.76 | % |
| COMSCORE INC (NMQ) | | | 16,508 | | | | 207,175 | | | | 0.60 | % |
| COUSINS PROPERTIES REIT ORD (NYS) | | | 29,444 | | | | 281,779 | | | | 0.81 | % |
| CYRUSONE REIT ORD (NMS) | | | 7,464 | | | | 415,670 | | | | 1.20 | % |
| DIAMONDBACK ENERGY ORD (NMS) | | | 2,149 | | | | 228,632 | | | | 0.66 | % |
| DUKE REALTY REIT ORD (NYS) | | | 9,298 | | | | 289,354 | | | | 0.84 | % |
| ENTERGY ORD (NYS) | | | 2,675 | | | | 259,208 | | | | 0.75 | % |
| EVERGY ORD (NYS) | | | 3,175 | | | | 183,579 | | | | 0.53 | % |
| EXELON ORD (NYS) | | | 4,176 | | | | 212,767 | | | | 0.61 | % |
| FOUR CORNERS PROPERTY ORD (NYS) | | | 9,178 | | | | 261,022 | | | | 0.75 | % |
| HEALTHCAR TRST OF AM CL A REIT ORD (NYS) | | | 13,013 | | | | 358,899 | | | | 1.04 | % |
| HUDSON PACIFIC PROPERTIES REIT ORD (NYQ) | | | 10,213 | | | | 356,025 | | | | 1.03 | % |
| INVITATION HOMES ORD (NYS) | | | 7,572 | | | | 188,240 | | | | 0.54 | % |
| INVSC S P 500 EQUAL WEIGHT ETF (PSE) | | | 13,220 | | | | 1,430,272 | | | | 4.13 | % |
| ISHARES IBOXX HIGH YIELD BOND ETF (PSE) | | | 47,023 | | | | 4,088,180 | | | | 11.81 | % |
| ISHARES IBOXX INVT GRADE BOND ETF (PSE) | | | 34,224 | | | | 4,080,185 | | | | 11.78 | % |
| KILROY REALTY REIT ORD (NYS) | | | 4,651 | | | | 357,708 | | | | 1.03 | % |
| MID AMERICA APT COMMUNITI REIT ORD (NYS) | | | 1,827 | | | | 199,892 | | | | 0.58 | % |
| REGENCY CENTERS REIT ORD (NMS) | | | 6,145 | | | | 412,821 | | | | 1.19 | % |
| UNITED PARCEL SERVICE CL B ORD (NYS) | | | 2,392 | | | | 254,078 | | | | 0.73 | % |
| VICI PPTYS ORD (NYS) | | | 20,654 | | | | 470,911 | | | | 1.36 | % |
| WEINGARTEN RLTY REIT ORD (NYS) | | | 10,507 | | | | 304,073 | | | | 0.88 | % |
| COMMON STOCK Total | | | 282,946 | | | | 16,406,902 | | | | 47.38 | % |
| | | | | | | | | | | | | |
| CORPORATE BONDS | | | | | | | | | | | | |
| BESPL EMTN 0.0000% 2020-01-15 | | | 700,000 | | | | 229,574 | | | | 0.66 | % |
| CORPORATE BONDS Total | | | 700,000 | | | | 229,574 | | | | 0.66 | % |
| TOTAL LONG | | | 982,946 | | | $ | 16,636,476 | | | | 48.04 | % |
| | | | | | | | | | | | | |
| SECURITIES SOLD SHORT | | | | | | | | | | | | |
| COMMON STOCK | | | | | | | | | | | | |
| ALEXANDRIA REAL ESTATE EQ REIT ORD (NYS) | | | (1,820 | ) | | | (259,150 | ) | | | -0.75 | % |
| APARTMENT INVST MGT CL A REIT ORD (NYS) | | | (5,031 | ) | | | (248,330 | ) | | | -0.72 | % |
| BRANDYWINE REALTY REIT ORD (NYS) | | | (13,038 | ) | | | (200,655 | ) | | | -0.58 | % |
| BRIXMOR PROPERTY GROUP REIT ORD (NYS) | | | (26,835 | ) | | | (479,810 | ) | | | -1.39 | % |
| CONSOLIDATED EDISON ORD (NYS) | | | (2,671 | ) | | | (230,133 | ) | | | -0.66 | % |
| CORPORATE OFFICE PROP REIT ORD (NYS) | | | (10,105 | ) | | | (281,727 | ) | | | -0.81 | % |
| CSX ORD (NMS) | | | (3,208 | ) | | | (255,453 | ) | | | -0.74 | % |
| DIGITAL REALTY REIT ORD (NYS) | | | (3,507 | ) | | | (412,809 | ) | | | -1.19 | % |
| DTE ENERGY ORD (NYS) | | | (2,122 | ) | | | (266,757 | ) | | | -0.77 | % |
| ENERGY SELECT SECTOR SPDR ETF (PSE) | | | (10,212 | ) | | | (675,115 | ) | | | -1.95 | % |
| EPR PROPERTIES REIT ORD (NYS) | | | (4,422 | ) | | | (348,719 | ) | | | -1.01 | % |
| ESSEX PROPERTY REIT ORD (NYS) | | | (1,225 | ) | | | (346,063 | ) | | | -1.00 | % |
| FIRST INDUSTRIAL REALTY TRUST ORD (NYS) | | | (8,021 | ) | | | (282,901 | ) | | | -0.82 | % |
| HEALTHCARE REAL REIT ORD (NYS) | | | (8,483 | ) | | | (261,955 | ) | | | -0.76 | % |
| INVSC QQQ TRUST SRS 1 ETF (NMS) | | | (1,088 | ) | | | (206,220 | ) | | | -0.60 | % |
| KIMCO REALTY REIT ORD (NYS) | | | (27,290 | ) | | | (474,573 | ) | | | -1.37 | % |
See Notes to Financial Statements.
| Annual Report | April 30, 2019 | 23 |
| Highland Resolute Fund | Consolidated Schedule of Investments |
April 30, 2019
| Description | | Contracts/Shares | | | Value | | | Percentage
of Value | |
| COMMON STOCK (CONTINUED) | | | | | | | | | | | | |
| MEDICAL PROPERTIES REIT ORD (NYS) | | | (11,796 | ) | | | (205,958 | ) | | | -0.59 | % |
| PIEDMONT OFFICE REIT CL A ORD (NYS) | | | (21,814 | ) | | | (454,167 | ) | | | -1.31 | % |
| REALTY INCOME REIT ORD (NYS) | | | (2,610 | ) | | | (182,726 | ) | | | -0.53 | % |
| SOUTHERN ORD (NYS) | | | (4,524 | ) | | | (240,767 | ) | | | -0.70 | % |
| SPDR S&P 500 ETF (PSE) | | | (739 | ) | | | (217,281 | ) | | | -0.63 | % |
| W P CAREY REIT ORD (NYS) | | | (2,499 | ) | | | (198,221 | ) | | | -0.57 | % |
| WEC ENERGY GROUP ORD (NYS) | | | (2,871 | ) | | | (225,173 | ) | | | -0.65 | % |
| COMMON STOCK Total | | | (175,931 | ) | | | (6,954,663 | ) | | | -20.10 | % |
| TOTAL SHORT | | | (175,931 | ) | | $ | (6,954,663 | ) | | | -20.10 | % |
| | | | | | | | | | | | | |
| REMAINING SECURITIES AND CASH | | | | | | $ | 24,948,853 | | | | 72.06 | % |
| TOTAL VALUE | | | | | | $ | 34,630,666 | | | | | |
Common Abbreviations:
AQR - AQR Capital Management LLC.
BBA - British Bankers Association.
EURIBOR - Euro Interbank Offered Rate.
LIBOR - London Interbank Offered Rate.
PIMCO - Pacific Investment Management Company.
S&P - Standard & Poor's.
SPDR - Standard & Poor's Depositary Receipt.
Currency Abbreviations:
AUD - Australian Dollar
CAD - Canada Dollar
CHF - Franc Switzerland
EUR - Euro
GBP - Great British Pound
INR - India Rupee
JPY - Japan Yen
KRW - South Korea Won
MXN - Mexico Peso
NOK - Norwegian Krone
PLN - Poland Zloty
SEK - Swedish Krona
SGD - Singapore Dollar
USD - United States Dollar
See Notes to Financial Statements.
24
| Highland Resolute Fund | Consolidated Statement of Assets and Liabilities |
April 30, 2019
| | | Highland Resolute Fund | |
| ASSETS | | | |
| Investments, at value | | $ | 270,539,795 | |
| Unrealized appreciation on total return swap contracts | | | 37 | |
| Deposits with brokers for securities sold short | | | 13,728,365 | |
| Deposits with brokers for total return swap contracts | | | 56,130,000 | |
| Foreign currency, at value (Cost $1,453,074) | | | 1,465,085 | |
| Receivable for investments sold | | | 2,471,616 | |
| Receivable for shares sold | | | 511,906 | |
| Dividends receivable | | | 255,191 | |
| Interest receivable | | | 888,935 | |
| Receivable for interest on total return swap contracts | | | 3,185,639 | |
| Other assets | | | 24,831 | |
| Total assets | | | 349,201,400 | |
| LIABILITIES | | | | |
| Securities sold short (Proceeds $13,023,757) | | | 13,802,221 | |
| Unrealized depreciation on total return swap contracts | | | 43,279 | |
| Investment advisory fees payable | | | 97,579 | |
| Distributions and service fees payable | | | 61,933 | |
| Payable for interest expense on securities sold short | | | 83,960 | |
| Payable for interest expense on total return swap contracts | | | 464,005 | |
| Payable for total return swap reset | | | 45,914 | |
| Payable to custodian | | | 63,933 | |
| Payable for investments purchased | | | 1,967,912 | |
| Trustee fees and expenses payable | | | 10,613 | |
| Chief compliance officer fee payable | | | 6,375 | |
| Principal financial officer fees payable | | | 833 | |
| Administration fees payable | | | 26,602 | |
| Transfer agent fees payable | | | 10,167 | |
| Professional fees payable | | | 52,835 | |
| Custody fees payable | | | 12,334 | |
| Accrued expenses and other liabilities | | | 15,968 | |
| Total liabilities | | | 16,766,463 | |
| NET ASSETS | | $ | 332,434,937 | |
| NET ASSETS CONSIST OF | | | | |
| Paid-in capital (Note 6) | | $ | 331,310,524 | |
| Total distributable earnings | | | 1,124,413 | |
| NET ASSETS | | $ | 332,434,937 | |
| INVESTMENTS, AT COST | | $ | 269,522,380 | |
| PRICING OF SHARES | | | | |
| Class I: | | | | |
| Net Asset Value, offering and redemption price per share | | $ | 10.30 | |
| Net Assets | | $ | 332,434,937 | |
| Shares of beneficial interest outstanding (unlimited number of shares, no par value common stock authorized) | | | 32,287,022 | |
See Notes to Financial Statements.
| Annual Report | April 30, 2019 | 25 |
| Highland Resolute Fund | Consolidated Statement of Operations |
For the Year Ended April 30, 2019
| | | Highland Resolute Fund | |
| INVESTMENT INCOME | | | | |
| Dividends | | $ | 3,775,976 | |
| Interest | | | 5,658,996 | |
| Foreign taxes withheld | | | (8,094 | ) |
| Total investment income | | | 9,426,878 | |
| | | | | |
| EXPENSES | | | | |
| Investment advisory fees (Note 7) | | | 5,262,549 | |
| Investment advisory fee-subsidiary | | | 267,332 | |
| Administration fees | | | 308,720 | |
| Transfer agency fees | | | 65,790 | |
| Distribution and service fees | | | | |
| Class I | | | 42,641 | |
| Professional fees | | | 67,632 | |
| Custody fees | | | 75,590 | |
| Reports to shareholders and printing fees | | | 11,358 | |
| Trustee fees and expenses | | | 19,380 | |
| Registration/filing fees | | | 36,303 | |
| Chief compliance officer fees | | | 61,218 | |
| Principal financial officer fees | | | 10,000 | |
| Dividend expense on securities sold short | | | 162,734 | |
| Interest expense on securities sold short | | | 497,726 | |
| Other | | | 17,450 | |
| Total expenses before waivers | | | 6,906,423 | |
| Less fees waived/reimbursed by investment adviser (Note 7) | | | | |
| Class I | | | (4,058,564 | ) |
| Waiver of investment advisory fees - subsidiary (Note 7) | | | (267,332 | ) |
| Total net expenses | | | 2,580,527 | |
| NET INVESTMENT INCOME | | | 6,846,351 | |
| Net realized gain on investments | | | 2,782,171 | |
| Net realized loss on securities sold short | | | (169,452 | ) |
| Net realized loss on total return swap contracts | | | (7,831,564 | ) |
| Net realized gain on foreign currency transactions | | | 6,148 | |
| Total net realized loss | | | (5,212,697 | ) |
| Net realized capital gain distributions from other investment companies | | | 50,001 | |
| | | | | |
| Net change in unrealized depreciation on investments | | | (1,439,220 | ) |
| Net change in unrealized depreciation on securities sold short | | | (906,186 | ) |
| Net change in unrealized appreciation on total return swap contracts | | | 133,327 | |
| Net change in unrealized appreciation on translation of assets and liabilities in foreign currency transactions | | | 12,756 | |
| Total net change in unrealized depreciation | | | (2,199,323 | ) |
| NET REALIZED AND UNREALIZED LOSS ON INVESTMENTS | | | (7,362,019 | ) |
| NET DECREASE IN NET ASSETS RESULTING FROM OPERATIONS | | $ | (515,668 | ) |
See Notes to Financial Statements.
26
| Highland Resolute Fund | Consolidated Statements of Changes in Net Assets |
| | | Highland Resolute Fund | |
| | | For the Year Ended
April 30, 2019 | | | For the Year Ended
April 30, 2018(a) | |
| OPERATIONS | | | | | | |
| Net investment income | | $ | 6,846,351 | | | $ | 9,150,835 | |
| Net realized gain/(loss) | | | (5,212,697 | ) | | | 22,993,299 | |
| Net realized gain distributions from other investment companies | | | 50,001 | | | | – | |
| Net change in unrealized depreciation | | | (2,199,323 | ) | | | (8,414,624 | ) |
| Net increase/(decrease) in net assets resulting from operations | | | (515,668 | ) | | | 23,729,510 | |
| TOTAL DISTRIBUTIONS (NOTE 4)(b) | | | | | | | | |
| Class I | | | (15,995,417 | ) | | | (32,044,404 | ) |
| Net decrease in net assets from distributions | | | (15,995,417 | ) | | | (32,044,404 | ) |
| BENEFICIAL INTEREST TRANSACTIONS (NOTE 6) | | | | | | | | |
| Shares sold | | | | | | | | |
| Class I | | | 9,834,051 | | | | 101,112,642 | |
| Dividends reinvested | | | | | | | | |
| Class I | | | 15,995,417 | | | | 32,044,404 | |
| Shares redeemed, net of redemption fees | | | | | | | | |
| Class I | | | (50,748,365 | ) | | | (242,788,583 | ) |
| Net decrease in net assets derived from beneficial interest transactions | | | (24,918,897 | ) | | | (109,631,537 | ) |
| Net decrease in Net Assets | | | (41,429,982 | ) | | | (117,946,431 | ) |
| NET ASSETS: | | | | | | | | |
| Beginning of period | | | 373,864,919 | | | | 491,811,350 | |
| End of period | | $ | 332,434,937 | | | $ | 373,864,919 | (c) |
| (a) | Prior to August 31, 2017 the Highland Resolute Fund was known as the Redmont Resolute Fund. |
| (b) | For the prior year ended April 30, 2018, Total Distributions consisted of Net Investment Income of $25,692,479, and Net Realized Gains of $6,351,925. |
| (c) | For the prior year ended April 30, 2018, included accumulated net investment income of $5,245,979. |
See Notes to Financial Statements.
| Annual Report | April 30, 2019 | 27 |
| Highland Resolute Fund | Consolidated Financial Highlights |
For a share outstanding throughout the periods presented
| | | Class I | |
| | | For the
Year Ended
April 30, 2019 | | | For the
Year Ended
April 30, 2018(a) | | | For the
Year Ended
April 30, 2017(b) | | | For the
Year Ended
April 30, 2016 | | | For the
Year Ended
April 30, 2015 | |
| NET ASSET VALUE, BEGINNING OF PERIOD | | $ | 10.81 | | | $ | 11.14 | | | $ | 10.75 | | | $ | 11.32 | | | $ | 11.18 | |
| INCOME/(LOSS) FROM OPERATIONS | | | | | | | | | | | | | | | | | | | | |
| Net investment income(c) | | | 0.20 | | | | 0.25 | | | | 0.09 | | | | 0.16 | | | | 0.20 | |
| Net realized and unrealized gain/(loss) on investments | | | (0.22 | ) | | | 0.38 | | | | 0.45 | | | | (0.39 | ) | | | 0.26 | |
| Total from Investment Operations | | | (0.02 | ) | | | 0.63 | | | | 0.54 | | | | (0.23 | ) | | | 0.46 | |
| | | | | | | | | | | | | | | | | | | | | |
| LESS DISTRIBUTIONS | | | | | | | | | | | | | | | | | | | | |
| Net investment income | | | (0.15 | ) | | | (0.77 | ) | | | (0.13 | ) | | | (0.18 | ) | | | (0.24 | ) |
| Net realized gain on investments | | | (0.34 | ) | | | (0.19 | ) | | | (0.02 | ) | | | (0.16 | ) | | | (0.08 | ) |
| Total Distributions | | | (0.49 | ) | | | (0.96 | ) | | | (0.15 | ) | | | (0.34 | ) | | | (0.32 | ) |
| NET INCREASE/(DECREASE) IN NET ASSET VALUE | | | (0.51 | ) | | | (0.33 | ) | | | 0.39 | | | | (0.57 | ) | | | 0.14 | |
| NET ASSET VALUE, END OF PERIOD | | $ | 10.30 | | | $ | 10.81 | | | $ | 11.14 | | | $ | 10.75 | | | $ | 11.32 | |
TOTAL RETURN(d) | | | 0.22 | % | | | 5.51 | % | | | 5.04 | % | | | (2.02 | )% | | | 4.16 | % |
| | | | | | | | | | | | | | | | | | | | | |
| RATIOS/SUPPLEMENTAL DATA | | | | | | | | | | | | | | | | | | | | |
| Net assets, End of Period (000s) | | $ | 332,435 | | | $ | 373,865 | | | $ | 491,811 | | | $ | 686,659 | | | $ | 689,266 | |
| RATIOS TO AVERAGE NET ASSETS: | | | | | | | | | | | | | | | | | | | | |
| Operating expenses excluding reimbursement/waiver(e) | | | 1.89 | %(f)(g) | | 1.94 | %(f)(g) | | 1.77 | %(f)(g) | | 1.69 | %(f) | | 1.68 | %(f) |
| Operating expenses including reimbursement/waiver(e) | | | 0.74 | %(f) | | | 0.82 | %(f) | | | 0.52 | %(f) | | | 0.35 | %(f) | | | 0.33 | %(f) |
| Net investment income including reimbursement/waiver(e) | | | 1.95 | % | | | 2.24 | % | | | 0.86 | % | | | 1.49 | % | | | 1.79 | % |
| PORTFOLIO TURNOVER RATE | | | 55 | % | | | 79 | % | | | 94 | % | | | 27 | % | | | 54 | % |
| (a) | Prior to August 31, 2017 the Highland Resolute Fund was known as the Redmont Resolute Fund. |
| (b) | Prior to August 31, 2016 the Highland Resolute Fund was known as the Redmont Resolute Fund II. |
| (c) | Calculated using the average shares method. |
| (d) | Total investment return is calculated assuming a purchase of a common share at the opening of the first day and a sale at closing on the last day of each period reported. Dividends and distributions, if any, are assumed for purposes of this calculation to be reinvested at prices obtained under the Fund's dividend reinvestment plan. Total returns would have been lower had certain expenses not been waived during the period. Total investment returns do not reflect brokerage commissions, if any, and are not annualized. |
| (e) | The ratios exclude the impact of expenses of the underlying funds in which the Fund invests as represented in the Schedule of Investments. |
| (f) | Dividend and interest expense on securities sold short totaled 0.19%, 0.25%, 0.10%, 0.08%, and 0.10% of average net assets for the years ended April 30, 2019, 2018, 2017, 2016, and 2015, respectively. |
| (g) | The ratio of operating expenses excluding fee waiver/reimbursements to average net assets is calculated excluding the waived Subsidiary management fee (See Note 7 for additional detail). The ratio inclusive of that fee would be 1.97%, 2.01% and 1.81% for the years ended April 30, 2019, 2018 and 2017, respectively. |
See Notes to Financial Statements.
28
| Highland Resolute Fund | Notes to Consolidated Financial Statements |
April 30, 2019
1. ORGANIZATION
Financial Investors Trust (the “Trust”), a Delaware statutory trust, is an open-end management investment company registered under the Investment Company Act of 1940, as amended (“1940 Act”). The Trust consists of multiple separate portfolios or series. This annual report describes the Highland Resolute Fund (the “Fund”). Effective August 31, 2017, the Fund changed its name from Redmont Resolute Fund. The Fund seeks to provide long-term total return with reduced volatility and reduced correlation to the conventional stock and bond markets. The Fund offers Class I shares.
Basis of Consolidation:Highland Resolute Cayman (the “Subsidiary”), a Cayman Islands exempted company, is a wholly owned subsidiary of the Fund. The Subsidiary’s investment objective is designed to enhance the ability of the Fund to obtain exposure to equities, financial, currency and commodities markets consistent with the limits of the U.S. federal tax law requirements applicable to registered investment companies. The Subsidiary is subject to substantially the same investment policies and investment restrictions as the Fund. The Subsidiary acts as an investment vehicle for the Fund in order to effect certain commodity-related investments on behalf of the Fund. Investments in the Subsidiary are expected to provide the Fund with exposure to the commodity markets within the limitations of Subchapter M of the Internal Revenue Code of 1986, as amended (the “Code”), and recent IRS revenue rulings, as discussed below under “Federal Income Taxes”. The Fund is the sole shareholder of the Subsidiary pursuant to a subscription agreement, and it is intended that the Fund will remain the sole shareholder and will continue to control the Subsidiary. Under the Articles of Association of the Subsidiary, shares issued by the Subsidiary confer upon a shareholder the right to wholly own and vote at general meetings of the Subsidiary and certain rights in connection with any winding-up or repayment of capital, as well as the right to participate in the profits or assets of the Subsidiary. The Fund may invest up to 25% of its total assets in shares of the Subsidiary. As a wholly owned subsidiary of the Fund, all assets and liabilities, income and expenses of the Subsidiary are consolidated in the financial statements and financial highlights of the Fund. All investments held by the Subsidiary are disclosed in the accounts of the Fund. As of April 30, 2019, net assets of the Fund were $332,434,937, of which $19,114,369 or 5.75%, represented the Fund’s ownership of all issued shares and voting rights of the Subsidiary.
2. SIGNIFICANT ACCOUNTING POLICIES
The accompanying financial statements were prepared in accordance with accounting principles generally accepted in the United States of America (“U.S. GAAP”). The preparation of financial statements in conformity with U.S. GAAP requires management to make certain estimates and assumptions that affect the reported amounts of assets and liabilities and disclosures of contingent assets and liabilities at the date of the financial statements and the reported amounts of revenue and expenses during the period. Actual results could differ from those estimates. The Fund is considered an investment company for financial reporting purposes under U.S. GAAP and follows the accounting and reporting guidance applicable to investment companies in the Financial Accounting Standards Board Accounting Standards Codification Topic 946. The following is a summary of significant accounting policies consistently followed by the Fund and Subsidiary in preparation of the financial statements.
Investment Valuation: The Fund generally values its securities based on market prices determined at the close of regular trading on the New York Stock Exchange (“NYSE”), normally 4:00 p.m. Eastern Time, on each day the NYSE is open for trading.
For equity securities and mutual funds that are traded on an exchange, the market price is usually the closing sale or official closing price on that exchange. In the case of equity securities not traded on an exchange, or if such closing prices are not otherwise available, the securities are valued at the mean of the most recent bid and ask prices on such day. Redeemable securities issued by open-end registered investment companies are valued at the investment company’s applicable net asset value, with the exception of exchange-traded open-end investment companies, which are priced as equity securities.
The market price for debt obligations is generally the price supplied by an independent third-party pricing service approved by the Board of Trustees (the “Board”), which may use a matrix, formula or other objective method that takes into consideration quotations from dealers, market transactions in comparable investments, market indices and yield curves. If vendors are unable to supply a price, or if the price supplied is deemed to be unreliable, the market price may be determined using quotations received from one or more brokers–dealers that make a market in the security. Municipal securities having a remaining maturity of greater than 60 days, are typically valued at the evaluated bid price formulated by an independent pricing service. Corporate Bonds, U.S. Government & Agency, and U.S. Treasury Bonds & Notes are valued using market models that consider trade data, quotations from dealers and active market makers, relevant yield curve and spread data, creditworthiness, trade data or market information on comparable securities, and other relevant security specific information. Mortgage-related and asset-backed securities are valued based on models that consider trade data, prepayment and default projections, benchmark yield and spread data and estimated cash flows of each tranche of the issuer. Publicly traded foreign government debt securities are typically traded internationally in the over-the-counter market and are valued at the mean between the bid and asked prices as of the close of business of that market.
| Annual Report | April 30, 2019 | 29 |
| Highland Resolute Fund | Notes to Consolidated Financial Statements |
April 30, 2019
Futures contracts that are listed or traded on a national securities exchange, commodities exchange, contract market or comparable over the counter market, and that are freely transferrable, are valued at their closing settlement price on the exchange on which they are primarily traded or based upon the current settlement price for a like instrument acquired on the day on which the instrument is being valued. A settlement price may not be used if the market makes a limit move with respect to a particular commodity. Over-the-counter swap contracts for which market quotations are readily available are valued based on quotes received from independent pricing services or one or more dealers that make markets in such securities. Options contracts listed for trading on a securities exchange or board of trade are valued at the last quoted sales price or, in the absence of a sale at the mean of the last bid and asked price.
Forward currency exchange contracts have a fair value determined by the current foreign currency exchange forward rates. The foreign currency exchange forward rates are calculated using an automated system that estimates rates on the basis of the current day foreign currency exchange rates and forward foreign currency exchange rates supplied by a pricing service. Foreign exchange rates and forward foreign currency exchange rates may generally be obtained at the close of the NYSE, normally 4:00 p.m. Eastern Time.
When such prices or quotations are not available, or when Highland Associates, Inc. (the “Adviser”) believes that they are unreliable, securities may be priced using fair value procedures approved by the Board.
Fair Value Measurements: The Fund discloses the classification of its fair value measurements following a three-tier hierarchy based on the inputs used to measure fair value. Inputs refer broadly to the assumptions that market participants would use in pricing the asset or liability, including assumptions about risk. Inputs may be observable or unobservable. Observable inputs reflect the assumptions market participants would use in pricing the asset or liability that are developed based on market data obtained from sources independent of the reporting entity. Unobservable inputs reflect the reporting entity’s own assumptions about the assumptions market participants would use in pricing the asset or liability that are developed based on the best information available.
Various inputs are used in determining the value of the Fund’s investments as of the end of the reporting period. When inputs used fall into different levels of the fair value hierarchy, the level in the hierarchy within which the fair value measurement falls is determined based on the lowest level input that is significant to the fair value measurement in its entirety. The designated input levels are not necessarily an indication of the risk or liquidity associated with these investments. These inputs are categorized in the following hierarchy under applicable financial accounting standards:
| | Level 1 – | Unadjusted quoted prices in active markets for identical investments, unrestricted assets or liabilities that the Fund has the ability to access at the measurement date; |
| | | |
| | Level 2 – | Quoted prices which are not active, quoted prices for similar assets or liabilities in active markets or inputs other than quoted prices that are observable (either directly or indirectly) for substantially the full term of the asset or liability; and |
| | | |
| Level 3 – | Significant unobservable prices or inputs (including the Fund’s own assumptions in determining the fair value of investments) where there is little or no market activity for the asset or liability at the measurement date. |
30
| Highland Resolute Fund | Notes to Consolidated Financial Statements |
April 30, 2019
The following is a summary of the inputs used to value the Fund’s investments as of April 30, 2019:
Highland Resolute Fund
| Investments in Securities at Value | | Level 1 -
Quoted Prices | | | Level 2 -
Other Significant
Observable Inputs | | | Level 3 -
Significant Unobservable Inputs | | | Total | |
| Common Stocks* | | $ | 43,165,102 | | | $ | – | | | $ | – | | | $ | 43,165,102 | |
| Open-End Mutual Funds | | | 134,618,730 | | | | – | | | | – | | | | 134,618,730 | |
| Purchased Put Options | | | 84,240 | | | | – | | | | – | | | | 84,240 | |
| Corporate Bonds* | | | – | | | | 59,578,521 | | | | – | | | | 59,578,521 | |
| Short Term Investments | | | | | | | | | | | | | | | | |
| Money Market Funds | | | 33,093,202 | | | | – | | | | – | | | | 33,093,202 | |
| Total | | $ | 210,961,274 | | | $ | 59,578,521 | | | $ | – | | | $ | 270,539,795 | |
| | | | | | | | | | | | | | | | | |
| Other Financial Instruments** | | | | | | | | | | | | | | | | |
| Assets: | | | | | | | | | | | | | | | | |
| Total Return Swap Contracts | | $ | – | | | $ | 37 | | | $ | – | | | $ | 37 | |
| Liabilities: | | | | | | | | | | | | | | | | |
| Corporate Bond Sold Short | | | – | | | | (3,036,590 | ) | | | – | | | | (3,036,590 | ) |
| Exchange Traded Funds Sold Short | | | (10,765,631 | ) | | | – | | | | – | | | | (10,765,631 | ) |
| Total Return Swap Contracts | | | – | | | | (43,279 | ) | | | – | | | | (43,279 | ) |
| Total | | $ | (10,765,631 | ) | | $ | (3,079,832 | ) | | $ | – | | | $ | (13,845,463 | ) |
| * | For detailed descriptions, see the accompanying Schedule of Investments. |
| ** | Other financial instruments are derivative instruments reflected in the Schedule of Investments. The derivatives shown in the table are reported at their unrealized appreciation/(depreciation) at measurement date, which represents the change in the contract’s value from trade date. |
For liabilities arising from overdrafts in the custody account, the carrying amount reported as Payable to custodian in the Statement of Assets and Liabilities approximates fair value due to the relatively short-term maturity of these financial instruments. As of April 30, 2019, the liability related to custody overdrafts in the Highland Resolute Fund are based on Level 2 inputs.
For the year ended April 30, 2019, the Fund did not have any securities that used significant unobservable inputs (Level 3) in determining fair value.
Trust Expenses: Some expenses of the Trust can be directly attributed to the Fund. Expenses which cannot be directly attributed to the Fund are apportioned among all funds in the Trust based on average net assets of the Fund.
Federal Income Taxes: The Fund complies with the requirements under Subchapter M of the Internal Revenue Code of 1986, as amended, applicable to regulated investment companies and intend to distribute substantially all of their net taxable income and net capital gains, if any, each year so that the Fund will not be subject to excise tax on undistributed income and gains. The Fund is not subject to income taxes to the extent such distributions are made.
As of and during the year ended April 30, 2019, the Fund did not have a liability for any unrecognized tax benefits. The Fund files U.S. federal, state, and local tax returns as required. The Fund’s tax returns are subject to examination by the relevant tax authorities until expiration of the applicable statute of limitations, which is generally three years after the filing of the tax return for federal purposes and four years for most state returns. Tax returns for open years have incorporated no uncertain tax positions that require a provision for income taxes.
Investment Transactions and Investment Income: Investment transactions are accounted for on the date the investments are purchased or sold (trade date basis). Net realized gains and losses from investment transactions are reported on an identified cost basis. Interest income, which includes accretion of discounts and amortization of premiums, is accrued and recorded as earned. Dividend income is recognized on the ex-dividend date or for certain foreign securities, as soon as information is available to the Fund. All of the realized and unrealized gains and losses and net investment income, are allocated daily to each class in proportion its average daily net assets.
Short Sales: The Fund may make short sales of securities consistent with its strategies. A short sale is a transaction in which a Fund sells a security it does not own in anticipation that the market price of that security will decline.
| Annual Report | April 30, 2019 | 31 |
| Highland Resolute Fund | Notes to Consolidated Financial Statements |
April 30, 2019
When a Fund makes a short sale, it must borrow the security sold short and deliver it to the broker dealer through which it made the short sale as collateral for its obligation to deliver the security upon conclusion of the sale. The Fund may have to pay a fee to borrow particular securities and is often obligated to pay over any accrued interest and dividends on such borrowed securities.
If the price of the security sold short increases between the time of the short sale and the time that a Fund replaces the borrowed security, the Fund will incur a loss; conversely, if the price declines, the Fund will realize a capital gain. Any gain will be decreased, and any loss increased, by the transaction costs described above. The successful use of short selling may be adversely affected by imperfect correlation between movements in the price of the security sold short and the securities being hedged.
To the extent that a Fund engages in short sales, it will provide collateral to the broker-dealer and (except in the case of short sales “against the box”) will maintain additional asset coverage in the form of segregated or “earmarked” assets determined to be liquid in accordance with procedures established by the Board and that is equal to the current market value of the securities sold short, or will ensure that such positions are covered by “offsetting” positions, until the Fund replaces the borrowed security. A short sale is “against the box” to the extent that the Fund contemporaneously owns, or has the right to obtain at no added cost, securities identical to those sold short. The Fund may engage in short selling to the extent permitted by the federal securities laws and rules and interpretations thereunder. To the extent a Fund engages in short selling in foreign (non-U.S.) jurisdictions, the Fund will do so to the extent permitted by the laws and regulations of such jurisdiction.
Distributions to Shareholders: The Fund normally pays dividends and distributes capital gains, if any, on an annual basis. Income dividend distributions are derived from interest and dividends and other income the Fund receives from their investments, including distributions of short term capital gains. Capital gain distributions are derived from gains realized when the Fund sells a security it has owned for more than a year. The Fund may make additional distributions and dividends at other times if its portfolio manager or managers believe doing so may be necessary for the Fund to avoid or reduce taxes.
3. DERIVATIVE INSTRUMENTS
Swap Contracts: The Fund may enter into swap transactions for hedging purposes or to seek to increase total return. At the present time, the Fund primarily enters into swap transactions for the purpose of increasing total return. Risks may arise as a result of the failure of the counterparty to the swap contract to comply with the terms of the swap contract. The loss incurred by the failure of a counterparty is generally limited to the net payment to be received by the Fund and/or the termination value at the end of the contract.
Therefore, the Fund considers the creditworthiness of each counterparty to a contract in evaluating potential credit risk. Additionally, risks may arise from unanticipated movements in interest rates or in the value of the underlying reference asset or index. Entering into these agreements involves, to varying degrees, market risk, liquidity risk and elements of credit, legal and documentation risk that are not directly reflected in the amounts recognized in the Statements of Assets and Liabilities.
The Fund invests in total return swaps to obtain exposure to a security or market without owning such security or investing directly in that market or to transfer the risk/return of one market (e.g., fixed income) to another market (e.g., equity) (equity risk and/or interest rate risk). Total return swaps are agreements in which there is an exchange of cash flows whereby one party commits to make payments based on the total return (coupons plus capital gains/losses) of an underlying instrument in exchange for fixed or floating rate interest payments. To the extent the total return of the instrument or index underlying the transaction exceeds or falls short of the offsetting interest rate obligation, the Fund will receive a payment from or make a payment to the counterparty. The Fund may pay or receive cash as collateral on these contracts which may be recorded as an asset and/or liability. The Fund must set aside liquid assets, or engage in other appropriate measures, to cover its obligations under these contracts. Swaps are marked to market daily using either pricing vendor quotations, counterparty prices or model prices and the change in value, if any, is recorded as an unrealized gain or loss. Upfront payments made and/or received by the Fund are recorded as an asset and/or liability and realized gains or losses are recognized ratably over the contract’s term/event, with the exception of forward starting interest rate swaps, whose realized gains or losses are recognized ratably from the effective start date. Periodic payments received or made on swap contracts are recorded as realized gains or losses. Gains or losses are realized upon termination of a swap contract and are recorded on the Statement of Operations. Swap agreements held at April 30, 2019 are disclosed in the Consolidated Schedule of Investments.
International Swaps and Derivatives Association, Inc. Master Agreements (“ISDA Master Agreements”) govern OTC financial derivative transactions entered into by the Fund and those counterparties. The ISDA Master Agreements maintain provisions for general obligations, representations, agreements, collateral and events of default or termination. Events of termination include conditions that may entitle counterparties to elect to terminate early and cause settlement of all outstanding transactions under the applicable ISDA Master Agreement. Any election to early terminate could be material to the financial statements.
32
| Highland Resolute Fund | Notes to Consolidated Financial Statements |
April 30, 2019
Option Contracts: The Fund may enter into options transactions for hedging purposes and for non-hedging purposes such as seeking to enhance return. The Fund may write covered put and call options on any stocks or stock indices, currencies traded on domestic and foreign securities exchanges, or futures contracts on stock indices, interest rates and currencies traded on domestic and, to the extent permitted by the CFTC, foreign exchanges. A call option on an asset written by the Fund obligates the Fund to sell the specified asset to the holder (purchaser) at a stated price (the exercise price) if the option is exercised before a specified date (the expiration date). A put option on an asset written by a Fund obligates the Fund to buy the specified asset from the purchaser at the exercise price if the option is exercised before the expiration date. Premiums received when writing options are recorded as liabilities and are subsequently adjusted to the current value of the options written. Premiums received from writing options that expire are treated as realized gains. Premiums received from writing options, which are either exercised or closed, are offset against the proceeds received or amount paid on the transaction to determine realized gains or losses which are recorded on the Statement of Operations.
Futures:The Fund may enter into futures contracts for hedging purposes. A futures contract represents a commitment for the future purchase or sale of an asset at a specified price on a specified date. Upon entering into a futures contract, the Fund is required to deposit an initial margin with the broker in an amount equal to a certain percentage of the contract amount. The Fund receives from or pays to the broker, on a daily basis, an amount of cash equal to the daily fluctuation in value of the contract. Such receipts or payments are known as “variation margin,” and are recorded by the Fund as unrealized gains or losses. When the futures contract is closed, the Fund records a gain or loss equal to the difference between the value of the contract at the time it was opened and the value at the time it was closed.
The Fund’s potential losses from the use of futures extend beyond its initial investment in such contracts. The use of futures contracts involves, to varying degrees, elements of market risk in excess of the amount recognized in the Statements of Assets and Liabilities. The predominant risk is that the movement of a futures contract’s price may result in a loss, which could render the Fund’s hedging strategy unsuccessful. There is minimal counterparty credit risk since futures contracts are exchange traded and the exchange’s clearinghouse, as counterparty to all exchange traded futures, guarantees the futures against default.
Risk Exposure:The following tables disclose the amounts related to the Fund’s use of derivative instruments.
The effect of derivatives instruments on the Statements of Assets and Liabilities as of April 30, 2019 was as follows:
| Risk Exposure | | Asset Derivatives Statements
of Assets and Liabilities
Location | | Fair Value | | | Liability Derivatives Statements
of Assets and Liabilities Location | | Fair Value | |
| Highland Resolute Fund | | | | | | | | | | |
| Equity Contracts (Total Return Swap Contracts) | | Unrealized appreciation on total return swap contracts | | $ | 37 | | | Unrealized depreciation on total return swap contracts | | $ | 12 | |
| Interest Rate Contracts (Total Return Swap Contracts) | | Unrealized appreciation on total return swap contracts | | | – | | | Unrealized depreciation on total return swap contracts | | | 43,267 | |
| Equity Contracts (Purchased Options) | | Investments, at value | | | 84,240 | | | N/A | | | N/A | |
| Total | | | | $ | 84,277 | | | | | $ | 43,279 | |
| Annual Report | April 30, 2019 | 33 |
| Highland Resolute Fund | Notes to Consolidated Financial Statements |
April 30, 2019
The effect of derivatives instruments on the Statements of Operations for the year ended April 30, 2019 was as follows:
| Risk Exposure | | Statement of Operations Location | | Realized Gain/(Loss) on Derivatives Recognized in Income | | Change in Unrealized Appreciation/(Depreciation) on Derivatives Recognized in Income |
| Highland Resolute Fund | | | | | | |
Equity Contracts (Total Return Swap Contracts)
| | Net realized gain on total return swap contracts/Net change in unrealized depreciation on total return swap contracts | | $ | (7,909,788 | ) | | $ | 195,221 | |
Interest Rate Contracts (Total Return Swap Contracts)
| | Net realized gain on total return swap contracts/Net change in unrealized depreciation on total return swap contracts | | | 78,224 | | | | (61,894 | ) |
Equity Contracts (Purchased Options)
| | Net realized loss on investments/Net change in unrealized depreciation on investments | | | (1,797,711 | ) | | | 26,595 | |
| Total | | | | $ | (9,629,275 | ) | | $ | 159,922 | |
Volume of Derivative Instruments for the Fund during the year ended April 30, 2019 was as follows:
| Derivative Type | | Unit of Measurement | | Monthly Average |
| Highland Resolute Fund | | | | |
| Equity Contracts (Total Return Swap Contracts) | | Notional Quantity | | | 199,954,343 | |
| Interest Rate Contracts (Total Return Swap Contracts) | | Notional Quantity | | | (3,813,886 | ) |
| Equity Contracts (Purchased Options) | | Contracts | | | 298 | |
Certain derivative contracts and repurchase agreements are executed under either standardized netting agreements or, for exchange-traded derivatives, the relevant contracts for a particular exchange which contain enforceable netting provisions. A derivative netting arrangement creates an enforceable right of set-off that becomes effective, and affects the realization of settlement on individual assets, liabilities and collateral amounts, only following a specified event of default or early termination. Default events may include the failure to make payments or deliver securities timely, material adverse changes in financial condition or insolvency, the breach of minimum regulatory capital requirements, or loss of license, charter or other legal authorization necessary to perform under the contract.
34
| Highland Resolute Fund | Notes to Consolidated Financial Statements |
April 30, 2019
The following table presents financial instruments that are subject to enforceable netting arrangements or other similar agreements as of April 30, 2019:
Highland Resolute Fund
Offsetting of Derivatives Assets
| | | | | | | | | | | | Gross Amounts Not Offset in the Statement of Assets and Liabilities | |
| | | Gross Amounts of Recognized Assets | | | Gross Amounts Offset in the Statement of Assets and Liabilities | | | Net Amounts Presented in the Statement of Assets and Liabilities | | | Financial Instruments Available for Offset(a) | | | Cash Collateral Received(a) | | | Net Receivable Amount | |
| Total Return Swap Contracts | | $ | 37 | | | $ | — | | | $ | 37 | | | $ | (37 | ) | | $ | — | | | $ | — | |
| Total | | $ | 37 | | | $ | — | | | $ | 37 | | | $ | (37 | ) | | $ | — | | | $ | — | |
Highland Resolute Fund
Offsetting of Derivatives Liabilities
| | | | | | | | | | | | Gross Amounts Not Offset in the Statement of Assets and Liabilities | |
| | | Gross Amounts of Recognized Liabilities | | | Gross Amounts Offset in the Statement of Financial Position | | | Net Amounts Presented in the Statement of Financial Position | | | Financial Instruments Available for Offset(a) | | | Cash Collateral Pledged(a) | | | Net Payable Amount | |
| Total Return Swap Contracts | | $ | 43,279 | | | $ | — | | | $ | 43,279 | | | $ | (37 | ) | | $ | (43,242 | ) | | $ | — | |
| Total | | $ | 43,279 | | | $ | — | | | $ | 43,279 | | | $ | (37 | ) | | $ | (43,242 | ) | | $ | — | |
| (a) | These amounts are limited to the derivative asset/liability balance and, accordingly, do not include excess collateral received/pledged. |
4. TAX BASIS INFORMATION
Reclassifications:As of April 30, 2019, permanent differences in book and tax accounting were reclassified. These differences had no effect on net assets and were primarily attributed to differing book and tax treatment of investments held in a controlled foreign corporation. The reclassifications were as follows:
| | | Distributable earnings | | Paid-in Capital |
| Highland Resolute Fund | | | $ | 49,405 | | | $ | (49,405 | ) |
Tax Basis of Investments:As of April 30, 2019, the aggregate cost of investments, gross unrealized appreciation/(depreciation) and net unrealized appreciation for Federal tax purposes were as follows:
| | | Gross Appreciation (excess of value over tax cost) | | Gross Depreciation (excess of tax cost over value) | | Net Appreciation/(Depreciation) of Foreign Currency | | Net Unrealized Appreciation/(Depreciation) | | Cost of Investments for Income Tax Purposes |
| Highland Resolute Fund | | | $ | 192,119,378 | | | $ | (193,037,437 | ) | | $ | 12,216 | | | $ | (905,843 | ) | | $ | 270,679,400 | |
| Annual Report | April 30, 2019 | 35 |
| Highland Resolute Fund | Notes to Consolidated Financial Statements |
April 30, 2019
Components of Earnings: As of April 30, 2019, components of distributable earnings were as follows:
| | | Accumulated Capital Gains/(Losses) | | Undistributed Ordinary Income | | Net Unrealized Appreciation/(Depreciation) | | Other Cumulative Effect of Timing Differences |
| Highland Resolute Fund | | | $ | (855,587 | ) | | $ | 2,982,895 | | | $ | (905,843 | ) | | $ | (97,052 | ) |
Other Cumulative Effect of Timing Differences is due to suspended losses on partnership investments.
Tax Basis of Distributions to Shareholders: The character of distributions made during the year from net investment income or net realized gains may differ from its ultimate characterization for federal income tax purposes. Also, due to the timing of dividend distributions, the fiscal year in which amounts are distributed may differ from the fiscal year in which the income or realized gain were recorded by the Fund.
The tax character of distributions paid by the Fund for the fiscal year ended April 30, 2019, were as follows:
| | | Ordinary Income | | Long-Term Capital Gains |
| Highland Resolute Fund | | | $ | 5,227,081 | | | $ | 10,768,336 | |
The tax character of distributions paid by the Fund for the fiscal year ended April 30, 2018, were as follows:
| | | Ordinary Income | | Long-Term Capital Gains |
| Highland Resolute Fund | | | $ | 25,692,479 | | | $ | 6,351,925 | |
Under current law, capital losses maintain their character as short-term or long-term and are carried forward to the next tax year without expiration. As of April 30, 2019, the Fund elects to carry forward $472,218 in short-term capital losses to the next tax year.
The Fund elects to defer to the period ending April 29, 2020, capital losses recognized during the period November 1, 2018 through April 30, 2019 in the amount of $383,369.
5. SECURITIES TRANSACTIONS
Purchases and sales of securities, excluding short-term securities and U.S. Government Obligations during the year ended April 30, 2019 were as follows:
| Fund | | | Purchases of Securities | | | Proceeds From Sales of Securities | |
| Highland Resolute Fund | | | $ | 135,923,187 | | | $ | 159,257,511 | |
6. BENEFICIAL SHARE TRANSACTIONS
The capitalization of the Trust consists of an unlimited number of shares of beneficial interest with no par value per share. Holders of the shares of the Fund of the Trust have one vote for each share held and a proportionate fraction of a vote for each fractional share. All shares issued and outstanding are fully paid and are transferable and redeemable at the option of the shareholder. Purchasers of the shares do not have any obligation to make payments to the Trust or its creditors solely by reason of the purchasers’ ownership of the shares. Shares have no pre-emptive rights.
Transactions in common shares were as follows:
| Highland Resolute Fund | | | | | | |
| Class I: | | For the Year Ended April 30, 2019 | | | For the Year Ended April 30, 2018 | |
| Common Shares Outstanding - Beginning of Period | | | 34,589,249 | | | | 44,145,034 | |
| Common Shares Sold | | | 935,962 | | | | 9,179,527 | |
| Common Shares Issued as Reinvestment of Dividends | | | 1,669,668 | | | | 2,958,854 | |
| Common Shares Redeemed | | | (4,907,857 | ) | | | (21,694,166 | ) |
| Common Shares Outstanding - End of Period | | | 32,287,022 | | | | 34,589,249 | |
36
| Highland Resolute Fund | Notes to Consolidated Financial Statements |
April 30, 2019
Shares redeemed within 30 days of purchase may incur a 2% short-term redemption fee deducted from the redemption amount. Redemption fees are reflected in the “Shares redeemed, net of redemption fees” in the Statements of Changes in Net Assets. For the year ended April 30, 2019 and the year ended April 30, 2018, the Fund retained fees as follows:
| Fund | | | For the Year Ended
April 30, 2019 | | | For the Year Ended
April 30, 2018 | |
| Highland Resolute Fund | | | $ | 337 | | | $ | – | |
7. MANAGEMENT AND RELATED PARTY TRANSACTIONS
Investment Advisory
The Adviser, subject to the authority of the Board, is responsible for the overall management and administration of the Fund’s business affairs. Pursuant to the Investment Advisory Agreement (the “Advisory Agreement”), the Adviser is entitled to an investment advisory fee, computed daily and payable monthly of 1.50% of the average daily net assets for the Fund. The management fee is paid on a monthly basis.
The Subsidiary has entered into a separate advisory agreement (the “Subsidiary Advisory Agreement”) with the Adviser for the management of the Subsidiary’s portfolio pursuant to which the Subsidiary is obligated to pay the Adviser a management fee at the same rate that the Fund pays the Adviser for investment advisory services provided to the Fund. The Adviser has agreed to waive the advisory fee it receives from the Fund in an amount equal to the management fee paid by the Subsidiary. This waiver may not be terminated or modified without the consent of the Board. This agreement may not be terminated or modified prior to this date except with the approval of the Board. For the year ended April 30, 2019, this amount equaled $267,332 and is disclosed in the Consolidated Statement of Operations.
The Adviser entered into an Investment Sub-Advisory Agreement with Incline Global Management, LLC. (“Incline”) and Chatham Asset Management, LLC (“Chatham”). The Investment Sub-Advisory Agreements are in accordance with the Fund’s investment objective, policies and limitations and investment guidelines established jointly by the Adviser and the Board. The Adviser determines the allocation of the Fund’s assets among Incline and Chatham (collectively the “Sub-Advisers”) and other open-end investment companies. The Fund is not required to invest with any minimum number of sub-advisers or open-end investment companies, and does not have minimum or maximum limitations with respect to allocations of assets to the Sub-Advisers, investment strategy or market sector. Highland may change the allocation of the Fund’s assets among the available investment options, and may add or remove sub-advisers, at any time. Each Sub-Adviser is responsible for the day-to-day management of its allocated portion of Fund assets. Highland has ultimate responsibility, subject to the oversight of the Board of the Fund, to oversee the Sub-Advisers, and to recommend their hiring, termination and replacement.
Pursuant to each Investment Sub-Advisory Agreement, the Adviser pays the Sub-Advisers an annual sub-advisory management fee which is based on the Fund’s average quarterly market value of the assets managed by the Sub-Advisers. The Adviser is required to pay all fees due to Sub-Advisers out of the management fee the Adviser receives from the Fund. The following table reflects the Fund’s contractual sub-advisory fee rates.
| Sub-Advisers | Contractual
Sub-Advisory Fee |
| Incline Global Management, LLC | 1.25% |
| Chatham Asset Management, LLC | 1.00% |
The Adviser has agreed, with respect to the Fund’s Class I shares, to waive the portion of its 1.50% management fee in excess of any sub-advisory fees paid by the Adviser to Sub-Adviser in connection with the Fund. This agreement is in effect September 1, 2018 through August 31, 2019. The prior agreement was in effect from September 1, 2017 through August 31, 2018. The Adviser may not discontinue this agreement to waive fees prior to August 31, 2019 without the approval of the Fund’s Board of Trustees. The Adviser is not permitted to recoup any amounts waived or reimbursed to the extent actual fees and expenses for a fiscal period are less than the expense limitation cap. Fees waived/reimbursed by adviser for the year ended April 30, 2019 are disclosed in the Consolidated Statement of Operations.
For the year ended April 30, 2019, the fee waivers and/or reimbursements were as follows:
| | | Fees Waived/
Reimbursed By Adviser | |
| Highland Resolute Fund - Class I | | $ | (4,058,564 | ) |
| Annual Report | April 30, 2019 | 37 |
| Highland Resolute Fund | Notes to Consolidated Financial Statements |
April 30, 2019
Administrator Fees and Expenses
ALPS Fund Services, Inc. (“ALPS”) serves as administrator to the Fund, and the Fund has agreed to pay expenses incurred in connection with its administrative activities. Pursuant to an Administration Agreement, ALPS provides operational services to the Fund including, but not limited to, fund accounting and fund administration and generally assists in the Fund’s operations. Officers of the Trust are employees of ALPS. The Fund’s administration fee is accrued on a daily basis and paid monthly. Administration fees paid by the Fund for the year ended April 30, 2019 are disclosed in the Consolidated Statement of Operations.
ALPS is reimbursed by the Fund for certain out-of-pocket expenses.
Transfer Agent
ALPS serves as transfer, dividend paying and shareholder servicing agent for the Fund. ALPS receives an annual minimum fee, a fee based upon the number of shareholder accounts and is also reimbursed by the Fund for certain out-of-pocket expenses. Transfer agent fees paid by the Fund for the year ended April 30, 2019 are disclosed in the Consolidated Statement of Operations.
Compliance Services
ALPS provides services that assist the Fund’s chief compliance officer in monitoring and testing the policies and procedures of the Fund in conjunction with requirements under Rule 38a-1 under the 1940 Act and receives an annual base fee. ALPS is reimbursed for certain out-of-pocket expenses by the Fund. Compliance service fees paid by the Fund for the year ended April 30, 2019 are disclosed in the Consolidated Statement of Operations.
Principal Financial Officer
ALPS receives an annual fee for providing principal financial officer services to the Fund. Principal financial officer fees paid by the Fund for the year ended April 30, 2019 are disclosed in the Consolidated Statement of Operations.
Distributor
ALPS Distributors, Inc. (“ADI” or the “Distributor”) (an affiliate of ALPS) acts as the distributor of the Fund’s shares pursuant to a Distribution Agreement with the Trust on behalf of the Fund. Shares are sold on a continuous basis by ADI as agent for the Fund, and ADI has agreed to use its best efforts to solicit orders for the sale of Fund’s shares, although it is not obliged to sell any particular amount of shares. ADI is not entitled to any compensation for its services as Distributor. ADI is registered as a broker-dealer with the U.S. Securities and Exchange Commission.
Shareholder Services Plan
Effective December 12, 2017, the Fund has adopted a Shareholder Services Plan (the “Plan”) with respect to its Class I shares. Under the Plan, the Fund is authorized to pay banks and its affiliates and other institutions, including broker-dealers and Fund affiliates which may include the Distributor, Adviser and/or the transfer agent (“Participating Organizations”), an aggregate fee in an amount not to exceed on an annual basis 0.10% of the average daily net asset value of Class I shares of the Fund attributable to or held in the name of the Participating Organizations for its clients as compensation for providing shareholder service activities, which do not include distribution services pursuant to an agreement with Participating Organizations. Any amount of such payment not paid to the Participating Organizations during the Fund’s fiscal year for such service activities shall be reimbursed to the Fund as soon as practicable. Plan fees are included with distribution and service fees in the Statement of Operations. Fees recaptured pursuant to the Plan for the year ended April 30, 2019 are included as an offset to distribution and service fees as disclosed in the Consolidated Statement of Operations.
Trustees
The fees and expenses of the independent trustees of the Board are presented in the Consolidated Statement of Operations.
8. INDEMNIFICATIONS
Under the Trust’s organizational documents, its officers and Trustees are indemnified against certain liability arising out of the performance of their duties to the Trust. Additionally, in the normal course of business, the Trust enters into contracts with service providers that may contain general indemnification clauses which may permit indemnification to the extent permissible under applicable law. The Trust’s maximum exposure under these arrangements is unknown, as this would involve future claims that may be made against the Trust that have not yet occurred.
38
| Highland Resolute Fund | Notes to Consolidated Financial Statements |
April 30, 2019
9. NEW ACCOUNTING PROUNCEMENTS
On October 4, 2018, the SEC amended Regulation S-X to require certain financial statement disclosure requirements to conform them to U.S. GAAP for investment companies. Effective November 4, 2018, the Fund adopted disclosure requirement changes for Regulation S-X and these changes are reflected throughout this report. The Fund’s adoption of those amendments, effective with the financial statements prepared as of April 30, 2019, had no effect on the Fund’s net assets or results of operations.
In August 2018, the Financial Accounting Standards Board (“FASB”) issued Accounting Standards Update (“ASU”) 2018-13, which changes the fair value measurement disclosure requirements of FASB Accounting Standards Codification Topic 820, Fair Value Measurement. The update to Topic 820 includes new, eliminated, and modified disclosure requirements. ASU 2018-13 is effective for fiscal years beginning after December 15, 2019, including interim periods. Early adoption is permitted for any eliminated or modified disclosures. The Fund early adopted effective with the financial statements prepared as of April 30, 2019, and they had no effect on the Fund’s net assets or results of operations.
10. SUBSEQUENT EVENT
Highland Associates, Inc. (“Highland”), the Fund’s investment advisor, announced that it has entered into a definitive agreement under which Regions Bank will acquire Highland. The acquisition is expected to close by the third quarter of 2019. The acquisition is subject to stockholder approval, clearances by the relevant regulatory authorities and other customary closing conditions.
As of the date of this report, there is no contractual change to the services provided to the Fund and no changes to the Fund’s fees as a result of the acquisition.
Subsequent events after the date of the Statement of Assets and Liabilities have been evaluated through the date the financial statements were issued.
| Annual Report | April 30, 2019 | 39 |
| Highland Resolute Fund | Report of Independent Registered Accounting Firm |
April 30, 2019
To the shareholders and the Board of Trustees of Financial Investors Trust:
Opinion on the Financial Statements and Financial Highlights
We have audited the accompanying consolidated statement of assets and liabilities, including the consolidated schedule of investments, of Highland Resolute Fund and subsidiary (formerly, Redmont Resolute Fund) (the “Fund’), one of the funds constituting the Financial Investors Trust, as of April 30, 2019, the related consolidated statement of operations for the year then ended, the consolidated statements of changes in net assets for each of the two years in the period then ended, the consolidated financial highlights for each of the five years in the period then ended, and the related notes. In our opinion, the consolidated financial statements and financial highlights present fairly, in all material respects, the financial position of Highland Resolute Fund of Financial Investors Trust as of April 30, 2019, and the results of its operations for the year then ended, the changes in its net assets for each of the two years in the period then ended, and the financial highlights for each of the five years in the period then ended, in conformity with accounting principles generally accepted in the United States of America.
Basis for Opinion
These financial statements and financial highlights are the responsibility of the Fund’s management. Our responsibility is to express an opinion on the Fund’s financial statements and financial highlights based on our audits. We are a public accounting firm registered with the Public Company Accounting Oversight Board (United States) (PCAOB) and are required to be independent with respect to the Fund in accordance with the U.S. federal securities laws and the applicable rules and regulations of the Securities and Exchange Commission and the PCAOB.
We conducted our audits in accordance with the standards of the PCAOB. Those standards require that we plan and perform the audit to obtain reasonable assurance about whether the financial statements and financial highlights are free of material misstatement, whether due to error or fraud. The Funds are not required to have, nor were we engaged to perform, an audit of its internal control over financial reporting. As part of our audits we are required to obtain an understanding of internal control over financial reporting but not for the purpose of expressing an opinion on the effectiveness of the Fund’s internal control over financial reporting. Accordingly, we express no such opinion.
Our audits included performing procedures to assess the risks of material misstatement of the financial statements and financial highlights, whether due to error or fraud, and performing procedures that respond to those risks. Such procedures included examining, on a test basis, evidence regarding the amounts and disclosures in the financial statements and financial highlights. Our audits also included evaluating the accounting principles used and significant estimates made by management, as well as evaluating the overall presentation of the financial statements and financial highlights. Our procedures included confirmation of securities owned as of April 30, 2019, by correspondence with the custodian and brokers; when replies were not received from brokers, we performed other auditing procedures. We believe that our audits provide a reasonable basis for our opinion.
DELOITTE & TOUCHE LLP
Denver, Colorado
June 25, 2019
We have served as the auditor of one or more investment companies advised by Highland Associates, Inc. since 2012.
40
| Highland Resolute Fund | Disclosure Regarding Approval of Fund Advisory Agreements |
April 30, 2019 (Unaudited)
On December 11, 2018, the Trustees met in person to discuss, among other things, the approval of the Investment Advisory Agreement between Highland Associates, Inc. (“Highland”) and the Trust, and the Investment Sub-Advisory Agreements with each of Chatham Asset Management, LLC (“Chatham”) and Incline Global Management, LLC (“Incline”), with respect to the Highland Resolute Fund (the “Highland Fund”), in accordance with Section 15(c) of the 1940 Act. In renewing and approving the Investment Advisory Agreement and Investment Sub-Advisory Agreements, the Trustees, including the Independent Trustees, considered the following factors with respect to the Highland Fund:
Nature, Extent, and Quality of the Services under the Investment Advisory and Sub-Advisory Agreements: The Trustees received and considered information regarding the nature, extent, and quality of services to be provided to the Highland Fund under the Investment Advisory and Investment Sub-Advisory Agreements. The Trustees reviewed certain background materials supplied by Highland, Chatham, and Incline in their presentations, including their Forms ADV.
The Trustees reviewed and considered Highland’s, Chatham’s, and Incline’s investment advisory personnel, their history as asset managers and their performance and the amount of assets currently under management by Highland, Chatham, and Incline and their affiliated entities. The Trustees also reviewed the research and decision-making processes utilized by Highland, Chatham, and Incline, including the methods adopted to seek to achieve compliance with the investment objectives, policies, and restrictions of the Highland Fund.
The Trustees considered the background and experience of Highland’s, Chatham’s, and Incline’s management in connection with the Highland Fund, including reviewing the qualifications, backgrounds, and responsibilities of the management team primarily responsible for the day-to-day portfolio management of the Highland Fund and the extent of the resources devoted to research and analysis of actual and potential investments.
The Trustees also reviewed, among other things, Highland’s, Chatham’s, and Incline’s insider trading policies and procedures and their Codes of Ethics.
Performance:The Trustees reviewed performance information for the Highland Fund for the 3-month, 1-year, 3-year, 5-year, and since inception periods ended September 30, 2018. That review included a comparison of the Highland Fund’s performance to the performance of a group of comparable funds selected by an independent provider of investment company data (the “Data Provider”). The Trustees noted that the performance of the Highland Fund was above its Data Provider universe median for the 1-year, 3-year, 5-year, and since inception periods ended September 30, 2018 and was below its Data Provider universe median for the 3-month period ended September 30, 2018. The Trustees also considered Highland’s, Chatham’s, and Incline’s discussion of the Highland Fund’s underlying portfolio diversification categories, its top contributors and top detractors, as well as Highland’s, Chatham’s, and Incline’s performance and reputation generally and their investment techniques, risk management controls, and decision-making processes.
Investment Advisory and Sub-Advisory Fee Rates: The Trustees reviewed and considered the contractual annual advisory fee paid by the Trust, on behalf of the Highland Fund, to Highland of 1.50% of the Highland Fund’s daily average net assets, in light of the extent and quality of the advisory services provided by Highland to the Highland Fund. The Trustees also reviewed and considered the contractual annual sub-advisory fee paid by Highland to Chatham of 1.00% of the Highland Fund’s daily average net assets allocated to Chatham. The Trustees also reviewed and considered the contractual annual sub-advisory fee paid by Highland to Incline of 1.25% of the Highland Fund’s daily average net assets allocated to Incline.
The Board received and considered information including a comparison of the Highland Fund’s contractual and actual advisory fees and overall expenses with those of funds in the peer group and universe of funds selected by the Data Provider. The Trustees noted that the Highland Fund’s contractual advisory fee rate was the same as the Data Provider peer group median contractual advisory fee rate.
Total Expense Ratios: The Trustees further reviewed and considered the total expense ratio (after waivers) of 0.48% for the Highland Fund. The Trustees noted that the total expense ratio (after waivers) for the Highland Fund was below the Data Provider peer group median total expense ratio (after waivers).
Comparable Accounts: The Trustees noted certain information provided by Highland, Chatham, and Incline regarding fees charged to its other clients utilizing a strategy similar to that employed by the portion of the Highland Fund for which such entity was responsible.
Profitability:The Trustees received and considered retrospective and projected profitability analyses prepared by Highland, Chatham, and Incline based on the fees payable under the Investment Advisory Agreement with Highland and the Investment Sub-Advisory Agreements with each of Chatham and Incline, with respect to the Highland Fund. The Trustees considered the profits, if any, anticipated to be realized by Highland, Chatham, and Incline in connection with the operation of the Highland Fund. The Board then reviewed Highland’s unaudited balance sheet as of September 30, 2018 and Profit and Loss for October 2017 through September 2018 and for October 2016 through September 2017 in order to analyze the financial condition and stability and profitability of Highland. The Board also reviewed financial information for Chatham, and Incline’s
| Annual Report | April 30, 2019 | 41 |
| Highland Resolute Fund | Disclosure Regarding Approval of Fund Advisory Agreements |
April 30, 2019 (Unaudited)
audited financial statements for the year ended December 31, 2017, in order to analyze the financial condition and stability and profitability of Chatham and Incline.
Economies of Scale: The Trustees considered whether economies of scale in the provision of services to the Highland Fund will be passed along to the shareholders under the agreements.
Other Benefits to the Adviser: The Trustees reviewed and considered any other incidental benefits derived or to be derived by Highland from its relationship with the Highland Fund, including whether soft dollar arrangements were used.
In renewing Highland as the investment adviser of the Highland Fund, and Chatham and Incline as sub-advisers of the Highland Fund, and the fees charged under the Investment Advisory and Investment Sub-Advisory Agreements, the Trustees concluded that no single factor reviewed by the Trustees was identified by the Trustees to be determinative as the principal factor in whether to renew the Investment Advisory and Investment Sub-Advisory Agreements. Further, the Independent Trustees were advised by separate independent legal counsel throughout the process. The Trustees, including all of the Independent Trustees, concluded that:
| ● | the nature, extent, and quality of services rendered by Highland, Chatham, and Incline under the Investment Advisory and Sub-Advisory Agreements, respectively, with respect to the Highland Fund were adequate; |
| ● | the performance of the Highland Fund was above its Data Provider universe median for the 1-year, 3-year, 5-year, and since inception periods ended September 30, 2018 and was below its Data Provider universe median for the 3-month period ended September 30, 2018; |
| ● | the contractual advisory fee rate was the same as the Data Provider peer group median contractual advisory fee rate; |
| ● | Chatham’s and Incline’s fees under their respective sub-advisory agreements are paid directly by Highland; |
| ● | the total expense ratio (after waivers) for the Highland Fund was below the Data Provider peer group median total expense ratio (after waivers); |
| ● | bearing in mind the limitations of comparing different types of managed accounts and the different levels of service typically associated with such accounts, the fee structures applicable to Highland’s, Chatham’s, and Incline’s other clients employing a comparable strategy to the Highland Fund were not indicative of any unreasonableness with respect to the advisory and sub-advisory fees payable by the Highland Fund; |
| ● | the profit, if any, realized by Highland, Chatham, and Incline in connection with the operation of the Highland Fund is not unreasonable to the Fund; and |
| ● | there were no material economies of scale or other incidental benefits accruing to Highland, Chatham, and Incline in connection with their relationship with the Highland Fund. |
Based on the Trustees’ deliberations and their evaluation of the information described above, the Trustees, including all of the Independent Trustees, concluded that Highland’s, Chatham’s, and Incline’s compensation for investment advisory and sub-advisory services is consistent with the best interests of the Highland Fund and its shareholders.
On March 12, 2019, the Trustees met in person to discuss, among other things, the approval of the Investment Sub-Advisory Agreement between Highland Associates, Inc. (“Highland), Parametric Portfolio Associates LLC (“Parametric”), and the Trust, with respect to the Highland Resolute Fund (the “Highland Fund”), and the approval of the Investment Sub-Advisory Agreement between Highland Associates, Inc. (“Highland), Solus Alternative Asset Management, LLC (“Solus”), and the Trust, with respect to the Highland Resolute Fund (the “Highland Fund”) (collectively, the “Investment Sub-Advisory Agreements”), in accordance with Section 15(c) of the 1940 Act. In approving each Investment Sub-Advisory Agreement, the Trustees, including the Independent Trustees, considered the following factors with respect to the Highland Fund:
Nature, Extent, and Quality of the Services under the Investment Sub-Advisory Agreements: The Trustees received and considered information regarding the nature, extent, and quality of services to be provided to the Highland Fund under the Investment Sub-Advisory Agreements. The Trustees also reviewed certain background materials supplied by Solus and Parametric in their presentations, including their Form ADVs.
The Trustees reviewed and considered Solus’ and Parametric’s investment sub-advisory personnel, their history as asset managers, their performance, and the amount of assets currently under management by them and their affiliated entities. The Trustees also reviewed the research and decision-making processes utilized by Solus and Parametric, including the methods adopted to seek to achieve compliance with the investment objectives, policies, and restrictions of the Highland Fund.
42
| Highland Resolute Fund | Disclosure Regarding Approval of Fund Advisory Agreements |
April 30, 2019 (Unaudited)
The Trustees considered the background and experience of Solus’ and Parametric’s management in connection with the Highland Fund, including reviewing the qualifications, backgrounds, and responsibilities of the management team primarily responsible for the day-to-day portfolio management of the Highland Fund and the extent of the resources devoted to research and analysis of actual and potential investments.
The Trustees also reviewed, among other things, Solus’ and Parametric’s insider trading policies and procedures and their Code of Ethics.
Performance:The Trustees noted that since neither Solus or Parametric had begun to manage their portions of the Highland Fund, there was no fund performance to be reviewed or analyzed at this time. The Trustees also considered Solus’ and Parametric’s discussion of their reputation generally and their investment techniques, risk management controls, and decision-making processes.
Investment Sub-Advisory Fee Rate: The Trustees reviewed and considered the contractual annual sub-advisory fees to be paid by Highland, on behalf of the Highland Fund, to Solus and to Parametric of 1.50% and 0.30%, respectively, of the Highland Fund’s daily average net assets allocated to Solus and Parametric, in light of the extent and quality of the sub-advisory services to be provided by Solus and Parametric to the Highland Fund. The Board also received and considered information provided by Solus and Parametric with respect to their operating expense structures.
The Board received and considered information including a comparison of the Highland Fund’s contractual and actual advisory fees and overall expenses with those of funds in the peer group and universe of funds selected by an independent provider of investment company data (the “Data Provider”). The Trustees noted that the contractual advisory fee rate for the Highland Fund of 1.50% of the Fund’s daily net assets was above the Data Provider peer group and universe medians.
Total Expense Ratios: Based on such information, the Trustees further reviewed and considered the total expense ratio (net of waivers) of 0.94% for the Highland Fund. The Trustees noted that the Highland Fund’s total expense ratio (net of waivers) was below the Data Provider peer group and universe medians.
Comparable Accounts: The Trustees noted that Solus reported no comparable clients managed utilizing a strategy similar to its investment mandate for the Highland Fund and that Parametric provided information regarding fees charged to other clients utilizing a strategy similar to its investment mandate for the Highland Fund.
Profitability:The Trustees received and considered Solus’ and Parametric’s statements regarding projected profitability based on the fees payable under the Investment Sub-Advisory Agreements. The Trustees considered the profits, if any, anticipated to be realized by Solus and Parametric with respect to the Highland Fund. The Board then reviewed the financial information provided by Solus and Parametric.
Economies of Scale: The Trustees considered whether economies of scale in the provision of services to the Highland Fund will be passed along to the shareholders under the proposed agreements.
Other Benefits to the Sub-Adviser: The Trustees reviewed and considered any other incidental benefits derived or to be derived by Solus and Parametric from their relationship with the Highland Fund, including whether soft dollar arrangements would be used.
In approving Solus and Parametric as investment sub-advisers for the Highland Fund and approving the Investment Sub-Advisory Agreements and the fees to be paid to Solus and Parametric by Highland under the Investment Sub-Advisory Agreements, the Trustees concluded that no single factor reviewed by the Trustees was identified by the Trustees to be determinative as the principal factor in whether to approve the Investment Sub-Advisory Agreements. Further, the Independent Trustees were advised by separate independent legal counsel throughout the process. The Trustees, including all of the Independent Trustees, concluded that:
| ● | the nature, extent, and quality of services to be rendered by Solus and Parametric under the Investment Sub-Advisory Agreements with respect to the Highland Fund were adequate; |
| ● | since Solus and Parametric have not yet begun to manage its portion of the Highland Fund, there is no fund performance to be reviewed or analyzed at this time; |
| ● | the investment sub-advisory fees to be paid to Solus and Parametric by Highland are fair and competitive when considered in light of particular services to be provided by Solus and Parametric to the Highland Fund; |
| ● | Solus had no clients with investment mandates directly comparable to that of the Highland Fund. Bearing in mind the limitations of comparing different types of managed accounts and the different levels of service typically associated with such accounts, the fee structures applicable to Parametric’s other clients employing a comparable strategy to Parametric’s investment mandate for the Highland Fund was not indicative of any unreasonableness with respect to the sub-advisory fees proposed to be payable to Parametric by the Fund; |
| Annual Report | April 30, 2019 | 43 |
| Highland Resolute Fund | Disclosure Regarding Approval of Fund Advisory Agreements |
April 30, 2019 (Unaudited)
| ● | the profit, if any, anticipated to be realized by Solus and Parametric in connection with the operation of their portion of the Highland Fund is not unreasonable to the Highland Fund; and |
| ● | there were no material economies of scale or other incidental benefits accruing to Solus or Parametric in connection with their relationship with the Highland Fund. |
Based on the Trustees’ deliberations and their evaluation of the information described above, the Trustees, including all of the Independent Trustees, concluded that Solus’ and Parametric’s compensation for investment sub-advisory services is consistent with the best interests of the Highland Fund and its shareholders.
44
| Highland Resolute Fund | Additional Information |
April 30, 2019 (Unaudited)
1. FUND HOLDINGS
The Fund files its complete schedule of portfolio holdings with the Securities and Exchange Commission (the “SEC”) for the first and third quarters of each fiscal year within 60 days after the end of the period. Copies of the Fund’s previously filed Form N-Qs are available without charge on the SEC website at http:// www.sec.gov.
2. FUND PROXY VOTING POLICIES, PROCEDURES AND SUMMARIES
Fund policies and procedures used in determining how to vote proxies and information regarding how each of the Fund voted proxies relating to portfolio securities during the most recent prior 12-month period ending June 30 are available without charge, (1) upon request, by calling (toll-free) (866) 759-5679 and (2) on the SEC’s website at http://www.sec.gov.
3. TAX INFORMATION (UNAUDITED)
The Fund designates the following for federal income tax purposes for distributions made during the calendar year ended December 31, 2018:
| | QDI | DRD |
| Highland Resolute Fund | 4.79 % | 3.70 % |
In early 2019, if applicable, shareholders of record received this information for the distribution paid to them by the Fund during the calendar year 2018 via Form 1099. The Fund will notify shareholders in early 2020 of amounts paid to them by the Funds, if any, during the calendar year 2019.
Pursuant to Section 852(b)(3) of the Internal Revenue Code, Highland Resolute Fund designates $10,768,336 as long-term capital gain distribution.
| Annual Report | April 30, 2019 | 45 |
| Highland Resolute Fund | Trustees & Officers |
| | April 30, 2019 (Unaudited) |
Additional information regarding the Fund’s trustees is included in the Statement of Additional Information, which can be obtained without charge by calling 855-268-2242.
INDEPENDENT TRUSTEES
Name,
Address*
& Year
of Birth | Position(s)
Held with
Fund | Term of Office**
and Length of
Time Served | Principal Occupation(s)
During Past 5 Years*** | Number of
Funds in
Fund
Complex
Overseen
by Trustee**** | Other Directorships Held
by Trustee During
Past 5 Years*** |
Mary K.
Anstine,
1940 | Trustee
and
Chairman | Ms. Anstine was elected at a special meeting of shareholders held on March 21, 1997 and re-elected at a special meeting of shareholders held on August 7, 2009. Ms. Anstine was appointed Chairman of the Board at the June 6, 2017 meeting of the Board of Trustees. | Ms. Anstine was formerly an Executive Vice President of First Interstate Bank of Denver until 1994, President/Chief Executive Officer of HealthONE Alliance, Denver, Colorado, from 1994 to 2004, and has been retired since 2004. Ms. Anstine is also Trustee/Director of AV Hunter Trust and Colorado Uplift Board. Ms. Anstine was formerly a Director of the Trust Bank of Colorado (later purchased and now known as Northern Trust Bank), HealthONE and Denver Area Council of the Boy Scouts of America, and a member of the American Bankers Association Trust Executive Committee. | 31 | Ms. Anstine is a Trustee of ALPS ETF Trust (20 funds); ALPS Variable Investment Trust (9 funds); Reaves Utility Income Fund (1 fund); and Segall Bryant & Hamill Trust (14 funds). |
Jeremy W.
Deems,
1976 | Trustee | Mr. Deems was appointed as a Trustee at the March 11, 2008 meeting of the Board of Trustees and elected at a special meeting of shareholders held on August 7, 2009. | Mr. Deems is the Co-Founder, Chief Operations Officer and Chief Financial Officer of Green Alpha Advisors, LLC, a registered investment advisor, and Co-Portfolio Manager of the Shelton Green Alpha Fund. Prior to joining Green Alpha Advisors, Mr. Deems was CFO and Treasurer of Forward Management, LLC, ReFlow Management Co., LLC, ReFlow Fund, LLC, a private investment fund, and Sutton Place Management, LLC, an administrative services company, from 1998 to June 2007. From 2004 to 2005, Mr Deems also served as Treasurer of the Forward Funds and the Sierra Club Funds. | 31 | Mr. Deems is a Trustee of ALPS ETF Trust (20 funds); ALPS Variable Investment Trust (9 funds); Clough Funds Trust (1 fund); and Reaves Utility Income Fund (1 fund). |
| Highland Resolute Fund | Trustees & Officers |
| | April 30, 2019 (Unaudited) |
INDEPENDENT TRUSTEES
Name,
Address*
& Year
of Birth | Position(s)
Held with
Fund | Term of Office**
and Length of
Time Served | Principal Occupation(s)
During Past 5 Years*** | Number of
Funds in
Fund
Complex
Overseen
by Trustee**** | Other Directorships Held
by Trustee During
Past 5 Years*** |
Jerry G.
Rutledge,
1944 | Trustee | Mr. Rutledge was elected at a special meeting of shareholders held on August 7, 2009. | Mr. Rutledge is the President and owner of Rutledge’s Inc., a retail clothing business. Mr. Rutledge is currently Director of the American National Bank. He was from 1994 to 2007 a Regent of the University of Colorado. | 31 | Mr. Rutledge is a Trustee of Principal Real Estate Income Fund (1 fund); Clough Global Dividend and Income Fund (1 fund); Clough Global Equity Fund (1 fund); and Clough Global Opportunities Fund (1 fund). |
Michael
“Ross” Shell,
1970 | Trustee | Mr. Shell was elected at a special meeting of shareholders held on August 7, 2009. | Mr. Shell is Founder and CEO of Red Idea, LLC, a strategic consulting/early stage venture firm (since June 2008). From 1999 to 2009, he was a part-owner and Director of Tesser, Inc., a brand agency. From December 2005 to May 2008, he was Director, Marketing and Investor Relations, of Woodbourne, a REIT/real estate hedge fund and private equity firm. Prior to this, from May 2004 to November 2005, he worked as a business strategy consultant; from June 2003 to April 2004, he was on the Global Client Services team of IDEO, a product design/innovation firm; and from 1999 to 2003, he was President of Tesser, Inc. Mr. Shell graduated with honors from Stanford University with a degree in Political Science. | 31 | None. |
| Annual Report | April 30, 2019 | 47 |
| Highland Resolute Fund | Trustees & Officers |
| | April 30, 2019 (Unaudited) |
INTERESTED TRUSTEE
Name,
Address*
& Year
of Birth | Position(s)
Held with
Fund | Term of Office**
and Length of
Time Served | Principal Occupation(s)
During Past 5 Years*** | Number of
Funds in
Fund
Complex
Overseen by
Trustee**** | Other Directorships Held
by Trustee During
Past 5 Years*** |
Edmund J.
Burke,
1961 | Trustee
and
President^ | Mr. Burke was elected as Trustee at a special meeting of shareholders held on August 7, 2009. Mr. Burke was elected President of the Trust at the December 17, 2002 meeting of the Board of Trustees. | Mr. Burke is President and a Director of ALPS Holdings, Inc. (“AHI”) (since 2005) and ALPS Advisors, Inc. (“AAI”) and Director of Boston Financial Data Services, Inc. (“BFDS”), ALPS Distributors, Inc. (“ADI”), ALPS Fund Services, Inc. (“AFS”) and ALPS Portfolio Solutions Distributor, Inc. (“APSD”). Because of his positions with AHI, BFDS, AAI, ADI, AFS and APSD, Mr. Burke is deemed an affiliate of the Trust as defined under the 1940 Act. | 31 | Mr. Burke is a Trustee of ALPS ETF Trust (20 funds); Clough Global Dividend and Income Fund (1 fund); Clough Global Equity Fund (1 fund); Clough Global Opportunities Fund (1 fund); Clough Funds Trust (1 fund); Liberty All-Star Equity Fund (1 fund); and Director of the Liberty All-Star Growth Fund, Inc. (1 fund). |
| Highland Resolute Fund | Trustees & Officers |
| | April 30, 2019 (Unaudited) |
OFFICERS
Name, Address*
& Year of Birth | Position(s) Held
with Fund | Term of Office**and
Length of Time Served | Principal Occupation(s)
During Past 5 Years*** |
Kimberly R. Storms,
1972 | Treasurer | Ms. Storms was elected Treasurer of the Trust at the March 12, 2013 meeting of the Board of Trustees. | Ms. Storms is Senior Vice President - Director of Fund Administration of ALPS. Because of her position with ALPS, Ms. Storms is deemed an affiliate of the Trust as defined under the 1940 Act. Ms. Storms is also Treasurer of Liberty All-Star Equity Fund, Liberty All-Star Growth Fund, Inc., and ALPS Series Trust. Ms. Storms also serves as a Board member and Treasurer of The Center for Trauma & Resilience, a nonprofit agency. |
Karen S. Gilomen,
1970 | Secretary | Ms. Gilomen was elected Secretary of the Trust at the December 13, 2016 meeting of the Board of Trustees. | Ms. Gilomen joined ALPS in August 2016 as Vice President and Senior Counsel. Prior to joining ALPS, Ms. Gilomen was Vice President - General Counsel & CCO of Monticello Associates, Inc. from 2010 to 2016. Because of her position with ALPS, Ms. Gilomen is deemed an affiliate of the Trust, as defined under the 1940 Act. Ms. Gilomen is also the Secretary of Reaves Utility Income Fund and the Assistant Secretary of the WesMark Funds. |
Ted Uhl,
1974 | Chief Compliance
Officer (“CCO”) | Mr. Uhl was appointed CCO of the Trust at the June 8, 2010 meeting of the Board of Trustees. | Mr. Uhl joined ALPS in October 2006, and is currently Deputy Compliance Officer of ALPS. Prior to his current role, Mr. Uhl served as Senior Risk Manager for ALPS from October 2006 until June 2010. Before joining ALPS, Mr. Uhl served a Sr. Analyst with Enenbach and Associates (RIA), and a Sr. Financial Analyst at Sprint. Because of his position with ALPS, Mr. Uhl is deemed an affiliate of the Trust as defined under the 1940 Act. Mr. Uhl is also CCO of the Axonic Alternative Income Fund, Boulder Growth & Income Fund, Inc., Centre Funds, Index Funds, Reality Shares ETF Trust, Reaves Utility Income Fund and XAI Octagon Floating Rate & Alternative Income Term Trust. |
Jennell Panella,
1974 | Assistant
Treasurer | Ms. Panella was elected Assistant Treasurer of the Trust at the September 15, 2015 meeting of the Board of Trustees. | Ms. Panella joined ALPS in June 2012 and is currently Fund Controller of ALPS Fund Services, Inc. Prior to joining ALPS, Ms. Panella served as Financial Reporting Manager for Parker Global Strategies, LLC (2009-2012). Because of her position with ALPS, Ms. Panella is deemed an affiliate of the Trust as defined under the 1940 Act. Ms. Panella also serves as Assistant Treasurer of James Advantage Funds. |
Sharon Akselrod,
1974 | Assistant
Secretary | Ms. Akselrod was elected Assistant Secretary of the Trust at the September 15, 2015 meeting of the Board of Trustees. | Ms. Akselrod joined ALPS in August 2014 and is currently Senior Investment Company Act Paralegal of ALPS Fund Services, Inc. Prior to joining ALPS, Ms. Akselrod served as Corporate Governance and Regulatory Associate for Nordstrom fsb (2013-2014) and Senior Legal Assistant – Legal Manager for AXA Equitable Life Insurance Company (2008-2013). Because of her position with ALPS, Ms. Akselrod is deemed an affiliate of the Trust as defined under the 1940 Act. Ms. Akselrod is also Assistant Secretary of ALPS ETF Trust, Clough Funds Trust and Principal Real Estate Income Fund. |
| Annual Report | April 30, 2019 | 49 |
| Highland Resolute Fund | Trustees & Officers |
| | April 30, 2019 (Unaudited) |
OFFICERS
Name, Address*
& Year of Birth | Position(s) Held
with Fund | Term of Office**and
Length of Time Served | Principal Occupation(s)
During Past 5 Years*** |
Jennifer Craig,
1973 | Assistant
Secretary | Ms. Craig was elected Assistant Secretary of the Trust at the June 8, 2016 meeting of the Board of Trustees. | Ms. Craig joined ALPS in 2007 and is currently Assistant Vice President and Paralegal Manager of ALPS. Prior to joining ALPS, Ms. Craig was Legal Manager at Janus Capital Management LLC and served as Assistant Secretary of Janus Investment Fund, Janus Adviser Series and Janus Aspen Series. Because of her position with ALPS, Ms. Craig is deemed an affiliate of the Trust as defined under the 1940 Act. Ms. Craig is also Assistant Secretary of Clough Global Dividend and Income Fund, Clough Global Equity Fund, Clough Global Opportunities Fund, Liberty All-Star Equity Fund and Liberty All-Star Growth Fund, Inc. |
Sareena Khwaja-Dixon,
1980 | Assistant
Secretary | Ms. Khwaja-Dixon was elected Assistant Secretary of the Trust at the December 12, 2017 meeting of the Board of Trustees. | Ms. Khwaja-Dixon joined ALPS in August 2015 and is currently Senior Counsel and Vice President of ALPS Fund Services, Inc. Prior to joining ALPS, Ms. Khwaja-Dixon served as a Senior Paralegal/Paralegal for Russell Investments (2011 – 2015). Ms. Khwaja-Dixon is also Secretary of Liberty All-Star Equity Fund and Liberty All-Star Growth Fund, Inc., Clough Funds Trust, Clough Dividend and Income Fund, Clough Global Opportunities Fund, and Clough Global Equity Fund. |
| * | All communications to Trustees and Officers may be directed to Financial Investors Trust c/o 1290 Broadway, Suite 1100, Denver, CO 80203. |
| ** | This is the period for which the Trustee or Officer began serving the Trust. Each Trustee serves an indefinite term, until his successor is elected. Officers are elected on an annual basis. |
| *** | Except as otherwise indicated, each individual has held the office shown or other offices in the same company for the last five years. |
| **** | The Fund Complex includes all series of the Trust (currently 31) and any other investment companies for which any Trustee serves as trustee for and which Highland Associates, Inc., Incline Global Management, LLC and/or Chatham Asset Management LLC provides investment advisory services (currently none). |
| ^ | Effective June 12, 2019, Mr. Burke’s term as President of the Trust ended and Bradley J. Swenson was appointed President of the Trust. |
| Highland Resolute Fund | Privacy Policy |
| | April 30, 2019 (Unaudited) |
| Who We Are | | |
| Who is providing this notice? | Highland Resolute Fund |
| What We Do |
How does the Fund protect my
personal information? | To protect your personal information from unauthorized access and use, we use security measures that comply with federal law. These measures include computer safeguards and secured files and buildings. |
How does the Fund collect my
personal information? | We collect your personal information, for example, when you |
| | ●open an account |
| | ●provide account information or give us your contact information |
| | ●make a wire transfer or deposit money |
| Why can't I limit all sharing? | Federal law gives you the right to limit only |
| | ●sharing for affiliates’ everyday business purposes-information about your creditworthiness |
| | ●affiliates from using your information to market to you |
| ●sharing for non-affiliates to market to you |
| | State laws and individual companies may give you additional rights to limit sharing. |
| Definitions |
| Affiliates | Companies related by common ownership or control. They can be financial and nonfinancial companies. |
| Non-affiliates | Companies not related by common ownership or control. They can be financial and nonfinancial companies. |
| | ●The Fund does not share with non-affiliates so they can market to you. |
| Joint marketing | A formal agreement between non-affiliated financial companies that together market financial products or services to you. |
| | ●The Fund does not jointly market. |
| Other Important Information |
| California Residents | If your account has a California home address, your personal information will not be disclosed to nonaffiliated third parties except as permitted by applicable California law, and we will limit sharing such personal information with our affiliates to comply with California privacy laws that apply to us. |
| Vermont Residents | The State of Vermont requires financial institutions to obtain your consent prior to sharing personal information that they collect about you with affiliated companies and nonaffiliated third parties other than in certain limited circumstances. Except as permitted by law, we will not share personal information we collect about you with nonaffiliated third parties or other affiliated companies unless you provide us with your written consent to share such information. |
| Annual Report | April 30, 2019 | 51 |
| Highland Resolute Fund | Privacy Policy |
| | April 30, 2019 (Unaudited) |
| FACTS | WHAT DOES THE FUND DO WITH YOUR PERSONAL INFORMATION? |
| Why? | Financial companies choose how they share your personal information. Federal law gives consumers the right to limit some but not all sharing. Federal law also requires us to tell you how we collect, share, and protect your personal information. Please read this notice carefully to understand what we do. |
| What? | The types of personal information we collect and share depend on the product or service you have with us. This information can include: |
| | ● Social Security number and account transactions |
| | ● Account balances and transaction history |
| | ● Wire transfer instructions |
| How? | All financial companies need to share customers’ personal information to run their everyday business. In the section below, we list the reasons financial companies can share their customers’ personal information; the reasons the Fund chooses to share; and whether you can limit this sharing. |
| Reasons we can share your personal information | Does the Fund share: | Can you limit this sharing? |
| For our everyday business purposes — such as to process your transactions, maintain your account(s), respond to court orders and legal investigations, or report to credit bureaus | Yes | No |
| For our marketing purposes — to offer our products and services to you | No | We do not share. |
| For joint marketing with other financial companies | No | We do not share. |
| For our affiliates’ everyday business purposes — information about your transactions and experiences | Yes | No |
| For our affiliates’ everyday business purposes — information about your creditworthiness | No | We do not share. |
| For nonaffiliates to market to you | No | We do not share. |

 | TABLE OF CONTENTS |
| Shareholder Letter | 1 |
| Performance Update | 4 |
| Disclosure of Fund Expenses | 10 |
| Portfolio of Investments | |
| Rondure New World Fund | 11 |
| Rondure Overseas Fund | 14 |
| Statements of Assets and Liabilities | 17 |
| Statements of Operations | 18 |
| Statement of Changes in Net Assets | |
| Rondure New World Fund | 19 |
| Rondure Overseas Fund | 20 |
| Financial Highlights | |
| Rondure New World Fund | 21 |
| Rondure Overseas Fund | 23 |
| Notes to Financial Statements | 25 |
| Report of Independent Registered Public Accounting Firm | 32 |
| Additional Information | 33 |
| Trustees and Officers | 34 |
| Privacy Policy | 39 |
Beginning on January 1, 2021, as permitted by regulations adopted by the U.S. Securities and Exchange Commission, paper copies of the Fund’s annual and semi-annual shareholder reports will no longer be sent by mail, unless you specifically request paper copies of the reports. Instead, the reports will be made available on the Funds’ website at www.rondureglobal.com and you will be notified by mail each time a report is posted and provided with a website link to access the report.
Beginning on January 1, 2019, you may, notwithstanding the availability of shareholder reports online, elect to receive all future shareholder reports in paper free of charge. If you invest through a financial intermediary, you can contact your financial intermediary to request that you continue to receive paper copies of your shareholder reports. If you invest directly with the Funds, you can call 1.855.775.3337 to let the Funds know you wish to continue receiving paper copies of your shareholder reports.
If you already elected to receive shareholder reports electronically, you will not be affected by this change and you need not take any action. You may elect to receive shareholder reports and other communications from the Funds electronically anytime by contacting your financial intermediary (such as a broker-dealer or bank) or, if you are a direct investor, by enrolling at www.rondureglobal.com.
| Rondure Funds | Shareholder Letter |
| | April 30, 2019 (Unaudited) |
When Pigs Fly
Dear Fellow Shareholders,
On February 4, 2019, around 20% of the world’s population sat down to a family feast and welcomed in the New Year on the world’s biggest holiday: the Chinese Lunar New Year. As China ushered in the Year of the Earth Pig, it also fueled a massive rally in stocks, and not one for the faint of heart.
While company after company—from smartphone makers to semiconductor chips—posts weaker results, the world’s stock markets just don’t seem to care. Bad news is good news again, as bad news implies that central banks will cut rates. Markets now appear to expect earnings to recover in the back half of 2019.
Animal spirits are back. Markets have gained confidence that the world’s central banks will support them. The world’s debt pile is $244 trillion, more than three times the size of the global economy. Yet no central banker appears willing to take away the punch bowl. Corporate balance sheets just keep building.
It’s the story of the Three Little Pigs, writ large—perfectly timed for the Year of the Pig. Governments are trying to keep straw houses from falling down(1).
So with a little help from the Federal Reserve, 1Q 2019 was one of the best quarters the S&P 500 had since Q3 2009, as the market rebounded from a very weak Q4 2018. China has truly been on a tear. Many of its up days have rivaled the frenetic froth of 2015 on the Shenzhen A-Share market. The army of individual Chinese investors appears to be back at their 2015 habits, rapidly borrowing money to buy stocks and participate in the run(2).
Below is a one-year chart based on data provided by the Chinese Securities Finance Corporation on the outstanding balance of margin debt in China, which is a sum of opening margin balances plus new margin purchases minus debt repayments. It is represented by the CHMDBMT Index with daily data provided by Bloomberg on a one-day lag, shown as of April 8, 2019.
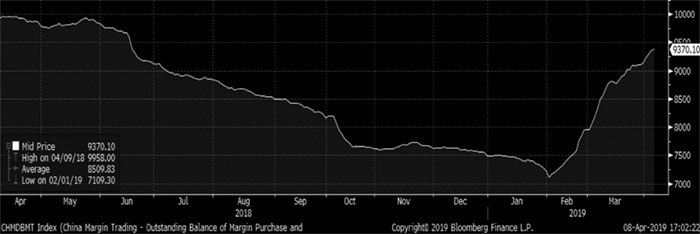
Source: Bloomberg, 4/8/19.
The big spike that happens to coincide very closely to the onset of the Lunar New Year—the onset of the Year of the Pig.
Past performance does not guarantee future results.
| Annual Report | April 30, 2019 | 1 |
| Rondure Funds | Shareholder Letter |
| | April 30, 2019 (Unaudited) |
The next chart below highlights the performance of the Shenzhen Stock Exchange Composite versus the S&P 500 Index, going back to include the massive Chinese stock market bubble of 2015. If the rally there continues, the market may soon outperform the S&P 500 since 2014. What a volatile ride it has been, amplified by expanding and contracting margin debt!
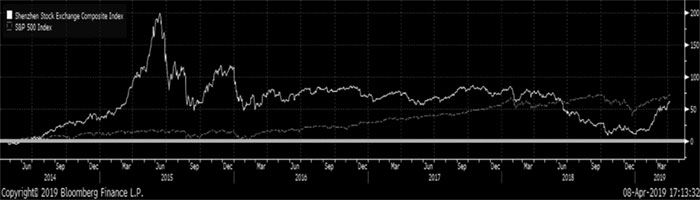
Source: Bloomberg, 4/8/19.
The U.S-China trade war news started in April of last year. The Chinese market is rallying on the prospects that nothing is going to come of it—that it ends with no consequences. So in spite of all of the positive headlines we’ve been reading about the performance of the American economy, it has been a year of incredible outperformance by the Shenzhen Composite.
Fund Performance & Attribution
See full performance on pages 4 and 7.
Rondure Overseas Fund
For the year, the Institutional share class returned -1.76% vs -2.73% for the benchmark. The two large investment regions for the Fund are Western Europe and the Pacific Rim. We outperformed slightly in Europe where we are significantly underweight versus the benchmark, and we underperformed slightly in the Pacific Rim. The Fund also benefited from our holdings in Canada. The Fund remained overweight in the Consumer sector, which was a weaker sector this year, but we outperformed here. Our weakest performance and biggest detractor was the Industrials sector.
Rondure New World Fund
For the year, the Institutional share class returned -3.09% vs -4.68% for the benchmark. The Pacific Rim is by far the largest weight for the benchmark and the Fund. The Pacific Rim performance pulled the benchmark returns down. Fortunately, we outperformed in this region, thus delivering positive contribution to the Fund. The smaller Eastern Europe and Central Asia regions were the largest detractors to the Fund. The Fund remains overweight in the Consumer sector, which was a weaker sector this year, but we outperformed here. The Industrials sector was the Fund’s largest detractor. We actually outperformed in Industrials as well, but our return was negative and we were overweight.
Conclusion
There is an old Wall Street saying that “Bulls make money and bears make money, but pigs get slaughtered.” The saying is a warning against excessive greed in the markets. A bull rages. A bear slashes and gnaws. Pigs are different. Piggish investors try to make money in a very short period of time. They take too much risk—they feast at the trough too long.
I am once again seeing some of the greatest risk taking I have ever seen in my career. We are worried that equity markets have gone too far too fast. Yet we are eyes wide open to the willingness of central banks to keep investors afloat, which may allow risk taking to continue unabated, at least for now. We will probably lag the broader market if that happens. We will participate, though.
Past performance does not guarantee future results.
| 2 | 1.855.775.3337 | www.rondureglobal.com |
| Rondure Funds | Shareholder Letter |
| | April 30, 2019 (Unaudited) |
High-quality dividend stocks are lagging the broader market in this environment. I am excited to just pick away at them, one by one. Volatility is also increasing. I think this is a good time for active investing. We can take our shots at the best stocks and go against the grain of late-cycle risk taking. But we will not be pigs.
Whatever the outcome, we will stick to our process—screening, visiting companies, building models, and valuing the cash flows. If we are right, and the central banks continue to repress interest rates, than we believe our strategy is going to work very well in the long run.
That process has worked for me for years. I don’t plan to stray from it. Thank you for investing with us. Thank you for your trust.
Sincerely,
Laura Geritz, CFA
CEO, Founder, and Portfolio Manager
Rondure Global Advisors LLC
The objective of all Rondure Funds is long-term growth of capital.
RISKS: Mutual fund investing involves risks and loss of principal is possible. Investing in small and micro-cap funds will be more volatile and loss of principal could be greater than investing in large cap or more diversified funds. Investing in foreign securities entails special risks, such as currency fluctuations and political uncertainties, which are described in more detail in the prospectus. Investments in emerging markets are subject to the same risks as other foreign securities and may be subject to greater risks than investments in foreign countries with more established economies and securities markets.
Must be preceded or accompanied by a prospectus.
The views and information discussed in this commentary are as of the date of publication, are subject to change, and may not reflect the writer's current views. The views expressed represent an assessment of market conditions at a specific point in time, are opinions only and should not be relied upon as investment advice regarding a particular investment or markets in general. Such information does not constitute a recommendation to buy or sell specific securities or investment vehicles. It should not be assumed that any investment will be profitable or will equal the performance of the Funds or any securities or any sectors mentioned herein. The subject matter contained herein has been derived from several sources believed to be reliable and accurate at the time of compilation. The Funds do not accept any liability for losses either direct or consequential caused by the use of this information.
Past performance does not guarantee future results.
The S&P 500 Index is widely regarded as the best single gauge of large-cap U.S. equities. There is over USD 7.8 trillion benchmarked to the Index, with index assets comprising approximately USD 2.2 trillion of this total. The Index includes 500 leading companies and captures approximately 80% coverage of available market capitalization. The Index is unmanaged and cannot be invested into directly. Past performance is not indicative of future results.
CFA®is trademark owned by CFA Institute.
The Rondure Funds are distributed by ALPS Distributors Inc. (ADI). ADI is not affiliated with Rondure Global Advisors.
| (1) | Rich, B. “Hedgeye Risk Management | Cartoon of the Day: The Three Little Pigs.” Hedgeye, Hedgeye Risk Management LLC, 17 Feb. 2016, app.hedgeye.com/insights/49195-cartoon-of-the-day-the-three-little-pigs?type=cartoons. |
| (2) | Bird, Mike. “Surging Chinese Stocks Ride a Wave of Debt.” The Wall Street Journal, Dow Jones & Company, 25 Feb. 2019, www.wsj.com/articles/surging-chinese-stocks-ride-a-wave-of-debt-11551094289. |
| Annual Report | April 30, 2019 | 3 |
| Rondure New World Fund | Performance Update |
| | April 30, 2019 (Unaudited) |
Annualized Total Return Performance for the periods ended April 30, 2019
| | | | | Expense Ratio(b) |
| | 6 Months | 1 Year | Since Inception(a) | Gross | Net(c) |
| Rondure New World Fund – Institutional (RNWIX) | 15.37% | -3.09% | 4.55% | 1.53% | 1.10% |
| Rondure New World Fund – Investor (RNWOX) | 15.30% | -3.37% | 4.28% | 1.82% | 1.35% |
| MSCI Emerging Markets TR USD Index(d) | 13.90% | -4.68% | 7.81% | | |
Performance data quoted represents past performance. Past performance does not guarantee future results. Investment return and principal value of an investment will fluctuate so that an investor’s shares, when sold or redeemed, may be worth more or less than the original cost. The Fund imposes a 2.00% redemption fee on shares held for less than 60 days. Current performance data may be higher or lower than actual data quoted. For the most current month-end performance data, please call 1-855-775-3337.
The table does not reflect the deduction of taxes a shareholder would pay on Fund distributions or redemption of Fund shares.
Subject to investment risks, including possible loss of the principal amount invested.
Returns for periods less than 1 year are cumulative.
| (a) | Fund inception date of May 1, 2017. |
| (b) | Ratios as of the Prospectus dated August 31, 2018 and may differ from the ratios presented in the Financial Highlights. |
| (c) | Rondure Global Advisors, LLC (the “Advisor”), has agreed to waive and/or reimburse fees or expenses in order to limit Total Annual Fund Operating Expenses After Fee Waiver/ Expense Reimbursement (excluding acquired fund fees and expenses, brokerage expenses, interest expenses, taxes and extraordinary expenses) to 1.35% and 1.10% of the Fund’s average daily net assets for the Fund’s Investor Class Shares and Institutional Class Shares, respectively. This agreement (the “Expense Agreement”) is in effect through August 31, 2019. The Advisor will be permitted to recover, on a class-by-class basis, expenses it has borne through the Expense Agreement to the extent that a Fund’s expenses in later periods fall below the expense cap in effect at the time of waiver or reimbursement. However, such recapture payments may not cause the Fund’s expense ratio (after recapture) to exceed the lesser of (i) the expense cap in effect at the time of the waiver and (ii) the expense cap in effect at the time of the recapture. Notwithstanding the foregoing, the Fund will not be obligated to pay any such deferred fees and expenses more than three years after the date of the waiver or reimbursement. The Expense Agreement may not be terminated or modified by the Advisor prior to August 31, 2019, except with the approval of the Fund’s Board of Trustees. |
| (d) | The MSCI Emerging Markets TR USD Index is an unmanaged total return index, reported in U.S. Dollars, based on share prices and reinvested dividends of approximately 800 companies from 24 emerging market countries. The Index is not actively managed and does not reflect any deductions for fees, expense, or taxes. An investor may not invest directly in the Index. |
| 4 | 1.855.775.3337 | www.rondureglobal.com |
| Rondure New World Fund | Performance Update |
| | April 30, 2019 (Unaudited) |
Growth of $10,000 for the period ended April 30, 2019
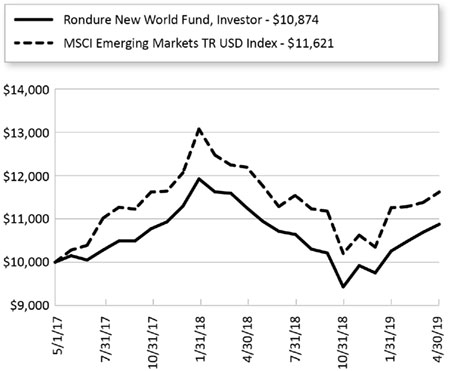
The chart shown above represent a hypothetical investment of $10,000 in the Fund’s Investor Class shares for the period from inception to April 30, 2019. All returns reflect reinvested dividends, but do not reflect the deduction of taxes that an investor would pay on distributions or redemptions.
Investing in the Fund is subject to investment risks, including possible loss of the principal amount invested.
The Fund also offers Institutional Class shares, performance for which is not reflected in the graphs above. The performance of Institutional Class shares may be higher or lower than the performance of the Investor Class shares shown in the graphs above based upon differences in fees paid by shareholders investing in the Investor Class shares and Institutional Class shares.
| Annual Report | April 30, 2019 | 5 |
| Rondure New World Fund | Performance Update |
| | April 30, 2019 (Unaudited) |
| Regional Allocation (as a % of Net Assets)* | |
| Asia ex Japan | 66.1% |
| Africa/Middle East | 9.7% |
| North America | 9.0% |
| Latin America | 6.7% |
| Europe | 4.5% |
| Australia/New Zealand | 1.7% |
| Cash, Cash Equivalents, & Other Net Assets | 2.3% |
| Total | 100.0% |
| Industry Sector Allocation (as a % of Net Assets)* | |
| Consumer | 70.9% |
| Industrials | 6.9% |
| Technology | 6.2% |
| Financials | 5.6% |
| Health Care | 4.3% |
| Energy & Materials | 3.8% |
| Cash, Cash Equivalents, & Other Net Assets | 2.3% |
| Total | 100.0% |
| Top 10 Holdings (as a % of Net Assets)* | |
| Aramex PJSC | 3.2% |
| Vitasoy International Holdings, Ltd. | 2.8% |
| Philippine Seven Corp. | 2.7% |
| Vincom Retail JSC | 2.6% |
| Carlsberg Brewery Malaysia Bhd | 2.5% |
| Yum China Holdings, Inc. | 2.4% |
| Wal-Mart de Mexico SAB de CV | 2.4% |
| Kweichow Moutai Co., Ltd. | 2.4% |
| San Miguel Food and Beverage, Inc. | 2.4% |
| Heineken Malaysia Bhd | 2.3% |
| Total | 25.7% |
| * | Holdings are subject to change, and may not reflect the current or future position of the portfolio. |
| 6 | 1.855.775.3337 | www.rondureglobal.com |
| Rondure Overseas Fund | Performance Update |
| | April 30, 2019 (Unaudited) |
Annualized Total Return Performance for the periods ended April 30, 2019
| | | | | Expense Ratio(b) |
| | 6 Months | 1 Year | Since Inception(a) | Gross | Net(c) |
| Rondure Overseas Fund – Institutional (ROSIX) | 5.12% | -1.76% | 6.71% | 2.09% | 0.85% |
| Rondure Overseas Fund – Investor (ROSOX) | 4.97% | -2.07%(d) | 6.42% | 1.97% | 1.10% |
| MSCI EAFE TR Index(e) | 7.73% | -2.73% | 5.66% | | |
Performance data quoted represents past performance. Past performance does not guarantee future results. Investment return and principal value of an investment will fluctuate so that an investor’s shares, when sold or redeemed, may be worth more or less than the original cost. The Fund imposes a 2.00% redemption fee on shares held for less than 60 days. Current performance data may be higher or lower than actual data quoted. For the most current month-end performance data, please call 1-855-775-3337.
The table does not reflect the deduction of taxes a shareholder would pay on Fund distributions or redemption of Fund shares.
Subject to investment risks, including possible loss of the principal amount invested.
Returns for periods less than 1 year are cumulative.
| (a) | Fund inception date of May 1, 2017. |
| (b) | Ratios as of the Prospectus dated August 31, 2018 and may differ from the ratios presented in the Financial Highlights. |
| (c) | Rondure Global Advisors, LLC (the “Advisor”), has agreed to waive and/or reimburse fees or expenses in order to limit Total Annual Fund Operating Expenses After Fee Waiver/ Expense Reimbursement (excluding acquired fund fees and expenses, brokerage expenses, interest expenses, taxes and extraordinary expenses) to 1.10% and 0.85% of the Fund’s average daily net assets for the Fund’s Investor Class Shares and Institutional Class Shares, respectively. This agreement (the “Expense Agreement”) is in effect through August 31, 2019. The Advisor will be permitted to recover, on a class-by-class basis, expenses it has borne through the Expense Agreement to the extent that a Fund’s expenses in later periods fall below the expense cap in effect at the time of waiver or reimbursement. However, such recapture payments may not cause the Fund’s expense ratio (after recapture) to exceed the lesser of (i) the expense cap in effect at the time of the waiver and (ii) the expense cap in effect at the time of the recapture. Notwithstanding the foregoing, the Fund will not be obligated to pay any such deferred fees and expenses more than three years after the date of the waiver or reimbursement. The Expense Agreement may not be terminated or modified by the Advisor prior to August 31, 2019, except with the approval of the Fund’s Board of Trustees. |
| (d) | Excludes adjustments in accordance with accounting principles generally accepted in the United States of America and as such, the net asset value and total return for shareholder transactions reported to the market may differ from the net asset value for financial reporting purposes. |
| (e) | The MSCI EAFE TR Index is an unmanaged total return index, reported in U.S. dollars, based on share prices and reinvested net dividends of approximately 1,100 companies from 22 developed market countries excluding the US and Canada. The Index is not actively managed and does not reflect any deductions for fees, expense, or taxes. An investor may not invest directly in the Index. |
| Annual Report | April 30, 2019 | 7 |
| Rondure Overseas Fund | Performance Update |
| | April 30, 2019 (Unaudited) |
Growth of $10,000 for the period ended April 30, 2019
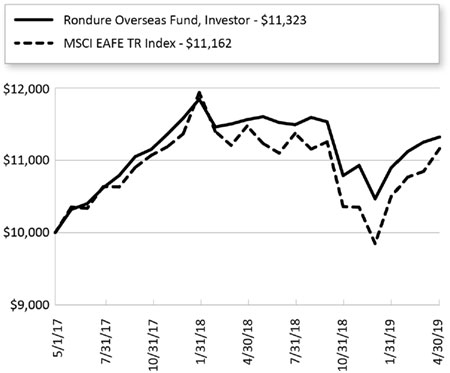
The chart shown above represent a hypothetical investment of $10,000 in the Fund’s Investor Class shares for the period from inception to April 30, 2019. All returns reflect reinvested dividends, but do not reflect the deduction of taxes that an investor would pay on distributions or redemptions.
Investing in the Fund is subject to investment risks, including possible loss of the principal amount invested.
The Fund also offers Institutional Class shares, performance for which is not reflected in the graphs above. The performance of Institutional Class shares may be higher or lower than the performance of the Investor Class shares shown in the graphs above based upon differences in fees paid by shareholders investing in the Investor Class shares and Institutional Class shares.
| 8 | 1.855.775.3337 | www.rondureglobal.com |
| Rondure Overseas Fund | Performance Update |
April 30, 2019 (Unaudited)
| Regional Allocation (as a % of Net Assets)* | |
| Europe | 47.8% |
| Japan | 29.9% |
| Australia/New Zealand | 11.6% |
| North America | 6.9% |
| Asia ex Japan | 3.8% |
| Cash, Cash Equivalents, & Other Net Assets | 0.0% |
| Total | 100.0% |
| Industry Sector Allocation (as a % of Net Assets)* | |
| Consumer | 67.8% |
| Industrials | 16.6% |
| Technology | 7.3% |
| Financials | 3.0% |
| Energy & Materials | 2.8% |
| Health Care | 2.5% |
| Cash, Cash Equivalents, & Other Net Assets | 0.0% |
| Total | 100.0% |
| Top 10 Holdings (as a % of Net Assets)* | |
| Alimentation Couche-Tard, Inc. | 2.6% |
| Nestle SA | 2.4% |
| Unilever NV | 2.2% |
| Suntory Beverage & Food, Ltd. | 2.2% |
| Pernod Ricard SA | 2.2% |
| Amadeus IT Group SA | 2.2% |
| Coca-Cola Amatil, Ltd. | 2.1% |
| Yamato Holdings Co., Ltd. | 2.1% |
| Air New Zealand, Ltd. | 2.0% |
| Lululemon Athletica, Inc. | 2.0% |
| Total | 22.0% |
| * | Holdings are subject to change, and may not reflect the current or future position of the portfolio. |
| Annual Report | April 30, 2019 | 9 |
| Rondure Funds | Disclosure of Fund Expenses |
April 30, 2019 (Unaudited)
As a shareholder of a Fund, you incur two types of costs: (1) transaction costs, including sales charges (loads) on purchase payments, reinvested dividends, or other distributions; redemption fees; and exchange fees; and (2) ongoing costs, including management fees; distribution and/or service (12b-1) fees; and other Fund expenses. This example is intended to help you understand your ongoing costs (in dollars) of investing in the Fund and to compare these costs with the ongoing costs of investing in other mutual funds.
This example is based on an investment of $1,000 invested at the beginning of the period and held for the entire six-month period of November 1, 2018 through April 30, 2019.
Actual Expenses The first line of the table provides information about actual account values and actual expenses. You may use the information in this line, together with the amount you invested, to estimate the expenses that you paid over the period. Simply divide your account value by $1,000 (for example, an $8,600 account value divided by $1,000 = 8.6), then multiply the result by the number in the first line under the heading “Expenses Paid During Period” to estimate the expenses you paid on your account during this period.
Hypothetical Example for Comparison Purposes The second line of the table provides information about hypothetical account values and hypothetical expenses based on the Fund’s actual expense ratio and an assumed rate of return of 5% per year before expenses, which is not the Fund’s actual return. The hypothetical account values and expenses may not be used to estimate the actual ending account balance or expenses you paid for the period. You may use this information to compare the ongoing costs of investing in the Fund and other mutual funds. To do so, compare this 5% hypothetical example with the 5% hypothetical examples that appear in the shareholder reports of the other funds. Please note that the expenses shown in the table are meant to highlight your ongoing costs only and do not reflect any transactional costs, such as redemption fees or exchange fees. Therefore, the second line of the table is useful in comparing ongoing costs only and will not help you determine the relative total costs of owning different funds. In addition, if these transactional costs were included, your costs would have been higher.
| | Beginning Account Value November 1, 2018 | Ending Account Value April 30, 2019 | Expense Ratio(a) | Expenses Paid During Period November 1, 2018 - April 30, 2019(b) |
| Rondure New World Fund | | | | |
| Institutional Class | | | | |
| Actual | $1,000.00 | $1,153.70 | 1.10% | $5.87 |
| Hypothetical (5% return before expenses) | $1,000.00 | $1,019.34 | 1.10% | $5.51 |
| Investor Class | | | | |
| Actual | $1,000.00 | $1,151.80 | 1.35% | $7.20 |
| Hypothetical (5% return before expenses) | $1,000.00 | $1,018.10 | 1.35% | $6.76 |
| Rondure Overseas Fund | | | | |
| Institutional Class | | | | |
| Actual | $1,000.00 | $1,051.20 | 0.85% | $4.32 |
| Hypothetical (5% return before expenses) | $1,000.00 | $1,020.58 | 0.85% | $4.26 |
| Investor Class | | | | |
| Actual | $1,000.00 | $1,049.60 | 1.10% | $5.59 |
| Hypothetical (5% return before expenses) | $1,000.00 | $1,019.34 | 1.10% | $5.51 |
| (a) | The Fund’s expense ratios have been annualized based on the Fund’s most recent fiscal half-year expenses. |
| (b) | Expenses are equal to the Fund’s annualized expense ratio multiplied by the average account value over the period, multiplied by the number of days in the most recent fiscal half-year 181/365 (to reflect the half-year period). |
| 10 | 1.855.775.3337 | www.rondureglobal.com |
| Rondure New World Fund | Portfolio of Investments |
April 30, 2019
| | | Shares | | | Value (Note 2) | |
| COMMON STOCKS (97.61%) | | | | | | | | |
| Australia (1.70%) | | | | | | | | |
| Coca-Cola Amatil, Ltd. | | | 360,500 | | | $ | 2,236,384 | |
| | | | | | | | | |
| Bangladesh (0.92%) | | | | | | | | |
| Square Pharmaceuticals, Ltd. | | | 391,432 | | | | 1,204,941 | |
| | | | | | | | | |
| Brazil (4.73%) | | | | | | | | |
| Ambev SA | | | 244,200 | | | | 1,150,283 | |
| B3 SA - Brasil Bolsa Balcao | | | 229,600 | | | | 2,023,075 | |
| Hypera SA | | | 171,400 | | | | 1,234,433 | |
| M Dias Branco SA | | | 114,700 | | | | 1,220,393 | |
| Raia Drogasil SA | | | 33,300 | | | | 582,332 | |
| | | | | | | | 6,210,516 | |
| | | | | | | | | |
| Canada (1.08%) | | | | | | | | |
| Lululemon Athletica, Inc.(a) | | | 8,025 | | | | 1,415,209 | |
| | | | | | | | | |
| China (14.84%) | | | | | | | | |
| ANTA Sports Products, Ltd. | | | 223,000 | | | | 1,571,984 | |
| Baidu, Inc., Sponsored ADR(a) | | | 7,000 | | | | 1,163,610 | |
| China Resources Beer Holdings Co., Ltd. | | | 560,000 | | | | 2,559,148 | |
| Haier Electronics Group Co., Ltd. | | | 233,000 | | | | 666,792 | |
| Hengan International Group Co., Ltd. | | | 79,000 | | | | 696,366 | |
| Kweichow Moutai Co., Ltd., Class A | | | 21,500 | | | | 3,108,449 | |
| Li Ning Co., Ltd.(a) | | | 1,424,000 | | | | 2,588,497 | |
| TravelSky Technology, Ltd., Class H | | | 409,000 | | | | 1,050,549 | |
| Tsingtao Brewery Co., Ltd., Class H | | | 381,000 | | | | 2,428,360 | |
| Want Want China Holdings, Ltd. | | | 590,000 | | | | 467,800 | |
| Yum China Holdings, Inc. | | | 67,175 | | | | 3,193,500 | |
| | | | | | | | 19,495,055 | |
| | | | | | | | | |
| Greece (1.69%) | | | | | | | | |
| JUMBO SA | | | 122,456 | | | | 2,225,017 | |
| | | | | | | | | |
| Hong Kong (4.70%) | | | | | | | | |
| Cafe de Coral Holdings, Ltd. | | | 214,000 | | | | 527,035 | |
| | | Shares | | | Value (Note 2) | |
| Hong Kong (continued) | | | | | | | | |
| Hong Kong Exchanges & Clearing, Ltd. | | | 57,000 | | | $ | 1,976,341 | |
| Vitasoy International Holdings, Ltd. | | | 729,000 | | | | 3,670,648 | |
| | | | | | | | 6,174,024 | |
| | | | | | | | | |
| India (7.96%) | | | | | | | | |
| Asian Paints, Ltd. | | | 31,244 | | | | 657,257 | |
| Britannia Industries, Ltd. | | | 14,622 | | | | 608,825 | |
| Castrol India, Ltd. | | | 200,000 | | | | 438,797 | |
| Colgate-Palmolive India, Ltd. | | | 39,204 | | | | 680,974 | |
| Dabur India, Ltd. | | | 159,000 | | | | 910,057 | |
| Eicher Motors, Ltd. | | | 1,775 | | | | 519,796 | |
| Godrej Consumer Products, Ltd. | | | 7,953 | | | | 74,529 | |
| Hindustan Unilever, Ltd. | | | 25,135 | | | | 635,189 | |
| Jubilant Foodworks, Ltd. | | | 93,500 | | | | 1,785,881 | |
| Marico, Ltd. | | | 14,900 | | | | 76,992 | |
| Maruti Suzuki India, Ltd. | | | 6,070 | | | | 581,781 | |
| Nestle India, Ltd. | | | 3,718 | | | | 582,944 | |
| Pidilite Industries, Ltd. | | | 6,385 | | | | 113,331 | |
| Radico Khaitan, Ltd. | | | 440,000 | | | | 2,238,470 | |
| United Breweries, Ltd. | | | 27,500 | | | | 561,021 | |
| | | | | | | | 10,465,844 | |
| | | | | | | | | |
| Indonesia (2.44%) | | | | | | | | |
| Indofood CBP Sukses Makmur Tbk PT | | | 2,571,000 | | | | 1,754,595 | |
| Kalbe Farma Tbk PT | | | 1,014,000 | | | | 109,939 | |
| Multi Bintang Indonesia Tbk PT | | | 515,000 | | | | 726,421 | |
| Unilever Indonesia Tbk PT | | | 193,000 | | | | 616,245 | |
| | | | | | | | 3,207,200 | |
| | | | | | | | | |
| Kenya (3.01%) | | | | | | | | |
| East African Breweries, Ltd. | | | 487,200 | | | | 1,068,083 | |
| Safaricom PLC | | | 10,368,600 | | | | 2,885,577 | |
| | | | | | | | 3,953,660 | |
| | | | | | | | | |
| Malaysia (5.86%) | | | | | | | | |
| Carlsberg Brewery Malaysia Bhd | | | 529,000 | | | | 3,231,960 | |
| Hartalega Holdings Bhd | | | 776,000 | | | | 944,076 | |
| Heineken Malaysia Bhd | | | 508,000 | | | | 3,010,279 | |
See Notes to Financial Statements.
| Annual Report | April 30, 2019 | 11 |
| Rondure New World Fund | Portfolio of Investments |
April 30, 2019
| | | Shares | | | Value (Note 2) | |
| Malaysia (continued) | | | | | | | | |
| Top Glove Corp. Bhd | | | 432,000 | | | $ | 508,850 | |
| | | | | | | | 7,695,165 | |
| | | | | | | | | |
| Mexico (5.50%) | | | | | | | | |
| Alsea SAB de CV | | | 16,300 | | | | 36,404 | |
| Arca Continental SAB de CV | | | 16,200 | | | | 92,127 | |
| Becle SAB de CV | | | 1,769,600 | | | | 2,731,257 | |
| Gruma SAB de CV, Class B | | | 118,200 | | | | 1,181,517 | |
| Wal-Mart de Mexico SAB de CV | | | 1,082,400 | | | | 3,180,213 | |
| | | | | | | | 7,221,518 | |
| | | | | | | | | |
| Pakistan (0.19%) | | | | | | | | |
| Nestle Pakistan, Ltd. | | | 4,578 | | | | 251,093 | |
| | | | | | | | | |
| Peru (1.54%) | | | | | | | | |
| Alicorp SAA | | | 380,855 | | | | 1,232,466 | |
| InRetail Peru Corp.(a)(b)(c) | | | 20,196 | | | | 787,644 | |
| | | | | | | | 2,020,110 | |
| | | | | | | | | |
| Philippines (8.10%) | | | | | | | | |
| International Container Terminal Services, Inc. | | | 601,000 | | | | 1,458,892 | |
| Jollibee Foods Corp. | | | 247,000 | | | | 1,443,727 | |
| Philippine Seven Corp. | | | 1,631,447 | | | | 3,600,219 | |
| Puregold Price Club, Inc. | | | 1,288,000 | | | | 1,035,590 | |
| San Miguel Food and Beverage, Inc. | | | 1,393,000 | | | | 3,100,753 | |
| | | | | | | | 10,639,181 | |
| | | | | | | | | |
| Poland (1.82%) | | | | | | | | |
| AmRest Holdings SE(a) | | | 94,000 | | | | 1,014,667 | |
| Dino Polska SA(a)(b)(c) | | | 41,600 | | | | 1,382,512 | |
| | | | | | | | 2,397,179 | |
| | | | | | | | | |
| Russia (1.03%) | | | | | | | | |
| Alrosa PJSC | | | 410,000 | | | | 597,534 | |
| LUKOIL PJSC, Sponsored ADR | | | 8,900 | | | | 754,542 | |
| | | | | | | | 1,352,076 | |
| | | | | | | | | |
| South Africa (2.75%) | | | | | | | | |
| Clicks Group, Ltd. | | | 115,400 | | | | 1,578,411 | |
| Distell Group Holdings, Ltd. | | | 40,100 | | | | 385,442 | |
| | | Shares | | | Value
(Note 2) | |
| South Africa (continued) | | | | | | | | |
| Shoprite Holdings, Ltd. | | | 137,200 | | | $ | 1,652,922 | |
| | | | | | | | 3,616,775 | |
| | | | | | | | | |
| South Korea (2.20%) | | | | | | | | |
| LG Household & Health Care, Ltd. | | | 650 | | | | 791,251 | |
| Medy-Tox, Inc. | | | 944 | | | | 451,817 | |
| Ottogi Corp. | | | 800 | | | | 497,197 | |
| S-1 Corp. | | | 13,800 | | | | 1,157,728 | |
| | | | | | | | 2,897,993 | |
| | | | | | | | | |
| Sri Lanka (1.14%) | | | | | | | | |
| Lion Brewery Ceylon PLC | | | 472,256 | | | | 1,492,795 | |
| | | | | | | | | |
| Taiwan (6.45%) | | | | | | | | |
| President Chain Store Corp. | | | 272,000 | | | | 2,535,064 | |
| Taiwan FamilyMart Co., Ltd. | | | 250,000 | | | | 1,787,968 | |
| Taiwan Semiconductor Manufacturing Co., Ltd. | | | 358,000 | | | | 3,000,615 | |
| Uni-President EnterprisesCorp. | | | 487,000 | | | | 1,156,784 | |
| | | | | | | | 8,480,431 | |
| | | | | | | | | |
| Tanzania (0.11%) | | | | | | | | |
| Tanzania Breweries, Ltd. | | | 34,234 | | | | 151,641 | |
| | | | | | | | | |
| Thailand (4.04%) | | | | | | | | |
| Airports of Thailand PCL | | | 263,000 | | | | 564,307 | |
| Bangkok Dusit Medical Services PCL | | | 750,000 | | | | 599,060 | |
| Bumrungrad Hospital PCL | | | 103,000 | | | | 571,057 | |
| CP ALL PCL | | | 129,000 | | | | 313,156 | |
| MK Restaurants Group PCL | | | 352,000 | | | | 802,130 | |
| TOA Paint Thailand PCL | | | 2,494,000 | | | | 2,460,799 | |
| | | | | | | | 5,310,509 | |
| | | | | | | | | |
| Turkey (1.00%) | | | | | | | | |
| BIM Birlesik Magazalar AS | | | 94,000 | | | | 1,308,334 | |
| | | | | | | | | |
| United Arab Emirates (3.61%) | | | | | | | | |
| Aramex PJSC | | | 3,253,000 | | | | 4,206,675 | |
| DP World PLC | | | 26,720 | | | | 534,400 | |
| | | | | | | | 4,741,075 | |
See Notes to Financial Statements.
| 12 | 1.855.775.3337 | www.rondureglobal.com |
| Rondure New World Fund | Portfolio of Investments |
April 30, 2019
| | | Shares | | | Value (Note 2) | |
| United States (2.38%) | | | | | | | | |
| Kansas City Southern | | | 9,125 | | | $ | 1,123,652 | |
| Starbucks Corp. | | | 25,800 | | | | 2,004,144 | |
| | | | | | | | 3,127,796 | |
| | | | | | | | | |
| Uruguay (0.41%) | | | | | | | | |
| Arcos Dorados Holdings, Inc., Class A | | | 77,600 | | | | 541,648 | |
| | | | | | | | | |
| Vietnam (6.41%) | | | | | | | | |
| Saigon Beer Alcohol Beverage Corp. | | | 249,320 | | | | 2,560,917 | |
| Vietnam Dairy Products JSC | | | 447,192 | | | | 2,492,561 | |
| Vincom Retail JSC | | | 2,181,185 | | | | 3,371,880 | |
| | | | | | | | 8,425,358 | |
| | | | | | | | | |
| TOTAL COMMON STOCKS | | | | | |
| (Cost $117,584,549) | | | | | | | 128,258,527 | |
| | | | | | | | | |
| TOTAL INVESTMENTS (97.61%) | | | |
| (Cost $117,584,549) | | | | | | $ | 128,258,527 | |
| | | | | | | | | |
| Other Assets In Excess Of Liabilities (2.39 %) | | | 3,136,214 | |
| | | | | | | | | |
| NET ASSETS (100.00%) | | | | | | $ | 131,394,741 | |
| (a) | Non-Income Producing Security. |
| (b) | Security exempt from registration under Rule 144A of the Securities Act of 1933. These securities may be resold in the ordinary course of business in transactions exempt from registration, normally to qualified institutional buyers. As of April 30, 2019, these securities had a total aggregate market value of $2,170,156 representing 1.65% of net assets. |
| (c) | Security was purchased pursuant to Regulation S under the Securities Act of 1933, which exempts securities offered and sold outside of the United States from registration. Such security cannot be sold in the United States without either an effective registration statement filed pursuant to the Securities Act of 1933, or pursuant to an exemption from registration. The security has been deemed liquid under guidelines approved by the Fund’s Board of Trustees. As of April 30, 2019, the aggregate market value of those securities was $2,170,156, representing 1.65% of net assets. |
See Notes to Financial Statements.
| Annual Report | April 30, 2019 | 13 |
| Rondure Overseas Fund | Portfolio of Investments |
April 30, 2019
| | | Shares | | | Value (Note 2) | |
| COMMON STOCKS (99.71%) | | | | | | | | |
| Australia (6.99%) | | | | | | | | |
| Coca-Cola Amatil, Ltd. | | | 77,100 | | | $ | 478,295 | |
| Domino’s Pizza Enterprises, Ltd. | | | 3,059 | | | | 92,727 | |
| REA Group, Ltd. | | | 5,946 | | | | 334,911 | |
| SEEK, Ltd. | | | 10,000 | | | | 128,371 | |
| Sydney Airport | | | 50,600 | | | | 271,809 | |
| Treasury Wine Estates, Ltd. | | | 23,500 | | | | 284,941 | |
| | | | | | | | 1,591,054 | |
| | | | | | | | | |
| Austria (1.05%) | | | | | | | | |
| Mayr Melnhof Karton AG | | | 1,850 | | | | 239,450 | |
| | | | | | | | | |
| Belgium (0.25%) | | | | | | | | |
| Lotus Bakeries NV | | | 22 | | | | 57,740 | |
| | | | | | | | | |
| Britain (12.61%) | | | | | | | | |
| Abcam PLC | | | 12,000 | | | | 203,894 | |
| Compass Group PLC | | | 4,696 | | | | 106,734 | |
| Diageo PLC | | | 6,500 | | | | 274,072 | |
| Diploma PLC | | | 3,200 | | | | 66,765 | |
| Domino’s Pizza Group PLC | | | 36,100 | | | | 125,924 | |
| Intertek Group PLC | | | 2,400 | | | | 167,434 | |
| J D Wetherspoon PLC | | | 13,488 | | | | 240,609 | |
| Rightmove PLC | | | 19,800 | | | | 139,579 | |
| St. James’s Place PLC | | | 15,900 | | | | 232,527 | |
| Unilever NV | | | 8,400 | | | | 508,381 | |
| Victrex PLC | | | 3,500 | | | | 110,996 | |
| WH Smith PLC | | | 10,287 | | | | 274,724 | |
| Whitbread PLC | | | 7,200 | | | | 418,741 | |
| | | | | | | | 2,870,380 | |
| | | | | | | | | |
| Canada (5.38%) | | | | | | | | |
| Alimentation Couche-Tard, Inc., Class B | | | 10,000 | | | | 589,610 | |
| Dollarama, Inc. | | | 2,100 | | | | 63,077 | |
| Lululemon Athletica, Inc.(a) | | | 2,575 | | | | 454,101 | |
| Ritchie Bros Auctioneers, Inc. | | | 3,400 | | | | 118,316 | |
| | | | | | | | 1,225,104 | |
| | | | | | | | | |
| Denmark (1.35%) | | | | | | | | |
| Novo Nordisk A/S, Class B | | | 1,301 | | | | 63,620 | |
| Novozymes A/S, Class B | | | 1,488 | | | | 69,345 | |
| | | Shares | | | Value (Note 2) | |
| Denmark (continued) | | | | | | | | |
| Royal Unibrew A/S | | | 2,440 | | | $ | 174,854 | |
| | | | | | | | 307,819 | |
| | | | | | | | | |
| Finland (2.31%) | | | | | | | | |
| Kone OYJ, Class B | | | 2,300 | | | | 126,043 | |
| Olvi OYJ, Class A | | | 10,805 | | | | 400,530 | |
| | | | | | | | 526,573 | |
| | | | | | | | | |
| France (9.49%) | | | | | | | | |
| Danone SA | | | 4,800 | | | | 388,056 | |
| EssilorLuxottica SA | | | 900 | | | | 109,524 | |
| Laurent-Perrier | | | 550 | | | | 58,234 | |
| L’Oreal SA | | | 1,300 | | | | 357,376 | |
| LVMH Moet Hennessy Louis Vuitton SE | | | 700 | | | | 274,046 | |
| Pernod Ricard SA | | | 2,900 | | | | 505,298 | |
| Remy Cointreau SA | | | 3,000 | | | | 399,738 | |
| Sodexo SA | | | 600 | | | | 68,810 | |
| | | | | | | | 2,161,082 | |
| | | | | | | | | |
| Germany (6.76%) | | | | | | | | |
| adidas AG | | | 1,130 | | | | 290,363 | |
| CTS Eventim AG & Co., KGaA | | | 3,745 | | | | 191,706 | |
| Deutsche Post AG | | | 7,505 | | | | 260,104 | |
| Puma SE | | | 690 | | | | 426,808 | |
| SAP SE | | | 2,200 | | | | 282,729 | |
| XING SE | | | 235 | | | | 87,376 | |
| | | | | | | | 1,539,086 | |
| | | | | | | | | |
| Hong Kong (1.90%) | | | | | | | | |
| Hong Kong Exchanges & Clearing, Ltd. | | | 2,000 | | | | 69,345 | |
| Vitasoy International Holdings, Ltd. | | | 72,000 | | | | 362,533 | |
| | | | | | | | 431,878 | |
| | | | | | | | | |
| Italy (3.66%) | | | | | | | | |
| Brembo SpA | | | 5,959 | | | | 78,198 | |
| Davide Campari-Milano SpA | | | 12,759 | | | | 128,580 | |
| De’ Longhi SpA | | | 11,781 | | | | 301,798 | |
| DiaSorin SpA | | | 383 | | | | 37,416 | |
| Ferrari NV | | | 2,125 | | | | 287,796 | |
| | | | | | | | 833,788 | |
See Notes to Financial Statements.
| 14 | 1.855.775.3337 | www.rondureglobal.com |
| Rondure Overseas Fund | Portfolio of Investments |
April 30, 2019
| | | Shares | | | Value (Note 2) | |
| Japan (29.90%) | | | | | | |
| ABC-Mart, Inc. | | | 3,000 | | | $ | 186,364 | |
| Calbee, Inc. | | | 6,800 | | | | 186,795 | |
| Coca-Cola Bottlers Japan Holdings, Inc. | | | 4,800 | | | | 117,937 | |
| Cosmos Pharmaceutical Corp. | | | 1,500 | | | | 238,880 | |
| Create SD Holdings Co., Ltd. | | | 16,500 | | | | 379,784 | |
| Ezaki Glico Co., Ltd. | | | 5,400 | | | | 284,070 | |
| Kakaku.com, Inc. | | | 6,000 | | | | 122,806 | |
| Kewpie Corp. | | | 9,900 | | | | 228,048 | |
| Kirin Holdings Co., Ltd. | | | 12,500 | | | | 282,721 | |
| Kobayashi PharmaceuticalCo., Ltd. | | | 1,800 | | | | 143,166 | |
| Kusuri no Aoki Holdings Co., Ltd. | | | 2,500 | | | | 175,502 | |
| Matsumotokiyoshi Holdings Co., Ltd. | | | 7,500 | | | | 246,084 | |
| McDonald’s Holdings Co. Japan, Ltd. | | | 1,800 | | | | 83,217 | |
| MEIJI Holdings Co., Ltd. | | | 800 | | | | 62,839 | |
| MISUMI Group, Inc. | | | 6,400 | | | | 165,350 | |
| MonotaRO Co., Ltd. | | | 10,500 | | | | 241,492 | |
| Morinaga & Co., Ltd. | | | 3,900 | | | | 161,924 | |
| Oriental Land Co., Ltd. | | | 2,500 | | | | 275,371 | |
| Pigeon Corp. | | | 5,200 | | | | 220,100 | |
| Secom Co., Ltd. | | | 4,500 | | | | 377,225 | |
| Seria Co., Ltd. | | | 6,500 | | | | 192,558 | |
| Seven & i Holdings Co., Ltd. | | | 11,200 | | | | 387,996 | |
| Shimano, Inc. | | | 700 | | | | 102,365 | |
| Ship Healthcare Holdings, Inc. | | | 6,400 | | | | 262,274 | |
| SK Kaken Co., Ltd. | | | 174 | | | | 71,970 | |
| Sundrug Co., Ltd. | | | 3,700 | | | | 98,848 | |
| Suntory Beverage & Food, Ltd. | | | 11,500 | | | | 505,858 | |
| Tsuruha Holdings, Inc. | | | 1,300 | | | | 110,517 | |
| Unicharm Corp. | | | 13,000 | | | | 425,845 | |
| Yamato Holdings Co., Ltd. | | | 21,700 | | | | 469,960 | |
| | | | | | | | 6,807,866 | |
| | | | | | | | | |
| Netherlands (1.66%) | | | | | | | | |
| Euronext NV(b)(c) | | | 5,450 | | | | 378,683 | |
| | | | | | | | | |
| New Zealand (4.66%) | | | | | | | | |
| Air New Zealand, Ltd. | | | 256,002 | | | | 459,092 | |
| | | Shares | | | Value (Note 2) | |
| New Zealand (continued) | | | | | | | | |
| Auckland International Airport, Ltd. | | | 51,800 | | | $ | 275,740 | |
| Mainfreight, Ltd. | | | 13,931 | | | | 325,658 | |
| | | | | | | | 1,060,490 | |
| | | | | | | | | |
| South Korea (0.79%) | | | | | | | | |
| S-1 Corp. | | | 2,150 | | | | 180,371 | |
| | | | | | | | | |
| Spain (2.19%) | | | | | | | | |
| Amadeus IT Group SA | | | 6,256 | | | | 497,627 | |
| | | | | | | | | |
| Sweden (2.63%) | | | | | | | | |
| Axfood AB | | | 19,844 | | | | 364,090 | |
| Hexpol AB | | | 12,500 | | | | 97,398 | |
| Loomis AB, Class B | | | 3,682 | | | | 136,081 | |
| | | | | | | | 597,569 | |
| | | | | | | | | |
| Switzerland (3.50%) | | | | | | | | |
| Cie Financiere Richemont SA | | | 3,400 | | | | 248,589 | |
| Nestle SA | | | 5,700 | | | | 548,491 | |
| | | | | | | | 797,080 | |
| | | | | | | | | |
| Taiwan (1.15%) | | | | | | | | |
| President Chain Store Corp. | | | 28,000 | | | | 260,962 | |
| | | | | | | | | |
| United States (1.48%) | | | | | | | | |
| Starbucks Corp. | | | 4,325 | | | | 335,966 | |
| | | | | | | | | |
| TOTAL COMMON STOCKS | | | | | | | | |
| (Cost $21,450,172) | | | | | | | 22,700,568 | |
| | | | | | | | | |
| PREFERRED STOCKS (0.26%) | | | | | | | | |
| Germany (0.26%) | | | | | | | | |
| FUCHS PETROLUB SE | | | 1,351 | | | | 58,762 | |
| | | | | | | | | |
| TOTAL PREFERRED STOCKS | | | | | |
| (Cost $73,715) | | | | | | | 58,762 | |
| | | | | | | | | |
| TOTAL INVESTMENTS (99.97%) | | | | | |
| (Cost $21,523,887) | | | | | | $ | 22,759,330 | |
| | | | | | | | | |
| Other Assets In Excess Of Liabilities (0.03 %) | | | 7,774 | |
| | | | | | | | | |
| NET ASSETS (100.00%) | | | | | | $ | 22,767,104 | |
See Notes to Financial Statements.
| Annual Report | April 30, 2019 | 15 |
| Rondure Overseas Fund | Portfolio of Investments |
April 30, 2019
| (a) | Non-Income Producing Security. |
| (b) | Security exempt from registration under Rule 144A of the Securities Act of 1933. These securities may be resold in the ordinary course of business in transactions exempt from registration, normally to qualified institutional buyers. As of April 30, 2019, these securities had a total aggregate market value of $378,683 representing 1.66% of net assets. |
| (c) | Security was purchased pursuant to Regulation S under the Securities Act of 1933, which exempts securities offered and sold outside of the United States from registration. Such security cannot be sold in the United States without either an effective registration statement filed pursuant to the Securities Act of 1933, or pursuant to an exemption from registration. The security has been deemed liquid under guidelines approved by the Fund’s Board of Trustees. As of April 30, 2019, the aggregate market value of those securities was $378,683, representing 1.66% of net assets. |
See Notes to Financial Statements.
| 16 | 1.855.775.3337 | www.rondureglobal.com |
| Rondure Funds | Statements of Assets and Liabilities |
April 30, 2019
| | | Rondure New World Fund | | | Rondure Overseas Fund | |
| ASSETS | | | | | | |
| Investments, at value (Cost - see below) | | $ | 128,258,527 | | | $ | 22,759,330 | |
| Foreign cash, at value (Cost $286,725 and $11,757, respectively) | | | 283,798 | | | | 11,765 | |
| Cash | | | 2,998,611 | | | | – | |
| Dividends and interest receivable | | | 257,244 | | | | 55,422 | |
| Receivable for investments sold | | | – | | | | 312,127 | |
| Receivable for fund shares subscribed | | | 33,248 | | | | – | |
| Receivable due from advisor | | | 50,925 | | | | 20,083 | |
| Prepaid and other assets | | | 22,109 | | | | 19,360 | |
| Total assets | | | 131,904,462 | | | | 23,178,087 | |
| | | | | | | | | |
| LIABILITIES | | | | | | | | |
| Payable to custodian | | | – | | | | 334,880 | |
| Payable for investments purchased | | | 249,246 | | | | – | |
| Foreign capital gains tax | | | 36,450 | | | | – | |
| Payable for fund shares redeemed | | | 4,639 | | | | 8,921 | |
| Advisory fees payable | | | 90,451 | | | | 13,260 | |
| Administration fees payable | | | 26,807 | | | | 16,112 | |
| Custodian fees payable | | | 30,862 | | | | 3,103 | |
| Payable for professional fees | | | 27,206 | | | | 23,143 | |
| Payable for trustee fees and expenses | | | 2,305 | | | | 422 | |
| Payable for chief compliance officer fee | | | 2,015 | | | | 369 | |
| Payable for principal financial officer fees | | | 704 | | | | 129 | |
| Distribution and service fees payable - Investor Class | | | 4,217 | | | | 832 | |
| Payable for transfer agency fees | | | 26,545 | | | | 8,167 | |
| Accrued expenses and other liabilities | | | 8,274 | | | | 1,645 | |
| Total liabilities | | | 509,721 | | | | 410,983 | |
| NET ASSETS | | $ | 131,394,741 | | | $ | 22,767,104 | |
| | | | | | | | | |
| NET ASSETS CONSISTS OF | | | | | | | | |
| Paid-in capital (Note 5) | | $ | 128,729,447 | | | $ | 22,214,055 | |
| Total distributable earnings | | | 2,665,294 | | | | 553,049 | |
| NET ASSETS | | $ | 131,394,741 | | | $ | 22,767,104 | |
| | | | | | | | | |
| INVESTMENTS, AT COST | | $ | 117,584,549 | | | $ | 21,523,887 | |
| | | | | | | | | |
| PRICING OF SHARES | | | | | | | | |
| Institutional Class | | | | | | | | |
| Net Assets | | $ | 110,799,810 | | | $ | 18,844,630 | |
| Net Asset Value, offering and redemption price per share | | $ | 10.80 | | | $ | 11.11 | |
| Shares of beneficial interest outstanding | | | 10,261,158 | | | | 1,696,722 | |
| Investor Class | | | | | | | | |
| Net Assets | | $ | 20,594,931 | | | $ | 3,922,474 | |
| Net Asset Value, offering and redemption price per share | | $ | 10.78 | | | $ | 11.12 | |
| Shares of beneficial interest outstanding | | | 1,910,359 | | | | 352,898 | |
See Notes to Financial Statements.
| Annual Report | April 30, 2019 | 17 |
| Rondure Funds | Statements of Operations |
For the Year Ended April 30, 2019
| | | Rondure New World Fund | | | Rondure Overseas Fund | |
| INVESTMENT INCOME | | | | | | | | |
| Dividends | | $ | 2,530,370 | | | $ | 435,871 | |
| Foreign taxes withheld | | | (221,539 | ) | | | (48,065 | ) |
| Other Income | | | 86,595 | | | | 37,951 | |
| Total investment income | | | 2,395,426 | | | | 425,757 | |
| EXPENSES | | | | | | | | |
| Investment advisor fees (Note 6) | | | 1,029,537 | | | | 164,816 | |
| Administrative fees | | | 234,650 | | | | 76,337 | |
| Distribution and service fees - Investor Class | | | 54,668 | | | | 11,410 | |
| Transfer agent fees | | | 176,079 | | | | 63,528 | |
| Professional fees | | | 45,027 | | | | 28,154 | |
| Printing fees | | | 18,874 | | | | 2,995 | |
| Registration fees | | | 43,829 | | | | 31,635 | |
| Custodian fees | | | 178,008 | | | | 26,652 | |
| Trustee fees and expenses | | | 4,072 | | | | 814 | |
| Chief compliance officer fees | | | 26,029 | | | | 5,082 | |
| Principal financial officer fees | | | 8,366 | | | | 1,634 | |
| Offering costs | | | 226 | | | | 181 | |
| Other expenses | | | 16,145 | | | | 6,492 | |
| Total expenses | | | 1,835,510 | | | | 419,730 | |
| Less fees waived/reimbursed by investment advisor (Note 6) | | | (448,341 | ) | | | (208,118 | ) |
| Total net expenses | | | 1,387,169 | | | | 211,612 | |
| NET INVESTMENT INCOME | | | 1,008,257 | | | | 214,145 | |
| | | | | | | | | |
| REALIZED AND UNREALIZED GAIN/(LOSS) ON INVESTMENTS | | | | | | | | |
| Net realized loss on investments | | | (7,901,131 | ) | | | (712,009 | ) |
| Net realized gain/(loss) on foreign currency transactions | | | (65,835 | ) | | | 497 | |
| Net realized loss | | | (7,966,966 | ) | | | (711,512 | ) |
| Net change in unrealized appreciation/(depreciation) on investments (net of change in foreign capital gains tax of ($48,748) and $0, respectively) | | | 2,661,967 | | | | (31,124 | ) |
| Net change in unrealized appreciation/(depreciation) on translation of assets and liabilities in foreign currencies | | | (1,776 | ) | | | 870 | |
| Net change in unrealized appreciation/(depreciation) | | | 2,660,191 | | | | (30,254 | ) |
| NET REALIZED AND UNREALIZED LOSS ON INVESTMENTS AND FOREIGN CURRENCY TRANSACTIONS | | | (5,306,775 | ) | | | (741,766 | ) |
| NET DECREASE IN NET ASSETS RESULTING FROM OPERATIONS | | $ | (4,298,518 | ) | | $ | (527,621 | ) |
See Notes to Financial Statements.
| 18 | 1.855.775.3337 | www.rondureglobal.com |
| Rondure New World Fund | Statement of Changes in Net Assets |
| | | For the Year Ended April 30, 2019 | | | For the Period May 2, 2017 (Commencement of Operations) to April 30, 2018 | |
| OPERATIONS | | | | | | |
| Net investment income | | $ | 1,008,257 | | | $ | 342,001 | |
| Net realized loss | | | (7,966,966 | ) | | | (280,302 | ) |
| Net change in unrealized appreciation | | | 2,660,191 | | | | 7,974,392 | |
| Net increase/(decrease) in net assets resulting from operations | | | (4,298,518 | ) | | | 8,036,091 | |
| TOTAL DISTRIBUTIONS TO SHAREHOLDERS (NOTE 3)(a) | | | | | | | | |
| From distributable earnings | | | | | | | | |
| Institutional Class | | | (805,429 | ) | | | (195,933 | ) |
| Investor Class | | | (134,438 | ) | | | (20,535 | ) |
| Net decrease in net assets from distributions | | | (939,867 | ) | | | (216,468 | ) |
| CAPITAL SHARE TRANSACTIONS (NOTE 5) | | | | | | | | |
| Institutional Class | | | | | | | | |
| Proceeds from sales of shares | | | 45,561,068 | | | | 98,740,607 | |
| Distributions reinvested | | | 775,462 | | | | 185,431 | |
| Cost of shares redeemed | | | (32,437,400 | ) | | | (4,530,207 | ) |
| Redemption fees | | | 2,181 | | | | 6,598 | |
| Net increase from capital shares transactions | | | 13,901,311 | | | | 94,402,429 | |
| Investor Class | | | | | | | | |
| Proceeds from sales of shares | | | 10,226,719 | | | | 25,295,273 | |
| Distributions reinvested | | | 133,941 | | | | 20,535 | |
| Cost of shares redeemed | | | (12,623,048 | ) | | | (2,546,642 | ) |
| Redemption fees | | | 1,142 | | | | 1,843 | |
| Net increase/(decrease) from capital shares transactions | | | (2,261,246 | ) | | | 22,771,009 | |
| Net increase in net assets | | | 6,401,680 | | | | 124,993,061 | |
| | | | | | | | | |
| NET ASSETS | | | | | | | | |
| Beginning of period | | | 124,993,061 | | | | – | |
| End of period | | $ | 131,394,741 | | | $ | 124,993,061 | (b) |
| | | | | | | | | |
| OTHER INFORMATION | | | | | | | | |
| Shares Transactions | | | | | | | | |
| Institutional Class | | | | | | | | |
| Issued | | | 4,483,691 | | | | 9,350,867 | |
| Issued to shareholders in reinvestment of distributions | | | 81,115 | | | | 16,542 | |
| Redeemed | | | (3,256,312 | ) | | | (414,745 | ) |
| Net increase in share transactions | | | 1,308,494 | | | | 8,952,664 | |
| Investor Class | | | | | | | | |
| Issued | | | 1,005,992 | | | | 2,383,360 | |
| Issued to shareholders in reinvestment of distributions | | | 14,025 | | | | 1,832 | |
| Redeemed | | | (1,265,236 | ) | | | (229,614 | ) |
| Net increase/(decrease) in share transactions | | | (245,219 | ) | | | 2,155,578 | |
| (a) | For the prior period ended April 30, 2018, Total Distributions consisted of Net Investment Income of $204,986, and Net Realized Gains of $11,482. |
| (b) | For the prior period ended April 30, 2018, included accumulated net investment income of $118,506. |
See Notes to Financial Statements.
| Annual Report | April 30, 2019 | 19 |
| Rondure Overseas Fund | Statement of Changes in Net Assets |
| | | For the Year Ended April 30, 2019 | | | For the Period May 2, 2017 (Commencement of Operations) to April 30, 2018 | |
| OPERATIONS | | | | | | |
| Net investment income | | $ | 214,145 | | | $ | 120,241 | |
| Net realized gain/(loss) | | | (711,512 | ) | | | 119,067 | |
| Net change in unrealized appreciation/(depreciation) | | | (30,254 | ) | | | 1,265,807 | |
| Net increase/(decrease) in net assets resulting from operations | | | (527,621 | ) | | | 1,505,115 | |
| TOTAL DISTRIBUTIONS TO SHAREHOLDERS (NOTE 3)(a) | | | | | | | | |
| From distributable earnings | | | | | | | | |
| Institutional Class | | | (239,395 | ) | | | (140,954 | ) |
| Investor Class | | | (49,787 | ) | | | (25,519 | ) |
| Net decrease in net assets from distributions | | | (289,182 | ) | | | (166,473 | ) |
| CAPITAL SHARE TRANSACTIONS (NOTE 5) | | | | | | | | |
| Institutional Class | | | | | | | | |
| Proceeds from sales of shares | | | 8,892,000 | | | | 14,305,962 | |
| Distributions reinvested | | | 229,107 | | | | 139,017 | |
| Cost of shares redeemed | | | (3,918,374 | ) | | | (1,341,389 | ) |
| Redemption fees | | | 1,619 | | | | 2,060 | |
| Net increase from capital shares transactions | | | 5,204,352 | | | | 13,105,650 | |
| Investor Class | | | | | | | | |
| Proceeds from sales of shares | | | 1,539,008 | | | | 5,925,966 | |
| Distributions reinvested | | | 49,575 | | | | 25,519 | |
| Cost of shares redeemed | | | (2,683,077 | ) | | | (924,780 | ) |
| Redemption fees | | | 1,670 | | | | 1,382 | |
| Net increase/(decrease) from capital shares transactions | | | (1,092,824 | ) | | | 5,028,087 | |
| Net increase in net assets | | | 3,294,725 | | | | 19,472,379 | |
| | | | | | | | | |
| NETASSETS | | | | | | | | |
| Beginning of period | | | 19,472,379 | | | | – | |
| End of period | | $ | 22,767,104 | | | $ | 19,472,379 | (b) |
| | | | | | | | | |
| OTHER INFORMATION | | | | | | | | |
| Shares Transactions | | | | | | | | |
| Institutional Class | | | | | | | | |
| Issued | | | 787,230 | | | | 1,355,282 | |
| Issued to shareholders in reinvestment of distributions | | | 22,528 | | | | 12,162 | |
| Redeemed | | | (359,383 | ) | | | (121,097 | ) |
| Net increase in share transactions | | | 450,375 | | | | 1,246,347 | |
| Investor Class | | | | | | | | |
| Issued | | | 139,570 | | | | 531,797 | |
| Issued to shareholders in reinvestment of distributions | | | 4,865 | | | | 2,227 | |
| Redeemed | | | (243,574 | ) | | | (81,987 | ) |
| Net increase/(decrease) in share transactions | | | (99,139 | ) | | | 452,037 | |
| (a) | For the prior period ended April 30, 2018, Total Distributions consisted of Net Investment Income of $49,002, and Net Realized Gains of $117,471. |
| (b) | For the prior period ended April 30, 2018, included accumulated net investment income of $104,048. |
See Notes to Financial Statements.
| 20 | 1.855.775.3337 | www.rondureglobal.com |
| Rondure New World Fund – Institutional Class | Financial Highlights |
For a Share Outstanding Throughout the Period Presented
| Institutional Class | | Year Ended
April 30, 2019 | | | For the Period
May 2, 2017
(Commencement
of Operations) to
April 30, 2018 | |
| NET ASSET VALUE, BEGINNING OF PERIOD | | $ | 11.25 | | | $ | 10.00 | |
| | | | | | | | | |
| INCOME FROM INVESTMENT OPERATIONS | | | | | | | | |
| Net investment income(a) | | | 0.09 | | | | 0.05 | |
| Net realized and unrealized gain/(loss) on investments | | | (0.45 | ) | | | 1.23 | |
| Total income/(loss) from investment operations | | | (0.36 | ) | | | 1.28 | |
| | | | | | | | | |
| DISTRIBUTIONS | | | | | | | | |
| From net investment income | | | (0.09 | ) | | | (0.03 | ) |
| From net realized gain on investments | | | – | | | | (0.00 | )(b) |
| Total distributions | | | (0.09 | ) | | | (0.03 | ) |
| | | | | | | | | |
| REDEMPTION FEES ADDED TO PAID-IN CAPITAL | | | 0.00 | (b) | | | 0.00 | (b) |
| | | | | | | | | |
| INCREASE/DECREASE IN NET ASSET VALUE | | | (0.45 | ) | | | 1.25 | |
| NET ASSET VALUE, END OF PERIOD | | $ | 10.80 | | | $ | 11.25 | |
| | | | | | | | | |
| TOTAL RETURN | | | (3.09 | )% | | | 12.78 | %(c) |
| | | | | | | | | |
| RATIOS AND SUPPLEMENTAL DATA | | | | | | | | |
| Net assets, end of period (in 000s) | | $ | 110,800 | | | $ | 100,760 | |
| | | | | | | | | |
| RATIOS TO AVERAGE NET ASSETS | | | | | | | | |
| Expenses (excluding fees waived/ reimbursed by investment advisor) | | | 1.46 | % | | | 1.62 | %(d) |
| Expenses (including fees waived/ reimbursed by investment advisor) | | | 1.10 | % | | | 1.10 | %(d) |
| Net investment income | | | 0.87 | % | | | 0.43 | %(d) |
| | | | | | | | | |
| PORTFOLIO TURNOVER RATE | | | 37 | % | | | 13 | %(c) |
| (a) | Per share numbers have been calculated using the average shares method. |
| (b) | Less than $0.005 or ($0.005) per share. |
See Notes to Financial Statements.
| Annual Report | April 30, 2019 | 21 |
| Rondure New World Fund – Investor Class | Financial Highlights |
For a Share Outstanding Throughout the Period Presented
| Investor Class | | Year Ended
April 30, 2019 | | | For the Period
May 2, 2017
(Commencement
of Operations) to
April 30, 2018 | |
| NET ASSET VALUE, BEGINNING OF PERIOD | | $ | 11.24 | | | $ | 10.00 | |
| | | | | | | | | |
| INCOME FROM INVESTMENT OPERATIONS | | | | | | | | |
| Net investment income(a) | | | 0.07 | | | | 0.03 | |
| Net realized and unrealized gain/(loss) on investments | | | (0.46 | ) | | | 1.22 | |
| Total income/(loss) from investment operations | | | (0.39 | ) | | | 1.25 | |
| | | | | | | | | |
| DISTRIBUTIONS | | | | | | | | |
| From net investment income | | | (0.07 | ) | | | (0.01 | ) |
| From net realized gain on investments | | | – | | | | (0.00 | )(b) |
| Total distributions | | | (0.07 | ) | | | (0.01 | ) |
| | | | | | | | | |
| REDEMPTION FEES ADDED TO PAID-IN CAPITAL | | | 0.00 | (b) | | | 0.00 | (b) |
| | | | | | | | | |
| INCREASE/DECREASE IN NET ASSET VALUE | | | (0.46 | ) | | | 1.24 | |
| NET ASSET VALUE, END OF PERIOD | | $ | 10.78 | | | $ | 11.24 | |
| | | | | | | | | |
| TOTAL RETURN | | | (3.37 | )% | | | 12.53 | %(c) |
| | | | | | | | | |
| RATIOS AND SUPPLEMENTAL DATA | | | | | | | | |
| Net assets, end of period (in 000s) | | $ | 20,595 | | | $ | 24,233 | |
| | | | | | | | | |
| RATIOS TO AVERAGE NET ASSETS | | | | | | | | |
| Expenses (excluding fees waived/ reimbursed by investment advisor) | | | 1.76 | % | | | 1.91 | %(d) |
| Expenses (including fees waived/ reimbursed by investment advisor) | | | 1.35 | % | | | 1.35 | %(d) |
| Net investment income | | | 0.66 | % | | | 0.24 | %(d) |
| | | | | | | | | |
| PORTFOLIO TURNOVER RATE | | | 37 | % | | | 13 | %(c) |
| (a) | Per share numbers have been calculated using the average shares method. |
| (b) | Less than $0.005 or ($0.005) per share. |
See Notes to Financial Statements.
| 22 | 1.855.775.3337 | www.rondureglobal.com |
| Rondure Overseas Fund – Institutional Class | Financial Highlights |
For a Share Outstanding Throughout the Period Presented
| Institutional Class | | Year Ended
April 30, 2019 | | | For the Period
May 2, 2017
(Commencement
of Operations) to
April 30, 2018 | |
| NET ASSET VALUE, BEGINNING OF PERIOD | | $ | 11.46 | | | $ | 10.00 | |
| | | | | | | | | |
| INCOME FROM INVESTMENT OPERATIONS | | | | | | | | |
| Net investment income(a) | | | 0.10 | | | | 0.10 | |
| Net realized and unrealized gain/(loss) on investments | | | (0.31 | ) | | | 1.48 | |
| Total income/(loss) from investment operations | | | (0.21 | ) | | | 1.58 | |
| | | | | | | | | |
| DISTRIBUTIONS | | | | | | | | |
| From net investment income | | | (0.11 | ) | | | (0.04 | ) |
| From net realized gain on investments | | | (0.03 | ) | | | (0.08 | ) |
| Total distributions | | | (0.14 | ) | | | (0.12 | ) |
| | | | | | | | | |
| REDEMPTION FEES ADDED TO PAID-IN CAPITAL | | | 0.00 | (b) | | | 0.00 | (b) |
| | | | | | | | | |
| INCREASE/DECREASE IN NET ASSET VALUE | | | (0.35 | ) | | | 1.46 | |
| NET ASSET VALUE, END OF PERIOD | | $ | 11.11 | | | $ | 11.46 | |
| | | | | | | | | |
| TOTAL RETURN | | | (1.76 | )% | | | 15.88 | %(c) |
| | | | | | | | | |
| RATIOS AND SUPPLEMENTAL DATA | | | | | | | | |
| Net assets, end of period (in 000s) | | $ | 18,845 | | | $ | 14,283 | |
| | | | | | | | | |
| RATIOS TO AVERAGE NET ASSETS | | | | | | | | |
| Expenses (excluding fees waived/ reimbursed by investment advisor) | | | 1.72 | % | | | 2.57 | %(d) |
| Expenses (including fees waived/ reimbursed by investment advisor) | | | 0.85 | % | | | 0.85 | %(d) |
| Net investment income | | | 0.95 | % | | | 0.92 | %(d) |
| | | | | | | | | |
| PORTFOLIO TURNOVER RATE | | | 40 | % | | | 14 | %(c) |
| (a) | Per share numbers have been calculated using the average shares method. |
| (b) | Less than $0.005 or ($0.005) per share. |
See Notes to Financial Statements.
| Annual Report | April 30, 2019 | 23 |
| Rondure Overseas Fund – Investor Class | Financial Highlights |
For a Share Outstanding Throughout the Period Presented
| Investor Class | | Year Ended
April 30, 2019 | | | For the Period
May 2, 2017
(Commencement
of Operations) to
April 30, 2018 | |
| NET ASSET VALUE, BEGINNING OF PERIOD | | $ | 11.48 | | | $ | 10.00 | |
| | | | | | | | | |
| INCOME FROM INVESTMENT OPERATIONS | | | | | | | | |
| Net investment income(a) | | | 0.08 | | | | 0.09 | |
| Net realized and unrealized gain/(loss) on investments | | | (0.32 | ) | | | 1.46 | |
| Total income/(loss) from investment operations | | | (0.24 | ) | | | 1.55 | |
| | | | | | | | | |
| DISTRIBUTIONS | | | | | | | | |
| From net investment income | | | (0.09 | ) | | | – | |
| From net realized gain on investments | | | (0.03 | ) | | | (0.08 | ) |
| Total distributions | | | (0.12 | ) | | | (0.08 | ) |
| | | | | | | | | |
| REDEMPTION FEES ADDED TO PAID-IN CAPITAL | | | 0.00 | (b) | | | 0.01 | |
| | | | | | | | | |
| INCREASE/DECREASE IN NET ASSET VALUE | | | (0.36 | ) | | | 1.48 | |
| NET ASSET VALUE, END OF PERIOD | | $ | 11.12 | | | $ | 11.48 | |
| | | | | | | | | |
| TOTAL RETURN | | | (1.98 | )% | | | 15.63 | %(c) |
| | | | | | | | | |
| RATIOS AND SUPPLEMENTAL DATA | | | | | | | | |
| Net assets, end of period (in 000s) | | $ | 3,922 | | | $ | 5,189 | |
| | | | | | | | | |
| RATIOS TO AVERAGE NET ASSETS | | | | | | | | |
| Expenses (excluding fees waived/ reimbursed by investment advisor) | | | 2.04 | % | | | 2.45 | %(d) |
| Expenses (including fees waived/ reimbursed by investment advisor) | | | 1.10 | % | | | 1.10 | %(d) |
| Net investment income | | | 0.74 | % | | | 0.82 | %(d) |
| | | | | | | | | |
| PORTFOLIO TURNOVER RATE | | | 40 | % | | | 14 | %(c) |
| (a) | Per share numbers have been calculated using the average shares method. |
| (b) | Less than $0.005 or ($0.005) per share. |
See Notes to Financial Statements.
| 24 | 1.855.775.3337 | www.rondureglobal.com |
| Rondure Funds | Notes to Financial Statements |
April 30, 2019
1. ORGANIZATION
Financial Investors Trust (the “Trust”), a Delaware statutory trust, is an open-end management investment company registered under the Investment Company Act of 1940, as amended (“1940 Act”). As of April 30, 2019, the Trust consists of multiple separate Portfolios or series. This annual report describes the Rondure New World Fund and the Rondure Overseas Fund (individually a “Fund” and collectively, the “Funds”). The Funds seek long-term growth of capital. The Funds offer Investor Class and Institutional Class shares.
2. SIGNIFICANT ACCOUNTING POLICIES
The accompanying financial statements were prepared in accordance with accounting principles generally accepted in the United States of America (“U.S. GAAP”). The preparation of financial statements in conformity with U.S. GAAP requires management to make certain estimates and assumptions that affect the reported amounts of assets and liabilities and disclosures of contingent assets and liabilities at the date of the financial statements and the reported amounts of revenue and expenses during the period. Actual results could differ from those estimates. The Funds are considered an investment company for financial reporting purposes under U.S. GAAP and follows the accounting and reporting guidance applicable to investment companies in the Financial Accounting Standards Board Accounting Standards Codification Topic 946. The following is a summary of significant accounting policies consistently followed by the Funds in preparation of its financial statements.
Investment Valuation:The Funds generally value their securities based on market prices determined at the close of regular trading on the New York Stock Exchange (“NYSE”), normally 4:00 p.m. Eastern Time, on each day the NYSE is open for trading.
For equity securities and mutual funds that are traded on an exchange, the market price is usually the closing sale or official closing price on that exchange. In the case of equity securities not traded on an exchange, or if such closing prices are not otherwise available, the securities are valued at the mean of the most recent bid and ask prices on such day. Redeemable securities issued by open-end registered investment companies are valued at the investment company’s applicable net asset value, with the exception of exchange-traded open-end investment companies, which are priced as equity securities.
Equity securities that are primarily traded on foreign securities exchanges are valued at the closing values of such securities on their respective foreign exchanges, except when an event occurs subsequent to the close of the foreign exchange and the close of the NYSE that was likely to have changed such value. In such an event, the fair value of those securities are determined in good faith through consideration of other factors in accordance with procedures established by and under the general supervision of the Board of Trustees (the “Board”). The Funds will use a fair valuation model provided by an independent pricing service, which is intended to reflect fair value when a security’s value or a meaningful portion of each Fund’s portfolio is believed to have been materially affected by a valuation event that has occurred between the close of the exchange or market on which the security is traded and the close of the regular trading day on the NYSE. The Funds’ valuation procedures set forth certain triggers which instruct when to use the fair valuation model.
Forward currency exchange contracts have a fair value determined by the prevailing foreign currency exchange daily rates and current foreign currency exchange forward rates. The foreign currency exchange forward rates are calculated using an automated system that estimates rates on the basis of the current day foreign currency exchange rates and forward foreign currency exchange rates supplied by a pricing service.
When such prices or quotations are not available, or when Rondure Global Advisors, LLC (the “Advisor”) believes that they are unreliable, securities may be priced using fair value procedures approved by the Board.
Fair Value Measurements:The Funds disclose the classification of their fair value measurements following a three-tier hierarchy based on the inputs used to measure fair value. Inputs refer broadly to the assumptions that market participants would use in pricing the asset or liability, including assumptions about risk. Inputs may be observable or unobservable. Observable inputs reflect the assumptions market participants would use in pricing the asset or liability that are developed based on market data obtained from sources independent of the reporting entity. Unobservable inputs reflect the reporting entity’s own assumptions about the assumptions market participants would use in pricing the asset or liability that are developed based on the best information available.
| Annual Report | April 30, 2019 | 25 |
| Rondure Funds | Notes to Financial Statements |
April 30, 2019
Various inputs are used in determining the value of the Funds’ investments as of the end of the reporting period. When inputs used fall into different levels of the fair value hierarchy, the level in the hierarchy within which the fair value measurement falls is determined based on the lowest level input that is significant to the fair value measurement in its entirety. The designated input levels are not necessarily an indication of the risk or liquidity associated with these investments. These inputs are categorized in the following hierarchy under applicable financial accounting standards:
Level 1 – Unadjusted quoted prices in active markets for identical investments, unrestricted assets or liabilities that the Funds have the ability to access at the measurement date;
Level 2 – Quoted prices which are not active, quoted prices for similar assets or liabilities in active markets or inputs other than quoted prices that are observable (either directly or indirectly) for substantially the full term of the asset or liability; and
Level 3 – Significant unobservable prices or inputs (including the Funds’ own assumptions in determining the fair value of investments) where there is little or no market activity for the asset or liability at the measurement date.
The following is a summary of each Fund’s investments in the fair value hierarchy as of April 30, 2019:
| Investments in Securities at Value | | Level 1 - Quoted and Unadjusted Prices | | | Level 2 - Other Significant Observable Inputs | | | Level 3 - Significant Unobservable Inputs | | | Total | |
| Rondure New World Fund | | | | | | | | | | | | | | | | |
| Common Stocks | | | | | | | | | | | | | | | | |
| Sri Lanka | | $ | – | | | $ | 1,492,795 | | | $ | – | | | $ | 1,492,795 | |
| Other* | | | 126,765,732 | | | | – | | | | – | | | | 126,765,732 | |
| Total | | $ | 126,765,732 | | | $ | 1,492,795 | | | $ | – | | | $ | 128,258,527 | |
| Investments in Securities at Value | | Level 1 - Quoted and Unadjusted Prices | | | Level 2 - Other Significant Observable Inputs | | | Level 3 - Significant Unobservable Inputs | | | Total | |
| Rondure Overseas Fund | | | | | | | | | | | | |
| Common Stocks* | | $ | 22,700,568 | | | $ | – | | | $ | – | | | $ | 22,700,568 | |
| Preferred Stocks* | | | 58,762 | | | | – | | | | – | | | | 58,762 | |
| Total | | $ | 22,759,330 | | | $ | – | | | $ | – | | | $ | 22,759,330 | |
| * | For a detailed country breakdown, see the accompanying Portfolio of Investments. |
For liabilities arising from overdrafts in the custody account, the carrying amount reported as payable to custodian in the Statement of Assets and Liabilities approximates fair value due to the relatively short-term maturity of these financial instruments. As of April 30, 2019, the liability related to custody overdrafts in the Rondure Overseas Fund are based on Level 2 inputs.
For the year ended April 30, 2019, the Funds did not have any securities that used significant unobservable inputs (Level 3) in determining fair value.
Investment Transactions and Investment Income:Investment transactions are accounted for on the date the investments are purchased or sold (trade date). Realized gains and losses from investment transactions are reported on an identified cost which is the same basis the Fund uses for federal income tax purposes. Interest income, which includes accretion of discounts and amortization of premiums, is accrued and recorded as earned. Dividend income is recognized on the ex-dividend date or for certain foreign securities, as soon as information is available to the Funds. All of the realized and unrealized gains and losses and net investment income, are allocated daily to each class in proportion to its average daily net assets.
| 26 | 1.855.775.3337 | www.rondureglobal.com |
| Rondure Funds | Notes to Financial Statements |
April 30, 2019
Cash Management Transactions: The Funds subscribe to the Brown Brothers Harriman & Co. (“BBH”) Cash Management Service (“CMS”), whereby cash balances are automatically swept into overnight offshore demand deposits with either the BBH Grand Cayman branch or a branch of a pre-approved commercial bank. This fully automated program allows the Funds to earn interest on cash balances. Excess cash with deposit institutions domiciled outside of the U.S. are subject to sovereign actions in the jurisdiction of the deposit institution including, but not limited to, freeze, seizure or diminution. Cash balances in the BBH CMS are included on the Statements of Assets and Liabilities under Cash and Foreign Cash, at Value. As of April 30, 2019, the Funds had the following cash balances participating in the BBH CMS:
| Fund | | | |
| Rondure New World Fund | | $ | 2,998,611 | |
| Rondure Overseas Fund | | | – | |
As of April 30, 2019, the Funds had the following foreign cash balances participating in the BBH CMS (cost and value of foreign cash balances are equal):
| Fund | | | |
| Rondure New World Fund | | $ | 7,964 | |
| Rondure Overseas Fund | | | 10,337 | |
Foreign Securities:The Funds may directly purchase securities of foreign issuers. Investing in securities of foreign issuers involves special risks not typically associated with investing in securities of U.S. issuers. The risks include possible reevaluation of currencies, the inability to repatriate foreign currency, less complete financial information about companies and possible future adverse political and economic developments. Moreover, securities of many foreign issuers and their markets may be less liquid and their prices more volatile than those of securities of comparable U.S. issuers.
Foreign Currency Translation:The books and records of the Funds are maintained in U.S. dollars. Investment valuations and other assets and liabilities initially expressed in foreign currencies are converted each business day into U.S. dollars based upon current exchange rates. Prevailing foreign exchange rates may generally be obtained at the close of the NYSE (normally, 4:00 p.m. Eastern Time). The portion of realized and unrealized gains or losses on investments due to fluctuations in foreign currency exchange rates are separately disclosed.
Foreign Currency Spot Contracts:The Funds may enter into foreign currency spot contracts to facilitate transactions in foreign securities or to convert foreign currency receipts into U.S. dollars. A foreign currency spot contract is an agreement between two parties to buy and sell currencies at the current market rate, for settlement generally within two business days. The U.S. dollar value of the contracts is determined using current currency exchange rates supplied by a pricing service.
The contract is marked-to-market daily for settlements beyond one day and any change in market value is recorded as an unrealized gain or loss. When the contract is closed, a realized gain or loss is recorded equal to the difference between the value on the open and close date. Losses may arise from changes in the value of the foreign currency, or if the counterparties do not perform under the contract’s terms. The maximum potential loss from such contracts is the aggregate face value in U.S. dollars at the time the contract was opened.
Trust Expenses: Some expenses of the Trust can be directly attributed to the Funds. Expenses which cannot be directly attributed to the Funds are apportioned among all funds in the Trust based on average net assets of each fund.
Fund and Class Expenses: Expenses that are specific to a Fund or class of shares of a Fund, including distribution fees (Rule 12b-1 fees), are charged directly to that Fund or share class. Expenses that are common to all Funds generally are allocated among the Funds in proportion to their average daily net assets.
Offering Costs: Offering costs, including costs of printing initial prospectuses, legal and registration fees, are being amortized over twelve months from the inception date of the Funds. Amounts amortized during the year ended April 30, 2019 for the Funds are shown on the Statements of Operations. All Offering costs have been fully amortized as of April 30, 2019.
Federal Income Taxes: The Funds comply with the requirements under Subchapter M of the Internal Revenue Code of 1986, as amended, applicable to regulated investment companies and intend to distribute substantially all of their net taxable income and net capital gains, if any, each year so that it will not be subject to excise tax on undistributed income and gains. The Funds are not subject to income taxes to the extent such distributions are made.
| Annual Report | April 30, 2019 | 27 |
| Rondure Funds | Notes to Financial Statements |
April 30, 2019
Distributions to Shareholders: Each Fund normally pays dividends and distributes capital gains, if any, on an annual basis. Income dividend distributions are derived from dividends and other income each Fund receives from their investments, including short term capital gains. Long term capital gain distributions are derived from gains realized when each Fund sells a security it has owned for more than a year. Each Fund may make additional distributions and dividends at other times if the portfolio manager believes doing so may be necessary for each Fund to avoid or reduce taxes. The Funds intend to pass through foreign tax credits to shareholders.
3. TAX BASIS INFORMATION
Reclassifications:As of April 30, 2019, permanent differences in book and tax accounting were reclassified. These differences had no effect on net assets. The reclassifications were as follows:
| Fund | | Paid-in Capital | | | Distributable
earnings | |
| Rondure New World Fund | | $ | – | | | $ | – | |
| Rondure Overseas Fund | | | – | | | | – | |
Tax Basis of Investments:As of April 30, 2019, the aggregate cost of investments, gross unrealized appreciation/(depreciation) and net unrealized appreciation for Federal tax purposes was as follows:
| Fund | | Gross Appreciation
(excess of value over tax cost) | | | Gross Depreciation
(excess of tax cost over value) | | | Net
Appreciation/
(Depreciation)
of Foreign Currency | | | Net Unrealized
Appreciation | | | Cost of
Investments for
Income Tax
Purposes | |
| Rondure New World Fund | | $ | 17,538,018 | | | $ | (6,864,042 | ) | | $ | (39,395 | ) | | $ | 10,634,581 | | | $ | 117,584,551 | |
| Rondure Overseas Fund | | | 2,315,812 | | | | (1,097,913 | ) | | | 110 | | | | 1,218,009 | | | | 21,541,431 | |
Components of Earnings: As of April 30, 2019, components of distributable earnings on a tax basis were as follows:
| Fund | | Undistributed
Ordinary Income | | | Accumulated
Capital Losses | | | Other Accumulated
Gain/(Loss) | | | Net Unrealized
Appreciation on
Investments and
Foreign Currency | | | Total Distributable
Earnings | |
| Rondure New World Fund | | $ | 120,325 | | | $ | (8,089,612 | ) | | $ | – | | | $ | 10,634,581 | | | $ | 2,665,294 | |
| Rondure Overseas Fund | | | 91,781 | | | | (756,758 | ) | | | 17 | | | | 1,218,009 | | | | 553,049 | |
Capital Losses arising in the post-October period of the current fiscal year may be deferred to the next fiscal year if the fund elects to defer the recognition of these losses. When this election is made, any losses recognized during the period are treated as having occurred on the first day of the next fiscal year separate from and in addition to the application of normal capital loss carry forwards as described below.
The Funds elect to defer to the period ending April 30, 2020, capital losses recognized during the period November 1, 2018 – April 30, 2019 in the amounts of:
| Fund | | Capital Losses Recognized | |
| Rondure New World Fund | | $ | 3,620,685 | |
| Rondure Overseas Fund | | | 756,758 | |
Under current law, capital losses maintain their character as short-term or long-term and are carried forward to the next tax year without expiration. As of the current fiscal year end, the following amounts are available as carry forwards to the next tax year:
| Fund | | Short-Term | | | Long-Term | |
| Rondure New World Fund | | $ | 2,816,689 | | | $ | 1,652,238 | |
| 28 | 1.855.775.3337 | www.rondureglobal.com |
| Rondure Funds | Notes to Financial Statements |
April 30, 2019
Tax Basis of Distributions to Shareholders: The character of distributions made during the year from net investment income or net realized gains may differ from its ultimate characterization for federal income tax purposes. Also, due to the timing of dividend distributions, the fiscal year in which amounts are distributed may differ from the fiscal year in which the income or realized gain were recorded by the Funds.
The tax characters of distributions paid by the Funds for the year ended April 30, 2019 were as follows:
| Fund | | Ordinary Income | | | Long-Term Capital Gain | |
| Rondure New World Fund | | $ | 939,867 | | | $ | – | |
| Rondure Overseas Fund | | | 289,182 | | | | – | |
The tax characters of distributions paid by the Funds for the year ended April 30, 2018 were as follows:
| Fund | | Ordinary Income | | | Long-Term Capital Gain | |
| Rondure New World Fund | | $ | 216,468 | | | $ | – | |
| Rondure Overseas Fund | | | 166,473 | | | | – | |
4. SECURITIES TRANSACTIONS
The cost of purchases and proceeds from sales of securities (excluding short term securities) during the year ended April 30, 2019 were as follows:
| Fund | | Purchases of Securities | | | Proceeds From Sales of Securities | |
| Rondure New World Fund | | $ | 53,053,235 | | | $ | 42,633,764 | |
| Rondure Overseas Fund | | | 13,288,782 | | | | 8,468,831 | |
5. SHARES OF BENEFICIAL INTEREST
The capitalization of the Trust consists of an unlimited number of shares of beneficial interest with no par value per share. Holders of the shares of the Funds of the Trust have one vote for each share held and a proportionate fraction of a vote for each fractional share. All shares issued and outstanding are fully paid and are transferable and redeemable at the option of the shareholder. Purchasers of the share do not have any obligation to make payments to the Trust or its creditors solely by reason of the purchasers’ ownership of the shares. Shares have no pre-emptive rights.
Shares redeemed within 60 days of purchase may incur a 2% short-term redemption fee deducted from the redemption amount. For the year ended April 30, 2019, the redemption fees charged by the Funds are presented in the Statement of Changes in Net Assets.
6. MANAGEMENT AND RELATED-PARTY TRANSACTIONS
The Advisor, subject to the authority of the Board, is responsible for the overall management and administration of the Funds’ business affairs. The Advisor manages the investments of the Funds in accordance with the Funds’ investment objective, policies and limitations and investment guidelines established jointly by the Advisor and the Trustees. Pursuant to the Advisory Agreement, (the “Advisory Agreement”), each Fund pays the Advisor an annual management fee based on each Fund’s average daily net assets. The management fee is paid on a monthly basis. The following table reflects the Funds’ advisory fee rates.
| Fund | Advisory Fee |
| Rondure New World Fund | 0.85% |
| Rondure Overseas Fund | 0.70% |
| Annual Report | April 30, 2019 | 29 |
| Rondure Funds | Notes to Financial Statements |
April 30, 2019
The Advisor has contractually agreed to limit certain of each Fund’s expenses (excluding acquired fund fees and expenses, brokerage expenses, interest expense, taxes and extraordinary expenses). The following table reflects the Funds’ expense cap.
| Fund | Expense Cap | Term of Expense Limit Agreements |
| Rondure New World Fund | | |
| Institutional Class | 1.10% | September 1, 2018 – August 31, 2019/ |
| Investor Class | 1.35% | March 23, 2017 – August 31, 2018 |
| Rondure Overseas Fund | | |
| Institutional Class | 0.85% | September 1, 2018 – August 31, 2019/ |
| Investor Class | 1.10% | March 23, 2017 – August 31, 2018 |
Pursuant to these agreements, the Advisor may seek reimbursement from a Fund for any previous fee waivers and expense reimbursements made by the Advisor, provided that any such reimbursements made by the Funds to the Advisor will not cause the Funds’ expense limitation to exceed expense limitations in existence at the time the expense was incurred, or at the time of the reimbursement, whichever is lower, and the reimbursement is made within three years after the expenses were incurred. Fees waived/reimbursed by Advisor for the year ended April 30, 2019 are disclosed in the Statements of Operations.
For the year ended April 30, 2019, the fee waivers/reimbursements and/or recoupments were as follows:
| Fund | | Fees Waived/Reimbursed By Adviser | |
| Rondure New World Fund | | | | |
| Institutional Class | | $ | 357,945 | |
| Investor Class | | | 90,396 | |
| Rondure Overseas Fund | | | | |
| Institutional Class | | $ | 165,269 | |
| Investor Class | | | 42,849 | |
| Fund | | Expires
2021 | | | Expires
2022 | | | Total | |
| Rondure New World Fund | | | | | | | | | | | | |
| Institutional Class | | $ | 366,501 | | | $ | 357,945 | | | $ | 724,446 | |
| Investor Class | | | 90,647 | | | | 90,396 | | | | 181,043 | |
| Rondure Overseas Fund | | | | | | | | | | | | |
| Institutional Class | | $ | 186,581 | | | $ | 165,269 | | | $ | 351,850 | |
| Investor Class | | | 33,311 | | | | 42,849 | | | | 76,160 | |
Administrator Fees and Expenses
ALPS Fund Services, Inc. (“ALPS”) serves as administrator to the Funds and the Funds have agreed to pay expenses incurred in connection with their administrative activities. Pursuant to an Administration Agreement, ALPS provides operational services to the Funds including, but not limited to, fund accounting and fund administration and generally assists in the Funds’ operations. Officers of the Trust are employees of ALPS. The Funds’ administration fee is accrued on a daily basis and paid monthly. Administration fees paid by the Funds for the year ended April 30, 2019 are disclosed in the Statements of Operations.
ALPS is reimbursed by the Funds for certain out-of-pocket expenses.
Transfer Agent
ALPS serves as transfer, dividend paying and shareholder servicing agent for the Funds. ALPS receives an annual minimum fee, a fee based upon the number of shareholder accounts, and is also reimbursed by the Funds for certain out-of-pocket expenses. Transfer agent fees paid by the Funds for the year ended April 30, 2019 are disclosed in the Statements of Operations.
| 30 | 1.855.775.3337 | www.rondureglobal.com |
| Rondure Funds | Notes to Financial Statements |
April 30, 2019
Compliance Services
ALPS provides services that assist the Trust’s chief compliance officer in monitoring and testing the policies and procedures of the Trust in conjunction with requirements under Rule 38a-1 under the 1940 Act and receives an annual base fee. ALPS is reimbursed for certain out-of-pocket expenses by the Funds. Compliance service fees paid by the Funds for the year ended April 30, 2019 are disclosed in the Statements of Operations.
Principal Financial Officer
ALPS receives an annual fee for providing principal financial officer services to the Funds. Principal financial officer fees paid by the Fund for the year ended April 30, 2019 are disclosed in the Statements of Operations.
Distributor
ALPS Distributors, Inc. (“ADI” or the “Distributor”) (an affiliate of ALPS) acts as the distributor of the Funds’ shares pursuant to a Distribution Agreement with the Trust. Shares are sold on a continuous basis by ADI as agent for the Funds, and ADI has agreed to use its best efforts to solicit orders for the sale of each Fund’s shares, although it is not obliged to sell any particular amount of shares. ADI is not entitled to any compensation for its services as Distributor. ADI is registered as a broker-dealer with the U.S. Securities and Exchange Commission.
Each Fund has adopted a Distribution and Services (Rule 12b-1) Plan pursuant to Rule 12b-1 of the 1940 Act (the “Plan”) for its Investor Class shares. The Plan allows the Funds to use Investor Class assets to pay fees in connection with the distribution and marketing of Investor Class shares and/or the provision of shareholder services to Investor Class shareholders. The Plan permits payment for services in connection with the administration of plans or programs that use Investor Class shares of each Fund as their funding medium and for related expenses. The recipients of such payments may include the Distributor, other affiliates of the Advisor, broker-dealers, financial institutions, plan sponsors and administrators and other financial intermediaries through which investors may purchase shares of the Fund. The Plan permits the Funds to make total payments at an annual rate of up to 0.25% of each Fund’s average daily net assets attributable to its Investor Class shares. The expenses of the Plan are reflected as distribution and service fees in the Statements of Operations.
Trustees
The fees and expenses of the independent trustees of the Board are presented in the Statements of Operations.
7. INDEMNIFICATIONS
Under the Trust’s organizational documents, its officers and Trustees are indemnified against certain liability arising out of the performance of their duties to the Trust. Additionally, in the normal course of business, the Trust enters into contracts with service providers that may contain general indemnification clauses, which may permit indemnification to the extent permissible under applicable law. The Trust’s maximum exposure under these arrangements is unknown, as this would involve future claims that may be made against the Trust that have not yet occurred.
8. NEW ACCOUNTING PROUNOUNCEMENTS
On October 4, 2018, the SEC amended Regulation S-X to require certain financial statement disclosure requirements to conform them to US GAAP for investment companies. Effective November 4, 2018, the Funds adopted disclosure requirement changes for Regulation S-X and these changes are reflected throughout this report. The Funds’ adoption of those amendments, effective with the financial statements prepared as of April 30, 2019, had no effect on the Funds’ net assets or results of operations.
In August 2018, the Financial Accounting Standards Board (“FASB”) issued Accounting Standards Update (“ASU”) 2018-13, which changes the fair value measurement disclosure requirements of FASB Accounting Standards Codification Topic 820, Fair Value Measurement. The update to Topic 820 includes new, eliminated, and modified disclosure requirements. ASU 2018-13 is effective for fiscal years beginning after December 15, 2019, including interim periods. Early adoption is permitted for any eliminated or modified disclosures. The Funds early adopted effective with the financial statements prepared as of April 30, 2019, and they had no effect on the Funds’ net assets or results of operations.
9. SUBSEQUENT EVENT
Subsequent events after the date of the Statements of Assets and Liabilities have been evaluated through the date the financial statements were issued.
| Annual Report | April 30, 2019 | 31 |
Report of Independent Registered
| Rondure Funds | Public Accounting Firm |
To the shareholders and the Board of Trustees of Financial Investors Trust
Opinion on the Financial Statements and Financial Highlights
We have audited the accompanying statements of assets and liabilities, including the portfolios of investments, of Rondure New World Fund and Rondure Overseas Fund (the “Funds”), two of the funds constituting the Financial Investors Trust, as of April 30, 2019, the related statements of operations for the year then ended, the statements of changes in net assets and financial highlights for the year ended April 30, 2019 and for the period May 2, 2017 (commencement of operations) to April 30, 2018, and the related notes. In our opinion, the financial statements and financial highlights present fairly, in all material respects, the financial position of Rondure New World Fund and Rondure Overseas Fund of Financial Investors Trust as of April 30, 2019, and the results of their operations for the year then ended, and the changes in their net assets and financial highlights for the year ended April 30, 2019 and for the period May 2, 2017 (commencement of operations) to April 30, 2018, in conformity with accounting principles generally accepted in the United States of America.
Basis for Opinion
These financial statements and financial highlights are the responsibility of the Funds’ management. Our responsibility is to express an opinion on the Funds’ financial statements and financial highlights based on our audits. We are a public accounting firm registered with the Public Company Accounting Oversight Board (United States) (PCAOB) and are required to be independent with respect to the Funds in accordance with the U.S. federal securities laws and the applicable rules and regulations of the Securities and Exchange Commission and the PCAOB.
We conducted our audits in accordance with the standards of the PCAOB. Those standards require that we plan and perform the audit to obtain reasonable assurance about whether the financial statements and financial highlights are free of material misstatement, whether due to error or fraud. The Funds are not required to have, nor were we engaged to perform, an audit of their internal control over financial reporting. As part of our audits we are required to obtain an understanding of internal control over financial reporting but not for the purpose of expressing an opinion on the effectiveness of the Funds’ internal control over financial reporting. Accordingly, we express no such opinion.
Our audits included performing procedures to assess the risks of material misstatement of the financial statements and financial highlights, whether due to error or fraud, and performing procedures that respond to those risks. Such procedures included examining, on a test basis, evidence regarding the amounts and disclosures in the financial statements and financial highlights. Our audits also included evaluating the accounting principles used and significant estimates made by management, as well as evaluating the overall presentation of the financial statements and financial highlights. Our procedures included confirmation of securities owned as of April 30, 2019, by correspondence with the custodian and brokers; when replies were not received from brokers, we performed other auditing procedures. We believe that our audits provide a reasonable basis for our opinion.
DELOITTE & TOUCHE LLP
Denver, Colorado
June 25, 2019
We have served as the auditor of one or more investment companies advised by Rondure Global Advisors, LLC since 2018.
| 32 | 1.855.775.3337 | www.rondureglobal.com |
| Rondure Funds | Additional Information |
April 30, 2019 (Unaudited)
1. FUND HOLDINGS
The Funds file their complete schedule of portfolio holdings with the Securities and Exchange Commission (the “SEC”) for the first and third quarters of each fiscal year within 60 days after the end of the period. Copies of the Funds’ previously filed Form N-Qs are available without charge on the SEC website at http://www.sec.gov.
2. FUND PROXY VOTING POLICIES, PROCEDURES AND SUMMARIES
The Funds’ policies and procedures used in determining how to vote proxies and information regarding how the Funds voted proxies relating to portfolio securities during the most recent prior 12-month period ending June 30 are available without charge, (1) upon request, by calling (toll-free) 1-855-775-3337 and (2) on the SEC’s website at http://www.sec.gov.
3. TAX DESIGNATIONS
The Funds designate the following amounts for federal income tax purposes for the fiscal year ended April 30, 2019:
| | Foreign Taxes Paid | Foreign Source Income |
| Rondure Overseas Fund | $40,898 | $404,150 |
| Rondure New World Fund | $184,119 | $2,365,045 |
Of the distributions paid by the Funds from ordinary income for the calendar year ended December 31, 2018, the following percentages met the requirements to be treated as qualifying for the corporate dividends received deduction and qualified dividend income:
| | Dividend Received Deduction | Qualified Dividend
Income |
| Rondure Overseas Fund | 8.29% | 100.00% |
| Rondure New World Fund | 18.76% | 100.00% |
In early 2019, if applicable, shareholders of record received this information for the distributions paid to them by the Funds during the calendar year 2018 via Form 1099. The Funds will notify shareholders in early 2020 of amounts paid to them by the Funds, if any, during the calendar year 2019.
| Annual Report | April 30, 2019 | 33 |
| Rondure Funds | Trustees and Officers |
| | April 30, 2019 (Unaudited) |
Additional information regarding the Fund’s trustees is included in the Statement of Additional Information, which can be obtained without charge by calling 855-775-3337.
INDEPENDENT TRUSTEES
Name,
Address*
& Year
of Birth | Position(s)
Held with
Fund | Term of Office**
and Length of
Time Served | Principal Occupation(s)
During Past 5 Years*** | Number of
Funds in
Fund
Complex
Overseen
by Trustee**** | Other Directorships Held
by Trustee During
Past 5 Years*** |
Mary K. Anstine,
1940 | Trustee
and
Chairman | Ms. Anstine was elected at a special meeting of shareholders held on March 21, 1997 and re-elected at a special meeting of shareholders held on August 7, 2009. Ms. Anstine was appointed Chairman of the Board at the June 6, 2017 meeting of the Board of Trustees. | Ms. Anstine was formerly an Executive Vice President of First Interstate Bank of Denver until 1994, President/Chief Executive Officer of HealthONE Alliance, Denver, Colorado, from 1994 to 2004, and has been retired since 2004. Ms. Anstine is also Trustee/Director of AV Hunter Trust and Colorado Uplift Board. Ms. Anstine was formerly a Director of the Trust Bank of Colorado (later purchased and now known as Northern Trust Bank), HealthONE and Denver Area Council of the Boy Scouts of America, and a member of the American Bankers Association Trust Executive Committee. | 31 | Ms. Anstine is a Trustee of ALPS ETF Trust (20 funds); ALPS Variable Investment Trust (9 funds); Reaves Utility Income Fund (1 fund); and Segall Bryant & Hamill Trust (14 funds). |
Jeremy W. Deems,
1976 | Trustee | Mr. Deems was appointed as a Trustee at the March 11, 2008 meeting of the Board of Trustees and elected at a special meeting of shareholders held on August 7, 2009. | Mr. Deems is the Co-Founder, Chief Operations Officer and Chief Financial Officer of Green Alpha Advisors, LLC, a registered investment advisor, and Co-Portfolio Manager of the Shelton Green Alpha Fund. Prior to joining Green Alpha Advisors, Mr. Deems was CFO and Treasurer of Forward Management, LLC, ReFlow Management Co., LLC, ReFlow Fund, LLC, a private investment fund, and Sutton Place Management, LLC, an administrative services company, from 1998 to June 2007. From 2004 to 2005, Mr. Deems also served as Treasurer of the Forward Funds and the Sierra Club Funds. | 31 | Mr. Deems is a Trustee of ALPS ETF Trust (20 funds); ALPS Variable Investment Trust (9 funds); Clough Funds Trust (1 fund); and Reaves Utility Income Fund (1 fund). |
| 34 | 1.855.775.3337 | www.rondureglobal.com |
| Rondure Funds | Trustees and Officers |
| | April 30, 2019 (Unaudited) |
INDEPENDENT TRUSTEES
Name,
Address*
& Year
of Birth | Position(s) Held with Fund | Term of Office**
and Length of
Time Served | Principal Occupation(s)
During Past 5 Years*** | Number of
Funds in
Fund
Complex
Overseen
by Trustee**** | Other Directorships Held
by Trustee During
Past 5 Years*** |
Jerry G. Rutledge,
1944 | Trustee | Mr. Rutledge was elected at a special meeting of shareholders held on August 7, 2009. | Mr. Rutledge is the President and owner of Rutledge’s Inc., a retail clothing business. Mr. Rutledge is currently Director of the American National Bank. He was from 1994 to 2007 a Regent of the University of Colorado. | 31 | Mr. Rutledge is a Trustee of Principal Real Estate Income Fund (1 fund); Clough Global Dividend and Income Fund (1 fund); Clough Global Equity Fund (1 fund); and Clough Global Opportunities Fund (1 fund). |
Michael “Ross” Shell,
1970 | Trustee | Mr. Shell was elected at a special meeting of shareholders held on August 7, 2009. | Mr. Shell is Founder and CEO of Red Idea, LLC, a strategic consulting/early stage venture firm (since June 2008). From 1999 to 2009, he was a part-owner and Director of Tesser, Inc., a brand agency. From December 2005 to May 2008, he was Director, Marketing and Investor Relations, of Woodbourne, a REIT/real estate hedge fund and private equity firm. Prior to this, from May 2004 to November 2005, he worked as a business strategy consultant; from June 2003 to April 2004, he was on the Global Client Services team of IDEO, a product design/innovation firm; and from 1999 to 2003, he was President of Tesser, Inc. Mr. Shell graduated with honors from Stanford University with a degree in Political Science. | 31 | None. |
| Annual Report | April 30, 2019 | 35 |
| Rondure Funds | Trustees and Officers |
| | April 30, 2019 (Unaudited) |
INTERESTED TRUSTEE
Name,
Address*
& Year
of Birth | Position(s)
Held with
Fund | Term of Office**
and Length of
Time Served | Principal Occupation(s)
During Past 5 Years*** | Number of
Funds in
Fund
Complex
Overseen
by Trustee**** | Other Directorships Held
by Trustee During
Past 5 Years*** |
Edmund J. Burke,
1961 | Trustee
and
President^ | Mr. Burke was elected as Trustee at a special meeting of shareholders held on August 7, 2009. Mr. Burke was elected President of the Trust at the December 17, 2002 meeting of the Board of Trustees. | Mr. Burke is President and a Director of ALPS Holdings, Inc. (“AHI”) (since 2005) and ALPS Advisors, Inc. (“AAI”) and Director of Boston Financial Data Services, Inc. (“BFDS”), ALPS Distributors, Inc. (“ADI”), ALPS Fund Services, Inc. (“AFS”) and ALPS Portfolio Solutions Distributor, Inc. (“APSD”). Because of his positions with AHI, BFDS, AAI, ADI, AFS and APSD, Mr. Burke is deemed an affiliate of the Trust as defined under the 1940 Act. | 31 | Mr. Burke is a Trustee of ALPS ETF Trust (20 funds); Clough Global Dividend and Income Fund (1 fund); Clough Global Equity Fund (1 fund); Clough Global Opportunities Fund (1 fund); Clough Funds Trust (1 fund); Liberty All-Star Equity Fund (1 fund); and Director of the Liberty All-Star Growth Fund, Inc. (1 fund). |
| 36 | 1.855.775.3337 | www.rondureglobal.com |
| Rondure Funds | Trustees and Officers |
| | April 30, 2019 (Unaudited) |
OFFICERS
Name, Address*
& Year of Birth | Position(s) Held
with Fund | Term of Office**and
Length of Time Served | Principal Occupation(s)
During Past 5 Years*** |
Kimberly R. Storms,
1972 | Treasurer | Ms. Storms was elected Treasurer of the Trust at the March 12, 2013 meeting of the Board of Trustees. | Ms. Storms is Senior Vice President - Director of Fund Administration of ALPS. Because of her position with ALPS, Ms. Storms is deemed an affiliate of the Trust as defined under the 1940 Act. Ms. Storms is also Treasurer of Liberty All-Star Equity Fund, Liberty All-Star Growth Fund, Inc., and ALPS Series Trust. Ms. Storms also serves as a Board member and Treasurer of The Center for Trauma & Resilience, a nonprofit agency. |
Karen S. Gilomen,
1970 | Secretary | Ms. Gilomen was elected Secretary of the Trust at the December 13, 2016 meeting of the Board of Trustees. | Ms. Gilomen joined ALPS in August 2016 as Vice President and Senior Counsel. Prior to joining ALPS, Ms. Gilomen was Vice President - General Counsel & CCO of Monticello Associates, Inc. from 2010 to 2016. Because of her position with ALPS, Ms. Gilomen is deemed an affiliate of the Trust, as defined under the 1940 Act. Ms. Gilomen is also the Secretary of Reaves Utility Income Fund and the Assistant Secretary of the WesMark Funds. |
Ted Uhl,
1974 | Chief Compliance
Officer (“CCO”) | Mr. Uhl was appointed CCO of the Trust at the June 8, 2010 meeting of the Board of Trustees. | Mr. Uhl joined ALPS in October 2006, and is currently Deputy Compliance Officer of ALPS. Prior to his current role, Mr. Uhl served as Senior Risk Manager for ALPS from October 2006 until June 2010. Before joining ALPS, Mr. Uhl served a Sr. Analyst with Enenbach and Associates (RIA), and a Sr. Financial Analyst at Sprint. Because of his position with ALPS, Mr. Uhl is deemed an affiliate of the Trust as defined under the 1940 Act. Mr. Uhl is also CCO of the Axonic Alternative Income Fund, Boulder Growth & Income Fund, Inc., Centre Funds, Index Funds, Reality Shares ETF Trust, Reaves Utility Income Fund and XAI Octagon Floating Rate & Alternative Income Term Trust. |
Jennell Panella,
1974 | Assistant
Treasurer | Ms. Panella was elected Assistant Treasurer of the Trust at the September 15, 2015 meeting of the Board of Trustees. | Ms. Panella joined ALPS in June 2012 and is currently Fund Controller of ALPS Fund Services, Inc. Prior to joining ALPS, Ms. Panella served as Financial Reporting Manager for Parker Global Strategies, LLC (2009-2012). Because of her position with ALPS, Ms. Panella is deemed an affiliate of the Trust as defined under the 1940 Act. Ms. Panella also serves as Assistant Treasurer of James Advantage Funds. |
Sharon Akselrod,
1974 | Assistant
Secretary | Ms. Akselrod was elected Assistant Secretary of the Trust at the September 15, 2015 meeting of the Board of Trustees. | Ms. Akselrod joined ALPS in August 2014 and is currently Senior Investment Company Act Paralegal of ALPS Fund Services, Inc. Prior to joining ALPS, Ms. Akselrod served as Corporate Governance and Regulatory Associate for Nordstrom fsb (2013-2014) and Senior Legal Assistant – Legal Manager for AXA Equitable Life Insurance Company (2008-2013). Because of her position with ALPS, Ms. Akselrod is deemed an affiliate of the Trust as defined under the 1940 Act. Ms. Akselrod is also Assistant Secretary of ALPS ETF Trust, Clough Funds Trust and Principal Real Estate Income Fund. |
| Annual Report | April 30, 2019 | 37 |
| Rondure Funds | Trustees and Officers |
| | April 30, 2019 (Unaudited) |
OFFICERS
Name, Address*
& Year of Birth | Position(s) Held
with Fund | Term of Office**and
Length of Time Served | Principal Occupation(s)
During Past 5 Years*** |
Jennifer Craig,
1973 | Assistant
Secretary | Ms. Craig was elected Assistant Secretary of the Trust at the June 8, 2016 meeting of the Board of Trustees. | Ms. Craig joined ALPS in 2007 and is currently Assistant Vice President and Paralegal Manager of ALPS. Prior to joining ALPS, Ms. Craig was Legal Manager at Janus Capital Management LLC and served as Assistant Secretary of Janus Investment Fund, Janus Adviser Series and Janus Aspen Series. Because of her position with ALPS, Ms. Craig is deemed an affiliate of the Trust as defined under the 1940 Act. Ms. Craig is also Assistant Secretary of Clough Global Dividend and Income Fund, Clough Global Equity Fund, Clough Global Opportunities Fund, Liberty All-Star Equity Fund and Liberty All-Star Growth Fund, Inc. |
Sareena Khwaja-Dixon,
1980 | Assistant
Secretary | Ms. Khwaja-Dixon was elected Assistant Secretary of the Trust at the December 12, 2017 meeting of the Board of Trustees. | Ms. Khwaja-Dixon joined ALPS in August 2015 and is currently Senior Counsel and Vice President of ALPS Fund Services, Inc. Prior to joining ALPS, Ms. Khwaja-Dixon served as a Senior Paralegal/Paralegal for Russell Investments (2011 – 2015). Ms. Khwaja-Dixon is also Secretary of Liberty All-Star Equity Fund and Liberty All-Star Growth Fund, Inc., Clough Funds Trust, Clough Dividend and Income Fund, Clough Global Opportunities Fund, and Clough Global Equity Fund. |
| * | All communications to Trustees and Officers may be directed to Financial Investors Trust c/o 1290 Broadway, Suite 1100, Denver, CO 80203. |
| ** | This is the period for which the Trustee or Officer began serving the Trust. Each Trustee serves an indefinite term, until his successor is elected. Officers are elected on an annual basis. |
| *** | Except as otherwise indicated, each individual has held the office shown or other offices in the same company for the last five years. |
| **** | The Fund Complex includes all series of the Trust (currently 31) and any other investment companies for which any Trustee serves as trustee for and which Rondure Global Advisors, LLC provides investment advisory services (currently none). |
| ^ | Effective June 12, 2019, Mr. Burke’s term as President of the Trust ended and Bradley J. Swenson was appointed President of the Trust. |
| 38 | 1.855.775.3337 | www.rondureglobal.com |
| Rondure Funds | Privacy Policy |
| | April 30, 2019 (Unaudited) |
| Who We Are |
| Who is providing this notice? | Rondure New World Fund, and Rondure Overseas Fund. |
| What We Do |
How do the Funds protect my
personal information? | To protect your personal information from unauthorized access and use, we use security measures that comply with federal law. These measures include computer safeguards and secured files and buildings. |
| How do the Funds collect my personal information? | We collect your personal information, for example, when you |
| | ● | open an account |
| | ● | provide account information or give us your contact information |
| | ● | make a wire transfer or deposit money |
| Why can't I limit all sharing? | Federal law gives you the right to limit only |
| | ● | sharing for affiliates’ everyday business purposes-information about your creditworthiness |
| | ● | affiliates from using your information to market to you |
| | ● | sharing for non-affiliates to market to you |
| | State laws and individual companies may give you additional rights to limit sharing. |
| Definitions |
| Affiliates | Companies related by common ownership or control. They can be financial and nonfinancial companies. |
| Non-affiliates | Companies not related by common ownership or control. They can be financial and nonfinancial companies. |
| | ● | The Funds does not share with non-affiliates so they can market to you. |
| Joint marketing | A formal agreement between non-affiliated financial companies that together market financial products or services to you. |
| | ● | The Funds does not jointly market. |
| Other Important Information |
| California Residents | If your account has a California home address, your personal information will not be disclosed to nonaffiliated third parties except as permitted by applicable California law, and we will limit sharing such personal information with our affiliates to comply with California privacy laws that apply to us. |
| Vermont Residents | The State of Vermont requires financial institutions to obtain your consent prior to sharing personal information that they collect about you with affiliated companies and nonaffiliated third parties other than in certain limited circumstances. Except as permitted by law, we will not share personal information we collect about you with nonaffiliated third parties or other affiliated companies unless you provide us with your written consent to share such information. |
| Annual Report | April 30, 2019 | 39 |
| Rondure Funds | Privacy Policy |
April 30, 2019 (Unaudited)
| FACTS | WHAT DO THE FUNDS DO WITH YOUR PERSONAL INFORMATION? |
| Why? | Financial companies choose how they share your personal information. Federal law gives consumers the right to limit some but not all sharing. Federal law also requires us to tell you how we collect, share, and protect your personal information. Please read this notice carefully to understand what we do. |
| What? | The types of personal information we collect and share depend on the product or service you have with us. This information can include: ● Social Security number and account transactions ● Account balances and transaction history ● Wire transfer instructions |
| How? | All financial companies need to share customers’ personal information to run their everyday business. In the section below, we list the reasons financial companies can share their customers’ personal information; the reasons the Funds choose to share; and whether you can limit this sharing. |
| Reasons we can share your personal information | Do the Funds share: | Can you limit this sharing? |
| For our everyday business purposes — such as to process your transactions, maintain your account(s), respond to court orders and legal investigations, or report to credit bureaus | Yes | No |
For our marketing purposes — to offer our products and services to you | No | We do not share. |
| For joint marketing with other financial companies | No | We do not share. |
| For our affiliates’ everyday business purposes — information about your transactions and experiences | Yes | No |
| For our affiliates’ everyday business purposes — information about your creditworthiness | No | We do not share. |
| For nonaffiliates to market to you | No | We do not share. |
| 40 | 1.855.775.3337 | www.rondureglobal.com |

Contact Us
| Mail: | Rondure Funds, P.O. Box 13664, Denver, CO 80201 | E-Mail: | rondureglobal@alpsinc.com |
| Phone: | 1.855.775.3337 | Web: | www.rondureglobal.com |
TABLE OF CONTENTS
| Letter to Shareholders | 1 |
| Performance Review | |
| Seafarer Overseas Growth and Income Fund | 5 |
| Seafarer Overseas Value Fund | 12 |
| Disclosure of Fund Expenses | 19 |
| Portfolio of Investments | 21 |
| Statements of Assets and Liabilities | 29 |
| Statements of Operations | 30 |
| Statements of Changes in Net Assets | 32 |
| Financial Highlights | 34 |
| Notes to Financial Statements | 40 |
| Report of Independent Registered Public Accounting Firm | 51 |
| Additional Information | 52 |
| Approval of Fund Advisory Agreement | 53 |
| Trustees and Officers | 56 |
| Privacy Policy | 61 |
Beginning on January 1, 2021, as permitted by regulations adopted by the U.S. Securities and Exchange Commission, paper copies of the Funds’ annual and semi-annual shareholder reports will no longer be sent by mail, unless you specifically request paper copies of the reports. Instead, the reports will be made available on the Funds’ website at www.seafarerfunds.com, and you will be notified by mail each time a report is posted and provided with a website link to access the report.
Beginning on January 1, 2019, you may, notwithstanding the availability of shareholder reports online, elect to receive all future shareholder reports in paper format free of charge. If you invest through a financial intermediary (such as a broker-dealer or bank), you can contact your financial intermediary to request that you continue to receive paper copies of your shareholder reports. If you invest directly with the Funds, you can call 1.855.732.9220 to request that you continue to receive paper copies of your shareholder reports.
If you already elected to receive shareholder reports electronically, you will not be affected by this change and you need not take any action. You may elect to receive shareholder reports and other communications from the Funds electronically anytime by contacting your financial intermediary or, if you are a direct investor, by logging into your Seafarer Funds account at www.seafarerfunds.com and enrolling in electronic delivery.
| Seafarer Funds | Letter to Shareholders |
April 30, 2019
LETTER TO SHAREHOLDERS
May 15, 2019
Dear Fellow Shareholders,
We are pleased to address you on behalf of the Seafarer Funds. This report covers the Funds’ 2018-19 fiscal year (May 1, 2018 to April 30, 2019).
Steady Amid Volatile Market Conditions
The past fiscal year was a volatile one for emerging markets. Buffeted by economic concerns, trade disputes, and a slowdown in corporate earnings, emerging market stocks corrected significantly during the course of the year. Markets have stabilized somewhat in recent months, but substantial uncertainties remain, notably as political and economic tensions between the U.S. and China have begat a so-called “trade war.”
Assets under management contracted at Seafarer Capital Partners, LLC (adviser to the Seafarer Funds) during the year. Though that decline was not without challenges, Seafarer continues to manage its finances and resources with care, and consequently the Adviser was prepared for such volatility. The Firm continues to invest in personnel and resources in order to better serve the Funds. Over the past year, Seafarer implemented new technology for investment research, trading and operations, liquidity management, information security, and digital collaboration. These systems increase our team’s efficiency, while expanding our global research, portfolio construction, risk management, and trading capabilities.
Amid the continued volatility that has characterized emerging markets, we are confident that we have assembled an experienced team at Seafarer that can face the challenges ahead. We remain dedicated to delivering an investment experience to our clients that is founded on long-term performance, low costs, transparent communications, and whenever possible, risk adjusted returns.
We are honored by the trust each shareholder has placed in us, and we will continue to work to earn that trust.
Growth and Income Fund Restructuring
During the fiscal year, Seafarer undertook a restructuring of the Seafarer Overseas Growth and Income Fund, principally by promoting Paul Espinosa and Inbok Song to Lead Portfolio Managers alongside Andrew Foster. Andrew has discussed the rationale for the restructuring in depth in preceding portfolio reviews;1 it was also addressed in a Message to Shareholders dated August 2018.2The principal objective was to better balance the Fund’s portfolio construction, drawing on Paul and Inbok’s specialty skills to add new value-oriented and growth-oriented positions to the Fund.
The shift in the portfolio resulted in turnover that was elevated relative to preceding years: 52% for the fiscal year ended April 30, 2019. Andrew has expressed his satisfaction that the modifications to the Fund’s management structure and portfolio construction have placed the Fund’s strategy on firmer footing, though the merits of the reorganization will only be demonstrated over time. It is important to note that the restructuring did not entail changes to Seafarer’s research process or to the Fund’s investment objectives. Seafarer continues to utilize bottom-up security selection to construct a portfolio that offers a broad balance between prospective growth and current cash flow. The Fund still aims to offer exposure to the growth potential of the emerging markets along with some current income (typically dividends from common stocks), while seeking to mitigate adverse volatility in returns.
Once the restructuring was completed in November 2018, the Growth and Income Fund’s Institutional Class re-opened to new investors. As stated in a Message to Shareholders, Seafarer believes the Fund has additional capacity to accept new assets, and also believes that it is in the best interest of long-term shareholders to restore the balance between subscription and redemption activity.3
| Annual Report – April 30, 2019 | 1 |
| Seafarer Funds | Letter to Shareholders |
April 30, 2019
For those shareholders who have persevered in your investment with the Fund through the portfolio restructuring, we thank you for your patience and trust.
Value Fund Approaches its Three-Year Anniversary
The Seafarer Overseas Value Fund was launched on May 31, 2016 under the management of Paul Espinosa. In the white paperOn Value in the Emerging Markets, Paul posited that the value opportunity in the emerging markets is both large and compelling. He identified seven distinct sources of value in emerging markets that may give rise to viable opportunities for long-term, value-oriented investments.4
The Value Fund aims to exploit certain long-term structural changes in the developing world – changes that we believe will force various companies to realize a portion of the value that is embedded in their balance sheets. The strategy is founded on the premise that some shares have been overlooked because markets favor rapid growth prospects over balance sheet analysis.
As we approach the three-year anniversary of the Value Fund, we note that the market environment of the past three years has been exceptionally favorable to growth stocks and correspondingly difficult for value investors of all types. Nonetheless, we believe Paul has selected unique and compelling value opportunities for the Fund. The Fund’s performance has displayed little correlation with the overall market, reflecting Paul’s distinctive approach to bottom-up stock picking. We look forward to the continued development of the Value Fund.
Emerging Markets Insights
Shortly after Seafarer was founded, Andrew Foster wrote a brief essay on the Firm’s goals.5 In that essay, he noted that our abiding goal as an investment adviser is to deliver superior long-term performance to our clients. However, he also noted three ancillary objectives: to increase the transparency associated with investment in developing countries; to mitigate a portion of the volatility that is inherent to the emerging markets; and to deliver lower costs to our clients, over time and with scale. We continue to work toward these three objectives, and we are pleased to provide an update on progress with respect to the first ancillary goal.
At Seafarer we aim to increase the transparency associated with investment in developing countries by producing high-quality research on the emerging markets and communicating it to our clients with candor and clarity. During the past year, we released two whitepapers:China’s Tech Rush: How the Country’s Strategic Technology Campaign is Shaping Markets6 andThe Evolution of China’s Bond Market.7 We also launched a new blog, Prevailing Winds, which tracks the economic and financial developments shaping China.8 Our investment team shared insights from research trips in “Field Notes” from cities such as Seoul, Tbilisi, São Paulo, Mexico City, and Manila.9 Two other communications are worth noting. In testimony to the U.S.-China Economic and Security Review Commission, Nicholas Borst, Director of China Research, described the array of challenges facing the Chinese economy and the structural reforms that would help China achieve sustainable economic growth.10 And in a video commentary, two members of our trading team discussed how China’s Stock Connect program is changing the way foreign investors access the A-share market.11
Our research team is pursuing several new areas of inquiry that we will share with you in the future. Current research topics include the evolution of the emerging market index and the reform and opening of China’s capital markets. As always, we welcome inquiries from shareholders on these and other topics of interest. Please send your questions and comments tocontact@seafarerfunds.com.
Expansion of Seafarer’s Team
As noted above, Seafarer continues to invest in its personnel. In early 2019, Tommy Held joined the Firm as the Communications Manager. Prior to joining Seafarer, Tommy researched Asian financial and
| 2 | | (855) 732-9220 seafarerfunds.com |
| Seafarer Funds | Letter to Shareholders |
April 30, 2019
economic developments at the Federal Reserve Bank of San Francisco. Previously, he worked as an organizer on political campaigns and taught English for four years in India and China.
We are pleased to welcome Tommy to Seafarer. Tommy works with the investment team to organize and disseminate its market commentaries and Fund-related communications. At Seafarer we don’t employ a large marketing team or a team of writers. We are committed to delivering insights directly from the individuals who manage your money. We believe that we enhance the quality and substance of our communications by facilitating direct reports from our investment personnel to our clients.
Expense Ratios and Economies of Scale
As described in the Letter to Shareholders as of April 30, 2017, Seafarer has committed to reduce expenses for the Funds, particularly as time and scale afford greater efficiency.12
The scale of the Growth and Income Fund declined during the 2018-19 fiscal year, as noted above; this in turn reversed some of the economies of scale that the Fund enjoyed in the prior year. The operating expense ratios for the fiscal year increased to 0.90% and 0.99% for the Institutional and Investor classes, respectively. For reference, the expense ratios were 0.87% and 0.97% for the respective classes during the preceding fiscal year.13
If the Growth and Income Fund’s assets expand in the future, we expect the Fund will realize greater economies of scale for shareholders, and the Fund’s expense ratio will likely decline in accordance with Seafarer’s long-term goals.
Compared to the Growth and Income Fund, the Value Fund’s smaller scale does not yield an equivalent degree of cost efficiency. However, Seafarer has established the same underlying expense structure for both Funds. Should the Value Fund’s assets grow over time, it is expected to achieve similar economies of scale. In the meantime, Seafarer continues to “cap” the Fund’s operating expenses via a contractual commitment, such that its net expense ratios remain 1.05% and 1.15% for the Institutional and Investor classes, respectively, through August 31, 2019.14
Thank you for entrusting us with your capital. We are honored to serve as your investment adviser in the emerging markets.
Sincerely,
| Michelle Foster | Nicholas Borst |
| Chief Executive Officer | Vice President and Director of China Research |
The Funds are subject to investment risks, including possible loss of the principal amount invested and therefore are not suitable for all investors. The Funds may not achieve their objectives. Diversification does not ensure a profit or guarantee against loss.
Information on the Seafarer website is provided for textual reference only, and is not incorporated by reference into this report.
The views and information discussed in this commentary are as of the date of publication, are subject to change, and may not reflect Seafarer’s current views. The views expressed represent an assessment of market conditions at a specific point in time, are opinions only and should not be relied upon as investment advice regarding a particular investment or markets in general. Such information does not constitute a recommendation to buy or sell specific securities or investment vehicles. It should not be assumed that any investment will be profitable or will equal the performance of the portfolios or any securities or any sectors mentioned herein. The subject matter contained herein has been derived from several sources believed to be reliable and accurate at the time of compilation. Seafarer does not accept any liability for losses either direct or consequential caused by the use of this information.
| Annual Report – April 30, 2019 | 3 |
| Seafarer Funds | Letter to Shareholders |
April 30, 2019
| 1 | www.seafarerfunds.com/funds/ogi/portfolio-review/2018/06/Q2#outlook and |
| | www.seafarerfunds.com/funds/ogi/portfolio-review/2018/09/Q3#allocation |
| 2 | www.seafarerfunds.com/message-to-shareholders/2018/08/31/ |
| 3 | www.seafarerfunds.com/message-to-shareholders/2018/11/13/ |
| 4 | www.seafarerfunds.com/commentary/on-value-in-the-emerging-markets/ |
| 5 | www.seafarerfunds.com/ask-seafarer/#what-are-the-firms-goals |
| 6 | www.seafarerfunds.com/commentary/chinas-tech-rush/ |
| 7 | www.seafarerfunds.com/commentary/the-evolution-of-chinas-bond-market/ |
| 8 | www.seafarerfunds.com/prevailing-winds/ |
| 9 | www.seafarerfunds.com/field-notes/ |
| 10 | www.seafarerfunds.com/prevailing-winds/2019/02/china-commission-testimony/ |
| 11 | www.seafarerfunds.com/video/2019/05/chinas-stock-connect/ |
| 12 | www.seafarerfunds.com/letters-to-shareholders/2017/04/annual#cost-reduction |
| 13 | The Growth and Income Fund’s Prospectus (dated August 31, 2018) states that the Fund’s expenses are 0.87% and 0.97% for the Institutional and Investor classes, respectively. |
| 14 | Seafarer Capital Partners, LLC has agreed contractually to waive and/or reimburse fees or expenses in order to limit Total Annual Fund Operating Expenses After Fee Waiver / Expense Reimbursements (inclusive of acquired fund fees and expenses, and exclusive of brokerage expenses, interest expenses, taxes and extraordinary expenses) to 1.15% and 1.05% of each Fund’s average daily net assets for the Investor and Institutional share classes, respectively. This agreement is in effect through August 31, 2019. |
| 4 | | (855) 732-9220 seafarerfunds.com |
| Seafarer Overseas Growth and Income Fund | Performance Review |
April 30, 2019
SEAFARER OVERSEAS GROWTH AND INCOME FUND
PERFORMANCE REVIEW
May 15, 2019
This report addresses the Seafarer Overseas Growth and Income Fund’s 2018-19 fiscal year (May 1, 2018 to April 30, 2019).
During the fiscal year, the Fund returned -4.17%, while the Fund’s benchmark, the MSCI Emerging Markets Total Return Index, declined -4.68%.1 By way of broader comparison, the S&P 500 Index increased 13.49%.
From the Fund’s inception (February 15, 2012) through the end of the fiscal year (April 30, 2019), the Fund generated an annualized rate of return of 5.46%.2 The benchmark index rose at an annualized rate of 3.07% over the same period.
The Fund began the fiscal year with a net asset value (NAV) of $13.14 per share. During the ensuing twelve months, the Fund paid two distributions: $0.114 per share in June 2018 and $0.784 per share in December 2018. Those payments brought the cumulative distribution per share, as measured from the Fund’s inception to the end of the fiscal year, to $2.679. The Fund finished the fiscal year with a value of $11.61 per share.3
* * * * *
During the Fund’s fiscal year ended April 30, 2019, the benchmark index declined approximately 5%, contrary to the preceding two fiscal years which had offered positive returns. The relatively small decline for the full year period belies the tumultuous movement that occurred during the year: between May 1, 2018 (the beginning of the fiscal period) and October 31, 2018 (mid-year), the benchmark fell -16.31%. The index then staged a recovery in the second half of the fiscal period, rising 13.90% between October 31, 2018 and April 30, 2019; this recovery ensured the index cumulatively declined by “only” -4.68% for the entire 12-month period.
The Fund marginally outperformed its benchmark for the fiscal year, but it did not exhibit satisfactory performance during the sell-off that occurred during the first half (the Fund declined -15.12%, versus -16.31% for the index). This dissatisfactory performance, combined with underperformance in the preceding two fiscal years, led us to revise the management structure of the Fund. Paul Espinosa and Inbok Song were promoted from Co-Portfolio Manager positions to Co-Lead Portfolio Manager positions, and each was invited to directly manage a component of the overall portfolio. Each was asked to draw upon specialized skill sets to introduce new positions to the Fund’s portfolio, with the intent to enhance the Fund’s risk-versus-reward potential, while remaining true to its growth and income strategy. Paul was tasked with managing positions with pronounced value characteristics, and Inbok was tasked with managing positions that exhibited elevated growth potential. Their direct contributions to the Fund began in the fourth quarter of 2018, and we believe their efforts will improve the Fund’s ability to achieve its investment objectives over the long term.
Looking at the Fund’s performance, it was boosted by the contribution of several distinct positions with disparate characteristics; in other words, there were no sector or geographical trends that were obviously responsible for the Fund’s modest outperformance.
The primary positive contribution to performance during the fiscal year came from WH Group, one of Paul Espinosa’s recent contributions to the Fund. The company is a meat processor based in China, and it owns the U.S. brand Smithfield Foods. During the first half of the fiscal year, many exogenous events weighed on the market’s perception of the stock’s value: ongoing trade disputes with China; flooding due to Hurricane Florence; African Swine Flu present in China’s swine stock. However, our team believed these events would ultimately prove mostly transitory, and thus we arrived at a different assessment of the company’s value.
| Annual Report – April 30, 2019 | 5 |
| Seafarer Overseas Growth and Income Fund | Performance Review |
April 30, 2019
When WH Group was added to the portfolio in the fall, the Fund was able to acquire shares at an attractive price. In the second half of the fiscal year, the market reassessed its earlier conclusion and bid up the company’s share price to the levels prevalent before the onset of U.S.-China trade frictions. This re-valuation made the stock the top contributor to the Fund, though it was present in the portfolio for only half of the fiscal period.
The second-largest contributor was a long–held position in the Fund, Infosys – a software services company based in India. After many preceding years where pundits had wrung their hands in doubt over the company’s growth prospects and profit margins, the company proved that it could perform admirably. While revenue growth and margins deteriorated marginally (but held up far better than feared), the company’s cash-rich balance sheet allowed it to offer large buybacks and pay dividends that grew substantially faster than earnings over the past five years. As of the end of the fiscal year, the Fund retains a position in the company, but it is smaller now, as the higher stock price now reflects much of the promise we saw in the company when it was first added seven years ago.
Two Chinese A-share positions also made notable contributions to the Fund’s performance, even as both were only added to the Fund by Inbok Song in the latter half of the fiscal year.4
China International Travel Service (CITS) is a duty-free shop operator in China with a dominant market share in its industry. CITS recently reorganized its asset base, including the divestiture of an unprofitable travel agency business and the rationalization of its duty-free shop operations. These developments were discussed in advance with investors, yet the stock market reacted with positive surprise when the company executed the reorganization in a diligent and timely fashion. The company’s operations in the island province of Hainan continue to contribute to earnings, reflecting healthy domestic tourism. We believe that duty-free shop operations offer an attractive way to invest in Chinese tourism. These operations are relatively underdeveloped in China – and we see strong growth potential ahead.
Hengrui is an oncology drug manufacturer in China. In the latter part of 2018, the Chinese government tested a centralized drug procurement system. That system sought a significant industry-wide price cut, which in turn led to a bifurcation between industry leaders and followers. As an industry-leading oncology drug company, Hengrui fared better than other pharmaceutical companies under the new procurement system, leading to impressive results and share price outperformance. Stepping back a bit, one of the reasons why Hengrui delivered this result is its long-standing dedication to the oncology field. Compared to other pharmaceutical companies in China that have tried to adapt their product lines to changing market conditions, Hengrui has been dedicated to oncology from the beginning. Thus, it has deep research and development capabilities with a knowledgeable sales team. We believe that amid increasing competition, the company’s strengths will yield durable advantages. The company recently garnered approval for a new therapy (“PD-1”), and it is now one of the leaders within the advanced immune-oncology drug space in China.
Lastly, performance was also lifted by one of the Fund’s longest-held positions, Odontoprev of Brazil. The company provides dental services, delivering bundled insurance and care to corporate and retail customers alike. Like many Brazilian stocks, Odontoprev’s shares rallied in the second half of the fiscal year because of investors’ perception that the election of a new president in that country might stabilize economic conditions, and even pave the way for better macroeconomic growth. Odontoprev’s performance has not yet borne witness to any major economic improvements – growth has not accelerated discernibly – yet the company’s ability to produce steady margins, cash flow and dividends remains unique; for this reason, it has been in the Fund’s portfolio for seven years.
One long-held position weighed terribly on performance: Sun Pharmaceuticals Advanced Research Company (SPARC) of India. The company is engaged in research and development to produce new chemical entities (i.e. new pharmaceutical therapies), new delivery systems (in order to enhance the efficacy and efficiency of existing drugs), and new consumer medical equipment (notably asthma inhalers). The company spun out of a larger generic pharmaceutical firm many years ago, and it has been a long-standing constituent of the Fund’s exposure to both India and the pharmaceutical
| 6 | | (855) 732-9220 seafarerfunds.com |
| Seafarer Overseas Growth and Income Fund | Performance Review |
April 30, 2019
industry. During that time, it has showed a great deal of promise with respect to some of the products in development.
Yet time and again, the company has made (in our view) dubious operational decisions as to how to advance its products to market, often relying too heavily on its former parent company for production. This in turn has inhibited the company’s ability to break even and produce positive cash flow. This was not an overwhelming problem so long as the company’s primary sponsor – the same individual who was the founder of the larger pharmaceutical parent company – stood ready to recapitalize SPARC from time to time. Yet his heretofore strong reputation has been cast into serious doubt, as the parent company has come under scrutiny after revelations of poor governance; this in turn has jeopardized SPARC’s future, sending the shares lower. The Fund has managed the associated risk by reducing the position size substantially, and it retained only a small residual position as of the end of the fiscal year.
The emerging market asset class was fraught with volatility and risk in the past fiscal year, with no reward. Yet conditions this year have improved, as growth has stabilized at a lower, but more sustainable level, and valuations are generally reasonable, if not outright attractive in some instances. We thank you for your patience amid such circumstances, and we thank you all the more for entrusting us with your capital. We are honored to serve as your investment adviser in the emerging markets.
Andrew Foster, Paul Espinosa, and Inbok Song
Portfolio Managers, Seafarer Overseas Growth and Income Fund
Seafarer Capital Partners, LLC
The MSCI Emerging Markets Total Return Index, Standard (Large+Mid Cap) Core, Gross (dividends reinvested), USD is a free float-adjusted market capitalization index designed to measure equity market performance of emerging markets. Index code: GDUEEGF.
The S&P 500 Total Return Index is a stock market index based on the market capitalizations of 500 large companies with common stock listed on the NYSE or NASDAQ.
It is not possible to invest directly in an index.
The Fund is subject to investment risks, including possible loss of the principal amount invested and therefore is not suitable for all investors. The Fund may not achieve its objectives. Diversification does not ensure a profit or guarantee against loss.
Information on the Seafarer website is provided for textual reference only, and is not incorporated by reference into this report.
The views and information discussed in this commentary are as of the date of publication, are subject to change, and may not reflect Seafarer’s current views. The views expressed represent an assessment of market conditions at a specific point in time, are opinions only and should not be relied upon as investment advice regarding a particular investment or markets in general. Such information does not constitute a recommendation to buy or sell specific securities or investment vehicles. It should not be assumed that any investment will be profitable or will equal the performance of the portfolios or any securities or any sectors mentioned herein. The subject matter contained herein has been derived from several sources believed to be reliable and accurate at the time of compilation. Seafarer does not accept any liability for losses either direct or consequential caused by the use of this information.
As of April 30, 2019, the Fund did not own shares in Smithfield Foods, Inc.
| 1 | References to the “Fund” pertain to the Fund’s Institutional share class (ticker: SIGIX). The Investor share class (ticker: SFGIX) returned -4.36% during the fiscal year. |
| 2 | The Fund’s Investor share class generated an annualized rate of return of 5.33% from the Fund’s inception through the end of the fiscal year. |
| Annual Report – April 30, 2019 | 7 |
| Seafarer Overseas Growth and Income Fund | Performance Review |
April 30, 2019
| 3 | The Fund’s Investor share class began the fiscal year with a net asset value of $13.11 per share. The Fund paid two distributions: $0.112 per share in June 2018 and $0.784 per share in December 2018. The Fund finished the fiscal year with a value of $11.56 per share. |
| 4 | Chinese A-Shares are a class of securitized common stock in Chinese companies, traded exclusively on Chinese stock exchanges (i.e., Shanghai and Shenzhen), and denominated in renminbi, China’s currency. If a Seafarer Fund is invested in Chinese A-Shares, please note the following: 1) any reduction or elimination of access to A-Shares could have a material adverse effect on the ability of the Fund to achieve its investment objective; and 2) uncertainties regarding China’s laws governing taxation of income and gains from investments in A-Shares could result in unexpected tax liabilities for the Fund, which could adversely impact Fund returns. |
| 8 | | (855) 732-9220 seafarerfunds.com |
| Seafarer Overseas Growth and Income Fund | Performance Review |
April 30, 2019
| | | |
| Total Returns | | | | | |
| As of April 30, 2019 | 1 Year | 3 Years | 5 Years | Since Inception
Annualized(1) | Gross Expense
Ratio(2) |
| Investor Class (SFGIX) | -4.36% | 4.74% | 3.45% | 5.33% | 0.97% |
| Institutional Class (SIGIX) | -4.17% | 4.88% | 3.58% | 5.46% | 0.87% |
| MSCI Emerging Markets Total Return Index(3) | -4.68% | 11.66% | 4.42% | 3.07% | |
All performance is in U.S. dollars with gross (pre-tax) dividends and/or distributions reinvested. The performance data quoted represents past performance and does not guarantee future results. Future returns may be lower or higher. The investment return and principal value will fluctuate so that an investor's shares, when redeemed, may be worth more or less than the original cost. Prior to August 31, 2016, shares of the Fund redeemed or exchanged within 90 days of purchase were subject to a 2% redemption fee. Performance does not reflect this fee, which if deducted would reduce an individual's return. To obtain the Fund’s most recent month-end performance, visit seafarerfunds.com or call (855) 732-9220.
| 1 | Inception Date: February 15, 2012. |
| 2 | Ratios as of Prospectus dated August 31, 2018. Seafarer Capital Partners, LLC has agreed contractually to waive and/or reimburse fees or expenses in order to limit Total Annual Fund Operating Expenses After Fee Waiver/Expense Reimbursements (inclusive of acquired fund fees and expenses, and exclusive of brokerage expenses, interest expenses, taxes and extraordinary expenses) to 1.15% and 1.05% of the Fund’s average daily net assets for the Investor and Institutional share classes, respectively. This agreement is in effect through August 31, 2019. |
| 3 | The MSCI Emerging Markets Total Return Index, Standard (Large+Mid Cap) Core, Gross (dividends reinvested), USD is a free float-adjusted market capitalization index designed to measure equity market performance of emerging markets. Index code: GDUEEGF. The index is not actively managed and does not reflect any deductions for fees, expense or taxes. An investor may not invest directly in an index. |
| Annual Report – April 30, 2019 | 9 |
| Seafarer Overseas Growth and Income Fund | Performance Review |
April 30, 2019
Performance of a $10,000 Investment Since Inception
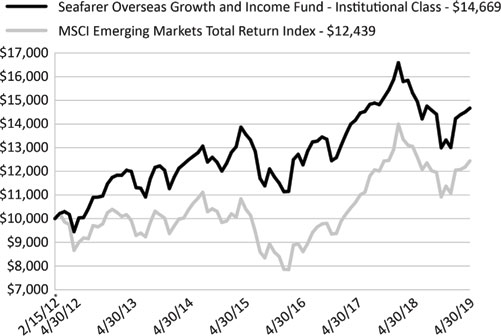
| * | Inception Date: February 15, 2012. |
The chart shown above represents historical performance of a hypothetical investment of $10,000 in the Fund’s Institutional Class shares for the period from inception to April 30, 2019. All returns reflect reinvested dividends and/or distributions, but do not reflect the deduction of taxes that an investor would pay on distributions or redemptions.
The Fund also offers Investor Class shares, performance for which is not reflected in the chart above. The performance of Investor Class shares may be higher or lower than the performance of the Institutional Class shares shown above based upon differences in fees paid by shareholders investing in the Investor Class shares and Institutional Class shares.
Investment Objective
The Fund seeks to provide long-term capital appreciation along with some current income. The Fund seeks to mitigate adverse volatility in returns as a secondary objective.
Strategy
The Fund invests primarily in the securities of companies located in developing countries. The Fund invests in several asset classes including dividend-paying common stocks, preferred stocks, and fixed-income securities.
The Fund seeks to offer investors a relatively stable means of participating in developing countries’ growth prospects, while attempting to mitigate adverse volatility in returns.
| 10 | | (855) 732-9220 seafarerfunds.com |
| Seafarer Overseas Growth and Income Fund | Performance Review |
April 30, 2019
| Portfolio Composition by Region | % Net Assets |
| East & South Asia | 79.9% |
| Emerging Europe | 4.5% |
| Latin America | 7.7% |
| Middle East & Africa | 4.5% |
| Cash & Other Assets, Less Liabilities | 1.4% |
| Government Bond, Short-term - USD and Foreign Currency | 2.0% |
| Total | 100.0% |
| Portfolio Composition by Sector | % Net Assets |
| Communication Services | 3.4% |
| Consumer Discretionary | 20.9% |
| Consumer Staples | 11.0% |
| Energy | 1.4% |
| Financials | 11.9% |
| Health Care | 13.4% |
| Industrials | 6.7% |
| Information Technology | 20.8% |
| Materials | 1.6% |
| Real Estate | 1.5% |
| Utilities | 4.0% |
| Cash & Other Assets, Less Liabilities | 1.4% |
| Government Bond, Short-term - USD and Foreign Currency | 2.0% |
| Total | 100.0% |
| Top 10 Holdings | % Net Assets |
| Hyundai Mobis Co., Ltd. | 4.4% |
| Samsung Electronics Co., Ltd. | 4.3% |
| Venture Corp., Ltd. | 3.8% |
| China Yangtze Power Co., Ltd., Class A | 3.6% |
| Richter Gedeon Nyrt | 3.3% |
| Odontoprev SA | 3.1% |
| Orion Corp. | 3.0% |
| Techtronic Industries Co., Ltd. | 2.7% |
| Taiwan Semiconductor Manufacturing Co., Ltd. | 2.5% |
| China International Travel Service Corp., Ltd., Class A | 2.4% |
| Total | 33.1% |
| | |
| Total Number of Holdings | 541 |
Holdings are subject to change, and may not reflect the current or future position of the portfolio.
Source: ALPS Fund Services, Inc.
| 1 | Excludes short-term government bonds; includes medium- and long-term government bonds. |
| Annual Report – April 30, 2019 | 11 |
| Seafarer Overseas Value Fund | Performance Review |
April 30, 2019
SEAFARER OVERSEAS VALUE FUND
PERFORMANCE REVIEW
May 15, 2019
This report addresses the Seafarer Overseas Value Fund’s 2018-19 fiscal year (May 1, 2018 to April 30, 2019).
During the fiscal year, the Fund returned -1.34%, while the Fund’s benchmark, the MSCI Emerging Markets Total Return Index, declined -4.68%.1 By way of broader comparison, the S&P 500 Index increased 13.49%.
From the Fund’s inception (May 31, 2016) through the end of the fiscal year (April 30, 2019), the Fund generated an annualized rate of return of 7.54%.2 The benchmark index rose at an annualized rate of 13.48% over the same period.
The Fund began the fiscal year with a net asset value (NAV) of $11.96 per share. The Fund paid a distribution of $0.333 per share in December 2018. That payment brought the cumulative distribution per share, as measured from the Fund’s inception to the end of the fiscal year, to $0.870. The Fund finished the fiscal year with a value of $11.43 per share.3
* * * * *
This performance review examines the Value Fund in a markedly different environment than I described six months ago in the Fund’s semi-annual report. After a substantial decline of both the benchmark index and the Fund that extended through the first half of the fiscal year, both have since yielded positive returns in early 2019. Both remain in negative territory for the annual period overall, with the Fund outperforming the benchmark by roughly three percentage points.
While trade and geopolitical developments meaningfully impacted the Fund’s performance in the first half of the fiscal year, the performance of Fund holdings has proven more idiosyncratic in the second half of the year. In other words, stock-specific factors reasserted themselves in determining equity valuations as geopolitical pressures receded concurrent with progress in trade negotiations between the U.S. and China. As I note in the Value Fund’s first quarter 2019 Portfolio Review, total return has most recently been dominated by holdings emblematic of the Value strategy: stocks that lie off the beaten path of the benchmark and generate value for shareholders in ways that extend beyond growth expectations.4
A characteristic Value Strategy holding that proved to be the top contributor to performance in the fiscal year is Qatar Gas Transport (Deleveraging source of value; Seafarer’s seven sources of value,5 hereafter referenced using parenthesized italics, are defined in Figure 1). Qatar Gas Transport is an owner and operator of liquified natural gas (LNG) transport vessels. The company’s share price appreciation this year is uncharacteristic of a security that is essentially a U.S. dollar bond disguised as equity, in the sense that the underlying business is based on shipping contracts with durations exceeding 20 years. There is a growing recognition in the market that Qatar Gas Transport will expand its fleet significantly in the coming years as the country grows its natural gas output. This newfound recognition by the market appears to coincide with news flow surrounding new orders for LNG vessels placed with Korean shipbuilders. While unfortunately the Fund held the position during the surprise announcement in June of 2017 of the embargo on Qatar, it used the associated share price decline to increase its position in the stock on the view that the embargo would not apply to Qatar Gas Transport’s operations, and that the country would substitute natural gas production for the interbank market as a source of U.S. dollars, as explained in the Value Fund’s second quarter 2017 portfolio review.6,7
| 12 | | (855) 732-9220 seafarerfunds.com |
| Seafarer Overseas Value Fund | Performance Review |
April 30, 2019
Figure 1. A Working Definition of Value
Seafarer has identified seven distinct sources of value in emerging markets that may give rise to viable opportunities for long-term, value-oriented investments.
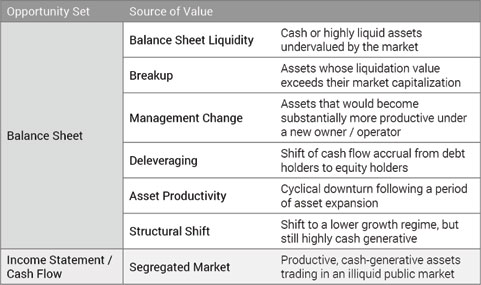
Source: Seafarer
Another characteristic Value Strategy holding that contributed meaningfully to fiscal year performance is Asia Satellite Telecom Holdings (Deleveraging), an owner and operator of satellites for data and communication services. The market is now beginning to recognize what attracted Seafarer to the stock since the inception of the Value Fund – that the balance sheet is on a clear deleveraging path, and that the dividend will continue to rise as the company reduces debt and capital expenditure requirements subside. A unique aspect of the underlying satellite business that I expect will foment further investor interest in the stock is the relative independence of demand for satellite services from fluctuations in gross domestic product (GDP) growth expectations that world economies appear to suffer from these days.
The last notable top contributor to the Fund’s NAV appreciation for the fiscal year is WH Group (Management Change), a Chinese meat processor and owner of U.S.-based Smithfield Foods. I highlighted this stock in the performance review for the first half of the fiscal year as a detractor to the Fund’s NAV.8 The flare-up of the trade dispute between the U.S. and China, Hurricane Florence in the U.S., and African Swine Flu in China conspired to mark-down the market’s assessment of the company’s value. As was the case with Qatar Gas Transport, the Value Fund increased its holding of WH Group at lower prices after taking a different view than the market on the impact of these factors on the company’s value. Fortunately, during the second half of the fiscal year, the market reassessed its earlier conclusion and bid up the share price of WH Group to a pre-trade-dispute level, catapulting the stock into one of the top contributors to the Fund’s NAV for the full fiscal year.
In the case of WH Group, the market eventually realized that African Swine Flu would lead to a shrinkage in the supply of hogs and thus a potentially higher profit margin for the company. Similarly, it took the view that the U.S. and China would resolve the trade dispute successfully. However, what did not change from the first half of the Fund’s fiscal year to the second half is the downward shift in growth expectations for the Chinese economy. This reassessment of the growth potential for Chinese companies in general represents the common denominator among the Value Fund’s top detractors for the year.
Indeed, one of the dominant factors in the Value Fund’s fiscal year performance was the extension of price discovery related to the trade dispute between the U.S. and China – from companies directly impacted by tariffs to companies indirectly affected. Melco International Development (Breakup Value),
| Annual Report – April 30, 2019 | 13 |
| Seafarer Overseas Value Fund | Performance Review |
April 30, 2019
a casino owner and operator, and Shangri-La (Breakup Value), a hotel owner and operator, are companies operating in China that reported incipient signs of earnings growth in recent quarters. In spite of the recent earnings momentum, and the fact that these companies do not have meaningful exports to the U.S. that could be impacted by tariffs, the stock prices of the companies declined during the year on the expectation that earnings growth would decelerate for reasons related to the broader slowdown in the Chinese economy, regardless of the outcome of trade negotiations.
A notable detractor to fiscal year Fund performance is First Pacific (Breakup Value), a conglomerate with assets in the Philippines and Indonesia. This is a case of a stock with a low valuation getting cheaper, in this instance motivated by the announcement of a third mobile operator in the Philippines. While the stock reaction following the news was understandable, the market had long expected a new mobile entrant. The Value Fund deems that the stock price of First Pacific fully captures the historical pressure on subsidiary cash flow that accrues to the parent company and ignores visible signs that point to a partial restoration of said cash flow, though with uncertain timing. Furthermore, management is taking steps to redress an historical misallocation of capital, though again, timing remains elusive.
Thank you for entrusting us with your capital. We are honored to serve as your investment adviser in the emerging markets.
Paul Espinosa
Portfolio Manager, Seafarer Overseas Value Fund
Seafarer Capital Partners, LLC
The MSCI Emerging Markets Total Return Index, Standard (Large+Mid Cap) Core, Gross (dividends reinvested), USD is a free float-adjusted market capitalization index designed to measure equity market performance of emerging markets. Index code: GDUEEGF.
The S&P 500 Total Return Index is a stock market index based on the market capitalizations of 500 large companies with common stock listed on the NYSE or NASDAQ.
It is not possible to invest directly in an index.
The Fund is subject to investment risks, including possible loss of the principal amount invested and therefore is not suitable for all investors. The Fund may not achieve its objectives. Diversification does not ensure a profit or guarantee against loss.
Information on the Seafarer website is provided for textual reference only, and is not incorporated by reference into this report.
The views and information discussed in this commentary are as of the date of publication, are subject to change, and may not reflect Seafarer’s current views. The views expressed represent an assessment of market conditions at a specific point in time, are opinions only and should not be relied upon as investment advice regarding a particular investment or markets in general. Such information does not constitute a recommendation to buy or sell specific securities or investment vehicles. It should not be assumed that any investment will be profitable or will equal the performance of the portfolios or any securities or any sectors mentioned herein. The subject matter contained herein has been derived from several sources believed to be reliable and accurate at the time of compilation. Seafarer does not accept any liability for losses either direct or consequential caused by the use of this information.
As of April 30, 2019, the Fund did not own shares in Smithfield Foods, Inc.
| 1 | References to the “Fund” pertain to the Fund’s Institutional share class (ticker: SIVLX). The Investor share class (ticker: SFVLX) returned -1.50% during the fiscal year. |
| 2 | The Fund’s Investor share class generated an annualized rate of return of 7.41% from the Fund’s inception through the end of the fiscal year. |
| 14 | | (855) 732-9220 seafarerfunds.com |
| Seafarer Overseas Value Fund | Performance Review |
April 30, 2019
| 3 | The Fund’s Investor share class began the fiscal year with a net asset value of $11.95 per share; it paid an annual distribution of $0.326 per share in December 2018; and it finished the fiscal year with a value of $11.41 per share. |
| 4 | This discussion in the Value Fund’s first quarter 2019 portfolio review is available at: www.seafarerfunds.com/funds/ovl/portfolio-review/2019/03/Q1#performance-overview |
| 5 | Additional information on Seafarer’s seven sources of value is available in the white paperOn Value in the Emerging Markets (www.seafarerfunds.com/value-in-em). |
| 6 | An interbank market is a foreign exchange market where banks trade currencies. |
| 7 | This discussion in the Value Fund’s second quarter 2017 portfolio review is available at: www.seafarerfunds.com/funds/ovl/portfolio-review/2017/06/Q2#geopolitical-risk |
| 8 | The Value Fund’s performance review in the Semi-annual Report for the period ended October 31, 2018 is available at: www.seafarerfunds.com/reports/2018/semi-annual |
| Annual Report – April 30, 2019 | 15 |
| Seafarer Overseas Value Fund | Performance Review |
April 30, 2019
| Total Returns | | | |
| As of April 30, 2019 | 1 Year | Since Inception Annualized(1) | Net Expense Ratio(2) |
| Investor Class (SFVLX) | -1.50% | 7.41% | 1.15% |
| Institutional Class (SIVLX) | -1.34% | 7.54% | 1.05% |
| MSCI Emerging Markets Total Return Index(3) | -4.68% | 13.48% | |
Gross expense ratio: 1.92% for Investor Class; 1.75% for Institutional Class.2
| All performance is in U.S. dollars with gross (pre-tax) dividends and/or distributions reinvested. The performance data quoted represents past performance and does not guarantee future results. Future returns may be lower or higher. The investment return and principal value will fluctuate so that an investor's shares, when redeemed, may be worth more or less than the original cost. Prior to August 31, 2016, shares of the Fund redeemed or exchanged within 90 days of purchase were subject to a 2% redemption fee. Performance does not reflect this fee, which if deducted would reduce an individual's return. To obtain the Fund’s most recent month-end performance, visit seafarerfunds.com or call (855) 732-9220. |
| 1 | Inception Date: May 31, 2016. |
| 2 | Ratios as of Prospectus dated August 31, 2018. Seafarer Capital Partners, LLC has agreed contractually to waive and/or reimburse fees or expenses in order to limit Total Annual Fund Operating Expenses After Fee Waiver/Expense Reimbursements (inclusive of acquired fund fees and expenses, and exclusive of brokerage expenses, interest expenses, taxes and extraordinary expenses) to 1.15% and 1.05% of the Fund’s average daily net assets for the Investor and Institutional share classes, respectively. This agreement is in effect through August 31, 2019. |
| 3 | The MSCI Emerging Markets Total Return Index, Standard (Large+Mid Cap) Core, Gross (dividends reinvested), USD is a free float-adjusted market capitalization index designed to measure equity market performance of emerging markets. Index code: GDUEEGF. The index is not actively managed and does not reflect any deductions for fees, expense or taxes. An investor may not invest directly in an index. |
| 16 | | (855) 732-9220 seafarerfunds.com |
| Seafarer Overseas Value Fund | Performance Review |
April 30, 2019
Performance of a $10,000 Investment Since Inception
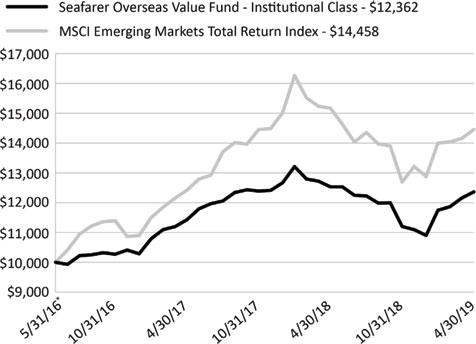
| * | Inception Date: May 31, 2016. |
The chart shown above represents historical performance of a hypothetical investment of $10,000 in the Fund’s Institutional Class shares for the period from inception to April 30, 2019. All returns reflect reinvested dividends and/or distributions, but do not reflect the deduction of taxes that an investor would pay on distributions or redemptions.
The Fund also offers Investor Class shares, performance for which is not reflected in the chart above. The performance of Investor Class shares may be higher or lower than the performance of the Institutional Class shares shown above based upon differences in fees paid by shareholders investing in the Investor Class shares and Institutional Class shares.
Investment Objective
The Fund seeks to provide long-term capital appreciation.
Strategy
The Fund invests primarily in the securities of companies located in developing countries. The Fund invests in several asset classes including common stocks, preferred stocks, and fixed-income securities.
The Fund’s portfolio is comprised of securities identified through a bottom-up security selection process based on fundamental research. The Fund seeks to produce a minimum long-term rate of return by investing in securities priced at a discount to their intrinsic value.
| Annual Report – April 30, 2019 | 17 |
| Seafarer Overseas Value Fund | Performance Review |
April 30, 2019
| Portfolio Composition by Region | % Net Assets |
| East & South Asia | 69.2% |
| Emerging Europe | 9.9% |
| Latin America | 6.9% |
| Middle East & Africa | 8.1% |
| Cash & Other Assets, Less Liabilities | 5.9% |
| Total | 100.0% |
| Portfolio Composition by Sector | % Net Assets |
| Communication Services | 5.2% |
| Consumer Discretionary | 19.1% |
| Consumer Staples | 22.9% |
| Energy | 8.4% |
| Financials | 8.5% |
| Health Care | 3.8% |
| Industrials | 11.2% |
| Information Technology | 4.0% |
| Materials | 6.4% |
| Real Estate | 2.0% |
| Utilities | 2.6% |
| Cash & Other Assets, Less Liabilities | 5.9% |
| Total | 100.0% |
| Top 10 Holdings | % Net Assets |
| WH Group, Ltd. | 6.1% |
| Qatar Gas Transport Co., Ltd. | 4.8% |
| Asia Satellite Telecommunications Holdings, Ltd. | 4.5% |
| Wilmar International, Ltd. | 4.2% |
| Samsung SDI Co., Ltd. | 4.0% |
| Melco International Development, Ltd. | 3.8% |
| Qualicorp Consultoria e Corretora de Seguros SA | 3.8% |
| Xtep International Holdings, Ltd. | 3.8% |
| PetroVietnam Technical Services Corp. | 3.7% |
| China Resources Beer Holdings Co., Ltd. | 3.5% |
| Total | 42.2% |
| | |
| Total Number of Holdings | 33 |
Holdings are subject to change, and may not reflect the current or future position of the portfolio. Source: ALPS Fund Services, Inc.
| 18 | | (855) 732-9220 seafarerfunds.com |
| Seafarer Funds | Disclosure of Fund Expenses |
April 30, 2019 (Unaudited)
DISCLOSURE OF FUND EXPENSES
As a shareholder of a Fund you will incur two types of costs: (1) transaction costs; and (2) ongoing costs, including management fees and other Fund expenses. The following examples are intended to help you understand your ongoing costs (in dollars) of investing in a Fund and to compare these costs with the ongoing costs of investing in other mutual funds. The examples are based on an investment of $1,000 invested on November 1, 2018 and held until April 30, 2019.
Actual Expenses. For each Fund and share class, the first line of the following table provides information about actual account values and actual expenses. You may use the information in this line, together with the amount you invested, to estimate the expenses that you paid over the period. Simply divide your account value by $1,000 (for example, an $8,600 account value divided by $1,000 = 8.6), then multiply the result by the number in the first line under the heading “Expenses Paid During Period” to estimate the expenses you paid on your account during this period.
Hypothetical Example for Comparison Purposes. For each Fund and share class, the second line of the following table provides information about hypothetical account values and hypothetical expenses based on the Fund’s actual expense ratio and an assumed rate of return of 5% per year before expenses, which is not the Fund’s actual return. The hypothetical account values and expenses may not be used to estimate the actual ending account balance or expenses you paid for the period. You may use this information to compare the ongoing costs of investing in the Fund and other mutual funds. To do so, compare this 5% hypothetical example with the 5% hypothetical examples that appear in the shareholder reports of the other mutual funds.
Please note the expenses shown in the following table are meant to highlight your ongoing costs only and do not reflect transaction costs. Therefore, for each Fund and share class, the second line of the following table is useful in comparing ongoing costs only, and will not help you determine the relative total costs of owning different funds. In addition, if these transactional costs were included, your costs would have been higher.
| Annual Report – April 30, 2019 | 19 |
| Seafarer Funds | Disclosure of Fund Expenses |
April 30, 2019 (Unaudited)
| | Beginning Account Value 11/01/18 | Ending Account Value 04/30/19 | Expense Ratio(a) | Expenses Paid During Period 11/01/18 - 04/30/19(b) |
| | | | | |
| SEAFARER OVERSEAS GROWTH AND INCOME FUND | | |
| Investor Class | | | | |
| Actual | $1,000.00 | $1,127.50 | 1.01% | $5.33 |
| Hypothetical (5% return before expenses) | $1,000.00 | $1,019.79 | 1.01% | $5.06 |
| | | | | |
| Institutional Class | | | |
| Actual | $1,000.00 | $1,129.00 | 0.91% | $4.80 |
| Hypothetical (5% return before expenses) | $1,000.00 | $1,020.28 | 0.91% | $4.56 |
| | | | | |
| SEAFARER OVERSEAS VALUE FUND | | | |
| Investor Class | | | | |
| Actual | $1,000.00 | $1,102.20 | 1.15% | $5.99 |
| Hypothetical (5% return before expenses) | $1,000.00 | $1,019.09 | 1.15% | $5.76 |
| | | | | |
| Institutional Class | | | |
| Actual | $1,000.00 | $1,103.80 | 1.05% | $5.48 |
| Hypothetical (5% return before expenses) | $1,000.00 | $1,019.59 | 1.05% | $5.26 |
| (a) | Annualized, based on the Fund's most recent fiscal half year expenses. |
| (b) | Expenses are equal to the Fund’s annualized expense ratio multiplied by the average account value over the period, multiplied by the number of days in the most recent fiscal half-year (181)/365 (to reflect the half-year period). |
| 20 | (855) 732-9220 seafarerfunds.com |
| Seafarer Overseas Growth and Income Fund | Portfolio of Investments |
April 30, 2019
| | | Currency | | | Shares | | | Value | |
| COMMON STOCKS (92.4%) | | | | | | | | | | | | |
| Brazil (4.7%) | | | | | | | | | | | | |
| Odontoprev SA | | | BRL | | | | 11,000,000 | | | $ | 47,241,845 | |
| Qualicorp Consultoria e Corretora de Seguros SA | | | BRL | | | | 5,600,000 | | | | 24,550,254 | |
| | | | | | | | | | | | | |
| Total Brazil | | | | | | | | | | | 71,792,099 | |
| | | | | | | | | | | | | |
| China / Hong Kong (34.5%) | | | | | | | | | | | | |
| China Yangtze Power Co., Ltd., Class A | | | CNY | | | | 22,000,000 | | | | 55,131,021 | |
| Techtronic Industries Co., Ltd. | | | HKD | | | | 5,700,500 | | | | 41,251,665 | |
| China International Travel Service Corp., Ltd., Class A | | | CNY | | | | 3,170,905 | | | | 36,523,466 | |
| WH Group, Ltd. | | | HKD | | | | 28,100,000 | | | | 33,248,313 | |
| Shenzhou International Group Holdings, Ltd. | | | HKD | | | | 2,260,500 | | | | 30,382,989 | |
| Jiangsu Hengrui Medicine Co., Ltd., Class A | | | CNY | | | | 3,068,318 | | | | 29,979,546 | |
| Alibaba Group Holding, Ltd., Sponsored ADR(a) | | | USD | | | | 142,193 | | | | 26,386,755 | |
| Foshan Haitian Flavouring & Food Co., Ltd., Class A(a) | | | CNY | | | | 1,898,016 | | | | 25,169,617 | |
| Shangri-La Asia, Ltd. | | | HKD | | | | 17,600,000 | | | | 24,953,001 | |
| Greatview Aseptic Packaging Co., Ltd. | | | HKD | | | | 40,357,000 | | | | 24,574,588 | |
| First Pacific Co., Ltd. | | | HKD | | | | 57,000,000 | | | | 23,640,206 | |
| Hang Lung Properties, Ltd. | | | HKD | | | | 9,610,000 | | | | 22,619,312 | |
| China Foods, Ltd. | | | HKD | | | | 56,574,000 | | | | 22,177,790 | |
| Texwinca Holdings, Ltd. | | | HKD | | | | 54,984,000 | | | | 21,867,999 | |
| Xinhua Winshare Publishing and Media Co., Ltd., Class H | | | HKD | | | | 27,500,000 | | | | 21,124,051 | |
| Pacific Basin Shipping, Ltd. | | | HKD | | | | 98,000,000 | | | | 20,135,235 | |
| Pico Far East Holdings, Ltd. | | | HKD | | | | 52,296,000 | | | | 19,132,358 | |
| China Resources Beer Holdings Co., Ltd. | | | HKD | | | | 3,900,000 | | | | 17,844,235 | |
| Xtep International Holdings, Ltd. | | | HKD | | | | 31,087,000 | | | | 17,723,572 | |
| Hangzhou Hikvision Digital Technology Co., Ltd., Class A | | | CNY | | | | 3,226,605 | | | | 15,691,979 | |
| | | | | | | | | | | | | |
| Total China / Hong Kong | | | | | | | | | | | 529,557,698 | |
| | | | | | | | | | | | | |
| Czech Republic (1.2%) | | | | | | | | | | | | |
| Moneta Money Bank AS | | | CZK | | | | 5,507,984 | | | | 17,654,806 | |
| | | | | | | | | | | | | |
| Total Czech Republic | | | | | | | | | | | 17,654,806 | |
| | | | | | | | | | | | | |
| Hungary (3.3%) | | | | | | | | | | | | |
| Richter Gedeon Nyrt | | | HUF | | | | 2,565,000 | | | | 50,894,058 | |
| | | | | | | | | | | | | |
| Total Hungary | | | | | | | | | | | 50,894,058 | |
| | | | | | | | | | | | | |
| India (3.2%) | | | | | | | | | | | | |
| Container Corp. Of India, Ltd. | | | INR | | | | 3,281,845 | | | | 23,262,663 | |
| Infosys, Ltd., Sponsored ADR | | | USD | | | | 1,750,000 | | | | 18,830,000 | |
| Annual Report – April 30, 2019 | | | 21 |
| Seafarer Overseas Growth and Income Fund | Portfolio of Investments |
April 30, 2019
| | | Currency | | | Shares | | | Value | |
| India (continued) | | | | | | | | | | | | |
| Sun Pharma Advanced Research Co., Ltd.(a) | | | INR | | | | 3,129,779 | | | $ | 7,575,120 | |
| | | | | | | | | | | | | |
| Total India | | | | | | | | | | | 49,667,783 | |
| | | | | | | | | | | | | |
| Indonesia (1.4%) | | | | | | | | | | | | |
| Bank Rakyat Indonesia Persero Tbk PT | | | IDR | | | | 70,480,000 | | | | 21,669,455 | |
| | | | | | | | | | | | | |
| Total Indonesia | | | | | | | | | | | 21,669,455 | |
| | | | | | | | | | | | | |
| Malaysia (1.3%) | | | | | | | | | | | | |
| Inari Amertron Bhd | | | MYR | | | | 47,909,600 | | | | 20,071,915 | |
| | | | | | | | | | | | | |
| Total Malaysia | | | | | | | | | | | 20,071,915 | |
| | | | | | | | | | | | | |
| Mexico (3.0%) | | | | | | | | | | | | |
| Bolsa Mexicana de Valores SAB de CV | | | MXN | | | | 15,250,000 | | | | 31,388,482 | |
| Credito Real SAB de CV SOFOM ER | | | MXN | | | | 13,290,238 | | | | 15,352,888 | |
| | | | | | | | | | | | | |
| Total Mexico | | | | | | | | | | | 46,741,370 | |
| | | | | | | | | | | | | |
| Philippines (1.6%) | | | | | | | | | | | | |
| Ayala Corp. | | | PHP | | | | 1,388,885 | | | | 24,091,413 | |
| | | | | | | | | | | | | |
| Total Philippines | | | | | | | | | | | 24,091,413 | |
| | | | | | | | | | | | | |
| Qatar (1.4%) | | | | | | | | | | | | |
| Qatar Gas Transport Co., Ltd. | | | QAR | | | | 3,761,395 | | | | 22,111,714 | |
| | | | | | | | | | | | | |
| Total Qatar | | | | | | | | | | | 22,111,714 | |
| | | | | | | | | | | | | |
| Singapore (6.6%) | | | | | | | | | | | | |
| Venture Corp., Ltd. | | | SGD | | | | 4,700,000 | | | | 58,943,484 | |
| Wilmar International, Ltd. | | | SGD | | | | 8,800,000 | | | | 23,534,562 | |
| SIA Engineering Co., Ltd. | | | SGD | | | | 10,244,500 | | | | 18,844,879 | |
| | | | | | | | | | | | | |
| Total Singapore | | | | | | | | | | | 101,322,925 | |
| | | | | | | | | | | | | |
| South Africa (2.2%) | | | | | | | | | | | | |
| Sanlam, Ltd. | | | ZAR | | | | 6,250,000 | | | | 33,466,153 | |
| | | | | | | | | | | | | |
| Total South Africa | | | | | | | | | | | 33,466,153 | |
| | | | | | | | | | | | | |
| South Korea (18.5%) | | | | | | | | | | | | |
| Hyundai Mobis Co., Ltd. | | | KRW | | | | 335,000 | | | | 66,824,221 | |
| Orion Corp./Republic of Korea | | | KRW | | | | 563,980 | | | | 46,786,506 | |
| 22 | (855) 732-9220 seafarerfunds.com |
| Seafarer Overseas Growth and Income Fund | Portfolio of Investments |
April 30, 2019
| | | Currency | | | Shares | | | Value | |
| South Korea (continued) | | | | | | | | | | | | |
| Woongjin Coway Co., Ltd. | | | KRW | | | | 460,000 | | | $ | 34,574,327 | |
| NAVER Corp. | | | KRW | | | | 330,000 | | | | 33,796,137 | |
| Samsung SDI Co., Ltd. | | | KRW | | | | 128,000 | | | | 25,989,899 | |
| Koh Young Technology, Inc. | | | KRW | | | | 310,625 | | | | 25,715,046 | |
| Dentium Co., Ltd. | | | KRW | | | | 358,598 | | | | 21,944,794 | |
| Sindoh Co., Ltd. | | | KRW | | | | 420,000 | | | | 18,042,872 | |
| LEENO Industrial, Inc. | | | KRW | | | | 215,070 | | | | 10,532,504 | |
| | | | | | | | | | | | | |
| Total South Korea | | | | | | | | | | | 284,206,306 | |
| | | | | | | | | | | | | |
| Taiwan (5.7%) | | | | | | | | | | | | |
| Taiwan Semiconductor Manufacturing Co., Ltd. | | | TWD | | | | 4,500,000 | | | | 37,782,145 | |
| Voltronic Power Technology Corp. | | | TWD | | | | 1,384,500 | | | | 27,330,669 | |
| ASPEED Technology, Inc. | | | TWD | | | | 1,085,500 | | | | 22,604,822 | |
| | | | | | | | | | | | | |
| Total Taiwan | | | | | | | | | | | 87,717,636 | |
| | | | | | | | | | | | | |
| Thailand (1.5%) | | | | | | | | | | | | |
| Bangkok Dusit Medical Services PCL, Class F | | | THB | | | | 29,510,000 | | | | 23,578,561 | |
| | | | | | | | | | | | | |
| Total Thailand | | | | | | | | | | | 23,578,561 | |
| | | | | | | | | | | | | |
| United Arab Emirates (0.9%) | | | | | | | | | | | | |
| National Central Cooling Co. PJSC | | | AED | | | | 32,609,233 | | | | 14,208,691 | |
| | | | | | | | | | | | | |
| Total United Arab Emirates | | | | | | | | | | | 14,208,691 | |
| | | | | | | | | | | | | |
| Vietnam (1.4%) | | | | | | | | | | | | |
| Bao Viet Holdings | | | VND | | | | 4,206,880 | | | | 16,088,748 | |
| PetroVietnam Gas JSC | | | VND | | | | 1,200,060 | | | | 5,857,570 | |
| | | | | | | | | | | | | |
| Total Vietnam | | | | | | | | | | | 21,946,318 | |
| | | | | | | | | | | | | |
| TOTAL COMMON STOCKS | | | | | | | | | | | | |
| (Cost $1,402,084,674) | | | | | | | | | | | 1,420,698,901 | |
| | | | | | | | | | | | | |
| PREFERRED STOCKS (4.3%) | | | | | | | | | | | | |
| South Korea (4.3%) | | | | | | | | | | | | |
| Samsung Electronics Co., Ltd. | | | KRW | | | | 2,050,000 | | | | 65,397,499 | |
| | | | | | | | | | | | | |
| Total South Korea | | | | | | | | | | | 65,397,499 | |
| | | | | | | | | | | | | |
| TOTAL PREFERRED STOCKS | | | | | | | | | | | | |
| (Cost $45,921,617) | | | | | | | | | | | 65,397,499 | |
| Annual Report – April 30, 2019 | 23 |
| Seafarer Overseas Growth and Income Fund | Portfolio of Investments |
April 30, 2019
| | | Currency | | | Rate | | | Maturity Date | | Principal Amount | | | Value | |
| GOVERNMENT BOND, SHORT-TERM - USD AND FOREIGN CURRENCY (1.9%) | | | | | |
| Colombia (0.3%) | | | | | | | | | | | | | | | | | | |
| Colombia Government International Bond | | | USD | | | | 11.75 | % | | 02/25/20 | | | 4,000,000 | | | $ | 4,304,040 | |
| | | | | | | | | | | | | | | | | | | |
| Total Colombia | | | | | | | | | | | | | | | | | 4,304,040 | |
| | | | | | | | | | | | | | | | | | | |
| India (0.1%) | | | | | | | | | | | | | | | | | | |
| Export-Import Bank of India | | | USD | | | | 2.75 | % | | 08/12/20 | | | 1,500,000 | | | | 1,493,207 | |
| | | | | | | | | | | | | | | | | | | |
| Total India | | | | | | | | | | | | | | | | | 1,493,207 | |
| | | | | | | | | | | | | | | | | | | |
| Latvia (0.2%) | | | | | | | | | | | | | | | | | | |
| Republic of Latvia Government International Bond, Series REGS | | | USD | | | | 2.75 | % | | 01/12/20 | | | 4,000,000 | | | | 3,999,040 | |
| | | | | | | | | | | | | | | | | | | |
| Total Latvia | | | | | | | | | | | | | | | | | 3,999,040 | |
| | | | | | | | | | | | | | | | | | | |
| Lithuania (0.3%) | | | | | | | | | | | | | | | | | | |
| Lithuania Government International Bond, Series REGS | | | USD | | | | 7.38 | % | | 02/11/20 | | | 4,000,000 | | | | 4,143,328 | |
| | | | | | | | | | | | | | | | | | | |
| Total Lithuania | | | | | | | | | | | | | | | | | 4,143,328 | |
| | | | | | | | | | | | | | | | | | | |
| Poland (0.3%) | | | | | | | | | | | | | | | | | | |
| Republic of Poland Government International Bond | | | USD | | | | 6.38 | % | | 07/15/19 | | | 4,000,000 | | | | 4,032,880 | |
| | | | | | | | | | | | | | | | | | | |
| Total Poland | | | | | | | | | | | | | | | | | 4,032,880 | |
| | | | | | | | | | | | | | | | | | | |
| South Africa (0.2%) | | | | | | | | | | | | | | | | | | |
| Republic of South Africa Government International Bond | | | USD | | | | 6.88 | % | | 05/27/19 | | | 4,000,000 | | | | 4,013,880 | |
| | | | | | | | | | | | | | | | | | | |
| Total South Africa | | | | | | | | | | | | | | | | | 4,013,880 | |
| | | | | | | | | | | | | | | | | | | |
| South Korea (0.5%) | | | | | | | | | | | | | | | | | | |
| The Korea Development Bank | | | USD | | | | 1.38 | % | | 09/12/19 | | | 4,000,000 | | | | 3,982,382 | |
| 24 | (855) 732-9220 seafarerfunds.com |
| Seafarer Overseas Growth and Income Fund | Portfolio of Investments |
April 30, 2019
| | | Currency | | | Rate | | | Maturity Date | | Principal Amount | | | Value | |
| South Korea (continued) | | | | | | | | | | | | | | | | | | |
| Korea Development Bank | | | USD | | | | 2.25 | % | | 05/18/20 | | | 4,000,000 | | | $ | 3,983,204 | |
| | | | | | | | | | | | | | | | | | | |
| Total South Korea | | | | | | | | | | | | | | | | | 7,965,586 | |
| | | | | | | | | | | | | | | | | | | |
| TOTAL GOVERNMENT BOND, SHORT-TERM -USD AND FOREIGN CURRENCY | | | | | | | | | |
| (Cost $29,959,876) | | | | | | | | | | | | | | | | | 29,951,961 | |
| | | | | | | | | | | | | | | | | | | |
| TOTAL INVESTMENTS | | | | | | | | | | | | | | | | | | |
| (Cost $1,477,966,167) (98.6%) | | | | | | | | | | | | | | | | $ | 1,516,048,361 | |
| | | | | | | | | | | | | | | | | | | |
| Cash and Other Assets, Less Liabilities (1.4%) | | | | | | | | | | | | | | | | | 21,514,654 | |
| NET ASSETS (100.0%) | | | | | | | | | | | | | | | | $ | 1,537,563,015 | |
Principal Amount is stated in local currency unless otherwise noted.
| (a) | Non-income producing security. |
| Currency Abbreviations |
| AED | - | United Arab Emirates Dirham |
| BRL | - | Brazil Real |
| CNY | - | China Yuan |
| CZK | - | Czech Koruna |
| HKD | - | Hong Kong Dollar |
| HUF | - | Hungary Forint |
| IDR | - | Indonesia Rupiah |
| INR | - | India Rupee |
| KRW | - | South Korea Won |
| MXN | - | Mexico Peso |
| MYR | - | Malaysia Ringgit |
| PHP | - | Philippine Peso |
| QAR | - | Qatar Riyal |
| SGD | - | Singapore Dollar |
| THB | - | Thailand Baht |
| TWD | - | Taiwan New Dollar |
| USD | - | United States Dollar |
| VND | - | Vietnam Dong |
| ZAR | - | South Africa Rand |
For Fund compliance purposes, the Fund's geographical classifications refer to any one or more of the sub-classifications used by one or more widely recognized market indexes or ratings group indexes, and/or as defined by Fund management. This definition may not apply for purposes of this report, which may combine sub-classifications for reporting ease. Geographical regions are shown as a percentage of net assets.
See accompanying Notes to Financial Statements.
| Annual Report – April 30, 2019 | 25 |
| Seafarer Overseas Value Fund | Portfolio of Investments |
April 30, 2019
| | | Currency | | | Shares | | | Value | |
| COMMON STOCKS (94.1%) | | | | | | | | | | | | |
| Brazil (3.8%) | | | | | | | | | | | | |
| Qualicorp Consultoria e Corretora de Seguros SA | | | BRL | | | | 251,000 | | | $ | 1,100,377 | |
| | | | | | | | | | | | | |
| Total Brazil | | | | | | | | | | | 1,100,377 | |
| | | | | | | | | | | | | |
| China / Hong Kong (45.5%) | | | | | | | | | | | | |
| WH Group, Ltd. | | | HKD | | | | 1,498,000 | | | | 1,772,454 | |
| Asia Satellite Telecommunications Holdings, Ltd. | | | HKD | | | | 1,540,000 | | | | 1,311,340 | |
| Melco International Development, Ltd. | | | HKD | | | | 455,000 | | | | 1,118,075 | |
| Xtep International Holdings, Ltd. | | | HKD | | | | 1,924,000 | | | | 1,096,927 | |
| China Resources Beer Holdings Co., Ltd. | | | HKD | | | | 224,000 | | | | 1,024,900 | |
| First Pacific Co., Ltd. | | | HKD | | | | 2,430,000 | | | | 1,007,819 | |
| AMVIG Holdings, Ltd. | | | HKD | | | | 3,754,000 | | | | 909,213 | |
| Shangri-La Asia, Ltd. | | | HKD | | | | 626,000 | | | | 887,533 | |
| China Yangtze Power Co., Ltd., Class A | | | CNY | | | | 301,990 | | | | 756,774 | |
| China Foods, Ltd. | | | HKD | | | | 1,920,000 | | | | 752,667 | |
| Texwinca Holdings, Ltd. | | | HKD | | | | 1,470,000 | | | | 584,642 | |
| Hang Lung Properties, Ltd. | | | HKD | | | | 247,000 | | | | 581,370 | |
| Pacific Basin Shipping, Ltd. | | | HKD | | | | 2,599,000 | | | | 533,995 | |
| Giordano International, Ltd. | | | HKD | | | | 958,000 | | | | 455,829 | |
| Greatview Aseptic Packaging Co., Ltd. | | | HKD | | | | 520,000 | | | | 316,644 | |
| Pico Far East Holdings, Ltd. | | | HKD | | | | 538,000 | | | | 196,826 | |
| | | | | | | | | | | | | |
| Total China / Hong Kong | | | | | | | | | | | 13,307,008 | |
| | | | | | | | | | | | | |
| Czech Republic (5.7%) | | | | | | | | | | | | |
| PFNonwovens SA(a) | | | CZK | | | | 19,000 | | | | 627,829 | |
| Moneta Money Bank AS | | | CZK | | | | 172,914 | | | | 554,243 | |
| Philip Morris CR AS | | | CZK | | | | 800 | | | | 480,248 | |
| | | | | | | | | | | | | |
| Total Czech Republic | | | | | | | | | | | 1,662,320 | |
| | | | | | | | | | | | | |
| Mexico (3.1%) | | | | | | | | | | | | |
| Credito Real SAB de CV SOFOM ER | | | MXN | | | | 789,609 | | | | 912,157 | |
| | | | | | | | | | | | | |
| Total Mexico | | | | | | | | | | | 912,157 | |
| | | | | | | | | | | | | |
| Philippines (2.3%) | | | | | | | | | | | | |
| Del Monte Pacific, Ltd.(a) | | | SGD | | | | 6,600,000 | | | | 659,951 | |
| | | | | | | | | | | | | |
| Total Philippines | | | | | | | | | | | 659,951 | |
| 26 | (855) 732-9220 seafarerfunds.com |
| Seafarer Overseas Value Fund | Portfolio of Investments |
April 30, 2019
| | | Currency | | | Shares | | | Value | |
| Qatar (4.8%) | | | | | | | | | |
| Qatar Gas Transport Co., Ltd. | | | QAR | | | | 237,000 | | | $ | 1,393,227 | |
| | | | | | | | | | | | | |
| Total Qatar | | | | | | | | | | | 1,393,227 | |
| | | | | | | | | | | | | |
| Russia (4.3%) | | | | | | | | | | | | |
| Cherkizovo Group PJSC | | | RUB | | | | 30,000 | | | | 765,124 | |
| Global Ports Investments PLC, GDR(a) | | | USD | | | | 197,000 | | | | 476,740 | |
| | | | | | | | | | | | | |
| Total Russia | | | | | | | | | | | 1,241,864 | |
| | | | | | | | | | | | | |
| Singapore (11.3%) | | | | | | | | | | | | |
| Wilmar International, Ltd. | | | SGD | | | | 456,000 | | | | 1,219,518 | |
| Genting Singapore, Ltd. | | | SGD | | | | 1,119,000 | | | | 811,407 | |
| HRnetgroup, Ltd. | | | SGD | | | | 1,350,000 | | | | 779,528 | |
| SIA Engineering Co., Ltd. | | | SGD | | | | 273,000 | | | | 502,187 | |
| | | | | | | | | | | | | |
| Total Singapore | | | | | | | | | | | 3,312,640 | |
| | | | | | | | | | | | | |
| South Korea (4.0%) | | | | | | | | | | | | |
| Samsung SDI Co., Ltd. | | | KRW | | | | 5,800 | | | | 1,177,667 | |
| | | | | | | | | | | | | |
| Total South Korea | | | | | | | | | | | 1,177,667 | |
| | | | | | | | | | | | | |
| United Arab Emirates (3.4%) | | | | | | | | | | | | |
| National Central Cooling Co. PJSC | | | AED | | | | 2,252,000 | | | | 981,255 | |
| | | | | | | | | | | | | |
| Total United Arab Emirates | | | | | | | | | | | 981,255 | |
| | | | | | | | | | | | | |
| Vietnam (5.9%) | | | | | | | | | | | | |
| PetroVietnam Technical Services Corp. | | | VND | | | | 1,063,780 | | | | 1,068,618 | |
| Petrovietnam Fertilizer & Chemicals JSC | | | VND | | | | 842,000 | | | | 651,619 | |
| | | | | | | | | | | | | |
| Total Vietnam | | | | | | | | | | | 1,720,237 | |
| | | | | | | | | | | | | |
| TOTAL COMMON STOCKS | | | | | | | | | | | | |
| (Cost $27,396,737) | | | | | | | | | | | 27,468,703 | |
| | | | | | | | | | | | | |
| TOTAL INVESTMENTS | | | | | | | | | | | | |
| (Cost $27,396,737) (94.1%) | | | | | | | | | | $ | 27,468,703 | |
| | | | | | | | | | | | | |
| Cash and Other Assets, Less Liabilities (5.9%) | | | | | | | | | | | 1,707,381 | |
| NET ASSETS (100.0%) | | | | | | | | | | $ | 29,176,084 | |
| (a) | Non-income producing security. |
| Annual Report – April 30, 2019 | 27 |
| Seafarer Overseas Value Fund | Portfolio of Investments |
April 30, 2019
| Currency Abbreviations |
| AED | - | United Arab Emirates Dirham |
| BRL | - | Brazil Real |
| CNY | - | China Yuan |
| CZK | - | Czech Koruna |
| HKD | - | Hong Kong Dollar |
| KRW | - | South Korea Won |
| MXN | - | Mexico Peso |
| QAR | - | Qatar Riyal |
| RUB | - | Russia Ruble |
| SGD | - | Singapore Dollar |
| USD | - | United States Dollar |
| VND | - | Vietnam Dong |
For Fund compliance purposes, the Fund's geographical classifications refer to any one or more of the sub-classifications used by one or more widely recognized market indexes or ratings group indexes, and/or as defined by Fund management. This definition may not apply for purposes of this report, which may combine sub-classifications for reporting ease. Geographical regions are shown as a percentage of net assets.
See accompanying Notes to Financial Statements.
| 28 | (855) 732-9220 seafarerfunds.com |
| Seafarer Funds | Statements of Assets and Liabilities |
April 30, 2019
| | | Seafarer Overseas Growth and Income Fund | | | Seafarer Overseas Value Fund | |
| ASSETS: | | | | | | |
| Investments, at value | | $ | 1,516,048,361 | | | $ | 27,468,703 | |
| Cash | | | 17,800,250 | | | | 1,626,840 | |
| Foreign currency, at value (Cost $2,377,096 and $28,473) | | | 2,368,474 | | | | 28,373 | |
| Receivable for investments sold | | | 991,671 | | | | – | |
| Receivable for shares sold | | | 1,278,983 | | | | 100 | |
| Interest and dividends receivable | | | 4,051,080 | | | | 142,216 | |
| Prepaid expenses and other assets | | | 21,903 | | | | 95 | |
| Total Assets | | | 1,542,560,722 | | | | 29,266,327 | |
| LIABILITIES: | | | | | | | | |
| Payable for investments purchased | | | 1,012,900 | | | | 29,338 | |
| Administrative fees payable | | | 85,042 | | | | 7,352 | |
| Shareholder service plan fees payable | | | 190,057 | | | | 3,229 | |
| Payable for shares redeemed | | | 2,369,414 | | | | – | |
| Investment advisory fees payable | | | 951,089 | | | | 2,778 | |
| Payable for chief compliance officer fees | | | 3,759 | | | | 3,759 | |
| Trustee fees and expenses payable | | | 27,507 | | | | 508 | |
| Payable for principal financial officer fees | | | 833 | | | | 833 | |
| Audit and tax fees payable | | | 25,129 | | | | 20,665 | |
| Accrued expenses and other liabilities | | | 331,977 | | | | 21,781 | |
| Total Liabilities | | | 4,997,707 | | | | 90,243 | |
| NET ASSETS | | $ | 1,537,563,015 | | | $ | 29,176,084 | |
| NET ASSETS CONSIST OF: | | | | | | | | |
| Paid-in capital (Note 5) | | $ | 1,555,737,528 | | | $ | 29,320,728 | |
| Total distributable earnings | | | (18,174,513 | ) | | | (144,644 | ) |
| NET ASSETS | | $ | 1,537,563,015 | | | $ | 29,176,084 | |
| INVESTMENTS, AT COST | | $ | 1,477,966,167 | | | $ | 27,396,737 | |
| PRICING OF SHARES | | | | | | | | |
| Investor Class: | | | | | | | | |
| Net Asset Value, offering and redemption price per share | | $ | 11.56 | | | $ | 11.41 | |
| Net Assets | | $ | 233,072,005 | | | $ | 326,758 | |
| Shares of beneficial interest outstanding | | | 20,163,090 | | | | 28,626 | |
| Institutional Class: | | | | | | | | |
| Net Asset Value, offering and redemption price per share | | $ | 11.61 | | | $ | 11.43 | |
| Net Assets | | $ | 1,304,491,010 | | | $ | 28,849,326 | |
| Shares of beneficial interest outstanding | | | 112,374,647 | | | | 2,524,748 | |
See accompanying Notes to Financial Statements.
| Annual Report – April 30, 2019 | 29 |
| Seafarer Funds | Statements of Operations |
Year Ended April 30, 2019
| | | Seafarer Overseas Growth and Income Fund | | | Seafarer Overseas Value Fund | |
| INVESTMENT INCOME: | | | | | | | | |
| Dividends | | $ | 70,457,879 | | | $ | 1,006,609 | |
| Foreign taxes withheld | | | (6,743,189 | ) | | | (34,426 | ) |
| Interest and other income | | | 4,258,793 | | | | 36,664 | |
| Total investment income | | | 67,973,483 | | | | 1,008,847 | |
| | | | | | | | | |
| EXPENSES: | | | | | | | | |
| Investment advisory fees (Note 6) | | | 14,496,465 | | | | 201,653 | |
| Administrative and transfer agency fees | | | 630,009 | | | | 54,135 | |
| Trustee fees and expenses | | | 60,573 | | | | 991 | |
| Registration/filing fees | | | 48,865 | | | | 32,958 | |
| Shareholder service plan fees | | | | | | | | |
| Investor Class | | | 520,588 | | | | – | |
| Institutional Class | | | 742,724 | | | | 8,829 | |
| Recoupment of previously waived fees | | | | | | | | |
| Investor Class | | | – | | | | 28 | |
| Institutional Class | | | – | | | | – | |
| Legal fees | | | 17,948 | | | | 243 | |
| Audit fees | | | 48,846 | | | | 23,127 | |
| Reports to shareholders and printing fees | | | 84,260 | | | | 1,901 | |
| Custody fees | | | 1,201,593 | | | | 48,162 | |
| Chief compliance officer fees | | | 22,230 | | | | 22,230 | |
| Principal financial officer fees | | | 5,000 | | | | 5,000 | |
| Miscellaneous | | | 36,172 | | | | 3,574 | |
| Total expenses | | | 17,915,273 | | | | 402,831 | |
| Less fees waived/reimbursed by investment adviser (Note 6) | | | | | | | | |
| Investor Class | | | – | | | | (897 | ) |
| Institutional Class | | | – | | | | (115,259 | ) |
| Total net expenses | | | 17,915,273 | | | | 286,675 | |
| NET INVESTMENT INCOME: | | | 50,058,210 | | | | 722,172 | |
| Net realized loss on investments | | | (75,278,751 | ) | | | (42,343 | ) |
| Net realized loss on foreign currency transactions | | | (3,096,478 | ) | | | (2,446 | ) |
| Net realized loss | | | (78,375,229 | ) | | | (44,789 | ) |
| Net change in unrealized depreciation on investments | | | (157,863,239 | ) | | | (1,126,918 | ) |
| Net change in unrealized appreciation on translation of assets and liabilities in foreign currency transactions | | | 93,045 | | | | 11 | |
| Net unrealized depreciation | | | (157,770,194 | ) | | | (1,126,907 | ) |
| 30 | (855) 732-9220 seafarerfunds.com |
| Seafarer Funds | Statements of Operations |
Year Ended April 30, 2019
| | | Seafarer Overseas Growth and Income Fund | | | Seafarer Overseas Value Fund | |
| NET REALIZED AND UNREALIZED LOSS ON INVESTMENTS AND FOREIGN CURRENCY TRANSLATIONS | | | (236,145,423 | ) | | | (1,171,696 | ) |
| NET DECREASE IN NET ASSETS RESULTING FROM OPERATIONS | | $ | (186,087,213 | ) | | $ | (449,524 | ) |
See accompanying Notes to Financial Statements.
| Annual Report – April 30, 2019 | 31 |
Seafarer Overseas Growth and Income Fund Statements of Changes in Net Assets
| | | Year Ended April 30, 2019 | | | Year Ended April 30, 2018 | |
| OPERATIONS: | | | | | | |
| Net investment income | | $ | 50,058,210 | | | $ | 60,023,167 | |
| Net realized gain/(loss) | | | (78,375,229 | ) | | | 155,796,309 | |
| Net change in unrealized depreciation | | | (157,770,194 | ) | | | (13,047,581 | ) |
| Net increase/(decrease) in net assets resulting from operations | | | (186,087,213 | ) | | | 202,771,895 | |
| DISTRIBUTIONS TO SHAREHOLDERS (NOTE 3):(a) | | | | | | | | |
| Total amount of distribution | | | | | | | | |
| Investor Class | | $ | (24,164,869 | ) | | $ | (28,418,560 | ) |
| Institutional Class | | | (109,435,374 | ) | | | (58,868,307 | ) |
| Net decrease in net assets from distributions | | | (133,600,243 | ) | | | (87,286,867 | ) |
| BENEFICIAL INTEREST TRANSACTIONS (NOTE 5): | | | | | | | | |
| Shares sold | | | | | | | | |
| Investor Class | | $ | 44,452,361 | | | $ | 153,357,729 | |
| Institutional Class | | | 774,931,703 | | | | 781,843,936 | |
| Dividends reinvested | | | | | | | | |
| Investor Class | | | 23,834,890 | | | | 27,962,467 | |
| Institutional Class | | | 94,069,305 | | | | 47,081,170 | |
| Shares Redeemed | | | | | | | | |
| Investor Class | | | (652,824,161 | ) | | | (209,017,564 | ) |
| Institutional Class | | | (1,455,504,946 | ) | | | (266,115,267 | ) |
| Net increase/(decrease) in net assets derived from beneficial interest transactions | | | (1,171,040,848 | ) | | | 535,112,471 | |
| Net increase/(decrease) in net assets | | $ | (1,490,728,304 | ) | | $ | 650,597,499 | |
| NET ASSETS: | | | | | | | | |
| Beginning of period | | $ | 3,028,291,319 | | | $ | 2,377,693,820 | |
| End of period | | $ | 1,537,563,015 | | | $ | 3,028,291,319 | (b) |
| Other Information: | | | | | | | | |
| SHARE TRANSACTIONS: | | | | | | | | |
| Investor Class | | | | | | | | |
| Sold | | | 3,794,490 | | | | 11,678,351 | |
| Distributions reinvested | | | 2,179,970 | | | | 2,137,427 | |
| Redeemed | | | (54,038,510 | ) | | | (15,740,189 | ) |
| Net decrease in shares outstanding | | | (48,064,050 | ) | | | (1,924,411 | ) |
| Institutional Class | | | | | | | | |
| Sold | | | 65,086,770 | | | | 59,053,386 | |
| Distributions reinvested | | | 8,768,097 | | | | 3,579,963 | |
| Redeemed | | | (123,834,889 | ) | | | (19,939,574 | ) |
| Net increase/(decrease) in shares outstanding | | | (49,980,022 | ) | | | 42,693,775 | |
| (a) | For the year ended April 30, 2018, the Seafarer Overseas Growth and Income Fund had Total Distributions consisting of Net Investment Income of $80,952,386, and Net Realized Gains of $6,334,481. |
| (b) | For the year ended April 30, 2018, Net Assets included Accumulated Undistributed Net Investment Loss of $19,844,339. |
See accompanying Notes to Financial Statements.
| 32 | (855) 732-9220 seafarerfunds.com |
| Seafarer Overseas Value Fund | Statements of Changes in Net Assets |
| | | Year Ended April 30, 2019 | | | Year Ended April 30, 2018 | |
| OPERATIONS: | | | | | | |
| Net investment income | | $ | 722,172 | | | $ | 512,088 | |
| Net realized gain/(loss) | | | (44,789 | ) | | | 79,423 | |
| Net change in unrealized appreciation/(depreciation) | | | (1,126,907 | ) | | | 423,350 | |
| Net increase/(decrease) in net assets resulting from operations | | | (449,524 | ) | | | 1,014,861 | |
| DISTRIBUTIONS TO SHAREHOLDERS (NOTE 3):(a) | | | | | | | | |
| Total amount of distribution | | | | | | | | |
| Investor Class | | $ | (8,420 | ) | | $ | (10,736 | ) |
| Institutional Class | | | (806,121 | ) | | | (637,490 | ) |
| Net decrease in net assets from distributions | | | (814,541 | ) | | | (648,226 | ) |
| BENEFICIAL INTEREST TRANSACTIONS (NOTE 5): | | | | | | | | |
| Shares sold | | | | | | | | |
| Investor Class | | $ | 36,125 | | | $ | 117,980 | |
| Institutional Class | | | 11,105,956 | | | | 16,887,311 | |
| Dividends reinvested | | | | | | | | |
| Investor Class | | | 8,124 | | | | 10,352 | |
| Institutional Class | | | 777,710 | | | | 624,682 | |
| Shares Redeemed | | | | | | | | |
| Investor Class | | | (17,747 | ) | | | (113,172 | ) |
| Institutional Class | | | (7,072,100 | ) | | | (2,417,257 | ) |
| Net increase in net assets derived from beneficial interest transactions | | | 4,838,068 | | | | 15,109,896 | |
| Net increase in net assets | | $ | 3,574,003 | | | $ | 15,476,531 | |
| NET ASSETS: | | | | | | | | |
| Beginning of period | | $ | 25,602,081 | | | $ | 10,125,550 | |
| End of period | | $ | 29,176,084 | | | $ | 25,602,081 | (b) |
| Other Information: | | | | | | | | |
| SHARE TRANSACTIONS: | | | | | | | | |
| Investor Class | | | | | | | | |
| Sold | | | 3,312 | | | | 9,613 | |
| Distributions reinvested | | | 789 | | | | 878 | |
| Redeemed | | | (1,530 | ) | | | (9,212 | ) |
| Net increase in shares outstanding | | | 2,571 | | | | 1,279 | |
| Institutional Class | | | | | | | | |
| Sold | | | 1,003,072 | | | | 1,388,144 | |
| Distributions reinvested | | | 75,506 | | | | 52,984 | |
| Redeemed | | | (668,216 | ) | | | (199,202 | ) |
| Net increase in shares outstanding | | | 410,362 | | | | 1,241,926 | |
| (a) | For the year ended April 30, 2018, the Seafarer Overseas Value Fund had Total Distributions consisting of Net Investment Income of $648,226, and Net Realized Gains of $0. |
| (b) | For the year ended April 30, 2018, Net Assets included Accumulated Undistributed Net Investment Loss of $121,252. |
See accompanying Notes to Financial Statements
| Annual Report – April 30, 2019 | 33 |
Financial Highlights
For a share outstanding through the years presented
| Investor Class |
| NET ASSET VALUE, BEGINNING OF PERIOD |
| INCOME FROM OPERATIONS: |
| Net investment income(a) |
| Net realized and unrealized gain/(loss) on investments |
| Total from investment operations |
| LESS DISTRIBUTIONS: |
| From net investment income |
| From net realized gains on investments |
| Total distributions |
| REDEMPTION FEES ADDED TO PAID IN CAPITAL |
| NET INCREASE/(DECREASE) IN NET ASSET VALUE |
| NET ASSET VALUE, END OF PERIOD |
| TOTAL RETURN(d) |
| SUPPLEMENTAL DATA: |
| Net assets, end of period (in 000s) |
| RATIOS TO AVERAGE NET ASSETS: |
| Operating expenses excluding reimbursement/waiver |
| Operating expenses including reimbursement/waiver |
| Net investment income including reimbursement/waiver |
| PORTFOLIO TURNOVER RATE |
| (a) | Calculated using the average shares method. |
| (b) | Less than $0.005 per share. |
| (c) | In preparing the financial statements in accordance with U.S. GAAP, management made certain adjustments as required by U.S. GAAP which caused the net asset value for purposes of these financial statements to differ from the net asset value used to process shareholder transactions as of the date of these financial statements. As a result, the net asset value increased from $12.50 to $12.51. |
| (d) | In some periods, total returns would have been lower had certain expenses not been waived during the periods. Returns shown do not reflect the deduction of taxes that a shareholder would pay on Fund distributions or the redemption of Fund shares. |
| (e) | Includes adjustments in accordance with U.S. GAAP and as such, the total return for shareholder transactions reported to the market may differ from the total return for financial reporting purposes. As a result, the total return decreased from 8.12% to 8.03%. |
| (f) | Includes adjustments in accordance with U.S. GAAP and as such, the total return for shareholder transactions reported to the market may differ from the total return for financial reporting purposes. As a result, the total return increased from 11.13% to 11.22%. |
| (g) | Effective September 1, 2015, the Adviser agreed to limit expenses to 1.15%. The Adviser agreed to limit expenses to 1.25% for the period September 1, 2014 through August 31, 2015. Prior to September 1, 2014, the Adviser agreed to limit expenses to 1.40%. (See Note 6.) |
| 34 | (855) 732-9220 seafarerfunds.com |
| Seafarer Overseas Growth and Income Fund |
Year Ended April 30, 2019 | | | Year Ended April 30, 2018 | | | Year Ended April 30, 2017 | | | Year Ended April 30, 2016 | | | Year Ended April 30, 2015 | |
| $ | 13.11 | | | $ | 12.51 | | | $ | 11.44 | | | $ | 12.64 | | | $ | 11.58 | |
| | | | | | | | | | | | | | | | | | | |
| | 0.36 | | | | 0.28 | | | | 0.22 | | | | 0.16 | | | | 0.14 | |
| | (1.02 | ) | | | 0.72 | | | | 1.04 | | | | (1.23 | ) | | | 1.26 | |
| | (0.66 | ) | | | 1.00 | | | | 1.26 | | | | (1.07 | ) | | | 1.40 | |
| | (0.01 | ) | | | (0.37 | ) | | | (0.19 | ) | | | (0.11 | ) | | | (0.19 | ) |
| | (0.88 | ) | | | (0.03 | ) | | | – | | | | (0.02 | ) | | | (0.15 | ) |
| | (0.89 | ) | | | (0.40 | ) | | | (0.19 | ) | | | (0.13 | ) | | | (0.34 | ) |
| | – | | | | – | | | | 0.00 | (b) | | | 0.00 | (b) | | | 0.00 | (b) |
| | (1.55 | ) | | | 0.60 | | | | 1.07 | | | | (1.20 | ) | | | 1.06 | |
| $ | 11.56 | | | $ | 13.11 | | | $ | 12.51 | (c) | | $ | 11.44 | | | $ | 12.64 | |
| | (4.36 | %) | | | 8.03 | %(e) | | | 11.22 | %(f) | | | (8.39 | %) | | | 12.55 | % |
| | | | | | | | | | | | | | | | | | | |
| $ | 233,072 | | | $ | 894,241 | | | $ | 877,384 | | | $ | 613,795 | | | $ | 53,543 | |
| | 0.99 | % | | | 0.97 | % | | | 1.02 | % | | | 1.14 | % | | | 1.30 | % |
| | 0.99 | % | | | 0.97 | % | | | 1.02 | % | | | 1.14 | %(g) | | | 1.30 | %(g) |
| | 3.02 | % | | | 2.12 | % | | | 1.88 | % | | | 1.50 | % | | | 1.19 | % |
| | 52 | % | | | 23 | % | | | 14 | % | | | 7 | % | | | 28 | % |
See accompanying Notes to Financial Statements.
| Annual Report – April 30, 2019 | 35 |
Financial Highlights
For a share outstanding through the years presented
| Institutional Class |
| NET ASSET VALUE, BEGINNING OF PERIOD |
| INCOME FROM OPERATIONS: |
| Net investment income(a) |
| Net realized and unrealized gain/(loss) on investments |
| Total from investment operations |
| LESS DISTRIBUTIONS: |
| From net investment income |
| From net realized gains on investments |
| Total distributions |
| REDEMPTION FEES ADDED TO PAID IN CAPITAL |
| NET INCREASE/(DECREASE) IN NET ASSET VALUE |
| NET ASSET VALUE, END OF PERIOD |
| TOTAL RETURN(c) |
| SUPPLEMENTAL DATA: |
| Net assets, end of period (in 000s) |
| RATIOS TO AVERAGE NET ASSETS: |
| Operating expenses excluding reimbursement/waiver |
| Operating expenses including reimbursement/waiver |
| Net investment income including reimbursement/waiver |
| PORTFOLIO TURNOVER RATE |
| (a) | Calculated using the average shares method. |
| (b) | Less than $0.005 per share. |
| (c) | In some periods, total returns would have been lower had certain expenses not been waived during the periods. Returns shown do not reflect the deduction of taxes that a shareholder would pay on Fund distributions or the redemption of Fund shares. |
| (d) | Effective September 1, 2014, the Adviser agreed to limit expenses to 1.05%. Prior to September 1, 2014, the Adviser agreed to limit expenses to 1.25%. (See Note 6.) |
| 36 | (855) 732-9220 seafarerfunds.com |
| Seafarer Overseas Growth and Income Fund |
Year Ended April 30, 2019 | | | Year Ended April 30, 2018 | | | Year Ended April 30, 2017 | | | Year Ended April 30, 2016 | | | Year Ended April 30, 2015 | |
| $ | 13.14 | | | $ | 12.54 | | | $ | 11.46 | | | $ | 12.66 | | | $ | 11.59 | |
| | | | | | | | | | | | | | | | | | | |
| | 0.29 | | | | 0.28 | | | | 0.21 | | | | 0.19 | | | | 0.15 | |
| | (0.93 | ) | | | 0.73 | | | | 1.07 | | | | (1.26 | ) | | | 1.28 | |
| | (0.64 | ) | | | 1.01 | | | | 1.28 | | | | (1.07 | ) | | | 1.43 | |
| | | | | | | | | | | | | | | | | | | |
| | (0.01 | ) | | | (0.38 | ) | | | (0.20 | ) | | | (0.12 | ) | | | (0.21 | ) |
| | (0.88 | ) | | | (0.03 | ) | | | – | | | | (0.02 | ) | | | (0.15 | ) |
| | (0.89 | ) | | | (0.41 | ) | | | (0.20 | ) | | | (0.14 | ) | | | (0.36 | ) |
| | – | | | | – | | | | 0.00 | (b) | | | 0.01 | | | | 0.00 | (b) |
| | (1.53 | ) | | | 0.60 | | | | 1.08 | | | | (1.20 | ) | | | 1.07 | |
| $ | 11.61 | | | $ | 13.14 | | | $ | 12.54 | | | $ | 11.46 | | | $ | 12.66 | |
| | | | | | | | | | | | | | | | | | | |
| | (4.17 | %) | | | 8.08 | % | | | 11.37 | % | | | (8.32 | %) | | | 12.76 | % |
| | | | | | | | | | | | | | | | | | | |
| $ | 1,304,491 | | | $ | 2,134,051 | | | $ | 1,500,310 | | | $ | 605,178 | | | $ | 129,714 | |
| | | | | | | | | | | | | | | | | | | |
| | 0.90 | % | | | 0.87 | % | | | 0.92 | % | | | 1.03 | % | | | 1.18 | % |
| | 0.90 | % | | | 0.87 | % | | | 0.92 | % | | | 1.03 | % | | | 1.10 | %(d) |
| | 2.45 | % | | | 2.09 | % | | | 1.82 | % | | | 1.72 | % | | | 1.30 | % |
| | 52 | % | | | 23 | % | | | 14 | % | | | 7 | % | | | 28 | % |
See accompanying Notes to Financial Statements.
| Annual Report – April 30, 2019 | 37 |
| Financial Highlights | Seafarer Overseas Value Fund |
For a share outstanding through the years presented
| Investor Class | | Year Ended April 30, 2019 | | | Year Ended April 30, 2018 | | | May 31, 2016 (Inception) to April 30, 2017 | |
| NET ASSET VALUE, BEGINNING OF PERIOD | | $ | 11.95 | | | $ | 11.30 | | | $ | 10.00 | |
| INCOME FROM OPERATIONS: | | | | | | | | | | | | |
| Net investment income(a) | | | 0.29 | | | | 0.35 | | | | 0.12 | |
| Net realized and unrealized gain/(loss) on investments | | | (0.51 | ) | | | 0.72 | | | | 1.28 | |
| Total from investment operations | | | (0.22 | ) | | | 1.07 | | | | 1.40 | |
| | | | | | | | | | | | | |
| LESS DISTRIBUTIONS: | | | | | | | | | | | | |
| From net investment income | | | (0.29 | ) | | | (0.42 | ) | | | (0.10 | ) |
| From net realized gains on investments | | | (0.03 | ) | | | – | | | | – | |
| Total distributions | | | (0.32 | ) | | | (0.42 | ) | | | (0.10 | ) |
| NET INCREASE/(DECREASE) IN NET ASSET VALUE | | | (0.54 | ) | | | 0.65 | | | | 1.30 | |
| NET ASSET VALUE, END OF PERIOD | | $ | 11.41 | | | $ | 11.95 | | | $ | 11.30 | |
| | | | | | | | | | | | | |
| TOTAL RETURN(b) | | | (1.50 | %) | | | 9.55 | % | | | 14.15 | % |
| SUPPLEMENTAL DATA: | | | | | | | | | | | | |
| Net assets, end of period (in 000s) | | $ | 327 | | | $ | 311 | | | $ | 280 | |
| RATIOS TO AVERAGE NET ASSETS: | | | | | | | | | | | | |
| Operating expenses excluding reimbursement/waiver | | | 1.45 | % | | | 1.80 | % | | | 3.71 | %(c) |
| Operating expenses including reimbursement/waiver | | | 1.15 | % | | | 1.15 | % | | | 1.15 | %(c) |
| Net investment income including reimbursement/waiver | | | 2.59 | % | | | 2.91 | % | | | 1.24 | %(c) |
| PORTFOLIO TURNOVER RATE(d) | | | 3 | % | | | 3 | % | | | 0 | % |
| (a) | Calculated using the average shares method. |
| (b) | Total returns are for the periods indicated and have not been annualized. Total returns would have been lower had certain expenses not been waived during the periods. Returns shown do not reflect the deduction of taxes that a shareholder would pay on Fund distributions or the redemption of Fund shares. |
| (d) | Portfolio turnover rate for a period less than one full year has not been annualized. |
See accompanying Notes to Financial Statements.
| 38 | (855) 732-9220 seafarerfunds.com |
| Financial Highlights | Seafarer Overseas Value Fund |
For a share outstanding through the years presented
| Institutional Class | | Year Ended April 30, 2019 | | | Year Ended April 30, 2018 | | | May 31, 2016 (Inception) to April 30, 2017 | |
| NET ASSET VALUE, BEGINNING OF PERIOD | | $ | 11.96 | | | $ | 11.28 | | | $ | 10.00 | |
| INCOME FROM OPERATIONS: | | | | | | | | | | | | |
| Net investment income(a) | | | 0.30 | | | | 0.35 | | | | 0.13 | |
| Net realized and unrealized gain/(loss) on investments | | | (0.50 | ) | | | 0.74 | | | | 1.28 | |
| Total from investment operations | | | (0.20 | ) | | | 1.09 | | | | 1.41 | |
| | | | | | | | | | | | | |
| LESS DISTRIBUTIONS: | | | | | | | | | | | | |
| From net investment income | | | (0.30 | ) | | | (0.41 | ) | | | (0.13 | ) |
| From net realized gains on investments | | | (0.03 | ) | | | – | | | | – | |
| Total distributions | | | (0.33 | ) | | | (0.41 | ) | | | (0.13 | ) |
| NET INCREASE/(DECREASE) IN NET ASSET VALUE | | | (0.53 | ) | | | 0.68 | | | | 1.28 | |
| NET ASSET VALUE, END OF PERIOD | | $ | 11.43 | | | $ | 11.96 | | | $ | 11.28 | (b) |
| | | | | | | | | | | | | |
| TOTAL RETURN(c) | | | (1.34 | %) | | | 9.74 | %(d) | | | 14.18 | %(e) |
| SUPPLEMENTAL DATA: | | | | | | | | | | | | |
| Net assets, end of period (in 000s) | | $ | 28,849 | | | $ | 25,291 | | | $ | 9,846 | |
| RATIOS TO AVERAGE NET ASSETS: | | | | | | | | | | | | |
| Operating expenses excluding reimbursement/waiver | | | 1.48 | % | | | 1.76 | % | | | 3.63 | %(f) |
| Operating expenses including reimbursement/waiver | | | 1.05 | % | | | 1.05 | % | | | 1.05 | %(f) |
| Net investment income including reimbursement/waiver | | | 2.65 | % | | | 2.90 | % | | | 1.36 | %(f) |
| PORTFOLIO TURNOVER RATE(g) | | | 3 | % | | | 3 | % | | | 0 | % |
| (a) | Calculated using the average shares method. |
| (b) | In preparing the financial statements in accordance with U.S. GAAP, management made certain adjustments as required by U.S. GAAP which caused the net asset value for purposes of these financial statements to differ from the net asset value used to process shareholder transactions as of the date of these financial statements. As a result, the net asset value decreased from $11.29 to $11.28. |
| (c) | Total returns are for the periods indicated and have not been annualized. Total returns would have been lower had certain expenses not been waived during the periods. Returns shown do not reflect the deduction of taxes that a shareholder would pay on Fund distributions or the redemption of Fund shares. |
| (d) | Includes adjustments in accordance with U.S. GAAP and as such, the total return for shareholder transactions reported to the market may differ from the total return for financial reporting purposes. As a result, the total return increased from 9.64% to 9.74%. |
| (e) | Includes adjustments in accordance with U.S. GAAP and as such, the total return for shareholder transactions reported to the market may differ from the total return for financial reporting purposes. As a result, the total return decreased from 14.29% to 14.18%. |
| (g) | Portfolio turnover rate for a period less than one full year has not been annualized. |
See accompanying Notes to Financial Statements.
| Annual Report – April 30, 2019 | 39 |
| Seafarer Funds | Notes to Financial Statements |
April 30, 2019
NOTES TO FINANCIAL STATEMENTS
1. Organization
Financial Investors Trust (the “Trust”), a Delaware statutory trust, is an open-end management investment company registered under the Investment Company Act of 1940, as amended (“1940 Act”). The Trust consists of multiple separate portfolios or series. This annual report describes the Seafarer Overseas Growth and Income Fund and the Seafarer Overseas Value Fund (individually a “Fund” and collectively, the “Funds”). The Seafarer Overseas Growth and Income Fund seeks to provide long-term capital appreciation along with some current income; it also seeks to mitigate adverse volatility in returns as a secondary objective. The Seafarer Overseas Value Fund seeks to provide long-term capital appreciation. The Funds each offer Investor Class and Institutional Class shares.
2. Significant Accounting Policies
The accompanying financial statements were prepared in accordance with accounting principles generally accepted in the United States of America (“U.S. GAAP”). The preparation of financial statements in conformity with U.S. GAAP requires management to make certain estimates and assumptions that affect the reported amounts of assets and liabilities and disclosures of contingent assets and liabilities at the date of the financial statements and the reported amounts of revenue and expenses during the period. Actual results could differ from those estimates. The Funds are considered an investment company for financial reporting purposes under U.S. GAAP and follow the accounting and reporting guidance applicable to investment companies in the Financial Accounting Standards Board Accounting Standards Codification Topic 946.The following is a summary of significant accounting policies consistently followed by the Funds in preparation of their financial statements.
Investment Valuation
Each Fund generally values its securities based on market prices determined at the close of regular trading on the New York Stock Exchange (“NYSE”), normally 4:00 p.m. Eastern Time, on each day the NYSE is open for trading.
For equity securities and exchange traded funds, the market price is usually the closing sale or official closing price on that exchange. In the case of equity securities not traded on an exchange, or if such closing prices are not otherwise available, the securities are valued at the mean of the most recent bid and ask prices on such day. Redeemable securities issued by open-end registered investment companies are valued at the investment company’s applicable net asset value, with the exception of exchange-traded open-end investment companies, which are priced as equity securities.
Equity securities that are primarily traded on foreign securities exchanges are valued at the closing values of such securities on their respective foreign exchanges, except when an event occurs subsequent to the close of the foreign exchange but before the close of the NYSE, such that the securities’ value would likely change. In such an event, the fair values of those securities are determined in good faith through consideration of other factors in accordance with procedures established by and under the general supervision of the Board of Trustees (the “Board”). Each Fund uses a fair valuation model provided by an independent pricing service, which is intended to reflect fair value when a security’s value or a meaningful portion of the Fund’s portfolio is believed to have been materially affected by a valuation event that has occurred between the close of the exchange or market on which the security is traded and the close of the regular trading day on the NYSE.
The market price for debt obligations is generally the price supplied by an independent third-party pricing service approved by the Board, which may use a matrix, formula or other objective method that takes into consideration quotations from dealers, market transactions in comparable investments, market indices and yield curves. If vendors are unable to supply a price, or if the price supplied is deemed to be unreliable, the market price may be determined using quotations received from one or more broker-dealers that make a market in the security. Corporate bonds and convertible bonds are valued using market models that consider trade data, quotations from dealers and active market makers, relevant yield curve and spread
| 40 | (855) 732-9220 seafarerfunds.com |
| Seafarer Funds | Notes to Financial Statements |
April 30, 2019
data, creditworthiness, trade data or market information on comparable securities, and other relevant security specific information. Publicly traded foreign government debt securities and foreign corporate bonds are typically traded internationally in the over-the-counter market and are valued at the mean between the bid and asked prices as of the close of business of that market.
Forward currency exchange contracts have a market value determined by the prevailing foreign currency exchange daily rates and current foreign currency exchange forward rates. The foreign currency exchange forward rates are calculated using an automated system that estimates rates on the basis of the current day foreign currency exchange rates and forward foreign currency exchange rates supplied by a pricing service.
When such prices or quotations are not available, or when the Trust’s Valuation Committee believes that they are unreliable, securities may be priced using fair value procedures approved by the Board.
Certain foreign countries impose a tax on capital gains which is accrued by each Fund based on unrealized appreciation, if any, on affected securities. The tax is paid when the gain is realized.
Fair Value Measurements
Each Fund discloses the classification of its fair value measurements following a three-tier hierarchy based on the inputs used to measure fair value. Inputs refer broadly to the assumptions that market participants would use in pricing the asset or liability, including assumptions about risk. Inputs may be observable or unobservable. Observable inputs reflect the assumptions market participants would use in pricing the asset or liability. Such inputs are developed based on market data obtained from sources independent of the reporting entity. Unobservable inputs reflect the reporting entity’s own assumptions about the assumptions market participants would use in pricing the asset or liability, which are developed based on the information available and the reporting entity’s best efforts to interpret such information.
Various inputs are used in determining the value of the Funds’ investments as of the end of the reporting period. When inputs used fall into different levels of the fair value hierarchy, the level in the hierarchy within which the fair value measurement falls is determined based on the lowest level input that is significant to the fair value measurement in its entirety. The designated input levels are not necessarily an indication of the risk or liquidity associated with these investments. These inputs are categorized in the following hierarchy under applicable financial accounting standards:
| Level 1 – | Unadjusted quoted prices in active markets for identical investments, unrestricted assets or liabilities that the Funds have the ability to access at the measurement date; |
| Level 2 – | Quoted prices which are not active, quoted prices for similar assets or liabilities in active markets or inputs other than quoted prices that are observable (either directly or indirectly) for substantially the full term of the asset or liability; and |
| Level 3 – | Significant unobservable prices or inputs (including the Funds’ own assumptions in determining the fair value of investments) where there is little or no market activity for the asset or liability at the measurement date. |
| Annual Report – April 30, 2019 | 41 |
| Seafarer Funds | Notes to Financial Statements |
April 30, 2019
The following is a summary of the inputs used to value each Fund as of April 30, 2019:
| Investments in Securities at Value(a) | | Level 1 - Quoted Prices | | | Level 2 - Other Significant Observable Inputs | | | Level 3 - Significant Unobservable Inputs | | | Total | |
| Seafarer Overseas Growth and Income Fund | | | | | | | | | | | | | |
| Common Stocks | | | | | | | | | | | | | | | | |
| Brazil | | $ | 71,792,099 | | | $ | – | | | $ | – | | | $ | 71,792,099 | |
| China / Hong Kong | | | 67,387,112 | | | | 462,170,586 | | | | – | | | | 529,557,698 | |
| Czech Republic | | | – | | | | 17,654,806 | | | | – | | | | 17,654,806 | |
| Hungary | | | – | | | | 50,894,058 | | | | – | | | | 50,894,058 | |
| India | | | 18,830,000 | | | | 30,837,783 | | | | – | | | | 49,667,783 | |
| Indonesia | | | – | | | | 21,669,455 | | | | – | | | | 21,669,455 | |
| Malaysia | | | – | | | | 20,071,915 | | | | – | | | | 20,071,915 | |
| Mexico | | | 46,741,370 | | | | – | | | | – | | | | 46,741,370 | |
| Philippines | | | – | | | | 24,091,413 | | | | – | | | | 24,091,413 | |
| Qatar | | | – | | | | 22,111,714 | | | | – | | | | 22,111,714 | |
| Singapore | | | – | | | | 101,322,925 | | | | – | | | | 101,322,925 | |
| South Africa | | | – | | | | 33,466,153 | | | | – | | | | 33,466,153 | |
| South Korea | | | 34,574,327 | | | | 249,631,979 | | | | – | | | | 284,206,306 | |
| Taiwan | | | 27,330,669 | | | | 60,386,967 | | | | – | | | | 87,717,636 | |
| Thailand | | | – | | | | 23,578,561 | | | | – | | | | 23,578,561 | |
| United Arab Emirates | | | – | | | | 14,208,691 | | | | – | | | | 14,208,691 | |
| Vietnam | | | – | | | | 21,946,318 | | | | – | | | | 21,946,318 | |
| Preferred Stocks | | | – | | | | 65,397,499 | | | | – | | | | 65,397,499 | |
| Government Bond, Short-term - USD and Foreign Currency | | | – | | | | 29,951,961 | | | | – | | | | 29,951,961 | |
| Total | | $ | 266,655,577 | | | $ | 1,249,392,784 | | | $ | – | | | $ | 1,516,048,361 | |
| 42 | (855) 732-9220 seafarerfunds.com |
| Seafarer Funds | Notes to Financial Statements |
April 30, 2019
| Investments in Securities at Value(a) | | Level 1 - Quoted Prices | | | Level 2 - Other Significant Observable Inputs | | | Level 3 - Significant Unobservable Inputs | | | Total | |
| Seafarer Overseas Value Fund | | | | | | | | |
| Common Stocks | | | | | | | | | | | | | | | | |
| Brazil | | $ | 1,100,377 | | | $ | – | | | $ | – | | | $ | 1,100,377 | |
| China / Hong Kong | | | 3,002,021 | | | | 10,304,987 | | | | – | | | | 13,307,008 | |
| Czech Republic | | | 480,248 | | | | 1,182,072 | | | | – | | | | 1,662,320 | |
| Mexico | | | 912,157 | | | | – | | | | – | | | | 912,157 | |
| Philippines | | | 659,951 | | | | – | | | | – | | | | 659,951 | |
| Qatar | | | – | | | | 1,393,227 | | | | – | | | | 1,393,227 | |
| Russia | | | – | | | | 1,241,864 | | | | – | | | | 1,241,864 | |
| Singapore | | | – | | | | 3,312,640 | | | | – | | | | 3,312,640 | |
| South Korea | | | – | | | | 1,177,667 | | | | – | | | | 1,177,667 | |
| United Arab Emirates | | | – | | | | 981,255 | | | | – | | | | 981,255 | |
| Vietnam | | | – | | | | 1,720,237 | | | | – | | | | 1,720,237 | |
| Total | | $ | 6,154,754 | | | $ | 21,313,949 | | | $ | – | | | $ | 27,468,703 | |
| (a) | For detailed descriptions of securities by country, see the accompanying Portfolio of Investments. |
For the year ended April 30, 2019, the Funds did not have any securities that used significant unobservable inputs (Level 3) in determining fair value.
Investment Transactions and Investment Income
Investment transactions are accounted for on the date the investments are purchased or sold (trade date). Realized gains and losses from investment transactions are reported on an identified cost basis. Interest income, which includes accretion of discounts and amortization of premiums, is accrued and recorded as earned. Dividend income is recognized on the ex-dividend date or for certain foreign securities, as soon as information is available to the Funds. All of the realized and unrealized gains and losses and net investment income are allocated daily to each share class in proportion to its average daily net assets.
Cash Management Transactions
Each of the Funds subscribes to the Brown Brothers Harriman & Co. (“BBH”) Cash Management Service (“CMS”), whereby cash balances are automatically swept into overnight offshore demand deposits with either the BBH Grand Cayman branch or a branch of a pre-approved commercial bank. This fully automated program allows the Funds to earn interest on cash balances. Excess cash with deposit institutions domiciled outside of the U.S. are subject to sovereign actions in the jurisdiction of the deposit institution including, but not limited to, freeze, seizure or diminution. Cash balances in the BBH CMS are included on the Statements of Assets and Liabilities under Cash and Foreign Currency, at value. As of April 30, 2019, the Funds had the following cash balances participating in the BBH CMS:
| Fund | | | |
| Seafarer Overseas Growth and Income Fund | | $ | 17,758,204 | |
| Seafarer Overseas Value Fund | | | 1,624,900 | |
| Annual Report – April 30, 2019 | 43 |
| Seafarer Funds | Notes to Financial Statements |
April 30, 2019
As of April 30, 2019, the Funds had the following foreign cash balances participating in the BBH CMS (cost and value of foreign cash balances are equal):
| Fund | | | | |
| Seafarer Overseas Growth and Income Fund | | $ | – | |
| Seafarer Overseas Value Fund | | | – | |
Foreign Securities
The Funds may directly purchase securities of foreign issuers. Investing in securities of foreign issuers involves special risks not typically associated with investing in securities of U.S. issuers. The risks include possible revaluation of currencies, the inability to repatriate foreign currency, less complete financial information about companies, and possible future adverse political and economic developments. Moreover, securities of many foreign issuers and their markets may be less liquid and their prices more volatile than those of securities of comparable U.S. issuers.
Foreign Currency Translation
The books and records of the Funds are maintained in U.S. dollars. Investment valuations and other assets and liabilities initially expressed in foreign currencies are converted each business day into U.S. dollars based upon current exchange rates. Prevailing foreign exchange rates may generally be obtained at the close of the NYSE (normally, 4:00 p.m. Eastern Time). The portion of realized and unrealized gains or losses on investments due to fluctuations in foreign currency exchange rates is not separately disclosed and is included in realized and unrealized gains or losses on investments, when applicable.
Foreign Currency Spot Contracts
Each Fund may enter into foreign currency spot contracts to facilitate transactions in foreign securities or to convert foreign currency receipts into U.S. dollars. A foreign currency spot contract is an agreement between two parties to buy and sell currencies at the current market rate, for settlement generally within two business days. The U.S. dollar value of a contract is determined using current currency exchange rates supplied by a pricing service. The contract is marked-to-market daily for settlements beyond one day and any change in market value is recorded as an unrealized gain or loss. When the contract is closed, the Fund records a realized gain or loss equal to the difference between the value on the open and close date. Losses may arise from changes in the value of the foreign currency, or if the counterparties do not perform under the contract’s terms. The maximum potential loss from such contracts is the aggregate face value in U.S. dollars at the time the contract was opened.
Trust Expenses
Some expenses of the Trust can be directly attributed to the Funds. Expenses that cannot be directly attributed to the Funds are apportioned among all funds in the Trust based on the average daily net assets of each fund.
Fund and Class Expenses
Expenses that are specific to a Fund or class of shares of a Fund, including shareholder servicing fees, are charged directly to that Fund or share class. Expenses that are common to all Funds are generally allocated among the Funds in proportion to their average daily net assets.
Federal Income Taxes
Each Fund complies with the requirements under Subchapter M of the Internal Revenue Code of 1986, as amended, applicable to regulated investment companies and intends to distribute substantially all of its net taxable income and net capital gains, if any, each year so that it will not be subject to excise tax on undistributed income and gains. The Funds are not subject to income taxes to the extent such distributions are made.
As of and during the year ended April 30, 2019, the Funds did not have a liability for any unrecognized tax benefits. The Funds file U.S. federal, state, and local tax returns as required. The Funds’ tax returns
| 44 | (855) 732-9220 seafarerfunds.com |
| Seafarer Funds | Notes to Financial Statements |
April 30, 2019
are subject to examination by the relevant tax authorities until expiration of the applicable statute of limitations, which is generally three years after the filing of the tax return for federal purposes and four years for most state returns. Tax returns for open years have incorporated no uncertain tax positions that require a provision for income taxes.
Distributions to Shareholders
In general, the Seafarer Overseas Growth and Income Fund’s policy is to distribute to its shareholders substantially all net investment income, paid out via two semi-annual dividends, in June and December. The Seafarer Overseas Value Fund’s policy is to distribute to its shareholders substantially all net investment income via one annual dividend in December. It is also each Fund’s policy to distribute annually all net realized short-term and long-term capital gains, if any, after offsetting any capital loss carryovers. Income dividend distributions are derived from dividends and other income each Fund receives from its investments, including short-term capital gains. Long-term capital gain distributions are derived from gains realized when a Fund sells a security it has owned for more than one year. Each Fund may make additional distributions if Seafarer Capital Partners, LLC (the “Adviser”) believes doing so may be necessary for the Fund to avoid or reduce taxes.
3. Tax Basis Information
Reclassifications
As of April 30, 2019, permanent differences in book and tax accounting were reclassified. These differences had no effect on net assets and were primarily attributed to equalization. The reclassifications were as follows:
| | | Paid-in Capital | | | Distributable earnings | |
| Seafarer Overseas Growth and Income Fund | | $ | 3,077,440 | | | $ | (3,077,440 | ) |
| Seafarer Overseas Value Fund | | $ | 38,130 | | | $ | (38,130 | ) |
Tax Basis of Investments
As of April 30, 2019, the aggregate cost of investments, gross unrealized appreciation/(depreciation), and net unrealized appreciation for Federal tax purposes were as follows:
| | | Cost of Investments | | | Gross Unrealized Appreciation | | | Gross Unrealized Depreciation | | | Net Appreciation/ (Depreciation) on Foreign Currencies | | | Net Appreciation/ (Depreciation) | |
| Seafarer Overseas Growth and Income Fund | | $ | 1,488,563,280 | | | $ | 149,169,425 | | | $ | (121,684,344 | ) | | $ | (8,827 | ) | | $ | 27,476,254 | |
| Seafarer Overseas Value Fund | | | 27,774,103 | | | | 3,408,428 | | | | (3,713,828 | ) | | | (436 | ) | | | (305,836 | ) |
| Annual Report – April 30, 2019 | 45 |
| Seafarer Funds | Notes to Financial Statements |
April 30, 2019
Components of Distributable Earnings
As of April 30, 2019, components of distributable earnings were as follows:
| Seafarer Overseas Growth and Income Fund | | | |
| Accumulated net investment income | | $ | 17,736,140 | |
| Accumulated net realized loss | | | (63,386,907 | ) |
| Net unrealized appreciation on investments | | | 27,476,254 | |
| Total distributable earnings | | $ | (18,174,513 | ) |
| | | | | |
| Seafarer Overseas Value Fund | | | | |
| Accumulated net investment income | | $ | 203,535 | |
| Accumulated net realized loss | | | (42,343 | ) |
| Net unrealized depreciation on investments | | | (305,836 | ) |
| Total distributable earnings | | $ | (144,644 | ) |
Capital Losses
Under current law, capital losses maintain their character as short-term or long-term and are carried forward to the next tax year without expiration. As of the current fiscal year end, the following amounts are available as carry forwards to the next tax year:
| | | Short-Term | | | Long-Term | |
| Seafarer Overseas Growth and Income Fund | | $ | 29,711,571 | | | $ | 4,296,115 | |
The Fund elects to defer to the period ending April 30, 2020, capital losses recognized during the period November 1, 2018 – April 30, 2019 in the amount of:
| | | Capital Losses Recognized | |
| Seafarer Overseas Growth and Income Fund | | $ | 29,379,221 | |
| Seafarer Overseas Value Fund | | | 42,343 | |
Tax Basis of Distributions to Shareholders
The character of distributions made during the year from net investment income or net realized gains may differ from the ultimate characterization for federal income tax purposes. Also, due to the timing of dividend distributions, the fiscal year in which amounts are distributed may differ from the fiscal year in which the income or realized gain is recorded by a Fund.
The tax character of distributions paid by the Funds for the fiscal year ended April 30, 2019 was as follows:
| | | Ordinary Income | | | Long-Term Capital Gain | |
| Seafarer Overseas Growth and Income Fund | | $ | 2,805,129 | | | $ | 130,795,114 | |
| Seafarer Overseas Value Fund | | | 751,764 | | | | 62,777 | |
| 46 | (855) 732-9220 seafarerfunds.com |
| Seafarer Funds | Notes to Financial Statements |
April 30, 2019
The tax character of distributions paid by the Funds for the fiscal year ended April 30, 2018 was as follows:
| | | Ordinary Income | | | Long-Term Capital Gain | |
| Seafarer Overseas Growth and Income Fund | | $ | 80,952,386 | | | $ | 6,334,481 | |
| Seafarer Overseas Value Fund | | | 648,226 | | | | – | |
4. Securities Transactions
The cost of purchases and proceeds from sales of securities excluding short-term securities during the year ended April 30, 2019 were as follows:
| | | Purchases of Securities | | | Proceeds from Sales of Securities | |
| Seafarer Overseas Growth and Income Fund | | $ | 999,215,650 | | | $ | 2,070,406,719 | |
| Seafarer Overseas Value Fund | | | 7,412,928 | | | | 611,713 | |
5. Shares of Beneficial Interest
The capitalization of the Trust consists of an unlimited number of shares of beneficial interest with no par value per share. Holders of shares of the Funds of the Trust have one vote for each share held and a proportionate fraction of a vote for each fractional share. All shares issued and outstanding are fully paid and are transferable and redeemable at the option of the shareholder. Purchasers of the shares do not have any obligation to make payments to the Trust or its creditors solely by reason of the purchasers’ ownership of the shares. Shares have no pre-emptive rights.
6. Management and Related Party Transactions
The Adviser, subject to the authority of the Board, is responsible for the overall management and administration of the Funds’ business affairs. The Adviser manages the investments of the Funds in accordance with the Funds’ investment objectives, policies, limitations and investment guidelines established jointly by the Adviser and the Trustees. Pursuant to the investment advisory agreement, the Funds, in the aggregate, pay the Adviser an annual management fee of 0.75% of the aggregate average daily net assets of the Funds up to $1.5 billion and 0.70% of the aggregate average daily net assets of the Funds over $1.5 billion. Each Fund pays the Adviser a monthly fee at the annual rate using the applicable management fee calculated based on the Fund’s pro rata share of the Funds’ combined average daily net assets. Prior to August 31, 2016, the Funds paid the Adviser an annual management fee of 0.75% of the aggregate average daily net assets of the Funds.
Effective September 1, 2014, the Adviser contractually agreed to limit certain Fund expenses (excluding brokerage expenses, interest expenses, taxes and extraordinary expenses) to 1.25% and 1.05% of the Funds’ average daily net assets in the Investor and Institutional share classes, respectively, through August 31, 2015. Effective September 1, 2015, the Adviser contractually agreed to waive and/or reimburse fees or expenses in order to limit Total Annual Fund Operating Expenses After Fee Waiver / Expense Reimbursements (excluding brokerage expenses, interest expenses, taxes and extraordinary expenses) to 1.15% and 1.05% of the Funds’ average daily net assets for the Investor and Institutional share classes respectively. This agreement (the “Expense Agreement”) is in effect through August 31, 2019. The Adviser will be permitted to recover, on a class-by-class basis, expenses it has borne through the Expense Agreement to the extent that the Funds’ expenses in later periods fall below the expense cap in effect at the time of waiver or reimbursement. The Funds will not be obligated to pay any such deferred fees and expenses more than three years after the date of the waiver. This agreement may not be terminated or modified prior to August 31, 2019, except with the approval of the Funds’ Board. During the year ended April 30, 2019, the Adviser agreed that it will only seek to recoup waived management
| Annual Report – April 30, 2019 | 47 |
| Seafarer Funds | Notes to Financial Statements |
April 30, 2019
fees and will not recoup any reimbursed expenses. As of April 30, 2019, the Adviser has recouped all available waived management fees from the Seafarer Overseas Growth and Income Fund.
For the year ended April 30, 2019, the fee waivers and/or reimbursements were as follows for the Seafarer Overseas Value Fund:
| Fund | | Fees Waived/ Reimbursed By Adviser | | | Recoupment of Past Waived Fees By Adviser | |
| Seafarer Overseas Value Fund | | | | | | |
| Investor Class | | $ | 897 | | | $ | 28 | |
| Institutional Class | | | 115,259 | | | | – | |
As of April 30, 2019, the balances of recoupable expenses for each class were as follows for the Funds:
| Fund | | Expires 2020 | | | Expires 2021 | | | Expires 2022 | | | Total | |
| Seafarer Overseas Growth and Income Fund | | | | | | | | | | | | | | | | |
| Investor Class | | $ | – | | | $ | – | | | $ | – | | | $ | – | |
| Institutional Class | | | – | | | | – | | | | – | | | | – | |
| Seafarer Overseas Value Fund | | | | | | | | | | | | | | | | |
| Investor Class | | $ | 1,140 | | | $ | 1,723 | | | $ | 897 | | | $ | 3,760 | |
| Institutional Class | | | 34,396 | | | | 108,082 | | | | 115,259 | | | | 257,737 | |
Fund Administrator
ALPS Fund Services, Inc. (“ALPS” and the “Administrator”) (an affiliate of ALPS Distributors, Inc.) provides administrative, fund accounting and other services to the Funds under the Administration, Bookkeeping and Pricing Services Agreement with the Trust.
The Funds’ administrative fee is accrued on a daily basis and paid monthly. The Administrator is also reimbursed by the Funds for certain out-of-pocket expenses. Administration fees paid by the Funds for the year ended April 30, 2019 are disclosed in the Statements of Operations.
Transfer Agent
ALPS serves as transfer, dividend paying and shareholder servicing agent for the Funds (“Transfer Agent”). ALPS is paid an annual base fee per Fund and a fee based on the number of shareholder accounts. The Transfer Agent is also reimbursed by the Funds for certain out-of-pocket expenses. Transfer agent fees paid by the Funds for the year ended April 30, 2019 are disclosed in the Statements of Operations.
Compliance Services
ALPS provides compliance services to the Funds under the Chief Compliance Officer Services Agreement with the Trust. ALPS provides services that assist the Trust’s chief compliance officer in monitoring and testing the policies and procedures of the Trust in accordance with the requirements of Rule 38a-1 under the 1940 Act. ALPS is paid an annual base fee and is reimbursed for certain out-of-pocket expenses. Compliance service fees paid by the Funds for the year ended April 30, 2019 are disclosed in the Statements of Operations.
Principal Financial Officer
ALPS provides principal financial officer services to the Funds under the Principal Financial Officer Services Agreement with the Trust. Under this Agreement, ALPS is paid an annual base fee and is
| 48 | (855) 732-9220 seafarerfunds.com |
| Seafarer Funds | Notes to Financial Statements |
April 30, 2019
reimbursed for certain out-of-pocket expenses. Principal financial officer fees paid by the Funds for the year ended April 30, 2019 are disclosed in the Statements of Operations.
Distributor
ALPS Distributors, Inc. (“ADI” or the “Distributor”) (an affiliate of ALPS) acts as the distributor of the Funds’ shares pursuant to the Distribution Agreement with the Trust. Under a side letter agreement, the Adviser pays ADI an annual base fee of $12,000 per Fund for the distribution services. The Adviser also reimburses ADI for certain out-of-pocket expenses. Shares are sold on a continuous basis by ADI as agent for the Funds, and ADI has agreed to use its best efforts to solicit orders for the sale of the Funds’ shares, although it is not obliged to sell any particular amount of shares. ADI is registered as a broker-dealer with the U.S. Securities and Exchange Commission.
Shareholder Service Plan for Investor Class and Institutional Class Shares
Each Fund has adopted a Shareholder Services Plan (a “Services Plan”) for each of its share classes. Under the Services Plan, each Fund is authorized to enter into shareholder service agreements with investment advisers, financial institutions and other service providers (“Participating Organizations”) to maintain and provide certain administrative and servicing functions in relation to the accounts of shareholders. Shareholder service arrangements typically include processing orders for shares, generating account and confirmation statements, sub-accounting, account maintenance, tax reporting, and disbursing cash dividends as well as other investment or administrative services required for a particular Participating Organizations’ products, programs, platform and accounts. The Services Plan will cause each Fund to pay an aggregate fee, not to exceed on an annual basis 0.15% and 0.05% of the average daily net asset value of the Investor and Institutional share classes, respectively. Such payments will be made on assets attributable to or held in the name of a Participating Organization, on behalf of its clients as compensation for providing service activities pursuant to an agreement with the Participating Organization. Any amount of such payment not paid to a Participating Organization for such service activities shall be reimbursed to the Fund as soon as practicable. Shareholder Services Plan fees paid by the Funds for the year ended April 30, 2019 are disclosed in the Statements of Operations.
Trustees
The fees and expenses of the independent trustees of the Board are presented in the Statements of Operations.
7. Indemnifications
Under the Trust’s organizational documents, its officers and Trustees are indemnified against certain liability arising out of the performance of their duties to the Trust. Additionally, in the normal course of business, the Trust enters into contracts with service providers that may contain general indemnification clauses, which may permit indemnification to the extent permissible under the applicable law. The Trust’s maximum exposure under these arrangements is unknown, as this would involve future claims that may be made against the Trust that have not yet occurred.
8. New Accounting Pronouncements
On October 4, 2018, the SEC amended Regulation S-X to require certain financial statement disclosure requirements to conform them to US GAAP for investment companies. Effective November 4, 2018, the Funds adopted disclosure requirement changes for Regulation S-X and these changes are reflected throughout this report. The Funds’ adoption of those amendments, effective with the financial statements prepared as of April 30, 2019, had no effect on the Funds’ net assets or results of operations.
In August 2018, the Financial Accounting Standards Board (“FASB”) issued Accounting Standards Update (“ASU”) 2018-13, which changes the fair value measurement disclosure requirements of FASB Accounting Standards Codification Topic 820, Fair Value Measurement. The update to Topic 820 includes new, eliminated, and modified disclosure requirements. ASU 2018-13 is effective for fiscal years beginning after December 15, 2019, including interim periods. Early adoption is permitted for any
| Annual Report – April 30, 2019 | 49 |
| Seafarer Funds | Notes to Financial Statements |
April 30, 2019
eliminated or modified disclosures. The Funds adopted the disclosure requirements effective with the financial statements prepared as of April 30, 2019; doing so had no effect on the Funds’ net assets or results of operations.
| 50 | (855) 732-9220 seafarerfunds.com |
| Seafarer Funds | Report of Independent Registered Public Accounting Firm |
April 30, 2019
To the shareholders and the Board of Trustees of Financial Investors Trust:
Opinion on the Financial Statements and Financial Highlights
We have audited the accompanying statements of assets and liabilities, including the portfolios of investments, of Seafarer Overseas Growth and Income Fund and Seafarer Overseas Value Fund (the "Funds"), two of the funds constituting the Financial Investors Trust, as of April 30, 2019, the related statement of operations for the year then ended, the statements of changes in net assets for each of the two years in the period then ended, the financial highlights for each of the five years in the period then ended for Seafarer Overseas Growth and Income Fund; the related statement of operations for the year then ended, the statements of changes in net assets for each of the two years in the period then ended, the financial highlights for each of the two years in the period then ended and for the period from May 31, 2016 (inception) through April 30, 2017 for Seafarer Overseas Value Fund; and the related notes.
In our opinion, the financial statements and financial highlights present fairly, in all material respects, the financial position of Seafarer Overseas Growth and Income Fund as of April 30, 2019, and the results of its operations for the year then ended, the changes in its net assets for each of the two years in the period then ended, and the financial highlights for each of the five years in the period then ended in conformity with accounting principles generally accepted in the United States of America. Also, in our opinion, the financial statements and financial highlights present fairly, in all material respects, the financial position of Seafarer Overseas Value Fund as of April 30, 2019, and the results of its operations for the year then ended, the changes in its net assets for each of the two years in the period then ended, and the financial highlights for each of the two years in the period then ended and for the period from May 31, 2016 (inception) through April 30, 2017 in conformity with accounting principles generally accepted in the United States of America.
Basis for Opinion
These financial statements and financial highlights are the responsibility of the Funds’ management. Our responsibility is to express an opinion on the Funds’ financial statements and financial highlights based on our audits. We are a public accounting firm registered with the Public Company Accounting Oversight Board (United States) (PCAOB) and are required to be independent with respect to the Funds in accordance with the U.S. federal securities laws and the applicable rules and regulations of the Securities and Exchange Commission and the PCAOB. We conducted our audits in accordance with the standards of the PCAOB. Those standards require that we plan and perform the audit to obtain reasonable assurance about whether the financial statements and financial highlights are free of material misstatement, whether due to error or fraud. The Funds are not required to have, nor were we engaged to perform, an audit of their internal control over financial reporting. As part of our audits we are required to obtain an understanding of internal control over financial reporting but not for the purpose of expressing an opinion on the effectiveness of the Funds’ internal control over financial reporting. Accordingly, we express no such opinion.
Our audits included performing procedures to assess the risks of material misstatement of the financial statements and financial highlights, whether due to error or fraud, and performing procedures that respond to those risks. Such procedures included examining, on a test basis, evidence regarding the amounts and disclosures in the financial statements and financial highlights. Our audits also included evaluating the accounting principles used and significant estimates made by management, as well as evaluating the overall presentation of the financial statements and financial highlights. Our procedures included confirmation of securities owned as of April 30, 2019, by correspondence with the custodian and brokers; when replies were not received from brokers, we performed other auditing procedures. We believe that our audits provide a reasonable basis for our opinion.
DELOITTE & TOUCHE LLP
Denver, Colorado
June 25, 2019
We have served as the auditor of one or more investment companies advised by Seafarer Capital Partners, LLC since 2012.
| Annual Report – April 30, 2019 | 51 |
| Seafarer Funds | Additional Information |
April 30, 2019 (Unaudited)
ADDITIONAL INFORMATION
1. Fund Holdings
Each Fund files its complete schedule of portfolio holdings with the Securities and Exchange Commission (the “SEC”) for the first and third quarters of each fiscal year within 60 days after the end of the period. Copies of the Funds’ previously filed Form N-Qs are available without charge on the SEC website at http://www.sec.gov.
2. Fund Proxy Voting Policies, Procedures and Summaries
The Funds’ policies and procedures used in determining how to vote proxies and information regarding how the Funds voted proxies relating to portfolio securities during the most recent prior 12-month period ending June 30 are available without charge, (1) upon request, by calling toll-free (855) 732-9220 and (2) on the SEC’s website at http://www.sec.gov.
3. Tax Designations (Unaudited)
The Funds designate the following as a percentage of taxable ordinary income distributions, or up to the maximum amount allowable, for the calendar year ended December 31, 2018:
| | Dividends Received Deduction | Qualified Dividend Income |
| Seafarer Overseas Growth and Income Fund | 0.00% | 100.00% |
| Seafarer Overseas Value Fund | 0.00% | 10.83% |
In early 2019, if applicable, shareholders of record received this information for the distributions paid to them by the Funds during the calendar year 2018 via Form 1099. The Funds will notify shareholders in early 2020 of amounts paid to them by the Funds, if any, during the calendar year 2019.
The Funds designate the following as long-term capital gain distributions:
| | Long Term Capital Gain Distributions |
| Seafarer Overseas Growth and Income Fund | $130,795,114 |
| Seafarer Overseas Value Fund | $62,777 |
The Seafarer Overseas Growth and Income Fund and the Seafarer Overseas Value Fund designate foreign taxes paid in the amount of $9,960,853 and $18,442 and foreign source income in the amount of $72,767,857 and $916,280, respectively, for federal income tax purposes for the year ended April 30, 2019.
The Seafarer Overseas Growth and Income Fund and the Seafarer Overseas Value Fund utilized equalization credits in the amounts of $3,077,439 and $38,130, respectively.
Please consult a tax advisor if you have questions about federal or state income tax laws, or how to prepare your tax returns.
| 52 | (855) 732-9220 seafarerfunds.com |
| Seafarer Funds | Approval of Fund Advisory Agreement |
April 30, 2019 (Unaudited)
DISCLOSURE REGARDING APPROVAL OF FUND
ADVISORY AGREEMENT
On December 11, 2018, the Trustees met in person to discuss, among other things, the approval of the Investment Advisory Agreement between and Seafarer Capital Partners, LLC (“Seafarer”) and the Trust, with respect to the Seafarer Overseas Growth and Income Fund and the Seafarer Overseas Value Fund (together, the “Seafarer Funds”), in accordance with Section 15(c) of the 1940 Act. In renewing and approving the Investment Advisory Agreement with Seafarer, the Trustees, including the Independent Trustees, considered the following factors with respect to the Seafarer Funds:
Nature, Extent, and Quality of the Services under the Investment Advisory Agreement
The Trustees received and considered information regarding the nature, extent, and quality of services provided to the Seafarer Funds under the Investment Advisory Agreement. The Trustees reviewed certain background materials supplied by Seafarer in its presentation, including its Form ADV.
The Trustees reviewed and considered Seafarer’s investment advisory personnel, its history as an asset manager, and its performance and the amount of assets currently under management by Seafarer. The Trustees also reviewed the research and decision-making processes utilized by Seafarer, including the methods adopted to seek to achieve compliance with the investment objectives, policies, and restrictions of the Seafarer Funds.
The Trustees considered the background and experience of Seafarer’s management in connection with the Seafarer Funds, including reviewing the qualifications, backgrounds, and responsibilities of the management team primarily responsible for the day-to-day portfolio management of the Seafarer Funds and the extent of the resources devoted to research and analysis of actual and potential investments.
The Trustees also reviewed, among other things, Seafarer’s insider trading policies and procedures and its Code of Ethics.
Performance
The Trustees reviewed performance information for the Institutional Class shares of each Seafarer Fund for the 1-year, 2-year, 3-year, 4-year, 5-year and since inception periods ended September 30, 2018, as applicable. That review included a comparison of each Fund’s performance to the performance universe average of a group of funds selected by an independent provider of investment company data (the “Data Provider”). The Trustees noted the performance of the Seafarer Overseas Growth and Income Fund was above the universe average for the 1-year, 4-year, 5-year, and since inception periods ended September 30, 2018 and below the universe average for the 2-year and 3-year periods ended September 30, 2018. The Trustees also noted that the performance of the Seafarer Overseas Value Fund was above the universe average for the 1-year and 2-year periods ended September 30, 2018 and below the universe average for the since inception period ended September 30, 2018. The Trustees also considered Seafarer’s discussion of each Fund’s underlying portfolio diversification categories, its top contributors and top detractors, as well as Seafarer’s performance and reputation generally and its investment techniques, risk management controls, and decision-making processes.
Investment Advisory Fee Rate
The Trustees reviewed and considered the contractual annual advisory fee paid by the Trust, on behalf of the Seafarer Overseas Growth and Income Fund and the Seafarer Overseas Value Fund, to Seafarer, respectively, of 0.75% of the Fund’s daily average net assets up to $1.5 billion and 0.70% over $1.5 billion, in light of the extent and quality of the advisory services provided by Seafarer to the Funds.
The Board received and considered information including a comparison of each Fund’s contractual and actual management fees and overall expenses with those of funds in the expense group and universe of funds selected by the Data Provider. The Trustees noted that the contractual and actual management
| Annual Report – April 30, 2019 | 53 |
| Seafarer Funds | Approval of Fund Advisory Agreement |
April 30, 2019 (Unaudited)
fee rate for the Institutional Class shares of each Seafarer Fund was below the average and median contractual and actual management fee rates of the Data Provider peer group median.
Total Expense Ratios
The Trustees further reviewed and considered the total expense ratio (after waivers) of 0.874% for the Institutional Class of the Seafarer Overseas Growth and Income Fund and 1.045% for the Institutional Class of the Seafarer Overseas Value Fund, and noted that each Fund’s total expense ratio (after waivers) was below the total expense ratio of the Data Provider universe average and median (after waivers).
Comparable Accounts
The Trustees noted certain information provided by Seafarer regarding fees charged to other Seafarer clients and considered Seafarer’s statements indicating that there were no clients with investment mandates directly comparable to the Seafarer Funds.
Profitability
The Trustees received and considered a retrospective and projected profitability analysis prepared by Seafarer based on the fees payable under the Investment Advisory Agreement with respect to each Seafarer Fund. The Trustees considered the profits, if any, anticipated to be realized by Seafarer in connection with the operation of each Seafarer Fund. The Board then reviewed Seafarer’s audited financial statements for the year ended December 31, 2016 in order to analyze the financial condition and stability and profitability of Seafarer.
Economies of Scale
The Trustees considered whether economies of scale in the provision of services to the Seafarer Funds will be passed along to the shareholders under the Investment Advisory Agreement.
Other Benefits to the Adviser
The Trustees reviewed and considered any other incidental benefits derived or to be derived by Seafarer from its relationship with the Seafarer Funds, including whether soft dollar arrangements were used.
In renewing Seafarer as the investment adviser to the Seafarer Funds and renewing the Investment Advisory Agreement and the fees charged under the Investment Advisory Agreement, the Trustees concluded that no single factor reviewed by the Trustees was identified by the Trustees to be determinative as the principal factor in whether to renew the Investment Advisory Agreement. Further, the Independent Trustees were advised by separate independent legal counsel throughout the process. The Trustees, including all of the Independent Trustees, concluded that:
| ● | the nature, extent, and quality of services rendered by Seafarer under the Investment Advisory Agreement with respect to the Seafarer Funds were adequate; |
| ● | the performance of the Seafarer Overseas Growth and Income Fund was above the universe average for the 1-year, 4-year, 5-year, and since inception periods ended September 30, 2018 and below the universe average for the 2-year and 3-year periods ended September 30, 2018; and the performance of the Seafarer Overseas Value Fund was above the universe average for the 1-year and 2-year periods ended September 30, 2018 and below the universe average for the since inception period ended September 30, 2018; |
| ● | the contractual and actual management fee rate for the Institutional Class shares of each Seafarer Fund was below the average and median contractual and actual management fee rates of the Data Provider peer group median; |
| ● | each Seafarer Fund’s total expense ratio (after waivers) was below the total expense ratio of the Data Provider universe average and median (after waivers); |
| 54 | (855) 732-9220 seafarerfunds.com |
| Seafarer Funds | Approval of Fund Advisory Agreement |
April 30, 2019 (Unaudited)
| ● | bearing in mind the limitations of comparing different types of managed accounts and the different levels of service typically associated with such accounts, the fee structures applicable to Seafarer’s other clients were not indicative of any unreasonableness with respect to the advisory fees payable by the Seafarer Funds; |
| ● | the profit, if any, realized by Seafarer in connection with the operation of the Seafarer Funds is not unreasonable to the Funds; and |
| ● | there were no material economies of scale or other incidental benefits accruing to Seafarer in connection with its relationship with the Seafarer Funds. |
Based on the Trustees’ deliberations and their evaluation of the information described above, the Trustees, including all of the Independent Trustees, concluded that Seafarer’s compensation for investment advisory services is consistent with the best interests of each Seafarer Fund and its shareholders.
| Annual Report – April 30, 2019 | 55 |
| Seafarer Funds | Trustees and Officers |
April 30, 2019 (Unaudited)
Additional information regarding the Funds’ trustees is included in the Statement of Additional Information, which can be obtained without charge by calling 855-732-9220.
INDEPENDENT TRUSTEES
Name, Address* & Year of Birth | Position(s) Held with Fund | Term of Office** and Length of Time Served | Principal Occupation(s) During Past 5 Years*** | Number of Funds in Fund Complex Overseen by Trustee**** | Other Directorships Held by Trustee During Past 5 Years*** |
| Mary K. Anstine, 1940 | Trustee and Chairman | Ms. Anstine was elected at a special meeting of shareholders held on March 21, 1997 and re-elected at a special meeting of shareholders held on August 7, 2009. Ms. Anstine was appointed Chairman of the Board at the June 6, 2017 meeting of the Board of Trustees. | Ms. Anstine was formerly an Executive Vice President of First Interstate Bank of Denver until 1994, President/Chief Executive Officer of HealthONE Alliance, Denver, Colorado, from 1994 to 2004, and has been retired since 2004. Ms. Anstine is also Trustee/Director of AV Hunter Trust and Colorado Uplift Board. Ms. Anstine was formerly a Director of the Trust Bank of Colorado (later purchased and now known as Northern Trust Bank), HealthONE and Denver Area Council of the Boy Scouts of America, and a member of the American Bankers Association Trust Executive Committee. | 31 | Ms. Anstine is a Trustee of ALPS ETF Trust (20 funds); ALPS Variable Investment Trust (9 funds); Reaves Utility Income Fund (1 fund); and Segall Bryant & Hamill Trust (14 funds). |
| Jeremy W. Deems, 1976 | Trustee | Mr. Deems was appointed as a Trustee at the March 11, 2008 meeting of the Board of Trustees and elected at a special meeting of shareholders held on August 7, 2009. | Mr. Deems is the Co-Founder, Chief Operations Officer and Chief Financial Officer of Green Alpha Advisors, LLC, a registered investment advisor, and Co-Portfolio Manager of the Shelton Green Alpha Fund. Prior to joining Green Alpha Advisors, Mr. Deems was CFO and Treasurer of Forward Management, LLC, ReFlow Management Co., LLC, ReFlow Fund, LLC, a private investment fund, and Sutton Place Management, LLC, an administrative services company, from 1998 to June 2007. From 2004 to 2005, Mr Deems also served as Treasurer of the Forward Funds and the Sierra Club Funds. | 31 | Mr. Deems is a Trustee of ALPS ETF Trust (20 funds); ALPS Variable Investment Trust (9 funds); Clough Funds Trust (1 fund); and Reaves Utility Income Fund (1 fund). |
| 56 | (855) 732-9220 seafarerfunds.com |
| Seafarer Funds | Trustees and Officers |
April 30, 2019 (Unaudited)
INDEPENDENT TRUSTEES (continued)
Name, Address* & Year of Birth | Position(s) Held with Fund | Term of Office** and Length of Time Served | Principal Occupation(s) During Past 5 Years*** | Number of Funds in Fund Complex Overseen by Trustee**** | Other Directorships Held by Trustee During Past 5 Years*** |
| Jerry G. Rutledge, 1944 | Trustee | Mr. Rutledge was elected at a special meeting of shareholders held on August 7, 2009. | Mr. Rutledge is the President and owner of Rutledge’s Inc., a retail clothing business. Mr. Rutledge is currently Director of the American National Bank. He was from 1994 to 2007 a Regent of the University of Colorado. | 31 | Mr. Rutledge is a Trustee of Principal Real Estate Income Fund (1 fund); Clough Global Dividend and Income Fund (1 fund); Clough Global Equity Fund (1 fund); and Clough Global Opportunities Fund (1 fund). |
| Michael “Ross” Shell, 1970 | Trustee | Mr. Shell was elected at a special meeting of shareholders held on August 7, 2009. | Mr. Shell is Founder and CEO of Red Idea, LLC, a strategic consulting/early stage venture firm (since June 2008). From 1999 to 2009, he was a part-owner and Director of Tesser, Inc., a brand agency. From December 2005 to May 2008, he was Director, Marketing and Investor Relations, of Woodbourne, a REIT/real estate hedge fund and private equity firm. Prior to this, from May 2004 to November 2005, he worked as a business strategy consultant; from June 2003 to April 2004, he was on the Global Client Services team of IDEO, a product design/innovation firm; and from 1999 to 2003, he was President of Tesser, Inc. Mr. Shell graduated with honors from Stanford University with a degree in Political Science. | 31 | None. |
| Annual Report – April 30, 2019 | 57 |
| Seafarer Funds | Trustees and Officers |
April 30, 2019 (Unaudited)
INTERESTED TRUSTEE
Name, Address* & Year of Birth | Position(s) Held with Fund | Term of Office** and Length of Time Served | Principal Occupation(s) During Past 5 Years*** | Number of Funds in Fund Complex Overseen by Trustee**** | Other Directorships Held by Trustee During Past 5 Years*** |
| Edmund J. Burke, 1961 | Trustee and President^ | Mr. Burke was elected as Trustee at a special meeting of shareholders held on August 7, 2009. Mr. Burke was elected President of the Trust at the December 17, 2002 meeting of the Board of Trustees. | Mr. Burke is President and a Director of ALPS Holdings, Inc. (“AHI”) (since 2005) and ALPS Advisors, Inc. (“AAI”) and Director of Boston Financial Data Services, Inc. (“BFDS”), ALPS Distributors, Inc. (“ADI”), ALPS Fund Services, Inc. (“AFS”) and ALPS Portfolio Solutions Distributor, Inc. (“APSD”). Because of his positions with AHI, BFDS, AAI, ADI, AFS and APSD, Mr. Burke is deemed an affiliate of the Trust as defined under the 1940 Act. | 31 | Mr. Burke is a Trustee of ALPS ETF Trust (20 funds); Clough Global Dividend and Income Fund (1 fund); Clough Global Equity Fund (1 fund); Clough Global Opportunities Fund (1 fund); Clough Funds Trust (1 fund); Liberty All-Star Equity Fund (1 fund); and Director of the Liberty All-Star Growth Fund, Inc. (1 fund). |
| 58 | (855) 732-9220 seafarerfunds.com |
| Seafarer Funds | Trustees and Officers |
April 30, 2019 (Unaudited)
OFFICERS
Name, Address* & Year of Birth | Position(s) Held with Fund | Term of Office** and Length of Time Served | Principal Occupation(s) During Past 5 Years*** |
Kimberly R. Storms, 1972 | Treasurer | Ms. Storms was elected Treasurer of the Trust at the March 12, 2013 meeting of the Board of Trustees. | Ms. Storms is Senior Vice President - Director of Fund Administration of ALPS. Because of her position with ALPS, Ms. Storms is deemed an affiliate of the Trust as defined under the 1940 Act. Ms. Storms is also Treasurer of Liberty All-Star Equity Fund, Liberty All-Star Growth Fund, Inc., and ALPS Series Trust. Ms. Storms also serves as a Board member and Treasurer of The Center for Trauma & Resilience, a nonprofit agency. |
Karen S. Gilomen, 1970 | Secretary | Ms. Gilomen was elected Secretary of the Trust at the December 13, 2016 meeting of the Board of Trustees. | Ms. Gilomen joined ALPS in August 2016 as Vice President and Senior Counsel. Prior to joining ALPS, Ms. Gilomen was Vice President - General Counsel & CCO of Monticello Associates, Inc. from 2010 to 2016. Because of her position with ALPS, Ms. Gilomen is deemed an affiliate of the Trust, as defined under the 1940 Act. Ms. Gilomen is also the Secretary of Reaves Utility Income Fund and the Assistant Secretary of the WesMark Funds. |
| Ted Uhl, 1974 | Chief Compliance Officer (“CCO”) | Mr. Uhl was appointed CCO of the Trust at the June 8, 2010 meeting of the Board of Trustees. | Mr. Uhl joined ALPS in October 2006, and is currently Deputy Compliance Officer of ALPS. Prior to his current role, Mr. Uhl served as Senior Risk Manager for ALPS from October 2006 until June 2010. Before joining ALPS, Mr. Uhl served a Sr. Analyst with Enenbach and Associates (RIA), and a Sr. Financial Analyst at Sprint. Because of his position with ALPS, Mr. Uhl is deemed an affiliate of the Trust as defined under the 1940 Act. Mr. Uhl is also CCO of the Axonic Alternative Income Fund, Boulder Growth & Income Fund, Inc., Centre Funds, Index Funds, Reality Shares ETF Trust, Reaves Utility Income Fund and XAI Octagon Floating Rate & Alternative Income Term Trust. |
| Jennell Panella, 1974 | Assistant Treasurer | Ms. Panella was elected Assistant Treasurer of the Trust at the September 15, 2015 meeting of the Board of Trustees | Ms. Panella joined ALPS in June 2012 and is currently Fund Controller of ALPS Fund Services, Inc. Prior to joining ALPS, Ms. Panella served as Financial Reporting Manager for Parker Global Strategies, LLC (2009-2012). Because of her position with ALPS, Ms. Panella is deemed an affiliate of the Trust as defined under the 1940 Act. Ms. Panella also serves as Assistant Treasurer of James Advantage Funds. |
| Annual Report – April 30, 2019 | 59 |
| Seafarer Funds | Trustees and Officers |
April 30, 2019 (Unaudited)
OFFICERS (continued)
Name, Address* & Year of Birth | Position(s) Held with Fund | Term of Office** and Length of Time Served | Principal Occupation(s) During Past 5 Years*** |
| Sharon Akselrod, 1974 | Assistant Secretary | Ms. Akselrod was elected Assistant Secretary of the Trust at the September 15, 2015 meeting of the Board of Trustees. | Ms. Akselrod joined ALPS in August 2014 and is currently Senior Investment Company Act Paralegal of ALPS Fund Services, Inc. Prior to joining ALPS, Ms. Akselrod served as Corporate Governance and Regulatory Associate for Nordstrom fsb (2013-2014) and Senior Legal Assistant – Legal Manager for AXA Equitable Life Insurance Company (2008-2013). Because of her position with ALPS, Ms. Akselrod is deemed an affiliate of the Trust as defined under the 1940 Act. Ms. Akselrod is also Assistant Secretary of ALPS ETF Trust, Clough Funds Trust and Principal Real Estate Income Fund. |
| Jennifer Craig, 1973 | Assistant Secretary | Ms. Craig was elected Assistant Secretary of the Trust at the June 8, 2016 meeting of the Board of Trustees. | Ms. Craig joined ALPS in 2007 and is currently Assistant Vice President and Paralegal Manager of ALPS. Prior to joining ALPS, Ms. Craig was Legal Manager at Janus Capital Management LLC and served as Assistant Secretary of Janus Investment Fund, Janus Adviser Series and Janus Aspen Series. Because of her position with ALPS, Ms. Craig is deemed an affiliate of the Trust as defined under the 1940 Act. Ms. Craig is also Assistant Secretary of Clough Global Dividend and Income Fund, Clough Global Equity Fund, Clough Global Opportunities Fund, Liberty All-Star Equity Fund and Liberty All-Star Growth Fund, Inc. |
Sareena Khwaja- Dixon, 1980 | Assistant Secretary | Ms. Khwaja- Dixon was elected Assistant Secretary of the Trust at the December 12, 2017 meeting of the Board of Trustees. | Ms. Khwaja-Dixon joined ALPS in August 2015 and is currently Senior Counsel and Vice President of ALPS Fund Services, Inc. Prior to joining ALPS, Ms. Khwaja-Dixon served as a Senior Paralegal/Paralegal for Russell Investments (2011 – 2015). Ms. Khwaja-Dixon is also Secretary of Liberty All-Star Equity Fund and Liberty All-Star Growth Fund, Inc., Clough Funds Trust, Clough Dividend and Income Fund, Clough Global Opportunities Fund, and Clough Global Equity Fund. |
| * | All communications to Trustees and Officers may be directed to Financial Investors Trust c/o 1290 Broadway, Suite 1100, Denver, CO 80203. |
| ** | This is the period for which the Trustee or Officer began serving the Trust. Each Trustee serves an indefinite term, until his successor is elected. Officers are elected on an annual basis. |
| *** | Except as otherwise indicated, each individual has held the office shown or other offices in the same company for the last five years. |
| **** | The Fund Complex includes all series of the Trust (currently 31) and any other investment companies for which any Trustee serves as trustee for and which Seafarer Capital Partners, LLC provides investment advisory services (currently none). |
| ^ | Effective June 12, 2019, Mr. Burke’s term as President of the Trust ended and Bradley J. Swenson was appointed President of the Trust. |
| 60 | (855) 732-9220 seafarerfunds.com |
Seafarer Funds | Privacy Policy |
April 30, 2019 (Unaudited)
| FACTS | WHAT DO THE FUNDS DO WITH YOUR PERSONAL INFORMATION? |
| Why? | Financial companies choose how they share your personal information. Federal law gives consumers the right to limit some butnot all sharing. Federal law also requires us to tell you how we collect, share, and protect your personal information. Please read this notice carefully to understand what we do. |
| What? | The types of personal information we collect and share depend on the product or service you have with us. This information can include: |
| | ● | Social Security number and account transactions |
| | ● | Account balances and transaction history |
| | ● | Wire transfer instructions |
| How? | All financial companies need to share customers’ personal information to run their everyday business. In the section below, we list the reasons financial companies can share their customers’ personal information; the reasons the Funds choose to share; and whether you can limit this sharing. |
| Reasons we can share your personal information | Do we share: | Can you limit this sharing? |
For our everyday business purposes – such as to process your transactions, maintain your account(s), respond to court orders and legal investigations, or report to credit bureaus | Yes | No |
For our marketing purposes – to offer our products and services to you | No | We do not share. |
| For joint marketing with other financial companies | No | We do not share. |
For our affiliates’ everyday business purposes – information about your transactions and experiences | Yes | No |
For our affiliates’ everyday business purposes – information about your creditworthiness | No | We do not share. |
| For nonaffiliates to market to you | No | We do not share. |
| Annual Report – April 30, 2019 | 61 |
Seafarer Funds | Privacy Policy |
April 30, 2019 (Unaudited)
| Who We Are | | |
| Who is providing this notice? | Seafarer Overseas Growth and Income Fund and Seafarer Overseas Value Fund. |
| | |
| What We Do | |
| How do the Funds protect my personal information? | To protect your personal information from unauthorized access and use, we use security measures that comply with federal law. These measures include computer safeguards and secured files and buildings. |
| How do the Funds collect my personal information? | We collect your personal information, for example, when you |
| | ● | open an account |
| | ● | provide account information or give us your contact information |
| | ● | make a wire transfer or deposit money |
| Why can't I limit all sharing? | Federal law gives you the right to limit only |
| | ● | sharing for affiliates’ everyday business purposes-information about your creditworthiness |
| | ● | affiliates from using your information to market to you |
| | ● | sharing for non-affiliates to market to you |
| | State laws and individual companies may give you additional rights to limit sharing. |
| Definitions | |
| Affiliates | Companies related by common ownership or control. They can be financial and nonfinancial companies. |
| Non-affiliates | Companies not related by common ownership or control. They can be financial and nonfinancial companies. |
| | ● | The Funds do not share with non-affiliates so they can market to you. |
| Joint marketing | A formal agreement between non-affiliated financial companies that together market financial products or services to you. |
| | ● | The Funds do not jointly market. |
| Other Important Information | | |
| California Residents | If your account has a California home address, your personal information will not be disclosed to nonaffiliated third parties except as permitted by applicable California law, and we will limit sharing such personal information with our affiliates to comply with California privacy laws that apply to us. |
| Vermont Residents | The State of Vermont requires financial institutions to obtain your consent prior to sharing personal information that they collect about you with affiliated companies and nonaffiliated third parties other than in certain limited circumstances. Except as permitted by law, we will not share personal information we collect about you with nonaffiliated third parties or other affiliated companies unless you provide us with your written consent to share such information. |
| 62 | (855) 732-9220 seafarerfunds.com |
Page Intentionally Left Blank
Table of Contents
| CONTENTS | PAGE |
| Shareholder Letter | 1 |
| Fund Overview | |
| Vulcan Value Partners Fund | 5 |
| Vulcan Value Partners Small Cap Fund | 8 |
| Disclosure of Fund Expenses | |
| Vulcan Value Partners Fund | 7 |
| Vulcan Value Partners Small Cap Fund | 10 |
| Statements of Investments | |
| Vulcan Value Partners Fund | 11 |
| Vulcan Value Partners Small Cap Fund | 14 |
| Statements of Assets and Liabilities | 17 |
| Statements of Operations | 18 |
| Statements of Changes in Net Assets | |
| Vulcan Value Partners Fund | 19 |
| Vulcan Value Partners Small Cap Fund | 20 |
| Financial Highlights | |
| Vulcan Value Partners Fund | 22 |
| Vulcan Value Partners Small Cap Fund | 24 |
| Notes to Financial Statements | 26 |
| Report of Independent Registered Public Accounting Firm | 35 |
| Disclosure Regarding Approval of Fund Advisory Agreements | 36 |
| Additional Information | 39 |
| Trustees and Officers | 40 |
| Privacy Policy | 45 |
Beginning on January 1, 2021, as permitted by regulations adopted by the U.S. Securities and Exchange Commission, paper copies of the Funds’ annual and semi-annual shareholder reports will no longer be sent by mail, unless you specifically request paper copies of the reports. Instead, the reports will be made available on the Funds’ website at www.vulcanvaluepartners.com and you will be notified by mail each time a report is posted and provided with a website link to access the report.
Beginning on January 1, 2019, you may, notwithstanding the availability of shareholder reports online, elect to receive all future shareholder reports in paper free of charge. If you invest through a financial intermediary, you can contact your financial intermediary to request that you continue to receive paper copies of your shareholder reports. If you invest directly with the Funds, you can call 1.877.421.5078 to let the Funds know you wish to continue receiving paper copies of your shareholder reports.
If you already elected to receive shareholder reports electronically, you will not be affected by this change and you need not take any action. You may elect to receive shareholder reports and other communications from the Funds electronically anytime by contacting your financial intermediary (such as a broker-dealer or bank) or, if you are a direct investor, by enrolling at www.vulcanvaluepartners.com.
www.vulcanvaluepartners.com
Shareholder Letter
April 30, 2019 (Unaudited)
Annual Shareholder Letter 04.30.2019
Vulcan Value Partners Fund returned 6.80% versus 9.06% for the Russell 1000® Value Index and 13.49% for the S&P 500®Index for the year ended April 30, 2019. The Vulcan Value Partners Small Cap Fund returned 4.76% versus 2.19% for the Russell 2000® Value Index and 4.61% for the Russell Value 2000® Index for the year ended April 30, 2019.
As we have often said, we place no weight on short-term results, good or bad, and neither should you. In fact, we have made and will continue to make decisions that could negatively impact short-term performance when we think we can improve our long-term returns and mitigate risk. We encourage you to place more weight on our longer-term historical results and a great deal of weight on our long-term prospects.
We generally define material contributors and detractors as companies having a greater than 1% impact on the portfolio.
Performance data quoted represents past performance. Past performance does not guarantee future results.
Vulcan Value Partners Large Cap Fund Review
In the discussion that follows, we highlight a few holdings in the Vulcan Value Partners Fund. Material contributors included Mastercard, Teradyne, Visa, Airbus and Hilton Worldwide Holdings. McKesson Corporation, National Oilwell Varco, and State Street Corporation were material detractors.
Mastercard is a company that we originally purchased during the financial crisis. Its weight in the portfolio has varied over our holding period. Mastercard’s value growth is among the highest of the companies we own due to the combination of consistent free cash flow production, strong double-digit bottom-line growth, and outstanding capital allocation. In fact, the value of Mastercard has compounded at a double-digit rate for over a decade. The value per share has compounded even faster because of outstanding capital allocation, all while the company continues to strengthen its competitive position.
As we have discussed in the past, Teradyne is the global leader in semiconductor test equipment. The business has generated excellent free cash flow and high returns on capital. In addition, Teradyne has a rapidly growing and underappreciated industrial automation business specializing in easy-to-operate robots, or “cobots”, that work alongside humans. The company’s stock price increased with the broader market rally during the period.
We have owned Airbus for several years and have been pleased with its performance. We added to our position during the period. We are gratified not only by the stock price, but also because our expectations for this company are coming to fruition. In previous commentary, we have stated,
“Airbus SE and Boeing are a global duopoly in commercial aviation. Also, both are leaders in the defense industry. As you know, we have owned Boeing in the portfolio for quite some time, but we sold it during the third quarter as its stock price reached our
| Annual Report | April 30, 2019 | 1 |
Shareholder Letter
April 30, 2019 (Unaudited)
estimate of fair value. Airbus’ financial results remind us of where Boeing was two years ago. Both companies have approximately seven years of commercial backlog, which will keep their factories in production for years to come. However, Airbus is ramping up production and making progress on bringing its cost curve down with greater economies of scale. As production increases and costs fall, Airbus’ reported earnings, and much more importantly, free cash flow should expand dramatically.”
In fact, that is exactly what is happening at Airbus. Orders are up, backlogs are bigger, production rates are increasing, economies of scale are being realized, cost curves are coming down, and free cash flow is increasing. None of this is surprising to us, but it is gratifying as we are seeing the results of remaining patient and following our discipline.
Hilton Worldwide Holdings is one of the largest hospitality companies in the world. Similar to several other hotel companies that we admire, Hilton went through a multi-year transition to an asset light model, meaning that they transitioned to focus on managing and franchising hotels under their brands rather than owning the physical properties. Hilton is a company that is well known to us and one we have followed as analysts for decades. We were pleased to be able to increase our stake in this great business as it got cheaper during the period.
There has been volatility in McKesson’s stock price due to publicity concerning the opioid crisis and the associated litigation involving the drug distributors. McKesson has robust compliance and anti-diversion programs and is committed to addressing the problem. There may be headlines, but we do not feel that the headlines affect our long-term outlook, as we have captured the liability associated with the opioid litigation in our valuation.
National Oilwell Varco’s stock price can be affected by movements in oil prices, but the company’s long-term value is not. The products it provides to the oil industry are needed regardless of commodity price movements. We acknowledge that, in the near term, wide fluctuations in oil prices can impact demand at the margin. However, these short-term fluctuations in demand do not have bearing on the company’s value. We look forward to stock price volatility in stable value businesses because it allows us the opportunity to execute our discipline. We are pleased to have been able to, once again, follow our discipline and add to our position in this great company during the period.
Vulcan Value Partners Small Cap Fund Review
In the discussion that follows, we highlight a few holdings in the Vulcan Value Partners Small Cap Fund. Material contributors included Sleep Number Corporation, ACI Worldwide, Frontdoor, and Acuity Brands. Sleep Country Canada Holdings and Despegar.com were material detractors.
Sleep Number is a premium bedding company in a stable industry. Its value has compounded at a strong double-digit rate over the time we have owned it. The management team has excelled at capital allocation and has used the company’s free cash flow to repurchase its stock at extremely discounted prices. To paraphrase Benjamin Graham, in the short run, the stock market is a voting machine but, in the long run, it's a weighing machine. Price can increase or decrease drastically based on popular sentiment, as demonstrated by Sleep Number’s stock price volatility over the
| 2 | www.vulcanvaluepartners.com |
Shareholder Letter
April 30, 2019 (Unaudited)
years we have owned it. Following our discipline, we have raised and lowered Sleep Number’s weight in the portfolio according to its price to value ratio. We increased its weight in the fund during the period, and we have already been rewarded.
Frontdoor is the American Home Shield segment of ServiceMaster. It was spun out in the fourth quarter of 2018. Frontdoor is the largest provider of home service plans in the U.S. It insures the larger cost systems in its customers’ homes and has a nationwide network of more than 15,000 pre-qualified professional contractor firms that perform associated repairs. This network represents ease of repair for homeowners and a predictable revenue stream for the contractors. Frontdoor is also trying to monetize this growing network by eventually extending its offering to include a home repair services outside of its insurance business. The company generates robust free cash flow from its insurance premiums, which are paid far in advance of the associated repair outflows. We are pleased to be able to own this niche company with a growing network effect at a significant discount to our estimate of its fair value.
Closing
We feel our portfolios remain better positioned now than they have been in some time. The lower our price to value ratios, the higher our margin of safety. Our goal is to mitigate risk. We believe returns will take care of themselves over our five year horizon. It is very important to understand that market volatility is not risk. We define risk as the probability of permanently losing capital over our five-year time horizon. Our investment discipline requires us only to invest in companies that we believe have inherently stable values. As a result, market price volatility can create opportunities for us to mitigate risk by improving our price to value ratios. Your patient capital alongside of ours and our shared long-term time horizon allows us to execute our investment philosophy which is based upon using short-term market disruptions to improve our long-term prospects.
Thank you for the confidence you have placed in us.
C.T. Fitzpatrick
Chief Executive Officer
Vulcan Value Partners, LLC
Past performance does not guarantee future results. The Funds’ prices fluctuate as the underlying assets have exposure to market fluctuations and other risks, as described in the Funds’ prospectus. Please call 877.421.5078 to obtain current performance information and for the current prospectus and statement of additional information. This material must be preceded or accompanied by a prospectus. Please read the prospectus carefully before investing.
The views of the Vulcan Value Partners, LLC and information discussed in this commentary are as of the date of publication, are subject to change, and may not reflect the writer's current views. The views expressed represent an assessment of market conditions at a specific point in time, are opinions only and should not be relied upon as investment advice regarding a particular investment or markets in general. Such information does not constitute a recommendation to buy or sell specific securities or investment vehicles. It should not be assumed that any investment will be profitable or will equal the
| Annual Report | April 30, 2019 | 3 |
Shareholder Letter
April 30, 2019 (Unaudited)
performance of the Funds or any securities or any sectors mentioned in this letter. The subject matter contained in this letter has been derived from several sources believed to be reliable and accurate at the time of compilation. Neither Vulcan Value Partners, LLC nor the Funds accept any liability for losses either direct or consequential caused by the use of this information.
The Funds are distributed by ALPS Distributors, Inc.
The Funds are subject to investment risks, including possible loss of the principal amount invested and therefore is not suitable for all investors. The Funds may not achieve their objectives.
Diversification does not eliminate the risk of experiencing investment losses.
Price to value ratio compares a firm's market to book value by dividing price per share by book value per share. It is also known as the price-equity ratio.
Margin of safety is a principle of investing in which an investor only purchases securities when their market price is significantly below their intrinsic value. In other words, when the market price of a security is significantly below your estimation of its intrinsic value, the difference is the margin of safety. Because investors may set a margin of safety in accordance with their own risk preferences, buying securities when this difference is present allows an investment to be made with minimal downside risk.
| 4 | www.vulcanvaluepartners.com |
Fund Overview
April 30, 2019 (Unaudited)
VULCAN VALUE PARTNERS FUND
Annualized Total Returns(as of 4/30/19)
| | | | | | Since | Expense Ratios(1) |
| | 6 Month | 1 Year | 3 Year | 5 Year | Inception* | Total | Net(2) |
| Vulcan Value Partners Fund | 9.56% | 6.80% | 11.08% | 8.37% | 12.06% | 1.09% | 1.09% |
| S&P 500®Total Return Index(3) | 9.76% | 13.49% | 14.87% | 11.63% | 13.18% | | |
| Russell 1000®Value Index(4) | 7.90% | 9.06% | 10.97% | 8.27% | 11.53% | | |
Performance data quoted represents past performance. Past performance does not guarantee future results. Investment return and principal value of an investment will fluctuate so that an investor’s shares, when sold or redeemed, may be worth more or less than the original cost. The Fund imposes a 2.00% redemption fee on shares held for less than 90 days. Current performance data may be higher or lower than actual data quoted. For the most current month-end performance data, please call 1-877-421-5078.
The table does not reflect the deduction of taxes that a shareholder would pay on Fund distributions or the redemption of Fund shares.
Subject to investment risks, including possible loss of the principal amount invested.
Returns for periods less than 1 year are cumulative.
| * | Fund inception date of 12/30/09. |
| (1) | Ratios as of the Prospectus dated August 31, 2018 and may differ from the ratios presented in the Financial Highlights. |
| (2) | Vulcan Value Partners, LLC (“Vulcan” or the “Adviser”) has contractually agreed to limit the Fund’s total annual fund operating expenses (exclusive of Acquired Fund Fees and Expenses, brokerage expenses, interest expense, taxes and extraordinary expenses) to 1.25% of the Fund’s average daily net assets. This agreement (the “Expense Agreement”) is in effect through August 31, 2019. The Adviser will be permitted to recover, on a class-by-class basis, expenses it has borne through the Expense Agreement to the extent that the Fund’s expenses in later periods fall below the expense cap in effect at the time of waiver or reimbursement. Notwithstanding the foregoing, the Fund will not be obligated to pay any such fees and expenses more than three years after the end of the fiscal year in which the fees or expenses were foregone or reimbursed. The Adviser may not discontinue or modify this waiver prior to August 31, 2019 without the approval by the Fund’s Board of Trustees. |
| (3) | The S&P 500® Total Return Index is an unmanaged index of 500 common stocks chosen for market size, liquidity and industry group representation. It is a market-value weighted index. The Index is not actively managed and does not reflect any deductions for fees, expenses or taxes. An investor may not invest directly in the Index. |
| (4) | The Russell 1000® Value Index is presented here as an additional index, and measures the performance of the large-cap value segment of the U.S. equity universe. It includes those Russell 1000®companies with lower price-to-book ratios and lower expected growth values. The Index is not actively managed and does not reflect any deductions for fees, expenses or taxes. An investor may not invest directly in the Index. |
| Annual Report| April 30, 2019 | 5 |
Fund Overview
April 30, 2019 (Unaudited)
Growth of $10,000 Initial Investment(for the period ended April 30, 2019)
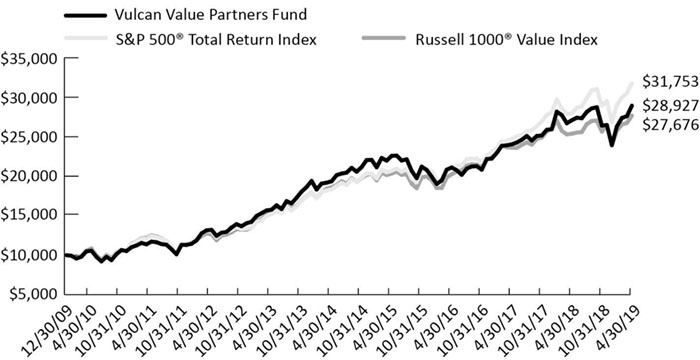
The chart above represents historical performance of a hypothetical investment of $10,000 in the Fund since inception. Past performance does not guarantee future results. This chart does not reflect the deduction of taxes that a shareholder would pay on Fund distributions or the redemption of Fund shares.
Investing in the Fund is subject to investment risks, including possible loss of the principal amount invested.
Industry Allocation(as a % of Net Assets)*
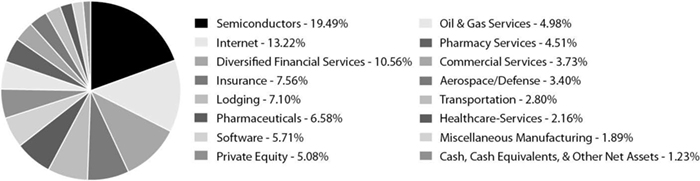
| Top Ten Holdings(as a % of Net Assets)* | |
| | |
| Skyworks Solutions, Inc. | 5.98% |
| Qorvo, Inc. | 5.95% |
| Mastercard, Inc. | 5.22% |
| Hilton Worldwide Holdings, Inc. | 5.11% |
| KKR & Co., Inc. | 5.08% |
| National Oilwell Varco, Inc. | 4.98% |
| Amazon.com, Inc. | 4.82% |
| NVIDIA Corp. | 4.62% |
| CVS Health Corp. | 4.51% |
| McKesson Corp. | 4.27% |
| Top Ten Holdings | 50.54% |
| * | Holdings are subject to change, and may not reflect the current or future position of the portfolio. |
| 6 | www.vulcanvaluepartners.com |
Disclosure of Fund Expenses
April 30, 2019 (Unaudited)
As a shareholder of the Vulcan Value Partners Fund (the “Fund”), you will incur two types of costs: (1) transaction costs, including applicable redemption fees; and (2) ongoing costs, including management fees and other fund operating expenses. The following examples are intended to help you understand your ongoing costs (in dollars) of investing in the Fund and to compare these costs with the ongoing costs of investing in other mutual funds. The examples are based on an investment of $1,000 invested on November 1, 2018 and held until April 30, 2019.
Actual Expenses.The first line of each table below provides information about actual account values and actual expenses. You may use the information in this line, together with the amount you invested, to estimate the expenses that you paid over the period. Simply divide your account value by $1,000 (for example, an $8,600 account value divided by $1,000 = 8.6), then multiply the result by the number in the first line under the heading “Expenses Paid During Period” to estimate the expenses you paid on your account during this period.
Hypothetical Example for Comparison Purposes.The second line of the table below provides information about hypothetical account values and hypothetical expenses based on the Fund’s actual expense ratio and an assumed rate of return of 5% per year before expenses, which is not the Fund’s actual return. The hypothetical account values and expenses may not be used to estimate the actual ending account balance or expenses you paid for the period. You may use this information to compare the ongoing costs of investing in the Fund and other mutual funds. To do so, compare this 5% hypothetical example with the 5% hypothetical examples that appear in the shareholder reports of the other mutual funds.
Please note the expenses shown in the table are meant to highlight ongoing Fund costs only and do not reflect transactional costs, such as redemption fees or exchange fees. Therefore, the second line of the table below is useful in comparing your ongoing costs only, and will not help you determine the relative total costs of owning different funds. In addition, if these transactional costs were included, your costs would have been higher.
Vulcan Value Partners Fund
| Beginning Account Value 11/1/18 | Ending Account Value 4/30/19 | Expense Ratio(a) | Expenses Paid During period 11/1/18 - 4/30/19(b) |
| Actual | $1,000.00 | $1,095.60 | 1.09% | $5.66 |
| Hypothetical (5% return before expenses) | $1,000.00 | $1,019.39 | 1.09% | $5.46 |
| (a) | The Fund's expense ratios have been annualized based on the Fund's most recent fiscal half-year expenses. |
| (b) | Expenses are equal to the Fund's annualized expense ratio multiplied by the average account value over the period, multiplied by the number of days in the most recent fiscal half-year (181)/365 (to reflect the half-year period). |
| Annual Report | April 30, 2019 | 7 |
Fund Overview
April 30, 2019 (Unaudited)
VULCAN VALUE PARTNERS SMALL CAP FUND
Annualized Total Returns(as of 4/30/19)
| | | | | | Since | Expense Ratios(1) |
| | 6 Month | 1 Year | 3 Year | 5 Year | Inception* | Total | Net(2) |
| Vulcan Value Partners Small Cap Fund | 13.73% | 4.76% | 9.62% | 6.73% | 12.56% | 1.27% | 1.27% |
| Russell 2000® Value Index(3) | 3.77% | 2.19% | 11.46% | 6.94% | 10.57% | | |
| Russell 2000® Index(4) | 6.06% | 4.61% | 13.60% | 8.63% | 11.88% | | |
Performance data quoted represents past performance. Past performance does not guarantee future results. Investment return and principal value of an investment will fluctuate so that an investor’s shares, when sold or redeemed, may be worth more or less than the original cost. The Fund imposes a 2.00% redemption fee on shares held for less than 90 days. Current performance data may be higher or lower than actual data quoted. For the most current month-end performance data, please call 1-877-421-5078.
The table does not reflect the deduction of taxes that a shareholder would pay on Fund distributions or the redemption of Fund shares. Subject to investment risks, including possible loss of the principal amount invested.
Returns for periods less than 1 year are cumulative.
| * | Fund inception date of 12/30/09. |
| (1) | Ratios as of the Prospectus dated August 31, 2018 and may differ from the ratios presented in the Financial Highlights. |
| (2) | Vulcan Value Partners, LLC (“Vulcan” or the “Adviser”) has contractually agreed to limit the Fund’s total annual fund operating expenses (exclusive of Acquired Fund Fees and Expenses, brokerage expenses, interest expense, taxes and extraordinary expenses) to 1.25% of the Fund’s average daily net assets. This agreement (the “Expense Agreement”) is in effect through August 31, 2019. The Adviser will be permitted to recover, on a class-by-class basis, expenses it has borne through the Expense Agreement to the extent that the Fund’s expenses in later periods fall below the expense cap in effect at the time of waiver or reimbursement. Notwithstanding the foregoing, the Fund will not be obligated to pay any such fees and expenses more than three years after the end of the fiscal year in which the fees or expenses were foregone or reimbursed. The Adviser may not discontinue or modify this waiver prior to August 31, 2019 without the approval by the Fund’s Board of Trustees. |
| (3) | The Russell 2000® Value Index is presented here as an additional index, and measures the performance of small-cap value segment of the U.S.equity universe. It includes those Russell 2000® companies with lower price-to-book ratios and lower forecasted growth values. The Index is not actively managed and does not reflect any deductions for fees, expenses or taxes. An investor may not invest directly in the Index. |
| (4) | The Russell 2000® Index is presented here as an additional index, and measures the performance of the small-cap segment of the U.S. equity universe. The Russell 2000®Index is a subset of the Russell 3000® Index representing approximately 8% of the total market capitalization of that index. It includes approximately 2,000 of the smallest securities based on a combination of their market cap and current index membership. The Index is not actively managed and does not reflect any deductions for fees, expenses or taxes. An investor may not invest directly in the Index. |
| 8 | www.vulcanvaluepartners.com |
Fund Overview
April 30, 2019 (Unaudited)
Growth of $10,000 Initial Investment(for the period ended April 30, 2019)
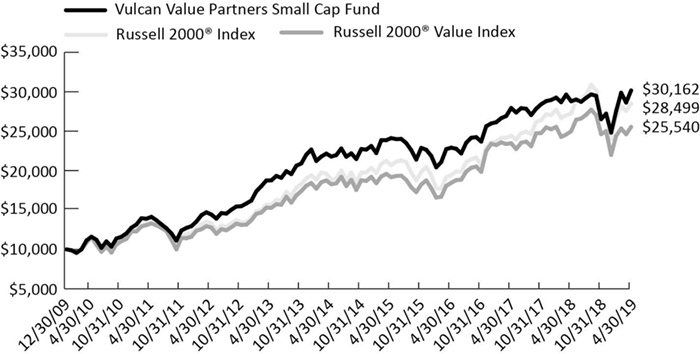
The chart above represents historical performance of a hypothetical investment of $10,000 in the Fund since inception. Past performance does not guarantee future results. This chart does not reflect the deduction of taxes that a shareholder would pay on Fund distributions or the redemption of Fund shares.
Investing in the Fund is subject to investment risks, including possible loss of the principal amount invested.
Industry Allocation(as a % of Net Assets)*
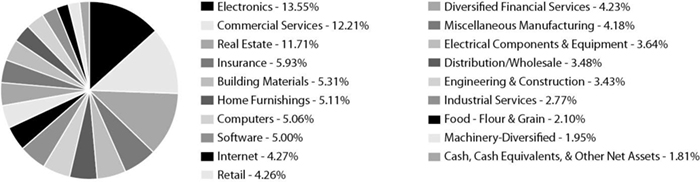
| Top Ten Holdings(as a % of Net Assets)* | |
| | |
| Cushman & Wakefield PLC | 6.81% |
| Coherent, Inc. | 6.21% |
| Ibstock PLC | 5.31% |
| Sotheby's | 5.28% |
| Avast PLC | 5.06% |
| Ituran Location and Control, Ltd. | 5.05% |
| Jones Lang LaSalle, Inc. | 4.90% |
| Despegar.com Corp. | 4.27% |
| Sleep Country Canada Holdings, Inc. | 4.26% |
| Virtus Investment Partners, Inc. | 4.23% |
| Top Ten Holdings | 51.38% |
| * | Holdings are subject to change, and may not reflect the current or future position of the portfolio. |
| Annual Report | April 30, 2019 | 9 |
Disclosure of Fund Expenses
April 30, 2019 (Unaudited)
As a shareholder of the Vulcan Value Partners Small Cap Fund (the “Fund”), you will incur two types of costs: (1) transaction costs, including applicable redemption fees; and (2) ongoing costs, including management fees and other fund operating expenses. The following examples are intended to help you understand your ongoing costs (in dollars) of investing in the Fund and to compare these costs with the ongoing costs of investing in other mutual funds. The examples are based on an investment of $1,000 invested on November 1, 2018 and held until April 30, 2019.
Actual Expenses.The first line of each table below provides information about actual account values and actual expenses. You may use the information in this line, together with the amount you invested, to estimate the expenses that you paid over the period. Simply divide your account value by $1,000 (for example, an $8,600 account value divided by $1,000 = 8.6), then multiply the result by the number in the first line under the heading “Expenses Paid During Period” to estimate the expenses you paid on your account during this period.
Hypothetical Example for Comparison Purposes.The second line of the table below provides information about hypothetical account values and hypothetical expenses based on the Fund’s actual expense ratio and an assumed rate of return of 5% per year before expenses, which is not the Fund’s actual return. The hypothetical account values and expenses may not be used to estimate the actual ending account balance or expenses you paid for the period. You may use this information to compare the ongoing costs of investing in the Fund and other mutual funds. To do so, compare this 5% hypothetical example with the 5% hypothetical examples that appear in the shareholder reports of the other mutual funds.
Please note the expenses shown in the table are meant to highlight ongoing Fund costs only and do not reflect transactional costs, such as redemption fees or exchange fees. Therefore, the second line of the table below is useful in comparing your ongoing costs only, and will not help you determine the relative total costs of owning different funds. In addition, if these transactional costs were included, your costs would have been higher.
Vulcan Value Partners Small Cap Fund
| | Beginning Account Value 11/1/18 | Ending Account Value 4/30/19 | Expense Ratio(a) | Expenses Paid During period 11/1/18 - 4/30/19(b) |
| Actual | $1,000.00 | $1,137.30 | 1.25% | $6.62 |
| Hypothetical (5% return before expenses) | $1,000.00 | $1,018.60 | 1.25% | $6.26 |
| (a) | The Fund's expense ratios have been annualized based on the Fund's most recent fiscal half-year expenses. |
| (b) | Expenses are equal to the Fund's annualized expense ratio multiplied by the average account value over the period, multiplied by the number of days in the most recent fiscal half-year (181)/365 (to reflect the half-year period). |
| 10 | www.vulcanvaluepartners.com |
| Vulcan Value Partners Fund | Statement of Investments |
April 30, 2019
| | | Shares | | | Value (Note 2) | |
| COMMON STOCKS (98.77%) | | | | | | | | |
| Communications (13.22%) | | | | | | | | |
| Internet (13.22%) | | | | | | | | |
| Alphabet, Inc., Class C(a) | | | 40,979 | | | $ | 48,702,722 | |
| Amazon.com, Inc.(a) | | | 32,134 | | | | 61,906,794 | |
| Booking Holdings Inc(a) | | | 17,178 | | | | 31,865,018 | |
| Facebook, Inc., Class A(a) | | | 141,231 | | | | 27,314,075 | |
| | | | | | | | 169,788,609 | |
| | | | | | | | | |
| TOTAL COMMUNICATIONS | | | | | | | 169,788,609 | |
| | | | | | | | | |
| Consumer, Cyclical (7.10%) | | | | | | | | |
| Lodging (7.10%) | | | | | | | | |
| Hilton Worldwide Holdings, Inc. | | | 755,103 | | | | 65,686,410 | |
| Marriott International, Inc., Class A | | | 186,730 | | | | 25,473,706 | |
| | | | | | | | 91,160,116 | |
| | | | | | | | | |
| TOTAL CONSUMER, CYCLICAL | | | | | | | 91,160,116 | |
| | | | | | | | | |
| Consumer, Non-cyclical (12.47%) | | | | | | | | |
| Commercial Services (3.73%) | | | | | | | | |
| S&P Global, Inc. | | | 217,106 | | | | 47,906,610 | |
| | | | | | | | | |
| Healthcare-Services (2.16%) | | | | | | | | |
| Anthem, Inc. | | | 105,330 | | | | 27,704,950 | |
| | | | | | | | | |
| Pharmaceuticals (6.58%) | | | | | | | | |
| AmerisourceBergen Corp. | | | 396,675 | | | | 29,655,423 | |
| McKesson Corp. | | | 460,479 | | | | 54,912,121 | |
| | | | | | | | 84,567,544 | |
| | | | | | | | | |
| TOTAL CONSUMER, NON-CYCLICAL | | | | | | | 160,179,104 | |
| | | | | | | | | |
| Energy (4.98%) | | | | | | | | |
| Oil & Gas Services (4.98%) | | | | | | | | |
| National Oilwell Varco, Inc. | | | 2,448,079 | | | | 63,992,785 | |
| | | | | | | | | |
| TOTAL ENERGY | | | | | | | 63,992,785 | |
| | | | | | | | | |
| Financial (23.20%) | | | | | | | | |
| Diversified Financial Services (10.56%) | | | | | | | | |
| BlackRock, Inc. | | | 31,690 | | | | 15,377,255 | |
| Mastercard, Inc., Class A | | | 263,577 | | | | 67,011,816 | |
| Visa, Inc., Class A | | | 324,120 | | | | 53,295,052 | |
| | | | | | | | 135,684,123 | |
| Annual Report | April 30, 2019 | 11 |
| Statement of Investments | Vulcan Value Partners Fund |
April 30, 2019
| | | Shares | | | Value (Note 2) | |
| Financial (continued) | | | | | | | | |
| Insurance (7.56%) | | | | | | | | |
| Axis Capital Holdings, Ltd. | | | 516,609 | | | $ | 29,369,222 | |
| Everest Re Group, Ltd. | | | 128,179 | | | | 30,186,154 | |
| Swiss Re AG | | | 389,332 | | | | 37,467,880 | |
| | | | | | | | 97,023,256 | |
| | | | | | | | | |
| Private Equity (5.08%) | | | | | | | | |
| KKR & Co., Inc., Class A | | | 2,668,742 | | | | 65,250,742 | |
| | | | | | | | | |
| TOTAL FINANCIAL | | | | | | | 297,958,121 | |
| | | | | | | | | |
| Industrial (8.09%) | | | | | | | | |
| Aerospace/Defense (3.40%) | | | | | | | | |
| Airbus SE | | | 319,848 | | | | 43,723,438 | |
| | | | | | | | | |
| Miscellaneous Manufactur (1.89%) | | | | | | | | |
| Parker-Hannifin Corp. | | | 134,111 | | | | 24,284,820 | |
| | | | | | | | | |
| Transportation (2.80%) | | | | | | | | |
| United Parcel Service, Inc., Class B | | | 338,298 | | | | 35,934,014 | |
| | | | | | | | | |
| TOTAL INDUSTRIAL | | | | | | | 103,942,272 | |
| | | | | | | | | |
| Pharmaceuticals (4.51%) | | | | | | | | |
| Pharmacy Services (4.51%) | | | | | | | | |
| CVS Health Corp. | | | 1,066,231 | | | | 57,981,642 | |
| | | | | | | | | |
| TOTAL PHARMACEUTICALS | | | | | | | 57,981,642 | |
| | | | | | | | | |
| Technology (25.20%) | | | | | | | | |
| Semiconductors (19.49%) | | | | | | | | |
| NVIDIA Corp. | | | 328,130 | | | | 59,391,530 | |
| Qorvo, Inc.(a) | | | 1,011,377 | | | | 76,470,215 | |
| Skyworks Solutions, Inc. | | | 870,905 | | | | 76,796,403 | |
| Teradyne, Inc. | | | 770,708 | | | | 37,764,692 | |
| | | | | | | | 250,422,840 | |
| | | | | | | | | |
| Software (5.71%) | | | | | | | | |
| Microsoft Corp. | | | 359,645 | | | | 46,969,637 | |
| 12 | www.vulcanvaluepartners.com |
| Vulcan Value Partners Fund | Statement of Investments |
April 30, 2019
| | | Shares | | | Value (Note 2) | |
| Technology (continued) | | | | | | | | |
| Software (continued) | | | | | | | | |
| Oracle Corp. | | | 475,772 | | | $ | 26,324,465 | |
| | | | | | | | 73,294,102 | |
| | | | | | | | | |
| TOTAL TECHNOLOGY | | | | | | | 323,716,942 | |
| | | | | | | | | |
| TOTAL COMMON STOCKS | | | | | | | | |
| (Cost $1,041,716,616) | | | | | | | 1,268,719,591 | |
| | | 7-Day Yield | | | Shares | | | Value (Note 2) | |
| SHORT TERM INVESTMENTS (0.46%) | | | | | | | | | | | | |
| Money Market Fund (0.46%) | | | | | | | | | | | | |
| Dreyfus Treasury & Agency Cash Management, Institutional Shares | | | 2.300 | % | | | 5,888,338 | | | | 5,888,338 | |
| | | | | | | | | | | | | |
| TOTAL SHORT TERM INVESTMENTS | | | | | | | | | | | | |
| (Cost $5,888,338) | | | | | | | | | | | 5,888,338 | |
| | | | | | | | | | | | | |
| TOTAL INVESTMENTS (99.23%) | | | | | | | | | | | | |
| (Cost $1,047,604,954) | | | | | | | | | | $ | 1,274,607,929 | |
| | | | | | | | | | | | | |
| Other Assets In Excess Of Liabilities (0.77%) | | | | | | | | | | | 9,948,309 | |
| | | | | | | | | | | | | |
| NET ASSETS (100.00%) | | | | | | | | | | $ | 1,284,556,238 | |
| (a) | Non-Income Producing Security. |
For Fund compliance purposes, the Fund's industry classifications refer to any one or more of the industry sub-classifications used by one or more widely recognized market indexes or ratings group indexes, and/or as defined by Fund management. This definition may not apply for purposes of this report, which may combine industry sub-classifications for reporting ease. Industries are shown as a percentage of net assets.
See Accompanying Notes to Financial Statements.
| Annual Report | April 30, 2019 | 13 |
| Statement of Investments | Vulcan Value Partners Small Cap Fund |
April 30, 2019
| | | Shares | | | Value (Note 2) | |
| COMMON STOCKS (98.19%) | | | | | | | | |
| Communications (4.27%) | | | | | | | | |
| Internet (4.27%) | | | | | | | | |
| Despegar.com Corp.(a) | | | 1,589,866 | | | $ | 23,196,145 | |
| | | | | | | | | |
| TOTAL COMMUNICATIONS | | | | | | | 23,196,145 | |
| | | | | | | | | |
| Consumer, Cyclical (12.85%) | | | | | | | | |
| Distribution/Wholesale (3.48%) | | | | | | | | |
| WESCO International, Inc.(a) | | | 330,530 | | | | 18,919,537 | |
| | | | | | | | | |
| Home Furnishings (5.11%) | | | | | | | | |
| Howden Joinery Group PLC | | | 1,578,321 | | | | 10,455,312 | |
| Sleep Number Corp.(a) | | | 496,110 | | | | 17,264,628 | |
| | | | | | | | 27,719,940 | |
| | | | | | | | | |
| Retail (4.26%) | | | | | | | | |
| Sleep Country Canada Holdings, Inc. | | | 1,667,646 | | | | 23,128,210 | |
| | | | | | | | | |
| TOTAL CONSUMER, CYCLICAL | | | | | | | 69,767,687 | |
| | | | | | | | | |
| Consumer, Non-cyclical (14.31%) | | | | | | | | |
| Commercial Services (12.21%) | | | | | | | | |
| Sabre Corp. | | | 913,908 | | | | 18,972,730 | |
| Savills PLC | | | 1,586,099 | | | | 18,655,840 | |
| Sotheby's(a) | | | 680,301 | | | | 28,695,096 | |
| | | | | | | | 66,323,666 | |
| | | | | | | | | |
| Food - Flour & Grain (2.10%) | | | | | | | | |
| Ebro Foods SA | | | 536,986 | | | | 11,392,158 | |
| | | | | | | | | |
| TOTAL CONSUMER, NON-CYCLICAL | | | | | | | 77,715,824 | |
| | | | | | | | | |
| Financial (21.87%) | | | | | | | | |
| Diversified Financial Services (4.23%) | | | | | | | | |
| Virtus Investment Partners, Inc. | | | 187,174 | | | | 22,949,404 | |
| | | | | | | | | |
| Insurance (5.93%) | | | | | | | | |
| Axis Capital Holdings, Ltd. | | | 305,495 | | | | 17,367,391 | |
| Everest Re Group, Ltd. | | | 63,119 | | | | 14,864,524 | |
| | | | | | | | 32,231,915 | |
| | | | | | | | | |
| Real Estate (11.71%) | | | | | | | | |
| Cushman & Wakefield PLC(a) | | | 1,882,847 | | | | 36,979,115 | |
| 14 | www.vulcanvaluepartners.com |
| Vulcan Value Partners Small Cap Fund | Statement of Investments |
April 30, 2019
| | | Shares | | | Value (Note 2) | |
| Financial (continued) | | | | | | | | |
| Real Estate (continued) | | | | | | | | |
| Jones Lang LaSalle, Inc. | | | 172,299 | | | $ | 26,632,257 | |
| | | | | | | | 63,611,372 | |
| | | | | | | | | |
| TOTAL FINANCIAL | | | | | | | 118,792,691 | |
| | | | | | | | | |
| Industrial (32.06%) | | | | | | | | |
| Building Materials (5.31%) | | | | | | | | |
| Ibstock PLC | | | 8,465,845 | | | | 28,835,100 | |
| | | | | | | | | |
| Electrical Components & Equipment (3.64%) | | | | | | | | |
| Acuity Brands, Inc. | | | 135,112 | | | | 19,770,939 | |
| | | | | | | | | |
| Electronics (13.55%) | | | | | | | | |
| Coherent, Inc.(a) | | | 227,897 | | | | 33,731,035 | |
| Ituran Location and Control, Ltd. | | | 745,972 | | | | 27,429,390 | |
| Resideo Technologies, Inc.(a) | | | 547,134 | | | | 12,419,942 | |
| | | | | | | | 73,580,367 | |
| Engineering & Construction (3.43%) | | | | | | | | |
| frontdoor, Inc.(a) | | | 529,248 | | | | 18,650,700 | |
| | | | | | | | | |
| Machinery-Diversified (1.95%) | | | | | | | | |
| Concentric AB | | | 658,493 | | | | 10,566,784 | |
| | | | | | | | | |
| Miscellaneous Manufacturing (4.18%) | | | | | | | | |
| Carlisle Cos., Inc. | | | 86,234 | | | | 12,195,212 | |
| Crane Co. | | | 123,842 | | | | 10,532,762 | |
| | | | | | | | 22,727,974 | |
| | | | | | | | | |
| TOTAL INDUSTRIAL | | | | | | | 174,131,864 | |
| | | | | | | | | |
| Retail (2.77%) | | | | | | | | |
| Industrial Services (2.77%) | | | | | | | | |
| MSC Industrial Direct Co., Inc., Class A | | | 180,154 | | | | 15,069,882 | |
| | | | | | | | | |
| TOTAL RETAIL | | | | | | | 15,069,882 | |
| | | | | | | | | |
| Technology (10.06%) | | | | | | | | |
| Computers (5.06%) | | | | | | | | |
| Avast PLC(a) | | | 6,957,500 | | | | 27,489,941 | |
| | | | | | | | | |
| Software (5.00%) | | | | | | | | |
| ACI Worldwide, Inc.(a) | | | 463,909 | | | | 16,478,048 | |
| Annual Report | April 30, 2019 | 15 |
| Statement of Investments | Vulcan Value Partners Small Cap Fund |
April 30, 2019
| | | Shares | | | Value (Note 2) | |
| Technology (continued) | | | | | | | | |
| Software (continued) | | | | | | | | |
| Lectra | | | 444,102 | | | $ | 10,684,353 | |
| | | | | | | | 27,162,401 | |
| | | | | | | | | |
| TOTAL TECHNOLOGY | | | | | | | 54,652,342 | |
| | | | | | | | | |
| TOTAL COMMON STOCKS | | | | | | | | |
| (Cost $460,346,100) | | | | | | | 533,326,435 | |
| | | 7-Day Yield | | | Shares | | | Value (Note 2) | |
| SHORT TERM INVESTMENTS (3.30%) | | | | | | | | | | | | |
| Money Market Fund (3.30%) | | | | | | | | | | | | |
| Dreyfus Treasury & Agency Cash Management, Institutional Shares | | | 2.300 | % | | | 17,916,676 | | | | 17,916,676 | |
| | | | | | | | | | | | | |
| TOTAL SHORT TERM INVESTMENTS | | | | | | | | | | | | |
| (Cost $17,916,676) | | | | | | | | | | | 17,916,676 | |
| | | | | | | | | | | | | |
| TOTAL INVESTMENTS (101.49%) | | | | | | | | | | | | |
| (Cost $478,262,776) | | | | | | | | | | $ | 551,243,111 | |
| | | | | | | | | | | | | |
| Liabilities In Excess Of Other Assets (-1.49%) | | | | | | | | | | | (8,069,325 | ) |
| | | | | | | | | | | | | |
| NET ASSETS (100.00%) | | | | | | | | | | $ | 543,173,786 | |
| (a) | Non-Income Producing Security. |
For Fund compliance purposes, the Fund's industry classifications refer to any one or more of the industry sub-classifications used by one or more widely recognized market indexes or ratings group indexes, and/or as defined by Fund management. This definition may not apply for purposes of this report, which may combine industry sub-classifications for reporting ease. Industries are shown as a percentage of net assets.
See Accompanying Notes to Financial Statements.
| 16 | www.vulcanvaluepartners.com |
Statements of Assets and Liabilities
April 30, 2019
| | | Vulcan Value Partners
Fund | | Vulcan Value Partners
Small Cap Fund |
| ASSETS: | | | | |
| Investments, at value | | $ | 1,274,607,929 | | | $ | 551,243,111 | |
| Receivable for investments sold | | | 17,104,665 | | | | 2,552,951 | |
| Receivable for shares sold | | | 1,735,664 | | | | 155,064 | |
| Dividends receivable | | | 2,925,607 | | | | 851,319 | |
| Other assets | | | 16,891 | | | | 12,921 | |
| Total assets | | | 1,296,390,756 | | | | 554,815,366 | |
| | | | | | | | | |
| LIABILITIES: | | | | | | | | |
| Payable for investments purchased | | | 6,907,538 | | | | 9,851,178 | |
| Payable for shares redeemed | | | 3,675,163 | | | | 1,114,152 | |
| Payable to adviser | | | 1,054,739 | | | | 558,014 | |
| Payable for administration fees | | | 68,328 | | | | 30,188 | |
| Payable for transfer agency fees | | | 17,965 | | | | 18,250 | |
| Payable for delegated transfer agent equivalent services fees | | | 8,771 | | | | 4,817 | |
| Payable for professional fees | | | 26,203 | | | | 23,349 | |
| Payable for trustee fees and expenses | | | 11,622 | | | | 4,778 | |
| Payable for principal financial officer fees | | | 1,172 | | | | 494 | |
| Accrued expenses and other liabilities | | | 63,017 | | | | 36,360 | |
| Total liabilities | | | 11,834,518 | | | | 11,641,580 | |
| NET ASSETS | | $ | 1,284,556,238 | | | $ | 543,173,786 | |
| | | | | | | | | |
| NET ASSETS CONSIST OF: | | | | | | | | |
| | | | | | | | | |
| Paid-in capital (Note 5) | | $ | 1,048,277,515 | | | $ | 463,538,971 | |
| Total distributable earnings | | | 236,278,723 | | | | 79,634,815 | |
| NET ASSETS | | $ | 1,284,556,238 | | | $ | 543,173,786 | |
| | | | | | | | | |
| INVESTMENTS, AT COST | | $ | 1,047,604,954 | | | $ | 478,262,776 | |
| | | | | | | | | |
| PRICING OF SHARES: | | | | | | | | |
| Net Asset Value, offering and redemption price per share | | $ | 21.05 | | | $ | 17.31 | |
| Shares of beneficial interest outstanding (unlimited number of shares, no par value common stock authorized) | | | 61,022,770 | | | | 31,380,510 | |
See Accompanying Notes to Financial Statements.
| Annual Report | April 30, 2019 | 17 |
Statements of Operations
For the Year Ended April 30, 2019
| | | Vulcan Value Partners
Fund | | Vulcan Value Partners
Small Cap Fund |
| INVESTMENT INCOME: | | | | | | | | |
| Dividends | | $ | 19,975,034 | | | $ | 15,373,947 | |
| Foreign taxes withheld | | | (490,905 | ) | | | (821,407 | ) |
| Total investment income | | | 19,484,129 | | | | 14,552,540 | |
| | | | | | | | | |
| EXPENSES: | | | | | | | | |
| Investment advisory fees (Note 6) | | | 13,366,761 | | | | 9,349,426 | |
| Administrative fees | | | 401,331 | | | | 244,903 | |
| Transfer agency fees | | | 99,623 | | | | 102,782 | |
| Delegated transfer agent equivalent services fees | | | 124,292 | | | | 148,185 | |
| Professional fees | | | 36,024 | | | | 29,737 | |
| Custodian fees | | | 204,562 | | | | 138,717 | |
| Principal financial officer fees | | | 6,326 | | | | 3,674 | |
| Trustee fees and expenses | | | 46,066 | | | | 23,373 | |
| Recoupment of previously waived fees | | | – | | | | 49,307 | |
| ReFlow Fees (Note 2) | | | 38,268 | | | | 107,246 | |
| Other | | | 82,321 | | | | 79,381 | |
| Total expenses before waiver | | | 14,405,574 | | | | 10,276,731 | |
| Less fees waived/reimbursed by investment adviser (Note 6) | | | – | | | | (136,637 | ) |
| Total net expenses | | | 14,405,574 | | | | 10,140,094 | |
| NET INVESTMENT INCOME | | | 5,078,555 | | | | 4,412,446 | |
| | | | | | | | | |
| Net realized gain on investments(a) | | | 72,707,406 | | | | 97,491,245 | |
| Net realized loss on foreign currency transactions | | | (89,551 | ) | | | (62,782 | ) |
| Net realized gain | | | 72,617,855 | | | | 97,428,463 | |
| Net change in unrealized depreciation of investments | | | (3,636,934 | ) | | | (99,605,465 | ) |
| Net change in unrealized appreciation/(depreciation) on translation of assets and liabilities denominated in foreign currencies | | | (43,860 | ) | | | 22,873 | |
| Net change in unrealized depreciation | | | (3,680,794 | ) | | | (99,582,592 | ) |
| NET REALIZED AND UNREALIZED GAIN/(LOSS) ON INVESTMENTS | | | 68,937,061 | | | | (2,154,129 | ) |
| NET INCREASE IN NET ASSETS RESULTING FROM OPERATIONS | | $ | 74,015,616 | | | $ | 2,258,317 | |
| (a) | See Note 2 for gain/(loss) on In-Kind transactions. |
See Accompanying Notes to Financial Statements.
| 18 | www.vulcanvaluepartners.com |
| Vulcan Value Partners Fund | Statements of Changes in Net Assets |
| | | For the
Year Ended
April 30, 2019 | | For the
Year Ended
April 30, 2018 |
| OPERATIONS: | | | | |
| Net investment income | | $ | 5,078,555 | | | $ | 6,077,602 | |
| Net realized gain | | | 72,617,855 | | | | 70,439,403 | |
| Net change in unrealized appreciation/(depreciation) | | | (3,680,794 | ) | | | 84,016,759 | |
| Net increase in net assets resulting from operations | | | 74,015,616 | | | | 160,533,764 | |
| | | | | | | | | |
| DISTRIBUTIONS TO SHAREHOLDERS (Note 3): | | | | | | | | |
| Total distributions(a) | | | (98,666,500 | ) | | | (22,197,741 | ) |
| Net decrease in net assets from distributions | | | (98,666,500 | ) | | | (22,197,741 | ) |
| | | | | | | | | |
| SHARE TRANSACTIONS (Note 5): | | | | | | | | |
| Proceeds from sales of shares | | | 257,281,793 | | | | 160,766,374 | |
| Issued to shareholders in reinvestment of distributions | | | 85,760,192 | | | | 17,693,956 | |
| Cost of shares redeemed, net of redemption fees | | | (348,353,451 | ) | | | (286,946,421 | ) |
| Net decrease from share transactions | | | (5,311,466 | ) | | | (108,486,091 | ) |
| | | | | | | | | |
| Net increase/(decrease) in net assets | | | (29,962,350 | ) | | | 29,849,932 | |
| | | | | | | | | |
| NET ASSETS: | | | | | | | | |
| Beginning of year | | | 1,314,518,588 | | | | 1,284,668,656 | |
| End of year | | $ | 1,284,556,238 | | | $ | 1,314,518,588 | |
| (a) | For the year ended April 30, 2018, Total Distributions consisted of Net Investment Income of $7,670,305, and Net Realized Gains of $14,527,436. |
See Accompanying Notes to Financial Statements.
| Annual Report | April 30, 2019 | 19 |
| Statements of Changes in Net Assets | Vulcan Value Partners Small Cap Fund |
| | | For the
Year Ended
April 30, 2019 | | For the
Year Ended
April 30, 2018 |
| OPERATIONS: | | | | |
| Net investment income | | $ | 4,412,446 | | | $ | 943,927 | |
| Net realized gain | | | 97,428,463 | | | | 15,803,042 | |
| Net change in unrealized appreciation/(depreciation) | | | (99,582,592 | ) | | | 18,367,056 | |
| Net increase in net assets resulting from operations | | | 2,258,317 | | | | 35,114,025 | |
| | | | | | | | | |
| DISTRIBUTIONS TO SHAREHOLDERS (Note 3): | | | | | | | | |
| Total distributions(a) | | | (91,839,425 | ) | | | (72,595,325 | ) |
| Net decrease in net assets from distributions | | | (91,839,425 | ) | | | (72,595,325 | ) |
| | | | | | | | | |
| SHARE TRANSACTIONS (Note 5): | | | | | | | | |
| Proceeds from sales of shares | | | 162,197,866 | | | | 245,328,871 | |
| Issued to shareholders in reinvestment of distributions | | | 79,373,996 | | | | 58,614,533 | |
| Cost of shares redeemed, net of redemption fees | | | (805,375,212 | ) | | | (325,509,690 | ) |
| Net decrease from share transactions | | | (563,803,350 | ) | | | (21,566,286 | ) |
| | | | | | | | | |
| Net decrease in net assets | | | (653,384,458 | ) | | | (59,047,586 | ) |
| | | | | | | | | |
| NET ASSETS: | | | | | | | | |
| Beginning of year | | | 1,196,558,244 | | | | 1,255,605,830 | |
| End of year | | $ | 543,173,786 | | | $ | 1,196,558,244 | |
| (a) | For the year ended April 30, 2018, Total Distributions consisted of Net Investment Income of $2,029,542, and Net Realized Gains of $70,565,783. |
See Accompanying Notes to Financial Statements.
| 20 | www.vulcanvaluepartners.com |
Intentionally Left Blank
For a share outstanding throughout the years presented.
|
| |
| NET ASSET VALUE, BEGINNING OF PERIOD |
| INCOME/(LOSS) FROM OPERATIONS: |
| Net investment income(a) |
| Net realized and unrealized gain/(loss) on investments |
| Total from investment operations |
| |
| LESS DISTRIBUTIONS TO SHAREHOLDERS: |
| From net investment income |
| From net realized gains on investments |
| Total distributions |
| |
| Redemption fees added to paid-in capital |
| Increase/(decrease) in net asset value |
| NET ASSET VALUE, END OF YEAR |
| |
| Total return |
| |
| RATIOS AND SUPPLEMENTAL DATA: |
| Net assets, end of year (000's) |
| |
| Ratio of expenses to average net assets without fee waivers/reimbursements |
| Ratio of expenses to average net assets including fee waivers/reimbursements |
| Net investment income to average net assets including fee waivers/reimbursements |
| |
| Portfolio turnover rate |
| (a) | Per share numbers have been calculated using the average shares method. |
| (b) | Less than $0.005 per share. |
See Accompanying Notes to Financial Statements.
| 22 | www.vulcanvaluepartners.com |
| Vulcan Value Partners Fund |
For the Year
Ended April 30,
2019 | | For the Year
Ended April 30,
2018 | | For the Year
Ended April 30,
2017 | | For the Year
Ended April 30,
2016 | | For the Year
Ended April 30,
2015 |
| $ | 21.39 | | | $ | 19.30 | | | $ | 17.17 | | | $ | 19.97 | | | $ | 18.20 | |
| | | | | | | | | | | | | | | | | | | |
| | 0.08 | | | | 0.09 | | | | 0.18 | | | | 0.20 | | | | 0.22 | |
| | 1.13 | | | | 2.35 | | | | 2.18 | | | | (1.51 | ) | | | 2.77 | |
| | 1.21 | | | | 2.44 | | | | 2.36 | | | | (1.31 | ) | | | 2.99 | |
| | | | | | | | | | | | | | | | | | | |
| | (0.13 | ) | | | (0.12 | ) | | | (0.23 | ) | | | (0.13 | ) | | | (0.17 | ) |
| | (1.42 | ) | | | (0.23 | ) | | | – | | | | (1.36 | ) | | | (1.05 | ) |
| | (1.55 | ) | | | (0.35 | ) | | | (0.23 | ) | | | (1.49 | ) | | | (1.22 | ) |
| | | | | | | | | | | | | | | | | | | |
| | 0.00 | (b) | | | 0.00 | (b) | | | 0.00 | (b) | | | 0.00 | (b) | | | 0.00 | (b) |
| | (0.34 | ) | | | 2.09 | | | | 2.13 | | | | (2.80 | ) | | | 1.77 | |
| $ | 21.05 | | | $ | 21.39 | | | $ | 19.30 | | | $ | 17.17 | | | $ | 19.97 | |
| | | | | | | | | | | | | | | | | | | |
| | 6.80 | % | | | 12.72 | % | | | 13.85 | % | | | (6.49 | %) | | | 16.61 | % |
| | | | | | | | | | | | | | | | | | | |
| $ | 1,284,556 | | | $ | 1,314,519 | | | $ | 1,284,669 | | | $ | 1,528,080 | | | $ | 1,770,104 | |
| | | | | | | | | | | | | | | | | | | |
| | 1.08 | % | | | 1.08 | % | | | 1.07 | % | | | 1.08 | % | | | 1.08 | % |
| | 1.08 | % | | | 1.08 | % | | | 1.07 | % | | | 1.08 | % | | | 1.08 | % |
| | 0.38 | % | | | 0.46 | % | | | 1.01 | % | | | 1.10 | % | | | 1.12 | % |
| | | | | | | | | | | | | | | | | | | |
| | 73 | % | | | 50 | % | | | 49 | % | | | 85 | % | | | 64 | % |
| Annual Report | April 30, 2019 | 23 |
For a share outstanding throughout the years presented.
| |
| NET ASSET VALUE, BEGINNING OF PERIOD |
| INCOME/(LOSS) FROM OPERATIONS: |
| Net investment income(a) |
| Net realized and unrealized gain/(loss) on investments |
| Total from investment operations |
| |
| LESS DISTRIBUTIONS TO SHAREHOLDERS: |
| From net investment income |
| From net realized gains on investments |
| Total distributions |
| |
| Redemption fees added to paid-in capital |
| Increase/(decrease) in net asset value |
| NET ASSET VALUE, END OF YEAR |
| |
| Total return |
| |
| RATIOS AND SUPPLEMENTAL DATA: |
| Net assets, end of year (000's) |
| |
| Ratio of expenses to average net assets without fee waivers/reimbursements |
| Ratio of expenses to average net assets including fee waivers/reimbursements |
| Net investment income to average net assets including fee waivers/reimbursements |
| |
| Portfolio turnover rate |
| (a) | Per share numbers have been calculated using the average shares method. |
| (b) | Less than $0.005 per share. |
See Accompanying Notes to Financial Statements.
| 24 | www.vulcanvaluepartners.com |
| Vulcan Value Partners Small Cap Fund |
For the Year
Ended April 30,
2019 | | For the Year
Ended April 30,
2018 | | For the Year
Ended April 30,
2017 | | For the Year
Ended April 30,
2016 | | For the Year
Ended April 30,
2015 |
| $ | 19.52 | | | $ | 20.16 | | | $ | 16.58 | | | $ | 18.61 | | | $ | 18.74 | |
| | | | | | | | | | | | | | | | | | | |
| | 0.10 | | | | 0.02 | | | | 0.03 | | | | 0.10 | | | | 0.10 | |
| | 0.38 | | | | 0.59 | | | | 3.61 | | | | (1.05 | ) | | | 1.77 | |
| | 0.48 | | | | 0.61 | | | | 3.64 | | | | (0.95 | ) | | | 1.87 | |
| | | | | | | | | | | | | | | | | | | |
| | (0.12 | ) | | | (0.03 | ) | | | (0.06 | ) | | | (0.06 | ) | | | (0.11 | ) |
| | (2.57 | ) | | | (1.22 | ) | | | – | | | | (1.02 | ) | | | (1.89 | ) |
| | (2.69 | ) | | | (1.25 | ) | | | (0.06 | ) | | | (1.08 | ) | | | (2.00 | ) |
| | | | | | | | | | | | | | | | | | | |
| | 0.00 | (b) | | | 0.00 | (b) | | | 0.00 | (b) | | | 0.00 | (b) | | | 0.00 | (b) |
| | (2.21 | ) | | | (0.64 | ) | | | 3.58 | | | | (2.03 | ) | | | (0.13 | ) |
| $ | 17.31 | | | $ | 19.52 | | | $ | 20.16 | | | $ | 16.58 | | | $ | 18.61 | |
| | | | | | | | | | | | | | | | | | | |
| | 4.76 | % | | | 3.08 | % | | | 21.97 | % | | | (5.04 | %) | | | 10.74 | % |
| | | | | | | | | | | | | | | | | | | |
| $ | 543,174 | | | $ | 1,196,558 | | | $ | 1,255,606 | | | $ | 1,147,007 | | | $ | 1,133,122 | |
| | 1.27 | % | | | 1.24 | % | | | 1.25 | % | | | 1.25 | % | | | 1.26 | % |
| | 1.25 | % | | | 1.24 | % | | | 1.25 | % | | | 1.25 | % | | | 1.25 | % |
| | 0.54 | % | | | 0.08 | % | | | 0.18 | % | | | 0.61 | % | | | 0.56 | % |
| | | | | | | | | | | | | | | | | | | |
| | 68 | % | | | 68 | % | | | 52 | % | | | 80 | % | | | 73 | % |
| Annual Report | April 30, 2019 | 25 |
| Notes to Financial Statements |
April 30, 2019
1. ORGANIZATION
Financial Investors Trust (the “Trust”) is organized as a Delaware statutory trust and is registered as an open-end management investment company under the Investment Company Act of 1940, as amended (“1940 Act”). The Trust consists of multiple separate portfolios or series. This annual report describes the Vulcan Value Partners Fund and Vulcan Value Partners Small Cap Fund (each a “Fund” and collectively, the “Funds”). The Funds seek to achieve long-term capital appreciation.
2. SIGNIFICANT ACCOUNTING POLICIES
The accompanying financial statements were prepared in accordance with accounting principles generally accepted in the United States of America (“U.S. GAAP”), including policies specific to investment companies. The preparation of financial statements in conformity with U.S. GAAP requires management to make certain estimates and assumptions that affect the reported amounts of assets and liabilities and disclosures of contingent assets and liabilities at the date of the financial statements and the reported amounts of revenue and expenses during the period. Actual results could differ from those estimates. The Funds are considered an investment company for financial reporting purposes under U.S. GAAP and follows the accounting and reporting guidance applicable to investment companies in the Financial Accounting Standards Board Accounting Standards Codification Topic 946. The following is a summary of significant accounting policies consistently followed by the Funds in preparation of their financial statements.
Investment Valuation: The Funds generally value their securities based on market prices determined at the close of regular trading on the New York Stock Exchange (“NYSE”), normally 4:00 p.m. Eastern Time, on each day the NYSE is open for trading.
For equity securities and mutual funds that are traded on an exchange, the market price is usually the closing sale or official closing price on that exchange. In the case of equity securities not traded on an exchange, or if such closing prices are not otherwise available, the securities are valued at the mean of the most recent bid and ask prices on such day. Redeemable securities issued by open-end registered investment companies are valued at the investment company’s applicable net asset value, with the exception of exchange-traded open-end investment companies, which are priced as equity securities.
The market price for debt obligations is generally the quote supplied by an independent third-party pricing service approved by the Board of Trustees (the “Board”), which may use a matrix, formula or other objective method that takes into consideration quotations from dealers, market transactions in comparable investments, market indices and yield curves. If vendors are unable to supply a quote, or if the quote supplied is deemed to be unreliable, the market price may be determined using quotations received from one or more broker–dealers that make a market in the security.
Equity securities that are primarily traded on foreign securities exchanges are valued at the preceding closing values of such securities on their respective exchanges, except when an occurrence subsequent to the time a value was so established is likely to have changed such value. In such an event, the fair values of those securities are determined in good faith through consideration of other factors in accordance with procedures established by and under the general supervision of the Board.
| 26 | www.vulcanvaluepartners.com |
Notes to Financial Statements
April 30, 2019
When such prices or quotations are not available, or when Vulcan Value Partners, LLC (the “Adviser”) believes that they are unreliable, securities may be priced using fair value procedures approved by the Board.
Fair Value Measurements: A three-tier hierarchy has been established to classify fair value measurements for disclosure purposes. Inputs refer broadly to the assumptions that market participants would use in pricing the asset or liability, including assumptions about risk. Inputs may be observable or unobservable. Observable inputs are inputs that reflect the assumptions market participants would use in pricing the asset or liability that are developed based on market data obtained from sources independent of the reporting entity. Unobservable inputs are inputs that reflect the reporting entity’s own assumptions about the assumptions market participants would use in pricing the asset or liability that are developed based on the best information available. Various inputs are used in determining the value of each Fund’s investments as of the reporting period end. The designated input levels are not necessarily an indication of the risk or liquidity associated with these investments. These inputs are categorized in the following hierarchy under applicable financial accounting standards:
| Level 1 – | Unadjusted quoted prices in active markets for identical investments, unrestricted assets or liabilities that the Funds have the ability to access at the measurement date; |
| Level 2 – | Quoted prices which are not active, quoted prices for similar assets or liabilities in active markets or inputs other than quoted prices that are observable (either directly or indirectly) for substantially the full term of the asset or liability; and |
| Level 3 – | Significant unobservable prices or inputs (including the Funds’ own assumptions in determining the fair value of investments) where there is little or no market activity for the asset or liability at the measurement date. |
The following is a summary of each input used to value each Fund’s investments as of April 30, 2019:
Vulcan Value Partners Fund:
| Investments in Securities at Value | | Level 1 - Unadjusted Quoted Prices | | | Level 2 -
Other Significant Observable Inputs | | | Level 3 - Significant Unobservable Inputs | | | Total | |
| Common Stocks(a) | | $ | 1,268,719,591 | | | $ | – | | | $ | – | | | $ | 1,268,719,591 | |
| Short Term Investments | | | 5,888,338 | | | | – | | | | – | | | | 5,888,338 | |
| TOTAL | | $ | 1,274,607,929 | | | $ | – | | | $ | – | | | $ | 1,274,607,929 | |
Vulcan Value Partners Small Cap Fund:
| Investments in Securities at Value | | Level 1 - Unadjusted Quoted Prices | | | Level 2 -
Other Significant Observable Inputs | | | Level 3 - Significant Unobservable Inputs | | | Total | |
| Common Stocks(a) | | $ | 533,326,435 | | | $ | – | | | $ | – | | | $ | 533,326,435 | |
| Short Term Investments | | | 17,916,676 | | | | – | | | | – | | | | 17,916,676 | |
| TOTAL | | $ | 551,243,111 | | | $ | – | | | $ | – | | | $ | 551,243,111 | |
| (a) | For detailed descriptions, see the accompanying Statements of Investments. |
| Annual Report | April 30, 2019 | 27 |
Notes to Financial Statements
April 30, 2019
For the year ended April 30, 2019, the Funds did not have any securities that used significant unobservable inputs (Level 3) in determining fair value.
Investment Transactions and Investment Income: Investment transactions are accounted for on the date the investments are purchased or sold (trade date). Realized gains and losses from investment transactions are reported on an identified cost basis, which is the same basis the Funds use for federal income tax purposes. Interest income, which includes accretion of discounts and amortization of premiums, is accrued and recorded as earned. Dividend income is recognized on the ex-dividend date or, for certain foreign securities, as soon as information is available to the Funds. All of the realized and unrealized gains and losses and net investment income, are allocated daily to each class in proportion to its average daily net assets.
ReFlow Liquidity Program: Each Fund may participate in the ReFlow liquidity program, which is designed to provide an alternative liquidity source for mutual funds experiencing net redemptions of their shares. Pursuant to the program, ReFlow Fund, LLC (“ReFlow”) provides participating mutual funds with a source of cash to meet net shareholder redemptions by standing ready each business day to purchase fund shares up to the value of the net shares redeemed by other shareholders that are to settle the next business day. ReFlow will purchase shares of the Fund at net asset value and will not be subject to any investment minimums. Following purchases of Fund shares, ReFlow then generally redeems those shares when the Fund experiences net subscriptions, at the end of a maximum holding period determined by ReFlow (currently 28 days), or at other times as the Fund may request. ReFlow may choose to redeem its position in the Fund with an in-kind transfer of securities, instead of cash, enabling the Fund to avoid a realization of capital gains on the securities it transfers. ReFlow will not be subject to any short-term redemption fees. While ReFlow holds Fund shares, it will have the same rights and privileges with respect to those shares as any other shareholder. For use of the ReFlow service, a Fund pays a fee to ReFlow each time it purchases Fund shares, calculated by applying to the purchase amount a fee rate determined through an automated daily auction among participating mutual funds. The current minimum fee rate is 0.20% of the value of the Fund shares purchased by ReFlow although the Fund may submit a bid at a higher fee rate if it determines that doing so is in the best interest of Fund shareholders. In accordance with federal securities laws, ReFlow is prohibited from acquiring more than 3% of the outstanding voting securities of a Fund. There is no assurance that ReFlow will have sufficient funds available to meet the Funds’ liquidity needs on a particular day. During the year ended April 30, 2019, the Funds participated in ReFlow. Fees associated with ReFlow are disclosed in the Statements of Operations.
Real Estate Investment Trusts (“REITs”): The Funds may invest a portion of their assets in REITs and are subject to certain risks associated with direct investment in REITs. REITs may be affected by changes in the value of their underlying properties and by defaults by borrowers or tenants. REITs depend generally on their ability to generate cash flow to make distributions to shareowners, and certain REITs have self-liquidation provisions by which mortgages held may be paid in full and distributions of capital returns may be made at any time. In addition, the performance of a REIT may be affected by its failure to qualify for tax-free pass-through of income under the Internal Revenue Code of 1986, as amended (the “Code”), or its failure to maintain exemption from registration under the 1940 Act. A Fund’s investments in REITs may result in such Fund’s receipt of cash in excess of the REITs’ earnings. If the Fund receives such distributions all or a portion of these distributions will constitute a return of capital to such Fund. Receiving a return
| 28 | www.vulcanvaluepartners.com |
Notes to Financial Statements
April 30, 2019
of capital distribution from REITs will reduce the amount of income available to be distributed to Fund shareholders. Income from REITs generally will not be eligible for treatment as qualified dividend income. As the final character of the distributions is not known until reported by the REITs on their 1099s, the Funds utilize an average of the prior year’s reallocation information as an estimate for the current year character of distributions.
Foreign Securities: The Funds may directly purchase securities of foreign issuers. Investing in securities of foreign issuers involves special risks not typically associated with investing in securities of U.S. issuers. The risks include possible reevaluation of currencies, the inability to repatriate foreign currency, less complete financial information about companies and possible future adverse political and economic developments. Moreover, securities of many foreign issuers and their markets may be less liquid and their prices more volatile than those of securities of comparable U.S. issuers.
Foreign Currency Translation: The books and records of the Funds are maintained in U.S. dollars. Investment valuations and other assets and liabilities initially expressed in foreign currencies are converted each business day into U.S. dollars based upon current exchange rates. Prevailing foreign exchange rates may generally be obtained at the close of the NYSE (normally, 4:00 p.m. Eastern Time). The portion of realized and unrealized gains or losses on investments due to fluctuations in foreign currency exchange rates is not separately disclosed and is included in realized and unrealized gains or losses on investments, when applicable.
In-Kind Redemptions: During the year ended April 30, 2019, the Vulcan Value Partners Fund and the Vulcan Value Partners Small Cap Fund distributed portfolio securities rather than cash as payment for certain redemptions of fund shares (in-kind redemptions) in the amount of $47,402,507 and $18,778,070, respectively. For financial reporting purposes, the Vulcan Value Partners Fund and the Vulcan Value Partners Small Cap Fund recognized gains on the in-kind redemptions in the amount of $18,277,073 and $10,160,499, respectively. For tax purposes, the gains are not recognized.
Trust Expenses: Some expenses of the Trust can be directly attributed to the Funds. Expenses which cannot be directly attributed are apportioned among all funds in the Trust based on average net assets of each fund.
Fund Expenses: Expenses that are specific to a Fund are charged directly to that Fund.
Federal Income Taxes: Each Fund complies with the requirements under Subchapter M of the Internal Revenue Code of 1986, as amended, applicable to regulated investment companies and intends to distribute substantially all of its net taxable income and net capital gains, if any, each year so that it will not be subject to excise tax on undistributed income and gains. The Funds are not subject to income taxes to the extent such distributions are made.
As of and during the year ended April 30, 2019, the Funds did not have a liability for any unrecognized tax benefits. The Funds file U.S. federal, state, and local tax returns as required. The Fund’s tax returns are subject to examination by the relevant tax authorities until expiration of the applicable statute of limitations, which is generally three years after the filing of the tax return for
| Annual Report | April 30, 2019 | 29 |
Notes to Financial Statements
April 30, 2019
federal purposes and four years for most state returns. Tax returns for open years have incorporated no uncertain tax positions that require a provision for income taxes.
Distributions to Shareholders: Each Fund normally pays dividends and distributes capital gains, if any, on an annual basis. Income dividend distributions are derived from dividends and other income each Fund receives from its investments, including short-term capital gains. Long term capital gain distributions are derived from gains realized when each Fund sells a security it has owned for more than a year. Each Fund may make additional distributions and dividends at other times if the portfolio manager believes doing so may be necessary for each Fund to avoid or reduce taxes.
3. TAX BASIS INFORMATION
Reclassifications:As of April 30, 2019 permanent differences in book and tax accounting were reclassified. These differences had no effect on net assets and were primarily attributed to in-kind redemptions. The reclassifications were as follows:
| Fund | | Paid-in Capital | | | Distributable earnings | |
| Vulcan Value Partners Fund | | $ | 10,160,499 | | | $ | (10,160,499 | ) |
| Vulcan Value Partners Small Cap Fund | | | 18,277,174 | | | | (18,277,174 | ) |
Tax Basis of Investments:As of April 30, 2019, the aggregate cost of investments, gross unrealized appreciation/(depreciation) and net unrealized appreciation for federal tax purposes was as follows:
| | | Vulcan Value Partners Fund | | | Vulcan Value Partners Small Cap Fund | |
| Gross appreciation (excess of value over tax cost) | | $ | 249,722,178 | | | $ | 90,675,974 | |
| Gross depreciation (excess of tax cost over value) | | | (31,408,289 | ) | | | (25,553,010 | ) |
| Net (depreciation) of foreign currency | | | (59,635 | ) | | | (8,500 | ) |
| Net unrealized appreciation | | $ | 218,254,254 | | | $ | 65,114,464 | |
| Cost of investments for income tax purposes | | $ | 1,056,294,040 | | | $ | 486,120,147 | |
Components of Earnings: As of April 30, 2019, components of distributable earnings were as follows:
| | | Vulcan Value Partners Fund | | | Vulcan Value Partners Small Cap Fund | |
| Accumulated capital gains | | | 18,024,469 | | | | 14,520,351 | |
| Net unrealized appreciation on investments | | | 218,254,254 | | | | 65,114,464 | |
| Total | | $ | 236,278,723 | | | $ | 79,634,815 | |
| 30 | www.vulcanvaluepartners.com |
Notes to Financial Statements
April 30, 2019
Tax Basis of Distributions to Shareholders: The character of distributions made during the year from net investment income or net realized gains may differ from its ultimate characterization for federal income tax purposes. Also, due to the timing of dividend distributions, the fiscal year in which amounts are distributed may differ from the fiscal year in which the income or realized gain were recorded by each Fund.
The tax character of distributions paid by the Funds for the fiscal year ended April 30, 2019 were as follows:
| | | Ordinary Income | | | Long-Term Capital Gain | |
| 2019 | | | | | | |
| Vulcan Value Partners Fund | | $ | 56,597,050 | | | $ | 42,069,450 | |
| Vulcan Value Partners Small Cap Fund | | | 10,950,971 | | | | 80,888,454 | |
The tax character of distributions paid by the Funds for the fiscal year ended April 30, 2018 were as follows
| | | Ordinary Income | | | Long-Term Capital Gain | |
| 2018 | | | | | | |
| Vulcan Value Partners Fund | | $ | 22,197,741 | | | $ | – | |
| Vulcan Value Partners Small Cap Fund | | | 59,551,178 | | | | 13,044,147 | |
4. SECURITIES TRANSACTIONS
The cost of purchases and proceeds from sales of securities (excluding short-term securities and in-kind redemptions) during the year ended April 30, 2019 were as follows:
| Fund | | Purchases of Securities | | | Proceeds From Sales of Securities | |
| Vulcan Value Partners Fund | | $ | 956,070,699 | | | $ | 1,019,193,894 | |
| Vulcan Value Partners Small Cap Fund | | | 522,151,205 | | | | 1,092,224,538 | |
5. SHARES OF BENEFICIAL INTEREST
The capitalization of the Trust consists of an unlimited number of shares of beneficial interest with no par value per share. Holders of the shares of the Funds of the Trust have one vote for each share held and a proportionate fraction of a vote for each fractional share. All shares issued and outstanding are fully paid and are transferable and redeemable at the option of the shareholder. Purchasers of the shares do not have any obligation to make payments to the Trust or its creditors solely by reason of the purchasers’ ownership of the shares. Shares have no pre-emptive rights.
Shares redeemed within 90 days of purchase may incur a 2% short-term redemption fee deducted from the redemption amount. The Vulcan Value Partners Fund and the Vulcan Value Partners Small Cap Fund retained $16,120 and $22,728, respectively, for the year ended April 30, 2019, and $3,889
| Annual Report | April 30, 2019 | 31 |
Notes to Financial Statements
April 30, 2019
and $11,246, respectively, for the year ended April 30, 2018, which is reflected in the “Cost of shares redeemed, net of redemption fees” in the Statements of Changes in Net Assets.
Transactions in shares of capital stock for the dates listed below were as follows:
Vulcan Value Partners Fund
| | | For the Year Ended April 30, 2019 | | | For the Year Ended April 30, 2018 | |
| Shares Sold | | | 12,191,768 | | | | 7,896,160 | |
| Shares Issued in Reinvestment of Dividends | | | 4,689,102 | | | | 870,263 | |
| Less Shares Redeemed | | | (17,310,102 | ) | | | (13,886,874 | ) |
| Net Decrease | | | (429,232 | ) | | | (5,120,451 | ) |
Vulcan Value Partners Small Cap Fund
| | | For the Year Ended April 30, 2019 | | | For the Year Ended April 30, 2018 | |
| Shares Sold | | | 9,339,047 | | | | 12,345,631 | |
| Shares Issued in Reinvestment of Dividends | | | 5,297,515 | | | | 3,018,064 | |
| Less Shares Redeemed | | | (44,554,915 | ) | | | (16,352,775 | ) |
| Net Decrease | | | (29,918,353 | ) | | | (989,080 | ) |
6. MANAGEMENT AND RELATED-PARTY TRANSACTIONS
The Adviser, subject to the authority of the Board, is responsible for the overall management and administration of the Funds’ business affairs. The Adviser manages the investments of the Funds in accordance with each Fund’s investment objective, policies and limitations and investment guidelines established jointly by the Adviser and the Board. Pursuant to the Investment Advisory Agreement (the “Advisory Agreement”), the Funds pay the Adviser an annual management fee of 1.00% and 1.15% for Vulcan Value Partners Fund and Vulcan Value Partners Small Cap Fund, respectively, based on each Fund’s average daily net assets. The management fee is paid on a monthly basis.
The Adviser has contractually agreed to limit each of the Fund’s total annual fund operating expenses (exclusive of acquired fund fees and expenses, brokerage expenses, interest expense, taxes and extraordinary expenses) to 1.25% of each Fund’s average daily net assets. This agreement (the “Expense Agreement”) is in effect from September 1, 2018 through August 31, 2019. The prior Expense Agreement was in effect from September 1, 2017 through August 31, 2018. The Adviser will be permitted to recover, on a class-by-class basis, expenses it has borne through the Expense Agreement to the extent that a Fund’s expenses in later periods fall below the expense cap in effect at the time of waiver or reimbursement. Notwithstanding the foregoing, the Funds will not be obligated to pay any such fees and expenses more than three years after the date of the waiver or reimbursement. The Adviser may not discontinue or modify this waiver prior to August 31, 2019 without the approval by the Funds’ Board.
| 32 | www.vulcanvaluepartners.com |
Notes to Financial Statements
April 30, 2019
For the year ended April 30, 2019, the fee waivers and/or reimbursements and recoupment amounts were as follows:
| Fund | | Fees Waived/Reimbursed By Adviser | | | Recoupment of Previously Waived Fees by Adviser | |
| Vulcan Value Partners Fund | | $ | – | | | $ | – | |
| Vulcan Value Partners Small Cap Fund | | | 136,637 | | | | 49,307 | |
As of April 30, 2019, the balances of recoupable expenses for each Fund were as follows:
| Fund | | Expires 2020 | | | Expires 2021 | | | Expires 2022 | | | Total | |
| Vulcan Value Partners Fund | | $ | – | | | $ | – | | | $ | – | | | $ | – | |
| Vulcan Value Partners Small Cap Fund | | | – | | | | – | | | | 87,330 | | | | 87,330 | |
Fund Administrator Fees and Expenses: ALPS Fund Services, Inc. (“ALPS”) serves as administrator to the Funds and the Funds have agreed to pay expenses incurred in connection with their administrative activities. Pursuant to an Administration Agreement, ALPS provides operational services to the Funds including, but not limited to fund accounting and fund administration and generally assist in each Fund’s operations. Officers of the Trust are employees of ALPS. The Funds’ administration fee is accrued on a daily basis and paid monthly. Administration fees paid by the Funds for the year ended April 30, 2019 are disclosed in the Statements of Operations.
ALPS is reimbursed by the Funds for certain out-of-pocket expenses.
Transfer Agent: ALPS serves as transfer, dividend paying and shareholder servicing agent for the Funds. ALPS receives an annual minimum fee, a fee based upon the number of shareholder accounts, and is also reimbursed by the Funds for certain out-of-pocket expenses. Transfer agent fees paid by the Funds for the year ended April 30, 2019 are disclosed in the Statements of Operations.
Compliance Services: ALPS provides services that assist the Trust’s chief compliance officer in monitoring and testing the policies and procedures of the Trust in conjunction with requirements under Rule 38a-1 under the 1940 Act and receives an annual base fee. ALPS is reimbursed for certain out-of-pocket expenses by the Funds. Vulcan pays this fee on behalf of the Funds.
Principal Financial Officer:ALPS Fund Services, Inc. (“ALPS” and the “Administrator”) (an affiliate of ADI) receives an annual fee for providing principal financial officer services to the Funds. Principal financial officer fees paid by the Fund for the year ended April 30, 2019 are disclosed in the Statements of Operations.
Distributor:ALPS Distributors, Inc. (“ADI” or the “Distributor”) (an affiliate of ALPS Fund Services, Inc.) acts as the distributor of each Fund’s shares pursuant to a Distribution Agreement with the Trust. Shares are sold on a continuous basis by ADI as agent for the Funds, and ADI has agreed to use its best efforts to solicit orders for the sale of each Fund’s shares, although it is not obliged to sell any particular amount of shares. ADI is not entitled to any compensation for its services as Distributor. ADI is registered as a broker-dealer with the U.S. Securities and Exchange Commission. Certain intermediaries may charge networking, omnibus account or other administrative fees with
| Annual Report | April 30, 2019 | 33 |
Notes to Financial Statements
April 30, 2019
respect to transactions in shares of the Funds. Transactions may be processed through the National Securities Clearing Corporation (“NSCC”) or similar systems or processed on a manual basis. These fees are paid by the Funds to the Distributor, which uses such fees to reimburse intermediaries. In the event an intermediary receiving payments from the Distributor on behalf of the Funds converts from a networking structure to an omnibus account structure or otherwise experiences increased costs, fees borne by the Funds may increase. Fees are disclosed on the Statements of Operations as “Delegated transfer agent equivalent services fees”.
Trustees:The fees and expenses of the independent trustees of the Board are presented in the Statement of Operations.
7. INDEMNIFICATIONS
Under the Trust’s organizational documents, its Officers and Trustees are indemnified against certain liability arising out of the performance of their duties to the Trust. Additionally, in the normal course of business, the Trust enters into contracts with service providers that may contain general indemnification clauses which may permit indemnification to the extent permissible under applicable law. The Trust’s maximum exposure under these arrangements is unknown, as this would involve future claims that may be made against the Trust that have not yet occurred.
8. RECENT ACCOUNTING PRONOUCEMENTS
On October 4, 2018, the SEC amended Regulation S-X to require certain financial statement disclosure requirements to conform them to US GAAP for investment companies. Effective November 4, 2018, the Funds adopted disclosure requirement changes for Regulation S-X and these changes are reflected throughout this report. The Funds’ adoption of those amendments, effective with the financial statements prepared as of April 30, 2019, had no effect on the Funds’ net assets or results of operations.
In August 2018, the Financial Accounting Standards Board (“FASB”) issued Accounting Standards Update (“ASU”) 2018-13, which changes the fair value measurement disclosure requirements of FASB Accounting Standards Codification Topic 820, Fair Value Measurement. The update to Topic 820 includes new, eliminated, and modified disclosure requirements. ASU 2018-13 is effective for fiscal years beginning after December 15, 2019, including interim periods. Early adoption is permitted for any eliminated or modified disclosures. The Funds early adopted effective with the financial statements prepared as of April 30, 2019, and they had no effect on the Funds’ net assets or results of operations.
9. SUBSEQUENT EVENT
Subsequent events after the date of the Statements of Assets and Liabilities have been evaluated through the date the financial statements were issued.
| 34 | www.vulcanvaluepartners.com |
Report of Independent Registered Public Accounting Firm
To the shareholders and the Board of Trustees of Financial Investors Trust
Opinion on the Financial Statements and Financial Highlights
We have audited the accompanying statements of assets and liabilities, including the statements of investments, of Vulcan Value Partners Fund and Vulcan Value Partners Small Cap Fund (the "Funds"), two of the funds constituting the Financial Investors Trust, as of April 30, 2019, the related statements of operations for the year then ended, the statements of changes in net assets for each of the two years in the period then ended, the financial highlights for each of the five years in the period then ended, and the related notes. In our opinion, the financial statements and financial highlights present fairly, in all material respects, the financial position of Vulcan Value Partners Fund and Vulcan Value Partners Small Cap Fund of the Financials Investors Trust as of April 30, 2019, and the results of their operations for the year then ended, the changes in their net assets for each of the two years in the period then ended, and the financial highlights for each of the five years in the period then ended in conformity with accounting principles generally accepted in the United States of America.
Basis for Opinion
These financial statements and financial highlights are the responsibility of the Funds’ management. Our responsibility is to express an opinion on the Funds’ financial statements and financial highlights based on our audits. We are a public accounting firm registered with the Public Company Accounting Oversight Board (United States) (PCAOB) and are required to be independent with respect to the Funds in accordance with the U.S. federal securities laws and the applicable rules and regulations of the Securities and Exchange Commission and the PCAOB.
We conducted our audits in accordance with the standards of the PCAOB. Those standards require that we plan and perform the audit to obtain reasonable assurance about whether the financial statements and financial highlights are free of material misstatement, whether due to error or fraud. The Funds are not required to have, nor were we engaged to perform, an audit of their internal control over financial reporting. As part of our audits we are required to obtain an understanding of internal control over financial reporting but not for the purpose of expressing an opinion on the effectiveness of the Funds’ internal control over financial reporting. Accordingly, we express no such opinion.
Our audits included performing procedures to assess the risks of material misstatement of the financial statements and financial highlights, whether due to error or fraud, and performing procedures that respond to those risks. Such procedures included examining, on a test basis, evidence regarding the amounts and disclosures in the financial statements and financial highlights. Our audits also included evaluating the accounting principles used and significant estimates made by management, as well as evaluating the overall presentation of the financial statements and financial highlights. Our procedures included confirmation of securities owned as of April 30, 2019, by correspondence with the custodian and brokers; when replies were not received from brokers, we performed other auditing procedures. We believe that our audits provide a reasonable basis for our opinion.
DELOITTE & TOUCHE LLP
Denver, Colorado
June 25, 2019
We have served as the auditor of one or more investment companies advised by Vulcan Value Partners, LLC since 2010.
| Annual Report | April 30, 2019 | 35 |
Disclosure Regarding Approval of Fund Advisory Agreements
April 30, 2019 (Unaudited)
Vulcan Funds
On December 11, 2018, the Trustees met in person to discuss, among other things, the approval of the Investment Advisory Agreement between Vulcan Value Partners, LLC (“Vulcan”) and the Trust, with respect to the Vulcan Value Partners Fund and the Vulcan Value Partners Small Cap Fund (together, the “Vulcan Funds”), in accordance with Section 15(c) of the 1940 Act. In renewing and approving the Investment Advisory Agreement with Vulcan, the Trustees, including the Independent Trustees, considered the following factors with respect to the Vulcan Funds:
Nature, Extent, and Quality of the Services under the Investment Advisory Agreement: The Trustees received and considered information regarding the nature, extent, and quality of services to be provided to the Vulcan Funds under the Investment Advisory Agreement. The Trustees reviewed certain background materials supplied by Vulcan in its presentation, including its Form ADV.
The Trustees reviewed and considered Vulcan’s investment advisory personnel, its history as an asset manager, and its performance and the amount of assets currently under management by Vulcan. The Trustees also reviewed the research and decision-making processes utilized by Vulcan, including the methods adopted to seek to achieve compliance with the investment objectives, policies, and restrictions of the Vulcan Funds.
The Trustees considered the background and experience of Vulcan’s management in connection with the Vulcan Funds, including reviewing the qualifications, backgrounds, and responsibilities of the management team primarily responsible for the day-to-day portfolio management of the Vulcan Funds and the extent of the resources devoted to research and analysis of actual and potential investments.
The Trustees also reviewed, among other things, Vulcan’s insider trading policies and procedures and its Code of Ethics.
Performance:The Trustees reviewed performance information for each of the Vulcan Funds for the 3-month, 1-year, 3-year, 5-year, and since inception periods ended September 30, 2018. That review included a comparison of each Fund’s performance to the performance universe median of a group of funds selected by an independent provider of investment company data (the “Data Provider”). The Trustees noted that the performance of the Vulcan Value Partners Fund was above its respective Data Provider universe median performance for the 3-month, 1-year, 3-year, 5-year, and since inception periods ended September 30, 2018, and the performance of the Vulcan Value Partners Small Cap Fund was above its respective Data Provider universe median performance for the 3-month and since inception periods ended September 30, 2018 and below its respective Data Provider universe median performance for the 1-year, 3-year, and 5-year periods ended September 30, 2018. The Trustees also considered Vulcan’s discussion of each Fund’s underlying portfolio diversification categories, its top contributors and top detractors, as well as Vulcan’s performance and reputation generally and its investment techniques, risk management controls, and decision-making processes.
Investment Advisory Fee Rate: The Trustees reviewed and considered the contractual annual advisory fee paid by the Trust, on behalf of the Vulcan Funds, to Vulcan of 1.00% of the Vulcan Value Partners Fund’s daily average net assets and 1.15% of the Vulcan Value Partners Small Cap
| 36 | www.vulcanvaluepartners.com |
Disclosure Regarding Approval of Fund Advisory Agreements
April 30, 2019 (Unaudited)
Fund’s daily average net assets, in light of the extent and quality of the advisory services provided by Vulcan to the Vulcan Funds.
The Board received and considered information including a comparison of each Fund’s contractual and actual advisory fees and overall expenses with those of funds in the peer group and universe of funds selected by the Data Provider. The Trustees noted that the contractual advisory fee rate of both Vulcan Funds was above the respective Data Provider peer group median contractual advisory fee rate.
Total Expense Ratios: The Trustees further reviewed and considered the total expense ratio (after waivers) of 1.08% for the Vulcan Value Partners Fund and 1.24% for the Vulcan Value Partners Small Cap Fund. The Trustees noted that the total expense ratio (after waivers) of the Vulcan Value Partners Fund was the same as the Data Provider peer group median total expense ratio (after waivers) and the total expense ratio (after waivers) of the Vulcan Value Partners Small Cap Fund was below the Data Provider peer group median total expense ratio (after waivers).
Comparable Accounts: The Trustees noted certain information provided by Vulcan regarding fees charged to its other clients utilizing a strategy similar to that employed by the Vulcan Funds.
Profitability:The Trustees received and considered a retrospective and projected profitability analysis prepared by Vulcan based on the fees payable under the Investment Advisory Agreement with respect to each Vulcan Fund. The Trustees considered the profits, if any, anticipated to be realized by Vulcan in connection with the operation of each Vulcan Fund. The Board then reviewed Vulcan’s audited financial statements for the years ended December 31, 2017 and 2016, provided supplementally, in order to analyze the financial condition and stability and profitability of Vulcan.
Economies of Scale: The Trustees considered whether economies of scale in the provision of services to the Vulcan Funds will be passed along to the shareholders under the Investment Advisory Agreement.
Other Benefits to the Adviser: The Trustees reviewed and considered any other incidental benefits derived or to be derived by Vulcan from its relationship with the Vulcan Funds, including whether soft dollar arrangements were used.
In renewing Vulcan as the investment adviser to the Vulcan Funds and renewing the Investment Advisory Agreement and the fees charged under the Investment Advisory Agreement, the Trustees concluded that no single factor reviewed by the Trustees was identified by the Trustees to be determinative as the principal factor in whether to renew the Investment Advisory Agreement. Further, the Independent Trustees were advised by separate independent legal counsel throughout the process. The Trustees, including all of the Independent Trustees, concluded that:
| ● | the nature, extent, and quality of services rendered by Vulcan under the Investment Advisory Agreement with respect to the Vulcan Funds were adequate; |
| ● | the performance of the Vulcan Value Partners Fund was above its respective Data Provider universe median performance for the 3-month, 1-year, 3-year, 5-year, and |
| Annual Report | April 30, 2019 | 37 |
Disclosure Regarding Approval of Fund Advisory Agreements
April 30, 2019 (Unaudited)
since inception periods ended September 30, 2018, and the performance of the Vulcan Value Partners Small Cap Fund was above its respective Data Provider universe median performance for the 3-month and since inception periods ended September 30, 2018 and below its respective Data Provider universe median performance for the 1-year, 3-year, and 5-year periods ended September 30, 2018;
| ● | each Vulcan Fund’s contractual advisory fee rate was above its Data Provider peer group median contractual advisory fee rate; |
| ● | the total expense ratio (after waivers) of the Vulcan Value Partners Fund was the same as the Data Provider peer group median total expense ratio (after waivers) and the total expense ratio (after waivers) of the Vulcan Value Partners Small Cap Fund was below the Data Provider peer group median total expense ratio (after waivers); |
| ● | bearing in mind the limitations of comparing different types of managed accounts and the different levels of service typically associated with such accounts, the fee structures applicable to Vulcan’s other clients employing a comparable strategy to one or more of the Vulcan Funds were not indicative of any unreasonableness with respect to the advisory fees proposed to be payable by the Vulcan Funds; |
| ● | the profit, if any, realized by Vulcan in connection with the operation of each Vulcan Fund is not unreasonable to such Vulcan Fund; and |
| ● | there were no material economies of scale or other incidental benefits accruing to Vulcan in connection with its relationship with the Vulcan Funds. |
Based on the Trustees’ deliberations and their evaluation of the information described above, the Trustees, including all of the Independent Trustees, concluded that Vulcan’s compensation for investment advisory services is consistent with the best interests of each Vulcan Fund and their shareholders.
| 38 | www.vulcanvaluepartners.com |
Additional Information
April 30, 2019 (Unaudited)
1. FUND HOLDINGS
The Funds file their complete schedule of portfolio holdings with the Securities and Exchange Commission (the “SEC”) for the first and third quarters of each fiscal year within 60 days after the end of the period. Copies of the Funds’ previously filed Form NQs are available without charge on the SEC website at http://www.sec.gov.
2. FUND PROXY VOTING POLICIES, PROCEDURES AND SUMMARIES
The Funds’ policies and procedures used in determining how to vote proxies and information regarding how the Fund voted proxies relating to portfolio securities during the most recent prior 12-month period ending June 30 are available without charge, (1) upon request, by calling (toll-free) (866)-759-5679 and (2) on the SEC’s website at http://www.sec.gov.
3. TAX DESIGNATIONS
The Funds designate the following for federal income tax purposes for the calendar year ended December 31, 2018:
| | Qualified Dividend Income | Dividend Received Deduction |
| Vulcan Value Partners Fund | 29.26% | 23.68% |
| Vulcan Value Partners Small Cap Fund | 100.00% | 36.87% |
In early 2019, if applicable, shareholders of record received this information for the distributions paid to them by the Funds during the calendar year 2018 via Form 1099. The Funds will notify shareholders in early 2020 of amounts paid to them by the Funds, if any, during the calendar year 2019.
Pursuant to Section 852(b)(3) of the Internal Revenue Code, the Vulcan Value Partners Fund and the Vulcan Value Partners Small Cap Fund designated $42,069,450 and $80,888,454 as long-term capital gain dividends.
| Annual Report | April 30, 2019 | 39 |
Trustees and Officers
April 30, 2019 (Unaudited)
Additional information regarding the Fund’s trustees is included in the Statement of Additional Information, which can be obtained without charge by calling 877-421-5078.
INDEPENDENT TRUSTEES
Name,
Address*
& Year
of Birth | Position(s)
Held with
Fund | Term of
Office** and
Length of
Time Served | Principal Occupation(s)
During Past 5 Years*** | Number of
Funds in
Fund
Complex
Overseen
by
Trustee**** | Other
Directorships
Held by Trustee
During Past
5 Years*** |
| Mary K. Anstine, 1940 | Trustee and Chairman | Ms. Anstine was elected at a special meeting of shareholders held on March 21, 1997 and re-elected at a special meeting of shareholders held on August 7, 2009. Ms. Anstine was appointed Chairman of the Board at the June 6, 2017 meeting of the Board of Trustees. | Ms. Anstine was formerly an Executive Vice President of First Interstate Bank of Denver until 1994, President/Chief Executive Officer of HealthONE Alliance, Denver, Colorado, from 1994 to 2004, and has been retired since 2004. Ms. Anstine is also Trustee/Director of AV Hunter Trust and Colorado Uplift Board. Ms. Anstine was formerly a Director of the Trust Bank of Colorado (later purchased and now known as Northern Trust Bank), HealthONE and Denver Area Council of the Boy Scouts of America, and a member of the American Bankers Association Trust Executive Committee. | 31 | Ms. Anstine is a Trustee of ALPS ETF Trust (20 funds); ALPS Variable Investment Trust (9 funds); Reaves Utility Income Fund (1 fund); and Segall Bryant & Hamill Trust (14 funds). |
Jeremy W. Deems,
1976 | Trustee | Mr. Deems was appointed as a Trustee at the March 11, 2008 meeting of the Board of Trustees and elected at a special meeting of shareholders held on August 7, 2009. | Mr. Deems is the Co-Founder, Chief Operations Officer and Chief Financial Officer of Green Alpha Advisors, LLC, a registered investment advisor, and Co-Portfolio Manager of the Shelton Green Alpha Fund. Prior to joining Green Alpha Advisors, Mr. Deems was CFO and Treasurer of Forward Management, LLC, ReFlow Management Co., LLC, ReFlow Fund, LLC, a private investment fund, and Sutton Place Management, LLC, an administrative services company, from 1998 to June 2007. From 2004 to 2005, Mr Deems also served as Treasurer of the Forward Funds and the Sierra Club Funds. | 31 | Mr. Deems is a Trustee of ALPS ETF Trust (20 funds); ALPS Variable Investment Trust (9 funds); Clough Funds Trust (1 fund); and Reaves Utility Income Fund (1 fund). |
| 40 | www.vulcanvaluepartners.com |
Trustees and Officers
April 30, 2019 (Unaudited)
INDEPENDENT TRUSTEES (continued)
Name,
Address*
& Year
of Birth | Position(s)
Held with
Fund | Term of
Office** and
Length of
Time Served | Principal Occupation(s)
During Past 5 Years*** | Number of
Funds in
Fund
Complex
Overseen
by
Trustee**** | Other
Directorships
Held by Trustee
During Past
5 Years*** |
Jerry G. Rutledge,
1944 | Trustee | Mr. Rutledge was elected at a special meeting of shareholders held on August 7, 2009. | Mr. Rutledge is the President and owner of Rutledge��s Inc., a retail clothing business. Mr. Rutledge is currently Director of the American National Bank. He was from 1994 to 2007 a Regent of the University of Colorado. | 31 | Mr. Rutledge is a Trustee of Principal Real Estate Income Fund (1 fund); Clough Global Dividend and Income Fund (1 fund); Clough Global Equity Fund (1 fund); and Clough Global Opportunities Fund (1 fund). |
Michael “Ross” Shell,
1970 | Trustee | Mr. Shell was elected at a special meeting of shareholders held on August 7, 2009. | Mr. Shell is Founder and CEO of Red Idea, LLC, a strategic consulting/early stage venture firm (since June 2008). From 1999 to 2009, he was a part-owner and Director of Tesser, Inc., a brand agency. From December 2005 to May 2008, he was Director, Marketing and Investor Relations, of Woodbourne, a REIT/real estate hedge fund and private equity firm. Prior to this, from May 2004 to November 2005, he worked as a business strategy consultant; from June 2003 to April 2004, he was on the Global Client Services team of IDEO, a product design/innovation firm; and from 1999 to 2003, he was President of Tesser, Inc. Mr. Shell graduated with honors from Stanford University with a degree in Political Science. | 31 | None. |
| Annual Report | April 30, 2019 | 41 |
Trustees and Officers
April 30, 2019 (Unaudited)
INTERESTED TRUSTEE
Name,
Address*
& Year of
Birth | Position(s)
Held with
Fund | Term of
Office** and
Length of
Time Served | Principal Occupation(s)
During Past 5 Years*** | Number of
Funds in
Fund
Complex
Overseen
by
Trustee**** | Other
Directorships
Held by
Trustee During
Past 5 Years*** |
Edmund J. Burke,
1961 | Trustee and President^ | Mr. Burke was elected as Trustee at a special meeting of shareholders held on August 7, 2009. Mr. Burke was elected President of the Trust at the December 17, 2002 meeting of the Board of Trustees. | Mr. Burke is President and a Director of ALPS Holdings, Inc. (“AHI”) (since 2005) and ALPS Advisors, Inc. (“AAI”) and Director of Boston Financial Data Services, Inc. (“BFDS”), ALPS Distributors, Inc. (“ADI”), ALPS Fund Services, Inc. (“AFS”) and ALPS Portfolio Solutions Distributor, Inc. (“APSD”). Because of his positions with AHI, BFDS, AAI, ADI, AFS and APSD, Mr. Burke is deemed an affiliate of the Trust as defined under the 1940 Act. | 31 | Mr. Burke is a Trustee of ALPS ETF Trust (20 funds); Clough Global Dividend and Income Fund (1 fund); Clough Global Equity Fund (1 fund); Clough Global Opportunities Fund (1 fund); Clough Funds Trust (1 fund); Liberty All-Star Equity Fund (1 fund); and Director of the Liberty All-Star Growth Fund, Inc. (1 fund). |
| 42 | www.vulcanvaluepartners.com |
Trustees and Officers
April 30, 2019 (Unaudited)
OFFICERS
Name,
Address*
& Year
of Birth | Position(s)
Held with
Fund | Term of Office**
and Length of
Time Served | Principal Occupation(s) During Past 5 Years*** |
Kimberly R. Storms,
1972 | Treasurer | Ms. Storms was elected Treasurer of the Trust at the March 12, 2013 meeting of the Board of Trustees. | Ms. Storms is Senior Vice President - Director of Fund Administration of ALPS. Because of her position with ALPS, Ms. Storms is deemed an affiliate of the Trust as defined under the 1940 Act. Ms. Storms is also Treasurer of Liberty All-Star Equity Fund, Liberty All-Star Growth Fund, Inc., and ALPS Series Trust. Ms. Storms also serves as a Board member and Treasurer of The Center for Trauma & Resilience, a nonprofit agency. |
Karen S. Gilomen,
1970 | Secretary | Ms. Gilomen was elected Secretary of the Trust at the December 13, 2016 meeting of the Board of Trustees. | Ms. Gilomen joined ALPS in August 2016 as Vice President and Senior Counsel. Prior to joining ALPS, Ms. Gilomen was Vice President - General Counsel & CCO of Monticello Associates, Inc. from 2010 to 2016. Because of her position with ALPS, Ms. Gilomen is deemed an affiliate of the Trust, as defined under the 1940 Act. Ms. Gilomen is also the Secretary of Reaves Utility Income Fund and the Assistant Secretary of the WesMark Funds. |
Ted Uhl, 1974 | Chief Compliance Officer (“CCO”) | Mr. Uhl was appointed CCO of the Trust at the June 8, 2010 meeting of the Board of Trustees. | Mr. Uhl joined ALPS in October 2006, and is currently Deputy Compliance Officer of ALPS. Prior to his current role, Mr. Uhl served as Senior Risk Manager for ALPS from October 2006 until June 2010. Before joining ALPS, Mr. Uhl served a Sr. Analyst with Enenbach and Associates (RIA), and a Sr. Financial Analyst at Sprint. Because of his position with ALPS, Mr. Uhl is deemed an affiliate of the Trust as defined under the 1940 Act. Mr. Uhl is also CCO of the Boulder Growth & Income Fund, Inc., Centre Funds, Elevation ETF Trust, Index Funds, Reality Shares ETF Trust and Reaves Utility Income Fund. |
Jennell Panella,
1974 | Assistant Treasurer | Ms. Panella was elected Assistant Treasurer of the Trust at the September 15, 2015 meeting of the Board of Trustees. | Ms. Panella joined ALPS in June 2012 and is currently Fund Controller of ALPS Fund Services, Inc. Prior to joining ALPS, Ms. Panella served as Financial Reporting Manager for Parker Global Strategies, LLC (2009-2012). Because of her position with ALPS, Ms. Panella is deemed an affiliate of the Trust as defined under the 1940 Act. Ms. Panella also serves as Assistant Treasurer of James Advantage Funds. |
| Annual Report | April 30, 2019 | 43 |
Trustees and Officers
April 30, 2019 (Unaudited)
OFFICERS (continued)
Name,
Address*
& Year
of Birth | Position(s)
Held with
Fund | Term of Office**
and Length of
Time Served | Principal Occupation(s) During Past 5 Years*** |
Sharon Akselrod,
1974 | Assistant Secretary | Ms. Akselrod was elected Assistant Secretary of the Trust at the September 15, 2015 meeting of the Board of Trustees. | Ms. Akselrod joined ALPS in August 2014 and is currently Senior Investment Company Act Paralegal of ALPS Fund Services, Inc. Prior to joining ALPS, Ms. Akselrod served as Corporate Governance and Regulatory Associate for Nordstrom fsb (2013-2014) and Senior Legal Assistant – Legal Manager for AXA Equitable Life Insurance Company (2008-2013). Because of her position with ALPS, Ms. Akselrod is deemed an affiliate of the Trust as defined under the 1940 Act. Ms. Akselrod is also Assistant Secretary of ALPS ETF Trust, Clough Funds Trust and Principal Real Estate Income Fund. |
Jennifer Craig,
1973 | Assistant Secretary | Ms. Craig was elected Assistant Secretary of the Trust at the June 8, 2016 meeting of the Board of Trustees. | Ms. Craig joined ALPS in 2007 and is currently Assistant Vice President and Paralegal Manager of ALPS. Prior to joining ALPS, Ms. Craig was Legal Manager at Janus Capital Management LLC and served as Assistant Secretary of Janus Investment Fund, Janus Adviser Series and Janus Aspen Series. Because of her position with ALPS, Ms. Craig is deemed an affiliate of the Trust as defined under the 1940 Act. Ms. Craig is also Assistant Secretary of Clough Global Dividend and Income Fund, Clough Global Equity Fund, Clough Global Opportunities Fund, Liberty All-Star Equity Fund and Liberty All-Star Growth Fund, Inc. |
Sareena Khwaja-Dixon,
1980 | Assistant Secretary | Ms. Khwaja-Dixon was elected Assistant Secretary of the Trust at the December 12, 2017 meeting of the Board of Trustees. | Ms. Khwaja-Dixon joined ALPS in August 2015 and is currently Senior Counsel and Vice President of ALPS Fund Services, Inc. Prior to joining ALPS, Ms. Khwaja-Dixon served as a Senior Paralegal/Paralegal for Russell Investments (2011 – 2015). Ms. Khwaja-Dixon is also Secretary of Liberty All-Star Equity Fund and Liberty All-Star Growth Fund, Inc., Clough Funds Trust, Clough Dividend and Income Fund, Clough Global Opportunities Fund, and Clough Global Equity Fund. |
| * | All communications to Trustees and Officers may be directed to Financial Investors Trust c/o 1290 Broadway, Suite 1100, Denver, CO 80203. |
| ** | This is the period for which the Trustee or Officer began serving the Trust. Each Trustee serves an indefinite term, until his successor is elected. Officers are elected on an annual basis. |
| *** | Except as otherwise indicated, each individual has held the office shown or other offices in the same company for the last five years. |
| **** | The Fund Complex includes all series of the Trust (currently 31) and any other investment companies for which any Trustee serves as trustee for and which Vulcan Value Partners, LLC provides investment advisory services (currently none). |
| ^ | Effective June 12, 2019, Mr. Burke’s term as President of the Trust ended and Bradley J. Swenson was appointed President of the Trust. |
| 44 | www.vulcanvaluepartners.com |
Privacy Policy
April 30, 2019 (Unaudited)
| WHO WE ARE | |
| Who is providing this notice? | Vulcan Value Partners Fund and Vulcan Value Partners Small Cap Fund. |
| WHAT WE DO | |
| How do the Funds protect my personal information? | To protect your personal information from unauthorized access and use, we use security measures that comply with federal law. These measures include computer safeguards and secured files and buildings. |
| How do the Funds collect my personal information? | We collect your personal information, for example, when you ● open an account ● provide account information or give us your contact information ● make a wire transfer or deposit money |
| Why can‘t I limit all sharing? | Federal law gives you the right to limit only ● sharing for affiliates‘ everyday business purposes-information about your creditworthiness ● affiliates from using your information to market to you ● sharing for non-affiliates to market to you State laws and individual companies may give you additional rights to limit sharing. |
| Annual Report | April 30, 2019 | 45 |
Privacy Policy
April 30, 2019 (Unaudited)
| FACTS | WHAT DO THE FUNDS DO WITH YOUR PERSONAL INFORMATION? |
| WHY? | Financial companies choose how they share your personal information. Federal law gives consumers the right to limit some but not all sharing. Federal law also requires us to tell you how we collect, share, and protect your personal information. Please read this notice carefully to understand what we do. |
| WHAT? | The types of personal information we collect and share depend on the product or service you have with us. This information can include: ● Social Security number and account transactions ● Account balances and transaction history ● Wire transfer instructions |
| HOW? | All financial companies need to share customers‘ personal information to run their everyday business. In the section below, we list the reasons financial companies can share their customers‘ personal information; the reasons the Funds choose to share; and whether you can limit this sharing. |
| REASONS WE CAN SHARE YOUR PERSONAL INFORMATION | DO THE FUNDS SHARE: | CAN YOU LIMIT THIS SHARING? |
For our everyday business purposes – such as to process your transactions, maintain your account(s), respond to court orders and legal investigations, or report to credit bureaus | Yes | No |
For our marketing purposes – to offer our products and services to you | No | We do not share. |
| For joint marketing with other financial companies | No | We do not share. |
For our affiliates‘ everyday business purposes – information about your transactions and experiences | Yes | No |
For our affiliates‘ everyday business purposes – information about your creditworthiness | No | We do not share. |
| For non-affiliates to market to you | No | We do not share. |
| 46 | www.vulcanvaluepartners.com |
This page left intentionally blank.

Item 2. Code of Ethics.
| (a) | The Registrant, as of the end of the period covered by this report, has adopted a code of ethics that applies to the Registrant’s principal executive officer, principal financial officer, principal accounting officer or controller or any persons performing similar functions on behalf of the Registrant. |
| (c) | During the period covered by this report, no amendments to the provisions of the code of ethics described in Item 2(a) above were made. |
| (d) | During the period covered by this report, no implicit or explicit waivers to the provisions of the code of ethics described in Item 2(a) above were granted. |
| (f) | The Registrant’s Code of Ethics is attached as an Exhibit to this report. |
Item 3. Audit Committee Financial Expert.
The Board of Trustees of the Registrant has determined that the Registrant has at least one Audit Committee Financial Expert serving on its audit committee. The Board of Trustees of the Registrant has designated Jeremy W. Deems as the Registrant’s “Audit Committee Financial Expert.” Mr. Deems is “independent” as defined in paragraph (a)(2) of Item 3 to Form N-CSR.
Item 4. Principal Accountant Fees and Services.
| (a) | Audit Fees: For the Registrant’s fiscal years ended April 30, 2019 and April 30, 2018, the aggregate fees billed for professional services rendered by the principal accountant for the audit of the Registrant’s annual financial statements or services that are normally provided by the accountant in connection with statutory and regulatory filings or engagements for those fiscal years were $338,280 and $368,680, respectively. |
| (b) | Audit-Related Fees: For the Registrant’s fiscal years ended April 30, 2019 and April 30, 2018, the aggregate fees billed for assurance and related services by the principal accountant that were reasonably related to the performance of the audit |
of the Registrant’s financial statements and are not reported under paragraph (a) of this Item were $0 and $0, respectively.
| (c) | Tax Fees: For the Registrant’s fiscal years ended April 30, 2019 and April 30, 2018, the aggregate fees billed for professional services rendered by the principal accountant for tax compliance, tax advice and tax planning were $96,055 and $97,875, respectively. The fiscal year 2018 and 2017 tax fees were for services for dividend calculation, excise tax preparation and tax return preparation. |
| (d) | All Other Fees: For the Registrant’s fiscal years ended April 30, 2019 and April 30, 2018, no fees were billed to Registrant by the principal accountant for products and services, other than the services reported in paragraphs (a) through (c) of this Item. |
| (e)(1) | Audit Committee Pre-Approval Policies and Procedures: All services to be performed by the Registrant’s principal accountant must be pre-approved by the Registrant’s Audit Committee. The Chairman of the Audit Committee may pre-approve non-audit services to be performed by the Registrant’s principal accountant on an interim basis, subject to ratification by the Audit Committee at its next regularly scheduled meeting. |
| (e)(2) | No services described in paragraphs (b) through (d) of this Item were approved by the Registrant’s Audit Committee pursuant to paragraph (c)(7)(i)(C) of Rule 2-01 of Regulation S-X. |
| (g) | The aggregate non-audit fees billed by the Registrant’s accountant to the Registrant, and rendered to the Registrant’s investment adviser (not including any sub-adviser whose role is primarily portfolio management and is subcontracted with or overseen by another investment adviser), and any entity controlling, controlled by, or under common control with the adviser that provides ongoing services to the Registrant, were $133,562 in the fiscal year ended April 30, 2019 and $132,945 in the fiscal year ended April 30, 2018. These fees consisted of non-audit fees billed to (i) the Registrant of $96,055 in the fiscal year ended April 30, 2019 and $97,875 in fiscal year ended April 30, 2018 as described in response to paragraph (c) above and (ii) to ALPS Fund Services, Inc. (“AFS”), an entity under common control with ALPS Advisors, Inc., the Registrant’s investment adviser, of $37,507 in the fiscal year ended April 30, 2019 and $35,070 in fiscal year ended April 30, 2018. The non-audit fees billed to AFS related to SSAE 16 services and other compliance-related matters. |
| (h) | The Registrant’s audit committee has considered whether the provision of non-audit services that were rendered to the Registrant’s investment adviser (not including any sub-adviser whose role is primarily portfolio management and is subcontracted with or overseen by another investment adviser), and any entity |
controlling, controlled by, or under common control with the investment adviser that provides ongoing services to the Registrant that were not pre-approved pursuant to paragraph (c)(7)(ii) of Rule 2-01 of Regulation S-X, is compatible with maintaining the principal accountant’s independence. The Registrant’s audit committee determined that the provision of such non-audit services is compatible with maintaining the principal accountant’s independence.
Item 5. Audit Committee of Listed Registrants.
Not applicable to the Registrant.
Item 6. Investments.
| (a) | Schedule of Investments is included as part of the Reports to Stockholders filed under Item 1 of this Form N-CSR. |
Item 7. Disclosure of Proxy Voting Policies and Procedures for Closed-End Management Investment Companies.
Not applicable to the Registrant.
Item 8. Portfolio Managers of Closed-End Management Investment Companies.
Not applicable to the Registrant.
Item 9. Purchases of Equity Securities by Closed-End Management Investment Company and Affiliated Purchasers.
Not applicable to the Registrant.
Item 10. Submission of Matters to a Vote of Security Holders.
There have been no material changes to the procedures by which shareholders may recommend nominees to the Registrant’s Board of Trustees, where those changes were implemented after the Registrant last provided disclosure in response to the requirements of Item 407(c)(2)(iv) of Regulation S-K, or this Item.
Item 11. Controls and Procedures.
| (a) | The Registrant’s principal executive officer and principal financial officer have concluded that the Registrant’s disclosure controls and procedures (as defined in Rule 30a-3(c) under the Investment Company Act of 1940, as amended) are effective based on their evaluation of these controls and procedures as of a date within 90 days of the filing date of this report. |
| (b) | There was no change in the Registrant’s internal control over financial reporting (as defined in Rule 30a-3(d) under the Investment Company Act of 1940, as amended) during the period covered by this report that has materially affected, or is reasonably likely to materially affect, the Registrant’s internal control over financial reporting. |
Item 12. Disclosure of Securities Lending Activities for Closed-End Management Investment Companies.
Not applicable to the Registrant.
Item 13. Exhibits.
| (a)(1) | Registrant’s Code of Ethics for Principal Executive and Senior Financial Officers, which is the subject of the disclosure required by Item 2 of Form N-CSR, is incorporated by reference to Exhibit 12(a)(1) to the Registrant’s Certified Shareholder Report on Form N-CSR, File No. 811-8194, filed on January 9, 2017. |
| (a)(2) | The certifications required by Rule 30a-2(a) of the Investment Company Act of 1940, as amended, and Section 302 of the Sarbanes-Oxley Act of 2002 are attached hereto as Exhibit 99.Cert. |
| (b) | The certifications by the Registrant’s principal executive officer and principal financial officer, as required by Rule 30a-2(b) of the Investment Company Act of 1940, as amended, and Section 906 of the Sarbanes-Oxley Act of 2002 are attached hereto as Exhibit 99.906Cert. |
SIGNATURES
Pursuant to the requirements of the Securities Exchange Act of 1934 and the Investment Company Act of 1940, the Registrant has duly caused this report to be signed on its behalf by the undersigned, thereunto duly authorized.
FINANCIAL INVESTORS TRUST
| By: | /s/ Brad Swenson | |
| | Brad Swenson (Principal Executive Officer)
President | |
| | | |
| Date: | July 8, 2019 | |
Pursuant to the requirements of the Securities Exchange Act of 1934 and the Investment Company Act of 1940, this report has been signed below by the following persons on behalf of the Registrant and in the capacities and on the dates indicated.
FINANCIAL INVESTORS TRUST
| By: | /s/ Brad Swenson | |
| | Brad Swenson (Principal Executive Officer)
President | |
| | | |
| Date: | July 8, 2019 | |
| By: | /s/ Kimberly R. Storms | |
| | Kimberly R. Storms (Principal Financial Officer)
Treasurer |
| | | |
| Date: | July 8, 2019 | |